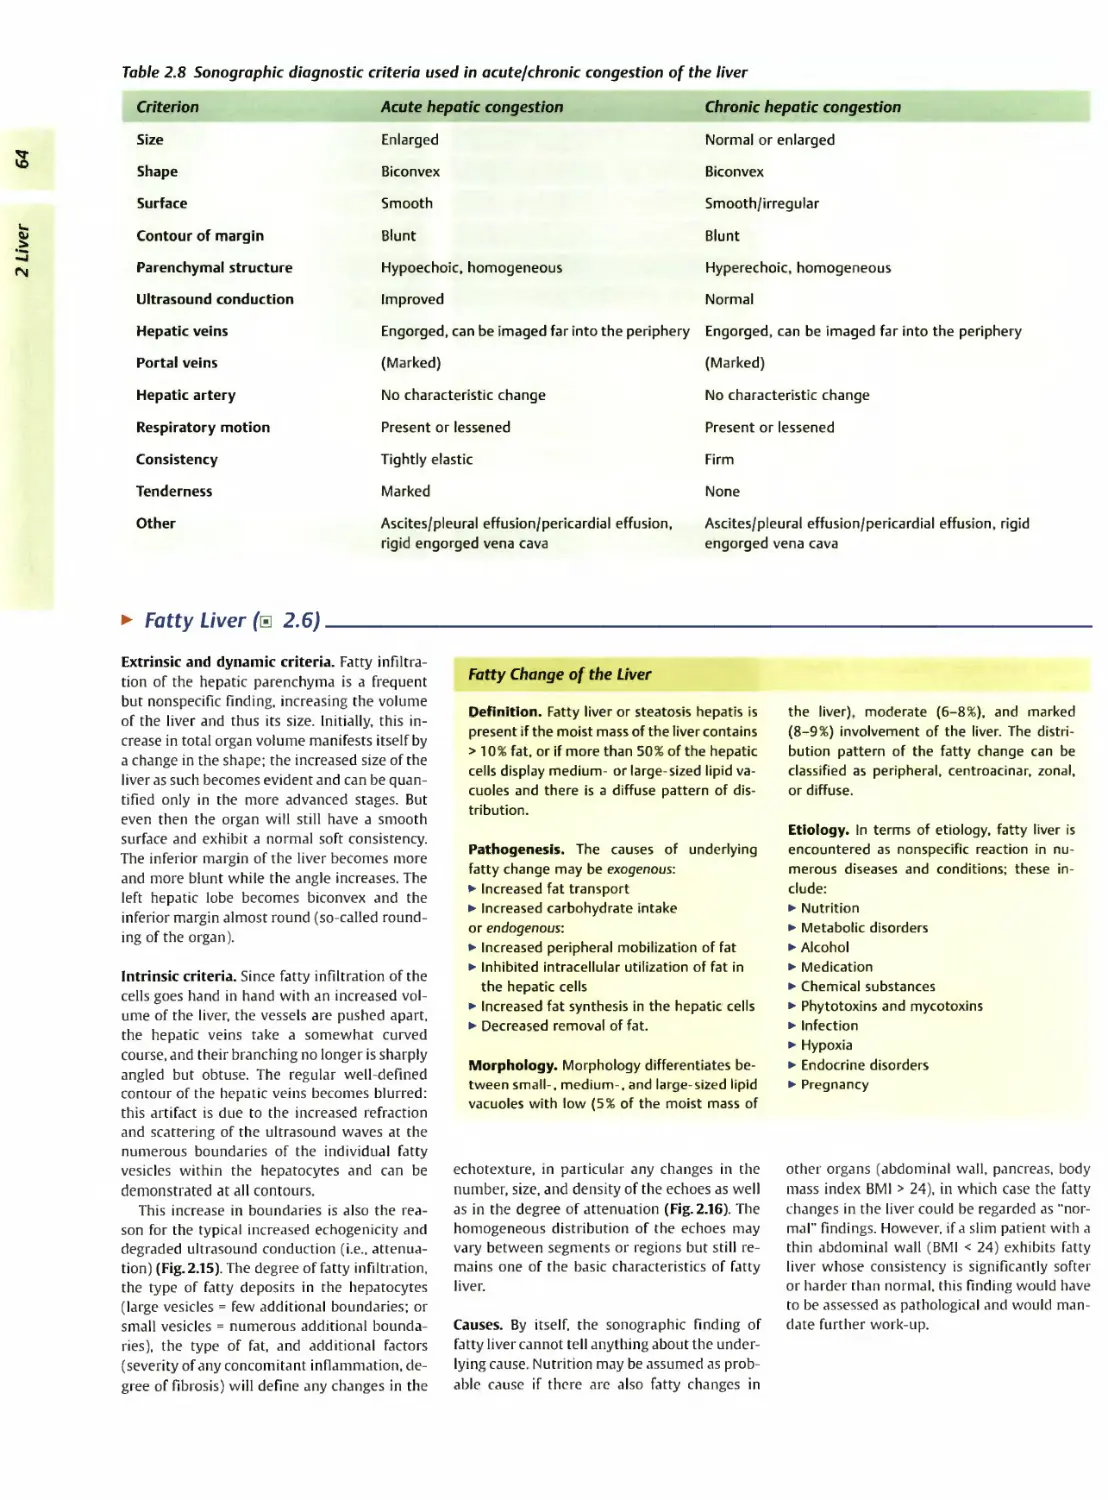
/


Автор: Schmidt G.
Теги: medicine differentiam diagnosis ultrasound imaging ultrasound diagnostics teaching atlas theime publisher
ISBN: 3-13-131891-0
Год: 2005


Текст
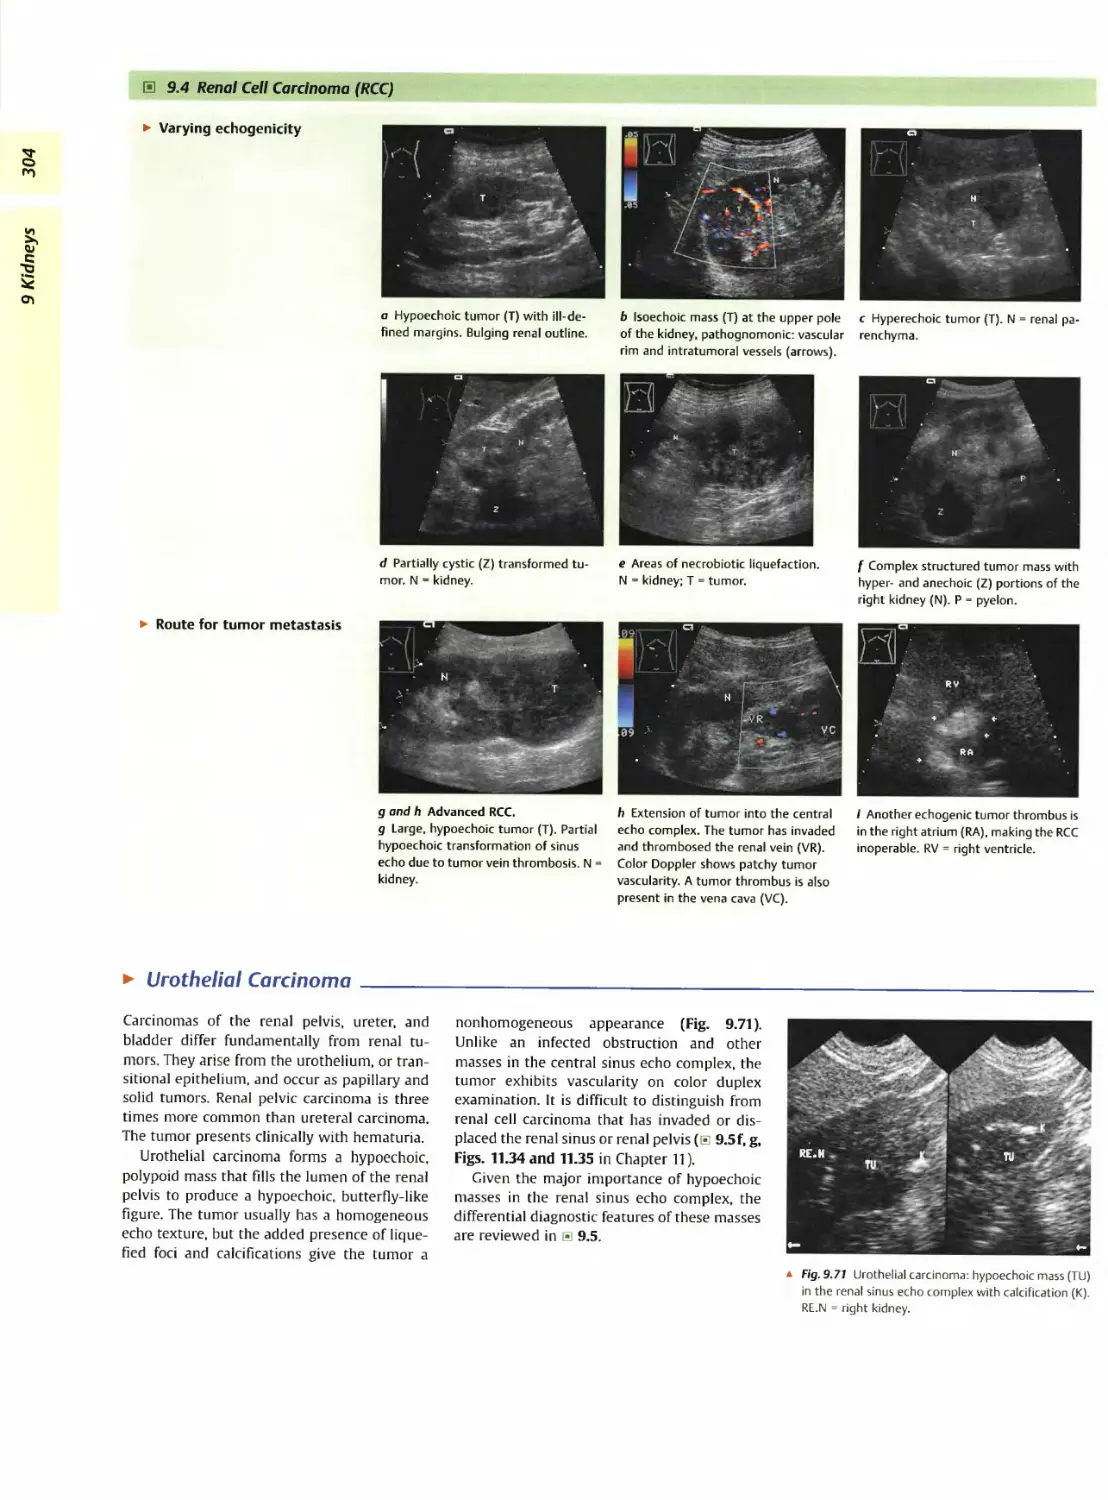
Differential Diagnosis
in Ultrasound Imaging
A Teaching Atlas
Guenter Schmidt
Thieme
Differential Diagnosis in Ultrasound
Д Teaching Atlas
Guenter Schmidt, M.D.
Director
Department of Internal Medicine
Protestant Hospital Kredenbach
Kreuztal, Germany
With contributions by
Barbara Beuscher-Willems, M.W. Max Brandt, Christian Goerg, Lucas Greiner,
Christian Jakobeit, Johannes Mueller, Dieter Nuernberg
2397 illustrations
Thieme
Stuttgart • New York
Library of Congress Caraloging-in-Publication
Data is available from the publisher.
This book is an authorized, revised and up’
dated translation of the German edition pub-
lished and copyrighted 2002 by Georg Thieme
Verlag, Stuttgart, Germany. Title of the German
edition: Sonographische Differenzialdiagnose:
Lernatlas zur systematischen Bildanalyse mit
uber 2500 Befundbeispielen.
Translators: Dietrich Herrmann, M.D., Hameln,
Germany: Terry Telger, Fort Worth, TX, USA
Important note: Medicine is an ever-changing
science undergoing continual development.
Research and clinical experience are continu-
ally expanding our knowledge, in particular our
knowledge of proper treatment and drug ther-
apy. Insofar as this book mentions any dosage
or application, readers may rest assured that
the authors, editors, and publishers have made
every effort to ensuie that such references are
in accordance with the state of knowledge at
the time of production of the book.
Nevertheless, this does not involve, imply, or
express any guarantee or responsibility on the
part of the publishers in respect to any dosage
instructions and forms of applications stated in
the book. Every user is requested to examine
carefully the manufacturers’ leaflets accompa-
nying each drug and to check, if necessary in
consultation with a physician or specialist,
whether the dosage schedules mentioned
therein or the contraindications stated by the
manufacturers differ from the statements
made in the present book. Such examination
is particularly important with drugs that are
either rarely used or have been newly released
on the market. Every dosage schedule or every
form of application used is entirely at the user’s
own risk and responsibility. The authors and
publishers request every user to report to the
publishers any discrepancies or inaccuracies
noticed. If errors in this work are found after
publication, errata will be posted at www.
thieme.com on the product description page.
Some of the product names, patents, and regis-
tered designs referred to in this book are in fact
registered trademarks or proprietary names
even though specific reference to this fact is
not always made in the text. Therefore, the
appearance of a name without designation as
proprietary is not to be construed as a repre-
sentation by the publisher that it is in the pub-
lic domain.
© 2006 Georg Thieme Verlag,
Riidigerstrasse 14, 70469 Stuttgart, Germany
http://www.thieme.de
Thieme New York, 333 Seventh Avenue,
New York, NY 10001 USA
http://www.thieme.com
Typesetting by primustype Hurler GmbH,
Notzingen
Printed in Germany by Karl Grammlich GmbH.
Pliezhausen
ISBN 3-13-131891-0 (GTV)
ISBN 1-58890-179-3 (TNY) 1 2 3 4 5 6
This book, including all parts thereof, is legally
protected by copyright. Any use, exploitation,
or commercialization outside the narrow limits
set by copyright legislation, without the pub-
lisher’s consent, is illegal and liable to prose-
cution. This applies in particular to photostat
reproduction, copying, mimeographing, prepa-
ration of microfilms, and electronic data proc-
essing and storage.
Preface
The raison d’etre for a new textbook in a dis-
cipline which has been served by standard
works for many years was the initial conviction
of Dr. Markus Becker of the Thieme Publishing
Group that a distinct need for a modern work
on differential diagnosis in ultrasound existed.
Realizing full well the time and effort required
by such an undertaking, I was reluctant at first.
But slowly and steadily the formula or blue-
print to be used took shape. 1 was motivated in
this endeavor by the joy sonography holds for
me, by the still surprising diagnostic avenues it
offers, and by my belief that this incredibly
versatile imaging modality should be mastered
by all physicians, be it in the hospital or office
setting.
Today, as time is more and more of the essence
in our daily work, I realize that it will be faster
to order a CT scan than to spend my own time
on an ultrasound study. Thus, during the early
stages of this project numerous concepts were
considered and discarded. How much extrane-
ous material should be included? How could
we ensure that the reader would come away
with maximum knowledge gained in the least
amount of time, benefiting daily practice?
The recent explosion of factual knowledge has
emphasized the need for a presentation which
would provide the reader with an opportunity
to assimilate pertinent facts in a logical fashion.
The clinical manifestations and diagnostic
studies are therefoie considered as a reflection
of anatomy and pathophysiology. 1 have delib-
erately chosen to provide a book which is heav-
ily illustrated since diagnostic ultrasound does
not rely on text but on images. The au courant
concept is hopefully apparent throughout the
entire work and is exemplified by colored text
boxes repeating basic tenets and deepening the
reader’s understanding—as one can only recog-
nize what one knows and understand what one
sees. The highlighted sonogram boxes (B) dis-
play variant courses and atypical images or
those particularly important in the differential
diagnosis of a particular pathology.
As a matter of course, careful sonographic dif-
feiential diagnosis of special findings has to
make use of color flow and spectral Doppler
imaging as well. Whenever it is deemed neces-
sary by the clinical issue in question, the reader
will find the В-mode images complemented by
color flow Doppler sonograms. There is some
repetition, since 1 see this work as providing a
reference to the diagnostic study of specific
diseases rather than as a book which is likely
to be read from cover to cover.
As stated above, the ultimate goal has been to
collate a book which is deserving of the adjec-
tive “modern.” The contributing authors are
acknowledged authorities in the areas in which
they have written; but, more importantly, they
are skilled, experienced teachers of sonography
infecting others with their enthusiasm for this
modality. Writing chapters is usually a thank-
less job, with no reward other than being rec-
ognized for one’s expertise and the satisfaction
of contributing to a textbook that has become,
by these very efforts, a valuable resource in
one’s chosen field. Needless to say, 1 have bene-
fited the most from all these efforts, being
given undue credit for the work of so many
others. 1 am deeply indebted to each of them
for their numerous ideas in making this a text-
book and guide for daily practice. They, to-
gether with all their coworkers, are to be com-
mended for their patience in tolerating the
countless delays and myriad requests from
the editorial office for more, different, or re-
vised information. Special gratitude is also due
to the many practitioners of the art—and it is an
art—who provided me with sonograms. It is my
hope that they all will share my pride in a job
well done, that their unselfish efforts will con-
tinue to sustain this textbook in the role into
which it has grown, and that they will see it as a
legacy worth perpetuating with future edi-
tions.
Work on the English edition began in 2003 and
1 owe my deep appreciation to Ms Angelika
Findgott, Editor, and Ms Stefanie Langner, Pro-
duction Manager, of Thieme International who
have shouldered the hard work of putting to-
gether a thoioughly revised and updated edi-
tion with countless new sonograms.
Nine years have passed since I accepted the
publisher’s and my own self-generated chal-
lenge to develop a “new and modern” textbook
of differential diagnosis in ultrasound. The fa-
vorable reception suggests that we have suc-
ceeded. As the landmark of the first English
edition is completed, the frustrations and toils
are erased and what remains is an immeasur-
able sense of gratitude.
Guenter Schmidt, M.D.
Preface
Contributors
Contributors
Barbara Beuscher-Willems, M.D.
Director
Klinikum Heilbronn GmbH
Department of Internal Medicine
Bethesda Hospital
Freudenberg, Germany
M.W. Max Brandt, M.D.
Director
St. Marienhospital
Department of Gastroenterology
Wesel, Germany
Christian Goerg, M.D.
Professor
Center for Internal Medicine
Department of Hematology/Oncology
University Hospital
Marburg, Germany
Lucas Greiner, M.D.
Professor and Director
Medical Clinic 2
Municipal Hospitals
Wuppertal, Germany
Christian Jakobeit, M.D.
Associate Professor and Director
Johanniter Hospital
Internal Medicine
Radevormwald, Germany
Johannes Mueller, M.D.
Klinikum Barmen
Medical Clinic A
Wuppertal, Germany
Dieter Nuernberg, M.D.
Associate Professor and Director
Ruppiner Kliniken GmbH
Medical Clinic В
Neuruppin, Germany
Contents
1 Vessels 1________________________________________________
Aorta, Vena Cava, and Periph-
eral Vessels 3
G. Schmidt
▼ Aorta, Arteries 5
► Anomalies and Variant Positions 5
► Dilatation 7
► Stenosis 11
► Wall Thickening 16
► Intraluminal Mass 20
► Perivascular Mass 22
Portal Vein and Its Tribu-
taries 33
C. Goerg
▼ Enlarged Lumen Diameter 35
► Portal Hypertension 35
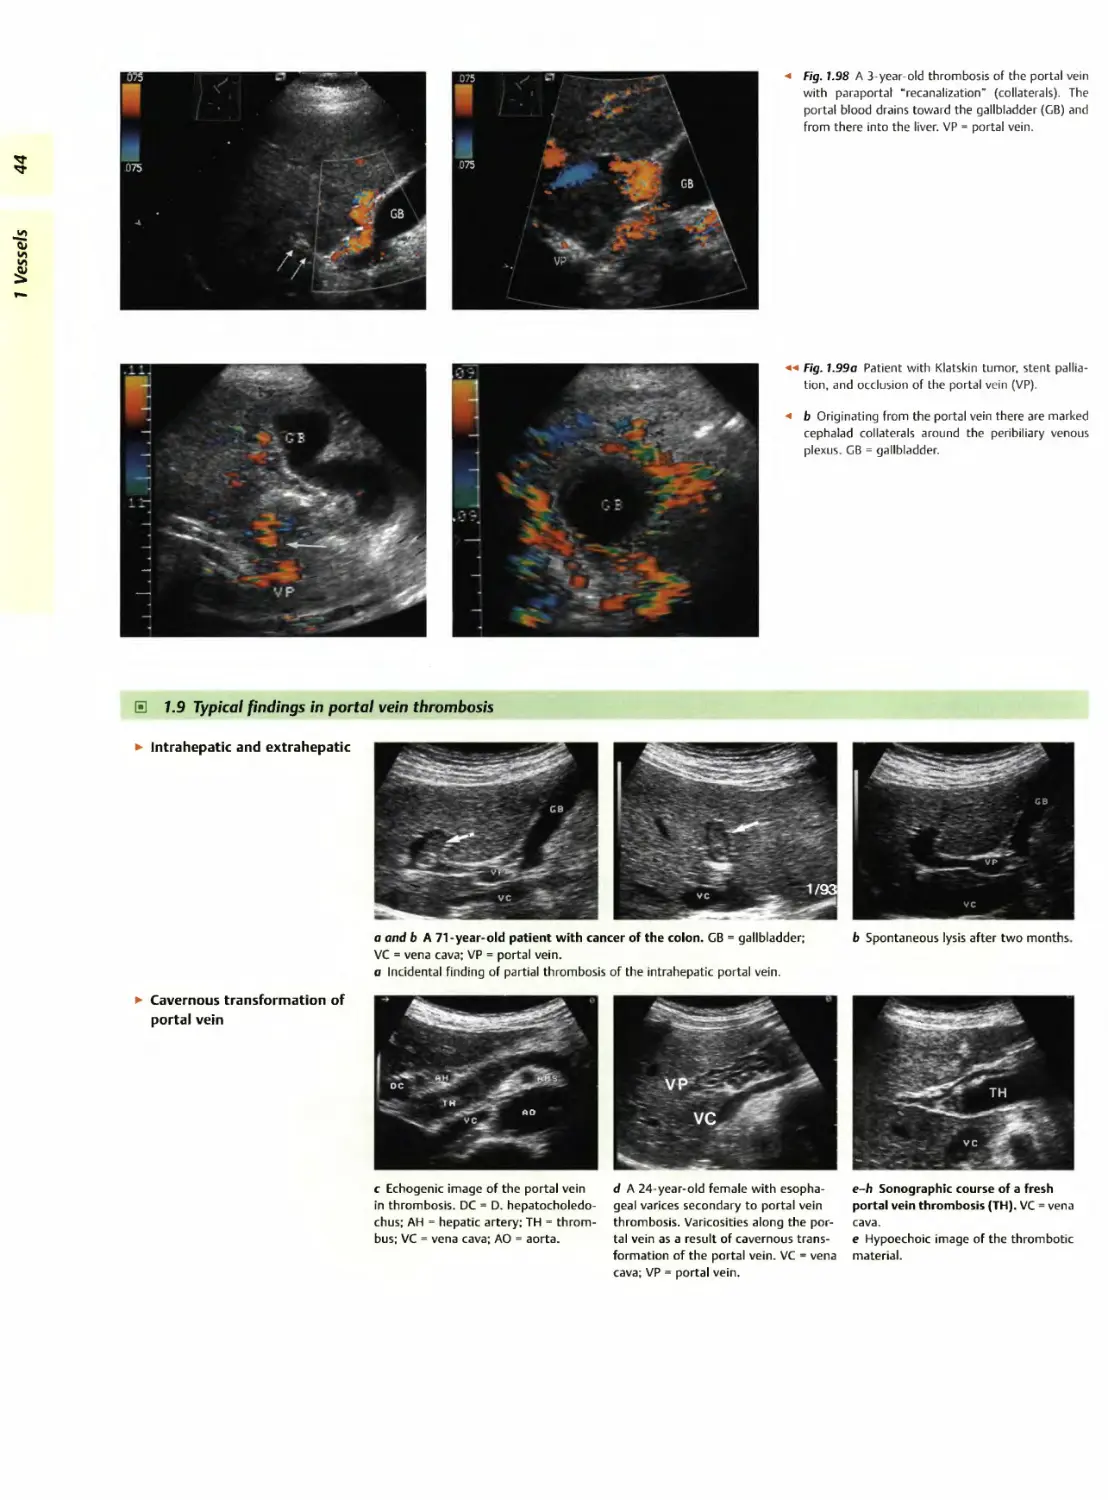
▼ Intraluminal Mass 43
► Thrombosis 43
► Tumor 48
Contents
▼ Vena Cava, Veins 25
► Anomalies 25
► Dilatation 26
► Intraluminal Mass 28
► Compression, Infiltration 31
2 Liver 49_________________________________________________________________________
M. Brandt
Diffuse Changes in the Hepatic
Parenchyma 61
► Enlarged Liver 62
► Small Liver 67
► Homogeneous Hypoechoic
Texture 68
► Homogeneous Hyperechoic
Texture 70
► Regionally Inhomogeneous
Texture 71
► Diffuse Inhomogeneous Texture 72
▼ Localized Changes in Hepatic
Parenchyma 74
► Anechoic Masses 76
► Hypoechoic Masses 81
► Isoechoic Masses 87
► Hyperechoic Masses 89
► Echodense Masses 94
► Irregular Masses 97
▼ Differential Diagnosis of Focal
Lesions 98
► Diagnostic Methods 98
► Suspected Diagnosis 99
3 Biliary Tree and Gallbladder 1 о i
ontents
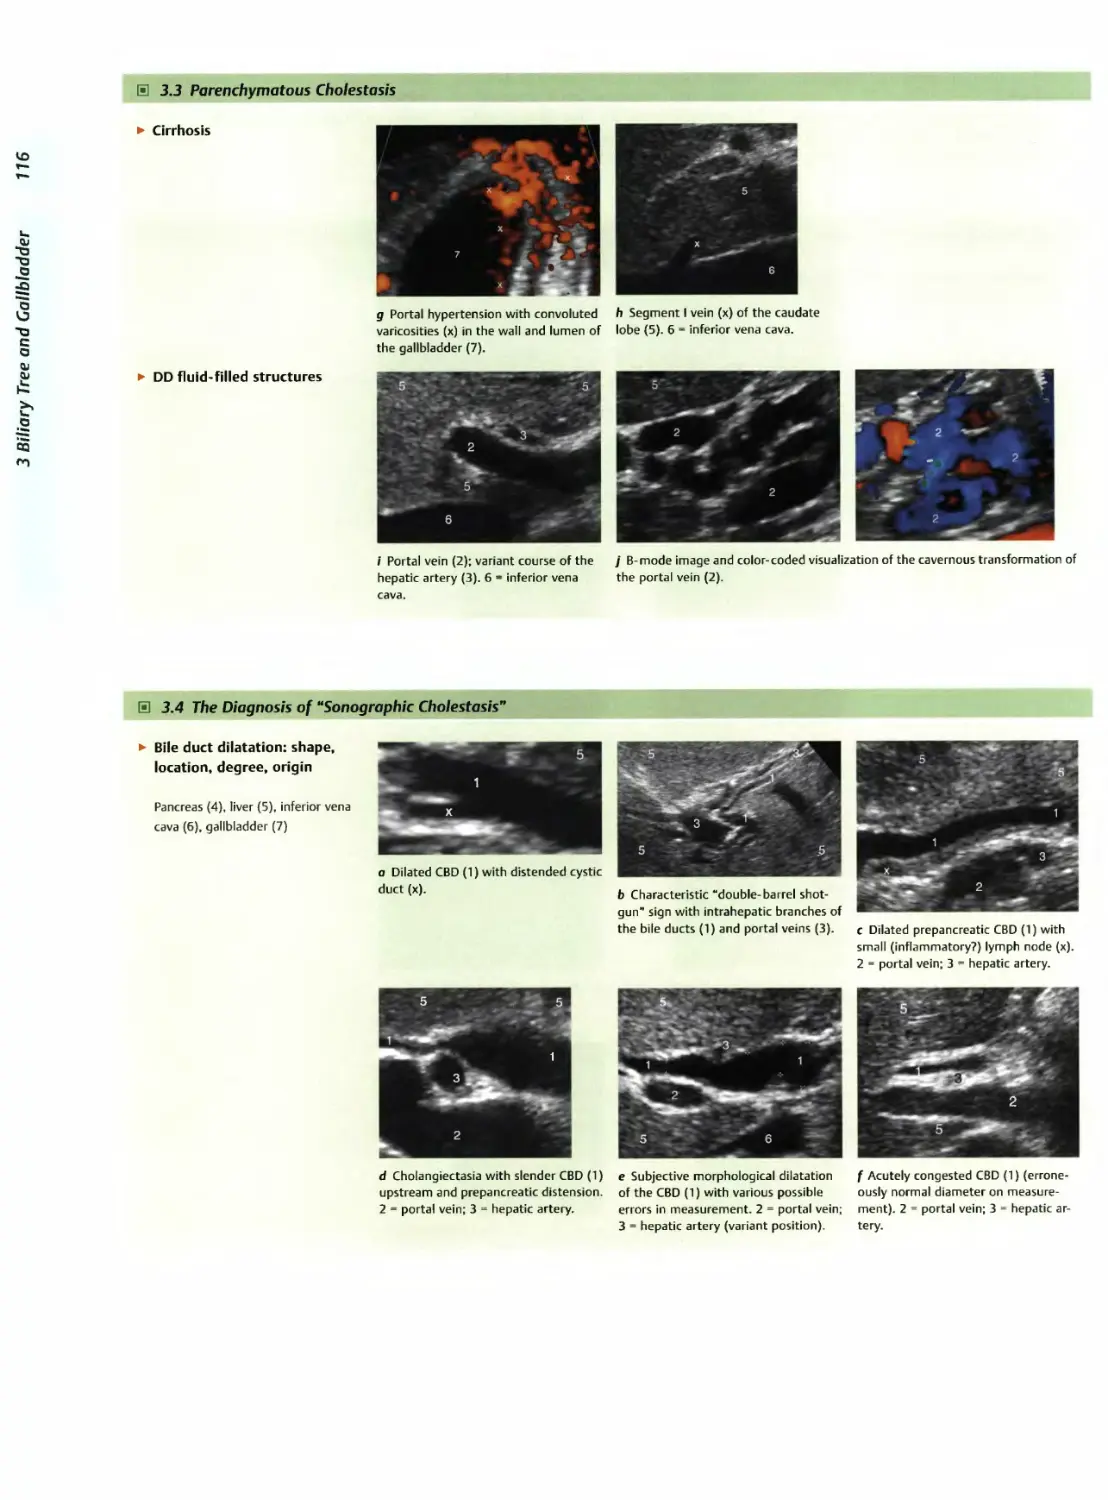
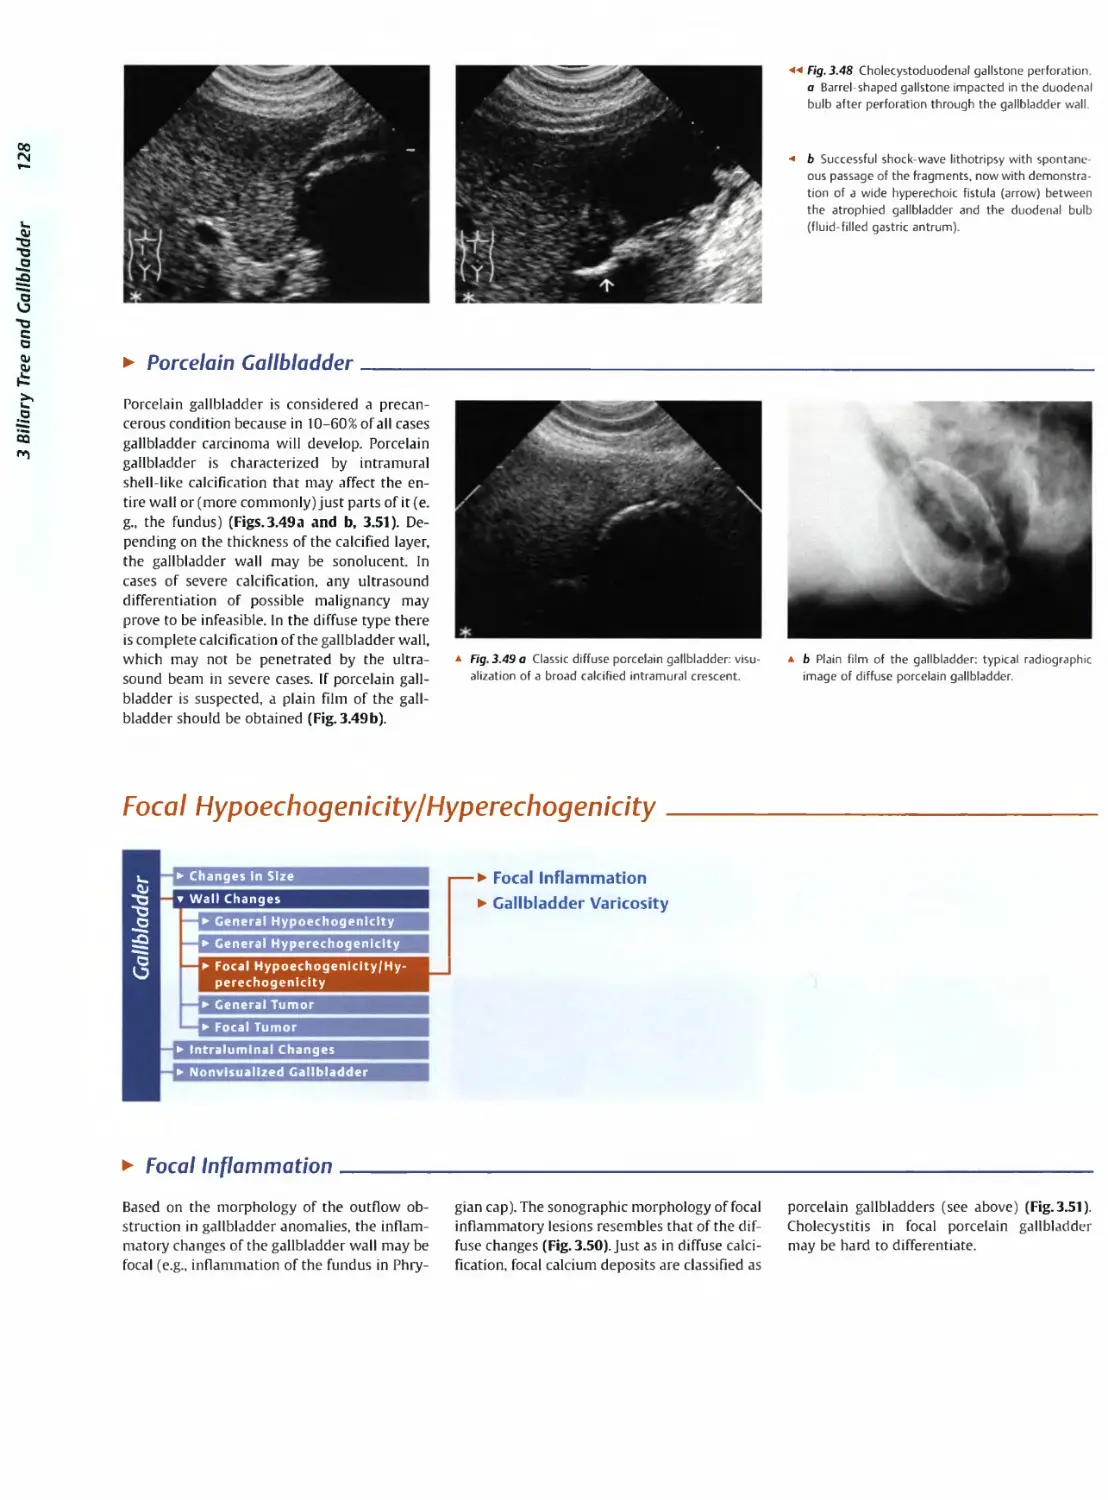
Biliary Tree 103
L Greiner and J. Mueller
▼ Thickening of the Bile Duct
Wall 105
► Localized and Diffuse 105
▼ Bile Duct Rarefaction 106
► Localized and Diffuse 106
▼ Bile Duct Dilatation and Intraductal
Pressure 107
► Intrahepatic 108
► Hilar and Prepancreatic 109
► Intrapancreatic 111
► Papillary 112
▼ Abnormal Intraluminal Bile Duct
Findings 112
► Foreign Body 112
▼ Differential Diagnosis of Sono-
graphic Cholestasis 114
► The Seven Most Important
Questions 114
Callbladder 119
C. Jakobeit
▼ Changes in Size 122
► Large Callbladder (> 10 cm) 122
► Small/Missing Callbladder 123
▼ Wall Changes 125
► General Hypoechogenicity 125
► General Hyperechogenicity 127
► Focal Hypoechogenicity/Hyperecho-
genicity 128
► General Tumor 129
► Focal Tumor 131
v Intraluminal Changes 134
► Hyperechoic 134
► Hypoechoic 134
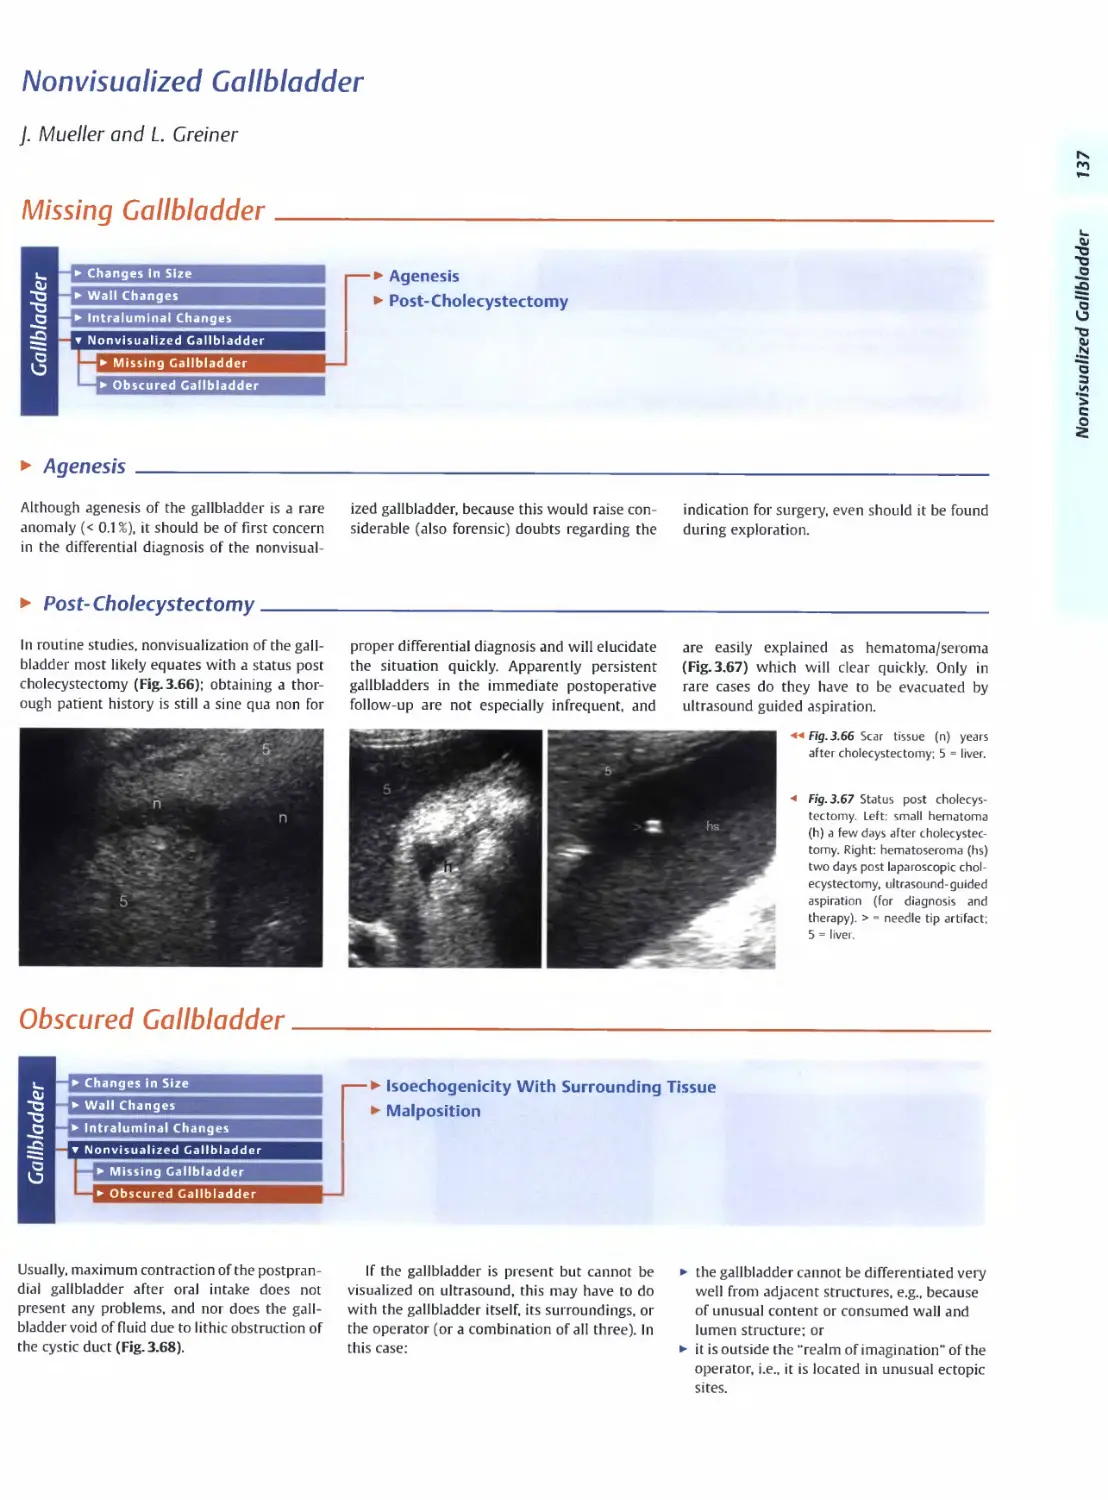
▼ Nonvisualized Callbladder 137
L. Greiner and J. Muller
► Missing Gallbladder 137
► Obscured Gallbladder 137
4 Pancreas 141_______________________________________________________
G. Schmidt
▼ Diffuse Pancreatic Change 144
► Large Pancreas 144
► Small Pancreas 145
► Hypoechoic Texture 147
► Hyperechoic Texture 148
▼ Focal Changes 152
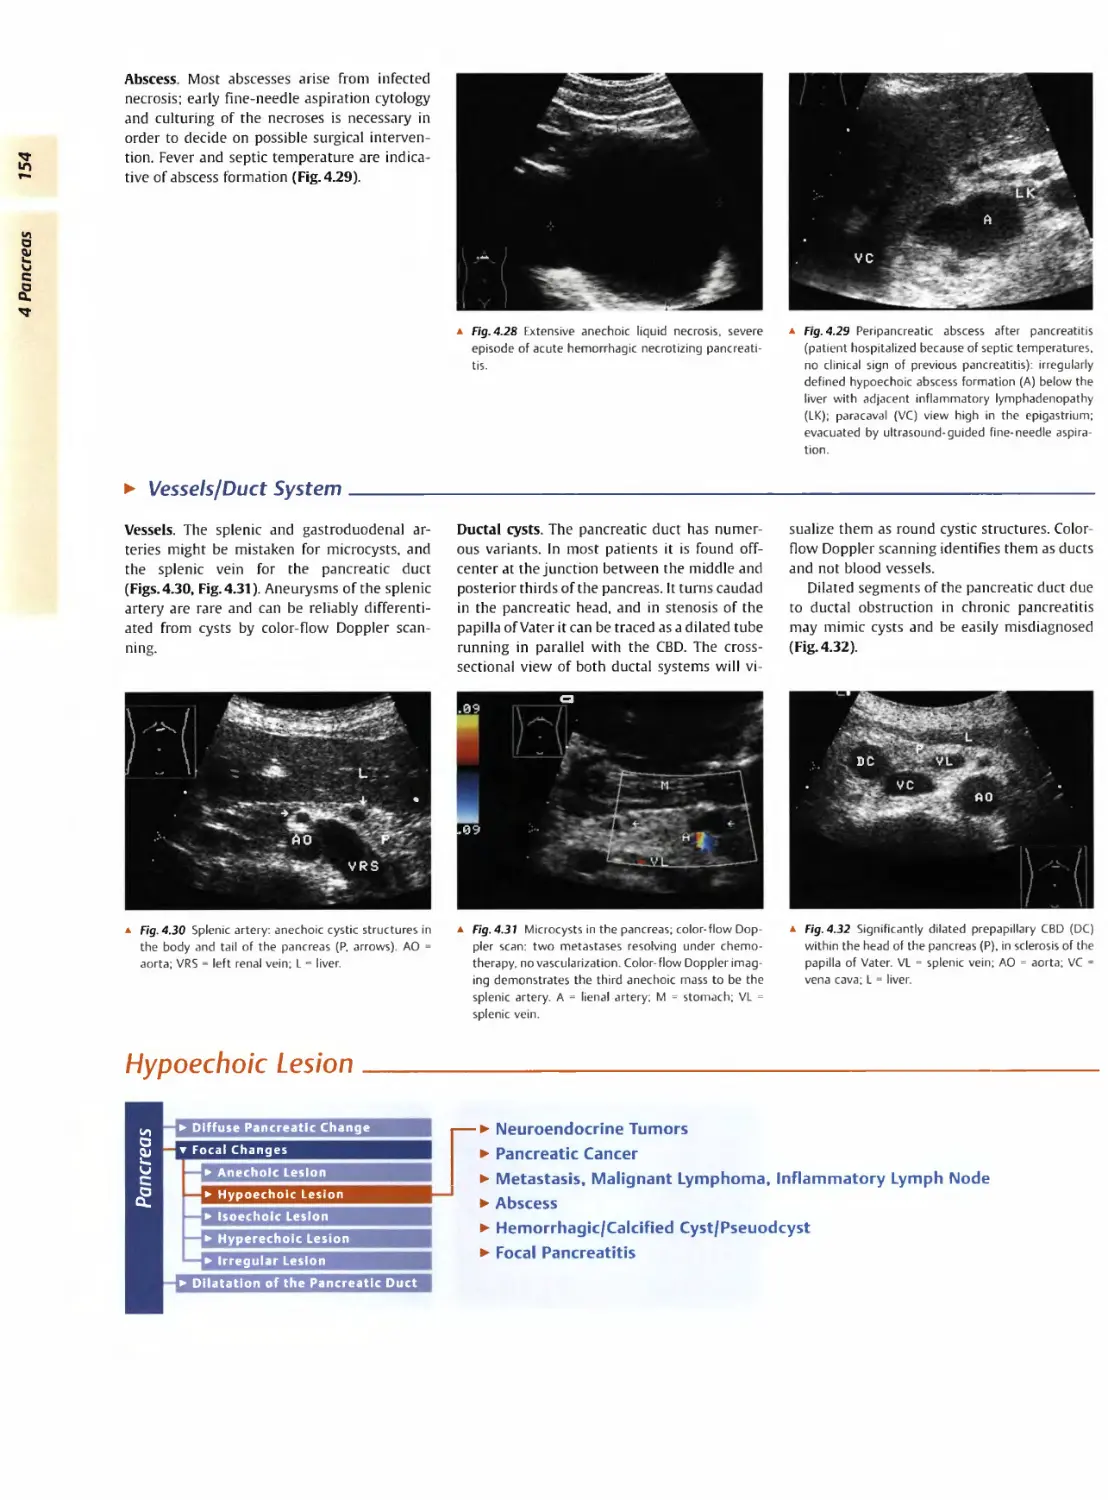
► Anechoic Lesion 152
► Hypoechoic Lesion 154
► Isoechoic Lesion 158
► Hyperechoic Lesion 160
► Irregular Lesion 163
▼ Dilatation of the Pancreatic
Duct 164
► Marginal/Mild Dilatation 166
► Marked Dilatation 167
5 Spleen 171
C. Goerg
▼ Nonfocal Changes of the
Spleen 176
► Diffuse Parenchymal Changes 176
► Large Spleen 177
► Small Spleen 180
▼ Focal Changes 182
► Anechoic Mass 182
► Hypoechoic Mass 184
► Hyperechoic Mass 193
► Splenic Calcification 195
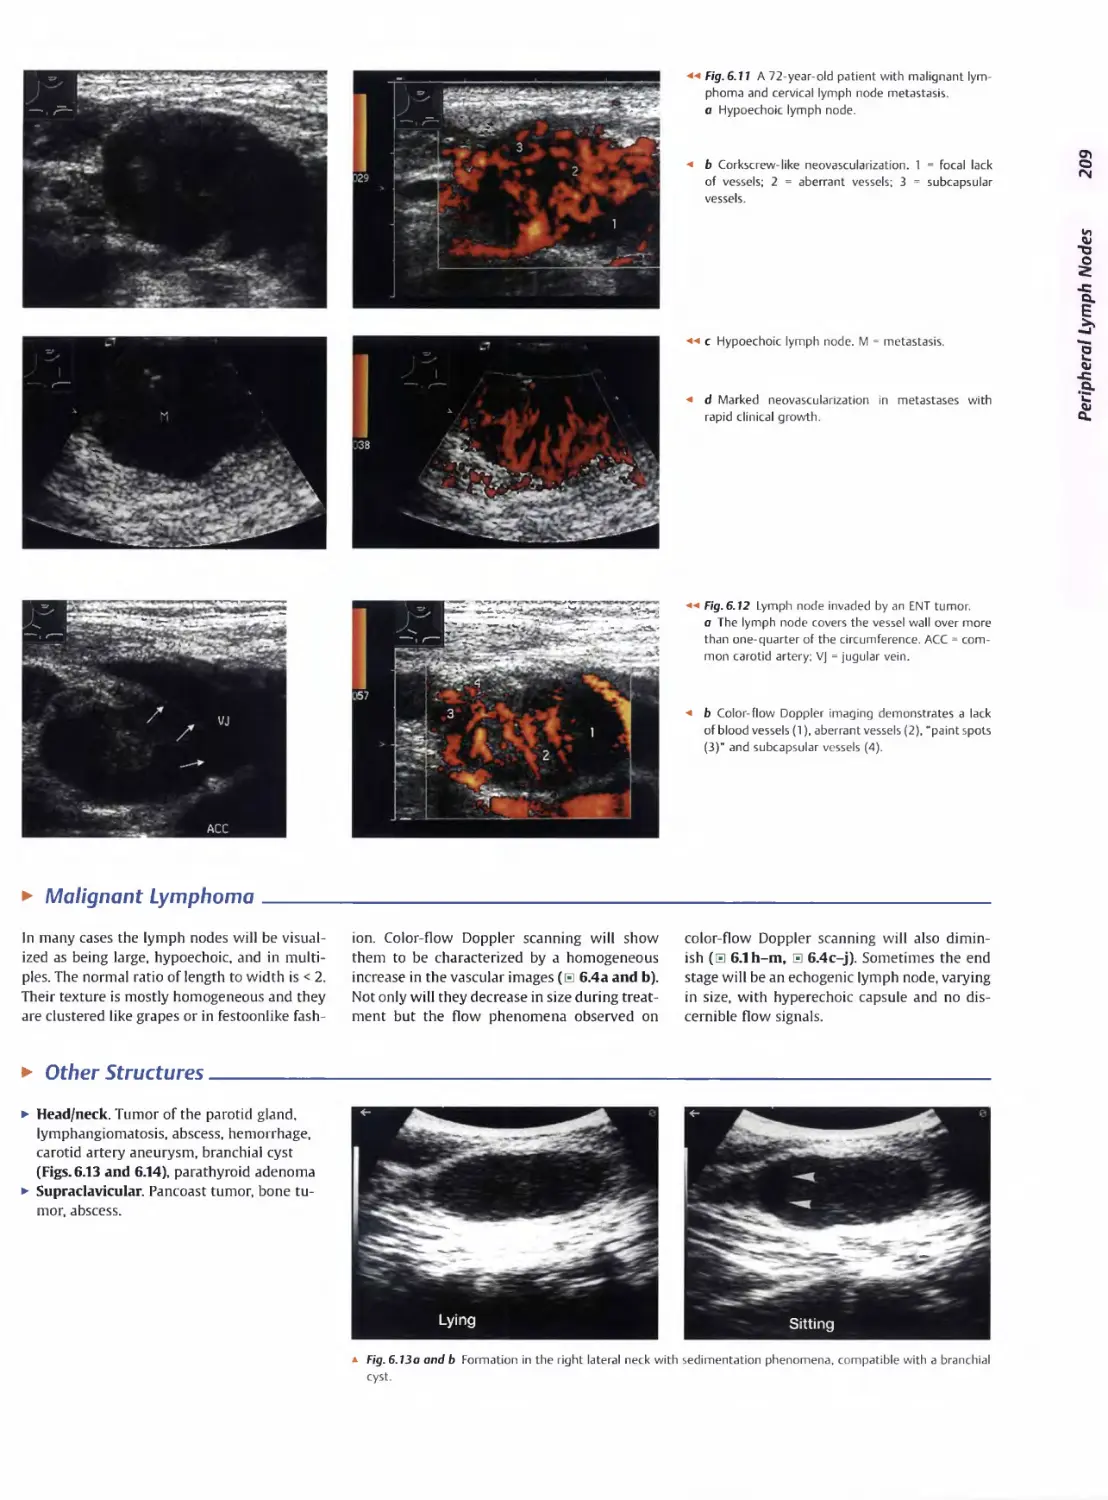
6 Lymph Nodes 197_______________________________________________
C. Goerg
▼ Peripheral Lymph Nodes 207
► Head/Neck 207
► Extremities (Axilla, Groin) 210
▼ Abdominal Lymph Nodes 212
► Hepatic Portal 212
► Splenic Hilum 215
► Mesentery (Celiac, Upper and Lower
Mesenteric Station) 216
► Retroperitoneum (Para-aortic, Para-
caval, Aortointercaval, and Iliac Sta-
tion) 219
Contents
7 Gastrointestinal Tract 223_______________________________________
M. Brandt
▼ Stomach 229
► Focal Wall Changes 229
► Extended Wall Changes 232
► Dilated Lumen 233
► Narrowed Lumen 234
▼ Small/Large Intestine 235
► Focal Wall Changes 236
► Extended Wall Changes 241
► Dilated Lumen 245
► Narrowed Lumen 247
8 Peritoneal Cavity 249___________________________________________________
D. Nuernberg
▼ Diffuse Changes 254
► Anechoic Structure 256
► Hypoechoic Structure 258
► Hyperechoic Structure 261
▼ Localized Changes 262
► Anechoic Structure 263
► Hypoechoic Structure 264
► Hyperechoic Structure 265
▼ Wall Structures 266
► Smooth Margin 266
► Irregular Margin 267
▼ Differentiating Intra- and Extra-
luminal Gl Tract Fluid 269
► Intragastric Processes 269
► Intraintestinal Processes 270
9 Kidneys 273__________________________________________________________
G. Schmidt
▼ Anomalies, Malformations 276
► Aplasia, Hypoplasia 276
► Cystic Malformation 277
► Anomalies of Number, Position,
or Rotation 278
► Fusion Anomaly 280
► Collecting System Anomaly 281
► Vascular Anomaly 281
▼ Diffuse Changes 282
► Large Kidneys 282
► Small Kidneys 287
► Hypoechoic Structure 289
► Hyperechoic Structure 290
► Irregular Structure 295
▼ Circumscribed Changes 296
► Anechoic Structure 296
► Hypoechoic or Isoechoic Struc-
ture 301
► Complex Structure 307
► Hyperechoic Structure 309
► Echogenic Structure 311
10 Adrenal Glands 315___________________________________________________
D. Nuernberg
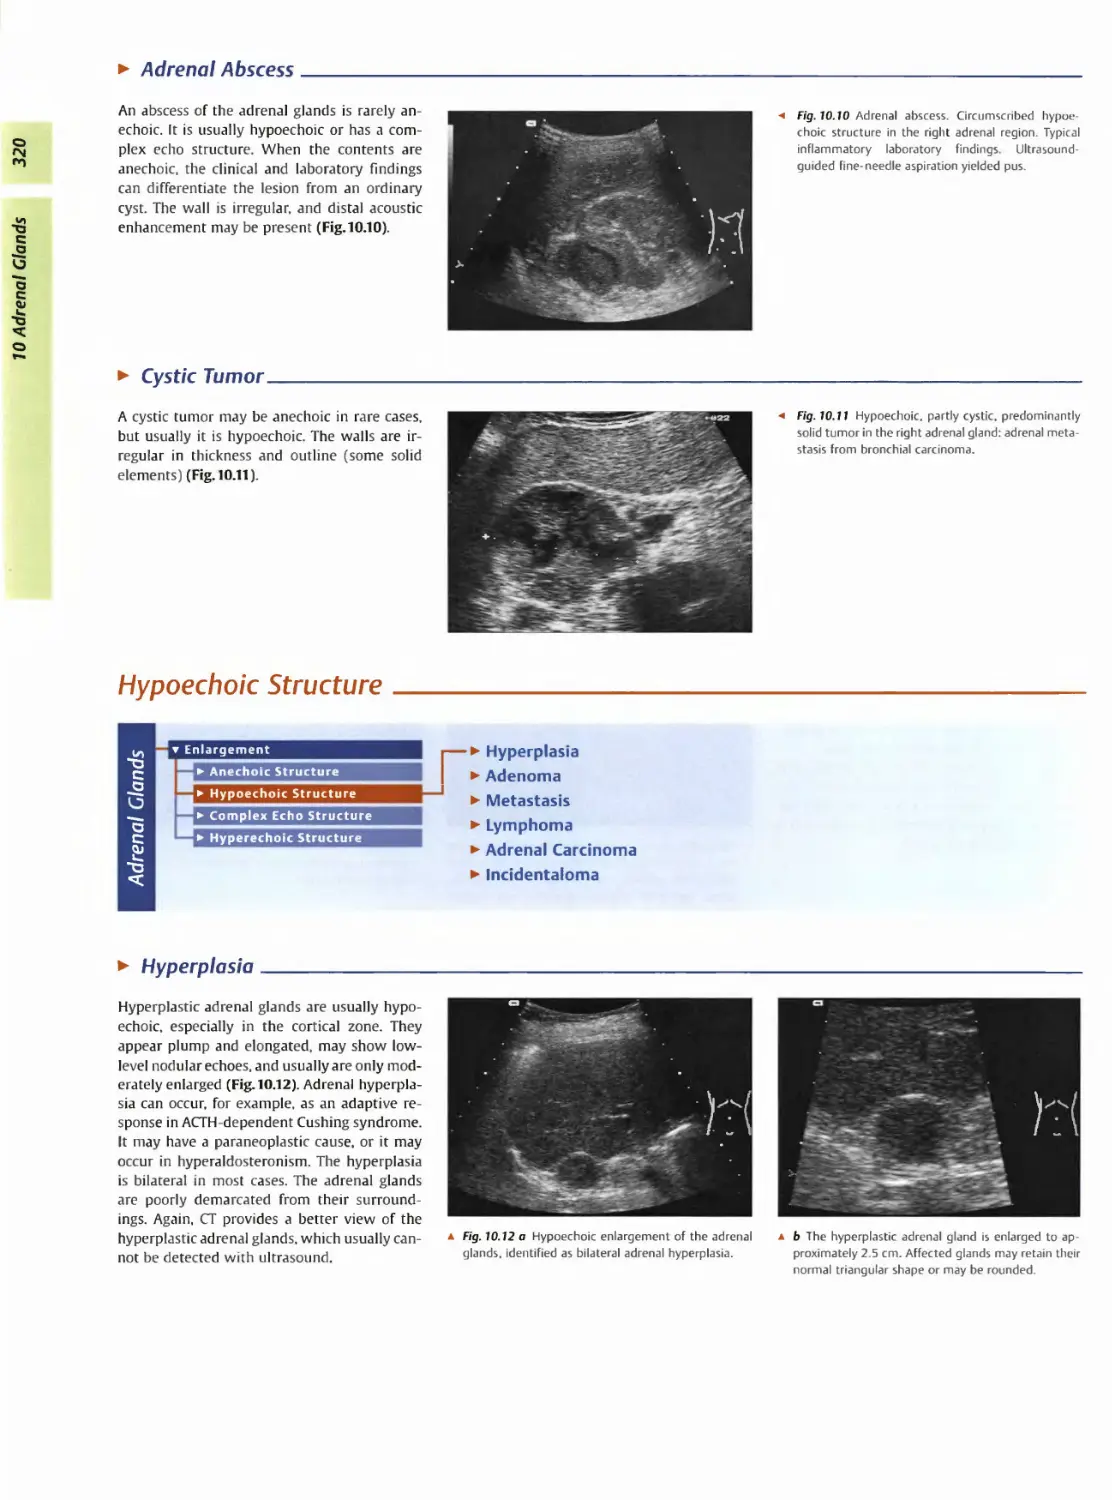
▼ Enlargement 318
► Anechoic Structure 318
ontents
► Hypoechoic Structure 320
► Complex Echo Structure 324
► Hyperechoic Structure 325
11 Urinary Tract 329
G. Schmidt
▼ Malformations 333
► Duplication Anomalies 333
► Dilatations and Stenoses 334
▼ Dilated Renal Pelvis and Ure-
ter 336
► Anechoic 336
► Hypoechoic 342
▼ Renal Pelvic Mass, Ureteral
Mass 344
► Hypoechoic 344
► Hyperechoic 345
▼ Changes in Bladder Size or
Shape 348
► Large Bladder 348
► Small Bladder 349
► Altered Bladder Shape 351
▼ Intracavitary Mass 352
► Hypoechoic 352
► Hyperechoic 355
► Echogenic 358
▼ Wall Changes 359
► Diffuse Wall Thickening 359
► Circumscribed Wall Thickening 360
► Concavities and Convexities 362
12 Prostate, Seminal Vesicles, Testis, Epididymis 365
G. Schmidt
The Prostate 367
▼ Enlarged Prostate 368
► Regular 368
► Irregular 370
▼ Small Prostate 371
► Regular 371
► Echogenic 372
v Circumscribed Lesion 372
► Anechoic 372
► Hypoechoic 373
► Echogenic 375
Seminal Vesicles 376
▼ Diffuse Change 376
► Hypoechoic 376
▼ Testis, Epididymis 379
► Anatomy and Topography 379
Testis, Epididymis 379
» Diffuse Change 380
► Enlargement 380
► Decreased Size 381
▼ Circumscribed Lesion 381
► Anechoic or Hypoechoic 381
► Irregular 383
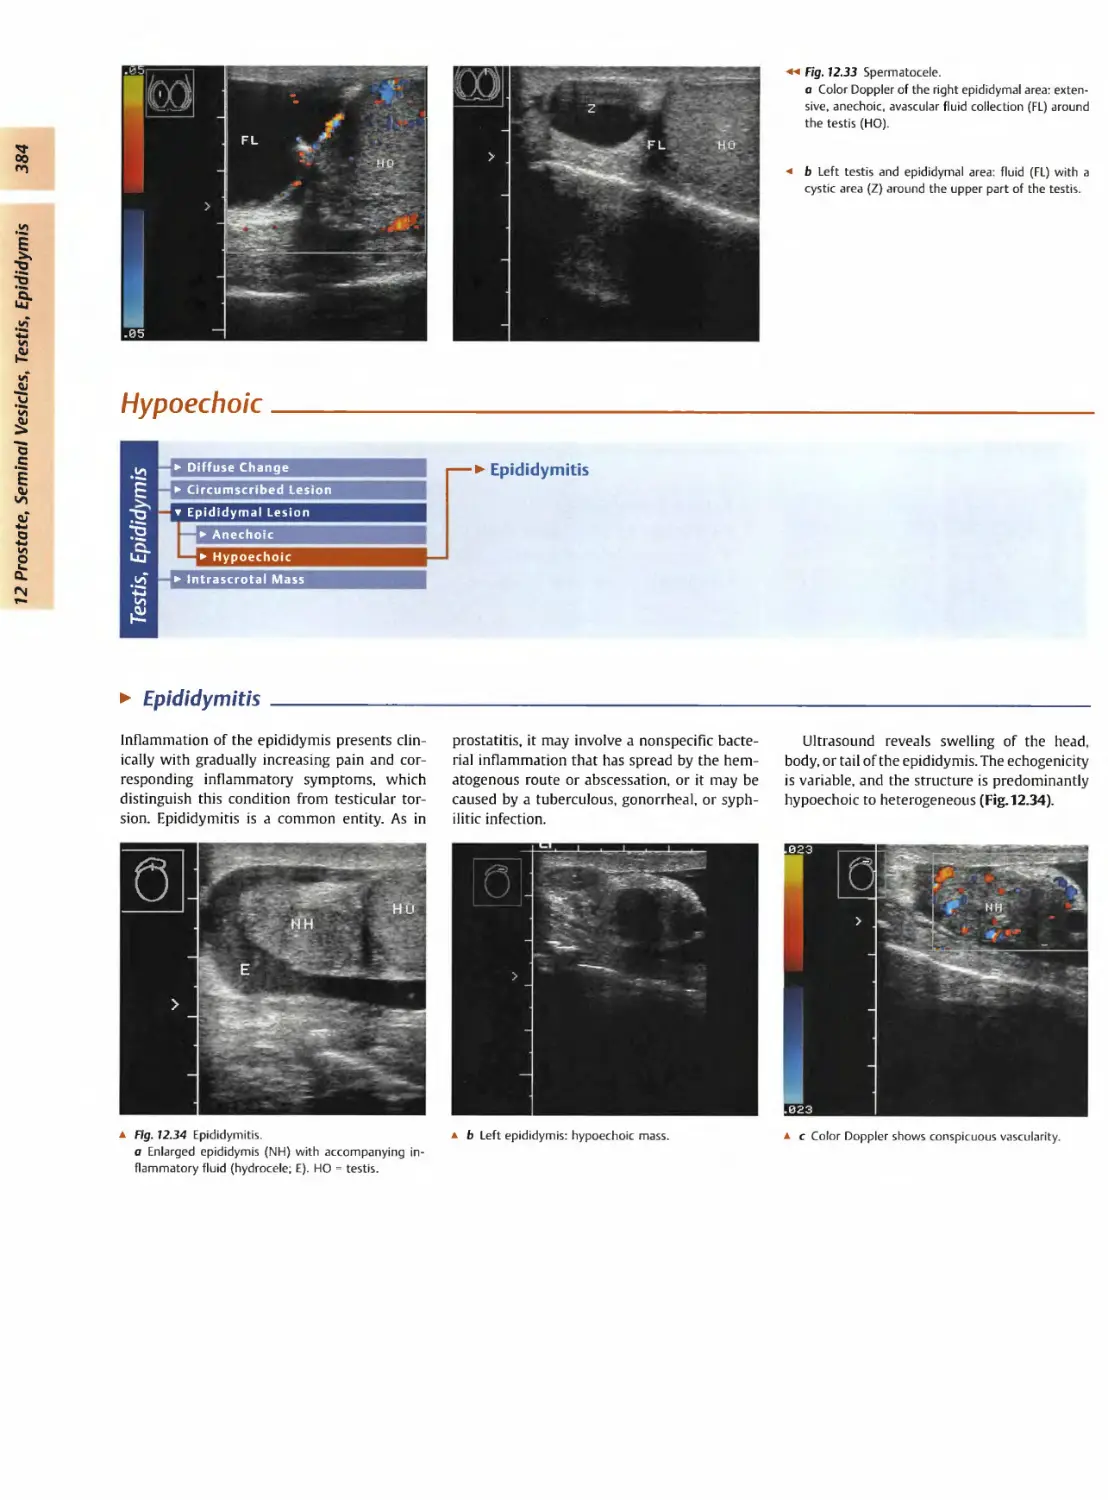
▼ Epididymal Lesion 383
► Anechoic 383
► Hypoechoic 384
▼ Intrascrotal Mass 385
► Anechoic or Hypoechoic 385
► Echogenic 386
▼ Circumscribed Change 377
► Anechoic 377
► Echogenic 378
► Irregular 378
13 Female Genital Tract 387
B. Beuscher-Willems
▼ Vagina 390
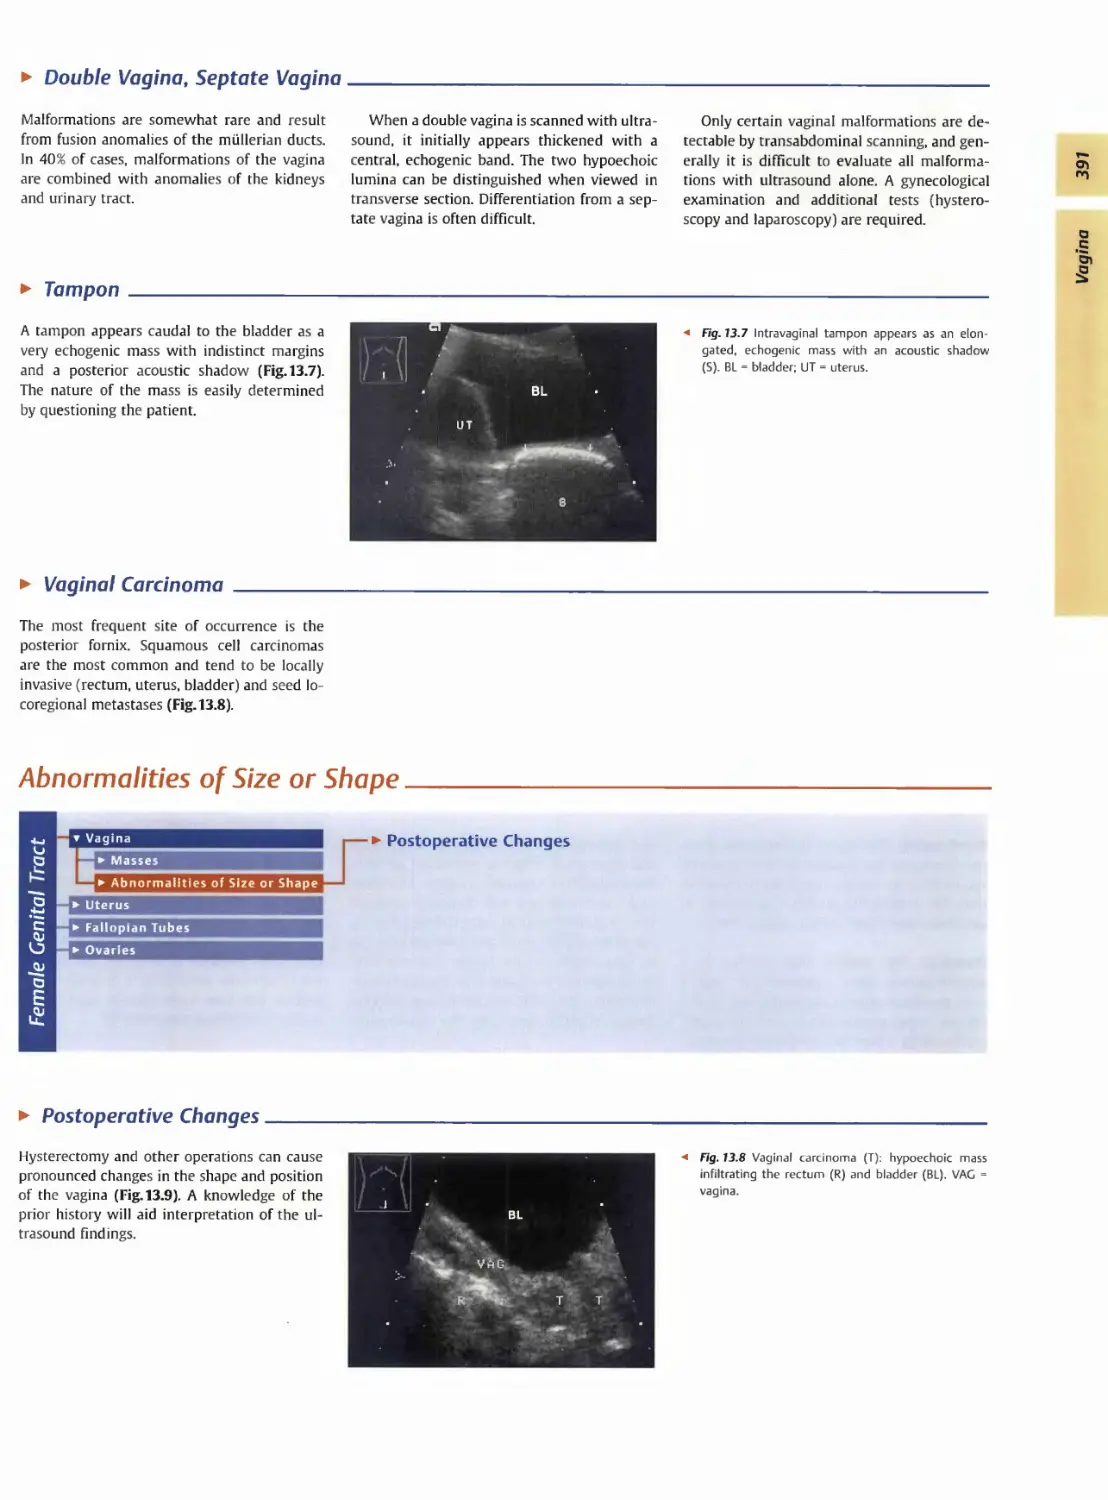
► Masses 390
► Abnormalities of Size or Shape 391
▼ Uterus 392
► Abnormalities of Size or Shape 393
► Myometrial Changes 394
► Intracavitary Changes 396
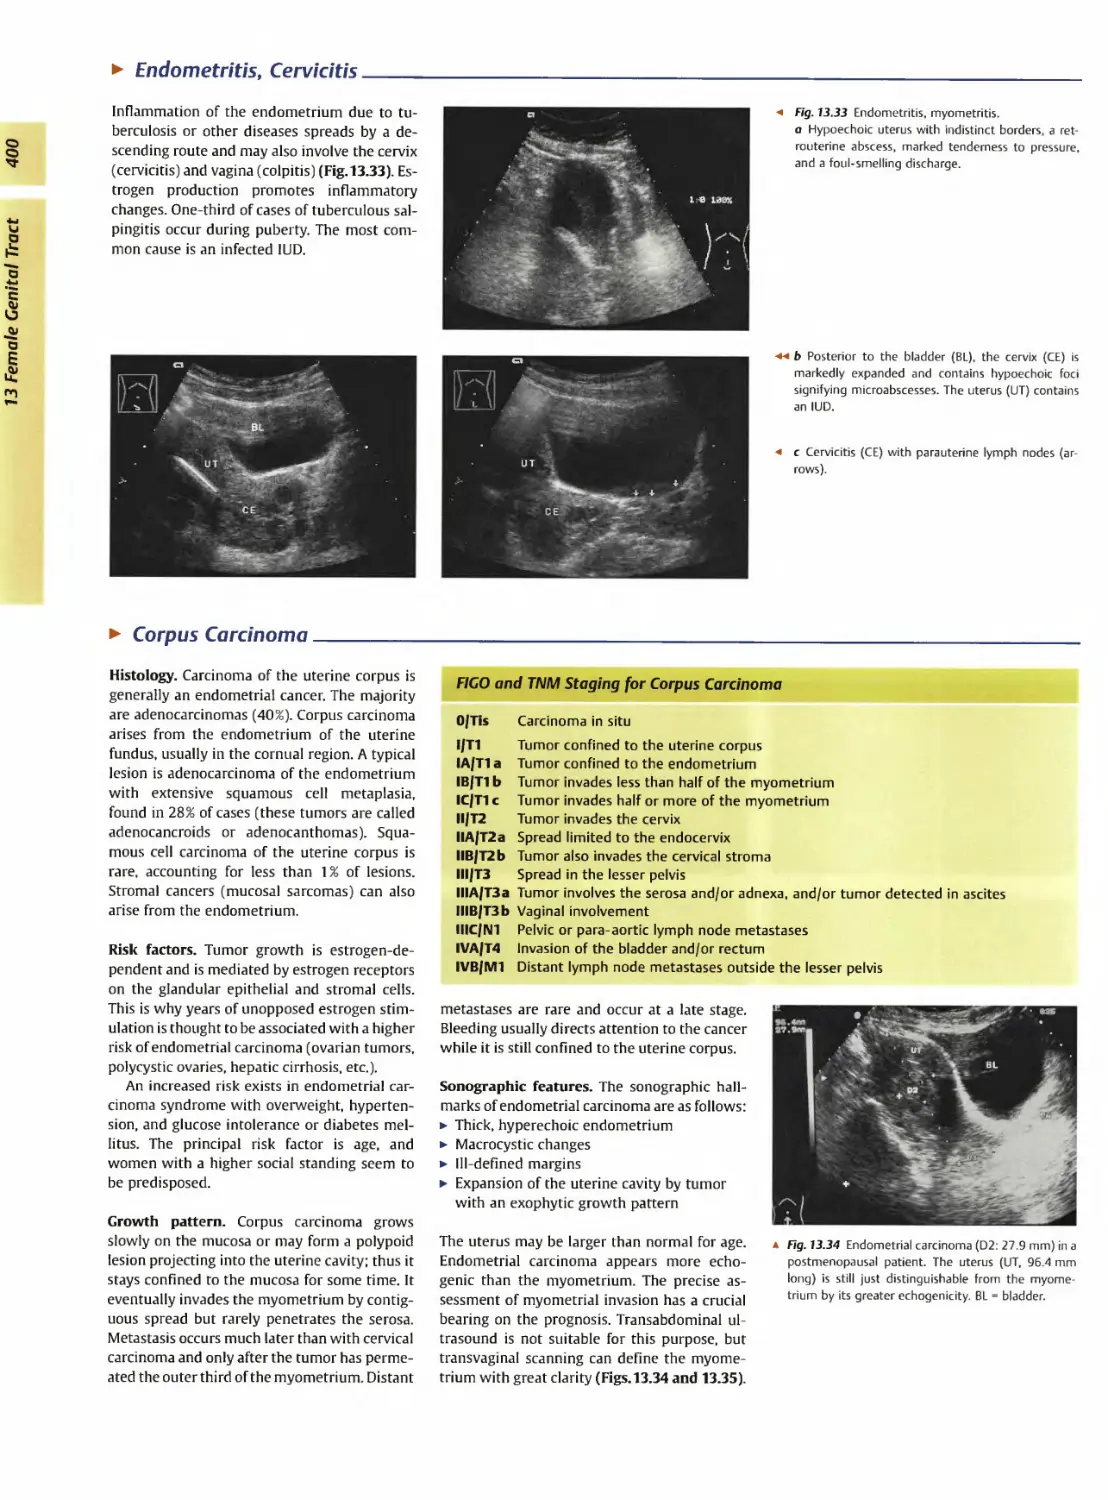
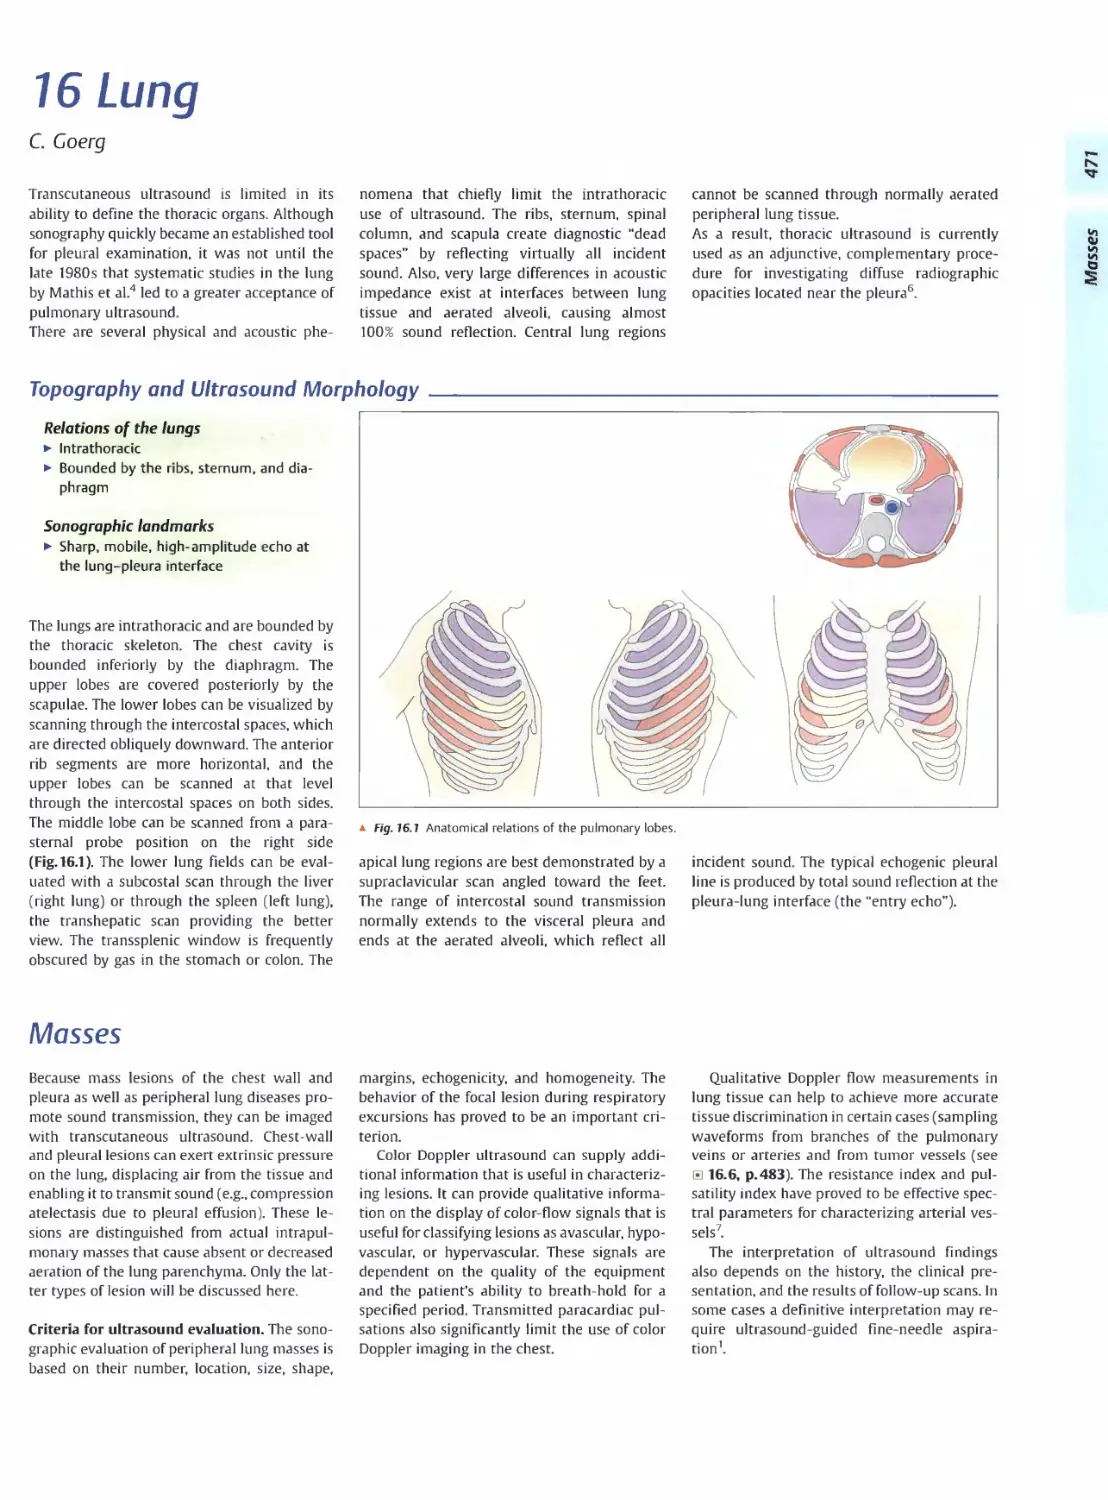
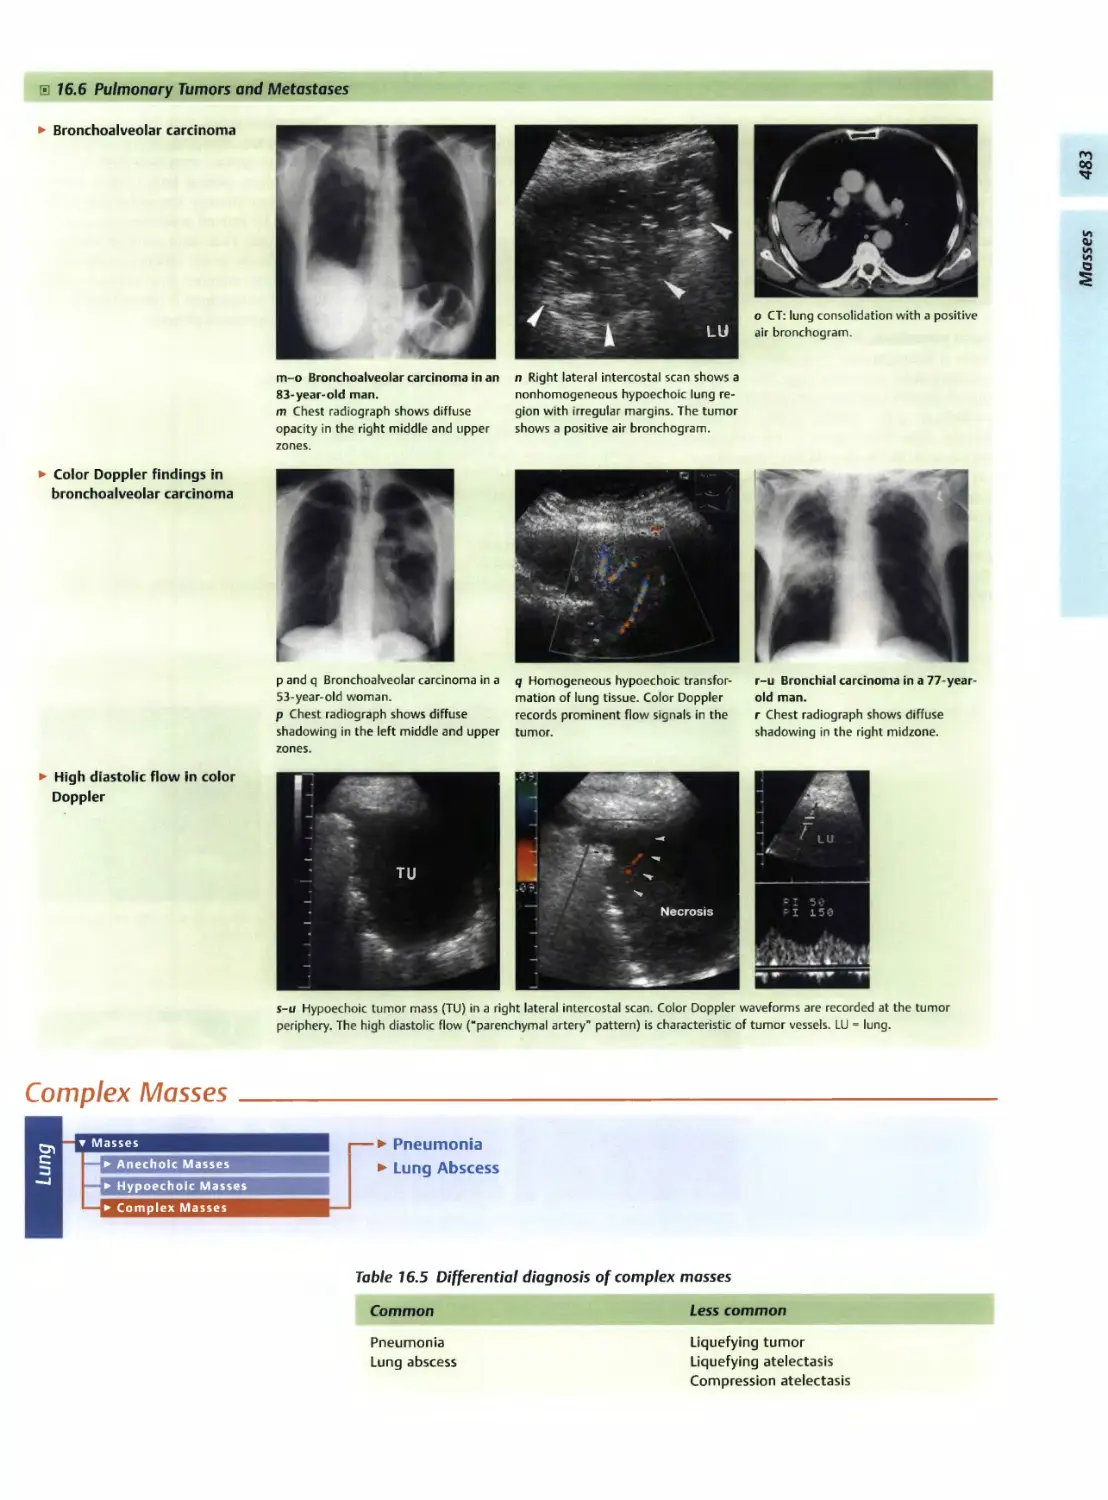
► Endometrial Changes 398
▼ Fallopian Tubes 402
► Hypoechoic Mass 402
▼ Ovaries 403
► Anechoic Cystic Mass 404
► Solid Echogenic or Nonhomogeneous
Mass 407
Contents
14 Thyroid Gland
G. Schmidt
▼ Diffuse Changes 419
► Enlarged Thyroid Gland 419
► Small Thyroid Gland 423
► Hypoechoic Structure 427
► Hyperechoic Structure 429
▼ Circumscribed Changes 429
► Anechoic 429
► Hypoechoic 431
► Isoechoic 438
► Hyperechoic 439
► Irregular 441
▼ Differential Diagnosis of Hyper-
thyroidism 443
► Types of Autonomy 443
75 Pleura and Chest Wall 447
C. Goerg
v Chest Wall 451
► Masses 451
▼ Parietal Pleura 456
► Nodular Masses 456
► Diffuse Pleural Thickening 459
▼ Pleural Effusion 462
► Anechoic Effusion 463
► Echogenic Effusion 464
► Complex Effusion 466
76 Lung 469
C. Goerg
▼ Masses 471
► Anechoic Masses 472
► Hypoechoic Masses 474
► Complex Masses 483
Index 489
Aorta, Vena Cava
and Peripheral Vessels 1
▼ Aorta, Arteries
5
▼ Anomalies and Variant
Positions
5
— ► Situs Inversus
► Aplasia, Hypoplasia, and
Duplication of the Aorta
— ► Coarctation of the Aorta
— ► Oblique/Transverse Course of
the Aorta
- ► Kinking of the Aorta
— ► Variant and Duplicated Arteries
▼ Dilatation
7
— ► Aortic Ectasia
— ► True Aneurysms
— ► Dissecting Aneurysms
— ► False Aneurysms
▼ Stenosis
11
► Aortic Stenosis
— ► Arterial Stenosis
— ► Aortic/Arterial Embolism
— ► Arteriosclerotic Aortic/Arterial
Occlusion
— ► Anastomotic/Bypass Stenosis
— ► Tumor Stenosis/lnfiltration
▼ Wall Thickening
16
— ► Early Arteriosclerotic Lesions
— ► Advanced Arteriosclerotic Lesions
— ► Complex Arteriosclerotic Lesions
— ► Protruding Arteriosclerotic Lesions
— ► White Thrombus
► Arteritis
— ► Mdnckeberg Arteriosclerosis
—- ► Synthetic Grafts
▼ Intraluminal Mass
20
— ► Aortic/Arterial Embolism
— ► Protruding Arteriosclerotic Plaques
— ► White Thrombi
— ► Endovascular Stent
— ► Intimal Dissection
▼ Perivascular Mass
22
► Pseudoaneurysm
— ► Arteriovenous Fistula/Arterio-
venous Malformation
— ► Suture-line Aneurysm
— ► Suture-line Breakdown, Graft
Infection
— ► Hematoma, Abscess
— ► Lymphomas, Metastases
— ► Retroperitoneal Fibrosis
— ► Horseshoe Kidney
— ► Intestinal Loop
▼ Vena Cava, Veins
25
▼ Anomalies
- ► Anomalies/Duplication of the
Inferior Vena Cava
► Anomalies of the Iliac Veins
— ► Duplication of Renal and Peri-
pheral Veins
▼ Dilatation
25
26
► Inferior Vena Cava Engorgement
— ► Prestenotic and Poststenotic
Dilatation
— ► Thrombosis
— ► Venectasia
— ► Venous Insufficiency
▼ Vena Cava, Veins (Continue)
▼ Intraluminal Mass
28
► Venous Thrombosis
► Phleboliths, Calcification
► Venous Valves
▼ Compression, Infiltration
31
—- ► Enlarged Caudate Lobe
► Budd-Chiari Syndrome
► Lymph Nodes, Cysts
— ► Other Masses
► Malignant Tumor
► Anatomy
Portal Vein and Its Tributaries
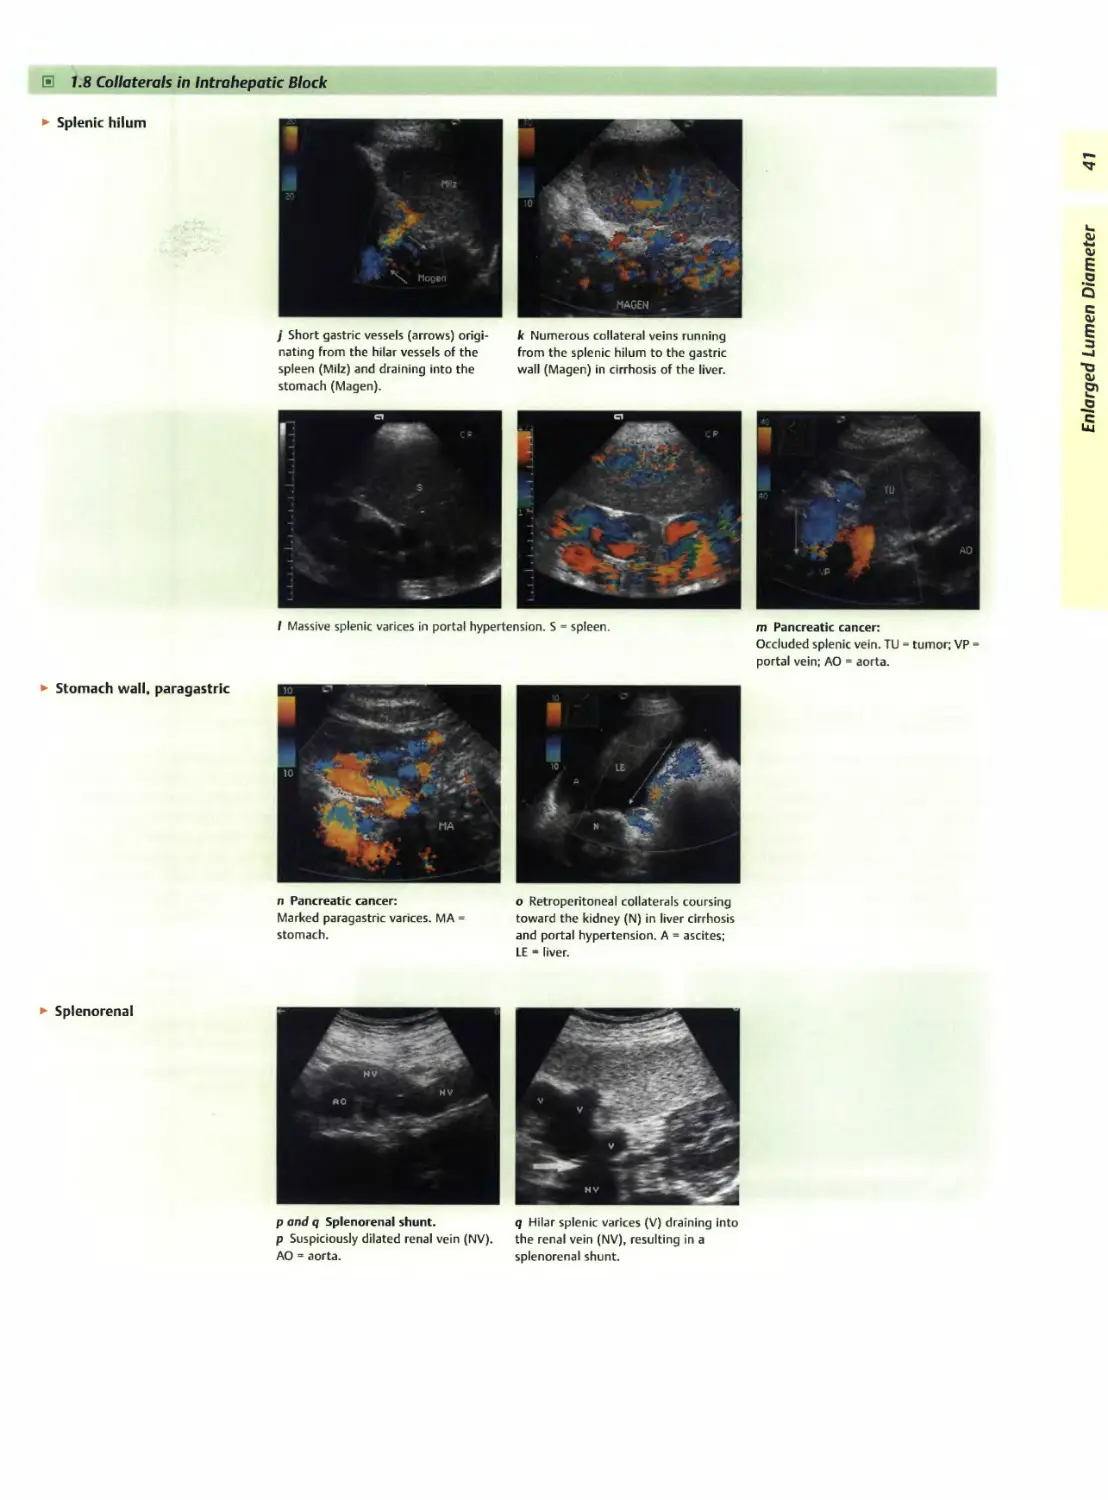
▼ Enlarged Lumen Diameter
^^^^o^a^^pertensio^11
35
35
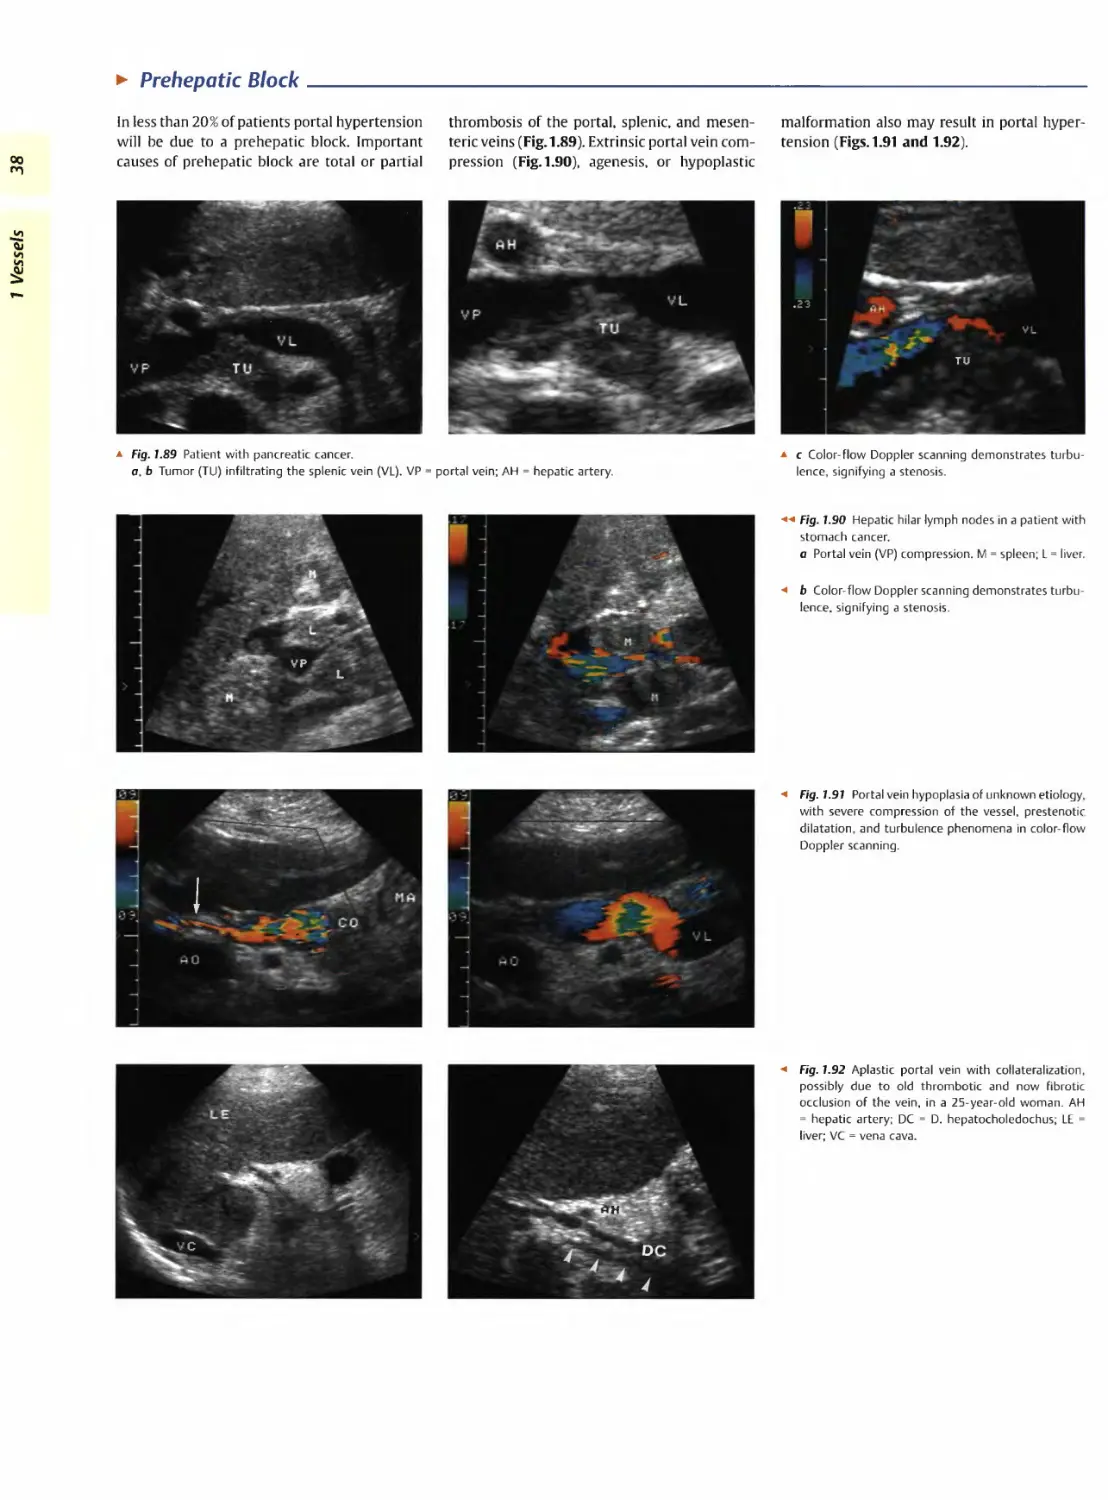
► Prehepatic Block
► Intra hepatic Block
► Posthepatic Block
43
43
48
► Tumor Infiltration
1 Vessels
Aorta, Vena Cava, and Peripheral Vessels
G. Schmidt
Aorta: Anatomy and Topography
Microanatomy
► Intima (endothelial cells), media (smooth-
muscle cells, elastic fibers), adventitia
(fibrocellular connective tissue, vascular
nerves)
► lntima-mediathicknessusually0.4-0.7 mm
Retroperitoneal Branches of the
Abdominal Aorta (incomplete)
► Lumbar arteries
► Left and right common iliac arteries
Splanchnic Branches of the Abdominal
Aorta
► Superior suprarenal arteries
► Celiac axis
► Left gastric artery
► Splenic artery
► Common hepatic artery — gastroduodenal
artery, right gastric artery, hepatic artery
proper
Microanatomy. The intima, the innermost
layer of the aorta, comprises the luminal endo-
thelium and a matrix of fibrils and fibers, while
the media as the thickest layer is organized as
concentric lamellae of elastin and collagen
meshworks with embedded smooth-muscle
cells. In the more peripheral arteries the media
is characterized by a particular abundance of
smooth-muscle cells. The adventitia of the
aorta is composed of fibrocellular connective
tissue and contains a network of vasa vasorum
and vascular nerves. The arterial wall, and thus
the aortic wall as well, is a key element in the
context of atherosclerosis and its clinical man-
ifestation of arteriosclerosis since the latter re-
sults in intimal and medial thickening that can
► Middle suprarenal arteries
► Superior mesenteric artery
► Ovarian/testicular arteries
► Inferior mesenteric artery
Course of the Aorta
► Left of midline and approximately 5 mm
anterior to the spine
► It enters the abdomen through the aortic
hiatus at the level of the lower border of the
12th thoracic vertebra and runs for about
14 cm to the level of the fourth lumbar
vertebra where it bifurcates into the com-
mon iliac arteries —»in turn these bifurcate
into the internal and external iliac arteries
Diameter of the Aortic Lumen
► Normal diameter of the aortic lumen im-
mediately below the diaphragm is 25 mm,
gradually tapering down to 20 mm at the
infrarenal location
be measured by ultrasonography (intima-me-
dia thickness). These pathological changes are
due to lipid accumulation, proliferation of
smooth-muscle cells, and fibroblastic connec-
tive tissue.
Ultrasonography depicts the arterial and
aortic wall as a triple-layered structure with a
hypoechoic layer sandwiched between two hy-
perechoic strata. The degree of atherosclerosis
correlates quite well with the intima-media
thickness, which can be measured using high-
resolution scanners with high-frequency
probes (7.5-10 Mhz). The changes in wall thick-
ness are a function of both age and atheroscle-
rosis; for example, the normal wall of the caro-
tid artery is 0.4-0.7 mm thick (Figs. 1.1 and
1.2). The sonographic measurements match
the thickness determined histologically.
1 Vessels
Retroperitoneal branches of the abdominal
aorta. The abdominal aorta gives off paired
retroperitoneal as well as (mostly intraperito-
neal) splanchnic branches. The retroperitoneal
branches comprise the lumbar arteries, which
are of no significance in ultrasonography, and
the common iliac arteries, which are essential
guideline structures and important in ultra-
sound pathology (Fig. 1.3).
Splanchnic branches of the abdominal aorta.
With the advent of color-flow Doppler scans,
imaging of the splanchnic branches of the aorta
л Fig. 1.1 Intima-media thickness of the right common
carotid artery (ACC): regular arterial wall with triple
layering as a result of reflection from the interfaces
between intima, media, and adventitia. In this case
the intima-media thickness is measured as 0 5 mm
(cf. the calipers).
a Fig. 1.2 Abdominal aorta—course and measurement
of the wall thickness.
a The upper section of the abdominal aorta runs
posterior to the liver. In the color-flow Doppler, lam-
inar flow toward the probe is coded red.
a b Same 73-year-old female patient: the thickness of
the aortic wall with an intima-media thickness of
1 mm (calipers) is normal for this age. AO = aorta.
1 Vessels
has played an increasingly important clinical
role in organ studies and the detection of dis-
ease. Acute chronic intestinal ischemia is easily
diagnosed using color-flow Doppler (Fig. 1.29,
p.15). All splanchnic branches (Fig.1.3) are
quite accessible to ultrasonography.
Course of the abdominal aorta. The abdomi-
nal aorta courses over a distance of about 14 cm
from the aortic hiatus of the diaphragm at the
level of the lower border of the 12th vertebra
to the level of the fourth lumbar vertebra
wheie it bifurcates into the common iliac ar-
teries. In its beginning it passes anterior to the
esophagus, which turns left toward the esoph-
ageal hiatus and is easily distinguishable by its
target sign dorsal to the aorta. It then runs as a
smooth straight band not more than 5 mm
antenor to the spine, hugging its curvature;
thus it follows the lumbar lordosis in an in-
creasingly anterior direction.
Diameter of the aortic lumen. The maximum
diameter of the upper intra-abdominal aortic
lumen is 25 mm, tapering down to 20 mm at
the intrarenal region; any larger diameter
signifies ectasia (< 30 mm) or an aneurysm
(> 30 mm) (Figs. 1.14-1.16, a 1.1 and s 1.2).
Inferior Vena Cava: Anatomy and Topography
Retroperitoneal and Splanchnic
Branches
(except for: splenic vein, superior and infe-
rior mesenteric vein, left and right gastric
vein = tributaries to the portal vein)
► Left and right common iliac vein
► Lumbar veins
► Left and right renal vein
► Right ovarian/testicular veins (the corre-
sponding left veins drain into the left
renal vein)
► Hepatic veins
Course of the Inferior Vena Cava
► Right of the midline, anterior to the
spine, and paralleling the aorta
Lumen Diameter of the Inferior Vena
Cava
► Physiologic caliber changes
► Lumen fluctuates with respiration
► A diameter in excess of 20 mm is patho-
logical: more precisely, it is pathological if
the inferior vena cava shows a loss of
kinetics—i.e., no change in caliber with
respiration or on compression
Microanatomy. The venous wall is quite thin
consisting of smooth-muscle cells and fibrocel-
lular collagen bundles.
The low intrinsic pressure and the thin wall
combine to make the inferior vena cava suscep-
tible to caliber changes and extrinsic compres-
sion. Therefore, adjacent pathological proc-
esses may result in compression, impression,
and displacement (see Figs. 1.76,1.78-1.80).
Retroperitoneal and splanchnic branches.
While all retroperitoneal branches mirror the
arterial tiee in that they are tributaries to the
vena cava, only some of the splanchnic veins
(renal, suprarenal, ovarian/testicular, and hep-
atic veins) drain into the inferior vena cava
(Fig. 1.4) and the others into the portal vein
(splenic, mesenteric, gastric, and pancreatic
veins).
Course of the vena cava. The right and left
common iliac veins join at the level of the fifth
lumbar vertebra and thus give rise to the infe-
rior vena cava. It courses right of the aorta and
anterior to the spine hugging the lumbar lor-
dosis. It passes along the posterior surface of
the liver dorsal to the caudate lobe, receives the
vein of the caudate lobe and at the ‘bare area’
the three hepatic veins as well. It then enters
the thoracic cavity through the central tendon
of the diaphragm, immediately terminating in
the right atrium (Fig. 1.5).
Lumen diameter of the inferior vena cava.
Since the inferior vena cava demonstrates
physiological as well as respiration-induced
caliber changes it does not exhibit a constant
and precise lumen diameter. Nevertheless, a
subphrenic diameter of more than 20 mm
may be regarded as abnormal when associated
with a lack of respiration induced changes in
the lumen diameter and no compressibility.
Hepatic veins
Renal artery
Celiac axis
Superior
mesenteric artery
Inferior vena cava
Inferior
mesenteric artery
External
iliac artery
Internal
iliac artery
External iliac vein Internal iliac vein
Fig. 1.4 Inferior vena cava and its branches
a Fig. 1.5 Inferior vena cava and its branches.
a Upper section of the subphrenic inferior vena cava
(VC): it courses posterior to the liver bordering the
caudate lobe, just before it is joined by the hepatic
veins (LV). H = right atrium; E = small pleural effusion;
L = liver.
a b Longitudinal plane through the inferior vena cava
with probe angled from right to left: In this image the
vena cava is uppermost, being crossed posteriorly by
the right renal vein. Since the aorta runs to the left of
the vena cava in this image, it appears at the bottom
(this atypical plane provides the best view of any
lymphomas between aorta and vena cava). The
cross-section of the portal vein with an oblique view
through the gallbladder is anterior to the vena cava.
Aorta, Arteries
Anomalies and Variant Positions______________________________________
И
a*
и
и
▼ Aorta. Arteries
► Anomalies and Variant
Positions
Dilatation
► Stenosis
► Wall Thickening
► Intraluminal Mass
► Situs inversus
► Aplasia, Hypoplasia and Duplication of the Aorta
► Coarctation of the Aorta
► Oblique/Transverse Course of the Aorta
► Kinking of the Aorta
► Variant and Duplicated Arteries
► Perivascular Mass
Aorta. Arteries
► Vena Cava, Veins
► Situs Inversus____________________________________________________________________________________
Anomalies of the aorta are quite rare; a situs
inversus is the most likely reason for surprise
but in most cases it is already known to the
patient (Fig. 1.6).
* Fig. 1.6 Situs inversus viscerum: the aorta is on the
right and the vena cava (not depicted) on the left: in
most cases the diagnosis is clear-cut if both subcos-
tal views demonstrate malrotation of the liver, i.e., it
is located on the left.
► Aplasia, Hypoplasia, and Duplication of the Aorta
Aplasia, hypoplasia, and duplication of the
aorta are extremely rare and in most cases
they will have been diagnosed during the peri-
natal period. Usually an aplastic aorta results in
a fatal defect and only two cases of aortic du-
plication have been described in the literature.
Artifacts feigning duplication may arise in the
transverse epigastric plane from the prismlike
effects of the fatty tissue between the rectus
abdominis muscles, which result in refraction
artifacts4,3. There is also the possibility of a
misdiagnosis due to physical ultrasound if
echo reverberation produces an image of mul-
tiple aortas. The preferred location of this
mirroring is found at especially hard interfaces,
e.g., plaque incrustation of the aortic wall; here,
* Fig. 1.7 Mirror imaging of the aorta (artifact) due to
the parallel thin echogenic lines. AO = aorta.
a kind of ping-pong effect at the echointensive
reflectors increases the transit time, which in
turn generates multiple images of the aorta
(Fig. 1.7)
► Coarctation of the Aorta______________________________________________________________________
Congenital circumscribed circular narrowing of
the aorta is known as aortic coarctation. It is
found at several segments of the aorta: for the
abdomen these are segments IV (from the sub-
phrenium to below the renal arteries) and V (all
the way to the aortic bifurcation). Sonograph-
ically these stenoses are best studied by color-
flow Doppler imaging and analysis of the flow
parameters (see below).
► Oblique/Transverse Course of the Aorta
VO
7 Vessels
In case of severe scoliosis or kyphosis of the
spine, the aorta will follow this course; the
usual longitudinal plane may result in a double
lumen, while the transverse view would depict
the aorta as a short bandlike structure (Fig. 1.8).
a Fig. 1.8 Oblique course of the aorta due to kinking.
a Longitudinal subxiphoid plane: because of its obli-
que course the aorta is visualized twice.
л b Oblique subxiphoid plane the aorta (AO) has been
insonated in an almost exact longitudinal direction
Calipers: aortic ectasia bordering on an aneurysm.
► Kinking of the Aorta
Hypertension and arteriosclerosis can lead not
only to an ectatic but also tortuous aorta. Since
the spine does not yield, the aorta becomes
displaced in a lateral and/or anterior direction
and escapes detection by the standard view in
the paramedian plane. If the vessel does not
follow a normal straight course, the probe
should be angled and shifted laterally in order
to demonstrate any kinking (Fig. 1.9).
a Fig. 1.9 Kinking of the aorta (AO) induced by hyper-
tension and arteriosclerosis (arrows: arteriosclerotic
lesions).
► Variant and Duplicated Arteries
The intraperitoneal and retroperitoneal vessels
exhibit numerous variations in their branches
and may course atypically or even become du-
plicated. Variants of clinical significance are
found at the celiac axis and the renal arteries,
as demonstrated by the following examples:
► Variants of the celiac axis (Figs. 1.10 and 1.11)
► Duplicated renal arteries (Fig. 1.12)
► Renal artery coursing anterior to the vena
cava (Fig. 1.13).
Figure 1.10 is a schematic summary of the most
important variants of the celiac axis (based on
Netter). The most common variant anatomy is
found in only 25% of cases: here, the left gas-
tric, common hepatic, and splenic arteries arise
from a common trunk, the so-called “Tripus
Halleri." Quite often the left gastric artery
branches off first, followed by the other two
arteries.
a Fig.1.11 Variant anatomy of the celiac axis.
AO = aorta; AL = splenic artery; AH = hepatic artery.
a Separate origins of the hepatic and splenic arteries
from the aorta.
Incomplete
celiac trunk
Celiac trunk
Gastrophrenic
trunk
Hepatomesenteric
trunk
a b Atypical origin of the superior mesenteric artery
(AMS) from the celiac trunk (TR): celiomesentenc
trunk. V = superior mesenteric vein.
a Fig. 1.10 Variant anatomy of the celiac axis (based on Netterq 9).
л Fig.1.12 Duplication of the renal artery.
a Longitudinal view: cross-section of two distinct
arteries (arrows) posterior to the vena cava (VC).
a b Transverse view of the right upper quadrant, color-
flow Doppler study. Both renal arteries (A) are de-
picted; if stenosis of the renal artery is suspected,
possible duplication should be ruled out. AO = aorta.
a Fig. 1.13 Irregular course of the right renal artery
(ARD) anterior to the vena cava (VC), secondary find-
ing: partial thrombosis (TH) of the vena cava. AO =
aorta.
Aorta, Arteries
Dilatation_______________________________________________________________________
£
Oi
и
и
Qj
▼ Aorta, Arteries
Anomalies and Variant Post-
tions
Dilatation
Stenosis
ijJ^WalTThickenin^™
intraluminal Mass
Perivascular Mass
► Vena Cava, Veins
— ► Aortic Ectasia
► True Aneurysms
► Dissecting Aneurysms
► False Aneurysms
► Aortic Ectasia______________________________________________________________________________________
A condition where the lumen diameter of the
aorta expands to 25-30 mm is defined as ecta-
sia. The primary trigger factors for this degen-
eration are hypertension and arteriosclerosis.
In most cases an ectatic aorta also displays a
tortuous course (Fig. 1.14).
a Fig. 1.14 Ectatic aorta with severe insufficiency of the aortic valve: tortuous ectatic aorta.
► True Aneurysms___________________________________________________________________
An aneurysm is a localized dilatation of the
arterial wall. Aneurysms may be classified as
follows:
► Etiology
- Congenital
- Atherosclerotic
- Dissecting
- Inflammatory
- Traumatic aneurysms
► Morphology
- Fusiform
- Pouch-shaped
- Tortuous
- Cylindrical
- Saccular
- Navicular aneurysms
► Pathogenesis
- True
- False (pseudo )
- Dissecting aneurysms
Aortic aneurysms. A practical working defini-
tion of abdominal aortic aneurysms is a trans-
verse lumen diameter of at least 30 mm. Local-
ized atheromatous lesions in the wall facilitate
the dilatation of the vessel and impair its con-
tractility, resulting in a weakened aortic wall
with aneurysm formation. Small aneurysms do
not usually have any thrombotic deposits.
Larger aortic aneurysms are characterized by
dilatation, arteriosclerosis, and white thrombi,
each of these being identifiable by ultrasound.
If all three signs can be demonstrated sono-
graphically, the diagnosis of an aneurysm is
confirmed.
Increased size. Aneurysms tend to expand in
size over time. The larger the lumen becomes
the less pressure the wall will tolerate before
rupturing. According to Laplace’s law the ten-
sion in the wall is directly proportional to the
radius; thus, small aneurysms with a diameter
00
1 Vessels
л Fig. 1.15 Borderline aortic aneurysm: localized ex-
pansion of the ectatic aorta (AO) to 29.5 mm just
cephalad of the bifurcation.
a Fig. 1.16 Large aortic aneurysm.
a В-mode image: all criteria of a true aneurysm are
fulfilled: widening of the vessel, sclerosis of the aorta
(arrows), white thrombi (TH). AO = aorta.
a b Color-flow Doppler: the remaining perfused lumen
is defined by the color-coded signal; the color change
(from red through black to blue) signifies the change
in the flow direction—the flow toward the probe is
red, and away from the probe it is blue.
Formal and Causative Aneurysm Formation
In true aneurysms there is a localized dila-
tation of the entire wall, the most frequent
cause being arteriosclerosis. Congenital
aneurysms arise from defects in orfibromus-
cular dysplasia of the media. Most mycotic
aneurysms are sequelae of systemic mycosis.
False aneurysms result from vascular
trauma (nowadays most often because of
diagnostic procedures, such as catheteriza-
tion) leading to perivascular hematoma that
is walled off by the surrounding tissue and
quite often ends up becoming thrombosed.
Dissecting aneurysms occur spontaneously
in middle-aged and older adults, with hyper-
tension being one of the most common fac-
tors. Congenital (Marfan syndrome, idio-
pathic cystic necrosis of the media) and
acquired (syphilis) etiology plays a minor
role. The trigger event is a tear in the intima
(entry point) with blood now forcing itself
into the media. This results in a “pseudo-
lumen” which rejoins the true lumen at a
more caudad location through another tear
in the intima (reentry point).
of less than 5 cm are not very likely to rupture
while in aneurysms with a diameter of more
than 7 cm the probability of rupture within one
year approaches 50%. The aneurysm expansion
rate can be monitored sonographically : aneur-
ysms of more than 5 cm in diameter exhibit a
mean annual increase in diameter of 0.6 cm,
while for smaller aneurysms the corresponding
value drops to 0.2 cm. Patients with diagnosed
aneurysms should undergo follow-up scans
every three to six months (Figs. 1.15 and 1.16,
3 1.2 a and b).
В 7.7 The Shape of Aortic Aneurysms
► Tortuous, berry-shaped,
fusiform aneurysm
a Tortuous aortic aneurysm. These
forms are difficult to define with ultra-
sound because the loops usually run
sideways (see E 1.2c).
b Pouch-shaped aneurysm. Character-
istic small asymmetric anterior bulge
(arrow). AO = aorta.
c Fusiform aneurysm (AN): steadily in-
creasing dilation of the aortic wall with
subsequent reduction to the original
diameter (here at the bifurcation into
the iliac artery (AIS). AO = aorta; VC =
vena cava.
► Cylindrical, saccular,
boat-shaped aneurysm
d Large cylinder-shaped aortic aneur-
ysm extending over 13.2 cm, i.e., in-
cluding the renal arteries (distance from
aortic bifurcation is more than 9.5 cm!).
e Saccular aneurysm: remaining lumen
(AO) in the center surrounded by a
concentric thrombosis; the aneurysm
ends where the aorta bifurcates into the
iliac artery (Al). Characteristics: diame-
ter 10 cm and more, balloonlike shape.
f Boat-shaped aneurysm (AN; cursors).
The aneurysm projects anteriorly on
one side.
S 1,2 Diagnosis in Aortic Aneurysm
► Aneurysm extent, aneurysm
complications
Cl
a and b Aortic aneurysm with open
rupture, transverse subxiphoid scans.
a В-mode image: suprarenal aortic
aneurysm (A) with partial thrombosis
and anechoic band (arrow) extending to
a subhepatic fluid pool.
b Color-flow Doppler image: rupture
leaking blood; the turbulence produces
this “confetti-like” phenomenon.
c Tortuous aortic aneurysm (AO A).
Origin of the renal artery (A, arrow) and
celiac trunk (TR, cut by the scan) from
the aneurysm. VR = renal vein.
Aorta, Arteries
d Aneurysmosis of the aorta (A): the
complete vessel has been turned into a
succession of aneurysms. Right para-
median transverse subxiphoid view:
crescent-shaped mass in the porta
hepatis. initially misdiagnosed as gall-
bladder (CB).
e Color-flow Doppler: the anechoic
masses in d are part of the aortic
aneurysmosis (A); without the color-
flow Doppler the anechoic crescent
would be misdiagnosed as gallbladder.
f Longitudinal subxiphoid view in the
median plane: adjacent saccular aneu-
rysms.
g and h Aneurysm extent:
g Origin of the celiac trunk (TR) from
the aneurysm (AO).
h Origin of the right renal artery (ARD)
from the aortic aneurysm (AOA).
VC = vena cava.
i Aortic aneurysm (AN), junction with
the aneurysmal right and left iliac ar-
teries (AID, AIS). Longitudinal scan
plane from right to left (to the origin of
the inferior mesenteric artery, see
Fig. 7.45, p. 243).
j In the color-flow Doppler there is
turbulent blood flow with color
changes. AO = aorta.
к Right subxiphoid view in the longi-
tudinal plane: the vena cava (VC) is in-
sonated through the oblique section of
the aneurysm (AN). AR = renal artery.
1 Vessels
a Fig. 1.17 Thoracic aortic aneurysm (AO), TEE: expan-
sion of the aorta to 40 mm, floating thrombus within
the lumen (red thrombus made up of fibrin and red
blood cells; arrows). Massive thickening and sclerosis
of the wall.
Aneurysm morphology. Ultrasound imaging
depicts the different shapes possible in abdomi-
nal aortic aneurysms. Most often the fusiform,
pouch-shaped, and tortuous aneurysms—and
some of the saccular ones as well—are true
aneurysms. Other saccular aneurysms and the
unilateral navicular type may be classified as
dissecting aneurysms. Cylindrical aneurysms
start and end rather abruptly and therefore ap-
pear cylinder-shaped.
The various shapes of abdominal aortic
aneurysms are illustrated in И 1.1.
Diagnosis in abdominal aortic aneurysms.
Aortic aneurysms command special interest
because of their high propensity to rupture. In
ultrasound studies the rupture appears as an-
echoic para-aortic band (“stable” rupture), and
is confirmed for certain when the leak with its
blood jet (“open" rupture) can be demon-
strated (a 1.2a and b). In most cases this life-
threatening emergency, with its vital indica-
tion for emergency repair, does not leave
much time for any detailed study.
Other essential parameters to note during
ultrasound imaging of abdominal aortic aneur-
ysms are location, length, and the possible
involvement of the renal and iliac arteries
(И 1.2c-h).
Nonaortic aneurysms. Aneurysms are not
limited to the aorta but may be found in other
intra- and retroperitoneal or peripheral (sub-
clavian artery) vessels as well. However,
isolated iliac artery aneurysms without an as-
sociated abdominal aortic aneurysm are rare
(H 1.2 i-k).
The images in В 1.2 are a diagnostic summary
of aortic and nonaortic aneurysms.
Thoracic aortic aneurysm. Most often a true
aneurysm of the thoracic aorta is diagnosed
first on plain chest films and then confirmed
by TEE (transesophageal echocardiography) or
CT (computed tomography) (Fig. 1.17).
► Dissecting Aneurysms_______________________________________________________________________________
In ultrasonography, dissecting aneurysms are
characterized by an echogenic intima floating
in synchronous motion with the pulse, or this
echogenic intima may be thickened and rigid
because of atherosclerosis. The vessel itself
may be dilated and display all other signs of
an aneurysm; however, quite often the artery
appears otherwise normal, and the diagnosis is
confirmed only by demonstrating the shea red-
off intima within the lumen generating the
color-flow Doppler image of two distinct lu-
mina.
In more than 90% of patients, dissection
with its massive, sharp chest pain will com-
mence as thoracic aneurysm and propagate to
the abdominal aorta (Stanford classification
type B: begins at the ascending aorta or the
aortic arch with possible extension to the ab-
dominal aorta). Thoracic aneurysms immedi-
ately distal to the aortic valve (Stanford classi-
fication type A: involving only the aortic arch
and ascending aorta) are diagnosed sono-
graphically by echocardiography or TEE
(Figs. 1.18 and 1.19).
a Fig. 1.18 Dissecting abdominal aortic aneurysm (AN), upper abdominal longitudinal scan (a) and transverse scan
(b): intraluminal intimal flap (arrows).
a Fig. 1.19 Dissecting aortic aneurysm. Stanford type
A. TEE demonstrates the intraluminal hyperechoic
intima (arrows) and the thrombosed, nonperfused
lumen of the dissected area. (Patient declined sur-
gery, died suddenly 2 weeks later.) AO = aorta.
► False Aneurysms_________________________________________________________________
Aorta. Compared with the false aneurysms
(pseudoaneurysms) most common today, i.e.,
after puncture of the femoral artery, traumatic
aneurysms of the aorta aie quite rare. Some-
times false aortic aneurysms are seen as a result
of suture-line leakage but these anastomotic
pseudoaneurysms of the aorta are also rather
infrequent. In ultrasound studies they appear
as an anechoic periaortic mass, usually situated
at the anastomosis and coursing with the aorta.
Femoral artery. Catheterization of the femoral
artery is complicated by a fairly significant rate
of pseudoaneurysm formation. The diagnosis is
confirmed by color-flow Doppler, which shows
blood spurting into the cavity of the aneurysm.
This differentiates the diagnosis from other
perivascular masses (see below). Quite often
the leak is pinpointed precisely by the blood
jet and may then be treated by compression of
this area with the probe, resulting in thrombo-
sis of the leak and thus closure (Fig. 1.20).
a Fig. 1.20 False or pseudoaneurysm after catheteriza-
tion of the femoral artery (AF): systolic jet (arrow)
with leakage of blood and hematoma formation.
Stenosis
И
cu
<✓)
tn
Oj
r Aorta, Arteries
► Anomalies and Variant Posi-
tions
► Wall Thickening
► Intraluminal Mass
— ► Aortic Stenosis
► Arterial Stenosis
► Aortic/Arterial Embolism
► Arteriosclerotic Aortic/Arterial Occlusion
► Anastomotic/Bypass Stenosis
► Tumor Stenosis/lnfiltration
Perivascular Mass
Vena Cava, Veins
Aorta, Arteries
► Aortic Stenosis____________________________________________________________________________________
Stenosis of the aorta may be depicted directly
in В-mode imaging, or it can be demonstrated
by color-flow Doppler and spectral analysis of
the blood flow. Apart from the congenital nar-
rowing due to coarctation of the aorta (see
above), most often these are multiple or exten-
sive atherosclerotic stenoses. A peak systolic
velocity of more than 200 cm/s in the Doppler
spectral analysis is indicative of hemodynami-
cally significant arterial stenosis8.
Arteriosclerotic stenotic lesions also exhibit
complex protuberances that produce luminal
stenosis of varying significance. Generalized
sclerosis of the aorta will lead to severe narrow-
ing of the aortic lumen (Figs. 1.21 and 1.22).
a Fig. 1.21 Arteriosclerotic sclerosis of the aorta: se-
vere narrowing of the distal aortic lumen (AO) due
to complex calcified plaques with posterior shadow-
ing (S)
a Fig. 1.22 Disseminated arteriosclerotic sclerosis of
the aorta.
о Multiple stenoses of the aorta (AO) due to complex
calcified plaques with posterior shadowing (S)
a b Paramedian view from the left with slightly angled
probe, illustrating the plaques and thrombi protrud-
ing severely into the lumen
► Arterial Stenosis_______________________________________________________________________________________
Splanchnic arteries. Although stenosis of the
intraperitoneal and peripheral arteries is a
quite common finding, the narrowing of the
lumen tends to be of no hemodynamic signifi-
cance. Usually even severe splanchnic artery
stenosis does not result in clinical symptoms
because these vessels are heavily interlinked
via various branches (e.g., the arc of Riolan):
► Left gastric artery (celiac axis) —> right gastric
artery (common hepatic artery)
► Superior pancreaticoduodenal artery (celiac
axis) — inferior pancreaticoduodenal artery
(superior mesenteric artery)
► Middle colic artery (superior mesenteric ar-
tery) — left colic artery (inferior mesenteric
artery)
Hemodynamically significant stenosis is con-
firmed by the inci eased systolic velocity in
color-flow Doppler spectral analysis. In the
branches of the celiac axis the regular systolic
velocity is 138 ± 99 cm/s6. A peak systolic ve-
locity of more than 220 cm/s in the celiac axis or
superior mesenteric artery is indicative of arte-
rial stenosis. In В-mode imaging these stenoses
are seen as arteriosclerotic plaques with nar-
rowing of the lumen. However, even if there is
no inflow stenosis, this does not rule out intes-
tinal ischemia since duplex scanning may easily
miss the more peripheral stenosis or embolism.
In this case the clinical symptoms and angiog-
raphy settle the diagnosis (Ы 1.3a-g).
Median arcuate ligament syndrome. Among the
functional obstructions, the median arcuate
ligament syndrome is a special case. The me-
dian arcuate ligament is a ligamentous arch
across the surface of the aorta, interconnecting
the crura of the diaphragm. Particularly in
young women, postprandial epigastric pain
mimicking ulcer may be due to compression
of the celiac axis by the median arcuate liga-
ment. Ultrasound confirms this diagnosis by
color-flow Doppler with the non-respiration-
dependent change in velocity: during expira-
tion there is a clear-cut increase in velocity
above 180 cm/s because of the stenosis, while
during inspiration the velocity will drop. If the
stenosis is fixated, the velocity increases during
inspiration as well as expiration. Dissection of
the ligament should eliminate the complaints
(and the ultrasound pathology).
Renal artery stenosis. Arteriosclerosis is the
underlying cause in most cases of renal artery
stenosis, which is frequently found at the origin
of the renal artery. Fibiomuscular stenosis of
the middle and peripheral segments of the re-
nal artery is far less common
The sonographic criteria of proximal renal
artery stenosis are:
► Demonstration of a localized thickening of
the wall, and in the В-mode image narrowing
of the lumen (quite often not identifiable)
► Turbulence before and after the stenosis
with coloi changes (“confetti phenomenon”)
H 7.3 Splanchnic Artery Stenosis
(N
1 Vessels
► Celiac trunk stenosis
a and b Stenosis of the celiac axis.
a Penetration ~70 mm, color-flow
Doppler velocity 46 cm/s. Despite
baseline shift, the maximum velocity
cannot be measured completely
(> 300 cm/s).
b Magnified detailed view of a.
Significant color changes indicating
high speed turbulence induced by the
stenosis (arrow). AH = common hepatic
artery; AL = splenic artery; TC = celiac
trunk, AO = aorta.
c High-grade stenosis of the celiac
trunk, showing no detectable flow even
at a low PRF. Doppler spectrum shows
marked flow acceleration to (a velocity
of) 400 cm/s. AO = aorta; TR = celiac
trunk.
► Mesenteric artery stenosis
(stenosis of the inferior mes-
enteric artery, see Fig. 7.45c).
d В-mode image of vascular calcifica-
tions in the celiac trunk and superior
mesenteric artery. AO = aorta; TR =
celiac trunk; AMS - superior mesenteric
artery.
e Color duplex: turbulent zones in both
arteries, indicating significant stenosis.
AO = aorta; TR = celiac trunk; AMS
superior mesenteric artery.
f Stenosis of the mesenteric artery.
Color-flow Doppler: color change sig-
nifying stenosis induced turbulence.
g Origins of the renal arteries (arrows,
В-mode image); Penetration ~80 mm,
color-flow Doppler velocity 69 cm/s.
Severe stenosis (arrow) at the aortic
origin (AO) of the renal artery (AR); the
color changes signify increased velocity
with turbulence.
► Renal arteries
h and i Stenotic renal artery.
i Color duplex with spectral analysis:
color reversals in the renal arteries plus
flow acceleration to (a velocity of)
200cm/s, indicating significant steno-
sis.
Table 1.1 Severity of stenosis—verified by В-mode imaging, spectral analysis, and color-flow Doppler scanning
(modified after references 8, 11)
Severity of local stenosis No stenosis (< 40%) Slight (40-60%) Moderate (60-70%) Severe (about 80%) Subtotal (> 90%)
В-mode image: quality of detection +++ +++ + + + +
В-mode image: Slight plaque forma- Slight plaque forma- Moderate narrowing of Severe narrowing of Almost complete
findings tion tion the lumen the lumen obstruction of the lumen
Spectral analysis Unremarkable Widening of the spectrum Widening of the spec- trum, larger fraction of lower frequencies Inverse frequencies within the widened spectrum Inverse frequencies within the reduced spectrum
Peak systolic velocity < 120 cm/s >120 cm/s > 120 cm/s > 240 cm/s Variable
Color-flow Doppler No or just localized turbulence Extended segmental systolic increase in velocity Circumscribed seg- mental systolic in- crease in velocity Tightly circumscribed segmental increase in velocity of high severity, with some backflow components
Aorta, Arteries
a Fig. 1.23a Conspicuous echogenic plaques in the in-
ternal carotid artery.
a b Turbulent zones and acoustic shadowing in the
stenosis.
a c Vascular narrowing by hard plaque, with zones of
turbulent flow.
a Fig. 1.24a Decreased flow velocity proximal to the
stenosis, with unchanged frequency spectrum.
a b Doppler spectrum sampled just in front of the
stenosis: marked decrease in flow velocity.
ал
Coroth
s
•и 45Л I */*1/1/5
W PW-Ttefe= 31mm
PWGrX* 30rm
PWV.-SI- ЭЛ
m/i •-
a c Doppler spectrum sampled in the stenosis: Vmax is
increased to 140 cm/s, indicating 50% stenosis.
► Increased velocity of more than 180 cm/s;
increase in the end-diastolic velocity above
50 cm/s
► Poststenotic drop in the velocity
► Decrease in the resistance ratio below 0.5
when comparing both sides (poststenotic or
at the intrarenal arteries)1
В 1.3 shows typical examples of splanchnic
and renal artery stenosis.
Carotid artery. Ultrasonography of the carotid
arteries and possibly the aortic arch may be of
vital importance in internal medicine and neu-
rology. В-mode imaging will demonstrate any
stenosis and thrombosed plaques, while the
severity is ascertained by duplex scanning. Ac-
cording to Widder, Neuerburg-Heusler, and
Hennerici8, ”, stenosis of rhe common, exter-
nal, and internal carotids may be classified ac-
cording to five possible degrees of severity
(Table 1.1, Figs. 1.23 and 1.24).
Peripheral arteries. In the peripheral arteries
the hemodynamic effects of a stenosis depend
on its severity. В-mode imaging and color-flow
Doppler scanning will directly demonstrate the
stenosis of a peripheral artery. A peripheral
artery in the extremities will be deemed to
exhibit clinically significant stenosis (>50%,
also known as critical stenosis'), if the following
criteria are present:
► Localized thickening of the vessel wall
► Reduction in the lumen diameter by more
than 50%
► More than 2-fold increase in the peak sys-
tolic velocity
Certain locations of the iliac-femoral axis are
predisposed to obstruction; these are: the bi-
furcation of the common femoral artery into
the superficial and deep femoral arteries;
7 Vessels
a Fig. 1.25 Color-flow duplex scan with spectral analy-
sis and measurement of the pulsatility index. ATP =
posterior tibial artery.
о In a solely neuropathic foot (plantar ulcer): normal
arterial spectral profile, pulsatility index 7.67.
a b For a neuroischemic foot (deep plantar ulcer Wag-
ner grade II): marked decrease in the peak systolic
velocity (lOcm/s), high diastolic plateau, pulsatility
index 0.87; critical ischemia of the lower extremity.
a Fig. 1.27 Stenosis (AID) of the right iliac artery. AO =
aorta.
a В-mode image- severe narrowing of the origin (ar-
row) of the iliac artery.
PI = 1.2
Occlusion
a Fig. 1.26 Pulsatility index and velocity as a function of the severity of the obstruction in normal and pathological
extremity flow pulses. The pulsatility index is computed by dividing the difference between peak and minimum
flow velocity (h) by the mean flow velocity (Vm) (see reference 8).
a b Color-flow Doppler scan: stenosis (arrow), the
color changes signifying turbulent flow.
Hunter’s canal, where the tendon of the adduc-
tor magnus muscle crosses the superficial fem-
oral artery; and the trifurcation of the popliteal
artery. Even during routine ultrasound studies,
it is usually possible to deliberately look for
obstruction in the peripheral arteries of the
limbs; clinical symptoms and the result of du-
plex scanning will be sufficient to indicate any
need for angiography.
New modalities in ultrasonography with
panoramic imaging of the vessel (e.g., SieScape)
facilitate the search for stenosis in long periph-
eral arteries. One definite indication for de-
tailed vascular work-up is the syndrome of
the neuroischemic diabetic foot with its ac-
companying sclerosis of the media, where the
pedal pulses are not palpable, even in the ab-
sence of any clinically significant obstruction,
and the parameters generated by Doppler ul-
trasound are meaningless. Here, a subtle search
for obstruction may be called for to differenti-
ate and assess the status of the ischemic leg in
the presence of any concomitant neuropathy.
In our studies the diabetic foot, solely due to
neuropathy and lacking any vascular obstruc-
tion, will yield a pulsatility index (PI) > 4, while
in the neuroischemic foot PI lies between 4 and
1.2; in critical ischemia of the lower extremity
the PI drops below 1.2 (Fig.l.25)2a.
Determination of the peak and minimum
flow velocities as well as the pulsatility index
of Gosling and King in the poststenotic seg-
ment of the artery is easier to perform. This
will resemble the curves illustrated in Fig. 1.26
(after Gosling as quoted in 8). Figs. 1.27 and
1.28 are images of iliac and femoral artery
stenoses, respectively.
a Fig. 1.28 Stenosis (arrow) of the femoral artery [AFJ,
color-flow Doppler scan: prestenotic color changes
denoting turbulence. The stenosis is due to a massive
calcified plaque (note the shadowing, S) encroaching
on the lumen.
► Aortic/Arterial Embolism_______________________________________________________________________________
Acute aortic embolism (the same as in acute
thrombosis of the aorta, aortic bifucation syn-
drome) is a rare event; however, acute embo-
lism of the peripheral arteries is still common
despite its incidence having decreased dramat-
ically after the introduction of anticoagulant
therapy for atrial fibrillation (see Fig. 1.44; the
incidence of embolism at the various sites of
the arterial tree is given in the schematic
Fig.1.45)7.
► Arteriosclerotic Aortic/Arterial Occlusion______________________________________________________________
In ultrasound imaging, arteriosclerotic occlu-
sion of the aorta and the other arteries is dem-
onstrated by a complete loss of continuity in
the lumen and no flow in color-flow Doppler
scanning. Adjacent collateral vessels become
visible. Spectral analysis identifies decreased
systolic and diastolic flow velocity proximal
to the occlusion, with no flow (or collaterals)
or decreased systolic velocity combined with a
high end-diastolic flow velocity distal to the
obstruction (Figs. 1.29 and 1.30).
Aorta, Arteries
a Fig. 1.29 Aortic occlusion.
a The interrupted color flow is caused by the shad-
owing due to wall calcification.
a b Occlusion of the superior mesentenc artery: no
arterial flow. AO = aorta; TR = celiac trunk.
a c Acute thrombotic occlusion of the common femo-
ral artery (AFC)
a d and e Chronic limb ischemia:
d High grade stenosis of the left iliac artery (AIS)
a e Following complete occlusion of the superficial
femoral artery (AFS). Stenosis of the profound fem-
oral artery (AFP)
a Fig.1.30 Chronic long segment occlusion of the fem-
oral artery (AF).
a Slowed preocclusive flow, absence of color flow
distally, slight increase of echogenicity.
a b Collaterals refill the popliteal artery (AP) VP =
popliteal vein.
► Anastomotic/Bypass Stenosis_____________________________________________________________
Stenosis within a bypass, at its proximal seg-
ment, or at the anastomosis is easily identified
sonographically by localized thickening of the
wall with encroachment of the lumen, while
color-flow Doppler scanning will demonstrate
increased peak systolic velocity (Fig. 1.31).
ID
7 Vessels
a Fig. 1.31 Stent insertion for carotid artery stenosis.
a Stent is clearly visible as a fragmentary echogenic
band.
a b Carotid stent. Segments are devoid of color flow
due to acoustic shadowing.
a c Carotid stent for external carotid artery stenosis.
Vmax indicates 70% stenosis.
► Tumor Stenosis/Infiltration_______________________________________________________________________________
Malignant lymphomas tend to compress adja-
cent vessels (Fig. 1.32), while in carcinomas in-
filtration of the vessel wall is more common.
a Fig. 1.32 Malignant lymphoma of the pancreas.
a Splenic artery coursing through the tumor (T),
note the distinct compression of the vessel.
a b Invasion of the celiac trunk and its branches (com-
mon hepatic artery, hepatic artery and splenic artery
[AL]) by inoperable pancreatic carcinoma: periarterial
hypoechoic masses. AH = hepatic artery; TR = celiac
trunk.
Wall Thickening___________________________________________________________
и
cu
in
in
QJ
▼ Aorta, Arteries
► Anomalies and Variant Posi-
tions
► Dilatation
► Stenosis
► Wall Thickening
► Intraluminal Mass
Perivascular Mass
Vena Cava, Veins
— ► Early Arteriosclerotic Lesions
► Advanced Arteriosclerotic Lesions
► Complex Arteriosclerotic Lesions
► Protruding Arteriosclerotic Lesions
► White Thrombus
► Arteritis
► Monckeberg’s Arteriosclerosis
► Synthetic Crafts
Most often thickening of the aortic and arterial
walls is the result of arteriosclerosis, which in
turn is rooted in atheromatosis and atheroscle-
rosis. The WHO has defined atherosclerosis as
follows:
WHO Definition of Atherosclerosis
“Atherosclerosis implies a fluid combination
of intima changes in the artenes—as com-
pared with the arterioles—comprising a focal
accumulation of lipids, complex carbohy-
drates, blood and its components, fibrous
tissue, and calcium deposits, accompanied
by changes in the media.”
► Early Arteriosclerotic Lesions__________________________________________________________________________
The early stages of arteriosclerotic lesions are
characterized by lipid and cholesterol deposits
(lipid plaques and “atheromas” or atheroscler-
otic plaques, respectively). Subsequently, these
plaques may rupture (atherosclerotic ulcers)
and become the focus for white thrombi (athe-
rothrombosis).
The different phases and stages of arterio-
sclerosis result in a variety of sonographic
structures in and at the wall of the vessels;
however, this always will imply a thickening
of the wall. The earliest morphological sign in
ultrasonography of these alterations taking
place within the intima and media is a widen-
ing of the intima-media complex (Fig.1.33)5.
a Fig. 1.33a Soft plaques: small, soft, nonshadowing
plaque (arrow) in the common carotid artery. Broad-
ening of the intima-media complex, consistent with
early atherosclerosis.
a b Hard plaques: calcified plaque in the carotid bulb.
Complex atherosclerotic lesion with secondary calci-
fication.
Aorta, Arteries
► Advanced Arteriosclerotic Lesions_______________________________________________________________________
The sonographic sign of advanced arterioscler-
otic lesions is a thickened arterial wall. It may
appear as a hypoechoic or—as in most cases—a
hyperechoic structure. If there is no shadow-
ing, this increased echogenicity could be ex-
plained by cholesterol deposits. On the other
hand, in complex lesions there will be fibrosis
leading to echogenic caps covering the plaques
(Fig. 1.34).
* Fig. 1.34 Advanced arteriosclerotic lesion: localized
thickening of the wall seen as a hypoechoic band
covered by an echogenic (fibrous) cap (arrows). AO =
aorta.
► Complex Arteriosclerotic Lesions_______________________________________________________________________
Secondary calcification, fibrosis, and plaque
rupture (arteriosclerotic ulcer) with superim-
posed white thrombi lead up to a complex
lesion.
The ultrasound image shows irregular wall
thickening of a complex structure and protrud-
ing hypoechoic areas, or in the case of secon-
dary calcification a severely hyperechoic area.
Consecutive shadowing may block the lumen.
Complex lesions protrude into the lumen to
varying degrees and result in narrowing of
the lumen (Fig. 1.35-1.38). Because of the tur-
* Fig. 1.36 Early stage of a complex arteriosclerotic
lesion: nascent calcification at the anterior aortic
wall, mirrored echo (W, resonance artifact). Com-
pared to the remainder of the aorta (AO) this seg-
ment appears to generate an echo
a Fig. 1.35a Complex arteriosclerotic lesion of the
aorta; atheromatosis: echogenic thickening of the
wall (arrows) without shadowing. AO = aorta.
a b Advanced, complicated (“complex") atheroscler-
otic lesion: pronounced wall thickening (posterior)
with a hypoechoic band of atheromatosis, bordered
on the luminal side by hyperechoic plaque. “Stable
plaque" with smooth margins. Note the twinkling
artifact on the wall
a Fig. 1.37 Complex arteriosclerotic lesion of the aorta
(AO): calcification of the aortic wall; shadowing. Pro-
tuberating soft plaque (arrow).
1 Vessels
bulence, color-flow Doppler scanning produces
numerous color changes from red to blue
(“confetti phenomenon’’) (Fig. 1.39, Fig.1.24,
and ® 1.2b).
a Fig. 1.38 Complex arteriosclerotic lesion of the com-
mon carotid artery (ACC): extensive white thrombi
(arrows) feigning thickening of the wall but still re-
sulting in significant narrowing of the lumen.
a Fig. 1.39 Thickening of the aortic wall with multiple
consecutive stenoses and turbulence-induced color
changes. Arrow: color change at the origin of the iliac
artery.
► Protruding Arteriosclerotic Lesions____________________________________________________________________
Once the lesions become superimposed by
white thrombi, the wall will bulge into the lu-
men, and these thrombi appear as hypoechoic
intraluminal mass of sometimes irregular
structure (Fig. 1.40).
a b Hyperechoic plaque with a regular surface (arrows;
internal carotid artery, ACI); mild to moderate embo-
lization risk. ACE = external carotid artery.
a c Complex structure with an irregular surface in the
distal aorta (AO), presumably at greater risk for em-
bolization.
a Fig. 1.40 Protuberant plaque with risk of emboliza-
tion.
a Hyperechoic, well-circumscribed plaque (arrows),
probably at low risk for embolization. (Femoral artery,
AF). S = shadowing.
► White Thrombus_________________________________________________________________________________________________________
Intraluminal white thrombi are most common
in aneurysms. They do not represent a true
thickening of the wall but nevertheless are a
sequela of the underlying arteriosclerosis
(Fig. 1.16, Fig. 1.46).
► Arteritis_____________________________________________________________________________________________________
There are clinical and histological differences
between the various types of arteritis. Figure
1.41 illustrates the sonographic characteristics
of one such type. There are characteristic signs
of temporal arteritis that can be visualized by
color Duplex ultrasonography; the most spe-
cific sign is a dark halo on the artery wall, other
signs are stenosis or occlusions of temporal-
artery segments.
Classification and Histopathology of Arteritis 10
* Panarteritis nodosa. Complex, aggressive
autoimmune inflammation, particularly of
the medium-sized arteries: intimal lesion
with fibroid necrosis, superimposed
thrombosis, granulation with localized
nodular pouching; affects all layers of the
wall, in particular the adventitia (“periar-
teritis”).
► Giant cell arteritis. Ciant-cell containing,
aggressive autoimmune inflammation of
the arteries, affecting primarily the tem-
poral artery, with fragmentation of the
tunica elastica and covered by lympho-
cytes, histiocytes, and giant cells; this re-
sults in “wormlike" thickening of the vessel
and later in superimposed clot formation.
► Mesoaortitis syphilitica. Chronic bacte-
rial (Treponema pallidum) inflammation of
the aortic wall with granulomas, ulcerous
destruction of the media, and aortic
aneurysm formation; late sequelae are
fibrosis and scarring.
a Fig. 1.41 a,b and c Temporal arteritis.
Hypoechoic wall thickening, regressed in response to treatment (b, c).
► Monckeberg’s Arteriosclerosis___________________________________________________________________________
Aorta, Arteries
This appears as a distinctive late effect of dia-
betes in large, medium-sized as well as small
arteries, especially at the iliofemoral axis but
also at the upper extremities (pseudohyperten-
sion). Monckeberg’s arteriosclerosis is a horse-
shoe-shaped calcification of the tunica elastica
in the media and may be demonstrated as such
on radiographic films and in ultrasonography.
Because of the loss of elasticity in the arterial
wall, the pedal pulses are no longer palpable
and Doppler-controlled blood pressure meas-
urements will yield extremely high values
above 260 mmHg (this will also be true in
case of upper limb involvement).
Ultrasound images will show beaded, hyper-
echoic thickening of the wall with incomplete
shadowing. In color-flow Doppler scanning, it
becomes evident that Monckeberg’s arterio-
sclerosis does not result in stenosis of the ves-
sel (Fig. 1.42).
a Fig. 1.42 Monckeberg's arteriosclerosis. Clinical
symptoms: diabetic neuropathic plantar ulcer, palpa-
ble pedal pulses, Doppler blood pressure above
300 mmHg. AP = popliteal artery.
a В-mode image: diffuse spots of calcification in the
popliteal artery wall (arrows), sometimes with shad-
owing (S).
a b Color-flow Doppler scan: no significant stenosis.
Strong reflections off the wall may account for seg-
mental blanking of the color signals.
► Synthetic Crafts_________________________________________________________________________________
Stents and synthetic grafts also exhibit the
characteristics of wall thickening. However,
their walls have such a unique corrugated
echogenic appearance in ultrasound that they
are easily identifiable (Figs. 1.43, 1.31, and
1.50).
a Fig. 1.43 Dacron graft (Prothesis).
a Synthetic aortoiliac bypass: echogenic, thickened
corrugated wall of the graft. AO - aorta.
a b Enlarged detail of an iliac graft: typical corrugated
appearance of the graft wall (in color-flow Doppler
scanning and spectral analysis a peak systolic velocity
above 300 cm/s implies a highly significant stenosis
of the graft). A - P = artery graft.
Intraluminal Mass
f\l
£
or
tn
m
Qj
r Aorta, Arteries
► Anomalies and Variant Posi-
tions
► Dilatation
7 Vessels
► Stenosis
► Wall Thickening
► Intraluminal Mass
— ► Aortic/Arterial Embolism
► Protruding Arteriosclerotic Plaques
► White Thrombi
► Endovascular Stent
► Intimal Dissection
► Perivascular Mass
► Vena Cava, Veins
► Aortic/Arterial Embolism_______________________________________________________________________________
Complete embolic obstruction of the aorta or of
a major artery is always a serious, sometimes
life-threatening, event. Duplex scanning is a
rapid and precise imaging modality in the di-
agnosis of vascular occlusion (see below).
In В-mode imaging, the actual embolus is
hard to see as an intraluminal mass since it
lacks any impedance and thus is difficult to
define within the low-level structures of the
artery (in contrast to venous thrombosis)
(Fig. 1.44). Knowing the clinical symptoms, it
may be presumed as hypoechoic mass; this
suspicion is confirmed by angiography and
color-flow duplex scanning, where the de-
crease, and even cessation, in flow velocity
becomes evident. Figure 1.457 shows the inci-
dence of embolic events at the various loca-
tions of the arterial tree.
a Fig. 1.44 Aortic saddle embolus (AO): weakly echo-
genic mass (arrow) cephalad of the aortic bifurcation.
Clinical findings: mitral valve defect, acute pulmonary
edema, pain in the lower extremities. Emergency
operation without preoperative angiography.
a Fig. 1.45 Incidence of arterial embolism.
► Protruding Arteriosclerotic Plaques____________________________________________________________________
Protruding arteriosclerotic plaques represent
circumscribed thickening of the artenal wall
(see above) but appear as an intraluminal
mass. If a white thrombus becomes superim-
posed on a ruptured arteriosclerotic plaque, its
sonographic appearance is that of a homoge-
neous, hypoechoic intraluminal mass. Such
plaque-thrombus complexes increase the risk
of arterial occlusion (myocardial infarction),
rupture, and microembolism. They also make
the vessels prone to sclerosis and calcification,
in which case ultrasonography will demon-
strate them as a heterogeneous irregular struc-
ture (Figs. 1.46,1.47 and Fig.1.40).
a Fig. 1.46 Complex protruding lesion of the femoral
artery (AF).
о В-mode image: echogenic white thrombus (ar-
row).
a b Color-flow duplex scan there are blank areas
within the flow; the "confetti phenomenon” indicates
significant stenosis. Clinical diagnosis was a neuro-
ischemic diabetic foot syndrome (in these lesions
platelet inhibition is mandatory)
a Fig. 1.47 Atheromatous plaques (arrows) protruding
into the lumen, echogenic arteriosclerotic wall thick-
ening of the descending aorta (AO), TEE search for
source of embolism.
► White Thrombi
A white or pale thrombus arises from a lesion
of the endothelium, leading to turbulence and
decreased flow velocity. These clots spread in
layers of "white” thrombi (platelets) and “red”
thrombi (fibrin and red blood cells), and are
found in atherosclerotic lesions and aneur-
ysms.
In ultrasound they appear as layered hypo-
echoic bands. Sometimes they become reper-
fused again or they wall off anechoic spaces
without flow in the interior or at the margin
(serosanguineous fluid) (Figs. 1.48 and 1.49).
л Fig. 1.48 White thrombus (TH) within a saccular
aortic aneurysm: at first glance, the shape of the
aorta (AO) seems to be regular while the vessels
appears to be surrounded by a tumor; however, these
are white thrombi within the aneurysmatic lumen.
a Fig. 1.49 White thrombi within a saccular aortic
aneurysm, staggered transverse views.
a Marginal layered thrombus (TH) and swirled
thrombus (arrow) with the crescent-shaped anechoic
remaining lumen; both clots are covered by an echo-
genic dissecting membrane (in aortic dissection this
would be the intima).
a b More caudad there is a regular, circular, central
lumen of the aorta (AO). It is surrounded by alternat-
ing layers of white thrombi (TH) and serosanguineous
fluid (S).
Aorta, Arteries
► Endovascular Stent________________________________________________________________________
Depending on the situation involved, vascular
grafts for aortic/arterial repair require open
surgery or endovascular stenting. In the latter
case, ultrasonography delineates these stents
as echogenic reflecting bands (Figs. 1.50,1.43,
and 1.31).
◄ Fig. 1.50 Endovascular aortic stent; delicate echo-
genic wall of the intraluminal graft within an aortic
aneurysm (transverse diameter41 mm, calipers). AO
= aorta.
► Intimal Dissection________________________________________________________________________________
Intimal dissection in the aorta or in aneurysms
demonstrates a sonographic image similar to
an endovascular stent; however, most often the
patient’s history is known, which then facili-
tates the differential diagnosis. Furthermore,
the intima tends to be thicker and presents as
a solitary echogenic intraluminal band. The ori-
gin of the dissection can be identified in only a
few cases (Fig. 1.51).
« Fig. 1.51 Intraluminal structure almost identical to
Fig. 1.50; dissection of the intima: in this case the
origin of the dissection (arrows) is clearly visible.
Perivascular Mass
£
OJ
tn
И
QJ
Aorta, Arteries
Anomalies and Variant Posi-
tions
► Dilatation
► Stenosis
► Wall Thickening
► Intraluminal Mass
► Perivascular Mass
> Vena Cava, Veins
— ► Pseudoaneurysm
► Arteriovenous Fistula/Arteriovenous Malformation
► Suture-line Aneurysm
► Sututure-line Breakdown, Craft Infection
► Hematoma, Abscess
► Lymphomas, Metastases
► Retroperitoneal Fibrosis
► Horseshoe Kidney
► Intestinal Loop
Perivascular masses may originate from the
vessel itself (pseudoaneurysm, suture-line
breakdown, graft infection) or arise completely
independently of it. Ultrasound plays a vital
role in the differential diagnosis of these dis-
eases. The diagnosis cannot be confirmed in all
cases; quite often the clinical picture will yield
important clues, and sometimes additional
imaging modalities are required or other diag-
nostic measures such as ultrasound-guided
needle aspiration for cytology and histology.
► Pseudoaneurysm ___________________________________________________________________
A pseudoaneurysm (or false aneurysm) is a
perivascular mass representing the extravasa-
tion of blood after iatrogenic or traumatic in-
jury to the artery. This leads to a perivascular
hematoma with either remaining blood flow or
complete thrombosis. Ultrasonography will
demonstrate a hypoechoic mass. In color-flow
Doppler scanning the fistula with the perfused
aneurysm and the degree of thrombosis can
seen directly. After deliberate compression of
the fistula with the ultrasound probe for about
20 minutes the canal of the fistula and the
aneurysm should become thrombosed, thus
making open surgeiy a thing of the past. This
does not apply to arteriovenous fistulas
(Fig. 1.52).
Fig. 1.52 Almost completely thrombosed pseudo-
aneurysm (A) of the femoral artery (AF) after cath-
eterization. Red arterial Doppler signal VF = throm-
bosed femoral vein.
► Arteriovenous Fistula/Arteriovenous Malformation
As is true for pseudoaneurysms, the most com-
mon cause of arteriovenous fistulas is iatro-
genic (e.g., catheterization) while shrapnel in-
juries have become quite rare. The sonographic
diagnosis is derived from the В-mode image
and the arterial signal detected m the vein
during duplex scanning (Fig. 1.53).
a Fig. 1.53a,band c Arteriovenous fistula (F) between the femoral artery (AF) and the greater saphenous vein after catheterization a color flow doppler spectrum sampled in the
fistula with a arterial signal b.c Fistula to the greater saphenous vein (VSM/arrow). VF = femoral vein.
An arteriovenous malformation is a congen-
ital vascular anomaly in which an artery and
vein are interconnected by undifferentiated
vessels without a capillary network. The
tangled vessels can be demonstrated by color
duplex and spectral analysis only if a high
shunt volume is present (Fig. 1.54).
л Fig. 1.54b Arteriovenous malformation:
a hypoechoic mass (arrows) anterior to and besides
the iliac vessels (Al = iliac artery).
a b undifferentiated vessels with low flow in the color
duplex scan.
Aorta, Arteries
► Suture-line Aneurysm______________________________________________________________________________
In a few cases bypass grafting may be compli-
cated by the formation of a true or false aneur-
ysm, the sonographic finding being the same as
for the "normal" arterial system. The diagnosis
is confirmed by color-flow duplex scanning.
► Suture-line Breakdown, Craft Infection____________________________________________________________
In most cases postoperative complications after
bypass grafting manifest themselves immedi-
ately. A delayed onset combined with general
symptoms, such as swelling, fever, or sepsis,
may be difficult to diagnose.
The typical sonographic appearance of su-
ture-line breakdown or graft infection is a hy-
poechoic perigraft mass; a local, walled-off
mass tends to be a hematoma, while the band-
like mass is more characteristic of purulent
graft infection (Figs. 1.55a and b).
a Fig. 1.55a Leaking femoral graft and infected hema-
toma. The fluid surrounding the infected graft (ar-
rows) permits excellent insonation of the graft wall
(W). Longitudinal section. AF = left femoral artery.
a b Infected popliteal graft (arrows; AP) with extensive
suppuration (calipers). Clinical signs were fever of
unknown origin and possible thrombosis of the pop-
liteal vein.
► Hematoma, Abscess____________________________________________________________
There is no clear-cut sonographic distinction
between hematoma and abscess presenting as
perivascular (aortic) mass, and the sonogra-
pher has to rely on the patient’s history and
the clinical signs. If the ultrasound findings are
ambivalent, sonographically guided fine-nee-
dle aspiration may settle the diagnostic issue,
possibly followed by therapeutic evacuation of
the hematoma or abscess (Fig. 1.56).
* Fig. 1.56 Postoperative abscess anterior to the aorta
after perforated appendicitis. (Clinical picture and
possible echogenic gas bubbles, barely seen here,
may point the way). AO = aorta.
► Lymphomas, Metastases____________________________________________________________
7 Vessels
Malignant lymphoma may appear as hypo-
echoic para-aortic mass in 50% of cases. Malig-
nant metastases usually are found along the
lymphatics draining the tumor and thus may
help pinpoint the primary. Whereas metastases
are round, lymphomas tend to present a “sand-
wich" structure (Fig. 1.57).
◄ Fig. 1.57 A band of periaortic lymphomas (LK):
“sandwich-like” appearance, highly malignant non-
Hodgkin lymphoma. The sonographic finding could
be confused with a partially thrombosed aortic
aneurysm. AO = aorta.
► Retroperitoneal Fibrosis________________________________________________________________________
In rare cases a hyperechoic periaortic and peri-
caval “encasing” mass may be due to retroper-
itoneal fibrosis, a disease associated with other
manifestations (Fig. 1.58, also see Chapter 11
“Urinary Tract” Fig. 11.28, p. 340).
« Fig. 1.58 Retroperitoneal fibrosis: hypoechoic
masses (calipers) encasing the aorta (AO). WS =
spine; VC = compressed vena cava.
► Horseshoe Kidney_______________________________________________________________________
A hypoechoic round or oval-shaped (in the
transverse diameter) mass anterior to the aorta
will confirm the diagnosis of a horseshoe kid-
ney, if the study is continued into the flanks
and a connection with the kidney becomes
evident (Fig. 1.59).
* Fig. 1.59 Hypoechoic mass resembling lymph nodes
anterior to the large abdominal vessels; horseshoe
kidney (N). AO = aorta; VC = vena cava.
► Intestinal Loop____________________________________________________________________________________________
Differential diagnosis of a para-aortic mass has
to include the possibility of a hypoechoic in-
testinal loop distended by fluid. If the mass is
observed over a period of time and shows signs
of peristalsis, this will settle any doubts
(Fig. 1.60).
Fig. 1.60 Periaortic “mass”: fluid filled intestinal loop,
differentiation from a true intra-abdominal mass is
possible only by its motion. AO * aorta; D = small
bowel.
Vena Cava, Veins
Anomalies____________________________________________________________
— ► Anomalies/Duplication of the Inferior Vena Cava
► Anomalies of the Iliac Veins
► Duplication of Renal and Peripheral Veins
Vena Cava, Veins
► Anomalies/Duplication of the Inferior Vena Cava
Anomalies. Anomalies of the vena cava are
infrequent and most are incidental findings
during ultrasonography, in which case they
present problems regarding the differential di-
agnosis. Precise knowledge of the anatomy is
invaluable in these instances. Agenesis is ex-
tremely rare and is usually associated with
other clinically significant cardiovascular mal-
formations during the prenatal and postnatal
period. The situs inversus viscerum is discussed
in the section on anomalies of the aorta.
Congenital Anomalies of the Inferior Vena Cava
► I Postrenal segment
Type A: persistent right postcardinal vein
(“retro- or periaortic ureter”)
Type B: persistent right supracardinal vein
(“normal inferior vena cava”)
Type C: persistent left supracardinal vein
(“left inferior vena cava”)
Type BC: persistent left and right supra-
cardinal veins (“duplicated inferior vena
cava")
► II Renal segment
Persistent ring of renal veins (“periaortic
ureter”)
► III Prerenal or hepatic segment
Missing hepatic segment (“azygos or
hemiazygos vein continuation”)
Duplication. Quite often duplication of the vena
cava is overlooked because it does not result in
any symptoms—except for thrombosis.
According to Chuang (cited in 9), duplication
of the inferior vena cava has an incidence of
0.05-3%, i.e., it is not especially rare. As part of
complex embryonic disorders, such duplication
develops from the embryonic post-, sub- and
supracardinal veins, which comprise a primar-
ily bilateral, symmetric, abdominal venous sys-
tem fusing to the secondary dextroverted
asymmetric system of the inferior vena cava.
The classification is based on the three possible
segments involved, and for the postrenal seg-
ment is subdivided into the four types A to BC.
E 1.4 shows examples of vena cava duplication.
В 1.4 Duplicated Inferior Vena Cava
a Longitudinal right paramedian view of the abdomen: right iliac vein (VI) and
inferior vena cava (VC).
b Longitudinal left paramedian view of the abdomen: left iliac vein (VI) and inferior
vena cava (VC); partial view of the iliac artery (Al).
d Oblique subxiphoidal median view and longitudinal paramedian epigastric view:
the left inferior vena cava (VC) crosses the aorta (AO) anteriorly and runs obliquely in
a cephalad direction joining the right vena cava (VC) (other courses are possible)
before entering the right atrium (RA).
c Transverse view at the umbilicus, В-mode image and color-flow Doppler scan:
there are two inferior venae cava (VC) with respective color signals. The left renal
vein (VR) joins the left inferior vena cava and does not cross the aorta anteriorly in
order to join the right vena cava as would be the case in normal anatomy. AO =
aorta.
► Anomalies of the Iliac Veins
Anomalies of the iliac veins are also known and
may become a problem in surgery or thrombo-
sis. In most cases it is an abnormal junction of
the left iliac vein with the right common iliac
vein or a true duplication.
1 Vessels
► Duplication of Renal and Peripheral Veins_______________________________________________________
A retroaortic left renal vein, or duplicated renal
veins, may become significant if there is throm-
bosis or the suspicion of tumor infiltration
(Fig. 1.61). Duplication of the popliteal vein is
a frequent variant of normal anatomy, while
duplicated femoral veins are rare. Most of these
cases are incidental findings in the work-up of
deep venous thrombosis (see below).
« Fig. 1.61 Renal vein with partial duplication (VR),
merging just before the junction with the inferior
vena cava (VC). Arrows: partial view of the renal
artery. L = liver: N = kidney.
Dilate tion_____________________________________________________________________
— ► Inferior Vena Cava Engorgement
► Prestenotic and Poststenotic Dilatation
► Thrombosis
► Venectasia
► Venous Insufficiency
► Inferior Vena Cava Engorgement____________________________________________________
The most common cause of an engorged infe-
rior vena cava is cardiac congestion, which in
turn may be due to right ventricular failure,
pulmonary embolism, pericardial fibrosis
(armored heart), or mitral valve disorders.
In ultrasonography, cardiac congestion is
seen as engorgement of the right atrium and
ventricle, inferior vena cava (beyond 20 mm),
and hepatic veins (beyond 10 mm). The lack of
physiological and respiration-induced varia-
tion in the caliber of the inferior vena cava
and its incompressibility are vital diagnostic
criteria and simply mirror the congestion of
the vein. Engorgement of the inferior vena
cava also implies enlarged venous tributaries
(Fig. 1.62).
a Fig. 1.62 Inferior vena cava and hepatic vein en-
gorgement.
a Marked expansion of the vena cava to 27 mm
(cursors), congested hepatic vein (LV), ascites (A).
a b Subcostal section, color flow duplex scan: The red
doppler signal of the liver veins marks the systolic
reverse flow.
► Prestenotic and Poststenotic Dilatation
Stenosis of the inferior vena cava will result in
prestenotic and poststenotic enlargement of
the vein, this sometimes being the only sign
of any obstruction (Figs.1.63 and 1.64).
CM
Vena Cava, Veins
a Fig. 1.63 Prestenotic enlargement of the inferior vena
cava due to two renal arteries (arrows) crossing pos-
teriorly. Color-flow Doppler scanning with fixed Dop-
pler velocity of 23 cm/s. Because of decreased flow
velocity there is no color signal in the vena cava seg-
ment (VC) proximal to the stenosis.
a Fig. 1.64 Poststenotic enlargement of the inferior
vena cava.
о Decreased flow velocity with turbulence (“RBC
noise", arrows).
a b Slight prestenotic and poststenotic dilatation;
color-flow Doppler scan: a 4-liter (!) liver cyst with
hematoma, extending behind the vena cava (VC) with
long-stretched indentation of the posterior wall of
the vein. VP = portal vein. C = cyst.
► Thrombosis______________________________________________________________________________
Lesions in the vessel wall, venostasis, and hy-
percoagulability (Virchow’s triad) will trigger
venous thrombosis. The latter two also are
causative factors in paraneoplastic thrombosis,
which should always be included in the differ-
ential diagnosis.
In ultrasound imaging, the essential charac-
teristics of venous thrombosis are a vein en-
larged to more than 1.5 times the diameter of
the respective artery3 and the lack of compres-
sibility (Fig. 1.65; see Figs. 1.13, p.7) (also see
"Intraluminal Mass," p. 28 ff.).
a Fig. 1.65 Vena cava thrombosis (TH) in a patient with
protein S and C deficiency, vena cava filter (arrows).
a Thrombotic (TH) and poststenotic enlargement of
the vena cava (VCI).
a b After thrombolysis: complete recanalization, regu-
lar caliber of the vein. VP = portal vein; H = liver.
► Venectasia_____________________________________________________________________________________
Segmental dilatation of a vein may be physio-
logical in nature or due to impaired outflow or
anatomy: for example, a large vena cava lumen
in adolescents, distended jugular veins, or
physiological engorgement of the left renal
vein when crossing the aorta. Venous aneur-
ysms, e.g., in the popliteal vein, presenting with
painful swelling may easily be differentiated
from Baker’s cyst, since in the latter case there
will be no color signal in color-flow Doppler
scanning (Figs. 1.66 and 1.67).
a Fig. 1.66 Ectatic internal jugular vein: marked en-
largement. slow turbulent flow demonstrated by
the blue-red color signal; very low flow velocity (fixed
low pulse repetition frequency. PRF, with correspond-
ing maximum velocity of 6 cm/s).
a Fig. 1.67 Presumed Baker’s cyst. VS = lesser saphe-
nous vein.
a Presumed cyst (Z) in the popliteal fossa.
a b After extrinsic compression of the lower leg, color-
flow Doppler evaluation detects venectasia (V) with
proven incompetence of the saphenopopliteal junc-
tion.
► Venous Insufficiency
00
1 Vessels
Refluxing blood in a vein will lead to segmental
dilatation, which in turn results in venous in-
competence. Predisposed locations are:
► Saphenofemoral junction (“insufficient
saphenous junction")
► Saphenopopliteal junction ("insufficient
parva junction")
► Proximal femoral and popliteal vein
► Lower leg (varicosities, incompetent
perforators)
The diagnosis is to be confirmed by color-flow
Doppler scanning, and the severity can easily
be graded according to the Hach classification4
(Figs. 1.68 and 1.69).
Hach Classification of Greater Saphe-
nous Insufficiency
► Stage I: Insufficient saphenous junction
► Stage II: Insufficient saphenous junction
plus reflux to the distal thigh
► Stage III: Insufficient saphenous junction
plus reflux to the proximal lower leg
► Stage IV: Insufficient saphenous junction
plus reflux to the ankle
a Fig. 1.68 Incompetence of the saphenofemoral junc-
tion.
a Junction of the enlarged greater saphenous vein
(VSM) and the femoral vein (VF).
a b Valsalva maneuver: color change from blue to red,
confirming venous reflux.
a Fig. 1.69 Incompetent Cockett's perforators: venous
runoff from the posterior tibial veins through the
gastrocnemius muscle (M) to the superficial venous
system.
Intraluminal Mass
и
r Aorta, Arteries
r Vena Cava, Veins
► Anomalies
— ► Venous Thrombosis
► Phleboliths, Calcification
► Venous Valves
> Dilatation
> Intraluminal Mass
► Compression, Infiltration
► Venous Thrombosis_________________
The value of diagnostic ultrasound. Today,
ultrasonography is the modality of choise
thrombosis in case of suspected, and together
with phlebography it has become the gold
standard in the diagnosis of venous thrombo-
sis. Color-flow Doppler scanning demonstrat-
ing little or no flow has expanded its diagnostic
capabilities. Sonographic work-up for sus-
pected venous thrombosis of easily accessible
regions may be performed without difficulty
and takes but a few minutes. It is more difficult
to perform on the iliac veins, the lower leg, the
periuterine venous plexus, or the ovarian vein,
where it has a higher error rate. Phlebography
only becomes necessary, if in case of strong
clinical suspicion, the diagnostic findings are
negative or ambivalent or if the conditions for
the study are especially poor. Reliable sono-
graphic diagnosis of venous thrombosis is
even possible in the lower leg, although here
usually only the posterior tibial veins can be
imaged.
Venous filling. There may be problems if the
deep veins are not filled enough, particularly in
hypovolemia, in which case it may be helpful to
evaluate the patient standing and with com-
pression of the lower leg. On the other hand,
marked venous engorgement will complicate
the evaluation since the deep veins will come
under pressure and this may mimic incompres-
sibility.
Criteria of thrombosis. The surest sign of
thrombosis is venous incompressibility. It is
not possible to differentiate between old and
fresh thrombi. Free-floating thrombus tail sur-
rounded by blood flow, identification of the
thrombus head, and discrete compressibility
of the thrombus point to a soft thrombus. A
normal venous lumen is seen only in old
thrombosis. Extrinsic compression of the vein
with the probe could shear off the thrombus in
rare cases but would not result in any clinically
evident embolism.
Ultrasonography of a thrombus surrounded
by blood demonstrates an anechoic marginal
lumen between thrombus and venous wall, the
flow being confirmed by color-flow Doppler
scan. Color-flow duplex evaluation is of vital
importance for this type of thrombosis as well
as for difficult sonographic conditions. Even if
the vein is hardly visible in В-mode imaging,
thrombosis can be definitively ruled out by
color-flow duplex scanning. Compression ul-
trasonography is best suited for evaluating
the treatment, making phlebographic controls
unnecessary. There is no formal distinction
between platelet- and tumor-induced throm-
bosis.
В 7.5 Sonographic Criteria for Assessing Venous Thrombosis
► Incompressibility (most
important sign)
a-c Deep venous thrombosis (TH) of
the thigh.
a Cross-section: this view permits bet-
ter detection of the vein, which cannot
be compressed because of the throm-
bosis.
b Longitudinal view: presentation of
the patent proximal segment of the
common femoral vein (VFC) as well as
the thrombus (TH). The greater saphe-
nous vein (VSM) is slender with no
suspicion of thrombosis.
c Compression: under extrinsic com-
pression there is complete collapse of
the proximal femoral and the greater
saphenous veins, while the thrombosed
section is incompressible.
Vena Cava, Veins
► Vascular enlargement (1.5
times the arterial diameter)
► Intraluminal echogenic struc-
tures
d Fresh venous thrombosis (TH), such
as is imaged here, will always enlarge
the diameter of the vessel. The lumen of
the vein will remain normal only in
cases of old thrombosis VF * femoral
vein; VSM = greater saphenous vein.
e Thrombosis of the vena cava (VC):
localized engorgement of the vena cava
(calipers). The thrombus itself hardly
has any structural elements and there-
fore cannot be seen directly.
f Thrombosis of the common femoral
vein (VFC): markedly dilated segment of
the vein at the partial thrombosis
(echogenic structures).
► No Doppler signals and flow
or flow defects in color-flow
Doppler scanning
g and h Old thrombosis of the femoral
vein (VF) in color-flow Doppler scan-
ning.
g Since the vein is not dilated, there is
no initial suspicion of thrombosis; no
flow in color-flow duplex scanning.
h For comparison, the right femoral
vein, which is not thrombosed.
i Partial thrombosis of the popliteal
vein (VP). В-mode image: central
thrombosis (arrows) of the vein. In
color-flow Doppler imaging there is
marginal flow. AP = popliteal artery.
1.5 gives examples of the sonographic
criteria of thrombosis after Habscheid3 (also
see Figs. 1.13 and 1.65).
Crural thrombosis. Venous thrombosis in the
calf is more difficult to image because the deep
posterior tibial veins are hard to insonate, es-
pecially in hypovolemia and dialysis. In this
case the lack of demonstrable veins almost
rules out venous thrombosis since the latter
would have resulted in easily viewed engorged
veins (Fig. 1.70).
Fig. 1.70 Deep venous thrombosis of the calf affect-
ing the posterior tibial group of veins (V, arrows). F =
fibula; T = tibia.
a Longitudinal view of the calf.
7 Vessels
Fig. 1.70
b Transverse view of the calf: incompressible veins
(arrows).
* c Deep venous thrombosis of the calf, color-flow
Doppler scan: enlargement of the vein (V) compared
with the artery (A). Incompressibility.
Fig. 1.71 Deep thrombosis of the superficial femoral
and greater saphenous veins.
a No flow in the greater saphenous vein (VSM), with
some flow in the superficial femoral vein (VF).
< b Compression: the remaining perfusion is blocked,
while the thrombus (TH) is incompressible.
« Fig. 1.72 Superficial venous thrombosis (TH).
a Thrombosis of the greater saphenous vein (VSM)
Distended lumen, echogenic structures, low-level
perfusion, spectral analysis.
< b Intensive spotty vascularization within a thrombus
in the jugular vein: tumorous thrombus originating
from thyroid metastasis of renal carcinoma.
Superficial venous thrombosis. Just as for the
deep veins, superficial venous thrombosis ful-
fills the same typical sonographic criteria. In
thrombosis of the greater and lesser saphenous
vein, always insonate the saphenofemoral and
saphenopophteal junctions, respectively, to
check the passage into the deep vein (Figs.
1.71 and 1.72).
► Phleboliths, Calcification-------------------------------------------------------------------------------
Phleboliths (also known as "vein stones”) are
calcified thrombi and appear as hyperecho-
genic masses, sometimes associated with shad-
owing. They may occur in focal fashion or as
extended horseshoe-shaped calcifications, re-
sulting in a bandlike structure within the vein
with strong reflections (Figs. 1.73 and 1.74).
a Fig. 1.73 Phleboliths with incomplete shadowing in a
superficial vein of the calf, old thrombosis, flow de-
fect in color-flow Doppler scanning.
a Fig. 1.74 Old calcified band-shaped thrombosis of
the lesser saphenous vein, shadowing (S).
► Venous Valves__________________________________________________________________________
Venous valves are pocket-shaped intimal folds
with check valve characteristics, permitting
blood flow only toward the heart. Under ex-
cellent sonographic conditions they may be
imaged as echogenic V-shaped intraluminal
structures opening toward the heart (Fig. 1.75).
•< fig. 1.75 Venous valves (arrows) within the femoral
vein (VF).
Vena Cava, Veins
Compression, Infiltration_______________________________________________
И
CD
r Aorta, Arteries
r Vena Cava, Veins
CD
► Anomalies
► Dilatation
► Intraluminal Mass
► Compression, Infiltration
— ► Enlarged Caudate Lobe
► Budd-Chiari Syndrome
► Lymph Nodes, Cysts
► Other Masses
► Malignant Tumor
► Enlarged Caudate Lobe______________________________________________________________________
The inferior vena cava arcs widely posterior to
the caudate lobe. Because of this close anatom-
ical relationship, it is moie (tumorous infiltra-
tion) or less (long arced impression in case of
cirrhotic enlargement of the caudate lobe) in-
volved in any adjacent changes (Fig. 1.76).
* Fig. 1.76 Cirrhotic enlargement of the caudate lobe
(LC): impressed and displaced Vena cava (VC).
► Budd-Chiari Syndrome_____________________________________________________________________
The most severe, and without treatment lethal,
effect on the inferior vena cava is Budd-Chiari
syndrome with thrombosis of all hepatic veins
(young women on oral contraceptives) or tu-
morous occlusion (older patients with infiltra-
tion of the inferior vena cava at the junction of
the hepatic veins). Ultrasonography, in partic-
ular color-flow duplex scanning with spectral
analysis, is the imaging modality of choice in
the diagnosis of a thrombotic or tumorous oc-
clusion of the hepatic veins. It may also aid in
the rapid diagnosis of the cause of lower ve-
nous congestion (as well as upper, e.g., with
local metastasis of lung cancer) (Fig. 1.77).
a Fig. 1.77 Acute and chronic Budd-Chiari syndrome.
a Acute Budd-Chiary-Syndrome: Occlusion of all
three hepatic veins (infiltration of the vena cava by
metastatic lymph nodes). Speckled liver structure, no
visible veins. Clinical diagnosis was ovarian cancer,
there was massive pain and the patient died after a
few days.
a b Chronic Budd-Chiary-Syndrome: Diffuse meta-
static infiltration with occlusion of the liver veins.
VC = Vena cava.
► Lymph Nodes, Cysts__________________________________________________________________________
Compression of the vena cava and peripheral
veins by lymph nodes and cysts is quite com-
JN mon. Because of their thin walls and low blood
pressure, veins will yield to the pressure of an
extrinsic mass and become indented according
to its shape. The type of mass may be diagnosed
on the basis of the patient’s history and clinical
symptoms, and occasionally by ultrasound-
guided fine-needle aspiration biopsy.
1 Vessels
« Fig. 1.78 Compression and displacement of the in-
ferior vena cava (VC) by lymph nodes: relapse of a
gastric MALT lymphoma post surgery. T = tumor.
► Other Masses________________________________________________________________________
Retroperitoneal fibrosis is another, but rather
uncommon, cause of impression of the vena
cava. Aortic aneurysm or enlargement of the
pancreatic head may also displace or severely
compress the vena cava (Figs. 1.79 and 1.80).
a Fig. 1.79 Severe curved displacement of the vena
cava by an aortic aneurysm: spectral analysis depicts
the normal venous Doppler spectrum with cardiac
modulation.
a Fig. 1.80 Compression of the vena cava by the en-
larged pancreatic head in an acute attack of chronic
pancreatitis. The vena cava (VC) is markedly nar-
rowed. Abnormal spectral waveform shows stenotic
flow acceleration and a pulsatile flow pattern. P =
pancreas.
► Malignant Tumor
Malignant tumors tend to infiltrate, whereas
metastases compress. In both cases the end
result may be occlusion of the vena cava with
its prognostically poor sequelae (Figs. 1.81,
1.82, and 1.97).
a Fig. 1.81 Severe infiltration of the vena cava (arrows)
by the caudate lobe metastasis of breast cancer. DA =
small bowel; VO = ovarian vein; VC = vena cava; L =
liver.
a Fig. 1 .82 Renal cell carcinoma. Upper abdominal
longitudinal scan of tumor (T) infiltrating the vena
cava (VC). L = liver: VP = portal vein.
References
1. Bbnhof JA, Meairs SP, Wetzler H. Duplex- und
Farbdoppler-sonographische Kriterien von Nie-
renarterienstenosen. Ultraschall Klin Prax
1990;5:187.S
2. Fellmeth BD, Roberts AC, Bookstein JJ et al. Post-
angiographic femoral artery injuries. Nonsurgical
repair with US-guided compression. Radiology
1991:178:671.
3. Habscheid W, Landwehr P. Diagnostik der akuten
tiefen Beinvenenthrombose mit der Kompres-
sionssonographie. Ultraschall in Med
1990;11:268-73.
4. Hach W Girth E, Lechner W. Einteilung der
Stammvarikose der V. saphena magna in 4 Sta-
dien. Phlebol Proktol 1977;6:116-23.
4a. Heyne, JP. Die doppelte Aorta-Raritat Oder Arte-
fakt im Ultraschall. Ultraschall in Med 2000;
21:145-148
5. Ludwig M, Kraft K, Rucker W, Hiither AM. Die
Diagnose sehr fruher arteriosklerotischer GefaR-
wandveranderungen mit Hilfe der Duplexsonog-
raphie. Klin Wochenschr 1989;67:442-6.
6. Mallek R, Mostbeck G, Walter R, Tscholakow D.
Duplexsonographie der Visceralarterien: An-
giographische Korrelation. Ultraschall Klin Prax
1990:5:186.
7. Morl H, Menges HW GeFaRkrankheiten in der
Praxis. 7th ed. Stuttgart: Thieme 2000.
8. Neuerburg-Heusler D, Hennerici M. GefaRdiag-
nostik mit Ultraschall. 2nd ed. Stuttgart: Thieme
1995.
9. Rettenmaier G, Seitz K. Sonographische Differ-
entialdiagnostik. Stuttgart: Thieme 2000.
10. Riede UN. Taschenatlas der allgemeinen Patho-
logic. Stuttgart: Thieme 1998.
11. Widder B. von Reutern GM, Neuerburg-Heusler
D. Morphologische und dopplersonographische
Kriterien zur Bestimmung von Stenosierungs-
graden an der A. carotis interna. Ultraschall
1986;7.
Portal Vein and Its Tributaries
C. Coerg
The portal venous system comprises four re- portal vein at the porta hepatis; splenic vein;
gions: intrahepatic branches of the portal vein; and splanchnic veins. Blood from the splanch-
nic region (including the spleen) normally
flows in hepatopetal fashion.
Anatomy_______________________________________________________________________
Size
► Portal vein at the hilum: 1.0-1.5 cm
► Splenic vein at the hilum: 0.5-1.0 cm
Flow
► Mean flow velocity of the portal vein:
15-20 cm/s
Size and shape. The diameter of the portal vein
displays a somewhat wider range between in-
dividuals (see Fig. 1.93). In fasting patients, a
diameter of up to 15 mm is considered normal.
Usually, the portal vein has an oval shape in the
transverse plane. The mean portal flow velocity
has been reported as 15-20 cm/s, with a wide
range of values here as well.
Under normal conditions the diameter of
the splenic vein at the hilum should be less
than 7 mm (в 1.6p and q). The mesenteric
vein is compressible and exhibits respiratory
caliber variations of more than 15%.
Vena Cava, Veins
Topography_____________________________________________________________________________
The right gastric vein joins the trunk of the
portal vein at the hepatic portal (в 1.6a and
b). Within the liver the portal trunk divides like
Position
► Splenic vein posterior to the pancreas
► Mesenteric vein parallel to the superior
mesenteric artery
► Portal vein posterior to the bile duct and
hepatic artery
► Intrahepatic bifurcation of the portal vein
into left and right branch
Lead structure
► Posterior to the pancreatic head
a “staghorn” into the left and right portal
branches (в 1.6c-f). The main right portal
branch gives off the anterior branch, which
supplies segments V and VIII, while its poste-
rior branch supplies segments VI and VII
(B 1.6g and h). The left portal branch divides
into the so-called horizontal and umbilical
paits, supplying segments 1, II, Ill, and IV (B
1.61-1). The splenic vein is regarded as lead
structure for the pancreas and can be followed
into the splenic hilum. The superior mesenteric
vein parallels the superior mesenteric artery
and can be demonstrated, together with its
branches, in the inferior parts of the mesentery
(B 1.6m-s, Fig. 1.83). Anomalies of the intra-
hepatic branches of the portal vein are rare.
л Fig. 1.83 Portocaval collaterals accessible to ultra-
sound in portal hypertension.
И 1.6 Topographic Anatomy of the Portal Vein and Its Tributaries
a and b Junction of the right gastric
vein (VCV) with the confluence of the
superior mesenteric and splenic veins
(co); respiratory variation in the lu-
men diameter.
a Inspiration.
b Expiration (arrows).
c Subcostal view of the liver with left
and right branches of the portal vein.
VC = vena cava; 1, 2, 3 = segments l-lll.
d Septum stretching between the right
branch of the portal vein and the gall-
bladder. VP = portal vein.
В 1,6 Topographic Anatomy of the Portal Vein and Its Tributaries
1 Vessels
e The venous ligament runs from the
left branch of the portal vein (2) to the
posteroinferior aspect of the liver. LVP -
left portal vein; VP = portal vein.
f The ligamentum teres stretches be-
tween the left branch of the portal vein
(3) and the umbilicus. LVP - left portal
vein.
g Right anterior branch of the portal
vein (A) with branches supplying the
anterior segments V (S5) (inferior) and
VIII (S8) (superior). RLV = right hepatic
vein.
h Posterior branch of the main right
portal vein trunk (P) supplying the
posterior segments VI (S6) (inferior)
and VII (S7) (superior) of the right
hepatic lobe. RLV - right hepatic vein;
VC = vena cava.
/-/ The left branch of the portal vein
(LVP) supplies segments I—IV (SI-S3)
(VC = vena cava).
i Segment I.
j Segment II. US = umbilical segment. к Segment III.
LLV = left hepatic vein.
/ Segment IV. RVP = right branch of
portal vein).
m Longitudinal subxiphoid view with
superior mesenteric vein (VMS). CO =
venous confluence.
n Transverse epigastric view with
splenic vein (VL). CO = venous conflu-
ence
о Left intercostal plane with hilar view
of the splenic vein (VL). P = pancreatic
tail.
p Splenic vein (VL) with normal lumen
diameter.
q Enlarged splenic vein (VL) in portal
hypertension.
rand s Respiratory variation in the lumen diameter of the superior mesenteric vein
(VMS). LE = liver. CO = venous confluence; MA = stomach.
Enlarged Lumen Diameter
Piecise diagnosis of any enlargement of the
portal vein diameter is one of the strong points
of ultrasonography.
tn
Portal Hypertension_____________________________________________________
И
и
(Z)
► Prehepatic Block
► Intrahepatic Block
► Posthepatic Block
Portal hypertension is defined as a pressure of
more than 10 mmHg in the portal vein. The
pressure depends on the resistance of the run-
offbed within the liver, the blood volume in the
splanchnic vessels, and the pressure in the in-
ferior vena cava. The etiology of its various
types and causes is classified according to the
location of the flow impediment. Accordingly,
portal hypertension may be subdivided into
prehepatic, intrahepatic, and posthepatic
types, with the intrahepatic type being subdi-
vided into postsinusoidal, sinusoidal, and pre-
sinusoidal forms (Table 1.2).
The pathophysiology of portal hypertension
is characterized by a drop in flow velocity, en-
larged vein diameter, sclerosis, opening up of
collaterals, and flow reversal in the portal vein
or its tributaries. The collaterals are differenti-
ated by the direction of their drainage, i.e., they
are subdivided into cephalad and caudad
draining shunts (Table 1.3).
Sonographic studies in portal hypertension
will yield presumed and rather firm findings.
Images similar to • 1.7 should raise the suspi-
cion of portal hypertension:
► Enlarged vena cava and hepatic veins
(B 1.7a and b)
► Demonstration of ascites (- 1.7c and d)
► Demonstration of liver cirrhosis (B 1.7a-d)
► Thickening of the gallbladder wall (в 1.7e)
► No respiratory variation in the diameter of
the portal vessels (B 1.7f)
► Thickening of the gastnc/intestinal wall
(B 1.7g-i)
► Splenomegaly, splenic fibrosis (в 1.7j and k)
► Enlarged lumen of the hepatic artery (в 1.71)
Table 1.2 Possible causes of portal hyper-
tension
Posthepatic
- Right-sided heart failure
- Constrictive pericarditis
- Tricuspid regurgitation
- Membranous obstruction of hepatic
segments of the vena cava
Intrahepatic
► Postsinusoidal
- Liver cirrhosis
- Budd-Chiari syndrome, venous oc-
clusion
► Sinusoidal
- Chronic hepatitis
- Fatty liver
- Liver cirrhosis
► Presinusoidal
- Idiopathic portal hypertension
- Hepatic fibrosis
- Myeloproliferative disorders
- Granulomatosis
- Primary biliary cirrhosis
- Severe splenomegaly without hepatic
disease
Prehepatic
- Portal vein thrombosis
- Cavernous transformation of the
portal vein
- Segmental thrombosis of the splenic
vein
- Arterioportal fistula
Table 1.3 Formation of possible collaterals
in portal hypertension (after reference 4)
Cephalad draining collaterals
► Right gastric vein
► Short gastric veins
► Periumbilical veins
► Portogastnc collaterals
► Portorenal collaterals
► Hepatic, phrenic, and splenic capsule
veins
Caudad draining veins
► Paraumbilical veins
► Gastrosplenic shunts
► Splenorenal shunts
► Splenolumbar shunts
► Hemorrhoidal plexus via the mesenteric
veins
With the advent of color-flow Doppler imaging,
the following are considered rather firm signs
of portal hypertension:
► Flow reversal in the portal vein or some of its
tributaries (Fig. 1.84)
► Oscillating flow in the portal vein or some of
its tributaries (Figs. 1.85-1.88)
► No flow
► Demonstration of portosystemic collaterals
Enlarged Lumen Diameter
< Fig. 1.84 Continuous flow reversal in the portal vein
(hepatofugal flow) in a patient with liver cirrhosis.
И 7.7 Portal Hypertension: Suspect Findings
<D
ГП
► Hepatic cirrhosis
► Contour signs
7 Vessels
a and b Cardiac cirrhosis in tricuspid insufficiency. Massively dilated hepatic veins,
the posteroinferior aspect of the liver has a corrugated appearance (arrows). COR =
heart.
c and d Completely cirrhotic liver with ascites (A) and corrugated appearance
(arrow) in a chronic alcoholic.
► Ascites, Thickening of the
gallbladder, vascular change
e Cirrhosis of the liver (L) with ascites
(A) and thickened wall of the gallblad-
der (arrows).
f Markedly enlarged lumen of the mes-
enteric vein (VMS) and its confluence,
with the splenic vein in portal hyper-
tension without respiratory variation.
LE = liver; CO = venous confluence.
► Thickening of the stomach, and
bowel walls
g and h Congested stomach with marked thickening of the gastric wall in cirrhosis
of the liver and portal hypertension (A = ascites, MA = gastric wall; LE = liver).
/ Pronounced intestinal wall in portal
hypertension.
► Structural, vascular change,
splenomegaly
j Completely cirrhotic liver (L) with
markedly coarse hepatic parenchyma.
к Portal hypertension with pronounced
splenomegaly (M).
/ Posthepatic cirrhosis of the liver with
decreased portal blood flow and in-
creased flow in the hepatic artery (AH).
VP = portal vein.
a Fig. 1.85 Images of different flow profiles: A, contin-
uous hepatopetal flow; B, pulsatile hepatopetal flow;
C, pulsatile flow with brief pulse-synchronous flow
reversal (arrows)
a In the portal vein.
a b In the splenic vein.
Enlarged Lumen Diameter
a Fig. 1.87 Patient with clinically evident symptomatic
pulmonary embolism.
a Flow profile of the hepatic veins with severe pulse-
synchronous reflux.
b Flow profile in the portal vein with predominantly
hepatopetal flow but also brief hepatofugal flow.
a Fig. 1.86 Pulsatile portal flow with brief pulse-synchronous flow reversal in a patient with cardiac cirrhosis. VP = portal vein.
◄ Fig. 1.88 Pericardial effusion.
a Patient with marked pericardial effusion (PE). RV =
right ventricular; LV = left ventricular.
b The flow profile in the portal vein demonstrates a
brief reflux episode (arrow).
► Prehepatic Block
00
In less than 20% of patients portal hypertension
will be due to a prehepatic block. Important
causes of prehepatic block are total or partial
thrombosis of the portal, splenic, and mesen-
teric veins (Fig. 1.89). Extrinsic portal vein com-
pression (Fig. 1.90), agenesis, or hypoplastic
malformation also may result in portal hyper-
tension (Figs. 1.91 and 1.92).
1 Vessels
a Fig. 1.89 Patient with pancreatic cancer.
a, b Tumor (TU) infiltrating the splenic vein (VL). VP = portal vein; AH = hepatic artery.
a c Color-flow Doppler scanning demonstrates turbu-
lence, signifying a stenosis.
Fig. 1.90 Hepatic hilar lymph nodes in a patient with
stomach cancer.
a Portal vein (VP) compression. M = spleen; L = liver.
b Color-flow Doppler scanning demonstrates turbu-
lence. signifying a stenosis.
Fig. 1.91 Portal vein hypoplasia of unknown etiology,
with severe compression of the vessel, prestenotic
dilatation, and turbulence phenomena in color-flow
Doppler scanning.
* Fig. 1.92 Aplastic portal vein with collateralization,
possibly due to old thrombotic and now fibrotic
occlusion of the vein, in a 25-year-old woman. AH
= hepatic artery; DC = D. hepatocholedochus; LE =
liver; VC = vena cava.
► Intrahepatic Block_________________________________________________________________________________
With -80% of cases, intrahepatic block is by far
the most common cause of portal hyperten-
sion. The most important factors are hepatic
disorders, in particular cirrhosis of the liver.
Cirrhotic vascular changes. The sonographic
criteria for transformation of the hepatic pa-
renchyma should be noted since the cirrhotic
vascular changes will point the way toward the
diagnosis of portal hypertension:
► Enlarged diameter of the portal vein in the
hepatic portal (Fig. 1.93a)
► Sudden diameter changes in the branches of
the portal vein (Fig. 1.93b)
► Pronounced periportal encasement
(Fig. 1.94)
► Ratified peripheral vascular tree in the liver
Collaterals. Demonstration of any collaterals is
of particular interest, the following collateral
systems being of primary importance:
► Enlarged right gastric vein with flow reversal
(-1 1.8a and b)
► Demonstration of esophageal varices
(И 1.8c and d)
► Recanalization of the umbilical veins (inner
and outer Medusa’s head) (s 1.8e-i)
► Demonstration of varicosities in the splenic
hilum (short gastric veins) (E 1.8j-n),
► Demonstration of splenorenal shunting
(E 1.8o-q)
Shunts. In rare cases, intrahepatic portocaval
or intrasplenic cephalad draining varicosities
may be demonstrated (E 1.8r and s).
> Fig. 1.93 Portal hypertension.
a Enlarged portal vein (VP).
л Fig. 1.94 Pronounced periportal echogenicity. VC =
vena cava.
a Normal branching of the portal vein (VP).
Й 1.8 Collaterals in Intrahepatic Block
► Coronary vein of stomach
a b Sudden caliber change in the portal branches of
the left hepatic lobe (LL).
a b Pronounced echogenic boundary of the portal vein
(although this finding is also seen as a normal var-
iant).
a Enlarged right gastric vein with normal flow into the portal vein. CO = confluence
of superior mesenteric and splenic vein, VR • renal vein, VC « vena cava, L = liver.
b Flow reversal in the right gastric vein (VCV) in portal hypertension. V * para-
esophageal varices; AH = hepatic artery; VP s portal vein; LE = liver.
Enlarged Lumen Diameter
7.8 Collaterals in Intrahepatic Block
► Paraesophageal varices
► Recanalized umbilical vein
c Marked paraesophageal varices (ar-
row).
d The paraesophageal varices are sup-
plied by the right gastric vein.
g Transverse view.
e Distinct recanalization of the umbil-
ical vein (VU).
fand g Recanalization of the umbilical
vein in color-flow duplex scanning.
f Longitudinal view. A = ascites.
h Atypical course of a recanalized um-
bilical vein (arrows) (A - ascites, LE =
liver, LT = ligamentum teres).
► Tangled vessels, color-Doppler
i Massively dilated umbilical vein. The other images (cephalocaudal view) demonstrate the varicosities of an inner Medusa’s
head. They could be mistaken for localized intra-abdominal fluid (caution: aspiration!). The last two images are color-flow
duplex scans of the varicosities. VP = portal vein; VU = umbilical vein; MA = stomach; A = ascites; D - short bowel.
В 1.8 Collaterals in Intrahepatic Block
► Splenic hilum
j Short gastric vessels (arrows) origi-
nating from the hilar vessels of the
spleen (Milz) and draining into the
stomach (Magen).
к Numerous collateral veins running
from the splenic hilum to the gastric
wall (Magen) in cirrhosis of the liver.
I Massive splenic varices in portal hypertension. S = spleen.
Enlarged Lumen Diameter
► Stomach wall, paragastric
m Pancreatic cancer:
Occluded splenic vein. TU = tumor; VP =
portal vein; AO = aorta.
n Pancreatic cancer:
Marked paragastric varices. MA =
stomach.
о Retroperitoneal collaterals coursing
toward the kidney (N) in liver cirrhosis
and portal hypertension. A = ascites;
LE - liver.
► Splenorenal
p and q Splenorenal shunt.
p Suspiciously dilated renal vein (NV).
AO = aorta.
q Hilar splenic varices (V) draining into
the renal vein (NV), resulting in a
splenorenal shunt.
В 1.8 Collaterals in Intrahepatic Block
► Intrasplenic
г Intrasplenic varicosity draining to-
ward the surface of the spleen in mye-
loproliferative disorder and portal hy-
pertension.
s Intrasplenic venous “watershed”. The hilar splenic veins exhibit normal drainage into the hilum, whereas the cortical splenic
veins drain toward the surface of the spleen (flow reversal).
► Posthepatic Block__________________
Posthepatic block is quite rare and occurs in
around 1 % of all patients with portal hyper-
tension. Budd-Chiari syndrome is really a
thrombosis with occlusion of the major hepatic
veins. The most important etiological factors
are systemic hematological disease, disorders
in hemostasis, and hepatic metastasis. In ve-
nous occlusive disease the major hepatic veins
are patent while the small veins at the micro-
scopic level are thrombosed. The primary etio-
logical factor is graft rejection after allogeneic
bone marrow transplant. Chronic constrictive
pericarditis (armored heart) is a rare cause of
posthepatic block, and another rare causative
entity is primary tumor of the vena cava
(Figs. 1.95-1.97).
Patients with posthepatic block usually ex-
hibit thickening of the gallbladder wall, and
sometimes it is possible to demonstrate intra-
hepatic venovenous collaterals or transdiaph-
ragmatic veins draining in a cephalad direction.
Flow reversal in the portal vein may also be
seen3. Quite often in patients with cardiac de-
compensation, the portal vein will exhibit re-
duced blood flow with a pulsatile profile,
which in some cases turns into full-fledged
pulse-synchronous flow reversal.
Fig. 1.95 A 23-year-old patient with ALL (acute lym-
phocytic leukemia) after allogeneic bone marrow
transplantation.
a Clinical diagnosis of hepatic veno-occlusive dis-
ease (VOD) with flow reversal in the portal vein (VP).
◄ b Posttherapy demonstration of normal direction of
flow in the portal vein.
« Fig. 1.96 A 24~year-old man with multiple drug de-
pendence: old hepatic veno-occlusive disease
(Budd-Chiari syndrome) with esophageal varices.
Normal hepatic veins cannot be demonstrated: sin-
gular varicosities around the junction of the hepatic
veins. VC = vena cava; LC = caudate lobe.
a Fig. 1,97 Patient presenting with primary leiomyoma
of the vena cava.
a Intracaval tumor mass (TU); flow reversal in the
right hepatic vein. COR = heart.
a b Demonstration of the tumor and portal vein (VP)
with normal direction of flow.
а c Marked recanalization of the umbilical vein in post-
hepatic block. LE = liver; AH = hepatic artery.
Intraluminal Mass
Intraluminal Mass
Thrombosis___________________________________________________________
a
QJ
И
un
Qj
— ► Portal Vein Thrombosis
► Splenic Vein Thrombosis
► Thrombosis of the Superior Mesenteric Vein
► Portal Vein Thrombosis__________________________________________________________________
The etiology of portal vein thrombosis is rather
varied (Table 1.4). Cirrhosis of the liver is by far
the most common cause, although in fresh
thrombosis hepatocellular carcinoma must be
ruled out3. Portal vein thrombosis may be sub-
divided into partial intrahepatic thrombosis,
complete or partial thrombosis of the portal
trunk, and additional thrombosis of the tribu-
taries (splenic and mesenteric veins).
Other less frequent collaterals may be seen
alongside these cavernous transformations:
► Atypical paraportal collaterals (Fig. 1.98)
► Varices around the peribiliary vascular
plexus (Fig. 1.99)
In addition, there may be hepatofugal collat-
erals via the right gastric vein or collaterals
draining in a caudad direction1.
Table 1.4 Etiology of portal vein throm-
bosis (after reference 1)
► Idiopathic
► Cirrhosis of the liver
► Malignancies
► Diseases of the pancreas
► Parainfectious
► Posttraumatic
► Collagen disorders
► Thrombophilia
► Myeloproliferative disorders
7 Vessels
* Fig. 1.98 A 3-year-old thrombosis of the portal vein
with paraportal “recanalization” (collaterals). The
portal blood drains toward the gallbladder (GB) and
from there into the liver. VP = portal vein.
Fig. 1.99a Patient with Klatskin tumor, stent pallia-
tion, and occlusion of the portal vein (VP).
« b Originating from the portal vein there are marked
cephalad collaterals around the peribiliary venous
plexus. CB = gallbladder.
В 1.9 Typical findings in portal vein thrombosis
► Intrahepatic and extrahepatic
b Spontaneous lysis after two months.
a and b A 71-year-old patient with cancer of the colon. GB = gallbladder;
VC = vena cava; VP = portal vein.
a Incidental finding of partial thrombosis of the intrahepatic portal vein.
► Cavernous transformation of
portal vein
c Echogenic image of the portal vein
in thrombosis. DC = D. hepatocholedo-
chus; AH = hepatic artery; TH = throm-
bus; VC = vena cava; AO = aorta.
d A 24-year-old female with esopha-
geal varices secondary to portal vein
thrombosis. Varicosities along the por-
tal vein as a result of cavernous trans-
formation of the portal vein. VC - vena
cava; VP « portal vein.
e-h Sonographic course of a fresh
portal vein thrombosis (TH). VC = vena
cava.
e Hypoechoic image of the thrombotic
material.
В 1.9 Typical findings in portal vein thrombosis
► Cavernous transformation
of portal vein
f Increasingly echogenic transforma-
tion of the thrombosis.
h Marked varicosities around the hep-
atic portal four years later.
in
Intraluminal Mass
g Beginning recanalization after four
months.
i Portal vein thrombosis, six years old. Fibrotic occlusion of the portal vein, no
significant recan; lization demonstrable.
j-i Thrombosis of the portal vein with
cavernous recanalization.
j Old portal vein thrombosis.
к Cavernous recanalization cephalad of
the portal vein.
/ Color-flow duplex scan of the caver-
nous recanalization.
► Splenic hilum collaterals
m Collateralization at the splenic por-
tal.
► Splenic Vein Thrombosis_______________________________________________________________
UP
1 Vessels
Complete or partial thrombosis of the splenic
vein is a common complication of acute pan-
creatitis and cancer of the pancreas. It may also
originate from portal vein thrombosis and
grow by apposition.
The ultrasound image depicts a hypoechoic
vascular lumen without any flow on color-flow
Doppler scanning. Partial thrombosis of the
splenic vein is sometimes observed. One of
the sequelae of this vascular obstruction is
“segmental" portal hypertension. Collateraliza-
tion primarily opens the peripancreatic and
perigastric veins draining cephalad via esoph-
ageal varices as well veins running in a caudad
direction (omental veins draining into the mes-
enteric veins) (Figs. 1.100-1.102),
A finding of hepatosplenomegaly is not
mandatory, and neither is the build-up of as-
cites. Over time, the splenic vein may become
recanalized or undergo cavernous transforma-
tion, although quite often the collaterals will
persist. In thrombosis of the splenic vein, one
rare complication is splenic infarction or even
rupture.
Fig. 1.100 Splenic vein thrombosis.
a Cancer (TU) of the pancreatic head. DC = D. hep-
atocholedochus.
-< b Demonstration of echogenic material in the
splenic vein (VL). AMS = superior mesenteric vein.
Fig. 1.101 Acute pancreatitis.
a The splenic vein cannot be depicted. Marked vari-
ces anterior to the pancreas.
b Demonstration of varicosities (V). M = spleen; LE =
liver; P = pancreas; AL = splenic artery.
« Fig. 1.102 Thrombosis of the splenic vein after mes-
enteric irradiation of a malignant lymphoma. LE =
liver; MA = stomach; CO = venous confluence; VC =
vena cava: VL = splenic vein; Milz = spleen.
a The splenic vein cannot be imaged and there is
marked peripancreatic collateralization.
* b Regular appearance of the splenic vein at the
splenic portal.
► Thrombosis of the Superior Mesenteric Vein______________________________________________
Truly isolated thrombosis of the superior mes-
enteric vein does not result in portal hyper-
tension. However, it may be associated with
splenic and/or portal vein thrombosis. The eti-
ology is primarily inflammatory, in particular
acute pancreatitis (Fig.1.103). During the acute
phase, the clinical symptoms with severe ab-
dominal pain are impressive (Fig. 1.104), On
ultrasound the mesenteric vessels appear di-
lated and lined with echogenic structures.
Color-flow Doppler scanning will not elicit
any flow signals. Partial thrombosis is possible.
In rare cases there may be segmental infarction
of the intestines. Usually this disorder does not
require surgery, and quite often there will
spontaneous recanalization.
Fig. 1.103 Patient with acute pancreatitis.
a The tip of the thrombus within the superior mes-
enteric vein extends into the confluence of the mes-
enteric and splenic veins. Color-flow duplex scanning
demonstrates echogenic thrombotic material.
< b Color-flow duplex scanning depicts partial recan-
alization. P = tail of pancreas; CO = venous conflu-
ence; TH = thrombosis.
Intraluminal Mass
a Fig. 1.104 A 50-year-old patient with acute abdomen.
a-c Color-flow duplex scanning demonstrates complete thrombosis of the superior mesenteric vein (VMS). DC = Common bile duct; TH = thrombosis; VP = portal vein; VC =
vena cava; CO = venous confluence; VL = splenic vein.
a d-f В-mode imaging also depicts the thrombosis. Massive dilatation of the small intestine. There is thickening of the colonic wall at the level of the sigmoid and a lack of
peristalsis (nonsurgical treatment proved to be successful).
Tumor
7 Vessels
— ► Tumor Infiltration
► Tumor Infiltration______________________________________________________________________________________________
Tumor infiltration into the portovenous system
is not infrequent, and in primary hepatic ma-
lignancies it is observed quite often at the porta
hepatis. Ultrasonography can differentiate be-
tween tumor infiltration and thrombosis of the
portal vein, but may be difficult to perform for
some segments. If color-flow Doppler imaging
demonstrates tumor vessels within the
"thrombotic material,” this will confirm the
diagnosis of tumorous thrombosis (Fig. 1.105).
At the confluence and along the splenic vein,
tumor infiltration may be one complication of
pancreatic cancer, with extensive infiltration of
the tumor into the vessel usually being a sign of
inoperability. Under good conditions in such
cases, ultrasonography may be able to demon-
strate direct infiltration of the portal vessels by
continuity3.
Fig. 1.105 Patient with hepatocellular carcinoma
(TU). TH = thrombosis.
a Demonstration of the tumor and the echogenic
portal vein immediately adjacent to it.
* b Color-flow duplex scanning confirmed the diag-
nosis of portal vein thrombosis. The discrete flow
signals within the thrombotic material raise the sus-
picion of a tumorous thrombus.
References
1. Furuse J, Matsutani S, Voskikawa M. Diagnosis of
portal vein tumor thrombus by Pulsed Doppler
Ultrasonography. JCU 1992;20:439-46.
2. Gaitini BD, Thaler I, Kaftori JK. Duplex sonography
in the diagnosis of portal vein thrombosis.
Fortschr Rdntgenstr 1990; 153(6): 645-9.
2 a. Janssen A. Pulsatility index is better than ankle-
brachial Doppler index for non-invasive detec-
tion of critical limb ischaemia in diabetes. Vasa
2005;4 (accepted for publication).
3. Ochs A. Sonographie der Leber. Freiburg: Falk
Foundation Freiburg 2000:1-115.
4. Seitz K, Wermke W, Haas K. Sonographie bei
portaler Hypertension und TIPPS. Freiburg: Falk
Foundation 1997; 3-64.
5. Schmidt, WA, Kraft HE, Vorpahl К et al. Color
Duplex Ultrasonography in the Diagnosis of
Temporal Arteritis. NEJM 1997;337:1336-1342.
Liver 51
▼ Diffuse Changes in the Hepatic
Parenchyma
J^TnJai^edHive^
— ► Congested Liver
— ► Fatty Liver
— ► Fatty Liver Hepatitis
— ► Fatty Cirrhosis
— ► Diffuse Infiltration
r Small Liver
— ► Atrophy
— ► Cirrhosis
— ► Resection
▼ Homogeneous Hypoechoic
Texture
— ► Acute Liver Congestion
— ► Amyloidosis
— ► Acute Hepatitis
▼ Homogeneous Hyperechoic
Texture
— ► Fatty Liver
— ► Hemochromatosis
— ► Fibrosis
▼ Regionally Inhomogeneous
Texture
— ► Focal Fatty Infiltration
— ► Necrosis
*—► Portal Venous Gas Embolism
f Utlfuse Inhomogeneous
Texture
— ► Chronic Hepatitis
— ► Cirrhosis
1—► Diffuse Tumor Growth
▼ Localized Changes in Hepatic
Parenchyma
^^Jnechoi^^asse^
61
62
67
68
70
72
74
76
— ► Cysts
— ► Polycystic Liver Disease
— ► Hemorrhage/Hematoma
— ► Bilioma
— ► Abscess
— ► Hydatid Cysts
— ► Osler Disease/Hepatic Peliosis
— ► Lipoma
— ► Lymphoma
— ► Metastases
— ► Vessels/Bile Ducts
▼ Hypoechoic Masses
— ► Metastasis
— ► Lymphoma
— ► Abscess
— ► Hematoma
— ► Complicated Cyst
---► Adenoma
— ► Focal Nodular Hyperplasia (FNH)
— ► Hepatocellular Carcinoma (HCC)
— ► Lipoma
— ► Atypical Hemangioma
— ► Focal Fatty Change
— ► Bile Ducts/Vessels
▼ Localized Changes in Hepatic
Parenchyma (Continue)
▼ Isoechoic Masses
— ► Focal Nodular Hyperplasia (FNH)
— ► Adenoma
► Hepatocellular Carcinoma (HCC)
► Metastasis
► Atypical Hemangioma
► Hematoma
► “Hepatized” Gallbladder
- — ► Bile Ducts/Vessels
▼ Hyperechoic Masses
— ► Hemangioma
— ► Bile Duct Hamartomas
— ► Porphyria
— ► Regenerative Nodules
— ► Hepatocellular Carcinoma (HCC)
— ► Focal Nodular Hyperplasia (FNH)
— ► Metastasis
— ► Abscess
— ► Necrosis
— ► Diaphragmatic Slips
— ► Ligamentum teres Hepatis
— ► Focal Fatty Change
— ► Bile Ducts/Vessels
▼ Echogenic Masses
► “Comet-Tails”
— ► Calcification
— ► Calculus
► Foreign Body
► Air
▼ Irregular Masses
— ► Hepatocellular Carcinoma (HCC)
► Thorotrastosis
► Diffuse Metastasis
► Alveolar Hydatid Disease
98
98
99
2 Liver
M. Brandt
The liver is the largest gland as well as the
largest single organ in the human body, weigh-
ing 1500-1800 g (accounting for about 2.3-3%
of body weight). Blood, primarily from the
splanchnic region, flows through the liver,
where numerous substances are recovered
and metabolized. Apart from breaking down
and synthesizing substances, the liver is a key
element in storage pathways (glycogen, fat). It
either releases these metabolites directly into
the bloodstream or excretes them via the bile
(1500 ml/day). In addition, the liver is charac-
terized by its organ-specific macrophages
(Kupffer cells), which are an integral part of
the human macrophage system (reticuloendo-
thelial system, RES). In summary, this organ
plays a vital role not only in metabolic detox-
ification but also in the synthesis de novo and
storage of proteins, sugar molecules, and fat as
well as in the secretion of digestive juices.
In order to realize these varied functions, the
anatomy of the liver is based on the so-called
hepatic lobules with their functional unit, the
hepatic acinus according to Rappaport
(Fig. 2.1]. Splanchnic blood flowing through a
branch of the portal vein passes three succes-
sive metabolic zones where the substances
a Fig. 2.1 Hepatic lobule and acinus according to
Kiernan and Rappaport. The gray hepatic lobule of
Kiernan is characterized by its central vein and the
peripheral portal areas; the colored hepatic acinus of
Rappaport has a terminal branch of the portal vein in
its center while the central veins (of the hepatic
lobule) are on its periphery, and in between there
are three distinct metabolic zones: zone 1 rich and
zone 3 poor in nutrients.
Portal triad
Central
vein
Artery Vein
Bile
duct
Bile
capillaries
Liver cell
trabe-
culation
Sinusoid
Liver cell
a Fig. 2.2 Schematic diagram of a hepatic sinusoid to-
gether with a portal triad. In the sinusoids, blood
from the terminal branch of the portal vein (joined
in the portal triad by the artery and the bile duct)
flows through the three successive metabolic zones
into the central vein. Excretion into the bile ducts
paralleling the branches of the portal vein is by coun-
tercurrent principle.
2 Liver
transported by the blood are metabolized. All
products synthesized by the liver are passed
into the bloodstream through the central vein
or excreted via a countercurrent mechanism
into the bile ducts that parallel the terminal
portal branches (Fig. 2.2).
Topography_____________________________________________________________________________
The liver is located in the right hypochondrium,
protected by the ribs (Fig. 2.3). Its general
shape is that of a pyramid, with the base point-
ing to the right side of the body. The average
transverse diameter is 25-30 cm, the cephalo-
caudal length is 12-20 cm, and the normal an-
teroposterior diameter is 6-10 cm. The supe-
rior aspect borders the diaphragm (facies dia-
phragmatica hepatis) and is composed of a
fixed and a mobile part; parts of the anterior
aspect are in contact with the abdominal wall.
The inferior surface of the liver points in a
posterocaudal direction; on the left and in the
middle the inferior aspect is in contact with the
gastric wall, while on the lateral right side it
borders the hepatic flexure of the colon. The
gallbladder is attached to the inferior surface of
the liver in the midclavicular line. The right
dorsal aspect of the liver is anterior to the
upper pole of the right kidney. The hepatic
portal is situated in the middle of the inferior
surface, anterior to the caudate lobe (see be-
low) and the dorsal vena cava (Fig.2.4); the
porta hepatis comprises the portal vein, he-
patic artery, bile duct, lymphatics, and nerves.
a Fig. 2.3 Topography. Location of the liver in the right
hypochondrium, protected by the lower right ribs;
note the relationship with the diaphragm, right
kidney, major retroperitoneal vessels, colon, and
stomach.
a Fig. 2.4 Schematic anatomy of the hepatic portal.
Aorta and vena cava are posterior; the portal vein is
on the right coursing obliquely and anteriorly to the
vena cava. The portal vein is posterior to the hepatic
artery and medial to the extrahepatic bile duct.
2 Liver
Table 2.1 Hepatic segments
Segment Location Topography, boundary Name Tributary
I Left medial, posterior, anterior to vena cava Anterior to vena cava, posterior to seg. IVa Caudate lobe Left portal vein branch PVS 1
II Left lateral, superior, subcardial Superior to seg. 1, medial to seg. IVa, forms superior left medial margin Superior part is anatomical left lobe Left portal vein branch PVS II
111 Left lateral, inferior Inferior to seg. II, medial to seg. IVb, forms inferior left medial margin Inferior part is anatomical left lobe Left portal vein branch III
IV Left medial, anterior Right lateral to lig. teres and lateral to seg. Il/lll, medial to seg. V Quadrate lobe Left portal vein branch IV
V Right medial, inferior Medial to seg. Vl/Vll, superior to gallbladder Forms gallbladder fossa Right portal vein branch PVS V
VI Right lateral, inferior Inferior to seg. VII, lateral to seg. V, forms right lateral margin Right portal vein branch PVS VI
VII Right lateral, superior, subphrenic Superior to seg. VI, lateral to seg. VIII, subphrenic, forms right lateral superior margin Right portal vein branch PVS VII
VIII Right medial superior, subphrenic Superior to seg. V, medial to seg. VII, subphrenic Right portal vein branch PVS VIII
Anatomy_______________________________________________________________________
From a macroscopic anatomical point of view,
the liver is subdivided into a larger right lobe
(representing the base of the pyramid) and a
smaller left hepatic lobe (the apex of the pyr-
amid), with the falciform ligament (containing
the ligamentum teres) dividing the two lobes
(Fig. 2.5). In terms of its micioanatomy, the
liver is composed of eight functionally separate
segments that follow the vascular tree (Fig. 2.6;
Table 2.1). If circumscribed masses or patho-
logical findings can be correlated to a specific
segment, this is extremely helpful in preoper-
ative and intraoperative diagnosis as well as for
possible resectability or any planned interven-
tional angiographic procedures. However, since
the numerous anatomical variants are not par-
ticularly infrequent, segmental correlation is
not always certain and thus may be of only
limited value in some cases.
Couinaud’s Segmental Anatomy of the Liver
The microanatomy of the liver is composed
of eight functionally different segments;
when viewed from the front/below they are
counted clockwise: the left hepatic lobe
comprises segments l-IV and the right lobe
segments V—VIII. Compared to the anatomi-
cal division of the liver along the falciform
ligament (including the ligamentum teres)
into a smaller left lobe (only segments II
and III) and a larger right lobe (segments
V—VIII plus segments I and IVa/b), Couinaud’s
segmental anatomy follows the vascular tree
(Fig. 2.6). Here the branches of the portal
vein (accompanied by the branches of the
hepatic artery and the bile ducts = portal
triad) are the central structures of each seg-
ment, while the hepatic veins running be-
tween the segments drain the blood. There
are three major hepatic veins—right (lateral
right), middle, and left (medial)—all joining
the vena cava posteriorly at the bare area of
the superior aspect of the liver below the
diaphragm. The middle hepatic vein divides
the angiographic right hepatic lobe from the
left lobe. The left hepatic vein drains be-
tween double segments il/lll as well as IVa/
IVb of the left lobe. The right hepatic vein
drains between double segments Vl/Vll and
V/VIII. Segment I is the caudate lobe and is
part of the left hepatic lobe. Segment IV
corresponds to the quadrate lobe, while seg-
ment V forms the base of the gallbladder
fossa.
« Fig. 2.5 Liver anatomy. Inferior view: the ligamen-
tum teres (falciforme) separates the anatomical left
hepatic lobe (LL) from the lateral anatomical right
lobe, which is larger and is shown with the gallblad-
der fossa on its inferior aspect. The vena cava can be
seen posteriorly. The dotted line marks the imagi-
nary plane running through the gallbladder fossa
and vena cava, which is considered the dividing line
between the vascular tree of the left and nght
branches of the portal vein.
« Fig. 2.6 Segmental hepatic anatomy according to
Coumaud. Schematic diagram of the hepatic seg-
ments I (caudate lobe) to IV (quadrate lobe) of the
left lobe as well as segments V—VIII of the right lobe;
the gallbladder fossa is posteroinferior to segment V.
Sonographic Morphology
Extrinsic Criteria
Size—depends on the patient's build
(Table 2.2)
► Pyknic: 80 mm
► Regular build: 120 mm
► Asthenic: 150 mm
► Caudate lobe: around 50 x 20 mm
► Left hepatic lobe < right lobe
Shape
► Left hepatic lobe (viewed anteriorly to
the aorta): convex/concave
► Right hepatic lobe (viewed laterally
right): biconvex
Surface
► Smooth
Contour
► Sharply angled configuration, 30°
(asthenics)
► < 45° (pyknic)
Anomalies
► Situs inversus
► Accessory lobe
Normal Variants in Liver Anatomy
Normal variants may impact on position and
shape of the liver and/or its microanatomy
(hepatic segmental anatomy) and vascular
supply.
One normal variant of position would be situs
inversus.
Accessory hepatic lobes (the so-called Rie-
del' s lobe) (Figs. 2.7 and 2.8) are most often
found around segment VI, less often around
segments IV or V, appear as large fingerlike
projections, and are normal variants in seg-
mentation and shape. They differ from ma-
lignant masses in their regular parenchymal
architecture with its smooth surface and a
Table 2.2 Assessment of liver size (longitudinal view in right MCL)
Build of patient Normal values
Asthenic (slim, long-limbed) < 15 cm
Normal <12 cm
Pyknic (squat, short-limbed) < 10 cm
normal vascular supply, i.e., a central branch
of the portal vein paralleled by a branch of
the hepatic artery, a bile duct, and a single
accessory central vein which drains the blood
separately from the portal branch.
The most common normal variants in the
vascular supply are found in the hepatic ar-
tery (right hepatic artery originating from
the superior mesenteric artery) and the hep-
atic veins (additional hepatic veins or acces-
sory hepatic veins not terminating at the
common venous junction but directly at the
vena cava).
2 Liver
Ultrasonography of the liver has to assess nu-
merous criteria. Only by putting together these
pieces of the puzzle will the sonographer come
up with a well founded diagnosis. The follow-
ing paragraphs will consider extrinsic, intrinsic,
and dynamic criteria, including adjacent find-
ings. Routine study of the sonographic charac-
teristics of the liver is performed with the pa-
tient in the supine position (sometimes supple-
mented by the left lateral decubitus position or
with the patient standing). The organ is imaged
in the longitudinal and transverse planes and
along the lower right costal margin of the ribs,
as well as in planes parallel to the intercostal
spaces, by sweeping the probe in fanlike fash-
ion during inspiration, expiration, and breath-
holding. The examination is completed by spe-
cific localized palpation with the probe, if
needed.
Extrinsic criteria (и 2.1; Table 2.3). The size of
the liver, its superior and inferior aspect, its
shape, its caudal edge, and any normal variants
are assessed on the basis of the following ex-
trinsic criteria.
The size of the liver is determined along the
midclavicular line and is given in centimeters;
to a large extent this parameter depends on the
build of the patient (Table 2.2). In addition, the
dimensions of the caudate lobe and the distri-
bution of mass between left and right hepatic
lobe have to be assessed.
Usually, the surface of the liver is smooth;
during routine studies its appearance is better
visualized at the inferior aspect of the liver
since, owing to the physics of the ultrasound
beam, the image is blurred at the near field
Another alternative is to switch to a higher-
frequency probe.
The shape takes into account the distribution
of mass between the right lobe and the left as
well as the caudate lobe; in addition, the infe-
rior aspect of the organ is assessed in longitu-
dinal views, with the left lobe being imaged in
the midline anterior to the aorta (the anterior
aspect is convex and the posterior one con-
cave), while the right hepatic lobe is scanned
in the right axillary line (biconcave).
* Fig. 2.7 Schematic anatomy of Riedel’s lobe Acces-
sory hepatic lobes are normal variants and may ap-
pear at various locations of the liver The most com-
mon form is the so-called Riedel's lobe, correspond-
ing to a long projection of the right hepatic lobe
around segment VI and possessing a regular archi-
tectural structure.
The inferior contour of the liver is examined,
too; for the left lobe it is sharply angulated at
30-45°, while the lateral edge of the right hep-
atic lobe is blunt (60 ).
Normal variants are uncommon and, apart
from the variant position (situs inversus), the
sonographer has to keep accessory lobes in
mind (so-called Riedel’s lobe) (Figs. 2.7 and
2.8).
2 Liver
Fig. 2.8 Riedel’s lobe.
a Lateral longitudinal view: image of Riedel’s lobe
with absolutely normal structural architecture of
hepatic veins and portal areas, normal parenchyma.
◄ b Color-flow duplex scan.
Table 2.3 Extrinsic criteria
Criterion
Size
Shape
Surface
Contour
Normal variants
Normal
► 12 cm in right MCL
► Convex/concave
► Smooth
► Angulated
Pathological
► Bigger, smaller
► Biconvex, rounded
► Irregular, localized bulging, pitting
► Blunt, rounded, beaklike
Example
► Fatty cirrhosis, atrophic cirrhosis
► Fatty liver, infiltration
► Chronic hepatitis, focal mass,
metastasis; status post hepatitis
► Fatty liver, cirrhosis
► Riedel’s lobe
Intrinsic Criteria
Parenchymal echotexture
► homogeneous, finely dispersed, me-
dium-sized, moderately bright, individual
echoes
Conduction
► Normal
Hepatic veins
► Draining between segments
► Common junction at the vena cava
(“venous star”)
► Running straight, sharply angulated
branching
► No wall echoes
► Typical signal on duplex scanning
Portal vein branches
► Originating at the hepatoduodenal liga-
ment (bifurcation of the portal vein) and
coursing in the center of the segments
► Periportal encasement
► Sufficient duplex signal for analysis
Hepatic artery
► Paralleling the branches of the portal vein
Bile ducts
► Paralleling the branches of the portal vein
Lymphatics
► Paralleling the branches of the portal vein
► At this time without clinical significance
► Pathological lymphadenopathy at the
hepatic portal
Intrinsic criteria (Table 2.4). The intrinsic cri-
teria deal with the actual parenchymal echo-
texture of the liver, organ-induced attenuation
of the ultrasound beam, and in particular the
demonstration of and changes in the venous
vessels and portal triads with portal vein, bile
duct, branches of the hepatic artery, and the
lymphatics.
The echotexture of the hepatic parenchyma
(E 2.2) comprises numerous individual echoes.
Assessment of these individual echoes has to
consider size (graininess), brightness, uniform-
ity (homogeneity) as well as distribution and
position (density). The parenchyma of a normal
liver will present as finely dispersed, moder-
ately bright, homogeneously and uniformly
distributed individual echoes of moderate
echogenicity. With normal presettings of the
equipment, no relative amplification or attenu-
ation will be seen: both criteria are highly de-
pendent on the type of equipment used and the
presets (time gain compensation, TGC).
The hepatic veins (a 2.3 and H 2.4) converge
on the so-called venous star (Fig.2.9), which
terminates at the vena cava; they drain the
blood from the periphery of the liver, run in
straight lines between the segments with
sharply angled branching, are smoothly lined,
and do not demonstrate any wall echoes. The
blood flow within the hepatic veins may be
assessed qualitatively and quantitatively by
duplex and color-flow duplex scanning.
The portal vein (E 2.5) enters the liver at the
termination of the hepatoduodenal ligament,
bifurcates at the hepatic portal (Fig.2.10) into
the left and right branch, and supplies the cen-
ter of the individual hepatic segments via its
respective segmental branches. The portal vein
branches are characterized by echoes in the
wall (periportal reinforcement), and the blood
flow in the portal vein and its branches may be
assessed and quantified by duplex and color-
flow duplex scanning. The portal veins regu-
larly are paralleled by branches of the hepatic
artery and bile ducts; these three vessels form
the so-called hepatic triads. Blood flow in the
various segments of the hepatic artery may also
be assessed and quantified by duplex and
color-flow duplex scanning. The intrahepatic
lymphatics are too small to be assessed with
today’s equipment, and all extrahepatic lymph
nodes at the hepatic portal visualized by ultra-
sound are pathological.
Dynamic criteria (Table 2.5). The dynamic
criteria take into account the respiratory mo-
tion of the liver, its consistency, and its (possi-
ble) tenderness on palpation.
Supplementary findings. Any pathological
findings in other organs and structures of the
abdomen also must be noted, for instance in
the gallbladder (wall thickening, visible blood
vessels within the wall), spleen (splenome-
galy), pancreas (cysts, pancreatitis), and portal
vessels (varicosities, collaterals), as well as any
free intra-abdominal fluid (amount, type).
Table 2.6 is a summary of the criteria used in
sonographic assessment of the liver.
S 2.1 Extrinsic Criteria
a-c Surface, angle, and con-
sistency.
tn
tn
2 Liver
a In the median line the liver is convex/
concave and sharply angled.
b Misinterpretations may be due to
deformation of the surface with inden-
tation of the anterior surface by the
pressure of the probe pushing down on
the abdominal wall.
c On the lateral aspect the liver is bi-
convex or convex/concave and obtusely
angled.
► d-i Changes in the hepatic
surface.
d Usually, the surface of the liver is
smooth (most often best assessed at
the inferior aspect).
e Inflammatory disorders will result in
diffuse changes in the entire surface of
the liver with an irregular wavy contour,
here in chronic autoimmune hepatitis.
f Irregular nodular hepatic surface in
cirrhosis; imaging is facilitated by the
presence of ascites.
g Localized changes in the surface due
to scarring after bypass surgery with
subsegmentation in the left lobe.
h Traumatic lesions: scar at the inferior
aspect of segment VI after blunt ab-
dominal trauma with ruptured liver,
which was sutured.
i Intrahepatic masses can bulge the
surface of the liver and indent adjacent
organs: here, a unilocular cyst at the
inferior aspect of segment III indenting
the gastric wall.
j Circumscribed changes in the surfaces
due to a bulging colon cancer meta-
stasis
к Gastric cancer metastasis infiltrating
and penetrating into the diaphragm
with concomitant pleural effusion.
I Cancerous impression at the inferior
aspect of segment VI of the right hep-
atic lobe with central pit and bulging
wall.
В 2.2 Assessing the Hepatic Parenchyma
in
2 Liver
► o-c Compared with the
kidney, the regular paren-
chyma of the liver is slightly
more echogenic, finely grained,
and homogeneous; in normal
sonography there is no ultra-
sound attenuation; other
organs used for comparison are
the spleen, pancreas, and psoas
muscle.
a Regular hepatic parenchyma.
b Simple fatty degeneration, easily
recognized by the increased echoge-
nicity when compared with the
(healthy!) kidney.
c Comparison of hepatic parenchyma
with other structures: anechoic (cystic,
transverse view of gallbladder) and hy-
perechoic mass (small angiolipoma in
the cortical parenchyma of the kidney).
► d-f Parenchymal changes in
fatty degradation. Characteris-
tic increased echogenicity, and
despite the excellent conduc-
tion of sound in fat, there is
definite attenuation in the pa-
renchyma because of the in-
creased number of boundaries,
diffraction, and dispersion of
the sonic beam, and runtime
artifacts.
d Blurred contour and boundaries.
e The surface becomes rounded (fatty
cirrhosis of the liver).
f Inhomogeneous parenchyma due to
irregular fat deposits and inflammatory
reaction (fatty liver hepatitis caused by
diabetes, alcoholism, or nonalcoholic
steatohepatitis).
► g-i Fatty degradation may
lead to regional, segmental,
or focal differences in the pa-
renchymal changes. Preferred
locations are the base of seg-
ment IV proximal to the hepatic
bifurcation and the gallbladder
fossa in segment V.
g As in this case, quite often focal dif-
ferences in parenchymal changes are
found around the veins and below the
capsule as well as around the teres lig-
ament.
h Maplike circumscribed pseudotumo-
rous parenchymal changes in fatty
degradation.
i Splotchy changes induced by fatty
degradation of the parenchyma.
► j-l Inflammatory parenchymal
changes and cirrhosis of the
liver. Acute inflammation does
not present with any changes;
because of the transformation
and the infiltration of the in-
flammatory cells, only chronic
inflammation with its inhomo-
geneous and coarsened paren-
chymal structures will be vi-
sualized. However, this is a
nonspecific sign.
/ Autoimmune hepatitis.
к Chronic toxic fatty liver hepatitis/cir- I Primary biliary cirrhosis,
rhosis.
2.2 Assessing the Hepatic Parenchyma
► m-o Noninflammatory diffuse
parenchymal changes: diffuse
coarse inhomogeneities of the
hepatic parenchyma are also
seen in numerous other dis-
eases and can only be recog-
nized when many other criteria
are looked at as well.
m Fibrosis of the liver with unilocular
cysts in Caroli disease.
n Cholangiofibroniatosis = von Meyen
burg complexes.
о Portovenous gas embolism with
small gas bubbles deposited in the
periportal hepatic parenchyma.
In
2 Liver
Table 2.4 Intrinsic criteria
Parenchyma
Conduction
Hepatic veins
Portal veins
Normal
► Homogeneous, finely dispersed
► Normal
► Straight, sharply angulated
branching
► Sharply delineated, no wall echoes
► Unobstructed lumen
► Sharply delineated, wall echoes
Pathological
► More echogenic
► Less echogenic
► Inhomogeneous
► Attenuated
► Enhanced
► Rounded, obtusely angled bi
► Diffuse delineation
► Irregular contour
► Rarefied
► Occluded
► Scabby
► Sudden alteration in caliber
Example
► Fatty liver
► Congestion
► Hepatitis, cirrhosis
► Fibrosis
► Edema
► Fatty liver
► Fatty liver
► Chronic hepatitis
► Cirrhosis
► Veno-occlusive disease,
Budd-Chiari syndrome
► Cirrhosis
► Cirrhosis + portal hyperten-
sion
Table 2.5 Dynamic criteria
Criterion Normal Pathological Example
Respiratory motion ► 2-3 fingerbreadths or 4-6 cm (about 2 inches) ► Missing ► Abscess, adhesions
Consistency ► Soft ► Increased, hardened ► Infiltrative changes, cirrhosis
Tenderness ► None ► Tender on palpation ► Capsular tension
Table 2.6 Sonographic criteria for assessing the liver
Extrinsic criteria
Intrinsic criteria
Size
Shape
Surface
Inferior margin
Angle
Normal variants
Parenchymal structure
Conductivity of sound
Hepatic veins
Hepatic arteries
Portal veins
(bile ducts)
(lymphatics)
Dynamic criteria
Respiratory motion
Consistency, malleability
Tenderness
Supplementary criteria
Changes in neighboring organs
and vessels, free fluid
Venous Flow Pattern
Dynamic Criteria
2 Liver
There is a distinct difference between the
flow patterns in the hepatic and the portal
veins.
Hepatic veins. Here, blood flow is character-
ized by a physiological triple-peak/triphasic
curve resembling the pulse curve in the jug-
ular vein: it mirrors the pressure situation in
the right heart.
► Phase I: first part of the blood flow is to-
ward the heart; at the latter, it corresponds
to the mechanical displacement of the
valve plane (systolic phase)
► Phase II: second part of the blood flow is
toward the heart; at the latter, it corre-
sponds to the opening of the atrioventric-
ular valve (diastolic phase)
► Phase III: regurgitation (back flow) is from
the right atrium; it results from the con-
traction of the right atrium and the bulging
of the tricuspid valve.
Measurements are taken at all three major
hepatic veins. The flow pathology concerns
the make-up of various phases (increased
regurgitation in right ventricular failure,
vena cava engorgement, tricuspid insuffi-
ciency) or the number of phases (biphasic
pattern or monophasic pattern in cirrhosis
of the liver). A ribbonlike flow profile, solely
back flow, or no flow at all are found in
Budd-Chiari syndrome or veno-occlusive
disease (VOD).
Portal veins. These exhibit a ribbonlike flow
profile with arterial modulation by the pul-
sations of adjacent arteries or propagated
through the liver; there is
► Physiological hepatopetal flow (antero-
grade into the liver)
► Pathological hepatofugal flow (retrograde
out of the liver)
► No flow or oscillating flow
and
► Thrombosis of the portal vein
Measurements of the flow direction and
the flow velocity are taken at the trunk of
the portal vein as well as its left and right
branches.
Respiratory motion
► During inspiration 2-3 fingerbreadths or
4-6 cm (~2 inches) caudad
Consistency
► Squeezable like a wet sponge
► Returns to its original shape once the
pressure is released
Tenderness
► None
a Fig. 2.9 View parallel to costal margin: regular hep-
atic parenchyma with the starlike junction of the
hepatic veins.
a Fig. 2.10 Portal veins. View parallel to right costal
margin: regular hepatic parenchyma with portal
vein bifurcating into the left and right branches.
2.3 Hepatic Veins
► Right, middle, and left hepatic
veins, venous confluence
a Right hepatic vein. The major hepatic
veins run in a straight or slightly curved
line, and their margins are smooth
without any wall echoes.
b Right and middle hepatic veins. Wall
echoes are found at the portal vessels
(transverse view) and wherever the
sound waves strike the hepatic veins at
right angle (large drop in impedance).
c Middle/left hepatic vein.
В 2.3 Hepatic Veins
► Flow parameters
d Hepatofugal flow in the hepatic veins.
2 Liver
► Bifurcation
► Structural parameters
e Regular triphasic duplex signal of a
normal middle hepatic vein.
f Abnormal monophasic duplex signal
of a hepatic vein in cirrhosis of the liver.
h Hepatofugal flow toward the heart.
g and h Chronic liver congestion.
Same duplex signal on the left, while
the signal on the right varies with
time.
g Hepatopetal flow reversal.
i Hepatofugal and hepatopetal flow at
different times in the same hepatic vein.
j Usually the hepatic vein branches at
sharp angles.
к Increased volume of the hepatic pa-
renchyma (e.g. in fatty liver) results in
obtuse angle branching (chronic liver
congestion).
/ In hepatosteatosis and inflammation,
the contour of the veins becomes
blurred and irregular.
0 2.4 Pathologic Liver Findings
► Stasis
a-c Chronic liver congestion. Rigid
engorged hepatic vein.
b In vena cava congestion, the hepatic
vein becomes visible well into the
(subcapsular) periphery of the liver.
c Vena cava congestion with enlarged
junction of the hepatic veins and right
pleural effusion.
E 2.4 Pathologic Liver Findings
► Rarefaction
©
io
2 Liver
d Irregular contour of the hepatic vein
with pitting and scarred indentations in
inflammatory disease.
e Scarred irregular contour of the vas-
cular wall with obstruction of the lumen
resulting in local flow disturbances, vi-
sualized in color-flow duplex scanning
as aliasing.
f-h Progress of the destructive in-
flammatory changes leading to the
appearance of the so-called “rarefied
hepatic vein": typical finding in cir-
rhosis.
f Rarefied hepatic vein, sonographic
imaging not possible because of the
parenchymal changes.
g Only color-flow duplex scanning of
the same area delineates the hepatic
vein by its disturbed flow.
h Differential diagnosis: hepatic vein
with fibrous occlusion in veno-occlusive
disease.
► Displacement and
Infiltration
i and j Perivascular infiltration, im-
pression, displacement, and vascular
infiltration in malignancies.
i Breast cancer metastasis indenting
the hepatic vein.
j Diffuse metastasis of gastric cancer
infiltrating the wall of the hepatic vein
k-m Hepatocellular carcinoma (HCC)
with typical infiltration of the hepatic
vein.
к Lengthy wall infiltration of the hep-
atic vein and vena cava.
I Tumor thrombus of an HCC obstruct-
ing the lumen of the hepatic vein.
m Color-flow duplex scan: the tumor
thrombosis does not occlude the lumen
recognizable by the local flow acceler-
ation with aliasing.
0 2.5 Portal veins
► Bifurcation
a-c Bifurcation of the portal vein.
a Left (LI) and right (RE) branch of the
portal vein. Liver segments 1, 2 ,3. 4.
b With the branches for segments I—IV
of the left hepatic lobe.
c With the branches for segments
V-VIII of the right hepatic lobe. RE
liver segments; 5, 6, 7, 8 = right.
d Appearance of "amputated” lateral
and terminal branches.
Diffuse Changes in the Hepatic Parenchyma
► Flow parameters
e-f Color-flow duplex scan of the
portal vein in cirrhosis.
e Hepatopetal flow in atrophic cirrhosis
of the liver.
f Hepatofugal flow; the arterial com-
pensation is easily recognized. Cirrhosis
of the liver in an infant before trans-
plantation.
Diffuse Changes in the Hepatic Parenchyma
The settings of the equipment used will have a
deep impact on the sonographer’s ability to
recognize and assess diffuse changes in the
hepatic parenchyma. Apart from a careful anal-
ysis of the actual shape, texture, echogenicity,
and distribution of the individual echoes rep-
resenting the parenchyma, a successful overall
assessment of the liver has to include as many
additional criteria as possible (Table 2.6). Only
by putting together the various criteria like
pieces of a puzzle will a reliable assessment of
this organ be achieved. One possibility,
although to be used with caution, is a compar-
ison of the hepatic parenchyma with that of
other organs (kidney, spleen, pancreas, psoas
muscle) (E 2.2a). This caveat has to do with the
fact that apart from disease one has to take into
account that aging will alter the characteristics
Parametric Ultrasonography
Parametric ultrasonography does not gener-
ate images but rather numbers. This is sup-
posed to neutralize any subjective bias on the
part of the sonographer as well as any pos-
sible objective bias due to the presettings
and/or equipment used. Not only can tissues
be detected and described objectively, but it
is also possible to quantify and document the
of the different parenchymas differently (Table
2.7).
Thus, assessment of diffuse changes in the
hepatic parenchyma is still influenced by any
number of subjective aspects, and to a large
brightness and homogeneity. These digital
signals are then processed and compared
by various statistical computer programs,
and the result opens up the possibility of
noninvasive classification of diffuse tissue
changes in ultrasonography, objective qual-
ity control in ultrasound equipment, and im-
proved imaging.
extent depends on the sonographer’s experi-
ence. Early results of studies using parametric
ultrasound are encouraging and give rise to the
hope that this might open up the possibility of
objective findings and their assessment.
Table 2.7 Comparison of hepatic parenchyma with other organs
Criterion Liver Spleen Kidney Pancreas Psoas muscle
Single echo size 4-4- 4- 4-4-4- + 4-4-
Echogenicity 4-4- + ++ 4- 4- - 4-4-4- 4- - 4-4-
Brightness 4-4- + 4-+ 4- 4-4-
Distribution Homogeneous Homogeneous Inhomogeneous Homogeneous Structured
Age-dependent changes Slight Yes Slight Distinct Slight
Function- dependent changes - - Yes - Distinct
Disease-dependent changes 4-4- 4- 4-4- 4-4-4- 4-
Enlarged Liver___________________________________________________________
▼ Diffuse Changes in the Hepatic
Parenchyma
Enlarged Liver
Small Liver
Homogeneous Hypoechoic
Texture
«► Homogeneous Hyperechoic
Texture
Regionally Inhomogeneous
Ц Texture
— ►Diffuse Inhomogeneous
Texture
► Localized Changes in Hepatic
Parenchyma
► Differential Diagnosis of Focal
Lesions
— ► Congested Liver
► Fatty Liver
► Fatty Liver Hepatitis
► Fatty Cirrhosis
► Diffuse Infiltration
When the liver increases in volume, this does
not necessarily become evident on a quantita-
tive level because of the distinct interpersonal
variability of this organ or because the change
may be compensated by a change in shape.
Sometimes the increase is noticed and docu-
mented only during follow-up studies. En-
largement of the liver is therefore an unrecog-
nized finding that is often overlooked and be-
comes evident only in its more advanced
stages.
Determining the Size of the Liver
Sonographic assessment of the size of the
liver is fraught with problems.
Volumetric measurements yield a value of
around 1/40 of the body weight (2.3-3%);
for the adult male this would mean 1500-
1800 ml and for the adult female 1200-
1500 ml.
Organ measurements yield a width (right-
left) of 25-30 cm, a length (cephalocaudad)
of 12-20 cm, and a sagittal depth (antero-
posterior) of 6-10 cm. Different shapes are
encountered depending on the build: in as-
thenic persons the liver expands mostly in
the longitudinal direction, while in pyknics
the largest dimension is in the sagittal plane.
Therefore, the build alone will account for
different normal values of size.
In ultrasonography the size of the liver is de-
termined in the right midclavicular line
(MCL), a normal value being 12 cm (9 cm in
pyknics, up to 15 cm in asthenics). Assess-
ment of the superior diaphragmatic aspect is
critical, since ultrasound may not be able to
clearly delineate the boundary because of
superposition of the phrenicocostal sinus,
and percussion is rather imprecise. One op-
tion would be assessment of the inferior bor-
der at the costal margin; however, this value
also varies widely depending on the build of
the patient (normal: inferior edge at the cos-
tal margin), and cannot be relied on because
of the respiratory motion of the liver or ab-
normal position of the diaphragm (emphy-
sema, phrenic nerve palsy). Sagittal mea-
surements also display a rather wide margin
of error since there are no fixed markers to be
used in reconstruction.
Determining the size of the caudate lobe,
either in absolute terms or in relation to the
right hepatic lobe, may aid in the presumed
diagnosis of cirrhosis or Budd-Chiari syn-
drome.
When assessing the size of the liver, the in-
tersegmental comparison and the relation
between right and left hepatic lobe (normal:
left < right) have to be considered as well.
Should the left hepatic lobe slide in between
the spleen and the diaphragm, displacing the
spleen inferiorly, this would be the firm sign
of an enlarged left hepatic lobe.
► Congested Liver
Acute congestion of the liver (Figs. 2.11 and
2.12). In cases of acute liver congestion the liver
is usually characterized by a significant in-
crease in size; this is due to congestion of the
vena cava, normally caused by cardiac insuffi-
ciency, which leads to blood backing up into
the liver, thus increasing its volume (edema)
and providing the explanation for the de-
creased echogenicity as well as the improved
ultrasound image of the organ. On the other
hand, quite often this will lead to capsular ten-
sion and pain. The liver has a smooth surface;
the inferior margin is obtusely angled or round.
The organ is tightly elastic/firm and quite ten-
der (on palpation); sometimes an expansive
hepatic pulse may be palpated. The hypoechoic
parenchyma has a “fluffy” appearance with im-
proved conduction of the ultrasound beam.
Characteristic sign are the distended hepatic
veins, which can be visualized all the way
into the periphery of the liver, and the en-
gorged junction of the hepatic veins at the
vena cava (“venous star”). Regular B-mode
imaging already displays real-time turbulent
flow in the hepatic veins, which presents rather
impressively in duplex and color-flow duplex
scanning with an increased percentage of flow
reversal and the typical change in the pulsed
Doppler curve (see “Venous Flow Pattern”,
p.58).
The diagnosis of acute congestion of the
liver, suspected on abdominal ultrasound, is
firmed up by additional findings, such as as-
cites, pleural effusion, incompressible enlarged
lumen of the vena cava, and congestion-in-
duced sequelae in other organs (kidneys,
spleen, stomach).
a Fig. 2.11 junction of the hepatic veins in acute hep-
atic congestion. Hypoechoic homogeneous paren-
chyma of the liver resulting from the edema: rigid
engorged hepatic veins and vena cava signifying con-
gestion of the vena cava; other criteria are: increased
size and consistency, possibly tenderness on palpa-
tion.
a Fig. 2.13 Chronic congestion of the liver with dis-
tinctly engorged rigid junction of the hepatic veins,
and a homogeneous hyperechoic parenchyma.
a Fig. 2.12 Junction of the hepatic veins in acute failure
of preexisting chronic hepatic congestion. Homoge-
neous parenchyma with an increased number of dif-
fusely dispersed, finely grained echoes; rigid en-
gorged hepatic veins and vena cava.
Diffuse Changes in the Hepatic Parenchyma
Chronic congestion of the liver (Figs. 2.13 and
2.14, И 2.4a and b). Although chronic conges-
tion of the liver also may present as substantial
enlargement of the organ, it is primarily char-
acterized by extended fibrotic changes; in
other words, the increase in size may not be
quite apparent or it might be pretended by a
low position of the liver in the abdomen with-
out any actual increase in size (e.g., in emphy-
sema). These fibrotic changes ("cardiac cirrho-
sis’’) may result in the organ becoming smaller
and would explain the distinct increase in con-
sistency as well as the increasing echogenicity.
The hepatic surface is smooth, possibly slightly
irregular because of the ongoing fibrosis, the
inferior margin is blunt or sharply angled.
Sometimes an expansive hepatic pulse may
be palpated. Capsular tension with concomi-
tant pain would be unusual for chronic hepatic
congestion, as it is more characteristic of acute
decompensation of the underlying congestion
of the vena cava. As is the case in acute hepatic
congestion, too, the engorged hepatic veins can
be visualized far into the periphery of the liver,
and also the junction of the hepatic veins at the
vena cava is enlarged.
a Fig. 2.14 Cardiac cirrhosis. Irregular surface and ho-
mogeneous parenchyma; the engorged hepatic vein
is visible far into the periphery. Signs of ascites and
right pleural effusion (not seen here).
Just as in acute congestion of the liver, du-
plex and color-flow duplex scanning demon-
strates the impressive flow changes. The car-
diac modulation may affect the duplex curve of
the portal system. Sometimes there may be
additional findings, such as ascites, pleural ef-
fusion, rigid enlarged lumen of the vena cava,
and congestion induced changes in other or-
gans (kidneys, spleen, stomach). Table 2.8 is a
summary of the criteria relevant in acute and
chronic congestion of the liver.
2 Liver
Table 2.8 Sonographic diagnostic criteria used in acute/chronic congestion of the liver
Criterion Acute hepatic congestion Chronic hepatic congestion
Size Enlarged Normal or enlarged
Shape Biconvex Biconvex
Surface Smooth Smooth/irregular
Contour of margin Blunt Blunt
Parenchymal structure Hypoechoic, homogeneous Hyperechoic, homogeneous
Ultrasound conduction Improved Normal
Hepatic veins Engorged, can be imaged far into the periphery Engorged, can be imaged far into the periphery
Portal veins (Marked) (Marked)
Hepatic artery No characteristic change No characteristic change
Respiratory motion Present or lessened Present or lessened
Consistency Tightly elastic Firm
Tenderness Marked None
Other Ascites/pleural effusion/pericardial effusion, r gid engorged vena cava Ascites/pleural effusion/pericardial effusion, rigid engorged vena cava
► Fatty Liver fs 2.6)________________________________________________________________________________
Extrinsic and dynamic criteria. Fatty in Filtra-
tion of the hepatic parenchyma is a frequent
but nonspecific finding, increasing the volume
of the liver and thus its size. Initially, this in-
crease in total organ volume manifests itself by
a change in the shape; the increased size of the
liver as such becomes evident and can be quan-
tified only in the more advanced stages. But
even then the organ will still have a smooth
surface and exhibit a normal soft consistency.
The inferior margin of the liver becomes more
and more blunt while the angle increases. The
left hepatic lobe becomes biconvex and the
inferior margin almost round (so-called round-
ing of the organ).
Intrinsic criteria. Since fatty infiltration of the
cells goes hand in hand with an increased vol-
ume of the liver, the vessels are pushed apart,
the hepatic veins take a somewhat curved
course, and their branching no longer is sharply
angled but obtuse. The regular well-defined
contour of the hepatic veins becomes blurred:
this artifact is due to the increased refraction
and scattering of the ultrasound waves at the
numerous boundaries of the individual fatty
vesicles within the hepatocytes and can be
demonstrated at all contours.
This increase in boundaries is also the rea-
son for the typical increased echogenicity and
degraded ultrasound conduction (i.e., attenua-
tion) (Fig. 2.15). The degree of fatty infiltration,
the type of fatty deposits in the hepatocytes
(large vesicles = few additional boundaries; or
small vesicles = numerous additional bounda-
ries), the type of fat, and additional factors
(severity of any concomitant inflammation, de-
gree of fibrosis) will define any changes in the
Fatty Change of the Liver
Definition. Fatty liver or steatosis hepatis is
present if the moist mass of the liver contains
>10% fat, or if more than 50% of the hepatic
cells display medium- or large-sized lipid va-
cuoles and there is a diffuse pattern of dis-
tribution.
Pathogenesis. The causes of underlying
fatty change may be exogenous:
► Increased fat transport
► Increased carbohydrate intake
or endogenous:
► Increased peripheral mobilization of fat
► Inhibited intracellular utilization of fat in
the hepatic cells
► Increased fat synthesis in the hepatic cells
► Decreased removal of fat.
Morphology. Morphology differentiates be-
tween small-, medium-, and large-sized lipid
vacuoles with low (5% of the moist mass of
echotexture, in particular any changes in the
number, size, and density of the echoes as well
as in the degree of attenuation (Fig. 2.16). The
homogeneous distribution of the echoes may
vary between segments or regions but still re-
mains one of the basic characteristics of fatty
liver.
Causes. By itself, the sonographic finding of
fatty liver cannot tell anything about the under-
lying cause. Nutrition may be assumed as prob-
able cause if there arc also fatty changes in
the liver), moderate (6-8%), and marked
(8-9%) involvement of the liver. The distri-
bution pattern of the fatty change can be
classified as peripheral, centroacinar, zonal,
or diffuse.
Etiology. In terms of etiology, fatty liver is
encountered as nonspecific reaction in nu-
merous diseases and conditions; these in-
clude:
► Nutrition
► Metabolic disorders
► Alcohol
► Medication
► Chemical substances
► Phytotoxins and mycotoxins
► Infection
► Hypoxia
► Endocrine disorders
► Pregnancy
other organs (abdominal wall, pancreas, body
mass index BM1 > 24), in which case the fatty
changes in the liver could be regarded as “nor-
mal” findings. However, if a slim patient with a
thin abdominal wall (BM1 < 24) exhibits fatty
liver whose consistency is significantly softer
or harder than normal, this finding would have
to be assessed as pathological and would man-
date further work-up.
S 2.6 Fatty Liver, Fatty Liver Hepatitis and Focal Fatty Infiltration
► Increased structural density
► Regional differences in fatty
infiltration: focal
a-c Fatty liver.
a The displaced hepatic veins no longer
course in a straight line but are slightly
curved and are poorly delimited.
b Because of the increased refraction
and scattering at the boundaries and
the runtime artifacts, the contours as
well as the boundaries are poorly de-
limited.
c Fatty liver/fatty liver hepatitis: in-
creasing fatty infiltration will diminish
the echodensity and increase the at-
tenuation.
Diffuse Changes in the Hepatic Parenchyma
UD
d The additional inflammatory changes
in diabetic or toxic fatty liver or non-
alcoholic steatohepatitis induce irregu-
lar margins of the hepatic veins; here, a
case of diabetic fatty liver hepatitis with
focal inhomogeneous fatty infiltration.
e-g Focal fatty infiltration (FFI).
e Focal non-steatosis in loco typico at
the inferior aspect of segment IV in the
left hepatic lobe anterior to the portal
bifurcation.
f FFI of segment II in the left hepatic
lobe; the parenchyma with its increased
fatty infiltration appears hyperechoic.
► Regional differences in fatty
infiltration: bizarre, maplike
g-i FFI may parallel the vessels and display a map of bizarre irregular margins.
► Fatty Liver Hepatitis fa 2.6)_______________________________________________________________________
In fatty liver hepatitis (Fig. 2.15-2.18) (e.g., al-
coholic hepatitis, nonalcoholic steatohepatitis,
diabetic fatty liver), the fatty infiltration is ac-
companied by necrosis and inflammatory
changes with fibrosis. Apart from the sono-
graphic signs of fatty deposits discussed above,
this results in increased consistency of the liver
and a decreased plasticity. The surface still re-
mains smooth.
The decisive aspect is the changes in the
hepatic veins: contrary to their somewhat
curved course in simple fatty liver, they now
appear as an entire network but can only be
imaged in a disjointed fashion, with some frag-
ments visible while whole other segments are
missing. Artifacts will blur the contours of the
hepatic veins and ultrasonography will show
irregular walls due to perivenous inflamma-
tion. Ultimately, increasing fibrosis and scar-
ring will lead to fatty cirrhosis, the transition
between these states being fairly fluid.
a Fig.2.15 Fatty liver/fatty liver hepatitis. Large right
hepatic lobe with a diffuse increase in the delicate
to moderate echotexture, which appears more
densely packed, with slightly irregular graininess,
and signals fatty infiltration; apart from the coarser
graininess of the parenchyma, the inflammation is
characterized by the irregular contour of the hepatic
veins. There is marked attenuation of the ultrasound
waves.
a Fig. 2.16 Fatty liver hepatitis. Large right hepatic lobe
with a diffuse increase in the delicate and particularly
the moderate echotexture, which appears more
densely packed and with irregular graininess; the
hepatic veins exhibit a networklike and disjointed
appearance, the fatty infiltration and inflammation
blurring their contours.
2 Liver
** Fig. 2.17 Fatty liver hepatitis. Large right hepatic
lobe with a diffuse increase in the moderate echo-
texture, which appears more densely packed and
with irregular graininess; the hepatic veins exhibit
markedly irregular contours, signifying perivascular
inflammation; the fatty liver aspect is recognizable
by the blurred contours and the echo density, the
inflammatory reaction being the most important
aspect (surface no longer totally smooth, increased
consistency at one-finger palpation).
* Fig. 2.18 Chronic toxic fatty liver hepatitis. Large
right hepatic lobe with a marked diffuse increase in
the moderate echotexture, which appears more
densely packed and with irregular graininess. The
hepatic veins present as a network and appear irreg-
ular; the surface shows fine irregularities as well, and
there is a marked increase in volume and consis-
tency.
► Fatty Cirrhosis
In fatty cirrhosis (Fig. 2.19) the liver has turned
into a densely firm organ. In many cases there
is a distinct shift in the mass relation of the
lobes from right to left, with a more significant
increase in the mass of the left lobe, and the
right hepatic lobe even appearing smaller than
normal. The caudate lobe may become quite
prominent. The fine nodular surface in fatty
cirrhosis can only be visualized by high-reso-
lution probes: during routine studies the liver
presents with a smooth surface. The individual
echoes of the hepatic parenchyma are coarse,
hyperechoic, and arranged as a homogeneous
texture. One of the typical findings is the be-
ginning rarefication of the hepatic veins; how-
ever, in contrast to posthepatitic cirrhosis, they
still are easily recognized. The portovenous
system is prominent and exhibits distinct so-
* Fig. 2.19 Fatty cirrhosis. Liver with marked diffuse
increase in moderately and coarsely textured echoes,
which display irregular graininess and are more
densely packed; the junction of the hepatic veins
appears stunted, and the peripheral segments of
the hepatic veins seem rarefied; obvious evidence
of attenuation of the ultrasound beam.
called periportal reinforcement, a scabby knot-
ted bifurcation of the portal vein, enlarged cen-
tral aspect of the vascular tree, and distinct
caliber changes at the more peripheral seg-
ments. Other criteria of cirrhosis may also be
evident: e.g., ascites, splenomegaly, thickening
of the gallbladder wall, and collaterals in portal
hypertension.
► Diffuse Infiltration____________________________________________________________________________________________
Diffuse infiltration with an increased size of the
liver may be the result of extracellular or intra-
cellular substrate deposits.
Intracellular deposits. Apart from fatty infil-
tration as discussed above, these deposits are
also encountered in other storage diseases such
as hemochromatosis and the glycogen storage
diseases. Just as in fatty liver, not only does the
echogenicity of the parenchyma increase but so
also does the consistency of the liver. The vas-
cular architecture, particularly that of the hep-
atic veins, remains unchanged for a long time.
Extracellular infiltrations. These may be
caused by fluid (edema) or cellular mecha-
nisms (e.g., chronic lymphocytic leukemia)
and lead to increased size and consistency of
the organ, with a typical decrease in parenchy-
mal echogenicity but improved conduction. In
many cases the echoes display a homogeneous/
diffuse distribution, though regional differen-
ces (perivenous) or segmental patterns are also
quite common.
Small Liver
▼ Diffuse Changes in the Hepatic
Parenchyma
► Enlarged Liver
2 ► Small Liver
Homogeneous Нуp о e c h о I c
Texture
► Homogeneous Hyperechoic
Texture
► Regionally Inhomogeneous
Texture
_► Diffuse Inhomogeneous
Texture
— ► Atrophy
► Cirrhosis
► Resection
to
► Localized Changes in Hepatic
Parenchyma
► Differential Diagnosis of Focal
Lesions
A small liver is a rather infrequent finding and
becomes evident only if the decrease in size is
substantial. Owing to the small probe contact
area and the hidden position below the ribs,
the conditions for ultrasound studies of the
liver are less than ideal.
Diffuse Changes in the Hepatic Parenchyma
► Atrophy________________________________________________________________________________________________________
Hepatic atrophy is a rather rare finding and
may pertain to the entire organ or just individ-
ual segments. Its possible causes comprise vas-
cular disorders or chronic inflammatory dis-
ease, the most common being chronic atrophic
ciirhosis.
► Cirrhosis_________________________________________________________________________________________________
Apart from the decrease in size, the cirrhotic
liver is characterized by certain typical criteria
(Table 2.9). Quite often there is a substantial
amount of ascites, in which the small organ
seems to float like a wooden block in water
and thus can still be insonated well despite its
lack of size (Figs. 2.20 and 2.21). Also, there are
clear-cut signs of portal hypertension, with a
drop in flow velocity within the portal vein,
even all the way down to no flow and some-
times a hepatofugal flow.
a Fig. 2.20 Atrophic cirrhosis. Grainy, slightly inhomo-
geneous hepatic parenchyma, irregular surface, rare-
fied vasculature; the liver floats like a wooden block in
the ascites. Ancillary finding: thickened gallbladder
wall, gallstone evident within the lumen of the gall-
bladder.
a Fig. 2.21 Completely atrophic cirrhosis of the liver
with irregular surface, rarefied intrahepatic vascula-
ture, and marked ascites; demonstration of hepato-
petal flow in the portal vein (PV) on color-flow duplex
scanning. Ancillary finding: thickened gallbladder
(GB) wall.
Table 2.9 Diagnostic criteria in cirrhosis of the liver
Criterion Fatty cirrhosis Posthepatitic cirrhosis Cardiac cirrhosis
00 Size +++ Normal-smaller Normal
to Shape Rounded Beaklike —
Surface Comparatively smooth Irregular Smooth
Contour of margin Blunt/rounded Sharply angulated Sharply angulated/blunt
IN Parenchymal structure Dense, homogeneous Coarse, inhomogeneous Coarse, inhomogeneous
Conduction Attenuated Normal Increased
Hepatic veins Narrow, blurred, beginning rarefaction Marked rarefaction Engorged
Portal veins Center: engorged Periphery: caliber change Center: engorged Periphery: caliber change Engorged
Hepatic artery No characteristic change Prominent due to compensation No characteristic change
Respiratory motion Normal Normal Normal
Consistency Firm Hard Hard
Tenderness Possible No In acute decompensation
► Resection_______________________________________________________________________________________
Usually, the status post resection of any parts of
the liver is hard to recognize just by looking at
the size of the organ since the liver has an
enormous capacity for regeneration, and any
surgical reduction in volume will be compen-
sated for by hypertrophy of the remaining tis-
sue. A postresection liver is best assessed by
the change in vascular architecture, but one has
to remember that the numerous normal var-
iants of the vascular system and the congeni-
tally different sizes of the various liver seg-
ments (smaller left lobe) may make this an
impossibility. Quite often, right hemihepatec-
tomy will produce an anomalous position of
the remaining liver with tilting, rotation, and
twisting around the portal axis. Apart from the
usual small contact area at the right thoracic
wall, these factors will hamper orientation
about the anatomy even further.
Homogeneous Hypoechoic Texture_______________________________
▼ Diffuse Changes in the Hepatic
Parenchyma
J ► Enlarged Liver
Small Liver
Homogeneous Hypoechoic
j Texture
Homogeneous Hyperechoic
Texture
B™>Regionally Inhomogeneous
Texture
► Diffuse Inhomogeneous
Texture
► Localized Changes in Hepatic
Parenchyma
► Differential Diagnosis of Focal
Lesions
► Acute Liver Congestion
► Amyloidosis
► Acute Hepatitis
A hypoechoic homogenous echotexture within
the liver is due to a decrease in the number of
echoes per unit area because of fluid accumu-
lation on the intracellular level (edema), or the
extracellular/intracellular/sinusoidal level (hy-
pervolemia, congestion), or both (right sided
heart failure, renal failure, hemodialysis).
► Acute Liver Congestion_____________________________________________________________________
Congestion of the inferior vena cava will in-
crease the volume load of the liver (edema)
and explains the lessened echogenicity but
heightened conduction of the organ; on the
other hand, such typical criteria as the signifi-
cant capsular tension with its concomitant pain
and the tightly elastic/firm consistency of the
liver on palpation with marked tenderness will
be hard to miss. The hypoechoic coarse paren-
chyma may be quite discrete and become
masked by previous chronic congestion of the
liver aggravated by acute right ventricular fail-
ure; however, sonographic findings of im-
proved ultrasound conduction of the organ,
engorged hepatic veins easily followed far
into the periphery, and a dilated junction of
the hepatic veins remain the characteristic so-
nographic signs of an acutely congested liver
(Figs. 2.11 and 2.12).
СЛ
to
► Amyloidosis_______________________________________________________________________________________________________
Amyloidosis is characterized by a homogene-
ous increase in the size of the liver, with regular
architecture and a homogeneous hypoechoic
parenchyma of coarse consistency.
► Acute Hepatitis_____________________________________________________________________________________
Since acute hepatitis is accompanied by edema
and the infiltration of inflammatory cells, one
would expect a hypoechoic organ that is easy
to insonate; unfortunately, a liver such as this is
rarely encountered in acute viral hepatitis. Ul-
trasonography is therefore not the modality of
choice in the work-up of acute hepatitis, espe-
cially since there are far more characteristic
findings suggesting the diagnosis of acute viral
hepatitis: even if shape, size, and echotexture
of the liver appear absolutely normal, quite
often an increasing resemblance of the paren-
chymal splenic and hepatic echotextures (pos-
sibly with homogeneous enlargement) be-
comes evident (Figs.2.22-2.24). A thickened
striated gallbladder wall of up to 20 mm (no
tenderness!) and hypoechoic, pathologically
enlarged hilai lymph nodes can also frequently
be demonstrated (Figs. 2.25 and 2.26). Paren-
chymal hypoechogenicity in acute viral hepati-
tis is an incidental finding in fulminating ne-
crosis of the liver; in this case, the organ is
surprisingly small, displays a markedly soft
consistency, and is characterized by a hypo-
echoic to splotchy/inhomogeneous parenchy-
mal echotexture.
Diffuse Changes in the Hepatic Parenchyma
a Fig. 2.24 Acute hepatitis. Compare spleen/liver: in
this case of acute viral hepatitis the hepatic and
splenic parenchyma begin to resemble each other
This is a case of acute hepatitis A.
a Fig. 2.22 Acute hepatitis in mononucleosis.
a Fig. 2.23 The spleen of the same patient as in
Fig. 2.22. Compare spleen/liver: in acute hepatitis
the parenchymal texture of the liver and spleen may
start resembling each other.
a Fig. 2.25 Callbladder in acute hepatitis. Marked
thickening and striation of the wall > 20 mm without
any tenderness in a case of acute hepatitis A; positive
demonstration of hypoechoic enlarged lymph nodes
in the duodenal ligament. The parenchyma itself and
the ultrasound conductivity of the liver are normal
(smooth surface, normal/soft consistency as seen by
the impressions formed on palpation with the probe).
a Fig. 2.26 Gallbladder (CB) in acute hepatitis A. Here,
too, there is marked thickening and striation of the
gallbladder wall > 20 mm. No tenderness; demon-
stration of hypoechoic enlarged lymph nodes (LK) in
the hepatoduodenal ligament; normal parenchyma
and ultrasound conductivity of the liver. PV = portal
vein.
Homogeneous Hyperechoic Texture______________________________
2 Liver
v Diffuse Changes in the Hepatic
Parenchyma
► Enlarged Liver
► Small Liver
Homogeneous Hypoechoic
Texture
► Homogeneous Hyperechoic
Texture
► Regionally Inhomogeneous
Texture
► Diffuse Inhomogeneous
Texture
— ► Fatty liver
► Hemochromatosis
► Fibrosis
► Localized Changes in Hepatic
Parenchyma
► Differential Diagnosis of Focal
Lesions
A hyperechoic homogeneous texture of the
hver may be the result of an increased number
of echoes/boundaries per unit area, which in
turn may be traced back to intracellular or
interstitial deposits of foreign substances (e.g.,
fat or iron, and fibrosis, respectively).
► Fatty Liver________________________________________________________________________________________
In principle, fatty tissue lends itself quite well
to insonation: it is characterized by a low den-
sity and impedance and conducts ultrasound
better than water or hepatic parenchyma. It is
the increase in the number of boundaries that
is responsible for the typical hyperechogenicity
and attenuation encountered in fatty liver. The
severity of the steatosis, the type of fatty de-
posits within the hepatocytes (large vesicles =
few additional boundaries: small vesicles = nu-
merous additional boundaries), the type of fat,
and other factors (severity of any concomitant
inflammation or fibrosis) predetermine the
change in the echotexture, i.e., the number.
size, and density of the individual echoes and
the degree of attenuation. But one aspect re-
mains constant: even if the overall echotexture
vanes between segments or regions, within
any such affected area the individual echoes
still exhibit the homogeneous appearance
(S2.6).
► Hemochromatosis--------------------------------------------------------------------
Although iron deposits in the hepatocytes re-
sult in a homogeneous increase in the echoge-
nicity as well as attenuation, this finding is
nonspecific, making ultrasonography an un-
suitable modality in the early diagnosis. Only
inflammatory changes and cirrhotic transfor-
mation of the hepatic parenchyma will then
characterize the disease (Fig. 2.27).
< Fig. 2.27 Hemochromatosis with subsequent cirrho-
sis of the liver: coarse hyperechoic texture due to the
fibrosis; prominent hepatic artery (A). P = pancreas,
VP = portal vein.
► Fibrosis---------------------------------------------------------------------------------------------------
Fibrosis of the liver may be a primary hepatic
disorder, a sequela to a previously overcome
bout of hepatitis, or a chronic vascular disease.
Typical ultrasound findings are the homogene-
ous, if somewhat coarsely grained, echogenic-
ity of the liver, demonstration of a slightly un-
dulating surface, firm consistency, and quite
often a still evident vascular and hepatic archi-
tecture (Fig. 2.28).
◄ Fig. 2.28 Fibrosis; in this case, Caroli syndrome with
slightly inhomogeneous, coarsely grained, hyper-
echoic hepatic parenchyma; demonstration of a
small cyst, still present hepatic vein taking a mildly
arced course.
Regionally Inhomogeneous Texture
u. Diffuse Changes in the Hepatic
Sj [ Parenchyma
-J M Enlarged Liver
_[► Small Liver
Гы ► Homogeneous Hypoechoic
|t| Texture
IW Homogeneous Hyperechoic
! Texture
Regionally Inhomogeneous
Й Texture
► Diffuse Inhomogeneous
*’ Texture
Iй ► Localized Changes in Hepatic
Parenchyma
► Differential Diagnosis of Focal
Lesions
The sonographic texture of the hepatic paren-
chyma is determined by the size, density,
brightness, and distribution/arrangement of
the individual echoes. In other words, irregular
ultrasound texture is the sequel to changes in
one or more of these echo characteristics.These
changes may pertain uniformly to the entire
organ or just to a segment, region, or zone.
In parenchyma with limited segmental, re-
gional or zonal irregularities (parenchyma with
circumscribed “splotches”) one has to differen-
tiate between changes found in one or more
segments (Fig. 2.29), or developing in typical
perivascular fashion or along the portal struc-
tures (a 2.2g and h), and those whose distri-
bution appears without any semblance of or-
der. In the latter case, it becomes rather diffi-
cult to distinguish these changes from infiltrat-
ing metastatic changes (Fig. 2.30).
— ► Focal Fatty Infiltration
► Necrosis
► Portal Venous Gas Embolism
a Fig. 2.29 Example of segmental inhomogeneity:
varying degree of fatty infiltration limited to one
segment (segment II).
a Fig. 2.30 Example of periportal inhomogeneity: peri-
portal infiltration in metastatic pancreatic cancer. AH
= hepatic artery; PV = portal vein; GG = bile duct.
Diffuse Changes in the Hepatic Parenchyma
► Focal Fatty Infiltration_________________________________________________________________________________________
Focal fatty infiltration of the liver (FFI) appears
as a mass within the classic findings of fatty
liver (a 2.6, Figs.2.29 and 2.31-2.33) (see
above). It is a rather common finding, charac-
terized by the juxtaposition of two different
areas of the parenchyma with echoes of the
same size/brightness, which may be densely
(hyperechoic) or more loosely (hypoechoic)
packed but always displaying a homogeneous
arrangement. There are a number of prime
locations for focal fatty infiltration (posteriorly
in segment IV, at the gallbladder fossa, around
the veins, left > right). Quite often they exhibit
a maplike delineation toward the neighboring
parenchyma but still fit in harmoniously with
the hepatic architecture, i.e., they do not de-
form any boundaries nor do they change the
surface or alter the course of any vessels. Focal
fatty infiltration seems to take place more fre-
< Fig. 2.31 Focal fatty infiltration. Inhomogeneous
splotches of hyperechoic/hypoechoic parenchyma
in the left hepatic lobe without involvement of the
vessels.
quently in certain situations, such as severe
nutritional steatosis or after anesthesia. If ul-
trasonography is the only diagnostic modality
used, it is sometimes impossible to differenti-
ate between focal infiltration and diffuse meta-
stasis. in which case abdominal CT or hepato-
biliary scintiscanning would have to be em-
ployed.
2 Liver
« Fig. 2.32 Segmental fatty infiltration. Hypoechoic
parenchyma with fatty infiltration of varying degree
along segment II of the left hepatic lobe; tonguelike
delineation of the fatty infiltration without any
changes in the surface or the course of the vessels.
Fig. 2.33 Segmental fatty infiltration. Pseudotumo-
rous pseudonodular hyperechoic areas respecting
the boundaries and surfaces of vessels and seg-
ments.
► Necrosis-----------------------------------------------------------------------------------------
Segmental necrosis requires a break in the
blood supply from the corresponding branch
of the portal vein as well as from the hepatic
artery. The early phase usually evades detec-
tion and is characterized by swelling and
edema, with a hypoechoic somewhat broken-
up parenchyma. Older necrosis presents as seg-
mental coarse changes in the parenchymal tex-
ture, with an irregular arrangement of echoes
of varying coarse graininess and brightness.
► Portal Venous Cas Embolism--------------------------------------------------------
Necrotizing intra-abdommal disease (e.g.,
acute mesenteric ischemia, pancreatitis), dis-
eases with a breakdown in the barner between
the intestinal lumen and the portal venous sys-
tem (e.g., penetrating GI ulcer, diverticulitis),
and septic conditions with gas-producing
pathogens from the portal run-in areas may
sweep gas bubbl, es into the liver via the portal
vein. In ultrasound, these bubbles appear as
coarse turbulent echoes within the portal
vein; in the hepatic parenchyma they are de-
posited first in the periportal regions and there
present as coarse echoes (Fig. 2.34). Eventually,
these coarse echoes will spread across the en-
tire parenchyma, and within just a few hours
portal venous gas embolism can develop into
life-threatening acidosis (Kussmaul respira-
tion) and fatal hepatic failure.
л Fig. 2.34 Portal venous gas embolism. Initial peripor-
tal deposits of gas bubbles.
Diffuse Inhomogeneous Texture-----------------------------------
▼ Diffuse Changes in the Hepatic
Parenchyma
► Enlarged Liver
► Small Liver
► Homogeneous Hypoechoic
Texture
► Homogeneous Hyperechoic
Texture
► Regionally Inhomogeneous
Texture
► Diffuse Inhomogeneous
Texture
► localized Changes in Hepatic
Parenchyma
► Differential Diagnosis of Focal
Lesions
► Chronic Hepatitis
► Cirrhosis
► Diffuse Tumor Growth
► Chronic Hepatitis___________________________________________________________________________________
During the course of hepatitis there will be
periportal and parenchymal inflammation, ac-
companied by edema and necrosis. As a result
size, density, brightness, and distribution of the
individual echoes within all of the hepatic pa-
renchyma will exhibit coarse inhomogeneity of
varying degree. The surface becomes increas-
ingly irregular and displays fibrotic dimpling,
which also will be found along the hepatic
veins where it leads to irregular margins (“nib-
bling away"). Eventually the veins will become
toituous and increasingly rarefied in the pe-
riphery. The branches of the portal veins
present with multiple periportal echoes, while
the consistency of the liver becomes increas-
ingly firm and in the end hard (Figs. 235 and
236). The extent of the sonographic changes
depends not so much on the possible etiology
of chronic hepatitis but rather on its duration
and seventy. Any pathological enlarged lymph
nodes at the hepatic portal will correlate with
the severity and activity of chronic hepatitis.
There is a fluid transition between the sono-
graphic findings of chronic hepatitis and cir-
rhosis of the liver.
► Cirrhosis_____________________________
In a liver with cirrhotic changes, the diffuse
irregular parenchymal echotexture by itself is
a rather poor criterion for the presence or
absence of any cirrhosis. Irregular surface, typ-
ical changes in the shape, firm/hard consis-
tency of the organ, rarefied hepatic veins,
splenomegaly, and collateralization in portal
hypertension are much more reliable in-
a Fig. 2.36 Chronic hepatitis. Irregular surface, inho-
mogeneous parenchyma, irregular corkscrewlike
hepatic vein with so-called “nibbling away." Other
criteria: increased consistency.
Fig. 2.35 Chronic autoimmune hepatitis: Irregular
surface, inhomogeneous and coarse parenchyma.
Hepatic veins already rarefied. Other criteria: in-
creased consistency, splenomegaly.
dicators of any cirrhotic transformation
(Figs. 237-239, Fig. 2.20, s 2.21, И 2.4f-h,
and в 2.7). The types of parenchymal disturb-
ance may differ: a relatively homogeneous hy-
Diffuse Changes in the Hepatic Parenchyma
0 2.7 Cirrhosis of the Liver
► Surface and Structure
a Cardiac cirrhosis with engorged
hepatic vein visible far into the periph-
ery: homogeneous dense parenchyma
with subtly irregular surface, ascites.
b In the longitudinal view at the mid-
line, typical beak-like/dolphin-nosed
appearance, large caudate lobe.
c Rigid inferior right lobe with coarsely
irregular surface, ascites.
d Inhomogeneous coarse parenchyma,
subtly irregular surface, the rarefied
hepatic veins cannot be visualized.
► Extrahepatic findings:
portal vein and gallbladder
e and f Extrahepatic findings in cir-
rhosis.
e Occlusion of the intrahepatic seg-
ment of the portal vein, with collateral
varicosity in the gallbladder fossa.
f Thickening of the gallbladder wall.
2 Liver
« Fig. 2.37 Cirrhosis of the liver. Irregular surface, as-
cites, coarse inhomogeneous parenchyma, rarefied
hepatic veins, irregular lumen, and in color flow
scanning demonstration of localized increased flow
velocity. Other criteria: increased consistency at one-
finger palpation.
* Fig. 2.38 Cirrhosis of the liver Small organ with
coarse inhomogeneous parenchyma, change in cal-
iber of the portal vessels, and rarefied hepatic veins.
perechoic texture would be more typical of
fatty cirrhosis, while a parenchymal change
characterized by large nodules would most
probably be due to chronic inflammatory dis-
ease. The vascular architecture could also pro-
vide clues about the possible etiology: rarefied
vessels are typical of inflammation, while in
toxic cirrhosis quite often the vessels still can
be imaged, and in cardiac cirrhosis the hepatic
veins will always be easy to visualize.
► Diffuse Tumor Growth
Diffuse infiltration of the liver by a tumor is an
infrequent finding; in rare cases, it may simply
lead to an increased size of the liver and to
coarse hypoechoic parenchyma (e.g., in chronic
lymphocytic leukemia), but more often it is
seen as an irregular region within the liver (e.
g., breast cancer) (Figs. 2.39-2.41) The decisive
diagnostic aspect is the presence of criteria for
malignancy (see below).
a Fig. 2.39 Differential diagnosis of irregular parenchy-
mal echotexture: in this case, hepatocellular carci-
noma (HCC) in underlying cirrhosis.
a Fig. 2.40 Differential diagnosis of irregular parenchy-
mal texture; in this case, diffuse infiltration by a car-
cinoma of the gallbladder.
a Fig. 2.41 Differential diagnosis of irregular parenchy-
mal texture; in this case, diffuse breast cancer meta-
stasis.
Localized Changes in Hepatic Parenchyma
The detection and identification of focal masses
in the liver largely depends on their size, the
difference in echogenicity and echotexture
compared to the adjacent hepatic parenchyma,
the location of the mass within the liver, and
the diligence with which the sonographer
studies the organ.
It is vital to cover all views possible (longi-
tudinal, transverse, along the costal margin,
intercostals, and those adapted to the particu-
lar findings) in order to image the liver com-
Table 2.10 Detection of intrahepatic masses-problems and possible solutions
Problem
Location
Technical
Finding
pletely. Despite all efforts, there remain some
problem areas where focal masses might be
missed owing to location, technical reasons,
or the finding itself (Table 2Л0).
Despite this caveat, ultrasonography is the
prime diagnostic modality of choice when it
comes to imaging focal masses in the liver,
particularly when one takes into account its
easy availability and only minor discomfort
for the patient.
Example
► Anterior subphrenic
► At the ligamentum teres
► Posterior in the caudate lobe
► Mass outside the focal range
► Frequency dependent resolution of the probe
► Noise
► Small mass
► Isoechoic mass
After the mass has been detected, its analy-
sis, characterization, and assessment according
to predefined criteria is of vital importance
(Fig. 2.42).
Sonographic criteria. The following criteria
are used.
► Number. The quantity is detailed as "soli-
tary”, a number (e.g., "4") or as “multiple".
It is useful to specify the estimated volume of
the mass as a percentage of the whole liver.
Solution
► Examine in inspiration/expiration
► Use sector probe
► Alter the focal range
► Use high-frequency probes
► Tissue harmonic imaging
► Use high-frequency probe
► Contrast harmonic imaging
► Location. For solitary masses or a small
number of masses, their location is specified.
The distinction is made between central
masses and those that have reached the sur-
face of the liver. If at all possible, the segment
involved is noted and whether or not the
margins of the segment are clear; at mini-
mum, it must be stated whether the mass is
in the left or right lobe.
► Distribution. Masses may be disseminated
or focal (periportal, perivenous, at the porta
hepatis, subcapsular).
► Size. In solitary masses it is quite useful to
specify the size, particularly in follow-up
studies. The size is defined by two orthogo-
nal diameters and given in centimeters or
millimeters; it is better to measure a mass
in all three planes (longitudinal, transverse,
sagittal). To compare the findings for future
reference, reproducible reference structures
should be included in the image. Multiple
masses are characterized by descriptive
terms (e.g., small nodular, large nodular).
► Shape. A mass may be round, oval, bizarre, or
maplike; only the shape of solitary masses
should be described.
► Margin. This term specifies how the mass is
delineated against the surrounding tissue; it
may be sharp, smooth, and easily detectable,
or blurred and irregular, or perhaps even
undetectable.
► Center/edge. Masses may possess a capsule,
a hypoechoic ring of parenchyma (“halo"),
and peripheral vasculature. Others present
with an anechoic, hypoechoic, or hypere-
choic center signifying central necrosis,
liquefaction, or hemorrhage.
► Interrelationship with adjacent tissue. The
surface may be respected or it may undergo
local bulging or protrusion, while other
masses may produce localized indentation
of their surface. Vessels may be indented,
compressed, or locally displaced. Masses
may grow infiltratively into vessels or infil-
trate the adjacent tissue with podlike off-
shoots.
► Changes in the surroundings. It is not al-
ways possible to differentiate between mar-
ginal changes of a mass and reaction of the
adjacent parenchyma. However, hypoechoic
coarse parenchyma (usually caused by in-
flammation/edema) or hyperechogenicity
are typical such changes.
► Echogenicity. Masses may be anechoic, hy-
poechoic, isoechoic, or hyperechoic com-
pared to the surrounding parenchyma. It
should be noted that this is no definite abso-
lute measure and does not characterize the
properties of the mass on a concrete level,
but specifies them relative to the surround-
ing tissue without taking into account that
the echogenicity of this parenchyma is by
itself not a constant but may vary substan-
tially depending on numerous factors (e.g.,
disease, nutrition, age).
► Texture. Assessment of the echotexture of a
mass is based on its size, brightness, and
echogenicity and the distribution/layout of
the individual echoes within the mass.
► Architecture. The architecture of a mass
takes into account structural changes caused
by reaction at the margins, formation of a
capsule, peduncle, etc.
► Consistency. Although often the consistency
of a mass may not be amenable to direct
examination, sometimes it can be assessed
by one-finger palpation or by observing the
resilience of the liver to vascular pulsation.
The terms used are firm, tightly elastic, and
soft/pliant.
► Tenderness. Rapid growth of a mass may be
painful. The reason may be tension in the
wall/capsule or pressure on adjacent tissue
by cysts, bleeding, or abscess.
► Vascularization. Vascularization is assessed
in the static state as well as dynamically after
a Fig. 2.42 Criterion: location of the mass/its relation to
the surface; in this case a hypoechoic metastasis with
central necrosis and breaking through the posterior
surface of the right hepatic lobe at segment V (to the
gallbladder fossa). Ancillary criterion: superficial le-
sion with the typical central depression.
administration of a contrast agent. Apart
from the quantitative aspect, the sonogra-
pher has to evaluate the blood flow qualita-
tively by looking at the flow direction, the
type of vascularization (arterial, venous,
shunting), and the timing of the circulation
in the mass compared with the surrounding
parenchyma. In the future, the interaction
between contrast agent and tissue, and also
between contrast agent and ultrasound
beam (energy), will yield further criteria for
assessing masses and parenchyma in the
liver.
► Extrahepatic factors. Pi oper assessment of a
mass has to include any changes in other
organs (primary tumor? lymphadeno-
pathy?) and clinical parameters (e.g., fever,
night sweat).
► Change in or activity of the mass. In follow-
up studies the sonographer can track any
changes taking place spontaneously, under
an antibiotic regimen, or with chemother-
apy (Figs. 2.43-2.45).
Localized Changes in Hepatic Parenchyma
a Fig. 2.43 Criterion: change/activity of a mass: in this
case, a small cell lung cancer at the time of the
original diagnosis—diffuse micronodular metastasis
of the liver with demonstration of numerous hypo-
echoic, irregularly shaped masses.
a Fig. 2.44 Criterion: change/activity of a mass; in this
case, the same small cell lung cancer after two cycles
of chemotherapy with the ACO protocol; the meta-
stases have grown in size and have a distinct halo
(zone of active tumor growth) and echogenic mate-
rial (necrosis) in the center. Note the increased echo-
genicity of the hepatic parenchyma resulting from
the toxic steatosis induced by the chemotherapy.
a Fig. 2.45 Criterion: change/activity of a mass; in this
case, the same small cell lung cancer after four cycles
of chemotherapy with the ACO protocol; there is an
inkling of diffuse infiltration although no definite focal
metastatic transformation can be seen except in a
few questionable places; complete remission clini-
cally.
Anechoic Masses
ID
2 Liver
► Diffuse Changes in the Hepatic
Parenchyma
▼ Localized Changes in Hepatic
Parenchyma
S► Anechoic Masses
► Hypoechoic Masses
Isoechoic Masses
Hyperechoic Masses
Echogenic Masses
Irregular Masses
► Differential Diagnosis of Focal
Lesions
— ► Cysts
► Polycystic Liver Disease
► Hemorrhage/Hematoma
► Bilioma
► Abscess
► Hydatid Cysts
► Osler Disease/Hepatic Peliosis
► Lipoma
► Lymphoma
► Metastasis
► Vessels/Bile Ducts
Anechoic masses in the liver are either pure
fluid-filled cavities or masses with very few
or weakly reflecting (hardly discernible) boun-
daries. The sonographer should always bear in
mind the possibility of inadequate presettings
of the equipment (insufficient gain)—one op-
tion would be comparison with the vascular
lumen.
► Cysts
Intrahepatic cystic masses (Figs. 2.46 and
2.47, 3 2.8d) may be unilocular or multiple,
may vary in size (a few millimeters to
>10 cm), and may be found anywhere in the
liver.
Unilocular cysts are round and smooth, and
the lumen is absolutely without any echoes.
Since the lumen of the cyst does not attenuate
the ultrasound beam, unilocular cysts demon-
strate posterior enhancement that is not al-
ways easy to detect in the near field, at large
depths, and in very small masses. The walls of
unilocular cysts do not exhibit any echotexture,
and they may elevate a surface or protrude
above it, but do not cross segmental bounda-
ries. They are not vascularized and the adjacent
parenchyma of the liver appears absolutely
normal. In cases of multiple true cystic masses,
the differential diagnosis of polycystic liver dis-
ease should not be overlooked.
л Fig. 2.46 Solitary cysts; here, there are two solitary
cysts in the right hepatic lobe: one reaching the sur-
face, anechoic, and with characteristic posterior en-
hancement; the other central within the parenchyma,
significantly smaller, and hard to differentiate from
the adjacent liver tissue, recognizable by its clearly
delimited posterior wall.
a Fig. 2.47 Cysts and gallbladder. Compared with the
gallbladder wall, the cystic masses in polycystic liver
disease do not display any echotexture in the wall.
► Polycystic Liver Disease
This autosomal dominant disease may be lim-
ited just to the liver but can involve the kidneys
and/or the pancreas as well. With age, the hver
is permeated by an uncountable number of
cystic masses in the liver (Figs.2.48-2.50,
в 2.8e and g). Initially, the cysts may be quite
small but vary in size later. In the end, this leads
to an enormous increase in the size of the
organ (all the way into the small pelvis). The
liver is firm, tightly elastic, and tender (capsu-
lar tension) and its surface is marred by a
myriad protruding cysts. Regular segmental
anatomy and the shape of the liver have dis-
appeared altogether. The image is dominated
by the cysts, and in the terminal stage of the
disease hardly any parenchyma can be demon-
strated. The gallbladder is differentiated (best
after a meal) from the cysts by its triple-layered
a Fig. 2.48 Polycystic liver disease. The hepatic paren-
chyma is permeated by numerous cysts; typical
“blooming" of the meager remaining parenchyma,
caused by the diminished attenuation.
a Fig. 2.49 Polycystic liver disease. The hepatic paren-
chyma is permeated by numerous very small cysts;
these are recognizable not only by the r better con
duction but also by the marked boundaries of the
cyst walls.
wall since, although the cysts are lined by a
simple columnar epithelium, they do not ex-
hibit any wall structures. Complications may
arise from hemorrhage into or infection of the
cysts; apart from the clinical sign of local ten-
derness it may alter/increase the echogenicity
of the pathological cystic contents.
► Hemorrhage/Hematoma__________
Hemorrhage or localized hematoma (Fig. 2.51,
a 2.8j-1) may be due to local trauma, e.g., nee-
dle biopsy, stab wound, or rupture of healthy
adjacent tissue, and is different from bleeding
into an existing lesion (e.g., adenoma, metasta-
sis, q.v.). Typically, a recent hematoma would be
anechoic and exhibit a smooth boundary with
the surrounding tissue; in cases of major paren-
chymal rupture, the shape could become irreg-
ular and even bizarre. Subcapsular hemorrhage
may lift the capsule off the hver like a tent. The
bleeding is characterized by a less than optimal
posterior enhancement, and frequently the ad-
jacent parenchyma displays a slight increase in
echodensity due to compression artifacts. Older
hemorrhages/hematomas lose their anecho-
genicity: the bleeding becomes organized, first
with hypoechoic and later with hyperechoic
intraluminal thrombi, which may appear in bi-
zarre lumps and strands.
* Fig. 2.50. Polycystic liver disease Finding during lap-
aroscopy
Hemorrhage/Hematoma
Hemorrhage. Bleeding in the liver may be
due to inadvertent trauma, iatrogenic injury
(needle biopsy, drainage), coagulation disor-
der, or it may complicate a preexisting mass
(e.g., adenoma). The typical finding would be
a hypoechoic to anechoic liquid mass; in rare
cases (due to compression) it is homogene-
ously hyperechoic. The mass caused by a
hemorrhage is sharply delimited and some-
times of irregular shape; the surrounding tis-
sue is compressed (increased echogenicity),
and quite often the patient is in pain (capsu-
lar tension).
Older hemorrhage. Apart from irregular
liquid regions, these demonstrate inhomo-
geneous echogenic areas corresponding to
clots, strands of fibrin, and different stages
of organization in the hemorrhage. Subcap-
sular bleeding may come from ruptured pa-
renchyma with irregular borders and end up
as perforation and massive hemorrhage into
the abdominal cavity (demonstration of free
fluid in the abdominal cavity).
Capsule injuries. In ultrasonography, inju-
ries solely to the capsule of the liver are
detected as gaps in the hepatic contour,
however, frequently this direct sign is impos-
sible to demonstrate and the sonographer
has to rely on the indirect sign of free fluid
in the abdominal cavity increasing in volume
during frequent follow-up scans.
Localized Changes in Hepatic Parenchyma
► Bilioma______________________________________________________________________________________
It is not possible to differentiate between acute
bleeding and collections of bile that may also
gather as a result of liver trauma and display
the same sonographic characteristics (Fig. 2.51,
В 2.8j).
< Fig. 2.51 Hemorrhage/hematoma/bilioma in the
right hepatic lobe after unguided needle biopsy in
chronic CMV hepatitis.
► Abscess_____________________________________________________________________________________
An abscess may present as anechoic mass with
distinct posterior enhancement (Fig. 2.52,
E 2.8g and i).
* Fig. 2.52 Abscess. Not quite anechoic, slight poste-
rior enhancement; the adjacent parenchyma ap-
pears coarse and hypoechoic.
2.8 Cysts
► Primary cystsfpolycystic
syndrome
2 Liver
a Typical unilocular cyst with anechoic
lumen, smooth margin without any
structures: so-called posterior en-
hancement.
b Tiny unilocular cyst anteriorly in
segment III of the left hepatic lobe;
owing to its small size, definite assess-
ment as cyst is not possible.
c Unilocular cysts may occur in multi-
ples, or clusters, or are disseminated.
d Septated unilocular cyst in the left
hepatic lobe.
e and f Polycystic liver disease.
e Easy to diagnose owing to the num-
ber of cysts and the disturbed architec-
ture of the organ.
f Polycystic liver disease with medium-
sized cysts.
► Secondary Cysts
g-k Differential diagnosis of cystic
mass.
g Small abscess in left hepatic lobe;
hypoechoic reaction of the adjacent
parenchyma.
h Septated cyst, posterior cyst not
quite anechoic—complication?
i Amebic liver abscess confirmed by
fine-needle aspiration; note the unusual
posterior enhancement.
j Accumulation of fluid along the in-
trahepatic canal of the fresh knife
wound (history): Hemorrhage? Bilioma?
Involvement of the gallbladder wall
к Bleeding after unguided needle bi-
opsy: hyperechogenicity of the adjacent
parenchyma as a result of compression.
/ Differential diagnosis of hypoechoic
mass. Large subcapsular hematoma/
hemorrhage in HELPP syndrome with
the capsule "sort of torn off" the pa-
renchyma.
В 2.8 Cysts
► Hydatid disease
m-q Hydatid cyst.
m Cystic Echinococcosis Type I WHO
p Cystic Echinococcosis Type IV WHO
о Cystic Echinococcosis Type III WHO
n Heavily encapsulated polycystic le-
sion with numerous septa and minor
calcification, type IIB according to
Koischwitz.
q Cystic Echinococcosis Type V WHO
Localized Changes in Hepatic Parenchyma
► Osler disease; peliosis
г Resection specimen of the two hy-
datid cysts.
s Peliosis hepatis. The features resem-
ble a cystic liver (left), but the hepatic
structure is irregular with patchy low
echogenicity and multiple anechoic
cystic masses up to 10 mm in size (ar-
rows). Magnified view shows a rela-
tionship of the cysts to portal vessels.
VCI - inferior vena cava.
► Hydatid Cysts________________________________
Hydatid cysts are parasitic cysts of Echinococ-
cus granulosus and may be present in the liver
as solitary or multiple cysts. Their typical ap-
pearance is that of cyst-within-cyst or as a
conglomerate of cysts (Fig. 2.53, E 2.8m-r).
The lumen of the hydatid cyst is anechoic,
and a layered cyst wall, akin to a capsule, is a
typical finding. Demonstration of marginal
daughter cysts (cyst-within-cyst) and calcifica-
tion in the wall is pathognomonic for hydatid
disease. Because of the wall thickness, poste-
rior enhancement is less marked or may even
be absent, and calcifications result in posterior
shadowing. The morphological classification of
hydatid disease is summarized in Table 2.11.
a Fig. 2.53 a and b Hydatid cyst.
a Typical cyst-within-cyst image in Echinococcus
granulosus infection; located in segment VI of the
right hepatic lobe; vital cyst, Koischwitz type HA.
Note the normal gallbladder.
a b Disintegrated cyst in q after two courses of alben-
dazole.
Table 2.11 Morphological WHO classifica-
tion of cystic echinococcosis (CE)1,2
Type Characteristics
о
00
2 Liver
СЕ 1 unilocular anechoic
CE 2 multivesicular, multiseptated
CE 3 floating laminated membrane
daughter cysts, hyperechoic
mass
CE 4 heterogeneous, degenerative
content, hyper-/hypoechoic,
or mixed structure
CE 5 arch-shaped image, cone-
shaped shadow, calcified
Echinococcus Infection
This tapeworm infection may be due to Echi-
nococcus granulosus resulting in cystic echi-
nococcosis (Echinococcus Granulosus, para-
sitic in canines), also known as unilocular
hydatid disease, or alveolar Echinoccocosis
(Echinococcus multilocularis) (parasitic in
foxes and small rodents) terminating in al-
veolar hydatid disease.
Ultrasonography of cystic echinococcosis
demonstrates the characteristics of a com-
plex cyst: thickened, sometimes layered cyst
wall, akin to a capsule, with marginal daugh-
ter cysts (cyst-within-cyst) and calcification
in the wall (pathognomonic). Because of the
wall thickness, posterior enhancement is less
pronounced or may even be absent, and in
calcification there will be posterior shadow-
ing. Old and no longer vital hydatid cysts may
present with different degrees of lumen de-
gradation, bizarre membrane formation, ir-
regular hyperechoic compaction, and also
central calcification, or they may exist just
as calcified remnants.
In multilocular hydatid disease there is dif-
fuse poorly delimited infiltration of the he-
patic parenchyma with inhomogeneous
coarse texture, whose more advanced stages
involve the vessels and bile ducts, may dem-
onstrate calcification, and can spread from
the liver to destroy the diaphragm, lungs,
hepatic portal, retroperitoneum. duodenum,
and pancreas.
► Osler Disease/Hepatic Peliosis
Osler disease is also associated with the pres-
ence of arteriovenous malformations in the
liver, which yield a corresponding Doppler sig-
nal. This finding is absent in peliosis, which is
characterized by blood-filled lacunae separate
from the portal circulation (e 2.8).
► Lipoma
Smooth margins and anechogenicity are not
characteristic of lipomas, and posterior en-
hancement is not very marked. Most lipomas
are found around the ligamentum teres.
► Lymphoma
Sometimes hepatic involvement in systemic
lymphatic malignancy may result in anechoic
masses in the liver. The intrahepatic masses
accompanying lymphomas are frequently mul-
tiple, vary in size, and tend to be of irregular
rather than round or oval shape (Fig. 2.54). One
typical feature is the simultaneous presence of
the various stages of lymphatic infiltration:
apart from solitary anechoic masses (no or
slight posterior enhancement), there are often
irregular areas of varying size with hypoechoic
infiltration of the parenchyma. In addition, ex-
trahepatic criteria such as splenomegaly with
infiltrative changes and lymphadenopathy may
be seen.
« Fig. 2.54 Lymphoma of the liver. Non-Hodgkin lym-
phoma with multiple hypoechoic masses and one
almost completely anechoic lesion.
Infiltrating Lymphoma
Involvement of the liver is seen in about 50%
of lymphoma cases (Hodgkin disease and
non-Hodgkin lymphoma). Particularly the
more advanced stages will demonstrate he-
patic involvement with circumscribed malig-
nant lymphadenopathy. Diffuse, miliary, or
periportal infiltration of the parenchyma is
primarily found in early stages of the disease
and usually escapes ultrasound detection. In
diffuse nonspecific parenchymal changes, the
presence of splenic pathology and lympha-
denopathy may warrant the presumed diag-
nosis of diffuse infiltrative lymphoma of the
liver. This suspicion must then be confirmed
by needle biopsy.
► Metastases_______________________________________________________________________________
Hypoechic/anechoic malignant lesions or de-
posits within the liver are highly suspicious
for a tumor with a high degree of malignancy
and a low degree of differentiation (see below)
(Fig. 2.55). Diffuse metastasis of the small nod-
ular type may present as numerous anechoic
masses that differ from polycystic liver disease
by their irregular shape and diffuse margin.
There is no posterior enhancement.
► Vessels/Bile Ducts________________________________________________________________________________________
Any differential diagnosis of anechoic masses
in the liver has to include the possibility of
vessels or bile ducts being viewed in cross-
section. In this case, the characteristic aspects
are the tubular shape of the lesion when im-
aged in the second plane, and its course, which
can be traced all the way back to the originat-
ing vessel/duct. In addition, vessels may be
identified by duplex or color-flow duplex scan-
ning. For reasons of clarity, these anechoic
“masses" are listed here.
► Bile ducts. Bile ducts appearing as anechoic
masses in the liver have to be pathologically
* Fig. 2.55 In some cases the metastases of neuroen-
docrine tumors may present as almost anechoic le-
sions.
enlarged/engorged (e.g., Caroli disease).
These cases are characterized by their peri-
portal location and identification of the so-
called hepatic triad, i.e., delineation of a
branch of each of the proper hepatic artery
and the portal vein as well as the enlarged
bile duct.
► Portal vein branches. Being part of the hep-
atic triad, the branches of the portal vein
course through the periportal area as well.
Venectasia, varicosities, and collaterals in
case of portal hypertension will all be im-
oo
aged as enlarged segments of the intrahe-
patic tree of the portal venous system.
► Hepatic vein branches. They are easily iden-
tified by their typical course terminating at
their stellate junction with the vena cava.
The sonographer should keep in mind the
possible venectasia and anomalies of the
Budd-Chiari syndrome.
► Hepatic artery aneurysms, shunts, and vas-
cular malformation. These may be identi-
fied by color-flow duplex scanning.
Localized Changes in Hepatic Parenchyma
Hypoechoic Masses
► Diffuse Changes in the Hepatic
Parenchyma
▼ Localized Changes in Hepatic
Parenchyma
Anechoic Masses__________
Д* Hypoechoic Masses
Д» Isoechoic Masses
» ► Hyperechoic Masses
► Echogenic Masses________
_> Irregular Masses
► Differential Diagnosis of Focal
Lesions
— ► Metastasis
► Lymphoma
► Abscess
► Hematoma
► Complicated Cyst
► Adenoma
► Focal Nodular Hyperplasia (FNH)
► Hepatocellular Carcinoma (HCC)
► Lipoma
► Atypical Hemangioma
► Focal Fatty Change
► Bile Ducts/Vessels
The typical lesions of liver pathology within the
hepatic parenchyma are hypoechoic masses.
However, the operator should always be aware
of possible “technical glitches" (e.g., improper
presettings with the gain too high), when noise
will turn anechoic masses into echogenic le-
sions and thus result in misinterpretation.
► Metastasis___________________________________________________________________________________
Numerous tumors will deposit hypoechoic
metastatic masses in the liver (Figs. 2.56-
2.58), These lesions may differ in size and dis-
tribution, but in most cases they are small and
tend to have an irregular/diffuse margin.
Although one cannot, in principle, deduce the
type of tumor from the sonographic image
alone, these hypoechoic metastatic deposits
are quite frequent in undeveloped, undifferen-
tiated, and actively growing malignancies. The
finding of hypoechoic metastasis is rather com-
mon (but not pathognomonic) in breast cancer,
in small cell lung cancer, and in endocrine tu-
mors. Numerous tumors exhibit this hypoecho-
genicity when initially invading the liver with
these small focal metastases. The growing size
of the lesion will lead to complications of tu-
mor growth, such as central necrosis, hema-
toma, etc., and eventually the original hypo-
echoic appearance will be found only along
the active outer rim (so-called "halo sign”).
Thus, in cases of rapid tumor growth quite
often one will discover small hypoechoic
masses next to large lesions with a halo.
Hepatic Metastases
Primary tumors. The incidence of hepatic
metastasis of nonhepatic primaries is about
50 times higher than that of primary cancer
of the liver; and in autopsies of patients who
have succumbed to nonhepatic malignancies,
these metastases are found in 36-40% of
cases. The most common primaries are can-
cer of the lung, colon, stomach, breast, and
pancreas as well as renal cell carcinoma, ma-
lignant melanoma, and neuroendocrine tu-
mors of the gastrointestinal tract.
Metastatic spread. The tumors metastasize
primarily via the venous system, most often
taking the portal route with periportal depos-
its, and far less frequently via the arterial tree;
spread via the lymphatics tends to be the
exception. Decreased portal blood flow and
the decrease in the number of lectin recep-
tors, which are needed if the tumor cells are
to bind to the hepatocytes, are common find-
ings in chronic liver disease and have helped
to explain, especially in cirrhosis of the liver,
why metastases of nonhepatic primaries are a
rather infrequent finding. Therefore, any
mass detected in a cirrhotic liver has to raise
a very high level of suspicion of hepatocellular
carcinoma (HCC) or granulomatous regener-
ation.
Echogenicity. The echogenicity of hepatic
metastases does not depend very much on
the type of primary malignancy but rather on
their activity and rate of growth: rapidly
growing tumors and the metabolically active
rims (halo) of metastases tend to present as
hypoechoic images, while slowly growing tu-
mors are inclined toward hyperechogenicity.
While small hepatic lesions tend to be hypo-
echoic as well, their growth is accompanied
by the sequelae of complications such as cen-
tral necrosis, hematoma, liquefaction, calcifi-
cation, etc.
Vascularization. In primary and secondary
tumors of the liver, 90-95% of the blood
supply arises from the hepatic artery. In
color-flow Doppler scanning, metastases
tend to be hypovascular (except for the neu-
roendocrine tumors), while contrast-en-
hanced imaging depicts a bizarre/chaotic ir-
regular vascular bed. Although it is not pos-
sible yet to identify hepatic metastases on the
basis of their vascular bed, this technique has
improved the differentiation of benign lesions
and malignant metastases of the liver. But
contrast-enhanced imaging studies and spe-
cial ultrasound techniques4,5 have resulted in
dramatically improved detection rates for
solid focal liver lesions with an overall diag-
nostic accuracy from 49% to 88% and with a
sensitivity for metastases from 60% to 88%.
Further diagnostic modalities. Suspicious
lesions in the liver may be subjected to fur-
ther diagnosis by specific indirect modalities
such as CT. MRI, PET, scintigraphy, or angiog-
raphy, while in the end metastases have to
undergo aspiration cytology—but only if it
results in clinical/therapeutic consequences.
a Fig. 2.56 Multiple hypoechoic metastases of small
cell carcinoma of the lung.
a Fig. 2.57 Diffuse and fine nodular hypoechoic meta-
stases of breast cancer in the liver.
a Fig. 2.58 Large solitary metastasis of squamous cell
carcinoma of the esophagus.
► Lymphoma
Hepatic spread of a systemic lymphatic malig-
nancy typically presents as hypoechoic lesions
(Fig. 2.59). Quite often these are numerous,
vary in size, and are neither spherical nor ovoid
in shape but exhibit irregular margins. The dif-
ference in the degree of lymphatic infiltration
is rather characteristic: apart from solitary,
seemingly anechoic lesions (little or no poste-
rior enhancement), there are often irregularly
shaped areas, differing in size, of hypoechoic
parenchymal infiltration. It is common in these
cases to encounter extrahepatic involvement
as well, such as splenomegaly with infiltrative
changes and lymphadenopathy.
« Fig. 2.59 Hypoechoic infiltration of a non-Hodgkin
lymphoma.
► Abscess
Abscess-forming lesions (И 2.8g) start as hy-
poechoic masses, usually with an ill-defined
margin. They are located either within the pa-
renchyma or in close proximity to bile ducts.
The liver tissue surrounding an abscess is char-
acterized by distinct hypervascularization. As
the abscess increases in size this may produce a
more hypoechoic, and even anechoic, liquid
center, or there may be hyperechoic changes
in the center because of necrosis and the for-
mation of gas. Such an abscess will present
with a wide, ill-defined hypoechoic halo.
Liver Abscess
Location. Usually, a liver abscess has a diffuse
margin and is secondary to bacterial or para-
sitic infection, which may be unifocal or multi-
focal. If blood-borne, these abscesses may be
found anywhere within the parenchyma; if
arising from the biliary tree, they will form
close to the bile ducts. If they are the sequelae
of interventional procedures, they appear
along the drainage or biopsy canal.
Appearance. An acute inflammation may
appear as hypoechoic edema surrounding
the intraparenchymal abscess, accompanied So
by inflammatory hypervascularization, while
the abscess itself will present as a completely
avascular lesion. No matter what the clinical
symptoms (fever, septicemia, disseminated
intravascular coagulation [DIC], etc.), acute
pyogenic abscesses under close follow-up
demonstrate a change in shape and increase
in size and possibly number, and exhibit de-
finite coarse intrinsic echoes. Gas formation
may herald complications.
► Hematoma-------------------------------------------------------------------------------------------
Hemorrhage/hematoma is usually character-
ized by anechogenicity, but as time goes by
and the blood coagulates/becomes organized
the image becomes less and less anechoic;
quite often compression will produce a hyper-
echoic halo.
Localized Changes in Hepatic Parenchyma
► Complicated Cyst________________________________________________________________________
Cysts may be complicated by hemorrhage or
infection, or they may be scanned in an oblique
plane resulting in a hypoechoic rather than
anechoic image; in these cases ultrasound mor-
phology would suggest hemorrhage/hema-
toma or an abscess, and not a cyst (Fig. 2.60).
Fig. 2.60 Cyst. Obliquely imaged and complicated
cysts may yield the image of a hypoechoic rather
than an anechoic cyst.
► Adenoma__________________________________________________________________
Adenomas of the liver are uncommon lesions
and they usually exhibit the same texture as
the regular parenchyma, but slightly less echo-
genicity (Fig. 2.61).
л Fig. 2.61 Liver adenoma. a b Power Doppler: distinctive vascularization with ar-
a Isoechoic tumor with focal anechoic necrosis/hem- terial supply. Histology: hepatocellular adenoma,
orrhage.
Liver Adenoma
Pathophysiology. Adenomas of the liver are
uncommon tumors; since they may be hor-
3 mone induced, young women are most at
risk. In most instances the lesions will be soli-
tary, with a diameter between 2 and 30 cm or
more. Histologically, these are hepatocytes
arranged in orderly fashion but lacking any
sign of portal areas. The typical complications
arising from these adenomas stem from the
2 Liver
increased internal pressure, which eventually
will lead to pain, central necrosis/hemorrhage
(peliosis hepatis), and rupture. Apart from
these common complications, there is firm
evidence of the adenoma —* malignancy se-
quence.
Ultrasound. Liver adenomas do not exhibit a
specific sonographic appearance. Smaller le-
sions tend to have a somewhat hypoechoic
texture, while larger tumors display a coarser
echotexture, probably due to the degenera-
tive changes in the tissue, and possibly a hy-
poechoic rim (target lesion). Complications
(central liquefaction/calcification) may also
be present. Color-flow Doppler imaging dem-
onstrates the distinct venous vascularization
at the margin.
► Focal Nodular Hyperplasia (FNH)
Focal nodular hyperplasia may exhibit all the
characteristics of a hypoechoic mass, especially
in a hyperechoic fatty liver. However, hypoe-
chogenicity of the lesion is not the most im-
portant criterion but lather the textural char-
acteristics of the parenchyma (inhomogene-
ous, coarse), the architecture of the mass (cen-
tral stellate scar radiating fibrous septa,
characteristic vascular tree), and the blood sup-
ply (hypervascularization) (a 2.9).
FNH Cross Anatomy and Microanatomy
Focal nodular hyperplasia is the second most
common benign tumor of the liver, with a
diameter mainly about 5 cm (1-15 cm). The
lesion is characterized by a distinct vascular
pedicle and hypervascularization. Histologi-
cally, it resembles liver parenchyma with cir-
cumscribed cirrhotic transformation. The ar-
chitecture demonstrates the typical stellate
scar tissue with a vessel at its center radiating
arteries in the fibrous septa that course to-
ward the periphery of the lesion, while being
accompanied by lymphocytic infiltration and
proliferating bile ducts. The hepatocytes be-
tween the fibrous septa form sinusoids with
Kupffer cells and make up the bulk of the
lesion. The mass is not encapsulated but is
delineated by compressed hepatic paren-
chyma, where distinct hypervascularization
may be found. Significant growth under es-
trogen replacement therapy has been re-
ported in the literature; malignant transfor-
mation remains a controversial issue but this
risk appears to be negligible.
Detection of FNH by the various imaging
modalities rests on its structural character-
istics (vascular pedicle, stellate scar tissue),
its typical mulberry-like hypervascularization
with a pedicle, central artery radiating cen-
trifugal blood flow, as well as the cellular
differentiation of the tumor with the pres-
ence of Kupffer cells and proliferating bile
ducts.
► Hepatocellular Carcinoma (HCC)
One third of all hepatocellular carcinomas will
exhibit hypoechogenicity. They have ill-de-
fined margins and typically are found in a cir-
rhotic liver (Fig. 2.62, E 2.10). On color-fiow
duplex imaging they demonstrate a distinctly
hypervascularized blood supply of bizarre ir-
regular outline.
a Fig.2.62 HCC growing diffusely. The ill-defined infil-
tration raises the suspicion of HCC and would call for
ultrasound-guided biopsy
Hepatic Carcinomas
Cause. HCC is the most common hepatic
malignancy. Although HCC may be found in
healthy livers as well, the most prevalent risk
for the development of HCC is cirrhosis of the
liver due to chronic alcoholism, viral infection
(hepatitis В and C), storage diseases such
as hemochromatosis or arantitrypsin defi-
ciency, and exposure to aflatoxins.
Histology. The tumor may grow as solitary
focal mass, but in 18-38% of cases it will
appear as a multifocal malignancy. The grad-
ing includes highly differentiated (fibrola-
mellar), moderately differentiated, and ana-
plastic HCC. The differential diagnosis must
include cholangiocellular carcinoma as well.
Sonographic image. The differences in the
histological findings also help to explain the
varied sonographic appearance, with hyper-
echoic. hypoechoic. and isoechoic (com-
pared with the surrounding hepatic paren-
chyma) masses. In an otherwise healthy liver
it is impossible to differentiate between soli-
tary HCC and other tumors; however, one
characteristic of HCC is its tendency to in-
vade the vascular system, which may be
demonstrated quite well by ultrasound
imaging. The observation that malignant
metastases are infrequent findings in a cir-
rhotic or diseased liver also serves to reaffirm
the suspicion that any mass detected in a
cirrhotic liver has to be regarded as HCC.
unless proven otherwise. In color-flow Dop-
pler scans, HCC quite often exhibits irregular
hypervascularization.
В 2.9 Focal Nodular Hyperplasia (FNH)
► FNH is a benign hepatic lesion,
its histology corresponding to
circumscribed cirrhotic trans-
formation: there is a central
vessel where the radial strands
of scar tissue terminate; at the
rim, increased circular vascu-
larization can be demon-
strated.
UH
00
a FNH (RF) in segment IV of the left
hepatic lobe. BD - abdominal wall; LTH
= round ligament of liver; CB » gall-
bladder; L.C. caudate lobe.
b Spokelike appearance of a hydatid
cyst.
c Isoechoic mass in a fatty liver. Even
color-flow Doppler imaging was unable
to ascertain its character.
► В-mode: stellate scar
► Color duplex: peripheral
vascularity, central vessel,
spoked-wheel pattern
d Isoechoic mass in segment IV a (cur-
e The same mass as in d. demonstrat-
Localized Changes in Hepatic Parenchyma
f Additional presence of a typical cir-
g Distinctive afferent vascular pedicle
and circular vascularization at the nm.
► Differential diagnosis:
metastasis, hydatid disease
h Increased vascularization at the mar-
gin and barely visible vascular star ra-
diating vessels; as a snapshot for docu-
mentation purposes it is possible proof,
but during real-time imaging this type
of vascularization is definite proof.
i With this В-mode image alone differ-
ential diagnosis is difficult Spokelike
metastasis of cancer of the colon.
/ Spokelike representation of a hydatid
cyst.
► Lipoma____________________________________________________________________________
Lipomas are rare. They are encapsulated,
smooth, almost anechoic masses with only
faint posterior enhancement and are fre-
quently found close to the ligamentum teres.
В 2Л0 Hepatocellular Carcinoma (HCC)
00
2 Liver
► a-c Hypoechoic HCC. One-
third of all HCC present as hy-
poechoic lesions, and they may
infiltrate the parenchyma dif-
fusely (quite often in previously
existing cirrhosis) or appear as
circumscribed masses.
a III-defined infiltration.
b Ill-defined infiltration.
c Circumscribed mass.
► d-f Isoechoic HCC. About one-
third of all HCC are isoechoic to
the surrounding liver tissue
and may only be detected by
their complications or circum-
scribed irregularities in the
texture
d III-defined invasion of a hepatic vein
by HCC.
e 111-defined invasion of a portal vein by
HCC.
f Isoechoic HCC with halo sign and bi-
zarre irregular hypervascularization.
► g-i Hyperechoic HCC. About
one-third of all HCC are hyper-
echoic to the surrounding liver
tissue and may easily be mis-
taken for hemangiomas, al-
though HCC is characterized by
a more pronounced attenua-
tion of the signal.
g Hyperechoic HCC.
h HCC invading a vessel.
i Hyperechoic HCC with signal attenu-
ation.
► Vascular complications in HCC
j HCC invading a hepatic vein.
к HCC invading a portal vein
I HCC invading a hepatic vein and the
vena cava.
► Atypical Hemangioma_______________________________________________________
Approximately 5% of all hemangiomas do not
exhibit the characteristic hyperechoic paren-
chyma but are less echogenic than the adjacent
hepatic tissue (Fig. 2.63). This may be due to
increased echogenicity of the parenchyma in
the vicinity of the mass, e.g., as part of fatty
changes; in rare cases, one is dealing with
rather hypoechoic hemangiomas of slightly in-
homogeneous texture and frequently ill-de-
fined margins.
< Fig. 2.63 Atypical hemangioma in the right hepatic
lobe.
► Focal Fatty Change___________________
If a hypoechoic lesion is due to focal fatty
change, it will typically be found at certain
locations: at the inferior aspect of segment IV,
near the bifurcation of the portal vein; in the
fossa of the gallbladder; and around the hep-
atic veins (Figs. 2.64 and 2.65). Characteristic
features are the frequently maplike appearance
of the mass, the fact that it respects segmental
interfaces and surfaces, the lack of tissue reac-
tion at the margin, and the undisturbed course
of the blood vessels.
a Fig. 2.64 Focal fatty change.
a Fig. 2.65 Differential diagnosis in focal fatty change:
metastasis, in this case cancer of the colon.
► Bile Ducts/Vessels_______________________________________________________________________________
Bile ducts may be dilated and contain hypoe-
choic sediment or tumor tissue. The portal and
hepatic veins may also be clogged by this hy-
poechoic thrombotic material (Fig. 2.66). Imag-
ing in the orthogonal plane will confirm the
lesion to be a pathological vessel.
Fig.2.66 Portal vein thrombosis in HCC. VP = portal
vein; LE = liver.
Localized Changes in Hepatic Parenchyma
Isoechoic Masses_______________________________________________________________
► Diffuse Changes In the Hepatic
Parenchyma
▼ Localized Changes in Hepatic
Parenchyma
► Anechoic Masses
► Hypoechoic Masses
► Isoechoic Masses
► Hyperechoic Masses
► Echogenic Masses
► Irregular Masses
► Differential Diagnosis of Focal
Lesions
Detection of isoechoic masses in the liver is
rather difficult and hinges on the slight differ-
ences in texture. The most important diagnos-
tic signs are surface and contour changes at the
segmental and vascular interfaces.
— ► Focal Nodular Hyperplasia (FNH)
► Adenoma
► Hepatocellular Carcinoma (HCC)
► Metastasis
► Atypical Hemangioma
► Hematoma
► “Hepatized” Gallbladder
► Bile Ducts/Vessels
► Focal Nodular Hyperplasia (FNH)______________________________________________________________
In terms of histopathology, FNH is defined as
circumscribed cirrhosis of the liver. Thus, there
are FNH variants that hardly differ from the
surrounding hepatic parenchyma and may
only be detected because of the circumscribed
inhomogeneity of their texture (ra 2.9a) and
their vascular characteristics (if visible at all):
in the latter cases, color-flow Doppler scanning
will unmask these lesions.
► Adenoma
Sometimes it is almost impossible to distin-
guish between normal parenchyma and ad-
52 enoma of the liver.
oo
2 Liver
► Hepatocellular Carcinoma (HCC)_________________________________________________________________
One-third of all HCC are isoechoic and may be
difficult to detect, particularly when superim-
posed upon underlying cirrhotic liver disease;
this corresponds to the diffuse infiltrative type
of hepatocellular carcinoma. In these cases, ex-
tra care should be given to the typical changes
induced by the tumor invading vessels. In iso-
echoic HCC, color-flow Doppler scanning will
yield bizarre irregular hypervascularization
(Figs. 2.67, 2.62, a 2.10d-f and 2.10j-l).
* Fig. 2.67 HCC invading a portal vein in cirrhosis of
the liver.
► Metastasis___________________________________________________________________________________
Small hepatic metastases in particulai may es-
cape detection because of their possible Isoe-
chogenicity. However, when scrutinized more
closely their parenchymal texture is somewhat
coarser and more echogenic. It is vital to check
for any changes in contour at the surfaces and
vascular interfaces. Isoechoic metastases are
quite typical in diffuse metastasis of gastric
and pancreatic cancer (Fig. 2.68), and after suc-
cessful chemotherapy as remnants of previ-
ously confirmed metastases (Fig. 2.45).
Fig. 2.68 a Isoechoic metastasis of pancreatic cancer;
the lesion is identified by its vascular invasion, halo
sign, and the central necrosis.
a b Large isoechoic metastasis of cancer of the colon
note the central liquefaction and the delicate hypo-
echoic halo with its irregular margin.
► Atypical Hemangioma______________________________________________________
Detection and differentiation of hemangiomas
depends not only on the texture and echoge-
nicity of the surrounding parenchyma but also
on the direction and angle of insonation. This
explains why hemangiomas can be detected
quite easily at one time but may remain unde-
tected during follow-up studies, and in the
more echogenic fatty liver hemangiomas may
be masked altogether (Figs. 2.69 and 2.70).
a Fig. 2.69 Atypical hemangioma. Isoechoic mass in
the right hepatic lobe, subphrenic segment, with
marginal echo enhancement.
a Fig. 2.70 Ciant hemangiomas. They can be demon-
strated in all of segments IV and I as isoechoic masses
► Hematoma____________________________________________________________________________________
Organized hemorrhage and hematoma may
appear as isoechoic lesions.
► “Hepatized” Callbladder_____________________________________________________________________
Viscous bile, rich in cholesterol, within the lu-
men of the gallbladder may mimic the texture
of parenchymal tissue. The typical location and
► Bile Ducts/Vessels_________________
Sediments within dilated bile ducts, thrombo-
sis of branches or the trunk of the portal vein,
as well as branches of the portal vein invaded
by tumor may appear isoechoic to the sur-
rounding parenchyma of the liver.
recognition of the gallbladder wall as a contin-
uous margin will prevent the sonographer
from misinterpreting this mass as an accessory
lobe; this presumed hepatic parenchyma also
lacks any kind of vascularization (see Fig.
3.36 b, p.122).
on
oo
Hyperechoic Masses
► Diffuse Changes In the Hepatic
Parenchyma
▼ Localized Changes in Hepatic
Parenchyma
► Anechoic Masses
Д* Hypoechoic Masses
► Isoechoic Masses
Hyperechoic Masses
► Echogenic Masses
Irregular Masses
► Differential Diagnosis of Focal
Lesions
► Hemangioma
► Bile Duct Hamartoma
► Regenerative Nodules
► Porphyria
► Hepatocellular Carcinoma (HCC)
► Focal Nodular Hyperplasia (FNH)
► Metastasis
► Abscess
► Necrosis
► Diaphragmatic Slips
► Ligamentum teres Hepatis
► Focal Fatty Change
► Bile Ducts/Vessels
Localized Changes in Hepatic Parenchyma
Hyperechoic liver masses are the typical target
structures when diagnosing parenchymal liver
pathology. Differential diagnosis is based on
essential criteria such as echotexture, delinea-
tion, the always present through-transmission
of a hyperechoic mass, the interaction of the
lesion with vessels and the surface, and the
reaction of the surrounding parenchyma.
► Hemangioma________________________________________________________________
The typical hemangioma is a hyperechoic mass
with a diameter of 10-30 mm, a smooth
clearly-defined margin, and good transmis-
sion; it appears as a solitaiy lesion or comes
in multiples, and will always be found next to a
vessel. Although the round margin may dis-
place vessels, and give the surface a nodular
appearance, hemangiomas respect adjacent
structures. An afferent vessel can often be iden-
tified. Large hemangiomas display an increas-
ingly inhomogeneous echotexture with a nod-
ular hypoechoic center. Palpation with the bare
fingertips and the effects of transmitted pulsa-
tion will evidence their soft nature. In CT imag-
ing the slow blood flow in hemangioma results
in the so-called filling-in phenomenon, and
this helps to explain why most of these hyper-
vascular tumors cannot be detected by color-
flow Doppler imaging (И 2.11 and 2.12).
Liver Hemangioma
Pathology and histology. Hemangioma is
the most frequently encountered benign liver
tumor, occurring in 0.4-7.3% of autopsies.
Most often they are solitary (90%), are be-
tween 1 and 3 cm in diameter, while 7% are
classified as giant hemangioma (> 4-5 cm).
They consist of interconnected cavernous
vascular spaces, whose walls are lined with
a fibrous matrix and delicate epithelium, the
spaces being filled with blood and clots. He-
mangiomas are soft, compressible tumors
that may grow in size by enlargement of their
spaces. Such enlargement has been reported
for estrogen replacement therapy and preg-
nancy. Degenerative changes will result in
fibrosis of the connective-tissue septa and
calcification.
Ultrasound. The typical (95%) sonographic
image of a hemangioma is a hyperechoic
mass measuring 10-30 mm in diameter,
with a smooth, clearly-defined margin and
good through-transmission. The fact that
the echogenicity may vary, depending on
the plane of scanning, is another typical
characteristic. Hemangiomas always arise in
the vicinity of a vessel, which their bulge may
displace. In many cases an afferent vessel can
be demonstrated. In CT imaging the slow
blood flow in the hemangioma results in
the so-called filling-in phenomenon, and
this helps to explain the paradox that usually
color-flow Doppler scanning will not detect
these hypervascular tumors. Contrast en-
hanced sonographic studies are required to
demonstrate the filling-in effect and to bet-
ter characterize the lesion by taking advant-
age of stimulated acoustic emission (SAE).
Atypical variants. Atypical hemangiomas
(about 5%) exhibit an inhomogeneous echo-
texture in many cases, while others demon-
strate hyperechoic textural changes and ul-
trasound signal attenuation due to increased
fibrosis and calcification.
И 2.7 7 Hemangiomas
► Sharply circumscribed hyper-
echoic mass
2 Liver
а-d Typical hemangiomas: hyperechoic, smooth contour and clearly-defined, good
through transmission, frequently in contact with vessels.
► Color duplex findings
e-g Demonstration of the vascular
pedicle; curved displacement but no
further interference with the other
vessels.
f Color-flow Doppler scanning cannot
identify the blood-filled cisterns be-
cause the flow is too slow.
g Intratumoral vessel (V. arrow) HAE e
hemangioma
► Atypical hemangiomas
h and i The same hemangiomas displaying varying degrees of echogenicity de-
pending on the time as well as plane of scanning.
J-l Giant hemangiomas. Their characteristics resemble those of the smaller variant: hyperechoic. smooth contour and clearly-
defined. good through transmission; the small hypoechoic centers and nodules within are quite typical. Frequently, these
hemangiomas will break the surface of the liver, and their soft texture can be demonstrated on palpation or compression.
Н 2.72 Atypical hemangiomas and differential diagnosis
* Atypical hemangiomas
a and b Atypical isoechoic hemangioma in segment V of the right hepatic lobe in
the gallbladder fossa. In b there is another small hemangioma.
c-e Atypical hypoechoic hemangio-
mas. In c note the unusual buckling of
the liver surface.
Localized Changes in Hepatic Parenchyma
► Differential diagnosis:
angiosarcoma, cholangiofi-
broma, porphyria, gastroin-
testinal metastases
f-i Differential diagnosis of heman-
giomas.
f Metastasis of myosarcoma.
g Hemangioma adjacent to multiple
small cholangiofibromas.
h HCC; note the distinctive signal at-
tenuation of the lesion.
i Metastasis of esophageal cancer.
► Bile Duct Hamartomas_______________________________________________________
2 Liver
Bile duct hamartomas (so-called Meyenburg
complexes) appear as very small hyperechoic
nodules, diffusely and unevenly distributed in
the parenchyma, usually <5 mm in diameter
(Fig. 2.71). (The echogenic masses in porphyria
are similar; see below.)
a Fig. 2.71 a Bile duct hamartomatosis.
a b Differential diagnosis of hepatic hemangioma
Multiple round “masses" with hypoechoic centers,
initially misinterpreted as multiple hemangiomas:
chronic hepatic porphyria. Color duplex image shows
vessels passing freely through the lesions (which re-
solved completely in six years!).
► Porphyria
In hepatic porphyria, hyperechoic lesions may
be seen in an otherwise normal parenchyma.
These pseudo tumors are characterized by the
fact that they do not induce changes in the
texture of the tissue or the course of vessels,
contours, segmental interfaces, and surfaces
(Fig. 2.71b).
► Regenerative Nodules________________________________________________________________________
In cirrhotic or inflammatory parenchyma, there
may be nodular zones that could be either
slightly hyperechoic. isoechoic, or even hypo-
echoic to the surrounding tissue. They should
be kept in mind as a rare, but significant, differ-
ential diagnosis when considering hyperechoic
masses (Fig. 2.72).
« Fig. 2.72 Regenerative nodule.
► Hepatocellular Carcinoma (HCC)----------------------------------------------------------------
Any hyperechoic mass in a cirrhotic liver must
be suspected of HCC, since about 1 /3 of all HCC
will present as such a hyperechoic lesion
(B 2.10g). Frequently these lesions attenuate
the through-transmission and exhibit posterior
shadowing. Color-flow Doppler imaging shows
these masses to have a significant hypervascu-
lanzation. Contrast-enhanced imaging results
in an improved detection of HCC from 52 to 67%.
► Focal Nodular Hyperplasia (FNH)_____________________________________________________________
Although focal nodular hyperplasia may be
more echogenic than the surrounding paren-
chyma, the most important criteria are struc-
tural changes, such as the spokelike architec-
ture with its central vessel, and its vasculariza-
tion (enhanced marginal vascularization, radial
centrifugal flow, central vessel, vascular pedicle
of the mass).
► Metastasis
Hyperechoic metastatic masses in the liver vary
in size and may occur in any segment; they are
characterized by the changes in texture and
contour of the normal parenchyma. If the
metastatic mass presents as a hyperechoic le-
sion, the tumor activity in the lesion may be
regarded as low (Fig. 2.73); only a hypoechoic
rim indicates the zone of active growth.
* Fig.2.73 Colon cancer metastases, note the “moth-
eaten" appearance.
► Abscess_____________________________________________________________________________________
The hyperechoic image of an abscess is due to
the textural transformation and organization.
Usually, this type of abscess is found as a soli-
tary mass and lacks the typical concomitant
clinical symptoms (Fig. 2.74).
* Fig. 2.74 Abscess.
► Necrosis____________________________
Tumor- or inflammation-induced necrosis may
yield a coarsely inhomogeneous and hypere-
choic mass. The increased echogenicity may
also be due to local compression. Apart from
this hyperechoic necrosis, additional complica-
tions can induce liquid areas that in turn may
be due to sequestered bile, hemorrhage, or
liquefaction of necrotic material.
Localized Changes in Hepatic Parenchyma
► Diaphragmatic Slips______________________________________________________________________________________
Diaphragmatic incisures at the dome of the
liver may present as hyperechoic curved or
triangular lesions. They will always demon-
strate a connection with the diaphragm and
may be more or less pronounced, depending
on the respiratory motion.
► Ligamentum teres Hepatis________________________________________________________
In cross-sectional views of the upper quad-
rants, usually the teres ligament will appear
as a more or less hyperechoic lesion (a 2.12 h
and i). The decisive aspect for differentiating
this spherical hyperechoic lesion from a true
mass is scanning in the sagittal plane, and its
characteristic location between segments II
and 111 on the left and segment IV on the right.
Anatomy of the Ligamentum teres Hepatis
The ligamentum teres hepatis is a fibrous
septum separating the double segments II/
III medially on the left from the double seg-
ments IVa/IVb laterally on the right, thus
splitting the liver into the anatomical left
and right lobes. The obliterated umbilical
vein ascends in this fibrous cord from the
umbilicus to end in the left branch of the
portal vein. In portal hypertension, varicose
collaterals are opened up along the obliter-
ated umbilical vein (which may become pat-
ent again), shunting blood from the portal
venous system of the liver to the convoluted
cutaneous varicosities around the umbilicus
(caput medusae) (see also Cruveilhier-
Baumgarten syndrome, й 1.8i).
► Focal Fatty Change
oi
Increased fatty infiltration in individual seg-
ments or certain areas of the liver parenchyma
may mimic an echogenic mass. The lack of
texture-induced changes in the surface, the
preservation of segmental interfaces, and
course of vessels usually points the way toward
diagnosing this parenchymatous lesion as focal
fatty change.
2 Liver
► Bile Ducts/Vessels_______________________________________________________________________________
Dilated bile ducts may be filled with sediment,
sludge, or viscous bile (Fig. 2.75). Past throm-
bosis of the portal vein may appear as mass of
moderate echogenicity.
< Fig. 2.75 Sediments in the bile duct.
Echodense Masses_____________________________________________________
► Differential Diagnosis of Focal
Lesions
► Anechoic Masses
► Hypoechoic Masses
► Isoechoic Masses
► Hyperechoic Masses
► Echogenic Masses
► irregular Masses
► Diffuse Changes in the Hepatic
Parenchyma
▼ Localized Changes in Hepatic
— ► “Comet-Tails”
► Calcification
► Calculus
► Foreign Body
► Air
The echogenic appearance of a mass in the liver
is due to changes that result in total reflection
of the signal, complete absorption of the ultra-
sound energy, and in consequence posterior
shadowing. Since in many cases the texture of
the mass itself cannot be evaluated, any further
differentiation has to rely on the type of shad-
owing encountered.
► “Comet-Tails”__________________________________________________________________________________
Very small but powerful reflectors produce im-
pressive comet-tail-like artifacts. The most fre-
quent location of the reflectors is periportal,
but they may also be found within the paren-
chyma. By themselves, the reflectors are hard
to detect and differentiate, but their comet-
tails, which sparkle in real-time studies, make
them hard to miss (Figs. 2.76 and 2.77). These
impressive comet-tail-like artifacts are the se-
quelae of changes induced by inflammation of
the liver or bile ducts.
Fig. 2.76 So-called “comet-tails.” Coarse reflectors
within the hepatic parenchyma, characterized by
their strong intrinsic echo and the posterior reverber-
ation artifacts
a Fig. 2.77 “Comet-tails.” Coarse perivenous reflectors
note the characteristic posterior reverberation arti
facts.
► Calcification______________________________________________________________________________________________
Calcifications present as echogenic masses that,
depending on their size, will always lead to
posterior shadowing. They may be found in
the parenchyma, around the portal veins, and
even within hepatic masses. The calcifications
in hydatid cysts, hepatocellular carcinoma, and
metastases (Figs. 2.78 and 2.79) are such typi-
cal examples. Differential diagnosis of echo-
dense periportal masses has to include the
possibility of calculi in the intrahepatic bile
ducts as well as phleboliths in branches of the
portal vein.
a Fig. 2.78 Calcification in an old Echinococcus mfec- a Fig. 2.79 Small periportal calcification,
tion.
in
► Calculus__________________________________________________________________________________________
Gallstones in the intrahepatic bile ducts аге a
characteristic finding in Caroli disease
(Fig. 2.80). They may obstruct the duct com-
pletely and thus mimic an intrahepatic echo-
dense mass. Frequently, these changes are lim-
ited to individual segments of the liver, in
which case these echodense masses are
grouped like beads on a string. To confirm the
suspected diagnosis, the sonographer has to
pin-point a fluid-filled/congested bile duct.
* Fig. 2.80 Calculus within a bile duct.
Localized Changes in Hepatic Parenchyma
► Foreign Body_____________________________________________________________________________________
Iatrogenic foreign bodies in the liver (drains,
stents, clips) are detected as echodense hepatic
masses of varying shape with relative ease be-
cause of their typical texture and the patient’s
history (Figs. 2.81-2.83). Metallic splinters and
projectlies will also be imaged as echodense
masses with posterior shadowing. Depending
on the time since they penetrated the liver.
they may be surrounded by hypoechoic liquid
lesions (hemorrhage, biliary leak) or hypere-
choic repair areas with organization/granula-
tion and the formation of scar/fibrous tissue.
a Fig. 2.81 Foreign body—here the basket of an abscess
drain.
a Fig. 2.82 Foreign body—here abscess drain with bas-
ket.
a Fig. 2.83 Foreign body—transjugular intrahepatic
portosystemic shunt (TIPS).
► Air________________________________________
Gas will produce hyperechoic reflections, and
sometimes even brilliant sparkles. There is an
eminent difference between the sonographic
appearance of small individual gas bubbles
and large areas containing gas. The latter result
in the characteristic total reflection and poste-
rior shadowing with its ill-defined margin,
while small individual gas bubbles will not
generate posterior shadowing. The acoustic
stimulation triggers natural oscillation, which
in turn produces an ill-defined posterior tail, a
hum, and may therefore be identified by real-
time scanning. Gas pockets can be found in bile
ducts and portal vein branches or they may be
part of complications within a hepatic mass
(tumor, metastasis, abscess) (E 2.13).
В 2.13 Intrahepatic Accumulation of Gas
СП
2 Liver
► Pneumobilia
a Pneumobilia: periportal echoes.
b Periportal echoes in discrete pneu-
mobilia after Whipple procedure: no
comet-tails.
► Gas formation
c Portovenous gas embolism. Left:
Early stage with initial gas deposits in
the parenchyma. Right: Late stage with
advanced confluent accumulation of
gas in the parenchyma.
d Abscess with central necrosis and gas
formation.
e Necrosis, after percutaneous ethanol
injection, with gas formation in HCC.
f Necrosis with gas formation in HCC,
after transarterial chemoembolization.
Intrahepatic Accumulation of Cas
Any accumulation of gas detected in the liver
has to be regarded as a serious complication
unless it is due to iatrogenic intervention.
Mass. Gas accumulated in a mass points to an
infection with gas-forming bacteria, usually
Gram-negative pathogens; another alterna-
tive would be necrosis with or without com-
plications.
oes (S 2.13c). Real-time ultrasound scan-
ning can demonstrate gas bubbles being
swept into the liver via the portal vein. If the
barrier between the intestinal lumen and the
mesenteric vascular system is impaired due to
necrotic inflammation or ulcers, or because of
endoscopic/radiological procedures, the re-
sult may be this potentially life-threatening
pathological finding.
hepatopetal flow of gas bubbles within the
portal vein rules out the differential diagnosis
of pneumobilia (S 2.13a and b). In the latter
case, the air in the bile ducts will shift, and
when the patient is repositioned the gas will
accumulate at the highest point; the acoustic
energy may induce reverberation in the gas,
making it “hum”.
Diffuse. Diffusely distributed gas in the he-
patic parenchyma is found in portovenous gas
embolism, initially as coarse periportal ech-
Aerobilia. In the case of portovenous gas
embolism, the detection of immobile sessile
echoes in the hepatic parenchyma and the
Irregular Masses
► Diffuse Changes in the Hepatic
Parenchyma
▼ Localized Changes in Hepatic
Parenchyma
* ► Anechoic Masses
J ► Hypoechoic Masses
► Isoechoic Masses
* ► Hyperechoic Masses
Echogenic Masses
Irregular Masses
► Differential Diagnosis of Focal
Lesions
— ► Hepatocellular Carcinoma (HCC)
► Thorotrastosis
► Diffuse Metastasis
► Alveolar Hydatid Disease
Гч
The texture of the hepatic parenchyma can be
inferred from the size, density, brilliance, and
distribution/pattern of the individual echoes.
Textural irregularities result from changes in
one or more of the characteristics of the indi-
vidual echo. If hepatic lesions are distributed
more or less evenly and affect the entire organ,
they may be very hard to detect as circum-
scribed lesions or at all. The following entities
are characterized by precisely such textural
changes.
► Hepatocellular Carcinoma (HCC)_________________________________________________________________
Localized Changes in Hepatic Parenchyma
Diffuse HCC cannot be differentiated from the
coarse echotexture of cirrhosis. Tell-tale signs
of malignancy are typical complications of HCC,
such as invasion of the vascular system, and the
diffuse irregular hypervascularization that may
be demonstrated on color-flow Doppler imag-
ing (Fig.2.84 and E 2.10f, k, and 1).
* Fig. 2.84 HCC with diffuse invasion of the portal vein
(VP). T = tumor.
► Thorotrastosis____________________________________________________________________________________
This tumor is hardly ever seen now and is also
characterized by diffuse changes of the entire
hepatic parenchyma (Fig. 2.85).
* Fig. 2.85 Thorotrastosis.
► Diffuse Metastasis___________________________________________________________________________
Although diffuse metastasis of the liver may
involve the entire organ, it may be impossible
to delineate individual lesions as metastases
with any certainty. Such changes are quite fre-
quent in cancer of the breast, stomach, and
pancreas (Figs. 2.86 and 2.87).
a Fig. 2.86 Diffuse liver metastasis of pancreatic can-
cer.
a Fig. 2.87 Diffuse liver metastasis of carcinoid tumor
► Alveolar Hydatid Disease
Infection with Echinococcus multilocularis
yields images similar to invasive tumor growth
and cannot be distinguished from a malignancy
by sonography alone (Table 2.12).
u Table 2.12 Alveolar hydatid disease. Sonographic classification after Wechsler and Kern3
ф
Stage Characteristic
гч
I Circumscribed inhomogeneous changes in the liver; ill-defined margin; mostly hyperechoic with a hypoechoic rim; calcification;
no invasion of the portal vein, bile ducts, and hepatic veins
II Appearance of hypoechoic cystic areas with ill-defined margins; invasion of bile ducts, branches of the portal vein, and hepatic
veins; increasing calcification
III Marked infiltration of the liver with complications due to invasion of bile ducts and vessels; extensive calcification at the
inhomogeneities; increasingly cystic hypoechoic areas
IV Crossing the organ boundary of the liver and invasion of the porta hepatis, diaphragm, retroperitoneum, head of the pancreas, and
the duodenum
Differential Diagnosis of Focal Lesions
Diagnostic Methods_________________________________________________________
► Diffuse Changes In the Hepatic
Parenchyma
► Localized Changes in Hepatic
Parenchyma
▼ Differential Diagnosis of Focal
Lesions
Ё. Diagnostic Methods
► Suspected Diagnosis
► Ultrasound
► CT
► MRI
► PET
► Scintigraphy
► Laparoscopy
► Needle Biopsy
► Angiography
Apart from the patient’s history, clinical find-
ings, and laboratory parameters, the differen-
tial diagnosis of focal liver lesions can draw on
other technical modalities that permit study of
the mass either directly by cytology/histology
and function testing, or indirectly by diagnostic
imaging. The importance of each modality de-
pends not only on the physical/technical limits
but, owing to rapid technical advances, also on
the model of the equipment used, the actual
performance of the study, and the personal
expertise of the clinician. It is essential to re-
gard the different diagnostic modalities as
being complementary rather than rivals, and
to employ them as efficiently as possible to
maximize the return for the patient. The im-
portance of diagnostic ultrasound within this
group of diagnostic modalities still has to be
defined.
Undoubtedly, abdominal sonography is the
imaging modality of choice in the detection
and diagnosis of hepatic disorders. Not only is
it the most widely available alternative of all
the imaging modalities, but it can be performed
at any time, with a high degree of sensitivity
and specificity, it does not endanger the pa-
tient, and it can be repeated as often as needed.
However, since not all lesions are amenable to
sonographic diagnosis, it has to be supple-
mented by other specific diagnostic methods.
The actual application of each modality de-
pends not only on the indication and issue at
hand but to a large extent also on its availabil-
ity, expenditure of diagnostic resources, and
cost; its invasiveness and the stress/danger
for the patient should also be considered.
Therefore, the differential diagnostic aspects
of the various modalities summarized below
cannot hope to be exhaustive; they are listed
only in terms of their importance as supple-
mentary measures to diagnostic ultrasound.
Alternative Modalities in the Differential Diagnosis of Focal Liver Lesions
Ultrasonography. Routine abdominal so-
nography can be supplemented by special
ultrasound techniques that can help in the
further diagnosis of a mass; primarily, this
would involve contrast-enhanced studies,
qualitative and quantitative studies of the
vascularization of the lesion, as well as the
various possibilities of guided needle biopsy
and intervention.
Computed tomography (CT). The primary
drawback of abdominal CT scanning is the
radiation exposure; furthermore, it only per-
mits static cross-sectional images. Its advan-
tages are in terms of documentation and the
imaging of masses in locations that might be
hard to study by ultrasound (subphrenic, in
massive obesity, etc.). The limits of detection
are about the same in both modalities (CT and
US); the sensitivity of each method in detect-
ing focal liver lesions is about 90%, which
increases to about 95% if both modalities
are combined.
Magnetic resonance imaging (MRI). The
most rapid advances in the imaging of focal
liver lesions have taken place in the field of
MRI, which nowadays plays an important role
in the detection and differential diagnosis of
these lesions. Because of the significant cost
and expenditure of resources and its lack of
widespread availability, MRI is not regarded as
a primary imaging modality but rather as an
important adjunct in the specific differential
diagnosis of lesions detected by routine so-
nography. Suspected hemangiomas lend
themselves particularly well to confirmation
by MRI.
Positron emission tomography. The impor-
tance of PET in the diagnostic armament is
still the subject of clinical studies; at present,
it cannot be regarded as a routine measure.
Scintigraphy. Because of the significant lo-
gistics and radiation exposure involved, scin-
tigraphic studies are also regarded as second-
line options. However, blood-pool scintigra-
phy is quite important when it comes to con-
firming focal lesions suspected of being he-
mangiomas. The same holds true for the di-
agnosis of FNH by hepatobiliary scintiscan
(HIDA scan), which specifically detects the
proliferating bile ducts of this disorder.
Laparoscopy. Laparoscopy is a minimally in-
vasive procedure that permits assessment of
the hepatic surface, precise guided biopsy of
circumscribed lesions, and, with the option of
an ultrasound scanner, a high-resolution
study of the liver. It is used primarily for un-
known diffuse disorders of the parenchyma,
and in the preoperative work-up of malignant
disease when the transabdominal ultrasound
finding is negative.
Needle biopsy with cytology|histology|
bacterial culture. Needle biopsy always is
an invasive procedure and can only be justi-
fied if it might lead to changes in the treat-
ment—in which case it becomes a necessity.
Angiography. Today, angiography does not
play any primary role in the diagnostic work-
up of the liver. It is of limited value in the
preoperative assessment of hepatic lesions.
Differential Diagnosis of Focal Lesions
Suspected Diagnosis____________________________________________________
► Diagnostic Methods
► Suspected Diagnosis
► Diffuse Changes in the Hepatic
Parenchyma
► Localized Changes in Hepatic
Parenchyma
▼ Differential Diagnosis of Focal
Lesions
— ► Hemangioma
► FNH
► HCC
► Metastasis
If the sonographic findings are tentative, the
sonographer has the following options to con-
firm or rule out the suspected diagnosis. Table
2.13 summarizes the significance of the various
diagnostic modalities.
Hemangioma. If contrast enhancement is
available, it can be used during the same study
to demonstrate the so-called filling-in phe-
nomenon by color-flow Doppler scanning, or
the pooling of the contrast agent within the
hemangioma by other imaging techniques
(stimulated acoustic emission, SAE).
The pooling of tracer-marked red blood cells
is also the basis for confirming a hemangioma
by blood-pool scintiscanning. The confirmation
of hemangiomas by CT also has its roots in the
filling-in phenomenon. In MRI, hemangiomas
are characterized by their typical behavior in
T1- and T2-weighted sequences.
Since hemangiomas are prone to hemor-
rhaging, they should not be needle-biopsied.
Unknown lesions breaking the surface of the
liver should be needle-biopsied in such a fash-
ion that the canal passes through a thick
enough stretch of normal hepatic parenchyma.
One characteristic of hemangiomas is a gush of
blood on aspiration.
Focal nodular hyperplasia. The diagnosis of
FNH is based on its architecture, with a thick
vascular pedicle, central stellate scar and radi-
ating fibrous septa, thick central blood vessel,
and radial centrifugal blood flow as well as
mulberry-like vascular tree. These characteris-
tics are easily demonstrated by abdominal
color flow Doppler imaging (improved by con-
trast enhancement), angio CT, and special MRI
studies.
FNH is confirmed by HIDA scanning since
the tracer is secreted into the bile ducts, whose
detectable presence is pathognomonic for this
disease (compared to adenoma, HCC, and
metastasis). However, this statement has to
be viewed in the light of recent studies that
have also demonstrated positive HIDA scans for
some adenomas.
Needle biopsy requires a tissue cylinder of
sufficient diameter; the procedure should al-
low for the hypervascular nature of this tumor
(possible hemorrhage), which is characterized
by its firm consistency.
Hepatocellular carcinoma. Any focal mass in a
cirrhotic liver should be suspected of HCC and
calls for further work-up and confirmation by
ultrasound guided needle biopsy (only if it re-
sults in clinical consequences for the patient).
Noninvasive color-flow Doppler scanning
may be able to demonstrate vascular invasion
of the tumor or its bizarre irregular hypervas-
cularization. HCC is delineated by its filling
defect on gadolinium-enhanced MRI.
Metastasis. Numerous proven methods can de-
tect hepatic metastases, including transabdo-
Liver 100
<N
minal ultrasound (particularly effective with
contrast enhanced imaging) and the equally
effective modalities of CT and MRL Laparoscopy
is the method of choice in the detection of
small superficial metastases since it bests all
other measures. At this time, typing a meta-
stasis in terms of its primary can only be
achieved by cytology/histology. However, con-
firmation by ultrasound-guided needle biopsy
after color-flow Doppler study is called for only
if it would result in clinical consequences. The
canal of the biopsy should always run through
a stretch of healthy parenchyma long enough
to prevent hemorrhage. Lesions with a sono-
graphic halo sign should be biopsied at the
hypoechoic rim.
References
1. WHO Informal Working Croup. International
classification of ultrasound images in cystic
echinococcosis for application in clinical and field
epidemiological settings. Acta Tropica
2003;85:253-261.
2. WHO Informal Working Group on Echinococcus
(WH0-1WGE). WHO/CDS/CSR/APH 2001.
3. Kern P, Wechsler, Lauchart W, Kunz R. Klinik und
Therapie der alveolaren Echinokokkose.
Deutsches Arzteblatt 91:2494-2501,1994.
4. Albrecht T, Blomley MJ, Bam PN, et al. Improved
detection of hepatic metastasis with pulse inver-
sion US during the liver-specific phase of SHU 508
A: multi-center study. Radiology
2003;227:361-370.
5. Quaia. E, F. Calliada, M. Bertolotto, S. Rossi. L.
Garioni, L. Rosa, R. Pozzi-Mucelli Characterisation
of Focal Liver Lesions with Contrast - Spezific US
Modes and a Sulfur Hexalfluoride-filled Micro-
bubble Contrast Agent: Diagnostic Performance
and Confidence. Radiology
2004;232:420-430.
6. Becker D, Giinter E, Hahn EG, Heyder N. Imaging
tumor vascularisation of hepatocellular carci-
noma with ultrasound angiography. Ultraschall
Med 1995;16:109-112.
Table 2.13 The importance of additional diagnostic modalities
Suspected sono- graphic diagnosis Additional diagnostic modality Impor- tance
Hemangioma Contrast enhanced color-flow Doppler imaging ++
MRI +++
Blood-pool scintigraphy ++
Angio-CT +
ICaution: needle biopsy!
FNH Contrast enhanced color-flow Doppler imaging ++
Hepatobiliary BIDA-imaging +++
CT +
MRI ++
Needle biopsy +
HCC Contrast enhanced color-flow Doppler imaging ++
MRI ++
Needle biopsy +++
Metastasis Contrast enhanced sonography with contrast harmonic imaging (CHI) ++
Needle biopsy +++
105
Biliary Tree
Biliary Tree 51
105
— ► Benign Thickening of the
Bile Duct Wall
—► Malignant Thickening of the
Bile Duct Wall
106
106
► PSC and Cirrhosis of the Liver
— ► Benign Periampullary Obstruction
—► Cancer
▼ Abnormal Intraluminal Bile Duct
Findings
▼ Foreign Body
— ► Pneumobilia/Stent
*—► Uncommon Causes
114
114
► Anatomy
— ► Topography
Callbladder 67
112
112
— ► Gallbladder Sludge
— ► Hemobilia
▼ Nonvisualized Gallbladder
▼ Missing Gallbladder
Agenesis
► Post-Cholecystectomy
Obscured Gallbladder
129
131
134
134
134
137
137
137
- - ► Isoechogenicity with
Surrounding Tissue
— ► Malposition
— ► Isoechogenicity with
Surrounding Tissue
► Malposition
3 Biliary Tree and Callbladder
Biliary Tree
L. Creiner and ]. Mueller
The intrahepatic and extrahepatic bile ducts
aie delicate tubular structures without the
stratified appearance so typical of smooth-
muscle walls—the epithelium of the bile ducts
lies directly adjacent to the outermost connec-
tive-tissue layer. Any rise in pressure within
Anatomy________________________________________________________________________
When viewed in the direction of bile flow, the
anatomy of the biliary tree may be subdivided
into an intrahepatic as well as an extrahepatic
compartment, the gallbladder appearing to be
“just” a dilated dead-end. The extrahepatic
course of the bile ducts can be broken down
further in to the hilar, prepancreatic, and intra-
pancreatic segments (ultrasound cannot differ-
entiate between a (rare) true intrapancreatic
course and the duct running in a “groove”).
Only in rare instances does another anatomical
landmark become visible by sonography—the
union of the cystic duct with the common hep-
atic duct. In ultrasound nomenclature this then
becomes DHC or “ductus hepatocholedochus,”
i.e., the common hepatic and hepatocystic
ducts (CBD. “common bile duct").
Diameter. Differential diagnosis in the ultra-
sound of the biliary tree relies much more on
the shape of the ducts than their “actual" or
“identifiable" diameter, since the piecise meas-
urement of biological structures is character-
ized by numerous variables: the definition of
the distances to be measured—which diameter
at which organ/tubule border and at which
position—is arbitrary and therefore not precise.
In addition, this issue becomes even more com-
plex when taking into account the typical
changes seen in the extrahepatic biliary tree,
the ducts results in immediate dilatation of
those parts of the ducts (and possibly also of
the gallbladder and/or cystic duct) upstream of
the obstruction. This facet of dilatation may be
detected quite easily by ultrasound and is the
most important aspect in the differential diag-
where the diameter of the ducts increases with
advancing age. Localized increases in the pre-
pancreatic duct diameter without a concomi-
tant rise in the intraductal pressure (“cholan-
giectasia”) do not depend on age and are a
frequent finding (see Fig. 3.3). Careful studies
have not been able to confirm the prevailing
concept that the diameter of the common duct
increases after cholecystectomy (taking into
account age adjusted cholangiectasia).
There are no systematic ultrasound studies
correlating bile duct diameter and patient po-
sition, and neither have there been any studies
on the (possible) changes in bile duct diameter
after meals or pressure relief, e.g., by endo-
scopic intervention.
Thus, any statement of “standard values" for
the diameter of the intrahepatic and extrahe-
patic bile ducts carries quite a large degree of
uncertainty.
Shape. Under normal pressure conditions
(< 20 cmH20), the intrahepatic and extra-
hepatic biliary tree is slender, particularly so
upstream of where the hepatic artery crosses
the common duct. The hepatic duct confluence
is very difficult to visualize on ultrasound
(I- 3.1 d). Even minor increases in intraductal
pressure will change the morphology of the
confluence (Fig. 3.1 b), i.e., it appears to become
nosis of (obstructive) cholestasis (with or with-
out jaundice). The changes in wall thickness,
intraluminal matter, and adjacent structures
form the basis for the sonographic assessment
of the level and cause (benign or malignant) of
biliary obstruction.
Diameter (Figs. 3.1 and 3.2)
► Barely visible interlobar branches
- Riqht/left hepatic duct: 1-2 mm
- Hilar common hepatic duct: 1-2 mm/
detection limit
- Prepancreatic CBD: 3-7(9) mm
Shape
► Slender interlobar seqment/close to the
hepatic duct confluence
- Hepatic duct confluence not or barely
visualized
- Slender hilar segment
- Slender/slightly ectatic prepancreatic
segment
- Intrapancreatic segment not or barely
visualized
3 Biliary Tree and Gallbladder 103
visualized more easily rather than there being
any actual changes in the measurements them-
selves, and the diffeientiation between the in-
trahepatic and extrahepatic segments of the
biliary system improves almost excessively
(Fig. 3.1c). Those segments close to the hepatic
duct confluence and the latter itself can be
differentiated immediately and the intra-
hepatic bile ducts become dilated, resulting in
the well known “double-barrel shotgun sign”
(Figs.3.1 band 3.2)
a Fig. 3.1 Diameter of the intrahepatic biliary tree.
a Slender intrahepatic bile duct (>) (segment II), ac-
companying branch of the portal vein (2).
a b Slightly dilated intrahepatic bile duct (>) (segment
III), accompanying branch of the portal vein (2).
a c Hepatic duct confluence with moderate biliary ob-
struction. Hepatic duct confluence (1) and portal vein
(2), branch of the hepatic aitery (3), inferior vena
cava (6).
3 Biliary Tree and Callbladder
Fig. 3.2 Dilated intrahepatic bile duct (1), accompa-
nying branch of the portal vein (2), and hepatic
artery (3) (segment III).
◄ Fig. 3.3 Prepancreatic cholangiectasis with ampul-
lary CBD (1 a) and slender segment near the hepatic
duct confluence (1 b); early branching of the hepatic
artery as a regular variant (3); portal vein (2).
Topography and Ultrasound Morphology
Both other vessels of the hepatic triad, the
trunks and branches of the portal vein and
the hepatic artery, can be considered manda-
tory and highly reliable sonographic landmarks
accompanying the intrahepatic and extrahe-
patic biliary tree.
Intrahepatic biliary tree. Ultrasound visual-
ization of the intrahepatic biliary tree
(Figs. 3.1 and 3.2) is facilitated by the fact that
the regular vascular branching of the hepatic
triad (“vascular architecture”) at all levels re-
sults in multiple, ever-smaller branches cours-
ing parallel to the surface of the probe, which
makes for optimum detection. The best resolu-
tion of details, almost resembling that of a
magnifying glass, is seen in the portal vein
branches (up to the intralobular level), fol-
lowed by the small branches of the bile ducts.
Normally, only the large intrahepatic branches
of the hepatic artery can be seen (with color-
flow Doppler scanning even more peripheral
branches may be visualized).
Extrahepatic biliary tree (E3.1). The hilar/
prepancreatic course of the extrahepatic biliary
tree is also well defined in terms of ultrasound
anatomy by the vascular triads originating
here. The portal vein always runs posterior to
the more slender common duct (3 3.1 a-f). The
relationship of the portal vein with the hepatic
Topography
► Hepatic triads:
Branches of the bile ducts, hepatic artery,
and portal vein running in parallel
► Intrahepatic:
Interlobular sheaths of connective tissue
► Extrahepatic:
Between segments I (caudate lobe) and IVb
then posterior to the duodenum and head
of the pancreas/intrapancreatic caudad to
the gastroduodenal artery
artery and its variant extrahepatic hilar
branches is somewhat more complex
(Fig. 3.4c, d). The hepatic artery always enters
the hepatic portal from the left (E 3.1 f) and
therefore initially lies to the left of the common
duct; it (or its main right branch) then crosses
behind the common duct (3 3.1c). Thus, it
courses anterior to the portal vein and poste-
rior to the common duct (B 3.1 a-c. Fig. 3.1c),
and in scans of the hepatic portal ( 3.1 f) it
appears as a round tubular cross-section. Infre-
quently—only in about 5%—this cross-section
of the hepatic artery may progress into its in-
trahepatic course anterior to the common duct
(Fig. 3.4a, b). Owing to the pressure of the
adjacent pancreatic parenchyma, the intra-
pancreatic segment of the CBD is almost im-
Sonographic landmarks
► Intrahepatic:
Typical topography of the branching struc-
tures accompanying the portal vein (seg-
ments II + 111 I)
► Extrahepatic:
Portal vein to the posterior
Hepatic artery from the left running be-
tween portal vein and common duct,
denting the latter
possible to visualize; it is best seen in sections
orthogonal to its anatomical course (3 3.1 f).
Clinical Notes
The structures of the hepatic portal are
best imaged with the patient in left lateral
decubitus position and inhaling deeply: this
moves the liver caudad and to the left,
thereby providing an excellent “sono-opti-
cal” window.
Previous operations in the upper abdomen
often lead to significant scarring with a
subsequent left shift of the intestinal or-
gans (including the common duct) since
the adhesions tend to shrink.
л Fig. 3.4 Hepatic artery, a and b Variants in the position of the hepatic artery (3); here, it is anterior to the dilated
common duct (1); portal vein (2).
л c and d Kinking of the hepatic artery (3)
Е 3.1 Anatomy of the Extrahepatic Biliary Tree
► Common duct (1), portal vein
(2), hepatic artery (3), pan-
creas (4), liver (5), inferior vena
cava (6), left and right hepatic
ducts (7), splenic vein (8), right
renal artery (9), abdominal
aorta (10), crura of diaphragm
(11), superior mesenteric ar-
tery (12), left renal vein (13),
posterior wall of the gastric
antrum (14), anterior wall of
the gastric antrum (15).
a
b c
d
e
Thickening of the Bile Duct Wall 105
Thickening of the Bile Duct Wall
Localized and Diffuse_________________________________________________________
5 ▼ Thickening of the Bile Duct Wall
Qj » — ........
Localized and Diffuse
X3 ------------------------------------
О J► Bile Duct Rarefaction
Э Bile Duct Dilatation
2 ► Abnormal Intraluminal Bile Duct
| Findings
Differential Diagnosis of Sono-
! graphic Cholestasis
► Benign Thickening of the Bile Duct Wall
► Malignant Thickening of the Bile Duct Wall
► Benign Thickening of the Bile Duct Wall______________________________________________________
Transcutaneous ultrasonography can assess lo-
calized benign thickening of the bile duct wall
in two disorders of the biliary system: intra-
hepatic and extrahepatic presentation of pri-
mary sclerosing cholangitis (PSC) (Fig.3.5), and
the solely extrahepatic manifestation of (se-
vere) suppurative cholangitis (Fig. 3.6). Except
for a few cases, in both instances the sono-
graphic morphology cannot be considered as
primary proof but rather “suggests" the sus-
pected diagnosis, with a greater or lesser de-
gree of probability, which then will have to be
confirmed by other means (clinical findings,
blood chemistry, and endoscopic retrograde
cholangiography).
The prolonged course of chronic inflamma-
tory bowel disease (Crohn disease, ulcerative
colitis) is often accompanied by the sono-
graphic telltale signs of PSC, from segmental
diffuse bile duct wall thickening all the way
to complete obstruction of the lumen, alternat-
ing with dilated/ectatic bile duct segments;
ducts may also appear simply to break off,
and intraductal sludge is a frequent finding. It
is not possible to rule out early cholangiocel-
lular carcinoma (CCC), and even fine-needle
aspiration cytology has its problems. PSC-like
changes have been described for HIV infections
with manifest AIDS symptoms.
Acute suppurative cholangitis may result in
thickening of the common duct wall, which can
be demonstrated for the extrahepatic segment.
This thickening of the wall becomes particu-
larly evident if endoscopic intervention (endo-
scopic papillotomy = EPT) has provided pres-
sure relief by removing or bypassing the biliary
obstruction (Figs.3.22 and 3.27): the dilated
bile duct walls, originally thinned out by their
distension, collapse and their inflamed and
swollen true structure becomes exceptionally
well visualized (Figs. 3.6 and 3.28).
3 Biliary Tree and Gallbladder 106
a Fig. 3.5 Primary sclerosing cholangitis.
a Dilatation and wall thickening (calipers) of the in-
trahepatic bile duct (1) in segment III. Accompanying
branch of the portal vein (2).
a b Dilatation and wall thickening (calipers) of the in-
trahepatic bile duct (1) in segment ll/lll.
a c Wall thickening (“sclerosis") of the common duct
(1); hepatic artery (3) crossing in between.
Fig. 3.6 Suppurative cholangitis, subsiding after en-
doscopic papillotomy and extraction of calculi, with
thickened wall (calipers) of the common duct (1);
portal vein (2); hepatic artery (3) crossing in be-
tween.
► Malignant Thickening of the Bile Duct Wall___________________________________________________
Malignant bile duct wall thickening may be
localized as in CCC or infiltrating as in HCC
(hepatocellular carcinoma), and in both cases
ultrasound detects these changes solely in
terms of the resulting biliary obstruction with
its subsequent prestenotic dilatation of the
duct. Consequently, these entities are discussed
in the section on pressure-induced bile duct
dilatation.
One rare special case is mucinous biliary
papillomatosis with its fluent transition to
well-differentiated cholangiocarcinoma (Fig.
3.7). The ultrasound findings show a nonex-
pansile solid mass originating in but well de-
fined and demarcated from the surrounding
bile duct wall, which it dilates to sometimes
bizarre shapes; complete biliary obstruction
tends to occur late in the disease. It has a rather
indolent course (over many years), and treat-
ment is characterized by effective long-term
interventional endoscopy (stenting, removal
of the tumor masses).
a Fig. 3.7 Obstruction of the common duct (1) in intra-
ductal spread of cholangiocarcinoma (xx); portal vein
(2): hepatic artery (3).
Bile Duct Rarefaction
Localized and Diffuse_________________________________________________________
— ► PSC and Cirrhosis of the Liver
► PSC and Cirrhosis of the Liver
Visualization of a rarefied biliary tree, be it
localized or diffuse, by ultrasound plays a role
of its own only in pediatrics (except for the
segmental bile duct rarefaction sometimes
seen in PSC). However, in the diagnostic
work-up of the cirrhotic liver the indirect cri-
terion of an "abnormal vascular architecture’’
(E 3.3f) also ties in with the rarefied intrahe-
patic bile ducts. By analogy, this concept ap-
plies to all types of cirrhosis as the common
end point of severe chronic hepatobiliary dis-
orders, and thus also to cirrhosis in PSC and in
primary biliary cirrhosis (PBC), for example. о
Bile Duct Dilatation and Intraductal Pressure
No intraductal pressure increase. Dilatation
of the bile ducts without concomitant rise in
intraductal pressure can be classified into two
entities: for the intrahepatic bile ducts this
would correspond to Caroli disease (Fig. 3.8),
and for the extrahepatic biliary tree the under-
lying disorder would be congenital cystic mal-
formation of the common duct. It is not true
that cholecystectomy always results in a di-
lated common duct.
With acute pressure increase. Any acute
rise in intraductal pressure within the biliary
tree, which has to drain about 700 ml of bile
per day, will lead to immediate dilatation of the
bile ducts (Figs. 3.1 b and 3.9): the intrahepatic
and extrahepatic bile ducts are tubes of con-
nective tissue lined with epithelium but lack-
ing any muscle fibers in the wall, and therefore
they cannot resist the pressure increase (this
observation becomes obvious during any retro-
grade injection of contrast media into bile
ducts with an initially regular diameter). In
acute biliary obstruction, the sonographic find-
ing of bile duct dilatation is the first reprodu-
cible indication of this rise in pressure, since in
intermittent obstruction the biochemical
markers (gamma-glutamyltransferase [a-GT],
alanine transaminase [ALT], aspartate transa-
minase [AST]) will not change or will rise to
abnormal values only hours later (6-24 hours).
One rather subtle but convincing sonographic
sign of the increased pressure in postcholecys-
tectomy patients is the visualization of the
cystic duct remnant (Fig. 3.9).
The more pronounced the acute rise in pres-
sure (for instance, in status post cholecystec-
tomy there is no possibility of pressure com-
pensation by the gallbladder), the more
pronounced the changes become in the intra-
hepatic biliary tree (Fig. 3.1b)—dilatation
("double barrel shotgun sign”) that can be
demonstrated quite well at the sonographically
easily accessible segments II and III, since there
the hepatic triads branch in a plane paralleling
the probe; (Fig. 3.2). However, this is tiue only
if the tissue surrounding the bile ducts is elastic
enough to allow this dilatation; in bile ducts
passing through cirrhotic parenchyma, even
high intraductal pressure may not result in
dilatation.
With chronic pressure increase. Chronic
pressure-induced dilatation of the bile ducts
(Figs. 3.2, 3.7, 3.10-3.13) is characterized by
maximal dilatation of the ducts involved; de-
scriptive terms (the image of the “exfoliated
oak tree”) for the intrahepatic bile duct dilata-
tion convey the situation quite accurately (as
long as they trigger the corresponding associ-
ations in the mind of the sonographer).
Long-term biliary obstruction with border-
line nonicteric compensation is typical of local-
ized intrahepatic obstruction (Fig. 3.12), for in-
a Fig. 3.8 Dilated intrahepatic bile duct (1) with multi-
ple calculi (xx); Caroli disease.
stance in CCC (particularly in unilateral Klat-
skin tumors). If the biliary obstruction is in-
complete and takes place over a long period,
just 20-25% of parenchyma with regular drain-
age will still be adequate to avoid any manifest
jaundice. Biliary obstruction arising at the
lower levels and being compensated over a
long period is a common finding in well-differ-
entiated periampullary carcinoma (in which
case the pancreatic duct will be dilated as
well—twin-duct stenosis; Fig.3.13) and the
somewhat rare truly benign stenosis of the
papilla of Vater.
Bile Duct Dilatation and Intraductal Pressure
a Fig. 3.9 Dilated cystic duct (1) in pancreatitis of the pancreatic head (4); inferior vena cava (6); portal vein (2).
a Fig.3.W Extensive dilatation of the intrahepatic bile
duct (1) with accompanying portal vein (2).
3 Biliary Tree and Gallbladder 108
«Fig.3.11 Dilated common duct.
a Extensive dilatation of the common duct (1);
portal vein (2); hepatic artery (3).
* b Kinking of the common duct (1) in long-term
pressure increase within the biliary tree; portal vein
(2); hepatic artery (3).
«Fig. 3.12 Extensive dilatation of the intrahepatic
branches (1) of just the right hepatic lobe in Klatskin
tumor.
* Fig. 3.13 Twin-duct stenosis in periampullary carci-
noma: dilated intrapancreatic CBD (1) and maximum
dilatation of the pancreatic duct (xx); inferior vena
cava (6); splenic vein (8).
Intrahepatic__________________________________________________________________
u
Qj
► Thickening of the Bile Duct Wall
► Bile Duct Rarefaction
▼ Bile Duct Dilatation
™ ► Intrahepatic
► Hilar and prepancreatlc
Intrapancreatic
gi ► Papillary
► Abnormal Intraluminal Bile Duct
Findings
► Differential Diagnosis of Sono-
graphic Cholestasis
— ► Intrahepatic Gallstones
► Heptocellular Carcinoma (HCC)/Cholangiocellular Carcinoma (CCC)
► Intrahepatic Gallstones___________________________________________________________________________
In most cases benign obstruction of the intra-
hepatic bile ducts is caused by intrahepatic
biliary calculi (cholangiolithiasis and hepatoli-
thiasis) (Fig. 3.14).
Focal liver lesions usually do not affect the
intrahepatic bile ducts, or at most they displace
them without any significant biliodynamic
consequences. This is also true for (very) large
benign and malignant focal lesions (e.g., volu-
minous hemangiomas, cysts, or metastases of
colorectal cancer).
* Fig.3.14 Multiple intrahepatic biliary calculi (hepa-
toliths) (xx).
► Hepatocellular Carcinoma (HCC)/Cholangiocellular Carcinoma (CCC)
Even aggressive metastatic spread within the
liver usually respects the structures of the bili-
ary tree. HCC may be the one exception, since it
is known to invade not only the blood vessels
but the bile ducts as well; tumor thrombi in the
venous (Fig. 3.15) and biliary vessels (see
Figs. 3.19-3.21) are pathognomonic for HCC.
As a possible cause of pressure-induced malig-
nant dilatation of intrahepatic bile ducts, its
incidence is well above that of the (quite rare)
true CCC (Fig. 3.16); however, in undifferenti-
ated tumors even pathological histomorphol-
ogy and/or cytomorphology will sometimes be
unable to diagnose precisely whether one is
dealing with HCC or CCC.
a Fig. 3.15 Small hepatocellular carcinoma (x) invading
a hepatic vein (y).
a Fig. 3.16 Cholangiocellular carcinoma (x) with local-
ized intrahepatic biliary obstruction^) (segment II).
Hilar and Prepancreatic____________________________________________________
► Benign Causes of Obstruction
► Malignant Tumors
Bile Duct Dilatation and Intraductal Pressure 109
► Benign Causes of Obstruction_________________________________________________________________
Gallstones. The primary cause of benign bilio-
dynamic obstructions in the hepatic portal and
the prepancreatic CBD are biliary calculi
(a 3.2), which may differ significantly in terms
of shape, size, and number. Gallstones at the
hepatic duct confluence and in the CBD will be
easier to detect by ultrasound the bigger they
are and the more they are encased by fluid. In
addition, “young" calculi made up of pure cho-
lesterol (Ы 3.2c) display a higher impedance
than old pigmented gallstones of low reflectiv-
ity (S3.2d). Direct detection of intrahepatic
and common duct biliary calculi may also de-
pend on the quality of the ultrasound platform
employed and, primarily, on the diligence and
experience of the sonographer. Sonographic
visualization of small and minute gallstones
(“microlithiasis”) (э 3.2h) is particularly chal-
lenging, since their passage through the papilla
of Vater appears to be the underlying cause in
most cases of so-called idiopathic pancreatitis.
When considered in the context of a typical
history and clinical findings, ultrasound can
detect the presence of such microliths only
indirectly by demonstration of the dilated bile
ducts. Even in endoscopic retrograde cholan-
giopancreatography [ERCP] studies there is
sometimes lingering doubt about the possible
presence of microliths, which may be screened
out by the contrast agent. In these cases it pays
to insonate the gallbladder immediately after
endoscopic retrograde cholangiographic [ERC]
cystography: these minute calculi may now be
seen in the boundary layer between the (heav-
ier) contrast agent and the (lighter) bile,
although they may have escaped detection in
previous studies despite patient positioning
(a 3.2h). When dealing with small CBD calculi,
posterior shadowing may facilitate detection
a Fig. 3.17 Mirizzi syndrome with cholecystolithiasis in
typical infundibular position (x). with hydrops and
inflamed thickened wall (y) and biliary outlet obstruc-
tion (1).
much better than actually looking for the bili-
ary calculus itself (s 3.2b and e).
Intraductal gallstones without any clinical or
biochemical findings are quite rare and should
always be treated by interventional endoscopy
(while silent calculi in the gallbladder may be
left alone).
A special case of calculus-induced inflam-
matory bile duct obstruction is Mirizzi syn-
drome (which can be difficult to visualize on
ultrasound) (Fig.3.17).
a Fig. 3.18 Hodgkin lymphoma (x) with dilatation of
the CBD (1).
3 Biliary Tree and Callbladder 110
И 3.2 Choledocholithiasis
a Two calculi (xx) in the dilated CBD (1).
b Small calculus (x) in the CBD with
faint but definite posterior shadowing
(У)-
c Hyperechoic (cholesterol?) CBD stone
(x) with surface defects after extracor-
poreal shock-wave lithotripsy (ESWL).
d Hypoechoic (pigmented?) CBD stone
(x and arrows) with posterior shadow-
ing (y).
f Floating intraductal gas bubbles =
pneumobilia (x) and CBD calculi (y) with
posterior shadowing (+); dilated CBD
(1).
g After ERC and with the patient su-
pine: floating microliths (xx) marking
the boundary layer between the lighter
bile (g) and the more viscous contrast
agent (k).
e Preampullary hyperechoic (choles-
terol?) CBD stones (x); CBD (1); inferior
vena cava (6); pancreatic head (4).
Hemobilia. In most cases hemobilia is iatro-
genic; because of the highly thrombolytic ac-
tivity of bile, biliary obstruction is the excep-
tion rather than the norm.
Cicatricial stenosis. Only rarely is stenosis
of the hilar biliary tree and common duct due
to scarring the sole cause of the obstruction-
most often they will be compensated for a
considerable time, and additional factors, such
as (micro-Jlithiasis. are required foi fully blown
cholestasis to develop.
Because of their propensity for scar contrac-
tion, bilioenteric anastomoses may, however,
decompensate without any additional lithic
obstruction. The short length of these strictures
does not make them amenable to direct sono-
graphic visualization.
Vascular causes. Intramural venous malfor-
mations have been described as a vascular
cause underlying common duct obstruction.
Lymph node enlargement. Differential di-
agnosis should always include mechanical cho-
lestasis by lymph node enlargement, no matter
what the etiology.
► Malignant Tumors______________________________________________________________________
Once again, when viewed in the direction of
bile flow, malignant obstruction at the level of
the hilar hepatic confluence or the prepancre-
atic common duct is due to CCC of the Klatskin
type, and in the case of CBD involvement it is
the invasive carcinoma of the gallbladder or
HCC infiltrating the biliary tree (Figs. 3.19-
3.21). Most of these masses are isoechoic with
the adjacent hepatic parenchyma and their
only evidence is obstruction of the biliary ves-
sels resulting in bile duct dilatation.
Cholangiocellular carcinoma of the Klatskin
type, obstructing just one of the two hepatic
ducts, is characterized by the difference in
echogenicity of the two hepatic lobes, which
is due to the different amounts of fluid in the
parenchyma
a Fig.3.19 Cholangiocellular carcinoma (x) with en-
larged lymph node (y) and tumor projecting into
the CBD (1).
a Fig.3.20 Carcinoma of the gallbladder (x) invading
the hepatic portal, dilatation of the intrahepatic bile
ducts (1).
a Fig.3.21 Hepatocellular carcinoma (x) with peg-
shaped invasion of the CBD (1); portal vein (2). hep-
atic artery (3).
Classification of Klatskin Tumors
Klatskin tumors24 is a collective term for bile-
duct adenocarcinomas located at the bifurca-
tion of the hepatic duct. They were subdi-
vided into three types by Bismuth and Corlett
in 1975 3a Type I tumors involve the common
hepatic duct, with no involvement of the right
and left secondary ducts. Type // tumors in-
volve the hepatic duct bifurcation, without
involving the secondary intrahepatic ducts.
Type III tumors involve the hepatic duct bifur-
cation, infiltrate the common hepatic duct,
and also involve one or both hepatic ducts
toward the liver or second-order bile ducts.
The different types are easily identified by
ultrasound.
Intrapancreatic
— ► Benign Intrapancreatic Stenosis
► Cancer of the Pancreatic Head
Bile Duct Dilatation and Intraductal Pressure
► Benign Intrapancreatic Stenosis
One of the most common causes of benign
intrapancreatic stenosis, apart from the acute
passage of gallstones, is marked chronic pan-
creatitis: in the presence of the typical sono-
graphic signs (Figs. 3.22 and 3.23) and the
pointed cone shaped obstructed CBD (com-
pared with the more plump cut-off appearance
in malignancies) (Fig.3.24), this pieliminary
diagnosis is well founded. Bihary obstruction
may also be caused by pseudocysts and acute
(segmental cephalic) pancreatitis. Other rare
causes described in the literature are benign
pancreatic masses along the line of focal mes-
enchymal lesions.
► Cancer of the Pancreatic Head
Most cases of malignant intrapancreatic ob-
struction (Fig. 3.24) are due to ductal carci-
noma of the pancreatic head. But at times (un-
differentiated carcinoma), even histology may
not be able to differentiate between ductal
pancreatic carcinoma and CCC of the intra-
pancreatic CBD. Pancreatic metastases are
rare by themselves and will haidly result in
obstruction of the biliary passage.
л Fig. 3.22 Hepaticoduodenal stent (x) draining the
CBD (1); reduced pancreatic parenchyma with multi-
ple small hyperechoic lesions (probably correspond-
ing to calcium deposits).
< Fig. 3.23 Chronic pancreatitis (4), with pseudocyst (x)
obstructing the CBD (1); dilated pancreatic duct (y);
inferior vena cava (6): abdominal aorta (10).
* Fig. 3.24 Cancer of the pancreatic head (x), ob-
structing the CBD (1): hepatic artery (3); liver (4);
posterior wall of the gastric antrum (14).
Papillary
3 Biliary Tree and Gallbladder 112
— ► Benign Periampullary Obstruction
► Cancer
► Benign Periampullary Obstruction___________________________________________________________
The periampullary duodenal diverticulum is
very hard to visualize on ultrasound, and its
role as a benign obstruction of the biliary tree
remains unclear. True sclerosis of the papilla of
Vater is also quite rare. Sonography can hardly
ever demonstrate calculi impacted in the pap-
illa of Vater. Other benign obstructions at the
level of the papilla, such as cysts of the duode-
nal wall and intramural duodenal heterotopic
pancreatic remnants, also escape sonographic
detection.
* Fig. 3.25 Periampullary cancer (y) obstructing the
CBD (1) and pancreatic duct (x); inferior vena cava
(6), splenic vein (8).
► Cancer____________________________
In characteristic sonomorphology, periampul-
lary and true papillary carcinomas result not
only in biliary but also pancreatic obstruction,
with the "double duct dilatation” of both duct
systems (Figs. 3.13 and 3.25). In cases of pain-
less jaundice, this sonographic picture raises
the hope of possible curative surgery.
Abnormal Intraluminal Bile Duct Findings
Foreign Body________________________________________________________________
CU
► Thickening of the Bile Duct Wall
► Bite Duct Rarefaction
► Bile Duct Dilatation
▼ Abnormal intraluminal Bile Duct
Findings
^^►^oreign Body
► Differential Diagnosis of Sono-
graphic Cholestasis
— ► Pneumobilia/Stent
► Uncommon Causes
► Pneumobilia/Stent__________________________________________________________________________
Intraductal gas or pneumobilia (Fig.3.26) after
endoscopic papillotomy (or hepatoenteric
anastomosis) is a clear sign of unobstructed
bile flow; here, too, sonography and endoscopy
of the abdomen are complementary rather
than competing modalities. The same holds
true when checking the function and position
of biliary stents (Fig. 3.27). Compared with
computerized tomography, sonographic real-
time scanning can differentiate, without prob-
lems, between pneumobilia and the pulsatile
snow-shower-like inflow of portal gas bubbles
(Fig. 3.26).
Fig. 3.26 Pneumobilia (x) of
the intrahepatic bile ducts,
on the left in “string of
beads” configuration and in
the middle image filling a
small duct completely. On
the right: small and minute
pulsatile inflow of brightly
echogenic gas bubbles in
the portal vein (y)
Abnormal Intraluminal Bile Duct Findings
a Fig. 3.27 Hepatoduodenal stents (x).
a Satisfactory drainage. Anterior (y) and posterior
walls (z) of the stent; portal vein (2). 1 = common
duct; 3 = bile duct.
a b Dysfunctional stent with dilated CBD and sludge.
a c Lumen (x) of a self-expanding hepatoduodenal
stent with satisfactory drainage.
► Uncommon Causes________________________________________________________
Numerous other intraluminal foreign bodies of
the bile duct have been described, mostly in the
literature on endoscopy; the common charac-
teristic of these uncommon findings is their
unfailing lack of detection by ultrasound.
They are listed here simply to round out this
discussion of differential diagnosis:
► Metal fragments after gunshot injuries
► Clips after surgery (Fig. 3.28a)
► Sutures and parts of T-tube drains
► Food particles (after choledochoduodenos-
tomy)
► Parasites (Echinococcus, Ascaris, Opisthorchis
sinensis, and others) (Fig.3.28b-d).
« Fig. 3.28 a Clip (x), with posterior shadowing (y),
close to the CBD after laparoscopic cholecystec-
tomy; portal vein (2); hepatic artery (3); CBD (1)
with residual inflammation of the wall (after endo-
scopic papillotomy).
a b Ascariasis: oval-shaped hyperechoic voids, slightly
distended duct (arrow) (clinical diagnosis: acute ne-
crotizing pancreatitis).
a d “Recovered” ascaris.
* c ERC photograph: ascaris. emerging from the papilla
of Vater.
Differential Diagnosis of Sonographic Cholestasis
3 Biliary Tree and Gallbladder 114
In today’s age of imaging modalities, the term
cholestasis—meaning “stoppage of the bile
flow”—is equated with mechanical obstruction
of the bile flow. Thus, the differentiation of this
term with respect to parenchymal cholestasis
(a 3.3) in acute hepatitis (a 3.3a), hepatic con-
gestion (a 3.3b), veno-occlusive disease
(a 3.3c), cholangitis with abscess formation
(S 3.3d), diffuse metastasis (И 3.3e), or in cir-
The Seven Most Important Questions
Ф J ► Thickening of the Bile Duct Wall
= ► Bile Duct Rarefaction
Bile Duct Dilatation
Q Abnormal Intraluminal Bile Duct
I Findings
qq И - —— ......................
'J ▼ Differential Diagnosis of Sono-
graphic Cholestasis
I he Seven Most Important
Questions
rhosis has become an issue of minor impor-
tance. This is understandable because the ex-
tent and duration of the ductal distension, and
the type and anatomical location of the ob-
struction with its possible impact on bile flow
dynamics, can be visualized so easily by means
of ultrasonography.
As in all other fluid-filled tubular systems,
any pressure increase in the bile-filled vessels
— ► Relationship with the Bile Ducts
► Pressure Increase
► Bile Duct Diameter
► Level of Flow Obstruction
► Possible Malignancy
► Duration of Obstruction
► Thickness of Bile Duct Wall
will increase their diameter, pressure in the
adjacent tissue permitting, and thus result in
distension. Therefore, the leading differential
diagnostic sign in the sonographic morphology
of cholestasis is distension of the intrahepatic
and/or extrahepatic bile ducts, with or without
clinical symptoms and rarely without concom-
itant rise in the blood level of bilirubin and/or
the other enzymes characteristic of cholestasis.
1. Are the vascular structures in question truly
part of the biliary tree?
The first step in the differential diagnosis of
vascular distension within the liver paren-
chyma or at the hepatic portal is to ascertain
whether the vessels are truly part of the biliary
tree. Intrahepatic arteries or the arteries and
veins of the porta hepatis are typical examples
of such misdiagnosed structures (Ы 3.3f, i, j).
Even without the capabilities of color-coded
Doppler scanning of the flow, precise knowl-
edge of the anatomy with its numerous var-
iants is essential for this first step in the differ-
ential diagnosis.
2. Are there signs of a (segmental or general)
pressure increase in the biliary tree?
The second aspect to be addressed when
considering dilatation of the biliary tree is to
resolve the issue of a pressure-independent
increase in the diameter (“ectasia") (B 3.4d)
Practical Considerations
The differential diagnosis of “sonographic
cholestasis”—more precisely, the question
of obstructive nonparenchymatous choles-
tasis—is the prime example of a medical
problem where ultrasonography (the Ital-
ians prefer the much more descriptive and
pertinent term of echoscopy) and endos-
copy are the perfect diagnostic as well as
interventional/therapeutic partners, pref-
erably performed by one and the same
physician. Other diagnostic modalities
such as CT or MRI would usually not be
needed at all.
or tiue dilatation by increased tubular pres-
sure—be it within individual segments (“lev-
els") (B 3.4h-j, k, q) or the entire biliary tree
(a 3.4k-p, г-u). Congenital malformations
such as choledodochal cysts or Caroli disease
and the age-dependent increase in the ductal
diameter, particularly that of the prepancreatic
CBD, are not pressure-dependent (a 3.4d). The
prevailing concept that the diameter of the
common duct increases after cholecystectomy
does not hold true.
3. What is the diameter of the bile ducts—sub-
jectively and measured?
The third question deals with the determi-
nation of the bile duct diameter. These milli-
meter values measured at ill-defined locations
are diagnostically inferior to the morphological
appearance of the biliary tree, since the latter
allows much better conclusions to be drawn
regarding the actual cause of the increased
pressure within the bile ducts (- 3.4d-g). Ves-
sels distended owing to increased pressure are
more or less dilated along their entire preste-
notic course; it should be noted that in case of
extrahepatic obstruction the hepatic duct con-
fluence is easily differentiated from its sur-
roundings. Only ectatic segments of the bile
tree (preferably in the prepancreatic region of
the CBD) with slender segments upstream
( 3.4d) do not exhibit any intraductal pres-
sure increase, i.e., no cholestasis.
It stands to reason that in cases of intraduc-
tal pressure increases the possibility of ductal
dilatation depends on the pressure of the sur-
rounding tissue: for instance, if the intra-
pancreatic course of the CBD becomes visible
this is (almost) proof of a significant pressure
increase in the prepapillary segment which
must more than negate the compression ex-
erted by the head of the pancreas. Cirrhosis of
the liver will not result in dilatation of the
intrahepatic biliary tree even if the pressure
increases significantly.
4. At what level of the biliary tree is the ob-
struction located?
5. Is the obstruction malignant or benign?
The fourth question concerning the “level”
and the fifth question dealing with the nature
(malignant or benign) of the biliary obstruction
are discussed in detail elsewhere in this chap-
ter in the section on “Bile Duct Dilatation and
Intraductal Pressure."
6. How long has the biliary tree been ob-
structed/dilated (acute—hours/days, or chron-
ic—weeks/months)?
The sixth issue focuses on the duration of
the cholestasis and has to be resolved in the
context of the patient’s history and laboratory
work-up. Lacking any muscle layers, the walls
of the bile ducts are quite thin, and therefore
any pressure increase will result in immediate
expansion of their diameter. In acute obstruc-
tion from calculi, e.g., impacted in the papilla of
Vater, bile duct dilatation is the first detectable
symptom (S 3.4g) and can be demonstrated
several hours before any rise in the cholestatic
enzymes.
Compensated chronic (weeks or months)
obstruction in the intrahepatic or extrahepatic
segments of the biliary tree (a 3.4g, i, q-u) can
lead to bizarre bile duct dilatation (E 3.4o) and
tortuosity.
7. Is there localized or diffuse thickening of the
bile duct walls?
The seventh aspect to be considered in the
differential diagnosis of cholestasis concerns
the thickness of the bile duct walls. If the ob-
structed bile flow is accompanied by cholangi-
tis, quite often thickening and layering can be
demonstrated in the bile duct walls, in partic-
ular after successful relief by interventional
endoscopy. Irregular wall thickening, with jux-
taposed segmental narrowing and dilatation of
the bile ducts, is characteristic of primary scle-
rosing cholangitis (PSC) (Fig.3.5).
S 3.3 Parenchymatous Cholestasis
► Viral hepatitis, congested liver,
portal vein thrombosis
a Gallbladder, with a lot of sludge but
little fluid and ill-defined wall (7), in
acute hepatitis A. 2 = branch of the
portal vein; 5 = liver.
b Congested liver (5). Left: with dilated
inferior vena cava (6), and congested
middle (xx) and right (xxx) hepatic vein
Right: same constellation, plus gas filled
parts of the lung (y).
DD of Sonographic Cholestasis
c Left: thrombosis of the portal vein (2); hepatic artery (3). Right: thrombosis of the
intrahepatic portal veins (2) with concomitant dilatation of the intrahepatic bile
ducts (3).
► Abscess, metastases
e Diffuse liver (5) metastases (x)
d Cholangitis with intrahepatic (5) ab-
scess (a). 2 - branch of the portal vein; 6
- hepatic vein.
► Cirrhosis
f Left: macronodular (x) cirrhosis of the liver (5). Right: rather pronounced hepatic
artery (3) in known cirrhosis. 2 portal vein.
E 3.3 Parenchymatous Cholestasis
► Cirrhosis
3 Biliary Tree and Gallbladder 116
► DD fluid-filled structures
g Portal hypertension with convoluted h Segment I vein (x) of the caudate
varicosities (x) in the wall and lumen of lobe (5). 6 = inferior vena cava.
the gallbladder (7).
i Portal vein (2); variant course of the j В-mode image and color-coded visualization of the cavernous transformation of
hepatic artery (3). 6 - inferior vena the portal vein (2).
cava.
В 3.4 The Diagnosis of “Sonographic Cholestasis”
► Bile duct dilatation: shape,
location, degree, origin
Pancreas (4), liver (5), inferior vena
cava (6), gallbladder (7)
b Characteristic “double-barrel shot-
gun" sign with intrahepatic branches of
the bile ducts (1) and portal veins (3).
c Dilated prepancreatic CBD (1) with
small (inflammatory?) lymph node (x).
2 = portal vein; 3 == hepatic artery.
d Cholangiectasia with slender CBD (1)
upstream and prepancreatic distension.
2 = portal vein; 3 = hepatic artery.
e Subjective morphological dilatation
of the CBD (1) with various possible
errors in measurement. 2 = portal vein;
3 = hepatic artery (variant position).
f Acutely congested CBD (1) (errone-
ously normal diameter on measure-
ment). 2 = portal vein; 3 = hepatic ar-
tery.
В 3,4 The Diagnosis of “Sonographic Cholestasis**
► Bile duct dilatation: shape,
location, degree, origin
Pancreas (4), liver (5), inferior vena
cava (6), gallbladder (7)
h Dilated intrahepatic bile duct (1).
g Significantly (chronic) dilated intra-
hepatic and extrahepatic biliary tree
(1). 2 = portal vein.
/ Dilated intrahepatic bile ducts (1).
Left: in CCC (confirmed by needle aspi-
ration biopsy). Right: adjacent branches
of the portal vein (2) in CCC (x).
DD of Sonographic Cholestasis 117
j Dilated intrahepatic and extrahepatic
biliary tree (1) in stenosis (x) due to
tumor (CCC?). 2 = portal vein; xx * liver
cysts.
m Dilated CBD (1) due to fragmenta-
tion (x) of an intraductal calculus by
extracorporeal shock wave lithotripsy. 2
= portal vein.
к Dilated intrahepatic and extrahepatic
bile ducts (1) due to sludge (s) after
extracorporeal shock-wave lithotripsy
of a CBD gallstone. 2 - portal vein; 3 =
hepatic artery.
n Dilated CBD (1) due to nonfunctional
stent; “anterior” (x) and “posterior" (y)
wall of the stent. 2 = portal vein; 3 =
hepatic artery.
/ Obstruction of the main right (1) and
left (2) bile ducts (—♦) due to tumor,
probably CCC. 3 = hepatic artery.
о Well-differentiated cholangiocarci-
noma (initially biliary papillomatosis)
with pronounced dilatation of the CBD
(—» «—). 2 = portal vein; 3 • hepatic
artery; x = biliary stent.
p Dilatation of the intrahepatic biliary
ducts (1) in a large CCC (x).
q Moderate “double-barrelshotgun sign”
with dilatation of the intrahepatic bile
ducts (1). 2 = branches of the portal vein.
г Dilated intrahepatic CBD (1). 12*
superior mesenteric artery; x = gastro-
duodenal artery.
s Significant (chronic) dilatation of the
intrahepatic bile ducts (1).
t Maximum dilatation of the intrahe-
patic biliary tree (1) with almost lacunar
transformation.
u Maximum (long-term chronic) dila-
tation of the CBD (1). 2 = portal vein; 3 =
hepatic artery.
3 Biliary Tree and Gallbladder 118
References
1. Akhan 0, Demirkazik FB, Ozmen MN, Ariyurek M.
Choledochal cyst: Ultrasonographic findings and
correlation with other imaging modalities. Ab-
dom Imaging 1994;19:243-7.
2. Baltazar U, Dunn J, Gonzalez-Dias S, Browder W.
Agenesis of the gallbladder. South Med J
2000 93(9):914-5.
3. Bismuth H, Majno PE. Hepatobiliary surgery. J
Hepatol 2000;32(l):208-24.
3a Bismuth H, Nakache R, Diamont T. Management
Strategies in Resection for hilar Cholangiocarci-
noma. Ann Surg 1992;215:31-38.
4. Borsch G, Wedmann B, Biand J, Zumtobel V. The
significance of preoperative and postoperative
sonography for biliary tract surgery. Dtsch Med
Wochenschr !985;110(36):1359-64.
5. Braun U. Pospischil A, Pusterla N, Winder C. Ul-
trasonographic findings in cows with cholestasis.
Vet Rec 1995:137(21):537-43.
6. Campbell WL, Ferris JV, Holbert BL, Thaete FL,
Baron RL Biliary tract carcinoma complicating
primary sclerosing cholangitis: evaluation with
CT, cholangiography, US and MR imaging. Radi-
ology 1998;207( 1 ):41-50.
7. Carlo I, Sauvanet A, Belghiti J. Intrahepatic lith-
tasis: a Western experience. Surg Today
2000;30(4):319-22.
8. Contractor QQ, Boujemla M, Contractor TQ, el-
Essawy OM. Abnormal common bile duct sonog-
raphy. The best predictor for choledochohthiasis
before laparoscopic cholecystectomy J Clin Gas-
troenterol 1997;25(2):429-32.
9. Gebel M. Wagner S, Meier P, Bieck J, Manns M.
IDUS-Differentialdiagnose von Gallenwegs-
stenosen. Ultraschall in Med 1995; 16:49
10. Greiner L, Schulz HJ. Sonographie und Endosko-
pie bei Cholostase. Endoskopie heute
1999;12:24-8.
11. Greiner L, Munks C, Heil W, Jakobeit C. Gallblad-
der stone fragments in feces after biliary extrac-
orporeal shock-wave lithotripsy. Gastroenterol-
ogy 1990;98(6):1620-4.
12. Greiner L. Die Weite des D. hepatocholedochus
bei Zustand nach Cholezystektomie: Ultraschall-
diagnostik 84. Stuttgart; Thieme 1985; p. 448.
13. Greiner L. Sonographische Kontrollen nach en-
doskopischen Papillotomien sowie internen und
externen Gallenwegsdiainagen. In; Riemann JF,
Demling L (eds.). Endotherapie der Gallenweg-
serkrankungen. Stuttgart: Thieme 1985; p.
146-50.
14. Greiner L, Pilger HJ. Sonographische Kontrolle
nach EPT, PTD und endoskopisch implantierten
Gallenwegsprothesen. Leber Magen Darm
1983;13:113-6.
15. Greiner L, Prohm P. Differentiating sonographic
diagnosis of cholelithiasis. An operation con-
trolled study. Med Welt 1983;34(27):769-72.
16. Hou MF, Ker CG, Sheen PC, Chen ER. The ultra-
sound survey of gallstone diseases of patients
infected with Clonorchis sinensis in southern
Taiwan. J Trop Med Hyg 1989;92(2);1O8-11
17. hda F, Kajikawa S, Hongome N. Evaluation of
imaging examination for hepatic invasion of car-
cinoma of the gallbladder and postoperative pa-
tient outcome. J Am Coll Surg 1995; 180(1 ):72-6.
18. Ikematsu Y, Eto T, Tomioka T, Matsumoto T, Tsu-
noda T, Kanematsu T. Bihary diverticulum with
pancreaticobiliary maljunction. Hepatogasrroen-
terology 1994;41(1):70-2.
19. Jakobeit C, Greiner L. Ultrasonography and biliary
extracorporeal shock-wave lithotripsy. J Clin Ul-
trasound l993;21(4):251-64.
20. Jakobeit C. Rebensburg S, Greiner L. Sonographi-
sche Gallenstemmorphologie. Z Gastroenterol
1992;30:594-7.
21. Jansen S, Jorgensen J, Caplehorn J, Hunt D. Pre-
operative ultrasound to predict conversion in la-
parascopic cholecystectomy. Surg Laparasc En-
dosc 1997;45(3):307-9.
22. Johanns W, Greiner L. Stellenwert der Farbdop-
plersonographie beim Budd-Chiari-Syndrom. Ul-
traschall 1995;16(1 ):43.
23. Khan AN, Wilson 1, Sherlock DJ. De Krester D,
Chisholm RA. Sonographic features of mucinous
biliary papillomatosis: a case report and review of
imaging findings. J Clin Ultrasound
1998;26(3):151-4.
24. Klatskin, G. Adenocarcinoma of the hepatic duct
at its bifurcation within the porta hepatis: An
unusual tumor with distinctive clinical and
patholocial features. Am J Med 1965;38:241-56.
25. Kuo CM, Kuo CH, Changchien CS. Sequential so-
nographic changes of the gallbladder in hemo-
bilia: case report patient with intrahepatic duct
stones. Changgeng; Yi; Xue, Za; Zhi
1999;22(3)i541-5.
26. Laing FC, Frates MC, Feldstein VA, Goldstein RB,
Mondro S. Hemobiha. sonographic appearances
in the gallbladder and biliary tree with emphasis
on intracholecystic blood. J Ultrasound Med
l997;16(8):537-43.
27. Leopold GR. Ultrasonography of jaundice. Radiol
Clin North Am 1979; 17(1): 127-36.
28. Miller WJ. Sechtin AG, Cambell WL, Pieters PC.
Imaging findings in Caroli’s disease. Am J Roent-
genol 1995;165:333-7.
29. Naganuma S, Ishida H. Konno К er al. Sonographic
findings of anomalous position of the gallbladder.
Abdom Imaging 1998;23( 1 ):67-72.
30. Pezzilli R, Billi P, Barakat B. Dimperio N. Miglio F.
Ultrasonographic evaluation of the common bile
duct in biliary acute pancreatitis patients: com-
parison with endoscopic retrograde cholangio-
pancreaticography. J Ultrasound Med
l999;18(6):39l-4.
31. Rettenmeier G, Seitz KH. Ultrasonic diagnosis in
jaundice. Dtsch Med Wochenschr
1977; 102(43): 1559-60.
32. Sharma MP, Ahuja V. Aetiological spectrum of
obstructive jaundice and diagnostic ability of ul-
trasonography: a chnican’s perspective. Trop
gastroenterol 1999;20(4): 167-9.
33. Wagner S, Maschek H, Meier PN, Nashan B,
Manns MP. IDUS improves ERC in the diagnosis of
bile duct stenosis. Dtsch Med Wochenschr
1998;123:291-5.
34. Wetter LA, Ring EJ, Pellegrini CA, Way LW. Dif-
ferential diagnosis of sclerosing cholangiocarci-
nomas of the common hepatic duct (Klatskin tu-
mors). Am J Surg 1991; 161(1 ):57-63.
35. Whitaker AJ. Agenesis of the gallbladder: case
report and review of the literature. J S C Med
Assoc 1981;77(10):503-4.
36. Willi UV. Reddish JM, Teele RL. Cystic fibrosis: its
characteristic appearance on abdominal sonog-
raphy. Am J Roentgenol 1980; 134(5); 1005-10.
Gallbladder
Ch. Jakobeit
Anatomy________________________________
Size
► Length 10 cm and diameter 4 cm max.,
when fasting
Shape
► Quite variable (depends on the constitu-
tion of the patient; also numerous var-
iants)
► Fasting: ovoid, pear-shaped
► Visualization of fundus, body, and neck
Wall thickness
► Fasting 2-4 mm
► Postprandial 4-8 mm
► Single-layered wall when fasting, triple-
layered postprandially
The gallbladder is assessed according to criteria
of location, size, shape, echogenicity, and intra-
luminal material.
Size. Since the size of the gallbladder depends
on its filling volume and on stimulation by the
possible presence of food, it should be meas-
ured in the fasting state. The most reliable
measurement of the length is obtained in the
longitudinal view at the edge of the liver (in
inspiration), while the subcostal oblique view
(also in inspiration) yields the best measure-
ment for the diameter. In healthy adults, the
normal size of the gallbladder is up to 10 cm in
length and up to 4 cm in diameter. A postpran-
dial study yields excellent results for gallblad-
der function: after stimulation the volume may
[Simplified; V= LT B]
be calculated as an ellipsoid of rotation: 0.5 x
(length x width x height). The data for the
volume measurements should be obtained 20,
40. and 60 minutes after stimulation by oral
intake (Fig. 3.29).
Shape. The shape of the gallbladder depends
on the filling volume and thus varies widely.
Shape and contour of the gallbladder are
closely tied to the constitution of the patient
and the state of filling of the adjacent organs
(e.g., the intestines). With the patient fasting,
the gallbladder is most often visualized as an
ovoid or pear-shaped organ. Ultrasound can
delineate reasonably well the anatomical divi-
sions into fundus, body, and infundibulum. The
wall of the gallbladder can easily be demon-
strated as a single-layered lamina with an ap-
proximate thickness of 2-4 mm (Fig. 3.30).
Since the gallbladder does not possess any
true histological tunica submucosa and tunica
musculans, the wall in the fasting gallbladder
will appear as a single layer. Postprandial con-
traction alters the appearance of the gallblad-
der wall into triple-layering (hyperechoic in-
ner, hypoechoic center, and hyperechoic outer
layer), and the wall thickness may be up to
4-8 mm (Fig. 3.31).
Variant shapes ( 3.5). The shape of the gall-
bladder is intimately tied to its degree of filling.
The most important criterion denoting a
healthy gallbladder is a wall smoothly and
clearly demarcated from the hepatic fossa as
well as the lumen. In many instances, precise
< Fig. 3.30 Longitudinal section through a typical gall-
bladder in the fasting state. The wall is well demar-
cated from the liver as a 2 mm single- layered lamina.
measurements of the wall can only be taken on
the hepatic side. Changes in shape and contour
may be focal (more frequent) or diffuse. Posi-
tion-induced foldover (в 3.5a) will recede
when being checked with the patient in a dif-
ferent position or while standing and can
therefore be separated from true septation
(3 3.5b-e). Most true septa are found in the
neck and fundus, and the caplike septation in
the latter is called “Phrygian cap” (в 3.5 f).
This region may be difficult to assess be-
cause of the proximity of the intestines. A
subtle ultrasound study employing views of
different orientation (during inspiration and
after patient repositioning) is vital if any calculi
hidden here are to be demonstrated. Tortuous
or corkscrew-like gallbladders are known con-
genital variants. Multiple septa of the gallblad-
der are infrequent findings, and so are diver-
ticula and doubling (B 3.5g-i).
Cystic duct. Demonstration of the cystic duct is
easiest during deep inspiiation (supine or left
lateral decubitus). With subtle shifts of the
probe, the cystic duct is visualized beginning
from the infundibulum of the gallbladder. The
distal segment of the cystic duct, most often
joining the hepatic duct at the posterior aspect,
is best demonstrated (by compression techni-
que) with the patient supine in the plane
through the hepatic portal, where it is anterior
to the portal vein. The cuspidal junctional folds
primarily found at the infundibulum are with-
out pathology and are known as the spiral
valve of Heister (Fig. 3.32).
« Fig. 3.29 Calculating the volume of the gallbladder
Transverse view
' ~ T .
DD of Sonographic Cholestasis 119
3 Biliary Tree and Callbladder 120
Fig. 3.31 Contracted gallbladder.
о Characteristic postprandial visualization.
< b Checking the gallbladder function (after oral in-
take). Very well contracted, triple-layered postpran-
dial wall, clearly demarcated from the liver and the
lumen.
л Fig. 3.32 Cystic duct.
о Spiral valve of Heister at the junctional segment of
the cystic duct origin.
л b Optimized visualization of the cystic duct with the
spiral valve of Heister.
a c Junction of the cystic duct at the posterior aspect
of the common hepatic duct. DHC = common hepatic
duct; DC = distal bile duct; DCY = cystic duct.
Topography-----------------------------------------------------------------------------
When looking for the gallbladder, useful land-
marks are the hepatic portal and the edge of
the right hepatic lobe (paramedian view)
(Figs. 3.33 and 3.34). During deep inspiration
the gallbladder may easily be demonstrated
anterior to the vena cava (the probe being
tilted somewhat to the median plane). In the
subcostal oblique view the landmark structure
to be used is the interlobar Fissure, which can
be visualized in almost all patients, and the
gallbladder will be found by aligning the probe
with the fissure and then tilting it caudad. The
gallbladder will be located inferior or lateral to
the fissure (between liver segments IV and V).
Landmark structures
► In the paramedian view: hepatic portal
and the edge of the right hepatic lobe
► In the subcostal oblique view: interlobar
fissure
a Fig. 3.33 Schematic illustration of the relationship
between the gallbladder and its adjacent organs.
a Fig. 3.34 Relationship of the gallbladder (GB) to the
duodenum.
о The posterior wall of the body of the gallbladder is
indented by the distended atonic duodenal bulb
(DUO).
a b ERCP image of the bile duct, gallbladder, and du-
odenum. The longitudinal axis of the gallbladder is
directed inferiorly and slightly to the right.
3.5 Variant Shapes of the Callbladder
► Septations, kinking
о Foldover (pseudo-septation): in su-
pine position a seeming septation in the
body is seen as a normal body demon-
stration in a left lateral decubitus posi-
tion.
f Phrygian cap.
d Furrow: when supine (right), a
seeming septum in the body, which
recedes almost completely in left lateral
decubitus position (left); now, only a
slight furrow (arrow) with pseudosep-
tum remains.
b and c True septation: even after repositioning into left lateral decubitus, the
septum in the neck of the gallbladder persists.
DD of Sonographic Cholestasis
e Septation of the gallbladder. Longi-
tudinal scan through the upper abdo-
men shows an echogenic ridge (arrow)
dividing the gallbladder (GB) into two
incomplete compartments. Septation
makes the gallbladder prone to 1 ithiasis,
as in this case. D = duodenum.
► Torsion, malformation,
doubling
h Diverticula (D). GB = gallbladder.
g Torsion and lateral displacement of
the gallbladder (GB); stones (arrows).
S = acoustic shadow (harmonic imag-
ing).
i Duplicated gallbladder (GB).
Longitudinal scan: longitudinal septa-
tion.
Transverse scan: gallbladder (GB) is
completely divided in two. The small
second gallbladder has a separate duct
(arrows, left).
Changes in Size
Large Gallbladder (> 10 cm)
▼ Changes in Size
Large Gallbladder
► Small/Mlssing Gallbladder
► Wall Changes
► Intraluminal Changes
► Nonvlsuallzed Gallbladder
► Asymptomatic (Functional)
► Asymptomatic (Pathological)
► Symptomatic (Pathological)
► Asymptomatic (Functional)
A large flaccid gallbladder with normal wall
(and a large volume of fluid) may be demon-
strated as a variant in the asthenic patient or as
an atonic sequel of long-term total parenteral
nutrition (Fig.3.35). Long periods of fasting
may also result in a large, functionally flaccid
gallbladder, not infrequently with intraluminal
sludge (viscous bile or microliths) (Fig. 3.36a).
Passing, and in case of permanent dysfunction
of the gallbladder even persistent, sludge for-
mation may be demonstrated in patients with
atonic/hypotonic gallbladder function after ab-
dominal surgery as well as in abdominal dis-
orders accompanied by various organ dysfunc-
tions (e.g., GI tract infection, hepatitis, pancrea-
titis, peritonitis, ileus). Metabolic disorders
with abdominal manifestation (for instance,
diabetes mellitus, polyneuropathy) may also
effect large atonic gallbladders with or without
sludge (Fig. 3.36b). In contrast to inflammatory
gallbladder disease, here the gallbladder does
not exhibit any tenderness on palpation (neg-
ative ultrasonic Murphy’s sign), and on ultra-
sound the wall appears normal. Another im-
portant criterion for differentiation from chol-
ecystitis is the lack of tense gallbladder disten-
sion (hydrops).
a Fig.3.35 Large flaccid gallbladder (congenital var-
iant). Characteristic: normal wall and texture, an-
echoic intraluminal material.
a Fig. 3.36 Flaccid gallbladder.
a After parenteral nutrition: normal wall, possibly
intraluminal sludge.
a b Flaccid gallbladder in diabetes mellitus with con-
current polyneuropathy. Afunctional gallbladder filled
with sludge (“hepatized gallbladder").
► Asymptomatic (Pathological)
The large still-functional gallbladder has to be
differentiated from the large pathological
specimen. Gallbladder size alone is insufficient
to differentiate between dysfunction and
pathological outflow obstruction. One such
classic criterion in this differential diagnosis is
the tense distension of the gallbladder, or hy-
drops. The nature of the outflow obstruction
(obstruction of the cystic duct due to, e.g., cal-
culus or tumor of the cystic duct, CBD, or pan-
creas) with enlarged palpable hydropic gall-
bladder (Courvoisier’s sign) can be differenti-
ated by subtle ultrasound study (Figs. 3.37 and
3.38). For optimum visualization of the cystic
duct the patient should be supine, while the
proximal CBD is best demonstrated in the left
lateral decubitus position.
a Fig. 3.37 Hydropic gallbladder (GB) (with dependent
sedimentation: S hepatic artery) in cystic duct ob-
struction. Gallbladder wall normal.
a Fig. 3.38 Gallbladder hydrops associated with a tu-
mor of the pancreatic head/common bile duct. The
Courvoisier’s sign is typical: palpable, tense, non-
tender gallbladder.
► Symptomatic (Pathological)
Symptomatic hydrops of the gallbladder is one
of the main criteria in cystic duct obstruction
due to gallstones and is characterized by a
tensely distended gallbladder tender on palpa-
tion. In the early phase of acute calculous cystic
duct obstruction, the concurrent cholecystitis
may not be manifest (Fig. 3.39). However, the
classic case does exhibit the combination of
cholecystolithiasis and cholecystitis (Fig.
3.40). The sonographic Murphy’s sign (gall-
bladder tender on palpation under ultrasonic
guidance during inspiration) is quite character-
istic. After oral intake the gallbladder does not
contract.
* Fig.3.39 Hydropic gallbladder without cholecystitis
in calculous obstruction of the cystic duct/CBD.
о Major criterion of floating gallstone with intermit-
tent impaction, no wall thickening.
л b Calculus obstructing the cystic duct not visible;
normal gallbladder wall, gallbladder tensely dis-
tended, round, tender on palpation, partially filled
with sludge.
a Fig. 3.40 Hydropic gallbladder with cholecystitis in
cholecystolithiasis/cholangiolithiasis. Typical sono-
graphic Murphy’s sign: distended gallbladder tender
on ultrasound guided palpation.
Small/Missing Gallbladder_________________________________________________
► Asymptomatic (Functional)
► Asymptomatic (Pathological)
► Symptomatic (Pathological)
► Asymptomatic (Functional) ________________________________________________________
Agenesis of the gallbladder is an extremely rare
finding (< 0.1%) (Fig.3.41 a). Congenital hypo-
plasia of the gallbladder is also rather rare. If
agenesis of the gallbladder is suspected, one
should assiduously look for a dystopic gallblad-
der (e.g., an atypical intrahepatic gallbladder or
one hyperextending all the way into the minor
pelvis). A completely empty postprandial (or
intrahepatic gallbladder) may also be quite
hard to visualize (cf. '’Nonvisualized Gallblad-
der,” p. 137 ff). A gallbladder completely void of
fluid is characterized by homogeneous triple-
layering of the wall (Fig. 3.41b).
a Fig. 3.41 a Agenesis of the gallbladder. Previous ul-
trasound and CT studies diagnosed an atrophic gall-
bladder; surgery demonstrated agenesis of the gall-
bladder. A = antrum, DHC = common bile duct, VP =
portal vein.
a b Postprandial gallbladder with minimum fluid. After
oral intake the gallbladder may be void of any fluid.
This state is characterized by a smooth wall echo with
homogeneous triple-layered foldover.
► Asymptomatic (Pathological)
3 Biliary Tree and Callbladder 124
The postprandial contracted gallbladder should
be differentiated from the asymptomatic cystic
duct obstruction with a gallbladder persis-
tently void of any fluid (Fig. 3.42).
Gallbladders with low fluid levels and con-
current wall edema are found in severe non-
biliary disorders (Table 3.1). They are charac-
terized by a diffuse swelling in the wall, some-
times more pronounced in the fundus, which is
hypoechoic or mixed hypoechoic and hyper-
Table 3.1 Callbladder changes in nonbiliary disorders
Right-sided heart fail- Cirrhosis of the liver Severe malabsorption Acute hepatitis
иге
Size
Shape
Wall
Surroundings
Normal or enlarged
Normal or little fluid
Smooth hypoechoic wall
thickening
Signs of cardiac conges-
tion
echoic, and cleanly demarcated from the lumen
as well as the outside. If these criteria are dem-
onstrated, the ultrasound study should concen-
trate on the underlying disease; typical exam-
ples are cirrhosis of the liver, right-sided heart
failure, acute hepatitis, or severe renal failure.
Severe hepatic dysfunction with insufficient
secretion of the bile (e.g., in cirrhosis) may
decrease the filling volume of the gallbladder
and result in wall edema due to hypoalbumi-
More likely small
Normal or little fluid
Smooth hypoechoic wall
thickening, possibly vari-
cose veins
Ascites
nemia (Fig. 3.43). Inflammatory lymph nodes
along the hepatoduodenal ligament are fre-
quent findings in acute chronic hepatitis. Hy-
poechoic increases in the wall thickness ac-
companied by loss of fluid are characteristic
for the severe hypoalbuminemia in renal fail-
ure or intestinal protein loss as well as for
massive chronic cardiac congestion. In these
cases hepatomegaly is another regular finding.
Normal or enlarged
Smooth or rippled
Wall thickening of mixed
echogenicity
More likely small
Ovoid, little fluid
Smooth hypo- or hyper-
echoic wall thickening
Edema of the intestinal wall Lymph nodes
a Fig. 3.42 Completely folded-over gallbladder wall
(without calculus); the underlying gallstone obstruc-
ting the cystic duct is not depicted in this image.
a Fig. 3.43 Gallbladder with little fluid and edema of the wall in cirrhosis of the liver with dysproteinemia. In
nonbiliary disorders the hypoechoic increase in wall thickness with decreased fluid level is a typical phenomenon.
► Symptomatic (Pathological)_________________________________________________________________________
Most fasting gallbladders with low or no fluid
levels result from cystic duct obstruction
(Fig. 3.42).
Inflammatory atrophy of the gallbladder
with its lack of fluid is usually caused by
chronic cholecystitis, where the shape of the
gallbladder is irregular and its wall thickened
and inhomogeneous (hyperechoic) (Figs. 3.44
and 3.45). During acute exacerbation, hypoe-
choic areas in the wall may also be visualized. A
typical finding would be several, sometimes
even encrusted, intraluminal gallstones. In the
end the atrophic gallbladder can only be iden-
tified by the enciusted calculi within the scar
tissue.
This contracted gallbladder with its gall-
stones is characterized by a crescent-shaped
band of echoes without demonstration of the
posterior wall. Sometimes even the anterior
wall with its scar contraction may hardly be
delimited from the gallstone echoes (Fig.3.45).
In these patients, differentiation of a possible
concurrent gallbladder carcinoma can be prob-
lematic. The differential diagnosis should in-
clude rare causes such as radiation injuries
and traumatic lesions (Fig. 3.45a-c).
a Fig. 3.44 Inflammatory atrophic gallbladder. Atro-
phied gallbladder (GB) void of any fluid.
Fig.3.45 о Calculous atrophied gallbladder. The
atrophied gallbladder is visualized as a crescent-
shaped band of echoes in the hepatic fossa with ill-
defined contour of the anterior wall. Usually, the
posterior wall cannot be demonstrated due to pos-
terior shadowing (S) of the gallstones.
Wall Changes
a b and c Gallbladder with wall thickening and scant
fluid.
b Radiogenic wall thickening (cursors) of the gall-
bladder (GB) and duodenum (D) after radiotherapy
for pancreatic head carcinoma.
c Traumatic gallbladder contusion: massive wall
edema effacing the lumen.
a d Traumatic wall thickening (with initial obstruction
of the lumen) as part of a contusion; sparse vascula-
rization in color-flow Doppler scanning.
Wall Changes
General Hypoechogenicity_______________________________________________
► Acute Cholecystitis
► Special Cases
► Wall Thickening in Hepatic/Pancreatic Disorders and Trauma
► Acute Cholecystitis____________________
Acute and chronic cholecystitis is characterized
by uneven thickening of the gallbladder wall
with irregular echo pattern. The typical finding
in acute cholecystitis is the tensely distended
afunctional/dysfunctional gallbladder with its
hypoechoic wall that is tender on palpation
(positive Murphy’s sign). Another sign is the
ill-defined intraluminal and extraluminal con-
tour of the wall, accompanied by hypoechoic
inflammation of the surrounding tissue (peri-
cholecystitis). Ultrasound morphology of the
gallbladder wall spans the spectrum from dif-
fuse hypoechoic thickening with poorly delim-
ited contour of the wall through hypoechoic
necrosis all the way to complete destruction
of the wall (E 3.6a, b; see Table 3.2). Intra-
luminal hyperechoic or inhomogeneously
echogenic material can point the way to the
diagnosis of cholecystic empyema.
Advanced and severe courses of acute chol-
ecystitis may result in necrosis of the mucosa
and filiform detachment of the tunica mucosa
(E3.6d). Usually, these cases present with
hyperechoic inhomogeneous necrotic debris
within the gallbladder. A pericholecystic film
is typical of localized perforation (E 3.6c
and d). Lacehke structures with hypoechoic
necrotic areas are infrequent findings.
Imminent perforation may be preceded by
ascites, ulcers of the gallbladder wall, or peri-
cholecystic infiltrates/abscesses (B 3.6e). Hy-
pervascularization of the gallbladder wall in
color-flow duplex scanning of cholecystitis is
by no means mandatory. The histological grad-
ing of edematous, phlegmonous, and gangre-
nous cholecystitis cannot be differentiated all
that well by ultrasound
► Special Cases_____________________________________________________________________________________
3 Biliary Tree and Gallbladder 126
Emphysematous cholecystitis. The character-
istic sign of emphysematous cholecystitis is
intraluminal and intramural gas (from infection
by gas-producing pathogens) (3 3.6f and g).
Acalculous and xanthogranulomatous
cholecystitis. Other special cases are acalcu-
lous (3 3.6h) and xanthogranulomatous
(B 3.6i and j) cholecystitis. Acalculous chole-
cystitis is a typical disorder in the immuno-
compromised patient in the intensive care
unit or after chemotherapy. It is characterized
by a gallbladder that is tender on palpation,
with edema of the wall and possible sludge.
In large hydropic gallbladders, ultrasound
may only demonstrate slight thickening of the
wall despite the presence of phlegmon. Xan-
thogranulomatous cholecystitis, on the other
hand, is characterized by pseudotumorous
thickening of the wall with loss of the usual
Table 3.2 Differentiating cholecystitis
Acute cholecystitis Chronic cholecystitis
Size Large Normal or atrophied
Shape Irregular Round
Echogenicity Hypoechoic—layered Hyperechoic
Lumen Large, calculi Small or lacking
Wall Thickened Thickened
layering. This entity is almost impossible to
differentiate from gallbladder carcinoma on
the basis of sonographic morphology alone.
S 3.6 Acute Cholecystitis: Complications and Special Cases
a Acute cholecystitis. Hypoechoic rim
around the gallbladder (GB, cursors). L =
liver. Positive Murphy’s sign.
b Acute phlegmonous cholecystitis in
cholecystolithiasis (vertical arrows,
acoustic shadow S). Laminar wall
thickening (cursors) with edema in the
gallbladder bed of the liver (horizontal
arrows). GB = gallbladder.
d Perforated gallbladder, gallbladder
empyema (GB). Harmonic imaging. The
perforation site (arrows) is clearly de-
fined. FL = perivesicular biliary fluid.
Upper abdominal longitudinal scan.
e Perforated gallbladder: phlegmonous
gallbladder with filiform desquamation
and extensive pericholecystic intraper-
itoneal fluid (bile).
f Empyema of the gallbladder with ex-
tensive cholecystitis and pericholecystic
abscess.
g Emphysematous cholecystitis: ex-
tensive intramural gas collection in
emphysematous cholecystitis.
h Emphysematous cholecystitis with
mild gas formation: difficult study con-
ditions may render the diagnosis more
problematic (image courtesy of Dr. WB
Stelzel, Frankfurt, Germany).
i Acalculous cholecystitis in an ICU pa-
tient with total parenteral nutrition:
gallbladder tender on palpation, with or
without sludge and wall edema.
i and j Xanthogranulomatous cholecystitis: rare special case with tumorlike thick-
ening of the gallbladder wall and complete loss of normal wall layering (image
courtesy of Dr. WB Stelzel, Frankfurt, Germany).
к Intensive complex thickening of the
gallbladder wall without fluid in acute
hepatitis and AIDS
/ Concurrent inflammatory wall thick-
ening in an acute episode of chronic
pancreatitis; perihepatic fluid film (ar-
rows); surgery did not yield any gall-
stones.
Wall Thickening in Hepatic/Pancreatic Disorders and Trauma
The differential diagnosis of cholecystic wall
changes has to include not only calculous chol-
ecystitis but also wall thickening secondary to
acute hepatitis, decompensated cirrhosis of the
liver, and acute episodes of (chronic) pancrea-
titis (a 3.6kt I).
General Hyperechogenicity_______________________________________________
Wall Changes
► Chronic Cholecystitis
► Porcelain Gallbladder
► Chronic Cholecystitis_________________
Chronic cholecystitis is accompanied by hyper-
echoic thickening of the gallbladder wall, span-
ning the gamut from barely noticeable to pro-
nounced callous thickening. After oral intake
these gallbladders present as dysfunctional or
even afunctional organs. In the early stages of
chronic inflammation the luminal wall displays
not only areas of scarred hyperechoic thicken-
ing but also acutely inflamed (hypoechoic) le-
sions of the mucosa. The terminal stage of
chronic scarred cholecystitis is characterized
by extensive callous (hyperechoic) thickening
of the wall with complete loss of layering. The
differentiation between acute and chronic
cholecystitis is listed in Table 3.2.
Mirizzi syndrome. If the inflammatory
changes induced by a stone impacted in the
neck of the gallbladder spread beyond the bor-
der of the gallbladder onto the hepatic portal,
leading to obstruction of the CBD, this may
result in Mirizzi syndrome (Fig. 3.46).
Cholelithic gallbladder perforation. Spon-
taneous perforation of calculi into the gastro-
intestinal tract is a rare complication of chronic
cholecystitis. Fecal studies have demonstrated
spontaneous passage of stones up to 5.7 cm in
diameter. Most often the stones perforate from
the gallbladder into the duodenum (52%); per-
foration into the stomach occurs rather infre-
quently (approx. 3%), while the remainder of
the GI tract is affected in 45% of cases. The
ultrasound signs of a perforated stone are its
atypical anatomical location, gas echoes (pneu-
mobilia) (Table 3.4) within the lumen of the
gallbladder (may not be present in case of fis-
tulas), demonstration of a fistula, and atrophic
gallbladder with visualization of calculi
(Figs. 3.47 and 3.48).
a Fig. 3.46 Mirizzi syndrome: calculus impacted in the
neck of the gallbladder, with adjacent inflammation
and dilatation of the CBD.
a Fig.3.47 Gallstone perforation from the gallbladder
into the gastric antrum.
a Barrel-shaped gallstone impacted in a fistula (ar-
row) between gallbladder and gastric antrum.
a b Successful disintegration of the calculus into multi-
ple fragments after extracorporeal shock-wave litho-
tripsy
3 Biliary Tree and Callbladder 128
« Fig. 3.48 Cholecystoduodenal gallstone perforation.
a Barrel-shaped gallstone impacted in the duodenal
bulb after perforation through the gallbladder wall.
•« b Successful shock-wave lithotripsy with spontane-
ous passage of the fragments, now with demonstra-
tion of a wide hyperechoic fistula (arrow) between
the atrophied gallbladder and the duodenal bulb
(fluid-filled gastric antrum).
► Porcelain Callbladder
Porcelain gallbladder is considered a precan-
cerous condition because in 10-60% of all cases
gallbladder carcinoma will develop. Porcelain
gallbladder is characterized by intramural
shell-like calcification that may affect the en-
tire wall or (more commonly) just parts of it (e.
g.t the fundus) (Figs. 3.49a and b, 3.51). De-
pending on the thickness of the calcified layer,
the gallbladder wall may be sonolucent. In
cases of severe calcification, any ultrasound
differentiation of possible malignancy may
prove to be infeasible. In the diffuse type there
is complete calcification of the gallbladder wall,
which may not be penetrated by the ultra-
sound beam in severe cases. If porcelain gall-
bladder is suspected, a plain film of the gall-
bladder should be obtained (Fig.3.49b).
л Fig. 3.49 a Classic diffuse porcelain gallbladder: visu-
alization of a broad calcified intramural crescent.
л b Plain film of the gallbladder: typical radiographic
image of diffuse porcelain gallbladder.
Focal Hypoechogenicity/Hyperechogenidty
► Intraluminal Changes
► Nonvisualized Gallbladder
— ► Focal Inflammation
► Gallbladder Varicosity
► Focal Inflammation______________
Based on the morphology of the outflow ob-
struction in gallbladder anomalies, the inflam-
matory changes of the gallbladder wall may be
focal (e.g., inflammation of the fundus in Phry-
gian cap). The sonographic morphology of focal
inflammatory lesions resembles that of the dif-
fuse changes (Fig. 3.50). Just as in diffuse calci-
fication, focal calcium deposits are classified as
porcelain gallbladders (see above) (Fig. 3.51).
Cholecystitis in focal porcelain gallbladder
may be hard to differentiate.
Fig. 3.50 Focal cholecystitis (in Phrygian cap).
◄ Fig.3.51 Porcelain gallbladder with sonolucent wall:
fine focal calcification of the fundus wall with trans-
lucent lumen of the gallbladder and identifiable
cholecystolithiasis (with sludge) (image courtesy of
Dr. WB Stelzel, Frankfurt, Germany).
Wall Changes 129
► Gallbladder Varicosity_________________________________________________________________________
When hypoechoic tubular intramural and ex-
tramural changes in the gallbladder wall are
encountered, the differential diagnosis should
include varicosity (Fig.3.52 and Fig. 1.99b,
p. 44). It is characteristic of portal hypertension
(in prehepatic or posthepatic block). The sus-
pected diagnosis is confirmed by color-flow
duplex scanning (Table 3.3). This modality is
also important in preoperative delineation of
vascular anomalies. Its application in the differ-
entiation of a benign polypoid mass (perfusion
of the stalk in adenomas) from a malignancy is
still experimental (Table 3.3).
a Fig. 3.52 Thickening of the gallbladder wall.
о Portal venous collaterals in the gallbladder wall.
a b Thickened gallbladder wall in cholecystolithiasis.
Stone shadow, with wall above thickened to 8 mm.
Color duplex scan shows aberrant spotlike tumor
vessels (arrows). Operative treatment. Histology: car-
cinoma.
Table 3.3 Color-flow duplex scanning in gallbladder disease
► Vascular anomalies in the hepatoduodenal ligament before surgery
► Varicosity of the gallbladder wall
► Perfusion of the polyp stalk (experimental)
► Vascularization of tumors (experimental)
General Tumor____________________________________________________________
— ► Adenomyomatosis
► Cholesteatosis
► Gallbladder Carcinoma
3 Biliary Tree and Gallbladder 130
► Adenomyomatosis__________________
Adenomyomatosis is a special case of gallblad-
der cholesteatosis and belongs to the group of
hyperplastic cholecystoses. It appears as a hy-
perechoic tumorous thickening of the wall
(generalized or focal), originating from hyper-
trophied Rokitansky-Aschoff sinuses. This dis-
order is characterized by coexistent cholesterol
deposits (with their typical comet-tail like ar-
tifacts) and cystic intramural inclusions
(Fig. 3.53, Table 3.4).
< Fig. 3.53 Adenomyomatosis: typical comet-tail pat-
tern (arrows) caused by cholesterol deposits. Wall
thickening and large pseudodiverticula (D). GB =
gallbladder.
Table 3.4 Comet- tail-like artefacts in gallbladder ultrasound
Emphysematous chole- cystitis Cholesteatosis Adenomyomatosis Microliths Pneumobilia
Size Large Normal Normal or smaller Normal Normal
Shape Round Normal Hourglass furrows Normal Normal
Lumen Sludge Normal Constricted Floating (calculi < 5 mm) Normal
Wall Hypoechoic wall thicken- ing Often normal or slightly thickened Hyperechoic, thickened, cystic inclusions Normal Normal
Comet-tail- like artifacts Intramural or intraluminal gas collections Intramural, partly few, partly diffuse Locali ed, intramural or dif- fuse Floating in the lumen Position-depen- dent gas collections
at the anterior wall
► Cholesteatosis____________________________________________________________________________________
Adenomyomatosis should be differentiated
from cholesteatosis (strawberry gallbladder),
which is also characterized by numerous
comet-tail-hke artifacts but mostly without
the wall thickening (Fig. 3.54).
a Fig. 3.54 a Cholesteatosis (“strawberry gallbladder"):
classic intramural hyperechoic “spotted" echoes with
comet-tail-like artifacts. GB = gallbladder.
a b Twinkling artifact in the region of comet-tail arti-
facts.
► Callbladder Carcinoma________________________________________________________________________________________
General adenomyomatosis should also be dif-
ferentiated from diffuse infiltrating gallbladder
carcinoma, although the latter completely de-
stroys the regular wall layering (see Fig. 3.63).
Gallbladder carcinoma lacks the Rokitan-
sky-Aschoff sinuses and intramural comet-
tail-like artifacts.
Focal Tumor
► Cholesterol Pseudopolyps
► Adenomas and Papillomas
► Adenomyomatosis
► Gallbladder Carcinoma
► Metastasis
Walt Changes
In order of frequency, focal changes in the
gallbladder wall are mural polypoid lesions,
partial wall thickening, and infiltrating lesions.
► Cholesterol Pseudopolyps________________________________________________________________
Cholesterol pseudopolyps are the most fre-
quently demonstrated. They are hyperplastic
polypoid neoplasms, usually hyperechoic,
smoothly contoured, round or ovoid. Some-
times they are visualized as small hyperplastic
(often hyperechoic) tumors, pendulating from
the gallbladder wall, that may display a short
stalk (hypoechoic lobulation is rather rare).
Usually, their size is less than 6 mm and they
are found in multiples (Figs. 3.55-3.57). The
gallbladder wall always appears normal. Cho-
lesterol polyps measuring more than 1 cm in
diameter are the exception and therefore
should undergo surgery.
a Fig. 3.55 Cholesterol pseudopolyp: characteristic vis-
ualization of a hyperechoic 5 mm cholesterol pseu-
dopolyp at the floor of the gallbladder.
a Fig. 3.56 Cholesterol pseudopolyps. Multiple small
sessile hyperechoic polyps of 3-5 mm at the gallblad-
der wall (some with longer stalks).
a Fig.3.57 Characteristic sonographic morphology of
five hyperechoic cholesterol pseudopolyps of less
than 5 mm diameter.
► Adenomas and Papillomas____________________________________________________________________
Adenomas. Compared with the more common
cholesterol pseudopolyps (> 1% of the popula-
tion) adenomas are infrequent findings
(Figs. 3.58-3.60). Usually, they are hypoechoic
sessile structures resting on the intraluminal
wall and are frequently found in the neck of
the gallbladder. Their size is mostly > 10 mm.
Because of the known adenoma—* carcinoma
sequence they have to undergo surgery.
Papillomas. The differentiation of adeno-
mas from papillomas relies on the fact that
papillomas tend to be pedunculated, displaying
a tabulated surface. Papillomas tend to be lo-
cated at the fundus and usually are hypoechoic
(Fig. 3.61, Table 3.5). All polyps are easily dif-
ferentiated from calculi by their sessile growth,
although sometimes viscous pseudopolypoid
sludge may mimic a polyp.
* Fig. 3.58 Pedunculated adenoma of about 2 cm
(confirmed histologically) in the body of the gall-
bladder.
3 Biliary Tree and Gallbladder 132
« Fig. 3.59 a Sessile adenoma: sessile adenoma of
about 2 cm diameter in the body of the gallbladder.
* b On spectral analysis, the color-flow signals can
definitely be assigned to vessels, ruling out a tumor
or sludge.
a Fig. 3.60 Polypoid adenoma (cursors). Intact wall, no
detectable invasion GB = gallbladder.
a Fig. 3.61 Papilloma
о Lobulated papilloma of the body of the gallbladder
with a diameter of about 1.2 cm.
a b Zoomed detail.
Table 3.5 Focal intraluminal polypoid wall changes
Cholesterol pseudopolyp Adenoma Papilloma Carcinoma
Size Often 2-6 mm and multi- ple, rarely > 8 mm Solitary, often > 1 cm Solitary, > 7 mm Solitary, > 1-2 cm
Shape Mostly round, sometimes bizarre, short stalk Sessile, polypoid, or superficial Lobulated Polypoid
Echogenicity Mostly rather hyperechoic Usually hyperechoic Rather more hypoechoic Hypoechoic, inhomoge- neous
Wall Regular Normal Normal Infiltrated
Location Varying Rather more in the neck Rather more in the fundus Varying
► Adenomyomatosis-----------------------------------------------------------------
A good example of partial wall thickening is
adenomyomatosis, which may also present as a
hyperechoic focal lesion (Fig. 3.62a). Combined
with the focal cystic inclusions and the classic
comet-tail-like artifacts, the focal hypertro-
phied Aschoff-Rokitansky sinuses will round
out the characteristic image in sonographic
morphology. In focal adenomyomatosis the
gallbladder may undergo segmental constric-
tion (hourglass gallbladder) (Fig.3.62b).
a Fig. 3.62 Adenomyomatosis (focal and segmental).
о Typical adenomyomatosis of the fundus (“fundus
adenoma"): hyperechoic wall thickening with hypo-
echoic inclusions (here no comet-tail-like artifacts).
a b “Hourglass gallbladder” in adenomyomatosis. In
segmental adenomyomatosis the gallbladder displays
segmental constriction at the body.
► Gallbladder Carcinoma
Every polypoid mass of irregular shape within
the lumen of the gallbladder as well as every
infiltrating lesion with destruction of the nor-
mal wall should be highly suspicious for gall-
bladder carcinoma. In the early stages (still
manageable by surgery), gallbladder carcinoma
is clinically quiescent and will typically present
in two manifestations: polypoid carcinoma,
mostly filling the lumen: or primarily diffuse
infiltrating carcinoma, with destruction of the
normal texture of the gallbladder wall as well
as early invasion of the surrounding tissue
(Fig. 3.63). The delineation between the mostly
hypoechoic infiltrates and the hepatic paren-
chyma may be ill defined (Fig.3.63c and e).
Local lymph node metastasis takes place at an
early stage. Histologically, it is a scirrhous ad-
enocarcinoma. Gallstones and chronic chole-
cystitis play an important role in the carcino-
genesis: 2-3% of gallstone carriers will develop
a carcinoma of the gallbladder.
л Fig. 3.63 Gallbladder carcinoma.
a Carcinoma of about 1 cm—with the appearance of
a large polyp—in the neck of the gallbladder (image
courtesy of Dr. WB Stelzel. Frankfurt, Germany).
л b Carcinoma of the fundus: hypoechoic adenocarci-
noma with segmental infiltration of the fundus and
body of the gallbladder.
л c Polypoid infiltrating carcinoma of the body: hypo-
echoic carcinoma with impacted gallstone, infiltrat-
ing diffusely from the body of the gallbladder into the
liver; ill defined delineation between wall and liver
parenchyma.
Wall Changes 133
л d Invasive gallbladder carcinoma (T). Carcinoma in-
filtrating the liver from the body of the gallbladder,
displacing the bile duct (G). Color duplex. VP = portal
vein.
a e Tumor invading the porta hepatis, with cutoff of
the hepatic duct (DH, arrow). VP = portal vein.
a f Differential diagnosis of carcinoma: severe chole-
cystitis with inflammatory matting (indistinct mar-
gins). Echogenic luminal change, presumed infiltra-
tion. GB = gallbladder.
► Metastasis___________________________________________________________________________________
Metastases in the wall of the gallbladder and
hepatic metastases infiltrating the gallbladder
from the liver may mimic primary carcinoma
of the gallbladder wall and do not display
any characteristic ultrasound morphology
(Fig. 3.64). Metastasis in the gallbladder wall
is a rare finding and cannot be clearly differ-
entiated by sonography from true gallbladder
carcinoma.
* Fig. 3.64 Metastasis in the gallbladder wall: large
hypoechoic metastasis of breast cancer in the gall-
bladder wall, infiltrating the lumen as well as the
liver.
Intraluminal Changes
3 Biliary Tree and Gallbladder 134
Hyperechoic____________________________________________________________
► Gallstones
► Callstones_____________________________
Gallstones are the classic example of mobile
changes within the gallbladder. The well-
known mnemonic of "the five Fs"—fat, female,
fertile, forty, fair—characterizes the segment of
the population most at risk for cholecystoli-
thiasis.
The typical gallbladder stones are mobile
and differ in their extent of posterior shadow-
ing (depending on the size of the calculus) as
well as in their intrinsic pattern (И 3.7). The
sonographic morphology of the stones depends
on their size, shape, and composition. Usually,
the gallstones are a mixture of cholesterol, cal-
cium, and bilirubin and are located at the most
dependent part of the gallbladder. When look-
ing for calculi it should be remembered that
with the patient supine the stones are more
likely to be found in the neck of the gallbladder,
while in left lateral decubitus position they
tend to collect in the region of the fundus/
body (a 3.7a-c). Fairly large pure cholesterol
stones (up to 60 mm) may float in the liquid
bile.
Shadowing can be observed in gallstones
with a diameter down to about 2-3 mm, de-
pending on the quality of the stone as well the
equipment used and the frequency employed.
Calculi with a diameter of less than 5 mm are
called microliths. From a diameter of 8 mm and
upward, subtle differentiation of the gallstones
into cholesterol, calcium, and pigmented cal-
culi usually does not present any problem. In
microliths with a diameter < 5 mm. assessment
of the intrinsic echo pattern may become diffi-
cult. Here, additional data such as tabular struc-
ture and comet-tail-like artifacts as well as any
flotation of the stones (rich in cholesterol) and
their size and shape (usually hyperechoic mi-
croliths dependent in the gallbladder are of
mixed calcium make-up) have to be taken
into account (Table 3.4). Ultrasound morphol-
ogy is essential when planning possible lysis or
shock-wave lithotripsy.
Differentiating gallstones. The criteria for
differentiating gallstones are their intrinsic
echo pattern, surface echo, and posterior shad-
owing ( 3.7d-i). Although gallstones are best
visualized at the focus of the transducer, the
quality and settings of the platform used are
eminently important as well. Optimized diffei-
entiation of the calculi is possible only if the
transmission power matches the situation at
hand.
Hypoechoic___________________________________________________________
— ► Gallbladder Sludge
► Hemobilia
► Callbladder Sludge_____________________________________________________________________________
Sludge formation in the gallbladder depends
on bile concentration, changes in crystalliza-
tion, and desquamation. The presence of sludge
is marked by a hypoechoic layer, or one of
mixed echogenicity, at the floor of the gallblad-
der (no posterior shadowing!), or the gallblad-
der is filled solid with sluggish floating mate-
rial. Gallbladder sludge is characterized by its
motility upon repositioning of the patient. De-
pending on make-up and amount, the types of
sludge in the gallbladder may be differentiated
as shown in Table 3.6 and И 3.8.
Table 3.6 Types of gallbladder sludge
Sludge-filled gallbladder Polypoid sludge Sludge sedimentation Floating cholesterol crystals
Size Callbladder filled solid Varying Varying Crystalline
Shape Gallbladder filled solid Polypoid, dependent on position Rather dependent on po- sition, often layered Tabular
Echogenicity Varying, sometimes hep- atized Varying Mixed, varying Hyperechoic, comet- tail-like artefacts
Wall Normal Normal Normal Normal
Intraluminal Changes
0 3.7 Differentiating Gallstones by Ultrasound
► Differentiating calculi in the
supine and left lateral decubi-
tus position
a Supine—the stones are more likely to
collect in the neck of the gallbladder.
b Left lateral decubitus—the calculi will
be located at the fundus/body of the
gallbladder
c Typical gallstone with the patient su-
pine: bright echo of the stone, classic
posterior shadowing.
► Differentiating calculi with a
diameter > 8 mm
d Cholesterol gallstone: fine crystalline
homogeneous intrinsic echo pattern
(“through-transmission”) with comet-
tail—like artifacts, weak surface echo,
soft posterior shadowing.
e Calcium stone: shell-like surface
echo, pronounced posterior shadowing,
inhomogeneous intrinsic echo pattern.
f Mixed pigment gallstone: inhomoge-
neous intrinsic echo pattern with black
voids (pigment), soft surface echo,
weak posterior shadowing.
► Differentiating calculi with a
diameter < 8 mm
g Cholesterol gallstone: intrinsic echo
pattern with tabular structure (with
somewhat comet-tail-like artifacts);
calculi floating within the lumen of the
gallbladder.
h Mixed calcium stones: rather hyper-
echoic gallstone dependent in the gall-
bladder.
i Mixed pigment gallstone: mixed in-
trinsic echo pattern (inhomogeneous);
stones mostly dependent in the gall-
bladder.
И 3.8 Types of Sludge
3 Biliary Tree and Gallbladder 136
a Sludge may float freely or appear as a
“pseudotumor" (modified from Retten-
meier/Seitz1*).
b Polypoid sludge within the gallblad-
der.
c Floating sludge: cholesterol tables at
the fundus arranged in rouleau fashion
d Diffuse floating sludge: multiple
echoes of different size and echogenic-
ity.
e and f Partially sludge-filled gall-
bladder
e Pseudotumor, homogeneous sludge.
f Change of shape after a position
change excludes a tumor
g Floating cholesterol crystals.
► Hem obiIia_______________________________________________________________
Hemobilia is a well-known complication of tu-
mor or, less commonly, inflammatory and trau-
matic gallbladder lesions. A fresh clot within
the gallbladder may mimic hypoechoic sludge.
Older traumatic clots adherent to the wall will
display as hyperechoic mass (Fig.3.65).
Conclusion
These findings demonstrate the enormous capabilities a subtle ultrasound study can offer in the
differential diagnosis of gallbladder disease. Ultrasound is the diagnostic modality of choice in
all disorders of the gallbladder, since its resolution is much better than that of all the other
modalities. Therefore, sonography is the linchpin in the diagnostic work-up of the gallbladder.
Fig. 3.65 Hemobilia, anticoagulant-related hemor-
rhage (ERCP).
a Fresh: hyperechoic lumen.
◄ b Regression with partially anechoic gallbladder
(GB) contents. Cholecystolithiasis. S = shadowing.
Nonvisualized Gallbladder
J. Mueller and L. Greiner
rs
Missing Gallbladder________________________________________________________
— ► Agenesis
► Post-Cholecystectomy
Nonvisualized Gallbladder
► Agenesis____________________________________________________________________________________
Although agenesis of the gallbladder is a rare
anomaly (< 0.1%), it should be of first concern
in the differential diagnosis of the nonvisual-
ized gallbladder, because this would raise con- indication for surgery, even should it be found
siderable (also forensic) doubts regarding the during exploration.
► Post- Cholecystectomy___________________________________________________________________
In routine studies, nonvisualization of the gall-
bladder most likely equates with a status post
cholecystectomy (Fig. 3.66); obtaining a thor-
ough patient history is still a sine qua non for
proper differential diagnosis and will elucidate
the situation quickly. Apparently persistent
gallbladders in the immediate postoperative
follow-up are not especially infrequent, and
are easily explained as hematoma/seroma
(Fig.3.67) which will clear quickly. Only in
rare cases do they have to be evacuated by
ultrasound guided aspiration.
«Fig. 3.66 Scar tissue (n) years
after cholecystectomy; 5 = liver.
« Fig. 3.67 Status post cholecys-
tectomy. Left: small hematoma
(h) a few days after cholecystec-
tomy. Right: hematoseroma (hs)
two days post laparoscopic chol-
ecystectomy, ultrasound-guided
aspiration (for diagnosis and
therapy). > = needle tip artifact;
5 = liver.
Obscured Gallbladder________________________________________________________
► Isoechogenicity With Surrounding Tissue
Malposition
Usually, maximum contraction of the postpran-
dial gallbladder after oral intake does not
present any problems, and nor does the gall-
bladder void of fluid due to lithic obstruction of
the cystic duct (Fig. 3.68).
If the gallbladder is present but cannot be
visualized on ultrasound, this may have to do
with the gallbladder itself, its surroundings, or
the operator (or a combination of all three). In
this case:
► the gallbladder cannot be differentiated very
well from adjacent structures, e.g., because
of unusual content or consumed wall and
lumen structure; or
► it is outside the "realm of imagination” of the
operator, i.e., it is located in unusual ectopic
sites.
3 Biliary Tree and Gallbladder 138
* Fig. 3.68 Left: pronounced postprandial contraction of the gallbladder (7); 5 = liver. Right: gallbladder atrophy (7)
in cholelithiasis with calculous obstruction (s).
► Isoechogenicity with Surrounding Tissue_________________________________________________________
Ultrasound may not be able to visualize the
gallbladder if it is very small by nature or if it
displays maximum volume reduction because
of chronic inflammation (Fig. 3.69). Somewhat
more common is the combination of (calculous
atrophic) gallbladder (Fig. 3.70) and heavy
tympanites (the latter may hinder a study,
although any statement to this effect should
be taken with a grain of salt).
Most problems in the differential diagnosis
result from a gallbladder that is relatively iso-
echoic with the surrounding tissue and with
homogeneous sludge resembling hepatic pa-
renchyma (Fig. 3.69), and those gallbladders
void of fluid that are being consumed by their
own (Fig. 3.71) or other malignancy, most com-
monly HCC (Fig. 3.72). This is also true if the
gallbladder becomes part of a cystic tumor (e.g.,
extensive ovarian cancer) or if it cannot be
delineated from multicystic processes of the
kidneys and/or liver, as well as (much less
often) in extreme poital hypertension or cav-
ernous transformation of the portal vein.
a Fig. 3.69 Left: bile stone with weak echo, almost impossible to demonstrate, in an atrophic gallbladder (7); 5 = liver.
Center: small atrophied gallbladder (7): the stone can only be demonstrated indirectly by its shadowing; 5 - liver.
Right: “hepatized" gallbladder (7) isoechoic with the liver (5)
Fig. 3.70 Fluid-filled atrophic gallbladder (7) in chol-
ecystolithiasis and tympanites; 5 = liver.
a Fig. 3.72 Tumor infiltration (t) of the gallbladder (7)
by hepatocellular carcinoma; liver (5).
a Fig. 3.71 Left: atrophic calculous gallbladder (7) (stones S) with inflammatory?-malignant? infiltration of the liver
(5). Right: gallbladder carcinoma (confirmed by needle aspiration biopsy) with tumor infiltration (t) of the liver (5).
► Malposition________________________
Malposition of the liver, and thus of the gall-
bladder, in severe kyphoscoliotic deformity of
the chest or paralysis of the right phrenic nerve
may limit the accessibility of the gallbladder to
ultrasound. Unusual (ectopic) location of the
gallbladder is more common than originally
thought; in the elderly, the gallbladder may
hyperextend all the way into the minor pelvis
References
1. Braun, Gunther, Schwerk (eds.). Ultraschalldiag-
nostik. Lehrbuch und Atlas 111-1.1 Biliares Sys-
tem. Ecomed 1993.
2. Fannon AM et al. Adenomatous polyps of the
gallbladder. Adenomas of the gallbladder. HPB
Surgery 1991 ;3:251.
3. Greiner L et al. Biliare StoEwellenhthotnpsie,
Flagmentation und Lyse - ein neues Verfahren.
Dtsch Med Wschr 1987;112:1893-6.
4. Hawass ND. False negative sonographic finding in
emphysematous cholecystitis. Acta Radiol
1988:29;137.
5. Heyder N et al. Polypoide Lasionen der Gallen-
blase. Dtsch Med Wschr 1990;115:243-7.
6. Imhof M et al. Sonomorphologie der StreEchole-
zystitis. Ultraschall in Med 1992;13:96-101.
7. Jakobeit C et al. Probleme der sonographischen
Verlaufskontrolle nach ESWL von Gallenblasen-
steinen. Ultraschall in Klinik und Praxis
1989;Supp.l:20.
8. Jakobeit C, Greiner L et al. Sonographie und bi-
liare extrakorporale StoEwellenhthotnpsie
(ESWL). Ultraschall in Med 1992:13:255-62.
9. Jakobeit C, Greiner L et al. Sonographische Gal-
lensteinmorphologie. Z Gastroenterol
1992;30:594-7.
10. Kubicka S, Manns MP. Das Gallenblasen- und
Gallengangskarzinom. Internist (Berlin)
2000;41(9):841-7.
11. Kunisch M et al. Gallenblasenadenokarzinom bei
bestehender villoser Adenomatose (Papilloma-
tose) der Gallenblase und des Ductus hepato-
to be visualized only there. The same holds true
for very slim, young patients in left lateral de-
cubitus position: here, the pendulous gallblad-
der, resembling a clapper, may reach far into
the left upper quadrant.
Abnormal locations resulting in poor or even
impossible differentiation may be encountered
in gallbladders deeply retracted in the portal
choledochus. Rofo Fortschr Geb Rontgenstr
Neuen Bildgeb Verfahr 1997;166(5):454-6.
12. Lee КС et aL Mirizzi Syndrom caused by xan-
thogranulomatous cholecystitis. Report of case.
Surg Today 1997;27(8):757-61.
13. Meckler U et al. (eds.). Ultraschall des Abdomen.
Diagnostischer Leitfaden. Cologne: Deutscher
Arzteverlag 1998.
14. Meckler U, Wermke W (eds.). Sonographische
Differentialdiagnostik: Systematischer Atlas. Co-
logne: Deutscher Arzteverlag 1997.
15. Nussie К et aL Adenomyomatose der Gallenblase:
Sonographischer Befund. Rontgenpraxis
1998;51(5):155-8.
16. Okabe T et al. Gallbladder-Carcinoma with chol-
edochoduodenal fistula - a case report with sur-
gical treatment. Hepatogastroenterology
l999;46(27):1660-3.
17. Ravo В et al. The Mirizzi syndrome: pre-operative
diagnosis by sonography and transhepatic chol-
angiography. Am J Gastroenterol 1986:81:688.
18. Rettenmaier G, Seitz К (eds.). Sonographische
Differentialdiagnostik. Stuttgart: Thieme 2000.
19. Roberts KM. Parsons MA. Xanthogranulomatous
cholecystitis: clinico-pathological study of 13
cases. J Clin Pathol 1987:40:412.
20. Sasatomi F et aL Precancerous conditions of
Gallbladder-Carcinoma: overview of histopatho-
logic characteristics and molecular genetic find-
ings. J Hepatobiliary Pancreat Surg
2000;7(6):556-67.
21. Schmidt G (eds.). Ultraschall-Kursbuch. 3rd ed.
Stuttgart: Thieme 1999.
hilum or in intrahepatic gallbladders, which
may then be misdiagnosed as focal liver lesion,
particularly so in the case of cholecystolithiasis.
Finally, visualization of the gallbladder in a
patient with transposition of viscera may also
present initial problems.
22. Schdlmerich J, Bischoff SC, Manns MP (eds.). Di-
agnostik in der Gastroenterologie und Hepatolo-
gie. Stuttgart: Thieme 1997.
23. Shinizu M et al. Porcelain gallblader: relation
between its type by ultrasound and incidence of
cancer. J Clin Gastroenterol 1989; 11:471.
24. Stelzel WB et al. Perforierte xanthogranuloma-
tose Cholezystitis. In: Schmitt W, Ottenjann R.
(eds.). Der seltene gastroenterologische Fall. Vol
3. Demeter 1990; p. 118-9.
25. Sturm J, Post S. Benigne Erkrankungen der Gal-
lenblase und der Gallenwege. Chirurg
2000;71(12):1530-51.
26. Tsuchiya Y et al. Sonographic diagnosis of gall-
stones. In: Speranza V, Barbara L. Nyhus LM (eds.).
Problems in general surgery. Vol. 8, Nr. 4:541
Philadelphia: Lippincot & Co 1991
27. Weiss A, Weiss H (eds.). Ultraschall in der Inneren
Medizin. Edition Medizin 2000.
28. Weiss H et aL Die Schichten der Gallenblasen-
wand - erne sonographisch-anatomische Ver-
gleichsuntersuchung Ultraschall Klin Prax
1992;7:142(Abstr.)
29. Wolpers C (eds.). Gallenblasensteine: Ihre Mor-
phogenese und Auswahl zur Litholyse. Karger
1987.
Nonvisualized Gallbladder 139
Pancreas 143
▼ Diffuse Pancreatic Change
^^Targ^’TncreaT"
- —► Acute Pancreatitis
— ► Chronic Pancreatitis
— ► Tumor Invasion
▼ Small Pancreas
- —► The Aging Pancreas
— ► Pancreatic Atrophy
— ► Post-Pancreatitic Necrosis/
Pancreatectomy
▼ Hypoechoic Texture
— ► juvenile Pancreas
— ► Acute Pancreatitis
— ► Early/Recurrent Chronic
Pancreatitis
— ► Ductal Dilatation
▼ Hyperechoic Texture
— ► Fibromatosis/Lipomatosis
— ► Fibrosis in Hemochromatosis/
Cystic Fibrosis
*—* ► Chronic Pancreatitis
▼ Focal Changes
fr^nTchokU^esiori
— ► Cysts
— ► Pseudocysts
— ► Necrosis
— ► Vessels/Duct System
▼ Hypoechoic Lesion
— ► Neuroendocrine Tumors
---► Pancreatic Cancer
— ► Metastasis, Malignant Lymphoma,
Inflammatory Lymph Node
---► Abscess
— ► Hemorrhagic/Calcified Cyst/
Pseudocyst
---► Focal Pancreatitis
▼ Isoechoic Lesion
158
— ► Pancreatic Cancer
— ► Malignant Lymphoma
— — ► Focal Pancreatitis
— ► Pancreas divisum
— Annular Pancreas
▼ Hyperechoic Lesion
— ► Calcification/Intraductal Calculus
— ► Calcified Splenic Artery
— ► Microcalcification, Calcium Soap
— ► Intraductal Gas/Stent
— Hemangioma, Lipoma
▼ Irregular Lesion
— ► Chronic Pancreatitis
---► Focal Chronic Pancreatitis
— ► Pseudocyst
---► Cystic Neoplasias: Cystadenoma/
Cystadenocarcinoma
▼ Dilatation of the Pancreatic Duct
^^^arginal/Mnc^ilatatio^"
— ► Bile Duct Disorder
— ► Acute/Recurrent Pancreatitis,
Pancreas Divisum
---► Chronic Pancreatitis
--► Periampullary Cancer, Cancer
of the Pancreatic Head
▼ Marked Dilatation
— ► Chronic Pancreatitis
— ► Intraductal Mass
*--► Pancreatic Cancer
4 Pancreas
C. Schmidt
Anatomy__________________________
Size
► Head: 2.5-3 cm
► Body: < 1.8-2 cm
► Tail: 2.5-3 cm
Shape
► Barbell
► Tadpole
The structure of the pancreas shows it to be a
composite tubuloalveolar gland. Its size may
vary significantly, depending on age and its
intrinsic physiological variation in shape; in
the elderly the organ becomes smaller and
may even atrophy. The variants in shape (bar-
bell and tadpole, Fig. 4.1) are characterized by
their differences in the size of the pancreatic
head and tail. Most of the glands display the
dimensions given above.
Microstructure. The enzyme-producing termi-
nal segments of the glands are termed acini
(“berries”). The interstice houses blood vessels,
fibroblasts, and strands of collagen, and this
interstitial connective tissue becomes denser
with age. During embryological development,
two large ducts (pancreatic duct and duct of
Santorini) drain into the duodenum; later the
duct of Santorini may degenerate completely,
with the pancreatic duct becoming the main
drainage. Accessory ducts, termed interlobular
excretory ductules, branch off orthogonally.
Further branching to the acini within the lo-
Fig. 4.1 Variant configurations of the pancreas. GB =
gallbladder; VR = left renal vein; L = liver; VL « splenic
vein; VC = vena cava; AO = aorta.
a Barbell: slender body and prominent head as well
as tail of the pancreas (P).
« b Tadpole: prominent pancreatic head, small body
and tail.
bules leads to the so-called intralobular duc-
tules. The lobules of the pancreas are separated
from the surrounding tissue not by a firm cap-
sule but by tenuous connective-tissue strands.
This explains the blurred outline of the organ in
the ultrasound image.
Function. The pancreas is composed of two
quite separate types of glandular tissue-the
exocrine and the endocrine. The exocrine gland
produces the viscous glassy mucus excreted by
the acini via excretory ductules into the pan-
creatic duct. The 0.5-2 million pancreatic islets
of Langerhans, diameter 100-200 pm, are cell
clusters mainly found in the body and tail of
the organ, which constitute the endocrine part
of the glandular tissue. They secrete insulin,
glucagon, somatostatin, pancreatic polypep-
tide, and other active peptide hormones and
neuropeptides directly into the bloodstream.
4 Pancreas 143
Topography________________________________
Topographic relationships
► Retroperitoneal location anterior to the
upper lumbar spine
► Head — anterior to the inferior vena cava
► Body — transverse in the middle of the
upper abdomen anterior to the aorta
► Tail — reaches the hilum of the spleen
Ultrasound landmark structures
► Portal vein confluence and its tributaries
► Inferior vena cava
► Vessels of the celiac axis
The pancreas lies transversely and somewhat
obliquely in the retroperitoneum, directly an-
terior to the spine at the level of the second
lumbar vertebra. The head of the pancreas nes-
tles in the posterocaudad concavity of the du-
odenum; the pancreatic body traverses the
spine and courses along the anterior margin
of the left kidney, while the tail reaches ceph-
alad into the hilum of the spleen (Figs.4.2-4.4).
Borders. The posterior borders are defined by
the spine and the lumbar part of the dia-
phragm, abdominal aorta, and inferior vena
cava, all anterior to the spine. Most of the ante-
rior aspect of the pancreas is covered by the
stomach. The omental bursa is formed by the
posterior wall of the stomach (up to the lesser
curvature) and the anterior aspect of the pan-
creas. From the border between the head and
body of the pancreas to the left, there is the
cavity of the omental bursa or lesser sac, which
in acute pancreatitis may fill up with exudate.
Posterior to the head of the pancreas, the distal
segment of the common bile duct and the pre-
papillary section of the pancreatic duct course
together for part of the way to the papilla of
Vater, in 75% of cases within a common trough,
in the other 25% intrapancreaticaily.
Blood supply. The origins of the celiac axis and
the superior mesenteric artery lie cephalad to
the pancreas. Since the celiac axis runs in an
anterosuperior direction and the superior mes-
enteric artery posteroinferior to the pancreas,
the organ is caught in a kind of vise. If in
pancreatic cancer these vessels are infiltrated,
the tumor is no longer amenable to resection.
The superior mesenteric artery and vein run in
the pancreatic incision across the uncinate
process, the latter resting posterior to these
vessels.
Common hepatic
Common
duct -
Cystic
duct
Gall- _
bladder
Head
a Fig. 4.2 Schematic diagram of the relationships of
the pancreas.
4 Pancreas 144
a Fig. 4.3 Ultrasound topography of the pancreas and
the relationships with its neighboring organs.
a Oblique right epigastric view: the head of the pan-
creas (P) is lateral and posterior to the gallbladder
(GB), posterior to the right hepatic lobe, and anterior
to the vena cava (VC). AO = aorta; К = venous con-
fluens.
а c Left oblique epigastric view: demonstration of the
entire tail of the pancreas (P) posterior to the left
hepatic lobe (L); the splenic artery (AL, Fig.4.3b)
meanders through the pancreatic tail.
The splenic vein courses posteroinferior to
the pancreas and is completely covered by it,
while the splenic artery meanders, partly intra-
pancreatically and partly retropancreatically,
along the superior pancreatic margin toward
the hilum of the spleen.
The gastroduodenal artery traverses the an-
terior part of the pancreatic head, runs anterior
to the pars superior duodeni, and branches into
the anterior and posterior superior pancreati-
coduodenal arteries.
a b Median transverse epigastric view, the median re-
gions of the right and left hepatic lobes are visualized
from anterior to posterior; the splenic vein (VL) lies at
the inferior border of the pancreas (P), followed by
cross-sectional views of the superior mesenteric ar-
tery, vena cava (VC), and aorta (AO). AL = splenic
artery.
The lymphatics of the pancreatic head drain
into the hepatic, pancreaticoduodenal, and
superior mesenteric lymph nodes; those of
the body and tail of the pancreas drain into
the aortic and preaortic nodes Quite often in
malignancy, these lymph nodes harbor meta-
stases and in sonographic staging will become
important when considering possible treat-
ment options.
a Fig. 4.4 The tail of the pancreas (P), anterior to the
splenic vein (VL), reaches the hilum of the spleen (M);
high lateral view.
Diffuse Pancreatic Change
In ultrasonography, diffuse pancreatic change
will alter the size and echo texture of the organ.
Large Pancreas
▼ Diffuse Pancreatic Change
Large Pancreas
► Small Pancreas
Jz ► Hypoechoic Texture
Д ► Hyperechoic Texture
► Focal Changes
► Dilatation of the Pancreatic Duct
— ► Acute Pancreatitis
► Chronic Pancreatitis
► Tumor Invasion
► Acute Pancreatitis___________________________________________________________________________________
Pancreatic edema. Acute pancreatitis will usu-
ally lead to diffuse enlargement of the entire
pancreas; however, in most cases of concurrent
pancreatitis the standard dimensions will not
be exceeded. The increase in size is caused by
interstitial edema, which in turn decreases the
echogenicity. Increased size and hypoechoge-
nicity are the most striking characteristics of
mild episodes of acute pancreatitis (Fig.4.5).
Subsiding edema is followed by a return to
normal size and echogenicity. However, even
after months there may be residual spiculation
of the organ contour.
Necrosis of the peripancreatic fat. In se-
vere cases of acute necrotizing pancreatitis,
focal masses, such as intrapancreatic and peri-
pancreatic fluid, fatty necrosis, hemorrhage,
and exudate, may hamper delineation of the
gland, thus resulting in a pseudo-enlargement
of the organ (Fig. 4.6).
Extensive peripancreatic fatty infiltration in
obesity and diabetes may blur the contours of
the pancreas by beam scattering and reflection,
and therefore may also mimic enlargement of
the gland (Fig. 4.7).
a Fig. 4.5 Acute edematous pancreatitis : diffusely en-
larged pancreas (P); blurred hypoechoic texture. VL =
splenic vein.
a Fig. 4.6 Acute pancreatitis: apparent enlargement by
echogenic peripancreatic areas (fat necrosis, hemor-
rhagic areas), which indent the posterior stomach
wall (cursors). The pancreas (cursors) is of normal
size and has a hazy, hypoechoic structure.
a Fig. 4.7 Apparent enlargement of the pancreas (P)
because intensive scattering (fibromatosis/lipomato-
sis, peripancreatic fat) makes delineation by ultra-
sound impossible: splenic vein (VL) just barely visual-
ized. M = stomach.
Diffuse Pancreatic Change 145
► Chronic Pancreatitis_________________________________________________________________________________
It is particularly the early stage and the acute
inflammatory episode of chronic pancreatitis
that will result in an enlarged pancreas. But in
this case texture and contour will tend to
undergo mottled, ill-defined, or irregular hy-
perechoic transformation (Fig.4.8).
< Fig. 4.8 Recurrent chronic alcohol-associated pan-
creatitis: distinctive enlargement of the pancreatic
body and head; coarse echo pattern due to fibrosis.
► Tumor Invasion___________________________________________________________________________________
In the rather rare case of diffuse carcinoma or
in malignant tumor invasion, enlargement of
the gland and misdiagnosis may also be en-
countered (Fig. 4.9). The echo pattern may be
isoechoic or hypoechoic (see Fig.4.36).
◄ Fig. 4.9 Confluent intrapancreatic and peripancre-
atic lymphomas (calipers), resulting in enlargement
of the pancreas (P) anterior and posterior to the
splenic vein (VL). AO = aorta; VR = renal vein.
Small Pancreas_________________________________________________________
— ► The Aging Pancreas
► Pancreatic Atrophy
► Post-Pancreatic Necrosis/Pancreatectomy
There are no clearly defined dimensional data
for the small pancreas, and therefore the as-
sessment of reduced pancreatic size is subjec-
tive and depends on the sonographic impres-
sion. Nevertheless, a thickness of less than
10 mm in the pancreatic head, body, or tail
would suggest a smaller than normal size. If
the reduced thickness is segmental, it may be
simply a physiological variant (Fig. 4.1).
► The Aging Pancreas
4 Pancreas 146
The most common cause of a smaller than nor-
mal size of the pancreas is age-dependent atro-
phy, which is quite common in slim, elderly
patients. It affects all parts of the organ evenly.
Echogenicity may be normal or increased. Any
hypergenicity is due to parenchyma being re-
placed by fatty and connective tissue (fibroli-
pomatosis). Problems in differential diagnosis
arise if in cachectic patients tubular structures
are very closely related, making orientation
rather difficult (splenic artery and vein; dilated
pancreatic duct/common hepatic artery/renal
vein; common bile duct/portal vein/proper
hepatic artery). In this case, color-flow Doppler
scanning will differentiate the various vessels
and facilitate visualization of the narrow pan-
creatic parenchyma (Fig. 4.10).
Fig. 4.10 Pancreas in old age: narrowed pancreas (P).
normal texture. VL = splenic vein; AO = aorta; VC =
vena cava; L = liver; M = gastric body.
► Pancreatic Atrophy_____________________________________________________________________________
Differentiation of atrophy in chronic pancrea-
titis from aging pancreas is possible only if
there are changes in the texture or in case of
ductal dilatation. Pancreatic atrophy is the ter-
minal stage of chronic pancreatitis and may
still exhibit the ultrasound criteria of this dis-
ease, i.e., calcification and fibrosis. Scarring will
often warp the duct and dilate it irregularly,
and it may be the only vestige of the gland.
Pancreatic atrophy as a sequel to chronic
pancreatitis or in the much more infrequent
chronic autoimmune pancreatitis will lead to
diabetes mellitus and maldigestion. Newly di-
agnosed diabetes mellitus or unexplained
weight loss may be the only clinical symptoms.
Early signs in ultrasound morphology might be
localized or diffuse hypoechogenicity without
the other signs of chronic pancreatitis2, 9 (Fig.
4.11 and Fig.4.67a-c).
Hemochromatosis. In atrophy concomitant
with advanced hemochromatosis, the fibrosis
may lead to diffuse or focal hyperechogenicity
of the pancreas (Fig. 4.12).
л Fig. 4.11 Atrophy resulting from “burnt out” chronic
pancreatitis: only a narrow band of hyperechoic pa-
renchyma and the slightly dilated pancreatic duct are
left. К - venous confluence; M = gastric body; L = liver;
VC = vena cava; AO « aorta.
a Fig. 4.12 Fibrosis of the pancreas (P) with diabetes
mellitus in hemochromatosis. VL = splenic vein; AO *
aorta; VC = vena cava; L = liver.
a Narrow hyperechoic organ.
a b In contrast to lipomatosis, here the pancreas can-
not be compressed by the palpating fingers. Finger-
kompression = finger compression.
► Post- Pancreatitic Necrosis/Pancreatectomy________________________________________________
After necrosis and partial resection of the pan-
creas as well as after total pancreatectomy it is
almost impossible to differentiate sonographi-
cally between the peripancreatic fat/connec-
tive tissue and the residual pancreatic tissue
because they hardly differ in impedance
(Fig. 4.13). In these cases, differential diagnosis
has to fall back on patient history and clinical
symptoms.
Fig. 4.13 Three months after necrotizing pancreati-
tis: while the pancreatic head (P) still appears to be of
normal size, the body and tail are missing almost
completely. VL = splenic vein; AO = aorta; VC =
vena cava; L = liver; M = stomach.
Hypoechoic Texture
Diffuse Pancreatic Change
§ ► Large Pancreas
U^Small Pancreas
Q ИД* Hypoechoic Texture
12* Hyperechoic Texture
► Focal Changes
Dilatation of the Pancreatic Duct
— ► Juvenile Pancreas
► Acute Pancreatitis
► Early/Recurrent Chronic Pancreatitis
► Ductal Dilatation
► juvenile Pancreas___________________________________________________________________________________
Quite often, the juvenile pancreas will be ex-
ceptionally hypoechoic and might be mistaken
for edematous pancreas in acute pancreatitis,
although the “juvenile organ" will demonstrate
normal size (Fig. 4.14).
< Fig. 4.14 juvenile pancreas in a slender female: com-
pared with acute pancreatitis the pancreas (P) is
markedly hypoechoic but with unchanged dimen-
sions in all segments. AO = aorta; VC = vena cava;
VL = splenic vein.
Diffuse Pancreatic Change
► Acute Pancreatitis___________________________________________________________________________________
Classification. There are four different interna-
tional classifications of acute and chronic pan-
creatitis: the Marseille classification of 1963,
the revised Marseille of 1984, the Cambridge
classification of 1983 (and of 1984 regarding
imaging modalities), and the Marseille-Rome
classification of 1988. According to the latter
three, the differentiation is only between acute
and chronic pancreatitis. In general, the tran-
sition from acute to chronic pancreatitis is as-
sumed to be a rare event. The revised Marseille
classification of 1984 is listed in the accompa-
nying box.
Ultrasound findings. In a mild episode of acute
pancreatitis there is definite ballooning and
enlargement of the organ, which is character-
ized by intensive homogeneous hypoechoic
transformation of its texture. These changes
correspond to the histological finding of pan-
creatic edema.
Necrosis of the peripancreatic fat may result
in the common ultrasonographic finding of
band-shaped hyperechoic peripancreatic
masses (Fig.4.7).
Classification of Acute Pancreatitis (Marseille 1984)8
Clinical characteristics. Acute onset of
abdominal pain, increased blood and/or
urine levels of the pancreatic enzymes.
Morphological characteristics
► Mild form: necrosis of the peripancreatic
fat, interstitial edema.
► Severe form: extensive necrosis of the
peripancreatic and intrapancreatic fat,
necrosis of the parenchymal tissue as
well as hemorrhaging; focal or diffuse
lesions.
In addition there also may be fluid-filled
spaces around the pancreas, liver, and kidney/
spleen, while large exudate tends to be present
in the more severe form (Table 4.1). Compres-
sion-induced dilatation of the pancreatic duct
is uncommon and would indicate pancreas di-
Course. Generally benign course; severe
episodes may be fatal; single or recurrent
episode; disorder of the exocrine and en-
docrine pancreas function of varying de-
gree and duration; after elimination of
the underlying cause usually complete
clinical, functional, and morphological re-
covery; morphological changes (e.g. scars,
pseudocysts) may persist as residual sign
of partial recovery.
visum or periampullary ductal obstruction
(prepapillary gallstone).
On the basis of the ultrasound findings, the
differential diagnosis should consider the early
stage of chronic or recurrent chronic pancrea-
titis (Figs. 4.15 and 4.16) or even the rarer case
of a hypoechoic juvenile pancreas (Fig. 4.14).
Table 4.1 Diagnostic ultrasound criteria in acute pancreatitis
Mild pancreatitis Severe pancreatitis
Enlarged organ (leading sign)
Blurred hypoechoic texture
Regular size and texture in “concurrent”
pancreatitis
Heterogeneous texture possible
In addition to the mild form:
Focal hypo-/hyperechoic intra- and extra-
pancreatic mass (hemorrhage/necrosis/ fatty
necrosis)
Ascites, pleural effusion
► Early/Recurrent Chronic Pancreatitis____________________________________________________________
4 Pancreas 148
Chronic pancreatitis is characterized by hyper-
echoic fibrosis and calcification as well as an-
echoic/hypoechoic microcysts and macrocysts
and ductal dilatation. If all signs are present,
the diagnosis is confirmed. In the presence of
just one or two criteria, differentiation of
chronic pancreatitis from malignancy or other
forms of fibrosis, or even acute pancreatitis,
becomes difficult. Particularly in alcohol-asso-
ciated pancreatitis, the texture may become
hypoechoic; however, on detailed study it dis-
plays the characteristics of chronic pancreatitis,
i.e., irregular contour, undulating duct, or inter-
spersed fibrotic regions (Figs.4.15 and 4.16).
a Fig. 4.15 Early stage of alcohol-associated chronic
pancreatitis: hypoechoic pancreas (P), irregular ante-
rior contour (arrows); subsiding acute pancreatitis will
demonstrate similar findings. VL = splenic vein.
a Fig. 4.16 Hypoechoic pancreas. The diagnosis of
chronic pancreatitis is clearly suspected in the pres-
ence of sporadically interspersed fibrotic areas and
the undulating, barely dilated pancreatic duct (sev-
eral episodes of inflammation in pancreas divisum).
CO = venous confluence.
► Ductal Dilatation__________________________________________________________________________________
Sometimes a “hypoechoic” pancreas is in real-
ity an enormously dilated pancreatic duct
which, particularly in the atrophic organ, may
constitute almost the entire gland. Detritus,
pus, and intraductal calculi produce heteroge-
neous changes in the texture of the duct that
are hard to discriminate from the other pan-
creatic parenchyma (Fig.4.17).
* Fig.4.17 Misdiagnosis of a hypoechoic pancreas:
there is a hypoechoic dilated pancreatic duct (DP);
calculi or a protein plug in the pancreatic head (ar-
row) and the pseudocyst (Z) point the way to the
underlying cause (chronic pancreatitis). VL = splenic
vein; AO = aorta.
Hyperechoic Texture____________________________________________________
— ► Fibromatosis/Lipomatosis
► Fibrosis in Hemochromatosis/Cystic Fibrosis
► Chronic Pancreatitis
► Fibromatosis/Lipomatosis_____________________________________________________________________
Lipomatosis. Very few diffuse changes of the
pancreas catch the eye as does pancreatic li-
pomatosis, and therefore this diagnosis is made
without hesitation. Compared with the liver,
the pancreas demonstrates normal size and
an even, intensively hyperechoic texture. This
change is found most often in the overweight
non-insulin-dependent diabetic patient.
Fibrolipomatosis. The same holds true for fi-
brolipomatosis, but here the change is coarser
and frequently accompanied by enlargement of
the gland. Fibrolipomatosis is more common in
the elderly, in whom the loss in parenchyma is
made up by fibrosis and fatty tissue (Fig. 4.18).
Differentiation. Differentiating siderosis or
chronic pancreatitis from pure fibrosis is diffi-
cult. It may be aided by checking the build of
the organ through palpation: in pure fibrosis
there is no compressibility or propagation of
the aortic pulse. Usually, the fibrosis results in a
significant loss of organ function and will lead
to exocrine and endocrine pancreatic insuffi-
ciency (Fig. 4.11).
a Fig. 4.18 Fibrolipomatosis of the pancreas (P): hyper-
echoic, somewhat coarse texture. M = stomach; К =
confluence of portal vein; VC = vena cava; AO = aorta;
L = liver.
► Fibrosis in Hemochromatosis/Cystic Fibrosis
In the more advanced stages, the organ quite
often atrophies, thus becoming smaller, and
will demonstrate an intensively hyperechoic
texture (Fig.4.12). In the early stages, size and
texture of the pancreas remain almost normal;
as part of hemochromatosis the initial fibrosis
may be present without any clear-cut sono-
graphic increase in echogenicity. In cystic fi-
brosis, there sometimes is additional cystic
transformation of the pancreatic texture. Ultra-
sound cannot differentiate the various causes
of pancreatic fibrosis (Fig. 4.19).
a Fig. 4.19 Fibrosis of the pancreas (calipers, P). VL =
splenic vein; AO = aorta; L = liver.
a In chronic alcohol-associated pancreatitis (calipers).
a b In hemochromatosis.
► Chronic Pancreatitis_________________________________________________________________________________
Diffuse Pancreatic Change 149
Parenchymal changes. Chronic pancreatitis is
characterized by fibrotic parenchymal scarring,
particularly in the acinar epithelium; with in-
creasing fibrosis, only ectatic excretory ducts,
pancreatic islets, obliterated vessels, and some
residual parenchyma will remain. In more than
40% of cases this process of fibrosis will be focal
within the pancreatic tail or will appear as
“groove pancreatitis" or divisum pancreatitis
in the head of the pancreas. The frequency of
protein deposits and calcification (intraductal
calculi) varies, focal necrosis being present in
roughly 10% and inflammatory postpancreati-
tis pseudocysts in 40% of patients. Dilatation of
the primary and secondary ducts manifests it-
self as retention cysts, wich in turn are sequelae
to intrapancreatic secretory obstruction and
ductal ectasia.
Ultrasound findings. As in siderosis, here too
ultrasound can demonstrate the increased
echogenicity induced by the fibrosis, but in
chronic pancreatitis these fibrotic areas tend
to be mottled or cloddy. They may be loosely
distributed or bunched together. Additional
calcification results in zones of posterior shad-
owing. Calcifying chronic pancreatitis demon-
strates finely or roughly distributed hard ech-
oes. Since the frequent shadowing zones are
most often wide, they will conceal the deeper
structures such as the retroperitoneal vessels.
The pancreas will be difficult to identify be-
cause the landmark structures cannot be vi-
sualized and the contour of the organ is
blurred. Together with the subsequent atrophy,
this compounds the fact that ultrasound stud-
ies of the pancreas have a sensitivity of only
70-80%1,4 (Fig. 4.20). Pseudocysts and dilata-
tion of the duct tend to result in a more het-
erogeneous texture (see below).
If all morphological changes are present,
chronic pancreatitis is characterized by the fol-
lowing ultrasound criteria (see Figs.4.23,4.25,
4.55):
► Fibrosis
► Calcification/lntraductal stones
► Microcysts and macrocysts
Classification of Chronic Pancreatitis (Marseille 1984)8
Clinical characteristics. Recurrent or per-
sistent abdominal pain; sometimes with-
out pain.
Morphological characteristics
► Irregular sclerosis with focal, segmental,
or diffuse destruction and permanent
loss of exocrine parenchyma of the
gland.
► Dilatation of varying degree of various
ductal segments.
► Protein deposits, calcification (intraduc-
tal calculi).
► Edema, focal necrosis, inflammatory
cells, and cysts and pseudocysts are
found to a varying degree.
► The islets of Langerhans will be affected
much later.
► The following descriptive morphological
terms are used:
1. Chronic pancreatitis with focal
necrosis
2. Chronic pancreatitis with segmental
or diffuse fibrosis
3. Chronic pancreatitis with or without
calcification (calculi)
Course. The irreversible morphological
changes will lead to a definite progressive
loss of the exocrine and endocrine pancre-
atic function.
Special case: Obstructive chronic pancrea-
titis
Morphological characteristics
► Dilatation of the ductal tree upstream of
the obstruction in a major duct (e.g. tu-
mor or scar).
► Diffuse atrophy of the parenchyma and
regularly diffuse fibrosis.
► Calculi are almost never present.
Course. After the obstruction has been
cleared, the morphological and functional
changes will usually resolve completely.
► Ectatic duct
► Atrophy in the terminal stage
The majority of all chronic pancreatitis does not
exhibit all of the above criteria but rather only
fibrosis, dilated ducts, or a combination of two
or more of these criteria. In acute episodes the
sonographic signs of acute pancreatitis may
also be present.
The 1984 Marseille classification8 of chronic
pancreatitis rests on the clinical and morpho-
logical aspects.
Imaging modalities play a vital role in the
diagnosis of chronic pancreatitis. Ultrasonogra-
phy and endoscopic retrograde pancreaticog-
raphy (ERP) are regarded as baseline studies.
The guidelines for assessing the severity of
chronic pancreatitis also take into account
these different imaging modalities (Table 4.2).
Since the different forms of chronic pancrea-
titis can be differentiated morphologically, and
furthermore since there may be focal change,
by itself or concomitant with the underlying
disease, chronic pancreatitis may be demon-
strated in a number of sonographic variants,
depending on the predominant histopatholog-
ical changes, a 4.1 depicts possible sono-
graphic images and variants.
Differentiation. Misdiagnosis may result from
pancreatic fibrolipomatosis/lipomatosis due to
fatty and fibrotic deposits in elderly obese dia-
betics, as well as scattering, refraction, and ul-
trasound absorption by adjacent/ superim-
posed tissue. These factors will blur the mar-
gins and texture of the organs and could lead to
the mistaken ultrasound diagnosis of chronic
pancreatitis (Table 4.3, Fig. 4.21).
4 Pancreas 150
a Fig. 4.20 Micronodular calcification with shadowing a b Plain radiographic film,
(S) in chronic calcifying pancreatitis.
a Sonographic innage. M = stomach; AO = aorta; L =
liver.
a Fig. 4.21 Misdiagnosis of chronic pancreatitis (P =
pancreas). In this case, ultrasound cannot assess the
possible presence of coarse, cloddy fibrosis. CT: nor-
mal pancreas (no clinical symptoms). Probably inter-
ference by superimposed peripancreatic fat.
Table 4.2 Classification of chronic pancreatitis by imaging modality (Cambridge 1984)5
Pancreas/pancreatitis ERCP Ultrasound or CT
Normal Good-quality visualization of the entire gland without pathological signs
Questionable < 3 pathological branches One pathological finding - pancreatic duct 2-4 mm
Mild > 3 pathological branches Two pathological findings: cysts <10 mm irregular duct acute focal pancreatitis parenchymal heterogenicity increased echogenicity of the duct wall irregular contour of head/body
Moderate All of the above signs plus pathological pan- creatitis All of the above pathological signs
Severe All of the above signs plus one or more of the following: cyst >10 mm intraductal voids calculi/pancreatic calcification duct obstruction (stricture) severe dilatation or irregularity of duct adjacent organs affected (demonstrated on ultrasound or CT)
Table 4.3 Differentiating chronic pancreatitis and fibrolipomatosis
Chronic pancreatitis
Hyperechoic, coarse texture
Inhomogeneities because of
- microcysts/macrocysts
- parenchymal calcification/intraductal calculi
- obstruction/stricture of duct, dilated duct
Increased/decreased size (atrophy)
Indurated
Fibrolipomatosis
Hyperechoic, fine texture
Homogeneous structure
Normal size
No or little induration (palpating finger/propagated aortic pulse)
0 4.1 Chronic Pancreatitis (CP) on Ultrasound (modified from reference 8)
► Chronic pancreatitis with focal
necrosis
in
► Chronic pancreatitis with
segmental or diffuse fibrosis
► Chronic pancreatitis with
calcification/calculi
a CP with necrotic episodes, necrosis
(C) of the pancreatic tail. VC = vena
cava; VP = portal vein; P = pancreas;
AO = aorta.
d Fibrosis of the pancreatic head (PK),
stenosis of the pancreatic duct (DP);
normal body and tail of the pancreas.
D = duodenum; P = pancreas.
b Six months later: regression accom-
panied by increased echogenicity and
shadowing (S); fresh necrotic area in the
head of the pancreas (С). P = pancreas;
AO = aorta.
e Hyperechoic micronodular texture:
fibrotic pancreas in cystic fibrosis/he-
mochromatosis. GB - gallbladder; DUO
= duodenum; VC = vena cava; AO =
aorta; P = pancreas; U = uncinate pro-
cess
c Months later, another episode of ne-
crosis. VL - splenic vein.
f Intermittent chronic pancreatitis
(pancreas divisum): hyperechoic mi-
cronodular fibrosis within the enlarged
edematous pancreas. Dilated excretory
ducts interspersed in the fibrosis (ar-
rows).
Diffuse Pancreatic Change
g Chronic pancreatitis: diffuse micro-
nodular calcification with summation
shadowing. M ж stomach, VL = splenic
vein; P = pancreas; L = liver.
h Same patient as in d with segmental
СР 31/2 years later: calcification of the
entire pancreas. DP = pancreatic duct;
AO = aorta.
i Same patient: oblique right epigastric
view: coarse cloddy calcification or in-
traductal calculi (arrows, shadowing S)
along the pancreatic duct in the head.
P = pancreas; DP = pancreatic duct.
► Obstructive chronic pancreati-
tis (special variant)
j Chronic obstruction of the pancreatic
duct (DP) due to microcystic adenoma,
with fibrotic areas in the pancreatic tail
and incipient atrophy. Initially inter-
preted as chronic pancreatitis.
к Pancreas divisum: relative stenosis of
the anterior accessory duct of Santorini
(downward arrow), filiform stenosis of
the posteroinferior duct (upward duct)
coursing toward the papilla of Vater.
DP - pancreatic duct; PK - pancreatic
head.
I Obstruction due to pancreas divisum
with loose, echogenic areas of fibrosis
and atrophy. A = antrum; L = liver; DP =
pancreatic duct; VL = splenic vein.
Focal Changes
4 Pancreas 152
Focal changes may display the whole gamut of
echogenicity from anechoic to hyperechoic and
heterogeneous lesions. They may correspond
to anomalies or variants, and may be inflam-
matory or tumorous. Every so often these focal
changes are the result of papillotomy or ductal
procedures, which can be confirmed quite
easily from the patient’s history. Cancer is the
most important of these focal changes. It can-
not be excluded from diagnostic consideration,
unless another origin of the lesion in question
has been proven.
Anechoic Lesion_______________________________________________________
1Л
О
► Cysts
► Pseudocysts
► Necrosis
► Vessels/Duct System
Table 4.4 lists the most important differential
diagnoses of the anechoic pancreatic mass.
Table 4.4 Differential diagnosis of the anechoic pancreatic mass
Congenital cyst Retention cyst Necrosis
Anechoic
Round
Enhancement
Liver/kidney cysts
Anechoic
Round or polygonal
< 1 cm together
with:
fibrosis, calcifica-
tion,
ductal ectasia
Anechoic/hypoechoic
Polycyclic
Mottled or banded
No halo
Pseudocyst
Anechoic/heteroge-
neous
Almost round
Echogenic wall
Congenital cyst. Congenital cysts may be soli-
tary or multiple, in the latter case accompanied
by polycystic kidney disease. Compared with
the cysts secondary to inflammation or the
frequent cysts in chronic pancreatitis, they are
extremely rare and incidental findings.
Retention cyst. Retention cysts are small, come
in multiples, and are usually found together
with other signs of chronic pancreatitis. They
are filled with clear pancreatic secretion.
Hydatid cyst. Intrapancreatic hydatid cyst is a
true rarity; as is the case with their hepatic
counterparts, these cysts will display a hyper-
echoic inflammatory wall.
Ultrasound findings. Ultrasound studies of
congenital cysts will demonstrate the charac-
teristic criteria of cysts and show them to be
anechoic. Retention cysts are also anechoic,
often with irregular texture, and frequently
hard to differentiate from other anechoic struc-
tures such as cross-sectional views of the
splenic artery, ectatic pancreatic duct with
stricture, dilated prepapillary CBD, and intra-
parenchymal necrosis (Figs. 4.22,4.23).
a Fig. 4.22 a Color duplex: myriad small cysts (C) in the
pancreas. VL = splenic vein; red = splenic artery.
a b Small pancreatic cyst (Z). Incidental finding in a
normal pancreas. Color-flow Doppler.
a c Cyst (Z) in chronic pancreatitis. Ectatic duct (DP),
pericystic calcification, fibrosis. AO = aorta; VL =
splenic vein.
► Pseudocysts_________________________________________________________________________________
Morphology. Ultrasound morphology differen-
tiates between microcysts of less than 10 mm
and macrocysts of more than 10 mm diameter:
symptomatic cysts usually have a diameter of
more than 60 mm. While in most cases micro-
cysts are simply ectatic sections of the pancre-
atic duct in chronic pancreatitis, filled with
clear juice, and should be properly classified
as retention cysts, the larger macrocysts tend
to be present in acute pancreatitis or an acute
episode of chronic pancreatitis. They are filled
with a greenish or brownish cloudy fluid of
inflammatory hemorrhagic nature. Pseudo-
cysts will develop in 5-15% of acute pancreati-
tis and 25% of chronic pancreatitis. Smaller
pseudocysts may resolve and vanish. The clas-
sification of pancreatic pseudocysts is listed in
Table 4.5.
Ultrasound findings. Some pseudocysts are
extremely large, filling most of the abdomen,
and ultrasound may not be able to retrace them
to the pancreas with certainty. Anechoic pseu-
docysts are rare; in most cases, they are filled
with hyperechoic irregular intrinsic structures
that (in infection, incidence 5%) are rooted in
pus and detritus or necrosis and blood clots
(Figs. 4.23-4.25).
Pathomorphology of Pancreatic Cysts
True cysts
► Congenital cysts. Their wall is made up of
simple epithelium, as in liver and kidney
cysts, and they are frequently found in
conjunction with them.
► Retention cysts. These represent ectatic
duct and branch segments and are filled
with clear pancreatic juice.
► Neoplastic cysts. These originate from
cystadenomas or cystadenocarcinomas;
their wall is made up of neoplastic epithe-
lium.
Pseudocysts
► Pseudocysts are the result of self-digestion
of the pancreas in trauma or inflammation.
► The walls of pseudocysts arise from the
reaction of the surrounding tissue to the
accumulation of inflammatory fluid.
► Pseudocysts are most often filled with
greenish or hemorrhagic cloudy secretion.
Table 4,5 Classification of Pancreatic Pseudocysts
Type I Pseudocysts in acute necrotizing pancreatitis:
usually, no communication with pancreatic duct
normal ERCP
Type II Pseudocysts after an acute episode of chronic pancreatitis:
often, communication with pancreatic duct
ERCP: irregular duct, no stenosis
Type III Retention cysts in chronic pancreatitis:
internal communication with pancreatic duct
ERCP: significant stenoses
ocal Changes 153
a Fig. 4.23 Microcyst (z) and macrocyst (Z) type II after
an acute episode of chronic pancreatitis: anechoic
mass in the body and tail of the pancreas. CB =
gallbladder.
a Fig. 4.24 Same patient as in Fig. 4.23. After five
months, spontaneous resolution of the pseudocysts;
hyperechoic calcification, shadowing (arrows). L =
liver; MA = stomach; P = pancreas; VL = splenic vein.
a Fig. 4.25 Incipient pseudocyst (C) after acute pan-
creatitis: predominantly hypoechoic mass with echo-
genic sediment. The stomach is displaced anteriorly.
► Necrosis__________________________________________________________________________________________
As the term implies, the severe course of acute
hemorrhagic necrotizing pancreatitis will pro-
duce necrosis within a few days after onset of
the disease. Frequently, it is accompanied by
collections of peripancreatic fluid, ascites
(around spleen, liver, kidney, and in the lower
abdomen/Douglas’s pouch), and pleural effu-
sion of the left lung (Fig. 4.26-4.28).
Ultrasonic differentiation between acute
edematous and hemorrhagic necrotizing pan-
creatitis is based on histopathological criteria:
however, in the early stages CT studies might
be useful for staging and in obtaining the base-
line status when surgery might be an option.
a Fig 4.26 Necrosis (N, calipers) in the tail of the pan-
creas (P), acute pancreatitis. M = stomach; AO =
aorta
a Fig. 4.27 Acute hemorrhagic necrotizing pancreatitis:
extensive edema of the pancreas (P), focal necrosis/
bleeding (horizontal arrow), hyperechoic peripancre-
atic fatty necrosis (arrows), fluid in the lesser sac (FL).
4 Pancreas 154
Abscess. Most abscesses arise from infected
necrosis; early fine-needle aspiration cytology
and culturing of the necroses is necessary in
order to decide on possible surgical interven-
tion. Fever and septic temperature are indica-
tive of abscess formation (Fig. 4.29).
a Fig. 4.28 Extensive anechoic liquid necrosis, severe
episode of acute hemorrhagic necrotizing pancreati-
tis.
a Fig. 4.29 Peripancreatic abscess after pancreatitis
(patient hospitalized because of septic temperatures,
no clinical sign of previous pancreatitis): irregularly
defined hypoechoic abscess formation (A) below the
liver with adjacent inflammatory lymphadenopathy
(LK); paracaval (VC) view high in the epigastrium:
evacuated by ultrasound-guided fine-needle aspira-
tion.
► Vessels/Duct System______________________________________________________________________________
Vessels. The splenic and gastroduodenal ar-
teries might be mistaken for microcysts, and
the splenic vein for the pancreatic duct
(Figs. 4.30, Fig. 4.31). Aneurysms of the splenic
artery are rare and can be reliably differenti-
ated from cysts by color-flow Doppler scan-
ning.
Ductal cysts. The pancreatic duct has numer-
ous variants. In most patients it is found off-
center at the junction between the middle and
posterior thirds of the pancreas. It turns caudad
in the pancreatic head, and in stenosis of the
papilla of Vater it can be traced as a dilated tube
running in parallel with the CBD. The cross-
sectional view of both ductal systems will vi-
sualize them as round cystic structures. Color-
flow Doppler scanning identifies them as ducts
and not blood vessels.
Dilated segments of the pancreatic duct due
to ductal obstruction in chronic pancreatitis
may mimic cysts and be easily misdiagnosed
(Fig. 4.32).
a Fig. 4.30 Splenic artery: anechoic cystic structures in
the body and tail of the pancreas (P. arrows). AO =
aorta; VRS = left renal vein: L = liver.
a Fig. 4.31 Microcysts in the pancreas; color-flow Dop-
pler scan: two metastases resolving under chemo-
therapy, no vascularization. Color- flow Doppler imag-
ing demonstrates the third anechoic mass to be the
splenic artery. A = lienal artery; M = stomach; VL =
splenic vein.
a Fig. 4.32 Significantly dilated prepapillary CBD (DC)
within the head of the pancreas (P). in sclerosis of the
papilla of Vater. VL = splenic vein; AO = aorta: VC -
vena cava; L = liver.
Hypoechoic Lesion____________________________________________________
► Dilatation of the Pancreatic Duct
— ► Neuroendocrine Tumors
► Pancreatic Cancer
► Metastasis, Malignant Lymphoma, Inflammatory Lymph Node
► Abscess
► Hemorrhagic/Calcified Cyst/Pseuodcyst
► Focal Pancreatitis
► Neuroendocrine Tumors
Neuroendocrine tumors comprise rare intra-
pancreatic tumors, stemming from the neural
crest, with possible endocrine activity. Because
the pancreas houses a large number of endo-
crine cells, endocrine tumors may arise here,
particularly insulinoma, a mostly benign tumor
while the gastrinoma as a rule can be detected
only after it has transformed into malignancy.
Even rarer entities are glucagonomas, VIPomas,
somatostatinomas, and carcinoid.
Because of their small size (< 2 cm), insuli-
nomas are hardly ever visualized on transcuta-
neous ultrasound; at best, the clinical diagnosis
in the fasting state can only be confirmed by
endosonography or intraoperatively.
Ultrasound studies show endocrine tumors
to be hypoechoic, round, and smoothly de-
lineated (Fig. 4.33a). Endosonography is the
most sensitive imaging modality in the diag-
nosis of neuroendocrine tumors. Endocrine tu- tq
mors appear as hypoechoic smooth, round
structures with increased vascularization;
however, further differentiation by ultrasonog-
raphy is not possible (Fig.4.33b).
Fig. 4.33 a Metastasizing neuroendocrine tumor (T)
of the head of the pancreas. AO = aorta; L = liver; P =
pancreas; VC = vena cava; VL = splenic vein.
b Insulinoma in the tail of the pancreas, also visual-
ized is the splenic vein. Endosonography (Dr. N.
Heyder, Munic).
Focal Changes
► Pancreatic Cancer__________________
Pancreatic cancer is a focal, defined solid lesion.
The most important criterion of malignancy is
its bulging contour: other diagnostic character-
istics are tumor spread, cut-off of the pancre-
atic duct, displacement, invasion, and locore-
gional as well as distant metastasis (Fig. 4.34).
Ductal pancreatic cancer arises from the epi-
thelium of rhe pancreatic duct and therefore
will result in a sudden cut-off of the duct and
prestenotic dilatation.
Periampullary cancer is a separate and quite
different entity because it is an adenocarci-
noma of the periampullary mucosa of the pa-
pilla of Vater.
Ultrasound findings. As in most other malig-
nancies, the texture of pancreatic cancer is hy-
poechoic, although assessment of the texture
depends on the echogenicity of the pancreas.
Since the gland may present as hypoechoic or
hyperechoic, depending on the age of the pa-
tient, pancreatic cancer will be demonstrated
not only as a hypoechoic structure within a
hyperechoic pancreas but also as an isoechoic
(quite rarely as hyperechoic) lesion within a
hypoechoic pancreas of normal texture.
p т
VL
« Fig. 4.34 Carcinoma (T) at the junction of the body
and tail of the pancreas: elliptical, hypoechoic mass
with irregular margins in an echogenic (lipomatous)
pancreas (P).
a В-mode image.
* b Color duplex scan. AL = splenic artery; VL = splenic
vein.
« d Carcinoma of the pancreas (T). endosonography:
multiple lymph nodes, the largest one with cursors.
Endosonography is the best imaging modality in the
diagnosis of small tumors and operability.
c Carcinoma at the body/tail of the pancreas with
infiltration (arrows) of the splenic vein (VL)
Histological Classification of Pancreatic Cancer
K©
Ln
4 Pancreas
Benign Pancreatic Tumors
► Adenomas, which are quite rare and arise
from the acinar or centroacinar cells
► Cystadenomas with cystic and solid parts:
cystadenomas are classified into mucinous,
macrocystic, and histologically most often
already malignant, types and the rather
rare microcystic benign cystadenoma
► Mesenchymal tumors (hemangioma,
lipoma)
► Endocrine tumors (insulinoma, gastri-
noma, VIPoma, and glucagonoma). Insu-
linoma and gastrinoma are the most
common endocrine tumors; rarely do they
exceed 1-2 cm and 2-4 cm in diameter,
respectively.
Malignant Tumors
► ductal carcinomas; accounting for 80% of
pancreatic malignancies, they arise from
the epithelium of the duct and originate
primarily in the head of the pancreas.
They comprise:
- Tubular adenocarcinoma
- Mucinous adenocarcinoma
- Adenosquamous carcinoma
- Squamous cell carcinoma
- Pleomorphic giant cell type carcinoma
► Endocrine tumors
► Acinar cell carcinoma.
► Metastasis, Malignant Lymphoma, Inflammatory Lymph Node
Differential diagnosis of suspected pancreatic
cancer has to consider endocrine tumors,
metastasis of, e.g., lung cancer or malignant
melanoma, and malignant lymphoma.
Metastases. These appear as smooth round or
polygonal structures and are almost impossible
to differentiate from primary pancreatic cancer
(Fig. 4.35).
Lymphoma. The pancreas is permeated by an
extensive intrapancreatic and extrapancreatic
lymph system, and therefore malignant lym-
phoma will manifest itself as intrapancreatic as
well as extrapancreatic neoplasm. It is seen as a
flat or bulky, primarily hypoechoic lesion
(Fig. 4.36).
Inflammatory lymph node. Sometimes there
are inflammatory lymph nodes along the pan-
creatic margin that may be difficult to separate
from the gland. In most cases, confirmation of
suspected malignancy has to await fine-needle
aspiration biopsy.
Fig. 4.35 Metastasis (M) of gastric cancer in the pan-
creatic head. AO = aorta; VL = splenic vein; P =
pancreas.
« Fig.4.36 High-grade non-Hodgkin lymphoma (T) in
the body/tail of the pancreas, sole manifestation.
Diagnosis confirmed by ultrasound-guided fine-nee-
dle aspiration biopsy. PK = head of pancreas; AO =
aorta: VC = vena cava; VL = splenic vein.
► Abscess
Abscess impresses as an anechoic or, more
commonly, hypoechoic mass; frequently, it
demonstrates intrinsic structures and may
then appear as a hypoechoic inhomogeneous
lesion (Fig. 4.29).
► Hemorrhagic/Calcified Cyst/Pseudocyst
Pancreatic pseudocysts may display a variety of
textures, but normally they are anechoic.
Bleeding or calcification in the wall will result
in a rather hypoechoic mass, even resembling a
tumor or abscess (Fig. 4.37).
* Fig. 4.37 Pancreatic pseudocyst (Z) with calcification
(arrows) at the margin, resembling a hypoechoic
(and not anechoic) cystic mass because of the super-
imposed incomplete shadowing. M = stomach with
impression.
► Focal Pancreatitis___________________________________________________________________________________
Focal pancreatitis of the head/tail of the pan-
creas resembles a tumor, making differentia-
tion from true malignancy difficult. The sus-
pected diagnosis of focal pancreatitis is based
on patient history and clinical symptoms, but it
should be remembered that pancreatic cancer
may also trigger acute pancreatitis. A special
form is “groove pancreatitis” (first described by
Becker), a focal pancreatitis affecting the head
of the pancreas around the intrapancreatic
common bile duct. In this case, any increased
tumor marker will subside after resolution of
the acute symptoms, while in pancreatic cancer
the marker will increase steadily. Fine-needle
aspiration biopsy will be of differential diag- D?
nostic value only if it is positive (Fig. 4.38, Table
4.6).
Fig. 4.38 о Focal pancreatitis in the head of the pan-
creas (P): hypoechoic, swollen, well-defined head
with calcifications, probably intraductal calculus (ar-
row): the swelling in the pancreatic head is almost
impossible to differentiate from cancer. L = liver: AO
= aorta: VL = splenic vein.
* b Acute attack of chronic pancreatitis: hypoechoic
swelling of the pancreatic head (PK) with compres-
sion of the inferior vena cava (VC). Arrow: dilated
pancreatic duct.
Focal Changes
«« c Focal pancreatitis in the pancreatic head, “groove
pancreatitis" with a duct stone, extracted endo-
scopically. Hypoechoic area in the uncinate process
around the common bile duct (DC). VL = splenic vein.
d Stenosis of the intrapancreatic common bile duct
(arrow): inflammatory wall thickening (calipers).
Table 4.6 Differentiating pancreatic cancer from focal pancreatitis
Contour
Texture
Delineation
Pancreatic duct
Surroundings
Color-flow duplex scanning
Pancreatic cancer
Bulging (leading sign), small “feet”
Homogeneous to finely mottled irregular (hy-
poechoic within hyperechoic basic texture,
isoechoic within hypoechoic basic texture)
Blurred to irregular, rarely smooth
Prestenotic dilatation common
Common: invasion of the duodenum and blood
vessels (splenic vein, celiac axis), locoregional
metastases, bile duct obstruction, gallbladder
with Courvoisier’s sign. Rarely: segmental
portal hypertension
Almost no intrinsic vascularization, invasion of
splenic vein and celiac axis
Focal pancreatitis
Bulging contour (head, tail), smooth/serrated
Hypoechoic—homogeneous (acute pancrea-
titis)
Hyperechoic—mottled to irregular (chronic
pancreatitis)
Well defined
Rarely dilated
Rarely: adhesive scarring of posterior gastric
wall/duodenum, thrombosis of splenic/portal
vein, bile duct obstruction
Normal or marked coloration
Isoechoic Lesion
4 Pancreas 158
— ► Pancreatic Cancer
► Malignant Lymphoma
► Focal Pancreatitis
► Pancreas Divisum
► Annular Pancreas
► Pancreatic Cancer______________________________________________________________________________
If the texture of the pancreas is hypoechoic, as
evidenced in slim young patients, the texture
of pancreatic cancer will be isoechoic and can
only be differentiated by its bulging contour
and any secondary signs. Cancers of the pan-
creatic tail and uncinate process are also hard
to detect, and at that only in the special planes
of the oblique/transverse epigastric views: on
the right for the head and on the left for the tail
of the pancreas (Figs. 4.39 and 4.40).
Fig. 4.39 Cancer of the pancreatic head in the un-
cinate process (T; calipers): isoechoic mass. Direc-
tion of spread is posterior, the splenic vein can no
longer be demonstrated; color-flow Doppler scan-
ning could help settle the issue of possible invasion
into the vena cava. AO = aorta; VL = splenic vein.
< Fig. 4.40 Pancreatic cancer: isoechoic texture of the
tumor invading the celiac axis and embracing the
hepatic artery (AH); inoperable. К = venous conflu-
ence; VC = vena cava.
► Malignant Lymphoma_____________________________________________________________________________________________________
Malignant lymphoma may also be isoechoic
with the pancreas, although its characteristic
texture is visualized as markedly hypoechoic
(Fig. 4.9).
► Focal Pancreatitis___________________________________________________________________________________
While in most cases acute focal pancreatitis
appears hypoechoic, chronic focal pancreatitis
may be isoechoic with the surrounding pancre-
atic tissue, and therefore can only be differen-
tiated by focal enlargement and a more macro-
nodular texture (Figs. 4.41 and 4.42).
Fig. 4.41 Acute pancreatitis: striking enlargement
(calipers) of the pancreatic head with isoechoic tex-
ture, tumorlike appearance; slightly inhomogeneous
hypoechoic overall pancreatic texture. The bulging
tumor cannot be differentiated from a malignant
mass. VL = splenic vein.
* Fig. 4.42 Isoechoic enlarged head of the pancreas:
chronic focal pancreatitis of the head with significant
focal enlargement; slightly irregular diameter of the
pancreatic duct (arrows), which is not dilated. VL =
splenic vein.
► Pancreas divisum__________________________________________________________________________
Congenital Anomaly—Pancreas divisum
During embryological development, the
smaller, originally ventral anlage and the
larger dorsal anlage fuse. The ventral anlage
constitutes the inferior parts of the head and
uncinate process of the pancreas, as well as
the main pancreatic duct, while from the
dorsal anlage emanate the remainder of the
pancreatic head, the entire body and tail, and
the anlage for the accessory duct of Santor-
ini. The latter may sometimes persist after
fusion and drains the pancreatic juice to the
minor papilla, or it may resolve and drain into
the main pancreatic duct to the papilla of
Vater.
Fusion anomalies (complete or incomplete
pancreas divisum) are quite common. The
accessory duct of Santorini will drain most
of the pancreatic juice via the minor papilla,
while the main pancreatic duct (of Wirsung)
drains part of the pancreatic head and the
uncinate process and displays either no
(complete pancreas divisum) or only a thin
(incomplete pancreas divisum) communica-
tion with the main duct (Fig. 4.43). The rel-
ative stenosis upstream of the minor papilla
may cause recurrent episodes of pancreatitis.
л Fig, 4.43 Schematic drawing of complete and incom-
plete pancreas divisum.
Focal Changes 159
Pancreas divisum is characterized by a strik-
ingly enlarged head of the pancreas with nor-
mal texture, segmental ductal dilatation in the
pancreatic body, and the demonstration of two
distinct ductal systems in the pancreatic head
(Fig. 4.43-4.45).
Fig. 4.44 Enlarged head of the pancreas.
a Impressing the posterior wall of the gallbladder
(arrow).
« b Impressing the vena cava (arrows). CT study sus-
pected malignancy. Ultrasound diagnosis: probably
pancreas divisum. ERCP: pancreas divisum.
Fig. 4.45 Pancreas divisum, recurrent pancreatitis.
a Longitudinal ultrasound view demonstrating two
pancreatic ducts (arrows). The ventral duct is seen to
possess a narrow communication with the main pan-
creatic duct (DP); the larger posterior duct is the
accessory duct of Santorini. VC = vena cava.
< b ERCP through the papilla of Vater, with visualiza-
tion of the CBD and rudiments of the main pancre-
atic duct.
► Annular Pancreas__________________
Annular pancreas is another example of an
isoechoic focal lesion with changes in size and
shape; only in rare instances is it completely
annular. In most patients it is completely or
incompletely annular around the pancreatic
head, which envelops the descending duode-
num and may result in stenosis.
In ultrasonography there is definite com-
pression of the descending duodenum by the
enlarged head of the pancreas, which is miss-
ing its usual border with the duodenum and
extends further to the right, posterior and lat-
eral to the duodenum ( kJ 4.2).
я 4.2 Annular Pancreas
4 Pancreas 160
► Annular pancreas: at the head
the pancreas presents as a
complete or incomplete ring
around the descending duo-
denum and may lead to steno-
sis.
a Pathological specimen (from: Riede
and Stolte, General and Special Pathol-
ogy, Thieme Verlag).
b Pancreatic tissue (P), unusually far to
the right: the descending duodenum
(D) is stenosed by the formation of the
pancreas. A = antrum, BD = duodenal
bulb. GB = gallbladder; II = uncinate
process: VC = vena cava; AO e aorta
c Transverse epigastric view. The pan-
creas (P) continues rather strikingly to
the right (arrows) posterior to the di-
lated (prestenotic) duodenum (BD). VL
= splenic vein.
L = liver
M = stomach
P = pancreas
VL = splenic vein
d and e Direct demonstration of the ring formation posterior to the duodenal bulb
in a view shifted somewhat compared with b and c. The CBD is also stenosed
upstream of the papilla (incidental clinical finding of cholestasis; the pancreas was
demonstrated first in the CT study).
DP = pancreatic duct
S = shadowing
AO = aorta
fand g Hypotone duodenogram and ERCP: stenosis of the descending duodenum.
In the ERC distal stenosis (not demonstrated here) of the CBD of intermittent
character and pancreatic duct enveloping the contrasted duodenum.
Hyperechoic Lesion_____________________________________________________
► Calcification/lntraductal Calculus
► Calcified Splenic Artery
► Microcalcification, Calcium Soap
► Intraductal Gas/Stent
► Hemangioma, Lipoma
► Calcification/lntraductal Calculus
The most striking, and in addition pathogno-
monic, criteria for chronic pancreatitis are cal-
cification and intraductal calculi. They are
made of calcium carbonate precipitates and
are located in the main pancreatic duct (intra-
ductal calculi) and the branching ductules (“pa-
renchymal calcification”). They appear as in-
tensively hyperechoic structures with poste-
rior shadowing (Fig. 4.46, Table 4.7).
◄ Fig. 4.46 Chronic calcifying pancreatitis with pancre-
atic duct stones (DP), and calcified areas in the
parenchyma.
a Fig. 4.47 a-c Chronic calcifying pancreatitis.
a Brightness picture: coarse diffuse echogenic struc-
ture with multiple posterior shadowing and summa-
tion shadowing. VL = splenic vein; AMS = superior
mesenteric vein, AO = aorta.
a b Color Doppler “twinkling artifact" with confetti
phenomena. VP = portal vein; VC = vena cava.
a c Trans-splenic section. Calcification (arrows) in the
tail of the pancreas, shadowing (S). Ml = spleen.
ocal Changes
Table 4.7 Diagnostic criteria for calcification/lntraductal calculi
Parenchymal calcification
Individual or multiple intensive echoes with
posterior shadowing; broad irregular band
of echoes
Summation shadowing with nonvisualiza-
tion of the structures behind
No landmark structure because of throm-
bosis or warping of the splenic vein, celiac
axis, aorta, and vena cava!
Intraductal calculi
Intensive echoes with posterior shadow-
ing, individual or loosely strung along the
duct
Dilatation of the prestenotic duct due to
calculi
► Calcified Splenic Artery__________________________________________________________________________________
Diffuse calcification of the splenic artery
presents as a similar structure (Fig. 4.48).
« Fig. 4.48 Echogenic calcified mottling (arrows): cal-
cified splenic artery. VL = splenic vein; P = pancreas.
► Microcalcification, Calcium Soap________________________________________________________________________
4 Pancreas 162
Microcalcification can be found in chronic pan-
creatitis, in pancreatic cancer, and as sclerosis
in arterial walls. Calcium soap as part of acute
pancreatitis will appear as focal echogenic peri-
pancreatic mottling/bands (Fig.4.49, 4.50 and
Fig. 4.24).
a Fig. 4.49 Echogenic microcalcification with shadow-
ing (S) in pancreatic cancer; cut-off of the pancreatic
duct (DP).
a Fig, 4.50 Microcalcification and macrocalcification
(arrows, shadowing S) in advanced pancreatic cancer
(T).
► Intraductal Cas/Stent----------------------------------------------------------------------------
After endoscopic intervention at the papilla or
pancreatic duct, gas (after papillotomy) or
stents may be evidenced as echogenic foreign
bodies within the duct (Fig. 4.51-4.53). Usually,
their differential diagnosis becomes self-evi-
dent from the patient’s history.
a Fig. 4.51 Pancreatic duct after ERCP; in serial views
the gas (arrows) beads around the duct on reposi-
tioning of the patient. P = pancreas; AO = aorta.
a Fig. 4.52 Echogenic stent in the pancreatic duct (ar-
row; DP). P = pancreas; VL = splenic vein; AO = aorta.
a Fig. 4.53 Diffuse pancreatic cancer in the head/body
of the pancreas (P) (calipers 20 mm); CBD stent (ar-
rows) in place. AO = aorta;.
► Hemangioma, Lipoma-------------------------------------------------------------
Hemangioma and lipoma will both be visual-
ized as round, intensively hyperechoic lesions
that cannot be differentiated by ultrasound.
Both are rare entities within the pancreas.Their
sonographic characteristics are those of typical
hepatic hemangiomas (Fig. 4.54).
◄ Fig. 4.54 Hyperechoic, smoothly delineated, ovoid
lesion at the junction of the pancreatic body and
tail: hemangioma (calipers differential diagnosis li
poma;) P = pancreas; AO = aorta.
Irregular Lesion
— ► Chronic Pancreatitis
► Focal Chronic Pancreatitis
► Pseudocyst
► Cystic Neoplasias: Cystadenonia/Cystadenocarcinoma
Focal Changes 163
► Chronic Pancreatitis_________________________________________________
If several or all of the criteria are present, quite
often chronic pancreatitis will resemble a
"lively" picture, where the individual criteria
(cyst, fibrosis, calcification, dilated duct) can
only be discerned with difficulty or not at all
(Fig. 4.55).
« Fig. 4.55 Chronic pancreatitis: without the splenic
vein as landmark structure (here thrombosed/oblit-
erated), the pancreas is almost impossible to delin-
eate (calipers): the “lively” image is due to ductal
ectasia (arrow), here, with calculus, fibrosis, calcifi-
cation, and microcysts. VC = vena cava; AO = aorta.
► Focal Chronic Pancreatitis___________________________________________
Here, too, the texture is heterogeneous, but
because of the fibrosis and/or calcification it is
micronodular to macronodular. Differential di-
agnosis has to consider pancreatic cancer
(Fig. 4.56).
Fig. 4.56 Mottled hypoechoic/hyperechoic texture
of the pancreatic head (P): focal chronic pancreatitis
in the head, cut-off of the pancreatic duct (DP)
(caution: cancer!)
► Pseudocyst________________________________________________________________________________
The retention cyst in chronic pancreatitis is
anechoic, while the inflammatory pseudocyst
in acute pancreatitis is characterized by detri-
tus, hemorrhage, and pus collections, constitut-
ing the “lively” ultrasound image of this lesion
with its hypoechoic as well as hyperechoic
areas (Fig. 4.57).
* Fig. 4.57 a Large, symptomatic pancreatic pseudo-
cyst: complex masses in the left upper abdomen.
Initial symptoms were caused by mass effects from
the cyst.
л b Incipient pseudocyst (Z) after acute pancreatitis:
complex mass displacing the hepatic artery (AH)
and splenic artery (AL). Color duplex. TR = celiac axis.
► Cystic Neoplasias: Cystadenoma/Cystadenocarcinoma
4 Pancreas 164
Cystic neoplasias of the pancreas are rare. Duc-
tal carcinomas comprise approximately 80% of
all malignant neoplasms of the pancreas, and
some 90% of those are ductal adenocarcinomas.
Variants are intraductal papillary mucinous
neoplasia and mucinous cystic neoplasia. The
most common differential diagnosis of pseudo-
cyst is versus neoplasms with a cystic appear-
ance (IPMN. MCN and SPN3) because the gross
appearance of the latter neoplasms may be
similar to that of pseudocysts. Histologically
and cytologically, however, pseudocysts differ
from the cystic neoplasms in that they lack any
epithelial lining but display hemorrhagic de-
bris and inflammatory cells. Moreover, pseudo-
cysts contain pancreatic enzymes, such as amy-
lase and lipase, and lack elevated levels of CEA
and CA 19-9.
► Mucinous Cystic Neoplasms (MCN)
MCNs of the pancreas affect women almost ex-
clusively, do not communicate with the ductal
system, and may be unilocular or multilocular.
More than 90% of MCNs occur in the body
and tail of the pancreas, where they form large
round cystic tumors showing a unilocular or
multilocular appearance and diameters be-
tween 2 and 35 cm (Fig. 4.58).
► Serous Cystic Neoplasms: Serous
Microcystic Adenoma (SMA)
Most common are SMAs, which make up 60%
of all SCNs. They present as single, well-circum-
scribed, slightly bosselated round tumors, with
diameters ranging from 1 to 25 cm.
About two thirds of the SMAs occur in the
body-tail region and almost all in elderly
women. They are usually found incidentally. Ul-
trasound shows numerous small (honeycomb-
like) cysts up to two cm. The tumor occurs pre-
dominantly in the head of the pancreas, where it
may obstruct the common bile duct and more
often the pancreatic duct (Fig. 4.59).
► Intraductal Papillary-Mucinous Neo-
plasms
IPMNs are characterized by intraductal prolif-
eration of mucin-producing cells, wich are ar-
ranged in papillary patterns. In many IPMNs
hypersecretion of mucin leads to a cystic dila-
tation of the involved ducts. In a few IPMNs,
focal or diffuse intraductal papillary growth
causes duct dilatation (Fig.4.60a).
► Ductal Adenocarcinoma and Variants
with Cystic Features
DACs and variants thereof showing cystic fea-
tures are relatively frequent among cystic tu-
mors and account for 10 %3 (Fig.4.60b).
► Solid Pseudopapillary Neoplasms (SPN)
SPNs are round tumors (diameters ranging
from 3 to 18 cm) which are found in any region
of the pancreas or loosely attached to it.
Table 4.8 is a summary list of the differential
diagnoses of diffuse and focal changes in the
texture and size of the pancreas.
a Fig. 4.58 Macrocystic cystadenoma (ZA) (confirmed
by histology): anechoic (cystic) and hyperechoic
(solid) regions of the tumors; longitudinal and trans-
verse epigastric view.
Fig. 4.59 a Microcystic cystadenoma of the pancreas
(calipers), confirmed by histology: hypoechoic mi-
crocystic tumor with a larger cyst (Z); cut-off of the
pancreatic duct (DP). After two year follow-up there
has so far been no change of this finding in a rather
old female patient. AO = aorta; VL = splenic vein.
b Microcystic cystadenoma: large tumor (T) of the
head of the pancreas with microcysts and spot-like
vascularization. VP = portal vein.
Dilatation of the Pancreatic Duct
Under good conditions ultrasound will demon-
strate the normal pancreatic duct in the body of
the pancreas as a narrow anechoic ligamentous
structure with delicate, smooth, echogenic
margins. If it appears marked or dilated, it
may be traced all the way to the papilla of
Vater (Fig. 4.60).
In dilatation of the pancreatic duct, appro-
priate views (oblique or sagittal epigastric) will
help identify and differentiate the nature of the
obstruction. A ductal diameter of 2 mm or less
is considered normal. The marginal diameter of
2-4 mm is much more common; its assess-
ment can be difficult, in which case additional
diagnostic measures are called for to settle the
issue. The widely dilated duct is found in
chronic pancreatitis, cancer, and metastasis.
Table 4.9 lists possible causes.
л Fig. 4.60 a Malignant pancreatic pseudocyst. The
celiac axis (TR) and splenic vein (VL) have been infil-
trated by a papillary bile-duct carcinoma invading the
pancreas, forming a malignant pseudocyst. AO =
aorta.
a b Intraductal Papillary-Nucinous Neoplasm (?). iden-
tified histologically as mucinous ductal carcinoma
Ultrasound shows a small, solid, cystic tumor with
smooth marginsand moderately large echo-free areas
(C) displacing, but not infiltrating, the portal vein. I he
disease took a relatively benign two-year course.
Table 4.8 Differential diagnosis of textural and ductal changes
Structural change
Diffuse Focal Anechoic lesion - pancreatic cysts/pseudocysts - renal/splenic cyst - splenic artery - gastroduodenal artery - arterial aneurysm - pancreatic duct - dilated prepapillary CBD
Hypoechoic structure - juvenile pancreas - acute pancreatitis - cancer with diffuse spread - autoimmune chronic pancreatitis Hypoechoic lesion - pancreatic cancer - necrosis/hemorrhage - hemorrhagic pancreatic cyst/ pseudocyst - abscess - focal acute pancreatitis of the head/tail - metastasis of cancer - metastasis of lymphoma - peripancreatic inflammatory lymph node
Hyperechoic texture - pancreas in the elderly - pancreatic lipomatosis/fibrolipomatosis - pancreatic fibrosis in hemochromatosis/ cystic fibrosis - chronic pancreatitis (with fibrosis/ calcification) Hyperechoic/echodense lesion - intraparenchymal calcification - intraductal calculus of the pancreatic duct - stented pancreatic duct - intraductal gas bubbles - calcified splenic artery - calcified tumor
Irregular/heterogeneous structure - pseudocystic transformation of the pancreas - acute pancreatitis - chronic pancreatitis Irregular/heterogeneous lesion - pancreatic pseudocyst - cystadenoma - pancreatic cancer - focal chronic pancreatitis
Size change Diffuse Focal
Enlarged - juvenile pancreas - acute pancreatitis - pancreatic edema - diffuse cancer - pancreas divisum Variant shapes - bar-bell - tadpole Pancreatitis - pancreatitis of the head - pancreatitis of the tail
Reduced - pancreas in the elderly - atrophic pancreas (terminal stage of chronic pancreatitis) - status post necrotizing pancreatitis - status post surgery - advanced pancreatitis fibrosis (hemochromatosis) Pancreatic cancer Enlarged head in pancreas divisum and annular pancreas
Dilatation of the Pancreatic Duct 165
Table 4.9 Causes of pancreatic duct dilatation
Ductal diameter marginal Ductal diameter > 4 mm Ductal diameter > 4 mm
(2~4 mm)
Smooth Smooth Convoluted
Postprandial Pancreatic cancer Chronic pancreatitis
cholelithiasis Periampullary cancer Atrophy in chronic
pancreatitis
Pancreas divisum Chronic pancreatitis
Obstructive chronic
pancreatitis
Marginal/Mild Dilatation
4 Pancreas 166
► Bile Duct Disorder
► Acute/Recurrent Pancreatitis, Pancreas Divisum
► Chronic Pancreatitis
► Periampullary Cancer, Cancer of the Pancreatic Head
► Bile Duct Disorder___________________________________________________________________________
Marginal diameters of 2-3 mm occur as a post-
prandial functional response, but often they are
based on a disease of the biliary system. In the
case of somewhat blurred ducts, it is well
worth the effort to take a look at the gallblad-
der and to trace the CBD all the way to the
papilla of Vater. In many cases, ductal dilatation
is nothing more than postcholecystectomy,
often preceded by recurrent colics (with ac-
companying pancreatitis?). The underlying
cause would have to be increased intraductal
pressure (Fig.4.61).
a Hg. 4.61 Pancreatic duct of marginal diameter.
a Postprandial: marked pancreatic duct (calipers) of
normal diameter in postcholecystectomy; echogenic
peripancreatic bandlike mass (arrows): fatty necrosis
after biliary pancreatitis? MA = stomach; L = liver.
a b Dilated pancreatic duct (arrows) in post-
cholecystectomy. К = venous confluence; AO = aorta;
L = liver
► Acute/Recurrent Pancreatitis, Pancreas Divisum
Here, ductal dilatation is infrequent since this is
counteracted by the edema. However, if there
is edema the differential diagnosis should in-
clude biliary pancreatitis and obstruction of the
pancreatic duct (Figs. 4.62 and 4.63).
a Fig. 4.63 Pancreas divisum. CB - gallbladder; DP =
pancreatic duct.
a Longitudinal section through the accessory duct
of Santorini; two duct systems are evident in the head
of the pancreas (arrows).
a b Shifted view: oblique section through both ducts
(accessory and main pancreatic duct) which are vi-
sualized as being dilated. GB = gallbladder; DP =
pancreatic duct.
a Fig. 4.62 Pancreas divisum: prominently dilated
stubby pancreatic duct terminating in a cul de sac;
dilated accessory duct (of Santorini), which has taken
over as primary drain via the minor papilla (see
Fig. 4.45, p. 159, years later; filling via the major
and minor papilla).
► Chronic Pancreatitis
Dilatation of the pancreatic duct in chronic
pancreatitis tends to be more marked rather
than marginal. The obstruction may be caused
by intraductal calculi, prepapillary gallstones,
protein plugs, and in a few rare cases a slowly
growing malignancy. The fibrosis of the adja-
cent tissue can result in a tortuous duct with
variations in its diameter, beaded irregularities,
and twisting, mostly in an advanced state
(Fig. 4.64).
* Fig. 4.64 Dilated undulating pancreatic duct (ar-
rows) in chronic pancreatitis (P). This appearance of
the duct is characteristic of chronic pancreatitis and
not ductal obstruction. VL » splenic vein; VC = vena
cava.
► Periampullary Cancer, Cancer of the Pancreatic Head
Here, dilatation of the pancreatic duct is nor-
mal and in the advanced stage quite marked.
Cancer of the tail of the pancreas will not result
in ductal dilatation, while cancer of the unci-
nate process will sometimes do so. Cancer in
the head of the pancreas is usually accompa-
nied by dilatation of the CBD (Fig. 4.65).
a Fig. 4.65 Dilated prepapillary ducts.
a Transverse epigastric view: cross-sectional view of
the pancreatic duct (DP) and CBD (CH) (double-duct
sign); periampullary ductal cancer of the pancreas.
The carcinoma could not be demonstrated on ultra-
sound or CT scanning. AO = aorta; VC = vena cava; VL
= splenic vein; P = pancreas.
л b ERCP film with tumorous void in the pancreatic
duct.
Dilatation of the Pancreatic Duct 167
Marked Dilatation_______________________________________________________________
► Chronic Pancreatitis
► Intraductal Mass
► Pancreatic Cancer
► Chronic Pancreatitis_________________________________________________________________________________
According to the Marseille Classification, calcu-
lous obstruction with dilatation of the pancre-
atic duct is classified as obstructive chronic
pancreatitis. The calculus will be visualized
when following the duct sonographically to
the papilla of Vater. One treatment option is
ultrasound guided lithotripsy (Fig.4.66).
Prominent dilatation of the pancreatic duct
with no obstruction delineated on ultrasound
or endoscopy is also seen in the rare patient
with chronic autoimmune pancreatitis. In
these cases, it is of vital importance that possi-
ble malignancy be ruled out for certain
(Fig. 4.67).
4 Pancreas 168
Fig. 4.66 Dilated pancreatic duct (DP) in chronic ob-
structive pancreatitis. L = liver: VL = splenic vein.
a Site of the obstruction (gallstone; acoustic shadow
S) at the junction of the head and body. Subsequent
prestenotic dilatation of the duct. Patient presented
clinically with diabetes mellitus.
« b Color duplex: the “twinkling artifact” aids in stone
detection (as with renal stones). VL = splenic vein;
DP = pancreatic duct.
a Fig. 4.67 Chronic pancreatitis. Clinical symptoms:
diabetes and weight loss. VL = splenic vein; К = ve-
nous confluence.
a Prominent undulating dilated duct (DP). ERCP: no
obstruction, no branches whatsoever.
a b Same patient after one year: additional loss of the
pancreatic duct. Without knowledge of the previous
findings and the clinical symptoms, the diagnosis of
CP would have been missed. VL = splenic vein.
a c Color-flow Doppler scan: no dilatation of the duct
evident, atrophy of the pancreas, no history of pan-
creatitis, probably primary autoimmune chronic pan-
creatitis.
► intraductal Mass________________
By far the most common causes of intraductal
mass are echogenic calculi with posterior shad-
owing, followed by sediments and pus, while
protein plugs are infrequent findings (Fig.
4.68).
* Fig. 4.68 Chronic (autoimmune?) pancreatitis, ec-
tatic duct with protein plug (DP, arrow); ERCP: wide
open papilla of Vater; biopsy and cytology negative
three years after these procedures periampullary
carcinoma. Surgery confirmed the protein plug
AMS = superior mesenteric artery; AO = aorta.
► Pancreatic Cancer______________
Dilatation of the pancreatic duct without dis-
cernible cause of the obstruction has to raise a
high degree of suspicion of malignancy unless
another cause can be confirmed (calculus, fi-
brosis, pseudocyst, twisted duct, ductal stric-
ture). Ultrasound will demonstrate the duct all
the way to the tumor. In the selective enlarge-
ment, the ductal cut-off will be either ovoid,
convex, or tapering.
Concurrent dilatation of the CBD is indicative of
a malignancy in the vicinity of the papilla (peri-
ampullary cancer) and is termed “double duct
sign”. ERCP with brush cytology and ductal
biopsy or CT study will help with the final
diagnosis: fine-needle aspiration biopsy should
be reserved for uncertain findings and inoper-
able cases because of the risk of implantation of
tumor cells along the needle track.
In 5 to 10%3 of patients, pancreatic cancer will
coexist with chronic pancreatitis. The cumula-
tive risk of pancreatic cancer in chronic pan-
creatitis is 1.8% after 10 years, and 4% after 20
years. Therefore, chronic pancreatitis is consid-
ered a precancer. When the symptoms persist,
cancer cannot be ruled out and the issue has to
be settled by surgery (Figs. 4.69-4.71).
* Fig. 4.69 Pancreatic duct (DP) with prestenotic dila-
tation and ductal cut-off without direct visualization
of the tumor; but, together with the cut-off (arrow),
the diffuse ill-defined enlarged head of the pancreas
suggests the malignancy. AO = aorta.
a Fig. 4.70 Small cancer (T) of the pancreatic head;
duct (DP) with prestenotic dilatation; dilated CBD
(DHC) and cystic duct (DCY).
Table 4.10 summarizes the differential diagno-
sis of the pancreatic duct with prestenotic di-
latation.
a Fig. 4.71 Cancer (T) of the uncinate process. AO =
aorta; VC = venous confluens; VL = splenic vein.
о With invasion of the pancreatic duct (arrow. DP).
л b Color-flow Doppler scan: invasion of the splenic
vein. The invasive spread confirms malignancy and
rules out surgery as an option.
Table 4.10 Differential diagnosis of the pancreatic duct with prestenotic dilatation
Dilatation of the Pancreatic Duct 169
Intraductal calculus
Pancreatic cancer
Metastasis/lymphoma
Periampullary cancer (pancreas/CBD)
Pancreas divisum
Hard echo due to calculus, posterior shadowing
Frequently in the head/body of the pancreas
Hypoechoic (isoechoic) tumor mass downstream of the stenosis
Tapered or convex cut-off of the duct (on selective enlargement)
Impossible to differentiate from pancreatic cancer by ultrasound morphology alone
(ultrasound-guided fine-needle aspiration biopsy)
Concurrent dilatation of the pancreatic duct and CBD
Usually, no direct visualization of the tumor possible
Ductal cut-off in the head/body without definite cause
Conspicuously enlarged head of the pancreas
Demonstration of two ductal systems in the pancreatic head
References
1. Bosseckert H. Diagnosestandards bei chronischer
Pankreatitis (CP) - Bildgebende Verfahren. Verh
Dtsch Ges Verdau.- u. Stoffwechselkr. 1991;26:53.
2. Etemad B, Whitcomb DC. Chronic Pancreatitis:
Diagnosis, Classification and New Genetic Devel-
opments. Gastroenterology 2001; 120: 682-707.
3. Kloppel G, Kosmahl, M. Cystic Lesions and Neo-
plasms of the Pancreas. Pancreatology, Basel 2001.
4. Lankisch PG, Lohr-Happe A, Otto J, Creutzfeldt W.
Natural course in chronic panreatitis. Pain, exo-
crine pancreatic insufficiency and prognosis of
the disease. Digestion 1992;54:148-55.
5. Lankisch PG, Staritz M, Freise J. Sicherheit bei der
Diagnostik der chronischen Pankreatitis. Z Gas-
troenterol 1990;28:253.
6. Loser CH, Folsch UR. Diagnostik der chronischen
Pankreatitis. Dtsch Med Wschr 1996;121:243-7.
7. Lowenfels AB. Maisonneuve P, Cavallini G et al.
International Pancreatitis Study Group. Pancrea-
titis and the risk of pancreatic cancer. N Engl J
Med 1993;328:1433-7.
8. Sarner M, Cotten PB. Classification of pancreatitis.
Cambridge 1983. Gut 1984;25:756-9.
9. Singer MV, Gyr K, Sarles H. Revidierte Klassifika-
tion der Pankreatitis - Marseille 1984. Inn Med
1985;12:242-5.
10. Taniguchi T, Seko S, Azuma K, Tamegai M, Nishida
O, Inone F. Okamoto M, MizumotoT, Kobayashi H.
Autoimmune Pancreatitis detected as a mass in
the tail of the Pancreas. Am J Gastroenterol 1995;
90:1834-7.
Spleen 173
▼ Nonfocal Changes of the Spleen
Diffuse Parenchymal Changes
Malignant Invasion
► Benign Nonhomogeneity
▼ Large Spleen
176
176
177
— ► Infection
— ► Congestive Splenomegaly
L—► Systemic Hematological Malig-
nancy
▼ Small Spleen
180
Variants. “Aged Spleen”
► Functional Hyposplenism/Asplenia
▼ Focal Changes
▼ Anechoic Mass
— ► Dysontogenetic Cysts
— ► Pseudocysts
— ► Infective Cysts
▼ Hypoechoic Mass
— ► Invasive Lymphoma
— ► Splenic Infarction
— ► Splenic Abscess
► Splenic Trauma
----► Splenic Metastasis
▼ Hyperechoic Mass
► Hemangioma
► Hamartoma
---► Lymphoma and Myeloproliferative
Disorders
▼ Splenic Calcification
- ► Focal Calcification
—-► Diffuse Calcification
► Vascular Calcification
5 Spleen
The spleen appears about the fifth week of
embryonic development as a localized thicken-
ing of the coelomic epithelium of the dorsal
mesogastrium near its cranial end. Its charac-
teristic shape is evident even during initial de-
velopment, and the early lobulated appearance
of the fetal spleen will resolve until birth. The
spleen fulfills numerous functions:
► Hematopoiesis: normally only during fetal
life
► Immune function: antibody and lympho-
cyte production
► Erythrocyte storage: in the human spleen
not nearly as marked as in other species
► Phagocytosis: removal of old and patholog-
ical blood cells, immune complexes, and
particulate matter in the bloodstream.
The arterial hemodynamics of the spleen must
be viewed within the context of the other
splanchnic organs. On the venous side it is
regarded as part of the portal venous system.
5 Spleen 173
Anatomy_______________________________
Size
► Length along the maximum cephalocau-
dal diameter < 11 cm
► Thickness from hilum to surface (cortex)
< 5 cm
Shape
► Crescent/coffee bean configuration,
highly variable
Size. Intercostal scanning will provide the most
reliable measurements of splenic dimensions.
In this view the largest distance between the
two poles should be determined (maximum
length). The thickness is determined orthogo-
nal to the maximum length by measuring from
the hilum to the apex of the splenic convexity
(Fig. 5.1). Additional measurement of the width
for computation of the splenic volume by the
ellipsoid method has not become part of rou-
tine clinical practice.
Normal dimensions of the adult spleen are a
maximum length < 11 cm and a thickness <
5 cm. The severity of any splenomegaly de-
pends on the size of the spleen:
► Mild to moderate: > 5 cm * 11 cm
► Marked: > 6 cm * 16 cm
► Extreme: > 8 cm * 20 cm
Any splenic dimensions above these normal
values have to result in the presumed diagnosis
of an enlarged spleen. Depending on the pa-
tient’s age (juvenile) and physique, a slightly
longer and thinner (asthenic) or shorter and
plumpish (pyknic) spleen can be regarded as
normal. During childhood the spleen tends to
be smaller.
Shape. The shape of the spleen is that of a half-
moon or crescent/coffee bean but is highly var-
iable and depends on the plane of the ultra-
sound view. The diaphragmatic surface is con-
vex and smooth, while the concave visceral
surface presents gastric, renal, pancreatic, and
colic impressions.
Vestiges of the complex embryological de-
velopment of the splenic anlage in the dorsal
mesogastrium may also be found as notches
and septa in the diaphragmatic surface
(Fig. 5.2). Complete congenital cleft with sepa-
rate hilar blood supply may be demonstrated in
rare cases (Fig. 5.3).
Sometimes branches of the vasculature pen-
etrate the visceral surface at various points. In a
few patients, blood vessels terminating on the
diaphragmatic aspect will also be seen. Usually,
the splenic vein has a diameter < 0.5 cm and
runs straight from the hilum of the spleen.
Varicosities and kinking along the course of
these vessels have been visualized.
Ultrasound texture. Comparison of the
healthy liver and spleen in the same patient
demonstrates a slightly diminished echogenic-
ity of the spleen, but the organ is significantly
more echogenic than the kidney.
a Fig. 5.1 Sonographic illustration of the splenic hilum
with assessment of length (Di) and thickness (D2).
a Fig. 5.2 Splenic septa at the diaphragmatic aspect
may become evident in the presence of ascites (A).
Milz = spleen; Niere = kidney.
a Fig. 5.3 Congenital cleft of the spleen (S) with dem-
onstration of separate hilar blood supply (arrows).
Topography___________________________
The spleen is situated principally in the left
hypochondric region of the abdomen and is an
almost completely intraperitoneal organ. Its
convex diaphragmatic aspect is in wide rela-
tion with the abdominal surface of the dia-
phragm (Fig. 5.5). Posterior and lateral protec-
tion is by the 9th to 12th ribs, and the organ is
covered by the costophrenic recess, which may
extend down as far as the inferior border of the
organ. The longitudinal axis of the spleen
roughly parallels the course of the 10th rib.
The anteromedial aspect of the concave gastric
surface is in relation with the posterior wall of
the gastric body, while the inferior renal sur-
face abuts the superior pole of the left kidney
5 Spleen 174
(Fig. 5.6). The anteroinferior aspect of the
spleen is in close relation with the left colic
flexure (Fig. 5.4).
Apart from the hilum, the spleen is almost
entirely surrounded by peritoneum. It remains
connected with the stomach by a peritoneal
fold, the so-called gastrosplenic ligament
(Fig. 5.7). Visualization of the splenorenal liga-
ment depends on the extent of fusion with the
dorsal peritoneum. Sometimes the gastro-
splenic ligament may become evident in pa-
tients with ascites. In the presence of an en-
larged left hepatic lobe the liver may be in
contact with the diaphragmatic aspect of the
spleen and cover it like a cap (Fig. 5.8).
Blood vessels. The splenic artery originates at
the celiac axis and then runs straight along the
superior margin of the pancreas. On arriving
near the spleen it follows a rather tortuous
course and close to the hilum it divides into
several branches. There are only infrequent
variants of its origin at the celiac axis. The
segmental branches of the splenic artery are
terminal arteries resulting in separate splenic
segments. The spleen is tied into the systemic
circulation via the splenic artery, and into the
portal circulation via the splenic vein (в 5.1 d
and e). The trunk of the splenic vein (some-
times located up to 6 cm from the actual
Relations (Fig. 5.4)
► Diaphragmatic surface with the left dome
of the diaphragm
► Gastric surface with the posterior gastric
wall
► Renal surface with the upper pole of the
left kidney
► Pancreatic tail touching the hilum of the
spleen
Ultrasound landmark structure
► Hilar blood vessels of the spleen
splenic hilum) commences from several tribu-
taries issuing from the stomach and spleen,
courses posterior to the tail and body of the
pancreas, and unites with the superior mesen-
teric vein to form the portal vein.
Vascular appearance. On color-flow Doppler
scanning, the vascular appearance is domi-
nated primarily by the spokelike course of the
segmental arteries and veins, which run in fan-
like fashion to and from the splenic hilum,
respectively (B 5.1a and b). The arterial blood
is supplied by the splenic artery (B 5.1c) and
only rarely via accessory arteries in the gastro-
a Fig. 5.4 Anatomical relations of the spleen, pancreas,
stomach, and kidney.
splenic ligament. The trunk of the splenic vein
is a landmark structure in ultrasound studies
for locating the tail of the pancreas (в 5.1 f and
g). Quite frequently it is possible to visualize
the area of the pancreatic tail by insonation
through the spleen from the patient’s left side
(“ultrasound window”); this might be possible,
even if the tail of the pancreas cannot be dem-
onstrated from anterior because of intestinal
gas (B 5.1 h and i).
л Fig. 5.5 Left lateral intercostal view. D =diaphragm.
a Visualization of the anterior crus of the diaphragm.
LU = lung.
a b Dome of the diaphragm and the posterior crus of
the diaphragm (arrows).
a Fig. 5.7 Transverse left hypochondric view visualizing
the gastrosplenic ligament (arrows) due to the pres-
ence of intraperitoneal fluid. The ligament is anterior
of the lesser sac (BO). CO = venous confluence; S =
spleen; LE = liver; MA = stomach.
a Fig. 5.6 Splenic dimensions.
a Maximum length (polar diameter).
a b Transverse view visualizing the posterior renal and
anterior gastric aspects. N = kidney; M = stomach; C =
posterior shadowing of the rib.
a Hg. 5.8 In hepatomegaly the liver (L) may cap the
spleen (M). N = kidney.
В 5.1 Blood Supply of the Spleen
► Parenchymal vessels
a 1: subsegmental arteries
2: segmental arteries
3: hilar artery
b 4: subsegmental arteries
5 Spleen 175
► Splenic artery
a and b Vessels of the splenic parenchyma on color-flow Doppler imaging.
c Quite often the splenic artery (AL)
displays a tortuous course. VL = splenic
vein; AO = aorta; tr = celiac axis; P =
pancreas.
d The splenic artery (AL) courses
through the pancreas.
► Splenic vein
e In the vicinity of the splenic hilum the
splenic vein (VL) will be visualized pos-
terior to the pancreas.
fand g Color-flow Doppler imaging: splenic vein (VL) at the central hypochondric
region and the hilum of the spleen. P = pancreas; CO « venous confluence; AO =
aorta; AL = splenic artery; S = spleen.
h Landmark structure: splenic vein (V).
Quite often the pancreatic tail cannot
be visualized because of the gastric gas.
P - pancreas; Milz = spleen.
i The region of the pancreatic tail (P)
may be assessed by insonation through
the spleen. P = pancreas; V = splenic
vein; SP - spleen.
Nonfocal Changes of the Spleen
5 Spleen 176
► Malignant Invasion
► Benign Nonhomogeneity
Diffuse Parenchymal Changes_______________________________________
Diffuse nonhomogeneity of the splenic texture
is rare, especially when compared with textural
nonhomogeneity of the liver. Definite diagnosis
is based on history, clinical picture, sono-
graphic follow-up, and possibly ultrasound-
guided fine-needle aspiration biopsy2.
The sonographic appearance is character-
ized by a "subjectively" inhomogeneous
splenic parenchyma without definite delinea-
tion of individual focal masses (compared with
healthy hepatic parenchyma, the tissue of the
healthy spleen appears somewhat “more ho-
mogeneous"). However, the transition to focal
micronodular splenic disorder is fluent.
► Malignant Invasion____________________________________________________________________
Diffuse splenic change as a sign of malignant
invasion is frequently found in low-grade lym-
phomas (Fig. 5.9), in Hodgkin disease
(Fig. 5.10), and rarely as diffuse splenic invasion
by a solid tumor (Fig. 5.11).
a Fig. 5.9 Splenomegaly with coarse splenic paren-
chyma in malignant lymphoma. This finding is com-
patible with splenic invasion.
a Fig. 5.10 Diffuse textural nonhomogeneity compati-
ble with splenic invasion in Hodgkin disease.
a Fig. 5.11 Coarse splenic parenchyma in metastasizing
breast cancer. This finding is suspicious for splenic
metastasis.
► Benign Nonhomogeneity___________________________________________________________
Diffuse nonhomogeneity may be demonstrated
in some cases of:
► Collagen disease (e.g., rheumatoid arthritis,
lupus erythematosus, polyarteritis nodosa)
► Benign granulomatous disease (Fig. 5.12)
(e.g., tuberculosis, Wegener granulomatosis,
sarcoidosis)
► Bacterial infection
► Amyloidosis (Fig. 5.13)
► Obstruction of the splenic artery
► Thorotrast exposure (Fig 5.14)
► Portal hypertension (Fig. 5.15)
► Incidental finding in “healthy" patients
(Fig. 5.16)
a Fig. 5.12a and b Diffuse textural nonhomogeneity of the spleen (S) with undulating surface in Wegener disease.
This finding is compatible with granulomatous invasion.
** Яд. 5.13 Coarse splenic parenchyma in amyloidosis.
Color-flow Doppler scanning cannot demonstrate
any flow signals. This finding is indicative of func-
tional hyposplenism.
Fig. 5.14 Small spleen with increased echogenicity in
known thorotrast exposure. M = spleen. Niere =
kidney; Lunge = lung.
** Fig. 5.15 Coarse splenic parenchyma in long-term
portal hypertension and hepatic cirrhosis. This find-
ing is compatible with splenic fibrosis. LU = lung.
< Fig. 5.16 Textural nonhomogeneity of the spleen in a
patient without obvious clinical pathological find-
ings. The etiology remains uncertain.
Nonfocal Changes of the Spleen
Large Spleen______________________________________________________________
cu
— ► Infection
► Congestive Splenomegaly
► Systemic Hematological Malignancy
Differential diagnosis of splenomegaly covers
an extremely wide range of possibilities (Table
5.1). From experience, any ultrasound study of
the spleen is not by itself sufficient for pin-
pointing the definite cause of splenomegaly.
Severity. Although the size of the spleen may
vary rather widely between patients with the
same disease, assessing the dimensions of the
organ may yield some differential diagnostic
clues.
Mild to moderate splenomegaly is encoun-
tered, e.g., in infections and granulomatous
disease (Fig. 5.17), portal hypertension
(Figs.5.20 and 5.21), and acute leukemia.
Severe splenomegaly is typical of, e.g., ma-
lignant lymphoma, hemolytic anemia
(Fig. 5.18), storage disease, infectious mononu-
cleosis (Fig. 5.19), and leishmaniasis.
Extreme splenomegaly is seen in myelofibrosis,
in terminal chronic myelocytic leukemia
(Fig. 5.23), and also in advanced low-grade ma-
lignant lymphomas (Fig. 5.24). In some cases
ultrasound may not be able to ascertain the
exact size of the spleen.
* Fig. 5.17a and b Hepatosplenomegaly in sarcoido-
sis. Hepatic involvement was confirmed by histology
178
Fig. 5.78 A 40-year-old patient with spherocytosis.
a Frequently there are bilirubin gallstones in the
gallbladder (GB) due to the chronic hemolysis.
« b Splenomegaly. GB = gallbladder; VP = portal vein.
Table 5.1 Possible causes of splenomegaly
Acute and chronic systemic infection
Infectious mononucleosis, chickenpox, hepatitis, AIDS, sepsis, endocarditis, typhus, tuber-
culosis, malaria, toxoplasmosis, leishmaniasis, candidiasis
Disorders of the portal circulation
Hepatic cirrhosis, thrombosis of the portal and splenic veins, AV fistula of the spleen
Hemolytic disorders
Pernicious anemia, spherocytosis, thalassemia, sickle-cell anemia
Malignant systemic disease
Leukemia, myeloproliferative disorders, myelodysplastic syndrome, non-Hodgkin lymphoma,
Hodgkin lymphoma, malignant histiocytosis, systemic mastocytosis
Immune disorders
Collagen disease, idiopathic thrombocytopenic purpura, Evans syndrome
Other
Amyloidosis, Wegener disease, sarcoidosis, hemochromatosis, lipidosis
► Infection_______________________________________________________________________________________________
In viral or bacterial infections, moderate sple-
nomegaly will sometimes display a slightly
inhomogeneous splenic parenchyma without
definite delineation of focal masses. In a few
patients, infectious mononucleosis may be
accompanied by extreme splenomegaly
(Fig. 5.19). Complete resolution of this state
may take months. Spontaneous splenic hemor-
rhage or rupture after inadequate incidental
trauma has been reported in a rare few cases,
mostly in spleens with rapidly enlarged vol-
ume.
Fig. 5.19 Infectious mononucleosis.
a Marked splenomegaly (M).
b The splenic enlargement resolved over time
(3 months).
► Congestive Splenomegaly______________________________________________________________
Hepatic cirrhosis and portal hypertension.
Splenomegaly will be observed in 50-75% of
patients with cirrhosis of the liver and portal
hypertension (Figs. 5.20 and 5.21). The causes
are:
► Passive congestion (diminished portal ve-
nous outflow)
► Hypercirculation (increased splanchnic in-
flow)
► Intrinsic splenic factors (e.g.. autoimmune
processes)
This is counteracted by hemodynamically im-
portant portosystemic shunts, the extent of
which may vary significantly from patient to
patient. A regular-sized spleen does not rule
out portal hypertension.
Splenic vein thrombosis. In thrombosis of the
splenic vein, splenomegaly will be observed in
approximately 60% of patients. A regular-sized
spleen does not rule out splenic vein thrombo-
sis. Ultrasound will visualize thrombosis of the
Fig. 5.20 Cirrhosis of the liver.
a Hepatic cirrhosis (L) and ascites confirmed by his-
tology.
splenic vein as a homogeneously echogenic
mass of varying severity within the lumen of
the vessel (Fig. 5.22). Color-flow Doppler imag-
ing will demonstrate the lack of flow as well as
the collateral circulation and thus confirm the
preliminary diagnosis.
« b Congestive splenomegaly (S).
Nonfocal Changes of the Spleen 179
Fig. 5.21 Congenital hypoplasia of the portal vein.
a Hypoplasia of the portal vein and esophageal vari-
ces.
« b Congestive splenomegaly.
Fig. 5.22 Partial thrombosis (TH) of the splenic vein.
a Color-flow Doppler image.
< b Mild splenomegaly.
► Systemic Hematological Malignancy
Myeloproliferative disorder. Splenomegaly is
regarded as the principal diagnostic sign in
myeloproliferative disorders, particularly in
myelofibrosis and chronic myelocytic leukemia
(CML) (Fig. 5.23). It is found in approximately
70% of CML cases at the time of primary diag-
nosis, and after several years frequently results
in an extremely large spleen. The number of
circulating blast cells and the size of the spleen
are decisive prognostic parameters.
High-grade lymphoma. In high-grade lym-
phoma, the size of the spleen is unreliable re-
garding possible splenic involvement. Despite
the fact that increasing splenic size will raise
the probability of invasion by the lymphoma, a
5 Spleen 180
normal-sized spleen does not rule out possible
involvement of the spleen1.
Low-grade lymphoma. In low-grade lym-
phoma, particularly in chronic lymphocytic
leukemia (CLL) (Fig. 5.24), hairy cell leukemia,
and also immunocytoma, splenomegaly will
point toward a highly probable invasion of
the spleen, even if the sonographic echo pat-
a Fig. 5.23 Extreme splenomegaly (M) in myeloprolifer-
ative disorder.
tern of the organ is homogeneous. This has to
do with the fact that these entities are charac-
terized by a leukemic course. Demonstration of
splenomegaly is of prognostic significance, par-
ticularly in CLL.
Hodgkin disease. Use of splenic size as the sole
criterion for possible involvement of the spleen
has been abandoned. Approximately one-third
a Fig. 5.24 Hepatosplenomegaly (S) in CLL
a Ultrasound does not yield accurate dimensions of
the spleen.
of all affected spleens are normal sized. In con-
trast to almost all non-Hodgkin lymphomas, in
Hodgkin disease the correlation between
splenic size and extent of organ involvement
is only tenuous.
a b Both organs may touch in the upper abdomen
(ST = stomach). L = liver.
Small Spleen
— ► Variants, “Aged Spleen”
► Functional Hyposplenism/Asplenia
► Variants, “Aged Spleen”
Sonographic determination of a longitudinal
diameter < 11 cm and a thickness < 5 cm should
be recorded and documented as a “small"
spleen (Fig. 5.25).
To date, this finding has been regarded as a
variant and certainly does not seem to be of any
clinical consequence in most cases. Splenic size
varies with the type of patient, but the volume
of the organ also decreases with age. On color-
flow Doppler scanning, these spleens will be
visualized with a normal fanlike vasculature of
the parenchyma. At present, it is unknown
whether this age-dependent decrease in
splenic size has any functional significance.
* Fig. 5.25 Small spleen in a 75-year-old patient, pos-
sibly corresponding to an “aged spleen.” PE = pleural
exudation.
► Functional Hyposplenism/Asplenia
In recent years functional autosplenectomy
syndromes have increasingly been reported in
sickle-cell anemia (E 5.2a), after extensive
splenic trauma and septic disease, in autoim-
mune disease (E 5.2b and c), as part of thoro-
trast exposure of the spleen, and particularly
on the heels of allogeneic bone marrow trans-
plantation as a complication of chronic GVHD
(graft-versus-host disease) (E 5.2d-f) (Table
5.2).
Apart from the clinical symptoms, the prin-
cipal sonographic sign of functional splenic
changes is the diminishing size of the spleen
(Б 5.2g-i). The findings in color-flow Doppler
scanning vary. Although in some cases there is
no vascularization whatsoever, most organs
will demonstrate a rarefied vascular bed. How-
ever. sonographic confirmation of splenic
blood flow cannot rule out functional asplenia.
This requires additional functional studies of
the spleen (technetium-99m [99mTc] sulfur col-
loid labeling, platelet count, demonstration of
Howell-Jolly bodies).
Table 5.2 Possible causes of functional hyposplenism/asplenia
Vascular
Parenchymal
► Obstruction of the large blood vessels
- embolic splenic infarction
- torsion of the splenic pedicle
- complete splenic vein thrombosis
► Obstruction of the smaller blood vessels
- sickle-cell anemia
- vasculitis
- sepsis with DIC
- thorotrast exposure
► Bone marrow transplantation
► Amyloidosis
► Thyrotoxicosis
► Post radiotherapy/chemotherapy
► Autoimmune disorders
- celiac disease
- Crohn disease
- ulcerative colitis
- collagen disease
► Malignant invasion
H 5.2 Functional Asplenia
► Sickle-cell anemia,
amyloidosis
Nonfocal Changes of the Spleen
a Small hyperechoic spleen with hypo-
echoic mass and crescent-shaped cal-
cification with posterior shadowing (S)
in homozygous sickle-cell anemia.
Splenic scarring as sequelae of recur-
rent splenic infarction, suspected func-
tional asplenia. LU = lung; К - kidney;
AO = aorta.
b and c Color-flow Doppler scanning of a small inhomogeneous spleen with spu-
rious flow signals in amyloidosis; suspected functional hyposplenism.
► Bone-marrow transplantation
(GVHD)
d-f Acute leukaemia.
d Normal-sized spleen before bone
marrow transplantation.
e Shrunken spleen after allogeneic
bone marrow transplantation in severe
GVHD.
f Colloid-labeled scintiscan: the spleen
is barely visible, indicating functional
hyposplenism.
► Sepsis, ulcerative colitis,
radiotherapy
g Small spleen with lack of flow signals
in sepsis and diffuse splenic hemor-
rhage one year earlier; suspected func-
tional hyposplenism. LU = lung; Vari-
zellen = chicken pox.
h Small spleen with normal flow signals
in chronic ulcerative colitis.
/ Small spleen with marked hilar flow
signals in malignant lymphoma and
post radiotherapy of the spleen; sus-
pected functional hyposplenism. LU =
lung; CO = venous confluence.
Focal Changes
Focal changes of the spleen are rare. Ultra-
sound detects them in approximately 0.2% of
cases. They are characterized sonographically
similarly to hepatic masses, i.e., according to
echogenicity, size, shape, delineation, and
number. Compared with hepatic masses, the
nosological assessment of a focal splenic mass
jL is often difficult and becomes possible only
182
when taking into account the history and clin-
ical symptoms of the patient as well as the
sonographic follow-up. In case of doubt, the
diagnosis is confirmed by definite cytology/his-
tology via ultrasound-guided fine-needle aspi-
ration cytology/biopsy.
The differential diagnostic consideration in
the sections below adheres to the morpholog-
ical typing. This is somewhat fraught with
problems since, for instance, splenic cysts
may be demonstrated as being anechoic, hypo-
echoic. or also hyperechoic. Therefore, an addi-
tional classification according to the frequency
of diagnosis has been introduced.
Anechoic Mass_________________________________________________________
► Anechoic Mass
Splenic cysts are rare benign lesions with an
incidence of less than 0.1 %. They are differen-
tiated by their origin as being infective (hydatid
— ► Dysontogenetic Cysts
► Pseudocysts
► Infective Cysts
disease) or noninfective. The latter group epidermoid, and dermoid cysts) and pseudo-
breaks down into “true" cysts (dysontogenetic, cysts (not lined with epithelium).
► Dysontogenetic Cysts______________________________________________________________________
True splenic cysts are characterized by an epi-
thelial lining and are congenital in origin. On
ultrasound, they appear as round, smooth, an-
echoic lesions, well-defined from the sur-
rounding splenic texture, with signs of distal
acoustic enhancement. Sometimes echogenic
septation, internal echoes, sedimentation phe-
nomena, sequestered tissue, and calcification
of the wall may be observed. The contents of
the cyst may be watery clear or dark brown
owing to hemorrhage. In other cases the lumen
of the (pseudo-)cyst is filled with pulpy mate-
rial. On ultrasound, the fluid within the cysts is
at times visualized with a floating, moving hy-
perechoic mass ("snowstorm”), corresponding
to cell conglomerates, sequestered tissue, or
crystals (a 5.3). This may complicate differen-
tiation from a solid mass. There are no certain
sonographic signs ruling out pseudocysts.
Fifty-two patients with noninfective splenic
cysts (24 true cysts and 28 pseudocysts) did
not show any significant difference regarding
size, intrinsic echogenicity, or contents of the
cyst. Only calcification of the wall appeared to
be more frequent in pseudocysts.
S 5.3 Splenic Cysts
► Different ultrasound appear-
ance of splenic cysts
a Central anechoic, smoothly de-
lineated round mass within the spleen,
with posterior acoustic enhancement,
compatible with splenic cyst.
b Anechoic splenic cysts of irregular
margin and with small septa.
c Hyperechoic splenic cyst (cy) with
signs of intramural calcification.
d and e Anechoic splenic cyst (d). Follow-up demonstrates intrinsic sedimentation
phenomena as in old hemorrhage (e). M = spleen.
f Large cyst (C) with signs of intramural
calcification. S = spleen.
► Pseudocysts_________________________________________________________________________________
By definition, pseudocysts are not lined with
epithelium. Almost without exception they are
solitary lesions and, as such, sequelae to lique-
factive, hemorrhagic, or encapsulating pro-
cesses after pancreatitis, splenic trauma
(E 5.4b and c), infarction (a 5.4a), and meta-
stasis (a 5.4d). Since splenic trauma and in-
farction are somewhat common, the percent-
age of secondary cysts (approx. 80%) is not only
far larger than that of primary cysts (approx.
20%), but also larger than for other parenchy-
mal organs (e.g., the liver).
General treatment of splenic cysts depends on
the clinical symptoms, which in turn are a
function of the size of the cyst. Cysts with a
diameter < 5 cm should be followed up. Large
lesions occupying the spleen are mostly treated
by suigery, even today when conservative pro-
Table 5.3 Differential diagnosis of anechoic splenic masses
Frequent
► Dysontogenetic splenic cyst
► Pseudocyst
► Infective splenic cyst
Rare
► Abscess
► Hemorrhage
► Infarction
► Metastasis
► Pseudoaneurysm
► Lymphangioma
► Hemangioma
► Hamartoma
oo
Focal Changes
cedures are increasingly preferred. Ultrasound-
guided catheter drainage with sclerosing
agents is becoming a more viable option. Rup-
ture and carcinoma of splenic cysts have been
reported in a few rare cases.
Table 5.3 lists other rare anechoic splenic
masses (B 5.4e-k).
Й 5.4 Pseudocysts and Other Anechoic Masses
а-d Pseudocysts.
a Central anechoic cyst (Cy) with cal-
cified wall. Triangular hypoechoic
structure at the margin as in splenic
infarction (Inf).
b Large old posttraumatic splenic cyst
(CY). The splenic parenchyma is lacer-
ated (arrows). S = spleen.
c Central anechoic splenic mass after
bicycle accident, compatible with
splenic hemorrhage.
d Echogenic mass within the spleen,
with central anechoic liquefaction, in
cancer of the floor of the mouth, com-
patible with colliquated splenic meta-
stasis. M = spleen; К = Kidney.
e and f Anechoic splenic abscess (A) (e); after needle evacuation hyperechoic air is
seen (f)
g and h Anechoic intrasplenic mass in hepatic cirrhosis, with demonstration of
arterial flow. Intrasplenic pseudoaneurysm; the patient underwent splenectomy. C=
cyst-like mass; M = spleen.
i Anechoic encasement of the spleen J to I Somewhat older anechoic splenic infarction (INF) in endocarditis of the aortic valve; follow-up demonstrated spontaneous
(S) in malignant lymphoma, compatible resolution. S = spleen,
with spontaneous subcapsular hemor-
rhage (H).
Infective cysts are rare and are encountered in
less than 2% of all patients infected with hyda-
tid disease. In most cases the infective agent is
Echinococcus cysticus or E. granulosus.
Most cysts are visualized as anechoic lesions
with a double wall (pericyst and endocyst). In
rare cases they may demonstrate daughter
cysts. In exceptional cases these secondary
cysts may be very small and numerous; and,
because of the large number of wall echoes
(Fig. 5.26), the sonographic appearance of such
a hydatid cyst may resemble that of a hyper-
echoic lesion. Intracystic membranes, hydatid
sand (scolicial sedimentation), and calcification
have been reported. In general, the ultrasound
appearance of infective splenic cysts is quite
characteristic, although sometimes they are
hard to differentiate from incidental splenic
cysts. When there is doubt, the diagnosis has
to be confirmed by laboratory work-up.
* Fig. 5.26 Anechoic mass with festoonlike structures
corresponding to a hydatid cyst. К = Kidney,
Hypoechoic Mass______________________________________________________
— ► Invasive Lymphoma
► Splenic Infarction
► Splenic Abscess
► Splenic Trauma
► Splenic Metastasis
Table 5.4 lists the most important hypoechoic
splenic masses.
Table 5.4 Differential diagnosis of hypoechoic splenic masses
Frequent
► Invasive lymphoma
► Infarction
► Abscess
► Splenic trauma
Rare
► Metastasis
► Tuberculosis
► Sarcoidosis
► Collagen disease
► Amyloidosis
► Histoplasmosis
► Leukemic infiltrate
► Microabscess
► Peliosis
► Invasive Lymphoma________________________
Splenic involvement may generally be diag-
nosed sonographically by the presence of sple-
nomegaly (primarily in low-grade lymphoma)
or the demonstration of hypoechoic focal or
diffuse textural lesions of the splenic paren-
chyma. However, splenic involvement cannot
be ruled out for certain even if the spleen is of
normal size and homogeneous texture.
Ultrasound differentiates between five dif-
ferent patterns of invasion (Fig. 5.27), with the
micronodular and macronodular invasion as
well as the bulky formation corresponding to
focal parenchymal lesions.
Diffuse splenic involvement. As in all paren-
chymal organs, the greatest difficulty ultra-
sound faces is with diffuse splenic involve-
ment, and this is the main reason for the poor
sensitivity (albeit for all imaging modalities) in
diagnosing possible invasion of the spleen.
Compared with the adjacent liver, a normal
spleen will appear to be somewhat more ho-
mogeneous. The (subjective or operator-de-
pendent) assessment of the splenic texture
should be based on the liver as an in-vivo refer-
ence ( 5.5a-c).
Focal parenchymal lesions. The value of ultra-
sonography in the detection of focal parenchy-
mal lesions is well known, having a sensitivity
of more than 90% and a specificity of 96%. Since
the general incidence of focal splenic destruc-
tion is low, hypoechoic splenic masses in pa-
В 5.5 Invasion by Lymphoma
► Diffuse invasion
a Diffuse splenic invasion in malignant
lymphoma.
b and c Diffuse hypoechoic invasion of the entire spleen in Hodgkin disease.
Resolved under therapy (c).
Focal Changes 185
► Focal (micronodular and
macronodular) lesions
d Micronodular splenic invasion in
Hodgkin disease. The hypoechoic
masses resolved under chemotherapy.
e Micronodular hypoechoic splenic
masses in malignant lymphoma.
f Macronodular hypoechoic splenic
mass (TU) in malignant lymphoma.
g Hypoechoic mass within the spleen;
splenectomy confirmed primary lym-
phoma of the spleen.
h and i Large complex masses within the spleen, with hyperechoic as well as
hypoechoic areas, in Hodgkin disease. Resolved under therapy (i).
► Perisplenic invasion
J Perisplenic invasion (L) originating at
the hilum in malignant lymphoma.
к and I Extensive invasion (TU) of the
spleen in malignant lymphoma; sub-
capsular hemorrhage (H). Under ther-
apy, demarcation of the intrasplenic
lesion (arrows) with resolution.
► Perivascular invasion
m and n Perivascular invasion (TU) at the splenic hilum in Hodgkin disease (ar-
rowheads); resolved under therapy (n). S = spleen.
о Perivascular invasion in malignant
lymphoma.
5 Spleen 186
tients with lymphoma have to be regarded as
neoplastic with a high degree of certainty
(E5.5d-g).
Frequently, large lesions will display an in-
homogeneous echo texture (- 5.5h and i) with
hyperechoic areas. Calcification is rare and will
occur mostly after treatment.
Corresponding with the macroscopic find-
ings, low-grade non-Hodgkin lymphoma as
well as Hodgkin lymphoma tend toward dif-
fuse or micronodular invasion, while high-
grade non-Hodgkin lymphoma will lead to
larger masses.
Perisplenic invasion. Perisplenic invasion by
lymphoma is extremely rare; it may originate
at the hilum and spread in caplike fashion
(E 5.5j). Perisplenic invasion is also possible
by the lymphoma spreading from the thorax
through the diaphragm into the capsula of the
spleen. In individual cases this may result in
complications such as hemorrhage, rupture
(E 5.5k and 1), and infarction of the spleen.
Hypoechoic perivascular structural transfor-
mation. Hypoechoic perivascular structural
transformation of the hilar vessels of the spleen
is a rare entity in patients with malignant lym-
phoma. The etiology is unknown and it re-
solves under chemotherapy. Similar changes
have been reported in the liver as hypoechoic
structural lesions encompassing the portal vein
(“periportal cuffing"). They have also been ob-
served in systemic hematological malignancy
as well as in benign disorders. Apart from in-
vasion by the lymphoma, perivascular edema
by lymphatic obstruction has also been sug-
gested as one possible explanation
(E 5.5 m-o).
1. Diffuse nvasion
4. “Bulky" type
2. Micronodularinvasion
(diameter of largest
mass < 3 cm)
3. Macronodular invasion
(diameter of largest
mass > 3 cm)
5. Perisplenic invasion
л Fig. 5.27 Schematic illustration of the different so-
nographic patterns of splenic invasion in malignant
lymphoma.
► Splenic Infarction____________________________________________________________________________________
Splenic infarction is relatively common. It is the
result of embolic or thrombotic obstruction of
branches of the splenic artery.
Clinical symptoms. The clinical picture is un-
remarkable and is characterized by:
► Lack of any symptoms
► Diffuse abdominal pain, or
► Left upper quadrant pain
Chronic recurrent infarction. It is chronic (re-
current) infarction (E 5.6c) in particular, typi-
cal in homozygous sickle-cell anemia, for ex-
ample. that displays calcification and focal hy-
poechoic as well as hyperechoic masses with
increasing atrophy of the organ, corresponding
to autosplenectomy (a 5.6d). In color-flow
Doppler scanning of the scarred spleen, circu-
lation in the organ is markedly reduced.
Total splenic infarction. Infarction of the en-
tire spleen may be the result of acute splenic
vein thrombosis in the wandering spleen, tor-
sion of the vascular pedicle, acute sequestra-
tion in homozygous childhood sickle-cell ane-
mia. septic disorders, disseminated intravascu-
lar coagulation (D1C), or as part of pancreatitis
(E 5.6g—i). The sonographic image is charac-
Because of the textural difference with regular
parenchyma, splenic infarction and its compli-
cations may be visualized by ultrasound
(Fig. 5.28).
Acute splenic infarction. Ultrasound shows
acute splenic infarction as more or less hypo-
echoic lesions of the parenchymal texture, dif-
fering in size and extending to the splenic mar-
gin (E 5.6a). If the ultrasound beam parallels
the longitudinal axis of the infarct, it may be
possible to visualize the typical pyramid or
wedge shaped defect, with its base pointing
toward the surface and the apex toward the
hilum (E 5.6a and b). In these cases, the char-
acteristic shape alone is sufficient to differen-
tiate between splenic infarction and the similar
sonographic morphology of splenic abscess or
neoplastic splenic invasion.
Color-flow Doppler imaging will delineate
infarction from regular splenic parenchyma
by the lack of flow signals in the formers.
The wide spectium of sonographic visual-
ization in splenic infarction reported in the
literature is partly due to the lack of methods
(primarily because of the unspecific clinical
picture) for determining the age of the infarc-
tion in retrospect.
Causes of Splenic Infarction
Thromboembolism. Depending on the pa-
tients studied, thromboembolism is the
cause of splenic infarction in up to 70% of
cases. It complicates various cardiovascular
diseases (arteriosclerosis, myocardial infarc-
tion with intramural thrombus, atrial fibrilla-
tion, bacterial endocarditis, cardiac catheter-
ization, but also in microangiopathy syn-
dromes).
There have been reports of septic emboli in
AIDS patients without any underlying cardiac
disease.
Myeloproliferative and lymphoprolifera-
tive disorders. The pathogenetic mecha-
nism of splenic infarction in myeloprolifera-
tive and lymphoproliferative disease is cer-
tainly multifactorial. Apart from congestion
due to invasion by malignancy and/or extra-
medullary hematopoiesis (primarily in mye-
loproliferative disorders), the mismatch be-
tween the increased oxygen consumption
incurred by the enlarged organ and the de-
creased oxygen supply in anemia plays a cer-
tain role.
Sickle-cell anemia. In homozygous sickle-
cell anemia, oxygen deficiency and/or acido-
sis will lead to abnormal crystallization of
hemoglobin with subsequent erythrocyte
adhesion and manifestation of splenic infarc-
tion. This complication is less common, but
still possible, in carriers (heterozygous sickle-
cell anemia).
Thrombophilia. Congenital or acquired
thrombophilia (e.g., congenital protein C or
S deficiency, lupus anticoagulant, erythro-
poietin therapy) is an infrequent cause of
splenic infarction.
Partial splenic dearterialization. Some
children with thalassemia major undergo
therapeutic partial dearterialization of the
splenic artery with subsequent splenic infarc-
tion. In myeloproliferative disorder, hyper-
splenism may be palliated by embolization
of branches of the splenic artery.
terized by hypoechoic inhomogeneous trans-
formation of the entire splenic texture.
Healing phase. Increasing echogenicity and
shrinking size of the infarct characterize the
healing phase. Sometimes local textural inho-
mogeneity or calcification will remain as a scar.
In 80% of cases the infarction will heal without
any complication {E 5.6e and f).
Complications. Twenty percent of patients will
suffer complications» including:
► Increasing liquefaction of the infarct
(0 5.7a-c)
► Development of subcapsular hemorrhage
(E 5.7d-f),
► Flow phenomena identifiable on color-flow
Doppler scanning as indication of pseudo-
aneurysm or arteriovenous fistula (s 5.7g-i)
► Demonstration of free intraperitoneal fluid
(blood) (a 5.7j and k)
Diagnosis Course Endpoint
л Fig.5.28 Sonographic visualization and complications of splenic infarction.
5.6 Acute and Chronic Recurrent Splenic Infarction
► Fresh and old infarctions
a and b Wedge-shaped splenic infarct (INF); in a slightly different view mimicking
a round mass (b).
c Old complex splenic infarct as resid-
ual scar; hyperechoic delineation (ar-
rows) of the margin.
► Follow-ups
Focal Changes
d Small echogenic spleen lacking any
vascular flow signals; chronic recurrent
infarction in homozygous sickle-cell
anemia. H = hematoma; S = spleen.
e and f Course of splenic infarction
(INF).
e Hypoechoic appearance during the
acute stage.
f Later, increasing echogenicity of the
infarct.
g-i Acute pancreatitis.
g Formation of a hypoechoic peri-
splenic abscess (A). SP = spleen; E =
pleural exudation.
h During the course, transient hypo-
choic transformation of the spleen,
lacking flow signals because of splenic
artery obstruction
i Two days later, revascularization is
evident.
► Splenic Abscess
5 Spleen 188
Macroabscess. Most of these are pyogenic. On
ultrasound, a macroabscess is visualized as a
smooth or irregularly shaped, primarily hypo-
echoic lesion that is delineated from the nor-
mal parenchymal texture. However, as for he-
patic abscess, there is a wide spectrum of ultra-
sound morphology of these splenic abscesses,
which can be traced back to the difference in
the number of acoustically relevant echo boun-
daries. These morphologies include:
► Completely anechoic abscess resembling a
cyst with posterior acoustic enhancement
► Hypoechoic abscess with different degree of
textural echo pattern (и 5.8a-c)
► Markedly hyperechoic abscess, sometimes
gaseous, with or without posterior acoustic
enhancement (Fig. 5.29)
Pathogenesis
One of the explanations for the rather low
incidence of splenic abscess is the high de-
gree of phagocytosis in the spleen. Hema-
togenous bacterial spread accounts for ap-
proximately 75% of all abscess formation,
bacterial endocarditis being the most com-
mon cause (possibly via infected splenic in-
farct).
Superinfection of hematoma in splenic hem-
orrhage or a liquefying infarct accounts for
only 15% of cases.
Other predisposing factors are diabetes, im-
munosuppression, and neoplastic disease
cancer of the stomach, colon, and pancreas.
These cancers tend to invade the spleen, with
secondary infection after the original organ
is perforated.
A distinction has to be made between mac-
roabscesses and microabscesses.
В 5.7 Complications of Splenic Infarction
► Liquefaction of the infarct
o-c Large liquefying splenic infarct with pseudocyst formation in endocarditis.
► Subcapsular hemorrhage
d-f Apart from a splenic infarct (INF) there is a subcapsular hematoma (H) with subsequent resolution.
► Pseudoaneurysm and
AV fistula
g-i Complex transformation of splenic tissue with small anechoic area (arrow). There are arterial flow signals compatible with
intrasplenic pseudoaneurysm (arrow). INF » infarct.
► Free intraperitoneal fluid
j and к Wedge-shaped splenic infarct (inf) with tenuous intraperitoneal fluid (FF) posterior to the urinary bladder (HB). Fine-
needle aspiration confirmed the presence of blood within the peritoneal cavity. S = spleen.
Differentiating splenic abscess from other
focal masses (hematoma, infarct, cyst, tumor)
by ultrasound criteria for contour and texture
alone, not taking into account any clinical pa-
rameters, is fraught with problems. Since
splenic abscess has a mortality of up to 100%
if left untreated, a tentative diagnosis should be
confirmed by ultrasound-guided fine-needle
aspiration (3-4 Fr) with bacteriological and cy-
tological work-up (a 5.8d-f). If it is an abscess,
the diagnostic procedure can be expanded to
definitive treatment in terms of quantitative
evacuation; an abscess of less than 8-10 cm
across may be aspirated repeatedly, while cath-
eter drainage is recommended for abscess di-
ameters > 8-10cm (B5.8g-i). Splenectomy
should be reserved for very special cases. Since
the parenchymal trauma carries with it the risk
of potential hemorrhage, any interventional
procedures in splenic abscess should involve
close cooperation with the surgeons at an early
stage.
Microabscess. Microabscesses within the
spleen, or liver, are uncommon and are seen
primarily in immunocompromised patients.
The prevalence is about 26% of all splenic ab-
scesses. The most important etiology is that of
chronic disseminated candidiasis, manifested
as hepatosplenic candidiasis; microabscess as
part of bacterial infection, such as miliary tu-
berculosis or infection with Pneumocystis
carinii, is infrequent (Fig. 5.30).
Establishing a prognosis in Candida abscess is
impossible unless the clinical picture is consid-
ered. It is not possible to differentiate a hypo-
echoic mass from micronodular invasion, as in
л Fig. 5.29a and b Large complex splenic abscess (A) with intralesional gas. M = spleen.
malignant lymphoma or leukemia, by sono-
graphic morphology alone. The diagnosis is con-
firmed by clinical parameters following up the
antimycotic treatment by ultrasound, and
sometimes even ultrasound-guided fine-needle
aspiration biopsy; because of the concurrent
antimycotic therapy, cytohistology mostly
demonstrates the presence of necrosis and
granulation. Frequently, calcification will be
seen as residual scar after splenic microabscess.
Focal Changes 189
5.8 Treatment of Splenic Abscess
► Repeated aspiration
a Hypoechoic splenic abscess (A):
80 ml
b and c Resolution four weeks later after two aspiration cycles.
► Abscess drainage without
catheter
d Complex splenic abscess (A) within
the hilum. S - spleen.
f Complete evacuation of the material
e In ultrasound-guided fine-needle as-
piration of the abscess the echo of the
tip of the needle is seen within the mass
(arrow).
► Catheter drainage of abscess
g Large abscess (A) capping the spleen.
i The catheter is placed by Seidinger
technique and the abscess is drained
h Puncture and placement of the
guidewire.
5 Spleen 190
a Fig. 5.30a and b Diffuse micronodular splenic inva-
sion in a patient with systemic hematological malig-
nancy, in complete remission, with septic temper-
ature; highly indicative of splenic candidiasis.
► Splenic Trauma_______________________
Sonographic findings. Ultrasound can visual-
ize the following alterations indicative of
splenic trauma.
► Hematoperitoneum: free intraperitoneal,
perisplenic, perihepatic fluid and/or fluid in
the rectovesical pouch or Douglas’s space in
primary splenic rupture with hemorrhage
into the peritoneal cavity.
► Subcapsular splenic rupture: liquid zones
(anechoic, isoechoic, or hyperechoic!) be-
tween the parenchyma and capsula of the
spleen.
► Organ injury: destruction of the parenchy-
mal texture, with visualization of textural
nonhomogeneity or splenic laceration of
varying severity as direct indication of tissue
lesions and/or hemorrhage.
Subcapsular splenic rupture. External trauma
leading to subcapsular splenic rupture
(S 5.9a-f) frequently results in the hemor-
rhage between parenchyma and capsula cap-
ping the organ, primarily along the convex dia-
phragmatic surface; this can produce a double
contour on ultrasound examination. Subcapsu-
lar hemorrhage around the splenic hilum is less
common.
As in the posttraumatic subcapsular hemor-
rhage of the liver, it has to be pointed out that
the acute subcapsular splenic hemorrhage may
also be distinctly hyperechoic and could easily
be overlooked on cursory examination. Some-
times an enlarged left hepatic lobe may mimic
a subcapsular mass.
Organ injury. A careful ultrasound study will
be able to successfully demonstrate most cases
of organ injury, although sometimes short-
term follow-up will become necessary. Injuries
to the spleen are recognized by:
► Irregularly defined hypoechoic, isoechoic, as
well as hyperechoic lesions of the usually
homogeneous parenchymal texture
(E 5.9 g-1)
► Destruction of the splenic contour
(I- 5.9m-o)
Ultrasound Grading System in Splenic Trauma
► Grade 1
Subcapsular hematoma, thickness < 3 cm,
and/or intraparenchymal lesion < 3 cm di-
ameter, splenic capsula unbroken.
► Grade 2
Subcapsular hematoma, thickness > 3 cm,
and/or intraparenchymal lesion > 3 cm di-
ameter, splenic capsula unbroken.
► Grade 3
Splenic fragmentation, avascular spleen, or
flow phenomena (arteriovenous pseudo-
aneurysms) in liquefied intraparenchymal
areas.
Treatment. In traumatic and nontraumatic
splenic rupture, the current regimen calls for
preservation of the spleen, if at all possible. This
depends on the extent of the injury, for which
there are several grading systems. These are
founded on ultrasound studies and have become
quite useful as additional parameters in the de-
cision how to tailor treatment. However, imag-
ing modalities cannot be the sole foundation on
which to rest the decision against surgery. The
clinical picture and laboratory work-up still play
the primary role here. Repeated short-term
(possibly even hourly) follow-up ultrasound
studies have proved to be very useful.
A retrospective study of 30 patients with
splenic rupture demonstrated that “watchful
waiting” was justified in grade 1 patients (n =
6), while surgery became necessary in all
grade 3 trauma cases (n = 8). Patients with
grade 2 splenic trauma (n = 16) had to
undergo surgery in 62% of cases (n = 9).
► Splenic Metastasis_____________________
Splenic metastasis is detected in approximately
7% of autopsies. Metastasis in the spleen is far
less common than in the liver, the hypothesis
being that the spleen is equipped with a special
immunological microenvironment.
Ultrasound appearance. Classification of
splenic metastasis is along the same lines as
in the liver, the splenic parenchyma being the
in-vivo reference. The metastases can be clas-
sified as being anechoic, hypoechoic, isoechoic,
hyperechoic, and complex. The most common
sonographic types demonstrated in the spleen
are hypoechoic metastases. Larger metastases
may exhibit central colliquation.
All metastases may present with or without
a halo, which can be regarded as typical of, but
not specific to, hepatic and splenic malignancy
(® 5.10a-d).
Metastasis in direct extension. Splenic meta-
stasis may also arise by direct extension of
pancreatic, colonic, and gastric cancer
(E 5.11). In rare cases, malignancies of the
lung or diaphragm may break through and in-
vade the spleen in continuity. Also peritoneal
metastasis may encase and invade the spleen.
Complications. Complications may be local-
ized perforation, abscess, splenic hemonhage,
and rupture (® 5.10e-i). Calcification of splenic
metastasis has also been reported as well as
tumor-induced splenic vein thrombosis.
И 5.9 Splenic Trauma
► Subcapsular hematoma
o-c Almost isoechoic subcapsular hematoma (H) in mononucleosis. Free fluid (FF) in Douglas's space. HB = bladder; К =
kidney; S = spleen.
ocal Changes
d-f Subcapsular hematoma (H) in chickenpox sepsis. During the course, changing echogenicity of the hematoma with
resolution. S = spleen.
► Intraparenchymal splenic
trauma
g-i Intraparenchymal splenic trauma with increasing echogenicity over time. In addition, free fluid (probably blood: B) in
Douglas's space. UB = urinary bladder.
j-/ Intraparenchymal, irregularly defined echogenic defect after blunt abdominal trauma, resolving eventually. H = hema-
toma; S = spleen.
m-o Large complex subcapsular splenic hemorrhage (H) with demarcation of a parenchymal laceration (arrow); eventually
resolved but with scarring. S = spleen.
5.10 Splenic Metastasis
► Anechoic/complex
5 Spleen 192
a Splenic metastasis.
b Hypoechoic splenic mass with central
liquefaction in colon cancer: splenic
metastasis.
c Hyperechoic splenic mass (M) with
hypoechoic margin (“halo”) and central
liquefaction in colon cancer: splenic
metastasis.
► Echogenic
d Splenic metastasis (M).
e and f Splenic metastasis (M) in ENT malignancy. Large intrasplenic hematoma (H);
at the same time a large amount of free intraperitoneal fluid (FF) can be demonstrated.
The weak, emaciated patient refused surgery. LIB = urinary bladder; S = spleen.
► Hemorrhagic areas
g-i Malignant melanoma. Slowly resolving splenic metastasis (M) and subcapsular hematoma (H); in addition, formation of a
liquefied splenic metastasis.
S 5.77 Splenic Metastasis in Direct Extension
► Pancreas, stomach
a Cancer of the pancreatic tail (TU) in-
vading the spleen (SP) in direct exten-
sion.
b and c Gastric cancer (TU) invading the spleen (Milz). The blood supply of the
tumor (arrow) can be demonstrated. LU = lumen; MW = stomach wall.
► Colon, ovary
d-f Mucinous cancer of the colon.
d Tumor (TU) invasion of the greater
omentum (MES).
e Perisplenic and splenic invasion by
the tumor (TU). S = spleen; AO = aorta.
f Hyperechoic perisplenic invasion by
the tumor (TU) in ovarian cancer with
peritoneal metastasis. S = spleen.
Hyperechoic Mass
— ► Hemangioma
► Hamartoma
► Lymphoma and Myeloproliferative Disorders
Table 5.5 lists the differential diagnosis of hy-
perechoic splenic masses and their incidence.
Benign solid hyperechoic splenic tumor is
usually diagnosed as an incidental finding in
abdominal ultrasound studies. It is extremely
rare, the most common being hemangiomas
and hamartomas.
The main advantage of ultrasound and other
tomographic imaging modalities is their ability
to differentiate these entities from primarily
malignant splenic tumors, splenic metastases,
or infiltrates in malignant lymphoma, and from
other hyperechoic intrasplenic masses. Only
rarely is ultrasound alone able to do that.
Table 5.5 Differential diagnosis of hyperechoic splenic mass
Frequent
Rare
► Hemangioma
► Hamartoma
► Lymphoma infiltrate
► Hemorrhage
► Abscess
► Metastasis
► Hemangiosarcoma
► Extramedullary hematopoiesis
► Gaucher disease
► Niemann-Pick disease
► Peliosis
► Spherocytosis
► Schistosomiasis
► Littoral cell angioma
Focal Changes 193
► Hemangioma ________________________________________________________________
Hemangiomas are the most common benign
tumors of the spleen. Their incidence in autopsy
studies ranges from 0.03% to 14%. They are
mostly asymptomatic and are diagnosed as in-
cidental findings. Their size varies from just a
few millimeters to 15 cm. This predominantly
cavernous and rarely capillary tumor arises
from the sinus epithelium. Hemangiomas may
be solitary or come in multiples and are seen as
part of a generalized angiomatosis. Isolated
splenic hemangiomatosis is a rare entity and is
usually detected as incidental finding after sple-
nectomy. Splenic hemangiomas will grow
slowly; rupture is the most common complica-
tion, with an incidence of up to 25%.
5.72 Splenic Hemangioma
a Hyperechoic splenic mass compatible
with hemangioma.
b and c Crowing hyperechoic splenic mass; splenectomy confirmed the diagnosis of d Hyperechoic calcified splenic mass
a cavernous hemangioma. corresponding to hemangioma.
S = spleen.
e Calcified splenic mass; these phe-
nomena are more frequent in heman-
giomas.
f Multiple hyperechoic splenic masses,
compatible with hemangioma; in addi-
tion, marked intrasplenic calcification.
TU = tumor; S = spleen.
Ultrasound appearance. Ultrasound can dif-
ferentiate between two separate types:
► A primarily smooth, homogeneous, hyper-
echoic and mostly round lesion (E 5.12a-c)
► A complex lesion with hypoechoic, partly
anechoic, areas and sometimes also calcifi
cation with posterior shadowing
(0 5.12d-f).
In terms of anatomical pathology, this corre-
sponds to a homogeneous vascular pattern or
liquid areas (partly hemorrhagic, partly filled
with serous fluid).
Cystic hemangioma is a rare variant.
► Hamartoma________________________________________________________________
5 Spleen
Hamartomas (splenomas or nodular hyper-
splenism) are regarded as infrequent congen-
ital neoplasias of the spleen. Most often they
will be solitary and are diagnosed as an inci-
dental finding. Anatomical pathology shows
them to be made up of normal splenic paren-
chyma. Their size ranges from several centi-
meters to more than fist-sized masses, but
they rarely cause any symptoms (Fig. 5.31).
Ultrasound appearance. Ultrasound visualizes
hamartomas as smoothly delineated tumors
weakly contrasted against the splenic paren-
chyma, with a primarily homogeneous textural
echo pattern, good through-transmission of
the ultrasound waves, and mild posterior en-
hancement. Their echogenicity is probably due
to the density of breaks in acoustic impedance
at the walls of their numerous microscopic
fissured cavities. On color-flow Doppler scan-
ning this mass will present as "silent tumor."
* Fig. 5.31a and b Large hyperechoic splenic mass
with hypoechoic central areas. Splenectomy con-
firmed a splenoma.
► Lymphoma and Myeloproliferative Disorders_________________________________________________________
Hyperechoic lesions may be identified as lym-
phoma infiltrates in just a few cases (< 10%)
(Fig. 5.32). They are primarily seen in chronic
lymphocytic leukemia (CLL) and marked sple-
nomegaly. Hyperechoic masses are also found
in some patients with extramedullary splenic
hematopoiesis in myeloproliferative disorders
(Fig. 5.33).
a Fig. 532 Malignant lymphoma.
a Multiple hyperechoic masses. The pathological
morphology of this finding remains unclear.
a b These masses resolved under chemotherapy, indi-
cating that they might have been lymphoma infil-
trates.
a Fig. 5.33 Multiple hyperechoic masses in a patient
with myeloproliferative disorder. The pathological
morphology of this finding remains unclear, possibly
corresponding to extramedullary hematopoiesis.
Splenic Calcification
► Non-Focal Parenchymal Change
Table 5.6 summarizes the differential diagnosis
of splenic calcification.
On ultrasound calcification of the splenic
parenchyma presents as solitary or multiple
hyperechoic structures, characterized by total
or partial posterior shadowing.
Definitive correlation with certain diseases,
based only on the ultrasound findings, is im-
possible in most cases. Since they do not re-
quire any treatment, the etiology of these
mostly incidental findings remains unclear.
— ► Focal Calcification
► Diffuse Calcification
► Vascular Calcification
Table 5.6 Differential diagnosis of splenic calcification
Frequent
► Metainfective Mstarry sky"
► Calcified cyst
► Vascular calcification
Rare
► Splenic calcification
► Calcified metastasis
► Calcified hemangioma
► Scarring after
- abscess
- lymphoma
- trauma
- infarction
Focal Changes 195
► Focal Calcification_______________________________________________________________________________________
Focal calcification will be seen as residual scar-
ring after infarction, hematoma, abscess, or in-
vasive lymphoma, or as part of a metabolic
disorder (e.g., chronic renal insufficiency)
(Fig. 5.34). Calcification of metastases (e.g., me-
dullary thyroid carcinoma) is rare. Splenic cysts
may exhibit intramural calcification. In larger
hemangiomas, hemorrhage may lead to calci-
fication as well. Sometimes recurrent splenic
infarction will leave substantial splenic scar-
ring. Such a spleen will rarely be visualized as
just a calcareous crescent, but this would be
characteristic in homozygous sickle-cell ane-
mia. Calcified lymph nodes at the splenic hilum
will sometimes be seen as sequelae of tuber-
culosis.
a Fig. 5.34 Malignant lymphoma.
a Splenic involvement.
a b Focal calcification of the spleen (S) after treatment
as residual scarring.
3 8 )
► Diffuse Calcification_____________________________________________________________________________________
Diffusely distributed fine reflectors in the
spleen will produce a pattern resembling a
“starry sky” (Fig. 5.35). Quite often it is visual-
ized as metainfective scarring and may be as-
sociated with calcification of other abdominal
organs (e.g., in tuberculosis, systemic histoplas-
mosis, brucellosis, sarcoidosis, aspergillosis,
candidosis, lupus erythematosus, pneumocys-
tis infection, and also amyloidosis).
< Fig. 5.35 Multiple small calcifications in an elderly
patient with miliary tuberculosis in her youth.
► Vascular Calcification-----------------------------------------------------------------------------------
196
This should be differentiated from the vascular
calcification of the arteries and veins (phlebo-
liths), which is primarily seen at the splenic
hilum but also as diffuse calcification within
the parenchyma. The etiology remains unclear.
It has been reported in a few patients with
general vascular sclerosis, renal insufficiency,
and long-standing portal hypertension (Fig.
5.36).
1Л
Fig. 5.36 Vascular calcification in chronic renal insuf-
ficiency. S = spleen.
References
1. Falk S. Maligne Lymphome in der Milz. Stuttgart:
Fischer 1991.
2. Gorg C, Schwerk WB. Milzsonographie. In: Braun
B, Gunther R, Schwerk WB (eds.). Ultraschall-
diagnostik - Lehrbuch und Atlas. Landsberg: ECO
med 2000.
3. Neiman RS, Orazi A. Disorders of the spleen. 2nd
ed. Philadelphia: W. B. Saunders 1999.
Nodes
Lymph Nodes 199
▼ Peripheral Lymph Nodes
J^Tfead/Neck"
— ► Inflammatory Lymph Nodes
— ► Metastases
— ► Malignant Lymphoma
— ► Other Structures
* Extremities (Axilla, Groin)
~ ► Inflammatory Lymph Nodes
— ► Metastases
— ► Malignant Lymphoma
► Other Structures
▼ Abdominal Lymph Nodes
_ ► Hepatic Portal
212
212
— ► Inflammatory Lymph Nodes
— ► Metastases
— ► Malignant Lymphoma
► Other Structures
► Splenic Hilum
215
— ► Inflammatory Lymph Nodes
— ► Metastases
— ► Malignant Lymphoma
I— ► Other Structures
► Mesentery (Celiac, Upper and
Lower Mesenteric Station)
216
— ► Inflammatory Lymph Nodes
— ► Metastases
— ► Malignant Lymphoma
— ► Other Structures
► Retroperitoneum (Para-
Aortic, Paracaval, Aortoin-
tercaval, and Iliac Station)
219
— ► Inflammatory Lymph Nodes
— ► Metastases
— ► Malignant Lymphoma
— ► Other Structures
6 Lymph Nodes
C. Goerg
Together with the spleen and the mucosa-as-
sociated lymphoid tissue [MALT], lymph nodes
form the essential barrier of the secondary im-
mune system. The usual lymph node diameter
varies between 0.2 cm and 2.5 cm and depends
on the functional state of the lymph node as
well as the age of the patient. Lymph nodes are
in connection with the lymphatics.
Assessment of possible lymph node malig-
nancy is based primarily on the clinical picture
(history, workplace, and age of patient, location
of lymph node in question, palpation of finding,
experience of examining physician) and only
secondarily on the ultrasound findings. A defi-
nite diagnosis has to await confirmation by
histology. Sonographic follow-up has proved
to be invaluable in terms of assessing possible
malignancy as well as documenting the re-
sponse to therapy. The diagnostic armamenta-
rium for the follow-up and detection of recur-
rence, particularly in diseases of the peripheral
lymph nodes, has gained immeasurably by the
addition of ultrasound.
A summary of possible differential diagnosis in
pathological lymph nodes is listed in Table 6.1.
Table 6.1 Differential diagnosis in lymphadenopathy (modified from reference 2)
Infectious disease
► Viral infection
Infectious mononucleosis (EBV), cytomegalic inclusion disease, infectious hepatitis. AIDS,
rubella, human herpesvirus 3 (varicella-zoster)
► Bacterial infection
Streptococci, staphylococci, salmonellae, Tropheryma whippelii (Whipple disease),
Froncisella tularensis (tularemia)
► Mycotic infection
Histoplasmosis, coccidioidomycosis, blastomycosis
► Chlamydial infection
Lymphogranuloma venereum, cat-scratch disease, trachoma
► Mycobacterial infection
Toxoplasmosis, trypanosomosis, microfilariae
► Spirochetosis
Syphilis, leptospirosis
Malignancy
► Hodgkin disease, non-Hodgkin lymphoma, chronic lymphocytic leukemia, acute lympho-
cytic leukem a
► Myelogenous leukemia (chloromas = extramedullary manifestation of myelogenous leu-
kosis): acute myelogenous leukemia, blast crisis in chronic myelogenous leukemia
► Metastasis of epithelial or mesenchymal tumors
Immunological disease
► Rheumatoid arthritis
► Systemic lupus erythematosus
► Dermatomyositis
► Allergic reaction to drugs such as phenytoin, hydralazine, allopurinol
6 Lymph Nodes 199
Other
Sarcoidosis
Lipid storage disease (Gaucher disease, Niemann-Pick disease)
Anatomy
The trabeculae extend from the capsule, com-
posed of connective tissue and a few elastic
fibrils, into the substance of the lymph node
and result in a radial configuration. From the
outside to the inside, the cortical substance is
made up of the cortex, the paracortex, and the
medulla where the immune response takes
place. The hilum is rich in connective tissue
and houses the afferent and efferent lym-
phatics and blood vessels.
Topography_____________________________________________________________________________
Overall, the normal patient harbors approxi-
mately 1000 lymph nodes. The lymphatic sys-
tem in mammals may be grouped into five
large regions, and the lymph of each drains
into a major lymphatic trunk:
1 Head/neck
2 Axilla (including ipsilateral arm. mammary
gland, and thoracic wall)
3 Groin (including ipsilateral leg and abdomi-
nal wall)
4 Intra-abdominal and pelvic organs
5 Intrathoracic organs
Each of these major drainage regions is subdi-
vided into several lymphatic subregions, the
names of which are primarily taken from the
adjacent blood vessels. For didactic as well as
differential diagnostic reasons, the lymph no-
des should be classified as peripheral or non-
peripheraL Mediastinal and pulmonary lymph
nodes will be excluded from this discussion
since transcutaneous sonography cannot visu-
alize them by conventional means.
Peripheral lymph nodes include the following
regions:
► Head/neck
► Axilla/groin
6 Lymph Nodes 200
Lymph node regions of the head/neck
(Fig. 6.1)
I Submental, submandibular
II Lymph nodes draining into the upper third
of the jugular vein
III Lymph nodes draining into the middle
third of the jugular vein
IV Lymph nodes draining into the lower third
of the jugular vein (including the supracla-
vicular lymph nodes)
V Nuchal
Relations
► Cervical lymph nodes along the jugular
vein and carotid artery
► Submandibular lymph nodes along the
muscles of the root of the tongue
► Nuchal lymph nodes posterior to the
sternocleidomastoid muscle
Landmark structure in ultrasound
► Jugular vein
► Carotid artery
► Subclavian artery and vein
a Fig. 6.1 Topography of the lymph nodes in the head
and neck.
Regions of the axillary lymph nodes (Fig. 6.2)
I Lymph nodes of the lower axillary region
II Lymph nodes of the central axillary region
III Lymph nodes of the upper axillary region
(including the infraclavicular lymph nodes)
Relations
► Lymph nodes along the axillary vessels
► Lymph nodes anterior, along, and poste-
rior to the pectoralis major muscle
Landmark structure In ultrasound
► Axillary vessels
► Pectoralis major muscle
a Fig. 6.2 Topography of the axillary lymph nodes.
Nonperipheral lymph nodes. The abdominal
(nonperipheral) lymph nodes comprise the fol-
lowing regions (Fig. 6.3):
► Intraperitoneal (splanchnic) lymph nodes
(hepatic hilum, splenic hilum, mesentery)
► Retroperitoneal (parietal) lymph nodes
(para-aortic, iliac)
Regions of the intraperitoneal lymph nodes
I Lymph nodes at the hepatic hilum
11 Lymph nodes at the splenic hilum
III Mesenteric lymph nodes
Regions of the retroperitoneal lymph nodes
I Para-aortic/paracaval lymph nodes
II Iliac lymph nodes
Usually, only enlarged lymph nodes will be
visualized for certain, but normal lymph nodes
can be detected down to a size of just 2-3 mm
(Fig. 6.4). Lymph nodes of the head and neck
measuring more than 10 mm across are con-
sidered as being pathologically enlarged. Quite
often a central hyperechoic ovoid hilum can be
differentiated from a peripheral hypoechoic
concentric cortex (Fig. 6.5).
The sonographic parameters for lymph node
assessment are listed in Table 6.2.
Relations
► Intraperitoneal along the blood vessels
leading to liver and spleen
► Along the mesenteric blood vessels
► Along the retroperitoneal iliac blood
vessels
Landmark structures for ultrasound
► Arteries and veins
0 Splanchnic lymph nodes 0 Parietal lymph nodes
a Fig. 6.3 Topography of the abdominal lymph nodes.
1 = hepatic portal
2 = hilum of spleen
3 = celiac group
4 = upper and lower mesenteric group
5 = para-aortic group
6 = iliac group
л Fig. 6.4 Demonstration of an 8-mm-long enlarged
lymph node (L) of homogeneous echogenicity in an
otherwise asymptomatic patient. The lymphadenop-
athy was considered as being reactive. VJ = jugular
vein.
Normal lymph node morphology
► Size <1 cm
► Discernible hilum
► Cortex and hilum distinctly different
► Ellipsoid shape (length : width > 2)
Location. The location alone of a lymph node
may point the way to the etiology (supra-
clavicular sentinel, or Virchow’s, node in gas-
tric cancer, painful inguinal lymphadenopathy
in erysipelas (alarm-bell sign), unilateral axil-
lary lymphadenopathy in breast cancer).
(S6.1a-d).
Table 6.2 Sonographic parameters for
lymph node assessment
Location
Region involved
Pattern of involvement
Morphology
Size
Shape
Delineation from adjacent tissue
Structural parameters
Hilar sign
Echogenicity
Homogeneity
Vascularization
Concentration of blood vessels
Pattern of vascularization
Flow parameters
6 Lymph Nodes 201
И 6.7 Location and Morphology of Abnormal Lymph Nodes
► Location
a and b A 29-year-old patient with lymph node in left supraclavicular fossa
(“Virchow’s sentinel node"). Ultrasound demonstrates two large hyperechoic lymph
node metastases caked together (gastroscopy confirmed the suspected diagnosis of
gastric cancer). This localization signals malignancy.
cand d A 51-year-old patient with erysipelas. Enlarged lymph node in the left groin
with wide hyperechoic hilum and thin hypoechoic parenchymal border; reactive
lymphadenopathy.
eandf Chronic lymphocytic leukemia,
e A 63-year-old patient with subman-
dibular tumor formation.
f Ultrasound demonstrates large lymph
nodes (L) invaded by tumor and caked
together.
И 6.1 Location and Morphology of Abnormal Lymph Nodes
6 Lymph Nodes 202
► Morphological criteria:
Size, shape, delimitation
g-i Lymph nodes of different size in-
vaded by tumor.
g Small lymph node metastasis in the
left groin in malignant melanoma.
h Lymph node metastasis of the lower
jugular region in lung cancer.
i Malignant lymphoma invading an in-
guinal lymph node.
j-l Peripheral lymph nodes of differ-
ent shape.
j Elongated hypoechoic reactive lymph
node in erysipelas.
к Ovoid hypoechoic lymph node in
vaded by malignant lymphoma.
/ Round hypoechoic lymph node in-
vaded by carcinoma.
m Multiple round hypoechoic tumor-
infiltrated well defined lymph nodes (L)
in lung cancer.
n Multiple ill-defined lymph nodes (L)
invaded by malignant lymphoma.
о Multiple lymphomas caked together
in Hodgkin disease.
One important criterion for assessing possi-
ble malignancy is the pattern of involvement,
i.e., whether this is localized or generally
spread.
The relation with the blood vessels is of
particular importance in ENT since it could
spell the difference between surgery and inop-
erability. If ultrasound demonstrates contact
between the tumor and the vascular wall over
a distance of more than 3.5 cm or more than
half the circumference, invasion of the vessel
no longer amenable to resection is indicated.3
Morphology. Apart from the size (3 6.1 e-j),
morphological assessment has to consider the
shape of the lymph nodes as well (g 6.1 k-n).
The parameter commonly used is the ratio of
length (L) to width (W); a L/W ratio > 2 is more
indicative of reactive changes, while a L/W ratio
< 2 suggests malignancy (Fig. 6.5). The infor-
mation gained by palpation can be supple-
mented by ultrasound because of its ability to
differentiate between a well-defined lymph
node and festoonlike lymphadenopathy or
lymphomas caked together like potatoes in a
bag (w 6.1 o-p).
Structural parameters. Regarding the struc-
tural parameters, the importance of any hilar
sign (present or missing) is generally accepted,
and it supposedly is indicative of malignant
lymphadenopathy (E 6.2a and b).
When assessing the echogenicity of any
lymph node, this should always be based on
an “in vivo” reference, usually the adjacent
tissue (E 6.2c-e). It has been stated that hypo-
echoic nodes would be typical for invasion by
malignant lymphoma, while hyperechoic pa-
renchyma seems to be more common in cancer
metastasis and lymph nodes with chronic in-
flammation or regression scars.1
The normal parenchyma is homogeneous
but may be clustered with anechoic (E 6.2g
and h), hypoechoic (a 6.2f and i) as well as
hyperechoic (£ 6.2m, n) masses. Anechoic le-
sions are seen in granulomatous or suppurat-
ing inflammation corresponding with necrosis,
but also in cancer metastases where the lesions
would correspond with colliquation. Hypo-
echoic lesions may be indicative of beginning
malignant lymph node invasion. Hyperechoic
regions in lymph nodes are seen in low-grade
malignant lymphoma and could correspond
with regressive changes. Calcification may rep-
resent lymph node scarring. However, some-
times lymph node metastases tend to calcify as
well (e.g., medullary thyroid carcinoma)
(a 6.2j-l).
Vascularization. Color-flow Doppler scanning
can demonstrate lymph node vascularization
only indirectly by the presence or absence of
flow phenomena.
The afferent and efferent hilar vessels in a
normal-sized lymph node can be visualized by
color-flow Doppler imaging. Depending on the
state of the lymph node, the cortical region will
display a spokelike or increased parenchymal
vascularization with a markedly hilar aspect
S 6.2 Structural Parameters of Abnormal Lymph Nodes
► Hilar sign, echogenicity,
homogeneity
g and b Peripheral lymph nodes with different levels of the hilar sign.
a Lymph node with malignant invasion and no or just a faint hilar sign.
6 Lymph Nodes 203
b Enlarged reactive lymph node with mild to marked hilar sign.
c-e Enlarged lymph nodes displaying
different levels of echogenicity.
c Hypoechoic to “anechoic” mesenteric
lymph node invaded by malignant
lymphoma.
d Hypoechoic cervical lymph node
metastasis in ovarian cancer.
e Structural inhomogenicity of a lym-
phoma infiltration in a groin lymph
node with hyper- and hypoechoic parts
at chronic lymphocytic leukemia (re-
gressive changes).
f Marked structural nonhomogeneities
in a tuberculous axillary lymph node
(LK) with hyperechoic and hypoechoic
elements (foci of liquefaction found at
surgery).
g Colliquation of an enlarged cervical
lymph node (N) in bacterial lymphade-
nitis.
h Lymph node (N) with liquefied center
invaded by cancer of the esophagus.
i Enlarged lymph node (LK) with focal hypoechoic lesions. In all three cases beginning lymph node metastasis in malignant
melanoma. The hypoechoic regions correspond with the malignant tissue (TU).
S 6.2 Structural Parameters of Abnormal Lymph Nodes
6 Lymph Nodes 204
► Peripheral lymph nodes with
calcification
j-l Different forms of lymph node
calcification.
j Cervical lymph node metastasis with
mild calcification in carcinoid of thy-
mus.
к Large plaquelike calcification in me-
dullary thyroid carcinoma.
/ Calcified cervical lymph node as end
stage of tuberculous lymphadenitis.
m CLL. Focal hyperechoic masses in an
enlarged lymph node (LK) invaded by
lymphoma. The pathomorphological
substrate of the hyperechoic lesion re-
mains unclear.
n Color-flow Doppler scanning shows a
hypervasculansation of the lymph
node.
1. Longitudinal hilar
vessel (LHV)
2. LHV with spurious
branching
3. LHV with multiple
branches
« Fig. 6.6 Schematic illustration of various vascular
patterns in peripheral lymph nodes on color flow
Doppler scanning (from reference 5).
4 Complete lack of vessels
6. Vascular displacement
7. Aberrant vessels
8. Focal lack of vessels
9. Subcapsular vessels
(Ы 6.3a-f). Sem«quantitative assessment of the
concentration of blood vessels differentiates
between increased vascularization (S 6.3g
and h), and a focal decrease or lack of flow
phenomena in the lymph node. “Increased
vascularization” is said to be indicative of re-
active lymphadenopathy in acute inflamma-
tion (И 6.3i and j), but it is also seen in malig-
nant lymphoma. A focal lack of flow phenom-
ena in lymph nodes has frequently been ob-
seived in metastasis.4 In addition, this lack of
flow signals is also quite common post therapy
(- 6.3k and I).
Apart from the intranodal vascular bed vi-
sualized on ultrasound in peripheral lymph
nodes, vascular displacement, aberrant vessels,
focal lack of vessels, subcapsular vessels, and so
called “paint spots" all point more toward ma-
lignant lymphadenopathy (Fig. 6.6, a 6.3m
and n).5 Enlarged reactive lymph nodes tend
to be characterized by more horizontal hilar or
longitudinal parenchymal vessels as well as
treelike branching.
Flow parameters, such as the resistance in-
dices measured in the lymph node arteries
(resistance index, Rl; pulsatility index, PI),
seem to offer some benefit in the differential
diagnosis of enlarged lymph nodes. A large
resistance index (Rl > 85) is considered indica-
tive of a lymph node invaded by metastasis.
Abdominal lymph nodes. Compared with the
peripheral lymph nodes, sonographic parame-
ters of the vascularization in abdominal lymph
nodes are difficult to obtain. Because of the
location away from the probe, В-mode imaging
yields less detailed sonographic resolution of
the parenchymal structures; this implies that
any differential diagnosis has to rely primarily
on location and morphology, while structural
parameters are relegated to a minor role. The
И 6.3 Vascularization in Abnormal Lymph Nodes
a and b Reactive lymph node en-
largement.
a Small ovoid hypoechoic lymph node,
diameter approximately 15 mm.
b On color-flow Doppler scanning hilar
flow signal (1) and regular intraparen-
chymal vascular branches (2. 3).
c and d Reactive lymph node en-
largement (resolved during follow-
up).
c Enlarged lymph node in the upper
jugular region, hilar sign present.
d Color-flow Doppler scanning dem-
onstrates increased vascularization.
1 = hilar vessel, 2 = longitudinal vessel,
3 = intraparenchymal vascular
branches.
6 Lymph Nodes 205
e and f Infectious mononucleosis
confirmed by serology. Enlarged
lymph node.
f Color-flow Doppler scanning demon-
strates hypervascularization in reactive
lymph node enlargement.
g and h Cancer of the prostate.
g Lymph node metastasis.
h Hypervascularization on color-flow
Doppler scanning.
i and j Reactive lymph node enlarge-
ment in autoimmune vasculitis.
i Lymph node enlargement.
j On color-flow Doppler scanning
marked vascularization with demon-
stration of hilar (1), longitudinal (2), and
peripheral vessels (3).
к and I Hodgkin disease.
к Persistent lymph node enlargement
after chemotherapy.
I On color-flow Doppler scanning no
flow signals within the lymph node pa-
renchyma. The nodular enlargement
was regarded as being reactive.
m and n Gastric cancer.
m Lymph nodes invaded by tumor.
n On color-flow Doppler scanning
subcapsular (1) and aberrant (2) ves-
sels.
criteria above for the diagnosis of possible ma-
lignancy in peripheral lymph nodes have been
confirmed far better than for abdominal lymph
nodes, since their sonographic pattern of in-
volvement and the ultrasound visualization
differ substantially from those of the peripheral
lymph nodes. The one important factor in ab-
dominal lymph nodes is their size. In most
cases it becomes impossible to demonstrate
the hilum, and thus in many patients selective
visualization of the cortex is also not feasible.
Ultrasound distinguishes four basic patterns
in the invasion of abdominal lymph nodes
(Fig.6.7). The diffuse speckled micronodular
invasion (primarily of the mesenteric lymph
nodes) is quite different from the focal enlarge-
ment of lymph nodes (micronodular and mac-
ronodular). The “bulky” formation is character-
ized by its large mass of tumor, which may
represent confluent lymphomas, or excessive
growth of individual lymph nodes (Fig. 6.8).
Ultrasound studies of abdominal lymph no-
des labor under the following disadvantages:
► Only enlarged lymph nodes will be detected.
► Specificity is rather low in lumbar and iliac
lymph nodes.
► Intestinal gas can limit the usefulness of the
study.
► Misdiagnosis is possible in solitary lympho-
mas.
► It requires substantial experience of the op-
erator in terms of technique and assessment
6 Lymph Nodes 206
Diffuse micronodular
invasion
Focal micronodular
invasion
Focal macronodular
invasion
“Bulky” formation
« Fig. 6.7 Schematic illustration of the different pat-
terns of invasion in abdominal lymph nodes around
the celiac axis.
< Fig. 6.8 Different patterns of invasion in abdominal
lymph nodes (L) around the celiac axis.
a Individual enlarged lymph nodes in hepatitis.
AH = hepatic artery; AL = splenic artery; TR = celiac
axis.
«« b Plaquelike micronodular lymph node metastasis in
gastric cancer (TU). AO = aorta.
c Low-grade non-Hodgkin lymphoma, celiac lymph
nodes. Scan shows hypoechoic lymph node tumors
(LK) displacing the splenic artery (AL) and hepatic
artery.
< d High-grade non-Hodgkin lymphoma. Multiple
lymph node metastases in the upper abdomen. AH
= hepatic artery, L = liver.
Staging in Abdominal Lymph Node Involvement
Solid gastrointestinal tumors. Ultrasound
cannot differentiate reliably between lymph
nodes with metastatic invasion and those
with benign lymphadenopathy. Frequently
the lymph nodes are located within the drain-
age region of the tumor. Lymph node involve-
ment has great prognostic significance in tu-
mor staging (TNM system). When removing
the tumor and the regional lymph nodes, the
number of metastatic lymph nodes and their
distance from the primary tumor are of addi-
tional prognostic importance (Fig. 6.9). In
most cases, exact staging is possible only
after pathological work-up since the mesen-
teric and parietal lymph nodes are superim-
posed on each other and thus defy precise
demonstration. Endosonography is the imag-
ing modality of choice when staging gastro-
intestinal tumors (except in the large and
small intestines). In solid tumors the primary
pattern of lymph node invasion is diffuse and
micronodular as well as focal lymphadenop-
athy (micro and macro). “Bulky” formations
are infrequent findings.
Malignant lymphoma. In the staging of ma-
lignant lymphoma, possible involvement of
the abdominal lymph nodes carries with it
far-reaching therapeutic consequences. If ul-
trasound cannot resolve the issue, additional
CT studies are warranted. In patients with
Hodgkin disease, staging laparotomy be-
comes necessary in only a few cases and is
performed only if it results in consequences
for the treatment regimen. The sonographic
image of abdominal lymph node involvement
in malignant lymphoma covers a broad spec-
trum. Focal lymphadenopathy is most preva-
lent, with the lymphomas being well defined
or confluent. Extremely “bulky” formations
with concomitant displacement phenomena
are not especially rare. If there is concurrent
lymphoma, involvement of parenchymal or-
gans of the Cl tract with an invasion pattern
characteristic of lymphoma ultrasound will
often be the first measure to raise the sus-
pected diagnosis of malignant lymphoma.
In localized, primarily gastrointestinal lym-
phomas, any additional splanchnic (regional)
lymph node involvement implies stage IIE1,
while parietal (nonregional) involvement
would indicate stage llE2 according to Mussh-
off. Sometimes this situation is difficult to
differentiate from primary lymph node in-
volvement with organ involvement by direct
extension.
Low-grade and high-grade non-Hodgkin
lymphoma (NHL). While the most common
manifestation of low-grade NHL is systemic
lymphadenopathy (the clinical symptoms fre-
quently being rather mild), high-grade NHLs
often manifest themselves by their enlarged
lymph nodes in localized anatomical regions,
but also by “bulky” formation. The diagnosis
has to be confirmed by histology (also needed
for subtyping of the lymphoma). Ultrasound-
guided fine-needle aspiration biopsy will be
able to distinguish benign lymphadenopathy
from cancer metastasis or malignant lym-
phoma; however, typing of malignant lym-
phoma usually requires substantially more
material, which often can only be obtained
by laparotomy (unless there are peripheral
lymph nodes easily accessible for excision).
Ф Splanchnic (regional) lymph nodes
Peripheral Lymph Nodes
Parietal (nonregional) lymph nodes
•« Fig. 6.9 Schematic illustration of the splanchnic and
parietal lymph nodes. TR = celiac axis; VC = vena
cava; N = kidney; M = stomach; AO = aorta; AMS =
superior mesenteric artery; AMI = inferior mesenteric
artery.
Peripheral Lymph Nodes
Head/ Neck_________________________________________________________
► Inflammatory Lymph Nodes
► Metastases
► Malignant Lymphoma
► Other Structures
► Inflammatory Lymph Nodes_______________________________________________________________
About 300 of the about 1000 lymph nodes in
the human body are located in the cervical
region. Depending on the age during child-
hood/adolescence, more than 80% of all en-
larged lymph nodes are reactive in nature.
Posterocervical nuchal lymph nodes tend to
be benign, while the lymph nodes of the supra-
clavicular fossa often aie malignant.
Acute inflammatory lymphadenopathy
(Вб.Зс and d) has to be differentiated from
the chronic inflammatory (regressive) lymph
node enlargement (E 6.4). Usually, acutely in-
flamed lymph nodes are small (< 1.5 cm), the
hilar sign is present, and the ratio of length to
width (L/W) is greater than 2: they are not
caked together and mostly display a homoge-
neous parenchyma (note: liquefying suppurat-
ing lymph node). Acute lymphadenitis is char-
acterized by homogeneous hyperperfusion
(E6.3e and f), but low-level perfusion, or
even lack of it, does not rule out reactive lymph
node enlargement (Fig. 6.10). It has been sug-
a Fig. 6.10 A 13-year-old girl with fever and cervical
lymphadenopathy.
a Enlarged homogeneous hypoechoic lymph node.
gested that on color-flow Doppler scanning of
the vascular supply of the lymph nodes, hori-
zontal hilar vessels, longitudinal branches, and
homogeneous vascular branching are indicative
of reactive lymphadenopathy (3 6.3i and j).
a b Subcapsular vessels (1) and a focal lack of blood
vessels (2) on color-flow Doppler imaging. The initial
findings raised a high suspicion of malignancy, while
the follow-up indicated reactive lymphadenopathy.
In regressive lymph nodes, parenchymal cal-
cification is possible (a 6.2j-l). On color-flow
Doppler imaging, chronic inflammatory lymph
nodes are characterized by a lack of flow.
► Metastases__________________________
hi metastasis, size is not a typical parameter
and usually the hilar sign is missing (E 6.3g
and h). This type of lymph node tends to be
round and hyperechoic (a 6.1a and b).
Sometimes invasive growth can be demon-
strated, necrosis is possible, and calcification
of the parenchyma has also been observed
(a 6.2j—1). The concentration of blood vessels
varies on color-flow Doppler scanning. The vas-
cular supply of the lymph nodes has been said
to indicate malignancy if color-flow Doppler
imaging visualizes vascular displacement,
aberrant vessels, and legions lacking any vas-
cularization, and capsular vessels (a 6.3m
and n). Metastases exhibiting rapid growth
have been shown to display a pathological
vascularization with corkscrew-like vessels
(Fig. 6.11). It is important to determine before
surgery whether the metastatic cervical lymph
nodes can be delineated from the large blood
vessels of the neck or whether there is vascular
® 6.4 Lymph Nodes in Hodgkin’s Disease
6 Lymph Nodes 208
a and b A 32-year-old patient with
Hodgkin disease four years previ-
ously, presenting with an acutely en-
larged lymph node.
a Homogeneous hypoechoic lymph
node.
b Hypervascularization on color-flow
Doppler scanning. Follow-up indicated
reactive lymphadenopathy.
c and d A 33-year-old patient with
Hodgkin disease.
c Persistently enlarged lymph node.
d Lack of any flow signals on color-flow
Doppler scanning. Follow-up indicated
reactive lymphadenopathy.
► Follow-up studies post
treatment
e-g A 22-year-old patient with Hodgkin disease and enlarged cervical lymph nodes that resolved under treatment. Scarred
enlarged lymph nodes may be demonstrated for years.
h-j Chronic lymphocytic leukemia.
h A 25-year-old patient with a large
tumor in the right axilla.
i and j Intensified vascularization on color-flow Doppler scanning before therapy;
after chemotherapy no more flow signals are detected (further resolution during
follow-up).
invasion. Contact between tumor and vessel
wall over a distance of more than 3.5 cm, or
over more than half the circumference, sug-
gests vascular invasion (Fig. 6.12).
Fig. 6.11 A 72-year-old patient with malignant lym-
phoma and cervical lymph node metastasis.
a Hypoechoic lymph node.
< b Corkscrew-like neovascularization. 1 = focal lack
of vessels; 2 = aberrant vessels; 3 = subcapsular
vessels.
< d Marked neovascularization in metastases with
rapid clinical growth.
c Hypoechoic lymph node. M = metastasis.
Peripheral Lymph Nodes 209
Fig. 6.12 Lymph node invaded by an ENT tumor.
a The lymph node covers the vessel wall over more
than one-quarter of the circumference. ACC = com-
mon carotid artery; VJ = jugular vein.
◄ b Color-flow Doppler imaging demonstrates a lack
of blood vessels (1), aberrant vessels (2). “paint spots
(3)” and subcapsular vessels (4).
► Malignant Lymphoma_____________________________________________________________________
In many cases the lymph nodes will be visual-
ized as being large, hypoechoic, and in multi-
ples. The normal ratio of length to width is < 2.
Their texture is mostly homogeneous and they
are clustered like grapes or in festoonlike fash-
ion. Color-flow Doppler scanning will show
them to be characterized by a homogeneous
increase in the vascular images (E 6.4a and b).
Not only will they decrease in size during treat-
ment but the flow phenomena observed on
color-flow Doppler scanning will also dimin-
ish (E 6.1 h-m, И 6.4c-j). Sometimes the end
stage will be an echogenic lymph node, varying
in size, with hyperechoic capsule and no dis-
cernible flow signals.
► Other Structures_________________________________________________________________________________
► Head/neck. Tumor of the parotid gland,
lymphangiomatosis, abscess, hemorrhage,
carotid artery aneurysm, branchial cyst
(Figs. 6.13 and 6.14), parathyroid adenoma
► Supraclavicular. Pancoast tumor, bone tu-
mor, abscess.
л Fig. 6.13a and b Formation in the right lateral neck with sedimentation phenomena, compatible with a branchial
cyst.
6 Lymph Nodes
< Fig. 6.14 a and b Formation in the right lateral neck
with liquefied center (N). The diagnosis of a branchial
cyst was made only after surgery. ACC = common
carotid artery; VJ = jugular vein.
Extremities (Axilla, Groin)---------------------------------------------------
► Abdominal Lymph Nodes
► Inflammatory Lymph Nodes
► Metastases
► Malignant Lymphoma
► Other Structures
Enlargement of locoregional lymph nodes is
observed particularly in injuries of the extrem-
ities. If axillary lymph nodes are enlarged, the
possibility of involvement of the breast has to
be kept in mind.
► Inflammatory Lymph Nodes_______________________________________________________________
Sometimes reactive lymph nodes can become
rather large (Figs. 6.15 and 6.16); in most cases
the hilar sign is present and marked (Fig. 6.17).
In a few patients, the cortex of the lymph nodes
may be nothing more than a delicate hypo-
echoic border. Vascularization may be rarefied
or marked. Complete healing will leave con-
stant regressive hyperechoic lymph nodes. Re-
active regressive lymph nodes in the groin are
almost mandatory.
a Fig.6.15a-c Reactive inguinal lymph nodes in erysipelas displaying different levels of hypoechoic parenchyma. H = hilum.
a Fig. 6.16 a and b A 42-year-old patient with known Hodgkin disease, now presenting with lymphadenopathy in the
left groin; elongated lymph node with hilar sign and markedly inhomogeneous texture of the parenchyma.
Histology confirmed reactive lymphadenopathy.
a Fig. 6.17 A 33-year-old patient with autoimmune he-
molytic anemia and sarcoidosis. Large lymph node
with hilar sign present in the left axilla. Follow-up
indicated reactive lymphadenopathy.
► Metastases_______________________________________________________________________________
Peripheral Lymph Nodes
Metastases are much more common in the ax-
illa than in the groin (Fig. 6.18-6.22). In breast
cancer they are mostly homogenous and hypo-
echoic (Fig. 6.18) and their sizes differ widely.
Very small lymph node metastases are fre-
quently found in malignant melanoma
(Fig. 6.22); in vascular invasion, compression
syndrome is a not uncommon finding.
a Fig.6.18 Homogeneous hypoechoic lymph node in
breast cancer. After two cycles of adriamycin plus
cyclophosphamide, no more flow signal was ob-
served; this was interpreted as positive response to
treatment. Histological work-up of the lymph node
did not yield any remaining vital tumor tissue.
л Fig. 6.19 Lymph node invaded by neuroendocrine
cancer.
a Fig. 6.20 Lymph node in the left axilla invaded by
malignant melanoma: the hilar sign is still present.
a Fig. 6.21 a Large hypoechoic lymph node invaded by
cancer of the rectum.
a b Abnormal flow pattern on color-flow Doppler
scanning. 1 = focal lack of vessels; 2 = aberrant ves-
sels; 3 = subcapsular vessels.
a Fig. 6.22 Hyperechoic metastasis of malignant mela-
noma in an inguinal lymph node, re Leiste = right
grein.
► Malignant Lymphoma
ГМ
The picture is similar to that of the head/neck
region (Fig. 6.23). Here, too, impaired venous
or lymphatic drainage due to lymphomas can
6 Lymph Nodes
often be expected (Fig. 6.24). Invasive growth
into the soft tissue has been observed, partic-
ularly in T-cell lymphoma of the groin. In these
cases, the lymphoma may be visualized as
being hyperechoic and ill defined to the adja-
cent soft tissues.
* Fig. 6.23 Lymph node with pathological vascular
pattern in malignant lymphoma.
« Fig. 6.24 A 55-year-old patient with swollen right
leg. Ultrasound showed multiple abnormally large
lymph nodes (L) without any sign of deep venous
thrombosis. Needle biopsy confirmed the diagnosis
of Hodgkin disease. The swollen leg was explained by
impaired lymphatic drainage.
► Other Structures
► Axilla. Scar, postoperative fibrosis, seroma,
thrombosis of the axillary vein, cellulitis,
panniculitis, abscess, myositis.
► Groin. Undescended testis, inguinal hernia,
varicosity, lymphocele, hematoma, abscess,
false aneurysm (Fig. 6.25).
a b Color-flow Doppler imaging confirmed the diag-
nosis of a false aneurysm.
л Fig. 6.25 a Mass with liquefied center in the right
groin. AF = femoral artery; VF = femoral vein.
Abdominal Lymph Nodes
Hepatic Portal
► Peripheral Lymph Nodes
▼ Abdominal Lymph Nodes
2 k Hepatic Portal
Splenic Hilum
i ► Mesentery (Celiac, Upper and
Д Lower Mesenteric Station)
E* Kelroperitoneum (Para-Aortic,
ВИ Paracaval, Aortolntercaval,
И and Iliac Station)
— ► Inflammatory Lymph Nodes
► Metastases
► Malignant Lymphoma
► Other Structures
► Inflammatory Lymph Nodes
Enlarged inflammatory lymph nodes at the
hepatic portal are quite common and can easily
be demonstrated on ultrasound. Most of these
lymph nodes are small (< 2 cm), ovoid or elon-
gated, and likely echogenic. They are almost
always found in acute hepatitis (А, В, C), con-
comitant hepatitis (EBV, chickenpox, HIV, etc.),
autoimmune hepatitis, primary biliary cirrho-
sis, primary sclerosing cholangitis, and bacte-
rial cholangitis (a 6.5).
► Metastases_______________________________________________________________________________
There are no definite ultrasound criteria for
ruling out possible malignancy. Enlarged
lymph nodes in primary tumors of the liver
will be diagnosed as definite metastasis or re-
active lymphadenitis only after surgery; how-
ever, it can be stated that the probability of
malignant invasion will increase with increas-
ing size of the lymph node (Fig. 6.26).
* Fig. 6.26 a and b Enlarged lymph node (L) in pan-
creatic cancer (TU). Only histology can confirm pos-
sible lymph node metastasis. AO = aorta; DC = com-
mon hepatic duct; M = mesenteric lymph node; MES
= mesentery.
Abdominal Lymph Nodes
H 6.5 Enlarged Reactive Lymph Nodes at the Hepatic Portal
a Enlarged echogenic lymph (L) node in
hepatitis. AH = hepatic artery; AL =
splenic artery; TR = celiac axis.
b Enlarged lymph node (L) in an HIV-
positive patient. AO = aorta; VC = vena
cava; VP = portal vein.
c and d Mononucleosis.
c Echogenic lymph node at the hepatic
portal. LE = liver; VC « vena cava; VP «
portal vein.
d Enlarged lymph node (cursors) with
subtle hilar signs.
e and f Enlarged reactive lymph node (L) in primary sclerosing cholangitis.
DC = common bile duct; P = pancreas; VC = vena cava; VP = portal vein.
► Malignant Lymphoma_____________________________________________________________________
Involvement of the hepatic portal is observed
particularly in systemic low-grade lymphoma.
Different patterns of invasion have been noted
(Fig. 6.7). Hypoechoic perivascular transforma-
tion of the portal vein and its intrahepatic
branches close to the hilum (so-called “peri-
portal cuffing") has to be differentiated from
actual lymphoma involving the hepatic portal.
Periportal cuffing is more likely to be found in
impaired lymphatic drainage (Fig. 6.27).
6 Lymph Nodes
Fig. 6.27 Different invasion patterns in lymph nodes
(L) of the hepatic portal in malignant melanoma. L =
lymph node; VC = vena cava; VP = portal vein; AO =
aorta.
a Individual lymph nodes in high-grade lymphoma.
* b Multiple lymph nodes in lymphocytic lymphoma
(LC).
* d Large “bulky” tumor transformation in lympho-
cytic lymphoma. DC = common bile duct; VP = portal
vein; VC = vena cava; P = pancreas.
c Extensive lymph nodes (TU) in lymphocytic lym-
phoma.
► Other Structures________________________________________________________________________________
► Hematoma at the hepatic portal, abscess
► Cavernous transformation of the portal vein,
thrombosis of the portal vein, varicosities in
portal hypertension, aneurysm of the hepatic
artery (Fig. 6.28).
a Fig. 6.28 a Hypoechoic mass with anechoic center
(A). TR = celiac axis; AO = aorta.
a b Color-flow Doppler scanning confirms the tenta-
tive diagnosis of hepatic artery aneurysm.
Splenic Hilum
► Peripheral Lymph Nodes
▼ Abdominal Lymph Nodes
Hepatic Portal
2k Splenic Hilum
Mesentery (Celiac, Upper and
Lower Mesenteric Station)
Retroperitoneum (Para-Aortic,
Paracaval, Aortointercaval,
and Iliac Station)
— ► Inflammatory Lymph Nodes
► Metastases
► Malignant Lymphoma
► Other Structures
IT)
► Inflammatory Lymph Nodes__________________________________________________________________________________
Enlargement of the lymph nodes of the splenic
hilum is somewhat infrequent but is visualized
quite well by insonation through the spleen.
Reactive lymphadenitis of lymph nodes at the
splenic hilum is almost never seen.
Abdominal Lymph Nodes
► Metastases_______________________________________________________________________________
Metastases have been demonstrated in adeno-
carcinoma of the pancreatic tail, neuroendo-
crine tumors of the pancreas, gastric cancer,
and less frequently in peritoneal metastasis.
The principal misgivings about assessment of
possible malignancy apply here as well. Possi-
ble invasion of the tumor into the spleen can be
demonstrated on ultrasound (Fig. 6.29).
< Fig. 6.29 Lymph node metastasis at the splenic hi-
lum in ovarian cancer. M = stomach.
► Malignant Lymphoma_____________________________________________________________________
It is particularly the low-grade lymphomas that
display involvement of the splenic hilum as
part of systemic disease (Fig. 6.30).
a Fig. 6.30 Different invasion patterns visualized in
lymph nodes (L) of the splenic hilum in malignant
lymphoma. S = spleen.
о Individual lymph nodes in chronic lymphocytic leu-
kemia (CLL).
а b Numerous confluent lymph nodes in CLL.
6 Lymph Nodes 216
** Fig. 6.27
c Extensive lymph node (L) invasion in mantle cell
lymphoma.
* d Perisplenic invasion by follicular center lymphoma.
► Other Structures_________________________________________________________________________________
► Accessory spleen (Fig. 6.31), abscess
► Pancreatic mass (tumor, cyst, necrosis)
(Fig. 6.32)
► Adrenal mass (metastasis, pheochromocy-
toma, incidentaloma)
► Vascular process (splenic varicosity, throm-
bosis of the splenic vein, splenic artery
aneurysm)
л Fig. 6.31 Small accessory spleen (arrow) at the
splenic hilum in CLL.
a Fig. 6.32 a Signs of chronic pancreatitis with enlarged
pancreatic duct (DP) and anechoic pseudocyst (C) at
the head of the pancreas. AO = aorta.
a b Echogenic pseudocyst (C) at the splenic hilum in
the same patient.
Mesentery (Celiac, Upper and Lower Mesenteric Station)
► Peripheral Lymph Nodes
▼ Abdominal Lymph Nodes
Hepatic Portal
► Splenic Hilum
— ► Mesentery (Celiac, Upper and
Lower Mesenteric Station)
Iе ► Retroperitoneum (Para-Aortic,
Paracaval, Aortointercaval,
and Iliac Station)
— ► Inflammatory Lymph Nodes
► Metastases
► Malignant Lymphoma
► Other Structures
Although sometimes the mesenteric lymph
node stations are difficult to visualize
(Fig. 6.33 and Fig. 6.34), they play an important
role in clinical practice.
* Fig.6.33 Usually the mesentery (MES) of the indi-
vidual hypoechoic loop of the small intestines will be
visualized as being homogeneously hyperechoic. CO
= colon.
л Fig. 6.34 Transverse section of the mesentery, AO =
aorta: VC = vena cava.
a The mesentery, inferior to the splenic vein at the
pancreas, displays a hyperechoic texture.
a b Once the mesenteric vessels have branched off the
aorta, they rest within this hyperechoic mesentery.
a c Mesenteric lipomatosis is characterized by homo-
geneous echogenic thickening of the mesentery.
Abdominal Lymph Nodes
► Inflammatory Lymph Nodes______________________________________________________________
Most of these lymph nodes are situated in the
mesenteric fat along the unpaired branches of
the aorta (celiac axis, superior and inferior
mesenteric artery). Since the majority of these
lymph nodes are small, the mesentery displays
a “dirty" pattern. In some cases the diameter of
an enlarged lymph node may be several centi-
meters. One important differential diagnosis of
acute appendicitis, particularly during child-
hood, is mesenteric lymphadenitis, which can
be assessed as such once ultrasound has dem-
onstrated or excluded other local inflammation
(nonspecific gastroenteritis, Crohn disease, ul-
cerative colitis, yersiniosis, ileocolitis, appendi-
citis) (И 6.6a-e).
H 6.6 Enlargement of the Mesenteric Lymph Nodes
► Size, shape, and structure are
not criteria for benignancy or
malignancy
a and b Marked reactive lymphade-
nitis (L) along the mesenteric vessels
in mesenteric lymphadenitis.
MES - mesentery
a Longitudinal view.
b Color duplex: central vessel and pe-
ripheral vascularity; no aberrant vessels
as with a nodal metastasis.
c Enlarged individual lymph nodes (L).
d In the epigastric longitudinal view,
numerous lymph nodes (L) along the
mesenteric vein; definite diagnosis: re-
active lymphadenitis in tuberculosis.
e and f Differential diagnosis of
“dirty” mesenteric invasion; assess-
ment regarding possible malignancy
based on the sonographic morphol-
ogy alone is impossible. АО ~ aorta;
MES = mesentery
e Enlarged lymph nodes in mesenteric
lymphadenitis.
f Enlarged lymph nodes (L) in gastric
cancer.
► Metastases
6 Lymph Nodes 218
Enlarged mesenteric lymph nodes are a fre-
quent finding in ultrasound studies of abdomi-
nal cancer (carcinoma of the stomach, pan-
creas, esophagus, colon, etc.). The definitive
diagnosis of malignancy is a prerogative of
the pathologist (postoperatively) (a 6.6 f).
► Malignant Lymphoma______________________________________________________________________
Possible involvement of the mesenteric lymph
nodes is seen in all the various lymphomas. The
sonographic morphology is rather diverse and
may lead to problems in the differential diag-
nosis (В 6.7). In case of primary involvement of
the abdominal lymph nodes, the diagnosis is
confirmed by ultrasound-guided needle bi-
opsy; however, sometimes the issue can only
be resolved by laparotomy.
И 6.7 Malignant Lymphomas in Mesenteric Lymph Nodes
► Nodular, confluent, extended
o—c Different nodular patterns of in-
vasion in malignant lymphoma.
a Small solitary lymph node (L) in CLL
AMS = superior mesenteric artery; MES
- mesentery.
b Numerous confluent lymph nodes in
CLL.
c Extended tumor formation encasing
the superior mesenteric artery (AMS) in
mantle cell lymphoma
► Atypical patterns
d-f Atypical pattern of mesenteric
involvement in malignant lymphoma:
extremely difficult diagnosis in case of
sole mesenteric involvement.
d Cross-sectional view: hypoechoic
mesenteric tumor formation in high
grade lymphoma. D = intestine: mes =
mesentery; TU “ tumor.
e Cross sectional view with annular
hypoechoic tumor formation around
the mesenteric artery in follicular cen-
ter lymphoma. AO = aorta; L = liver; MES
= mesentery.
f Longitudinal epigastric view with ex-
tended, partly nodular, ill defined tumor
formation in CLL. AO = aorta; L = liver;
MES = mesentery.
► Small confluent nodes,
bulky formation
g-i Patterns of mesenteric invasion in
malignant lymphoma and ascites.
g Micronodular confluent lymph nodes
(L) in high grade T-cell lymphoma.
D = intestine.
h Extended sheets of lymphomas in
lymphoblastic lymphoma (LB-NHL).
D - intestine; MES « mesentery.
i Homogeneous hyperechoic tumor
formation invading all of the mesenteric
root in Hodgkin disease. A - ascites;
AO = aorta; b - bowels; VMS = superior
mesenteric vein; WS = vertebral col-
umn.
► Other Structures_________________________________________________________________________________
The differential diagnosis of an isolated mes-
enteric mass covers a whole gamut of possibil-
ities, including:
► Intestinal loop, mesenteric cyst (Fig. 6.35),
necrosis in pancreatitis, abscess
► Mesenteric varicosities in portal hyperten-
sion, thrombosis of the mesenteric vessels,
mesenteric artery aneurysms, hematoma
► Inflammatory pseudotumor (Fig. 6.36), lipo
ma, primary mesenchymal tumor
a Fig. 6.35 Transverse epigastric view with anechoic
mesenteric mass corresponding with a cyst (C). AO
= aorta; L = liver; MA = stomach; MES = mesentery.
л Fig. 6.36 Hypoechoic mesenteric mass (TU); histol-
ogy confirmed an inflammatory pseudotumor. AO =
aorta.
a Transverse epigastric view.
л b Longitudinal view. AMS = superior mesenteric ar-
tery.
Abdominal Lymph Nodes 219
Retroperitoneum (Para- Aortic, Paracaval, Aortointercaval, and Iliac Station)
► Peripheral Lymph Nodes
▼ Abdominal Lymph Nodes
® ► Hepatic Portal
Splenic Hilum
Mesentery (Celiac, Upper and
। Lower Mesenteric Station)
Retroperitoneum (Para-Aortic,
Paracaval, Aortointercaval,
and Iliac Station)
► Inflammatory Lymph Nodes
► Metastases
► Malignant Lymphoma
► Other Structures
In ultrasound studies gas shadowing frequently
makes it quite difficult to visualize the retro-
peritoneal lymph nodes.
► Inflammatory Lymph Nodes______________________________________________________________
Para-aortic lymph nodes with reactive enlarge-
ment are rare. In the iliac region they may be
demonstrated in the presence of local inflam-
mation (appendicitis, diverticulitis, adnexitis)
(Figs. 6.37 and 6.38).
-< Fig. 6.37 Transverse epigastric view with reactive en-
largement of the para-aortic lymph nodes in lupus
erythematosus. AO = aorta; WS = spine.
6 Lymph Nodes 220
** Fig. 6.38 Enlarged inflammatory lymph nodes (L) in
tuberculosis. AO = aorta; AR = renal artery; VC = vena
cava.
a Cross-sectional view.
b Longitudinal view.
► Metastases_________________________
Enlarged para-aortic lymph nodes are malig-
nant unless proven otherwise. They are seen in,
e.g., cancer of the kidney, testis, esophagus,
prostate, colon, and rectum. Their sonographic
pattern of invasion cannot be distinguished
► Malignant Lymphoma_________________
Quite often as part of a systemic lymphoma the
retroperitoneum will be invaded by lymphoma
masses. The sonographic patterns of invasion
► Other Structures___________________
Particularly in local retroperitoneal tumor for-
mations, the differential diagnosis covers a
wide spectrum of possibilities.
► Para-aortic region. Crura of diaphragm,
horizontal part of the duodenum, horseshoe
kidney, hematoma, abscess, aortic aneurysm,
from malignant lymphoma. Despite the princi-
pal uncertainty in the assessment of possible
malignancy if there is nonregional (parietal)
lymphadenopathy in cancer of the stomach,
pancreas, gallbladder, or liver, because of the
are rather varied. As in all other lymph node
stations, here too there is “bulky" disease, as
well as micronodular and macronodular and
retroperitoneal fibrosis, necrosis in pan-
creatitis, lymphocele, primarily retroperito-
neal tumors (0 6.10a-d).
► Iliac region. Ovary, undescended testis,
lymphocele, hematoma, abscess
(Ы 6.10e-h).
location alone (para-aortic, aortointercaval,
paracaval) it has to be regarded as metas-
tasis with a frequently unfavorable prognosis
(B 6.8).
diffuse involvement. Isolated retroperitoneal
manifestation of lymphoma is rare but possi-
ble (E 6.9).
S 6.8 Retroperitoneal Lymph Node Metastasis
► Varying patterns of involve-
ment of para-aortic lymph
nodes
► Multiple, confluent lymph
node metastases
a-c Different patterns of invasion of
para-aortic lymph nodes in cancer
(cross-sectional view).
a Individual hypoechoic lymph nodes
(LK) in cancer of the colon. AO = aorta;
DU = intestine; WS - spine; VC = vena
cava.
b Large para-aortic hyperechoic tumor
formation encasing the aorta (AO) in
esophageal cancer. WS = spine.
c Large para-aortic lymph node to the
right of the aorta (AO) in testicular
cancer. M = metastasis.
Abdominal Lymph Nodes 221
d Numerous para-aortic lymph nodes
(L) in malignant melanoma. AO = aorta;
VC « vena cava; WS = spine.
e Marked hypoechoic lymph node (L)
metastasis in cancer of the bladder.
Cross-sectional view. AO = aorta;
WS = spine.
f Transverse epigastric view with iso-
lated lymph node metastasis (L) in
ovarian cancer. The mesentery (MES) is
not involved. AO - aorta.
S 6.9 Para-aortic and Iliac Lymph Node Metastasis in Malignant Melanoma
► Varying patterns of
involvement of para-aortic
lymph nodes
a-c Different patterns of invasion in
para-aortic lymph nodes.
a Confluent lymphomas encasing the
aorta in centroblastic lymphoma. AO =
aorta; WS = spine.
b Extended tumor formation (arrow-
heads) in low-grade lymphoma (L). AO
= aorta; WS = spine.
c “Bulky” tumor formation (L) in CLL.
AO - aorta; WS = spine.
► Varying infiltration patterns of
iliac nodes
d-f Different patterns of invasion in
iliac lymph nodes.
d Large solitary hypoechoic tumor for-
mation (L) in Hodgkin disease. Al = iliac
artery; VI = iliac vein.
e Large complexes of well-defined
lymphoma masses (TU) in high-grade
lymphoma. VI = iliac vein.
f Large, faint, ill-defined hypoechoic
tumor formation (TU) in high-grade
lymphoma. AIC = common iliac artery.
В 6.70 Differential Diagnosis in Enlarged Para-aortic and Parailiac Lymph Nodes
6 Lymph Nodes 222
* Para-aortic masses
а-d Para-aortic.
a Transverse epigastric view with duo-
denum (DUO). AO = aorta; MA = stom-
ach; VC ~ vena cava.
b Transverse epigastric view with visu-
alization of the parenchymal bridge in a
horseshoe kidney. AO - aorta; VC - vena
cava.
c Transverse view of the lower abdo-
men with retroperitoneal hematoma
(H). A = iliac artery; V = iliac vein;
WS = spine.
d Transverse view of the lower abdo-
men with partially thrombosed aortic
aneurysm. AO = aorta; WS - spine.
► Parailiac masses
e-h Parailiac.
e Parietal view on the right with the
ovary. HB - urinary bladder; VI = iliac
vein.
f Transverse view of the lower abdo-
men with the inguinal ligament. HB =
urinary bladder; HD = testicle; SI -
sigma.
g Transverse view of the right groin
with a varicosity (?). AF = femoral ar-
tery; VF - femoral vein.
h Transverse view of the right groin
with an inguinal hernia. A = iliac artery;
V = iliac vein.
References
1. Ahuja et al. The use of sonography in differenti-
ating cervical lymphomatous lymph nodes from
cervical metastatic lymph nodes. Clin Radiol
1996:51:186.
2. Fischer et al. LymphknotenvergroEerung. Inter-
nist 1994:35:301.
3. Gritzmann et al. Invasion of the carotic artery and
jugular vein by lymph node metastases: Detec-
tion with sonography. Am J Radiol 1990:154:411.
4. Tschammler et al. Dignitatsbeurteilung
vergrdEerter Lymphknoten durch qualitative und
semiquantitative Auswertung der Lymphkno-
tenperfusion mit der farbkodierten Duplex-
sonographie. Fortschritte Rontgenstr
1991:154:414.
5. Tschammler et al. Lymphadenopathie: Differen-
tiation of benign from malignant disease - Color
Doppler US assessment of intranodal angio-
architexture. Radiology 1998;208:117.
Gastrointestinal Tract
Gastrointestinal Tract 225
r Stomach
229
▼ Focal Wall Changes
— ► Gastric Polyps
— ► Stromal Tumor
— ► Carcinoma
— ► Lymphoma
— ► Gastric Varices
— ► Ulceration
— ► Diverticula, Mucosal Folds
—Hypertrophic Pyloric Stenosis
▼ Extended Wall Changes
— ► Carcinoma/Scirrhus
— ► Lymphoma
— ► Gastritis
— ► Congestion, Edema
—-► Peritoneal Carcinomatosis
▼ Dilated Lumen
— ► Physiological Dilatation
— ► Inflammation
— ► Gastric Outlet Obstruction
---► Functional Disorder
▼ Narrowed Lumen
— ► Impression
— ► Compression
— ► Tumor
— ► Postoperative Status
▼ Small/Large Intestine
▼ Focal Wall Changes
---► Carcinoma
— ► Lymphoma
— ► Hematoma
— ► Polyp
— ► Intussusception
— ► Gallstone/Bezoar
— ► Diverticula
— ► Diverticulitis
— ► Appendix
— ► Appendicitis
—-► Hernia
▼ Extended Wall Changes
229
232
233
234
235
236
241
— ► Enteritis
— ► Sprue
— ► Crohn Disease
— ► Ulcerative Colitis
---► Amyloidosis
- —-► Ischemia
— ► Pseudomembranous (Antibiotic-
associated) Enterocolitis
— ► Hypertrophy
---► Tumor
► Lymphoma
▼ Dilated Lumen
245
---► Physiological Dilatation
—-► Prepping for the Study
— ► Inflammation
— ► Ileus
- —-► Coprostasis
— ► Tumor
— ► Foreign Body
▼ Narrowed Lumen
247
— ► Tumor Stenosis
— ► “Starvation Gut
— ► Ischemia
---► Atrophy
7 Gastrointestinal Tract
M. Brandt
In humans the food is ingested, transported,
and stored by the gastrointestinal (Gl) tract,
which may be subdivided into four major sec-
tions: esophagus, stomach, small intestine, and
large intestine.
The esophagus propels food taken up in the
mouth into the stomach, where it is mixed,
ground down, digested, and stored. The ingesta
are then passed into the small intestine, where
they undergo selective absorption. The residual
indigestible parts of our food become thick-
ened in the large intestine and are stored there
until evacuation.
In addition, the gastrointestinal tract plays an
important role as defensive barrier, and its
Peyer’s patches and lymphocytes comprise
the most extensive immune system in the hu-
man body.
Successful realization of these functions is
based on a common wall structuie of the gas-
trointestinal tube: the innermost mucous
membrane secretes and absorbs; the submu-
cous layer in the middle with its blood vessels,
lymphatics and nerves and the majority of the
enteric lymphatic organ lets the outer tela
muscularis slide with respect to the mucous
membrane. This muscular coat is characterized
by longitudinal and circular muscle fibers ar-
ranged in different fashions in the various parts
of the gastrointestinal tract; their peristaltic
contraction mixes and propels the intestinal
contents as well as controlling this transport
by means of special sphincter organs.
7 Gastrointestinal Tract 225
Anatomy and Topography (Fig. 7.1)______________________________________________________
Esophagus
► Wall thickness 3-4 mm
► Length 40 cm
► Transitory transport of the ingesta
Stomach
► Wall thickness 5-7 mm
► Length 20 cm
► Capacity: fasting 50 ml; postprandial up to
2000 ml
Duodenum
► Wall thickness 3-4 mm
► Length 30 cm
► Transitory transport of the chyme
Jejunum and Ileum
► Wall thickness 3-4 mm
► Total length 150 cm
► Transitory transport of the chyme
Colon
► Wall thickness 2-3 mm
► Length 120 cm
► Scybala/air
a Fig 7.1 Topographical anatomy of the intestinal tract.
Esophagus. The esophagus is a muscular tube
about 40 cm long connecting the pharynx to
the stomach and is located in the posterior
mediastinum. Its distal segment is anterior to
and parallels the aorta. It penetrates the dia-
phragm through the so-called esophageal hia-
tus (hiatus oesophagei) terminating at the
esophagocardiac transition zone.
Stomach. The stomach is one of the intraper-
itoneal organs and is situated in the left upper
quadrant. This hook- or comma-shaped hollow
organ runs from the cephalad left to the caudad
right and has a length of approximately 20 cm.
Under fasting conditions it contains about 50
ml of fluid, but will expand physiologically up
to a maximum capacity of 2 liters.
The stomach is subdivided into cardia, fun-
dus/fornix, body, and pyloric antrum. The car-
diac opening of the stomach is situated anterior
to the aorta at the level of the esophageal hia-
tus; its anterior aspect is covered by the infe-
rior surface of the left hepatic lobe. The fundus/
fornix of the stomach with its round dome fills
the space in the left upper quadrant, the supe-
rior border of which is formed by the dia-
phragm, while the left fundic aspect is in con-
tact with the spleen. The distal part of the
stomach comprises the body and the pyloric
antrum, which are defined on the anterior as-
pect by the left hepatic lobe. The muscular
opening into the duodenum is the pyloric or-
ifice, which is in direct contact with the head of
the pancreas.
Small intestine. The small intestine is subdi-
vided into the duodenum, which is about
30 cm long, and the jejunum plus ileum, which
altogether measure approximately 1.5 m. The
duodenum is only partially covered by perito-
neum, its shape resembling an arc (slightly
larger than a semicircle) that encloses the
head of the pancreas. The superior duodenal
segment crosses the structures of the hepatic
portal, i.e., common bile duct, portal vein, and
hepatic artery, while the gallbladder is antero-
lateral to it. The descending duodenal segment
parallels the posterolateral vena cava and bor-
ders the right kidney. The inferior duodenal
segment, situated about two fingerbreadths in-
ferior to the mesenteric root and caudad of the
pancreas, crosses anterior to the vena cava and
the aorta. Cross-sectional views of the superior
mesenteric artery and vein can be demon-
strated anterior to the intestine. The retroper-
itoneal duodenum continues as intraperitoneal
organ at the level of the mesenteric root
slightly left of the aorta.
The jejunum and ileum are attached to the
posterior abdominal wall by the fan-shaped
folds of the peritoneum known as the mesen-
tery proper; most of the coils of the small in-
testine are found in the left upper (jejunum)
and lower (ileum) quadrant. The jejunum and
ileum account for most of the intraperitoneal
space. The terminal ileum ascends from the
pelvis over the right psoas major muscle, the
iliac vessels paralleling its medial margin, at
the level of McBurney’s point and ends in the
right iliac fossa by opening into the medial side
of the cecum at the ileocecal (Bauhin’s) valve.
Colon. The colon is about 120 cm long and runs
along the margins of the intraperitoneal cavity.
In a clockwise direction (from the subject's
point of view) it is subdivided into cecum, as-
cending, transverse, descending, and sigmoid
colon, and the rectum.
The cecum is situated anterior to the psoas
major muscle in the right lower quadrant. The
ascending colon parallels the right lateral ab-
dominal wall and its superior segment is ante-
rior to the inferolateral part of the right kidney.
The hepatic flexure comprises the terminal part
of the ascending colon and the commencement
of the transverse colon; usually, the convex
part of this flexure hugs the gallbladder and
7 Gastrointestinal Tract 226
the lower right margin of the liver, but as a
variant it may dome up far superior and may
even be situated between the lower right
thoracic wall and the right hepatic lobe. The
transverse colon touches the anterior abdomi-
nal wall and traverses the upper abdomen from
Ultrasound Morphology_____________________
With enough training and experience the so-
nographer will be able to identify and demon-
strate most tegions of the gastrointestinal tract
(-3 7.1).
Esophagus. The proximal part of the cervical
esophagus posterior to the left lobe of the thy-
roid lends itself to sonographic study (Fig. 14.5,
p. 418): although for all practical purposes the
thoracic segment is beyond the reach of trans-
cutaneous ultrasound, ultrasonography can
demonstrate the distal esophagus at the level
of the gastric cardia.
Stomach and duodenum. With appropriate
techniques all of the stomach and duodenum
are accessible to sonographic study.
Jejunum and ileum. In the fasting state the
individual loops of the jejunum cannot be dif-
right to left: elongated variants may have a
drooping center section reaching all the way
into the pelvis. The splenic flexure connects the
transverse and descending colon, its convex
aspect being inferior to the spleen. The prox-
imal part of the descending colon is anterior
ferentiated, while their mesenteric attachment
and the Kerckring’s folds characterize the post-
prandial fluid-filled loops. Later, the postpran-
dial ileum loops in the lower abdomen will also
be fluid-filled and display vivid peristalsis.
Colon. Usually, the ileocecum and colon can be
visualized reasonably well and, taking into ac-
count the anatomical relations, the topography
of these parts of the gastrointestinal tract can
be identified for certain. Sometimes an elon-
gated sigmoid colon or drooping transverse
colon may interfere and be the reason for mis-
classification. Almost always the colon will ap-
pear as a tube filled with a varying amount of
feces and lacking peristalsis.
Cut signature. The morphological criterion to
look for in the ultrasound study of the gastro-
intestinal tract is the so-called gut signature. At
and lateral to the left kidney. The S-shaped
sigmoid colon forms a loop that, depending
on its length, frames the roof of the urinary
bladder more or less markedly. The rectum
descends into the pelvis posterior to the blad-
der and terminates at the anus.
any place of the gut this cross-sectional view
will demonstrate the GI tube as an annular
structure, while the longitudinal view depicts
it as a tubular structure. Assessment of the
intestinal wall and differentiation of its cha-
racteristic layered structure becomes pos-
sible only with high-frequency probes (5, 7
or 7.5 MHz) (Table 7.1).
Cut signature criteria. Detection of a gut sig-
nature calls for analysis of its ultrasound mor-
phology, lumen, and peristalsis as well as of the
surroundings and the intestinal segments up-
stream and downstream. Only all of these cri-
teria together will permit typing and assess-
ment with a clear-cut diagnosis in many cases.
The criteria to be considered are listed below.
► Location/relation. Specifying the position of
a gut signature offers the first chance of de-
fining the anatomical relations. It is impor-
Cut Signature
The normal “gut signature” is known as the
“cockade," a term whose origins date back to
Old French and refer to a rosette-shaped
badge. In ultrasound, the “gut signature"
and its pathological variant the “target sign"
have come to denote the round cross-sec-
tional view of the intestinal wall with its dif-
ferent layers. Although it has also been used
to describe the longitudinal view of the gas-
trointestinal tube, it is reserved exclusively for
the Cl tract and should not be applied to other
rosette-shaped structures, such as hepatic
metastasis, which are given their own terms
(e.g., “halo" or “bull’s-eye” sign).
Thus, in the cross-sectional view the gut sig-
nature/target sign refers to the annular image
of the layered intestinal wall and its center,
while in the longitudinal view it refers to the
parallel arrangement of adjacent intestinal
segments with the lumen in between.
Physiological gut signature. A so-called
physiological gut signature refers to a lumen
that is normal for this segment, a wall struc-
ture with characteristic layering, well-defined
wall thickness, and normal peristalsis.
Pathological gut signature. A so-called
pathological gut signature is characterized
by changes in the normal appearance of lu-
men, wall thickness, and/or peristalsis/pliabil-
ity (Table 7.2). Pathological wall changes
may be circular or eccentric and focal, or
they may be continuous or discontinuous
along the longitudinal axis. Intussusception
will be seen on ultrasound as the “target/
doughnut sign” (cross-sectional view) or
"pseudokidney sign” (longitudinal view). Ad-
jacent target signs fixed in space are charac-
teristic of a conglomerate.
Table 7.1 Layers of the intestinal wall
Sonographic layer Histological layer
Entrance echo—innermost hyperechoic layer Mucosal surface
Innermost hypoechoic layer Mucosa
Central hyperechoic layer Submucosa
Outermost hypoechoic layer Muscularis propria
Outermost hyperechoic layer—entrance/exit echo Serosal surface
Table 7.2 Criteria of the pathological gut
signature
Wall thickness > 4 mm Circumferential thickening Off center appearance
Wall layering Pronounced Interrupted Missing
Peristalsis Rigid wall Lack of pliability Lack of peristalsis
Lumen Constricted Distended
Vascularity Missing Enhanced
И 7Л Visualization of the Gastrointestinal Tract
► Stomach and duodenum:
physiological gut signature
a Typical gut signature of the esopha-
gocardiac junction anterior to the aorta
at the esophageal hiatus.
b Gut signature of the antrum: longi-
tudinal (contraction [left] and begin-
ning [center] dilatation) and cross-sec-
tional view.
CM
c Normal gut signature of the superior
part of the duodenum indenting the
gallbladder, longitudinal and cross-sec-
tional view.
7 Gastrointestinal Tract
d Normal gut signature of the inferior
part of the duodenum where it crosses
the aorta (AO). VMS = superior mesen-
teric vein: WK = spine; Darm = intestine.
e Jejunum, slightly fluid-enhanced,
after oral fluid intake; note the clearly
delineated Kerckring’s folds.
f Loops of the small intestine at their
mesenteric attachment, floating in as-
cites of cardiac origin.
► The differential diagnosis of
fluid-filled intestinal loops has
to rely on peristalsis
g Chronic ileus in obstructing tumor of
the hepatic flexure, exhibiting distended
intestinal loops and abnormally sluggish
and ineffective peristaltic movement.
h Sprue with so-called “tumbler phe-
nomenon.”
i Mechanical ileus (adhesions) with fo
cal fixation of the intestinal loops, re-
sulting in impaired peristalsis.
► Colon
j Haustra in a colon displaying meteor-
ism and scybala.
I Haustra after a saline enema.
к Haustra of the hepatic flexure in-
denting the gallbladder may mimic
gallstones.
m Descending colon post enema.
n Hydrocolonic sonography demon-
strating the intestinal wall of the de-
scending colon.
о Hydrocolonic sonography demon-
strating the ileocolic valve and an ileo-
cecal jet of fluid.
7 Gastrointestinal Tract 228
tant to recognize whether the pathology
exhibits a fixed location or is mobile.
► Echogenicity. Basically, the echogenicity of
the gut signature may be normal, hypo-
echoic, or hyperechoic; since one is dealing
with a layered anatomical structure, this
criterion has to be applied to the predomi-
nant elements of the wall or should reflect
the possible loss of layering.
► Wall thickness. Numerous standard dimen-
sions have been listed for the wall thickness
(see above). Measurement of the wall thick-
ness has to account for the degree of filling
and the functional state (contraction/dilata-
tion) of the intestines, and it also has to
specify whether the wall is thickened or
thinned out or whether its outline is inter-
rupted or ill defined.
► Wall layering. The wall may display a nor-
mal layered structure or it may be markedly
layered, may demonstrate thickening of just
one particular layer, may present with layer
defects, or may have lost its layered makeup
altogether.
► Shape/texture of the gut signature. The
cross-sectional view of the gut signature
may be round or ovoid, or it may be char-
acterized by asymmetrical changes; one
characteristic pathological sign is the so-
called target or bull’s-eye sign.
► Extent. In terms of length, the short focal or
extended lesions have to be differentiated
from the diffuse changes in the intestinal wall.
► Internal delineation. Assessment of the lu-
minal surface of the bowel wall will be able
to differentiate between normal as well as
pathological Kerckring’s folds and haustra
(preserved or lost) and also focal polypoid/
tumorous changes, ulcers, and other surface
irregularities.
► External delineation. The outside of the gas-
trointestinal tube may be smooth or irregu-
lar; it may exhibit pod-like extensions or
invade other structures.
► Changes in the surroundings. The sur-
roundings of the gut signature may be
absolutely normal or there may be free air
or fluid; ultrasound may be able to visu-
alize focal reactions in the surrounding
tissue, e.g., hyperechoic pannus, abscess
and fistula formation, as well as lymph-
adenopathy.
► Lumen. Assessment of the lumen has to ac-
count for the functional state/degree of
contraction; it may be normal, distended, or
reduced/narrowed.
► Stenosis. A stenosis is a circumscribed func-
tionally narrowed lumen of the bowel with
prestenotic distension and poststenotic nar-
rowing of the intestinal tube; usually, a
pathological gut signature or “target sign”
will be seen at the stenosis itself.
► Contents. Within the lumen of the gut there
may be anechoic fluid, echogenic chyme/in-
gesta, hyperechoic feces/scybala, air, and
foreign bodies.
► Peristalsis. Assessment of the peristalsis dif-
ferentiates between physiological contrac-
tion/distension on the one hand and normal,
missing, increased, impaired, or pathological
peristalsis (pendulating peristalsis) on the
other.
► Texture/pliability. Normal intestinal loops
are compliant; lack of pliability suggests in-
vasive inflammatory or malignant changes.
► Painfulness. A normal gut signature is not
painful; if localized pain can be triggered at a
focal change in the intestinal wall, this indi-
cates either an inflammatory or a functional
disorder (e.g., irritable bowel syndrome).
► Vascularity. The intestinal wall and its sur-
rounding tissues may be hypervascular or
avascular, or the vascularity may be normal.
► Changes in intestinal segments upstream.
Upstream of a focal lesion one may find
characteristic changes in the intestinal lu-
men (e.g., distension in the presence of ileus),
peristalsis, and texture (e.g., thickening of the
muscularis propria in case of hypertrophy).
► Changes in intestinal segments down-
stream. In case of mechanical ileus, a typi-
cal sign downstream is the so-called “star-
vation gut."
► Changes observed over time. The quality
and/or quantity of one or more of the ob-
served criteria may become more or less
pronounced.
► Changes in other organs. Additional find-
ings in other organs may help immensely
in the correct interpretation of intestinal
sonographic observations (e.g., gallbladder,
biliary tree, and liver in case of gallstone
ileus; assessment of the flow signals m the
superior and inferior mesenteric artery in
ischemic and inflammatory bowel disease).
Peristalsis
Peristalsis comprises a wave of contraction,
followed by immediate relaxation, passing
along the longitudinal axis of the intestinal
tube; under physiological conditions it may
be visualized sonographically at the stomach
and small intestine. Next to a segment ac-
tively contracting and displaying a thickened
intestinal wall with narrowing of the lumen,
the segments upstream and downstream will
undergo concurrent relaxation of the intesti-
nal wall musculature with thinning of the
wall, dilatation, and widening of the lumen.
Stomach. Gastric peristalsis is best seen
around the antrum and is characterized by
rhythmic contractions with a frequency of
2-4 times per minute and a period of
2-20 s. The dilatation phases with discernible
passage of chyme subsequent to swallowing
are best observed at the esophagogastric
junction.
Small intestine. Under fasting conditions,
the empty small intestine (the Latin word
“jejunus” means empty, dry, barren) is hard
to visualize sonographically and thus its peri-
staltic movement remains hidden. Under
physiological conditions the postprandial
peristalsis usually appears as a steady and
orderly alternation of muscular contraction
and dilatation propelling chyme and fluid in
a directed fashion.
In inflammatory disorders the lumen of the
small intestine will still be filled with some
fluid even when fasting; by itself this demon-
stration of intraluminal fluid (e.g., within the
duodenum in case of pancreatitis or cholecys-
titis) may be enough to suggest the under-
lying inflammation. Depending on the se-
verity of the inflammation, the peristalsis
may be vigorous, increased or even turbulent
(e.g., the so-called “tumbler phenomenon" in
sprue). Disturbed peristalsis with pathological
contractions, mandatory pathological disten-
sion of the lumen, and conspicuously uncoor-
dinated movement of the intestinal wall and
intraluminal chyme/fluid are characteristic of
ileus (see below).
Large intestine. Under physiological condi-
tions, ultrasonography cannot visualize peri-
staltic activity in the large intestine. However,
the characteristically impaired peristalsis in
the presence of ileus does become evident
on ultrasound.
Stomach
Although the stomach is not part of a routine
transabdominal ultrasound study, except for
some special cases, it quite often produces typ-
ical findings, which have to be interpreted cor-
rectly. This calls not only for a systematic anal-
ysis of the above criteria but also for the use of a
5 MHz probe, which will improve the diagnos-
tic interpretation (differentiation of the wall
layers).
Assessment of any sonographic findings at
the stomach has to consider somewhat pre-
cisely the time of the patient’s last ingestion.
Interpretation may be facilitated and improved
by oral fluid intake (with an antifoaming agent
added). Specific sonomorphological analysis of
the gastric wall requires endoscopic/bioptic
and endosonographic procedures.
Focal Wall Changes________________________________________________
Stomach 229
▼ Stomach
Focal Wall Changes
Д» Extended Wall Changes
Dilated Lumen
Narrowed Lumen
► Small/Large Intestine
► Gastric Polyp
► Stromal Tumor
► Carcinoma
► Lymphoma
► Gastric Varices
► Ulceration
► Diverticula, Mucosal Folds
► Hypertrophic Pyloric Stenosis
► Gastric Polyps________________________________________________________________________________________
Polypoid changes of the gastric wall are purely
incidental findings and are best visualized with
the stomach containing only very little fluid
(Fig. 7.2). The polyp will appear as a sessile
focal mass protruding into the gastric lumen
and presenting as an atypical (off-center)
pathological gut signature. Polyps arise from
certain layers of the gastric wall, most often
the mucosa and submucosa, but may also in-
volve the deeper layers of the wall. A more
precise analysis of the wall layers would re-
quire the use of high-frequency probes or
even endoscopic/endosonographic procedures.
In larger polyps, color-flow Doppler imaging
may be able to demonstrate the intravascular
blood flow. Polyps do not affect the outer de-
lineation of the gastric gut signature. Being
subjected to the peristaltic movement of the
stomach wall, the sessile polyp will be moving
passively and thus can be better differentiated
from the mucosal folds. Since ultrasound can-
not distinguish between benign and malignant
polyps, it is impossible to differentiate a benign
polyp from gastric adenocarcinoma type I.
a Fig. 7.2 Gastric polyp (P). Demonstration of a sessile
polypoid gastric tumor awash in fluid/secretions.
Left: transverse plane. Right: longitudinal plane.
► Stromal Tumor____________________________________________________________________________
These most frequent benign fibroid tumors
(e.g., leiomyoma), with their smooth margins,
are found in the layered wall of the stomach,
quite often relate to one of the central layers,
and are well vascularized. They exhibit inter-
stitial growth and may become as large as sev-
eral centimeters. Although these firm, elastic
tumors display a somewhat varied echogenic-
ity, they are mostly hypoechoic (Fig. 7.3). The
following stromal tumors may be found in the
stomach:
► Leiomyoma
► Leiomyoblastoma
► Neurinoma
► Neurofibroma
a Fig. 7.3 Gastrointestinal stromal tumor (GIST).
a Hypoechoic tumor (T) with extramural spread and
vascularity. M = stomach.
a b Endoscopic view; the biopsies were negative.
► Carcinoma---------------------------------------------------------------------------
7 Gastrointestinal Tract 230
Focal adenocarcinoma may arise anywhere
within the stomach (Table 7.3). Frequently, so-
nography will demonstrate a pathological con-
centric gut signature limited to the gastric an-
trum or cardia, while focal pathological atypi-
cal (off-center) gut signatures are more com-
mon in the corpus and rare in the fundus of the
stomach. The typical lesion is visualized as a
pathological thickening of the gastric wall with
loss of the usual layering. Quite often the lesion
is poorly delineated at the gastric lumen, and in
case of concentric tumors it is not uncommon
to encounter a stenotic lumen; in such cases
there will be retention of food proximal to the
stenosis. The immediate vicinity of the tumor
shows a characteristic loss of peristalsis, while
the pathological gut signature is hard and not
Table 7.3 The sites of gastric adenocarci-
noma
Site Frequency (%)
Antrum 50-80
Corpus/fundus 20-30
Cardia 10-20
compliant. The surface of the tumor may either
be smooth or irregular. In advanced gastric
carcinoma, there may be free fluid as well as
lymphadenopathy around the pancreas, the
hepatic portal, and/or the celiac axis (Figs. 7.4,
7.5).
a Fig. 7.4 Carcinoma of the gastric cardia (T) impinging
on the fornix. Irregular, abnormal target sign (com-
pare with 7.1a)
Fig. 7.5 Gastric carcinoma.
a Thickened ovoid pathological gut signature of the
gastric antrum in the longitudinal plane, right next
to an abdominal aortic aneurysm.
* b Pathological gut signature with loss of wall layer-
ing, irregular and clearly thickened wall, ill defined
outer margin, and narrowed lumen.
«« c Carcinoma of the gastric body (signet-ring carci-
noma). The stomach wall is markedly thickened to
14 mm (cursors) and shows intense, hypoechoic
structural transformation with loss of the normal
layered pattern
◄ d Irregular thickened pathological gut signature of
the gastric antrum; the free fluid present in the
perigastric space indicates local metastasis (in addi-
tion there is ascites in Morrisons pouch as well as
hepatic metastasis)
► Lymphoma_____________________________________________________________________________________________________
Gastric lymphoma may be visible on ultra-
sound as a focal hypoechoic mass involving
the wall of the stomach, with clearly evident
hypervascularity and loss of its typical layered
appearance (see Fig. 7.11).
► Gastric Varices
Vances of the gastric wall are quite common in
portal hypertension; owing to their tortuous
course, sectional views of these varices will
appear as small anechoic/hypoechoic cystoid
structures on the outside of the gastric wall
(Fig. 7.6). At the gastric fundus and cardia, as
well as at the distal esophagus, they may pro-
trude transmurally into the lumen of the stom-
ach as esophageal or fundic varices. Color-flow
Doppler scanning will demonstrate a ribbon-
like hepatofugal portovenous blood How.
Fig. 7.6 Gastric varices. Endosonography demon-
strating varices in the gastric wall in portal hyper-
tension.
Stomach 231
► Ulceration________________________________________________________________________________________
The majority of gastric ulcers are far too small
to be visualized on transabdominal ultrasound.
At the ulceration, the gastric wall is thinned out
and has lost its layered appearance; trapped air
or food particles will often be seen within the
cavity of the ulcer, resulting in a coarse echo.
Peristalsis will spare the area of the lesion. The
liver, pancreas, or greater omentum may wall
off any possible penetration, and in other cases
there may be free fluid, while free air can some-
times be demonstrated in frank perforation
(Figs. 7.7 and 7.8).
Fig. 7.7 Benign gastric ulcer.
a Craterlike benign gastric ulcer (M; arrows) after
fluid ingestion. Note the rigid wall thickening
along the lesser curvature (beam directed ob-
liquely upward from the greater to lesser curva-
ture).
* b Double-contrast radiograph of the stomach dem-
onstrates a benign ulcer in the lesser curvature.
Fig. 7.8 Free air caused by an intra-abdominal per-
foration.
a Perforated diverticulum: grainy, hyperechoic air
bubbles between the parietal and visceral perito-
neum of the hepatic surface with a reverberation
artifact.
« b Complete sound reflection from copious free in-
tra-abdominal air. Perforated ulcer.
► Diverticula, Mucosal Folds________________________________________________________________________________
Diverticulum-like sacculation in the gastric
wall is rare; when looking at all wall layers
there will be focal excavation of the lumen.
Transverse sections through rugal hypertro-
phy at the gastric body may mimic focal poly-
poid wall lesions.
► Hypertrophic Pyloric Stenosis______________________________________________________________
Hypertrophic pyloric stenosis (Fig. 7.9) is a rel-
atively common condition affecting the new-
born—recurrent projectile vomiting is almost
pathognomonic. On ultrasonography, the pylo-
rus appears as a circumscribed lengthy circular
thickening of the muscle, the total pyloric di-
ameter being >12 mm and the pyloric canal
being compressed (so-called “cervix sign’’); at
the same time the stomach will display marked
fluid retention.
« Fig. 7.9 Hypertrophic pyloric stenosis. So-called cer-
vix sign with marked circumscribed thickening of the
lamina propria mucosae and tight pyloric canal, ac-
companied by gastric distension and fluid retention
(with the kind permission of Dr. R. Kardorff. Wesel,
Germany).
Extended Wall Changes
7 Gastrointestinal Tract 232
► Carcinoma/Scirrhus
► Lymphoma
► Gastritis
► Congestion, Edema
► Peritoneal Carcinomatosis
► Carcinoma/Scirrhus__________________________________________________________________________
Scirrhous carcinoma is characterized by diffuse
extensive invasion of the gastric wall by the
tumor, resulting in a narrowed lumen and
loss of the layered wall architecture. Owing to
the intramural spread of the carcinoma, the
inner and outer margins of the gastric wall
are still smoothly defined irrespective of a pos-
sible wall thickness of several centimeters. The
region of the tumor will be void of any peri-
staltic movement, and the pathological gut sig-
nature will demonstrate a coarse texture and
lack any pliability (Figs. 7.10 and 7.17).
a Fig. 7.10 a, b Scirrhous carcinoma. Oblong abnormal target sign produced by a scirrhous signet-ring cell carcinoma
of the stomach. MW, MaW = gastric wall.
► Lymphoma
Diffuse invasion of the gastric wall by lym-
phoma may lead to clearly recognizable irreg-
ular and noncompliant hypoechoic thickening
of the wall, with easily visualized hypervascu-
larity and loss of its layered architecture
(Fig. 7.11).
◄ Fig.7.11 Gastric lymphoma: diffuse tumor invasion
of the gastric wall (T) with lymph node metastasis
(LK).
► Gastritis____________________________________________________________________________________________________
The different types of gastritis (Helicobacter
pylori infection, long-term therapy with proton
pump inhibitors), as well as Menetrier disease,
display a markedly pronounced emphasis of
the layering and rugal coarsening (Fig. 7.12).
a Fig. 7.12 a Marked corporic rugae, fasting state.
a b Hypertrophic antral folds in gastritis, with normal
wall layers.
► Congestion, Edema_______________________________________________________________________________
Congestion. In cardiac congestion, the outer
layers of the gastric wall will undergo a marked
hypoechoic thickening; other signs of the car-
diac congestion will always be present as well
(distended hepatic veins, engorged vena cava,
possibly ascites, and pleural effusion).
Edema. Concomitant inflammatory reaction of
the gastric wall as part of pancreatitis could
result in a more pronounced appearance of
the layering as well as discrete extended thick-
ening of the gastric wall. Owing to the concur-
rent paralytic ileus, there is no peristalsis and
the pliability of the wall is diminished by the
inflammatory invasion.
► Peritoneal Carcinomatosis______________________________________________________________________________________
As part of diffuse peritoneal carcinomatosis the
gastric wall may undergo appositional thicken-
ing from the outside, and it is quite typical of
these cases that marked ascites can frequently
be demonstrated (see Fig. 7.16).
Stomach 233
Dilated Lumen_________________________________________________________________
— ► Physiological Dilatation
► Inflammation
► Gastric Outlet Obstruction
к Functional Disorder
Being a storage organ, the stomach may hold
up to 2000 ml of food even under physiological
conditions. Conditioning and disease/disorders
can increase this volume beyond 3000 ml. In
the fasting state (6 hours, at most 12 hours,
after the last ingestion) under physiological
conditions the stomach will empty completely;
with the patient in the supine position the
small residual secretion of about 50 ml can be
demonstrated at the gastric fundus. The echo-
genicity of the gastric contents depends on the
type of food ingested.
► Physiological Dilatation____________________________________________________________________________
The postprandial chyme can be visualized at
the gastric fundus with the patient in the su-
pine position (Fig. 7.13). Peristaltic activity will
mix it and then transport it to the gastric outlet,
where it is portioned through the pylorus into
the duodenum. Here, the chyme becomes visi-
ble only because of the peristalsis and can then
be demonstrated within the lumen along its
brief passage through the duodenum.
* Fig. 7.13 Postprandial lumen of the stomach, mark-
edly dilated by ingesta; thinned out, dilated gastric
wall.
► Inflammation____________________________________________________________________________
When dealing with inflammation near the du-
odenal C (pancreatitis, cholecystitis, compli-
cated ulcer, ileus) one can always demonstrate
fluid within the duodenal lumen (indirect
sign), the latter displaying a markedly patho-
logical and diminished peristalsis with sloshing
of the fluid. At the same time, the gastric lumen
will contain an increased amount of food par-
ticles and fluid. Because of the lack of peristal-
sis, the solid particles will settle in layers be-
neath the fluid and gas and can be churned by
deliberate palpation or by repositioning the
patient.
► Gastric Outlet Obstruction
7 Gastrointestinal Tract 234
Gastric outlet stenosis or obstruction by the
duodenum will result in a markedly ectatic
stomach, retaining the food and fluid previ-
ously ingested as well as the increased amount
of gastric juice produced (Fig. 7.14b)
► Functional Disorder
Functional disorders of gastric emptying are
encountered in ileus and diabetic gastro-
paresis (Fig. 7.14); here, it is primarily the
a Fig. 7.14 a Pathological dilatation of the stomach in
diabetic gastroparesis (in this case more than 3000
ml of hematinic fasting secretion was drained).
retention of fluid characterized by fine ech-
oes.
a b Gastric lumen narrowed by scirrhous carcinoma of
the antrum with antral stenosis (arrow) and ensuing
massive dilatation of the stomach (M).
л c Abnormal dilatation of the antrum and duodenal
bulb, indicating a postbulbar location of the stenosis
(here, duodenal carcinoma with locoregional meta-
stasis; hypoechoic retrogastic and retrobulbar
masses).
Narrowed Lumen
— ► Impression
► Compression
► Tumor
► Postoperative Status
In fasting, peristaltic movement of the antrum
will result in concentric contraction of the gas-
tric wall with complete loss of the lumen; de-
pending on the degree of prefilling, this nar-
rowing of the lumen may be incomplete.
► Impression
Impression of the stomach from the outside
may result in eccentric narrowing of the gastric
lumen, the primary such cause being masses in
adjacent organs, e.g., hepatic (Fig.7.15) or pan-
creatic cysts, but also the gallbladder.
Fig. 7.15 a Anterior impression of the stomach by a liver ►
cyst.
b Posterior indentation of the stomach (MA) by an ►►
area of pancreatic necrosis (N).
► Compression
Compression of the gastric lumen from the out-
side is seen in massive ascites (e.g.. in perito-
neal carcinomatosis; Fig. 7.16) and severe pan-
creatitis with retroperitoneal edema and as-
cites.
a Fig. 7,16 a Gastric compression by ascites in a gyne-
cological tumor with peritoneal carcinomatosis, the
stomach lacking any dilatability.
a b Gastric compression (M) by chronic calcifying pan-
creatitis (calipers). AO = aorta; A = antrum; VL =
splenic vein.
Small/Large Intestine 235
► Tumor
Focal circular tumors of the gastric antrum,
body, and cardia as well as scirrhous carci-
noma (Fig. 7.17) will lead to significant narrow-
ing of the lumen, accompanied by dilatation of
those segments of the stomach and/or esoph-
agus upstream.
a Fig. 7.17 a Narrowing of the gastric lumen by an
oblong scirrhous carcinoma of the antrum, upper
abdominal transverse scan.
a b Longitudinal scan showing the antrum in trans-
verse section: target sign.
► Postoperative Status______________
Depending on the degree of resection in stom-
ach operations, the lumen of the gastric stump
may be markedly smaller.
Small/La где Intestine
Small intestine. Ultrasonographic assessment
of the jejunum and ileum is successful only if
certain conditions are met. When differentiat-
ing sonographic findings of the small intestine,
it is vital to know the time of the last ingestion.
In a fasting patient these segments of the small
intestine do not display a filled lumen, and
unless there are pathological findings, such as
ascites or inflammatory or neoplastic changes,
this "empty intestine” is masked from diagnos-
tic ultrasonography. The only section of the
small bowel regularly identified during ultra-
sound scanning is the terminal ileum where it
crosses anterior to the psoas muscle and where
it terminates at the colon (ileocecal valve).
Visualization and assessment of the jejunal
and ileal loops can be facilitated and improved
by examining the patient postprandially or
after oral intake of fluid (with antifoaming
agent added). Apart from a systematic analysis
based on the above criteria, assessment profits
from the 5 MHz probe since this allows better
differentiation of the wall layers. In the visual-
ization and assessment of peristaltic activity,
no other abdominal organ, except the small
bowel, has to rely so heavily on real-time scan-
ning. Wall thickening in the setting of inflam-
matory bowel disease can be detected with an
accuracy of 90.5% (sensitivity 90.3%, specificity
88.4%).
Colon. The large bowel frames the abdominal
cavity. It is always filled to a varying degree by
feces, scybala, and gas, thus being more of a
hindrance for abdominal ultrasound scanning
than offering easy access for diagnostic sonog-
raphy. The physiological peristaltic movement
of the colon cannot be visualized. The wall,
lumen, and peristalsis can only be identified
in large-bowel pathology or when employing
special examination techniques (retrograde
saline lavage, hydrocolonic sonography).
Focal Wall Changes
7 Gastrointestinal Tract 236
► Carcinoma
► Lymphoma
► Hematoma
► Polyp
► Intussusception
► Callstone/Bezoar
► Diverticula
► Diverticulitis
► Appendix
► Appendicitis
► Hernia
Focal wall changes at the small and large intes-
tine always present as a localized finding at the
intestinal loop itself. However, there will usu-
ally be characteristic reactions and changes in
the vicinity of this target sign as well, partic-
ularly in those intestinal segments upstream of
the lesion.
► Carcinoma___________________________________________________________________________
Focal adenocarcinoma is a common patholog-
ical finding in the large bowel, while it is a rare
entity in the small intestine (Figs. 7.18-7.20).
Ultrasonography will demonstrate a typical
concentric or atypical off-center target sign
with loss of the normal wall layers. Irregular
delineation at the luminal surface is not un-
common, and in concentric malignancies quite
often the lumen will be narrowed. This stenosis
may result in dilatation of the intestinal seg-
ments upstream, finally leading to full-blown
ileus. The area around the neoplasm is charac-
terized by a lack of peristaltic movement. The
texture of the target sign is coarse, lacks plia-
bility, and sometimes may be painful, signify-
ing peritonitis.
The tumor may present a smooth or irregu-
lar surface, and in advanced stages free fluid
and localized lymphadenopathy around the tu-
mor may be demonstrated. Presently, there are
no clear-cut color-flow Doppler criteria charac-
teristics of intestinal malignancy.
a Fig. 7.18 Cancer of the small intestine.
a Fig.7.19 Cancer of the ascending colon with target
sign due to tumor-induced concentric swelling of the
wall.
л Fig. 7.20 Tumor (T, cursors) has invaded a long seg-
ment of the sigmoid colon, growing into and along
the bowel wall (DW). Harmonic imaging.
► Lymphoma
Lymphoma of the small and large bowel
presents as a focal hypoechoic mass in the in-
testinal wall with loss of the normal layered
architecture (Fig. 7.21). One often encounters
bizarre neoplasms with luminal stenosis,
which are difficult to delineate from the adja-
cent tissue and frequently are hypervascular.
a Fig. 7.21 a NHL of the jejunum.
a b Lymphoma at the ileocecal valve in AIDS.
► Hematoma
Sometimes coumarin anticoagulant therapy
will be complicated by bleeding into the intes-
tinal wall, leading to circular hypoechoic thick-
ening of the wall or a focal hypoechoic mass,
with subsequent narrowing of the lumen and
loss of peristalsis (Fig. 7.22).
► Polyp________________________________________________________________________________________
Polypoid changes of the intestinal wall are
purely incidental findings best visualized
when the lumen of the bowel contains only a
trace of fluid (Fig. 7.23). Such a polyp will ap-
pear as a focal sessile protrusion into the in-
testinal lumen characterized by an atypical
pathological gut signature. In larger polypoid
lesions, color-flow Doppler scanning may dem-
< Fig. 7.22 Bleeding into the small bowel wall (DW) in
a patient on anticoagulant medication has produced
a thickened wall with a homogeneous, very hypo-
echoic structure (“garden hose” appearance).
onstrate the presence of vessels, thus permit-
ting these neoplasms to be differentiated from
scybala. Polyps do not alter the outer margin of
the intestinal wall. During peristaltic move-
ment of the bowel, such a sessile polyp may
be localized, but sometimes large polyps can
induce intussusception.
a Fig. 7.23 Colon polyp.
Small/Large Intestine
► intussusception__________________________________________________________________________________
In intussusception one part of the intestine
prolapses along the longitudinal axis into an
immediately adjoining part. Intussusception
of early childhood, where the abnormal mobil-
ity of various intestinal segments will lead to
the well-known enteric (Fig. 7.24) and ileocecal
intussusception, has a different etiology from
that in adults. In the latter case, there will al-
ways be a lead point triggering and leading the
way for the prolapse. Such lead points include
polyps (Figs. 7.25 and 7.26), large mural lymph
nodes, and tumors; in addition, intussuscep-
tion may also arise in small bowel affected by
Crohn disease.
Intussusception will present intermittently as a
multilayered pathological gut signature or tar-
get sign (Fig. 7.27). Edema and inflammation
produce marked thickening, thus emphasizing
the various layers of the wall, the outermost
hypoechoic layer (muscularis propria) of the
intussusceptum being especially thick. The in-
tussusceptum can be identified by its own peri-
stalsis, and in adults a tumorous lesion (polyp,
tumor, lymph node) will provide the lead point.
When bowel loops are invaginated, the patient
suffers from massive localized pain and tender-
ness.
a Fig. 7.24 Enteric intussusception.
a Fig. 7.25 Cross-sectional view of an intussusception.
Left: through the apex. Right: through the neck of the
polyp.
a Fig. 7.26 Intussusception. Left: longitudinal view with
muscular hypertrophy in the thickened outer and
delicate invaginated inner gut signature. Right:
cross-sectional view of a polyp as the leading point.
a Fig. 7.27 So-called target sign (layered pathological
gut signature) in intussusception.
► Callstone/Bezoar
7 Gastrointestinal Tract 238
Large foreign objects may impact in the small
bowel, thus producing localized reaction and
even triggering mechanical ileus. The most
common such object is a large gallstone that
has perforated the gallbladder into the duode-
a Fig. 7.28 Gallstone ileus.
g Ultrasound image.
num (Fig. 7.28). If it obstructs the lumen of the
small intestine it will be visualized as a ball-
shaped, inhomogeneous hyperechoic mass
with posterior shadowing. There is very little
localized tenderness and the findings and
a b Surgical specimen.
symptoms of the mechanical ileus dominate
the picture. In addition, unequivocally patho-
logical findings can be demonstrated at the
gallbladder and possibly the biliary tree (pneu-
mobilia).
a c Differential diagnosis: bezoar, distinguished from a
gallstone by its irregular surface. D = intestine.
► Diverticula
Besides the typical clinical findings, ultrasound
has become the most important method for
the diagnosis of diverticulitis, providing a sen-
sitivity of 98.1 % and a diagnostic accuracy of
97.7%.
Diverticula of the sigmoid colon are echogenic
because of the gas or feces they contain; some-
times the outer hypoechoic layer of the intes-
tinal wall (muscularis propria) becomes more
pronounced owing to the concurrent muscular
hypertrophy.
At times, penampullary duodenal diverticula
(Fig. 7.29) may be recognized by the alternating
presenceofair and fluid within the lumen. How-
ever, Meckel’s diverticulum may only be visual-
ized in the presence of pathological changes.
« Fig. 7.29 Visualization of a periampullary duodenal
diverticulum filled with air.
► Diverticulitis
Inflammation of a diverticulum will always re-
sult in localized tenderness. The diverticulum
itself displays marked distension; the divertic-
ular wall will appear as edematous hypoechoic
crescent-shaped halo around the lumen which,
when filled with feces, will be hyperechoic or
hypoechoic in the presence of fluid.
Apart from this typical local finding, diver-
ticulitis will demonstrate two other character-
Diverticulosis/DiverticuHtis
True diverticula are sacculations of the intesti-
nal wall involving all layers and resulting in
localized outpouching, e.g., duodenal divertic-
ula (Fig.7.29), Meckel’s diverticulum, diver-
ticula of the ascending colon. However, false
diverticula, also known as pseudodiverticula,
are by far more frequent: here, gaps (defects)
in the muscularis propria lead to localized
sacculation of mucosa and submucosa (e.g.,
sigmoid diverticula). Local findings always
comprise hyperplasia of the muscularis prop-
istic findings: particularly proximal of the di-
verticulum, the intestinal loop shows extended
muscular hypertrophy of the wall and thicken-
ing of the outermost hypoechoic layer, as well
as edema with pronounced layering of the wall
and marked narrowing of varying degree of the
gut lumen. There will be significant inflamma-
tory hypervasculanty at the diverticulum,
which is surrounded by a localized massive
ria, and the musculature of the surrounding
intestinal wall becomes hypertrophied.
The formation of numerous pseudodiverticula
in the sigmoid colon (diverticulosis) is seen as
sequela of local pressure increases within the
intestinal lumen, which in turn arises from
nutrition low in dietary fiber. In addition, focal
weakening of the bowel wall around the af-
ferent and efferent vessels is also considered
a causative factor. Feces impacted and inspis-
sated in the extruded diverticular sac induce
reaction of the adjacent tissue: its being walled
off by the greater omentum may result in a
hyperechoic halo several centimeters thick.
Complications are heralded by peridiverticular
fluid, local collection of gas, abscess formation
and fistulization (B 7.2).
local pressure erosion of the mucosa, chronic
inflammatory granulation (diverticulitis), and
also possibly abscess formation and perfora-
tion (3 7.2). Apart from muscular hypertro-
phy of the intestinal wall (particularly of the
proximal segments), recurrent and chronic
inflammation with edema and narrowing of
the lumen will finally result in cicatricial con-
traction of the chronically inflamed bowel
segment.
Н 7.2 Acute Sigmoid Diverticulitis
a Left: Extensive edematous patholog-
ical gut signature in the left lower
quadrant with muscular hypertrophy of
the intestinal wall and narrowed lumen.
Right: Edematous wall of the sigmoid
colon with stool-filled diverticulum and
hypoechoic halo.
b Accentuated edematous intestinal
wall. Diverticulum filled with feces;
marked reaction of the adjacent tissue
with hyperechoic halo.
c Edematous diverticulum (arrows)
with hyperechoic panniculitis.
d Walled off perforation with localized
collection of free air and free fluid.
Small/Large Intestine 239
e Perforation with demonstration of
free fluid and abscess formation.
f Demonstration of inflammatory hy-
pervascularity.
► Appendix_____________________________________________________________________________
High-resolution probes can visualize a normal
appendix in approximately 40% of cases; a gut
signature displaying normal architecture will
be seen at the cecum, terminating blindly and
lacking in peristalsis, with a maximum diame-
ter > 6 mm (Fig. 7.30).
* Fig. 7.30 View of the appendix from the cecum
(COE) to its blind end over the iliac artery (Al).
Inflammatory wall thickening at that site is consis-
tent with appendicitis (surgery).
► Appendicitis______________________________________________________________________________________
Acute appendicitis can be diagnosed sono-
graphically with a positive predictive value of
95.7% and a sensitivity of 88.5%. Thus, the di-
agnostic accuracy of ultrasound is only margin-
ally below that of bolus CT (sensitivity 96%,
positive predictive value 95-96%). Inflamma-
tion of the appendix is characterized by en-
largement, dilatation, and thickening, initially
with demonstration of edema and accentuated
layering of the wall; quite often fecaliths will
be seen within the lumen. Appendicitis is
always accompanied by localized tenderness
(Fig. 7.31). Advanced stages will destroy the
layered structure of the wall and produce a
hyperechoic echo, local accumulation of fluid,
and abscess formation (Table 74, Figs. 7.32-
7.34). In such an advanced stage of the inflam-
mation, the appendix itself is almost impossi-
ble to identify, and frequently localized lym-
phadenopathy will be evident.
Table 7.5 summarizes the differential diag-
nosis of appendicitis by ultrasound (Fig. 7.35).
a Fig. 7.31 Acute appendicitis. Pathologically dis-
tended and thickened appendix with local tender-
ness.
a Fig. 7.32 Acute appendicitis. Thick pathological gut
signature with pronounced wall layering and hyper-
echoic halo.
Table 7.4 Sonographic signs in acute ap-
pendicitis
► Swelling of the appendix
► Thickening of the wall
► Fluid-filled lumen
► Tenderness
► Fecalith
► Hyperechoic omental cap
► Free fluid
► Pentyphlitis
► Loss of peristalsis
7 Gastrointestinal Tract 240
a Fig. 7.33 Acute purulent appendicitis.
a Fig. 7.34 Perforated acute appendicitis: partial loss of
delineation of the appendix (AP) and thickening of
the cecal wall (COE). Arrows: swelling. The patient
also had fluid around the liver and an atonic, con-
gested gallbladder (not shown).
« Fig. 7.35 Purulent salpingitis.
Table 7.5 Differential diagnosis of acute
appendicitis by ultrasound
Bowel ► Enteritis ► Terminal ileitis ► Intussusception ► Diverticulitis ► Tumor
Adnexa and ovary ► Adnexitis ► Tubo-ovarian abscess (Fig. 7.35) ► Ectopic pregnancy ► Hemorrhagic cyst ► Torsion of ovarian tumor
Psoas muscle ► Hematoma of the psoas muscle
Ureter ► Stenotic ureteral origin ► Ureterolith
Lymph node ► Mesenteric lymphadenitis
Vessels ► Thrombosis ► Arterial dissection ► Aneurysm
Other ► Cholecystitis ► Pancreatitis ► Perforated gastric ulcer
► Hernia_____________________________________________________________________________________
Hernias are defects in the abdominal wall. Ul-
trasound can identify the location (inguinal,
femoral, umbilical, incisional, spigelian, epigas-
tric) and size of the fascial defect as well as the
contents. Demonstration of an edematous gut
signature with accentuated wail architecture in
the hernial sac proves that bowel is involved in
the herniation; in these cases, stasis and even
mechanical ileus may be present in the more
proximal intestinal segments (Fig.7.36).
a Fig. 7.36 a Inguinal hernia on the left with incarcer-
ated intestinal loop and mechanical ileus.
a b Incisional hernia (arrows); interrupted peritoneal
contour (P).
Extended Wall Changes_________________________________________________
— ► Enteritis
► Sprue
► Crohn Disease
► Ulcerative Colitis
► Amyloidosis
► Ischemia
► Pseudomembranous (Antibiotic** asociated) Enterocolitis
► Hypertrophy
► Tumor
► Lymphoma
Si
Extended changes in the jejunal, ileal, and co-
lonic wall are primarily due to acute infection
or chronic inflammation, while toxic, allergic,
ischemic, invasive, and functional causes are
much less common. Differential diagnosis has
to rule out extended malignant wall changes.
Small/Large Intestine
► Enteritis_____________________________________________________________________________________________________
The continuous, extended edematous thicken-
ing of the mucosa in enteritis is seen primarily in
the ileum but also in the jejunum and colon.
There is markedly accentuated wall layering,
with the mucosa and/or submucosa being par-
ticularly thick, resulting in a narrowed lumen of
the bowel. In acute enteritis the intestinal lumen
always contains some fluid, even in the fasting
state, and this finding is present even before the
clinical symptom of diarrhea (Figs. 7.37-7.41).
In the small intestine the folds of Kerckring
may be pronounced, while in the colon the
haustra and folds may intertwine in gyrose
fashion. One characteristic sign in the small
bowel is vigorous peristalsis that propagates
in an orderly antegrade way and does not ex-
hibit any tendency to pendulate. In acute enter-
itis the colon, too, will demonstrate peristaltic
activity. Color-flow Doppler scanning may vis-
ualize inflammatory hypervascularity in the in-
testinal wall that, at least in its initial stages,
seems to correlate with the severity of the in-
flammation. Outside the bowel, ascites may be
present, signifying the inflammatory perito-
neal reaction, as well as enlarged mesenteric
lymphadenopathy.
In severe necrotizing inflammation the peri-
staltic activity and the inflammatory hypervas-
cularity will subside again. There will be diffuse
tenderness along the diseased bowel segment,
and the intestinal wall will be characterized by
indistinct wall layering; the appearance of gas
bubbles has to be regarded as a particularly
ominous sign. These gas bubbles will be carried
along the venous system of the mesentery and
are the cause of portovenous gas embolism in
the liver.
a Fig. 7.37 Infectious enteritis, probably yersiniosis
(patient presented clinically with suspected appendi-
citis). Scan shows “gyral" wall thickening with an
accentuated layered structure (cursors) and intralu-
minal fluid (FL).
a Fig. 7.38 Microbial invasive enterocolitis (Campylo-
bacter jejuni). Scan demonstrates the thickened, lay-
ered wall of the terminal ileum (Tl. cursors).
a Fig. 7.39 Enterocolitis with free peritoneal fluid.
a Fig. 7.40 Acute ileitis with appendicitis, each shown
in transverse section: layered wall thickening of the
terminal ileum (I) and appendix (arrows: histologically
confirmed at operation).
a Fig. 7.41 a and b Similar appearance as in Fig. 7.40. with longitudinal sections of the terminal ileum (Tl) and
appendix (AP; cursors 4.5 mm). These findings, along with the mesenteric lymph nodes (L in b). are suggestive of
yersiniosis. Acute appendicitis also reguires differentiation from mesenteric lymphadenitis, which may occur in the
absence of ileitis and can cause significant lymph node enlargement. D = intestine.
► Sprue
7 Gastrointestinal Tract 242
Being a special case of enteric reaction, celiac
disease is characterized by edema with hypo-
echoic thickening of the intestinal wall and
marked distension of the fluid-filled lumen.
The hyperperistaltic loops of the small bowel
spin around each other, giving rise to the term
"tumbler phenomenon” (Fig. 7.42).
л Fig. 7.42 a and b Sprue.
► Crohn Disease_________________________________________________________________________________
Crohn disease is a chronic inflammatory bowel
disease occurring anywhere in the gastrointes-
tinal tract, with discontinuous extended in-
volvement of individual bowel segments, the
primary location being the terminal ileum and
colon. In addition to the segmental pattern of
the typical pathological changes demonstrated
by ultrasound, the type and severity of the
most frequent transmural inflammation and
its complications, with their wildly mixed and
constantly alternating pattern, are characteris-
tic of Crohn disease (в 7.3).
Type of wall change. In Crohn disease various
types of change in the intestinal wall can be
seen, depending on the transmural severity of
the inflammation.
► On the one hand, the layering of the wall
becomes more pronounced and thickened,
® 7.3 Crohn Disease
► Colon involvement
► Complications
► Accentuated wall, inflamma-
tory hypervascularity
а-d Involving the terminal ileum.
a Terminal ileitis.
d Crohn colitis.
b Accentuated layering of the intestinal
wall in the terminal ileum.
e Accentuated wall of the descending f Crohn colitis,
and sigmoid colon.
c Terminal ileitis with inflammatory
hypervascularity.
g Crohn colitis, hyperactive phase: hy-
poechoic swelling of the wall (DW) with
loss of all layering. Al = iliac artery; VI -
iliac vein.
h-i Complications.
h Accentuated wall of the terminal
ileum post appendectomy with abscess
formation. Al = iliac artery; VI = iliac
vein.
i Crohn disease of the terminal ileum
(Tl) with a hazy, thickened wall and
“mesenteritis" (arrows with echogenic
"omental cap"). Fistulous tract (F) leads
from the wall-thickened loop of ileum
into the abdominal wall (BW). Con-
firmed at operation.
the intestinal lumen is narrowed, and, be-
cause of the impaired peristalsis (inflamma-
tory rigidity), the segment involved may act
as functional stenosis.
► On the other hand, the intestinal wall may
display a complete loss of normal layering,
and diffuse and irregular hypoechoic thick-
ening or hyperechoic widening, which may
also result in aperistaltic narrowing of the
lumen.
► Ulcerative Colitis
Ulcerative colitis is a continuous chronic inflam-
mation of the distal left or even the entire colon.
It manifests as an extended homogeneous slight
thickening of the colonic wall with clearly iden-
tifiable wall layers and a tight lumen. There is
There is a gradual transition from one type of
wall change to the other.
Complications. Complications of Crohn dis-
ease can be expected to arise from the func-
tional and/or organic stenosis (colicky pain up-
stream of the stenotic segment, signs of me-
chanical ileus in the proximal bowel loops) as
well as the local inflammation. Apart from local
tenderness, color-flow Doppler scanning will
reveal inflammatory hypervascularity in the
intestinal wall and its vicinity. There will be
hyperechoic panniculitis and inflammatory re-
neither peristaltic activity nor clear-cut hyper-
vascularity or concurrent reaction of the adja-
cent tissue. On physical examination, extended
diffuse tenderness may be triggered along the
pathological gut signature (Fig. 7.43).
action of the greater omentum (hyperechoic
halo) as well as complications such as forma-
tion of abscesses, fistulas, and conglomerates
comprising several loops of bowel.
Sensitivity and specificity in the diagnosis of
inflammatory bowel disease are reported be-
tween 90.3% and 95%K 2: in detecting strictures
a sensitivity and specificity of 100% and 91%,
respectively, and in the diagnosis of fistulas
87% and 90%, respectively with a bowel wall
thickening of at least 3 mm . Power Doppler
has a high accuracy in the detection of disease
acitivity4.
Small/Large Intestine 243
It seems possible to discriminate severe and
moderately extend and activity with a specific-
ity, sensitivity, and diagnostic accuracy of 96%,
90.3%, and 92.9%, respectively5.
л Fig. 7.43 Ulcerative colitis.
a and b Thickened wall of the bowel with tight lumen.
a c There is no hypervascularity
► Amyloidosis_______________________
Amyloid deposits in the wall of the bowel are a
rare finding: they are seen as hyperechoic, ho-
mogeneous thickening of the entire intestinal
wall with filifoim stenosis of the lumen
(Fig. 7.44), and there is no peristalsis.
► Ischemia
In acute ischemia there will be edematous
swelling of the bowel wall and, while initially
the layering of the wall persists, eventually it
will end in hypoechoic thickening and narrow-
ing of the lumen. The lack of vascularization
(especially since the diseases to be considered
in the differential diagnosis tend to be hyper-
vascular) raises the suspicion of a circulation
disorder (Fig. 7.45).
a Fig. 7.44 Amyloidosis.
a Hyperechoic homogeneous thickening of the en-
tire intestinal wall.
л b Amyloidosis. Filiform narrowing of the lumen.
л Fig. 7.45 a-c Ischemic colitis on the left side.
a Descending colon wall shows hypoechoic swelling
that starts abruptly in the distal transverse colon
Color duplex shows no evidence of vascularity.
7 Gastrointestinal Tract 244
« b Close-up view, caudal end: no vascularity.
•« c Occlusion of the inferior iliac artery (Al) with slight
evidence of retrograde flow (red).
► Pseudomembranous (Antibiotic-associated) Enterocolitis
This type of colitis is characterized by a marked
hypoechoic hypervascular swelling of the in-
testinal wall (Fig. 7.46).
л Fig. 7.46 a-c Pseudomembranous (antibiotic-associ-
ated) pancolitis. The inflammatory wall swelling is
most pronounced in the ascending colon and dimin-
ishes toward the sigmoid colon.
a Ascending colon: massive, tumorlike wall swelling
with loss of the normal layered pattern (DW).
a b Sigmoid colon: hypoechoic wall swelling with a
faint layered pattern (DW)
a c Marked swelling of the intestinal wall, intensive
hyporeflectivity, pronounced vascularization.
► Hypertrophy
The musculature of the intestinal wall up-
stream of a stenosis or a functionally stenosed
bowel segment will become hypertrophic be-
cause of increased activity and will display
widening of the outermost hypoechoic layer
(muscularis propria) despite the dilated lumen.
Typical such examples are the wall of the de-
scending colon and sigmoid in stenotic sigmoid
diverticulitis and the prestenotic bowel seg-
ments in Crohn disease.
► Tumor_________________________________
Extended tumor growth may mimic diffuse
changes in the wall of the bowel and has to
be differentiated especially from Crohn disease
as well as ischemia; however, these present the
typical characteristics of a focal tumor lesion
(Fig. 7.20). The musculature of the intestinal
wall upstream of a stenosis or a functionally
stenosed bowel segment will become hyper-
trophic because of increased activity and will
display widening of the outermost hypoechoic
layer (muscularis propria) despite the dilated
lumen.
► Lymphoma_____________________________________________________________________________________
Lymphoma may lead to extended diffuse in-
volvement of the bowel wall.
Dilated Lumen
— ► Physiological Dilatation
► Prepping for the Study
► Inflammation
► Ileus
► Coprostasis
► Tumor
► Foreign Body
Small intestine. Under physiological condi-
tions no chyme can be demonstrated in the
small intestine (hence its name “intestinum
jejunum”: empty intestine). Oral intake of
food and fluid will result, after some delay
(temporary retention of the ingesta in the
stomach), in a dilated lumen of the small
bowel. Demonstration of fluid within the in-
testinal lumen in the fasting patient has to be
regarded as pathological; further differentia-
tion should include the size of the lumen, peri-
staltic activity, and the wall changes.
Large intestine. Because of its storage function,
the large bowel is always full of scybala and air
and therefore the sonographic assessment of
its diameter is irrelevant. In pathological con-
ditions or when particular types of bowel prep-
aration are employed, fluid or sonolucent
chyme can be visualized in the lumen, in which
case the diameter of the lumen, particularly
any change in lumen diameter, can be assessed
during the sonographic study.
Small/Large Intestine 245
► Physiological Dilatation___________________________________________________________________________
Fluid can be demonstrated in the small intes-
tine within just a few minutes after oral intake;
the lumen becomes fluid-filled in segmental
fashion, waves of contraction alternating with
distension of the intestinal loops and propel-
ling the column of ingesta forward. The loops of
small bowel display a normal wall texture. In
those jejunal segments filled with fluid, the
Kerckring’s folds will be visualized as fine cor-
rugations. while at the ileum the intraluminal
surface will be smooth. Even a distended lumen
will not have a diameter exceeding 15-20 mm.
and during contraction the bowel will be
wrung dry; here, the loops of the small bowel
will evidence a thick muscular layer. The fine
film of remaining fluid permits excellent delin-
eation of the mucosa as well.
► Prepping for the Study____________
Specific loading by oral fluid uptake for sono-
graphic Sellink studies or rectal enemas for
hydrocolonic sonography (HCS) permit assess-
ment of changes in the lumen and of focal and
extended changes in the intestinal wall, detec-
tion and localization of circumscribed obstruc-
tions and stenosis, and especially assessment of
the peristalsis.
► Inflammation____________________________________________________________________________
In a fasting patient suffering from enteritis, the
intestinal lumen will exhibit some fluid, but
here the dilatation is less than after oral intake
and rarely goes beyond a luminal diameter of
10 mm (Fig. 7.47). The primary aspect is edem-
atous thickening of the intestinal wall of vary-
ing degree, accompanied by vigorous or even
swirling hyperperistalsis characterized by con-
stant alternation between contraction and di-
lation without any rest in these phases. During
their peristaltic movements the loops of the
small bowel constantly change their location.
Other findings in enteritis may be the signs of
peritonism (free intra-abdominal fluid) as well
as regional lymphadenopathy.
* Fig. 7.47 Enteritis with a thin film of fluid covering
the folds of Kerckring in the jejunum.
► Ileus___________________________________________________________________________________________________________
The leading sonographic sign of ileus is disten-
sion of the bowel. In the small intestine this
dilatation of the lumen may be several centi-
meters. The lumen is filled with fluid (in the
small bowel) or echogenic chyme (in the large
bowel and in chronic ileus). Because of the
constant filling of the lumen, the intestinal
wall can be assessed quite well at the intra-
luminal surface. The Kerckring’s folds in the
small bowel appear rigid, giving rise to the
so-called “piano key phenomenon,” and in the
large intestine the haustra are easily identifi-
7 Gastrointestinal Tract 246
able. Despite the dilatation, with increasing
duration and severity of the damage the intes-
tinal wall itself may appear thickened and full
of edema (S 7.4).
Peristalsis. The most important sonographic
criterion in the differential diagnosis of ileus
is assessment of the peristaltic movement. The
early stages of mechanical ileus will demon-
strate vigorous peristaltic activity of the wall,
which, however, is ineffective and only results
in incomplete contraction. The intraluminal
The Various Types of Ileus
Ultrasound may be able to diagnose ileus six
hours before it shows up on regular radio-
graphic films.
All types of ileus. All types of ileus are char-
acterized by significant distension of the lu-
men, signs of wall thickening (edema, hyper-
trophy), and finally signs of peritonitis with
demonstration of an increasing amount of
free fluid between the bowel loops. The typ-
ical air-fluid interfaces have a sonographic
counterpart: with the patient supine, the
air-filled intestinal loops will block imaging
with the probe on the anterior abdominal
wall, while a study with the probe on the
lateral abdominal wall will demonstrate quite
well the intestinal loops, distended by the
column of fluid exhibits pendulating peristal-
sis, while during the later stages the unsuccess-
ful peristalsis of the intestinal wall will cease
completely. The intraluminal fluid will slosh
back and forth gently and finally will simply
stop moving. This stage of the mechanical ileus
can no longer be differentiated from paralytic
ileus, with the same ngidly distended lumen,
thickened wall, and signs of peritonism (free
fluid). The possible causes of mechanical ileus
are summarized in Table 7.6.
fluid/chyme, and their peristalsis, thus per-
mitting better differentiation of the ileus.
Mechanical ileus. Initially this will demon-
strate hyperperistalsis in those intestinal seg-
ments upstream of the obstruction, which
itself can quite often be visualized sono-
graphically, but the chyme/fluid will no longer
be propelled in a directed fashion. In addition
to antegrade “squirty” movements, more and
more retropulsion (backward sloshing) be-
comes evident as well as pendulating motion
of the intraluminal fluid. During the late
stages of mechanical ileus this hyperperistal-
sis will disappear completely, the intestinal
wall will be seen to initiate some ineffective
efforts of contraction, and the intraluminal
Table 7.6 The causes of mechanical ileus
► Adhesions
► Tumor
► Hernia
► Inflammatory stenosis (Crohn disease)
► Intussusception
► Volvulus and torsion
► Gallstone
► Foreign body
column of fluid sloshes back and forth gently
until it finally rests. Downstream of the me-
chanical obstruction the bowel will be con-
tracted, demonstrating a collapsed lumen
and lacking any obvious peristaltic activity
(so-called starvation gut).
Paralytic ileus. This type of ileus is charac-
terized by luminal distension, thickening of
the wall, and the signs of peritonism (free
fluid). The intestinal wall does not exhibit
any peristaltic activity and the intraluminal
column of fluid is static; this situation cannot
be differentiated from advanced mechanical
ileus, unless it is possible to visualize the
cause underlying the mechanical obstruction.
- 7.4 Ileus
a Ileus with peritonism and rigid dis-
tended ileal loops.
b Chronic ileus.
c lleocecum in chronic ileus (stenotic
tumor of the hepatic flexure).
d Chronic ileus in incarcerated inguinal
hernia (Fig. 7.36).
e Chronic ileus of the small bowel with
distended lumen and edematous
thickened Kerckring’s folds.
f Rigid Kerckring’s folds displaying the
so-called piano key phenomenon.
g In addition, free fluid signifying peri-
tonism.
h Free fluid in peritonism and intra-
mural gas in the jejunal wall.
► Coprostasis------------------------------------------------------------------------------------------------------------
The colon filled with gas or feces can be iden-
tified by its prominent arching haustra, which
would be a perfectly normal finding, intensi-
fied however in coprostasis. In the irritable
bowel syndrome, local tenderness may often
be elicited along the course of the colon.
CM
► Tumor
A large polypoid tumor may fill the lumen
completely. It may be identified by indirect
signs (e.g., as cause of mechanical ileus) or the
visualization of tumor vessels in the polypoid
mass may facilitate the differentiation of tumor
from feces. A possible complication is the tu-
mor acting as the leading point in intussuscep-
tion.
Small/Large Intestine
► Foreign Body---------------------------------------------------------------------------------------------------------------------
It is the rare exception for foreign bodies to be
identified and located as such; quite often, it is
possible only if they are sufficiently large to
produce complete obstruction with subse-
quent mechanical ileus.
Narrowed Lumen__________________________________________________
► Tumor Stenosis
► "Starvation Cut"
► Ischemia
► Atrophy
The lumen may be narrowed by changes in the
bowel wall (tumor, inflammation, invasion) or
by external effects (adhesions, tumor, hernia).
► Tumor Stenosis______________________________________________________________________________________
Carcinomas that grow primarily in circular
fashion, but also off-center, as well as lympho-
mas can narrow the lumen until there is a fili-
form stenosis, and finally a complete stoppage
with the full-blown clinical picture of mechan-
ical ileus (Fig. 7.48). Apart from the pathologi-
cal gut signatuie of the tumor, ultrasonography
can demonstrate the distended intestinal loops
proximal of the obstruction, while downstream
there is the poststenotic “starvation gut” (see
below).
« Fig. 7.48 Sigmoid carcinoma. Solid, hypoechoic tu-
mor mass (T). Prestenotic dilatation of the sigmoid
colon, markedly overdistended with gas (echogenic
zone with an acoustic shadow obscuring the poste-
rior wall). Arrows = diverticulum.
► “Starvation Cut”
7 Gastrointestinal Tract 248
Compared with the distended intestinal loops ileus the bowel segment distal to the obstruc-
proxima) to the obstruction, in mechanical tion will be contracted and empty.
► Ischemia___________________________
In chronic ischemia there is extended hyper-
echoic thickening of the intestinal wall with a
markedly narrowed lumen.
► Atrophy_________________________
Bypassed intestinal loops demonstrate a con-
stricted lumen.
References
1. Schwerk WB BK, Raith M. A prospective evalua-
tion of high-resolution sonography in the diag- 3.
nosis of inflammatory bowel disease. Eur J Gas-
troenterol Hepatol 1992;4:173-182 4.
2. Solvig J, Eckberg O. Lindgren S, et al. Ultrasound
examination of the small bowel: Comparison
with enteroclysis in patients with Crohn's dis-
ease. Abdom Imaging 1995;20;323-326
Gasche C, Moser G, Turetschek K, Schober E,
Moeschl P, Oberhuber G. Gut 1999;44:112-117
Neye H, Voderholzer W, Riekes S. Weber J,
Wermke W, Lochs H. Evaluation of criteria for the
activity of Crohn’s disease by power Doppler so-
nography. Digestive Diseases 2004:22:67-72
5. Arienti V, Campieri M, Boriani L, et al. Manage-
ment of severe ulcerative colitis with the help of
high-resolution ultrasonography. Am J Gastroen-
terol 1996;91(10):2163-9
8 Peritoneal Cavity
Peritoneal Cavity 251
▼ Diffuse Changes
f ▼ Anechoic Structure
► Cirrhosis of the Liver
► Heart Failure
► Peritonitis
— ► Hypoalbuminemia
► Peritoneal Carcinomatosis
► Hemoperitoneum
▼ Hypoechoic Structure
— ► Pancreatitis
► Cirrhosis of the Liver with SBP
(Spontaneous Bacterial Peritonitis)
► Peritoneal Carcinomatosis
— ► Purulent Peritonitis
— ► Tuberculosis
► Choleperitoneum
— ► Hemoperitoneum
— ► Cl Tract Perforation
— ► Chyloperitoneum
▼ Hyperechoic Structure
I--► Pneumoperitoneum
▼ Localized Changes
I^^JneThoi^tructure
► Septated Ascites
► Intra-abdominal Abscess
▼ Hypoechoic Structure
—- ► Abscess
► Bilioma
► Hematoma
► Necrosis after Pancreatitis
▼ Hyperechoic Structure
► Localized Perforation
► Gas Abscess
▼ Wall Structures
▼ Smooth Margin
— ► Right-Sided Heart Failure
— ► Cirrhosis
► Peritoneal Carcinomatosis
▼ Irregular Margin
— ► Pancreatitis
► Peritonitis
► Peritoneal Carcinomatosis
▼ Differentiating Intra-and Extra-
luminal Gl Tract Fluid
▼ I nt rag astric Processes
► Gastric Outlet Obstruction
▼ Intraintestinal Processes
— ► Duodenal Stenosis
— ► Small Bowel Obstruction
► Large Bowel Obstruction
8 Peritoneal Cavity
D. Nuernberg
Anatomy________________________________________________________________________
Definition
► Capillary space between the parietal and
visceral peritoneum
Synonyms
► Peritoneal cavity
► Greater peritoneal cavity
► Intraperitoneal space
► Abdominal cavity
► Intra-abdominal space
The abdominal organs (viscera) are invested by
a thin serous membrane, the so-called visceral
peritoneum, while its continuation lining the
abdominal wall (parietes) is known as the pa-
rietal peritoneum. The peritoneum continu-
ously transudes serous fluid, thus enabling
the organs, lined by the visceral peritoneum,
to glide over each other. Since the peritoneum
reabsorbs this peritoneal fluid constantly, the
imaging modalities will not be able to demon-
strate any significant amount of fluid. Thus, the
peritoneal cavity usually exists as a “peritoneal
gap" and is that space that can be visualized
sonographically only in pathological condi-
tions. A true space or cavity exists only if fluid
or another substrate collects in the gap be-
tween the visceral and parietal peritoneum
(intraperitoneal position).
Intraperitoneal fluid may stem from hyper-
secretion or impaired absorption, e.g., when
there is inflammation (peritonitis). This intra-
peritoneal fluid may also arise from injuries of
fluid-filled organs, e.g., bleeding {hemoperito-
neum) or perforation of the bile system (chol-
eperitoneum) or the gastrointestinal (Gl) tract.
Another reason for these fluid collections may
be pressure changes in the venous system
(right-sided heart failure, portal hypertension).
The peritoneal cavity may contain not only col-
lections of fluid but also gas and solid matter.
8 Peritoneal Cavity 251
Topography_____________________________________________________________________________
If an organ is completely invested by perito-
neum it is called Intraperitoneal* (e.g., stom-
ach, spleen, liver, small intestine, transverse
and sigmoid colon, ovaries). Retroperitoneal
organs are the kidneys, adrenal glands, aorta,
and vena cava. If only the anterior part of an
organ is invested by peritoneum and otherwise
it is directly fixed to the posterior abdominal
wall, it is also regarded as being retroperitoneal
(e.g., pancreas, descending part of the duode-
num).
The reflections of the peritoneum divide it
into different abdominal compartments. Fig-
ures 8.1-8.4 illustrate this concept. The signifi-
cance of these compartments becomes evident
when the question arises whether there is dif-
fuse fluid within the peritoneal cavity or if it
only involves certain subspaces (e.g., in
“trapped” ascites).
Right subphrenic
recess
Right paracolic
recess
Ascending
mesocolon
a Fig. 8.2 Delineation and correlation of the longitudi
nal recesses on the right (based on reference 2).
D:
R:
U:
O:
E:
duodenum
rectum
uterus
ovary
esophagus
Hepatoduodenal ligament
a Fig. 8.1 Peritoneal reflections and the recesses thus created (based on reference 2)
8 Peritoneal Cavity 252
« Fig. 8.3 Delineation and correlation of the longitudi-
nal recesses in the midclavicular line (based on refer-
ence 2).
« Fig. 8.4 Delineation and correlation of the transverse
recesses {based on reference 2).
Ultrasound Morphology_______________________________________________________________________
The peritoneum itself cannot be demonstrated
by ultrasound since it does not exhibit a large
enough impedance gradient However, in ultra-
sound studies of the viscera it seems to be an
integral part of their boundary layers, e.g., the
hepatic surfaces, the boundary layer between
the liver and the right kidney, the splenic sur-
faces, and the inner lining of the abdominal
wall, and therefore appears as a hyperechoic
band investing the capsule of the organ. When
the visceral relations change (for instance, be-
tween liver and right kidney) the "gliding” mo-
tion of the peritoneum becomes quite evident
(Fig. 8,5).
Visualization of the peritoneal space implies
the presence of pathology! But there is always
an exception to the rule: in menstruating young
females a scant amount of free fluid can be dem-
onstrated in Douglas’s pouch. The same is true in
patients after abdominal surgery.
Ultrasonography of the Peritoneal
Cavity
► Sonographic accessibility
► Preferred localization for fluid and/or gas
collections
► Classification as to intraperitoneal, ex-
traperitoneal, and retroperitoneal loca-
tion
► Retroperitoneal space
Fluid collections. Fluid collections are seen as
anechoic/hypoechoic structures between the
abdominal viscera. Owing to gravity, fluid will
always collect in the dependent areas, i.e.,
while recumbent in the posterior parts of the
body and while upright in the lower abdomen
(Fig. 8.6).
Preferred localizations for fluid (anechoic/
hypoechoic) collections are (a 8.1 a-f):
► Perihepatic right
► Perihepatic left
► Subhepatic right (between the right lobe of
the liver and the right kidney = Morrison's
pouch)
► Subphrenic
► Perisplenic
► Omental bursa
► Douglas’s pouch, perivesical
► Between the bowel loops (characteristic for
ascites)
► Pericolic (“paracolic gutter”)
► Below the abdominal wall (knee-elbow po-
sition).
Gas collections. The accumulation of free in-
tra-abdominal gas may result in the formation
of hyperechoic structures. Physics dictates that
gas will rise, and therefore it will be found in
locations different from those for fluid, i.e., in
the more superior regions such as the sub-
phrenic recess (Fig. 8.7, see И 8.1 g-i).
Knowledge of these preferred localizations
helps to identify substrates and recesses: when
the patient is repositioned, fluids will gravitate to
the more dependent parts of the abdominal cav-
ity while gases will rise.
Extraperitoneal and intraperitoneal loca-
tion. Determination whether a formation is
intraperitoneal, extraperitoneal, or retroperito-
neal may be quite difficult. Visualization of the
organ surfaces is the most decisive factor in this
correlation; in the case of fluid collections in
the gastrointestinal tract, precise correlation
requires demonstration of the stomach or
bowel wall. Differential diagnosis becomes es-
pecially problematic when the fluid or gas does
not relocate upon patient repositioning. This
repositioning does not produce any significant
alterations in extraperitoneal and retroperito-
neal formations.
Differentiating intraluminal air within the G1
tract from hyperechoic intra-abdominal struc-
tures (gas collections) can become rather diffi-
cult (E 8.2a and b).
Retroperitoneal space. Here too this space as
such may only be demonstrated by the organs
it contains or by collections of foreign struc-
tures such as fluid, gas, or solid tissue. The
retroperitoneal space is delineated by correlat-
ing it with the retroperitoneal organs, e.g., the
kidneys, large vessels, or pancreas (E 8.2c-h).
Fig. 8.5 The hyperechoic boundary between the right
hepatic lobe and the right kidney (Morrison's pouch)
is formed by the surfaces of these two viscera and the
investing peritoneum.
л Fig. 8.6 Anechoic collection of free fluid (e.g., hepa
togenous ascites) within the peritoneal cavity, char-
acterized by the bowel loops floating in the fluid.
л Fig. 8.7 Gas collection as sequela of Gl tract perfora-
tion (based on reference 1). L = liver; К = kidney; S -
spleen.
Е 8.1 Gas and Fluid Collections within the Peritoneal Cavity
► Fluid collections
a Perihepatic: anechoic film anterior
and lateral to the right hepatic lobe.
Ascites due to alcoholic cirrhosis. The
amount of ascites may be guessed by
the thickness of the film.
b Morrison’s pouch: already there is a
small amount of free fluid in the hepa-
torenal recess, seen as anechoic gap
between the liver and kidney. Malignant
ascites in ovarian cancer.
c Subhepatic: free fluid below the liver
in the right transverse plane; ascites
(transudate) in right cardiac failure. The
hyperechoic delineation anterior to the
kidney corresponds with the perito-
neum plus the renal capsule.
8 Peritoneal Cavity 253
d Perisplenic: anechoic film around the
spleen, particularly at the hilum. In the
presence of just a minute amount of
fluid only hypoechoic organ surfaces
will be visualized.
e Douglas's pouch: in the lesser pelvis
even minute amounts of fluid can be
demonstrated. In this longitudinal plane
the uterus is bathed by the fluid.
f Interenteric: in the presence of large
amounts of free intra-abdominal fluid
the bowel loops float in the fluid and
weave around like underwater plants
(“sea anemone phenomenon”).
► Gas collections
g Hyperechoic intra-abdominal mass
caused by free air. Note the character-
istic reverberations.
h Characteristic image of the hyper-
echoic gas collection anterior to the left
hepatic lobe in the transverse plane,
with the patient supine. The left hepatic
lobe can be seen between the “curtain"
of free air.
i Gas collection inferior to the left
hepatic lobe; visible in the longitudinal
plane and posterior to the left hepatic
lobe in the area around the perforation
(duodenal ulcer).
И 8.2 Correlation of Extraperitoneal or Intraperitoneal Location
a Intraluminal air within the Gl tract.
Compared with the free air anterior to
the reverberation artifacts, the multi-
layered bowel wall is demonstrated.
b In a free perforation, repositioning
the patient will not yield any changes
and the wall of the Gl tract will not be
c The cardinal structures of the retro-
peritoneal space are its viscera, e.g., the
kidneys.
visualized.
d Intraperitoneal and retroperitoneal
hypoechoic masses anterior to and
around the right kidney in status post
rupture of the bile duct, with bile leak-
ing into the peritoneal cavity and the
retroperitoneal space.
8 Peritoneal Cavity 254
И 8.2 Correlation of Extra peritonea I or Intraperitoneal Location
e Peripancreatic hypoechoic mass; fluid
collection anterior to the head of the
pancreas in acute hemorrhagic pan-
creatitis.
f Hypoechoic film enveloping the right
kidney in retroperitoneal bile collection
due to a lesion during endoscopy of the
bile duct.
g Inhomogeneous hypoechoic retro-
peritoneal mass on the left, particularly
in the left psoas muscle: hematoma in
coumarin anticoagulant overdosage.
h Hyperechoic band anterior to the
right kidney and posterior to the gall-
bladder and duodenum: pneumoperi-
toneum due to retroperitoneal perfo-
ration during ERCP.
Diffuse Changes
Diffuse intra-abdominal formations may either
be anechoic, hypoechoic (echogenic!), or hy-
perechoic (Table 8.1). Patient repositioning
will alter the sonographic image of this diffuse
distribution, an almost pathognomonic charac-
teristic. The formation will change its location
and can be visualized in different compart-
ments.
Amount. The bigger the collection, the better
this effect will be noted. In anechoic substrates
(fluid) a small volume of 5-10 ml can already
be demonstrated, particularly within Morri-
son’s pouch. Between the bowel loops (pre-
ferred localization of ascites) and within Dou-
glas's pouch very small amounts may also be-
come visible. An amount of about 700-1000 ml
is required to become clinically detectable!
When the collection is large (several hundred
milliliters, or liters), if not all compartments
then at least several compartments will be in-
volved. The "floating" loops of the small intes-
tine in the anechoic fluid are particularly im-
pressive (so-called "sea anemone phenomen-
on," Fig. 8.9).
Determination of the volume involved can
be fraught with problems. Some authors rely
on the width of the right perihepatic film with
the patient supine (1 cm = approx. 1 liter; 2 cm
Table 8.1 The echogenicity of diffusely distributed substrates
Echogenicity Substrate Contents Translucency
Anechoic Fluid Transudate Exudates Blood (early phase) Good translucency; surroundings can be assessed
Hypoechoic (echogenic) Fluid Exudate Blood (late phase) Bile Pus Chyle Good translucency; surroundings can be assessed
Hyperechoic Gas Gas/air (pus + gas) No translucency; reverberation artifacts; severely curtailed as-
sessment of the surroundings
= 1.5 liter; 3 cm = 2 liters) (Fig. 8.10). When the
patient is sitting or standing, the fluid will
gravitate into Douglas’s pouch and the amount
can be approximated by the ellipsoid method:
0.5 x h x w * / (Fig. 8.11). Rule-of-thumb ap-
proximation is more practicable than exactness
in the form x milliliters, x hundred milliliters,
or x liters. Follow-up studies by one and the
same sonographer have proved to be rather
helpful and may sometimes determine the
course of treatment.
Origin. The origin of peritoneal fluid collec-
tions (ascites) may be quite varied (Table 8.2).
The rate at which a particular type of ascites is
observed depends on the profession of the so-
nographer and the patient population studied.
In gastroenterology ascites tends to be hepato-
genic in origin; in oncology malignant ascites
prevails; while in gynecology ascites may be
due to ovarian cancer or ectopic pregnancy,
and hemoperitoneum will be most common
in the surgical emergency room. The makeup
a Fig. 8.8 Minute fluid collection between the bowel
loops (several milliliters) resembling an obtuse angle.
a Fig. 8.9 “ Sea anemone phenomenon”: in the case of
large amounts of diffusely distributed free fluid the
bowel loops will float unencumbered in the fluid.
a Fig. 8.10 When “guesstimating" the amount of free
fluid, the distance between the surface of the liver
and the lateral abdominal wall is a good marker.
Table 8.2 Origin of intra-abdominal fluid collections (by organ)
Hepatogenic/portal Cirrhosis, portal vein thrombosis, Budd-Chiari syndrome
Peritoneal Peritoneal carcinomatosis, peritonitis
Cardiac Right-sided heart failure
Pancreatogenous Acute/chronic pancreatitis
Ovarian Ectopic pregnancy, ovarian cancer
Vascular Portal hypertension, ruptured vessel
Chylous Lymphatic aplasia
Table 83 Type of ascites by origin and its
rate
Cirrhosis 30-50%
Malignancy 30-50% <N
Cardiac origin 10-15%
Other origins 10%
Diffuse Changes
of a patient population with ascites seen in a
regular hospital is listed in Table 8.3.
The most important parameters for the dif-
ferential diagnosis of intra-abdominal fluid are
patient history, clinical signs, distribution of
the fluid in the ultrasound study, sonographic
morphology, and finally ultrasound-guided
fine-needle paracentesis (Fig. 8.12).
Figure 8.13 illustrates an algorithm for the dif-
ferential diagnosis in ascites, based on diagnos-
tic paracentesis.
The differential diagnosis of fluid collections
within the peritoneal cavity is quite varied; an
overview is listed in Table 8.4.
a Fig. 8.11 The amount of free fluid in the lesser pelvis
(Douglas’s pouch) may also be "guesstimated” when
viewed in the longitudinal plane. Since this is a de-
pendant region of the body, even minute amounts of
fluid can be detected here.
a Fig. 8.12 Ultrasound-guided fine-needle paracente-
sis in the differential diagnosis of ascites. The tip of
the needle is visible as a small echogenic structure
anterior to the bowel loops. Ultrasound guidance will
help avoid injuries to intra-abdominal structures.
Ultrasound-guided Fine-needle Paracentesis
Quite often the clinical data and the patient’s
history, supplemented by ultrasound mor-
phology and the pattern of distribution, are
not enough to confirm the precise type of
ascites. Ultrasound-guided fine-needle para-
centesis is an efficient and proven method
with few potential complications that can
help ascertain the final diagnosis. For diag-
nostic purposes it uses needles of up to 3Fr
(1 mm diameter), while bigger needles are
employed in therapeutic procedures.
Ultrasound targeting. Ultrasound targeting
helps to avoid injury to vascular structures on
the inside of the abdominal wall (e.g., internal
Medusa’s head) as well as dry aspiration due to
the tip of the needle adhering to tissue. Fur-
thermore, it permits atypical needle insertion
sites in the left lowerquadrant (inverse McBur-
ney’s point). While any site may be selected,
the distance to the target should be as short as
possible and also should avoid any obstacles,
such as the bowel, omentum, etc.
Laboratory studies. If fluid can be aspirated,
thus confirming the suspected ultrasound di-
agnosis of “free fluid,” it first undergoes gross
examination; this will allow the ascites to be
classified as transudate/exudate, blood, bile,
pus, urine, or chyle. Then the liquid substrate
is subjected to additional cytological, bacter-
iological, and other laboratory studies.
While one aspiration would be enough for the
laboratory panel, in the case of peritoneal car-
cinomatosis cytology sometimes requires sev-
eral aspirations and work-ups. The sensitivity
depends directly on the number of aspirations.
If a malignant fluid collection is suspected clin-
ically and the cytology is negative, the fine-
needle aspiration has to be repeated. For dif-
ferential diagnosis, the following laboratory
parameters are cardinal findings:
Protein T in exudate
Amylase,
lipase j in pancreatogenous ascites
Hemoglobin j in status post bleeding
Granulocytes j in peritonitis
Cholesterol j in malignant ascites
Tumor cells T in malignant ascites
Bacteria T in peritonitis
Table 8.4 Differential diagnosis of intraperitoneal fluid (based on reference 7)
Transudate (anechoic) Exudate (anechoic or echogenic) Hemorrhage Postoperative, posttraumatic (echogenic)
Cirrhosis of the liver Peritoneal carcinomatosis Trauma Hematoma
Budd-Chiari syndrome Peritonitis Iatrogenic Seroma
Right-sided heart failure Pancreatitis Ectopic pregnancy Biloma
Inferior vena cava syndrome Tuberculosis Coagulation disorder Urinoma
Nephrotic syndrome Peritoneal dialysis Ruptured abdominal aortic aneurysm Chyme
Mesenteric venous thrombosis Mesothelioma Contents of a cyst
Hypoalbuminemia Lymphocele (chyliform ascites)
< Fig. 8.13 Algorithm for differentiating ascites by di-
agnostic paracentesis (based on reference 9)
8 Peritoneal Cavity 256
Anechoic Structure
▼ Diffuse Changes
Д » Anechoic Structure
Д» Hypoechoic Structure
Hyperechoic Structure
► Cirrhosis of the Liver
► Heart Failure
► Peritonitis
► Hypoalbuminemia
► Peritoneal Carcinomatosis
► Hemoperitoneum
Transudate. Most anechoic intra-abdominal
masses are transudates. There are no fine par-
ticles floating in the fluid, no strands of fibrin,
and no irregularities in the wall, examples
being cirrhosis of the liver, heart failure, and
peritoneal carcinomatosis. During its early
phase, acute hemorrhage after blunt abdomi-
nal trauma may also appear as anechoic fluid!
► Cirrhosis of the Liver
In most cases ascites in cirrhosis with hepatic
failure is anechoic (Fig. 8.14). When the patient
is being repositioned it will shift location and
may be demonstrated in all compartments. The
underlying disease can be diagnosed quite
easily based on the organ changes in the liver:
altered shape, outline, size, intrahepatic vascu-
lar pattern, and the extrahepatic signs of portal
hypertension, splenomegaly, and portovenous
shunts (collaterals) (see И 2.2, p. 56, and E 2.7,
p. 73). The irregular surface of the liver and the
splenomegaly are the easiest and most reliable
signs to detect.
л Fig. 8.14 Diffuse collection of anechoic fluid in alco-
holic cirrhosis of the liver.
a Transverse view high up in the upper right quad-
rant: ascites (A) and pleural effusion (E); the abdomi-
nal and thoracic cavity are separated by the echo-
genic diaphragm (ZW). L = liver.
л b Coarsely structured hepatic parenchyma, changes
in the vascular pattern, rounded margin
► Heart Failure
Transudate in decompensated right-sided
heart failure is a late symptom and appears
after or concomitant with pleural effusion
(right > left). Apart from the general clinical
signs, ultrasound will demonstrate a markedly
wide and rigid inferior vena cava and wide
hepatic veins (with pronounced starlike junc-
tion) as definite signs firming up the suspected
diagnosis (Fig. 8.15).
a Fig.8.15 Right-sided heart failure.
a The wide and rigid inferior vena cava and the wide
hepatic veins are characteristic for right ventricular
failure.
a b Right hepatic lobe bathed in anechoic ascites
(transudate) in decompensated right-sided heart fail-
ure.
Diffuse Changes 257
► Peritonitis_________________________________________________________________________________________________
Inflammation and infection in the peritoneal
cavity mostly result in exudates, and thus in
echogenic ascites with strands of fibrin and
septation. If there is only a small amount of
hypersecretion, e.g., in viral infection with
polyserositis, the ascites may also be anechoic
(Fig.8.16). Markedly purulent peritonitis is
characterized by echogenic contents, adhe-
sions, and bowel loops that no longer glide
unencumbered. In “spontaneous bacterial peri-
tonitis” (SBP) complicating decompensated cir-
rhosis of the liver, there will often be fine ech-
oes within the fluid.
a Fig. 8.16 g Small amount of subhepatic ascites in viral
polyserositis (accompanied by pleural and pericardial
effusion = multicavity effusion).
a b Small ‘angle of ascites’ between the right hepatic
lobe and the inferior pole of the right kidney in con-
comitant viral peritonitis.
► Hypoalbuminemia___________________________________________________________________
Irrespective of its origin, protein deficiency
with a markedly low level of plasma albumin
may result in the production of a hypoechoic
transudate. In these cases the wall of the gall-
bladder is thicker than normal (> 3 mm). Apart
from this observation, the liver appears un-
changed and there are no wide veins. Labora-
tory studies will yield further diagnostic clues.
► Peritoneal Carcinomatosis__________________________________________________________________
The malignant ascites in peritoneal carcinoma-
tosis may also be anechoic (Figs. 8.17 and 8.18),
but internal echoes within the fluid are much
more common. In anechoic ascites, the lack of
any signs for cirrhosis of the liver or portal
hypertension on the one hand and the demon-
stration of a possible primary tumor or meta-
stases on the other will lead one to suspect the
malignant origin. A detailed discussion of the
ultrasound criteria differentiating between be-
nign and malignant ascites is found in the sec-
tion on “Wall Structures” below.
a Fig. 8.17 Anechoic ascites enveloping the liver in
peritoneal carcinomatosis of metastatic gastnc can-
cer. Most often peritoneal carcinomatosis will display
echoes within the fluid, but it may also be anechoic.
a Fig. 8.18 Anechoic malignant ascites in advanced
gastric cancer. The retracted mesentery pulls to-
gether the bowel loops quite clearly.
► Hemoperitoneum__________________________________________________________________
8 Peritoneal Cavity 258
During its early phase, acute bleeding into the
peritoneal cavity after blunt abdominal trauma,
iatrogenic injury, in ectopic pregnancy, or drug
induced (e.g., anticoagulation therapy) will also
demonstrate an anechoic fluid collection
(Fig. 8.19). However, as time passes (hours)
there will be echogenic internal echoes due to
strands of fibrin that are formed while coagu-
lation sets in. History, clinical signs, and the
changing ultrasound image will firm up the
diagnosis in 95-98% of cases.
a Fig. 8.19 о Anechoic hemoperitoneum with blood in
the lesser pelvis after blunt abdominal trauma. With
the passage of time there will be echoes and strands
of fibrin, indicating the beginning of organization.
a b This massive hemopentoneum was caused by a
marked splenic lesion. The hematoma encompasses
more than 50% of the organ, while at the inferior pole
of the spleen there is free blood indicating open
rupture.
Hypoechoic Structure-------------------------------------------------
I2k Hyperechoic Structure
► Localized Changes
► Wall Structures
► Differentiating Intraluminal Cl
Tract from Intraperitoneal/
Extraperitoneal Fluid
— ► Pancreatitis
► Cirrhosis of the Liver with SBP (Spontaneous Bacterial Peritonitis)
► Peritoneal Carcinomatosis
► Purulent Peritonitis
► Tuberculosis
► Choleperitoneum
► Hemoperitoneum
► Cl Tract perforation
► Chyloperitoneum
Exudate. In most cases, the hypoechoic intra-
abdominal liquid structure displaying fine in-
ternal echoes or septation will be an exudate.
Strandlike structures adhering to the lateral
abdominal wall or the visceral peritoneum are
also rather characteristic. These strands of fi-
brin will demonstrate a classic swinging or
undulating motion with the shifting intra-ab-
dominal fluid. Examples of echogenic ascites
are pancreatogenous ascites and the ascites in
purulent peritonitis. Ascites permeated by fine
floating echoes may be present in spontaneous
bacterial peritonitis (SBP), a classic complica-
tion of decompensated cirrhosis of the liver.
However, echogenic internal echoes within
the fluid have been demonstrated in peritoneal
carcinomatosis as well.
► Pancreatitis------------------------------------------------------------------------------------------
In many cases of acute or recurrent pancreatitis
exudation into the free peritoneal cavity will be
seen. This is more true for necrotizing pancrea-
titis than for the hemorrhagic type. In severe
cases, all compartments are involved, present-
ing the full-blown picture of pancreatogenous
ascites. The latter may be anechoic, although
interna) echoes and septation as well as irreg-
ularities in the walls are much more common
(Figs.8.20 and 8.21). The ultrasound image is
characterized by floating strands of fibrin. The
inflammatory changes in the pancreas itself
(necrosis and other signs of pancreatitis as
well as vascular changes) are also important
for the diagnosis. If the clinical signs and ultra-
sound study do not result in a firm diagnosis,
ultrasound-guided fine-needle paracentesis,
with high levels of amylase and lipase in the
ascites will prove the pancreatic origin.
a Fig. 8.20 Echogenic ascites with numerous strands of
fibrin ("waving flag") resulting in septation, pancrea-
togenous ascites in acute necrotizing pancreatitis.
a Fig. 8.21 Complete septation in the lower abdomen,
classic honeycomb pattern in pancreatogenous as-
cites (necrotizing pancreatitis). Similar images will
also be seen in tuberculous ascites
► Cirrhosis of the Liver with SBP (Spontaneous Bacterial Peritonitis)
Decompensated cirrhosis of the liver is usually
characterized by anechoic ascites, although
fine echoes floating in the fluid can be demon-
strated in up to 20% of patients (Fig. 8.22). In
some marked cases there will be septation,
mural strands of fibrin, and partially septated
ascites. Ultrasound-guided fine-needle para-
centesis and the subsequent laboratory work-
up (granulocyte count and bacterial culture)
will firm up the diagnosis. Intractable echo-
genic ascites in cirrhosis of the liver does imply
SBP and warrants further study.
Fig. 8.22 a Characteristic image of micronodular cir-
rhosis of the liver with marked ascites. The diffusely
distributed fine echoes could be due to spontaneous
bacterial peritonitis (SBP).
b Echogenic ascites lateral to the right hepatic lobe
with a single strand of fibrin in SBP.
Diffuse Changes 259
► Peritoneal Carcinomatosis------------------------------------------------------------------
Peritoneal carcinomatosis is characterized by
echogenic ascites with fine echoes, irregular
margin, septation, retraction of the mesentery,
and solid structures on the peritoneum itself
(Fig. 8.23 and E 8.3). Differentiating between
benign and malignant ascites resembles put-
ting together a puzzle and will be explained
further on (see Tables 8.6 and 8.7, Б 8.6). The
sensitivity of a single ultrasound-guided fine-
needle puncture is unacceptably low (50-60%).
If there is a definite case for suspected malig-
nancy, repeat cytology is called for (at least
three times). Peritoneal carcinomatosis can be
like a chameleon; it is detailed further in И 8.3.
« Fig. 8.23 Echogenic ascites and markedly thickened
as well as irregularly delineated peritoneum in peri-
toneal carcinomatosis due to advanced cancer of the
colon.
И 8.3 Echogenic Ascites in Peritoneal Carcinomatosis
a Strandlike structures originating
from the peritoneum in ovarian malig-
nancy with peritoneal carcinomatosis.
b "Turbid" echogenic ascites and fibrin
apposition in peritoneal carcinomatosis
of metastasizing gastric cancer. Normal
hepatic texture; smooth margins
c Malignant ascites with fine internal
echoes and a markedly retracted mes-
entery: peritoneal carcinomatosis in
cancer of the colon.
d Ascites with honeycomb septation in
cystic ovarian malignancy. This aspect
without acute symptoms is character-
istic of a gynecological process.
e Marked thickening of the abdominal
wall with tumor masses adhering to the
peritoneum: peritoneal carcinomatosis
in colon cancer.
f Echogenic ascites and fine appositions
on the parietal peritoneum in peritoneal
carcinomatosis (gastric cancer).
g Markedly pushed-back mesentery
and air-filled bowel. Increased distance
between omentum/bowel and ab-
dominal wall indicating peritoneal car-
cinomatosis.
h Thickened visceral peritoneum in
peritoneal carcinomatosis (gastric can-
cer) mimicking a pathological gut sig-
nature.
► Purulent Peritonitis_______________________________________________________________________________________
8 Peritoneal Cavity 260
The ultrasound image of purulent peiitonitis is
characterized by inhomogeneous hypoechoic
structures displaying a varied echo texture
and lacking a definite interconnection
(Fig. 8.24). During repositioning of the patient,
the septation and adhesions will not permit
free shifting of the putrid ascites. The clinical
symptoms take puncture over any other mo-
dality. Ultrasound studies are of limited value
in the primary diagnosis and are much more
useful in identifying walled-off abscesses. Most
often treatment is by surgery.
* Fig. 8.24 Purulent peritonitis. Structured fluid (cali-
pers) enveloping the liver. Clinically: perforated duo-
denal ulcer.
► Tuberculosis _______________________________________________________________________________________
The sonographic morphology of tuberculous
ascites resembles that in necrotizing pancrea-
titis. As well as echoes within the fluid there is
also septation and the wall is irregular in out-
line. If the paracentetic specimen is hemorrha-
gic. this is also indicative in terms of diagnosis.
► Choleperitoneum________________________________________________________________________
Bile leakage may be due to a perforated hy-
dropic or empyemic gallbladder as rare com-
plication of cholecystolithiasis. Localized perfo-
ration is much more common than free bile
leakage into the abdominal cavity (choleperi-
toneum). Other causes may be intraoperative
lesions to the biliary tree or iatrogenic endo-
scopic injury. Another quite common compli-
cation after external PTCD (percutaneous
transhepatic bile duct drainage) for palliation
of a stenosing malignancy is dislocation of the
drain with subsequent bile leakage.
Initially the leaking bile is anechoic, but after
a few hours the characteristic streaks and septa
will appear that induce layering and which are
pathognomonic (Fig. 8.25). In those few cases
with uncertain diagnosis, ultrasound-guided
fine-needle puncture will confirm the free in-
tra-abdominal bile (gross assessment and bili-
rubin panel).
a Fig. 8.25 о Anechoic intra-abdominal formation with
streaks of internal structures in choleperitoneum due
to a perforated gallbladder (GB).
a b Thin hypoechoic film around the right hepatic lobe
due to intra-abdominal collection of bile in biliary
leakage after a dislocated PTCD.
► Hemoperitoneum______.___________________________________________________________
Within a few horns after hemorrhage, the or-
ganizing hemoperitoneum will become more
and more echogenic, comprising internal ech-
oes, strands of fibrin, and septation. The effu-
sion will become more hyperechoic and inho-
mogeneous (Figs. 8.26 and 8.27). If there is no
increase in volume, ultrasonography lends it-
self quite easily to the morphological follow-
up. The advancing organization will be accom-
panied by absorption, and sometimes some
regions will undergo re-liquefaction.
a Fig. 8.26 Anechoic inhomogeneous structures in in-
tra-abdominal and retroperitoneal hemorrhage
under anticoagulant therapy.
a Fig. 8.27 Anechoic collection of fluid in the lesser
pelvis after blunt abdominal trauma with ruptured
spleen. The blood will collect at the most dependant
part of the abdominal cavity; initially it is anechoic,
becoming echogenic later.
► Cl Tract Perforation
The cardinal symptom of G1 tract perforation is
the demonstration of free gas within the peri-
toneal cavity. However, there may also be fluid
leaking from the stomach or bowel. This fluid is
permeated by echoes and displays gas inclu-
sion (Fig. 8.28). Demonstration of the actual
site leaking gas and fluid is a rare feat. The
preferred localization of fluid collections in a
perforated upper G1 tract is around the stom-
ach and duodenum as well as around both
hepatic lobes. In perforation of the more down-
stream intestinal regions, the free gas tends to
accumulate more in the lower abdomen.
It should be kept in mind that the combina-
tion of free gas and free fluid may be indicative
for GI tract perforation.
a Fig. 8.28 Demonstration of echogenic fluid and some
free gas after upper GI tract perforation (duodenal
ulcer).
Diffuse Changes
► Chyloperitoneum________________________________________________________________________
Chyle leaking into the abdominal cavity is a
rare event, its cause possibly being traumatic
or a postoperative complication. Chyloperito-
neum has also been demonstrated in malignant
lymphoma. Ultrasound will depict homogene-
ous ascites permeated by fine echoes, resulting
in a "milky” image. After ultrasound-guided
fine-needle puncture, chyloperitoneum per-
mits diagnosis at a glance: milky white turbid
lymph!
Hyperechoic Structure__________________________________________________
— ► Pneumoperitoneum
▼ Diffuse Changes
^jMHyperechoi^Structure
► Localized Changes
► Pneumoperitoneum_________________________________________________________________
A collection of free intra-abdominal gas (pneu-
moperitoneum) is visualized as a hyperechoic
structure with characteristic reverberation
echoes and appears, for example, in free perfo-
rations of the GI tract. However, in general a
frank perforation is a rare event (frequency
only 1-2%).
Cause. The most common causes are:
► Duodenal/gastric ulcer
► Inflammatory bowel disease (appendicitis,
diverticulitis, etc.)
► Postoperative, anastomotic/suture line leak-
age
► Iatrogenic (endoscopy, excision biopsy and
polypectomy, contrast enema)
► Trauma, foreign body
► Tumor (stomach, colon)
The most common cause of a free perforation is
gastric or duodenal ulcer. In complicated diver-
ticulitis of the colon, the leading symptom
tends to be localized peritonitis of the left
lower quadrant.
Sonographic morphology. In the hands of the
expert the signs of a free collection of intra-
abdominal gas are easy to recognize (sensitiv-
ity 80-90%), while the less experienced sonog-
rapher can reproduce these findings in post-
operative patients after laparoscopic surgery
and with vestiges of pneumoperitoneum. Fol-
low-up studies of these patients provides ex-
cellent training. The most important signs of
free intra-abdominal gas will be discussed be-
low (a 8.4).4
► The characteristic localizations have already
been mentioned above. If the echoes (gas)
rise on patient repositioning, this is patho-
gnomonic.
► The reverberation echoes at the preferred
localizations already mentioned are charac-
teristic of perforation.
► The additional leakage of fluid, quite often
with internal echoes, is another sign of GI
tract injury.
► Compared with intraluminal gas collections
in the GI tract, marked breathing movement
will not result in positional changes (con-
stant respiratory position).
► Furthermore, in the left lateral position there
is a discontinuity between the gas in the
distal segments of the lungs and the free gas
anterior to the liver.
► In the more superior recesses, however, e.g.,
below the diaphragm with the patient up-
right or below the abdominal wall with the
patient supine, the echoes there will shift
when repositioning the patient.
В 8.4 The Ultrasound Signs of Free Intra-abdominal Gas
8 Peritoneal Cavity 262
► Multiple reverberation echoes
► Characteristic localizations
(see above)
► Additional fluid with internal
echoes
► No change in position with
breathing movements
► Pleuroperitoneal discontinuity
a Hyperechoic intra-abdominal collec-
tion of gas. No organs can be visualized
behind the curtain of free gas, charac-
teristic reverberation echoes.
b Hyperechoic collection of gas ante-
rior to the left and right hepatic lobe,
parts of the liver are masked. Status
post perforation of a duodenal ulcer.
c Apart from the free perihepatic gas
on the right of the liver, there is also
echogenic free fluid. Free gas + fluid is
indicative of a perforated Gl tract (here,
perforated duodenal ulcer).
► Hyperechoic echoes in the
superior recesses
d At the lower margin of the left hep-
atic lobe: hyperechoic structure (free
gas). Posterior to the left hepatic lobe:
intense echo complex with posterior
shadowing marking the site of the per-
foration (duodenal ulcer).
e Anterior to and at the lower margin of
the left hepatic lobe: free gas (hyper-
echoic). Posterior to the left hepatic
lobe: a string of small hyperechoic gas
bubbles.
f In the longitudinal plane: some free
gas anterior to and to the right of the
calculous gallbladder.
g In the transverse plane of the epi-
gastric region: a small section of the left
hepatic lobe. The rest of the organ is
masked by the free gas. Status post
perforation of the colon in cancer of the
hepatic flexure.
Localized Changes
“Pseudoascites.” Diagnosis of anechoic and
hypoechoic intra-abdominal structures has to
differentiate them from fluid structures with-
out connection to the abdominal cavity. The
latter are also called "pseudoascites." This
term is something of a misnomer since the
fluid is not actual ascites but rather structures
outside the abdominal cavity that are not in-
terconnected with it. This includes quite a
number of fluid collections discussed else-
where, the most important being (E 8.5):
► Abscess
► Hematoma
► Cysts (liver, kidney, pancreas pseudocysts,
ovaries)
► Ovarian cystoma and other cystic masses
(cystadenoma, cystadenocarcinoma)
► Mesothelioma, lymphangioma
► Preformed hollow viscera (urinary bladder,
gallbladder hydrops)
► Aortic aneurysm
► Hydronephrosis
► Ileus and gastric outlet obstruction
► Hypoechoic masses
► Fluid processes within the abdominal wall.
0 8.5 Differentiating Fluid Masses from Ascites
► Liver
* Abdominal wall
a Polycystic liver: to be differentiated
from septated ascites in the upper
quadrants.
b Large irregularly defined collection of
fluid: large abscess in the right hepatic
lobe as sequela of pyogenic cholangitis.
c Septated collection of fluid with some
sedimentation of the contents: massive
hematoma after heparin induced
thrombocytopenia, totally within the
abdominal wall and therefore extraper-
itoneal in location.
Localized Changes 263
► Pancreas
► Spleen
► Kidney
d Localized cystic mass in the left upper
quadrant, permeated by septumlike
structures; no walled-off pancreatoge-
nous ascites but cystic malignancy of
the pancreas (cystadenocarcinoma).
e Irregularly defined collection of fluid
within the spleen: invasion of a pan-
creatic pseudocyst.
f Massively dilated renal calices and
pelvis. No parenchymal margin to be
visualized; hydronephrotic nephrecta-
sia; no interconnection with the ab-
dominal cavity.
Anechoic Structure___________________________________________________________
► Septated Ascites
► Intraabdominal Abscess
► Septated Ascites__________________________________________________________________________
If there is no unrestricted intercompartmental
connection, e.g., as may be the case in the
presence of adhesions, the collection of intra-
abdominal fluid will be localized. Classic exam-
ples are the septated ascites in peritoneal car-
cinomatosis with adhesions (Fig. 8.29) and in
pancreatitis (Fig. 8.30). The example of sep-
tated ascites in the omental bursa has already
been demonstrated (E 8.2e).
a Fig. 8.29 Septated ascites in peritoneal carcinomato-
sis (ovarian malignancy). The septa may compart-
mentalize the fluid, which then will not shift freely
on repositioning of the patient.
a Fig. 830 In necrotizing pancreatitis, septation may
also result in compartmentalization, thus “trapping”
the ascites. Here, too, the fluid cannot shift freely on
repositioning of the patient.
► Intra-abdominal Abscess
8 Peritoneal Cavity 264
Inflammatory adhesions may also wall off in-
tra-abdominal collections of fluid, for instance
in abscesses. However, these structures are
rarely anechoic but more commonly tend to
be hypoechoic.
Hypoechoic Structure_________________________________________________
► Abscess
► Bilioma
► Hematoma
► Necrosis after Pancreatitis
► Abscess____________________________________________________________________________________
Intra-abdominal abscess, e.g., between the
bowel loops, subphrenic, or subhepatic, is hy-
poechoic and displays an inhomogeneous
structure. In most cases the margin is irregu-
lar (Figs. 8.31 and 8.32). Less frequently the
abscess may be anechoic or hyperechoic; this
is particularly true in gas abscess due to bacte-
rial colonization. The diagnosis is facilitated by
the presence of the appropriate clinical symp-
toms with markedly elevated blood markers,
fever, and pain.
a Fig. 8.31 Two large, irregularly defined hypoechoic
abscesses below the liver after cholecystectomy.
The narrow interconnection between the abscess
permits the fluid to communicate; successful inter-
ventional treatment with two drains.
л Fig. 8.32 Localized, irregularly defined echogenic
process around the right liver after pancreatitis: ab-
scess.
► Bilioma_______________________________________________________________________________________
Biliary leakage or perforation does not neces-
sarily result in the full-blown picture of chol-
eperitoneum. Much more common is the local-
ized collection of bile, the so-called bilioma.
The internal texture of the bilioma is echo-
genic, or it may be characterized by streaking
(Fig. 8.33). Only “fresh" bile will be anechoic.
Biliomas are found in the vicinity of the biliary
tree.
Fig. 8.33 Localized anechoic liquid structure below
the liver after dislocated left-sided PTCD, corre-
sponding with a bilioma. Color-flow Doppler imaging
will help differentiate it from a solid mass.
► Hematoma________________________________________________________________
If there is no frank hemorrhage into the ab-
dominal cavity, a hematoma may be formed
within the smaller compartments. With aging,
the intra-abdominal hematoma will become
more and more hyperechoic and will display
an internal texture. Over the course of the
hematoma, it may demonstrate not only the
more organized echogenic parts but also liquid
regions undergoing liquefaction (Fig. 8.34).
< Fig. 8.34 Status post hemorrhage under anticoagu-
lant therapy: hypoechoic inhomogeneous paracolic
structure, corresponding with a localized hematoma
becoming organized.
► Necrosis after Pancreatitis___________________________________________________________________________
Localized Changes 265
Necrosis as sequela of necrotizing pancreatitis
(see Chapter 4, “Pancreas") is frequently local-
ized in the retroperitoneum, but it may also
arise within the abdominal cavity apart from
the pancreas, resulting in the image of a cir-
cumscribed hypoechoic mass (Fig. 8.35). The
necrosis is irregularly defined and inhomoge-
neous. In addition, there are clear signs of pan-
creatitis at the organ itself. Ultrasound can
demonstrate peripancreatic as well as paracolic
necrosis and necrosis invading parenchymal
organs, such as the liver or spleen.
◄ Fig. 8.35 Large anechoic mass with hyperechoic pos-
terior sections: marked necrosis of the pancreas.
Hyperechoic Structure__________________________________________________
► Localized Perforation
► Gas Abscess
In the case of a localized hyperechoic structure,
the sonographer should primarily think of ac-
cumulated gas—for instance, localized perfora-
tion or gas abscess between the bowel loops.
► Localized Perforation____________________________________________________________________________
If the gas leak is small and the perforation in the
GI tract is well localized, there will not be any
frank perforation. The hyperechoic collection of
gas with its characteristic reverberation echoes
is truly local and will not shift on patient repo-
sitioning. Most of the localized hyperechoic col-
lections of gas will be seen in the immediate
vicinity of the GI tract and will be difficult to
differentiate from the intraluminal gas collec-
tions (Fig. 8.36). Apart from the intracavitary
hyperechoic structures of the perforation, there
may be fluid as well (mixed with hypoechoic
regions), resulting in a mixed image.
Fig. 8.36 a Localized hyperechoic structure with re-
verberation echoes and posterior shadowing around
the hepatic portal (subhepatic left) in a localized
perforated duodenal ulcer.
л b Hyperechoic structures in localized perforation
► Gas Abscess
8 Peritoneal Cavity 266
In a gas abscess the hypoechoic regions of the
liquid components may be predominant. The
gas produced by the bacteria is characterized
by individual marked echo complexes increas-
ing over the course of the abscess (Fig. 8.37). In
most cases it displays an irregular margin. Dif-
ferential diagnosis is based on the clinical pic-
ture supplemented by fine-needle puncture.
Fig. 8.37 Localized hypoechoic, rather smoothly de-
fined structure with a hyperechoic region corre-
sponding with gas; the “curtainlike" appearance
and the posterior shadowing are indicative. Large
paracolic gas abscess on the right complicating ne-
crotizing pancreatitis.
Wall Structures
Smooth Margin
— ► Right-Sided Heart Failure
► Cirrhosis
► Peritoneal Carcinomatosis
▼ Walt Structures
E. Smooth Margin
► Irregular Margin
► Differentiating Intraluminal Gl
Tract from Intraperitoneal/
Extraperitoneal Fluid
The peritoneum can only be visualized indi-
rectly (see above). Usually the peritoneum is
smoothly defined.
► Right-Sided Heart Failure__________
In right ventricular failure the intra-abdominal
collection of fluid is a transudate. The outline of
the peritoneum is always smooth and lacks any
juxtaposition, while the ascites is anechoic
(Fig. 8.15).
► Cirrhosis
Decompensated cirrhosis of the liver with as-
cites is characterized by a smoothly delineated
peritoneum. The ascites is anechoic. The liver
displays the changes in shape and texture,
among others, characteristic of cirrhosis
(Fig. 8.38).
a Fig. 8.38 a Smoothly delineated visceral and parietal
peritoneum in decompensated alcoholic cirrhosis of
the liver.
a b In Medusa’s head, the tortuous course of the blood
vessels on the inside of the abdominal wall is a sure
sign of portal hypertension in cirrhosis.
► Peritonea! Carcinomatosis__________________________________________________________________
In peritoneal carcinomatosis the peritoneum
may still be smoothly delineated and appear
absolutely normal (Fig. 8.9). However, much
more common are irregularities, septation.
and tumor masses on the peritoneum itself.
The findings are considered as cardinal signs
of malignancy.
Irregular Margin__________________________________________________________________
► Pancreatitis
► Peritonitis
► Peritoneal Carcinomatosis
Wall Structures 267
► Pancreatitis_________________________________________________________________________________________
The intra-abdominal collection of fluid in pan-
creatitis is characterized not only by its internal
echoes but, as has already been stated above,
quite often by septation and strands of fibrin.
These originate from the peritoneum and will
lead to an irregular outline. “Fluttering fibrin
strands” originating from the peritoneum may
be found in pancreatitis as well as peritonitis
(Figs. 8.39 and 8.40).
a Fig. 8.39 “Flags" of fibrin coating the peritoneum and
dominating the picture in necrotizing pancreatitis
(exudate).
a Fig. 8.40 The septation may become almost com-
plete and can mask all of the peritoneum. Honey-
comb texture due to strands of fibrin in necrotizing
pancreatitis.
► Peritonitis_________________________________________________________________________________________________
Bacterial peritonitis is not necessarily accom-
panied by ascites. In the classic case, the peri-
toneum is lined by inflammatory accretions
and will display an irregular outline on ultra-
sonography. In addition, there may be strand-
like extensions and irregular thickening.
► Peritoneal Carcinomatosis__________________________________________________________________
In peritoneal carcinomatosis the peritoneum
may be thickened and display an irregular out-
line. These irregularities in the contour, includ-
ing tumor masses on the peritoneum, are indi-
cative of advanced peritoneal carcinomatosis.
The more ascites the better the irregularities
will be visualized. Usually, these changes are
easier to demonstrate on the visceral peri-
toneum (Figs. 8.41, 8.42, Fig. 8.23, and 8.3).
The peritoneum is a frequent site for metasta-
ses. Eighty percent of all malignancies can re-
sult in peritoneal carcinomatosis; the most
common origin is gastrointestinal and gyneco-
logical tumors (Table 8.5). However, diagnostic
ultrasound in peritoneal carcinomatosis is not
a Fig. 8.41 Inhomogeneous solid tumor masses lining
the parietal (anterior) peritoneum, which on the
whole is displaying an irregular outline.
* Fig. 8.42 Juxtapositions and strands of fibrin on the
visceral peritoneum (liver and bowel) destroying an
otherwise smooth contour: peritoneal carcinomatosis
in advanced gastric cancer.
8 Peritoneal Cavity 268
without pitfalls. Its sensitivity is only 50-60%,
one of the prime reasons being the fact that
only about 50% of all cases with peritoneal
carcinomatosis will present with ascites! The
optimum diagnostic modality is laparoscopy.
But some criteria for ultrasound morphology
can be quite useful for differentiating benign
from malignant ascites (Table 8.6 and 8.7,
Fig. 8.43, E 8.6).
The importance of ultrasound-guided fine-
needle puncture in the precise assessment of
the fluid has already been discussed. In malig-
nant ascites this is an exudate that quite often
has high cholesterol levels. Malignant cells will
be found in 50-70% of cases. Repeat paracent-
esis and cytological evaluation will increase the
sensitivity to 70-80%.3
a Fig. 8.43 Schematic representation of the character-
istic signs in benign (left) and malignant (right) as-
cites (based on reference 6).
Table 8.5 Primary malignancies in perito-
neal carcinomatosis
GI tract (stomach, pancreas, colon) 34%
Ovaries 27%
Breast 14%
Lymphoma 4%
Sarcoma, kidney, uterus, unknown 18%
primary
Table 8.6 Signs of peritoneal carcinoma-
tosis (based on reference 8)
Thickened omentum 97%
Peritoneal mass 19%
Interrupted peritoneum 16%
Mesenteric adhesions 16%
Hepatic metastases 24%
Ascites 49%
Table 8.7 Ultrasound in the differential diagnosis of benign and malignant ascites
Ultrasound morphology Benign Malignant
Echogenicity of the ascites ► Anechoic ► Internal echoes (echogenic) ► Septation + ++
Fluid shift on repositioning Unrestricted Limited
Septation Unrestricted Walled off, encapsulated
Peritoneal margin Smooth Irregular, mass
Greater omentum Thin Thickened, rigid
Mesentery Unrestricted Retracted
Small-bowel loops “Sea anemone,” “creepers” Conglomerate
Abdominal wall Thin, mobile Thickened, rigid
Bowel—abdominal wall Unrestricted Adherence
Other signs of disease Cirrhosis Metastases; malignancy of the bowel, Pancreatitis pancreas, uterus, ovaries Right ventricular failure
Lymph node and hepatic metastases None ++
И 8.6 Differential Diagnosis of Benign and Malignant Ascites
► Benign ascites
a Smooth peritoneum and freely float-
ing loops of bowel (“sea anemone"
phenomenon) in benign ascites: de-
compensated cirrhosis.
b ‘Angle of ascites’ and mesenteric
collaterals (shunts) in portal hyperten-
sion point to benign ascites: portal hy-
pertension.
c The ‘heart’ in the lower abdomen,
resulting from the tortuous collaterals
in portal hypertension with shunts,
points to benign ascites.
Е 8.6 Differential Diagnosis of Benign and Malignant Ascites
► Malignant ascites
d Internal echoes and a clearly re-
tracted mesentery signifying malignant
ascites, compared with the “sea ane-
mone phenomenon" in benign ascites.
e The presence of hepatic metastasis
usually proves the malignant origin of
the ascites: small hepatic metastasis in
pancreatic cancer.
f Marked septation and strandlike
structures originating from the perito-
neum (here, ovarian malignancy) tend
to be indicative of malignant rather
than benign ascites.
► Peritoneal tumor masses
g Peritoneal tumor masses are a certain
sign in the differential diagnosis: peri-
toneal carcinomatosis in advanced
cancer of the colon.
h Peritoneal carcinomatosis without
ascites (about 50%). Peritoneal tumor
masses are the cardinal sign in sonog-
raphy.
i Increased separation of colon and
abdominal wall because of the perito-
neum and greater omentum. This is a
cardinal sign even if ascites is not
present.
Intra-and Extraluminal Cl Tract Fluid 269
Differentiating Intra- and Extraluminal Gl Tract Fluid
In the differential diagnosis of intra-abdominal
and extra-abdominal fluid the pathological col-
lection of fluid within the Cl tract plays a spe-
cial role and therefore will be discussed sepa-
rately. This topic includes especially the im-
paired intragastric and intraintestinal trans-
port, where there is no definite peristalsis
facilitating the assessment “within the GI tract
lumen" but where the fluid simply sits (Table
8.8).
Assessment is possible when considering
the following signs:
► Demonstration of the GI tract wall
► Peristalsis
► Characteristic localization and shape
► Characteristic intraluminal structures, e.g.,
haustration and Kerckring’s folds
Table 8.8 Possible causes of impaired GI
tract transport
Stomach Bowel
► Ulcer
► Tumor
► Peritoneal carcinomatosis
► Inflammatory stenosis
(Crohn disease)
► Tumor
► Intussusception
► Mechanical ileus
(adhesions)
► Volvulus
Intragastric Processes____________________________________________________________
о
CD
► Diffuse Changes
► Localized Changes
► Wall Structures
▼ Differentiating Intraluminal Gl
— ► Outlet Obstruction
О»
peritoneal Fluid
► Intragastric Processes
!► Intraintestinal Processes
► Gastric Outlet Obstruction___________________________________________________________________
8 Peritoneal Cavity 270
The stomach is easily delineated because of its
location (subhepatic, anterior to the pancreas).
A massively fluid-filled stomach concomitant
with a lack of fluid in the duodenum suggests
gastric outlet obstruction. With the upper ab-
domen upright, the fluid that will not drain
becomes clearly visible, while the impeding
gas will rise cephalad (gastric bubble, fornix).
This disorder is characterized by small rising
gas bubbles producing the image of a “starry
sky" with the paradoxical fact that there are not
falling but rising stars (Fig. 8.44). The most
common origins of gastric outlet obstruction
are ulcers and tumors. In this case ultrasound
will be able to demonstrate the signs of a
pathological gut signature (see Chapter 7,
“Gatrointestinal Tract,” pp. 229, Focal Wall
Changes).
a Fig. 8.44 Small gas bubbles rising in the massively
fluid-filled stomach (fermentation), producing the
image of the “star studded stomach”: gastric outlet
obstruction.
Intraintestinal Processes___________________________________________________________
cu
► Diffuse Changes
► Localized Changes
► Wall Structures
▼ Differentiating Intraluminal Gl
Tract from Intraperitoneal/
Extraperitoneal Fluid
Intragastric Processes
► Intraintestinal Processes
► Duodenal Stenosis
► Small Bowel Obstruction
► Large Bowel Obstruction
► Duodenal Stenosis__________________________________________________________________
If impaired gastric emptying is accompanied by
a rather distended and fluid-filled duodenum,
while the other parts of the small and large
intestine are without pathological findings,
the stenosis or obstruction will be in the
more distal duodenum (Fig. 8.45). This condi-
tion will always be accompanied by collections
of fluid in the duodenum as well as the stom-
ach, and the most common causes are tumors
and inflammation at the head of the pancreas.
a Fig. 8.45 a Duodenal stenosis: massive collection of
fluid and distension of the duodenum (posterior to a
hydropic gallbladder) in distal duodenal obstruction
due to cancer of the pancreas.
a b Distal duodenal obstruction is characterized by a
fluid-filled stomach and distended duodenum, while
the other sections of the small bowel do not exhibit
any luminal filling.
► Small Bowel Obstruction______________________________________________________________________
Classic small bowel obstruction is character-
ized by distended bowel loops with their typ-
ical Kerckring's folds, the so-called “piano key
phenomenon" (Figs. 8.46-8.48). Depending on
the stage and origin of the ileus, massive re-
sistance-induced peristalsis, pendulating peri-
stalsis, or no peristalsis at all can be demon-
strated. The most common causes are inflam-
matory changes of the intestinal wall (see
Chapter 7, pp. 245) and peritoneal carcinoma-
tosis.
* Fig. 8.46 Differential diagnosis is not always as easy
as in this case with its peritoneal carcinomatosis and
ileus.
Fig. 8.47 Small-bowel obstruction. Distended intes-
tine and the loops of the small bowel are identified
by their Kerckring’s folds projecting into the lumen,
the so-called “piano key” or “Jacob’s ladder" phe-
nomenon.
Fig. 8.48 Small-bowel obstruction. Tentative “piano
key phenomenon” in ileus due to peritoneal carcino-
matosis in cancer of the pancreas. Also note the free
ascites outside the bowel.
► Large Bowel Obstruction_______________________________________________________________________
In the presence of a distended and rather fluid-
filled intestinal lumen, large bowel obstruction
is characterized by the haustra coli and the typ-
ical course of the intestine (fixed colic position)
(Fig. 8.49). The segments of bowel upstream
will also be affected. The most common causes
are tumors and inflammatory stenosis.
Intra-and Extraluminal Cl Tract Fluid
a Fig.8.49 a Large-bowel obstruction: well distended
lumen and marked intraluminal fluid filling.
a b Severe large-bowel obstruction with demonstra-
tion of the ileocecal valve in a stenotic sigmoid mass.
References 4-
1. Beyer D, Modder U. Diagnostic des akuten Ab-
domens mit bildgebenden Verfahren. Berlin:
Springer 1985.
2. Bilger R. Klinische abdominelle Ultraschalldiag- 5.
nostik. Stuttgart: Fischer 1989.
3. Gerbes A. Ascitic fluid analysis for the differen-
tiation of malignancy-related and nonmalignant 6-
ascites. Cancer 1991:68:1808.
Kainberger P, Zukriegel M, Sattlegger P, Forstner
R, Schmoller H.J. Ultrasound detection of pneu-
moperitoneum based on typical ultrasound
morphology. Ultraschall Med 1994; 3: 122-5.
Kremer H, Dobrinski W. Sonographische Diag-
nostic. 4th ed. Munich: Urban & Schwarzenberg
1994.
Meckler U. Ultraschall des Abdomens. 3rd ed.
Cologne: Deutscher Arzteverlag 1998.
7. Rettenmaier G, Seitz KH. Sonographische Differ
entialdiagnose. Stuttgart: Thieme 2000.
8. Rioux M. Sonographic detection of peritoneal
carcinomatosis. Abdom Imaging 1995;20:47-51
9. Scholmerich J. Diagnostik und Therapie des As-
zites. Internist 1987;28:448-58.
10. Thomas L. Diagnostik des Aszites In: Labor und
Diagnose. 5th ed. Frankfurt/M.: TH-Books Ver-
lagsgesellschafl 1998.
Kidneys 275
▼ Anomalies, Malformations
J^^pTasia?^ypoplasia
E, Renal Agenesis
► Hypoplasia
► Cystic Malformation
I----► Polycystic Kidney Disease
► Anomalies of Number, Posi-
tion, or Rotation
— ► Duplex Kidney
— ► Ectopic Kidney
— ► Malrotation
► Fusion Anomaly
1—► Horseshoe Kidney
► Collecting System Anomaly
► Caliceal Diverticula
I—► Megacalicosis
276
276
277
278
280
281
281
► Vascular Anomaly
— ► Aberrant Vessels
— ► Renovascular Malformations
▼ Diffuse Changes
UP Large Kidneys
---► Constitutional/Acromegaly
— ► Duplex Kidney, Single Kidney
— - ► Diabetic Nephropathy
— ► Polycystic Kidney Disease
— ► Acute Renal Failure, Shock Kidney
— ► Septic-Toxic Kidneys
— ► Acute Urinary Retention, Acute
Outflow Obstruction
— ► Renal Congestion due to Heart
Failure
— ► Renal Vein Thrombosis
— ► Acute Glomerulonephritis
— ► Acute Pyelonephritis
— ► AIDS- and Heroin-induced
Nephropathy
---► Amyloidosis/Paraprotein Kidney
— ► Pyonephrosis
— ► Renal Tumor
— ► Renal Allograft, Allograft Rejection
* Small Kidneys
— ► Hypoplasia
— ► Renal Artery Stenosis, Embolism
— ► Arteriosclerosis, Arteriolosclerosis
— ► Chronic Pyelonephritis
— ► Analgesic Nephropathy
— ► Chronic Glomerulonephritis
— ► Diabetic Nephropathy
► Hypoechoic Structure
---► Acute Renal Failure
---► Acute Nephritis
---► Right Heart Failure
— — ► Renal Vein Thrombosis
► Hyperechoic Structure
— ► Hypoxemic Renal Shock
— ► Diabetic Nephropathy
---► Acute and Chronic Glomerulo-
nephritis
— ► Chronic Pyelonephritis
— ► Analgesic Nephropathy
— ► Septic-Toxic Kidneys
290
▼ Diffuse Changes (Continue)
► Hyperechoic Structure
► Severe Metabolic Disorders
— ► Light-Chain Deposition Disease,
Waldenstrom Disease
► Amyloidosis
► Infiltration by Lymphoma
► Atrophic Kidneys
► Irregular Structure
—► Analgesic Nephropathy
—► Diffuse Tumor Infiltration
► Suppurative Pyelonephritis,
Pyonephrosis
▼ Circumscribed Changes
4 ^^Anecho^^truct^T
► Renal Cysts, Polycystic Kidney
► Perirenal Cystic Masses
► Lymph Cysts
— ► Cystic Renal Cell Carcinoma,
Intracystic Carcinoma
- ► Papillary Necrosis, Cystic Degener-
ation of the Medullary Pyramids
— ► Cavities
► Abscess
— ► Organized Hematoma
► Urinoma, Seroma
- ► Vascular Dilatations
► Hydrocalices, Pyelectasis,
Hydronephrosis
Hypoechoic or Isoechoic
л-j Structure
301
— ► Dromedary Hump, Fetal Lobulation
— ► Abscess
— ► Hemorrhagic Cyst
— ► Fresh Renal Infarct
— ► Hematoma
— ► Renal Cell Carcinoma
— ► Urothelial Carcinoma
— — ► Malignant Lymphoma
— ► Metastasis
► Adenoma, Inflammatory Tumor
► Complex Structure
► Abscess, Pyonephrosis
► Xanthomatous Pyelonephritis
► Hematoma, Intracystic Hemor-
rhage
► Renal Cell Carcinoma, Cystic Renal
Carcinoma, Malignant Lymphoma
► Hyperechoic Structure
— ► Renal Abscess, Carbuncles
— ► Hemorrhagic Cyst
— ► Renal Cell Carcinoma
— ► Angiomyolipoma
— ► Scars
► Echogenic Structure
— ► Papillary Calcification
► Interlobar and Arcuate Arteries
► Bacterial Gas Bubbles
— ► Parenchymal Calcification
► Nephrocalcinosis, Medullary
Sponge Kidney
— ► Renal Tuberculosis, Putty Kidney
► Pyelocaliceal Stone, Staghorn
Calculus
9 Kidneys
C. Schmidt
Anatomy
Anatomical structures
► Renal hilum
► Renal cortex and medulla
► Medullary pyramids and papillae
► Renal vessels
Size
► Length 10-11.5 cm
► Width 5-7 cm
► Thickness 3-4 cm
The convex anterior surface of the kidney and
its smooth posterior surface unite at the
rounded lateral border. On the medial border
they form a central fissure, the renal hilum,
where the renal vein, renal artery, and ureter
enter and leave the organ. The anatomical sub-
division into the renal cortex and medulla is
clearly appreciated at ultrasound.
Cortex. The renal cortex is a 6 to 10 mm-wide
strip located just beneath the fibrous renal
capsule. Its boundary is formed by an imagi-
nary line along the bases of the medullary pyr-
amids. Extensions of the renal cortex, called the
renal columns, extend between the seven to
nine pyramids that make up the renal medulla.
The renal cortex contains the renal (malpigh-
ian) corpuscles, composed of a glomerulus and
Bowman capsule, and the renal tubules.
Medulla. The renal medulla consists of the re-
nal pyramids with their collecting ducts and
more central papillary ducts, which unite at
the papilla. The papillae project into the renal
calices. Due to the high fluid content of the
collecting ducts, the medullary pyramids ap-
pear markedly less echogenic at ultrasound
than the renal cortex (Fig. 9.1).
Vessels. The vessels of the kidney, the renal
artery and vein, divide into an anterior and a
posterior branch at the renal hilum while still
outside the kidney. Further branching into four
a Fig.9.1 Renal cortex and medulla.
a Diagram showing the medullary pyramids, vessels,
and a malpighian corpuscle.
a b Close-up view of the right kidney, showing the
relatively hypoechoic medullary pyramids (MP) and
the cortex (R), bounded by an imaginary line con-
necting the bases of the pyramids. Between the me-
dullary pyramids are the renal columns (CO).
9 Kidneys 275
a Fig. 9.2 Radial branching of the segmental arteries
into the interlobar vessels. Left kidney (enlarged fol-
lowing a right nephrectomy). AR = renal artery; VR =
renal vein.
a Fig. 9.3 Detail view of a medullary pyramid (MP) with
the surrounding interlobar vessels, which turn hori-
zontally at the bases of the pyramids to form the
arcuate vessels.
segmental arteries and veins occurs in the fatty
renal sinus. From there the vessels run along
the columns between the medullary pyramids
to the renal cortex as the interlobar arteries
and veins (Figs. 9.2, 9.3). There they divide
into the arcuate arteries, which run horizon-
tally parallel to the bases of the pyramids, and
the interlobular arteries, which pass radially
into the renal cortex. The individual vessels
are displayed particularly well by color Doppler
ultrasound. The veins run parallel to the named
arteries. The entire vascular system is also
clearly demonstrated by 3D imaging.
Topography
Relations
► The kidneys are retroperitoneal, lying
anterior to the lumbar muscles.
► Colic flexures overlie the lower renal
poles; liver and stomach overlie the upper
poles.
► The spleen and pancreatic tail are in
contact with the upper pole of the left
kidney.
Both kidneys are located in the retroperitoneal
space, one on either side of the spinal column,
and are anterior to the lumbar muscles (psoas
major, quadratus lumborum, and transversus
abdominis). They project past the 12th rib
into the last intercostal space, so that part of
the kidneys extends into the chest between the
diaphragm and chest wall. The central portion
of each kidney is anterior to the diaphragm at
the level of the lateral part of the 12 th rib, and
the lower portion extends down past the 12 th
rib (Fig. 9.4a).
At the medial, concave border of the kidney
is the hilum with the renal vessels. The vein is
anterior, the artery is behind it, and the upper
ureter is posterior. In the right kidney, this
region borders on the descending part of the
duodenum. The anterior surface of the kidney
9 Kidneys 276
a Fig. 9.4 Relations of the kidney to neighboring struc-
tures.
a Ribsand spinal column (from a dorsal point of view).
a b Organs in the upper and lower abdomen.
л Fig. 9.5 Topography of the right kidney (N). The or-
gan is retroperitoneal, lying anterior to the muscula-
ture (M). Its anterior surface is related to the liver (L),
which bears the renal impression. The lower pole of
the kidney extends anteriorly downward and is parti-
ally obscured by high-level echoes from the right
colic flexure, which casts an acoustic shadow (S).
forms the renal impression in the right lobe of
the liver. The right and left colic flexures overlie
the lower renal poles (Figs.9.4b, 9.5), The
upper portion of the left kidney borders on
the spleen, while the tail of the pancreas and
the posterosuperior gastric surface overlie it.
Cystic areas arising from the spleen, kidney,
or tail of the pancreas may be found in the
renal-splenic angle; they are difficult to local-
ize to a specific organ in ultrasonography (see
В 9.2h).
Anomalies, Malformations
Anomalies and malformations are based on a
congenital disturbance of fetal renal develop-
ment. Their severity depends on the timing of
their occurrence, i.e., the period ranging from
the metanephrogenic blastema and the ure-
teric bud (agenesis) to the fully formed kidney
(postrenal urinary tract anomaly).
Not every presumed malformation is ac-
tually classified as such. A number of “malfor-
mations" are actually normal variants, such as a
dromedary hump in the lateral border of the
left kidney (see Fig. 9.66b).
Aplasia, Hypoplasia____________________________________________________
▼ Anomalies, Malformations
► Aplasia, Hypoplasia
► Cystic Malformation
► Anomalies of Number,
Position, or Rotation
► Fusion Anomaly
► Collecting System Anomaly
► Vascular Anomaly
► Renal Agenesis
► Hypoplasia
► Diffuse Changes
► Circumscribed Changes
► Renal Agenesis_____________________________________________________________________________
Inability to visualize the kidney with ultra-
sound is not unusual. Most of these cases in-
volve an ectopic kidney, whereas actual renal
agenesis is very rare. In both cases the kidneys
are not found in the renal fossa. An ectopic
kidney and renal agenesis are easily differenti-
ated with ultrasound, because the contralateral
kidney is enlarged in agenesis but is of normal
size in ectopia (except in patients with ectopic
hypoplastic kidneys, which also leads to com-
pensatory enlargement of the opposite kidney
if there is much functional impairment). The
measurement of renal size, then, is as impor-
tant as the search for an ectopic kidney
(Fig. 9.6). The latter is most easily found by
looking caudal to the “normal location" along
the line of ascent (pelvic, lumbar, abdominal
dysplasia). Renal agenesis in one-third of pa-
tients is associated with cystic seminal vesicles
or unilateral seminal-vesicle agenesis.
Fig. 9.6 Aplasia of the right kidney with compensa-
tory enlargement of the left kidney (N).
a The right renal fossa is empty. L = liver, S = Sha-
dowing from gas in the colon.
-« b Left kidney with two parapelvic cysts. P = pyelon.
► Hypoplasia________________________________________________________________________________
Hypoplastic renal dysplasia appears sonog-
raphically as abnormal development of the re-
nal tissue with associated disturbances of nor-
mal renal architecture. The kidney is small or
very small, and some hypoplastic kidneys are
too small to be defined with ultrasound. Differ-
entiation from an atrophic kidney is not always
possible, but most hypoplastic kidneys exhibit
normal parenchyma and normal central hilar
echoes. Calcifications or multicystic changes
may be found (Fig. 9.7, Fig. 9.14b).
< Fig. 9.7 Renal hypoplasia. The apparent “missing left
kidney" is probably a tiny hypoplastic kidney (cur-
sors).
Anomalies, Malformations 277
Cystic Malformation__________________________________________________
CD
r Anomalies, Malformations
Д» Aplasia, Hypoplasia
Cystic Malformation
!► Anomalies of Number,
Position, or Rotation
Fusion Anomaly
> Collecting System Anomaly
Vascular Anomaly
► Polycystic Kidney Disease
► Diffuse Changes
► Circumscribed Changes
► Polycystic Kidney Disease_____________
Polycystic kidney diseases fall in the category
of ontogenic renal lesions. They are frequently
associated with cystic changes in other organs
and are caused by increased intratubular pres-
sure due to distal tubular obstructions and by
tubular epithelial dysplasia. The cystic lesions
thus represent tubular retention cysts. Cysts
located in the area of the renal sinus are gen-
erally lymphatic cysts. Secondary cysts may be
found in the setting of chronic renal diseases
(see below). The various types of renal cyst are
reviewed in Table 9.1.
Sonographic features. Renal cysts appear so-
nographically as round, anechoic, smooth-bor-
dered masses that are lined with epithelium,
forming a cyst wall. For physical reasons, they
cause posterior acoustic enhancement. Simple
solitary or multiple cysts and adult-type poly-
cystic kidneys (Potter type III) are of particular
interest for routine scanning in internal medi-
cine.
Polycystic kidneys contain multiple an-
echoic masses of varying size, usually causing
considerable organ enlargement. The cysts pro-
duce an undulating renal outline with no dis-
cernible capsule, causing poor delineation of
the kidney. Large bullous cysts obscure the
residual intact parenchyma through a “bloom-
ing effect,” so that the kidney appears to consist
almost entirely of cystic areas. Microcystic kid-
neys still display numerous areas of renal pa-
renchyma. This pattern requires differentiation
from multiple renal cysts. In this case the pa-
renchyma is still clearly visible and generally
the kidneys are not enlarged (Figs.9.8 and 9.9;
see also Circumscribed Changes).
Table 9.1 Types of renal cysts (after reference 11)
Type of cystic
kidney (Potter)
Age at symptom onset, location Morphology
Complications, associated
disorders
9 Kidneys 278
Infantile polycystic nephropathy
(type I)
Dysplastic cystic
kidney (type II)
Adult polycystic nephropathy
(type III)
Familial
nephronophthisis
Medullary sponge kidney
Simple renal cysts
Newborn, infants
Bilateral
Infants, small children
Unilateral or bilateral
20-40 years of age
Bilateral
Adolescents, adults
Bilateral
Adults
80% bilateral
Any age
Unilateral or bilateral
Kidneys greatly enlarged, with
collecting ducts 1-2 mm in size
Polycystic kidneys, cortical cysts
Kidneys greatly enlarged, with
cysts in all nephrons
Small kidneys, sclerosing intersti-
tial nephropathy with distal tubu-
lar cysts
Collecting duct cysts in the papil-
lae with calculi
Solitary or multiple cysts up to
5 cm in size
Renal failure, hepatic fibrosis
Obstructive ureteral or bladder
anomalies, recurrent urinary
tract infections
Frequent hepatic cysts, pyelo-
nephritis, hypertension, uremia
Mental deficiency, hepatic fibro-
sis, ataxia, uremia
Recurrent urinary tract infec-
tions, urolithiasis
Rarely, pyelonephritis
a Fig. 9.8 Polycystic renal degeneration (Potter type III
adult polycystic disease). Cystic renal degeneration
(N). The parenchyma is difficult to identify due to
the many anechoic spaces.
a Macrocystic-bullous form.
a b Predominantly microcystic form.
a Fig. 9.9 Multiple renal cysts (Z). The kidney is still of
normal size, and the parenchyma is clearly visible;
dialysis.
Anomalies of Number, Position, or Rotation
!▼ Anomalies, Malformations
► Aplasia. Hypoplasia
► Cystic Malformation
► Anomalies of Number,
Position, or Rotation
► Fusion Anomaly
► Collecting System Anomaly
= ► Vascular Anomaly
— ► Duplex Kidney
► Ectopic Kidney
► Malrotation
► Duplex Kidney__________________________________________________________________________
Duplex kidney is the most common renal
anomaly, occurring in 1 % of the general popu-
lation. It is characterized by duplicated renal
pelves and two ureters that unite somewhere
between the kidney and bladder. The duplex
kidney is also enlarged. When the ureters have
different insertions, the ureter with the more
distal insertion belongs to the upper moiety
according to the Meyer-Weigert rule. The ure-
ter belonging to the lower moiety consistently
empties proximal to that site. In a duplex kid-
ney with hydronephrosis, then, the upper ure-
ter (e.g., megaureter, see Chapter 11) and asso-
ciated pelvis will be obstructed owing to the
ectopic insertion (caution: upper-pole cyst).
But if the lower ureter is affected, the obstruc-
tion is not due to an ectopic insertion but to
some other obstructive process.
л Fig. 9.10 Duplex kidney: 12 cm-long kidney with two
pelves separated by a band of parenchyma.
a Fig. 9.11 Duplicated renal hilum. VC = vena cava; AO
= aorta: N = kidney: VR = renal vein.
a Upper renal vein.
a b Lower renal vein, demonstrated by a lower trans-
verse scan.
a Fig.9.12 Duplex kidney. The two moieties are sepa-
rated by a parenchymal band (B), where a notch is
visible in the renal outline (arrows; the lower arrow
marks the hilum of the lower renal segment).
a Fig. 9.13 Color duplex image showing two renal
pelves. N = kidney; VC = vena cava.
a Upper renal artery (A).
a b Lower renal artery (AR).
Anomalies, Malformations 279
It is common to find an ectopic insertion of
the lower moiety with an associated uretero-
cele, leading to vesicorenal reflux or ureteral
obstruction that again affects the upper moiety
(with a ureterocele, it cannot be determined
with ultrasound whether the ureter runs
within or outside the detrusor muscle).
The ultrasound features of a duplex kidney
are as follows (Figs. 9.10-9.13):
► Longitudinal enlargement with a normal or-
gan thickness
► A band of parenchyma separating the upper
and lower collecting systems
► Usually, a notch at the level of the parenchy-
mal band
► Duplication of the renal hilum
► Ectopic Kidney
Most ectopic kidneys are located low in the
pelvis; high ectopic kidneys are very rare3.
A lumbar kidney is the most common form of
renal ectopia, with ultrasound revealing the ec-
topic kidney in the anterior iliac fossa. The key
sonographic landmark is the iliac artery—the
ectopic kidney will generally be found anterior
to that vessel. The less common pelvic kidney
lies anterior to the sacrum and below the aortic
bifurcation. Abdominal ectopia is the easiest
form to detect, as the affected kidney is mark-
edly lower than its counterpart; but in contrast
to the lumbar and pelvic forms, usually the kid-
ney is not small or malrotated (Fig. 9.14).
a Fig.9.14 Ectopic right kidney in the lesser pelvis (re-
nal pelvic dysplasia).
a The right kidney is not found at its usual site pos-
terior to the liver (L) (no renal impression!).
a b The dysplastic right kidney is located in the lesser
pelvis between the bladder (HB) and rectum (R).
► Malrotation_________________________________________________________________________________
9 Kidneys 280
Malrotation is an anomaly in which the renal
hilum faces anteriorly (caution: this makes the
vessels vulnerable to a percutaneous needle!).
Otherwise difficult to detect, a malrotated kid-
ney can be positively identified by the location
of its hilum (Fig. 9.15).
Fig. 9.15 Malrotated kidney in a slightly ectopic lo-
cation (cursors). The renal hilum faces anteriorly.
Fusion Anomaly_______________________________________________
▼ Anomalies, Malformations
Aplasia, Hypoplasia
!► Cystic Malformation
Anomalies of Number,
Position, or Rotation
Fusion Anomaly
Д* Collecting System Anomaly
^►Vascular Anomaly
► Diffuse Changes
► Circumscribed Changes
► Horseshoe Kidney
► Horseshoe Kidney_______________________________________________________________________
In the most common fusion anomaly, the sym-
metrical horseshoe kidney, the lower poles of
the kidneys are fused together across the mid-
line. Horseshoe kidney has an incidence of
1:425 in the general population. The descrip-
tive term is best understood in the excretory
urogram, where an AP view displays the typical
horseshoe pattern (Fig. 9.16).
It is not unusual for horseshoe kidney to be
missed at ultrasound, as the scan planes may
not completely define the inferior outline of
the lower pole. A lower pole that “keeps going"
should always raise suspicion of the anomaly.
Ultrasound may suggest a misdiagnosis of pre-
aortic lymphoma unless horseshoe kidney is
considered in the differential diagnosis. The
apparent "tumor mass" in these cases is the
isthmus joining the two lower poles, which
may consist of renal parenchyma or a fibrous
band (Fig. 9.17). Color Doppler usually estab-
lishes the diagnosis by demonstrating the typ-
ical vascular configuration.
Incomplete horseshoe kidney is diagnosed
when ultrasound shows the typical medial ex-
tension of the lower pole, often crossing the
aorta, but the contralateral kidney is absent.
Morphologically, this results in an elongated
L-shaped or sigmoid kidney. Fusion of the
upper and lower poles results in a ring-shaped
kidney. A cake kidney results when the fusion
occurs over broader areas, producing an irreg-
ularly shaped organ.
a Fig. 9.16 Radiograph of a horseshoe kidney. The
horseshoe shape of the kidney is appreciated in this
AP view following intravenous contrast administra-
tion.
a Fig. 9.17 Horseshoe kidney.
a Right kidney with an unbounded lower pole.
a b and c The renal parenchyma (N) continues to the left across the aorta (AO) and spinal column (WS).
Collecting System Anomaly
— ► Caliceal Diverticula
► Megacalicosis
► Caliceal Diverticula__________________________________________________________________________________
Anomalies, Malformations 281
Caliceal diverticula are epithelialized protru-
sions of caliceal tissue that often contain crys-
talline precipitate and stones as a result of flow
stasis (Fig. 11.10, p. 335). They require differ-
entiation from caliectasis due to obstructing
caliceal stones, which are more common in
older patients.
► Megacalicosis_________________________________________________________________________________________________
This is a congenital dilatation of the calices,
which is usually asymptomatic.
Vascular Anomaly___________________________________________________________
▼ Anomalies, Malformations
, Aplasia, Hypoplasia
। ► Cystic Malformation
. Anomalies of Number,
* ' Position, or Rotation
!► Fusion Anomaly
— ► Aberrant Vessels
► Renovascular Malformations
► Aberrant Vessels_________________________________________________________________________
A crossing interlobar artery will occasionally
narrow the neck of the calix, causing preste-
notic dilatation of the upper calix. Ultrasound
then shows an abnormal expansion of the af-
fected calix with no visible outflow obstruction
(stone).
A more common aberrant configuration is a
lower pole artery arising separately from the
aorta and narrowing the upper ureter, causing
pyelectasis. Ultrasound shows an anechoic
mass in the pyelocaliceal system obstructing
the proximal ureter but does not demonstrate
a causative lesion (tumor, stone). This anomaly
should always be suspected in cases of this
kind (Fig. 11.11, p. 335). The differential diag-
nosis should also include pyelectasis due to an
ampullary renal pelvis and a hypermobile kid-
ney with proximal kinking of the ureter.
► Renovascular Malformations_______________________________________
9 Kidneys 282
These include intrarenal or extrarenal aneur-
ysms, arteriovenous fistulas, and extrarenal
vessels that take an atypical course. The latter
are occasionally found at routine ultrasonogra-
phy. Color duplex scanning should be per-
formed whenever unexplained ectatic vessels,
indeterminate cystic lesions, or atypical vascu-
lar courses are discovered (Fig.9.18).
a Fig.9.18 Intrarenal vascular ectasia. Arteriovenous
malformation appears as an echo-free mass within
the kidney. L = liver; N = kidney.
a В-mode image demonstrates cystic masses in the
renal sinus echo (arrows).
a b Color duplex scan identifies the cystic masses as
ectatic intrarenal arterial vessels, probably arteriove-
nous malformations of the renal artery. (Doppler
spectral analysis with resistance index [after Pource-
lot: Vmdx - Vmin = Vmdx] determination yields addi-
tional information on the nature of the vascular ec-
tasia.)
Diffuse Changes
Large Kidneys_________________________________________
4/, Anomalies, Malformations
й? J^^Hfus^Change^"
"O l-ar9e Kidneys
MHypoechoic Structure
Hyperechoic Structure
Irregular Structure
Circumscribed Changes
— ► Constitutional/Acromegaly
► Duplex Kidney, Single Kidney
► Diabetic Nephropathy
► Polycystic Kidney Disease
► Acute Renal Failure, Shock Kidney
► Septic-Toxic Kidneys
► Acute Urinary Retention, Acute Outflow Obstruction
► Renal Congestion due to Heart Failure '
► Renal Vein Thrombosis
► Acute Glomerulonephritis
► Acute Pyelonephritis
► AIDS- and Heroin-induced Nephropathy
► Amyloidosis/Paraprotein Kidney
► Pyonephrosis
► Renal Tumor
► Renal Allograft, Allograft Rejection
Sonographic Determination of Renal Size
The sonographic estimation of renal size is
unreliable. Whether a kidney appears large
or small at ultrasonography depends very
much on the selected field of view, i.e., an
undersize kidney may appear large because it
is displayed in a large scale, and vice-versa
(Fig. 9.19). For some investigations, then, it
is necessary to measure at least the longitu-
dinal renal diameter and parenchymal thick-
ness.
Anatomically, the adult kidney measures 1 cm
over the sonographic diameter, 10-11.5 cm
in length, 5-7 cm in width, and 3-4 cm in
thickness, while for physical reasons, radio-
graphic measurements of the kidney add ap-
proximately 1.5 cm to its length and 1 cm to
its width. Sonographic measurements are
slightly smaller than the true dimensions be-
cause the kidneys occupy planes that are
angled laterally and anteromedially and do
not coincide precisely with the planes used
for routine scanning.
The size ratio of the renal parenchyma to the
central sinus echo provides an index for eval-
uating parenchymal thickness. Table 9.2
shows how the normal ratio of the anterior
and posterior parenchyma to the central sinus
echo (the parenchymal-pelvic ratio) changes
with aging.
<40 1.8: 1-2.0 :1
40-60 1.7:1
> 60 1.1 : 1
Table 9.2 Dependence of the parenchy-
mal-pelvic ratio on age (after reference 6)
Age (years) Ratio
a Fig. 9.19 Subjective assessment of renal size.
a In a large field of view, the kidney (N) appears small
in relation to the overall image.
a b The kidney (N) appears larger in an enlarged view.
According to measurements, this kidney is small but
still within normal limits for the patient’s body size.
Diffuse Changes 283
► Constitutional/Acromegaly____________________________________________________________________
Renal size is dependent on the patient’s con-
stitution or body size. As a result, the renal
dimensions may be above or below normal,
but the shape and parenchymal-pelvic ratio
will still be within normal limits (Table 9.2).
Lengths from 9.6 to 13 cm may still be consid-
ered normal, depending on body size
(Fig. 9.20). Nomograms plotted for children
(by Weitzel and Troger) show a direct correla-
tion with body size.
a Fig.9.20 a Constitutionally large kidney (13.5cm,
contralateral 13.0 cm) in a 47-year-old man with a
height of 196 cm and body weight of 111 kg.
a b Enlarged kidneys in acromegaly (13.7 cm).
► Duplex Kidney, Single Kidney______________________________________________________________________
Duplex kidney. One of the most common types
of renal enlargement involves duplex kidneys,
whose sonographic features are described
above. Their shape at ultrasound resembles
that of a pretzel. The longitudinal diameter
may be normal or increased up to 15 cm, with
a normal width. The overall thickness may be
increased if the duplicated kidneys are ar-
ranged side by side (Fig. 9.21), creating a tu-
morlike appearance. The moieties can be dis-
tinguished from a tumor by color Doppler so-
nography, which shows a normal duplex vas-
cular pattern.
Single kidney. A single kidney undergoes com-
pensatory physiological enlargement in re-
sponse to contralateral hypoplasia or aplasia,
contralateral nephrectomy, a nonfunctioning
opposite kidney, or a renal allograft (Fig.9.22).
a Fig. 9.21 Large duplex kidney with multiple paren-
chymal bands.
a Fig. 9.22 Renal aplasia.
a Absent left kidney, empty renal fossa below the
spleen (Ml) on the left side. F = fatty tissue: M =
musculature; S = shadow.
a b Compensatory enlargement of the right kidney
(12.3 cm. cursors).
► Diabetic Nephropathy________________________________________________________________
Another common but less familiar form of renal
enlargement occurs in diabetic nephropathy. In
its later stages, it is the most frequent indica-
tion for hemodialysis. In the early stage, which
marks the onset of a progressive function im-
pairment leading to frank renal failure, the
kidneys are enlarged as a result of hyperperfu-
sion. According to studies of diabetic nephro-
pathy in type I diabetics, the enlargement is
based on a volume increase1 affecting both
the longitudinal diameter and thickness of the
organ.
9 Kidneys 284
In cases where diabetes and blood pressure
are effectively controlled, the early changes
(Mogensen stages I—III 8) are reversible, which
is why early detection at the hyperperfusion
stage critically influences the prognosis. Other
cr iteria of diabetic nephropathy are not present
in stages 1 and II, and the only sign of hyper-
perfusion is an elevated creatinine clearance
rate in excess of 120 ml/min.
Sonographic features. At ultrasound, the renal
parenchyma is thickened and often shows in-
creased sonodensity. The medullary pyramids
appear bulky and less echogenic than the ad-
jacent parenchyma, which often but not always
shows increased echogenicity. The kidney
should therefore be measured in patients eval-
uated for diabetic nephropathy. It is not until
an advanced stage, when the patient requires
hemodialysis, that the kidney shrinks in size
and shows obvious structural changes. Other
signs of diabetic nephropathy are swollen,
a Fig. 9.23 Stage IV diabetic nephropathy with a large
kidney (N) (12.1 cm) and proteinuria. Long history of
type II diabetes mellitus. Six months later, persistent
diarrhea and reversible decompensation with creati-
nine of 8 mg/dl. Ml = spleen.
hypoechoic medullary pyramids. In advanced
stages (Mogensen stages IV-V, here with frank
a Fig. 9.24 Diabetic nephropathy. Large kidney (N)
(12.5 cm) with prominent hypoechoic medullary pyr-
amids (arrow). L = liver.
renal failure), the parenchyma shows increased
echogenicity (Figs. 9.23 and 9.24).
► Polycystic Kidney Disease________
Besides multiple anechoic lesions and ill-de-
fined borders, polycystic kidneys are conspic-
uous by their impressive enlargement due to
the mass effect of the cysts (Fig. 9.8).
► Acute Renal Failure, Shock Kidney
In the setting of acute renal failure and renal
shock or severe hypovolemia, ultrasound usu-
ally shows an increased parenchymal volume
and a decrease (or increase) in echogenicity
with enlargement of the kidneys and conse-
quent narrowing of the sinus echo complex
(Fig. 9.25).
► Septic- Toxic Kidneys
Renal enlargement also occurs occasionally in
sepsis. The kidneys tend to show increased
echogenicity, probably due a suppurative, leu-
kocytic reaction to septicopyemic foci in the
organs. The reaction may also be a result of
dehydration (Fig. 9.26).
a Fig. 9.25 a Acute prerenal renal failure. Creatinine
8.2 mg/dl (alcohol-related disease, persistent vomit-
ing and diarrhea). The kidney is greatly enlarged
(16.1 cm) with a hypoechoic, ill-defined structure.
a b Sepsis, alcohol-related disease, kidney (N) enlarged
to 13.0 cm. Renal echogenicity is slightly decreased.
The medullary pyramids are swollen and very hypo-
echoic. L = liver.
* Fig. 9.26 Septic-toxic kidneys with renal failure:
greatly enlarged kidney (N) with parenchymal swel-
ling. The medullary pyramids are markedly enlarged
and hypoechoic.
► Acute Urinary Retention, Acute Outflow Obstruction
In this situation as well, the kidneys often react
with enlargement and decreased echogenicity
due to interstitial edema. The medullary pyra-
mids may show signs of conspicuous swelling.
Often the bladder is greatly distended. The so-
nographic renal changes are the same as those
seen in renal congestion resulting from heart
failure.
► Renal Congestion due to Heart Failure______________________________________________________
The fluid build-up that occurs in severe con-
gestive heart failure leads to swelling and in-
creased echogenicity of the renal parenchyma
secondary to edema and hemorrhage. This
swelling is another cause of renal enlarge-
ment (Fig. 9.27).
* Fig. 9.27 Acute prerenal renal failure; enlarged kid-
neys (13.0 cm), hypoechoic parenchyma, and swol-
len, hypoechoic medullary pyramids (arrows).
Diffuse Changes 285
► Renal Vein Thrombosis___________________________________________________________________
Acute renal vein thrombosis also leads to en-
largement and unilateral hypoechoic swelling
of the parenchyma (Fig. 9.28). The diagnosis is
supported by:
► A broadened renal vein that contains intra-
luminal echoes and is devoid of color flow
► A high resistance index (after Pourcelot:
Vmax - Vmin = Vm<lx) in the intrarenal renal
arteries
► Reverse flow (hard, negative systolic signal
in the renal artery)
л Fig. 9.28 a Renal vein thrombosis secondary to sup-
purative pyelitis. The kidney is greatly enlarged to
142 mm (cursors) with a hazy, irregular hypoechoic
structure.
a b Spectral analysis in renal vein thrombosis indicates
an extremely high resistance index of 0.96.
► Acute Glomerulonephritis
In acute glomerulonephritis there may be sig-
nificant broadening of the renal cortex with
greatly increased echogenicity due to hyaline
casts, leukocyte infiltration, glomerular obliter-
ation, and tubular atrophy5. The increased cort-
ical echogenicity is in stark contrast with the
low echogenicity of the medullary pyramids
(Fig. 9.29, Fig.9.41).
« Fig. 9.29 Acute IGA (immune globulin A) nephritis:
slightly enlarged, swollen kidney (N) with prominent
medullary pyramids (arrows).
► Acute Pyelonephritis______________________________________________________________________________
A different picture is seen with severe acute
septic pyelonephritis, in which one or both
kidneys are enlarged and generally show a de-
crease in parenchymal echogenicity. Often
there are accompanying abscesses, pyonephro-
sis. or merely circumscribed anechoic to hyper-
echoic lesions in the parenchyma, renal pelvis,
or renal sinus representing abscesses or in-
fected, purulent urine. Swelling of the renal
pelvic walls is also occasionally seen
(Fig. 9.30). Other characteristic findings are ur-
othelial thickening to more than 2 mm and
hypoechoic foci in the parenchyma.
9 Kidneys 286
** Fig. 9.30 a Acute septic pyelonephritis: slightly en-
larged kidney with swollen, hypoechoic parenchyma.
The sinus echo has largely disappeared. Focal ab-
scess (arrows).
b Color duplex shows inflammatory hypervascular-
ity.
► AIDS- and Heroin-induced Nephropathy---------------------------------------------------------------------
As in other forms of renal enlargement, these
cases show increased cortical echogenicity that
heightens the contrast with the unchanged,
hypoechoic medullary pyramids.
► Amyloidosis/Paraprotein Kidney______________________________________________________________
The sonographic changes in amyloidosis are
like those seen in AIDS-related and heroin-re-
lated nephropathy and acute glomeruloneph-
ritis. These conditions are indistinguishable by
their sonographic features (Fig. 9.31, Fig.9.50).
Fig. 9.31 Paraprotein kidney (lymphoplasmacytic
immunocytoma with Bence Jones proteinuria). En-
larged kidney (N) shows slightly increased echoge-
nicity relative to the liver (L). The medullary pyramids
(arrows) are markedly swollen and show patchy low
echogenicity due to protein-filled tubules, with the
formation of hyaline casts in the distal tubules (cre-
atinine 3.0 mg/dl).
► Pyonephrosis_______________________________________________________________________________
If the purulent collection in the renal pelvis
takes up the entire central echo complex, the
pyonephrotic mass leads to overall renal en-
largement. The affected kidney has a tumorlike
appearance and is hardly distinguishable from
a large tumor by its ultrasound features
(Fig. 9.76; И I1.3g-i).
► Renal Tumor_______________________________________________________________________________
The characteristic appearance of a malignant
renal tumor is that of a circumscribed, hypo-
echoic mass. Renal cell carcinoma appears as a
sharply circumscribed bulge in the renal out-
line, while urothelial carcinoma forms a hypo-
echoic mass in the central sinus echo. With
extensive tumor infiltration, the kidney ap-
pears substantially enlarged and broadened.
Its structure is markedly nonhomogeneous
owing to intrarenal pyelectasis and the pres-
ence of calcifications (Fig. 9.32).
-« Fig. 9.32 Greatly enlarged kidney completely per-
meated by tumor. The kidney shows a heterogene-
ous, predominantly hypoechoic structure. Histolog
ical diagnosis: high grade non-Hodgkin lymphoma.
► Renal Allograft, Allograft Rejection_______________________________________________________________________
As a solitaiy functioning kidney, the renal al-
lograft is enlarged owing to adaptive hyper-
trophy. Additional enlargement occurs in asso-
ciation with allograft rejection. Enlargement is
not a dependable sign of rejection, however. A
more definitive sign is occlusive vasculopathy,
which can be demonstrated with Doppler ul-
trasound.
Complications consist of renal artery steno-
sis, renal vein thrombosis, and arteriovenous
fistulas. The resistance index (RI) in these cases
is greater than 0.9 and the pulsatility index (PI)
is greater than 1.6. Published reports on sensi-
tivity and specificity range from 14% to 98%!
(Fig. 9.33).
« Fig. 9.33 Renal transplant. The allograft is enlarged
to 13.0 cm, with accentuated renal columns (C) and
prominent hypoechoic medullary pyramids (arrows).
Diffuse Changes 287
Small Kidneys____________________________________________________________
— ► Hypoplasia
► Renal Artery Stenosis, Embolism
► Arteriosclerosis, Arteriolosclerosis
► Chronic Pyelonephritis
► Analgesic Nephropathy
► Chronic Glomerulonephritis
► Diabetic Nephropathy
► Hypoplasia________________________________________________________________________________
Renal hypoplasia is characterized by a small
kidney with essentially normal parenchyma
accompanied by compensatory contralateral
enlargement and often showing ectopia or
malrotation. These features serve to distinguish
a hypoplastic kidney from other, secondary
forms of small kidney with associated struc-
tural and contour changes (see Fig. 9.7).
► Renal Artery Stenosis, Embolism_________________________________________________________________________
When a small kidney is due to renal artery
stenosis, generally the stenosis is severe and
of long duration and is associated with chronic
hypertension.
Renal artery stenosis may be classified as
atherosclerotic (85% of cases) or fibromuscular
(15%). Accessory renal arteries occur in up to
28% of cases, so that when renovascular hyper-
tension is diagnosed, these vessels should be
included in diagnostic considerations.
Sonographic features. The parenchyma may
appear normal or thinned at ultrasound. The
structure is largely normal. The maximum flow
velocity rises to values above 180 cm/s at the
stenosis, and there is concomitant spectral
broadening and aliasing. The resistance index
associated with stenosis or occlusion of the
segmental arteries is less than 0.5 with a sen-
sitivity of 95% and a specificity of 97%2.
The following signs indicate an occlusion:
► No intraluminal color or flow signals in the
color Doppler image
► Markedly decreased flow velocity and RI in
intrarenal branches relative to the opposite
side
► Renal length decreased to less than 9 cm
With a renal arterial trunk embolism, a large
portion of the kidney may become anemic and
diminished in size, accompanied by an increase
in echogenicity (Fig. 9.34).
* Fig. 9.34 Small, nonfunctioning kidney with a filiform
renal artery stenosis.
► Arteriosclerosis, Arteriolosclerosis--------------------------------------------------------------------
9 Kidneys 288
While arteriolosclerosis leads to a decrease in
renal size with thinning of the cortex, arterio-
sclerosis causes an irregular surface with areas
of parenchyma thinning but a normal overall
renal size. Similar changes are seen as a result
of multiple infarcts in panarteritis nodosa
(Fig. 9.35).
< Fig. 9.35 Left kidney is atrophic probably due to ar-
teriolosclerosis Note the wavy surface contour. M =
spleen.
► Chronic Pyelonephritis---------------------------------------------------------------------------
Chronic pyelonephritis is a chronic interstitial
(bacterial), episodic inflammatory process
characterized by the scarring and destruction
of renal parenchyma. In bilateral cases that
have progressed to a stage requiring dialysis,
the kidneys are significantly smaller than nor-
mal, especially in their longitudinal dimen-
sion9. Additional features are focal changes
such as stones (33%) and cysts (31%) and
changes in cortical structure with a significant
increase in echogenicity (a 9.2g). In interstitial
renal diseases, a correlation exists between the
echogenicity of the renal cortex and histolog-
ical changes such as sclerosis, tubular atrophy,
hyaline casts, and focal leukocyte infiltration .
A small or atrophic kidney in pyelonephritis
is more often unilateral than bilateral, and it
can be difficult in these cases to establish a
cause. In the advanced stage of renal atrophy
when the longitudinal size of the kidney has
dwindled to approximately 6-7 cm, ultrasound
generally is no longer helpful in diagnosing the
cause. In addition to these changes, abscesses
may form in the renal pelvis, appearing as hy-
poechoic masses. This is especially common in
diabetics with an acute infection (Figs. 9.36
and 9.61, 0 9.5 d).
a Fig. 9.36 Renal atrophy in pyelonephritis. The kidney
is difficult to detect, consisting only of residual pa-
renchyma (N) and scars (arrows). The patient had a
history of recurrent pyelonephritis and analgesic use.
M = spleen.
► Analgesic Nephropathy______________________________________________________________
The term analgesic nephropathy refers to a
chronic, abacterial, interstitial, bilateral neph-
ritis that is incited by the use of analgesic med-
ication. The histological features are a lumen-
occluding capillary sclerosis, tubular and pap-
illary necrosis, and papillary necrosis with cal-
cification of the papillary tips.
The sonographic features reflect the histo-
logical changes in the form of decreased renal
size, increased echogenicity, wavy contours,
and fine calcifications at the tips of the medul-
lary pyramids. Some cases present with secon-
dary microcysts, usually resulting from the
cystic degeneration of medullary pyramids, or
with tubular retention cysts (detectable in 50%
of cases)9 (Fig. 9.37).
a Fig. 9.37 Analgesic nephropathy (N). Marked paren-
chymal rarefaction with a hazy structure and fine
calcifications projected over the papillary tips (ar-
rows). Secondary cyst (Z). Patient had a 30-year his-
tory of daily analgesic use and known pyelonephritis.
Creatinine 4.8 mmol/l. Harmonic imaging.
► Chronic Glomerulonephritis-------------------------------------------------------------------
Chronic glomerulonephritis and diabetic
nephropathy (glomerulosclerosis) are both
characterized by a decrease in renal size that
does not occur until an advanced stage. In both
diseases, the longitudinal diameter of the kid-
ney is within normal limits in patients who
have leached the dialysis stage9. The authors
found cystic lesions in 14% of cases.
Sonographically, the kidney shows mark-
edly increased echogenicity due to glomerular
hyalinization and tubular atrophy. The medul-
lary pyramids may still be appreciated as hy-
poechoic areas, but in most cases they disap-
pear owing to histologically demonstrable tub-
ular atrophy. In advanced stages the renal
structural change may no longer be helpful in
identifying the cause of the disease (Figs. 9.38,
9.41, and 9.42).
* Fig. 9.38 Small, hyperechoic right kidney (N) due to
an unknown cause. Left-sided hydronephrosis (fol-
lowing ureteral ligation). Renal failure with creatinine
of 5.6 mg/dl. L = liver; A = ascites.
► Diabetic Nephropathy_______________________________________________________________
Diffuse Changes 289
In our own observations of diabetics with
nephropathy, we found that the renal sizes in
stage 1 to stage IV cases of diabetic nephrop-
athy8 were consistently above normal, with
lengths up to 13.5 cm. In stage V disease, the
kidneys are either normal or slightly decreased
in size, and small kidneys are not seen until the
later dialysis stage.
Ultrasound at that stage demonstrates rare-
fied areas in the cortex and increased echoge-
nicity. Microcysts are also found, consisting
mainly of medullary pyramids that have under-
gone cystic degeneration. The end stage is
marked by atrophic kidneys with complete
parenchymal destruction, and the nature of
the disease can no longer be determined from
sonographic findings (Fig. 9.39).
л Fig. 9.39 Atrophic kidney (cursors) in diabetic nephr-
opathy requiring dialysis. The kidney, which is very
difficult to identify, has an irregular structure and
contains calcifications with acoustic shadows (S).
Hypoechoic Structure_________________________________________________
► Acute Renal Failure
► Acute Nephritis
► Right Heart Failure
► Renal Vein Thrombosis
Many renal diseases marked by structural
changes are also associated with a change in
renal size. Thus, some of the following disor-
ders have already been described above and
will be merely outlined here. It should also be
noted that while the features listed are sugges-
tive of the various diseases, they do not neces-
sarily mean that ultrasound can sensitively de-
tect the disease in question.
► Acute Renal Failure_________________________________________________________________________________________________________
If there are any characteristic changes in acute
renal failure, they are renal enlargement and
decreased echogenicity. In many cases, how-
ever, no significant abnormalities are seen
(Fig. 9.25).
► Acute Nephritis_____________________________________________________________________________________________________________
Besides renal enlargement, decreased paren-
chymal echogenicity is frequently seen as a
result of inflammatory edema (Fig. 9.29).
► Right Heart Failure
9 Kidneys 290
Characteristic features are enlargement and
decreased echogenicity, accompanied by con-
gestion of the vena cava and renal veins
(Fig. 9.27).
► Renal Vein Thrombosis___________________________________________________________________________________
Renal vein thrombosis may be unilateral or
bilateral. Besides the enlargement noted above,
the renal parenchyma generally appears hypo-
echoic (Fig. 9.28). Color duplex evaluation of
the renal veins is diagnostic.
Hyperechoic Structure__________________________________________________
— ► Hypoxemic Renal Shock
► Diabetic Nephropathy
► Acute and Chronic Glomerulonephritis
► Chronic Pyelonephritis
► Analgesic Nephropathy
► Septic-Toxic Kidneys
► Severe Metabolic Disorders
► Light-Chain Deposition Disease. Waldenstrom Disease
► Amyloidosis
► Infiltration by Lymphoma
► Atrophic Kidneys
► Hypoxemic Renal Shock____________________________________________________________
A septic-toxic illness or hypoxemia can cause
severe kidney damage with renal failure, lead-
ing to subtle but definite changes consisting of
a diffuse increase in cortical echogenicity and
very echopenic medullary pyramids. These
changes are caused by diffuse tubular damage
and necrosis, and also by decreased vasculari-
zation in cases with severe hypoxemia, so that
hypovascular or avascular areas are found at
color duplex scanning (Fig. 9.40).
a Fig. 9.40 Hypoxemic renal shock in the setting of
acute cardiac and renal failure. The patient was re-
suscitated for ventricular fibrillation (after sniffing
butane gas, with a fatal outcome).
a The parenchyma is broadened and hyperechoic,
resulting in a narrow sinus echo complex. Prominent
hypoechoic medullary pyramids.
a b Color Doppler shows scant color signals, reflecting
the marked decrease in vascularity.
► Diabetic Nephropathy_______________________________________________________________
Diabetic nephropathy has become the most
frequent indication for hemodialysis. Renal ul-
trasound examination in glomerular diseases,
including diabetic glomerulosclerosis (known
also as Kimmelstiel-Wilson syndrome), shows
increased cortical echogenicity due to histopa-
thological changes in basement membrane col-
lagenization, glomerular enlargement, mesan-
gial cell proliferation, and subsequent glomer-
ulosclerosis. The lucency of the medullary pyr-
amids stands in sharp contrast to the very
echogenic cortex (3 9.1) (Table 9.3, 9.4).
В 9.7 Diabetic Nephropathy (after reference 8)
► Stages 1 and II
Hyperperfusion with a volume increase
a Large kidneys, normal structure.
► Stage III
Incipient nephropathy with microalbu-
minuria (hyperperfusion with a volume
increase)
Diffuse Changes
► Stage IV
Overt nephropathy (proteinuria)
► Stage V
Renal failure (nephrotic syndrome)
► Stage V with dialysis
b Enlarged kidneys (N), normal width,
incipient hyperechoic cortex, promi-
nent hypoechoic medullary pyramids
(arrows). L = liver.
c Normal-size kidneys (N), parenchy-
mal thickness still normal, increased
cortical echogenicity; broadened, hy-
poechoic medullary pyramids.
d Renal size still normal, rarefied cor-
tex, markedly hypoechoic “cystic” pyr-
amids with echogenic demarcation.
e Small kidneys (N) (8.7 cm), rarefied
cortex, degeneration or disappearance
of the medullary pyramids (MP), pa-
renchymal destruction (possible sec-
ondary cysts, calcifications). Spotty,
deformed vascular segments. L = liver.
Table 9.3 Sonographic changes seen in different stages of diabetic nephropathy
Eariy stage
Advanced stage
End stage
9 Kidneys 292
► Renal enlargement (volume increase)
► Increased cortical echogenicity
► Markedly hypoechoic medullary pyramids
► Normal renal size with rarefied parenchyma
► Increased cortical echogenicity
► Cystic transformation or disappearance of
medullary pyramids
► Wavy contours
► Small kidneys
► Intensely hyperechoic parenchyma
► Disappearance of medullary pyramids
► Secondary cysts, calcifications
Table 9.4 Histopathology of chronic diabetic, glomerular and interstitial nephropathy (after reference 11)
Diabetic nephropathy Early stage ► Glomerular enlargement, mesangial cell proliferation ► Basement membrane collagenization Late stage ► Glomerulosclerosis ► Broadened mesangium with deposits ► Arteriosclerosis ► Glycogen storage in tubules ► Papillary tip necrosis
Chronic glomerulonephritis ► Mesangial cell proliferation ► Glomerular enlargement ► Basement membrane thickening ► Mesangial, capillary, tubular deposits ► Cellular infiltrates
Chronic pyelonephritis ► Interstitial scarring ► Lymphoplasmocytic infiltrates ► Tubular atrophy ► Tubular protein deposits ► Scarring of the pyelocaliceal system
Analgesic nephropathy ► Papillary necrosis ► Broadening of the capillary basement membrane in the renal medulla (capillary sclerosis) ► Lipofuscin deposits in tubules ► Lymphoplasmohistiocytic infiltrate with fibrosis, sclerosis
► Acute and Chronic Glomerulonephritis_________________________________________________________
Both acute and chronic (bilateral) glomerulo-
nephritis are associated with increased cortical
echogenicity, which is more distinct than in
diabetic nephropathy9. Again, the medullary
pyramids appear markedly hypoechoic relative
to the cortex. The kidney is enlarged in acute
glomerulonephritis and is of normal size in
chronic glomerulonephritis (Figs.9.41 and
9.42).
The usually pronounced increase in echoge-
nicity is caused by histological changes. It has
been shown that cortical echogenicity corre-
lates with histological criteria such as sclerosis,
tubular atrophy, hyaline casts, and focal leuko-
cytic infiltration5 (Table 9.4).
a Fig. 9.41 Acute glomerulonephritis: enlarged kidneys
(N) with markedly increased cortical echogenicity and
very prominent, hypoechoic medullary pyramids (ar-
rows).
a Fig. 9.42 Chronic glomerulonephritis (prior history of
rheumatic fever) and chronic renal failure: small kid-
ney (N), hyperechoic cortex, disappearance of the
medullary pyramids, shallow notches due to scarring
(arrows). L = liver.
► Chronic Pyelonephritis____________________________________________________________________________
Chronic pyelonephritis is also associated with
increased echogenicity. The kidney is generally
small, however, compared with the inflamma-
tory conditions listed above, and scarring leads
to areas of parenchymal thinning (Fig. 9.43,
Table 9.4).
< Fig. 9.43 Old chronic pyelonephritis: small kidney
with multiple echogenic sites of parenchymal retrac-
tion due to scarring.
Diffuse Changes 293
► Analgesic Nephropathy______________________________________________________________
Of all the chronic renal diseases, analgesic
nephropathy shows the greatest increase in
echogenicity. As in the other diseases above,
this results from underlying histological
changes, chiefly fibrosis, sclerosis, and calcifi-
cations. Sonographically, the changes cause
scarring with contour irregularities, lack of de-
marcation, a decrease in renal size, anechoic
areas (secondary cysts), and very hyperechoic
areas with associated acoustic shadows, espe-
cially from calcifications at the tips of the pap-
illae (Fig. 9.37, Fig. 9.44, Table 9.4).
« Fig. 9.44 Analgesic nephropathy: nonhomogeneous,
hyperechoic parenchyma with ill-defined contours.
Note the hyperechoic areas at the tips of the medul-
lary pyramids (calc fying papillary necrosis, acoustic
shadows S).
► Septic-Toxic Kidneys_________________________________________________________________________________
Severe septic-toxic disease states are charac-
terized by a markedly hyperechoic, swollen
renal cortex. The changes are usually associ-
ated with renal enlargement. Diiect septic-
toxic tissue effects such as necrosis, lympho-
leukocytic infiltration, or ischemic vascular
changes can occur. Similar changes are found
in acute tubular obstruction by urates in the
chemotherapy of malignant lymphoma, also in
acute renal failure, lupus erythematosus, he-
molytic-uremic syndrome, and acute glomeru-
lar renal diseases. After the systemic manifes-
tations have subsided, the diffuse structural
changes also regress (Figs. 9.45 and 9.46).
a Fig. 9.45 Septic-toxic abdomen: normal-size kidney
with increased cortical echogenicity and prominent
hypoechoic medullary pyramids.
a Fig. 9.46 Septic-toxic renal failure.
a The kidney (N) shows greatly increased echogenic-
ity relative to the liver (L) Note the prominent, hypo-
echoic medullary pyramids.
a b Enlarged view shows massive swelling and de-
creased echogenicity of the medullary pyramids
(MP).
► Severe Metabolic Disorders
9 Kidneys 294
Severe metabolic disorders such as untreated
diabetes mellitus, with or without diabetic
coma, are occasionally associated with pro-
nounced renal structural changes. Possible
causes are severe dehydration, tubular glyco-
gen storage or other storage disorders, as well
as glomerular/tubular changes that do not al-
ways have a discernible cause, especially if the
case cannot be evaluated histologically
(Figs. 9.47 and 9.48).
a Fig. 9.47 Neglected case of type I diabetes mellitus:
massive parenchymal swelling, increased echogenic-
ity (relative to the spleen M), prominent hypoechoic
pyramids (arrows). Lateral flank scan displays the
aortic band at the bottom of the image. N = kidney.
a Fig. 9.48 Toxic renal failure secondary to extensive
thrombosis of the portal venous system: large, echo-
genic kidney (N), prominent hypoechoic pyramids,
perirenal ascites.
► Light-Chain Deposition Disease, Waldenstrom Disease
Light-chain deposition disease is a nonspecific
condition that leads to renal failure based on
the precipitation of light-cham paraproteins in
the distal tubules, a hypercalcemic tubulopathy
in hypercalcemia syndrome, and/or an accom-
panying deposition of amyloid. Similar changes
are encountered in Waldenstrom disease and
amyloid kidney.
Ultrasound may demonstrate renal enlarge-
ment and increased cortical echogenicity.
Often there is only mild enlargement with an
indistinct parenchymal texture (Fig. 9.49).
a Fig. 9.49 Light-chain deposition disease, hypercalce-
mic crisis, renal failure.
a Right kidney (N): parenchyma has a somewhat
indistinct structure and appears slightly hyperechoic
to the liver (L). Prominent medullary pyramids.
a b Acute renal failure requiring dialysis in a patient
with paraproteinemia (and initial hypercalcemia)
and a plasmacytoma. The kidneys are still of normal
size (N, cursors). The parenchyma shows markedly
increased echogenicity with enlarged, hypoechoic
to anechoic medullary pyramids (arrows).
► Amyloidosis
Amyloidosis is also associated with an increase
in cortical echogenicity and prominent hypo-
echoic pyramids. We see, then, that these dif-
fuse structural changes occur in a variety of
diseases and cannot be considered specific so-
nographic features; indeed, they are very non-
specific. Only if the underlying disease is
known can the echogenicity changes be re-
ferred to a specific renal complication
(Fig. 9.50).
* Fig. 9.50 Presumed renal amyloidosis: echogenic re-
nal cortex with increased parenchymal volume caus-
ing slight narrowing of the sinus echo complex. Hy-
poechoic, ill-defined medullary pyramids (rheuma-
toid arthritis, renal failure with nephrotic syndrome)
L = liver; N = kidney.
► Infiltration by Lymphoma
The infiltrating lymphomatous tissue leads to
renal enlargement (see above). Increased echo-
genicity may be seen, but the bulges in the
renal outline, frequent nonhomogeneous
structure, and irregular tumor vascularity serve
to distinguish this disease from those listed
above (Fig. 9.32 and Fig. 9.79).
► Atrophic Kidneys_____________________________________________________________________________
Generally the detection of renal atrophy does
not point to a specific cause (Fig. 9.51),
although bilateral atrophic kidneys are more
likely to have a diabetic etiology (only in the
late dialysis stage) or a glomerular cause or
may result from analgesic nephropathy.
Unilateral renal atrophy, or bilateral atrophy
that differs in severity between the sides, usu-
ally has a different cause such as pyelonephritis
or vasopathy (Fig.9.52).
As the name implies, the kidneys appear
small at ultrasound. The parenchyma is
thinned, and the renal outlines are smooth
(glomerular, diabetic) or wavy (pyelonephritis
or analgesic nephropathy). The structure is
usually echogenic (except with renal artery
stenosis). In the end stage of tuberculous kid-
neys (“putty kidney”), very hyperechoic areas
are also seen. Calcifications and secondary
stones are additionally found in some atrophic
kidneys (Figs. 9.53, 9.37, 9.39, and 9.94).
a Fig. 9.51 Small, hyperechoic right kidney (N, arrows)
due to an unknown cause. Slight structural irregular-
ity. L = liver.
a Fig.9.52 Renal atrophy (85 mm) due to arterioscle-
rosis and arteriolosclerosis: irregular, rarefied, slightly
hyperechoic parenchyma (cursors) with a corre-
spondingly broadened sinus echo.
a Fig. 9.53 Severely atrophic kidney with calcifications
and acoustic shadows (S). Diabetic nephropathy,
transplantation.
Diffuse Changes 295
Irregular Structure______________________________________________________________
Anomalies, Malformations
ф4 «"’MJiffuse Cha"r?gZ^"
О ► Large Kidneys
Д ^>"small Kidneys
И Hypoechoic Structure
M Hyperechoic Structure
Irregular Structure
.!► Circumscribed Changes
— ► Analgesic Nephropathy
► Diffuse Tumor Infiltration
► Purulent Pyelonephritis, Pyonephrosis
► Analgesic Nephropathy______________________________________________________________
The kidney in analgesic nephropathy also ac-
quires an irregular echo structure as a result of
fibrosis, papillary calcifications, and secondary
cystic and calcifying changes (Figs. 9.37, 9.44).
► Diffuse Tumor Infiltration_____________________________________________________________________________________________________________
Secondary changes such as liquefaction, calci-
fication, and fresh tumor growth lead to irreg-
ular structural changes in the kidney. Renal
enlargement and contour irregularities are
also present (Fig. 9.32).
► Suppurative Pyelonephritis, Pyonephrosis
9 Kidneys 296
In cases with extensive pyelonephritis involv-
ing much of the renal pelvis and parenchyma,
the hypoechoic inflammatory changes will be
accompanied by a generally irregular structure
like that associated with other types of abscess
formation (Fig. 9.54; see also в 11.3, p.344).
The central sinus echo complex is poorly de-
fined. In pyonephrosis caused by an ascending
infection, the pyelocaliceal system is com-
pletely filled with pus.
« Fig. 9.54 Suppurative pyelonephritis (arrows): heter-
ogeneous mass in the renal sinus echo complex with
hyperechoic areas (bacterial gas bubbles? residual
sinus echoes?). N = kidney.
Circumscribed Changes
Anechoic Structure__________________________________________________________
— ► Renal Cysts, Polycystic Kidney
► Perirenal Cystic Masses
► Lymph Cysts
► Cystic Renal Cell Carcinoma, Intracystic Carcinoma
► Papillary Necrosis, Cystic Degeneration of the Medullary Pyramids
► Cavities
► Abscess
► Organized Hematoma
► Urinoma, Seroma
► Vascular Dilatations
► Hydrocalices, Pyelectasis, Hydronephrosis
► Renal Cysts, Polycystic Kidney
Simple cysts (dysontogenic). Round, sharply
circumscribed, anechoic masses located in or
on the kidney and showing posterior acoustic
enhancement can be confidently identified as
primary (dysontogenic) cysts if, in addition to
the usual cystic criteria, they show an absence
of vascularity on color duplex scanning and
there are no additional structural abnormal-
ities in the affected kidney. Whether single or
multiple, they represent tubular retention cysts
that have resulted from dilatation of the Bow-
man capsule or proximal tubules. Conse-
quently, they have a cyst wall that produces
typical entrance and exit echoes at ultrasound
but cannot always be directly visualized. Pri-
mary dysontogenic cysts display a typical loca-
tion (Table 9.5) (E 9.2a-d).
Multiple cysts (dysontogenic). Kidneys that
contain multiple cysts are usually of normal
size. In contrast to a polycystic kidney, the renal
cortex, medullary pyramids, and renal sinus are
clearly defined (Ы 9.2 e, Fig. 9.9).
Polycystic kidney (dysontogenic). This dis-
ease involves a polycystic malformation of the
distal renal tubules, tubular epithelium, or tub-
ular walls leading to a predominantly bilateral
polycystic transformation of the kidneys. At
ultrasound the kidneys are considerably en-
larged and contain numerous cysts that com-
pletely alter the contours of the renal capsule
and cause poor delineation of the renal bor-
ders. There is variable rarefaction of the paren-
chyma due to a combination of cyst compres-
sion, blooming effects, and interstitial fibrosis.
Polycystic kidneys are commonly associated
with cysts in the liver and other organs, and
the initial ultrasound findings are unmistak-
able (Fig. 9.8).
Atypical or secondary cysts. Atypical or sec-
ondary cysts differ from simple, uncomplicated
cysts in their shape, location, or contents. They
may be elliptical, polygonal, or oblong; they
may show a parapelvic or extrarenal location;
and they may contain internal echoes (thick-
ened walls, septa, sedimentation, flakes, or
clots) and blood vessels in malignant tumors
(И 9.2g, Fig. 9.55).
Septated cysts. Renal cysts occasionally show
fine septations that subdivide the cysts into
separate compartments. Septated cysts require
Table 9.5 Classification of renal cysts by
their location and strucure (after Bosniak)
Classifica- tion Type of cyst
Bosniak 1 Simple cyst
Bosniak II Minimally complicated cyst (minimal septae)
Bosniak 111 More complicated cyst (multiple septae)
Bosniak IV Lesion probably malignant
careful scrutiny at ultrasound to differentiate
them from cystic renal cell carcinoma (] 9.2a,
Fig.9.56). Lesions having this appearance re-
quire surveillance and possible surgery. The
differential diagnosis should also include a hy-
datid cyst and, in young boys, multilocular
cystic nephroma (benign cystic nephroma),
wich demonstrate in ultrasonography a com-
plex renal mass with numerous anechoic cysts
separated by echogenic septae Э 9.3g, h.
И 9.2 Renal Cysts and Perirenal Cystic Masses
► Perirenal cysts
о Septated right upper pole cyst:
slightly irregular cystic mass (Z) subdi-
vided by an echogenic septum (arrows);
Differential diagnosis: cystic renal cell
carcinoma. L = liver; N = kidney.
b Two subcapsular cysts (Z, z) appear as
anechoic masses “piggybacked" on the
left kidney (N).
c Perirenal cyst, no vascularization. Left
lower pole cyst (C).
► Cortical and parapelvic cysts
d Peripeivic cyst (Z): round, anechoic
mass located in the renal sinus; appa-
rently a cortical cyst protruding into the
renal sinus. L = liver; N = kidney.
e Multiple renal cysts: some of the
cysts (Z, z) are round; others are trian-
gular or bandlike.
f Renal cortical cyst displaying all cri-
teria: anechoic mass with smooth mar-
gins, a capsule (bright entry echo at the
cyst apex), and distal acoustic en-
hancement; dysontogenic tubular re-
tention cyst. L = liver; N = kidney.
Circumscribed Changes 297
► Differential diagnosis of cystic
masses
g Secondary cysts (arrows) in an atro-
phic kidney with a hyperechoic rim of
residual parenchyma. The patient pre-
sented clinically with a plasmacytoma.
h und i Differential diagnosis of a
perirenal cystic mass.
h Large echo-free mass (cyst, Z) in the
triangle between the kidney, spleen,
and pancreatic tail. Differential diag-
nosis: cyst of the kidney, spleen, or
pancreatic tail.
i “Cystlike" metastasis (Z) from a high-
grade adrenal non-Hodgkin lymphoma
(see also Fig. 9.79). The indentation of
the posterior hepatic surface suggests a
solid mass. L = liver.
Retention cysts due to scarring. Secondary
retention cysts develop in one-third to one-
half of all patients with chronic interstitial
nephritis requiring dialysis. These cysts result
from scarring of the renal tubules. Many of the
cysts are misshapen and rather small, and most
are related to the cortex (и 9.2g, Fig.9.37).
Hydatid cyst. Both the dog tapeworm (Echino-
coccus granulosus), which forms a primary cyst
containing internal daughter cysts, and the fox
tapeworm (Echinococcus multilocularis), in
which the daughter cysts invade and destroy
the host tissues from the primary cyst, can
cause hydatid disease in humans. The most
frequently infected organ is the liver but other
sites may be affected, including the kidneys.
Sonographically, the cysts are outlined by an
echogenic wall. Daughter cysts produce a ro-
sette-like pattern. Echinococcus multilocularis
may also appear as a solid tumor mass. Hydatid
cysts require differentiation from cysts with
internal septations (see Fig. 2.53 and Fig. 5.26).
► Perirenal Cystic Masses_____________________________________________________________________________
Cystic renal lesions also require differentiation
from other anechoic masses in neighboring or-
gans and from adjacent cystic processes. Peri-
renal cystic masses may represent adherent
bowel loops, the gallbladder, loculated ascites.
cystic/liquid adrenal processes, and splenic or
pancreatic-tail cysts or abscesses. In the case of
adherent fluid-filled bowel loops, the correct
diagnosis is supplied by using real-time ultra-
sound to observe the moving bowel contents.
Equivocal findings require further investiga-
tion, such as ultrasound-guided fine-needle as-
piration biopsy (FNAB) (в 9.2h and i).
► Lymph Cysts__________________________________________________________________
9 Kidneys 298
Parapelvic (peripelvic) lymph cysts. Parapel-
vic cysts generally represent lymph cysts,
which have an epithelial lining. Projecting
into the renal sinus, they present as flattened,
usually elliptical cystic lesions. Generally these
cysts are multiple.
When they are bilateral and show a finger-
like arrangement extending toward the renal
hilum, they are classified as multiple parapelvic
cysts or benign cystic lymphangioma. Between
the elliptical, anechoic lesions tapering toward
the hilum are hyperechoic, septumlike parti-
tions formed by the compressed sinus tissue
and pyelocaliceal system ( 9.3a-e). Differen-
tiation is required from renal pelvic dilatation
due to a low urinary tract obstruction, but the
absence of ureteropelvic junction dilatation
serves to exclude that condition. Occasionally
there is no alternative to excretory urography
for establishing a diagnosis. In the case of lymph
cysts, the urogram will show sharply circum-
scribed impressions on the pyelocaliceal system.
Intrarenal or perirenal lymphoceles. Intrare-
nal or perirenal cystic lesions may also be lym-
phoceles, depending on the cause of the dis-
ease. They occur after surgery, in rejection epi-
sodes after renal transplantation, and also in
chronic progressive renal diseases such as renal
failure requiring dialysis. When they present as
a perirenal mass, lymphoceles have an an-
echoic, cystic appearance. They may also con-
tain septations (3 9.3f).
► Cystic Renal Cell Carcinoma, Intracystic Carcinoma
Renal cell carcinoma. Cystic renal cell carci-
noma (RCC) is a rare form of renal carcinoma
(see Table 9.6). It shows a predominantly an-
echoic, cystic structure with more or less pro-
nounced solid components. Foci of necrobiotic
tumor liquefaction are common, especially in
tumors of long duration (Fig. 9.55).
Intracystic carcinoma. Another type of cystic
renal tumor is renal carcinoma that arises in-
side a cyst. Because intracystic carcinoma is
extremely rare, it does not justify regular sono-
graphic or CT follow-ups in patients with
known cysts (Figs. 9.56-9.58 and Fig. 9.78).
a Fig. 9.55 Cystic renal cell carcinoma. No histology
because of earlier nephrectomy on the left side.
a Transverse scan through the right upper abdomen:
solid and cystic tumor components with pathological
intratumoral vessels (compare with Fig. 11.7, p. 334).
N = kidney.
a b Oblique scan through the right upper abdomen:
the solid tumor component (T) again shows internal
vascularity, which is absent in the cystic component
(Z) with an atypical internal structure.
В 9.3 Lymph Cysts
a Perirenal lymph cysts (arrows): small
cysts, some showing a string-of-beads
arrangement (varied at follow-ups). The
patient presented clinically with severe
right heart failure and erythrocytosis.
N = kidney.
b and c Multiple parapelvic cysts on
both sides: “benign cystic lymphan-
gioma.”
b Right kidney (N): elliptical cysts radi-
ating toward the hilum in a fan-shaped
pattern. L = liver.
c Left kidney: a less obvious alignment
toward the hilum.
d Benign cystic lymphangioma: frag-
mented color pixels among the cysts,
representing vessels in the renal sinus;
no typical tumor vessels (clinical pre-
sentation: advanced colon carcinoma!).
e Cystic renal cell carcinoma? Atypical
cysts (Z), septumlike internal struc-
tures, contour distortion (arrow). Re-
quires cytohistological workup! (Given
the bilateral occurrence of parapelvic
cysts, an atypical benign cystic lym-
phangioma is likely.)
f Postoperative lymphocele (C) follow-
ing stone surgery with postoperative
bleeding; very conspicuous medullary
pyramids (arrows). Left nephrectomy.
N = kidney.
g, h Differential diagnosis. Multilocu-
lar cystic nephroma.
g Longitudinal scan of the left kidney
shows numerous anechoic locules sep-
arated by echogenic septae.
h Contrast-enhanced CT confirms a
multilocular mass with enhancing sep-
tations replacing the renal parenchyma.
a Fig. 9.56 Cysbassociated renal cell carcinoma (RCC)
(arrows). Histology: chromophobe clear-cell RCC. N =
kidney.
a Fig. 9.57 Extensive tumor necrosis and cystic intra-
tumoral hemorrhage (90%) in a chromophil renal cell
carcinoma (histology). Woman 47 years of age pre-
sented with a cystic-solid mass. Ultrasound findings
suggested xanthogranulomatous pyelonephritis. CT
revealed intracystic hemorrhage. Intracystic carci-
noma?
a Fig. 9.58 Large perirenal cyst with papillomatous tu-
mor infiltration of the cyst floor (no histology). Asso-
ciated finding, parapelvic cysts.
ircumscribed Changes 299
► Papillary Necrosis, Cystic Degeneration of the Medullary Pyramids
Papillary necrosis and caliceal cysts most com
monly develop in a setting of purulent or non-
purulent interstitial chronic nephritis. They
present as small cystic lesions projecting to-
ward the calices.
In advanced diabetic nephropathy, it is not
uncommon to find cystic degeneration of the
medullary pyramids, which exhibit classic
cystic features. Often they are located next to
very hypoechoic medullary pyramids that may
eventually undergo complete cystic transfor-
mation. The medullary pyramids disappear in
the dialysis stage, often to be replaced by mul-
tiple small, secondary cysts that were once
pyramids (Fig. 9.59, И 9.1 d).
a Fig. 9.59 Irregular cystic mass in the area of a medul-
lary pyramid. Color Doppler shows no vascularity.
Diabetes mellitus. Probably the cystic transformation
of a medullary pyramid. N = kidney.
► Cavities
Hematogenous spread of renal tuberculosis
gives rise to cortical tubercles that descend
into the tubules, papillae, and associated cali-
ces where they form ulcer cavities.
These cavities have a cystic appearance at
ultrasound. While a purely cavernous-cystic
process cannot be recognized sonographically
as a tuberculous cavity, the late stage is addition-
ally marked by the formation of scars and calci-
fications. This combination allows for a pre-
sumptive sonographic diagnosis (Figs. 9.60,
9.92, and 9.93)
« Fig. 9.60 Old cavernous (?) medullary pyramids that
have undergone secondary cystic transformation
(arrows). Ultrasound shows irregular, echo-free
masses with a hyperechoic rim projected at the site
of the medullary pyramids (see also Fig. 9.92). Pa-
tient had a known history of spinal tuberculosis.
► Abscess_____________________________________________________________________________________
Renal abscess generally appears as a predom-
inantly hypoechoic mass with internal echoes
that distinguish it from a cystic lesion. Some
abscesses, however, may be so hypoechoic that
they mimic cystic lesions. A color void is seen
on color Doppler scanning (Fig.9.61, 9.5d,
and E 11.3d-f, p.344).
a b Right kidney in magnified view: cystic mass with
irregular margins (cursors) in the renal sinus echo
complex.
a Fig. 9.61 Bilateral abscesses in a patient with septic
urinary tract infection and diabetes mellitus. N =
kidney.
a Left kidney: predominantly echo-free cystic ab-
scesses with irregular margins (arrows).
► Organized Hematoma
9 Kidneys 300
Whereas fresh hematomas appear as echo-
genic. heterogeneous masses at ultrasound
(see below), older hematomas appear increas-
ingly hypoechoic to anechoic. Besides circum-
scribed parenchymal destruction, hematomas
usually produce a subcapsular mass caused by
the subcapsular extravasation of blood. This
mass presents sonographically as perirenal
fluid (Fig. 9.62). Color Doppler shows de-
creased perfusion in areas of renal contusion,
while it shows an absence of perfusion in a
hematoma.
The history and clinical presentation give
additional information on the cause of these
cystic lesions. Equivocal cases should be eval-
uated by CT, which is superior to ultrasound for
this type of investigation.
a Fig. 9.62 Perirenal, elliptical echo-free mass (arrows):
urinoma, hematoma following renal trauma. N = kid-
ney.
► Urinoma, Seroma
Urinoma. The presence of a urinoma signifies
leakage from the renal pelvis or ureter in a
setting of renal colic or trauma. Accordingly, it
appears sonographically as an anechoic, trian-
gular or crescent-shaped perirenal mass. It is
typically associated with flank pain, and pyelo-
caliceal obstruction is always detectable with
ultrasound (Fig. 11.27, p.339).
Seroma. A seroma is a collection of blood, se-
rum, or lymph in a postsurgical cavity. For this
reason, the nature of the mass can generally be
inferred from the patient’s history. It is usually
anechoic with somewhat irregular margins,
but some seromas contain internal echoes.
► Vascular Dilatations
Aneurysm or intrarenal arteriovenous mal-
formation. Aneurysms or arteriovenous mal-
formations of the renal artery can mimic a cyst
when located within the kidney. The nature of
the lesion can be established by color Doppler
scanning and spectral analysis. Arterial signals
are typically recorded from aneurysms, while
arteriovenous malformations exhibit high flow
velocities up to 180 cm/s and low resistance
indices (RI 0.32-0.25)12 (Fig.9.18). Renal artery
aneurysms located outside the kidney are rel-
atively easy to identify.
Renal vein ectasia or congestion. An ectatic or
congested renal vein has the same sonographic
appearance as an aneurysm or artenal-vemous
malformation (AVM), and the color Doppler
examination is diagnostic. The vein can be con-
fidently distinguished from an arterial aneur-
ysm by spectral analysis (Fig. 9.63).
a Fig. 9.63 Ectatic branches of the renal vein. L = liver;
N = kidney.
a В-mode image: irregular cystlike areas in the sinus
echo complex.
a b Color Doppler: vascularity consistent with ectatic
renal veins.
► Hydrocalices. Pyelectasis, Hydronephrosis
Certain planes of section through distended
calices in obstructive pyelocaliceal dilatation
can create the impression of multiple renal
cysts. In this case an oblique longitudinal
scan, preferably from the posterior side (ure-
ter!), will demonstrate the cystic enlargement
of the calices.
Hydrocalices and hydronephrosis are seen
in association with ureteral obstructions. Hy-
drocahces may also be congenital or secondary
to caliceal stones or nephrocalcinosis (Figs.
9.64 and 9.65, and Fig. 11.10, p. 335).
a Fig. 9.64 Obstructive cahectasis. N = kidney.
a Scan through the calices, which resemble cysts (Z)
in this plane.
a b Oblique scan demonstrates the dilated pyelocali-
ceal system (P).
< b Excretory urogram: curved medial and lateral in-
dentations in the upper portions of the calices. Renal
pelvic indentation and congestion due to subpelvic
obstruction (by a tumor?).
Circumscribed Changes 301
Hypoechoic or Isoechoic Structure___________
► Dromedary Hump, Fetal Lobulation
► Abscess
► Hemorrhagic Cyst
► Fresh Renal Infarct
► Hematoma
► Renal Cell Carcinoma
► Urothelial Carcinoma
► Malignant Lymphoma
► Metastasis
► Adenoma, Inflammatory Tumor
► Dromedary Hump, Fetal Lobulation---------------------------
Dromedary hump. The physiological drome-
dary hump in the left kidney appears as a hy-
poechoic “mass” that is occasionally difficult or
impossible to distinguish from a tumor. It is
helpful to inspect the structure closely in a
zoomed view and note the normal renal archi-
tecture, and to obtain a color Doppler view
showing an absence of irregular tumor vessels
and an abnormal vascular rim.
Fetal lobation. Fetal lobation is a developmen-
tal anomaly based on incomplete fusion of the
fetal nephrons. It is characterized by a normal
but undulating parenchyma that bulges out-
ward and also toward the renal sinus. The con-
stricted areas between the bulges represent
sites of normal parenchymal thickness and
are not rarefied areas like those caused by scar-
ring (Fig. 9.66).
a b Physiological, hypoechoic dromedary hump in the
left renal border, indistinguishable from a tumor (see
E 9.4). M = spleen; N = kidney.
a Fig. 9.66 Renal contour distortion.
a In fetal lobation.
► Abscess
9 Kidneys 302
Abscesses in and about the kidney can result
from local abscessation (pyelonephritis, usually
E. coli) or from the hematogenous spread of
infection (usually staphylococcal). They can
spread beyond the renal capsule to form a peri-
nephritic abscess, or they may spread into the
perirenal fat, forming a paranephritic abscess.
Their sonographic features are diverse. A
simple abscess produces a mass effect creating
a bulge in the renal outline. It shows a hypo-
echoic to heterogeneous echo structure and
usually has ill-defined margins. The sonogra-
pher should look for gas bubbles, which are a
common phenomenon and appear as focal
echogenic inclusions with or without reverber-
ations (Figs. 9.67 and 9.30).
Perirenal abscesses appear as ill-defined
masses that may spread in an inferior or lum-
bar direction. Emphysematous and xanthogra-
nulomatous pyelonephritis are special forms.
a Fig. 9.67 Renal abscess. L = liver; N = kidney.
a Echogenic bacterial gas bubbles with reverbera-
tions (arrows, W) before medical treatment.
a b After antibiotic treatment: hypoechoic mass (ar-
rows), contour distortion, ill-defined margins, and
scattered echogenic gas bubbles.
► Hemorrhagic Cyst____________________________________________________________________
While some cyst criteria such as smooth mar-
gins and a round shape are maintained in a
hemorrhagic cyst, the bleeding causes the ini-
tial anechoic mass to become more reflective.
This makes the cyst difficult to distinguish from
a tumor. The diagnosis can be established by
fine-needle aspiration biopsy or CT (Figs. 9.68
and 9.77).
* Fig. 9.68 Hemorrhagic cyst (ultrasound-guided as-
piration): elliptical, isoechoic to hyperechoic mass
in the renal sinus. The patient presented clinically
with metastatic colon cancer. N = kidney.
► Fresh Renal Infarct______________________________________________________________________________________
A fresh renal infarct is seldom diagnosed clin-
ically and is usually detected incidentally at
imaging. In the acute stage, it displays a typical
wedge shape with the base directed toward the
renal capsule. The late stage is marked by sur-
face retractions and focal rarefied areas in the
parenchyma due to scarring and fibrous con-
tracture (Fig. 9.69).
a Fig. 9.69 Fresh renal infarct.
о Survey scan shows increased echogenicity in the
upper pole of the right kidney.
a b Close-up view shows a sharply defined, wedge-
shaped hypoechoic region
a c Color Doppler- the wedge-shaped avascular region
(arrows) confirms the infarct. The patient presented
clinically with flank pain.
► Hematoma----------------------------------------------------------------
Like renal infarcts and hematomas at other
locations, a renal hematoma or contusion
undergoes structural changes over time. It ap-
pears initially as a hyperechoic or isoechoic
mass that causes a bulge in the renal outline.
The echo structure of the mass is somewhat
irregular compared with the normal renal pa-
renchyma. Later the hematoma becomes less
echogenic and may culminate in a residual sec-
ondary cyst or pseudocyst (Fig. 9.77 c).
л Fig.9.77c Common sonographic findings include an echogenic intrarenal mass with a homogeneous or hetero-
geneous appearance reflecting varying degrees of hemorrhage and necrosis; increased vascularity is noted on color
doppler sonography.13
Circumscribed Changes 303
► Renal Cell Carcinoma----------------------------------------------------------------
Forms. Renal cell carcinoma (RCC) occurs in
three different forms:
► Ordinary solid renal cell carcinoma (most
common form)
► Tubulopapillary form
► Cystic renal cell carcinoma (rare)
Based on the international WHO classification
of 1998, renal cell carcinomas are classified
histologically as epithelial or nonepithelial
types as shown in Table 9.6, Since RCC arises
from the renal parenchyma, it displays the im-
munohistochemical features of uropoietic tub-
ular epithelium11.
Sonographic features. The ultrasound appear-
ance of RCC varies greatly with its stage and
histological classification.
The most common and characteristic ap-
pearance of RCC is that of a round, isoechoic
mass in the renal parenchyma that creates a
bulge in the renal outline. Hypoechoic tumors
are also seen. Atypical hyperechoic tumors are
found in 30% of cases; most of these are early-
stage tumors (see Figs. 9.81 and 9.82). Cystic
RCC displays cystic features along with solid
elements or septations (Fig.9.55, Fig.9.78).
The echo texture of RCC is homogeneous to
irregular. Advanced tumors show regressive
changes in the form of liquefaction, hypere-
choic areas, and calcifications (a 9.4c). With
its wide spectrum of features, RCC can be char-
acterized as a chameleon in its sonographic
appearance (И 9.4).
A narrow, anechoic rim (displaced vessels) is
consistently present around the tumor. If this is
accompanied by irregular internal tumor ves-
sels within the mass (color Doppler), the ultra-
sound diagnosis may be considered established
and the patient can be leferred at once for
surgical treatment without further tests. Con-
trast-enhanced color duplex scanning demon-
strates increased vascularity with arteriove-
nous shunts. Spectral analysis shows a high
Doppler shift > 1 m/s with high diastolic flow.
Table 9.6 International classification of renal parenchymal tumors (after reference 10)
Benign forms
Epithelial tumors
► Papillary and tubulopapillary adenoma
► Oncocytic adenoma
► Metanephric adenoma
Nonepithelial tumors
► Angiomyolipoma
► Leiomyoma
► Lipoma
► Renomedullary interstitial cell tumor
► Hemangioma
► Lymphangioma
► Juxtaglomerular cell tumor
Malignant forms
Epithelial tumors
► Renal cell carcinoma
► Clear cell carcinoma
► Granular cell carcinoma
► Chromophobe cell carcinoma
► Spindle cell carcinoma
► Cyst-associated renal cell carcinoma
- Renal cell carcinoma originating in a cyst
- Cystic renal cell carcinoma
► Papillary renal cell carcinoma
► Collecting-duct carcinoma
Nonepithelial tumors
► Malignant soft-tissue tumors
Diagnostic procedure. At present, renal cell
carcinoma is detected incidentally at routine
ultrasound in 70-80% of cases. It is rarely diag-
nosed by a targeted search in patients who
already have metastatic symptoms. Metastasis
may occur by the hematogenous route or by
contiguous spread into the renal vein (20%)
and inferior vena cava (5%)4. Tumor thrombi
may occur in the right heart. It is essential,
therefore, to closely inspect the renal veins,
vena cava, and locoregional lymphatics during
ultrasound examination. On the left side, a
dromedary hump should be included in the
differential diagnosis.
Wilms tumor. A special type of renal tumor in
children is nephroblastoma (Wilms tumor; see
Table 9.6), which usually presents as a rapidly
enlarging mass that becomes symptomatic
(Fig. 9.70).
Nephroblastic lesions (pediatric tumors)
► Nephroblastoma (Wilms tumor)
► Benign or malignant cystic nephroma
► Cystic, partially differentiated nephroblastoma
► Other pediatric tumors
9.4 Renal Ceil Carcinoma (RCC)
► Varying echogenicity
9 Kidneys 304
a Hypoechoic tumor (T) with ill-de-
fined margins. Bulging renal outline.
b Isoechoic mass (T) at the upper pole
of the kidney, pathognomonic: vascular
rim and intratumoral vessels (arrows).
c Hyperechoic tumor (T). N = renal pa
renchyma.
d Partially cystic (Z) transformed tu-
mor. N * kidney.
e Areas of necrobiotic liquefaction.
N = kidney; T = tumor.
f Complex structured tumor mass with
hyper- and anechoic (Z) portions of the
right kidney (N). P = pyelon.
► Route for tumor metastasis
g and h Advanced RCC.
g Large, hypoechoic tumor (T). Partial
hypoechoic transformation of sinus
echo due to tumor vein thrombosis. N =
kidney.
h Extension of tumor into the central
echo complex. The tumor has invaded
and thrombosed the renal vein (VR).
Color Doppler shows patchy tumor
vascularity. A tumor thrombus is also
present in the vena cava (VC).
/ Another echogenic tumor thrombus is
in the right atrium (RA), making the RCC
inoperable. RV = right ventricle.
► Urothelial Carcinoma_________________________________________________________________________________
Carcinomas of the renal pelvis, ureter, and
bladder differ fundamentally from renal tu-
mors. They arise from the urothelium, or tran-
sitional epithelium, and occur as papillary and
solid tumors. Renal pelvic carcinoma is three
times more common than ureteral carcinoma.
The tumor presents clinically with hematuria.
Urothelial carcinoma forms a hypoechoic,
polypoid mass that fills the lumen of the renal
pelvis to produce a hypoechoic, butterfly-like
figure. The tumor usually has a homogeneous
echo texture, but the added presence of lique-
fied foci and calcifications give the tumor a
nonhomogeneous appearance (Fig. 9.71).
Unlike an infected obstruction and other
masses in the central sinus echo complex, the
tumor exhibits vascularity on color duplex
examination. It is difficult to distinguish from
renal cell carcinoma that has invaded or dis-
placed the renal sinus or renal pelvis (E 9.5f, g.
Figs. 11.34 and 11.35 in Chapter 11).
Given the major importance of hypoechoic
masses in the renal sinus echo complex, the
differential diagnostic features of these masses
are reviewed in - 9.5.
a Fig. 9.71 Urothelial carcinoma: hypoechoic mass (TU)
in the renal sinus echo complex with calcification (K).
RE.N = right kidney.
S 9.5 Differential Diagnosis of Hypoechoic Masses in the Renal Sinus Echo Complex
► Renal column
► Conical extension between the
medullary pyramids
► Isoechoic to the renal cortex
► No vascularity
a Hypertrophic renal column (C) next
to large, hypoechoic medullary pyra-
mids: renal transplant. NP = paren-
chyma.
► Duplex kidney
► Notch in the renal outline
► Enlarged, elongated kidney
► Normal echo structure (or hypo-
echoic with overlying parenchyma)
► Normal vascularity
► Duplicated renal pelvis
► Duplicated ureters (visible only with
obstruction)
Circumscribed Changes 305
► Sinus lipomatosis
► Hypoechoic. nodular mass with ill-
defined margins
► Confined to the sinus echo complex
► Parenchymal-pelvic ratio shifted in
favor of renal sinus
► No vascularity
Bilateral
* Infected obstruction, abscess
► Infected obstruction
► Hypoechoic to anechoic area con-
forming to the pyelocaliceal system
and extending into the ureter
► No vascularity
Abscess, pyonephrosis
► Round or polygonal, nonhomogene-
ous mass, usually with ill-defined
margins
► No vascularity
► Parapelvic cysts, atypical cysts
► Multiple round to oval masses with
ill-defined margins
► Anechoic to hypoechoic (in small
cysts with flat bases)
► Echogenic walls
► Distal acoustic enhancement
► Frequently bilateral (always bilateral
with benign cystic lymphoma)
b Tumorlike nub of parenchyma ex-
tending into the central echo complex.
c Hypoechoic tumorlike transformation
of the sinus echo complex; no vascu-
larity in the mass. N = kidney.
d Renal pelvic abscess: hypoechoic
mass with ill-defined borders. Clinically,
the patient had poorly controlled dia-
betes. N ’ kidney.
e Atypical parapelvic cysts (z) with
septations (cystic carcinoma?); here,
benign cystic lymphoma.
9.5 Differential Diagnosis of Hypoechoic Masses in the Renal Sinus Echo Complex
► Renal pelvic carcinoma
9 Kidneys 306
► Hypoechoic mass in the central echo
complex
► Polygonal margins
► Detectable tumor vessels
f Liquefied area in a renal pelvic carci-
noma (cursors). Histology: urothelial
carcinoma.
► Renal cell carcinoma
► Well-demarcated mass that may be
hypoechoic» isoechoic, or hypere-
choic to the renal parenchyma
► Connection with cortical substance
► Detectable tumor vessels
g Renal cell carcinoma (T) that has in-
vaded the renal sinus and renal pelvis.
Perirenal abscess with gas bubbles (ar-
rows) in emphysematous pyelonephri-
tis. N = kidney.
► Malignant Lymphoma_____________________________________________________________________
Another hypoechoic renal tumor is malignant
lymphoma. It may occur as a diffuse hypo-
echoic or heterogeneous mass (high-grade
lymphoma) or as a smaller, circumscribed,
round or oval tumor (renal involvement by
low-grade lymphoma) (Figs. 9.72, 9.32, and
9.79).
< Fig. 9.72 Renal involvement by low-grade non-
Hodgkin lymphoma (cursors): elliptical hypoechoic
tumor as the junction of the renal sinus and paren-
chyma.
► Metastasis___________________________________________________________________________________
It is not uncommon for tumors to metastasize
to the kidney by the hematogenous route.
Metastases most often originate from the
breast, bronchi, or gastrointestinal tract, or
from the lymphogenous or hematogenous
spread of ipsilateral or contralateral renal can-
cers.
Renal metastases appear sonographically as
round, nodular, relatively homogeneous, hypo-
echoic masses located in the renal parenchyma
or the sinus echo complex (Fig.9.73).
a Fig. 9.73 Renal metastases.
a Metastasis (T) from small-bowel carcinoma, with
focal pyelectasis (PV).
a b Ipsilateral metastasis (LK) of renal cell carcinoma
(T). Round, isoechoic, homogeneous mass in the re-
nal sinus. N = kidney.
► Adenoma, Inflammatory Tumor-----------------------------------------------------------
Adenoma. Adenoma (classification in Table
9.6) is a benign, slow-growing renal tumor
that can reach considerable size. Regressive
changes are common, and progression to car-
cinoma can occur.
Sonographically, adenoma appears hypoe-
choic and nonhomogeneous but occasionally
a Fig. 9.74 Renal adenoma (CT. operation)
a Sharply circumscribed, very hypoechoic mass.
Based on ultrasound morphology, the fine echogenic
wall (arrows) is suggestive of a hemorrhagic cyst. N =
kidney.
a b Color Doppler shows subtle but constant vascular-
ity, ruling out a cyst or abscess in favor of a solid
mass.
a Fig. 9.75 Inflammatory tumor in the renal sinus com-
plex: elliptical mass with an irregular echo structure.
Histology identified the mass as tumor-simulating
vasculitis. Clinical presentation: dysplastic syndrome;
inflammatory lung tumor was detected incidentally;
operation. N = kidney.
may be hyperechoic. It has smooth margins.
No reliable sonographic criteria are available
(Fig. 9.74).
Inflammatory tumor. By contrast, inflamma-
tory tumors are rare lesions that tend have ill-
defined margins and a nonhomogeneous, hy-
poechoic structure (Fig. 9.75). Inflammatory
tumors in the sinus echo complex are virtually
indistinguishable from masses due to bacterial
inflammation, although the former show in-
tense vascularity on color duplex examination.
Circumscribed Changes
Complex Structure_______________________________________
► Anomalies, Malformations
► Diffuse Changes
т Circumscribed Changes
. !► Anechoic Structure
J► Hypoechoic or isoechoic
Structure
Complex Structure
Hyperechoic Structure
— ► Echogenic Structure
— ► Abscess, Pyonephrosis
► Xanthomatous Pyelonephritis
► Hematoma, Intracystic Hemorrhage
► Renal Cell Carcinoma, Cystic Renal Carcinoma, Malignant Lymphoma
► Abscess, Pyonephrosis_____________________________________________
Large abscesses and pyonephrosis present so-
nographically as an irregular mass that de-
stroys the normal renal architecture while
forming hyperechoic and hypoechoic areas.
They may contain bizarre, anechoic compo-
nents. The diagnosis is based on the clinical
presentation, fine-needle aspiration, CT, or the
histological analysis of surgical specimens
(Fig.9.61, 9.76, and В 11.3g-i in Chapter 11).
◄ Ftg. 9.76 Pyonephrosis: hypoechoic mass with ill-de-
fined margins, partially filled with echogenic material
(debris, inspissation).
► Xanthomatous Pyelonephritis____________________________________________
This is a subacute or chronic pyelonephritis in
which the usual pyelonephntic structural
changes are accompanied by the presence of
lipid-laden foam cells, granulomas, and giant
cells. At ultrasound, these elements (some-
times combined with focal urinary tract ob-
struction and phosphate stones) can produce
a heterogeneous mass that resembles a tumor.
► Hematoma, Intracystic Hemorrhage________________________________________________________________________
9 Kidneys 308
Depending on its stage, a hematoma may con-
tain anechoic to hyperechoic components that
create an irregular echo pattern. Intracystic
a Fig. 9.77 Intracystic hemorrhage.
a Large, sharply circumscribed, irregular structure
with cystic and solid components.
hemorrhage leads to a hypoechoic (rare), he-
terogeneous, or hyperechoic structure, raising
serious problems of sonographic differential
a b Color duplex shows no vascularity even at a low
pulse repetition frequency. This means that a tumor is
unlikely.
diagnosis, especially since renal carcinomas
also tend to bleed and may be masked by intra-
cystic hemorrhage (Figs. 9.77, 9.68, and 9.70).
a c Traumatic renal hematoma (H): isoechoic (to
slightly hyperechoic) mass causing circumscribed pa-
renchymal destruction and a bulge in the renal out-
line (arrows). N = kidney.
► Renal Cell Carcinoma, Cystic Renal Carcinoma, Malignant Lymphoma
Diffuse RCC, cystic renal cell carcinoma, and
high-grade lymphoma are additional lesions
that can acquire a heterogeneous echo texture
as they enlarge.
Predominantly regressive tumor changes in
the form of calcifications and cystic tumor
liquefaction determine the ultrasound appear-
ance of the affected kidneys. Anechoic ele-
ments may also represent displaced blood ves-
sels or focal obstructions of the pyelocaliceal
system (Figs. 9.78, 9.79, 9.55, and В 9.4).
Fig. 9.78 Cyst-associated renal cell carcinoma (ar-
rows). Histology: chromophobe clear-cell renal cell
carcinoma (pseudocystic transformation to cystic
RCC occurs only in clear-cell and papillary carcino-
mas).
a Nonhomogeneous, hyperechoic tumor areas ac-
companied by partially infiltrated, tumor-com-
pressed cysts with irregular margins. N = kidney.
* b Cyst-associated renal cell carcinoma: cystically
transformed (necrosis, hemorrhage, Z) clear cell car-
cinoma. Color duplex shows scant vascular signals.
Fig. 9.79 High-grade renal lymphoma (enlarged
view).
a Irregular mass with echo-free components (ob-
structive pyelectasis, P) and vascular structures
(arrow, A) along with intact, hypoechoic medullary
pyramids (MP).
* b Color Doppler: echo-free to hyperechoic areas
(arrows), irregular tumor vessels.
Hyperechoic Structure
— ► Renal Abscess, Carbuncle
► Hemorrhagic Cyst
► Renal Cell Carcinoma
► Angiomyolipoma
► Scars
► Renal Abscess, Carbuncles___________________________________________________________________
Circumscribed Changes 309
Renal abscesses, like hepatic abscesses, often
acquire a structure that is hyperechoic to the
normal parenchyma. Renal carbuncles are
staphylococcal abscesses that arise in the kid-
ney owing to hematogenous spread (Fig. 9.80).
a Fig. 9.80 Mass in the renal parenchyma (N) caused by
abscessation.
a Circumscribed mass with an echogenic border
(cursors).
a b Color Doppler shows an absence of vascularity in the
abscess structure (arrows), which is surrounded by
displaced normal parenchyma (N). The kidney is gen-
erally enlarged with a washed-out appearance. Patient
presented clinically with headache and septic fever.
► Hemorrhagic Cyst____________________________________________________________________
A hemorrhagic cyst can also show increased
echogenicity relative to the surrounding paren-
chyma. Hemorrhagic cysts, angiomyolipomas,
and renal cell carcinomas appear as almost
identical masses and are very difficult to dis-
tinguish from one another. A cyst always has
smooth margins. The sonographic features of
angiomyolipoma are listed in Table 9.7
(Fig. 9.68).
► Renal Cell Carcinoma________________________________________________________________
RCCs with a dense echo pattern are less common
than the isoechoic tumors cited above. Echo-
genic RCCs always raise formidable problems
of differential diagnosis. The lesion can be cor-
rectly identified by the appearance of its periph-
eral rim and fine internal vascularity or, if neces-
sary, by ultrasound-guided fine-needle aspira-
tion biopsy with cytological or histological anal-
ysis and/or CT scanning (Figs. 9.81 and 9.82).
a Fig. 9.81 Two renal tumors: the large tumor (T) is a
renal cell carcinoma (RCC), appearing as an oval mass
isoechoic or slightly hyperechoic to the renal paren-
chyma (N). It has a faint peripheral rim and creates an
outward bulge in the renal sinus. These features are
typical of RCC (and could justify surgery without fur-
ther testing). The second mass is a small, echogenic
tumor (arrow), most likely a benign nonepithelial tu-
a Fig. 9.82 Echogenic renal cell carcinoma (T). The dif-
ferential diagnosis includes angiomyolipoma, and
therefore CT should be performed.
a Transverse scan through the right upper quadrant
shows a sharply circumscribed, homogeneously
echogenic mass with a vascularized rim. N = kidney.
a b Flank scan reveals intratumoral vessels. The vascu-
lar rim and intratumoral vessels are consistent with
renal cell carcinoma, not angiomyolipoma. N = kid-
ney.
mor.
► Angiomyolipoma
9 Kidneys
Angiomyolipomas are a common type of be-
nign nonepithelial tumor. They contain thick-
walled vessels, smooth muscle, and fatty tissue
in vaiying proportions.
The tumor can confidently be diagnosed by
the fat attenuation observed on CT, but this
study is unnecessary when typical ultrasound
findings are present. The accuracy of CT is com-
promised by an absence of fat in some tumors
(< 10%). When characteristic ultrasound fea-
tures are noted (Table 9.7), the identity of the
lesion can be appreciated at once (Figs. 9.83
and 9.84).
Multiple, bilateral angiomyolipomas occur
in the setting of tuberous sclerosis (van Hip-
pel-Lindau syndrome). This disease is fre-
quently associated with clear-cell renal carci-
nomas, however, and so additional tests should
be performed (Fig. 9.85, Table 9.7).
Table 9.7 Sonographic features of angio-
myolipoma (after Helweg and Frauscher13)
► Hyperechoic mass
► Size 1-3 cm (occasionally > 5 cm)
► Globular shape
► No distal acoustic shadow
► Solitary occurrence (except in tuberous
sclerosis)
► Rarely causes a bulge in the renal
outline
► Detectable vascularity
► Multiple in 80% of patients with tuber-
ous sclerosis; only angiomyolipomas
associated with this condition may
undergo malignant transformation!
a Fig. 9.83 Angiomyolipoma (arrow) showing distinc-
tive sonographic features; echogenic intraparenchy-
mal tumor with a fine, reticular internal structure and
finely serrated contours. N = kidney; L = liver.
a Fig. 9.84 Angiomyolipoma. Changing the scan angle
demonstrates two additional echogenic tumors (ar-
rows). Multiple angiomyolipomas. often in both kid-
neys, occur in Bourneville-Pringle disease.
a Fig. 9.85 Color duplex shows here no detectable in-
ternal vascularity.
► Scars
“Scar" refers to any circumscribed, fibrous area
of postinflammatory or postinfarction contrac-
tion. The areas may be solitary or multiple and
tend to undergo focal calcification, producing
high-level entiy echoes with acoustic shadow-
ing. Scars may appear as linear or patchy le-
sions (a 9.6).
Cause. It can be difficult to establish a cause in
any given case (pyelonephritic abscessation,
stone-related, tuberculous, or secondary to
anemia or infarction), although funnel-shaped
scars most likely result from an old renal in-
farction (и 9.6a) while pyelonephritic scars
tend to have an irregular shape (a 9.6d).
Multiple wavy parenchymal notches and
rarefactions are characteristic features of pe-
ripheral renal arteriosclerosis in a setting of
long-standing hypertension (3 9.6b, c). These
cases show undulant thinning of the paren-
chyma with no overall decrease in renal size.
Rarely, sites of irregular scarring are also seen
in panarteritis nodosa.
Scars in the setting of chronic, nondestruc-
tive interstitial nephritis are diffuse and there-
fore produce an irregular renal surface with
indistinct outlines. Calcifications may occur.
True scars require differentiation from a pa-
renchymal notch in duplex kidneys, a medially
tilted scan plane through the renal hilum, and
fetal lobulations (и 9.6e and f, Fig.9.66a).
0 9.6 Scars and Parenchymal Notching
► Vascular scars
a Wedge-shaped infarction scar (ar-
rows) in a patient with absolute ar-
rhythmia in atrial fibrillation. P = pyelon.
b Vascular scar (arrows) with focal
thinning of the parenchyma. The pa-
tient presented clinically with advanced
atherosclerosis. N - kidney.
c Broad, echogenic atherosclerotic scar
extending focally through the entire
parenchyma (arrow) in a patient with
chronic hypertension and generalized
atherosclerosis. N = kidney.
И 9.6 Scars and Parenchymal Notching
► Postinflammatory scars and
differential diagnosis
d Pyelonephritic scar (arrow). Cystic
transformation of two medullary pyra-
mids and a calix (arrows), appearing as
“caliceal cysts” in the urogram.
e Broad, echogenic scar in the anterior
parenchyma following renal tuberculo-
sis.
f Anteroinferior notching of the pa-
renchyma (arrow): scan plane cuts the
renal hilum.
Circumscribed Changes
Echogenic Structure_____________________________________________________
2 ► Anomalies, Malformation5
&J4 J^TTiffuse Changes
Q 5 ▼ Circumscribed Changes
MS*Anech°lc Structure
i j Hypoechoic or Isoechoic
i’ I Structure
Complex Structure
!|> Hyperechoic Structure
►Echogenic Structure
► Papillary Calcification
► Interlobar and Arcuate Arteries
► Bacterial Gas Bubbles
► Parenchymal Calcification
► Nephrocalcinosis, Medullary Sponge Kidney
► Renal Tuberculosis, Putty Kidney
► Pyelocaliceal Stone, Staghorn Calculus
► Papillary Calcification___________________________________________________________________________________
Calcifications at the tips of the renal papillae
are characteristic findings in analgesic nephr-
opathy and diabetes mellitus. They appear only
as echogenic flecks on ultrasound survey scans,
where they often go undetected. They are
easily detected and identified in strongly mag-
nified views (Fig. 9.86).
« Fig. 9.86 Medullary (papillary) (MP) calcification (ar-
rows) with an acoustic shadow. Clinical presentation:
neglected type I diabetes.
► Interlobar and Arcuate Arteries_____________________________________________________________________
The renal artery itself, its branches in the renal
sinus, and the interlobar and arcuate arteries
tend to undergo atherosclerosis and calcifica-
tion in patients with longstanding hyperten-
sion (arteriolosclerosis would affect the
straight and interlobular arterioles arising
from the arcuate artery along with the more
distal afferent vessels and the postglomerular
efferent vessels).
< Fig. 9.87 Bright double echoes with a central, narrow
echo-free band (arrow). Atherosclerosis of the arcu-
ate artery at the base of the medullary pyramid (MP).
N = kidney.
9 Kidneys 312
Ultrasound will occasionally demonstrate
these thickened, echogenic vessels, some of
which have shadowing wall calcifications
(Figs. 9.87 and 9.88).
« Fig. 9.88 Extensive atherosclerosis of the small renal
arteries, close-up tangential parenchymal view in
pseudoxanthoma elasticum.
► Bacterial Gas Bubbles________________________________________________________________________________
Small, vesicular, hoodlike echogenic masses
may be observed in the setting of emphysem-
atous (bacterial gas-forming) pyelonephritis;
the shadowed region usually obscures the ab-
scess itself. These findings indicate an urgent
need for treatment (immediate broad-spec-
tium antibiotics or nephrectomy) due to exist-
ing or impending bacterial sepsis (Fig. 9.89 and
Fig. 9.67).
* Fig. 9.89 Hoodlike bacterial gas collection (arrows)
with associated reverberations. An actual abscess
cannot be identified. Sepsis, emergency surgery,
nephrectomy. N = kidney.
► Parenchymal Calcification________________________________________________________________________________
Parenchymal calcifications can have a variety of
causes. They may reflect an old focal pyelo-
nephritis, possibly in a setting of renal lithiasis,
as well as calcifications in diabetic nephro-
pathy or analgesic nephropathy. Some calcifi-
cations suggest a cystic etiology because of
their shape. Calcifications also occur in the set-
ting of tuberculosis (see below). Other calcifi-
cations develop as a sequel to old renal trauma,
and others remain unexplained (Fig. 9.90).
« Fig. 9.90 Broad scar with calcification (arrows) of
undetermined cause. Acoustic shadow (S)
► Nephrocalcinosis, Medullary Sponge Kidney_________________________________________________________
Nephrocalcinosis and medullary sponge kidney
are different renal diseases that are associated
with calcifications and have similar or identical
ultrasound appearances.
Medullary nephrocalcinosis (medullary
sponge kidney) is based on a dysontogenic dis-
order that can be broadly classified among the
cystic diseases. It is characterized by a cystic
dilatation of the collecting tubules in the renal
papillae, leading to stone formation (a cauli-
flower or rosette pattern is seen in the i.v.
pyelogram). Ultrasonography shows echo-
genic, rosettelike calcifications with acoustic
shadows in the medullary pyramids.
Cortical nephrocalcinosis is marked by calci-
fications of the parenchyma and medullary
pyramids and the formation of kidney stones.
Calcifications of the medullary pyramids are
the dominant feature. Nephrocalcinosis devel-
ops in a setting of hypercalcemia or tubular
acidosis. A calcium excess is common to both
disorders (increased supply or decreased tub-
ular reabsorption).
If caliceal stones and renal pelvic/ureteral
stones are also present, scans will show more
or less intense, anechoic areas of caliceal and
pelvic ectasia (Fig.9.91).
« Fig. 9.91 a Medullary nephrocalcinosis (renal tubular
acidosis): echogenic medullary pyramids (arrows)
and obstructive pyelocaliectasis (C) with multiple
renal pelvic and ureteral stones. N = kidney.
« b Medullary nephrocalcinosis: annular calcifications
in medullary pyramid projection (arrows). S = acous-
tic shadow
► Renal Tuberculosis, Putty Kidney
Advanced stage III ulcerocavernous urogenital
and renal tuberculosis leads to ulcerative, cav-
ernous destruction of renal caliceal groups
with stasis, calcifications, and the spread of
caseous tuberculosis through the kidney.
The renal changes are impressive, and nor-
mal renal architecture is not observed. The
ultrasound findings are diverse, with shadow-
ing lesions of varying echogenicity that corre-
late with inspissated, calcified necrotic mate-
rial and scar tissue (Figs. 9.92-9.94).
Circumscribed Changes
* Fig. 9.92 Renal tuberculosis: focal parenchymal calci-
fications (arrows) around a presumably destroyed
medullary pyramid (see also Fig. 9.60).
л Fig. 9.93 Renal tuberculosis: calcifications (arrows,
acoustic shadow S), cavernous cysts (Z). N = kidney.
a Fig. 9.94 Putty kidney (following tuberculosis): dif-
fuse calcifications, acoustic shadow (S). An actual
renal structure is not defined (N, cursors). L = liver.
► Pyelocaliceal Stone, Staghorn Calculus_______________________________________________________________
Pyelocaliceal stones or staghorn calculi are
easily diagnosed with ultrasound, which dem-
onstrates the bright stone-surface echoes and
associated shadows that are typical of stones
and calcifications. Occasionally the stones are
so small that their presence is revealed only by
an acoustic shadow. This introduces a degree of
uncertainty, as the shadowing focus may rep-
resent a vascular calcification.
Staghorn calculi in the renal pelvis may ex-
hibit various shapes, depending on the orien-
tation of the scan plane. If the scan is directed
through the greatest width of the lenal pelvis,
it will display a broad, hard linear echo with an
equally broad acoustic shadow. But if the plane
cuts portions of the stone in the calices, multi-
ple echoes and acoustic shadows will be seen
(Figs. 9.95 and 9.96; see also Chapter 11).
Some small stones may be missed within the
bright reflections of the sinus echo complex. A
helpful guide in these cases is the “twinkling
a Fig. 9.95 Staghorn calculi in the renal pelvis with cir-
cumscribed pyelocaliectasis: multiple high-ampli-
tude stone echoes (arrow) and acoustic shadows
(S). N = kidney.
artifact” seen in color duplex scanning. It con-
sists of red and blue color artifacts appearing
within the shadow cast by calcified renal
stones (or calcium stones in general;
a Fig. 9.96 Small atrophic kidney (N, cursors) due to
renal pelvic stones or (unlikely here) multiple calcifi-
cations. Acoustic shadows (S). Excretory urogram
showed a silent kidney with no focal opacities (urate
stones?).
Figs.4.46 and 4.47 in Chapter 4). Reportedly,
this phenomenon is seen even with very small
stones7.
References
1. Banholzer P, Haslbeck M, Mehnert H. Sonogra-
phische GroBenveranderungen der Nieren bei
Typ-I-Diabetes als Fruherkennungsmethode der
diabetischen Nephropathie. Ultraschall
1988;9:255-9.
2. Bonhof JA, Meairs SP, Wetzler H. Duplex- und
Farbdoppler-sonographische Kritrien von Niere-
narterien-Stenosen. Ultraschall Klin. Prax. 1990;
5: 187.
3. Bruhl P, Schafer M. Fehlbildungen und spezielle
Erkrankungen. In: jocham D, Miller К (eds.).
Praxis der Urologie. Stuttgart: Thieme 1994.
4. Hofmann R, Schiitz R, Leyh H, Braun J. Sonogra
phischer Nachweis von Nierenvenen- und Vena-
cava-Thrombosen beim Adenokarzinom der
Niere. Ultraschall 1985:6.312-5.
5. Hricak H, Cruz C, Romanski R et al. Renal paren-
chymal disease: sonographic-histologic correla-
tion. Radiology 1982;144:141-7.
6. Hust W, Preim D, Bundschuh H. Parenchym-Pye-
lon-lndex. Eine wertvolle Hilfe in der Beurteilung
renaier Erkrankungen. In: Rettenmaier G (eds.).
Ultraschalldiagnostik in der Medizin. Stuttgart:
Thieme 1981.
7. Klauser A, Pallwem L, Frauscher F, Helweg G,
Peschel R, Debus J. Die Wertigkeit des farbdop-
plersonographischen „Twinkling-Artefakts" in
der Diagnostik der Nephrolithiasis. 24th
Dreilandertreffen der OGUM, DEGUM, SGUM.
Vienna 2000.
8. Mogensen CE. Diabetes melhtus and the kidney.
Kidney Int 1982;21:673-5.
9. Mostbeck G, Derfler K. Walter R, Herold Ch, Mal-
lek R, Tscholakoff D. Sonographie bei terminaler
Niereninsuffizienz - atiologische Ruckschliisse?
Ultraschall 1988;9.
10. Mostofi FK, Davis CJ. Histological Typing of Kid-
ney Tumours. 2nd ed. Berlin: Springer 1998.
11. Riede UN, Werner H. Nieren In: Riede UN,
Schaefer HE (eds.). Allgemeine und spezielle
Pathologie. Stuttgart: Thieme 1995.
12. Takebayashi S. Aida N. Matsui K. Arteriovenous
malformations of the kidney: diagnosis and fol-
low-up with color Doppler sonography in six
patients. Am J Roentgenol 1991;157:991-5.
13. Ultraschall 2000; 24. Dreilandertreffen SGUM/
DEGUM/OGUM Wien 2000.
14. Van Campenhout J. Patriquin H. Malignant mi-
crovasculature in abdominal tumors in children:
Detection with Doppler US. Radiology 1992:183:
445-448.
Adrenal Glands 317
▼ Enlargement
7 ► Anechoic Structure
— ► Adrenal Cyst
— ► Intra-adrenal Hemorrhage
— ► Adrenal Abscess
*—► Cystic Tumor
► Hypoechoic Structure
0 Adrenal Gl
— ► Hyperplasia
— ► Adenoma
— ► Metastasis
— ► Lymphoma
— ► Adrenal Carcinoma
— ► Incidentaloma
► Complex Echo Structure
—-► Metastasis
— ► Pheochromocytoma
---► Carcinoma
► Hyperechoic Structure
— ► Lipoma. Myelolipoma
— ► Calcification
— ► Metastasis
— ► Pheochromocytoma
— ► Neuroblastoma
7 0 Adrenal Glands
D. Nuernberg
Anatomy_______________________________________________________________________
The adrenal glands are small, caplike glandular
organs situated in close proximity to the kid-
neys. Often these "suprarenal” glands are in-
correctly looked for above the kidneys, but the
term "adrenal" correctly implies that each
gland is predominantly medial to the upper
pole of the associated kidney. The right adrenal
gland has a linear or V shape, while the left
adrenal gland is more V- or Y-shaped. The
wings of each gland are 2-3 cm long and
6-8 mm thick. Their function is hormone pro-
duction. The adrenal cortex secretes cortisol,
aldosterone, and sex hormones, while the
adrenal medulla secretes epinephrine and nor-
epinephrine.
Shape
► Right: linear or V-shaped
► Left: V- or Y-shaped
Size
► Wings are 2-3 cm long and 6-8 mm
thick.
70 Adrenal Glands
Ultrasound Topography_________________________________________________________
Landmarks
► Right side: kidney and inferior vena cava
► Left side: aorta, lower pole of spleen,
upper pole of kidney
Visualization
► Right side: subcostal flank scan or oblique
scan
► Left side: intercostal flank scan through
the spleen
* Fig. 10.1 Cross-sectional diagram at the level of the
adrenal glands. The adrenal glands are the Y-shaped
structures lying anteromedial to the kidneys. Pa =
pancreas; rK = right kidney: IK = left kidney; A = aorta;
V = inferior vena cava; SC = spinal column.
a Fig. 10.2 Diagram of the adrenal glands showing
their relations to neighboring organs.
The adrenal glands aie located within the ret-
ropentoneum. The right adrenal gland lies
superomedial to the right kidney and postero-
lateral to the inferior vena cava. These are the
principal landmarks on the right side. Typically
the right adrenal gland is visualized behind the
right lobe of the liver and anterior to the infe-
rior (lumbar) crus of the diaphragm. The most
favorable planes for ultrasound scanning are a
right subcostal flank scan or oblique subcostal
scan.
The left adrenal gland is inherently more
difficult to scan than the right because it lacks
the acoustic window of the liver and is ob-
scured by air in the stomach. It is imaged
with an intercostal flank scan directed through
the spleen. The key landmarks are the aorta
medially and the lower pole of the spleen or
upper renal pole laterally.
Not infrequently, the adrenal glands extend
down to the level of the renal hilum. Besides
a Fig. 10.3 The adrenal region is the space located pos-
terior to the right lobe of the liver, lateral to the vena
cava, and medial to the right kidney.
the kidneys, they are bordered by the liver and
inferior vena cava on the right side and by the
aorta and tail of the pancreas on the left side
(Figs. 10.1 and 10.2). The adrenal region on
each side appears as a triangular echogenic
a Fig. 10.4 In transverse section the adrenal region is
posterior to the right lobe of the liver and medial to
the right kidney. It is an echogenic area in which the
gland itself is often not visualized.
area bordered by the landmarks noted above
(Figs. 10.3 and 10.4).
10 Adrenal Glands 318
Ultrasound Morphology_________________
The normal adrenal glands are difficult to vis-
ualize with ultrasound. This requires good
scanning conditions, a high-resolution trans-
ducer, and a meticulous examination by a
knowledgeable sonographer. It is more accu-
rate, then, to speak of evaluating the “adrenal
region" rather than the glands themselves. CT
can consistently define the normal-size adrenal
glands, giving this study a priority role in the
primary imaging of these structures.
a Fig. 10.5 a Normal adrenal gland of an infant, con-
sisting of a hyperechoic medulla and hypoechoic cor-
tex.
Table 10.1 Sonographic features of adrenal diseases with or without endocrine symptoms
(after reference 8)
Sonographic appearance
Diseases with endocrine symptoms
a b Medial to the upper pole of the right kidney is a
sharply circumscribed, hypoechoic mass: typical
adrenal incidentaloma.
Addison disease Adrenal atrophy not detectable with ultrasound; possible calcifications as evidence of prior tuberculosis
Conn disease Unilateral adenomas, usually < 2 cm, not detectable with ultrasound
Cushing syndrome In 80% of cases, bilateral hyperplasia due to pituitary (75%) or paraneoplastic (5%) ACTH overproduction; hyperplasia is usu- ally not detectable with ultrasound
Pheochromocytoma Can be localized with ultrasound in 80-90% of cases; extra- adrenal location is difficult, usually prevents identification
Diseases without endocrine symptoms
Adrenal adenoma Most common solid mass
Adrenal carcinoma Often quite large (several centimeters) despite absence of symptoms; sometimes detected incidentally at ultrasound
Adrenal metastases Common with bronchial carcinoma, malignant lymphoma, breast cancer, renal cancer, pancreatic cancer, and melanoma
Adrenal tumors and cysts Detectable at 1-1.5 cm on the right side, at 1.5-2 cm on the
left side
When the normal adrenal glands can be
defined with ultrasound, they present a nar-
row. oblong shape with a hypoechoic cortex
and medulla. The adrenal glands can almost
always be visualized in newborns. The physio-
logical hypertrophy at this stage of life results
in relatively large glands that are easily identi-
fied at ultrasound and show clear corticome-
dullary differentiation (Fig. 10.5a).
In adults, however, the adrenal glands are
usually visualized only when they are enlarged.
Some types of enlargement have pathological
significance. Diseases of the adrenal glands
may or may not be associated with endocrine
symptoms (Table 10.1). Examination of the
adrenal region is indicated for the staging of
oncological disease and in endocrinological in-
vestigations. Adrenal abnormalities are often
detected incidentally, however. In the absence
of an underlying disease, an incidentally de-
tected solid adrenal mass is called an inciden-
taloma (Fig. 10.5b).
Enlargement
As mentioned, only enlarged adrenal glands
can be clearly visualized with ultrasound.
Anechoic Structure__________________________________________________________
► Adrenal Cyst
► Intra-adrenal Hemorrhage
► Adrenal Abscess
► Cystic Tumor
Masses adjacent to the adrenal glands. An-
echoic adrenal masses require differentiation
from anechoic structures that are located near
the gland but are not related to it. These in-
clude the following:
► Renal cysts
► Pancreatic pseudocysts
► Splenic vessels
Renal cysts. Parietal cysts located in the upper
pole of the kidney are particularly apt to be
Fig. 10.6 Pancreatic tail pseudocysts are clearly vi-
sualized with transsplenic ultrasound and require
differentiation from upper renal cysts and adrenal
cysts. Diagnosis is aided by the history and ultra-
sound-guided fine-needle aspiration.
< Fig. 10.7 A cystic, septated mass medial to the left
kidney is localized to the pancreatic tail, not the left
adrenal gland. Imaging and ultrasound-guided fine-
needle aspiration identify the lesion as a cystadeno-
carcinoma of the pancreas.
mistaken for adrenal cysts. They are distin-
guished by defining the relation of the cyst to
the renal parenchyma.
Pancreatic pseudocysts and tumors. Pancre-
atic pseudocysts often form in the retroperito-
neum following acute pancreatitis. The con-
tents of the cysts may be completely anechoic,
and the wall is usually irregular (Fig. 10.6).
Fine-needle aspiration and laboratory analysis
demonstrate high levels of pancreatic enzymes.
Cystadenocarcinoma of the pancreas can also
be a source of confusion (Fig. 10.7).
Splenic vessels. Tortuous and ectatic splenic
vessels can mimic a cystic mass in the adrenal
region. Shunt vessels in portal hypertension
(e.g., secondary to splenic vein thrombosis)
can also assume bizarre shapes.
tn
Enlargement
► Adrenal Cyst____________________________________________________________________________
A cyst of the adrenal region is anechoic, has
smooth margins, and shows distal acoustic en-
hancement. Its extent is variable. True cysts
have regular walls and are filled with serous
material (Fig. 10.8).
Most cystic masses in the adrenal region are
secondary cysts that develop following pan-
creatitis, hemorrhage, or inflammation.
The greater mobility of adrenal cysts serves
to differentiate them from hepatic cysts in the
right adrenal region. Lack of contact with the
renal parenchyma distinguishes them from a
cyst of the upper renal pole.
a Fig, 10.8 a Round, sharply circumscribed, echo-free
mass located medial to the spleen and cranial to the
left kidney: adrenal cyst. Ultrasound-guided fine-
needle aspiration excluded pancreatic cyst, hemor-
rhage, etc.
a b Typical cystic criteria: echogenic wall, echo-free
contents, and distal acoustic enhancement character-
ize the adrenal cyst
► Intra-adrenal Hemorrhage________________________________________________________________________
Bleeding into an adrenal gland is anechoic in its
early stage. It can occur in newborns due to
obstetric trauma, hypoxia, or coagulation dis-
orders. Intra-adrenal hemorrhage may corre-
late clinically with adrenal insufficiency. A
large central hemorrhage (adrenal apoplexy)
consistently leads to marked enlargement of
the gland (Fig. 10.9). An older hemorrhage be-
comes increasingly echogenic over time and
may eventually be completely absorbed. Differ-
entiation is required from partially cystic neu-
roblastomas in small children.
Up to 25% of patients who sustain blunt
abdominal trauma are discovered to have hem-
atomas in the adrenal region. They also occur in
patients on anticoagulant medication and can
lead to hypocortisolism (Addison disease).
a Fig. 10.9 Echo-free intra-adrenal hemorrhage in a
newborn.
► Adrenal Abscess
10 Adrenal Glands 320
An abscess of the adrenal glands is rarely an-
echoic. It is usually hypoechoic or has a com-
plex echo structure. When the contents are
anechoic, the clinical and laboratory findings
can differentiate the lesion from an ordinary
cyst. The wall is irregular, and distal acoustic
enhancement may be present (Fig. 10.10).
< Fig. 10.10 Adrenal abscess. Circumscribed hypoe-
choic structure in the right adrenal region. Typical
inflammatory laboratory findings. Ultrasound-
guided fine-needle aspiration yielded pus.
► Cystic Tumor____________________________________________________________________________________________
A cystic tumor may be anechoic in rare cases,
but usually it is hypoechoic. The walls are ir-
regular in thickness and outline (some solid
elements) (Fig. 10.11).
* Fig.10.11 Hypoechoic, partly cystic, predominantly
solid tumor in the right adrenal gland: adrenal meta-
stasis from bronchial carcinoma.
Hypoechoic Structure_________________________________________________
► Hyperplasia
► Adenoma
► Metastasis
► Lymphoma
► Adrenal Carcinoma
► Inddentaloma
► Hyperplasia__________________________________________________________________________________
Hyperplastic adrenal glands are usually hypo-
echoic. especially in the cortical zone. They
appear plump and elongated, may show low-
level nodular echoes, and usually are only mod-
erately enlarged (Fig. 10.12). Adrenal hyperpla-
sia can occur, for example, as an adaptive re-
sponse in ACTH-dependent Cushing syndrome.
It may have a paraneoplastic cause, or it may
occur in hyperaldosteronism. The hyperplasia
is bilateral in most cases. The adrenal glands
are poorly demarcated from their surround-
ings. Again, CT provides a better view of the
hyperplastic adrenal glands, which usually can-
not be detected with ultrasound.
a Fig. 10.12 a Hypoechoic enlargement of the adrenal
glands, identified as bilateral adrenal hyperplasia.
a b The hyperplastic adrenal gland is enlarged to ap-
proximately 2.5 cm. Affected glands may retain their
normal triangular shape or may be rounded.
► Adenoma------------------------------------------------------------------
Adenomas are uniformly hypoechoic with
smooth margins and a round to oval shape,
although some lesions have scalloped borders
(Fig. 10.13). Adenomas occasionally have a non-
homogeneous appearance. Autopsy statistics
indicate that they are quite common
(10-20%), but most adenomas (90%) produce
no endocrine symptoms and are too small to be
seen with ultrasound. The average size of 23
operated adenomas in one study was 1.5 cm l,
although they may exceed 5 cm in diameter.
Adenomas are bilateral in a small percentage
of patients. Functioning and nonfunctioning
adenomas are indistinguishable by their sono-
graphic features.
гм
a Fig. 10.13 a Large, very hypoechoic. sharply circum-
scribed mass above the right kidney. Typical adrenal
adenoma. If the gland measures more than 5 cm in
diameter, laparoscopic adrenalectomy should be per-
formed.
a b Hypoechoic, sharply circumscribed adenoma of
the right adrenal gland discovered at routine ultra-
sound (confirmed by ultrasound-guided fine-needle
aspiration).
a c Scant vascularity on color Doppler.
c
E
ф
?
о
c
LU
► Metastasis___________________________________________________________________________________
With their rich blood supply, the adrenal
glands are the fourth most frequent site for
hematogenous metastasis. Metastases to the
adrenal glands account for the majority of solid
adrenal tumors. These lesions are less homoge-
neous than adenomas and often have irregular
margins (И 10.1). The most common primaries
are bronchial carcinoma (15-25%) and breast
carcinoma. Other possible sources are renal
carcinoma, gastric carcinoma, pancreatic carci-
noma, and malignant melanoma. Adrenal
metastases are bilateral in up to 30% of cases,
and this can produce the clinical manifesta-
tions of Addison disease. Bionchial carcinoma
is virtually the only tumor that is associated
with isolated adrenal metastases.
0 10.7 Adrenal Metastases
► Primary tumors that can
metastasize to the adrenal
glands
► Bronchial carcinoma
► Breast carcinoma
► Renal carcinoma
► Pancreatic carcinoma
► Malignant lymphoma
c Large hypoechoic, partially irregular
metastasis from bronchial carcinoma
on the left side, imaged by scanning
through the spleen.
a and b Longitudinal and transverse scans of an enlarged, hypoechoic adrenal gland
with metastatic bronchial carcinoma. The original shape of the gland (triangular or
cowl-shaped) is largely preserved.
d Irregularly marginated tumor of the
right adrenal gland located posterior to
the right lobe of the liver: metastatic
colon carcinoma.
e Metastases are generally hypovascu-
lar in the color Doppler image, whereas
adrenal adenomas may be hypervascu-
lar. Metastatic tumor of the right adre-
nal gland.
f Left and right adrenal metastases
from bronchial carcinoma Negative on
color Doppler
► Lymphoma
10 Adrenal Glands 322
The adrenal region is a rare extranodal site of
occurrence for lymphoma. Foci of lymphoma-
tous infiltration have smooth borders and are
hypoechoic (Fig. 10.14). Differentiation is re-
quired from lymphomas in the renal hilum
(a9.2i, p.297). If invasion by lymphoma is
suspected, other nodal stations should be
scanned and commonly infiltrated organs
should be closely scrutinized.
« Fig. 10.14 Perisplenic lymphoma in the left adrenal
region of a patient with В-cell lymphoma.
► Adrenal Carcinoma__________________________________________________________________
Adrenal carcinoma is usually hypoechoic with
irregular margins. It frequently infiltrates its
surroundings, and metastases can be demon-
strated in the adrenal region and in other or-
gans (e.g., the liver) (Fig. 10.15).
< Fig. 10.15 Adrenal carcinoma may be hypoechoic or
may have a complex echo structure. Usually it is
relatively large when diagnosed (in this case 8 cm x
9 cm) and has irregular margins.
► Incidentaloma______________________________________________________________________________
An incidentaloma is an adrenal tumor that is
detected incidentally in an asymptomatic pa-
tient. Incidentalomas are found in 1% of CT
examinations. They are much less common in
ultrasound examinations, if only because of the
difficulty in defining small lesions (Fig. 10.16).
The predominantly hypoechoic tumors listed
in Table 10.2 account for the great majority of
incidentalomas. Figure 10.17 shows the algo-
rithm used in the investigation of incidentalo-
mas. The recommended endocrine work-up is
detailed in Table 10.3. In some cases, ultra-
sound-guided fine-needle aspiration can also
aid in the evaluation of incidentalomas
(Fig. 10.18).
Hypoechoic tumors of the adrenal region
require differentiation from other masses in
that region such as a renal tumor (Fig. 10.19),
accessory spleen (Fig. 10.20), lymphoma (Fig.
10.21), and gastric folds.
Table 10.2 Pathological classification of incidentalomas (n = 172) (after reference 8)
Diagnosis n %
Nonfunctioning adrenal adenoma 134 77.9
Cortisol-producing adenoma 14 8.1
Aldosteronoma 1
Adrenal carcinoma (aldosterone-forming) 1
Pheochromocytoma 5 2.9
Adrenal cyst 5 2.9
Myelolipoma 6 3.5
Ganglioneuroma 2
Neurilemoma 1
Hypernephroma 1
Metastasis (thyroid carcinoma) 1
a Fig. 10.16 a Approximately 5 cm hypoechoic mass
above the right kidney: typical incidentaloma without
associated symptoms, detected at routine upper ab-
dominal ultrasound. Histology identified the lesion as
an adrenal adenoma (most common incidentaloma).
Fig. 10.17 Algorithm for investigating an adrenal in-
cidentaloma (after reference 8)
a b Hypoechoic tumor detected incidentally in the
right adrenal region. Because of its irregular margins,
biopsy was performed. Result: metastasis from a pre-
viously undiagnosed bronchial carcinoma.
a Fig.10.18 Algorithm for “sonographic” adrenal tu-
mors and the use of ultrasound-guided fine-needle
aspiration (UFNA) (after reference 4).
Ultrasound-guided Fine-needle Aspi-
ration of an Adrenal Lesion
Given the frequency of incidentally de-
tected adrenal tumors, every case should
undergo an initial endocrine work-up. If
the tumor cannot be positively identified
by laboratory tests and imaging (ultra-
sound, CT), ultrasound-guided fine-needle
aspiration (UFNA) can supply a diagnosis in
cases requiring treatment. The sensitivity
of adrenal UFNA is between 90% and 95%.
UFNA can furnish material for cytological
or preferably histological analysis with a
relatively low risk of complications. The
procedure is performed in a lateral posi-
tion. Access is more favorable for a right-
sided lesion than a left-sided lesion, and
the complication rate is also somewhat
higher on the left side. UFNA is particularly
indicated for the oncological investigation
of tumors larger than 3 cm (Fig. 10.18).
Enlargement 323
a Fig. 10.19 Differential diagnosis: small, solid tumor
on the upper pole of the left kidney. This lesion is
definitely related to the kidney. Renal carcinoma.
Fig. 10.20 A rounded mass having the same echo-
genicity as the spleen is sometimes found in the
splenic hilum or at the inferior border of the spleen.
It is not a left adrenal mass but an accessory spleen.
< Fig. 10.21 Transsplenic scan of a large, hypovascular
tumor.
Table 703 Endocrine laboratory work-up of adrenal incidentaloma (after reference 8)
10 Adrenal Glands 324
Initial work-up
Mandatory
Optional
► Free catecholamines in 24 h urine
► Serum cortisol in dexamethasone suppression test (1 mg)
► Plasma renin activity after 30 min rest period
► Potassium excretion in 24 h urine
Extended work-up if initial findings are abnormal
Preclinical Cushing syn-
drome
Conn syndrome
► High-dose dexamethasone suppression test (8 mg)
► CRH stimulation test
► Aldosterone-18-glucuronide in 24 h urine
► Plasma renin activity and aldosterone at rest and orthostasis
► Selective renal vein catheteri ation with bilateral blood sampling for aldosterone and cortisol in adrenal
venous blood
Complex Echo Structure______________________________________________________
— ► Metastasis
► Pheochromocytoma
► Carcinoma
► Metastasis___________________________________________________________________________________
Metastases are the adrenal tumors that are
most frequently detected by ultrasound. Their
appearance can be very diverse. Some metasta-
ses have a complex, nonhomogeneous echo
structure and irregular margins (Figs. 10.22-
10.24). The most common primary tumor is
bronchial carcinoma. Other primary tumors
have been mentioned above.
* Fig. 10.22 Metastasis from advanced renal cell carci-
noma in a left transsplenic scan. Complex internal
structure.
a Fig. 10.23 Metastasis from bronchial carcinoma
a Large, triangular mass with a complex echo struc-
ture located above the right kidney.
a b Transverse scan shows a metastasis with a complex
echo structure “wedged" between the kidney, infe-
rior vena cava, right lobe of the liver, and spinal
column.
a Fig. 10.24 Large metastasis from bronchial carci-
noma on the right side, with a very nonhomogeneous
internal structure. Solid components are seen along
with liquid areas.
► Pheochromocytoma----------------------------------------------------------------
Pheochromocytoma is a tumor of the adrenal
medulla that is generally detected sonograph-
ically (80-90% of cases) following the appear-
ance of clinical symptoms (hypertension and
tachycardia caused by increased catecholamine
secretion). Most pheochromocytomas are al-
ready several centimeters in diameter when
diagnosed. They have smooth margins, a round
shape, and a nonhomogeneous or complex
echo structure. Hypoechoic liquid components
are also observed. A spectrum of appearances
may be seen (Figs. 10.25 and 10.26). Pheochro-
mocytomas are bilateral in approximately 10%
of cases and extra-adrenal in 10-20%. The
“Zuckerkandl organ” should be looked for at
the level of the origin of the inferior mesenteric
artery, anterior to the aorta. Other extra-adre-
nal sites are the renal hilum, bladder wall, and
thorax. Pheochromocytoma is occasionally
seen posterior to the renal vein in transverse
scans.
Rarely, pheochromocytoma is diagnosed in
the setting of multiple endocrine neoplasia
(MEN). From 2% to 5% of pheochromocytomas
are malignant.
Owing to the risk of inciting a hypertensive
crisis, fine-needle aspiration biopsy should def-
initely be avoided when a pheochromocytoma
is suspected.
Enlargement 325
a Fig. 10.25 Pheochromocytoma.
a Nonhomogeneous tumor with a hyperechoic cen-
ter (positive endocrine test, increased catecholamine
secretion).
a b Large, functionally active pheochromocytoma
(7.3 cm in diameter). The lateral scan bypasses the
relatively hyperechoic tumor core
a Fig. 10.26 Small, functionally active pheochromocy-
toma only 3 cm in diameter. Typical hyperechoic in-
ternal structure.
► Carcinoma____________________________________________________________________________
Adrenal carcinoma is a very rare (1:17 million),
highly malignant tumor with a poor prognosis.
Carcinomas have a hypoechoic to complex
echo structure that is usually nonhomogene-
ous. The tumors have irregular margins and
may infiltrate their surroundings. Adrenal car-
cinoma is indistinguishable sonographically
from a metastasis, although the visualization
of additional tumors can advance the differen-
tial diagnosis. Most adrenal carcinomas are
hormone-producing. The tumor is usually de-
tected only after it has reached considerable
size (often > 8 cm). Intratumoral hemorrhage,
necrotic foci, and calcifications may occur, add-
ing to the variegated appearance (Fig. 10.15).
Hyperechoic Structure___________________________________________________
▼ Enlargement
► Anechoic Structure
Hypoechoic Structure
Complex Echo Structure
► Hyperechoic Structure
► Lipoma, Myelolipoma
► Calcification
► Metastasis
► Pheochromocytoma
► Neuroblastoma
► Lipoma, Myelolipoma
10 Adrenal Glands 326
Lipoma. A pure lipoma of the adrenal glands
has smooth margins and high, homogeneous
echogenicity. In contrast to the mixed tissues of
myohpoma, posterior acoustic shadowing does
not occur. Lipoma is rare and shows no prolif-
erative tendency.
Myelolipoma. Adrenal myelolipoma has
smooth margins and a homogeneous hyper-
echoic structure (but it may also be heteroge-
neous or hypoechoic depending on the medul-
lary component) and it is well delineated; large
fatty areas are defined by CT7 (Figs. 10.27 and
10.28). It resembles a renal angiomyolipoma in
its sonographic features. Posterior acoustic
shadowing is often present. Malignant trans-
formation is not known to occur. The tumor
consists histologically of fat and bone marrow
tissue (hematopoietic cells and reticular cells).
Intratumoral hemorrhage and calcifications
may be seen.
a Fig. 10.27 Homogeneous, sharply circumscribed, hy-
perechoic tumor adjacent to the right kidney Classic
adrenal lipoma.
a Fig. 10.28 Hyperechoic, homogeneous tumor above
the right kidney represents a myelolipoma of the
adrenal gland. Differentiation is mainly required
from a renal angiomyolipoma.
► Calcification__________________________
Complete or partial calcification of the adrenal
glands is characterized by a typical echo com-
plex with a posterior acoustic shadow. Calcifi-
cations can result from a retained intra-adrenal
hemorrhage or prior inflammatory process
(e.g., tuberculosis). Patients occasionally show
the clinical manifestations of Addison disease.
Calcifications can also develop in tumors, how-
ever (carcinoma, metastases, pheochromocy-
toma, adenoma).
► Metastasis
Metastases can have a variety of ultrasound
appearances, including high echogenicity.
They tend to have irregular margins and a non-
homogeneous internal structure (Figs. 10.29-
10.32). The most common primary tumor is
bronchial carcinoma, which is associated with
adrenal metastases in up to 25% of cases.
< Яд. 10.2Э Hyperechoic, relatively homogeneous
metastasis from breast carcinoma.
a Fig. 10.30 Large, hyperechoic, nonhomogeneous tu-
mor of the left adrenal gland: adrenal metastasis
from bronchial carcinoma (cursor 1). The less echo-
genic mass in the spleen is a splenic metastasis (cur-
sor 2).
а Яд. 10.31 Longitudinal scan shows a nonhomogene-
ous, hyperechoic tumor above the nght kidney: meta-
stasis from bronchial carcinoma.
а Яд. 10.32 An adrenal metastasis (e.g., bronchial car-
cinoma) can also appear hyperechoic, but it usually
has a nonhomogeneous internal structure with irreg-
ular margins.
► Pheochromocytoma
Pheochromocytomas typically have a complex
echo structure with hypoechoic elements, but
some appear hyperechoic. The descriptions
presented earlier under "Complex Echo Struc-
ture” also apply to the hyperechoic valiant.
► Neuroblastoma
Neuroblastoma, like pheochromocytoma, arises
from cells of the adrenal medulla. Next to Wilms
tumor, it is the most common malignant ab-
dominal tumor in children. Approximately
70% of neuroblastomas are located in the adre-
nal glands, the rest occurring at other sites in the
sympathetic chain. Most neuroblastomas are
very large and predominantly hyperechoic.
Some may have cystic elements (due to hemor-
rhage) and calcifications. Laboratory tests usu-
ally show an increase in catecholamine secre-
tion.
Considerably less common are benign neural
tumors such as ganglioneuromas. They have
been described only sporadically in the adrenal
glands, occurring more commonly in the pos-
terior mediastinum and at paravertebral sites.
References
1. Allolio B, Schulte HM. Praktische Endokrinologie.
Munich: Urban & Schwarzenberg 1996.
2. Braun B. Nebennieren. In: Braun B, Gunther R,
Schwerk WB. Ultraschalldiagnostik. Lehibuch
und Atlas. Landshut: Ecomed 1983.
3. Burton S, Ros PR. Adrenal Glands. In: Stark D,
Bradley WG (eds.). Magnetic Resonance Imaging.
Mosby 1999.
4. Frohlich E, Rufle W, Strunk H, Struckmann G,
Seeliger H. Stellenwert der Feinnadelpunktion bei
Nebennierentumoren. Ultraschall in Med
1995;16:90-3.
5. Gorg C. Schwerk WB, Bittinger A, Euer B, Gorg K.
Sonographisch gesteuerte Feinnadelpunktion
von Nebennierentumoren. DMW
1992;117:448-54.
6. Gunther R. Sonographie der Nebenmeienerk-
rankungen. Radiologe 1986;26:174.
7. Rao P„ Kenney P, Wagner B, Davidson A. Imaging
and pathological features of myelolipoma. Ra-
diographics 1997;17;1373-85.
8. Reincke M, Allolio В Das Nebenniereninzidenta-
lom Dtsch. Arztebl. 1995;92:A764-A770.
9. Schmidt G. Ultraschall-Kursbuch. Stuttgart:
Thieme 2004.
333
Urinary Tract 331
333
334
► Caliceal and Ureteral Diverticula
► Megacalicosis
—- ► Aberrant Arteries
► Megaureter
---► Ureteropelvic Junction Obstruction
r Dilated Renal Pelvis and Ureter
336
► Anechoic
336
— ► Pyelectasis
— ► Subpelvic Ureteral Stenosis
— ► Urinary Stone Colic
— ► Chronic Urinary Stasis
—► Retroperitoneal Fibrosis
(Ormond Disease)
---► Reflux
Hypoechoic
342
— ► Hemorrhage (Traumatic, Clot)
► Infected Obstruction
— ► Suppurative Pyelitis
— ► Pyonephrosis
344
344
345
— ► Caliceal Stones
— ► Renal Pelvic Stone
— ► Staghorn Calculus
► Ureteral Stone
348
348
349
351
► Partially Contracted Bladder
— ► Diverticulum, Pseudodiverticulum
► Indented Bladder, Operated
Bladder
▼ Intracavitary Mass
352
► Hypoechoic
► Blood Clots
---► Bladder Sludge
---► Bladder Papilloma
- ► Polypoid Bladder Carcinoma
► Mesenchymal Tumors
► Hyperechoic
352
355
— ► Urinary Catheter
► Blood Clots
► Polypoid Bladder Tumor
► Benign Prostatic Hyperplasia
► Lipoma, Fibroma, Myoma,
Hemangioma
► Ureterocele
► Artifacts
।
— ► Foreign Bodies
► Bladder Calculi
362
358
359
359
360
— ► Ureteroceles
— ► Diverticula
11 Urinary Tract
C. Schmidt
The excretory portion of the urinary tract be-
gins with the collecting ducts of the renal pa-
renchyma, where the secondary urine is
formed through reabsorption. These ducts
unite to form 10-30 papillary ducts, which
Anatomy------------------------------------------------------------------------
Shapes and sizes
► Shape of the renal pelvis
► Ureteral length and diameter
► Shape, volume, and size of the urinary
bladder
Shape of the renal pelvis. The renal pelvis
presents a spectrum of shapes ranging from
the tubular (dendritic) form to the sachke “am-
pullary” form. The latter type is usually appre-
ciated as a fluid-filled space at ultrasound,
whereas the normal, non-fluid-filled pyeloca-
liceal system is not visible sonographically.
The renal pelvis is lined by a thin mucosa
composed of special stratified, transitional epi-
thelium (“urothelium,” which also lines the
ureter and bladder) and a muscular layer com-
posed of smooth-muscle fibers. The mucosa
can be distinguished from the renal sinus
echo complex only when it is inflamed and
swollen or when the pyelocaliceal system is
filled with fluid (Fig. 11.1).
Ureteral length and diameter. The ureter sim-
ilarly consists of an inner layer of mucosa, an
intermediate layer of smooth-muscle fibers,
and an outer adventitial layer. Normally it is
a Fig. 11.2 Urinary bladder.
a Normal full bladder (HB) in a transverse scan
through the lower abdomen: squared-off shape
with rounded corners.
open into the minor calices at the tips of the
papillae. The papillae are lined with a single
layer of epithelium that becomes stratified in
its further course and lines a total of 8-10-
minor calices, which collect the urine like fun-
not visualized with ultrasound owing to lack of
contrast with the surrounding retroperitoneal
tissue. The ureter is 30 cm long and 4-7 mm in
diameter.
Shape, volume, and size of the bladder. The
bladder wall consists of a thick muscular coat
along with a mucous and submucous layer and
a serosal layer. The three-layered structure of
the bladder wall can be appreciated at ultra-
sound, especially in relation to the fluid-filled
lumen.
The body or corpus of the bladder forms the
anterosuperior roof, and the base or fundus of
the bladder forms the posteroinferior floor.
From the fundus, the bladder tapers in a funnel
shape across the bladder neck to the urethra,
which opens at the apex of the bladder trigone.
The ureters pierce the muscular bladder wall
and enter the bladder lumen at the ureteral
orifices, located at the lateral angles of the
trigone on the posterior wall of the fundus
(Figs.11.2 and 11.3). Sonographically, the sub-
mucous segments of the ureters appear as
prominent ureteral ridges that protrude into
the bladder lumen (Fig. 11.3).
The size of the bladder depends on its de-
gree of distension. This also determines the
a b Full bladder in a longitudinal scan through the
lower abdomen: oval shape with a tapered anterosu-
perior roof and posteroinferior floor. Normal wall
thickness (cursors).
nels. They unite to form major calices, from
which urine drains into the renal pelvis and
thence to the ureter, bladder, and urethra.
shape of the bladder, which may appear round,
squared with rounded corners, or elliptical
(Fig. 11.2). The wall thickness of the full bladder
is 1-3 mm. An urge to urinate is felt when the
bladder is filled to approximately 350 ml, but
the bladder can easily accommodate twice that
volume.
11 Urinary Tract
a Fig. 11.1 Acute suppurative pyelitis with pelvic dila-
tation and hypoechoic wall thickening (cursors).
a c Diagram showing the anatomy and relations of the
bladder, seminal vesicles, urethra, and prostate.
11 Urinary Tract 332
Fig. 11.3 Ureteral orifices at the lateral angles of the
trigone (arrows) with a prominent "ureteral bud.”
SB = seminal vesicle; R = rectum; HB = urinary blad-
der; P = pelvis.
a Transverse scan.
< b Longitudinal scan.
Topography________________________________
Locations
► Ureteropelvic junction
► Ureter anterior to the iliac vessels
► Prevesical ureter
► Bladder in the lesser pelvis
Ureteropelvic junction and course of the ure-
ter. The ureter leaves the renal hilum posterior
to the renal vein and artery. Hence it is best to
scan the ureter from behind with the ultra-
sound beam directed anteriorly (Figs. 11.4 and
11.5). The ureter descends anteriorly to the
iliopsoas muscle, following the lordotic curva-
ture of the lumbar spine. Initially it takes a
steep anterior and inferomedial course, then
turns distally toward the lateral border of the
bladder. As it descends, it crosses over the iliac
vessels at the level of the origin of the deep iliac
artery, follows the wall of the lesser pelvis, and
finally opens into the bladder at the laterobasal
ureteral ridges (Fig. 11.5).
Bladder. Figures 11.3 and 11.6 illustrate the
relations of the bladder to the organs of the
lesser pelvis and to the male reproductive tract.
л Fig. 11.4 Transverse scan of the right kidney (N).
From anterior to posterior: the renal vein (V) followed
by the renal artery (A) and upper ureter (U). L = liver.
« Fig. 11.5 Course and relations of the ureter.
a Proximal ureter.
< b Course from the renal pelvis to the bladder tri-
gone. 1 = ureteropelvic junction area; 2 = ureter
crossing over the iliac vessels; 3 = supravesical seg-
ment.
а с-е Course of the ureter (U) is visualized by ultra-
sound due to obstruction by a prevesical ureteral
stone (arrow, acoustic shadow S).
c Junction of the ureter (U) with the dilated renal
pelvis (P). N = kidney.
a d Ureteral segment anterior to the iliac artery (Al).
a e Prevesical ureter.
Malformations 333
a Fig, 11,6a Diagram showing a sagittal section
through the bladder and male reproductive tract.
a b, c Sonographic relationship of the bladder (HB),
prostate (PR), seminal vesicle (SB; see Fig. 11,3),
and rectum (R).
b Lower abdominal transverse scan.
a c Lower abdominal longitudinal scan.
Malformations
► Duplex Kidney
► Duplex Ureter
► Bifid Ureter
Duplication Anomalies
The renal collecting ducts, renal pelvis, and
ureter are formed by the differentiation of the
cranial end of the ureteral bud in the fourth to
fifth week of gestation. The ureteral bud itself
forms posteriorly and medially from the pri-
mary ureter, the Wolffian duct, before it opens
into the urogenital sinus. The presence of a
second, separate ureteral bud gives rise to a
complete ureteral duplication, while division
of the ureteral bud at the later stage results in
a partial duplication. When two ureters are
present, the Weigert-Meyer rule states that
the upper-pole ureter inserts closer to the blad-
der neck, frequently at an ectopic site, owing to
the medial and caudal rotation of the Wolffian
duct that occurs during embryonic develop-
ment. Meanwhile the lower-pole ureter inserts
closer to the bladder roof. This accounts for the
tendency for reflux to occur in the lower-pole
system while the upper system is more suscep-
tible to obstruction.
A ureterocele is another relatively common
anomaly resulting from abnormal develop-
ment of the initially higher ureteral bud, which
drains the upper-pole system but opens in the
bladder floor due to caudal rotation. This leads
to frequent dysplasia with megaureter forma-
tion and hydronephrosis of the upper system.
► Duplex Kidney
11 Urinary Tract 334
Duplex kidney is an anomaly characterized by
the presence of two renal pelves that are joined
at the level of the ureteropelvic junction. Sono-
graphically, the kidney appears elongated and
the moieties are separated by a band of paren-
chyma, creating a visible notch in the renal
outline (Figs. 11.7 and 11.8).
a Fig. 11,7 Duplex kidney: normal renal size (33 cm),
complete parenchymal band with a notch in the renal
outline (cystic RCC was diagnosed five years later;
Fig. 9.55, p. 298; contralateral kidney Fig. 11.23).
a Fig. 11.8 Bifid ureter: the duplicated upper ureters
(U) are joined at the level of the ureteropelvic junc-
tion (arrow), with a dilated renal pelvis (P). Urinary
obstruction.
► Duplex Ureter_________________________________________________________________________
Duplex ureter refers to a complete ureteral
duplication with two separate renal pelves.
The ultrasound appearance is like that of a
duplex kidney, because normally both ureters
cannot be visualized. Ultrasound can confirm a
duplex ureter only when urinary tract obstruc-
tion is present, but excretory urography can
consistently demonstrate the anomaly.
► Bifid Ureter____________________________________________________________________________________
Bifid ureter is a partial ureteral duplication in
which the ureters arise from separate renal
pelves and unite between the pelvis and blad-
der to form a single ureter (Figs.11.8 and 11.9).
a Fig. 11.9 Bifid ureter: both ureters (U) are ob-
structed.
a Oblique upper abdominal scan through the left
kidney (P = renal pelvis).
a b Oblique midabdominal scan on the left side, show-
ing the site where the ureters join together
a c Oblique lower abdominal scan on the left side.
Cause of the ureteral obstruction: metastatic tumor
(T) of the left ovary.
Dilatations and Stenoses________________________________________________________
— ► Caliceal and Ureteral Diverticula
► Megacalicosis
► Aberrant Arteries
► Megaureter
► Ureteropelvic Junction Obstruction
► Caliceal and Ureteral Diverticula
Caliceal and ureteral diverticula are very rare,
congenital lesions. Stone precipitation occurs
in caliceal diverticula and can lead to clinical
symptoms. Diverticula appear sonographically
as anechoic masses in calices or along the
course of a ureter (Fig. 11.10).
л Fig. 11.10 Caliceal diverticulum (12-year-old boy).
a Oval, echo-free area of caliectasis. N = kidney.
a b A stone (ST; arrow - acoustic shadow) is visible in
the distended calix of a child with colicky episodes. It
is likely that the caliectasis is primary and that the
stone formed secondarily. SS = shadowing.
Malformations 335
► Megacalicosis
Megacalicosis is an anomaly in which the cali-
ces in one kidney are dilated and increased in
number. Most of these cases are clinically
asymptomatic. Ultrasound examination reveals
enlarged, dilated, fluid-filled calices.
► Aberrant Arteries
Aberrant arteries can occur in the necks of the
calices and at the ureteropelvic junction. Ultra-
sound may show caliceal enlargement in cases
where an interlobar artery leads to caliectasis,
or it may show enlarged groups of calices when
pyelectasis has developed due to tethering of
the upper ureter by an aberrant renal artery.
Color duplex examination can demonstrate an
aberrant vessel in 91% of cases (Fig. 11.11).
a Fig. 11.11 Subpelvic ureteral stenosis. Ultrasound
shows marked separation of the sinus echo complex
by a bandlike, echo-free mass representing the fluid-
filled renal pelvis (P). Vascular tethering?
a В-mode image: small, anechoic round feature by
the ureteropelvic junction (U, arrow).
a b Color duplex: aberrant lower pole vessel. P = pelvis.
► Megaureter
Megaureters and megacalices are congenital
anomalies involving the dilatation of urinary
passages. The classification of Hohenfellner
and Walz3, as modified by Kropfl6, is shown
below. Nowadays a congenital megaureter is
generally diagnosed with antenatal ultrasound,
but this modality is of limited value for classi-
fying the lesion.
Primary idiopathic megaureter is caused by
a perivesical fibrotic stenosis. Concomitant re-
flux is present. Primary refluxive megaureter is
based on an anomalous insertion of the ure-
teral bud. Secondary refluxive and obstructive
megaureters are usually caused by bladder wall
changes due to subvesical stenosis. Further dif-
ferentiation requires a special urological ex-
amination (Fig. 11.12).
Classification of Megaureter (Uretri-
Vesical Function Obstruction)
► Obstructive megaureter
- Primary, idiopathic
- Secondary (e.g., to neurogenic bladder,
subvesical obstruction)
► Refluxing megaureter
- Primary due to reflux
- Secondary to neurogenic bladder,
subvesical obstruction
► Nonobstructive, nonrefluxive megaure-
ter
11 Urinary Tract 336
** Fig. 11.12 Megaureter (U), probably caused by a fi-
brotic obstruction proximal to the bladder insertion
(HBL).
a Result: hydronephrotic sac (LLN).
b Iliac portion of the ureter.
** c Massive cystic dilatation at the prevesical level.
► Ureteropelvic Junction Obstruction_______________________________________________________________
An obstruction at the ureteropelvic junction
has a similar appearance to an aberrant artery.
The changes range from a dilated pyelocaliceal
system to hydronephrosis with loss of renal
function. Ultrasound shows pyelocaliectasis
or, in long-standing cases, a hydronephrotic
sac whose dilatation cannot be traced into the
ureter (Figs. 11.1 and 11.13).
л c Differential diagnosis: ureteropelvic junction stone
(arrow, acoustic shadow S). Scans should always in-
clude the ureteropelvic junction to aid the differential
diagnosis. N = kidney; P = pelvis.
a Fig. 11.13 a and b Hydronephrotic sac. Dilated proximal ureter (U). Cause: severe ureteropelvic junction obstruc-
tion (surgery)? P, К = massive pyelocaliectasis.
Dilated Renal Pelvis and Ureter
Anechoic_____________________________________________________________
► Pyelectasis
► Subpelvic Ureteral Stenosis
► Urinary Stone Colic
► Chronic Urinary Stasis
► Retroperitoneal Fibrosis (Ormond Disease)
► Reflux
► Pyelectasis__________________________________________________________________________________________
Pyelectasis refers to an anechoic separation of
the central renal sinus echogenicity due to di-
latation of the lenal pelvis with no associated
expansion of the caliceal system or upper ure-
ter. Pyelectasis may result from an ampullary
renal pelvis or from fluid diuresis (Figs. 11.14
and 11.15).
Other frequent causes are incipient urinaiy
stasis, like that resulting from pregnancy or
stone colic with an incomplete obstruction, as
well as urinary retention (Figs. 11.16-11.19).
« Fig. 11.14 Pyelectasis (P). L = liver; N = kidney.
a В-mode image: typical triangular, echo-free mass
in the sinus echo complex with nonvisualization of
the proximal ureter.
* b Color Doppler image: a dilated renal vein can be
excluded from the differential diagnosis (see also
Fig. 11.20).
Dilated Renal Pelvis and Ureter 337
a Fig. 11.15 Pyelectasis resulting from an ampullary
renal pelvis. L = liver; N = kidney.
a Enlarged, anechoic pyelocaliceal system (P).
a b Scan from a more lateral angle shows a nondilated,
normal-appearing ureter (arrow).
a c High transverse scan of the right kidney (N). Pos-
terior to the artery is the ectatic renal pelvis (P) with
no dilatation of the proximal ureter. VC = inferior vena
cava.
a Fig. 11.16 Pyelectasis with a dilated proximal ureter
(U). Obstruction? The patient presented clinically
with suppurative pyelitis. IVP (i. v. urogramm) showed
an ampullary renal pelvis with no outflow obstruc-
tion. N = kidney.
a Fig. 11.17 Color Doppler view of the plane in
Fig. 11.16: no vascularity, signifying fluid in the renal
pelvis. N = kidney; U = ureter.
a Fig. 11.18 Renal pelvic stone (arrow, acoustic shadow
S) with radial anechoic streaks representing the di-
lated calices and infundibula. Here the renal pelvis is
only minimally dilated. These stones are often missed
at ultrasound, as are stones at the ureteropelvic junc-
tion (see also Fig. 11.22). N = kidney.
ч-« Fig. 11.19 a Obstructive pyelectasis. N « kidney;
P = pelvis.
b Cause: pregnancy.
The differential diagnosis should include all
conditions that cause a hypoechoic, dilated re-
nal pelvis (see below) as well as anechoic or
hypoechoic transformation of the sinus echo
(Fig. 11.20).
7 7 Urinary Tract 338
** Fig. 11.20 Initial sonographic impression: obstruc-
tive pyelectasis of the left kidney (N).
a В-mode image shows an echo-free band in the
sinus echo complex.
* b Color Doppler: a dilated renal vein!
► Subpelvic Ureteral Stenosis _
A dilated pyelocaliceal system with no ureteral
dilatation indicates a subpelvic stenosis.
Primary causes are congenital aberrant ves-
sels and congenital ureteropelvic junction ob-
struction due to fibrous bands (see above).
Most cases involve a partial obstruction that
is not associated with progressive dilatation,
and so there is no functional deterioration
over time. Progressive stenoses culminate in a
hydronephrotic, nonfunctioning kidney
(Fig. 11.12).
The differential diagnosis includes secon-
dary stenoses due to postoperative stricture,
stone obstruction, or urothelial carcinoma
(Figs. 11.21-11.23).
Fig. 11.21 Subpelvic ureteral stenosis with a clinically
indeterminate cause.
a Ultrasound shows a markedly ectatic renal pelvis
(P) with a broad, approximately rectangular echo-
free mass. N = kidney.
* b Massive dilatation of the proximal ureter (U) with
granular hyperechoic structures and an acoustic
shadow (S) consistent with lithiasis. Urogram
showed ureteropelvic junction stenosis of indetermi-
nate cause with massive pyelocaliectasis. Retrograde
ureterography with stenting showed ureteropelvic
junction stenosis of undetermined cause.
«Fig. 11.22 Stone (cursors, acoustic shadow S) ob-
structing the upper ureter (U).
« Fig. 11.23 Two small masses with cystlike ultrasound
features in the lower moiety of a duplex kidney.
Dilated pyelocaliceal system. Cause: urothelial carci-
noma at the ureteropelvic junction ( 11.2d).
► Urinary Stone Colic________________________
When the obstructing stone is not located at
the ureteropelvic junction, ultrasound shows
the features of pyelocaliectasis and ureteral
dilatation. Stones tend to become impacted at
three sites of physiological narrowing
(Figs. 11.5 and 11.3):
► The ureteropelvic junction
► The point where the ureter crosses the iliac
vessels
► The ureterovesical junction
Generally the ureter is not visualized by ultra-
sound unless it is fluid-filled owing to an ob-
struction. It then appears as an anechoic band
that can be traced distally from the renal pelvis,
in some cases as far as its insertion in the
bladder floor (Fig.11.3). Generally the im-
pacted stone can be detected and localized.
This is not possible with partial obstructions.
In these cases it may be possible (with effort) to
locate a constant, hyperechoic stony structure
that casts an acoustic shadow. If the neck of the
calix is enlarged to more than 4 mm and the
pelvis and ureter to more than 5 mm, urinary
stasis is present. This is also indicated by a
unilateral decrease or absence of the ureteral
jet phenomenon (3 or 4 per minute is normal)
(Figs. 11.24-11.27 and Figs. 11.49-11.52).
Clinical Note
If a stone is detected and infection is not
present, several days of conservative ther-
apy may be tried under ultrasound surveil-
lance before proceeding with invasive
treatment. Intravenous urography is con-
traindicated, as the contrast administra-
tion could lead to rupture of the fornix or
ureter (Fig. 11.27). If the ultrasound find-
ings are equivocal, an abdominal plain film
can be taken to check for a shadowing
calculus.
Fig. 11.24 Dilated pyelocaliceal system in a patient
with flank pain. Suspicion of biliary colic.
a Dilated calix (CA) communicating with the dilated
and obstructed renal pelvis (PY).
< b A proximal ureteral stone (arrow) causing obstruc-
tive caliceal ectasia. Scan shows two echo-free
masses in the central echo complex. The upper
mass represents an ectatic caliceal neck. The en-
largement of a caliceal neck to more than 5 mm
(here 11 mm) indicates obstruction. The lower
mass is the dilated renal pelvis.
« Fig. 11.25 Color Doppler examination.
a Course of the ureter (U) anterior to the vena cava
(VC) and the iliac artery and vein (Al; VI), oblique
scan through the right midabdomen.
< b Lower part of the ureter (U) in the lesser pelvis,
anterior to the iliac artery (Al). The impacted stone
(arrow, acoustic shadow S) is visualized.
Dilated Renal Pelvis and Ureter 339
a Fig. 11.26 a and b Renal and ureteral obstruction.
a Pyelocaliceal stone (arrow, acoustic shadow S), di-
lated renal pelvis (P). N = kidney.
a b Cause: prevesical stone with an acoustic shadow
(S); two days later, detectable urine flow (ureteral
jets). HB = bladder; U = ureter.
a Fig. 11.27 Fluid collection around the lower pole of
the kidney: urinoma (arrows). Dilatation of the renal
pelvis (P) and ureter (U).
► Chronic Urinary Stasis_______________________________________________________________________
Chronic urinary stasis is based on a disturbance
of urinary transport. Urinary stasis can be clas-
sified into four grades of severity, as described
by Gladishlb, based on its sonographic appear-
ance. This assessment includes evaluating the
degree of renal pelvic distension by fluid, the
integrity of the renal sinus echo complex, and
the loss of renal parenchyma (в 11.1).
Chronic urinary stasis can have a variety of
causes, most of which can be demonstrated
with ultrasound. Once urinary stasis has been
detected sonographically, the cause can often
be discovered by starting with a posterolateial
scan of the ureteropelvic junction and then
moving the scan anterolaterally and inferome-
dially, using color Doppler as needed, until the
dilated, anechoic ureter appears to terminate.
This site marks the point of the obstruction.
A special form of urinary stasis due to out-
flow obstruction is hydronephrosis. It is iden-
tical to the grade IV hydronephrotic sac de-
scribed above, but there are several special
features in addition to chronic urinary stasis:
the condition is usually detected incidentally
and is based on an unnoticed, often congenital
cause. Its significance lies in the fact that when
it is bilateral (usually due to an infravesical
cause), it can lead to end-stage renal failure,
infection, and pyonephrosis (see below).
The various causes of chronic urinary stasis
are listed in Table 11.1 and illustrated in - 11.2.
Table 77.7 Causes of chronic urinary stasis
► Ureteropelvic junction obstruction,
aberrant vessel
► Impacted stone
► Clot or necrotic papilla
► Stricture
► Ectopic ureteral insertion, ureterocele
► Bladder tumor
► Prostatic hypertrophy or tumor
► Colon carcinoma
► Ovarian carcinoma
► Ureteral carcinoma
► Ormond disease
и 11.1 Sonographic Criteria for Grading the Severity of Urinary Stasis
► Mild urinary stasis (grade I)
11 Urinary Tract 340
► Moderate urinary stasis
(grade II)
► Pyelocaliectasis with anechoic
separation of the renal sinus
echo complex; the ureter or
ureteropelvic junction may be
dilated and echo-free
► Preservation of the bright sinus
echoes
► Normal thickness of the renal
parenchyma
► Marked caliceal dilatation to
5-10 mm, pyelectasis
► Ureteral dilatation, incipient
tortuosity
► Parenchyma still normal or
slightly thinned
► Diminished sinus echo com-
plex
a Echo-free separation of the central
renal sinus echogenicity; preservation
of sinus echoes; intact parenchyma (N).
This patient had metastatic colon can-
cer and postoperative ureteral occlu-
sion by a suture ( 11.2f). PY = pelvis:
U = ureter.
b Conspicuous, echo-free pyelocaliec-
tasis (C) with diminished sinus echoes
and incipient parenchymal thinning.
Postoperative ureteral occlusion by a
suture as above, six months later.
N = kidney.
► Severe urinary stasis (grade III)
► Hydronephrotic sac (grade IV)
► Massive caliceal dilatation,
pronounced anechoic pyelec-
tasis
► Loss of the sinus echo complex
► Rarefaction of the renal pa-
renchyma
c Conspicuous, echo-free pyelocaliec-
tasis (К, P); loss of renal sinus echoge-
nicity; thinned parenchyma, dilated
ureter (U). Patient had a metastatic
ovarian tumor. N= kidney.
► Anechoic cystic mass in the
central echo complex due to
severe pyelocaliceal dilatation
► Complete loss of the renal si-
nus echogenicity
► Complete or almost complete
loss of the renal parenchyma
d Calices (K) and renal pelvis (P) are
combined to form an echo-free hydro-
nephrotic sac with little or no evidence
of any residual parenchyma.
► Retroperitoneal Fibrosis (Ormond Disease)______________________________
Fibrosis arising from the region of the L4 and L5
vertebrae, with the formation of collagenous
connective-tissue fibers up to 2 cm thick, can
lead to the extensive fibrous encasement of
retroperitoneal structures including the psoas
muscle, aorta, and vena cava along with the
iliac vessels, mesentery, and ureters.
At ultrasound, the ureters are visibly en-
sheathed and obstructed, leading to chronic
urinary stasis. In contrast to other occlusive
diseases, a localized obstruction cannot be
found. Instead there is a long, rigid, dilated
ureteral segment with none of the tortuosity
that is usually seen in association with chronic
urinary stasis. The fibrosis itself is slightly
echogenic and is poorly delineated from other
retroperitoneal structures. The detection of fi-
brotic encasement on other retroperitoneal or-
< b Broad, rigid ureter (U) encased in retroperitoneal
connective tissue, recognized here only by the rigid
course of the ureter. The connective tissue itself is
not visualized because of its low impedance.
gans supports the ultrasound impression of
fibrosis-induced urinary stasis.
Retroperitoneal fibrosis involving the ure-
ters also occurs in inflammatory disorders
such as Crohn disease, diverticulitis, sarcoido-
sis, and radiation-induced fibrosis. Other retro-
peritoneal causes of urinary stasis, such as sar-
coma and malignant lymphoma, should be in-
cluded in the differential diagnosis (Fig. 11.28).
Fig. 11.28 Ormond disease (retroperitoneal fibrosis).
a Grade II stasis kidney (N) with a dilated renal pelvis
(P). C = calix.
в 7 7.2 Causes of Chronic Urinary Stasis
► Ureteral tumor obstruction
► Ureteral stone obstruction
► Ureteropelvic junction stone,
ureteral stricture, ureterocele
a Ureteropelvic junction obstruction?
(arrow; no dilated ureter), dilated renal
pelvis (P); В-mode image.
d Ureteral tumor (urothelial carcinoma,
T): hypoechoic oval mass with smooth
margins; indwelling drain (arrows. DR).
g В mode image: obstruction caused by
a hypoechoic mass (arrow)
j-j Grade II urinary stasis caused by a
bladder tumor.
b Postoperative ureteral stricture (U,
arrows): indistinct ureter in a hypo-
echoic scarred area. Al, VI = iliac artery
and vein.
e Locoregional metastasis of ovarian
carcinoma (T): cutoff of the obstructed
ureter (U) at the level where it crosses
the iliac vessels (Al).
h Color doppler image: no vascularity,
lack of a twinkling artifact (which
mostly can be detected in renal stones.
U = ureter, Al = iliac artery
к Ureteropelvic junction. Ureteral tor-
tuosity over the iliac artery and vein (Al,
VI). P - pelvis; U = ureter; HB = bladder.
c Ureterocele (UZ) with an obstructed
ureter (U).
f Metastatic prostate cancer (T) in-
denting the bladder (HB) and obstruct-
ing the ureter (U).
i Stone obstruction of the ureteral or-
ifice. Distinctive twinkling artifact.
Ureteral jet. U = ureter.
/ Invasion of the ureter (U) by a bladder
tumor (T). HB = bladder; DK = catheter
balloon.
Dilated Renal Pelvis and Ureter 341
► Reflux____________________________________________________________________________________________
Vesicoureteraland vesicorenal reflux also lead to
dilatation of the ureter and renal pelvis. A dis-
tinction is drawn between primary congenital
forms of reflux and secondary acquired forms.
Primary forms. Primary forms of reflux (ure-
terovesical junction obstruction, i.e., refluxing
megaureter) are based on developmental ab-
normalities of the terminal ureter. These may
consist of abnormal orifices, ectopic insertions,
or an abnormal course of the ureter in the
bladder wall. The results are partial or com-
plete dilatation of the ureter and renal pelvis,
with risk for developing progressive renal fail-
ure. Besides showing initial suggestive signs,
ultrasound can furnish information on the de-
gree of urinary obstruction. The detection of
reflux is the domain of the excretory urogram
and voiding cystogram. While color Doppler
can demonstrate the presence of a ureteral
jet, Doppler ultrasound has not yet established
itself as a standard study4.
Secondary forms. Secondary forms of vesi-
corenal reflux are caused by inflammatory or
postoperative changes in the bladder floor or
by mechanical or functional infravesical ob-
structions (Fig. 11.29 and Fig. 11.53).
The following classification system was de-
vised by the International Reflux Study Group
(1985), as quoted in Riedmiller and Kohl9.
Classification of Reflux
11 Urinary Tract 342
► Grade I: Reflux causes variable dilatation of
the ureter, does not reach the renal pelvis.
► Grade II: Reflux reaches the renal pelvis,
causes no dilatation of the collecting sys-
tem; the fornices remain sharp.
► Grade III: Mild or moderate dilatation of
the ureter with or without kinking and/or
mild or moderate dilatation of the collect-
ing system; the fornices are blunted.
► Grade IV: Moderate dilatation of the ureter
with or without kinking, moderate dilata-
tion of the collecting system; the fornices
are blunted; papillary impression is still
visible.
► Grade V: Severe dilatation of the ureter
with kinking; massive dilatation of the
collecting system; papillary impression of
the calices is no longer visible.
л Fig. 11.29 Chronic primary reflux with grade III ure-
teral dilatation and chronic urinary stasis: ectopic
ureteral insertion.
Hypoechoic___________________________________________________________
— ► Hemorrhage (Traumatic. Clot)
► Infected Obstruction
► Suppurative Pyelitis
► Pyonephrosis
► Hypoechoic Transformation of the Central Renal Sinus Echogenicity
► Hemorrhage (Traumatic, Clot)_____________________________________________________________________
Traumatic or postprocedure hemorrhages in
the kidney appear as hypoechoic masses in
the renal pelvis and ureter or may produce
the features of fluid-related pyelectasis. The
cause in most cases can be determined clini-
cally (Fig. 11.30). Fresh hemorrhages are echo-
genic and show nondirectional flow with tur-
bulent zones at color Doppler.
a Fig. 11.30 Bleeding in the renal pelvis following the
percutaneous puncture of a transplanted kidney;
here, persistent echogenic bleeding.
a В-mode image shows high-level echoes with asso-
ciated shadows.
a b Color duplex confirms the hemorrhage by showing
the confetti-like artifact, indicating significant turbu-
lence.
► Infected Obstruction _________________________________________________________________________
If a patient with renal stone colic becomes
febrile, an infected obstruction should be sus-
pected. Urinalysis will show signs of a urinary
tract infection. Not every infected obstruction
is preceded by stone colic, but an obstructive,
septic urinary tract infection should be consid-
ered in patients who present with unexplained
fever. This is especially likely in older patients
with impaired host resistance and in poorly
controlled diabetics.
Ultrasound often shows only a hypoechoic
or largely anechoic dilatation of the pyelocali-
ceal system. A stone is frequently but not al-
ways detectable. If the obstruction can be vi-
sualized, it may appear as a hyperechoic mass
in the renal pelvis (staghorn calculus), in the
ureter (ureteral stone), or at the vesical or in-
travesical level (tumor, reflux, or prostatic hy-
perplasia, which is bilateral). For this reason,
the sonographic investigation of fever should
always include a detailed inspection of the
kidneys, ureters, and bladder (Figs. 11.31-
11.33 and Fig.11.16).
Even if a stone is not detected and there is no
ureteral dilatation, the mere suspicion of an
infected obstruction warrants intervention in
order to prevent urosepsis.
a Fig. 11.31 Infected obstruction in association with a
prevesical stone: septic temperatures.
a Grade I urinary stasis. The renal pelvis (P) and
ureter (U) are not entirely anechoic. N = kidney.
a b Prevesical obstructing stone (arrow, acoustic
shadow S). HB = bladder.
a Fig. 11.32 Infected obstruction: anechoic to hypo-
echoic, poorly marginated dilatation of the pyeloca-
liceal system (P) and ureter (U). N = kidney.
«Fig. 11.33 Infected obstruction in association with
subpelvic ureteral stenosis.
a Hypoechoic, obstructed pelvis with sonographi-
cally indistinct margins.
« b Radiograph: ureteropelvic junction obstruction?,
probably due to an aberrant vessel.
Dilated Renal Pelvis and Ureter 343
► Suppurative Pyelitis_______________________________________________________________________
Suppurative pyelitis is a pyelonephritis that has
developed by the ascending route and predom-
inantly affects the renal pelvis. Obstruction may
be present or absent. Unlike pyelonephritis that
anses by the hematogenous route, the findings
aie concentrated in the renal pelvis and consist
of an anechoic mass that is clearly definable
with ultrasound. Suppurative pyelitis may re-
sult from an obstruction to urine outflow such
as a congenital malformation, prostatic hyper-
plasia, or urolithiasis, or there may be factors
predisposing to infection such as diabetes mel-
litus, a ureteral stent, or a urinary catheter.
The sonographic signs of suppurative pyelitis
range from the features of an anechoic obstruc-
tion or a dilated renal pelvis with internal ech-
oes to circumscribed round, oval, or bandlike
hypoechoic or anechoic masses. Inflammatory
swelling of the renal pelvic walls over 2 тт1д,
which appear as smooth, thin, hypoechoic
bands, is virtually pathognomonic of this con-
dition (E 11.3, Fig. 11.1).
► Pyonephrosis_______________________________________________________________________________
An infected hydronephrosis leads to pyoneph-
rosis. The sonographic findings are difficult to
interpret because the familiar parenchymal-
sinus echo pattern is absent and the normal
renal shape and structure are markedly
changed, which can easily lead to misinterpre-
tation. Pyonephrosis appears as a patchy het-
erogeneous, tumorlike mass with a rounded or
elliptical shape.
The images in a 11.3 illustrate the typical
sonographic features of pyelitis, pyonephrosis,
and renal pelvic abscesses.
011.3 Suppurative Inflammations of the Renal Pelvis
► Suppurative pyelitis
a Suppurative pyelitis. Slightly shifted
scan plane shows a hypoechoic ureter
with absence of central echoes (arrow).
The hypoechoic “tram tracks” could
represent the swollen ureteral wall.
L e liver; N = kidney.
b and c Bilateral suppurative pyelitis in
a young diabetic man with septic tem-
peratures.
b Right kidney: hypoechoic bandlike
mass in the renal pelvis/ureteropelvic
junction (arrows). N = kidney.
c Left kidney: hypoechoic separation of
the central renal sinus echogenicity due
to purulent fluid in the renal pelvis and
calices (arrows).
®11.3 Suppurative Inflammations of the Renal Pelvis
► Renal pelvic abscesses
11 Urinary Tract 344
d Renal pelvic abscess (arrow) before
treatment: elliptical hypoechoic mass
u- 11.3e).
e В-mode image: elliptical anechoic
mass (A) with a fine, hypoechoic pelvic
wall that shows inflammatory swelling.
f Pyelitis with abscessation: two hypo-
echoic masses in the renal pelvis (A).
N * kidney.
► Pyonephrosis
g Pyonephrosis: extensive hypoechoic,
nonhomogeneous mass in the pyelo-
calyceal system.
h Pyonephrosis: hypoechoic abscesses
with irregular margins (A) in suppura-
tive pyelitis of the kidney (N).
i Pyonephrosis (surgery): left flank scan
demonstrates an irregular mass. The
kidney can no longer be identified be-
cause the entire pyelocalyceal system
has acquired a solid texture due to
suppuration.
Renal Pelvic Mass, Ureteral Mass
Hypoechoic__________________________________________________________
► Pyonephrosis, Renal Pelvic Abscess
► Urothelial Carcinoma
► Ureteral Clots
The differential diagnosis of hypoechoic
changes in the renal sinus complex centers on
the differentiation of urothelial carcinoma (see
below) from other hypoechoic masses such as
suppurative pyelitis, an infected obstruction,
renal cell carcinoma invading the renal pelvis,
atypical renal parenchymal bands, parapelvic
cysts, and sinus lipomatosis. The differential
diagnosis is aided by color Doppler examina-
tion, which frequently shows internal vascular-
ity in tumors but not in abscesses, sinus lipo-
matosis, or cysts (see E 9.5, p. 305).
► Urothelial Carcinoma
Classification. The majority of urinary tract
tumors are urothelial carcinomas. They arise
as malignant tumors from the transitional epi-
thelium (urothelium) and therefore occur in
the renal pelvis, ureter, and bladder. The fol-
lowing tumor types are named in the 1998
WHO classification of epithelial renal pelvic
tumors8:
► Benign papilloma
► Malignant carcinoma
- Transitional cell carcinoma
- Squamous cell carcinoma
- Adenocarcinoma
- Medullary renal carcinoma
- Undifferentiated carcinoma
- Carcinosarcoma
Actual urothelial carcinomas—transitional cell
carcinomas—are less common than renal cell
carcinomas. They occur grossly in papillary or
solid forms.
Ultrasound. The ultrasound appearance varies
with tumor location. Tumors in the renal pelvis
usually assume the shape of the pyelocaliceal
system and may extend into the upper ureter
as well as the renal parenchyma. They are
somewhat more reflective than the renal pa-
renchyma, but they may also be less echogenic.
A long-standing tumor may contain foci of
a Fig. 11.34 Urothelial carcinoma (T) (surgery): hypo-
echoic mass in the pyelocaliceal system with exten-
sion into the ureter, indistinguishable from suppura-
tive pyelitis or pyonephrosis in the В-mode image.
(Color Doppler can help by demonstrating intratu-
moral vascularity.)
liquefaction, giving it a cystic or abscesslike
appearance.
The differential diagnosis includes metasta-
ses. hemorrhagic cysts in the renal sinus, and
extension of renal cell carcinoma into the renal
a Fig. 11.35 Urothelial carcinoma (surgery): one hypo-
echoic and one largely anechoic mass in the renal
pelvis of the right kidney (cursors). The echo-free
mass (cursors) represents an area of tumor liquefac-
tion.
pelvis (Figs. 11.34-11.37; W 11.2d), see also
Chapter 9, p. 304).
Urothelial carcinoma in the ureter appears
as a hypoechoic mass with associated obstruc-
tion to urine outflow (B 11.2d).
a Fig. 11.36 Renal cell carcinoma located in the central
echo complex: rounded, hypoechoic mass in the kid-
ney (Dr. R.-D. Hanrath. Hagen, Germany).
Renal Pelvic Mass, Ureteral Mass 345
Fig. 11.37 Sinus lipomatosis, the main lesion requir-
ing differentiation from urothelial carcinoma of the
renal pelvis.
a В-mode image: hypoechoic streaks in the sinus
echo complex of the kidney (N). Sinus lipomatosis
or urothelial carcinoma?
* b Color Doppler: absence of vascularity in the hypo-
echoic mass is more consistent with sinus lipomato-
sis.
► Ureteral Clots
Ureteral clots appear as hypoechoic or hetero-
geneous tumorlike masses in the ureters with
associated obstruction to urine outflow. They
may occur in the setting of a generalized hem-
orrhagic diathesis, after surgical procedures, or
in association with a renal tumor or urolithia-
sis. They are difficult or impossible to distin-
guish from primary tumors by ultrasound. The
correct diagnosis is usually made from the his-
tory, the clinical course, or endoscopic inspec-
tion (Fig.11.38).
< Fig.11.38 Ureteral clot, caused by renal cell carci-
noma bleeding into the ureter. Patient presented
clinically with renal colic. Hypoechoic mass in the
prevesical ureter (U). Arrows = echogenic ureteral
ridge: HB = urinary bladder: SB = seminal vesicles.
Hyperechoic
► Malformations
— ► Caliceal Stones
► Renal Pelvic Stone
► Staghorn Calculus
► Ureteral Stone
11 Urinary Tract 346
Urolithiasis. Urolithiasis can have many
causes: primary or secondary hyperuricemia
(tumor chemotherapy!), hypercalcemia, ma-
lassimilation syndromes, inflammatory bowel
diseases with increased oxalic acid absorption,
and inflammatory or neoplastic renal pelvic
diseases. Less frequent causes are congenital
or acquired metabolic disorders such as renal
acidosis or a disturbance of cystine metabo-
lism. Often, however, lithiasis results from the
crystallization of salts dissolved in the urine,
► Caliceal Stones
A renal caliceal stone is characterized by a
stone echo with an acoustic shadow and by
caliectasis, which occurs proximal to the site
of the stone. Concomitant ectasia of the caliceal
with no identifiable cause. Since crystals re-
quire a relatively calm precipitation medium
in order to grow, they tend to form at sites
where a high salt concentration is combined
with fluid stasis and a favorable pH. Stones
most commonly form in the renal pelvis and
bladder, therefore.
Sonographic criteria. Regardless of the stone
composition—urate or cystine/xanthine stones,
calcium oxalate/calcium phosphate stones, or
neck suggests a calculus located distal to the
infundibulum, whereas a caliceal stone echo
not associated with caliectasis is difficult or
impossible to distinguish from papillary calci-
infection stones (struvite/carbonate apatite)
—ultrasound shows an intensely echogenic fo-
cus with distal acoustic shadowing. Because a
stone surface echo is very difficult to discern
within the high-level echoes of the renal sinus
complex, the presence of an acoustic shadow is
important in confirming the diagnosis of uroli-
thiasis. Not every echo, even when associated
with partial shadowing, represents a stone. It
must also be consistently definable in multiple
planes of section.
fication. The history and clinical presentation in
these cases will suggest the correct diagnosis
(Figs. 11.39-11.41).
a Fig. 11.39 Lower caliceal stone with caliectasis (ar-
row; acoustic shadow S). Scan shows a high-ampli-
tude, hood-shaped echo below a circumscribed an-
echoic area.
a Fig. 11.40 Upper caliceal stone (cursors), similar ap-
pearance as in Fig. 11.39, but without caliectasis two
days after renal colic. The initial obstruction has sub-
sided due to partial outflow.
л Fig. 11.41 Stone in a lower caliceal neck (arrow) with
another, more distal outflow obstruction, causing
very clear delineation of the caliceal stone in the fluid
milieu of the pyelocaliceal system. (Without an
acoustic shadow, ordinarily it would not be possible
to distinguish the stone within the central echo com-
plex.)
► Renal Pelvic Stone
Renal pelvic stones, like caliceal stones, may be
solitary or multiple. They have the same ultra-
sound appearance as caliceal stones but lack
the typical isolated caliectasis that occurs
with the latter. They may also be obstructive
for one or more caliceal groups (Fig. 11.42).
► Staghorn Calculus
Because a staghorn calculus is associated with a
broad linear echo or an irregular echogenic
zone, it is easily missed when nonobstructive
and may be mistaken for a bright central sinus
echo. Depending on the scan plane, ultrasound
may show a broad echo with a single broad
associated shadow, or a scan in the caliceal
plane may show multiple echogenic foci that
cast separate shadows (Figs. 11.43-11.47).
The differential diagnosis of hyperechoic
masses in the renal sinus echo complex is re-
viewed in Table 11.2.
a Fig. 71.42 Renal pelvic stone (arrow; acoustic shadow
S).
a Here a mild obstruction of the renal pelvis (P)
delineates the stone in the left kidney (N).
л b High-amplitude echo from a nonobstructive stone
< Fig. 11.43 Renal pelvic stone (partial staghorn calcu-
lus) with local obstruction of the middle and lower
caliceal groups: broad hyperechoic zones with
acoustic shadows (S) in the midpelvic region of the
left kidney (N).
л Fig. 11.44 Partial staghorn calculus, ureteropelvic
junction stone. N = kidney.
о Hyperechoic calculi in the upper and middle pye-
localiceal system (P, arrows, acoustic shadows S).
a b Calcification with an acoustic shadow (S) in the
mid- to lower renal pelvis.
a c Shadowing stone in the lower renal pelvis and a
ureteral stone (U; acoustic shadows S).
** Fig. 11.45 Staghorn calculus: multiple high-level
stone echoes with acoustic shadows (S) throughout
the pyelocaliceal system. Depending on the scan
plane, ultrasound may demonstrate multiple isolated
stone echoes as shown here or a broad linear echo
(Fig. 11.46). N = kidney.
« Fig. 11.46 Staghorn calculus with massive caliectasis
and a bright linear echo (arrows) with an acoustic
shadow (SS). Massive, anechoic caliectasis with se-
vere chronic renal congestion and parenchymal loss.
Renal Pelvic Mass, Ureteral Mass 347
a Fig. 11.47 Radiographic view of a staghorn calculus
(compare with Fig. 11.46).
Table 11.2 Differential diagnosis of echo-
genic masses in the sinus echo complex
' Kidney stone (Fig. 11.39)
► Vascular calcification
(Fig. 9.87, p. 311)
► Papillary calcification
(Fig. 9.86, p. 311)
► Nephrocalcinosis (Fig. 9.91, p. 312)
► Tumor calcification (Fig. 9.71, p. 304)
► Gas-forming abscess
(Fig. 9.89, p. 312)
Medullary sponge kidney
Inflammatory calcification
(Figs. 9.92, 9.93, p. 313)
► Posttraumatic calci ication
► Ureteral Stone
The most frequent cause of renal colic is a
ureteral stone. Calculi tend to become im-
pacted at sites of physiological narrowing: the
ureteropelvic junction, the point where the
ureter crosses the iliac vessels, and the ureter-
ovesical junction ureter. Of these sites, the lat-
ter is the most common.
The landmark for locating the stone at ultra-
sound is the dilated ureter. An intravenous uro-
gram can usually be omitted, also because of
the potential for contrast-induced diuresis
with risk of fornix rupture and perirenal uri-
noma formation (Fig.11.48). Figures 11.49-
11.52 illustrate some typical locations of ure-
teral stones.
a Fig.11.48 Urinoma: perirenal echo-free fluid cres-
cent (FL) with a dilated, congested renal pelvis (P).
N = kidney.
a Fig. 11.49 Two high ureteral stones: hyperechoic foci
in the dilated ureter (U), mild pyelectasis in the left
kidney (N). S = shadowing.
11 Urinary Tract 348
a Fig. 11.50 Prevesical ureteral stone (arrow), proximal
to the ureteral insertion into the bladder (HB). No
ureteral obstruction.
a Fig. 11.51 Hyperechoic prevesical stone in the ure-
teral orifice (U). Color Doppler: twinkling artifact in
the acoustic shadow. This artifact is over 90% sensi-
tive in the detection of calcium stones.
a Fig. 11.52 Prevesical stone in the right ureter (ST,
partial acoustic shadow S), color Doppler view: no
ureteral jet on the right side with fluid diuresis, but
a conspicuous color-flow jet (UJ) is visible on the left
side. HB = bladder.
Changes in Bladder Size or Shape
Large Bladder___________________________________________________________
— ► Urinary Retention
► Overflow Bladder, Neurogenic Bladder
► Urinary Retention_____________________________________________________________________________
Urinary retention refers to an inability to
empty the bladder All gradations can occur
from mildly impaired outflow with or without
residual urine to total retention. The causes are
diverse and include functional and neurogenic
causes (detrusor paralysis, as in Parkinson dis-
ease) as well as morphological changes (stones,
tumors, foreign bodies, infravesical obstruc-
tions). Most causes can be detected and iden-
tified at ultrasound (Table 11.3). Idiopathic uri-
nary retention is rare.
Volume estimation. Ultrasound in urinary re-
tention demonstrates an overdistended blad-
der. The degree of enlargement can be mea-
sured by estimating the bladder volume. Nor-
mally a bladder volume of 350-450 ml triggers
the urge to urinate. The maximum anatomical
bladder capacity is 400-600 ml, and patholog-
ical bladder volumes may reach 2 liters or
more. The sonographic estimation of bladder
volume and residual urine is simple: take the
product of the largest longitudinal, transverse,
and anteroposterior diameters and divide by 2
(the formula for a rotational ellipsoid). The
range of error is relatively large (small volumes
are overestimated, large volumes are underes-
timated), but the formula is quite satisfactory
for clinical purposes (Figs. 11.53 and 11.54).
Misinterpretation may be caused by para-
vesical anechoic masses such as ovarian cysts
and loculated ascites (Fig. 11.55).
Table 11.3 Vesical and infravesical causes
of urinary retention
Vesical causes
► Neurogenic bladder dysfunction
► Bladder neck stones
► Bladder tumors
Infravesical causes
► Prostatic hyperplasia
► Prostatic carcinoma
► Foreign bodies
► Phimosis
a Fig. 11.53 Maximal bladder distension behind a clogged urethral catheter, with secondary reflux into the ureter (U) and renal pelvis (P). N = kidney; HB = bladder.
Changes in Bladder Size or Shape 349
a Fig. 11.54 Measurement of bladder volume in a full
bladder (HB).
a lower abdominal transverse scan: width x depth
(cursors).
a b Lower abdominal longitudinal scan: greatest length
(cursors). P = normal prostate: R = rectum.
a Fig. 11.55 Ascites in the lower abdomen (A) assum-
ing the shape of the bladder. The actual bladder (HB)
can be positively identified as such only by scanning it
after voiding and when distended (if necessary, by
retrograde filling). A small papillomatous bladder tu-
mor is noted as an incidental finding (arrow).
► Overflow Bladder, Neurogenic Bladder___________________________________________________
Overflow bladder and neurogenic bladder are
types of urine storage disorders. Their clinical
hallmarks are pollakiuria, nycturia, and incon-
tinence. Neurogenic bladder is diagnosed by
exclusion and is classified on the basis of clin-
ical findings.
The ultrasound appearance corresponds to
that of urinary retention (Fig. 11.56).
Fig.11.56 Urinary retention with a maximally dis-
tended bladder (HB): neurogenic bladder dysfunc-
tion in a patient receiving chemotherapy for chronic
lymphatic leukemia.
Small Bladder__________________________________________________________
— ► Empty Bladder
► Residual Urine
► Shrunken Bladder
► Empty Bladder
7 7 Urinary Tract 350
When the bladder is in an empty or almost
empty state, its roof sags, giving it a bowl-
shaped appearance at ultrasound. Asking the
patient when he or she last voided can explain
a “small bladder" in doubtful cases and exclude
inflammatory shrinkage (Figs. 11.57 and 11.58).
a Fig. 11.57 Almost empty bladder (HB) in a lower ab-
dominal transverse scan. Here the bladder wall ap-
pears thickened (5 mm between cursors).
a Fig. 11.58 Completely empty bladder. A lumen is no
longer visualized. The bladder location is indicated by
an indwelling balloon catheter (DK). SB = seminal
vesicle.
► Residual Urine
The presence of residual urine, which can be
misinterpreted as a small bladder, is demon-
strated by imaging the bladder in the distended
state and immediately after voiding. The vol-
ume formula is used to calculate volume
(Fig. 11.59). Normally no residual urine is
found. Small amounts less than 15 ml are not
clinically significant in older adults.
a Fig. 11.59 a Residual urine (Restham) after complete
voiding, in this case 68.6 ml. Lower abdominal trans-
verse scan to determine the transverse and antero-
a b Lower abdominal longitudinal scan to determine
the craniocaudal diameter.
posterior diameters.
► Shrunken Bladder
Unlike a partially emptied bladder, a shrunken
bladder exhibits shape and wall changes in
addition to a small size. The causes are chronic
inflammatory disorders such as urinary tuber-
culosis and radiocystitis. The inflammatory
bladder changes in urinary tuberculosis start
around the ureteral orifices and then spread
deep into the bladder wall, causing induration
of the wall muscles and a diminished bladder
capacity (Fig. 11.60).
a Fig. 11.60 Shrunken bladder.
a After urinary tuberculosis. HB = bladder. Maximum
bladder capacity is 153 ml, residual urine volume is 43
ml. Thickened wall (cursors).
a b Neurogenic shrunken bladder with reflux. Maxi-
mum bladder capacity is 60 ml.
Altered Bladder Shape
► Partially Contracted Bladder
► Diverticulum, Pseudodiverticulum
► Indented Bladder, Operated Bladder
in
► Partially Contracted Bladder______________________________________________________________
The bladder roof sags during micturition, cre-
ating a bowl-shaped lumen with tapered lat-
eral extensions that may be mistaken for diver-
ticula.
An almost empty bladder has a variable ul-
trasound appearance: crescent-shaped, round-
ed, or oval. The contracted muscles give the
wall an irregular border and increase its thick-
ness to as much as 6-8 mm. A wall thickness
greater than 10 mm is definitely abnormal
(Fig. 11.61, Fig. 11.57).
* Fig. 11.61 Partially contracted bladder (HB) with ap-
parent wall thickening due to the contracted
muscles (cursors). The three-part wall structure is
clearly visualized.
Changes in Bladder Size or Shape
► Diverticulum, Pseudodiverticulum__________________________________________________________
Multiple pseudodiverticula resulting from a
subvesical obstruction (benign prostatic hyper-
plasia) or laige diverticula without a distinct
neck can impait a bizarre shape to the bladder
that is difficult to recognize sonographically as
having a diverticular cause. The correct diag-
nosis can usually be made, however, by exam-
ining the bladder in a partially full or partially
empty state or by imaging the bladder in differ-
ent planes (Figs. 11.62 and 11.63).
л Fig. 11.62 Bladder diverticulum in a partially filled
bladder. With additional distension a hypoechoic
saccular mass appears, representing a large, partially
filled diverticulum (D) The extension (arrows) corre-
sponds to the elongated neck of the diverticulum.
л Fig. 11.63 a Multiple pseudodiverticula (arrows) with
wall hypertrophy (cursors). The protrusion of the
diverticula through gaps in the bladder wall can be
seen. HB = bladder.
л b Large pseudodiverticulum (D). neck of diverticu-
lum (arrow), and wall hypertrophy (12.8 mm) in be-
nign protuberant prostatic hyperplasia (PR).
► Indented Bladder, Operated Bladder
7 7 Urinary Tract 352
Bladder shape can also be altered by extrinsic
indentation from a tumor, an enlarged uterus,
colonic gas, or adherent bowel loops.
A special case is a bladder substitute that has
been reconstructed from bowel. The ileal neo-
bladder resembles a normal full bladder but is
distinguished by its asymmetry and thin wall
(Figs. 11.64 and 11.65).
a Fig. 11.64 Scarring and deformity of the bladder (HB)
caused by old peritonitis following severe colitis and
colostomy placement. Polygonal bladder shape with
tapered extensions and ill-defined walls.
a Fig. 11.65 Ileal bladder substitute following bladder
tumor surgery. The substitute bladder has an irregu-
lar shape and no clearly defined wall (the ileal wall is
not visualized in the standard 3.5 MHz scan).
Intracavitary Mass
Hypoechoic
► Malformations
► Dilated Renal Pelvis and Ureter
► Renal Pelvic Mass, Ureteral Mass
► Changes in Bladder Size or Shape
▼ Intracavitary Mass
I JE^Hypoechoic
[ Hyperechoic
► Echogenic
► Wall Changes
► Blood Clots
► Bladder Sludge
► Bladder Papilloma
► Polypoid Bladder Carcinoma
► Mesenchymal Tumors
► Blood Clots
Blood clots in the bladder are usually iatrogenic
following the construction of a suprapubic
bladder fistula, but they can also result from
inflammations, cytostatic therapy, coagulation
disorders, and tumors. If they are mobile, the
diagnosis is easily made. But clots adherent to
the bladder wall require differentiation from
polypoid tumors, which they resemble in their
mixed hypoechoic-hyperechoic structure. This
differentiation can be made by demonstrating
their mobility and possible shape changes
when the patient is repositioned or by instilling
fluid into the bladder through an indwelling
catheter (Figs. 11.66 and 11.67).
Bladder tamponade. Bladder tamponade is
caused by extremely heavy clot formation,
leading to severe compression pain and com-
pletely obstructing the outflow of urine. Gen-
erally it requires operative treatment. Sono-
graphically, bladder tamponade appears as a
tumorlike mass, usually slightly heterogeneous
to hypoechoic, that completely occupies the
bladder lumen. Residual anechoic urine is
sometimes detectable (Figs. 11.68 and 11.69).
a Fig. 11.66 Clotted blood in the bladder (HB), lower
abdominal transverse scan.
a Tumorlike echo texture (arrow).
a b The mass is no longer seen after several position
changes, proving that it is not a real tumor. Its posi-
tion also changes on standing. Other ways to distin-
guish a clot from tumor are to repeat the scans with
different degrees of bladder distention or rapidly fill
the bladder through an indwelling catheter.
a Fig. 11.67 Large polypoid blood clot (arrow), appear-
ing as an echogenic mass on the bladder floor. The
clot showed motion-dependent shape and position
changes with transient swirling of clot particles. HB =
bladder.
Fig. 11.68 Incomplete bladder tamponade.
a Bizarre, tumorlike hypoechoic mass (arrow) with a
small amount of residual free urine.
< b The clot moved after several position changes,
excluding a tumor. HB = bladder.
** Fig. 11.69 a Bladder tamponade requiring surgery.
The bladder is filled by hypoechoic clot with a non-
homogeneous structure.
< b Differential diagnosis of bladder tamponade. The
bladder (HB) has been invaded by sigmoid carcinoma
(T). which completely fills the bladder lumen.
Intracavitary Mass 353
► Bladder Sludge_____________________________________________________________________________
Sediment found in the bladder usually consists
of urinary precipitates or pus. It presents a
shifting or mobile sludge structure much like
that seen in the gallbladder. The mobility of
bladder sludge will generally distinguish it
from flat, sessile bladder-wall tumors and areas
of hypertrophic wall thickening (Fig. 11.70).
* Fig. 11.70 Purulent bladder sediment in a patient
with pyonephrosis.
► Bladder Papilloma________________________________________________________________________
Most benign and malignant bladder tumors
appear sonographically as exophytic intralumi-
nal masses or as plaquelike lesions infiltrating
the bladder wall. Benign bladder papilloma is
an example of an exophytic tumor. Other than
the loose correlation between tumor size and
biological behavior, there are no sonographic
criteria that can confidently distinguish a be-
nign papilloma from papillary carcinoma. De-
tectable wall infiltration is suggestive of carci-
noma, however. This requires differentiation
from an adenoma of the prostatic median
lobe protruding into the bladder
(Figs. 11.71-11.73 and Fig.11.55).
« Fig. 11.71 Polypoid bladder tumor (papillary tumor
by cystoscopy, urothelial carcinoma by histology):
lobulated hypoechoic mass (arrow) on the bladder
floor. Detected incidentally in a 46-year-old man.
HB = bladder.
* Fig. 11.72 Bladder papilloma (arrow): lobulated. nar-
row polypoid mass occupying a constant position in
the bladder. Next to it is a hyperechoic mass with an
acoustic shadow (S): bladder stone. HB = bladder.
11 Urinary Tract 354
«Fig. 11.73 Median-lobe adenoma (benign prostatic
hyperplasia), color Doppler.
a Polypoid mass extending into the bladder lumen.
Apparent wall infiltration, scant peripheral vascular-
ity.
•< b Longitudinal scan angled slightly downward shows
that the tumor is connected to the median lobe of
the prostate. HB = bladder.
► Polypoid Bladder Carcinoma .
Most benign and malignant bladder tumors
arise from the transitional epithelium (urothe-
lium). Other tumor types include squamous
cell carcinomas (often associated with schisto-
somiasis), adenocarcinomas, and mesenchymal
tumors (rhabdomyosarcoma, seen mainly in
children). The UICC staging system is shown
in Fig. 11.98. The most common malignant
bladder tumor is urothelial carcinoma. Mor-
phologically, approximately 70% of malignant
bladder tumors display a papillary, almost vil-
lous type of growth. A small percentage are
solid or nodular. Bladder carcinomas metasta-
size chiefly to the regional lymph nodes along
the iliac vessels. They can also seed hematoge-
nously to the liver, lung, and bone marrow.
Bladder carcinomas may become ulcerated,
and therefore typical complaints such as ur-
gency are usually accompanied by hematuria.
Sonographic features. Polypoid bladder carci-
noma is easily detected sonographically in a
well-distended bladder when the lesion is
larger than 5 mm. Exceptions are tumors lo-
cated on the floor or roof of the bladder. Ultra-
sound demonstrates a nonhomogeneous inter-
nal echo pattern with smooth or lobulated,
often hyperechoic, margins (Figs. 11.74 and
11.75). Some tumors are pedunculated and ex-
hibit a cauhflower-like structure. An intensely
echogenic “hood” suggests a fibrous or partially
calcified tumor surface, which reportedly is
more characteristic of squamous cell carci-
noma2. The sonographic staging5 of a pre-
sumed or detected bladder carcinoma requires
evaluating the deeper wall structures.
Sensitivity of ultrasound. Ultrasound has only
about a 50% sensitivity in the diagnosis of blad-
der tumors7. This results from the low detec-
tion rate of small tumors and precancerous
lesions confined to the mucosa, tumors located
on the bladder roof or anterior wall, and multi-
ple tumors. Other lesions that usually escape
sonographic detection are foci of simple or
atypical hyperplasia, small urothelial papillo-
mas, carcinoma in situ, plaquelike urothelial
carcinomas, and small papillary carcinomas.
Differentiation from clot. It is difficult to dis-
tinguish bladder carcinoma from intravesical
clots. The following criteria are helpful in this
regard:
► A mass on the bladder roof on sidewalls is
suggestive of neoplasia.
► Movement of the mass when the patient is
repositioned suggests a clot (no movement is
more consistent with a neoplasm).
► Swirling echoes and a change in shape and
size on rapid filling of the bladder suggest a
blood clot.
► Color Doppler examination: vascularity sug-
gests a tumor, while lack of vascularity (low
flow velocity) is more consistent with a clot.
► Wall infiltration positively identifies the
mass as a tumor.
► Repeat scans should always be obtained to
check the constancy of the finding!
A bladder tumor is rarely the result of invasion
by prostatic carcinoma, because that tumor
arises from the outer zone of the prostate and
does not extend toward the bladder floor like a
median-lobe adenoma (Fig. 11.76).
a Fig. 11.74 Polypoid bladder tumor (T; papillary uro-
thelial carcinoma).
a Intravesical mass with irregular margins (blooming
effect causes the surface to appear more echogenic).
a b Irregular tumor vessels are detected, proving that
the mass is not a clot.
a c Infiltration of the seminal vesicle (SB) is detected,
indicating a stage T4a tumor by ultrasound (see
Fig. 11.98)
* Fig. 11.75 Polypoid bladder tumor (T). Histology
(after transurethral resection) indicated urothelial
carcinoma without bladder wall infiltration (stage
pTa).
a Hypoechoic tumor with an echogenic rim and no
detectable bladder wall infiltration. HB = bladder.
a b Color Doppler shows spotty vascularity.
a Fig. 11.76 Known local metastatic prostatic carci-
noma, histologically confirmed. The tumor (T) has
infiltrated the bladder floor and obstructed the ureter
(U). The tumor regressed completely after combined
hormonal and chemotherapy. HB = bladder.
Intracavitary Mass 355
► Mesenchymal Tumors________________________________________________________________________________________________
The rare mesenchymal tumors rhabdomyoma,
rhabdomyosarcoma, and reticuloendothelial
tumors are sonographically indistinguishable
from urothelial carcinoma, and so the same
ultrasound criteria are used for these tumors
as for carcinoma.
Hyperechoic_____________________________________________________________
— ► Urinary Catheter
► Blood Clots
► Polypoid Bladder Tumor
► Benign Prostatic Hyperplasia
► Lipoma, Fibroma, Myoma, Hemangioma
► Ureterocele
► Artifacts
► Urinary Catheter____________________________________________________________________________
The most common hyperechoic mass seen in
the bladder is a urinary balloon catheter. The
catheter itself appears sonographically as
bright parallel walls with a central anechoic
fluid band. The balloon appears as a target
figure with a hyperechoic wall and a bright
central echo representing the catheter tip
(Figs. 11.77 and 11.78).
Pigtail catheters and catheter fragments ex-
hibit only a double wall with a central anechoic
lumen (Fig. 11.79).
a Fig. 11.77 Urinary catheter balloon (arrow): echo-
genic balloon wall surrounding a central high-level
echo (catheter tip). HB = bladder.
a Fig. 11.78 Urinary catheter (DK) in a lower abdominal
longitudinal scan: echogenic parallel walls with a cen-
tial anechoic, fluid-filled lumen. HB = bladder.
a Fig. 11.79 Hyperechoic drain, placed to stent a ureter
obstructed by urothelial carcinoma.
► Blood Clots
7 7 Urinary Tract 356
Clots with a hyperechoic or irregularly hyper-
echoic structure do occur but otherwise show
the same sonographic features as the more
hypoechoic-appearing forms (Fig. 11.80). Their
diagnosis is described above.
a fig. 11.80 Hyperechoic blood clots.
a Aggregate clot on the bladder roof (arrows).
a b After body movement, fragments of the clot ap-
pear as bright swirling echoes.
► Polypoid Bladder Tumor
Like blood clots, benign and malignant bladder
tumors may appear hyperechoic owing to the
blooming effect—an acoustic enhancement
that occurs when sound travels through fluid
spaces (Fig. 11.81). The true echogenicity of the
mass can be appreciated by lowering the TGC
(time gam compensation) setting. In other re-
spects the tumors have the same features as
the hypoechoic tumors mentioned above.
Some bladder tumors may show a high-am-
plitude entry echo (Fig. 11.75). Squamous cell
carcinomas occasionally contain superficial cal-
cifications5.
« Fig. 11.81 Benign bladder papilloma (cursors), his-
tologically confirmed Typical location on the bladder
floor near the ureteral orifices: hyperechoic lobu-
lated mass Here the echogenicity of the mass is
enhanced due to a blooming effect.
► Benign Prostatic Hyperplasia
Benign prostatic hyperplasia (BPH) is a mass
extrinsic to the bladder. BPH due to a median-
lobe adenoma can mimic an exophytic tumor
of the bladder floor. BPH may be very hypo-
echoic as well as hyperechoic, depending on its
histology (see Chapter 12).
Unlike bladder carcinoma, BPH shows a visi-
ble connection with the prostate on dynamic
ultrasound examination. It has a homogeneous
echo structure, smooth margins, and a conical
or globular shape (see Chapter 12) (Fig. 11.82).
a Fig. 11.82 Adenoma of the prostatic median lobe
(benign hyperplasia) appears as a relatively echogenic
mass protruding into the bladder (HB).
a Polypoid tumor mass (T) in the bladder.
a b Angling the scan demonstrates BPH. ruling out a
primary bladder tumor. P = prostate.
► Lipoma, Fibroma, Myoma, Hemangioma
These somewhat rare benign tumors have
smooth margins and high, homogeneous echo-
genicity. They cannot be reliably classified as
benign or malignant by ultrasound.
► Ureterocele_________________________
A ureterocele, on the other hand, can be accu-
rately diagnosed sonographically as an intra-
luminal mass. Its ultrasound appearance is un-
mistakable: a balloonlike structure with a thin
echogenic wall and anechoic lumen, protrud-
ing into the bladder from the ureteral ridge.
Stone formation is common in ureteroceles,
however, and can produce high-level internal
echoes with acoustic shadows. Only large ure-
teroceles are difficult to recognize as arising
from the ureteral ridge, appearing as a thin,
elliptical membrane within the bladder lumen
(Figs.11.83 and 11.84).
!n
a Fig. 11.83 Ureterocele (Z): anechoic urine and echo-
genic contents (stone, horizontal arrow, partial
acoustic shadow S). The ureteral wall appears as a
hyperechoic ring that has herniated into the bladder
(HB). The ureter (U) is partially obstructed.
a Fig. 11.84 Large right-sided ureterocele: hyperechoic
elliptical membrane in the bladder lumen.
о Lower abdominal transverse scan.
a b Lower abdominal longitudinal scan. (Dr. K. Ringe-
wald, Hofgeismar, Germany)
Intracavitary Mass
► Artifacts______________________________
Hyperechoic bladder-wall indentations and
motion-related or image artifacts can mimic
true masses in the bladder.
Wall indentations. These often result from in-
complete bladder distension (Fig. 11.85a).
Ureteral jet. A ureteral jet is a reflection caused
by urine flowing into the bladder from the
ureteral orifice. It appears as a hyperechoic
cone that exhibits color-flow signals in color
Doppler because of its motion (Fig. 11.85b).
Side-lobe artifact. A side-lobe artifact is
caused by paravesical hyperechoic structures
that are projected into the fluid medium owing
to the physics of sound transmission from a
convex transducer (Fig. 11.86).
a Fig. 11.85 Hyperechoic wall indentation in a partially
filled bladder, with a ureteral jet.
a Slightly filled bladder (HB) with wall indentations
mimicking an hourglass bladder.
b In color Doppler, a jet of urine entering the bladder
produces a flare of color pixels, see Fig. 11,89a.
a Fig. 11.86 Hyperechoic side-lobe artifacts caused by
highly reflective structures located lateral to the
bladder. HB = bladder.
Echogenic
7 7 Urinary Tract 358
— ► Foreign Bodies
► Bladder Calculi
► Foreign Bodies__________________________________________________________________________________
Foreign bodies such as pins, wires, or small
tubes may be inserted into the urethra inad-
vertently during masturbation. Most foreign
bodies found in the bladder are iatrogenic,
however. At ultrasound they produce very
high-level intraluminal echoes with acoustic
shadowing (Figs. 11.87,11.92b).
-< Fig. 11.87 Echogenic catheter fragment in a not en-
tirely echo-free bladder caused by bleeding after
catheter avulsion.
► Bladder Calculi----------------------------------------------------------------------------
Stones in the bladder are common, but consid-
erably less so than in the kidney or ureter.
Uroliths that have passed through the ureter
are occasionally still imaged in the bladder
before entering the urethra. Otherwise, bladder
calculi are found in association with incom-
plete bladder emptying, bladder diverticula,
or a ureterocele. Their ultrasound appearance
is like that of other stones: a high-level echo
that casts an acoustic shadow and moves when
the patient is repositioned.
Stones resting on the bladder floor may be
missed if they are located in blind spots, but
their mobility and acoustic shadows can con-
firm the diagnosis (Figs. 11.88-11.90).
a Fig. 11.88 Bladder stone: echogenic mass on the
bladder floor (cursors) with partial acoustic shadow-
ing. HB = bladder.
a Fig. 11.89 Small bladder stone (arrow) with an acous-
tic shadow (S).
a Transverse scan. HB = bladder; U = ureteral jet.
a b Longitudinal scan.
a Fig. 11.90 Hyperechoic mass (left arrow, right ure-
teral orifice) with an acoustic shadow (S), represent-
ing a ureterocele with a stone. A second ureterocele
with a thin echogenic membrane appears near the
left onfice (right arrow). HB = bladder.
Wall Changes
Diffuse Wall Thickening
Wall Changes 359
► Bladder- Wall Hypertrophy
The normal wall thickness of a distended blad-
der is 1-3 mm and does not exceed 5 mm
(Fig. 11.91).
Diffuse bladder-wall hypertrophy greater
than 5 mm may be found in association with
inflammations (e.g., after prolonged catheter-
ization) or schistosomiasis in some regions, but
it most commonly results from infravesical ob-
struction, often combined with pseudo-diver-
ticula (Figs. 11.92 and 11.93). Inadequate blad-
der distension may be misinterpreted as dif-
fuse wall thickening (Fig. 11.94).
a Fig. 11.91 Normal three-layered wall (cursors) of a
well-distended bladder (HB).
a Fig. 11.92 Diffuse bladder-wall thickening secondary
to an infravesical prostatic obstruction (BPH). HB =
bladder.
a Bladder-wall thickening without a pseudodivertic-
ulum (cursors).
a b Diffuse wall thickening with pseudodiverticulum
(arrows). IC = echogenic indwelling catheter.
«м Fig. 11.93 Massive wall thickening, measuring up to
20 mm at some sites and exceeding the wall thick-
ness of an empty bladder (compare with Fig. 11.94).
IC w indwelling catheter. FL e urinary fluid.
* Fig. 11.94 Apparent diffuse wall thickening (cursors)
in a partially distended bladder (HB).
► Flat Bladder Tumor
It can be difficult or impossible to distinguish
diffuse bladder-wall hypertrophy from a carci-
noma, sarcoma, or lymphoma that has formed
a plaquelike growth on the bladder wall.
If ultrasound raises suspicion of a flat carci-
noma on the bladder wall, further tests such as
cystoscopy, radiography, and CT should be car-
ried out (Fig. 11.95).
11 Urinary Tract 360
« Fig. 11.95 Plaquelike bladder tumor (histology: pap-
illary urothelial carcinoma, probably a diverticular
tumor).
a Tumor has spread over the bladder floor and (in
other planes) into both sidewalls, almost extending
to the bladder roof on the left side. HB = bladder.
b Tumor-encased diverticula (D). The internal
echoes are caused by tumor tissue inside the diver-
ticula. T = tumor.
Circumscribed Wall Thickening____________________________________________
► Malformations
► Dilated Renal Pelvis and Ureter
► Renal Pelvic Mass, Ureteral Mass
► Changes in Bladder Size or Shape
► intracavitary Mass
▼ Wall Changes
Diffuse Wall Thickening
Д ► Lncumscribed Wall Thickening
= >Concavlties and Convexities
— ► Bladder-Wall Hypertrophy
► Bladder-Wall Edema
► Bladder Carcinoma
► Blood Clots
► Bladder- Wall Hypertrophy____________________________________________________________
Bladder-wall hypertrophy is the most frequent
cause of circumscribed bladder-wall thickening
demonstrated by ultrasound. The wall thick-
ness often exceeds 7 mm in cases due to infra-
vesical obstruction. Pseudodiverticula gener-
ally appear as anechoic, usually multiple, sharp
or rounded protrusions of the bladder wall.
They most commonly occur on the bladder
floor and sidewalls, rarely affecting the bladder
roof (Figs. 11.96 and 11.97).
Sites of inflammatory wall thickening due to
infiltration from adjacent organs, as in Crohn
disease of the terminal ileum or peridiverticu-
litis, are not uncommon.
The differential diagnosis should include
clots or sludge adherent to the bladder wall, a
flat circumscribed tumor, and especially a
faulty examination technique with inadequate
bladder filling.
a Fig. 11.96 Wall hypertrophy in a trabeculated bladder
with incipient pseudodiverticula. HB = bladder.
a В-mode image, lower abdominal transverse scan:
relatively long, serrated area of circumscribed wall
thickening (arrows) with adherent, fluid-filled bowel
segment (D). Tumor was excluded by cystoscopy.
Side-lobe artifacts are also visible.
a b Color Doppler shows scattered vascular spots but
no tumor vascularity. DA = bowel wall.
Fig. 11.97 Circumscribed wall thickening on the
bladder floor, raising suspicion of a tumor. HB =
bladder.
a Lower abdominal transverse scan. Color Doppler
shows no vessels. PR = prostate.
* b Longitudinal scan shows a polypoid tumor mass
(arrow). P = prostate. Cystoscopy showed a trabecu-
lated bladder due to BPH.
► Bladder- Wall Edema
Circumscribed bladder-wall edema is usually
based on mechanical irritation and inflamma-
tion from a bladder catheter, and so generally
the cause is apparent.
► Bladder Carcinoma__________________________________________________________________
The most important sonographic diagnosis is a
flat, circumscribed carcinoma of the bladder
wall. It is occasionally difficult to distinguish
from bladder-wall hypertrophy. Tumor spread
through the bladder wall to neighboring or-
gans, especially adjacent bowel segments (e.g.,
the sigmoid colon), and the presence of lymph
node metastases prove that the lesion is a ma-
lignant process. Conversely, it is not uncommon
to find bladder invasion by tumors in adjacent
organs, such as ovarian or rectosigmoid cancer.
Flat, circumscribed bladder carcinoma most
commonly occurs on the bladder floor in the
area of the trigone and ureteral orifices, leading
to ureteral obstruction (Figs. 11.99-11.101).
Sonographic tumor staging is of limited ac-
curacy in transabdominal ultrasound, but tran-
surethral scanning is more reliable. The system
for staging bladder tumors is shown in
Fig. 11.98.
Bladder carcinoma is isoechoic to the rest of
the bladder wall. Its outline is usually wavy but
occasionally smooth. Sites of wall thickening
near diverticula are always suspicious for car-
cinoma, as they are considered premalignant
lesions (see Fig.11.105).
Involve-
ment
outside the
bladder
NewTNM
stage
TNM In-
volvement
of urothel-
ium, lamina
propria,
muscle lay-
ers, adventitia
Tl T2 ТЗа ТЗЬ T4
.Prostate.
Uterus,
i
.vagina,
abdomi-
nal wall,
pelvis
Wall Changes
л Fig. 11.99 Carcinoma involving the left side of the
bladder floor. HB = bladder. R = rectum.
a Hypoechoic, slightly nonhomogeneous mass (T)
spread over the bladder floor.
a b Shifting the probe slightly shows involvement of
the left ureteral orifice (arrow) causing ureteral ob-
struction (U).
a Fig. 11.98 Staging of bladder carcinoma (after refer-
ence 10).
a c Color Doppler: atypical spotty vascularity.
** Fig. 11.100 Tumor spread over the bladder floor (ar-
rows), with ureteral obstruction (U). HB = bladder.
< Fig. 11.101 Recurrent urothelial carcinoma (arrow)
in an 87-year-old woman two years after transure-
thral resection: flat, circumscribed, hypoechoic mass
on the bladder floor.
► Blood Clots______________________________________________________________________________
Blood clots or viscous sludge adherent to the
bladder wall may be confused with real tumors
(see above).
Concavities and Convexities
J1 Urinary Tract 362
► Malformations
► Dilated Renal Pelvis and Ureter
► Renal Pelvic Mass. Ureteral Mass
► Changes In Bladder Size or Shape
► Intracavitary Mass
▼ Wall Changes
— ► Ureteroceles
► Diverticula
► Diffuse Wall Thickening
► Circumscribed Wall Thickening
* Concavities and Convexities
► Ureteroceles_____________________________________________________________________________________
Protrusions from the bladder floor near the
ureteral orifices are ureteroceles. Their ultra-
sound appearance is described above
(Fig. 11.102).
* Fig. 11.102 Ureterocele: elliptical, hyperechoic ure-
teral wall herniating into the bladder from the area of
the right ureteral orifice. The wall layers can be
identified.
► Diverticula
Congenital bladder diverticula are based on a
congenital weakness in the bladder wall, al-
lowing a localized full-thickness herniation of
the wall. They may be solitary or multiple and
range in size from very small to extremely
large. Diverticula predispose to stone forma-
tion and diverticular carcinoma (Fig. 11.105),
which is why they should be surgically re-
moved.
At ultrasound, diverticula typically appear as
anechoic round or oval masses located outside
the bladder wall. Most diverticula are con-
nected to the bladder lumen by a neck or stalk.
The wall of the diverticulum is thinner than the
rest of the bladder wall. Diverticula may reach
a size exceeding that of the bladder, often caus-
ing them to be mistaken for cysts or the blad-
der itself. The diagnosis of diverticula is facili-
tated by examining the bladder in various de-
grees of distension (Figs. 11.103-11.105).
Pseudodiverticula are secondary reactions
to subvesical obstructions, and so they are usu-
ally associated with wall hypertrophy produc-
ing a trabeculated bladder (see below;
Fig. 11.106). They represent protrusions of the
bladder mucosa between bundles of hypertro-
phied muscle.
Fig.11.103 Large bladder diverticula: one located
cranially (D) with a well-defined diverticular neck,
and one located in the bladder floor, separated
from the mam lumen by an echogenic wall and con-
taining a stone (arrow: acoustic shadow S). HB
bladder.
-« Fig.11.104 Diverticulum (D) in the bladder floor,
with a narrow neck (arrow). The sac contains a large
stone (ST) with a wide acoustic shadow (S). HB w
bladder.
** Fig. 11.105 Extensive diverticular tumor (arrows):
hypoechoic mass spread over the bladder floor and
occupying the diverticula (D). HB = bladder.
< Fig. 11.106 Numerous pseudodiverticula (D), some
with a diverticular neck. Bladder-wall hypertrophy.
HB - bladder.
References
la. Feuchtner G, F. Frauschner, L Pallwein et al. Ul-
traschall 2000, 26. Dreilandertreffen SGUM/DE-
GUM/OGUM Basel 2002.
1b. Gladisch R. Praxis der abdominellen Ultraschall-
diagnostik. 2nd ed. Stuttgart: Schattauer 1992.
2. Gottfried HW. Ultraschall in der Urologie. In:
Jocham D, Miller H (eds.). Praxis der Urologie.
Stuttgart: Thieme 1995; p. 55-75.
3. Hohenfellner R, Walz RH. Primarer und se-
kundarer Megaureter. In: Hohenfellner R, Thiiroff
JW, Schulte-Wissermann H. Kinderurologie in
Klinik und Praxis. Stuttgart: Thieme 1986: p. 268.
4. Jequir S, Paltiel H, Lafortune M. Ureterovesical jets
in infants and children: duplex and color Doppler
US. Radiology 1990:175:349.
5. Jocham D. Maligne Tumoren der Harnblase. In:
Jocham D, Miller H (eds.). Praxis der Urologie.
Stuttgart: Thieme 1995: p. 49-115.
6. Kropfl D. Harnleiteranomalien. In: Jocham D,
Miller H (eds.). Praxis der Urologie. Stuttgart:
Thieme 1995; p. 377.
7. Malone PR, Weston-Anderwood J, Aron PM.
Transcutaneous ultrasound in the detection of
superficial bladder cancer. Brit J Urol
1985:58:664 ff.
8. Mostofi FK, Davis CJ. Histological Typing of Kid-
ney Tumors. Berlin: Springer 1998.
9. Riedmiller H, Kohl U. Vesikoureteraler und ves-
ikorenaler Reflux. In: Jocham D, Miller H (eds.).
Praxis der Urologie. Stuttgart: Thieme 1995;
p. 384-388.
10. Wilmanns W., Huhn D., Wilms K. Internistische
Onkologie. Stuttgart: Thieme 2000: p. 534.
Wall Changes 363
12 Prostate, Seminal Vesicles,
Testis, Epididymis
Prostate 367
▼ The Prostate
367
► Anatomy and Topography
368
368
370
► Benign Prostatic Hyperplasia
► Prostatic Carcinoma
► Chronic Prostatitis
▼ Small Prostate
► Regular
► Operated Prostate
I— ► Radiation Therapy
► Echogenic
► Chronic Prostatitis
▼ Circumscribed lesion
Anechoic
— ► Abscess, Cavity
► Utricular Cyst, Ectopic Ureter
— ► After Transurethral Resection
► Hypoechoic
— ► Benign Prostatic Hyperplasia
---► Prostatic Carcinoma
► Echogenic
► Stones, Calcifications
► “Surgical Capsule”
371
371
372
372
372
373
375
Seminal Vesicles 376
▼ Diffuse Change
► Hypoechoic
— ► Vesiculitis
— ► Tumor Infiltration
▼ Circumscribed Change
IT* Anechoic
—— ► Dilatation, Cyst
— ► Abscess
► Echogenic
► Stones, Calcifications
► Irregular
— ► Chronic Vesiculitis
— ► Tumor Infiltration
376
376
377
377
378
378
Testis, Epididymis 379
▼ Diffuse Change
► Enlargement
► Orchitis
► Testicular Torsion
► Decreased Size
— ► Anorchism, Cryptorchidism
— ► Hypogonadism
► Atrophy
379
379
380
380
381
381
381
383
383
383
384
► Epididymitis
385
385
386
► Scrotal Hernia
72 Prostate, Seminal Vesicles,
Testis, Epididymis
C. Schmidt
Prostatic changes. Diseases of the prostate
consist of inflammatory changes (prostatitis),
hyperplasias, and neoplasias. Inflammatory
changes are most common in young men,
while hyperplasia and carcinoma are typical
diseases of aging. The incidence of prostatic
carcinoma rises with aging. Its peak age inci-
dence is the highest of all malignancies, be-
tween the seventh and eighth decades. As a
result, prostate cancer has become the leading
cause of death in men over age 55. Benign
prostatic hyperplasia, which involves a nodular
transformation of the gland, is based on a hor-
monal disorder.
Hyperplasia predominantly affects the upper
central portion of the gland, while carcinoma
tends to arise in the lower peripheral zone2.
This is important sonographically because focal
lesions located in the median lobe of the pros-
tate generally represent hyperplasia, while
cancers are typically located in the periphery
of the gland. When it comes to differentiating
between benign and malignant prostatic le-
sions, transabdominal ultrasound is less re-
warding than transurethral and transrectal
scanning (which are not described here but
may be found in the specialized urological lit-
erature). Transabdominal scanning is of un-
questioned value in assessing the size of the
enlarged prostate and in the general detection
of pathomorphological changes. Besides en-
largement and structural abnormalities, ultra-
sound can demonstrate fibrotic areas, calcifica-
tions, and cysts.
Seminal vesicle changes. The seminal vesicles
are paired glands that secret fluid necessary for
the transport and nutrition of the sperm. Pri-
mary diseases of the seminal vesicle are ex-
tremely rare, but the gland is commonly in-
volved by diseases spreading from adjacent
organs (invasion by prostatic tumor!). Cystic
dilatations and calcifications are occasionally
noted at ultrasound.
Testicular changes. The location of the testes
makes them easily accessible to ultrasound
scanning. As a result, sonography is the modal-
ity of choice for investigating inflammatory
changes and masses.
he Prostate
The Prostate
Anatomy and Topography_________________________________________________________________
Lying against the posterior bladder floor, the
prostate can be clearly visualized by placing the
transducer over the distended bladder and an-
gling the scan plane caudally (Fig. 12.2), The
paired seminal vesicles are found posteriorly
between the bladder floor and prostate (see
below). The urethra runs from the funnel-
shaped urethral orifice through the center of
the prostate, defining a periurethral zone that
can be distinguished from the inner and outer
zones (Fig. 12.1).
This is of key importance in sonography,
because it is primarily the stroma (smooth
muscle) and glandular tissue in the periure-
thral and inner zones (transitional zone) of
the posterosuperior median lobe that are sus-
ceptible to hyperplasia. The remaining portions
of the gland are compressed by the hyperplas-
tic tissue, forming an apparent capsule called
the “surgical capsule." Carcinomas, on the
other hand, generally arise in the predomi-
Structure
► Cross anatomy: right lobe, left lobe,
median lobe (posterior, superior)
► Zonal anatomy: periurethral zone, inner
zone, outer zone with capsule
Relations
► Superior, bladder trigone and ureteral
orifices
► Posterosuperior: seminal vesicles
► Inferior: corpora cavernosa
► Posterior: rectum
nantly glandular outer zone. These zones of
predilection in the prostate aid the examiner
in differentiating between carcinoma and hy-
perplasia. Special attention is given to the pro-
static capsule surrounding the outer zone in
the evaluation of transcapsular tumor spread.
Periurethral zone
Mucosa
Inner zone,
submucosa
Tubuloalveolar gland
with stroma
Capsule
л Fig. 12.1 Coronal section through the prostate, dem-
onstrating the zones of the prostate, the bladder
trigone with the ureteral orifices, and the seminal
vesicles posterior to the prostate.
** Fig. 12.2 Normal prostate (P, cursors).
a Lower abdominal transverse scan angled caudally
demonstrates the chestnut-shaped, homogeneous
prostate (P) posteroinferior to the bladder (HB).
b Lower abdominal longitudinal scan. The rectum is
visible at a more posterior level.
Enlarged Prostate
12 Prostate, Seminal Vesicles, Testis, Epididymis 368
Regular_________________________________________________________________
r Enlarged Prostate
► Benign Prostatic Hyperplasia
► Prostatic Carcinoma
► Acute Prostatitis
► Benign Prostatic Hyperplasia________________________________________________________________
Benign prostatic hyperplasia (BPH) leads to
prostatic enlargement that may be either cir-
cumscribed (see below) or diffuse. The volume
of the prostate is determined by multiplying
length (longitudinal ultrasound section) *
width * depth (in transverse section) and di-
viding the product by the factor 0.523 (this
calculation is already built into scanners and
documentation programs). This formula is
fairly accurate in transabdominal ultrasound
but is more accurate in transrectal scanning.
Here too, however, the measured volume de-
viates from the actual volume or weight by up
to 2O%10. Enlargement that exceeds 80 ml is
generally referred for transabdominal prosta-
tectomy. However, estimated size alone is not a
reliable indictor of clinical manifestations,
which depend more on the location of the hy-
perplasia.
A coarser echo texture is seen with diffuse
enlargement, consisting of a mixed pattern of
hypoechoic and hyperechoic elements. Overall,
the affected tissue appears less echogenic than
the normal gland (Figs. 12.3 and 12.4).
a Fig. 12.3 Early benign prostatic hyperplasia (BPH) (P):
homogeneous, hypoechoic enlargement of the pros-
tate, which has a slightly irregular shape but smooth
borders (cursors). Volume = 30 ml. fairly good delin-
eation. HB =» bladder.
a Fig. 12.4 BPH (cursors): homogeneous structure,
fairly smooth borders.
a Lower abdominal transverse scan shows a large,
convex indentation in the bladder floor with a small
anechoic area cranially.
a b Lower abdominal longitudinal scan. The indenta-
tion of the bladder floor is caused by the posterosu-
penor median lobe. The anechoic extension from the
bladder floor represents the urethral orifice. (The ap-
parent cystic mass in a is cut obliquely by the scan.)
QJ
► Prostatic Carcinoma___________________________________________________________________________________
Because carcinoma arises in the outer zone of
the prostate in 95% of cases, considerable time
passes before urinary tract obstruction occurs.
As a result, early prostatic cancers are almost
always an incidental finding at ultrasound, ap-
pearing as focal lesions (see below). In the ad-
vanced stage, the tumor has permeated the
central portions of the prostate, penetrated
the capsule, and invaded surrounding struc-
tures, particularly the seminal vesicles, bladder,
and rectum. Local tumor extent is classified
according to the modified TNM system7 (Table
12.1).
Extent and structure. Transabdominal ul-
trasound is imprecise and tends to understage
the extent of disease. Again, transrectal and
tiansurethral scanning yield significantly bet-
ter results.
Prostatic carcinoma usually has a predomi-
nantly hypoechoic structure with irregular out-
Table 12.1 Staging of prostatic carcinoma by the TNM system (after reference 7)
TX Primary tumor cannot be assessed
TO No evidence of primary tumor
T1 Tumor not palpable, detected incidentally at screening or TUR
T1 a Fewer than three foci, well differentiated
T1 b More than three foci, poorly differentiated
T2 Palpable tumor confined to the prostate; tumor size:
T2a < 1.5 cm
T2b >1.5 cm or involves more than one lobe
T3 Invasion of the bladder neck or seminal vesicles
T4 Tumor fixed in the lesser pelvis, invades adjacent structures
lines. Hyperechoic tumors are also seen. Differ-
entiation from benign prostatic hyperplasia is
an ever-recurring issue in routine examina-
tions. The main criteria for malignancy are
the presence of peripheral, asymmetrical tu-
mor structures, irregular margins, and exten-
sion through the capsule; diffuse spread is not
very characteristic (Figs. 12.5 and 12.6).
a Fig. 12.5 Prostatic carcinoma: enlarged prostate (P)
with an approximately normal echo structure but ill-
defined margins. The malignant tumor is barely dis-
tinguishable from BPH. HB - bladder.
a Fig. 12.6 Hypoechoic, predominantly diffuse pros-
tatic enlargement. A circumscribed hard consistency
was noted on digital rectal examination, raising strong
suspicion of carcinoma. HB = bladder: PR = prostate,
о Lower abdominal longitudinal scan: enlarged pros-
tate indenting the bladder floor, consistent with me-
dian-lobe hyperplasia. The gland appears slightly less
echogenic inferiorly.
a b Lower abdominal transverse scan with color Dop-
pler: subtle echopenic area on the left side (arrows)
with atypical vascularity, creating a very high index of
suspicion.
Enlarged Prostate 369
Differentiation from benign prostatic hyper-
plasia can be difficult or impossible by trans-
abdominal ultrasound. Distinguishing morpho-
logical criteria are listed in Table 12.2.
Specificity and sensitivity. The specificity of
transabdominal ultrasound is only 30%, which
is slightly lower than that of transrectal scan-
ning. Observational studies reported 33.7% at-
tendance at digital rectal examination (DRE)
plus transrectal ultrasound (TRUS) and 66.9%
at prostate-specific antigen (PSA). The reported
positive predictive value of digital rectal ex-
amination is 6%-33%. Both digital rectal exami-
nation and prostate-specific antigen can detect
occult prostate cancer. Transrectal ultrasound
is no longer considered a first-line screening
test for prostate cancer, but does play a role in
the investigation of patients with abnormal
DRE or/and PSA.
In prostatic cancer screening, the highest
detection rate (better than 98%) is achieved
Clinical Diagnosis of Prostatic Carcinoma4
An effective early screening program for pro-
static carcinoma consists of digital rectal ex-
amination with assessment of overall size,
median sulcus, surface characteristics, and
consistency (a circumscribed or diffuse “stony
hard” consistency is suggestive of malig-
nancy), combined with the determination of
prostate-specific antigen (PSA). If induration
is noted at palpation and the PSA is between
4 ng/ml (upper normal limit with men over
60 years of age: lower with younger men!)
and 10 ng/ml, there is a 41% chance that
carcinoma is present. With a PSA> 10 ng/ml,
this rises to 72%. The incidence of carcinoma
through the combined use of digital rectal ex-
amination, PSA testing, and transrectal or pref-
erably transurethral ultrasound1. The role of
transabdominal scanning is limited to detect-
is 69% in cases where a hard, discrete nodule
is found in the prostate, and 91 % when the
corresponding PSA is higher than 10 ng/ml.
Thus, the digital findings and PSA are critical
in the early detection of prostate cancer.
Transurethral sonography can support a pre-
sumptive diagnosis of carcinoma, and core
biopsy can confirm the diagnosis. Even with a
negative histology, however, a high PSA is still
considered suspicious for carcinoma, as it is a
specific tumor marker. It is extremely rare for a
histological prostatic malignancy to be iden-
tified as a sarcoma or malignant lymphoma.
ing an abnormal echo structure and making a
presumptive diagnosis or, in cases with con-
firmed carcinoma, assessing tumor extent and
checking for locoregional metastases4.
Table 12.2 Differentiation of prostatic carcinoma from benign prostatic hyperplasia
Prostatic carcinoma
Benign prostatic hyperplasia
► Predominantly hypoechoic or irregular structure
► Peripheral asymmetrical tumor structures
► Irregular outlines
► Capsule breached
► Invasion of seminal vesicles, less commonly of the bladder floor
► Locoregional lymphogenous spread, distant metastases
► Prostate shows low central echogenicity with rounded outlines
► Central hypoechoic tumor structure in the median lobe, indenting
the bladder floor
► Smooth outlines
► Capsule intact
► Displacement, atrophy, and encapsulation of normal peripheral
glandular tissue
► Possible echo-free or echogenic areas
► Acute Prostatitis__________________________________________________________________________________________
Five different histopathological types of pros-
tatitis2 can underlie the rather nonspecific
symptom complex of pain, aching, burning, or
pressure in the anorectal or urogenital region.
Chronic complaints are often referable to a
functional “prostatodynia,” however.
Ultrasonography in acute prostatitis shows
edematous swelling and rounding of the gland,
which has a hypoechoic structure. Focal lesions
(see below) may also be seen. The diagnosis is
based on the clinical presentation plus corre-
sponding sonographic findings or the detection
of a causative microorganism. Swollen, hypo-
echoic seminal vesicles indicate concomitant
inflammatory involvement of those glands
(Fig. 12.7).
12 Prostate, Seminal Vesicles, Testis, Epididymis 370
Histopathological Forms of Prostatitis
► Purulent bacterial prostatitis, which is
often associated with abscess formation.
► Gonorrheal prostatitis, once the most
common form, now rare.
► Granulomatous prostatitis, usually
with an abacterial or allergic cause,
marked histopathologically by destruc-
tive foci, giant cells, histiocytes, and fi-
broblasts.
► Chronic nonspecific prostatitis, in
which the stasis of secretions with the
formation of amyloid bodies can lead to
secondary calcification and thus to
prostatolithiasis and inflammation. It is
diagnosed by detecting the causative
organism in fluid sampled by “milking”
the gland.
► Tuberculous prostatitis, which is asso-
ciated with foci of caseous liquefaction.
Irregular
a Fig. 12.7 Prostatitis (P).
a Lower abdominal transverse scan shows a largely
anechoic mass. HB = bladder.
► Benign Prostatic Hyperplasia
► Prostatic Carcinoma
► Chronic Prostatitis
a b Lower abdominal longitudinal scan shows a small
prostate with a mottled hypoechoic texture and an
anechoic cystic mass (arrow). The rectum (R) appears
posteriorly
► Benign Prostatic Hyperplasia
Varying proportions of stromal or glandular
elements affect the echo structure of benign
prostatic hyperplasia: a preponderance of
stroma causes the hyperplasia to appear more
hypoechoic, while a preponderance of glandu-
lar elements creates a more isoechoic or hyper-
echoic appearance relative to the normal pros-
tate. The result is an irregular sonographic pat-
tern. Hyperechoic calcifications, secretory
stones, and anechoic cystic areas are also seen
(Fig. 12.8).
a Fig. 12.8 Benign prostatic hyperplasia.
a Enlarged prostate with smooth borders, a patchy
hypoechoic structure, and rounded shape.
a b Large prostate protruding into the bladder floor,
nonhomogeneous texture due to numerous echo-
genic (arrows) microcalcifications (amyloid bodies, a
common finding in chronic prostatitis). HB = bladder.
► Prostatic Carcinoma
Benign prostatic hyperplasia and prostatic car-
cinoma may present a predominantly homoge-
neous echo texture or a markedly irregular
structure. The latter is particularly apt to occur
when carcinoma is accompanied by adenoma-
tous hyperplasia and/or fibrous, cystic, or cal-
cifying prostatic elements. These different
components cannot be distinguished by their
transabdominal morphological features
(Figs. 12.9 and 12.10).
a Fig. 12.9 a Advanced prostatic carcinoma (P). which
has already metastasized. Scan shows a large, tumor-
ous prostate with irregular borders, a coarse hypo-
echoic texture, and tumor extension through the
prostatic capsule.
a b Prostatic carcinoma (P). lower abdominal longitu-
dinal scan: invasion of the seminal vesicle (SB), indi-
cating a T3 tumor by ultrasound. HB = bladder.
a Fig. 12.10 Prostatic carcinoma (T), color duplex: hy-
poechoic tumor foci in both lobes (surgery: T3 tu-
mor). HB = bladder; PR = prostate.
Small Prostate
► Chronic Prostatitis________________________________________________________________________________________
The complaints that are associated with acute
and chronic prostatitis are fairly nonspecific,
and so the diagnosis can be established only
by identifying the causative organism and/or
detecting signs of urethral inflammation at
ureterocystoscopy.
The sonographic diagnosis is also uncertain.
Circumscribed hypoechoic or anechoic areas
are found in acute prostatitis, while chronic
prostatitis shows zones of increased density
or calcification that are responsible for the ir-
regular structural transformation (Fig. 12.11
and 12.20).
a Fig. 12.11 Findings consistent with chronic prostati-
tis. HB = bladder, PR = prostate.
a Irregular echo structure with numerous calcifica-
tions arrows; known prostatitis.
a b Small prostate with microcalcifications and an ir-
regular structure (45-year-old man)
Small Prostate
Regular__________________________________________________________________
► Operated Prostate
Radiation Therapy
► Operated Prostate_____________________________________________________________________
A small prostate found at ultrasound is usually
a result of surgery. In patients who have had a
transurethral resection (TUR), the size reduc-
tion results from a complete resection of the
previously enlarged median lobe. Ultrasound
demonstrates a small prostatic remnant and
often shows a funnel-shaped, anechoic ure-
thral orifice formed by the resection defect at
the level of the bladder neck (Fig. 12.12).
A transabdominal total prostatectomy in-
volves removing the enlarged median lobe in
the plane of the surgical capsule, while a trans-
abdominal tumor resection consists of a radical
prostatovesiculectomy, in which case the pros-
tate and seminal vesicles are completely absent
(Fig.12.13).
12 Prostate, Seminal Vesicles, Testis, Epididymis 372
>Fig. 12.12 Small prostate (PR) following transure-
thral resection (TUR). The urethral orifice and pros-
tatic urethra appear widened and anechoic after
TUR. The expanded urethral orifice is funnel-shaped
and fluid-filled (arrow). HB = bladder.
* Fig. 12.13 Prostatectomy for carcinoma: nonvisuali-
zation of the prostate in a transabdominal low trans-
verse scan. Urinary catheter (DK) is in place. Nor-
mally the seminal vesicle or prostate would be vi-
sualized between the bladder floor and rectum (R).
► Radiation Therapy_______________________________________________________________________________________________________
The goal of radiation therapy is complete tumor
destruction. The irradiation also leads to atro-
phy and size reduction of the remaining gland.
A tissue increase discovered at ultrasound sug-
gests a recurrence or, more likely, the local re-
growth of residual tumor.
Echogenic______________________________________________________________
► Chronic Prostatitis
► Chronic Prostatitis________________________________________________________________________________________
The prostate in the end stage of chronic pros-
tatitis is small (Fig. 12.11), consisting only of
glandular remnants and dense lesions such as
fibrosis or calcifications. Such changes are also
commonly seen in prostatic hyperplasia—at
times incidentally—with no prior clinical man-
ifestations of chronic prostatitis.
Circumscribed Lesion
Anechoic______________________________________________________________
► Abscess, Cavity
► Utricular Cyst, Ectopic Ureter
► After Transurathral Resection
► Abscess, Cavity------------------------------------------------------------------------------------------------------
Anechoic lesions in the prostate may be ab-
scesses when corresponding clinical signs are
present, or they may represent cavities in rare
instances of urogenital tuberculosis (Fig. 12.7).
The diagnosis is established by biopsy with
culture or histological analysis.
► Utricular Cyst, Ectopic Ureter________________________________________________________________________
Anechoic areas located in the posteromedian
and cranial portion of the prostate represent
harmless utricular cysts (Fig. 12.14). They are
considered remnants of the embryonic miiller-
lan duct. Differentiation is required from an
ectopic ureter with an anomalous insertion
into the wolffian duct.
a Fig. 12.14 Cystic mass (Z) in the lower midline of an
otherwise normal-appearing prostate (P) in a 43-
year-old man with no symptoms. Most likely a utric-
ular cyst. HB « bladder.
a Lower abdominal transverse scan.
a b Lower abdominal longitudinal scan.
R
rn
c
о
bn
"X3
ь
и
E
з
и
c
► After Transurethral Resection
Anechoic areas are also seen following TUR.
Irregular, anechoic areas are found at the site
of the resection cavity, or a funnel-shaped an-
echoic area may be found at the junction of the
bladder neck with the proximal urethra. A prior
history of TUR suggests the correct interpreta-
tion for both of these findings (Fig.12.12).
Hypoechoic___________________________________________________________
— ► Benign Prostatic Hyperplasia
► Prostatic Carcinoma
Prostatic hyperplasia and prostatic carcinoma
typically appear sonographically as circum-
scribed hypoechoic lesions that are difficult to
distinguish from each other by their ultrasound
features. Every hypoechoic lesion is suspicious
for carcinoma, therefore, and warrants further
investigation. The location of the lesion (see
above) is the only helpful sonographic sign for
benign/malignant differentiation Clinical find-
ings (digital rectal examination, PSA) and
transrectal/transurethral sonography can ad-
vance the diagnosis.
► Benign Prostatic Hyperplasia_________________________________________________________________
A hypoechoic area in the median lobe of the
prostate is suggestive of hyperplasia
(Fig. 12.15).
Hypoechoic areas can also appear as a pe-
ripheral rim that contrasts with the more echo-
genic compressed tissues, forming a "surgical
capsule" (Fig. 12.16).
a Fig. 12.15 Hypoechoic median-lobe adenoma (hy-
perplasia; PR), clearly demarcated from the rest of
the prostate. HB « bladder.
a Fig. 12.16 Hyperplastic median lobe (P), delineated
by high-level echoes (arrows) from the hypoechoic
displaced prostatic tissue. HB = bladder.
► Prostatic Carcinoma
12 Prostate, Seminal Vesicles, Testis, Epididymis 374
The early stage of prostatic carcinoma usually
appears sonographically as a focal hypoechoic
mass5 (Figs. 12.17-12.19). Irregular isoechoic
structures can also occur, depending on the
tumor histology and extent and any preexisting
changes that are incorporated into the tumor.
a Fig. 12.18 Patchy hypoechoic prostatic carcinoma
(PR), locally advanced.
a Infiltration of the bladder floor (HB. arrows) and
rectum (R).
Tumors smaller than 5 mm are not detected by
transabdominal or transrectal sonography. Dif-
ferentiation from benign prostatic hyperplasia
with hypoechoic fibromuscular nodules and
from focal lesions in prostatitis is almost im-
possible, with the result that carcinoma usually
* b Color Doppler view.
a b Infiltration of the seminal vesicles (SB).
cannot be detected by ultrasound screening.
Generally, then, the role of ultrasonography is
limited to defining tumor extent and detecting
lymph node involvement in the lesser pelvis
and along the iliac chain7 (Figs. 12.18 and
12.19).
Fig. 12.17 Prostatic carcinoma.
a Hypoechoic mass (P). HB = bladder with a layer of
basal sediment. SB seminal vesicle.
a c Locoregional lymph node (LK). All the changes re-
gressed in response to treatment. HN = bladder.
a Fig. 12.19 Prostatic carcinoma infiltrating the rec-
tum. HB = bladder; PR = prostate; R = rectum.
a Sonography: ill-defined posteroinferior margin and
a thickened, infiltrated rectal wall (R; arrows).
a b Color duplex image of a: scattered aberrant tumor
vessels.
a c Endoscopy: intestinal bleeding.
Echogenic
— ► Stones, Calcifications
► “Surgical Capsule”
► Stones, Calcifications
Echogenic foci also occur in prostatic hyper-
plasia. They are consistently located in the cap-
sulelike layer of prostatic tissue demarcated
from the rest of the gland by an echogenic
rim. Nonspecific inflammations, inspissated se-
cretions, glandular hyperplasia, calculi, and cal-
cifications are the correlates of these echogenic
areas.
Stones and calcifications occur in inflamma-
tory conditions (prostatitis in the setting of
hyperplastic changes) and in carcinomas, ap-
pearing sonographically as more or less pro-
nounced hyperechoic areas. Larger stones and
calcifications cast prominent acoustic shadows,
making them easy to detect with ultrasound
(Figs. 12.20 and 12.21).
a Fig. 12.21 Prostatic calcifications following hormonal
ablation of prostatic carcinoma 12 years before: mot-
tled echogenic areas with a partial acoustic shadow.
HB = bladder.
Circumscribed Lesion 375
л Fig. 12.20 Prostatic calculi (arrow, acoustic shadows
S). Scan shows intensely echogenic, shadowing
masses in the prostate (P). HB = bladder.
► “Surgical Capsule”___________________
Between a hyperplastic nodule and the dis-
placed peripheral part of the gland is a hyper-
echoic fibrous layer called the "surgical cap-
sule,” so named because it defines the plane
for surgical enucleation of the nodule
(Fig.12.16).
12 Prostate, Seminal Vesicles, Testis, Epididymis 376
Seminal Vesicles
Diffuse Change
Hypoechoic__________________________________________________________
► Vesiculitis
► Tumor Infiltration
While primary tumors of the seminal vesicles
are virtually unknown, vesiculitis develops oc-
casionally, and secondary tumor infiltration (e.
g., by prostatic carcinoma) is common. Trans-
rectal sonography is used for making a detailed
evaluation, but transabdominal scanning is still
useful for detecting essential changes.
► Vesiculitis______________________________________________________________________________________________________
Acute and chronic vesiculitis may be suppura-
tive (empyema) or may consist of diffuse in-
flammation. Bacteriology will often identify a
causative organism.
Sonographically, the seminal vesicles exhibit
unilateral or bilateral hypoechoic swelling. Be-
cause of their dilatation, the vesicles may show
a hypoechoic string-of-beads transformation or
a plump, elliptical appearance (Fig.12.22).
* Fig. 12.22 Purulent vesiculitis: swollen, intensely
echogenic seminal vesicles in a patient with suppu-
rative pyelonephritis. Purulent bladder sediment
(PUS). HBL = bladder.
► Tumor Infiltration____________________________________________________________________________________________________________________
Infiltration of the seminal vesicles by prostatic
carcinoma is more frequently unilateral than
bilateral. The tumor structure is hypoechoic,
and the vesicles show irregular expansion.
The tumor extensions may arise from the sur-
roundings, from the prostate, or even from the
rectum (Fig. 12.18).
Circumscribed Change
Anechoic_____________
и
— ► Dilatation,
► Abscess
И
u
► Diffuse Change
▼ Circumscribed Change
□
E
► Dilatation, Cyst_________________________________________________________________________________________
A row of elliptical, anechoic lesions found in the
seminal vesicle (usually incidentally) represent
foci of vesicular ectasia. They may be a mani-
festation of vesiculitis. Primary cysts are sim-
ilar, but round and smooth (Fig. 12.23).
a Fig. 12.23 Bilateral cystic masses in the seminal
vesicles. HB « bladder; SB • seminal vesicle. R =
rectum.
a Probable areas of ectasia.
a b Medially situated cystic masses (arrows).
a c When the vesicles (SB) are scanned at an oblique
angle, each mass elongates into a vas deferens (DEF)
(see also Fig. 12.25).
► Abscess______________________________________________________________________________________________________________
Circumscribed anechoic to hypoechoic lesions
in the seminal vesicles can also result from
abscess formation. The diagnosis is established
by the clinical features and by transabdominal
or transrectal sonography, possibly combined
with percutaneous drainage.
Echogenic
12 Prostate, Seminal Vesicles, Testis, Epididymis 378
— ► Stones, Calcifications
► Stones, Calcifications-----------------------------------------------------------------------------------
Echogenic areas in the seminal vesicles repre-
sent stones or calcifications. Their ultrasound
features are identical to those of prostatic
stones and calcifications, but transabdominal
ultrasound can definitely localize them to the
seminal vesicle (Fig. 12.24).
◄ Fig. 12.24 Irregularly hyperechoic seminal vesicles
with calcifications, acoustic shadows, and echogenic
reverberations. HB = bladder; SB - seminal vesicle.
► Chronic Vesiculitis
► Tumor Infiltration
► Chronic Vesiculitis-------------------------------------------------------------------------------------------------------------
Irregular structures with mixed hyperechoic/
hypoechoic or cystic areas are seen in chronic
vesiculitis or may be detected incidentally with
no apparent cause.
► Tumor Infiltration--------------------------------------------------------------------------------------------------------------
Cancer infiltrating the seminal vesicles displays
structural irregularities similar to those com-
monly seen in prostatic carcinoma. Detection
of the primary tumor confirms the diagnosis
(Fig. 12.18 b).
Testis, Epididymis
Anatomy and Topography
Structure
► Testicular lobules
► Seminiferous tubules
► Head of the epididymis
► Duct of the epididymis
► Tail of the epididymis
► Spermatic cord with the vas deferens
Testis. The testicular lobules contain sperma-
togonia, spermatocytes, seminal fluid, and hor-
mones. Their secretions are carried by the
seminiferous tubules to the efferent ductules
of the epididymis.
Epididymis. The epididymis lies on the lateral
aspect of the testis and consists of a superior
head and an inferior tail, which is continuous
with the vas deferens. The latter duct ascends
from the scrotum in the spermatic cord, accom-
panied by the testicular artery and vein and the
deferential artery and vein. The vas deferens
crosses over the ureter and passes behind the
seminal vesicles to enter the upper part of the
prostate (Figs. 12.25-12.27).
estls, Epididymis 379
a Fig. 12.25 Diagram showing the anatomy of the tes-
tis, epididymis, and vas deferens and their relation to
the prostate and bladder.
a Fig. 12.26 Ultrasound scans through a normal testis
and epididymis.
a Scan through the upper part of the testis (HO)
displays the head of the epididymis (NH) and the
patchy hyperechoic spermatic cord with the vas def-
erens.
a b Midlevel scan through the right testis demon-
strates a finely granular echo texture (same appear-
ance as in uncomplicated orchitis). RE = rectum.
a c Low longitudinal scan displays the lower portions of
the testis and the tail of the epididymis within the
fluid medium of the scrotum.
« Fig. 12.27 Ectatic vas deferens (arrow) proximal to
its entry into the prostate. HB = bladder; PR « pros-
tate.
a Lower abdominal transverse scan: small, anechoic,
avascular mass.
◄ b Duct system (arrows) terminates at the prostate
and has no connections with the bladder.
Diffuse Change
12 Prostate, Seminal Vesicles, Testis, Epididymis 380
Enlargement_________________________________________________________
► Orchitis
► Testicular Torsion
► Orchitis________________________________________________________________________________________________
Ultrasound contributes little to the diagnosis of
orchitis, which can be inferred from the under-
lying disease (mumps, sarcoidosis, tuberculo-
sis, syphilis). One or both testes are enlarged
and occasionally (tuberculosis, sarcoidosis) dis-
play nonhomogeneities. Generally the epididy-
mides are involved by the inflammation. With
unilateral orchitis, the affected testis appears
slightly hypoechoic relative to the opposite
side (Figs. 12.28 and 12.29).
a Fig. 12.28 Orchitis: enlarged, balloonlike testis
(40.5 cm) with an accompanying hydrocele
a Fig. 12.29 Bacterial orchitis on the right side with
abscessation (FL), confirmed at operation. HO = testis.
a Right testis (scanned from left to right): echo-
genicity is slightly decreased relative to the left side,
with inflammatory hypervascularity. Inflammatory
edema of the scrotum (SK).
a b Compare with the normal structure and vascularity
of the left testis. Patient presented clinically with
poorly controlled diabetes mellitus. LI = left.
► Testicular Torsion____________________
Testicular torsion occurs when the testis, epi-
didymis, and spermatic cord are twisted on
their longitudinal axis. It generally affects a
testis that is abnormally mobile. The initial
venous occlusion leads to unilateral enlarge-
ment with no change in echogenicity, but
with passage of time the testis becomes
smaller and more hypoechoic. The diagnosis
is made clinically. When arterial occlusion de-
velops, color Doppler can confirm the diagnosis
based on an absence of Doppler flow signals.
Decreased Size
► Epididymal Lesion
* Intrascrotal Mass
► Circumscribed Lesion
► Anorchism, Cryptorchidism
► Hypogonadism
► Atrophy
► Anorchism, Cryptorchidism___________________________________________________________________
Unilateral or bilateral testicular aplasia is easy
to diagnose with ultrasound. In cryptorchidism,
ultrasound shows an ectopic, undescended tes-
tis in the groin or abdomen (e.g., iliac region).
The testis is in these cases is hypoplastic.
Circumscribed Lesion 381
► Hypogonadism___________________________________________________________________________________________________
Small testes occur as an ontogenic condition in
intersexuality, Klinefelter syndrome, prepuber-
tal and postpubertal hypopituitarism (hypogo-
nadotropic eunuchoidism, organic pituitary dis-
ease), and various other syndromes. The small-
ness of the testes is demonstrated by ultrasound.
► Atrophy______________________________________________________________________________________________________________
Testicular atrophy can result from insults such as
testicular torsion or radiation therapy. The diag-
nosis is made from the underlying disorder, and
ultrasound can confirm the clinical suspicion.
Circumscribed Lesion
Anechoic or Hypoechoic_______________________________________________
-E
on
= ► Diffuse Change
В Circumscribed Lesion
Anechoic or Hypoechoic
► Irregular
Epididymal Lesion
Intrascrotal Mass
— ► Testicular Cyst
► Hematoma
► Abscess
► Testicular Infarction
► Testicular Tumor
E
► Testicular Cyst__________________________________________________________________________________________
Testicular cysts occur as simple cysts without a
cyst wall and in the form of very rare epider-
moid cysts. Simple testicular cysts display typ-
ical cystic features at ultrasound: an anechoic
interior with a rounded border and distal
acoustic enhancement. Epidermoid cysts may
contain distinct internal echoes.
► Hematoma
12 Prostate, Seminal Vesicles, Testis, Epididymis 382
Posttraumatic hematoma can appear as a pre-
dominantly anechoic lesion, depending on its
stage (Fig. 12.30). High-level internal echoes
with reverberations represent bubbles pro-
duced by gas-forming bacteria.
a Fig. 12.30 Posttraumatic testicular hematoma. LI =
left.
a В-mode demonstrates an anechoic mass.
a b Color Doppler shows an absence of vascularity in
the hematoma.
► Abscess_____________________________________________________________________________________
Most abscesses are anechoic, but occasionally a
cloudy internal structure is seen. The margins
are irregular (Fig. 12.31). The diagnosis is estab-
lished by the clinical presentation and if neces-
sary by ultrasound-guided needle aspiration.
Given the variable appearance of abscesses,
there are cases in which the diagnosis can be
confirmed only by demonstrating bacterial gas
formation.
« Fig. 12.31 Testicular abscess: anechoic to hypo-
echoic mass within the testis (HO) and scrotum.
Color Doppler shows no blood flow within the
mass. Patient presented clinically with septic tem-
peratures and an infected hematoma.
► Testicular Infarction___________________________________________________________________________________
On the whole, testicular infarctions are very
rare. They have been characterized as hypo-
echoic as well as hyperechoic lesions that are
virtually indistinguishable from tumors9.
► Testicular Tumor_________________________________________________________________________________________
Many different tumors can occur in the testes,
showing a peak incidence during adolescence.
They can be classified by histological and ge-
netic criteria into seminomas, nonseminoma-
tous tumors (embryonic carcinoma, yolk sac
tumor, choriocarcinoma), gonadal stromal tu-
mors (Leydig cell tumor, Sertoli cell tumor), and
malignant lymphomas8.
With regard to frequency distribution, 35%
of testicular tumors are seminomas, 25% are
teratocarcinomas, approximately 20% are em-
bryonic carcinomas, and 15% are combined
types. All other testicular tumors are rare. The
sonomorphological features described by
Schwerk and Schwerk9 are listed in Table 12.3
(see Fig. 12.32).
Table 12.3 Sonomorphological features of
testicular tumors (after reference 9)
► One or more foci disrupting the
testicular echo texture
► Tumor outline smooth or irregular
► Great majority of tumors (approxi-
mately 90%) are hypoechoic; a few are
isoechoic or hyperechoic
► Homogeneous or heterogeneous tumor
structure, in some cases with focal cal-
cifications and/or (pseudo)cystic areas
a Fig. 12.32 Testicular tumor (TU).
a Testicular carcinoma: nonhomogeneous, hypo-
echoic mass with small anechoic cysts.
a b Color Doppler: hypervascular periphery.
а c ‘'Starry sky” calcifications in the right testis (testic-
ular microlithiasis) following a left orchiectomy for a
germ cell tumor. Microlithiasis may have a neoplastic
or inflammatory etiology or may be chemotherapy-
induced.
Epididymal Lesion 383
Irregular_________________________________________________________________________
— ► Orchitis (see p. 380)
► Testicular Abscess (see p. 382)
► Testicular Hematoma (see p. 382)
► Testicular Tumor (see p. 382)
All of the focal lesions described above can also
assume a heterogeneous structure. In orchitis,
this is seen mainly with atypical granuloma-
tous inflammations. Testicular microlithiasis
can occur in association with inflammatory as
well as neoplastic testicular lesions
(Fig. 12.32c). Differentiation in these cases can
be accomplished histologically or by reference
to the history and clinical presentation
(trauma, fever with inflammatory swelling,
underlying disease).
Epididymal Lesion
Anechoic______________________________________________________________
► Spermatocele, Epididymal Cyst
► Spermatocele, Epididymal Cyst---------------------------------------------------------------------------------
Spermatoceles and epididymal cysts are an-
echoic areas in the epididymis that display
typical cystic features. They may be multiple
and can reach considerable size (Fig. 12.33).
72 Prostate, Seminal Vesicles, Testis, Epididymis 384
** Fig. 12.33 Spermatocele.
a Color Doppler of the right epididymal area: exten-
sive, anechoic, avascular fluid collection (FL) around
the testis (HO).
« b Left testis and epididymal area: fluid (FL) with a
cystic area (Z) around the upper part of the testis.
Hypoechoic___________________________________________________________
— ► Epididymitis
► Epididymitis______________________________________________________________________________________
Inflammation of the epididymis presents clin-
ically with gradually increasing pain and cor-
responding inflammatory symptoms, which
distinguish this condition from testicular tor-
sion. Epididymitis is a common entity. As in
prostatitis, it may involve a nonspecific bacte-
rial inflammation that has spread by the hem-
atogenous route or abscessation, or it may be
caused by a tuberculous, gonorrheal, or syph-
ilitic infection.
Ultrasound reveals swelling of the head,
body, or tail of the epididymis. The echogenicity
is variable, and the structure is predominantly
hypoechoic to heterogeneous (Fig. 12.34).
a Fig. 12.34 Epididymitis.
a Enlarged epididymis (NH) with accompanying in-
flammatory fluid (hydrocele; E). HO = testis.
a b Left epididymis: hypoechoic mass.
a c Color Doppler shows conspicuous vascularity.
Intrascrotal Mass
Anechoic or Hypoechoic______________________________________________
► Hydrocele
► Varicocele
► Hematocele
Intrascrotal Mass 385
► Hydrocele_________________________________________________________________________________
A hydrocele is a collection of watery fluid in the
tunica vaginalis of the testis. It often commu-
nicates with ascitic fluid in the abdominal cav-
ity, the pressure rise in the abdomen causing
the previously closed processus vaginalis to
become patent. Inflammatory hydroceles are
also common, however (e.g., secondary to epi-
didymitis), and cause a cystlike expansion of
the tunica vaginalis. Transient hydroceles are
also occasionally detected in small infants
(Fig. 12.35).
a Fig. 12.35 a and b Bilateral hydroceles.
a Right side: testis (HO) and epididymis (NH) sur-
rounded by fluid.
a b Sections of both testes with scrotal septum.
a c Hydrocele (HY) and spermatocele (SP): anechoic
mass around the testis (HO). The spermatocele
does not change its position, unlike the mobile fluid
in the hydrocele.
► Varicocele__________________________________________________________________________________________
A varicocele is defined as a palpable and visible
dilatation of the veins of the pampiniform
plexus (WHO). It is caused by retrograde flow
in the testicular vein or by an absence of ve-
nous valves. It occurs predominantly on the left
side and is occasionally bilateral. Treatment is
unnecessary in patients who have no com-
plaints and a normal semen analysis or azoo-
spermia. Otherwise, surveillance should be
maintained to assess the need for operative
treatment.
Ultrasound demonstrates convoluted, an-
echoic venous structures arranged around the
testis, showing a luminal diameter greater than
2 mm. Color duplex examination reveals low-
flow waveforms. If no flow is detected, the
stasis may be caused by intra-abdominal or
retroperitoneal tumor compression or tumor
invasion of the testicular vein, which is occa-
sionally definable with ultrasound in thin pa-
tients (Fig. 12.36).
a Fig. 12.36 Varicocele.
a B mode image of the right testis: multiple an-
echoic foci of vascular ectasia around the epididymis.
a b Color Doppler during a Valsalva maneuver shows
extensive vascularity. HO testis: VA = varicocele.
► Hematocele
72 Prostate, Seminal Vesicles, Testis, Epididymis 386
A hematocele is a collection of free blood in the
scrotal cavity. It is generally preceded by sur-
gical or other trauma.
Ultrasound shows a predominantly an-
echoic, hypoechoic, or even irregular mass, de-
pending on the age of the hematoma (Figs.
12.30 and 12.31).
Echogenic_______________________________________________________________
E
.IZ)
bn
► Diffuse Change
► Circumscribed Lesion
► Epididymal Lesion
▼ Intrascrotal Mass
Anechoic or Hypoechoic
► Echogenic
— ► Scrotal Hernia
► Scrotal Hernia_____________________________________________________________________________________
Sonography is an excellent modality for the
investigation of intrascrotal swelling. One
cause of such swelling is a scrotal hernia. The
hernial sac is found to contain bowel struc-
tures, which are easily identified as such with
ultrasound (Fig. 12.37).
Fig. 12.37 Scrotal hernia: hyperechoic bowel struc-
tures within the scrotal cavity. DA » intestine.
References
1. Bertermann H. Transrektale Sonographic von
Prostata und Samenblasen. In: Braun G, Schwerk
WB (eds.). Ultraschalldiagnostik. Ecomed 1996.
2. Bockung A. Riede UN. Vorsteherdriise. In: Riede
UN, Schaefer HE (eds.). Allgemeine und spezielle
Pathologie. Stuttgart: Thieme 1993.
3. Giatto S, Bonardi R, Mazzotta A, et al. Comparing
two modalities for screening for prostatic cancer:
digital rectal exam plus transrectal ultrasound
versus prostate-specific antigen. Tumor
1995:81:225-9.
4. Fabricus PG. Prostata- und Samenblasentumoren.
In: Jocham D, Miller К (eds.). Praxis der Urologie.
Stuttgart: Thieme 1994.
5. Frentzel-Beyme B, Schwarz I. Aurich B. Das Bild
des Prostataadenoms und -karzinoms bei der
transrektalen Sonographic. Fortschr Rontgenstr
1982;137:261-8.
6. Gottfried HW. Transrektale Sonographie. In: Joc-
ham D, Miller К (eds.). Praxis der Urologie.
Stuttgart: Thieme 1994.
7. Hermanek P. Neue TNM/pTNM-KIassifikation und
Stadieneinteilung urologischerTumoren ab 1987.
Urologe Ausg. В 1986;26:193-7, cited after Fab-
ricus PG. Prostata und Samenblasentumoren. In:
Jocham D, Miller К (eds.). Praxis der Urologie.
Stuttgart: Thieme 1993.
8. Riede UN, Wehner H. Hoden. In: Riede UN,
Schaefer HE (eds.). Allgemeine und spezielle
Pathologie. Stuttgart: Thieme 1993.
9. Schwerk WB, Schwerk WN. Sonographie des
Skrotalinhaltes. In: Braun G, Schwerk WB (eds.).
Ultraschalldiagnostik. Ecomed 1994.
10. Terris MK, Stamey TA. Determination of the
prostate volume by transrectal ultrasound. J Urol
1991;145:984.
Female Genital Tract
Female Genital Tract 389
▼ Vagina
I— ► Ultrasound Morphology
► Masses
— ► Imperforate Hymen with
Hematocolpos
— ► Vaginal Wall Cyst
— ► Septate Vagina
— ► Tampon
---► Vaginal Carcinoma
* Abnormalities of Size or
Shape
► Postoperative Changes
▼ Uterus
r—Anatomy
L—► Ultrasound Morphology
(Figs. 13.10-13.12)
► Abnormalities of Size or
Shape
— ► Uterine Prolapse
— ► Malformations
— ► Uterine Aplasia, Atresia
— ► Uterine Hypoplasia,
Small Uterus
’—► Hemangioma, Lymphoma,
Angiomyoma, Myoma
► Myometrial Changes
—► Uterine Myomas
— ► Uterine Adenomyomatosis
— ► Uterine Sarcoma
* Intracavitary Changes
I— ► Foreign Body (IUD)
— ► Mucocele, Serometra,
Pyometra, Hematometra
Pregnancy
► Ectopic Pregnancy
:► Missed Abortion, Incomplete
Abortion, Cervical Pregnancy
► Endometrial Polyps, Cervical
Polyps, Placental Polyps
Endometrial Changes
390
390
391
392
393
394
396
398
— ► Proliferative Endometrium
(Midcycle)
— ► Cystic Glandular Hyperplasia and
Atypical Adenomatous Hyperplasia
— ► Endometritis, Cervicitis
— ► Corpus Carcinoma
Chorioepithelioma
*““► Cervical Carcinoma
▼ Fallopian Tubes
^^^^^poechoic Mass
402
402
— ► Sactosalpinx, Hematosalpinx,
Pyosalpinx
---► Tubal Carcinoma
— ► Benign Tumors
► Tubal Pregnancy
▼ Ovaries
403
— ► Anatomy and Histology
— ► Topography
— ► Ultrasound Morphology
► Anechoic Cystic Mass
404
t»* Simple Follicles
► Functional Cysts (Follicular and
Corpus Luteum Cysts)
---► Theca-Lutein Cyst
— ► Paraovarian Cyst
— ► Polycystic Ovaries (PCO Syndrome,
Stein-Leventhal Syndrome)
— ► Cystic Ovarian Tumors
▼ Ovaries (Continue)
Solid Echogenic or Non-
homogeneous Mass
— ► Endometriotic Cysts
— ► Thecomatosis
— - ► Inflammatory Adnexal Mass
— ► Ovarian Carcinoma
— ► Metastases
— ► Pseudomyxoma peritonei
— ► Ovarian Tumors (by Histological
Criteria)
13 Female Cenital Tract
B. Beuscher-Willems*
Transabdominal ultrasound. Transabdominal
scanning of the lower abdomen should be done
for screening purposes as part of every abdomi-
nal ultrasound examination. The use of ultra-
sonography in gynecology was first described
by Donald in 19585. Today, transvaginal sonog-
raphy has become the procedure of first choice
for gynecological investigations. The short pen-
etration depth permits the use of a higher-fre-
quency transducer, which provides higher res-
olution and more detailed images. Transvaginal
sonography has been practiced increasingly
since about 1985.
Transabdominal ultrasound is still important in
gynecology, especially as an adjunct to trans-
vaginal scanning, in defining the boundaries
and extent of large masses. With its greater
penetration depth, transabdominal ultrasound
is also useful for evaluating positional anoma-
lies. Other indications for transabdominal scan-
ning exist in patients with an imperforate hy-
men or vaginal stenosis, or patients who refuse
transvaginal ultrasound (Table 13.1).
Appearance of the genital tract The physio-
logical appearance of the female genital tract
varies with hormonal changes relating to the
menstrual cycle and to age. The sex hormones
(estrogens, progestins, androgens) are pro-
duced in the ovaries, and ovarian function is
regulated by means of a feedback control loop
(hypothalamus [gonadotropin-releasing hor-
mone =GnRH] —> anterior pituitary [gonado-
tropins] —* ovary [sex hormones]). The gonado-
tropins (follicle-stimulating hormone FSH, lu-
teinizing hormone LH, and prolactin PRL) are
synthesized in the anterior lobe of the pituitary
gland.
The likelihood that an abnormal process exists
in the female genital tract also depends on the
age and hormonal status of the patient. Know-
ing the patient’s period of life and clinical pre-
sentation is an essential part of the overall
assessment and in formulating a differential
diagnosis. Thus a distinction is drawn between
examinations performed before menarche,
Periods of Life in the Female
► Neonatal period, initially still influenced
by maternal hormones
► Childhood
► Puberty, including premenarche and
postmenarche and marked by increasing
ovarian function
► Adolescence, marked by feminization
► Sexual maturity, marked by the onset of
fertility and biphasic menstrual cycles
during the reproductive years, during and after
menopause, and in old age.
Table 13.1 Indications for transabdominal
ultrasound scanning in gynecology
► Lower abdominal pain
► Urinary stasis
► Tumor screening
► Defining the extent of large tumors
► Follow-ups
► Positional anomalies
► Intact hymen
► Vaginal stenosis
► Refusal of transvaginal sonography
13 Female Cenital Tract 389
► Menopause, including premenopause
with relative estrogenism and luteal insuf-
ficiency
► Postmenopause, marked by declining es-
trogen production
► Old age
Topography (Figs. 13.1-13.3)
Relations of the genital organs
► Located in the lesser pelvis, predomi-
nantly intraperitoneal
► Anterior to the rectum
► Posterior to the bladder
► Medial to the psoas muscle
► Superior and medial to the iliac wings
► Posterior to the pubic bone and sym-
physis
Sonographic landmarks
► Bladder
► Rectum
► internal and external iliac vein
< Fig. 13.1 Relations of the female internal genital or-
gans: vagina, uterus, fallopian tubes, and ovaries.
<« Fig. 13.2 Longitudinal scan of the uterus (UT) and
vagina.
< Fig. 13.3 Transverse scan of the uterine fundus.
* The transvaginal ultrasound images were provided by Heilbronn Womens Hospital, whose help is gratefully acknowledged.
Vagina
13 Female Genital Tract 390
Ultrasound Morphology_______________________________________________________________________
The vagina is a flattened tube leading to the
uterus. With its anterior and posterior walls
composed of mucosal and muscular layers,
the vagina appears as a thin, multilayered
band in longitudinal and transverse ultrasound
scans through the lower abdomen (Figs. 13.4
and 13.5). The vagina may appear echogenic
to hypoechoic, depending on the angle at
which it is scanned. In some cases ultrasound
can distinguish a high-level entry echo fol-
« Fig. 13.4 Longitudinal scan of the vagina. UT = ute-
rus; BL = bladder; V = vagina; R = rectum; FL = fluid in
the cul-de-sac.
< Fig. 13.5 Transverse scan of the vagina. BL = bladder;
V = vagina; R = rectum.
lowed by the hypoechoic anterior wall, a bright
luminal echo at the center, the hypoechoic pos-
terior wall, and a bright exit echo. The lumen
may also be hypoechoic, depending on the fluid
and mucosal content of the vagina.
Masses
j Vagina
► Imperforate Hymen with Hematocolpos
► Vaginal Wall Cyst
► Double Vagina, Septate Vagina
► Tampon
► Vaginal Carcinoma
E
0)
► Imperforate Hymen with Hematocolpos
An imperforate hymen does not become clin-
ically apparent until puberty. With menarche,
the patient experiences monthly lower ab-
dominal pain and increasing malaise with an
absence of menstrual bleeding. The blood pools
in the vagina (hematocolpos) and may reflux
into the uterus (hematometra) or fallopian
tubes (hematosalpinx). The pseudotumor may
extend to the level of the umbilicus.
Hematocolpos. Ultrasound demonstrates an
almost anechoic mass of variable size and ex-
tent in the vagina, located posterior and infe-
rior to the bladder. The uterus, which shows
increased echogenicity, is displaced upward
and is often barely detectable in its position
above the mass (Fig. 13.6).
Hematometra. The blood may back up into the
uterus, resulting in an enlarged anechoic mass
posterior to the bladder.
Hematosalpinx. The fallopian tubes may also
fill with blood, causing extension of the mass
lateral to the bladder.
* Fig. 13.6 Hematocolpos.
► Vaginal Wall Cyst
Vaginal wall cysts are remnants of the wolffian
duct (mesonephric duct), appearing sono-
graphically as anechoic, smooth-bordered
masses located caudal to the bladder. The de-
velopment of carcinoma in vaginal wall cysts is
known to occur.
► Double Vagina, Septate Vagina___________________________________________________________________
Malformations are somewhat rare and result
from fusion anomalies of the miillerian ducts.
In 40% of cases, malformations of the vagina
are combined with anomalies of the kidneys
and urinary tract.
When a double vagina is scanned with ultra-
sound, it initially appears thickened with a
central, echogenic band. The two hypoechoic
lumina can be distinguished when viewed in
transverse section. Differentiation from a sep-
tate vagina is often difficult.
Only certain vaginal malformations are de-
tectable by transabdominal scanning, and gen-
erally it is difficult to evaluate all malforma-
tions with ultrasound alone. A gynecological
examination and additional tests (hystero-
scopy and laparoscopy) are required.
Vagina 391
A tampon appears caudal to the bladder as a
very echogenic mass with indistinct margins
and a posterior acoustic shadow (Fig. 13.7).
The nature of the mass is easily determined
by questioning the patient.
< Fig. 13.7 Intravaginal tampon appears as an elon-
gated, echogenic mass with an acoustic shadow
(S). BL = bladder; LIT = uterus.
► Vaginal Carcinoma_______________________________________________________________________________________
The most frequent site of occurrence is the
posterior fornix. Squamous cell carcinomas
are the most common and tend to be locally
invasive (rectum, uterus, bladder) and seed lo-
coregional metastases (Fig. 13.8).
Abnormalities of Size or Shape___________________________________________
— ► Postoperative Changes
► Postoperative Changes_________________________________________________________________________
Hysterectomy and other operations can cause
pronounced changes in the shape and position
of the vagina (Fig. 13.9). A knowledge of the
prior history will aid interpretation of the ul-
trasound findings.
< Fig. 13.8 Vaginal carcinoma (T): hypoechoic mass
infiltrating the rectum (R) and bladder (BL). VAG =
vagina.
13 Female Cenital Tract 392
Uterus
Anatomy
* Fig. 13.9 a Vaginal fornix after hysterectomy.
« b Bladder following resection of the uterus, vagina,
and rectum: complete acoustic enhancement pos-
teroinferior to the bladder. No organic structures are
visualized.
Position
► Anteversion, anteflexion (normal finding)
► Retroversion
► Straight (especially in old age, when it is
more difficult to evaluate by transvaginal
scanning; the fundus should be manually
flexed forward)
Uterine size and shape
► Prepubertal
- 2-3.3 cm long, 1 cm wide, 0.5-1 cm thick
- Cervical diameter is greater than the
corpus diameter. The cervix accounts for
two-thirds of total uterine length
Blood supply. The uterus (including the distal
part bordering the bladder) receives its blood
supply from the uterine artery, which branches
from the internal iliac artery. It is drained by
valveless veins of the uterine venous plexus.
Histology. The uterine wall consists of a
smooth-muscle layer (myometrium) and a
very glandular mucosa (endometrium of the
uterine corpus and cervix). Most of the uterus
is covered by a layer of serosa (perimetrium).
The endometrium of the uterine corpus con-
sists of a single row of columnar epithelium
► Nullipara
- Pear-shaped
- 5-9 cm long, transverse diameter
1.6- 4 cm. 3 cm thick
► Multipara
- 10 x 5 x 6 cm
- Uterine corpus comprises the upper two-
thirds of the total length, the cervix the
lower third
► Postmenopause
- 4.5 cm long, 2 cm wide, 1.5 cm thick
- Symmetrically hyperplastic
Uterine weight
► Adolescence: 44-66 g
► Childbearing age: 80-120 g
► Pregnancy: weight increases 20-fold from
50 g to 1000 g
and undergoes cyclic changes in its structure
and function in response to ovarian steroids.
The endocervix responds to these hormones
with functional but not structural changes.
The cyclic structural and size changes that oc-
cur in the myometrium and endometrium can
be appreciated at ultrasound. The postmen-
strual uterus is small and firm. During the sec-
ond half of the cycle, the uterine wall thickens
due to cellular hypertrophy. The myometrium
contains abundant ovarian steroids owing to its
estrogen and progesterone receptors.
Endometrium. Cyclic changes in the endo-
metrium were first described by Hirschmann
and Adler in 1908. During the proliferative
phase in the first half of the cycle, estrogens
stimulate an increase in endometrial thickness
and vascularity that continues until the LH
surge. During the second half of the cycle fol-
lowing ovulation, glycogen-filled vacuoles de-
velop in response to progesterone. Mucus-
filled glands develop in the later secretory
phase of the cycle, and spiral arteries are
formed. The regression phase begins several
days before menstruation, as hormone produc-
tion wanes and the thickness of the mucosa
decreases by approximately 50% owing to fluid
loss. The hormones decline precipitously in the
desquamation phase, and the endometrial lin-
ing is sloughed. A regenerative phase follows
menstruation, reinitiating the cycle.
Uterine cervix. The cervix consists mainly of
connective tissue and a few smooth-muscle
fibers, with the result that it undergoes mini-
mal cyclic structural changes. The cervical ca-
nal is lined by columnar epithelium and in-
creases its diameter at midcycle. The cervical
mucus becomes more fluid in response to es-
trogens and then more viscous again in re-
sponse to increased progesterone.
Ultrasound Morphology (Figs. 13.10-13.12)-------------------------------------------------------
Even the normal uterus is subject to certain
variations. To interpret the findings correctly,
it must be known whether the patient is pre-
pubertal. sexually mature, premenstrual, or
postmenstrual at the time of the examination.
This also has an important bearing on differ-
ential diagnostic considerations. For example,
lower abdominal pain in an adolescent girl is
more likely due to appendicitis than to a gyne-
cological tumor. If a tumor is present in an
adolescent patient, it will tend to undergo
rapid enlargement owing to the high rate of
proliferation.
Echogenicity
► Outer serosa: hyperechoic
► Myometrium: uniformly hypoechoic;
vessels appear as anechoic areas
► Endometrium and cervical canal: hyper-
echoic
► Cervix: may contain anechoic areas cor-
responding to nabothian follicles
a Fig. 13.10 Longitudinal uterine scan posterior to the
bladder. Anteflexion is clearly defined. UT = uterine
corpus; BL ~ bladder.
a Fig. 13.11 Transverse scan through the uterus (UT)
and rectum (R). BL = bladder.
a Fig. 13.12 Postpartum uterus (UT PP). Uterine length
is still approximately 16 cm. BL = bladder.
Uterus 393
Abnormalities of Size or Shape____________________________________________
► Uterine Prolapse
► Malformations
► Uterine Aplasia, Atresia
► Uterine Hypoplasia, Small Uterus
► Hemangioma, Lymphoma, Angiomyoma, Myoma
► Uterine Prolapse_____________________________________________________________________________
Atypical and abnormal positions of the uterus
affect the shape of the uterus as displayed by
ultrasound (Fig.13.13).
◄ Fig.13.13 Uterine prolapse. The uterus appears
somewhat straightened, and the cervix (C) extends
far caudally.
► Malformations___________________________________________________________________________
► Bicornuate uterus
- Uterus bicornis unicollis
- Uterus bicornis bicolli
► Subseptate uterus
► Uterus septus duplex (uterus bilocularis)
with a septate vagina
► Arcuate uterus
► Uterus didelphys with two vaginas
Uterus bicornis unicollis is the most common
malformation (Fig.13.14). On the posterior as-
pect of the bladder, the two hypoechoic uterine
horns curve around the floor and posterior wall
of the bladder. This creates the appearance of a
hypoechoic triangle in the lower abdominal
transverse scan. Two separate endometrial
echoes (thick proliferative endometrium) are
seen in a transverse scan through the uterine
horns at midcycle, which is the best time for
detecting this anomaly when it is suspected.
The malformations listed above are commonly
associated with renal anomalies, and therefore
the kidneys should be included in the ultra-
sound examination1.
a Fig. 13.14 Bicornuate uterus. UT = uterine horns; OV
= ovaries; BL = bladder.
► Uterine Aplasia, Atresia
13 Female Genital Tract 394
Uterine aplasia, characterized by a rudimentary
uterus, is seen in Rokitansky-Kiistner syn-
drome (vaginal aplasia). Despite a full bladder,
the uterus either is not visualized or appears
only in a rudimentary form. This aplasia is rare
and congenital.
Uterine atresia, on the other hand, is an
acquired condition (Fig. 13.15).
Fig. 13.15 Rudimentary uterus (snared) in uterine
atresia.
► Uterine Hypoplasia, Small Uterus______________________________________________________________________________
Uterine hypoplasia occurs in patients with in-
complete vaginal aplasia (affecting only the
lower third). Hematometra may develop, giv-
ing the uterus an anechoic appearance.
A small uterus (4.5 cm x 1.5 cm x 2 cm) is a
normal finding in postmenopausal women.
► Hemangioma, Lymphoma, Angiomyoma, Myoma
Benign tumors can cause significant changes in
the size and shape of the uterus, depending on
their size and location.
Myometrial Changes__________________________________________________
► Uterine Myomas
► Uterine Adenomyomatosis
► Uterine Sarcoma
► Uterine Myomas___________________________________________________________________________________
Myomas (fibroids) are muscular tumors of the
uterus, generally classified histologically as fi-
broleiomyomas . Myomas are benign tumors
composed of smooth muscle and connective
tissue. They are the most common type of gen-
ital tumor.
The formation and growth of uterine myo-
mas depend on the functional status of the ova-
ries (relative estrogen dominance). Myomas do
not occur in children or the elderly and tend to
regress after menopause. Antiestrogens and
progesterone inhibit their growth.
Myomas develop in the uterine corpus and
cervix. They are rarely solitary and may have an
intramural, subserous, submucous, or intraliga-
mentous location. Myomas lack a true capsule.
The tumor nodules are initially round but may
alter their shape owing to pressure effects. My-
omas undergo structural changes over time:
Malaria, characterized by the following
changes:
► Cavernous transformation, permeation by
edema
► Rapid myxomatous growth
► Tense cystic appearance, resembling an
ovarian cyst
► Fatty degeneiation (especially in the puer-
perium)
► Necrotic foci due to vascular occlusion
► Suppuration due to infection ascending from
the uterine cavity, spreading from the bowel,
or transmitted by blood vessels or lym-
phatics; breakdown by putrefactive bacteria,
especially in submucous myomas
Induration, consisting of the following
changes:
► Progressive fibrous transformation, ranging
to a pure fibroma
► Irregular or eggshell calcification. Fully cal-
cified myomas may become dislodged, re-
sulting in the “delivery” of uterine stones.
Sonographic features. Approximately 25% of
all women over age 35 have uterine myomas10.
These tumors appear sharply circumscribed at
ultrasound. Initially they are largely homogene-
ous and less echogenic than the rest of the my-
ometrium owing to their copious blood supply.
Most myomas are subserous in location
(l-I 13.1 a). Five percent of myomas are submu-
cous 9; they often cause bleeding abnormalities
and are not palpable. Diffuse myomatosis is
found in many multiparous women, leading
to uterine enlargement with no circumscribed
nodularity (E 13.1c).
Degenerating myomas appear as hyper-
echoic masses. Calcified myomas cast an acous-
tic shadow that can obscure surrounding struc-
tures (E 13.1 d, e). Central necrosis, due, for
example, to tumor growth outstripping blood
supply, appears as an anechoic area (в 13.1 f).
Pedunculated or intraligamentous myomas
can mimic an adnexal tumor. Unequivocal vi-
sualization of the stalk, as by color duplex ex-
amination, is required. Myomas cannot be dis-
tinguished sonographically from other tumors
with absolute confidence. Rapid enlargement is
suggestive of sarcomatous transformation.
The enlargement of a myoma is normal in
early pregnancy and requires surveillance10.
Large myomas can obstruct delivery3.
Clinical Presentation
Myomas present clinically with bleeding
abnormalities such as hypermenorrhea
(usually only intramural myomas affect
uterine wall contractility), menorrhagia,
and metrorrhagia (caused by submucous
myomas). Dysmenorrhea is caused by cap-
sular tension or contractions and also de-
pends on the tumor location.
Myomas can also cause bladder complaints
and constipation or hydronephrosis (intra-
ligamentous myoma) (B 13.1 g-i). A rup-
tured myoma capsule can produce the
signs and symptoms of an acute abdomen.
Myomas can cause infertility. A necrotic
myoma can lead to an elevated ESR.
Uterus 395
В 13.1 Uterine Myomas
► Diffuse myomatosis
► Solitary and multiple myomas
a Subserous myoma. S e shadow.
c Diffuse myomatosis with uterine en-
largement.
b Multiple myomas (MY) in the uterus.
BL - bladder.
► Calcifications and necrosis
d Uterine myoma with diffuse calcifi-
cation. UT - Uterine sarcoma; BL «
bladder; S = shadow.
e Uterine myoma with eggshell calcifi-
cation and acoustic shadowing (S). BL =
bladder.
f Uterine myoma with central hypo-
echoic necrosis.
► Renal pelvic obstruction
g Uterine myoma, nonhomogeneous,
compressing the ureter.
h Obstructed renal pelvis, drained with
a DJ stent (arrow).
i Uterusfornix (UF) with myoma, club-
like cervix (UC), bladder (B) with in-
dwelling DJ ureteral stent.
► Uterine Adenomyomatosis_________________________________________________________
The presence of endometrial cells in the myo-
mas leads to the development of uterine endo-
metriosis—more accurately termed adenomyo-
sis—which may be associated with hyperme-
norrhea and dysmenorrhea. One-third of pa-
tients are asymptomatic.
The uterus is uniformly enlarged and shows
a number of 1 -5 mm sized hypoechoic zones in
the myometrium, which may grow consider-
ably larger if intramural hemorrhage occurs.
The posterior uterine wall is more commonly
affected than other wall regions (Figs. 13.16
and 13.17).
13 Female Genital Tract 396
« Fig. 13.16 Adenomyosis with hypoechoic foci in the
myometrium. T = enlarged uterus; BL = bladder.
« Fig. 13.17 Adenomyosis: hypoechoic foci in the pos-
terior uterine wall. UT = uterus; BL = bladder.
► Uterine Sarcoma__________________________________________________________________________________
Sarcomas of the uterus account for 2-4% of
uterine cancers. The majority are mixed sarco-
mas. The most common type, leiomyosarcomas
of the uterine wall (uterine wall sarcoma), can
be difficult to distinguish from benign myomas.
The mitotic rate is an important criterion for
assessing malignancy. Sarcomas are softer than
myomas, bleed easily, and show a greater de-
gree of necrosis. There are also stromal sarco-
mas of the endometrium (mucosal sarcomas,
see below). Carcinosarcomas are mixed meso-
dermal tumors that contain both sarcomatous
and adenocarcinomatous elements.
Most sarcomas are detected incidentally in
myomas that have been surgically removed.
Sonographic features. Sarcoma appears sono-
graphically as a nonhomogeneous hypoechoic
mass with some anechoic elements and ill-de-
fined margins. Rapid enlargement is noted in
follow-up scans (Figs. 13.18 and 13.19).
Treatment consists of surgical removal of
the uterus and adnexa followed by irradiation.
The prognosis is poorer than with uterine car-
cinoma.
a Fig. 13.18 Fast-growing uterine myoma: well-circum-
scribed mass showing only slight nonhomogeneity.
a Fig.13.19 Uterine sarcoma (UT): fast-growing, non-
homogeneous mass with ascites (FL).
Features Helpful in Distinguishing
Uterine Carcinoma from Myoma
► Rapid uterine enlargement
► Uterine enlargement after menopause
► Change in the uterine cavity
► Secondary changes such as renal ob-
struction and lymph node enlargement
► Late signs such as discomfort, ascites,
and cachexia
Intracavitary Changes______
► Foreign Body (IUD)
► Mucocele. Serometra, Pyometra, Hematometra
► Pregnancy
► Ectopic Pregnancy
► Missed Abortion, Incomplete Abortion, Cervical Pregnancy
► Endometrial Polyps, Cervical Polyps, Placental Polyps
► Foreign Body (IUD)-------------
An intrauterine contraceptive device (IUD) ap-
pears as an intensely echogenic band with
slightly indistinct margins at the center of the
uterus. The shape and sharpness of the foreign
body are variable, depending on the type of IUD
(Figs. 13.20 and 13.21).
Contraceptive Protection
Today the IUD is the second most widely
used contraceptive in the world. Before an
IUD is inserted, transvaginal sonography
should be performed to measure the size of
the uterine cavity and exclude an obstructing
myoma. The position of the IUD should be
checked regularly to ensure contraceptive
protection. The distance of the IUD from
the fundus is normally 1 cm and should not
exceed 2 cm. In a uterus with myomas, it is
difficult to confirm correct IUD placement.
The examination should be scheduled for
midcycle when the uterus has a thick, prolif-
erative endometrium.
The incidence of ectopic pregnancy is 4-5
times higher in IUD wearers.
♦« fig. 13.20 IUD (arrows): very echogenic structure in
the uterine cavity. Correct placement is indicated if
the distance between the endometrium and IUD is
less than 5 mm. UT = uterus: BL = bladder; V =
vagina.
« Fig. 13.21 T-shaped IUD.
Uterus
► Mucocele, Serometra, Pyometra, Hematometra
Mucocele. A mucocele is a collection of secre-
tions retained in the uterine cavity, especially
around menopause. The cause of the ob-
structed drainage may be a carcinoma.
Serometra. This refers to an excessive accumu-
lation of endometrial discharge due to inter-
mittent cervical obstruction. The discharge
may have a malignant or inflammatory cause
(Fig. 13.22).
Pyometra. Pyometra occurs as a complication
of endometrial carcinoma owing to stenosis of
the cervical canal. Its sonographic hallmark is a
dilated, hypoechoic uterine cavity. Underlying
endometrial carcinoma is present in more than
50% of cases.
a Fig. 13.22 a Serometra: hypoechoic mass in the ute-
rine cavity.
a b Hematometra: anechoic mass within the uterine
cavity (UT), caused by anticoagulant therapy.
► Pregnancy_____________________________________________________________________________
Pregnancy should be considered in patients
undergoing ultrasound for lower abdominal
pain or unexplained vomiting, and an ectopic
pregnancy should be excluded.
In an intrauterine pregnancy, the normal
anechoic chorionic cavity can be seen at an
eccentric location in the uterus as early as 2
weeks’ gestational age (Fig. 13.23). Its size in-
creases by approximately 1 mm/day. By the 5 th
week, a ringlike structure can be seen in the
chorionic cavity, representing the secondary
yolk sac. This structure is of embryonic origin
and affords proof of intrauterine pregnancy1
(Fig.13.24).The normal average diameter of
the chorionic cavity is 5.5 cm (3-7 cm). Devia-
tions from the norm signify a developmental
anomaly, and karyotyping should be per-
formed. The chorionic cavity is surrounded by
the hyperechoic chorion, which displays a typ-
ical ringlike vascular pattern.
As gestation progresses, the product of con-
ception becomes visible and embryofetal de-
tails can be defined and evaluated (Figs. 13.25
and 13.26).
Fig. 13.23 Anechoic chorionic cavity in the third
week of pregnancy, surrounded by the hyperechoic
chorion.
* Fig. 13.24 Early pregnancy wth a chorionic cavity
and hyperechoic conceptus. UT = uterus; BL = blad-
der.
Fig. 13.25 Embryo in the 12th week of pregnancy.
< Fig. 13.26 Fetus in the 27th week of pregnancy. Male
genitals are visible between the thighs.
► Ectopic Pregnancy____________________________________________________________________
ТЗ Female Genital Tract 398
In an ectopic pregnancy (1:100 births)10, a
pseudogestational sac may appear at the center
of the uterus. This fluid collection is caused by a
decidual reaction within the slitlike uterine
cavity. The sac rarely exceeds 2 cm in diameter,
lacks an echogenic rim, and does not enlarge. A
mass with a hyperechoic ring and anechoic
center can be demonstrated in the adnexal
region. Since this usually represents a tubal
abortion, a conceptus is not present.
Ectopic pregnancy occurs more frequently
when an IUD is in place (Fig. 13.27). It is ex-
tremely rare for an intrauterine pregnancy to
coexist with an IUD: 1:35 000 pregnancies10.
** Fig. 13.27 Ectopic pregnancy: thickened, hypoe-
choic fallopian tube with an IUD in the uterine cavity
(high-level echo).
► Missed Abortion, Incomplete Abortion, Cervical Pregnancy---------------------------------
In a missed abortion, either the chorionic cavity
does not contain a conceptus or the conceptus
is rudimentary and fails to develop further. The
adnexa appear normal.
In an incomplete abortion, structures with
irregular outlines and varying echogenicity can
be demonstrated within the uterine cavity. The
hyperechoic areas are retained products of
conception, while hypoechoic areas represent
small pockets of blood.
In some cases the remnants of an incom-
plete abortion may be found entirely in the
cervical region. Differentiation is then required
from an abnormal cervical pregnancy, which is
recognized by a clublike expansion of the cer-
• 9
V1X .
► Endometrial Polyps, Cervical Polyps, Placental Polyps
Endometrial polyps. Like adenomas, polyps
arise from local sites of mucosal hypertrophy
and project into the uterine cavity. They are
usually benign. They may be pedunculated,
and the pedicle may be so long that the polyp
protrudes from the cervical os. Endometrial
polyps are usually solitary. Large polyps can
form in response to increased estrogen produc-
tion after menopause. Treatment in bleeding
patients consists of dilatation and curettage.
Further surveillance is indicated because of
the risk of carcinoma.
Sonographically, the endometrium is hyper-
echoic and thickened with indistinct borders
(Fig. 13.28). If a mucocele or serometra is
present, the polyps will be clearly delineated
within the anechoic or hypoechoic uterine cav-
ity.
Cervical polyps. More common than endome-
trial polyps, cervical polyps are lentil-size to
cherry-size growths that may be seen in the
cervical os during speculum examination. Re-
moval of these polyps should be followed by
dilatation and curettage. Cervical polyps
should not be removed during pregnancy.
a Fig. 13.28 Endometrial polyp (histological finding):
thickened, hyperechoic endometrium in a meno-
pausal patient on tamoxifen. Nonhomogeneous ute-
rine cavity.
Endometrial Changes_____________________________________________________
— ► Proliferative Endometrium (Midcycle)
► Cystic Glandular and Atypical Adenomatous Hyperplasia
► Endometritis, Cervicitis
► Corpus Carcinoma
► Chorioepithelioma
► Cervical Carcinoma
► Proliferative Endometrium (Midcyde)-----------------------------------------------------------------------
The endometrium is more echogenic than the
myometrium and appears as an oblong or el-
liptical structure with homogeneous echoge-
nicity and smooth margins at the center of
the uterus. Its thickness varies during the men-
strual cycle.
Endometrial thickness is measured sono-
graphically as twice the single-wall thickness,
or the sum of both visible endometrial layers
minus the intervening cavity.
Normal values of endometrial thickness. The
normal thickness values are hormone-depend-
ent:
► Postmenopausal (without hormone replace-
ment) < 8 mm
► Postmenstrual 0
► Premenstrual 8-15 mm
The menstrual history is helpful in correctly
interpreting the image.
Pathological findings in the endome-
trium. The principal findings are as follows:
► Thickness > 15 mm. or > (5-) 8 mm after
menopause.
► Nonhomogeneous echo pattern with micro-
cystic or macrocystic changes, which may be
benign or malignant. Cysts smaller than
3 mm are typically benign.
► Indistinct endometrial/myometrial boun-
dary.
Uterus 399
Cyclic Endometrial Changes
► After menstruation: no visible endome-
trium.
► Proliferative phase: central echogenic line
3 mm thick (Fig. 13.29).
► Midcycle: hyperechoic boundary with the
myometrium, bright central echo, gaping
cervical canal; graafian follicle may be de-
tectable (Fig. 13.30).
► Secretory phase: During the secretory phase
after ovulation, luteal hormones stimulate
increasing transformation of the tubular
glands and glandular secretions, giving the
endometrium a porous, edematous ap-
pearance. The mucosa initially shows al-
ternating hypoechoic and echogenic
layers. The overall echogenicity of the en-
dometrium increases during the luteal
phase while the bright central echo disap-
pears (Fig. 13.31), culminating in a well-
defined hypoechoic center caused by col-
lected secretions (Fig. 13.32).
► Postmenopause: The postmenopausal en-
dometrium appears at most as an echo-
genic band less than 8 mm thick, usually
without a detectable cavity.
A small amount of fluid in the uterine cavity
does not have pathological significance.
A homogeneous endometrium more than
8 mm thick warrants ultrasound surveillance.
The differential diagnosis includes hyperplasia
and early endometrial carcinoma. Cytological
examination is inconclusive, and the diagnosis
is established by curettage.
A bright internal echo in the uterine cavity
with a homogeneous endometrium, seen par-
ticularly well in the presence of serometra, may
be an endometrial polyp. This is confirmed by
removing the lesion for histology.
It is normal after ovulation to find a small
amount of free fluid in the rectouterine pouch.
Other causes of ascites should be excluded,
however.
Fig. 13.29 Proliferative phase: endometrium with a
fine central echo (first half of cycle).
« Fig. 13.30 Endometrial layers at midcycle: hypere-
choic - hypoechoic - hyperechoic - hypoechoic -
hyperechoic.
Fig. 13.31 Uniformly echogenic endometrium (E)
during the secretory phase after ovulation, with no
central echo. Normal, circular myometrium blood
flow pattern is clearly defined by power Doppler.
« Fig. 13.32 Thick, proliferative endometrium (ar-
rows), hyperechoic with a hypoechoic center. BL =
bladder.
► Cystic Glandular Hyperplasia and Atypical Adenomatous Hyperplasia
Cystic glandular hyperplasia occurs in an anov-
ulatory cycle with a persistent follicle9.
Atypical adenomatous hyperplasia is diag-
nosed histologically by curettage. It is a pre-
cancerous lesion that progresses to corpus car-
cinoma in 20% of cases.
Women who take tamoxifen (antiestrogen)
are at increased risk for developing endome-
trial carcinoma.
► Endometritis, Cervicitis__________________________________________________________________________
13 Female Genital Tract 400
Inflammation of the endometrium due to tu-
berculosis or other diseases spreads by a de-
scending route and may also involve the cervix
(cervicitis) and vagina (colpitis) (Fig.13.33). Es-
trogen production promotes inflammatory
changes. One-third of cases of tuberculous sal-
pingitis occur during puberty. The most com-
mon cause is an infected IUD.
Fig. 13.33 Endometritis, myometritis.
a Hypoechoic uterus with indistinct borders, a ret-
routerine abscess, marked tenderness to pressure,
and a foul-smelling discharge.
b Posterior to the bladder (BL), the cervix (CE) is
markedly expanded and contains hypoechoic foci
signifying microabscesses. The uterus (UT) contains
an IUD.
« c Cervicitis (CE) with parauterine lymph nodes (ar-
rows).
► Corpus Carcinoma____________________________________________________________________
Histology. Carcinoma of the uterine corpus is
generally an endometrial cancer. The majority
are adenocarcinomas (40%). Corpus carcinoma
arises from the endometrium of the uterine
fundus, usually in the cornual region. A typical
lesion is adenocarcinoma of the endometrium
with extensive squamous cell metaplasia,
found in 28% of cases (these tumors are called
adenocancroids or adenocanthomas). Squa-
mous cell carcinoma of the uterine corpus is
rare, accounting for less than 1% of lesions.
Stromal cancers (mucosal sarcomas) can also
arise from the endometrium.
Risk factors. Tumor growth is estrogen-de-
pendent and is mediated by estrogen receptors
on the glandular epithelial and stromal cells.
This is why years of unopposed estrogen stim-
ulation is thought to be associated with a higher
risk of endometrial carcinoma (ovarian tumors,
polycystic ovaries, hepatic cirrhosis, etc.).
An increased risk exists in endometrial car-
cinoma syndrome with overweight, hyperten-
sion, and glucose intolerance or diabetes mel-
litus. The principal risk factor is age, and
women with a higher social standing seem to
be predisposed.
Growth pattern. Corpus carcinoma grows
slowly on the mucosa or may form a polypoid
lesion projecting into the uterine cavity; thus it
stays confined to the mucosa for some time. It
eventually invades the myometrium by contig-
uous spread but rarely penetrates the serosa.
Metastasis occurs much later than with cervical
carcinoma and only after the tumor has perme-
ated the outer third of the myometrium. Distant
FIGO and TNM Staging for Corpus Carcinoma
0/Tis Carcinoma in situ
I/T1 Tumor confined to the uterine corpus
IA/T1 a Tumor confined to the endometrium
IB/T1 b Tumor invades less than half of the myometrium
IC/T1 c Tumor invades half or more of the myometrium
II/T2 Tumor invades the cervix
IIA|T2a Spread limited to the endocervix
IIB/T2 b Tumor also invades the cervical stroma
III/T3 Spread in the lesser pelvis
IIIA/ТЗа Tumor involves the serosa and/or adnexa, and/or tumor detected in ascites
IIIB/ТЗЬ Vaginal involvement
IIIC/N1 Pelvic or para-aortic lymph node metastases
IVA/T4 Invasion of the bladder and/or rectum
IVB/M1 Distant lymph node metastases outside the lesser pelvis
metastases are rare and occur at a late stage.
Bleeding usually directs attention to the cancer
while it is still confined to the uterine corpus.
Sonographic features. The sonographic hall-
marks of endometrial carcinoma are as follows:
► Thick, hyperechoic endometrium
► Macrocystic changes
► Ill-defined margins
► Expansion of the uterine cavity by tumor
with an exophytic growth pattern
The uterus may be larger than normal for age.
Endometrial carcinoma appears more echo-
genic than the myometrium. The precise as-
sessment of myometrial invasion has a crucial
bearing on the prognosis. Transabdominal ul-
trasound is not suitable for this purpose, but
transvaginal scanning can define the myome-
trium with great clarity (Figs.13.34 and 13.35).
a Fig. 13.34 Endometrial carcinoma (D2 27.9 mm) in a
postmenopausal patient The uterus (UT, 96.4 mm
long) is still just distinguishable from the myome-
trium by its greater echogenicity. BL = bladder.
•« Fig. 13.35 Endometrial carcinoma.
a The tumor is just distinguishable by its higher
echogenicity in the transabdominal scan.
* b Transvaginal scan: 2 cm carcinoma (arrows) with
ill-defined margins. Uterine width is 54 mm.
Uterus 401
► Chorioepithelioma__________________
Choriocarcinoma (malignant chorioepithe-
lioma) arises from syncytial and Langhans cells
of the placenta following a birth (20%), miscar-
riage (25%), or molar pregnancy (50%). It may
develop after a latent period of several years.
The overall incidence of chorioepithelioma is
very low (1 : 100 000 births).
The tumor begins with a nodule in the en-
dometrium, which grows rapidly into the ute-
rine wall. Chorioepithelioma is extremely ma-
lignant and metastasizes early to lung, brain,
kidney, bone, etc. Bleeding is a frequent com-
plication. Serum levels of chorionic gonadotro-
pins and a-hCG are elevated.
Ultrasound shows inadequate postpartum
involution of the uterus in addition to an en-
larging intracavitary mass. Because of the cho-
rionic gonadotropins from chorioepithelioma,
the ovaries contain corpora lutea at various
developmental stages as well as granulosa
and theca lutein cysts. As a result, cystic ovaries
are frequently noted at ultiasonography.
► Cervical Carcinoma
Cervical carcinoma is usually a nonkeratinizing
squamous cell carcinoma that metastasizes
early to regional lymph nodes. Even with a
microcarcinoma (FIGO 1A2, TNM T1 a2) not ex-
ceeding 5 cm in depth and 7 mm in its super-
ficial extent, metastases are already present in
10% of cases. The tumor spreads contiguously
to the vagina, uterus, and parametria. Distant
metastases are rare and occur at a late stage.
FICO Staging for Cervical Carcinoma
0 Carcinoma in situ
I Strictly confined to the cervix
II Extends into the parametria (but not onto the pelvic sidewall) or the upper two-thirds
of the vagina
III Has spread onto the pelvic sidewall and/or involves the lower third of the vagina
IV Has spread beyond the lesser pelvis to distant organs and/or has invaded the bladder,
rectum, or both
Sonographic features. The carcinoma initially
appears hyperechoic. Transabdominal ultra-
sound can detect the tumor only after it has
reached an advanced stage (at least IB/T1 b)
(Fig. 13.36). With endophytic tumors, the cer-
vix may appear greatly thickened; with exo-
phytic tumors (less common), a cauliflower-
like growth can be seen. A barrel-like disten-
tion of the cervix is most often seen with can-
cers of the cervical cavity. Over time the tumor
may become less echogenic, particularly in re-
sponse to treatment (Fig. 13.37). Transvaginal
sonography (TVS) yields more accurate find-
ings and permits an earlier diagnosis.
A sharply circumscribed, globular type of
tumor requires differentiation from a uterine
myoma. An extensive ovarian cancer can also
mimic cervical carcinoma.
Complications. Ultrasound can detect the fol-
lowing complications due to tumor invasion:
► Rectal stenosis with bowel obstruction
► Ureteral obstruction with hydroureter and
hydronephrosis
Other complications may arise:
► Infiltration of the sciatic nerve, causing scia-
tica
► Obstruction of the iliac vessels with inflow
stasis of the vulva and lower extremities
► Infections, septic pyonephritis, and uremia
Fig. 13.36 Cervical carcinoma (arrows) spreading to
the uterine corpus and vagina (arrows). Ulcerated
tumor with free fluid (FL). UT = uterus; BL = bladder.
< Fig. 13.37 Cervical carcinoma (stage IIIB, following
irradiation and cisplatin chemotherapy): hypoechoic
broadening of the cervix with tapered posterior mar-
gin due to tumor infiltration.
13 Female Cenital Tract 402
Fallopian Tubes
The fallopian tubes can be identified at their
origin from the uterus, to the right and left of
the uterine fundus. Their further course can be
visualized only if pathological changes are
present.
Hypoechoic Mass______________________________________________________
— ► Sactosalpinx, Hematosalpinx, Pyosalpinx
► Tubal Carcinoma
► Benign Tumors
► Tubal Pregnancy
► Sactosalpinx, Hematosalpinx, Pyosalpinx__________________________________________________
Definitions. Sactosalpinx is a hypoechoic mass
between the uterus and ovary caused by a fluid
collection in the fallopian tube due to various
causes.
Hematosalpinx is a collection of blood ex-
tending into the fallopian tube, e.g., due to
hymenal atresia.
Pyosalpinx is a collection of pus secondary
to an inflammatory stenosis.
Sonographic features. The tubal wall appears
sonographically as a pair of echogenic lines.
With an abscess, the wall shows echogenic
thickening (Fig. 13.38). The fallopian tube runs
a tortuous course. When it contains a collection
of clear fluid, the lumen is dilated and anechoic.
With blood or pus in the tube, the lumen may
appear echogenic and nonhomogeneous.
Differentiation. Color duplex examination
can differentiate a fallopian tube from varicose
vessels. Bowel loops generally have a hypo-
echoic wall that distinguishes them from the
fallopian tube. Malignant masses tend to be
painless, whereas inflammatory processes
cause severe pain. Tubo-ovarian cysts are not
true neoplasms but residua from pelvic inflam-
matory disease.
a Fig. 13.38 Tubo-ovarian abscess. Transvaginal scan
shows a hypoechoic mass with ill-defined margins
(49.8 mm* 27 mm) in the left adnexa.
► Tubal Carcinoma_____________________________________________________________________
Only 0.3% of gynecological cancers are primary
malignant tumors of the fallopian tube. The
most common type is adenocarcinoma. Pa-
tients present clinically with pain on the af-
fected side, discharge (50%), and bleeding
(25%). The periodic drainage of large fluid vol-
umes that is commonly seen with tubal carci-
noma is termed hydrops tubae profluens. Thus,
vaginal discharge assumes special significance
in postmenopausal women and should always
be investigated. Tumor cells are not found in
material obtained by D&C, but the cytological
examination of cervical secretions will reveal
cancer cells. Given the copious lymphatic
drainage of the fallopian tube region, metasta-
ses from tubal carcinoma are frequent. The
prognosis is the same as for ovarian carcinoma.
Sonographic features. Tubal carcinomas are
unilateral, round-to-oval lesions with a hypo-
echoic to hyperechoic appearance. The tube is
often dilated distally and is tender to manual
pressure. In its advanced stages, the tumor has
the same appearance as ovarian carcinoma.
► Benign Tumors__________________________________________________________________________________________________________
Benign tumors of the fallopian tubes are very
rare. The following types occur:
► Myomas
► Fibromas
► Lipomas
► Dermoids
► Lymphangiomas
► Adenomas
► Tubal Pregnancy_______________________________________________________________________
More than 90% of ectopic pregnancies are tubal
pregnancies. The affected tube appears thick-
ened and hypoechoic at transabdominal ultra-
sound (Fig. 13.39). Transvaginal sonography is
definitely superior to transabdominal scanning
in the diagnosis of tubal pregnancy.
With a ruptured tubal pregnancy, ultra-
sound will generally detect free fluid in the
abdomen (Fig. 13.40).
a Fig. 13.39 Tubal pregnancy: thickened, hypoechoic
fallopian tube with an IUD in place (high-level echo
in the uterine cavity).
a Fig. 13.40 Tubal rupture: free fluid (cursors) in the
hepatorenal sinus following a tubal rupture due to
ectopic pregnancy.
Ovaries 403
Ovaries
The ovaries undergo both structural and func-
tional changes in response to gonadotropin
production and aging. The sex hormones are
synthesized in the ovaries.
The ovaries are highly variable in their size,
shape, echogenicity, and position, making them
difficult to visualize with ultrasound. Diseases
of the ovaries are often detected at an ex-
tremely late stage owing to the delayed onset
of symptoms.
Anatomy and Histology_________________
The ovaries are small, firm, almond-shaped or-
gans lying in the lesser pelvis. They are sur-
rounded by a thin fibrous capsule (tunica albu-
ginea). Their surface is smooth initially but be-
comes irregular ovei time owing to the pitting
and scarring that result from follicular matura-
tion and degeneration. The ovaries become
seal red and atrophic after menopause.
The follicles (primordial follicles, primary
and secondary follicles) are located in the
very cellular cortical zone of the ovary, along
with the corpora lutea and corpora albicantia.
The cortical zone is continuous with the
smaller medullary zone, with no distinct boun-
dary between the two. The medullary zone is
composed of connective tissue with occasional
smooth-muscle cells and vessels.
Most of the ovary is intraperitoneal. Vessels
enter the ovary at the hilum, which is extra-
peritoneal. The ovary is supplied by the ovarian
arteries, which arise directly from the aorta
below the renal artery, and by the ovarian
branch of the uterine artery. The left ovarian
artery occasionally arises from the left renal
artery. The blood vessels run to the hilum in
the ovarian suspensory ligament.
Arborizing valveless veins form a network,
the pampiniform plexus (ovarian venous
plexus), that surrounds the organs. The right
ovarian vein opens directly into the vena cava,
while the left ovarian vein drains into the left
renal vein.
Topography_____________________________________________________________________________
The ovaries of the nullipara lie in a small groove
(ovarian fossa) in the lateral pelvic wall on both
sides the uterus. They are located anterior to
the ureter in the bifurcation of the common
iliac artery (Fig. 13.41).
The ovaries are attached to the pelvic wall by
the ovarian suspensory ligament and to the
cornual area of the uterus by the proper ovar-
ian ligament. They are attached posteriorly to
the mesovarium by the broad ligament. During
pregnancy, the enlarged uterus displaces the
ovaries into the abdomen. After pregnancy,
the ligaments are so stretched that the ovaries
become mobile and can vary greatly in their
position.
a Fig. 13.41 Ovaries (Ovar) flanking the uterus (UT)
posterior to the bladder (BL) in a nullipara.
Ultrasound Morphology_______________________________________________________________________
The ovaries can usually be visualized m women
of reproductive age (Fig. 13.41). Both ovaries
can be identified in approximately 80% of
cases. The ovaries can rarely be visualized after
menopause, when they are smaller and less
echogenic.
The ovaries in fertile women measure ap-
proximately 2 x 3 x 1.5 cm6, which corresponds
closely to the anatomical dimensions of 2.5 cm
long, 2 cm wide, and 1 cm thick \ They may be
slightly less echogenic than the uterus and dis-
play anechoic cystic changes during the ovar-
ian cycle.
The ovarian cortex initially contains several
rounded, anechoic masses up to 10 mm in di-
ameter. Approximately seven days after men-
struation, one dominant follicle appears while
13 Female Cenital Tract 404
the others regress. The dominant follicle grows
to a graafian follicle by the time of ovulation,
measuring approximately 2 cm in size and pro-
jecting above the organ surface. An echogenic
ringlike structure, the cumulus oophorus, ap-
pears in the follicle. After ovulation, free fluid
can be demonstrated in the cul-de-sac. Now
the follicle is misshapen or no longer visual-
ized. When bleeding occurs in the corpus lu-
teum, the follicle becomes uniformly hyper-
echoic.
Size and shape
► 2 x 3 x 1,5 cm
► Almond-shaped
Structure
► Medullary zone
► Cortical zone with follicles, corpora lutea,
and corpora albicantia
► Capsule (tunica albuginea)
Landmarks
► Bladder
► Uterus
► Pelvic wall
► Iliac vessels
Anechoic Cystic Mass__________________________
— ► Simple Follicles
► Functional Cysts (Follicular and Corpus Luteum Cysts)
► Theca-Lutein Cyst
► Paraovarian Cyst
► Polycystic Ovaries (PCO Syndroms, Stein-Leventhal Syndrome)
► Cystic Ovarian Tumors
► Simple Follicles___________________________________________________________________________________________________
Simple follicles appear as unilocular, anechoic
masses with sharply circumscribed margins.
When intraluminal hemorrhage is present,
they appear hyperechoic. Simple follicles re-
gress spontaneously.
The dominant follicle grows to a graafian
follicle by the time of ovulation. It enlarges to
approximately 2 cm and projects above the
ovarian surface. The cumulus oophorus is visi-
ble as a ringlike structure of high echogenicity.
After ovulation, the follicle normally appears
distorted in its shape or is no longer visible
(Figs. 13.42-13.44).
a Fig. 13.42 Mature graafian follicle. BL = bladder; UT =
uterus; C = follicle appearing as a cystic mass.
a Fig. 13.43 Follicular rupture. Residual follicle (C); FL =
free fluid; VI = iliac vein; UT = uterus; BL = bladder.
a Fig. 13.44 Persistent follicle: early pregnancy with a
chorionic cavity in the uterus (UT) and a follicle (C) in
the ovary.
► Functional Cysts (Follicular and Corpus Luteum Cysts)
Most ovarian cysts are “functional cysts" such
as follicular and corpus luteum cysts. Func-
tional cysts are the response of the ovaries to
elevated gonadotropin levels (FSH and LH) in
the blood. A cyst no larger than 3-6 cm in a
woman under age 30 may be a functional cyst.
If it does not regress by the next menstruation
or grows even larger, it should be surgically
removed.
Follicular cyst. A follicular cyst is the most
common ovarian cyst and can occur at any
age. It is common after menarche and in the
climacteric and is rare after menopause. A fol-
licular cyst develops in response to estrogen
stimulation when ovulation fails to occur. Gen-
erally the cyst is detected incidentally, but pa-
tients occasionally present with abdominal
pain, a palpable mass, or signs of estrogen ac-
tivity. The cysts may rupture when palpated,
which can lead to hemorrhage, peritoneal
shock, and spillage of the cyst contents into
the abdominal cavity.
The sonographic criteria of a follicular cyst
are as follows:
► Thin-walled
► Usually no larger than 5 cm (maximum
8 cm)
► Solitary, rarely multiple
► Unilateral, rarely bilateral
► Contains clear watery fluid, rarely hemor-
rhagic
Retention cysts. Retention cysts are formed by
the accumulation of fluids such as blood and
secretions tn follicular cysts. Unlike cytomas,
they grow no larger than fist-size.
Corpus luteum cyst. A corpus luteum cyst re-
sults from cystic enlargement of the corpus
luteum. It develops when hemorrhage occurs
► Theca-Lutein Cyst----------------------------------------------------------------------------
Lutein cysts develop from atretic follicles. They
represent follicular cysts that have theca-lutein
cells on their inner surface. Lutein cysts result
from hyperstimulation by gonadotropins and
therefore occur in diseases and conditions that
are associated with increased a-hCG formation,
i.e., in 20% of molar pregnancies, in chorioepi-
thelioma patients, and in multiple pregnancies.
For this reason they are also commonly seen in
patients with polycystic ovaries and in women
treated for infertility. They may contain proges-
terone in high doses and regress after the cause
within the corpus luteum and the blood is re-
absorbed, leaving a cavity that contains serous
fluid. Corpus luteum cysts are rarer than follic-
ular cysts.
Most patients are clinically asymptomatic or
present with irregular menstrual periods due
to the overproduction of progesterone. A cor-
is eliminated, although this may take several
months.
Patients may become symptomatic owing to
complications such as cyst torsion, intracystic
hemorrhage, and rupture with hemorrhage.
Ruptures and infarctions are an indication for
operative treatment.
Sonographic features. Theca-lutein cysts
can range from 6 to 20 cm in size8. A single
cyst is rarely larger than a lemon; but because
lutein cysts tend to be multiple and bilateral,
the ovaries may be substantially enlarged. The
pus luteum cyst is often present during preg-
nancy and regresses spontaneously.
The sonographic criteria of a corpus luteum
cyst are as follows:
► Unilateral
► Up to 5 cm in diameter
► Anechoic to echogenic contents
Ovaries 405
cyst wall resembles an abscess membrane. The
ovarian parenchyma is edematous. The cysts
rupture easily, and pedunculated cysts often
undergo torsion. Ascites may occur.
The sonographic criteria of a theca-lutein
cyst are listed below:
► Multiple
► Bilateral
► Thin-walled
► Anechoic contents
► Echogenic with intracystic hemorrhage
► Moderate to massive ovarian enlargement
► Paraovarian Cyst___________________________________________________________________________
Paraovarian cysts arise from fetal tissues bor-
dering the ovaries (epoophoron, rests of the
caudal mesonephric duct in the mesovary).
They are more accurately classified as retention
cysts rather than true neoplasms. They arise in
the mesovary, are invariably benign, and occur
at any age. Paraovarian cysts are variable in
size; they may be pedunculated, and those
with long pedicles tend to undergo torsion.
Their sonographic criteria are as follows:
► Elliptical shape
► Intraligamentous
► Well delineated from the ovary, may be pe-
dunculated
► Polycystic Ovaries (PCO Syndrome, Stein-Leventhal Syndrome)
PCO syndrome develops during puberty as a
result of increased androgen production by
the adrenal cortex following adrenarche. It af-
fects up to 7% of the female population. The
initiating cause is poorly understood.
Stein-Leventhal syndrome develops when
the hyperandrogenemia7 gives rise to a symp-
tom complex of polycystic ovaries, hirsuitism,
menstrual abnormalities, and obesity.
Pathogenesis of PCO Syndrome
PCO syndrome is characterized by a vicious
cycle in which a stressful situation with
increased ACTH secretion stimulates the
formation of androstenedione in the adre-
nal cortex. This hormone is metabolized in
the fat to estrone and sensitizes the pitui-
tary to LHRH. The result is excessive LH
secretion (FSH is unaffected), causing an
unphysiological stimulation of the ovaries
and increased androgen production (an-
drostenedione) in the theca follicles and
stromal cells. The androgen is again con-
verted to estrone in the fatty tissue, and
the cycle is continued.
The following are additional symptoms of
PCO:
► Sterility and infertility (74%)
► Hirsuitism (50-70%)
► Amenorrhea and oligomenorrhea (approxi-
mately 50%)
► Dysfunctional bleeding (approximately 30%)
► Overweight (40%)
The estrogen stimulation of the endometrium
induces hyperplasia and can also lead to well-
differentiated endometrial carcinoma.
Sonographic features. The ovaries are gener-
ally larger than the uterine corpus. The smooth
a Fig. 13.45 Polycystic ovary (OV) on the right side.
Thickened endometrium in the uterus (UT). BL =
bladder.
tunica albuginea shows echogenic thickening,
and the cortex contains anechoic, usually
equal-sized follicles up to 5 mm in diameter
(rarely > 1 cm) arranged in a circumferential
pattern. Follicular maturation does not occur.
Since ovulation is absent, there is no surface
pitting and no corpora albicantia.
The sonographic criteria are as follows
(Figs. 13.45 and 13.46):
► Bilateral occurrence
► Enlarged ovaries
► Hyperechoic center
► Multiple cysts (anechoic follicles up to 5 mm
in the cortex)
► Endometrial hyperplasia usually present
a Fig. 13.46 Bilateral polycystic ovaries in menarche.
13 female Genital Tract 406
► Cystic Ovarian Tumors__________________
These lesions include benign cystadenoma,
mucinous cystoma (which has a high malig-
nant potential), and cystadenocarcinoma.
Cystadenoma. Benign cystadenoma (serous
cystadenoma) is the most common benign
ovarian tumor. It corresponds histologically to
a cystoma serosum simplex. The wall of the
cystic epithelial tumor is thin, smooth, and
lined with epithelium. Cystadenoma is usually
unifocal and rarely multifocal. If bilateral cystic
tumors are present, they are very likely to be
malignant (65-75% of carcinomas are bilat-
eral). A cystadenoma may have serous contents
(similar to the fallopian tubes) or mucinous
contents (similar to the endocervix), depend-
ing on the type of epithelium and the tumor
origin. The cysts are typically large and may fill
the entire abdomen.
The sonographic criteria are as follows
(Figs. 13.47 and 13.48):
► Anechoic mass
► Thin echogenic wall
► Thin septa, sometimes multilocular
► Smooth surface
Mucinous cystoma. Mucinous cystomas even-
tually undergo malignant transformation and
therefore should be removed without delay.
They account for approximately 25% of all ovar-
ian tumors, and 10% are malignant when diag-
nosed. Mucinous tumors are rarely bilateial
(5% of benign tumors, 10% of borderline tu-
mors, and 20% of mucinous carcinomas are
bilateral). The older the patient, the greater
the likelihood that the tumor is malignant.
Mucinous cystomas are frequently septated,
and their echogenicity can vary. The interior of
the septated areas may show a fine to coarse
echogenic pattern. Needle aspiration is not ad-
vised owing to the risk of tumor cell dissem-
ination.
The sonographic criteria are as follows
(Fig. 13.49):
► Cystic
► Multifocal, often septated
► Thin-walled with no deposits
Cystadenocarcinoma. Serous cystadenocarci-
noma is the most common malignant ovarian
tumor, accounting for approximately one-third
of all ovarian cancers. The tumor is predomi-
nantly cystic, but unlike benign cystadenoma
there are solid hyperechoic elements in the
cyst wall, which shows circumscribed thicken-
ing (Figs.13.50 and 13.51). Hyperechoic, some-
times polypoid structures may project into the
cyst lumen. Nonhomogeneous, hypoechoic
areas may also appear due to intratumoral
hemorrhage and necrosis. Stromal infiltration
can be demonstrated histologically.
Fig. 13.47 Cystadenoma: anechoic mass (C) in the
enlarged ovary (T). A = ascites; UT = uterus; BL =
bladder.
Fig. 13 48 Serous cystadenoma: ovarian cyst (ap-
proximately anechoic mass) in menopause. 10 cm
in diameter.
Fig. 13.49 a Mucinous ovarian cystoma appears as a
cystic mass with multiple septa (S).
b Cystic carcinoma: same as in o, but malignant.
Appears as a predominantly cystic mass with internal
septa.
« Fig. 13.50 Ovarian cyst (C). bladder (BL), uterus (U)
The cyst wall should be scrutinized for local thicken-
ing (cystadenocarcinoma).
Fig. 13.51 Cystadenocarcinoma: circumscribed
thickening of the cyst wall (CW),
Solid Echogenic or Nonhomogeneous Mass
4.J ► Vagina
О И .1
О ► Uterus
Fallopian Tubes
2 J ▼ Ovaries
С Anechoic Cystic Mass
О Solid Echogenic or Nonhomo-
Qj geneous Mass
"s
E
,oj . '
► Endometriotic Cysts
► Thecomatosis
► Inflammatory Adnexal Mass
► Ovarian Carcinoma
► Metastases
► Pseudomyxoma Peritonei
► Ovarian Tumors (by Histological Criteria)
Ovaries 407
► Endometriotic Cysts____________________________________________
Fifty-five percent of patients with endometrio-
sis have ovarian involvement. The endometri-
otic cysts are usually located on the ovarian
surface, initially have a uniformly hypoechoic
cystic appearance, and later become nonhomo-
geneous owing to recurrent bleeding. In this
case the endometriosis is no longer distin-
guishable from carcinoma. The full differential
diagnosis is shown in Table 13.2.
The sonographic criteria are as follows
(Figs. 13.52 and 13.53):
► Anechoic mass on the cortex, 1 -5 mm in
diameter
► With intracystic bleeding, the mass enlarges
and may show homogeneous internal echoes
► Thick, echogenic wall
► Difficult to localize to a specific organ
► With recurrence, a nonhomogeneous echo
pattern may be seen
Ovarian Endometriosis
Pathogenesis. The cyst wall is lined with
endometrioid epithelium. This can result
from the dissemination of endometrium
from the uterus, but a more likely cause is
the primary formation of cysts composed of
coelomic epithelium. This would better ex-
plain the primary occurrence of ovarian ad-
enocarcinoma (approximately 5% of ovarian
tumors are endometrioid tumors, mostly
carcinomas).
Management. Histological confirmation is
always required. Ultrasound follow-ups
should be scheduled at six-month intervals.
Response should be monitored in cases that
have been treated with GnRH analogues.
Table 13.2 Differential diagnosis of endo-
metriotic cysts
► Hemorrhagic functional cyst
► Cystadenoma
► Ovarian carcinoma (endometrioid car-
cinoma)
► Intraligamentous myomas
► Inflammatory processes
a Fig. 13.52 Endometriotic cysts of the ovary
a Multiple hypoechoic foci in the ovary.
a b Large, solitary histological endometriotic cyst (sur-
gery and histology: first sonographic diagnosis: ab-
scess). The clinical and sonographic diagnosis was
abscess. The absence of vascularity is not consistent
with ovarian carcinoma. BL = bladder; UT = uterus.
a Fig. 13.53 Endometriosis with bleeding: hypoechoic
mass, hematomas (H) due to bleeding in foci of
endometriosis. UT = uterus.
► Thecomatosis____________________________________________________________________________
Thecomatosis is a pure stromal hyperplasia
causing moderate enlargement of the ovary,
which undergoes nodular changes. Histologi-
cally, the cortex is hyperplastic and shows in-
tracellular fat deposits. Stromal hyperplasia oc-
curs only in menopause.
► Inflammatory Adnexal Mass
13 Female Genital Tract 408
Enlargements of the ovaries due to inflamma-
tion fall under the heading of adnexal masses.
They include the following entities:
► Ovarian abscess
► Tubo-ovai ian abscess originating from the
fallopian tube (Fig. 13.38)
► Hematogenous tuberculosis. Conglomerate
masses are formed, usually bilateral and
densely matted (making them difficult to
distinguish from carcinoma!)
► Ovarian Carcinoma
FICO and TNM Staging for Ovarian Carcinoma
T1/I Tumor confined to one ovary
Tlc/lc Tumor on the ovarian surface, or capsule ruptured, or malignant cells in the peritoneal
cavity
T2/II Tumor extension beyond the ovary
T3/III Peritoneal metastases outside the pelvis and/or regional lymph node metastasis
Ml/IV Distant metastases
Any kind of tissue can give rise to a malignant
tumor, but only tumors derived from the ger-
minal epithelium are classified as ovarian car-
cinoma. Thecahke transformation in ovarian
tumors leads to small amounts of estrogen
production in 15-20% of all epithelial cancers.
Tumors in postmenopausal women who are
not on hormone replacement therapy are al-
ways suspicious. If findings are equivocal, diag-
nostic laparoscopy is always advised.
Sonographic features. Carcinoma can have al-
most any sonomorphological appearance:
cystic, hyperechoic, hypoechoic, and nonho-
mogeneous. Large tumors contain non homoge-
neous solid components, may show central an-
echoic necrosis, and tend to invade neighbor-
ing structures, producing ill-defined margins. It
is common for ovarian carcinoma to coexist
with uterine or tubal cancers. Primary malig-
nant tumors of the ovary are indistinguishable
from metastases arising from other primary
malignancies.
Endometrioid adenocarcinomas are more
heavily permeated by cysts and papillomas.
Borderline Criteria
Borderline tumors are tumors that have a low
malignant potential2:
► Epithelial tumors
► Confined to the organ
► No stromal invasion
► Amenable to curative surgery
They account for approximately 5% of ovarian
tumors.
Peritoneal carcinomatosis. Serous or muci-
nous carcinomas usually become disseminated
throughout the abdominal cavity while the pri-
mary tumor itself is still relatively small. The
peritoneum in these cases is studded with
small tumor nodules and shows irregular hy-
perechoic thickening. Metastases are seeded
early to the greater omentum, and a large,
flat, confluent, hypoechoic tumor is formed
(л 8.3a, d, s 8.6f, Fig.8.29). Hypoechoic
masses also form on the diaphragm and along
the umbilical vein. With the associated ob-
struction of lymphatic drainage, the serous
fluid produced by the tumor cells usually leads
to a copious ascites that is blood-tinged on
percutaneous aspiration. Cytological analysis
of the ascites has a diagnostic accuracy of 80%.
Metastasis. Lymph node metastases (para-
aortic, inguinal, lesser pelvis) are of minor im-
portance. Ovarian carcinoma spreads hemato-
genously to the pleura, lung, and liver and less
commonly to the brain and bone.
► Five-year survival rate 80-90%, even with
peritoneal seeding
► Occurrence in premenopausal women.
Two-thirds of malignant tumors in women
under age 40 are borderline tumors, as
opposed to only 10% in women over age
40.
Table 13.3 Differential diagnosis of ovar-
ian masses
► Gallbladder hydrops
► Splenic tumor
► Pelvic kidney, renal tumor, hydroneph-
rosis
► Pancreatic cysts
► Mesenteric cysts
► Bowel tumors, diverticulosis
► Tuberculous conglomerate masses
► Nodal packages in the mesentery
► Distended bladder
► Uterine myomas
► Tumors of the pelvic connective tissue
(lipoma, sarcoma, endothelioma, retro-
peritoneal liposarcoma, retroperitoneal
pseudomyxoma, osteoma, enchon-
droma)
► Tumors of the bony pelvis (may invade
the connective tissue)
Differential diagnosis. Differentiation from in-
testinal carcinoma can be difficult. Bowel can-
cers are frequently associated with hepatic and
lymph node metastases, but they rarely show
omental involvement or peritoneal carcinoma-
tosis with ascites.
In differentiating ovarian cancer from ute-
rine myomas, a short, firm pedicle not attached
to the cornual region suggests a subserous my-
oma, whereas a soft, mobile pedicle connected
to the cornual region suggests an ovarian tu-
mor. The full differential diagnosis is listed in
Table 13.3.
The sonographic criteria for carcinoma are
as follows (Figs.13.54 and 13.55):
► Larger than 5 cm
► Nonhomogeneous, cystic-solid
► Ill-defined margins
► Lobulated or nodulated
► Echogenic
► Broad septa
► Bilateral
► Papillary deposits
► Free fluid
► On palpation: fixed, matted, firm
Fig. 13.54 Cystadenocarcinoma: hyperechoic poly-
poid tumors of the cystic epithelium.
« Fig. 13.55 Endometrial hyperplasia (transvaginal
scan) in ovarian carcinoma, uterus with endometrial
hyperplasia (16.3 mm).
Ovaries 409
► Metastases___________________________________________
Ovarian metastases are very rare and originate
from cancers of the bronchial system, gastroin-
testinal tract, breast, and gallbladder. Approxi-
mately 3% of malignant ovarian tumors are
metastases.
Krukenberg tumor is the term applied to en-
larged ovaries (generally both) that are dif-
fusely permeated by epithelial signet-rmg cells,
usually from gastric carcinoma and occasion-
ally from colon carcinoma. The tumor cells
metastasize chiefly by the lymphogenous route
and less commonly via the bloodstream.
► Pseudomyxoma peritonei-----------------------------------------------------
In pseudomyxoma peritonei, the peritoneal
cavity is filled with a large quantity of mucin.
Ultrasound demonstrates anechoic fluid in the
peritoneal cavity.
The cause may be tumor cells seeded from a
mucinous ovarian tumor or a mucinous adeno-
carcinoma of the appendix. Pseudomyxoma
peritonei can also arise secondarily from the
rupture of a mucinous cystoma (usually at op-
eration) or possibly as a primary epithelial dis-
ease based on peritoneal metaplasia.
As there is no effective treatment, the dis-
ease runs a malignant course marked by intes-
tinal adhesions and obstructions, with patients
dying from cachexia.
► Ovarian Tumors (by Histological Criteria)------------------------------------------------------------
Because many different cell types exist in the
ovaries, a large number of different neoplasms
can arise. As a result, the ovaries are subject to a
greater diversity of tumor types than any other
organ in the human body.
Incidence data.
Epithelial tumors:
► 66% of all ovarian tumors are epithelial tu-
mors.
► Of the malignant tumors, 85% are epithelial
tumors.
Serous tumors:
► 50% of all ovarian tumors are serous tumors.
► 70% of serous tumors are benign, and
20-25% of serous tumors are true invasive
carcinomas.
► 40% of ovarian carcinomas are serous carci-
nomas, making this the most common type.
Sex cord-stromal tumors:
► 3% of all true ovarian tumors are sex cord-
stromal tumors.
Germ cell tumors:
► 15-20% of all ovarian tumors are germ cell
tumors.
► 95% of germ cell tumors are benign cystic
teratomas.
► 2-3% of germ cell tumors are malignant.
► Approximately 65% of malignant ovarian
tumors up to age 20 are germ cell tumors.
Bilateral occurrence:
► 20-30% of benign tumors
► 30-40% of borderline tumors
► 65-75% of carcinomas
Classification of Ovarian Tumors11
► Superficial epithelial-stromal tumors
- Serous tumors
- Mucinous tumors
- Endometrioid tumors
- Clear cell tumors
-Transitional cell tumors (Brenner tumor)
- Squamous cell tumors
- Epithelial mixed tumors
- Undifferentiated car
► Sex cord-stromal tumors
- Granulosa-stromal cell tumors
- Sertoli-stromal cell tumors, androblas-
toma
- Sex cord tumors with annular tubules
- Gynandroblastoma
- Unclassifiable
- Steroid (lipid) cell tumors
► Germ cell tumors
- Dysgerminoma
- Yolk sac tumor
- Embryonic carcinoma
- Choriocarcinoma
- Teratoma
- Mixed types
► Gonadoblasotoma
Epithelial tumors. Epithelial tumors arise
from inclusion cysts in the germinal epithe-
lium. The ovary contains numerous germinal
epithelial cysts whose origin is still unex-
► Germ cell-sex cord-stromal tumors
► Tumors of the rete ovarii
► Mesothelial tumors
► Tumors of uncertain histogenesis
► Gestational trophoblastic diseases
► Soft-tissue tumors, not ovary-specific
► Malignant lymphoma
► Unclassifiable tumors
► Metastases
► Tumorlike lesions
- Solitary follicular cyst
► - Multiple follicular cysts
- Luteinized cyst in pregnancy
- Hyperreaction luteinalis (multiple lutein
cysts)
- Corpus luteum cyst
- Gestational luteoma
- Ectopic pregnancy
- Stromal hyperplasia
- Stromal hyperthecosis
- Massive edema
- Fibromatosis
- Endometriosis
- Nonclassifiable cyst
- Inflammatory lesions
13 Female Genital Tract 410
plained. Mixed epithelial tumors occur. Epithe- (5-15% of malignant ovarian tumors), while phogenous spread. Overall, they have a favor- hal tumors can vary consideiably in size. They epithelial tumors are less common. Germ cell able prognosis. may be cystic, cystic/sohd, or solid. Most solid tumors occur predominantly in childhood and tumors are malignant. from 20 to 30 years of age; they are rare after Morphological and sonomorphological cri- menopause. Approximately two-thirds of ma- teria. Tables 13.4-13.6 summarize the principal Sex cord-stromal tumors. These tumors arise lignant ovarian tumors in patients under age 20 morphological and sonomorphological criteria from sexually differentiated mesenchyma. are germ cell tumors. They are derived from for the three main groups of superficial stromal They are palpable, hormone-producing ovarian primordial germ cells (direct: dysgerminoma; tumors, sex cord-stromal tumors, and germ cell tumors that are composed of one or more cell indirect embryonic: teratoma; extraembryonic tumors. The next box then reviews the essential types. They produce estrogen or androgens. tumors: choriocarcinoma, yolk sac tumor). aspects ofthe clinical manifestations, diagnosis. Germ cell tumors grow rapidly, are unilateral. and treatment of ovarian tumors. Germ cell tumors. Germ cell tumors are more and metastasize by hematogenous and lym- prevalent in Africa and Asia than in Europe
Table 13.4 Features of epithelial tumors
Tumor Tumor behavior, frequency, bilateral occurrence Histology, morphology Sonographic criteria Special features
Serous tumors
► Cystadenoma - Most common benign ovarian tumor - Generally unilateral - Thin cyst wall, lined with epithelium - Serous contents - Usually large cysts - Anechoic mass - Smooth surface - Thin echogenic wall - Thin septa, possibly multi- locular - See Cystic Ovarian Masses
► Cystadeno- carcinoma - Most common malig- nant ovarian tumor (1/3 of all ovarian can- cers) - Predominantly cystic with solid elements - Circumscribed thickening of cyst wall - Polypoid structures, in- tratumoral hemorrhage, and necrosis may occur - Stromal infiltration - Mixed anechoic (cystic ele- ments) to hyperechoic (cyst wall) - Nonhomogeneous echogenic areas (bleeding and necrosis) - Often with ascites in metasta- ses/peritoneal metastases - See Cystic Ovarian Masses
Mucinous tumors
► Mucinous cystoma - 25% of all ovarian tu- mors - Initially benign, even- tually degenerates - 5-20% bilateral (de- pending on malig- nancy) - Multifocal - Often septated - Thin-walled - Variable echogenicity - Fine to coarse internal echoes in the septated spaces - See Cystic Ovarian Masses
► Mucinous cystade- nocarcinoma - 10% of ovarian carci- nomas - 20% bilateral - Mixed cystic and solid - Intratumoral hemorrhage and necrosis may occur - Anechoic (cystic) to echogenic (solid) with hypoechoic areas (bleeding and necrosis) - Often associated with pseudo- myxoma peritonei
Endometrioid tumor - 20% of ovarian carci- nomas - 30—40% bilateral - Mixed cystic and solid - Cyst contents serous or bloody - Foci of bleeding and ne- crosis - Cyst contents hypoechoic to echogenic - Coexists with endo- metrial carcinoma in 15-30% of cases
Clear cell tumor - 5-10% of ovarian car- cinomas - 40% bilateral - Mixed cystic and solid - Mixed anechoic and hyper- echoic - Indistinguishable from other tumors by ultrasound
Transitional cell tumor (Brenner tumor) - 1-2% of all ovarian tumors - Usually benign - Unilateral - Smooth margins - Not visible or up to 2-3 cm large - Calcifications may occur - With calcifications: high-level internal echoes with acoustic shadows - Patients are ap- proximately 50 years old
Table 13,5 Features of sex cord-stromal tumors
Tumor Tumor behavior, frequency, bilateral occurrence Histology, morphology Sonographic criteria Special features
Granulosa-stromal cell tumors ► Granulosa cell - Most common estro- - Solid structure - Hypoechoic - Estrogen production can lead to
tumor gen-producing ovar- - Up to 30 cm in diame- - Possible cysts precocious pseudopuberty in ado-
► Thecoma ian tumor - Usually unilateral - Frequent malignant growth without cor- relative histology - Less common than ter - 5-10 cm in diameter - Smooth margins lescents. to uterine and breast en- largement in sexually mature women, to endometrial hyperplasia or carcinoma in postmenopausal women - Can recur after 10-20 years - Estrogen production
(theca cell tu- granulosa cell tumor - Consists of fat-rich - Hypoechoic with echo- - Rare in puberty, common around
mor) ► Ovarian fi- - Unilateral - Generally benign - Most common ovar- stromal cells, collagen-producing cells, and nests of granulosa cells - Arises from sexually genic strands - Smooth margins, oval, menopause - Causes menstrual abnormalities and breast enlargement; endometrial hy- pertrophy and carcinoma may occur - Often confused with fibroma - 40% of fibromas > 6 cm associated
broma ian stromal tumor - 4% of all ovarian tu- mors undifferentiated mes- enchyma - Firm due to collagen uniformly hypoechoic - Occasional cystic de- generation with ascites - Rare development of fibrosarcoma - Meigs syndrome: benign ovarian
► Sarcoma - Usually unilateral - Usually benign - Very malignant production - “Adenofibroma”: also contains glands and cysts - Solid, less firm than fi- - Often heavily calcified - Solid, predominantly tumor (fibroma) with ascites and pleural effusion (usually on the right side), caused by lymphatic obstruc- tion? - Differentiation required from Kruken- berg tumor: metastases from bowel or breast tumors - In young women and children
Sertoli stromal - Pure sarcomas are rare, mostly mixed forms: fibrosarcoma, leiomyosarcoma, ad- enosarcoma - 0.2% of all ovarian bromas - Histological structure resembles “fish meat” - Solid, up to 10 cm in hypoechoic (less hypo- echoic than fibroma) - Smooth margins, non- - In young women (ca. 25 years)
cell tumors, an- tumors diameter homogeneous hypo- - 80% produce androgens, causing
droblastomas - Usually benign - Cells resemble Sertoli echoic/hyperechoic hirsuitism with beard growth, deep
Steroid (lipid) - Unilateral - Usually benign and Leydig cells - Resemble a hyper- texture voice, secondary amenorrhea, clito- ral hypertrophy, breast and uterine atrophy, alopecia, increased libido - Androblastomas: incomplete devel- opment of a testis from stroma of embryonic gonads; special form composed of ovarian hilar cells (hi- lar-Leydig cell tumor) may produce estrogen - Urinary 17-ketosteroids sometimes
cell tumors nephroma, may arise from heterotopic adrenal tissues - Soft, slightly necrotic elevated - Obesity, virilization, abdominal striae
Ovaries 411
13 Female Genital Tract
Table 13.6 Features of germ cell tumors
Tumor Tumor behavior, frequency, bilateral occurrence Histology, morphology Sonographic criteria Special features
Dysgerminoma (gonocytoma, round cell sarcoma, semi- noma) - 5-10% of all ovarian tumors, ca. 2% of ma- lignant ovarian tu- mors up to age 20 - Most common ma- lignant germ cell tu- mor (50%) - Most common ma- lignant tumor in pregnancy and inter- sexuality - 10% bilateral (large tumors) - Very fast-growing, solid tumor up to about 30 cm - Very radiosensitive - Good prognosis - Occult tumors on the opposite side
Yolk sac tumor (entodermal sinus tu- mor) - 20% of immature germ cell tumors of the ovary - Malignant - Reticular epithelial cells - Papillary structure - Product AFP (used a tumor marker) - Better prognosis today with cytostatics
Teratomas
► Dermoid (benign teratoma, dermoid cyst) - 15% of all ovarian tu- mors - One-third of all be- nign ovarian tumors - 80% of all germ cell tumors - Benign, but the squ- amous portion may show malignant change (1 %) - Usually unilateral - Composed of em- bryonic germ cells - Crows very slowly - Rarely larger than fist-size - Surface smooth but irregular - Ill-defined margins - Solid with high nonhomogeneous echogenicity, occasionally with cal- cium - Cyst with layered internal structure; pathognomonic, especially when echogenic part is anterior (floating sebum, liquid at body temperature) - May contain tooth bud and bone with acoustic shadowing - In younger women - Strictly speaking, a re- tention cyst; enlarges when skin secretions expand the cyst sac - Prone to torsion, sup- puration; may pene- trate into the rectum
► Malignant solid teratomas - Highly malignant - Dermoid with dis- ordered cell pat- tern and glial pro- liferation - Rapid growth - Destructive spread - Metastases
► Struma ovarii - Monodermal neo- plasm, predomi- nates in thyroid tissue - Requires differentiation from hem- orrhagic cyst, cystadenoma, fibroma - Hormone production can cause hyper- thyroidism
Clinical Aspects, Diagnosis, and Treatment of Ovarian Tumors
Symptoms
► There are no early symptoms.
► Ovarian tumors cause few if any complaints and have ample room to expand from the lesser to the greater
pelvis. Often they are detected only after increasing the abdominal girth. Many of these tumors are detected
incidentally.
► Uterine bleeding (7%) occurs when there is a coexisting uterine tumor or when the ovarian cancer has
penetrated the vaginal wall.
► Estrogen production and its associated symptoms occur in 18% of all ovarian tumors and 25% of ovarian
carcinomas.
► In 70% of cases, metastases are already present at operation.
Typical complications
► Torsion of a pedunculated uterine tumor (10-20%) may be caused by an external force acting on the tumor
(sudden deceleration), especially if the mass contains fluid. A gradual occlusion of the blood supply causes a
gradual increase in complaints, while sudden occlusion produces a shocklike condition with peritonitis.
Torsion can lead to necrosis.
► Infections occur in 2% of ovarian tumors, usually owing to the migration of infectious microorganisms from
the bowel. They can lead to suppuration (pyogenic organisms) and putrefaction (putrefactive bacteria). The
results are high intermittent fever and life-threatening peritonitis.
► Incarceration occurs if the tumor cannot move upward out of the lesser pelvis.
► Rupture occurs in 3% of all ovarian cysts, usually spontaneously and often as a result of torsion. Life-
threatening internal bleeding can develop. The draining cystic fluid and spillage of cells lead to chronic
ascites.
► Complaints relating to the complications are low back pain, a bloated feeling, difficulties in passing urine and
stool, varices, and leg edema.
Diagnosis
Gynecological examination and ultrasonography by an experienced examiner using modern equipment should
ensure that no malignant tumors are discovered incidentally at operation.
Tumor locations:
► Large ovarian tumors can exert traction on the uterus, causing it to assume a transverse position in the lesser
pelvis.
► Small ovarian tumors are located in the lesser pelvis adjacent to the uterus, which they may displace.
► Dermoid cysts are often located anterior to the uterus.
► Tumors of the pelvic connective tissue are difficult to define.
Rule:
► The attachment of a tumor is located opposite the site of greatest mobility. Testing this mobility sign will
usually help in distinguishing between an abdominal tumor and a tumor of genital origin
Suspicious signs during palpation:
► Tumor adherent, irregularly enlarged, or bilateral.
► Palpable nodule on the uterine attachment of the sacrouterine ligaments, in the cul-de-sac, or on the
epiploic appendages of the rectum.
► Ovaries palpable after menopause.
Ovaries 413
Imaging and invasive studies
The patient may be examined by ultrasound, laparoscopy, CT (in exceptional cases), or laparotomy with
extirpation and histological evaluation.
Ultrasound with a well-distended bladder:
► Criteria for malignancy: solid, irregular, mixed solid/cystic elements, ascites.
► Criteria for benignancy: smooth, unilocular or multilocular cysts.
Cysts should not be aspirated:
► Danger of rupture and possible cell spillage!
► Needle aspiration cannot exclude intracystic carcinoma.
► Cyst aspiration is never curative!
Aspiration of ascites:
► The ascites in early ovarian carcinoma is free of tumor cells.
Laparoscopy:
► Laparoscopy is unsafe owing to the risk of cell spillage and uncertain because a wedge excision may be
nondiagnostic. Because every ovarian tumor ultimately should be removed, laparoscopy merely wastes
time.
Computed tomography:
► Whenever possible, CT should be performed only after menopause because of radiation exposure to the
ovaries.
13 Female Genital Tract
Treatment
► Wait for menstruation to occur before performing surgery, as functional cysts will regress spontaneously.
► With malignant ovarian tumors, both ovaries and fallopian tubes should almost always be removed along
with the uterus and greater omentum because of the likelihood of metastases.
► A cure is possible if the largest tumor remnant left behind is no larger than 1-2 cm.
► Ovarian tumors are responsive to chemotherapy. If tumors recur, they do so quickly after the therapy is
discontinued.
► Even during pregnancy, every true ovarian tumor should be surgically removed because of the risk of
torsion, rupture, and suppuration in the puerperium (10%).
Prognosis
The prognosis depends critically on the timing of the first operation and the corresponding tumor stage, the
degree of tumor differentiation, and the histological type (serous tumors have a poorer prognosis than
mucinous or endometrioid lesions).
► The 5-year survival rates (after surgery and chemotherapy) are as follows:
Stage I
Stage II
Stage III
Stage IV
80%
50%
10-12%
1-2%
► Today, 70% of ovarian carcinomas are diagnosed in stage III or IV; the 5-year survival rate is 30%.
References 6.
1. Frank K. Goklhofer W. Uterus und Adnexe. In:
Rettenmaier G. Seitz К (eds.). Sonographische
Differentialdiagnostik. Stuttgart: Thieme 1999.
2. Innes D, Jackson J (University of Virginia School of 7-
Medicine) Basic Pathology, http://www.med.vir-
ginia.edu/med-ed/path/gyn/index.html
3. Kaiser R. Pfleiderer A. Geschwiilste. In: Lehrbuch 8-
der Gynakologie. Stuttgart: Thieme 1985.
4. Kaiser R, Pfleiderer A. Keimzelltumoren. In:
Lehrbuch der Gynakologie. Stuttgart: Thieme
1985.
5. Kozlowski P, Bohmer S. Gynakologische Frages- 9.
tellung in der Ultraschalldiagnostik. Landshut:
ecomed 1991.
Merz E. Anatomie des weiblichen Beckens. In:
Sonographische Diagnostik in Gynakologie und
Geburtshilfe. VoI1, 2nd ed. Stuttgart: Thieme
1997.
Moltz L Androgenisierungserscheinungen. In:
Differentialdiagnose in Geburtshilfe und Gyna-
kologie. Stuttgart: Thieme 1984; p.46.
Schmidt-GoIIwitzer K, Schmidt-Gollwitzer M. Der
palpable Unterbauchtumor. In: Martius G,
Schmidt-Gollwitzer M (eds.). Differentialdiag-
nose in Geburtshilfe und Gynakologie. Stuttgart:
Thieme 1984.
Schmidt-Gollwitzer M. Abnorme vaginale Blu-
tungen. In: Martius G, Schmidt-Gollwitzer M
(eds.). Differentialdiagnose in Geburtshilfe und
Gynakologie. Stuttgart: Thieme 1984; p.16.
10. Sohn C, Krapfl-Gast AS, Schiesser M. Checkliste
Sonographie in Gynakologie und Geburtshilfe.
Stuttgart: Thieme 1998.
11. Soully, R. Histological typing of ovarian tumours.
Deutsch: Histologische Klassifikation der Ovar-
ialtumore. World Health Organization 1997. Ber-
lin: Springer 1999.
Thyroid Gland 417
▼ Diffuse Changes
f^Tnk^ecTrbyroi^TTand
— ► Diffuse Parenchymatous Goiter
— ► Diffuse Colloid Goiter
— ► Hypertrophic Hashimoto
Thyroiditis
— ► Immunogenic Basedow
Hyperthyroidism
— ► Subacute de Quervain Thyroiditis
— ► Invasive Sclerosing Thyroiditis
(Riedel Goiter)
---► Goiter in Acromegaly
---► Amyloidosis
Small Thyroid Gland
423
— ► Acquired Autoimmune Thyroiditis
(AIT): Atrophic Lymphocytic
Thyroiditis (juvenile)
— ► Acquired Autoimmune Thyroiditis
(AIT) in Polyglandular Autoimmune
Disease (PAS)
---► Lithium- or Amiodarone-Induced
Thyroiditis
— ► Neonatal Hypothyroidism
— ► Postoperative Thyroid/Unilateral
Aplasia
— ► Radioiodine-Treated Thyroid
— ► Radiation-Induced Hypothyroidism
► Hypoechoic Structure
— ► Chronic Thyroiditis with Transient
Hyperthyroidism, Postpartum
Thyroiditis
---► Silent (Sporadic) Thyroiditis
---► Lithium- or Amiodarone-Induced
Thyroiditis
► Hyperechoic Structure
---► Radiation-Induced Hypothyroidism
▼ Circumscribed Changes
^^^nechoi^
I— ► Cysts
[— ► Vessels
----► Abscess
► Hypoechoic
|— ► Microfollicular (Papillary) Adenoma
!--► Oncocytic Adenoma
I • ► Lipoma
I — ► Parathyroid Adenoma
I— ► Abscess
f—• ► Focal de Quervain Thyroiditis
— ► Malignant Lymphoma
|— ► Carcinoma
---► Tumor Infiltration or Metastasis
* Isoechoic
---► Normofollicular Adenoma
|— ► Hemorrhagic or Colloid Cyst
।--► Regressive Changes in an Adenoma
or Adenomatous Nodule
I
I
I
▼ Circumscribed Changes
(Continue)
F^^yperechZh"-
— ► Macrofollicular Adenoma or Nodule
— ► Hemorrhagic Cyst. Colloid Cyst
—- ► Nodule with Regressive Changes
— ► Hemangioma. Myolipoma. Thyroid
Regressive Changes
I— ► Calcifications
► Irregular
— ► Nodular Gotter
— ► Regressive Nodular Goiter
— ► Tumor
▼ Differential Diagnosis of Hyper-
thyroidism
LJ^T^^^Tn^Honom^"
443
443
— ► Unifocal autonomy
— ► Bifocal autonomy
— ► Multifocal autonomy
— ► Disseminated autonomy
14 Thyroid Gland
G. Schmidt
The thyroid gland is an endocrine gland whose
function is to secrete three hormones: tetraio-
dothyronine (thyroxine, T4), trace amounts of
triiodothyronine (T3; most T3 is produced pe-
ripherally by the deiodination of T4), and calci-
tonin. Thyroxine and triiodothyronine are syn-
thesized in the thyrocytes while calcitonin is
produced in the C cells of the colloid-contain-
ing follicular epithelium.
Thyroid calcitonin plays a key role in bone
metabolism along with serum calcium, serum
phosphate, and parathormone and is subject to
a feedback control mechanism.
An intrathyroid iodine deficiency leads to a
numerical increase in the thyrocyte population
(follicular hyperplasia), while an increase in
thyroid-stimulating hormone (TSH) leads to
thyroid enlargement (follicular hypertrophy).
Both processes, then, are responsible in differ-
ent ways for the development of a goiter.
Ultrasonography is the method of first choice
for imaging the thyroid and for evaluating the
lymph nodes in the neck and thyroid region.
MRI and CT are useful only in selected inves-
tigations. Radionuclide scanning (scintigraphy)
is best for evaluating focal thyroid lesions and
investigating hyperthyroidism.
14 Thyroid Gland 417
► Anatomy_____________________________________________________________________
Shape
► Anterior aspect: butterfly-shaped
► In cross-section: horseshoe-shaped
Size
► AP diameter: 10-17 mm
► Transverse diameter: 12-20 mm
► Length of a thyroid lobe: 40-70 mm
Microanatomy
► Colloid-filled microfollicles, macrofol-
licles, and normal-sized follicles
► Follicular epithelium composed of thyro-
cytes and calcitonin cells
Blood supply
► Superior and inferior thyroid arteries
(both paired)
When viewed from the front, the thyroid gland
has a butterfly shape, with the head repre-
sented by the often rudimentary pyramidal
lobe and the two wings by the thyroid lobes.
The pyramidal lobe is a remnant of the thyro-
glossal duct present during embryonic develop-
Table 14.1 Upper normal limits for sonographic measurements of thyroid volume
Age/sex Volume (corresponds to weight in grams)
Newborn 1.5-2 ml
Up to 2 years 2-3 ml
3-4 years 3 ml
Up to 6 years 4 ml
Up to 10 years 6 ml
Up to 12 years 7 ml
Up to 14 years 8-10 ml
15-18 years 15 ml
Adult women up to 18 ml
Adult men up to 25 ml
ment of the thyroid gland from the tongue base.
Incomplete obliteration of the thyroglossal duct
occasionally results in medial neck cysts.
The thyroid gland is surrounded by muscles.
The sternohyoid and sternothyroid muscles are
anterior to the thyroid, the sternocleidomas-
toid muscles are lateral, and the longus colli
muscle is posterior. The blood vessels of the
thyroid run through the gland in pairs: the
superior thyroid artery above and the inferior
thyroid artery below. Lateral to the gland are
the common carotid artery and internal jugular
vein (Fig. 14.1).
Horseshoe shape. While the thyroid gland has
a butterfly shape when viewed from the front
and by radionuclide scanning, it exhibits a
horseshoe shape in the transverse ultrasound
scan (Fig.14.2a). The curved arms of the horse-
shoe are formed by the lobes, which are united
by the thyroid isthmus. The borders of the
thyroid are smooth owing to the presence of
the thyroid capsule.
Size. The size of the thyroid gland is deter-
mined sonographically by measuring each
lobe separately in a transverse scan on the right
Sternocleidomastoid
muscle
Sternohyoid,
sternothyroid muscles
a Fig. 14.1 Cross-section through the neck at the level
of the thyroid gland.
and left sides (Fig. 14.2). This method yields the
following approximate dimensions': AP depth
10-17 mm, transverse diameter 12-20 mm,
longitudinal dimension of each lobe
40-70 mm.
Volume. The volume of the thyroid gland is
calculated using the volume formula fora rota-
Microanatomy of the Thyroid Gland
The microanatomy of the thyroid gland is
determined by the follicles. The microfol-
licles, macrofollicles, and normal-sized fol-
licles range from 50 to 200 am in size and
contain colloid, which consists mainly of
thyroglobulin and deposits of monoiodo-
tyrosine and diiodothyrosine. The iodina-
tion of thyroglobulin by inorganic iodide to
monoiodothyrosine and diiodothyrosine,
and probably their coupling to tetraiodo-
thyronine (thyroxine) and triiodothyronine,
are catalyzed by the enzyme thyroid per-
oxidase (TPO).
The single row of epithelial cells in the
follicles consists of thyrocytes and calcito-
nin cells. Even the normal thyroid gland
contains thyrocytes, isolated or in aggre-
gates, that are primarily autonomous cells,
i.e., not subject to the feedback control
system. These cells can proliferate, espe-
cially in an iodine-deficient state, and grow
into autonomous nodules (adenomas).
14 Thyroid Gland 418
tional ellipsoid: length of one lobe (cm) * the
width of the lobe (cm) x the depth (cm) x 0.5.
Both thyroid lobes are measured separately
and the results are added together to obtain the
total volume (the volume of the isthmus is
ignored). The normal values for age are shown
in Table 14.1. The volume calculation is only an
approximation, as it overestimates smaller vol-
umes and underestimates larger volumes. It is
difficult to make a reasonably accurate volume
measurement in a nodular goiter with poorly
defined margins.
Unilateral aplasia is occasionally detected
incidentally in adults (previous surgery should
be excluded).
a Fig. 14.2 Measuring the size of the thyroid gland (the
measuring cursors are shown).
a Transverse scan through the neck.
a b Longitudinal scan on the right side.
► Topography__________________________________________________________________________
Location of the thyroid gland
► Anterior to the first and fourth tracheal
rings
► Isthmus and pyramidal lobe at the level of
the cricoid cartilage
► Thyroid lobes anterior in the thyroid
trigone
► Relates posteriorly to the pharynx and
upper esophagus
Location of the parathyroid glands
► Outside the thyroid capsule
► Upper parathyroids at the level of the
cricoid cartilage between the trachea and
esophagus, on the posterior aspect of the
upper third of the thyroid
► Lower parathyroids on the trunk and be-
tween the branches of the inferior thy-
roid artery; on the lateral or posterior
aspect of the inferior thyroid pole or at a
lower level
The thyroid gland has a horseshoe shape in
anatomical cross-section. From anterior to pos-
terior are the cervical fascia followed by the
sternohyoid and sternothyroid muscles, the
omohyoid muscles anterolaterally, and the
powerful sternocleidomastoid muscles later-
ally. Posterior to these muscles are the isthmus
of the thyroid gland and the left and right
thyroid lobes. They are followed posteriorly
by the trachea, parathyroid glands, esophagus
(a little to the left), and retropharyngeal con-
nective tissue. Behind that, placed lateral to the
spinal column, are the longus colli muscles. The
relations noted in this anatomical cross-section
can be appreciated in the corresponding trans-
verse ultrasound scan and longitudinal scans
through each thyroid lobe (Figs. 14.3 and 14.4).
The portion of the upper esophagus behind the
thyroid gland is visible posteriorly between the
left thyroid lobe and the tracheal acoustic
shadow (Fig. 14.5).
Vessels. Ultrasound can consistently demon-
strate the blood vessels that run in and around
the thyroid gland. The common carotid artery
and internal jugular vein run lateral to the
thyroid. The superior and inferior thyroid ar-
teries that supply the organ are consistently
defined at its upper and lower poles in longi-
tudinal scans (Figs. 14.6-14.8).
Parathyroid glands. The four parathyroid
glands show frequent variations in their num-
ber and position; usually only two or three are
present. They are located on the posterior as-
pect of the thyroid. Generally the upper para-
thyroids are extracapsular (rarely intracapsu-
lar) and are at the level of the cricoid cartilage
between the trachea and esophagus. The lower
parathyroids are located on the branches or
trunk of the inferior thyroid artery or, in rare
cases, directly on the lower poles (see
Figs. 14.35 and 14.36).
« Fig. 14.3 Topographic relations of the thyroid gland
(TH). M = sternocleidomastoid muscle; ACC = com-
mon carotid artery; JV = jugular vein; T = trachea.
Posterior to the left thyroid lobe is the esophagus
(appearing here as a triangular hypoechoic struc-
ture). In the right posterolateral quadrant, the infe-
rior thyroid vein enters the jugular vein.
< Fig. 14.4 Longitudinal color duplex scan of the left,
structurally normal thyroid gland (TH, cursors). The
less echogenic anterior neck muscles (M) are visible
anteriorly. Normal, scant color spots appear at a low
pulse repetition frequency (PRF) corresponding to a
flow velocity of 0.06 m/s.
◄◄ Fig. 14.5 Left lobe of the thyroid gland (TH), lying
anterior to the cervical part of the esophagus (OE).
a Transverse scan.
« b Longitudinal scan: the anterior wall shows the
typical three-part alternation between hypoechoic,
hyperechoic, and hypoechoic layers The echogenic
lumen appears farther posteriorly.
« Fig. 14.6 a and b Lateral to the thyroid gland (TH) are
the internal jugular vein (VJ)—in this case markedly
dilated with slow flow due to cardiac congestion—
and, posterolaterally, the common carotid artery
(AC).
Fig. 14.7 Superior thyroid artery (A) in the upper
part of the thyroid gland (TH). M = musculature.
◄ Fig. 14.8 Inferior thyroid artery (ATI) at the lower
pole of the thyroid gland (TH). AC = common carotid
artery; M = anterolateral neck muscles.
Diffuse Changes
Diffuse Changes
Diffuse thyroid changes are associated with
changes in the size and/or structure of the
organ. The enlarged thyroid may show a nor-
mal, hyperechoic, or hypoechoic structure,
whereas the diffuse structural changes in a
normal-sized thyroid are, with few exceptions
(e.g., radiation-induced hypothyroidism), hy-
poechoic. Aside from goiters composed of mul-
tiple confluent hypoechoic nodules, these dif-
fuse hypoechoic changes always have an in-
flammatory, immunogenic, or autoimmune eti-
ology.
Micro-, macro- and normal-sized follicles as
well as blood vessels determine the normal
echo structure of the thyroid gland. Changes
in the dominant follicle type lead to changes
in this echo structure. It is best to evaluate the
thyroid structure in relation to the surrounding
musculature; otherwise the evaluation is sub-
ject to substantial errors. The normal thyroid
tissues are more echogenic than the surround-
ing muscles (Fig. 14.4). Several factors deter-
mine the echogenicity of the thyroid: the dom-
inant follicle type (see Table 14.2), vascularity,
inflammation, and any regressive changes that
have occurred.
Enlarged Thyroid Gland______________________________
► Enlarged Thyroid Gland
► Small Thyroid Gland
► Hypoechoic Structure
► Hyperechoic Structure
▼ Diffuse Changes
► Circumscribed Changes
► Differential Diagnosis of Hyper-
thyroidism
► Diffuse Parenchymatous Goiter
► Diffuse Nodular Goiter
► Hypertrophic Hashimoto Thyroiditis
► Immunogenic Basedow Hyperthyroidism
► Subacute de Quervain Thyroiditis
► Invasive Sclerosing Thyroiditis (Riedel Goiter)
► Goiter in Acromegaly
► Amyloidosis
► Diffuse Parenchymatous Goiter______________________
When a goiter is diagnosed clinically, adoles-
cents and adults under age 40 are most likely to
have a diffuse goiter, whereas older patients
will generally have a nodular goiter or less
commonly a cystic or neoplastic disease.
The underlying cause of both diffuse and
nodular goiters in the United States, Germany,
and several other European countries is a die-
tary iodine deficiency. Under the influence of
various growth factors, the thyroid mounts a
TSH-independent adaptive response consisting
of hyperplasia with an increase in follicles, par-
ticularly microfollicles.
Sonographic features. The sonographic corre-
late of a diffuse goiter is an enlarged thyroid
that retains a normal echo structure. Generally
the structure is homogeneous, but circum-
scribed lesions such as adenomas, cysts, or cal-
cifications may also be seen (Fig. 14.9).
14 Thyroid Gland 420
► Diffuse Colloid Goiter
Once hyperplasia of the thyroid has established
a hormonal equilibrium, additional colloid
storage occurs, causing an irregular increase
in the size of the follicles. These macrofollicles
and their colloid contents alter the structure of
the gland, increasing its echogenicity
(Fig. 14.10). Sonographically, then, the diffuse
colloid goiter appears as an enlarged thyroid
gland with a homogeneous hypei echoic struc-
ture. This ultrasound finding, with a normal
TSH level, justifies the initiation of treatment
without further diagnostic tests.
Fig. 14.9 Scans of a grade-II goiter show greatly en-
larged thyroid lobes (cursors) with a normal echo
structure relative to muscle tissue (M).
a Transverse scan on the right side.
< b Longitudinal scan on the right side.
▲ Fig. 14.10 Diffuse colloid goiter: enlarged, hyper-
echoic thyroid (SieScape panoramic image).
Treatment of Diffuse Goiter
Iodine therapy 1 \ 400 (to 500) pg/day for
one year, then the following maintenance
regimen:
Adults and adolescents
School-age children
Small children
Pregnant or lactating
women
200 pg/day
140-180 pg/day
100-120 pg/day
230-260 pg/day
► Hypertrophic Hashimoto Thyroiditis_________________________________________________________
Hashimoto thyroiditis is a type of autoimmune
thyroid disease and the leading cause of ac-
quired thyroid hypofunction. A rare hypertro-
phic form of this disease is distinguished from
an atrophic form. The Thyroid Section of the
German Society for Endocrinology recognizes a
chronic lymphocytic form with and without
goiter, also referring to this entity as autoim-
mune thyroiditis, Hashimoto thyroiditis, atro-
phic autoimmune thyroiditis, and primary
myxedema. Anglo-American authors draw a
distinction between autoimmune thyroiditis
and Hashimoto thyroiditis.
Sonographic features. In both the rare hyper-
trophic form and the atrophic form of auto-
immune Hashimoto thyroiditis, ultrasound
demonstrates a homogeneous, very echopenic
organ that appears isoechoic to the surround-
ing muscles and has a bulky, often asymmet-
rical shape. Color duplex examination reveals
an intense, speckled hypervascular pattern that
is chiefly responsible for the hypoechoic struc-
ture (Fig. 14.11; Figs. 14.19 and 14.20).
Morphology, Clinical Aspects, and Immunology of Chronic Lymphocytic Hashimoto
Thyroiditis 10t 15
Hashimoto thyroiditis is one of a number of
autoimmune thyroid diseases. Histologically,
the thyroid gland shows diffuse lymphocytic
and plasma cell infiltration. Consistent with
the immune pathogenesis, antibodies
against microsomes are found—specifically
against thyroid peroxidase (anti-TPO), al-
ways present in high titers. Thyroglobulin
antibodies and low titers of TSH receptor-
blocking antibodies are also present.
Hyperplastic form. The hyperplastic form of
the disease is associated with thyroid en-
largement (usually an asymmetrical goiter)
and the atrophic form with a decrease in
organ size. High anti-TPO titers are always
combined histologically with lymphocytic in-
filtrates, eliminating the need for fine-needle
aspiration.
Low titers of anti-TSH receptor antibodies
are responsible for a transient hyperthyroid
phase. They also stimulate thyroid growth
and cause thyroid enlargement, which
presents clinically as an asymmetrical goiter.
Atrophic form. The atrophic form is respon-
sible for nearly 80% of all hypothyroidism in
adults. Besides lymphocytic and plasma cell
infiltrates, scarring of the thyroid paren-
chyma is present. Hypothyroid symptoms
are mild and progress slowly. Women are
affected much more frequently than men.
Myxedema. Myxedema is a rare condition
that represents the end stage of Hashimoto
thyroiditis. Even with intensive therapy, the
prognosis is poor owing to cardiovascular
complications; the mortality rate is 70%.
< Fig. 14.11 a and b Hashimoto goiter, hypertrophic
form. TSH elevated. anti-TPO positive. The goiter is
hypoechoic to the muscle tissue, and the thyroid
gland (TH) is enlarged in both its longitudinal and
AP dimensions. M = muscle.
► immunogenic Basedow Hyperthyroidism------------------------------------------------------
This condition is also commonly known as
Basedow disease and Graves disease. The
term “immunogenic Basedow hyperthyroid-
ism” expresses both the autoimmune etiology
of the disease and the hyperthyroid state. The
hyperthyroidism is frequently associated with
extrathyroid manifestations such as endocrine
ophthalmopathy and pretibial myxedema.
Younger women are predominantly affected.
Basedow disease is the most frequent cause of
hyperthyroidism in adolescents. Diagnosis is
generally based on the clinical presentation
and laboratory findings (autoantibody detec-
tion).
Sonographic features. Ultrasound shows a
marked volume increase (up to 90 ml) and
symmetrical enlargement of the thyroid. The
enlargement includes the isthmus, and this is
considered a significant criterion for the dis-
ease. The thyroid acquires a rounded, balloon-
hke appearance (Fig. 14.12). The volume dwin-
dles during remissions and increases during
recurrences. Because of the rich blood supply,
the thyroid shows a diffuse decrease in echo-
genicity with densely packed hypoechoic
areas, resulting in an echo-poor internal struc-
ture14.
Color Doppler examination. Given the hyper-
vascularity that underlies the characteristic
echo structure, color Doppler reveals intense
color-flow signals throughout the organ, creat-
ing a pattern described as a “thyroid inferno”14
or “vascular inferno" (Figs. 14.13 and 14.14).
Diagnosis of Basedow Hyperthyroidism
Clinical features. The typical clinical symp-
toms present as the classic Merseburg triad
of goiter, exophthalmos, and tachycardia,
first described by Karl von Basedow in 1840.
Laboratory findings. The hyperthyroidism
is confirmed by in-vitro suppression tests
showing low TSH and elevated free T4 and
T3. Since isolated T3 hyperthyroidism can oc-
cur, a T4 determination is insufficient in itself.
TRAbs. Autoantibodies against the TSH re-
ceptor (TRAbs) exert a TSH-like effect that
directly stimulates the thyrocytes and pro-
duces a diffuse hyperplasia and hypertrophy
The internal hypervascularity does not cor-
relate with functional status, however1; it is
due chiefly to inflammation. But the density
of the color pixels does correlate strongly
with the need for thyrostatic treatment. An-
other indication for color duplex examination
is follow-up, because thyroid blood flow is sig-
nificantly higher in patients with a recurrence,
and therefore vascularity becomes an impor-
tant prognostic indicator. The peak flow veloc-
ity is also markedly increased to 127 cm/s16)
(Fig. 14.15). This is best demonstrated by Dop-
pler sampling of the inferior thyroid artery.
Differentiation from autoimmune thyroiditis.
Autoimmune thyroiditis has a similar hypo-
echoic structure, but Basedow goiter is distin-
guished by a coarser hypoechoic pattern, a
of the thyroid follicular epithelium. TRAbs are
positive in 90% of patients with Basedow
disease. They are still positive in 46% of cases
following radioiodine therapy and in 2% fol-
lowing strumectomy10.
Anti-TPO. Besides TRAbs, low titers of an-
tithyroid peroxidase antibodies (anti-TPO,
formerly microsomal antibodies) are found
in 76% of cases.
The diagnosis is definite when signs of endo-
crine ophthalmopathy are seen. Other than
thyroid ultrasound, there is no need for fur-
ther testing.
Diffuse Changes 421
more rounded shape due to concomitant isth-
mic enlargement, and more intense vascularity
with a high arterial flow velocity. Autoimmune
thyroiditis also shows marked hypoechoicity,
but the vascularity on color duplex examina-
tion is less pronounced and has a finer texture.
Autonomous nodules. Autonomous nodules
in a hyperthyroid Basedow goiter, or Base-
dow disease developing on the basis of a
nodular goiter (Marine-Lenhart syndrome11
(3 14.4p-r), may occur. Autonomous nodules
and adenomas do not participate in the auto-
immune changes in the Basedow thyroid; this
confirms their autonomous growth and identi-
fies them as true neoplasms in Basedow goi-
ters. At the same time, areas of legressive fi-
brosis may appear as focal lesions.
Fig. 14.12 Immunogenic Basedow goiter: balloonlike
enlargement of the thyroid gland (TH) with a patchy
echopenic structure that is isoechoic to the muscle
(M). The markedly enlarged isthmus, which crosses
over the trachea (TR), is a characteristic feature of
Basedow goiter.
a Transverse scan through the right thyroid lobe.
* b Transverse scan through the left thyroid lobe.
« Fig. 14.13 Color Doppler view of a Basedow goiter,
showing intense hypervascularity (“vascular inferno"
pattern). In our experience, the low PRF setting (cor-
responding to a color Doppler velocity of 0.06 m/s) is
optimal for thyroid examinations (it should be low-
ered to 0.025 m/s only with scant vascularity to
detect very slow flows). The Doppler window should
encompass the entire thyroid lobe
a Transverse scan on the midline. TR = trachea.
* b Longitudinal scan of the right thyroid lobe (TH). M
= muscle.
14 Thyroid Gland 422
Diagnosis. The balloonlike shape, grainy hypo-
echoic texture, and intense vascularity are such
typical sonographic features that, when hyper-
thyroidism is detected, ultrasound can estab-
lish the diagnosis of Basedow goiter even with-
out serology.
Ultrasound yields a correct diagnosis in 74%
of patients with Basedow disease, radionuclide
scanning in 96%. Given this high sensitivity of
ultrasound and the reliability of serological
testing, radionuclide scanning is indicated in
Basedow disease only in cases where ultra-
sound has additionally detected focal changes.
a Fig. 14.14 Basedow disease: patchy hypoechoic thy-
roid gland (TH), isoechoic to the muscle (M) (B-mode
image corresponding to Fig. 14.13b).
a Fig. 14.15 Color Doppler with spectral analysis in
Basedow disease. The peak systolic flow velocity in
the inferior thyroid artery (ATI) is greatly increased,
measuring 1.55 m/s.
► Subacute de Quervain Thyroiditis_________________________________________________________________________
De Quervain thyroiditis is an acute or subacute
viral thyroiditis. Histologically15, this form of
thyroiditis is distinguished by giant-cell-like
granulomas and by scarring in the healing
stage. This can also be demonstrated by ultra-
sound-guided fine-needle aspiration cytology.
Sonographic features. Sonographically, the
thyroid enlargement is based mainly on an in-
crease in AP diameter. The isthmus does not
appear as prominent as in Basedow disease.
With regard to echo texture, this type of goiter
is distinguished by its intensely hypoechoic
structure with a coarse patchy, focal, or diffuse
texture (Figs. 14.16 and 14.17)8.
Color Doppler sonography. In color Doppler,
de Quervain thyroiditis shows little or no vas-
cularity, which positively distinguishes it from
the Basedow thyroid. Unilateral focal lesions
may occur (Fig. 14.17b; Figs. 14.38 and 14.39).
Symptoms of de Quervain Thyroiditis
Patients manifest the clinical signs of a viral
infection (adenovirus, myxovirus. para-
myxovirus) with general malaise, fever, an
enlarged thyroid with local tenderness, and
laboratory tests positive for inflammation.
Patients often describe pain radiation to
the neck region. Brief cortisone therapy
can bring dramatic improvement, but
most cases resolve spontaneously over a
period of weeks or months.
Hyperthyroidism (up to 50 %) is often the
dominant initial finding.
a Fig. 14.16 De Quervain thyroiditis: patchy hypo-
echoic thyroid lobes (TH) with no isthmic enlarge-
ment. T = trachea; AC = common carotid artery.
« Fig. 14.17 De Quervain thyroiditis, color duplex. M =
muscle. TH = thyroid lobe.
a Patchy low echogenicity with flow voids.
b Four weeks later: regression of swelling, clear de-
lineation of the hypoechoic area, marked increase in
vascularity in the rest of the thyroid gland.
► Invasive Sclerosing Thyroiditis (Riedel Goiter)_________________________________________________________
The cause of this "stony hard” thyroid enlarge-
ment is poorly understood, but it shows sim-
ilarities to other fibrosclerosis such as the ret-
roperitoneal fibrosis in Ormond disease. In this
type of goiter, inflammation spreads from an
extrathyroid source to involve the thyroid
gland and other tissues in the neck. It belongs
in the broader category of immune thyroiditis
because it is associated with lymphocytic infil-
trates and leads to scarring and the formation
of hyaline connective tissue.
Sonographic features. The diffuse, intense hy-
poechoicity reflects both the presence of hypo-
echoic connective tissue and the inflamed con-
dition of the thyroid, which shows a balloonlike
enlargement similar to that in Basedow disease
(Fig. 14.18).
a Fig. 14.18 Riedel goiter. The thyroid exhibits balloon-
like swelling with an intensely hypoechoic structure
► Goiter in Acromegaly
A goiter is almost always present in acrome-
galy. It may be a diffuse goiter (93%) or a nod-
ular goiter (73%), depending on the duration of
the acromegaly8.
► Amyloidosis---------------------------------------------------------------------------------------------------------------
Amyloid deposition in the thyroid, whether
isolated or in a setting of generalized amyloi-
dosis, is extremely rare and leads to a relatively
coarse, diffuse increase in echogenicity.
Diffuse Changes 423
Small Thyroid Gland_______________________________________________________
— ► Acquired Autoimmune Thyroiditis (AIT): Atrophic Lymphocytic
Thyroiditis (primary Myxedema)
► Acquired Autoimmune Thyroiditis (AIT) in Polyglandular Autoimmune
Syndrome (PAS)
► Lithium- or Amiodarone-Induced Thyroiditis
► Neonatal Hypothyroidism
► Postoperative Thyroid/Unilateral Aplasia
► Radioiodine-Treated Thyroid
► Radiation-Induced Hypothyroidism
Concept of Acquired Autoimmune Thyroiditis
Acquired autoimmune thyroiditis (AIT) is a
collective term for various conditions that
are probably synonymous with chronic lym-
phocytic Hashimoto thyroiditis:
► Chronic Hashimoto-type autoimmune
thyroiditis (see above). This presents as a
hypothyroidism with no other associated
diseases and is characterized by the detec-
tion of anti-TPO and antithyroglobulin
antibodies and a typical diffusely hypoe-
choic sonographic pattern. Small, hypere-
choic foci of scarring appear in the late
stage.
► Polyglandular autoimmune syndrome
(PAS). This is an autoimmune hypothyr-
oidism that is associated with type I diabe-
tes and most commonly occurs in children
and adolescents but is also seen in older
patients with LADA diabetes (type II and 111
polyglandular autoimmune syndrome, PAS
or PGA). Other, coexisting hormonal defi-
ciencies occur in the following percentages
of cases 10:
-Hypoparathyroidism 80-90%
- Adrenal insufficiency (Addison disease)
60-70%
- Hypogonadism 40-50%
-IDDM 10-20%
- Autoimmune gastritis
Conversely, 70-80% of patients who have had
type I diabetes for an average of 18 years also
have hypothyroidism.
In the type II form of PGA. autoimmune thy-
roiditis and type I diabetes are accompanied
by hypogonadism, myasthenia, vitiligo, and
alopecia.
In type III PGA, type I diabetes is accompanied
by an autoimmune thyroiditis or by adrenal
insufficiency with Hashimoto autoimmune
thyroiditis.
► Chronic thyroiditis (juvenile) with transi-
ent hyperthyroidism.
► Postpartum thyroiditis (see below).
► Other forms of autoimmune thyroiditis
such as lithium- or amiodarone-induced
thyroiditis are probably separate entities
that do not fall under the heading of Ha-
shimoto thyroiditis.
► Acquired Autoimmune Thyroiditis (AIT): Atrophic Lymphocytic Thyroiditis (juvenile)
Atrophic thyroiditis is responsible for most
cases of silent hypothyroidism in adults, fol-
lowed by hypothyroidism after a thyroid resec-
tion. The atrophic form is far more common
than the classic Hashimoto thyroiditis associ-
ated with a goiter (see above).
Sonographic features. Ultrasound shows a
markedly small thyroid, often asymmetrical,
with a homogeneous grainy or patchy hypo-
echoic texture containing fine, hyperechoic
areas of scarring. The scars may produce con-
tour irregularities (Figs. 14.19a and 14.20a).
Color duplex examination shows a fine or
coarse pattern of vascular signals that may still
be very pronounced or already diminished ow-
ing to scarring (Figs. 14.19b and 14.20b).
Scans at the end stage of myxedema may
still show residual areas of thyroid tissue,
whose volume is less than that of a normal
thyroid lobe (Fig. 14.21).
74 Thyroid Cland 424
« Fig. 14.19 Chronic atrophic autoimmune Hashimoto
thyroiditis. M = sternocleidomastoid muscle; I = isth-
mus with a section of muscle; TR « trachea.
о В-mode image shows a hypoechoic background
texture with small, hyperechoic inclusions, probably
due to focal scarring
◄ b Color Doppler with a low PRF setting (correspond-
ing to a Doppler velocity of 0.06 m/s) shows greatly
decreased vascularity.
a Fig. 14.20 Atrophy in autoimmune Hashimoto thy-
roiditis with severe hypothyroidism. M = muscle; VJ
= jugular vein.
a Atrophic thyroid gland (TH) with a patchy hypo-
echoic texture.
a b Color duplex. The initial hypervascularity is still
appreciated in the thyroid remnants.
a Fig. 14.21 Myxedema due to complete thyroid atro-
phy (TH) with microcalcifications and acoustic shad-
owing (S) TR • trachea.
► Acquired Autoimmune Thyroiditis (AIT) in Polyglandular Autoimmune Disease (PAS)
Diabetes-associated autoimmune thyroiditis is
common in long-standing cases of diabetes. For
this reason, a TSH test and/or thyroid ultra-
sound scan should be performed in any patient
who has more than a 10-year history of type I
diabetes.
The echo texture and vascularity are like
those seen in other types of autoimmune thy-
roiditis, as are the clinical manifestations and
patterns of elevated anti-TPO antibodies and
borderline anti-TSH receptor antibodies,
although the TPO titers often do not reach the
same level as in Hashimoto thyroiditis. The
thyroid gland becomes small in the advanced
stage, presenting a hypoechoic structure
(B 14.1 a-c).
Largely identical patterns are also seen in
nondiabetes-associated forms of autoimmune
hypothyroidism (B 14.1 d-g).
► Lithium- or Amiodarone-Induced Thyroiditis__________________________________________
Both drugs can cause or ignite a chronic thyroi-
ditis. Hyperthyroidism develops, and a hypo-
thyroid atrophy of the thyroid gland can de-
velop with long-term use (Fig.14.22).
a Fig. 14.22 Thyroid atrophy following 10 years of lith-
ium therapy. Small, hypoechoic thyroid remnants.
о Lithium-induced hyperthyroidism: slightly en-
larged thyroid gland with a normal echo texture and
scant vascularity by color duplex.
a b Transverse scan through the neck.
Е 74.7 Acquired Autoimmune Thyroiditis (AIT) in Polyglandular Autoimmune Disease (PAS)
► Autoimmune thyroiditis in
type 1 diabetes mellitus
a Small thyroid lobes (TH), uniformly
hypoechoic to the muscle (M). I = isth-
mus, TR = trachea.
b Color Doppler view of the left lobe in
a (TH) with a very low PRF (corre-
sponding to a Vmax of 0.023 m/s) shows
scant vascularity.
c Severely atrophic thyroid gland (TH)
in long-standing diabetes mellitus. Only
a greatly enlarged view can identify
remnants between the common carotid
artery (AC) and trachea (TR).
Diffuse Changes 425
► Autoimmune thyroiditis, auto-
immune gastritis, operated
renal cell carcinoma
d Very high anti-TPO titers and low
titers of anti-TSH receptor antibodies in
a 50-year-old woman with hypothy-
roidism. Longitudinal scan on the left
side. TH = thyroid gland; M = muscle.
e and f Color Doppler scans of the left thyroid lobe. Longitudinal scan shows
intense, irregular color-flow signals with spared areas, which are also spared from
hypoechoicity in the В-mode image (d) (may be autonomous adenomas not
involved by the autoimmune thyroidi-
tis).
► Neonatal Hypothyroidism_____________
This condition is often based on ectopic thyroid
tissue (lingual thyroid, aplasia), as indicated by
the absence of detectable thyroglobulin.
In a study of 38 newborns with congenital
primary hypothyroidism, Meller et aL12 found 7
cases of athyrosis, 9 lingual goiters, and 15
infants with an iodine organification defect (4
with Pendred syndrome). Ectopic thyroid tis-
sue could be detected only by radionuclide
scanning. In four of the patients, the correct
diagnosis could be made only by scintigraphy
using the perchlorate depletion test.
Ultrasound yielded a false-negative diagno-
sis in two patients with hypoplasia and a false-
positive diagnosis in two other patients with
athyrosis. Thus, while ultrasound has limited
value in terms of diagnostic accuracy, thyroid
sonography is still an essential routine study
for detecting an orthotopic or ectopic thyroid
gland. Radionuclide scanning is still superior
for locating an ectopic thyroid, however.
Immunogenic neonatal hypothyroidism
often results from the transmission of maternal
blocking antibodies to the fetus.
► Postoperative Thyroid/Unilateral Aplasia__________________________________________________________
During surgical resection of the thyroid gland,
the poles are exposed and the posterior por-
tions of the gland are dissected free in the area
of the recurrent nerve. The isthmus is resected
first, followed by the other parts of the gland,
leaving a remnant of thyroid tissue measuring
approximately 2-4 cm * 2 cm * 2 cm. Nodular
areas are resected completely. Thus, a subtotal
strumectomy leaves behind a greatly dimin-
ished residual gland that can be identified
and measured sonographically (Fig. 14.23).
When a total strumectomy is performed for
thyroid carcinoma, all portions of the gland are
resected after the recurrent nerve has been
dissected free. Ultrasound does not demon-
strate a thyroid remnant in these cases.
In both operations, the parathyroid glands
posterior to the upper and lower poles of the
thyroid are left intact.
Unilateral aplasia is occasionally detected
incidentally in adults (previous surgery should
be excluded).
14 Thyroid Gland 426
a Fig. 14.23 Small residual thyroid (TH, cursors) follow-
ing a subtotal strumectomy. The remnant displays a
normal echo structure.
a Postoperative thyroid gland: small amount of re-
sidual thyroid tissue on the right side (cursors).
a b and c Unilateral aplasia of the thyroid gland. Normal thyroid function, no history of surgery. AC = common
carotid artery: I = isthmus; M = muscle.
► Radioiodine-Treated Thyroid__________________________________________________________________
Following radioiodine treatment with iodine-
127, the thyroid volume may continue to de-
crease even 1-2 years after the therapy. Vol-
ume reductions of 20-40% are typically
achieved, with some cases showing up to a
70% reduction. Hypothyroidism can develop
in 15% of cases1 (Fig. 14.24).
a b Longitudinal scan.
л Fig. 14.24 Left thyroid lobe (cursors) following radio-
iodine therapy. The organ is markedly reduced in size
and shows slightly irregular contours. AC = common
carotid artery; M = muscle; TR = trachea.
a Transverse scan.
► Radiation-Induced Hypothyroidism___________________________________________________________
In these cases the cause of the hypothyroidism
is determined from the history. Ultrasound
generally shows a small thyroid gland with
normal or slightly increased echogenicity. The
contours may be irregular owing to scarring
(Fig. 14.25).
a Fig. 14.25 Radiation*induced hypothyroidism. The
patient underwent surgery for palatal carcinoma
with radiation to the neck nodes. Hypothyroidism
developed years later.
a Transverse scan on the left side shows a small
thyroid lobe (TH) and irregular, indistinct vessels
that are distorted due to scarring. ACC = common
carotid artery.
a b Longitudinal scan on the left side. The inferior
thyroid artery has a blurry, rarefied appearance.
< с and d Scant color-flow signals at a low PRF setting
(same signal pattern seen at 0.05 m/s), indicating a
slight decrease in vascularity. AC = common carotid
artery; M = muscle.
Hypoechoic Structure_________________________________________________
Diffuse Changes 427
► Chronic Thyroiditis with Transient Hyperthyroidism,
Postpartum Thyroiditis
► Silent (Sporadic) Thyroiditis
► Lithium- or Amiodarone-Induced Thyroiditis
The diffuse hypoechoic thyroid changes de-
scribed below are generally associated with a
normal-sized thyroid gland.
► Chronic Thyroiditis with Transient Hyperthyroidism, Postpartum Thyroiditis
Both chronic thyroiditis with transient hyper-
thyroidism (juvenile) and postpartum thyroi-
ditis are associated with a brief period of hy-
perthyroidism, which should not be treated
with thyrostatic agents.
Postpartum thyroiditis generally develops
during a brief interval after pregnancy, show-
ing an average incidence of 5 %8. It is associated
with transient but persistent hyperthyroidism
or hypothyroidism. Postpartum thyroiditis is
negative for anti-TSH receptor antibodies but
positive for anti-TPO antibodies. In most cases
it resolves within one year.
Ultrasound in both diseases shows diffuse or
patchy hypoechoicity of the thyroid gland.
Color duplex examination reveals increased
vascularity as the cause of the low echogenic-
ity (Fig. 14.26).
a Fig. 14.26 Chronic thyroiditis with transient hyper-
thyroidism. Patient presented clinically with mild hy-
perthyroidism and no goiter. Anti-TPO and TRAbs
negative, antithyroglobulin antibodies strongly pos-
itive.
Thyroid (TH) with a patchy hypoechoic structure.
a b Color Doppler: pronounced vascularity.
► Silent (Sporadic) Thyroiditis____________________________________________________________________________
This condition runs a subacute or chronic
course lasting from weeks to several months
(years) with a self-limitated course. It is usually
associated with hyperthyroidism, rarely with
hypothyroidism, but presents no other symp-
toms. Anti-TPO and antithyroglobulin anti-
bodies are elevated. Silent thyroiditis is also
interpreted as a painless variant of de Quervain
thyroiditis, indistinguishable from postpartum
thyreoiditis. it is distinguished by low radio-
tracer uptake in the thyroid.
The ultrasound findings are nonspecific,
showing hypoechoic transformation of the
gland (Fig. 14.27),
14 Thyroid Gland 428
a Fig. 14.27 Silent thyroiditis. Patient had mild hyper-
thyroidism, clinically asymptomatic and unchanged
for years. TPO moderately elevated; TRAbs slightly
elevated initially, now negative. Thyroid (TH) is
slightly enlarged with a homogeneous, moderately
hypoechoic structure.
a Transverse scan on the left side.
a b Longitudinal scan on the left side.
a c Color Doppler shows scant color-flow signals, con-
trasting with the hypervascularity in a Basedow goiter
or autoimmune hyperthyroidism (Fig, 14.13b, E
14.1 e and f» S 14.4q).
► Lithium- or Amiodarone-Induced Thyroiditis_________________________________________
Lithium. Psychiatric patients who take lithium
frequently develop a thyroid disorder. This may
take the form of a goiter, hypothyroidism, or
both. It is assumed that lithium incites a thy-
roid autoimmune response. While slight en-
largement is relatively common, the develop-
ment of a frank autoimmune thyroiditis occurs
in about 10% of cases, but this percentage rises
significantly in cases with preexisting thyroid
disease. Anti-TPO and antithyroglobulin anti-
bodies are elevated.
Sonographically, the thyroid shows diffuse
hypoechoicity that increases if low echogenic-
ity was already present9 (Figs. 14.22,14.28).
Amiodarone. Treatment with amiodarone is
also commonly followed by hyperthyroidism
or hypothyroidism. This is based on the high
iodine content of amiodarone and its structural
similarity to the T3 and T4 hormones. Amiodar-
one has both agonistic and antagonistic effects
on thyroid function. The fT4 (free T4) level rises
by approximately 40%, while the serum fTj
level falls by about 50%, accompanied by a
slight increase in the basal TSH.
The ultrasound findings are nonspecific and
depend partly on a preexisting thyroid disor-
der. In Basedow disease with latent autonomy,
patients frequently develop overt hyperthyro-
idism. Patients with Hashimoto thyroiditis tend
to develop frank hypothyroidism or an exacer-
bation of existing hypothyroidism. If the thy-
roid is normal prior to amiodarone therapy, the
drug may trigger an autoimmune thyroiditis,
which is also associated with a hypoechoic thy-
roid (Fig. 14.29).
The changes are reversible after the drugs
are discontinued.
a Fig. 14.28 Lithium-induced hypothyroidism. Besides
minimal hypoechoicity, even color Doppler shows a
normal-appearing thyroid gland (TH). TR = trachea;
M= muscle.
a Fig. 14.29 a and b Amiodarone-induced hypothyroidism: small, uniformly hypoechoic thyroid (TH). TR = trachea;
AC = common carotid artery.
Hyperechoic Structure
▼ Diffuse Changes
► Enlarged Thyroid Gland
J► Small Thyroid Gland
Ji► Hypoechoic Structure
Hyperechoic Structure
► Circumscribed Changes
► Differential Diagnosis of Hyper-
thyroidism
— ► Radiation-Induced Hypothyroidism
► Radiation- Induced Hypothyroidism________________________________________________________________________________
The thyroid gland is located within the radio-
therapy portal when radiation is applied to the
neck region, and it responds with hypothyroid-
ism following a long latent period. The thyroid
becomes smaller and undergoes a fibrous atro-
phy.
Accordingly, ultrasound demonstrates a
small thyroid (see above) that shows a diffuse
or mottled increase in echogenicity (Fig. 14.25).
Circumscribed Changes 429
Circumscribed Changes
► Vessels
► Abscess
Anechoic______________________________________________________________
Cystic masses, along with thyroid nodules, are
the most common focal changes that are found
in the thyroid. Thyroid cysts are not true cysts
and therefore do not contain cystic epithelium.
Solitary cysts in an otherwise normal thyroid
generally result from central hemorrhage in
adenomas.
Cyst contents. Depending on their contents,
cysts may appear sonographically as anechoic
masses or may show a hypoechoic, hypere-
choic, or irregular internal echo pattern
(л] 14.2). Further diagnostic tests consist of
color duplex sonography and fine-needle aspi-
ration cytology. In many cases the cyst contents
are unknown until fine-needle aspiration is
performed. Cysts may contain various fluids:
► Fresh hemorrhage (И 14.2 d and e)
► Older hemorrhage (chocolate cysts.
Fig. 14.49)
► Colloid (colloid cysts, - 14.2f)
► Lymph (lymph cysts)
Fresh hemorrhages and colloid cysts generally
have a distinctive internal echo pattern and do
not appear anechoic but hypoechoic or hyper-
echoic (S 14.2d and e). With color duplex,
cystic tumors show a vascularity that is never
seen in cysts or hemorrhages. Other cysts ex-
trinsic to the thyroid, such as neck cysts, should
also be included in the differential diagnosis.
Solitary cysts. Uncomplicated serous cysts ap-
pear sonographically as anechoic, rounded or
polygonal, sometimes lobulated, scalloped or
patchy lesions with smooth margins. Like cysts
in other organs, they display several typical
cystic features such as absence of internal ech-
oes, smooth borders, and distal acoustic en-
hancement, while a circular shape is somewhat
unusual. Edge shadows are not present owing
to the absence of a cyst wall. There is an addi-
14 Thyroid Gland 430
tional sign, however: definite compressibility
of the cysts by external transducer pressure.
Solitary cysts also occur as hemorrhagic areas
in diffuse goiters. Peripheral or circular rem-
nants of the old adenomatous structure are also
seen in most cases (B 14.2a-c). Color Doppler
examination shows a complete absence of vas-
cularity in the cysts (B 14.2 e and i).
Multiple cysts. Multiple cysts are characteristic
of regressive changes in the adenomatous nod-
ules of older nodular goiters. They differ from
В 14.2 Thyroid Cysts
hemorrhages in true adenomas by their multi-
plicity and their occurrence in the background
structure of the nodular goiter.
Sonographically, they appear in various sizes
ranging from microcysts to macrocysts. The
latter often present clinically as circumscribed
palpable nodules. Fresh bleeding in the cysts
leads to the abrupt appearance or enlargement
of a goiter.
Hemorrhagic cysts. Fresh bleeding in cysts
produces a heterogeneous internal echo pat-
tern that includes high-level echoes (B 14.2d
and e).
Lymph cysts. It is not uncommon for small
cystic lesions to represent lymph cysts. They
do not differ from other cystic lesions, except
perhaps by their small size (B 14.2g).
Colloid cysts. Because they contain colloid,
these cysts display an anechoic or more or
less finely granular internal echo pattern
(B 14.2 f).
► Adenomas/noduls showing
cystic regression
a Two cysts (C) in an otherwise un-
changed left thyroid lobe (TH): an-
echoic masses with irregular margins.
One shows septumlike partitions (ar-
rows) and distal enhancement and cre-
ates a bulge in the thyroid contour.
b Cyst (C) in a nodular goiter (TH), the
latter showing some peripheral vascu-
larity.
c Anechoic cystic mass (C) with no in-
ternal blood flow in an isoechoic ad-
enoma (cursors) in the left thyroid lobe
(SD).
► Hemorrhagic, colloid cysts
f Two cystic areas (C), one with internal
echoes. Fine-needle aspiration yielded a
creamy colloidal fluid (confirmed cyto-
logically as colloid). M = musculature,
TR = trachea.
d and e Hemorrhagic cyst (arrows) with a contour bulge. The bright internal echoes
are typical of fresh intracystic hemorrhage. Differentiation is required from an
adenoma or tumor. Diagnosis is confirmed by the absence of internal vascularity (e)
and by fine-needle aspiration. The pe-
ripheral vascular rim delineates the ad-
enoma.
► Cysts in nodular goiters
g Multiple small cysts (C) in a nodular
goiter, interpreted as regressive
changes. The more echogenic and more
coarsely structured nodules (collage-
nous connective tissue) are also re-
gressive changes. Differential diagnosis:
lymph cysts.
h and i Irregular, regressive cystic mass with indistinct margins and mottled echo
structure (C) in a goiter (TH). Fine peripheral vessels rim the nodular area (N).
► Vessels
Cysts require differentiation from anechoic le-
sions that can be identified as vessels only by
color Doppler examination with spectral anal-
ysis (Figs. 14.30 and 14.31; Figs. 14.6 and 14.7),
a b Color Doppler identifies the areas as vessels
a Fig. 14.30 Vessels in the thyroid. AC = common car-
otid artery; TR = trachea.
о Cystic areas (arrows) in gray-scale image.
Circumscribed Changes 431
a Fig. 14.31 Large, predominantly anechoic cystic mass
(cursors) in the left thyroid lobe (TH). The common
carotid artery (AC) is posterior. TR = trachea.
a Gray-scale image: the mass may be a large ad-
enoma or a large cyst.
a b Color Doppler and spectral analysis identify the
mass as a venous vessel (dilated internal jugular vein).
► Abscess
Abscesses almost always appear very hypo-
echoic and occasionally anechoic. The diagno-
sis is made clinically and/or by percutaneous
aspiration (see Fig. 14.37).
Hypoechoic
► Anechoic
► Hypoechoic
► Isoechoic
► Hyperechoic
► Irregular
► Diffuse Changes
▼ Circumscribed Changes
► Differential Diagnosis of Hyper-
thyroidism
► Microfollicular (Papillary) Adenoma
► Oncocytic Adenoma
► Lipoma
► Parathyroid Adenoma
► Abscess
► Focal de Quervain Thyroiditis
► Malignant Lymphoma
► Carcinoma
► Tumor Infiltration or Metastasis
► Microfollicular (Papillary) Adenoma
14 Thyroid Gland 432
Pathogenesis and Morphology of Thyroid Adenomas and Adenomatous Nodules
Prevalence. Thyroid nodules are found in
35-50% of people living in iodine-deficient
areas. It is estimated that autonomous nod-
ules are present in 2-6% of the general pop-
ulation3 and in 10-20% of patients with a
preexisting goiter.
Pathogenesis. The normal thyroid gland al-
ready contains a number of thyrocytes with
an autonomous growth tendency that may
give rise to adenomas, regardless of the io-
dine supply. A similar mechanism underlies
the development of the predominantly
autonomous nodules in a nodular goiter.
Morphology. True adenomas are benign
neoplasms. Aside from very rare leiomyomas,
they account for virtually all benign neo-
plasms in the thyroid. Follicular adenomas
are the most common type of adenoma.
Other variants are papillary adenoma and on-
cocytoma. Adenomas, unlike the adenoma-
tous nodules in a nodular goiter, do not take
part in autoimmune changes. Functionally,
microfollicular adenomas consist mainly of
autonomously functioning adenomas that
appear as hot nodules at scintigraphy,
whereas macrofollicular adenomas usually
appear as cold nodules.
Sonographic features. Adenomas may ap-
pear as hypoechoic, isoechoic, or hyperechoic
masses at ultrasound. The relationships be-
tween follicular histology and echogenicity
shown in Table 14.2 apply with fair accuracy
to the echo structure of adenomas as well as to
adenomatous nodules and regressive changes
(0 14.3a-c).
Echogenicity, Hypoechoic nodules generally
represent microfollicular adenomas (rarely
papillary adenomas), whereas hyperechoic
nodules are usually macrofollicular adenomas.
Normofollicular adenomas generally appear
isoechoic and are demarcated from the normal
thyroid by a hypoechoic rim of displaced ves-
sels, which can be identified with color Dop-
pler. This vascular rim is also a feature of most
other adenomas and adenomatous nodules
(B 14.3e, f, and i ). Isoechoic and hypoechoic
adenomas are the most common types of ad-
enoma, while hyperechoic adenomas aie the
least common.
Hypoechoic adenomas. The great majority of
hypoechoic adenomas are autonomous adeno-
mas, two-thirds of which are associated with
latent hyperthyroidism (suppressed basal TSH
with normal fr3/fT4 levels) and only one-third
with overt hyperthyroidism . The most com-
mon microfollicular adenomas are conspicuous
by their hypoechoic structure and round shape.
The anechoic rim described above is also a
general characteristic of adenomas, although
it is not seen with every adenoma.
Another characteristic of hypoechoic adeno-
mas is their internal vascularity, which signifies
autonomy in a high percentage of cases (73%)5.
The absence of internal vascularity rules out
autonomy with a negative predictive value of
94%2. Meanwhile, peripheral and internal vas-
cularity is also found in a high percentage of
malignancies, raising problems of differentia-
tion based on ultrasound appearance.
Thyroid adenomas are also subject to regres-
sive changes with intralesional hemorrhage
and calcification, resulting in anechoic or hy-
perechoic internal structures (E 14.3f). A hy-
poechoic structure is insufficient in itself for
evaluating functional autonomy (E 14.3h and
I).
The above points can be summarized as fol-
lows:
► The color Doppler examination of thyroid
nodules is a useful screening method for
autonomous adenomas3, especially in pa-
tients with known hyperthyroidism.
Diagnostic Evaluation of Solitary or Multiple Separate Hypoechoic Thyroid Nodules
► Sonography with color duplex scanning
► Basal TSH, also fT3, fT4 if necessary
► Scintigraphy of nodules >10 mm
► Fine-needle aspiration of hypoechoic
nodules that have an irregular rim and are
larger than 10 mm
Table 14.2 Histomorphology of thyroid nodules correlated with typical echogenicity at
ultrasound
Histomorphological finding Typical echogenicity
Predominance of microfollicles Hypoechoic
Predominance of normal-sized follicles Normal echo structure
Predominance of macrofollicles Hyperechoic
Collagenous connective tissue Hyperechoic
Hyaline connective tissue Hypoechoic
Table 14.3 Sonographic clues for the differentiation of adenomas and adenomatous
nodules
Adenomas Adenomatous nodules
Usually solitary or isolated Multiple
Usually in normal thyroid gland Occurrence in a nodular goiter
Well-defined hypoechoic rim Scalloped hypoechoic rim
Homogeneous internal echo pattern Heterogeneous thyroid structure
Internal hypervascularity Absent or scant internal vascularity
► True adenomas cannot be distinguished
from adenomatous nodules by their sono-
graphic features (this cannot even be done
histologically in some cases). The sono-
graphic findings can provide clues for dif-
ferentiation, however (Table 14.3).
► With normal TSH but suspected autonomy:
suppression scintigraphy
► With a sonographically hypoechoic nodule
that is cold by scintigraphy: always fine-
needle aspiration or surgery; also calcito-
nin assay (medullary C-cell carcinomal).
Н 143 Thyroid Adenomas
► Types of adenoma
► Adenomas and nodules, color
duplex
c Hyperechoic.
a Hypoechoic (microfollicular) ad-
enoma (A): intensely hypoechoic mass
with a subtle echo-free rim. Patient
presented clinically with hyperthyroid-
ism.
b Isoechoic adenoma, delineated only
by a slightly hypoechoic peripheral
vascular rim (color duplex).
Circumscribed Changes 433
d Hypoechoic mass (T). Differential di-
agnosis: adenoma, malignant tumor,
hemorrhagic cyst.
e Further examination with color Dop-
pler shows intense peripheral vascular-
ity as well as internal vessels.
f Multiple adenomas (A) of varying
echogenicity in an otherwise normal
thyroid, outlined by peripheral vascu-
larity.
g Isoechoic adenoma with hypoechoic
areas devoid of internal vascularity:
adenoma with fresh intralesional hem-
orrhage (painful swelling; treated sur-
gically).
h Hyperechoic adenoma with an old
hemorrhagic area and cystic transfor-
mation (C).
i Thyroid adenoma with regressive
changes. C = cyst, arrow = calcium with
acoustic shadow. TH e thyroid; TR -
trachea.
► Oncocytic Adenoma___________________________________________________________________________
Oncocytic adenoma is another, rare type of
adenoma. It is indistinguishable from a well-
differentiated follicular carcinoma by ultraso-
nography or fine-needle aspiration cytology.
Benign/malignant differentiation relies on the
detection or exclusion of invasive growth in
histologically examined surgical material.
Sonographically, oncocytic adenoma shows
more or less pronounced internal vascularity
but usually does not have a peripheral vascular
rim (Figs. 14.32 and 14.33).
Differentiation is required from other hypo-
echoic tumors such as lipoma, malignant lym-
phoma, carcinoma, and metastases as well as
rare abscesses or focal thyroiditis.
a Fig. 14.32 Oncocytoma in a nodular goiter, cytolog-
ical and surgical diagnosis.
a Very hypoechoic tumor with no detectable halo,
relatively well demarcated (arrows) from the rest of
the thyroid (TH).
a b Color Doppler scan at a low PRF clearly reveals
internal vascularity.
14 Thyroid Gland 434
« Fig. 14.33 Oncocytic adenoma, incidental finding,
cytological diagnosis surgically confirmed. AC =
common carotid artery.
a Homogeneous tumor (T). slightly hypoechoic to
the rest of the thyroid (TH).
* b Color Doppler at a relatively high PRF shows al-
most no vascularity.
► Lipoma
A lipoma is occasionally misinterpreted clini-
cally as a nodular goiter. While its ultrasound
features resemble those of adenoma or micro-
cystic nodular transformation, it can be distin-
guished (when considered in the differential
diagnosis) by its typical mottled or streaky hy-
poechoic appearance. The thyroid can usually
be clearly delineated from the lipoma em-
bedded in the anterior subcutaneous fat
(Fig. 14.34).
< Fig. 14.34 Patient had received replacement therapy
for a goiter for years. A nodule extends far toward
the right side. A lipoma is delineated only by its lack
of vascularity on color duplex examination of the
thyroid gland (TH). AC = common carotid artery
► Parathyroid Adenoma
Like lipoma, parathyroid adenoma (both pri-
mary idiopathic adenoma and secondary para-
thyroid hyperplasia due to renal failure and
hypocalcemia) appears as a hypoechoic mass
located next to the thyroid gland. The location
of the parathyroid glands has been described
above under “Topography."
Sonographic features. Parathyroid adenoma is
markedly less echogenic than the thyroid, has
an echo structure ranging from homogeneous
to patchy-cystic with increasing size, and
presents a round, oval, or polygonal shape. In-
ternal vascularity has been variously described
and may be subtle. Peripheral vascularity is
believed to be uncommon, but curved vascular
rims have been described around the adeno-
mas (Figs. 14.35 and 14.36).
a Fig. 14.35 Parathyroid adenoma (cursors) in hyper-
parathyroidism: rounded, hypoechoic mass border-
ing the common carotid artery (AC) at the infero-
lateral pole of the thyroid.
a Fig. 14.36 Parathyroid adenoma (A).
a Located at the lower pole of the thyroid (accom-
panied here by an isoechoic thyroid adenoma; TH-A)
and above the aortic arch (AO).
а b Color Doppler demonstrates slight internal vascu-
larity and subtle peripheral vascularity.
► Abscess_____________________________________________________________________________________
Rare abscesses of the thyroid gland have a sim-
ilar hypoechoic appearance to adenomas, cysts,
and lymphomas. Their presence signifies an
acute purulent thyroiditis.
Thyroid abscess appears sonographically as
a mostly anechoic or hypoechoic mass with
irregular internal echoes. Color duplex exami-
nation shows an absence of vascularity
(Fig. 14.37).
* Fig. 14.37 Thyroid abscess (A) next to a thyroid ad-
enoma with a regressive cyst (C); very hypoechoic
mass opposite the cyst with faint internal echoes and
blocky contours. Patient presented clinically with
marked signs of inflammation and a reddish, tender
neck mass.
Circumscribed Changes 435
► Focal de Quervain Thyroiditis____________________________________________________________________________
De Quervain thyroiditis is usually a diffuse thy-
roid disease, but infrequent unilateral cases
occur. The diagnosis is established by clinical
examination and fine-needle aspiration cytol-
ogy.
Typical ultrasound findings consist of well-
circumscribed or irregular hypoechoic areas
that either are hypovascular or, in some re-
ports, show moderate vascularity (Figs. 14.38
and 14.39).
a Fig. 14.38 Focal de Quervain thyroiditis of the right
thyroid lobe, transverse scan through both lobes
(cursors). The right lobe contains a central, ill-de-
fined, hypoechoic mass causing an elliptical contour
bulge; the left lobe appears normal. Patient had a
three-month history of viral infection, high inflam-
matory parameters, and a circumscribed bulge with
pain radiating to the right side of the neck.
a Fig. 14.39 Focal de Quervain thyroiditis. Color Dop-
pler image shows scant peripheral vascularity and no
internal vessels. Scintigraphy revealed a cold spot on
the right side. Fine-needle aspiration cytology
showed no evidence of an abscess or malignancy.
Weeks later the left thyroid lobe was also involved.
TH = thyroid; M - muscle.
► Malignant Lymphoma____________________________________________
Malignant lymphomas of the thyroid gland
usually occur in the setting of generalized lym-
phomatous disease. Tumor clusters in the neck
may be distributed about the thyroid gland.
They can be difficult to delineate from the nor-
mal thyroid structure even when thyroid nod-
ules are present.
Malignant lymphomas are characterized by
a very low echogenicity. They show a variable
degree of vascularity (Fig. 14.40).
a Fig. 14.40 Stage lib Hodgkin lymphoma, nodular
sclerosis.
a Markedly enlarged parathyroid lymph node (LN)
with a patchy, very hypoechoic structure. Longitudi-
nal parathyroid scan of the right neck.
a b Lymphomas lying directly adjacent to the thyroid
gland (TH) show no vascularity. T = trachea; VJ =
internal jugular vein; AC = common carotid artery.
74 Thyroid Gland 436
► Carcinoma_________________________________
Thyroid carcinomas present as a clinically pal-
pable neck mass that produces a cold nodule at
scintigraphy. Ultrasound can be an effective
adjunct to radionuclide scanning by showing
that many cold nodules are not suspicious for
cancer (cysts, calcified or hyperechoic nod-
ules). Malignancies always have a hypoechoic
or nonhomogeneous hypoechoic structure.
Histology. The following malignant thyroid tu-
mors are listed in the WHO classification:
► Carcinoma
- Follicular carcinoma
- Papillary carcinoma
- Medullary C-cell carcinoma
- Undifferentiated (anaplastic) carcinoma
- Special form: squamous ceil carcinoma
(Lindsay tumor)
► Nonepithelial tumors
► Malignant lymphoma
► Metastases from extrathyroid tumors
Papillary and follicular carcinoma are more
common in the thyroid gland than medullary
C-cell carcinoma, while anaplastic and squa-
mous cell carcinoma are rare. Distant metasta-
ses are more common with follicular and me-
dullary C-cell carcinoma, while locoregional
metastases are more typical of papillary carci-
noma. Medullary C-cell carcinoma grows
slowly but often has already metastasized after
reaching 10 mm. Undifferentiated anaplastic
carcinoma is considered highly malignant ow-
ing to its propensity for rapid invasive growth
and early metastasis. Only about 3% of patients
survive longer than two years.
Detection. A thyroid malignancy cannot be
positively detected by ultrasonography, even
when color Doppler is used. Fine-needle aspi-
ration cytology is still the most accurate
method for cancer diagnosis. This pertains
chiefly to papillary and medullary cancers.
The diagnosis of follicular carcinoma must gen-
erally rely on surgical specimen histology. C-
cel 1 carcinoma is best diagnosed by fine-needle
aspiration with a calcitonin assay or by direct
histological examination.
Sonographic features. Besides their consis-
tently hypoechoic to almost anechoic appear-
ance, carcinomas are distinguished sonograph-
ically by a predominantly absent or incomplete
(rarely closed) peripheral vascular rim. They
invariably show intense central vascularity,
but this is also detectable in 30% of benign
nodules (Fig. 14.41, Fig. 14.64, and Fig. 14.42).
It can be extremely difficult to detect malig-
nancies in nodular goiters. Most cases involve
older patients with a prominent goiter. Acous-
tic enhancement as well as shadowing may be
seen posterior to a carcinomatous lesion. Floc-
culent calcifications are suggestive of medul-
lary C-cell carcinoma, while microcalcifications
are often found in papillary carcinoma as well
Medullary Thyroid Carcinoma
MEN syndrome. Medullary thyroid carci-
noma (MTC) is not a carcinoma of the actual
thyroid tissue but an endocrine carcinoma
located in the thyroid gland. It shows a fam-
ilial occurrence and may be isolated (FMTC)
or may occur in the setting of multiple en-
docrine neoplasia (MEN II syndrome: MTC,
pheochromocytoma, parathyroid hyperpla-
sia, cutaneous neurofibromatosis). Sporadic
cases also occur.
MEN I tumors are also derived from the pe-
ripheral endocrine APUD system. The diag-
nosis of this syndrome relies on intestinal
polypeptide screening. The age-dependent
sequence of lesions occurring from early in-
fancy to over age 50 is as follows: insulino-
mas, parathyroid adenomas, gastrinomas,
prolactinomas (ACTH), glucagonomas, and
finally VIPomas.
as in other forms. On the whole, the different
types of carcinoma cannot be distinguished
from one another by their sonographic fea-
tures.
Differential diagnosis. The most difficult le-
sion to distinguish sonographically from carci-
noma is a hypoechoic adenoma. The former
belief that adenoma could be distinguished
from carcinoma by its peripheral rim is no
Table 14.4 Differentiation of microfollicular adenoma from carcinoma based on common
sonographic features
Micro- or normofollicular adenoma Carcinoma
Structure Hypoechoic, normal echoge- nicity Hypoechoic
Regressive changes Frequent cysts, calcification Rarely, cystic elements
Microcalcifications Rare Common
Peripheral rim Common Variable
Internal vascularity Common (approximately 51% of cases) 67-100%
Lymph nodes None Relatively common
Table 14.5 Diagnosis and treatment of a hypoechoic cold thyroid nodule
Nodule Diagnosis Treatment
<10 mm 6-month ultrasound follow- 200 pg iodide
ups
10-20 mm FNAB, if benign —* 200 pg iodide, follow-ups
> 30 mm Surgery or FNAB
De novo Always evaluate by FNAB Surgery if required
Laboratory values. Medullary thyroid carci-
noma leads to a rise in basal or stimulated
serum calcitonin levels providing a marker
for early diagnosis. Even if the tumor is not
detectable, it can be inferred from elevated
calcitonin levels. Carcinoembryonic antigen
(CEA) is also elevated.
Growth characteristics. Medullary thyroid
carcinoma grows slowly but metastasizes
early to locoregional lymph nodes. Standard
operative treatment should therefore include
locoregional lymph node dissection in addi-
tion to total thyroidectomy. This operation is
curative in 25% of cases even with positive
cervical lymph nodes 6.
longer supported by data in the literature2- 16.
It remains unclear whether color duplex scan-
ning can advance the differential diagnosis. The
sonographic features of adenoma are con-
trasted with those of carcinoma in Table 14.4.
Ultrasound is most accurate in diagnosing car-
cinoma only when multiple signs (absence of a
peripheral halo combined with microcalcifica-
tions and intranodal hypervascularity) are si-
multaneously present in a thyroid nodule with
a high specifity of 97.2 % but a low sensitivity of
16.6%. Therefore only in a small proportion of
patients with thyroid carcinoma is ultrasonog-
raphy and color flow Doppler information
highly predictive of malignancy.
Further management. With hypoechoic thy-
roid nodules smaller than 10 mm, an expectant
approach with 6-month follow-ups is appro-
priate owing to the slow growth rate of differ-
entiated carcinomas. Any hypoechoic nodule
larger than 10 mm should be investigated by
thyroid scintigraphy, and a cold nodule always
warrants fine-needle aspiration biopsy. Table
14.5 shows the recommended diagnostic strat-
egy for a scintigraphic cold nodule that is hy-
poechoic at ultrasound.
«« Fig. 14.41 Thyroid carcinoma (C-cell carcinoma).
a Hypoechoic mass (cursors) with a hypoechoic rim.
It contains a small flocculent calcification with an
acoustic shadow.
« b An intense vascular rim partially surrounds the
mass, which shows internal vascularity.
Circumscribed Changes 437
Fig. 14.42 Thyroid carcinoma: squamous cell carci-
noma (Lindsay tumor), detected incidentally in a 45-
уеаг-old woman undergoing ultrasound for type I
diabetes.
a Hypoechoic tumor (cursors, microcalcification).
S = shadowing.
b Color Doppler shows both peripheral and internal
vascularity. AC = common carotid artery.
► Tumor Infiltration or Metastasis________________________________________________________________________________
Esophageal and tracheobronchial carcinomas
are most likely to infiltrate the thyroid,
whereas hematogenous metastasis is more
common with bronchial and renal-cell carci-
noma, malignant melanoma, and breast cancer.
Contiguous spread. The tumors that most
commonly invade the thyroid by direct exten-
sion are esophageal carcinoma and occasion-
ally tracheal carcinoma.
Ultrasound may show evidence of the pri-
mary tumor. Conversely, the trachea may be
infiltrated by a primary thyroid carcinoma or
very rarely a sarcoma. The growth of a benign
nodular goiter into the trachea is extremely
difficult to distinguish from the extension of
carcinoma (Figs. 14.43-14.45).
Metastases. Metastases have the same ultra-
sound appearance as thyroid carcinoma. They
may be microscopically small or may reach
tremendous size, sometimes acquiring a scal-
loped shape. Their vascularity at color duplex
examination ranges from hypovascular to very
hypervascular (Figs. 14.46 and 14.47).
a Fig. 14.43 Tracheal carcinoma invading the thyroid
gland (TH). The patient presented with severe stridor.
Scan shows a hypoechoic mass with ill-defined mar-
gins (T, cursors). Vj = jugular vein.
a Fig. 14.44 Esophageal carcinoma (TU) invading the
lower pole of the thyroid (TH). A = small thyroid
adenoma.
a Fig. 14.45 This patient presented with a firm nodule
on the left side of the neck. Color Doppler demon-
strates a vascular rim encircling a large nodule that
shows internal vascularity. The resistance index is
increased to 0.85. The lesion shows a slightly non-
homogeneous structure with hyperechoic and hypo-
echoic areas. The morphological features are those of
an adenomatous nodule with subtle regressive
changes. A similar nodule was found on the right
side. Surgery and histology: both were whitish nod-
ules identified as metastases from a trabecular clear-
cell carcinoma (renal cell carcinoma 10 years after
nephrectomy! See Fig. 1.72b, p. 30).
14 Thyroid Gland 438
a Fig. 14.46 Metastases from a malignant melanoma.
Color Doppler shows marked intralesional vascularity.
a Fig. 14.47 Adenomatous nodule or metastasis?
a В-mode image shows a large, suspicious hypo-
echoic mass following melanoma surgery. Cytology
was suspicious for metastatic melanoma, but histol-
ogy confirmed an adenoma.
a b Color Doppler shows prominent internal vascular-
ity.
Isoechoic_________________________________________________________________
► Diffuse Changes
▼ Circumscribed Changes
Anechoic
Hypoechoic
_ ► Isoechoic
! Hyperechoic
Inegular
► Differential Diagnosis of Hyper-
thyroidism
— ► Normofollicular Adenoma
► Hemorrhagic or Colloid Cyst
► Regressive Changes in an Adenoma or Adenomatous Nodule
► Normofollicular Adenoma__________________________________________________________________
As a rule, solitary isoechoic nodules in the thy-
roid gland are normofollicular adenomas. They
have the same echo structure as the rest of the
thyroid parenchyma and can be distinguished
only by their hypoechoic or anechoic rim
(halo). Normofollicular thyroid nodules, like
hypoechoic nodules, may show increased ra-
diotracer uptake at scintigraphy, identifying
them as autonomous adenomas. By contrast,
hyperechoic adenomas almost never show up-
take that indicates autonomy.
Sonographic features. Normofollicular adeno-
mas have the same reflectivity as normal thy-
roid tissue, with the result that adenomas usu-
ally are not detectable with ultrasound unless
they are located at the periphery of the gland
and cause an appreciable contour bulge. They
may be circumscribed by an echo-poor vascu-
lar rim (Fig. 14.48, E 14.3b).
Fig. 14.48 Isoechoic adenoma (A) in a euthyroid pa-
tient. M = muscle.
a В-mode image shows an elliptical halo in an oth-
erwise normal-appearing thyroid (TH).
< b Color Doppler demonstrates a vascular rim with
slight internal vascularity.
► Hemorrhagic or Colloid Cyst----------------------------------------------------------
Besides adenomas, isoechoic nodules may be
caused by fresh bleeding within a cyst or by
large colloid-containing cysts. These cystic le-
sions can be identified as such by noting their
compressibility at ultrasound. Subtle move-
ments of the cyst contents may also be ob-
served. Fine-needle aspiration can quickly re-
solve any doubts as to whether the mass is
liquid or solid (Fig. 14.49 and в 14.2f). Carci-
nomas are rarely isoechoic and are almost
never hyperechoic.
* Fig. 14.49 A cyst with internal hemorrhage is pre-
dominantly isoechoic and creates a bulge in the
thyroid contour. Fine-needle aspiration identified
this lesion as a chocolate cyst.
ircumscribed Changes 439
► Regressive Changes in an Adenoma or Adenomatous Nodule
Adenomas tend to undergo regressive changes
over time. As collagenous connective tissue is
formed, the initially hypoechoic nodules be-
come more echogenic. The adenomas lose their
homogeneous structure, and other regressive
changes such as cyst formation and calcifica-
tion may supervene, giving the nodule an irreg-
ular or heterogeneous echo structure
(Fig. 14.50).
« Fig. 14.50 Regressive changes in an isoechoic nodule
with an echopenic halo. The lesion is isoechoic to the
rest of the thyroid gland but has a somewhat coarser
texture, probably due to the presence of collagenous
connective tissue. It also contains a small calcifica-
tion with a posterior shadow (S).
Hyperechoic______________________________________
— ► Macrofollicular Adenoma or Nodule
► Hemorrhagic Cyst, Colloid Cyst
► Nodule with Regressive Changes
► Hemangioma, Myolipoma, Thyroid Regressive Changes
► Calcifications
Hyperechoic lesions in the thyroid gland
may be macrofollicular adenomas, adenoma-
tous nodules, nodules with regressive fibrous
changes, or in rare cases benign tumors such as
hemangiomas, lipomas, and myolipomas. Re-
gressive changes may consist of cystic trans-
formation, fibrous changes with collagenous or
hyaline connective-tissue formation, and calci-
fications. While hyaline connective tissue has a
very low reflectivity ( 14.1a), collagenous
connective tissue is very echogenic. Thus,
high echogenicity in a nodule may by caused
by a histomorphological macrofollicular struc-
ture or by the presence of collagenous connec-
tive tissue in the nodule.
► Macrofollicular Adenoma or Nodule_________________________________________________________________
Solitary hyperechoic nodules in an otherwise
normal thyroid gland are generally macrofol-
licular adenomas. They show no tracer uptake
at scintigraphy, appearing as cold nodules.
Scintigraphy cannot evaluate the structural
changes that underlie cold nodules, which
may represent carcinoma, fibrous regressive
nodules, or cysts. Sonography is an ideal com-
plement to scintigraphy in making this kind of
differentiation (Table 14.5).
Hyperechoic adenomas are less common
than hypoechoic microfollicular adenomas.
Macrofollicular nodules show little or no inter-
nal vascularity when evaluated by color Dop-
pler
Nodules with fibrous regressive changes,
like macrofollicular adenomas, are more echo-
genic than normal thyroid tissue but tend to
display a coarsely granular to patchy echo tex-
ture (Fig. 14.51).
л Fig. 14.51 Hyperechoic adenoma (A) in a normal thy-
roid gland (TH, cursors), delineated by peripheral
vascularity.
► Hemorrhagic Cyst, Colloid Cyst______________________________________________________________________
Hemorrhagic or colloid cysts may exhibit a
hyperechoic or irregular echo structure. They
are sharply marginated compared with other
hyperechoic masses. The nature of the mass is
determined by fine-needle aspiration (E 14.2f
and Fig. 14.49).
► Nodule with Regressive Changes_________________________________________________________________
A nodular goiter of long standing will generally
contain nodules with regressive changes.
Cystic transformation and calcification are
common along with fibrous changes
(Fig. 14.52).
« Fig. 14.52 Hyperechoic, nonhomogeneous thyroid
nodule (cursors) with regressive changes.
► Hemangioma, Myolipoma, Thyroid Regressive Changes
These small, round, well-circumscribed lesions
are quite conspicuous at ultrasound owing to
their very high reflectivity. When these lesions
are found, it is difficult to tell what histopatho-
logical elements are responsible for their high
echogenicity. They have no real clinical signifi-
cance other than the fact that they may repre-
sent a parathyroid gland that appears more
echogenic due to fatty degeneration or fibro-
sis (Fig. 14.53).
-« Fig. 14.53 Small, round, hyperechoic nodule (cur-
sors) in a hypoechoic thyroid gland The differential
diagnosis consists of hemangioma, lipoma, and thy-
roid adenoma with regressive changes. The patient
presented with renal failure and mild hyperparathy-
roidism.
► Macrofollicular Adenoma or Nodule
Solitary hyperechoic nodules in an otherwise
normal thyroid gland are generally macrofol-
licular adenomas. They show no tracer uptake
at scintigraphy, appearing as cold nodules.
Scintigraphy cannot evaluate the structural
changes that underlie cold nodules, which
may represent carcinoma, fibrous regressive
nodules, or cysts. Sonography is an ideal com-
plement to scintigraphy in making this kind of
differentiation (Table 14.5).
Hyperechoic adenomas are less common
than hypoechoic microfollicular adenomas.
Macrofollicular nodules show little or no inter-
na] vascularity when evaluated by color Dop-
pler.
Nodules with fibrous regressive changes,
like macrofollicular adenomas, are more echo-
genic than normal thyroid tissue but tend to
display a coarsely granular to patchy echo tex-
ture (Fig. 14.51).
a Fig. 14.51 Hyperechoic adenoma (A) in a normal thy-
roid gland (TH, cursors), delineated by peripheral
vascularity.
► Hemorrhagic Cyst, Colloid Cyst
Hemorrhagic or colloid cysts may exhibit a
hyperechoic or irregular echo structure. They
are sharply marginated compared with other
hyperechoic masses. The nature of the mass is
determined by fine-needle aspiration (® 14.2f
and Fig. 14.49).
► Nodule with Regressive Changes
A nodular goiter of long standing will generally
contain nodules with regressive changes.
Cystic transformation and calcification are
common along with fibrous changes
(Fig. 14.52).
< Fig. 14.52 Hyperechoic, nonhomogeneous thyroid
nodule (cursors) with regressive changes.
► Hemangioma, Myolipoma, Thyroid Regressive Changes
These small, round, well-circumscribed lesions
are quite conspicuous at ultrasound owing to
their very high reflectivity. When these lesions
are found, it is difficult to tell what histopatho-
logical elements are responsible for their high
echogenicity. They have no real clinical signifi-
cance other than the fact that they may repre-
sent a parathyroid gland that appears more
echogenic due to fatty degeneration or fibro-
sis (Fig. 14.53).
* Fig. 14.53 Small, round, hyperechoic nodule (cur-
sors) in a hypoechoic thyroid gland. The differential
diagnosis consists of hemangioma, lipoma, and thy-
roid adenoma with regressive changes. The patient
presented with renal failure and mild hyperparathy-
roidism.
14 Thyroid Gland 442
the nodular goiter is easily recognized at ultra-
sound by the halos that surround the nodules.
Frequently, however, the nodules are confluent
and of variable size, making it extremely diffi-
cult to delineate them in the В-mode image.
Only color Doppler can define individual nod-
ules in these cases (Figs. 14.57-14.59). It is vir-
tually impossible, however, to distinguish
autonomous nodules with ultrasound. This ap-
plies to carcinomatous nodules as well (see
below).
a Fig. 14.59 Nodular goiter (TH). The individual nod-
ules can no longer be identified
о В-mode image shows only bizarre anechoic lines
(arrows) that are not consistent with a diffuse goiter
(which should be included in the differential diagno-
sis).
a b In the color Doppler image, the anechoic lines can
be identified as remnants of peripheral vessels around
the nodules.
► Regressive Nodular Goiter_______________________________________________________________________
The ultrasound appearance of a long-standing
nodular goiter becomes increasingly difficult to
interpret over time. The already diverse sono-
morphological features of nodules are made
more complex by the addition of regressive
changes such as cystic transformation, hyper-
echoic collagenous connective tissue, hypo-
echoic hyaline connective tissue, and microcal-
cifications or macrocalcifications, which create
an extremely heterogeneous appearance
(Figs. 14.60 and 14.61).
* Fig. 14.60 Regressive nodular goiter. SieScape pan-
oramic image shows an irregular thyroid structure
with anechoic inclusions (cysts), hyperechoic areas
(collagenous connective tissue), and hypoechoic el-
ements (blood vessels, hyaline connective tissue?).
* Fig. 14.61 a and b Nodular goiter with regressive
changes in a hyperthyroid patient. Scans show a
patchy, hyperechoic background texture with hypo-
echoic adenomatous nodules (A), also calcifications
with acoustic shadows (S). C = cyst.
► Tumor__________________________________________________________________________
Large tumors tend to develop areas of necrotic
liquefaction. Together with calcifications, they
produce a complex echo pattern with an irreg-
ular sonomorphological structure that is diffi-
cult to interpret (Figs. 14.62-14.64). The diag-
nosis relies chiefly on radionuclide findings
(cold nodules), clinical manifestations (enlarg-
ing goiter), and fine-needle aspiration biopsy.
◄ Fig. 14.62 Follicular thyroid carcinoma. Emergency
surgery was performed for stridor. Ultrasound shows
a large hypoechoic tumor with several hypoechoic to
anechoic areas and multiple fine echogenic foci.
Histology partially necrotic follicular thyroid carci-
noma.
a Fig. 14.64 Undifferentiated anaplastic carcinoma
shows an irregular structure with a hypoechoic back-
ground, internal vascularity, central anechoic foci of
liquefaction, and echogenic microcaicifications.
л Fig. 14.63 Papillary thyroid carcinoma (histologically
well-differentiated) shows a coarse heterogeneous structure with multiple confluent hypoechoic
areas and small, echogenic flecks of calcification. VJ = jugular vein; T = trachea.
Differential Diagnosis of Hyperthyroidism
Types of Autonomy
Differential Diagnosis of Hyperthyroidism 443
— ► Unifocal Autonomy
► Bifocal Autonomy
► Multifocal Autonomy
► Disseminated Autonomy
Approximately 40% of all hyperthyioidism
has an immune etiology. Almost all children
and adolescents with hyperthyroidism have
Basedow disease as an underlying condition.
In older patients with hyperthyroidism, func-
tional autonomy (usually multifocal) is present
in 70-80% of cases. In iodine-deficient areas,
hyperthyroidism occurs predominantly in a la-
tent form (low basal TSH with normal periph-
eral hormone levels) that is generally missed
unless a routine basal TSH determination is
performed (just as overt hyperthyroidism is
often missed because of nonspecific clinical
symptoms).
Both the sonographic and scintigraphic de-
tection of autonomous foci in nodular goiters
present major difficulties, because multiple
confluent nodules give the thyroid a generally
hypoechoic appearance in which these echo-
penic (potentially autonomous) nodules can-
not be individually identified.
Special problems arise in cases where auton-
omously functioning nodules coexist with
Basedow hyperthyroidism (Marine-Lenhard
syndrome, 1 % incidence) (И 14.4p-r) or auton-
omous foci develop in a setting of autoim-
mune lymphocytic thyroiditis (Hashimoto)
(И 14.4s-u). Definitive treatment for hyper-
thyroidism should be withheld in these cases,
and replacement therapy should be instituted
despite the hyperthyroidism.
Given the important role of ultrasound in
patients who present with hyperthyroid symp-
toms, the causes of hyperthyroidism are listed
in E 14.4 and illustrated with ultrasound im-
Clinical Classification of Hyperthyroidism
Even isoechoic adenomas, like hypoechoic
microfollicular adenomas, may be autono-
mous and lead to hyperthyroidism. In nodu-
lar goiters as well, the likelihood that ad-
enomatous nodules will develop increases
with the age of the goiter. The following
types of autonomy can arise:
► Unifocal autonomy (one nodule)
► Bifocal autonomy (two nodules)
► Multifocal autonomy (multiple nodules)
► Disseminated autonomy involving the en-
tire thyroid (rarer than the other types)
ages and correlative radionuclide scans. The
examples do not include hyperthyiosis factitia
(hyperthyroidism induced by the exogenous
administration of thyroid hormones) or hyper-
thyroidism as a paraneoplastic syndrome.
Autoimmune thyroid diseases that are asso-
ciated with hyperthyroidism include the fol-
lowing:
► Immunogenic Basedow hyperthyroidism
► Hypertrophic Hashimoto thyroiditis
► de Quervain thyroiditis (including silent
thyroiditis)
► Chronic thyroiditis with transient hyper-
thyroidism or postpartum thyroiditis
► Amiodarone-induced thyroiditis
s 14.4 Hyperthyroidism: Ultrasound Findings and Correlative Scintiscans
14 Thyroid Gland 444
► Unifocal autonomy
a Color Doppler scan at a relatively high
PRF shows circumscribed hypervascu-
larity only in the area of the adenoma.
b Scan at a low PRF shows diffuse vas-
cularity that is most intense superiorly.
c Unifocal autonomy on the right side.
The other portions of the thyroid are
suppressed.
► Bifocal autonomy
d Patchy hypoechoic adenomatous
nodule in the lower part of the right
lobe (A), showing marked peripheral
vascularity.
e Similar adenomatous nodule in the
left lobe with peripheral vascularity.
f Predominantly left-sided goiter with
bifocal autonomy.
► Multifocal autonomy
g Transverse scan on the right side
shows an irregular, generally hypo-
echoic background pattern in the right
lobe.
i Multifocal autonomy.
h Longitudinal scan on the right side
shows a hypoechoic mass with scant
peripheral vascularity.
► Disseminated autonomy
j Nodular goiter (SD).
к Coarse, patchy vascularity, subtly
delineating a nodular lesion.
I Disseminated autonomy with con-
firmed hyperthyroidism.
► Disseminated autonomy in
autoimmune thyroiditis
(polyglandular autoimmune
syndrome type II)
m Right thyroid lobe: coarse, patchy
hypoechoic structure.
n Swelling of the isthmus. Scan at 0.09
m/s still shows definite vascularity
(similar to Basedow disease). Maximally
high TPO levels, no anti-TSH receptor
antibodies.
о Diffuse goiter predominantly affect-
ing the right lobe.
В 14.4 Hyperthyroidism: Ultrasound Findings and Correlative Scintiscans
► Basedow disease with focal
autonomy (Marine-Lenhard
syndrome)
► Autoimmune thyroiditis with
additional autonomous ad-
enomas
p Basedow disease: marked hypo-
echoicity and swelling of the left lobe,
also nodules (one marked with an ar-
row). AC = carotid artery.
q Hypervascularity in one of the nod-
ules, which here appears more reflec-
tive than the otherwise hypoechoic
thyroid gland. AC = carotid artery.
г Basedow thyroid shows increased ra-
diotracer uptake predominantly in the
left lobe.
s Hypoechoic thyroid gland (TH) with a
circumscribed, anechoic bandlike area
on the right side; incipient thyrotoxi-
cosis. Anti-TPO > 1000, anti-TSH re-
ceptor antibodies slightly elevated.
t Pronounced hypervascularity in the
patchy echo-free lesion in s. The vessel-
spared area is a cyst (C). The rest of the
thyroid also shows increased vascular-
ity.
и Scintiscan shows intense uptake in
the right lobe and decreased uptake in
the left lobe.
Differential Diagnosis of Hyperthyroidism 445
References
1. Baldini M, Castagnone D, Rivolta D et al. Thyroid
vascularisation by color Doppler ultrasonography
in Graves disease. Changes related to different
phases and to the long-term outcome of the dis-
ease. Thyroid 1997;7:823-8.
2. Beckei D, Bair Hj, Becker W et al. Thyroid
autonomy with color-coded image-directed so-
nography; internal hypervascularisation for the
recognition of autonomous adenomas. J clin Ul-
trasound 1997;25:63-9.
3. Becker D, Lohner W, Mai tus P, Hahn EG. Farb-
dopplersonographische Detektion von fokalen
Schilddnisenautonomien. Ultraschall in Med
1999;20:41-6.
4. Braun B, Giinther R, Schwerk WB. Ultraschall-
diagnostik. Lehrbuch und Atlas. Landshut:
Ecomed 1992.
5. Clark KJ, Cronan JJ, Scola FH. Color doppler so-
nography: Anatomic and physiologic assessment
of thyroid. J clin Ultrasound 1995;23:215-23.
6. Dralle H, Scheumann GFW, Proye C. The value of
lymph node dissection in hereditary medullar
thyroid carcinoma. J Intern Med
1995:238:357-61.
7. Guggenberger D. Ultraschalldiagnostik 94.
Dreilandertreffen Basel 1994.
8. Junik R, Sawicka J, Kozak W, Gembicki M. Thyroid
volume and function in patients with acromegaly
living in iodine deficient areas.] Endocrinol Invest
1997; 20(3): 134-7.
9. Loviselh A, Bocchetta A, Mossa P et al. Value of
thyroid echography in the long-term follow up
lithium-treated patients. Neuropsychobiology
1997;31(1):37-41.
10. Mann K. Vorsymposium 33. Jahrestagung Deut-
sche Diabetesgesellschaft Frankfurt 1999.
11. Marine D, Lenhard CH. Pathological anatomy of
exophthalmic goiter. The anatomical and phys-
iological relations of the thyroid gland to the
disease; the treatment. Arch, intern. Med.
1911;3:265-316.
12. Meller J. Zappel H, Konrad M, Roth C, Emmrich D,
Becker W. 123J-Szintigraphie und Perchlorat-
Depletionstest bei der Diagnostik der kongenita-
len Hypothyreose. Nuklearmedizin
1998;37(1):7-11.
13. Rago T, Vitti P, Chiovato L et al. Role of conven-
tional ultrasonography and color flow-doppler
sonography in predicting malignancy in “cold"
thyroid nodules. EurJ Endocrinol 1998;138:41-6.
14. Ralls PW, Mayekawa DS, Lee KP et aL Color-flow
Doppler-sonography in Graves disease: “thyroi-
dinferno”. Amer J Roentgenol 1988;150:781-4.
15. Riede UN, Oberholzer M, Klbppel G. Schilddriise.
In: Allgemeine und Spezielle Pathologie. Stutt-
gart: Thieme 1995.
16. Saleh A, Santen R, Maims J et al. B-Mode-Sonog-
raphie und moderne dopplersonographische
Methoden bei Krankheiten der Schilddriise und
der Nebenschilddi iise. Radiologe
1998;38:344-54.
17. Scherbaum WA. Kongress of Internists Wies-
baden 1999.
18. Schneider AB, Bekermann C. Cleland J et aL Thy-
roid nodules in the follow-up of irradiated indi-
viduals: comparison of thyroid ultrasound with
scanning and palpation. J Clin Endocrinol Metab
1997;82(l2):4020-7.
Pleura and Chest Wall 449
v Chest Wall
► Masses
451
451
► Rib and Sternal Fractures
► Rib and Sternal Metastases
► Cutaneous Metastases
— ► Carcinoma of the Chest Wall
15 Pleura and Chest
456
456
459
► Pleural Carcinomatosis
► Pleural Fibrosis
► Diffuse Malignant Mesothelioma
462
463
464
466
► Inflammatory or Malignant Effusion
— ► Fibrothorax
— ► Seropneumothorax, Pneumothorax
15 Pleura and Chest Wall
C. Coerg
As early as the 1960s, initial efforts were made
to examine masses near the pleura with ultra-
sound as an adjunct to conventional radiogra-
phy. Ultrasound has gained a well-established
role in the diagnosis and differentiation of
pleural effusion6, 7.
Anatomy and Topography
The pleura lines the thoracic cavity and invests
the lung parenchyma. Histologically, it consists
of a single layer of epithelium. The visceral
pleura, which covers the surface of the lung,
is distinguished from the parietal pleura, which
Location of the Pleura
► Along the inner chest wall (parietal)
► Along the inner surface of the diaphragm
(parietal)
► Over the surface of the lung parenchyma
(visceral)
Pleural thickness
► Visceral, parietal, and diaphragmatic:
1 mm or less
Histology
► Single layer of epithelial cells lining the
thoracic cavity
Ultrasound appearance
► Sharp, bright, linear “entry echo” pro-
duced as the sound enters the lung
Indications. The following indications are cur-
rently recognized for ultrasound scanning of
the chest wall and pleura:
► The differentiation of chest wall masses
► The investigation of pleural opacities seen on
radiographs
lines the inner chest wall (thoracic part) and
covers much of the diaphragm (diaphragmatic
part). Normally the two pleural layers are ap-
posed, forming a potential space called the
pleural cavity.
л Fig. 15.1 Anatomical relations of the parietal pleura
in the lateral chest wall.
a Schematic diagram: (1) skin; (2) subcutaneous fat;
(3) chest wall muscle; (4) intercostal muscles; (5) ribs;
(6) parietal pleura; (7) visceral pleura; (8) lung.
► Guiding thoracentesis, drainage, and pleural
biopsy
► Dynamic assessment of diaphragmatic mo-
tion
At the level of the chest wall, the pleura is
bounded externally by the ribs, sternum, and
intercostal muscles. Overlying these structures
is a layer of chest wall muscle and subcutane-
ous fat (Fig. 15.1).
15 Pleura and Chest Wall 449
a b Sonographic appearance of the structures. 1 =
Subcutaneous fat; 2 = chest wall muscle; 3 = inter-
costal muscle; 4 = pleural echo.
Ultrasound Morphology
Normal appearance. The bony structures of
the chest wall (ribs and sternum) are charac-
terized by a high-level surface echo with al-
most complete posterior acoustic shadowing
(E 15.1a, b). By contrast, the uncalcified costal
cartilages allow the complete through-trans-
mission of sound (3 15.1c). The parietal pleura
lines the inner chest wall, while the visceral
pleura invests the lung parenchyma.
The pleura normally appears as a bright,
well-defined linear echo called the pleural
line. The potential space between the pleural
layers cannot be visualized with ultrasound. In
dynamic real-time sonography during breath-
ing, the visceral part of the pleural echo can be
seen gliding in relation to the stationary parie-
tal part (: 15.1 d).
Positions for scanning. The patient should be
examined in a sitting position whenever possi-
ble. Generally the ultrasound probe is placed
intercostally. A subcostal transhepatic and in-
tercostal approach is recommended for subpul-
monary and diaphragmatic scanning (Fig. 15.2,
E 15.1 e and f). The posterior insertion of the
muscular diaphragm (crus) can be defined in
the paravertebral region in an upper abdominal
transverse scan (0 15.1 g-i). When fluid accu-
mulates in the pleural cavity and abdomen,
ultrasound can clearly define the contractions
of the diaphragm that occur with respiration
(E 15.1 j-1). On deep inspiration, a subcostal
scan angled toward the head can show variable
degrees of hepatic impression by the diaphrag-
matic crura, which appear as hyperechoic
“pseudotumors" in the liver (0 15.1 m-o).
A complete ultrasound examination of the
pleura is not possible because the mediastinal
and paravertebral pleura cannot be visualized.
Additional blind spots exist in the regions of
the scapula and left hemidiaphragm.
a Fig. 15.2 Diagram of transducer placements for
thoracic ultrasound. Left: subcostal transhepatic
scan for evaluating the lower lung field. Right: inter-
costal scan parallel to the ribs.
H 15.1 Ultrasound Appearance of the Ribs, Pleura, and Diaphragm
► Ribs
15 Pleura and Chest Wall 450
► Pleura-lung boundary line
a and b Appearance of a bony rib (a) and a cartilaginous rib (b) in transverse section.
C = rib, LU = lung.
c Total shadowing in the bony part of
the rib in longitudinal scan. P - pleura-
lung boundary echo.
d Power Doppler scan color-encodes
the respiratory movements of the lung
(right) P = pleura.
e The pleural lines in subcostal scans
through the liver (L). Reflections from
the pleura produce a mirror image ar-
tifact (LE). LU = lung.
f Effusion outlines the diaphragm (ar-
rows) in an intercostal scan on the right
side.
► Muscular diaphragm
g-f Posterior insertion of the muscular diaphragm (arrows) in upper abdominal transverse scans (g) and upper abdominal
longitudinal scans (h, /'). AO aorta; VC = vena cava; AR = renal artery; SC = spinal column.
► Diaphragm, respiratory posi-
tion changes
j-l Subcostal scans in the presence of ascites (A) and pleural effusion (PE). The survey scans (/, k) show relaxation of the
diaphragm with expiration and contraction with inspiration. LU = lung.
► Diaphragmatic crura
m When ascites is present (A), the di-
aphragmatic crura are clearly visualized
along the anterior chest wall. GB = gall
bladder; LE « liver.
л The diaphragmatic crura occasionally
appear as pseudotumors. LU = lung.
о The diaphragmatic crura may deeply
indent the liver tissue in the subcostal
scan.
Chest Wall
Masses______________________________________________________________
Chest Wall 451
CJ
The ultrasound investigation of chest wall
lesions is directed by the physical examina-
tion (Fig. 15.3). The interpretation depends on
the sonographic findings, the clinical data, and
also on the result of ultrasound-guided fine-
needle aspiration or core-needle biopsy. Under
the proper conditions, these percutaneous pro-
cedures through the chest wall can be done
virtually without complications. The main
value of chest-wall ultrasound lies in its ability
to define the location of masses as intracuta-
neous, subcutaneous, intramuscular, bony, or
pleural8. The principal masses of the chest
wall are reviewed in Table 15.1.
Table 15.1 Differential diagnosis of masses in the chest wall
More common
Rib and sternal fractures
Cutaneous metastases
Rib metastases
Carcinoma
Less common
Abscess
Lipoma
Benign bone tumors
Sarcoma
Malignant mesothelioma
л Fig. 15.3 Fractured rib.
о A man 50 years of age presented with localized
left-sided chest pain (arrow) following a fall.
л b Minimally displaced rib fracture appears sono-
graphically as a discontinuity in the cortical echo.
p
► Rib and Sternal Fractures_________________________________________________________________________
Bony thoracic lesions can be difficult to diag-
nose on radiographs because minimally dis-
placed fractures are occasionally obscured by
superimposed shadows.
Sonographic features. Fractures of the bony
ribs and sternum can be visualized with ultra-
sound (E 15.2a-c). A discontinuity in the lin-
ear cortical echo serves as a direct fracture sign.
Indirect fracture signs are local hematoma
(E 15.2d-f) and a pneumothorax or hemato-
thorax. It is not always possible to distinguish
between traumatic and pathological fractures
Table 15.2 Sonographic fracture signs (after reference 1)
Direct fracture signs
Disruption of the cortical echo
Cap between the bone ends (stepoff)
by ultrasound (a 15.2c). The callus that forms
during fracture healing can also be defined
sonographically (0 15.2g-l). The accuracy of
Indirect fracture signs
Local hematoma
Pleural effusion
Pneumothorax
Hematothorax
ultrasound in the diagnosis of thoracic frac-
tures is superior to that of conventional radio-
graphs (Table 15.2).
в 15.2 Rib Fractures
15 Pleura and Chest Wall 452
► Direct fracture sign:
bony discontinuity
► indirect fracture sign:
hematoma
► Follow-ups
a and b Plasmacytoma, osteoporosis, and chest pain in a 78-year-old woman.
Longitudinal scan shows disruption of the sternal cortical echo by a fracture.
c Bronchial carcinoma and scinti-
graphically confirmed rib metastasis in
a 52-year-old man. Step-off with soft-
tissue lesion consistent with a fracture.
d-f Thoracic trauma in an 83-year-old man.
d and e Largely echo-free parasternal mass consistent with a hematoma (H).
S = shadowing; COR = heart.
f CT demonstrates a left parasternal
hematoma.
g-i A 60-year-old woman with bronchial asthma and chest pain after a fit of coughing. Ultrasound (g) shows a displaced rib
fracture. Appearance after one day (h) and one week (i). H= hematoma; C = rib; P = Pleura-lung boundary ec; LU = lung.
j-l Serial scans document the healing of a
traumatic rib fracture with callus formation.
► Rib and Sterna/ Metastases______________________________________________________________
The ultrasound examination is directed by the
frequent presence of localized pain. It should
be noted that, in principle, a benign/malignant
differentiation cannot be made based on ultra-
sound findings alone (B 15.31).
Sonographic features. With metastasis to the
bony thorax, ultrasound will often show a rel-
atively long break in the cortical echo (В 15.3a,
b). Some sites allow complete through-trans-
mission of sound (B 15.3i and g). Tumor ex-
tension into the soft tissue is seen with meta-
static carcinoma and multiple myeloma
(B 15.3c-h). On color Doppler examination,
prominent vascular signals are observed in
bony metastases (B 15.3j and k).
Ultrasound has a limited role in the diagno-
sis of bony metastases and should be consid-
ered only an adjunct to conventional studies1.
Ultrasound can be helpful in monitoring re-
sponse to treatment and for planning radio-
therapy portals in selected cases.
Е 15,3 Rib and Sternal Metastases
► Sternal metastasis
a—c Transverse scans show varying degrees of destruction including the still-intact sternum and the start of tumor involve-
ment ST = sternum; TU = tumor; C = rib; LU = lung.
best Wall 453
/ A \
d and e Sternal metastasis from bronchial carcinoma, d Longitudinal scan. The
sternum has been engulfed and consumed by a metastasis approximately 5 cm in
size.
f CT appearance of sternal metastasis.
► Bone destruction
g Normal rib in transverse section.
h Rib metastasis from bronchial carci-
noma. Incipient cortical destruction and
tumor formation (TU) consistent with a
rib metastasis.
i Plasmacytoma (TU) in a 69-year-old
man. Almost complete sound trans-
mission through a rib, consistent with
tumor infiltration.
j-l Plasmacytoma in a 73-year-old
woman.
j Chest radiograph shows a soft-tissue
lesion in the right lateral chest wall.
к Transverse scan of a rib shows cortical
destruction and a large soft-tissue
mass. TU = tumor; LU = lung. Color
Doppler detects flow signals in the tu-
mor tissue.
/ Benign differential diagnosis: 30-year-
old man presented with a tumor in the
right anterior chest wall. Ultrasound
shows a complex solid lesion arising
from the rib. Histology: fibrous dyspla-
sia (Jaffe-Lichtenstein dysplasia of
bone).
► Cutaneous Metastases_____________________________________________________________________
The ultrasound investigation of cutaneous
metastases is directed by any palpable abnor-
malities that are noted on physical examina-
tion. The palpable mass may have a rounded or
flattened shape (E 15.4a-n).
A benign tumor (lipoma, granuloma, seba-
ceous cyst) in any given case can be confirmed
only by histological examination (S 15.4o).
Lipomas usually present sonographically as
mobile, hyperechoic lesions with smooth mar-
gins. Granulomas are difficult to distinguish
from cutaneous metastases by their ultrasound
features. Granulomas frequently develop in
scai red areas and usually show no vascularity
on color Doppler examination.
Cutaneous metastases typically have a
round to oval shape and are usually hypo-
echoic. Flow signals can be detected by color
Doppler. Percutaneous biopsy is almost never
performed, because local excision is the
method of choice for establishing the diagnosis.
в 15,4 Cutaneous Metastases
► High-grade lymphoma
15 Pleura and Chest Wall 454
► Breast carcinoma
a An area of palpable induration (ar-
rows) was noted about a Groshong
catheter site in a 53-year-old woman.
b and c Longitudinal and transverse scans show a homogeneous hypoechoic lesion
in the area of the cartilaginous rib (C) junction. Histology confirmed invasion by
lymphoma. LU ш lung; ST = sternum.
d A poorly demarcated area of palpable
firmness (dotted circle) was noted in
the right parasternal region of a 53-
year-old woman.
e Ultrasound shows a triangular hypo-
echoic lesion (TU) to the right of the
sternum (ST), consistent with chest-
wall infiltration by known breast carci-
noma. LU = lung.
f Left parasternal region appears nor-
mal. LU = lung; ST = sternum; TU -
tumor.
► Plasmacytoma
g Palm-size mass in the right lateral
chest wall of a 64-year-old man.
h and i Longitudinal and transverse scans show a large, hypoechoic mass. The ribs
(C) appear normal. Histology confirmed soft-tissue infiltration by plasmacytoma. LU
= lung.
► Hodgkin disease
j Left parasternal swelling in a 20-year-
old woman.
к and I Multiple nodular chest-wall tumors arising from the anterior mediastinum
(TU). Diagnosis was confirmed by ultrasound-guided core biopsy. ST = sternum; AO
= aorta; LU - lung.
► Bronchial carcinoma and
liposarcoma
m A 53-year-old man with bronchial
carcinoma and a subcutaneous nodule
on the left side of the chest. Ultrasound
reveals a hypoechoic cutaneous meta-
stasis (M). C « rib; LU - lung.
n A 65-year-old man with a firm mass
in the left posterior chest wall. Ultra-
sound shows a rounded, echogenic tu-
mor mass (TU). Excision confirmed the
diagnosis of liposarcoma. C= rib.
о Differentiation from benign lesions:
tuberculous abscess in a 30-year-old
HIV-positive man. Transverse and lon-
gitudinal ultrasound scans show a left
parasternal mass (TU) that is fluctuant
on compression.
► Carcinoma of the Chest Wall
Carcinomas of the chest wall are almost invar-
iably peripheral bronchial carcinomas with the
main tumor mass located in the chest wall
(Fig. 15.4). The importance of ultrasound lies
in its ability to define the extent of tumor in-
filtration into the various layers of the chest
wall and exclude a benign lesion (hematoma,
abscess, etc.).
« Fig. 15.4 Bronchial carcinoma in a 78-year-old man.
a Chest radiograph shows diffuse opacification of
the left upper lung field.
« b Ultrasound shows a hypoechoic tumor mass (TU)
that has penetrated the pleura (arrow) and invaded
the chest wall. LU = lung.
Sonographic features. Chest-wall carcinomas
are usually hypoechoic at ultrasound. Their
margins are irregular. Color Doppler shows
rather sparse tumor vascularity.
Pancoast tumor is a peripheral bronchial
carcinoma that arises in the superior sulcus
and infiltrates neighboring tissues (nerve
plexus, rib, spinal column)9 (Fig. 15.5).
Other malignant tumors of the chest wall,
such as sarcomas and malignant lymphomas,
have a similar sonographic appearance. Ultra-
sound-guided percutaneous biopsy is the
method of choice for confirming the diagnosis.
Chest Wall 455
« Fig. 15.5 A 62-year-old man with right shoulder
pain.
a Palpable mass in the right supraclavicular fossa.
< b Right-sided meiosis, ptosis, and enophthalmos
(Horner syndrome).
c and d Posteroanterior scans of the ribs (C) show a
destructive lesion (TU) infiltrating the soft tissues,
consistent with a Pancoast tumor.
Parietal Pleura
15 Pleura and Chest Wall 456
Nodular Masses______________________________________________________
— ► Metastases
► Pleural Plaque
Focal nodular masses of the pleura are local-
ized lesions that either originate from the
pleura or are in intimate contact with it (Table
15.3). There may or may not be associated
pleural effusion (Fig. 15.6). If effusion is absent,
the lesions are usually located between the
pleural layers. When pleural effusion is
present, the lesion can be localized to the pleu-
ral layers4,5 (Fig. 15.7).
A confident benign/malignant discrimina-
tion is not possible based on ultrasound find-
ings alone.
Table 15.3 Differential diagnosis of focal nodular mass lesions of the pleura
Common
Metastases
Pleural plaque
Less common
Mesothelioma
Lipoma
Fibroma
Fibrin bodies (in pleural effusion)
Neurogenic tumors
Loculated fluid
Organized empyema
Fig. 15.6 Pleural metastases (M) in a 43-year-old
man with hypernephroma. LU • lung.
< Fig. 15.7 Hypernephroma in a 61-year-old man.
Scan shows two echogenic round lesions (m) sur-
rounded by pleural effusion on the right side of the
diaphragm. L = liver.
► Metastases_______________________________________________________________________________
Metastases are the most common type of focal
pleural lesion. The most common primaries are
bronchial carcinoma and breast cancer. The le-
sions may or may not be associated with pleu-
ral effusion.
Sonographic features. The lesions usually ap-
pear sonographically as round, sharply circum-
scribed nodules of variable echogenicity. They
are frequently in contact with the parietal
pleura (a 15.5a-c). Infiltration of the visceral
pleura should be assumed if the lesion does not
move with respiratory excursions in the ab-
sence of pleural effusion8 (Fig. 15.8). Even so,
differentiation from peripheral lung metasta-
ses cannot always be achieved. Subcostal trans-
hepatic scans are best for demonstrating in-
volvement of the diaphragmatic pleura
Mobile pleural
tumor:
reverberations
move with
respiration
Mobile lung
tumor:
moves with
respiration
Fixed pleural
tumor:
reverberations
do not move
with respiration
Fixed lung
tumor:
does not
move with
respiration
Fig. 15.8 Technique for diffeientiating a mobile tumor from a fixed tumor (after reference 8).
(л 15.5d-f). Color Doppler ultrasound can dif-
ferentiate among loculated fluid (a 15.5g-1),
hematoma, and pleural fibrin bodies
(a 15.5m, n). which are occasionally seen in
fibrin-rich exudative pleural effusions. The de-
finitive diagnosis is established by ultrasound-
guided fine-needle aspiration (И 15.5o).
In rare cases, malignant mesothelioma can
occur as a localized tumor that is indistinguish-
able from pleural metastases or peripheral
bronchial carcinoma by its ultrasound features.
s 75.5 Differential Diagnosis of Pleural Metastases
► Pleural metastases
Parietal Pleura 457
a-c Focal mass of the parietal pleura.
a Solitary nodular lesion (M), meta-
static to breast carcinoma. L = lung.
b Confluent nodular metastases (TU)
from breast carcinoma.
c Large focal tumor (TU) invading the
chest wall. Metastasis from breast car-
cinoma. LU s lung.
► Malignant mesothelioma
d-f Malignant mesothelioma in a 76-
year-old patient.
d Chest radiograph shows moderate
pleural effusion on the right side.
e and f Right lateral intercostal scan and subcostal transhepatic scan show an
echogenic tumor mass in the diaphragm (arrow). PE = pleural effusion.
► Local fluid: pulmonary cyst
i CT appearance of the pulmonary cyst
► Local fluid: aortic aneurysm
g-i Peripheral round lesion in a 64-year-old man.
g and h Rounded, sharply circumscribed, echo-free peripheral lesion (C), most likely
a pulmonary cyst. LU = lung.
j-l A 67-year-old patient with me-
diastinal widening.
j Chest radiograph shows mediastinal
widening.
к and I В-mode image shows an elongated, echo-free structure on the pleural wall
in the left posterior paravertebral region. Color Doppler image shows zones of
arterial turbulence consistent with an aortic aneurysm on the posterior chest wall.
The finding was confirmed by MRI. LU = lung; WS = spinal column.
® 15.5 Differential Diagnosis of Pleural Metastases
15 Pleura and Chest Wall 458
* Parainfectious effusion
► Pleural effusion with a fibrin
body
m and n A 76-year-old man with exudative pleural effusion (PE) on the right side.
Fibrin body appears as a homogeneous mass on the pleural wall, mobile in the
pleural effusion. D - diaphragm.
о A 20-year-old man evaluated for
pleural effusion. Ultrasound two days
after thoracentesis shows pleural
thickening in the area of the puncture
site (arrows), interpreted as a local re-
action to needle insertion. The clinical
course was consistent with a parain-
fectious effusion. LU = lung; S = spleen.
► Pleural Plaque--------------------------------------------------------------------------------------
Pleural plaques appear as focal hypoechoic le-
sions that represent the end stage of pneumo-
nia, infarction, empyema, hematoma, tumor
irradiation, or chemotherapy. They are also
found in the setting of asbestos exposure and
other pneumoconioses (Fig. 15.9). Not infre-
quently, the pleural layers are adherent.
Sonographic features. At ultrasound the nor-
mally sharp pleural line appears irregular and
fragmented. The lesions are mostly hypoechoic
and oblong with ill-defined margins. The max-
imum thickness of the lesions is usually less
than 5 mm.
Lesions of the visceral pleura cannot be dis-
tinguished from small peripheral pulmonary
embolisms or pleurisy by their ultrasound fea-
tures alone. The focal lesions can be localized to
the visceral pleura, however, and the clinical
presentation can further narrow the differen-
tial diagnosis2. Differentiation from pleural car-
cinomatosis is generally difficult.
Calcifications. Localized calcifications are oc-
casionally found on the pleural layers. They are
observed after infections (e.g., tuberculosis),
after trauma (e.g., fibrothorax), in pneumoco-
niosis (e.g., asbestosis), and also in hypercalce-
mia (e.g., renal failure) (Fig. 15.10).
Fig. 15.9 A 57-year-old man with a history of asbes-
tosis.
a Ultrasound shows plaquelike areas of pleural
thickening in addition to pleural nodules (arrow).
b CT appearance of the pleural plaques.
« Fig. 15.10 Old pulmonary tuberculosis in a 70-year-
old man.
a Chest radiograph shows a white hemithorax on
the left side following surgical treatment of tuber-
culosis, with pleural calcifications on the right side.
◄ b Ultrasound shows localized pleural calcifications
(arrowheads). LU = lung.
Parietal Pleura 459
Diffuse Pleural Thickening_________________________________________________
— ► Pleural Carcinomatosis
► Pleural Fibrosis
► Diffuse Malignant Mesothelioma
A continuum exists between nodular and
more diffuse lesions of the pleura. Occasionally
both infiltration patterns are encountered in
the same patient.
The differentiation of malignant from be-
nign diffuse pleural thickening has major clin-
ical relevance. In some cases only thoracoscopy
can establish the cause of the pleural thicken-
ing (Table 15.4). There are no definite sono-
graphic criteria for malignant infiltration,
although pleural thickening that exceeds
1 cm, additional nodular lesions, and involve-
ment of the mediastinal pleural suggest a ma-
lignant etiology.
Table 15.4 Differential diagnosis of diffuse pleural thickening
Common Less common
Pleural carcinomatosis
Chronic fibrosing pleurisy
Diffuse malignant mesothelioma
Localized pleural effusion
Asbestosis
Connective-tissue diseases
Chronic empyema
Tuberculosis
Aspergillosis
► Pleural Carcinomatosis---------------------------------------------------------------------
Pleural carcinomatosis may present sono-
graphically with pleural effusion, focal pleural
metastases, or diffuse pleural thickening. The
latter may occur with or without pleural effu-
sion.
Ultrasound shows a homogeneous, hypo-
echoic or even hyperechoic, sheetlike tumor
mass that is usually distributed along the pari-
etal pleura (Figs. 15.11 and 15.12). The margins
are generally well-defined, but additional nod-
ular lesions may occasionally be seen
(Fig. 15.13). The diagnosis is established by ul-
trasound-guided thoracentesis4, 5.
a Fig. 15.11 & 38-year-old woman with breast carci-
noma.
a Chest radiograph shows a small pleural effusion on
the right side.
a b Subcostal transhepatic scan demonstrates pleural
effusion (PE) and diffuse thickening of the parietal
pleura (TU) consistent with pleural carcinomatosis.
D = diaphragm; L = liver.
15 Pleura and Chest Wall 460
a Fig. 15.12 A 69-year-old man with an ENT tumor.
о Chest radiograph shows bilateral pleural effusion.
a b and c Right lateral intercostal scan (b) and subcostal transhepatic scan (c) show diffuse, hyperechoic thickening
of the parietal pleura consistent with pleural carcinomatosis (Til). D = diaphragm; E = effusion; L = liver; LU = lung;
COR = heart.
* Fig. 15.13 a and b Low-grade non-Hodgkm lym-
phoma in a 78-year-old man. Right lateral intercostal
scan shows extensive pleural thickening in a string-
of-beads pattern (M), consistent with lymphoma-
tous infiltration. LU = lung; D = diaphragm; L = liver.
► Pleural Fibrosis_______________________
The pleural cavity may become diffusely per-
meated by fibrotic tissue during or after pneu-
monia and pleurisy and less commonly after a
tuberculous effusion (E 15.6a-c), empyema
(E 15.6d-h), pulmonary fibrosis (E 15.6i-n),
asbestosis (E 15.6o, p), or hemothorax. A con-
comitant exudative effusion is often present.
Sonographic features. Ultrasound usually
demonstrates an extended area of hypoechoic
pleural thickening. Generally the thickening is
less then 5 mm. Typically both the parietal
pleura and visceral pleura are thickened and,
in the absence of pleural effusion, cannot be
defined as separate layers.
Pleural effusion. The pleural layers can be
differentiated when pleural effusion is present.
The effusion sometimes contains fibrin strands
of varying extent ranging to a dense, honey-
comb-like structure.
Scar stage. In the scar stage the visceral
pleura cannot be distinguished from the pari-
etal layer and appears as a homogeneous, hy-
poechoic, solid thickening of the pleural space.
Calcifications due to scarring after tuberculosis
or asbestosis can be visualized with ultrasound.
The pleural line is irregular and indistinct. The
lung usually appears stationary on real-time
ultrasound.
Lung. Additional ultrasound evaluation of
the lung (e.g., pneumonia, tumor atelectasis,
pulmonary metastasis, peripheral lung tumor)
is helpful in determining the etiology of con-
comitant pleural thickening. Acute pleurisy and
pleuropneumonia are discussed in Chapter 16
as diseases that arise from the pulmonary pa-
renchyma and visceral pleura.
E 15.6 Various Causes of Pleural Fibrosis
► Tuberculosis
a-c Old pulmonary tuberculosis in a
75-year-old man.
a Chest radiograph shows scar changes
in the right lung.
b Extensive pleural thickening (arrows), c Normal pleura. LU e lung.
LU = lung.
в 75.6 Various Causes of Pleural Fibrosis
► Pyothorax
► Old pleural empyema
d-f Pyothorax after pneumonectomy.
d Chest radiograph shows a white left
hemithorax following pneumonectomy
for bronchial carcinoma.
e and f Fluid with a layer of sediment (A). The pleura (P, arrows) shows extensive
thickening. Percutaneous aspiration yielded pus consistent with pyothorax. AO =
aorta; E = effusion.
Parietal Pleura 461
g and h Old pleural empyema in a 53-
year-old man.
g Chest radiograph shows pleural
thickening on the left side.
h Ultrasound shows diffuse pleural
thickening with focal calcifications in
the area of the former pleural em-
pyema.
► Pulmonary fibrosis
i and j A 72-year-old man with
chronic obstructive lung disease.
i Chest radiograph shows signs of pul-
monary emphysema with increased
markings in the right lower lung field.
j The entry echo shows extended ir-
regularity with fine fibrotic changes.
к A 74-year-old man with known pul-
monary fibrosis: diffuse thickening of
the pleura (PL) to 4 mm (arrows).
f-n A 32-year-old woman with left
pulmonary fibrosis of undetermined
cause.
/ Chest radiograph shows increased
markings in the right lateral and lower
lung zones.
m and n Ultrasound shows diffuse thickening of the visceral (PV) and parietal (PP)
pleura. The lung is immobile. The arrows mark the entry echo at the visceral-parietal
interface.
► Asbestosis
о and p Asbestosis in a 53-year-old
man.
о Chest radiograph shows bilateral
opacities on the pleural wall.
p Ultrasound shows diffuse thickening
of the pleura (PL) to 10 mm with focal
calcifications (arrow). The lung (LU) is
fixed.
► Diffuse Malignant Mesothelioma
15 Pleura and Chest Wall 462
Almost 80% of cases occur in individuals with a
history of asbestos exposure. The average la-
tent period is 35 years. Three histological types
are distinguished: epithelial, mesenchymal
(sarcomatous), and mixed.
* Fig. 15.14 A 40-year-old man with malignant meso-
thelioma.
a Chest radiograph shows encasement of the right
lung.
a b and c Right lateral intercostal scan shows extensive hypoechoic tumor encasement (TU) of the lung (LU). L = liver.
Sonographic features. Ultrasound almost al-
ways shows pleural thickening that extends
into the costophrenic angle or interlobar fis-
sures, depending on the degree of spread.
Less commonly we find tumor infiltration of
the chest wall or abdominal cavity. The tumor
has a complex echo structure with hyperechoic
elements. It cannot be distinguished from pleu-
ral carcinomatosis, metastatic adenocarci-
noma. or an advanced fibrothorax by its ultra-
sound features alone. Pleural effusion is fre-
quently present. In the advanced stage, the
lung is encased by tumor (Fig. 15.14).
a f CT: pleural tumor.
a d and e Subcostal transhepatic scan shows diffuse tumor spread. Scattered nodular lesions (TU) are also demon-
strated in the lateral scan (e).
Pleural Effusion
Pleural effusion is by far the most common
space-occupying process occurring in the pleu-
ral cavity (Table 15.5, E 15.7). The value of
ultrasound lies in its ability to distinguish an
effusion from other diffuse lung opacities that
are seen on radiographs. Ultrasound is superior
to conventional chest films in both its sensitiv-
ity and specificity. Free effusion volumes as
small as 5 ml can be identified. Sonography
cannot detect a loculated interlobar effusion
or localized mediastinal fluid.
A pleural effusion displays characteristic so-
nographic features with regard to its location
(И 15.7a, b, d-f) (unilateral/bilateral), extent
(E 15.7c, g, h), echogenicity (E 15.7j), and
the presence of septations (B 15.7i, к, 1), de-
pending on the cause of the effusion (Table
15.6). Goecke et al.3 described a volumetry
technique that has proved useful for the sono-
Table 15.5 Differential diagnosis of mass
lesions in the pleural cavity
Common
Anechoic effusion
Echogenic effusion
Complex effusion
Less common
Hematothorax
Pneumothorax
Fibrothorax
graphic assessment of effusion volume
(Fig. 15.15).
The etiological classification of a pleural ef-
fusion is based on clinical presentation, sono-
graphic findings, and the result of percutane-
ous aspiration. Table 15.7 reviews the differ-
ential diagnosis of pleural effusion and the
characteristic ultrasound findings.
‘1 A = maximum effusion depth
В = basal distance from lung
to diaphragm
V(ml) = 70 x (A (cm) + В (cm)]
A (correlation coefficient = 0.87)
a Fig. 15.15 Diagram showing the technique of pleural
effusion volumetry (after reference 3).
Table 15.6 Possible causes of pleural effusion
Metastatic/hemodynamic (usually transu-
date)
► Heart failure
► Hepatic cirrhosis
► Uremia
► Hypercalcemia
Inflammatory (usually exudate)
► Pleurisy
► Pneumonia
► Pulmonary infarction
► Connective tissue disease
► Pancreatitis
Neoplastic (usually exudate)
► Pleural carcinomatosis
► Malignant mesothelioma
► Malignant lymphoma
► Sarcoma
Table 15.7 Differential diagnosis of pleural effusion
Transudate Exudate
Inflammatory Hemorrhagic Chylous Purulent Malignant
Analysis of aspirate Protein < 3 g% Hypocellular Cholesterol < 60 mg% Protein > 3 g% Very cellular Cholesterol > 60 mg% Protein > 3 g% Bloody Protein > 3 g% Milky turbid Triglycerides >100 mg% Protein > 3 g% Debris Protein > 3 g% Possible tumor cells
Sonographic characteristics Anechoic Fine pleural line Frequently bilateral Anechoic to hyper- echoic Septa, fibrin strands Accentuated pleural line Parenchymal lesion Anechoic to hyperechoic Sedimentation “Snowstorm” Hyperechoic “Snowstorm” Variable sedi- mentation Air echoes Pleural thicken- ing Variable septa, fibrin strands Pleural tumors Parenchymal lesion
Examples Heart failure Hepatic cirrhosis Protein deficiency Pneumonia Infarction Connective tissue disease Hematothorax Tumor hemor- rhage Chest trauma Pleural empyema Pulmonary abscess Pyothorax Pleural carcino- matosis NHL Mesothelioma
Pleural Effusion 463
Anechoic Effusion_____________________________________________________
— ► Transudative Effusion
► Exudative Effusion
► Transudative Effusion-------------------------------------------------------------------------
An exudative type of pleural effusion (> 2.5 g%)
is distinguished from a transudative effusion
(< 2.5 g%) based on the protein content of the
aspirate. A transudative effusion is anechoic
and is more often bilateral in varying degrees.
The effusion is usually benign by aspiration
cytology and occurs, for example, in heart fail-
ure due to various causes.
With extreme cardiomegaly, the heart may
occasionally appear as an anechoic area on the
lateral chest wall that mimics a pleural effusion
(Fig. 15.16). An aortic aneurysm on the poste-
rior chest wall can also appear sonographically
as an anechoic liquid mass ( 15.5j-l).
15 Pleura and Chest Wall 464
a Fig. 15.16 A 54-year old man with congestive heart
failure.
a Chest radiograph shows pronounced cardiomegaly
and possible pleural effusion.
а b Right lateral intercostal scan shows an indetermi-
nate hypoechoic mass (?).
a c Conspicuous flow patterns at color Doppler confirm
that the mass is an enlarged right heart. LU = lung.
► Exudative Effusion_____________________________________________________________________________________________________
In principle, even protein-rich pleural effusions
may appear anechoic. They consist mainly of
parainfectious effusions (e.g., due to pleurisy,
pneumonia, polyserositis, or tuberculosis) and
malignant effusions (e.g., due to bronchial or
mammary carcinoma).
Echogenic Effusion______________________________________________________
— ► Benign Effusion
► Malignant Effusion
► Benign Effusion______________________________________________________________________________________
An echogenic pleural effusion is caused by small
corpuscular reflectors suspended in the fluid.
These may consist of fibrin components, fat par-
ticles. corpuscular blood elements, air, or cellu-
lar debris. Real-time ultrasound demonstrates
moving echoes within the exudative fluid.
The differential diagnosis of an echogenic pleu-
ral effusion includes the following:
► Inflammatory effusion
► Pyothorax (a 15.6d-f)
► Hematothorax (Fig. 15.17)
► Chylothorax
Fibrin strands and septa ate commonly ob-
served in varying degrees. A benign effusion
cannot be positively distinguished from a ma-
lignant effusion based on sonographic criteria
alone.
Fig. 15.17 Bronchial carcinoma in a 60-year-old
man.
a Chest radiograph shows almost complete opacifi
cation of the right lung.
« b Right lateral intercostal scan shows a nonhomoge-
neous hypcrechoic structure formed by echoes that
move with respiration. Pleural fluid aspiration con-
firmed a hematothorax. L = liver.
a 15.7 Imaging Appearances of Pleural Effusion
► Basal effusion, inflammatory
a-c Radiographic and sonographic
appearances of pleural effusion.
a Chest radiograph shows elevation of
the diaphragm in a 47-year-old woman.
b Right lateral intercostal scan dem-
onstrates a subpulmonic effusion as the
cause of the radiographic sign. PE *
pleural effusion; L = liver; LU = lung.
c Normal chest radiograph. Ultrasound
reveals a small effusion on the left side.
D - diaphragm; LU = lung.
Pleural Effusion 465
► Peripheral effusion, inflamma-
tory
d-f A 48-year-old man with pleurisy.
d CT shows a localized fluid collection
along the pleural wall.
e and f Ultrasound scans over a six-month period document resolution of the
pleural effusion (PE; E) in response to antibiotic therapy. LU = lung.
► Malignant effusion: lymphoma
g and h A 39-year-old man with low-
grade lymphoma.
g Chest radiograph shows conspicuous
bilateral effusion.
h Subcostal scan angled toward the
head demonstrates the bilateral effu-
sion. PE = pleural effusion; L = liver.
i A 24-year-old man with Hodgkin dis-
ease. Ultrasound shows individual septa
in an exudative pleural effusion. SP =
spleen; D - diaphragm; PE = pleural ef-
fusion.
► Malignant effusion: bronchial
carcinoma
J-l Effusion in patients with bronchial
carcinoma.
j Left lateral intercostal scan in a 53-
уеаг-old man. Ascites (A) appears as an
echo-free area, contrasting with the
more echogenic pleural effusion (PE) on
the left side.
к A 74-year-old man with bronchial
carcinoma and complete opacification
of the hemithorax on chest radiograph.
Ultrasound shows a conspicuous pleural
effusion (PE) with upper lobar atelec-
tasis (AT). The atelectasis is surrounded
by a honeycomb-like fibrin mass due to
exudative effusion.
/ Bronchial carcinoma in a 57-year-old
man. Right lateral intercostal scan
shows septa in the pleural effusion with
thickening of the pleura due to exuda-
tive effusion. L = liver; LU = lung.
► Malignant Effusion
15 Pleura and Chest Wall 466
A malignant echogenic effusion is diagnosed
when tumor cells are detected by aspiration
cytology. The echogenicity of the effusion
(Fig. 15.18) and the presence of fibrin strands
or septa are considered indirect but nonspecific
signs. The sonographic detection of diffuse
л Fig. 15.18 Metastatic mucus-forming ovarian carci-
noma in a 74-year-old woman.
a Chest radiograph shows almost complete opacifi-
cation of the right lung.
pleural thickening that exceeds 1 cm or the
detection of nodular foci of pleural thickening
also suggests a malignant etiology. The diagno-
sis should be confirmed by cytological analysis.
Frequently the effusion is unilateral, and it is
not uncommon to find diffuse opacification of
a b and c Right anterior intercostal scan shows a nonhomogeneous echogenic mass containing faint echoes that
move with respiration. Aspiration yielded mucoid material from an expansile tumor metastatic to ovarian
carcinoma. COR = heart; VC = vena cava; L = liver; AO = aorta.
the hemithorax. A larger pleural effusion leads
to partial atelectasis of the lung; this makes it
possible to evaluate the lung parenchyma with
ultrasound and detect any pulmonary nodules
or a central tumor (Fig. 15.19).
a Fig. 15.19 Bronchial carcinoma in a 63-year-old man.
SL = superior lobe; IL = inferior lobe.
a Chest radiograph shows complete opacification of
the left lung.
a b and c Left lateral intercostal scan (b) and a second scan perpendicular to the first (c) demonstrate a hyperechoic
effusion with complete atelectasis of the superior lobe (SL) and inferior lobe (IL). The inferior lobe contains a liquid
mass consistent with necrotic liquefaction.
Complex Effusion
— ► Inflammatory or Malignant Effusion
► Fibrothorax
► Seropneumothorax, Pneumothorax
► Inflammatory or Malignant Effusion
Ultrasound examination of a complex pleural
effusion will show varying degrees of fibrin
stranding and septation, ranging to a honey-
comb-like permeation of the pleural cavity in
extreme cases. These structures are defined
less clearly by computed tomography than by
ultrasound. The ultrasound-guided aspiration
of septated effusions can be rewarding in clin-
ically symptomatic patients, consistently yield-
ing an exudative fluid. Various degrees of pleu-
ral thickening are seen. These findings are char-
acteristic of an inflammatory or malignant ef-
fusion.
In the latter case, it is not uncommon to find
nodular tumor masses in the effusion when
disease is advanced (Fig. 15.20). Ultrasound-
guided percutaneous drainage is no longer
beneficial in these cases.
Pleural Effusion 467
a Fig. 15.20 Low grade non-Hodgkin lymphoma in a
21-year-old woman.
a Chest radiograph shows complete opacification of
the left lung.
a b Left lateral intercostal scan shows an extensive,
loculated pleural effusion with a string-of-beads ar-
rangement of nodular masses (M) along the dia-
phragmatic pleura. Cytology confirmed lymphoma-
tous involvement of the pleura. SP = spleen.
► Fibrothorax
Fibrothorax is a special type of complex effu-
sion that develops following unilateral pneu-
monectomy (Fig. 15.21).
a Fig. 15.21 & 65-year-old man who had previously
undergone pneumonectomy for bronchial carci-
noma.
□ Chest radiograph shows complete opacification of
the left hemithorax.
a b Left anterior intercostal scan shows a nonhomoge-
neous, solid/cystic-appearing mass consistent with a
fibrothorax. COR = heart.
► Seropneumothorax, Pneumothorax
In rare cases, air or gas can be detected in the
pleural cavity in addition to a serous effusion.
The main causes are the iatrogenic introduc-
tion of air during the percutaneous aspiration
of an effusion or an infection with air-forming
or gas-forming bacteria. The air appears sono-
graphically as a sharp, echogenic line with pos-
terior acoustic shadowing.
A pneumothorax can also be diagnosed with
ultrasound. The air in the pleural cavity appears
as a sharp, highly reflective band. Unlike intra-
pulmonary air, the band does not move with
respiration. The extent of a pneumothorax is
determined by chest radiography, however.
References
1 Bitschnau R, Gehmacher 0, Kopf A, Scheier M,
Mathis G. Ultrasonography in the diagnosis of rib
and sternal fracture. Ultraschall in Med
1997;18:158-61.
2. Gehmacher 0, Kopf A, Scheier M, Bitschnau R,
WertgenT, Mathis G. 1st die Pleuritis sonogra-
phisch darstellbar? Ultraschall in Med
1997;18:214-9.
3. Goecke W, Schwerk WB. Die Real-Time Sonogra-
phie in der Diagnostik von PleuraergOssen. In:
Gebhardt J et al. (eds.). Ultraschalldiagnostik 89.
Berlin: Springer 1990; p. 385-7.
4. Gorg C, Gorg K, Schwerk WB, Kleinsorge F. So-
nographie der Pleura diaphragmatica beiTumor-
patienten. Ultraschall in Med 1988;9:274-8.
5. Gorg C, Schwerk WB, Gorg K, Walters E. Pleural
Effusion: An “Acoustic Window’’ for Sonography
of pleural metastases. JCU 1991;19:93-7.
6. Mathis G. Thoraxsonography-Part 1: Chest Wall
and Pleura. Ultrasound in Med & Biol
1997;23:1131-9.
7. Reul? J. Sonographic imaging of the pleura: nearly
30 years experience. EJU 1996;3:125-39.
8. Wernecke K. Sonographic Features of Pleural
Disease. AJR 1997;168:1061-6.
9. Yang PC, Lee LN, Luh KT et aL Ultrasonography of
Pancoast Tumor. Chest 1988;94:124-8.
Lung 471
▼ Masses
471
= ► Anechoic Masses
472
— ► Loculated Pleural Effusion
— ► Pulmonary Cyst, Liquefaction,
Abscess
1— ► Aortic Aneurysm, Cardiac Cavity
► Hypoechoic Masses
---► Atelectasis
— ► Pulmonary Embolism or Infarction
— ► Pulmonary Tumors and Metastases
► Complex Masses
483
--► Pneumonia
'-► Lung Abscess
16 Lung
C. Coerg
Transcutaneous ultrasound is limited in its
ability to define the thoracic organs. Although
sonography quickly became an established tool
for pleural examination, it was not until the
late 1980s that systematic studies in the lung
by Mathis et al.4 led to a greater acceptance of
pulmonary ultrasound.
There are several physical and acoustic phe-
nomena that chiefly limit the intrathoracic
use of ultrasound. The ribs, sternum, spinal
column, and scapula create diagnostic “dead
spaces” by reflecting virtually all incident
sound. Also, very large differences in acoustic
impedance exist at interfaces between lung
tissue and aerated alveoli, causing almost
100% sound reflection. Central lung regions
cannot be scanned through normally aerated
peripheral lung tissue.
As a result, thoracic ultrasound is currently
used as an adjunctive, complementary proce-
dure for investigating diffuse radiographic
opacities located near the pleura6.
Topography and Ultrasound Morphology___________________________________________________
Relations of the lungs
► Intrathoracic
► Bounded by the ribs, sternum, and dia-
phragm
Sonographic landmarks
► Sharp, mobile, high-amplitude echo at
the lung-pleura interface
The lungs are intrathoracic and are bounded by
the thoracic skeleton. The chest cavity is
bounded inferiorly by the diaphragm. The
upper lobes are covered posteriorly by the
scapulae. The lower lobes can be visualized by
scanning through the intercostal spaces, which
are directed obliquely downward. The anterior
rib segments are more horizontal, and the
upper lobes can be scanned at that level
through the intercostal spaces on both sides.
The middle lobe can be scanned from a para-
sternal probe position on the right side
(Fig. 16.1). The lower lung fields can be eval-
uated with a subcostal scan through the liver
(right lung) or through the spleen (left lung),
the transhepatic scan providing the better
view. The transsplenic window is frequently
obscured by gas in the stomach or colon. The
a Fig. 16.1 Anatomical relations of the pulmonary lobes.
apical lung regions are best demonstrated by a
supraclavicular scan angled toward the feet.
The range of intercostal sound transmission
normally extends to the visceral pleura and
ends at the aerated alveoli, which reflect all
incident sound. The typical echogenic pleural
line is produced by total sound reflection at the
pleura-lung interface (the “entry echo”).
Masses
Because mass lesions of the chest wall and
pleura as well as peripheral lung diseases pro-
mote sound transmission, they can be imaged
with transcutaneous ultrasound. Chest-wall
and pleural lesions can exert extrinsic pressure
on the lung, displacing air from the tissue and
enabling it to transmit sound (e.g., compression
atelectasis due to pleural effusion). These le-
sions are distinguished from actual intrapul-
monary masses that cause absent or decreased
aeration of the lung parenchyma. Only the lat-
ter types of lesion will be discussed here.
Criteria for ultrasound evaluation. The sono-
graphic evaluation of peripheral lung masses is
based on their number, location, size, shape,
margins, echogenicity, and homogeneity. The
behavior of the focal lesion during respiratory
excursions has proved to be an important cri-
terion.
Color Doppler ultrasound can supply addi-
tional information that is useful in characteriz-
ing lesions. It can provide qualitative informa-
tion on the display of color-flow signals that is
useful for classifying lesions as avascular, hypo-
vascular, or hypervascular. These signals are
dependent on the quality of the equipment
and the patient’s ability to breath-hold for a
specified period. Transmitted paracardiac pul-
sations also significantly limit the use of color
Doppler imaging in the chest.
Qualitative Doppler flow measurements in
lung tissue can help to achieve more accurate
tissue discrimination in certain cases (sampling
waveforms from branches of the pulmonary
veins or arteries and from tumor vessels (see
В 16.6, p.483). The resistance index and pul-
satility index have proved to be effective spec-
tral parameters for characterizing arterial ves-
sels7.
The interpretation of ultrasound findings
also depends on the history, the clinical pre-
sentation, and the results of follow-up scans. In
some cases a definitive interpretation may re-
quire ultrasound-guided fine-needle aspira-
tion1.
Anechoic Masses
16 Lung 472
A loculated pleural effusion is the most fre-
quent cause of an anechoic mass between the
lung and chest wall. Differentiation is required
from rare anechoic lung masses, which can be
defined with ultrasound if they reach the pa-
renchymal surface (Table 16.1, ® 16.1).
► Loculated Pleural Effusion
► Pulmonary Cyst, Liquefaction, Abscess
► Aortic Aneurysm, Cardiac Cavity
Table 16.1 Differential diagnosis of echo-free masses
Common Less common
Loculated effusion in a lobar fissure Lung abscess
Primary lung cyst
Liquefying tumor
Liquefying atelectasis
Aortic aneurysm on the chest wall
Cardiac cavity abutting the chest wall
► Loculated Pleural Effusion___________________________________________________________________
Localized anechoic masses between the lung
and chest wall most likely represent a loculated
pleural effusion (Fig. 16.2). An exudative type
of effusion is usually present. The underlying
disease may be an infection or malignant pro-
cess.
* Fig. 16.2 Bronchial carcinoma in a 45-year-old man.
Left lateral intercostal scan shows the bright entry
echo at the interface of the pleura and lung (LU)
cranial to the spleen (SP). A rounded, echo-free
mass rimmed by solid echogenic material is visible
in the costophrenic angle. It is consistent with a
loculated effusion in pleural carcinomatosis.
► Pulmonary Cyst, Liquefaction, Abscess_____________________________________________________________________________________
Pulmonary cysts are rare and are subdivided
into primary and secondary forms (® 16.1a,
d-f).
Liquefying processes (pneumonic infiltrates,
tumors, metastases) can occasionally appear
anechoic (E 16.1 g-k).
Lung abscesses usually have a complex echo
texture but may also appear anechoic (® 16.11).
They have an echogenic wall and produce char-
acteristic clinical symptoms. Abscessation can
be confirmed by ultrasound-guided percutane-
ous aspiration.
► Aortic Aneurysm, Cardiac Cavity___________________________________________________________________________________________
An aortic aneurysm bordering the chest wall
(Fig. 16.3) and a cardiac cavity abutting the
chest wall due to cardiomegaly are rare differ-
ential diagnoses for a hypoechoic mass; they
illustrate the importance of seeing the chest
radiograph before making a definitive interpre-
tation of the ultrasound findings.
и 76.1 Pulmonary Cysts, Liquefaction, and Abscesses
► Cyst, aspergilloma
Masses 473
a A 67-year-old woman with a 12-year
history of a constant peripheral lung
mass. Parasternal scan demonstrates an
echo-free mass with irregular margins
in the right parasternal region, consis-
tent with a pulmonary cyst (Су), c =
secondary cysts.
b and c A 49-year-old man with leu-
kemia and fever.
b Chest radiograph shows multiple
pulmonary nodules.
c Right lateral intercostal scan shows
an almost echo-free mass in the lung
(LU), identified histologically as an as-
pergilloma.
► Peripheral pulmonary nodule
f CT: peripheral lung nodule.
d-f Peripheral lung nodule in a
74-year-old man.
d Initially complex lung mass.
e Over the next two months the mass
resolves into a cystic focus, presumably
the result of pneumonia or infarction.
► Liquefaction, cystic tumor,
abscess
g A 38-year-old man with fever. Right
anterior intercostal scan shows diffuse
hypoechoic transformation of the lung
with central liquefaction (A) consistent
with cavitating pneumonia. INF = in-
farction; LU = lung.
h and i Bronchial carcinoma.
h Chest radiograph shows complete
opacification of the left hemithorax.
i Left lateral intercostal scan shows
pleural effusion (PE) with upper (UL)
and lower lobar atelectasis. The lower
lobe contains a central hypoechoic area
(arrows) consistent with liquefaction.
j and к A 33-year-old woman with
known sarcoma and a large right
thoracic metastasis.
У Color duplex demonstrates a cystic-
solid mass with color-flow signals in the
solid components.
к Sampled waveforms display a high-
resistance “extremity" pattern in pul-
monary arterial vessels and a low-re-
sistance “parenchymal" pattern in tu-
mor vessels.
/ A 79-year-old man with fever and
dyspnea. Left lateral intercostal scan
shows a large, echo-free mass with ir-
regular margins and central air echoes
(arrow) cranial to the spleen (SP). Per-
cutaneous aspiration of the mass
yielded pus. A = abscess; SP = spleen.
16 Lung 474
а Яд. 16.3 A 67-year-old man with mediastinal widen-
ing in the chest radiograph.
a Ultrasound shows a rounded, hypoechoic mass
with a septum (arrows) in the left paravertebral re-
gion. SC = spinal column; LU = lung.
a b Color Doppler shows arterial turbulence within the
mass.
л c MRI confirms the diagnosis of a dissecting thoracic
aortic aneurysm.
Hypoechoic Masses___________________________________________________
Table 16.2 reviews the differential diagnosis of
hypoechoic masses in the lung.
► Atelectasis
► Pulmonary Embolism or Infarction
► Pulmonary Tumors and Metastases
Table 16.2 Differential diagnosis of hypoechoic masses
Common Less common
Atelectasis Lobar pneumonia
Pulmonary embolism or infarction Lung abscess
Pulmonary tumor
► Atelectasis___________________________________________________________________________________________
Atelectasis is characterized by an absence of
aeration in pulmonary segments, lobes, or an
entire lung. It is distinguished from dysatelec-
tasis, in which aeration is decreased.
Compressive and obstructive atelectasis. Ate-
lectasis is classified as compressive or obstruc-
tive on the basis of its pathogenesis. Compres-
sive atelectasis is caused by a large pleural
effusion in which the external fluid pressure
on the lung parenchyma exceeds the internal
pressure transmitted by the outside air
(E 16.2). Obstructive atelectasis, called also ab-
sorption atelectasis, results from bronchial ob-
struction and absorption of the air in the oc-
cluded area (E 16.3).
Sonographic features. Compression atelecta-
sis appears sonographically as a narrow, rela-
tively well-defined, wedge-shaped area of pe-
ripheral lung showing homogeneous hypo-
echoic transformation. Real-time ultrasound
may show partial reinflation of the collapsed
area during inhalation. This may produce a
conspicuous “air bronchogram.’’ Partial reinfla-
tion may occur following percutaneous aspira-
tion of the effusion (Table 16.3, E 16.2).
Obstructive atelectasis also shows homoge-
neous low echogenicity. The sectional ultra-
sound image of the affected lung segment re-
sembles a scan of the liver parenchyma (“hepa-
tization” of the lung) (E 16.3f). An air broncho-
gram is not observed (Table 16.3). With
longstanding atelectasis (usually caused by a
central tumor mass), the retention of secretions
can produce a “fluid bronchogram'’ (E 16.3a,
b). Ultrasound demonstrates hypoechoic, mu-
cus-filled bronchial lumina surrounded by
echogenic bronchial walls. Color Doppler can
differentiate the fluid bronchogram from vas-
cular structures. Increased color-flow signals
are observed in the atelectatic lung tissue
(B 16.3 f,j-l).
Central mass. Central obstructions of the
bronchial tree can cause the development of
atelectasis. Occasionally the obstructing central
mass can be identified, the atelectatic lung
serving as a kind of acoustic window for ex-
ploring mediastinal structures (£ 16.3c, e, n).
In principle, central masses that are sono-
graphically defined can be aspirated through
the atelectasis with a fine percutaneous needle.
Structural non homogeneities. The pulmonary
vascular tree may account for nonhomogene-
ities seen with ultrasound in the postobstruc-
tive lung. Rounded, predominantly hypoechoic
or anechoic areas are caused by retained secre-
tions in the atelectatic lung. When infection is
present, poststenotic foci of liquefaction may
be seen due to abscess formation (obstructive
pneumonitis) (B 16.3p-r). The positive differ-
entiation of hypoechoic focal masses (incipient
abscess, metastasis) is occasionally difficult.
Table 16.3 Possible sonographic findings in compressive and obstructive atelectasis
Compressive atelectasis
Obstructive atelectasis
В-mode ultrasound
► Moderate to marked pleural effusion
► Triangular, peaked-cap hypoechoic transformation of
the lung parenchyma
► Indistinct margins with aerated lung
► Partial reinflation during inhalation (“air broncho-
gram*’)
► Partial reinflation after pleurocentesis
► Little or no pleural effusion
► Homogeneous, hypoechoic transformation of
the lung parenchyma
► Echogenic bands may be visible (“fluid bron-
chogram”)
► Intraparenchymal foci may appear due to:
- parenchymal
- liquefaction
- microabscesses or
- macroabscesses,
- metastases
► A central mass may be seen
► No reinflation during inhalation
Masses 475
Color Doppler ultrasound
► Increased flow signals relative to the liver
► Increased flow signals relative to the liver
► Triphasic pulmonary artery waveforms
(“extremity” pattern)
0 16.2 Compression Atelectasis
► Partial atelectasis
a and b Pleural effusion (PE) in an 87-
уеаг-old woman.
a Compression atelectasis (AT) affect-
ing the lower lobe of the right lung (LU).
b Color Doppler shows increased flow
signals in the atelectatic area (AT).
c A 73-year-old man with squamous
cell carcinoma and a radiograph show-
ing a white hemithorax on the right
side. Ultrasound demonstrates effusion
and upper lobe atelectasis (UL). The
central hypoechoic masses are consis-
tent with lymphnode metastasis (L).
► Complete atelectasis
d-f A 35-year-old man with bronchial
carcinoma.
d Chest radiograph shows complete
opacification of the left hemithorax.
e and f Longitudinal and transverse scans show pronounced effusion with atelec-
tasis of upper (UL) and lower (LL) lobes. COR = heart; PE = pleural effusion.
a 16.3 Obstructive Atelectasis
► Middle lobe atelectasis
16 Lung 476
a and b Bronchial carcinoma.
о Chest radiograph shows signs of
middle lobe atelectasis.
b Right anterior intercostal scan shows
hypoechoic transformation of the lung
with an echo-free “fluid bronchogram”
caused by central obstruction. AT
atelektasis; LU = lung; COR * heart.
c Bronchial carcinoma in a 67-year-old
man. Right anterior ultrasound scan
shows hypoechoic transformation of
the lung consistent with atelectasis
(AT). A central tumor mass (TU) is
identified. LU = lung; COR = heart.
► Upper and lower lobe atelec-
tasis
d and e Bronchial carcinoma.
d Chest radiograph shows almost
complete opacification of the left
hemithorax.
e Transversal scan shows upper lobe
atelectasis (AT) with delineation of a
central tumor (TU). The arrows point to
the severely narrowed upper lobar
bronchus. COR = heart; UL = upper lobe;
LU - lung.
f Bronchial carcinoma. Right lateral in-
tercostal scan shows “hepatization" of
the lung characteristic of atelectasis
(AT). Color Doppler shows increased
flow signals in the atelectatic lung tis-
sue. L = liver; LU = lung.
g-i Bronchial carcinoma in a 74-year-
old woman.
g Chest radiograph shows opacification
of the left lower lung field.
h Ultrasound shows homogeneous hy-
poechoic transformation of the left
lower lobe consistent with atelectasis
(AT). D = diagram; M » spleen.
i The central portions of the upper lobe
(UL) are still aerated. Together with
scant pleural effusion (PE), this suggests
obstructive atelectasis of the lower
lobe.
► Vascular Doppler spectrum
j-l Suspected bronchial carcinoma in a 74-year-old woman. In the color Doppler scanning of atelectasis, characteristic
waveforms can usually be sampled from the pulmonary arteries (“extremity” pattern) and pulmonary veins. AT = atelectasis;
LU ’ lung.
a 16.3 Obstructive Atelectasis
► Lower lobe atelectasis with
tumor focus
► Lower lobe atelectasis with
obstructive pneumonitis
m-о A 73-year-old man with a cyto-
logically malignant pleural effusion.
m Chest radiograph shows a right-
sided pleural effusion.
n Upper lobe atelectasis with a central
hypoechoic focus. LE - liver; PE pleural
effusion.
о The absence of intralesional flow
signals on color Doppler is consistent
with incipient liquefaction, but a
metastasis cannot be excluded. AT ’
atelectasis; PE = pleural effusion.
Masses 477
p-r Bronchial carcinoma in a 65-year-
old man.
p Chest radiograph shows a white
hemithorax on the left side.
q Ultrasound scan shows homogene-
ous, hypoechoic transformation of the
left lower lobe consistent with ob-
structive atelectasis. AT =• atelectasis;
D = diaphragm.
r Scan shows a rounded, hypoechoic,
partially air-filled mass within the ate-
lectasis in the upper lobe, consistent
with obstructive pneumonitis.
► Pulmonary Embolism or Infarction
The results of autopsy studies prove that pul-
monary embolism is among the leading causes
of death (10-30%}. An intravital diagnosis is
made in just 20-30% of cases. An acute pulmo-
nary embolism is accompanied by hemorrhagic
lung infarction in approximately 45-60% of
cases.
Diagnosis. Pulmonary embolism is diagnosed
with the aid of available methods and includes
an overall assessment of clinical findings, chest
radiography, pulmonary scintigraphy, CT, echo-
cardiography, and MRI.
Role of ultrasound. Although lung tissue that
has undergone hemorrhagic infarction or con-
solidation can in principle be visualized on the
basis of abnormal pulmonary sound transmis-
sion, the role of thoracic ultrasound in the di-
agnosis of pulmonary infarction cannot be ad-
equately evaluated at present3’ 5. For a pulmo-
nary embolism to be detectable with ultra-
sound, there must be a significant perfusion
defect causing compromise of alveolar ventila-
tion. But in many cases a large pulmonary em-
bolism involving pulmonary, lobar and seg-
mental arteries will not produce an infarction
owing to an adequate collateral supply, usually
via branches of the bronchial rami (Fig. 16.4).
This type of embolism cannot be visualized
with thoracic ultrasound (s 16.4a-c). Embo-
lisms at the subsegmental level are more apt
to cause hemorrhage into the alveolar airspace,
making them accessible to ultrasound imaging.
Thus, thoracic ultrasound has a special role
in the diagnosis of small, scintigraphically neg-
ative embolisms and infarctions that are 2 cm
or less in diameter.
Whereas the hemorrhage associated with
pulmonary embolism may resolve completely
within a matter of days, a pulmonary infarction
will show delayed regression in serial ultra-
sound examinations. Generally these lesions
heal by scarring.
Sonographic features. Pulmonary embo-
lism can have various ultrasound appearances
(B 16.5). All possible patterns of involvement
may be associated with varying degrees of
pleural effusion.
Localized irregular entry echo. Irregular entry
echoes are a common finding even in patients
with deep lower-extremity venous thrombosis
who are clinically asymptomatic for pulmonary
embolism ("sentinel emboli?”). Irregular entry
echo refers to a localized disruption in the
sharp pleural line measuring less than 2 cm.
The foci may be in the millimeter size range.
They may have a wedge or square shape with
homogeneous low echogenicity. They may rep-
resent hemorrhages and may resolve within a
few days. Frequently, no clinical or scinti-
graphic correlate is found to explain the sono-
graphic change (a 16.4d-i).
Bandlike disruption of the entry echo. This
feature is characterized by a lengthy disruption
in the normal pleural entry echo. It is less com-
mon than a localized disruption and frequently
has a scintigraphic correlate ("tip of the ice-
berg”?) (a I6.4j-o).
Wedge-shaped lesion. The classic wedge-
shaped morphology of a pulmonary infarction
with homogeneous low echogenicity and an
absence of vascular color-flow signals in the
infarcted area is rather uncommon. In serial
examinations, these infarctions often show a
gradual tendency to regress over a period of
weeks (a 16.5a-k).
Larger areas of structural transformation.
Relatively large areas of hypoechoic transfor-
mation in the lung are often associated with a
pleural effusion and are considered a nonspe-
cific feature of pulmonary embolism in thoracic
ultrasound. The concomitant detection of a
16 Lung 478
a Fig. 16.4 Schematic diagram showing the occlusion of a pulmonary artery.
a Central pulmonary artery.
Perfusion scanning
UCC
Pulmonary angiography
Pulmonary Lobar Segmental Sub- Subsub-
artery artery artery segment- segment-
al artery al artery
a b Peripheral pulmonary artery.
deep lower-extremity venous thrombosis or of
irregular entry echoes in the otherwise nor-
mal-appearing opposite lung suggests the like-
lihood of pulmonary embolism when corre-
sponding clinical findings are present
(S 16.41-q). Large areas of structural transfor-
mation are also seen, however, in association
with pleuropneumonia and compression ate-
lectasis due to other causes.
Color Doppler ultrasound. Color-flow signals
are usually not detected in the infarcted area.
In rare cases an afferent vessel may be demon-
strated.
The definitive role of thoracic ultrasound in
the diagnosis of pulmonary embolism remains
to be determined. However, it is superior to all
other modalities for selected applications, par-
ticularly the detection of smaller pulmonary
embolisms (Fig.16.5)3.
ICA = intercostal artery, pBA = peripheral bronchtal artery. TN = tumor neoangiogenesis,
cBA= central bronchia! artery, PA= pulmonat artery
a Fig. 16.5 Role of ultrasound in the diagnosis of pul-
monary embolism (after reference 3) (UCG = echo-
cardiography).
E 16.4 The Entry Echo in Pulmonary Embolism
► Normal entry echo vs. localized
irregularity
c Ultrasound shows a completely nor-
mal. sharp pleural entry echo along
segments 2/3 of the right lung (LU).
a-c Suspected pulmonary embolism
in a 64-year-old man.
a and b Lung scintiscans. The findings in segments 2 and 3 of the right upper lobe
are consistent with pulmonary embolism.
в 76.4 The Entry Echo in Pulmonary Embolism
► Normal entry echo vs. localized
irregularity
f after 9 weeks.
Masses 479
d-f A 72-year-old woman with pul-
monary embolism confirmed by scin-
tigraphy.
d Radiograph shows no lung abnor-
malities.
e Small foci approximately 5 mm in size
are visible over both lower lung fields,
consistent with pulmonary embolism.
g-i A 65-year-old man with scintigraphically confirmed pulmonary embolism. Left anterior intercostal scan shows an ap-
proximately 1.5 cm pleural defect. Scans taken after one and four weeks document cicatricial healing. These findings are
consistent with pulmonary infarction.
► Extended disruption of the
entry echo
j-l Scintigraphically confirmed pulmo-
nary embolism in a 46-year-old woman.
j Chest radiograph shows no lung ab-
normalities.
к Extended irregular entry echo, con-
sistent with pulmonary embolism.
LU = lung
I Normal pleural entry echo for com-
parison. LU = lung.
m-o Pulmonary embolism in an 80-
уеаг-old woman.
m CT shows thrombotic material in the
right pulmonary artery.
n and о Ultrasound scans through different intercostal spaces show variable pleural
structural defects in the posterior part of the right lower lung field.
LU = lung; S = spleen.
0 16.5 Wedge-shaped Lesions and More Diffuse Areas of Structural Transformation due to Pulmonary Embolism
► Wedge-shaped lesion
16 Lung 480
a and b Scintigraphically confirmed
pulmonary embolism in a 71-year-old
woman.
a Chest radiograph shows opacity in
the left lower lung field.
b Left lateral intercostal scan shows a
wedge-shaped hypoechoic lesion. Color
Doppler shows afferent flow signals but
none within the lesion. The finding is
suspicious for pulmonary infarction.
► Postinfarction pneumonia
c-h Scintigraphically confirmed pul- d and e Radiographs at four and eight weeks document regression of findings in the
monary embolism in a 34-year-old right lower field.
man.
c-e Chest radiographs show the progression of a pulmonary embolism in the right lower lobe.
c Initial radiograph shows no abnormalities.
f-h Right lateral intercostal scans in postinfarction pneumonia show the progression of sonographic findings over a four-week
period.
► Hypoechoic transformation
i-k Pulmonary embolism in a 56-
year-old man.
/ CT shows thrombotic material in the
right pulmonary artery.
j Hypoechoic transformation of lung
parenchyma.
к Color Doppler does not record flow
signals consistent with pulmonary in-
farction.
В 16.5 Wedge-shaped Lesions and More Diffuse Areas of Structural Transformation due to Pulmonary Embolism
► Diffuse hypoechoic transfor-
mation
Masses 481
l-q Scintigraphically confirmed pulmonary embolism in a 30-year-old man.
l-n Left lateral intercostal scan shows a large area of hypoechoic transformation with moderate pleural effusion (PE). Scans
through different intercostal spaces on the right side show pleural structural defects. Given the bilateral findings, the
parenchymal defect on the left side is also very suspicious for postinfarction pneumonia. LE = liver; LU - lung; SP = spleen.
о Chest radiograph. The costophrenic
angle is not defined at the edge of the
lower left field.
p Follow-up radiograph shows consol-
idation in that region.
Rnterioi
q Left-sided pulmonary embolism on
scintigraphy.
► Pulmonary Tumors and Metastases__________________________________________________________
Sonography is the method of choice for accu-
rately determining local tumor spread and
should be performed before any proposed sur-
gical treatment. The most frequent causative
lesions are non-small-cell bronchial carcinomas.
Sonographic features. Peripheral lung tumors
and metastases can be defined sonographically
as solid hypoechoic masses when they extend
to the visceral or parietal pleura (B 6.6a-f).
Tumor invasion of the chest wall can be
diagnosed by noting fixation of the lesion to
the chest wall during respiratory excursions
(see Fig.15.8; see also Chapter 15, p.449)
(B 16.6g-i). Structural nonhomogeneities in
the tumor may be due to necrosis (Table 16.4,
В 16.6j-l). Most tumors are sharply demar-
cated from surrounding hyperechoic lung.
Color Doppler ultrasound. In the sonographic
diagnosis of lung tumors and metastases, it
should be considered that complete segmental
Table 16.4 Possible sonographic findings associated with peripheral lung tumors
В-mode ultrasound
► Usually shows homogeneous, hypoechoic transformation of lung tissue
► Sharply demarcated from aerated lung
► No air bronchogram
► Occasional central necrosis
Color Doppler ultrasound
► Decreased color flow in relation to the liver
► Waveforms from tumor vessels often show high diastolicflow (“parenchymal artery” pattern)
consolidation due to pneumonia or atelectasis
may also show homogeneous low echogenicity.
Atelectatic areas show increased vascular flow
signals in color Doppler, however. Tumors are
often characterized by a scant number of ves-
sels, which are often seen in the peripheral part
of the lesion (В 16.6e, г-u). An exception is
alveolar cell carcinoma, which is conspicuous
at color Doppler by its hypervascularity
(B 16.6 m-q).
Table 16.4 lists the sonographic findings that
are most commonly associated with peripheral
lung tumors.
Ultrasound-guided percutaneous biopsy. Pe-
ripheral lung tumors and metastases can be
safely punctured under ultrasound guidance.
With larger lesions, tissue should be sampled
from areas that exhibit color-flow vascularity.
Ultrasound-guided percutaneous biopsy is par-
ticularly indicated for masses at the pleural
apex (Pancoast tumors), which are difficult to
biopsy by bronchoscopy.
н 16.6 Pulmonary Tumors and Metastases
16 Lung 482
► Tumor movement with
respiration
a-c The absence (a, b) or presence (c) of peripheral lung tumor (M) fixation to the parietal pleura can be determined by
watching for tumor movement during respiration.
► Adhesion to the chest wall
f CT: peripheral tumor mass.
► Infiltration of the chest wall
d-f Bronchial carcinoma in a 72-year-
old man.
d An area of lung tissue showing ho-
mogeneous hypoechoic transformation
is adherent to the chest wall. TU = tumor.
e Color flow is seen only at the pe-
riphery of the tumor (TU).
g-i Malignant lymphoma in a 70-
уеаг-old man.
g Chest radiograph shows diffuse
opacity in the lower right lung.
h Right anterior scan angled caudally
shows a predominantly hypoechoic le-
sion infiltrating the chest wall. The ribs
are engulfed by tumor (TU) but are not
destroyed. S - acoustic shadows.
i CT: tumor mass infiltrating the chest
wall.
► Necrosis
I CT: thoracic tumor mass.
j-l Malignant histiocytoma in an 85-year-old man.
j and к Scans through different intercostal spaces on the left side show a complex
tumor mass (TU) with signs of calcification and necrosis (N). S = acoustic shadow;
COR = heart.
s 16.6 Pulmonary Tumors and Metastases
► Bronchoalveolar carcinoma
о CT: lung consolidation with a positive
air bronchogram.
Masses 483
m-o Bronchoalveolar carcinoma in an
83-year-old man.
m Chest radiograph shows diffuse
opacity in the right middle and upper
zones.
n Right lateral intercostal scan shows a
nonhomogeneous hypoechoic lung re-
gion with irregular margins. The tumor
shows a positive air bronchogram.
► Color Doppler findings in
bronchoalveolar carcinoma
p and q Bronchoalveolar carcinoma in a
53-year-old woman.
p Chest radiograph shows diffuse
shadowing in the left middle and upper
zones.
q Homogeneous hypoechoic transfor-
mation of lung tissue. Color Doppler
records prominent flow signals in the
tumor.
г-u Bronchial carcinoma in a 77-year-
old man.
r Chest radiograph shows diffuse
shadowing in the right midzone.
► High diastolic flow in color
Doppler
s—u Hypoechoic tumor mass (TU) in a right lateral intercostal scan. Color Doppler waveforms are recorded at the tumor
periphery. The high diastolic flow (“parenchymal artery" pattern) is characteristic of tumor vessels. LU = lung.
Complex Masses___________________________________________________
Lung
► Pneumonia
► Lung Abscess
Table 16.5 Differential diagnosis of complex masses
Common
Pneumonia
Lung abscess
Less common
Liquefying tumor
Liquefying atelectasis
Compression atelectasis
► Pneumonia_______________________________________________________________________
16 Lung 484
Ultrasound is of limited value in the diagnosis
of pneumonia (S 16.7). It can show a more or
less pronounced replacement of alveolar air,
depending on the degree of pneumonic
changes (B 16.7a-c). But the majority of in-
flammatory lung changes (especially central
and interstitial) cannot be visualized with ul-
trasound (E 16J7d-h). Table 16.6 reviews the
sonographic findings that may be seen in pneu-
monia.
Lobar pneumonia. True lobar pneumonia pro-
duces a homogeneous, hypoechoic structural
transformation in its early stage. The echo tex-
ture of affected lung resembles that of the liver
(B 16.7i,j). Color Doppler shows increased
vascular color-flow signals in the infiltrated
lung area (e 16.7 m-q; в 16.8c). Aerated bron-
chi may appear as prominent echogenic bands,
similar to the bronchogram seen on radio-
graphs (E 16.71). They may have a branched,
string-of-beads appearance or may present as
focal echogenic zones with irregular margins.
The consolidated areas are usually irregular but
may show segmental boundaries. The healing
stage is marked by reaeration with an increase
in echogenicity. Concomitant effusion is often
present. The complication of cavitating pneu-
monia usually appears as a hypoechoic to an-
echoic area within the consolidated lung
(B 16.8).
Ultrasound is not a substitute for chest ra-
diography in pneumonia, but it is helpful as a
follow-up study in detecting complications, re-
ducing radiation exposure, and advancing the
differential diagnosis (Table 16.5)2.
Table 16.6 Possible sonographic findings in pneumonia
В-mode ultrasound
► Frequent hypoechoic transformation of lung tissue
► Tends to be poorly demarcated from aerated lung
► Frequent positive air bronchogram
► Aeration often increases during inspiration
► Possible concomitant effusion
Color Doppler ultrasound
► Increased color flow in relation to the liver
► Triphasic Doppler spectrum of pulmonary artery waveforms (“extremity artery” pattern)
Pleuropneumonia, pleurisy. A continuum ex-
ists between pleuropneumonia and pleurisy.
The latter appears sonographically as a break
in the sharp pleural line, usually combined
with pleural effusion. The parenchymal defects
that can be defined with ultrasound are often
smaller than 1 cm and cannot be detected ra-
diographically in the absence of pleural effu-
sion. When combined with physical examina-
tion, ultrasonography is the method of choice
in the diagnosis of pleurisy.
в 16.7 Interstitial and Lobar Pneumonia
► Air bronchogram
a-c Types of air bronchogram that may
be seen in pneumonia. The pattern of
air echoes depends partly on the course
of the pneumonia.
a Branched air bronchogram.
b Patchy air bronchogram.
c Diffuse air bronchogram. LU = lung;
S « spleen.
► Interstitial Pneumonia
d-f Bronchial carcinoma and intersti-
tial pneumonia in a 60-year-old man.
d The pleural line is fragmented with
partial sound transmission in the lung
tissue.
e Posterior scan through the lowest
intercostal space on the right side (for
comparison) demonstrates a normal
pleural line.
f CT: interstitial pneumonia.
В 16.7 Interstitial and Lobar Pneumonia
► Interstitial Pneumonia
h CT: interstitial pneumonia.
Masses 485
► Lobar pneumonia
g and h Interstitial pneumonia in a
20-year-old woman.
g Ultrasound shows slight disruption of
the pleural line; partial sound trans-
mission in the lung tissue.
I and j Early form of lobar pneumonia.
i Chest radiograph shows opacity in the
lower left lung field.
j Left posterior intercostal scan shows a
largely homogeneous hypoechoic
transformation of lung tissue.
k-q Pneumonia in a 73-year-old man.
к Chest radiograph shows opacity in
the lower right lung field.
I Hypoechoic transformation of lung
tissue. A branched air bronchogram is
seen in the magnified view.
m and n Color Doppler image defines the course of blood vessels along the
bronchial system. LA - lung artery; LV = lung vein; BR = air bronchogram.
o~q The pulmonary artery (p) and pulmonary vein (q) can be identified by their color-flow image and spectral waveforms.
LU = lung; LV = lung vein.
0 16.8 Complications of Pneumonia
► Accompanying effusion
16 Lung 486
a-f Pneumonia in a 31-year-old man.
a Chest radiograph shows diffuse
shadowing in the area of the right
costophrenic angle.
b Right lateral intercostal scan shows a
small effusion and a triangular area of
hypoechoic lung tissue. A subtle,
speckled air bronchogram is present.
c Prominent flow signals are observed
with color Doppler.
► Liquid contents
d-f Serial scans document progressive aeration over a three-week period. A small fluid collection persisted as a complication
(still visible at 21 days).
► Liquefaction
g and h Pneumonia in a 72-year-old
man.
g Pleural effusion (PE) and a wedge-
shaped area of complex lung transfor-
mation. LE = liver; LU = lung.
h Color Doppler shows peripheral flow
signals. The central echo-free structure
is an area of cavitating pneumonia.
i Open pulmonary tuberculosis in a 60-
year-old man. Ultrasound scans show
hypoechoic transformation of periph-
eral lung tissue. The echo-free round
lesion with a central air echo in the lung
parenchyma (arrow) is caused by
liquefaction.
► Lung Abscess_______________________________________________________________________________
Lung abscesses do not have a specific ultra-
sound appearance. They tend to be hypoechoic
but, like abdominal abscesses, can have a vari-
able internal echo pattern (Table 16.7,
0 16.9a-f). Small air inclusions are evidence of
gas-forming microorganisms. Larger air collec-
tions form as a result of bronchogenic fistulae.
It can be difficult to distinguish lung abscess
from a pleural empyema (0 16.9g-i). The in-
flammatory perifocal reaction to lung ab-
scesses bordering the pleura generally incites
a local adhesion of the visceral and parietal
pleura layers with corresponding fixation of
the mass. This creates a more or less conspic-
uous hyperechoic boundary comprising the ab-
scess membrane. Sedimentation effects may be
seen if the abscess contains acoustic reflectors
(sequestra, cellular debris).
Ultrasound-guided fine-needle aspiration is
useful for confirming the diagnosis, sampling
material, and decompressing the abscess
Table 16.7 Possible sonographic findings in lung abscess/empyema
В-mode ultrasound
► Complex transformation of lung tissue
► Sharply demarcated from aerated lung
► Mass shows echogenic rim
► Possible intralesional air inclusions and moving echoes (liquefaction)
Color Doppler ultrasound
► No color-flow signals
(0 16.9d-f). Catheter drainage is recommen-
ded for abscesses that persist or cannot be de-
compressed with a thin needle (viscous con-
tents).
Е 16.9 Lung Abscess
► Pleural empyema
Masses 487
а-d Septic lung abscesses in a 54-
уеаг-old man.
a Chest radiograph shows multiple
pulmonary nodules.
b Ultrasound shows a homogeneous
hypoechoic peripheral lung mass (LU).
c Color Doppler shows flow signals only
at the periphery of the mass (Tu). An
abscess was diagnosed by ultrasound-
guided core biopsy (which yielded
streptococci).
d-f Patient with bronchial carcinoma
and septic temperatures.
d Chest radiograph shows diffuse opa-
cification of the left lung.
e Loculated pleural effusion and com-
plete lower lobe atelectasis (AT) with a
central hypoechoic area of retained
fluid. M e spleen.
f Diagnostic needle aspiration yielded
purulent fluid consistent with a lung
abscess. The arrow indicates the needle
tip echo.
g-i Differential diagnosis: pleural
empyema.
g Chest radiograph shows a large
opacity bordering the chest wall on the
left side.
h Scan at a higher level shows bright air
echoes in the upper part of the mass.
i The lower part of the lesion contains
echogenic material. The margins of the
lesion are relatively smooth.
References 5.
1. Blank W. Sonographisch gesteuerte Punktionen
und Drainagen. In: Braun G, Schwerk WB (eds.).
Ultraschalldiagnostik. Landsberg: ECO-Med 1994, 6.
III.II. .5-12.
2. Gehmacher O. Ultrasound pictures of pneumonia.
EJR 1996;3:161-7.
3. Kroschel U, Seitz K, Reul? J, Rettenmeier. Sonog- у
raphische Darstellung von Lungenembolien. Er-
gebnisse einer prospektiven Studie. Ultraschall in
Med 1991;12:263-8.
4. Mathis G. Lungen- und Pleurasonographie. 2nd
ed. Berlin: Springer 1996.
Mathis G, Dirschmid K. Pulmonary infarction:
sonographic appearance with pathologic corre-
lation. EJR 1993;17:170-4.
Schwerk WB, Gorg C. Pleura und Lunge. In: Braun
G, Schwerk WB (eds.). Ultraschalldiagnostik.
Landsberg: ECO-Med 1993,12.Erg.Lfg. Ill
2.2.,1-43.
Yang PC. Color Doppler ultrasound of pulmonary
consolidation. EJR 1996;3:169-78.
Gorg C, Seifart U, Gorg K, Zugmaier G. Color
Doppler sonographic mapping of pulmonary le-
sions: evidence of dual arterial supply by spectral
analysis J Ultrasound Med 2003:22(10): 1033-39.
9. Gorg C, Seifart U, Holzinger I, Wolf M, Zugmaier G.
Bronchioloalveolar carcinoma: sonographic pat-
tern of'pneumonia.' Eur J Ultrasound
2002;15(3):109-17.
10. Gorg C, Bert T. Transcutaneous color Doppler so-
nography of lung consolidations: review and
pictorial essay. Ultraschall Med
2004;25(3):221-6.
Index
A
abdomen
acute 47
wall hernia 240
see also lymph nodes, abdominal
abdominal aorta 3-4
aneurysms 10
intraperitoneal branches, duplicated/
variant 6-7
retroperitoneal branches 3
duplicated/variant 6-7
splanchnic branches 3-4
abortion, incomplete/missed 398
abscess
adrenal 320
aortic 23
diverticulitis 238-239
epididymis 384
gallbladder 125, 126
gas 266
intra-abdominal 264
liver 77, 78, 83. 263
amebic 78
cholangitis 115
gas formation 96
hyperechoic 93
lung 472, 473, 483, 486-487
pancreas 154,156
perirenal 302
prostate 372
renal 299, 302, 305, 307, 309, 344
seminal vesicles 377
spleen 183,188-190
testes 382
thyroid gland 431, 435
tuberculous 454
abscess drain, basket 95
accessory duct of Santorini 159
acromegaly
goiter 423
kidneys 283
Addison disease 319
adnexal mass, inflammatory 408
adrenal glands
abscess 320
adenoma 321
adjacent masses 319
anatomy 317
anechoic structure 318-320
calcification 326
carcinoma 322, 325
complex echo structure 324-325
cysts 319
disease 318
enlargement 318-327
hematoma 319
hemorrhage 319
hyperechoic structure 325-327
hyperplasia 320
hypoechoic structure 320-324
incidentaloma 318, 322-324
lipoma 326
lymphoma 322
mass 216
metastases 321, 324, 326
morphology 318
myelolipoma 326
neuroblastoma 327
pheochromocytoma 325, 327
topography 317
tumors 321-324, 326-327
cystic 320
aerobilia 96
AIDS-induced nephropathy 286
albendazole 79
amebic fiver abscess 78
amiodarone 424, 428
amyloidosis
asplenia 180, 181
bowel 243
kidneys 286, 294
liver 69
spleen benign nonhomogeneity 176,177
thyroid 423
analgesic nephropathy 288, 292, 293, 295
calcifications 312
androblastomas 411
aneurysms
hepatic artery 214
nonaortic 10
renal arteries 300
see also aorta, aneurysms
angiography, focal liver lesion differential
diagnosis 99
anorchism 381
antibiotics, pseudomembranous entero-
colitis 244
aorta
abscess 23
anatomy 3-4
aneurysms 7-10
chest wall 457, 472, 474
congenital 8
diagnosis 10
dissecting 8,10
false 8, 10, 22
intimal dissection 21
morphology 10
mycotic 8
pleural effusion differential diagnosis 457,
463-464
rupture 8
shape 8-9
suture-line 23
thoracic 10
true 7-10
vena cava compression 32
white thrombi 18,21
anomalies 5-16
aplasia 5
coarctation 5-6,11
complex arteriosclerotic lesions 17,18
course 3, 4
dilatation 7-10
duplication 5
ectasia 7
embolism 14-15,20
hematoma 23
horseshoe kidney 24
hypoplasia 5
intestinal loop differential diagnosis 24
intimal dissection 21
kinking 6
lumen diameter 3, 4
lymphoma 24
metastases 24
microanatomy 3
protruding arteriosclerotic plaque 20
pseudoaneurysms 8, 10, 22
retroperitoneal fibrosis 24
situs inversus 5
stenosis 11
topography 3-4
variant positions 5-7
wall thickening 16-19
see also abdominal aorta
aortic valve endocarditis 183
appendicitis 239-240
appendix 239
APUD system 436
arcuate arteries 311-312
arterial stenosis 11-14
carcinoma 16
lymphoma 16
severity 13
arteries
embolism 14-15,20
wall thickening 16-19
arteriosclerosis
advanced lesions 17
aortic stenosis 11
complex lesions 17-18
Monckeberg’s 19
protruding lesions 18
protruding plaques 20-21
tortuous aorta 6
arteriovenous fistula 22-23
renal 287
spleen 187, 188
arteriovenous malformations 22-23
intrarenal 300
renal arteries 282
arteritis 18-19
asbestosis 457
diffuse mesothelioma 462
pleural fibrosis 460, 461
ascariasis 113
Aschoff-Rokitansky sinuses 130,132
ascites 235, 254
alcoholic cirrhosis 253
algorithm for differentiation 256
angle of 268
benign 259, 268-269
echogenic 258
enteritis 241
heart failure 257, 266
hepatic cirrhosis 253, 256, 259, 266
malignant 257, 259, 268-269
origin 254-255
pancreatogenous 258
peritoneal carcinomatosis 268
Index 489
Index 490
ascites, peritonitis 257
septated 263
small bowel obstruction 271
volume 254
aspergilloma 473
asplenia, functional 180-181
atelectasis 473, 474-477
bronchial carcinoma 487
complete 475
compressive 474, 475
lower lobe 476, 477
middle lobe 476
obstructive 474, 475, 476-477
partial 475
upper lobe 476
atheroma 17
atherosclerosis 16-19
WHO definition 16
atherosclerotic plaque 17
axillary lymph nodes 200, 203, 210-212
chronic lymphocytic leukemia 208
В
Baker’s cyst 27
Basedow hyperthyroidism, immuno-
genic 421-422
autonomously functioning nodules 443
focal autonomy 443, 445
bezoars, small intestine 238
bile duct
adenocarcinoma 111
calculi 95, 109-110
common 103
prepancreatic 116
congestion 116
dilatation 107-108, 168
cholestasis 116-117
hilar 109-110
intrahepatic 108-109
intrapancreatic 111
papillary 112
prepancreatic 109-110
dilated 87, 89
disorders 166
extrahepatic dilated 117
foreign bodies 112-113
gas pockets 95
hamartoma 92
hyperechoic 94
intraductal pressure 107-108
intrahepatic dilated 117
intraluminal findings 112-114
isoechoic 89
malignant tumors 110
obstruction 107,108
benign 109-110
inflammatory 109
rarefaction 106-108
stenosis
cicatricial 110
intrapancreatic 157
stents 112-113
wall thickening 105-106, 115
benign 105-106
malignant 106
bile leakage 260
biliary colic 339
biliary papillomatosis, mucinous 106
biliary tree
anatomy 103-104
diameter 114
extrahepatic 103, 104
hepatocellular carcinoma 110
intrahepatic 102,103
morphology 103,104
obstruction 114
pressure 114
topography 103,104
bilioenteric anastomosis 110
bilioma 77, 264
bone marrow transplantation, asplenia 180,
181
breast cancer
adrenal metastases 326
chest wall cutaneous metastases 454
metastases 60, 74, 82,176
lymph nodes 211
pleural carcinomatosis 459
Brenner tumor 410
bronchial carcinoma 455
adrenal metastases 324, 326
atelectasis 475, 476, 477
chest wall
adhesion 482
cutaneous metastases 454
interstitial pneumonia 484
metastases
adrenal 324, 326
cutaneous 454
pleural effusion 466
sternal 453
opacification of hemithorax 473
peripheral 457
pleural effusion 465
loculated 472
pleural empyema 487
pneumonectomy 467
bronchoalveolar carcinoma 483
Budd-Chiari syndrome 31-32, 42, 43
diagnosis 62
bypass graft, infection/suture-hne break-
down 23
C
calcitonin 417
calcium soap 162
Campylobacter jejuni 241
candidiasis, splenic 189, 190
carcinoid tumor, hepatic metastases 97
carcinomatosis
peritoneal 233, 235, 257-259, 263, 267-269
ovarian carcinoma 408
pleural 459-460
cardiac cavity 472
cardiac cirrhosis 63
parenchyma 73
portal flow 37
cardiac congestion 26
cardiac insufficiency 63
cardiomegaly 464. 472
Caroli disease 57, 70, 95
carotid arteries
complex arteriosclerotic lesions 18
stenosis 13,16
stents 16
carotid artery, common 418, 419
intima-media thickness 4
celiac axis
pancreatic carcinoma invasion 16
stenosis 11,12
variants 6
celiac disease 242
cervical lymph nodes 203
lymphoma, malignant 209
metastases 203
cervical lymphadenopathy 207
cervicitis 400
cervix sign 231
chemotherapy, liver parenchyma 75
chest wall
anatomy 449
carcinoma 455
cutaneous metastases 453-454
lung tumor adhesion 482
lymphoma 482
masses 451-455
differential diagnosis 451
metastases 473
cutaneous 453-454
morphology 449-450
necrosis 482
topography 449
tumor infiltration 482
chickenpox, spleen sepsis 191
cholangiectasis, prepancreatic 104,116
cholangiocarcinoma
bile duct dilatation 109,110,117
intraductal spread 106
cholangiocellular carcinoma 105
cholangiofibroma 91
cholangiofibromatosis 57
cholangitis
liver abscess 115
primary sclerosing 105,106
pyogenic 263
suppurative 105,106
cholecystectomy, post-surgery status 137
cholecystic empyema 125,126
cholecystitis 123
acalculous 126
acute 125-127
calculous 127
chronic 126,127-128
gallbladder carcinoma 133
emphysematous 126
gallbladder carcinoma differential
diagnosis 133
phlegmonous 125,126
xanthogranulomatous 126
cholecystolithiasis 123,139, 260
choleperitoneum 260
cholestasis
differential diagnosis 114-117
parenchymatous 115-116
sonographic 116-117
cholesteatosis 130
cholesterol
gallbladder deposits 130
gallbladder pseudopolyps 131,132
gallbladder sludge 134,135,136
gallstones 134,135
chorioepithelioma 405
chorionic cavity 397
chronic lymphocytic leukemia
axillary lymph nodes 208
lymph nodes 201
spleen 194
splenomegaly 180
chronic myelocytic leukemia, spleno-
megaly 177, 179-180
chyloperitoneum 261
chylothorax, pleuial effusion differential
diagnosis 464
cirrhosis see hepatic cirrhosis
clips, surgical 113
colic arteries, stenosis 11
colitis, ischemic 243-244
collagen disease, spleen benign non-
homogeneity 176
colon 225-226, 227
coprostasis 247
Crohn's disease 242
diverticula 238
haustra 227
morphology 226
polyps 237
colon cancer 44
carcinoma 236
hepatic metastases 88
peritoneal carcinomatosis 259, 269
splenic metastases 192
comet-tail artifacts 94
computed tomography (CT), focal liver lesion
differential diagnosis 99
confetti phenomenon 20,161
congenital malformations
arteriovenous 22-23, 282, 300
inferior vena cava 25, 26
coprostasis 247
corpus luteum cysts 405
critical stenosis 13
Crohn’s disease 105, 242-243
complications 243
intussusception 237
urinary bladder wall hypertrophy 360
cryptorchidism 381
Cushing syndrome 320
cystic duct obstruction 123
cystic fibrosis 149
cytomegalovirus (CMV) hepatitis 77
D
de Quervain thyroiditis
focal 435
subacute 422
diabetes mellitus
autoimmune pancreatitis 146
autoimmune thyroiditis 424, 425
chronic pancreatitis 168
confetti phenomenon 20
fatty liver 65
large gallbladder 122
Monckeberg's arteriosclerosis 19
renal abscess 299
renal structural changes 294
diabetic foot, neuroischemic 14
diabetic glomerulosclerosis 290
diabetic nephropathy 283-284, 288-289,
290-292
calcifications 312
histopathology 292
stages 292
diaphragm
liver incisures 93
morphology 449-450
diverticula 238
diverticulitis 238-239
diverticulosis 238-239
diverticulum, perforated 231
double-barrel shotgun sign 103,107,116
Douglas pouch 253, 254, 255
dromedary hump, renal 301
ductus hepatocholedochus 103
duodenal diverticulum, periampullary 112
duodenal ulcer 253
perforated 265
duodenum
gut signature 227
morphology 226
stenosis 160, 270
E
Echinococcus cysticus 184
Echinococcus granulosus 79-80,184, 297
Echinococcus multilocularis 98, 297
endometriosis, ovarian 407
endometritis 400
endometrium 392, 393
changes 398-401
corpus carcinoma 400-401
cyclic changes 399
hyperplasia 409
adenomatous/cystic glandular 399
pathology 399
polyps 398
proliferative 399
thickness 399
enteritis 241
intestinal inflammation 245
enterocolitis 241
pseudomembranous 244
epididymis
abscess 384
anatomy 379
cyst 383-384
decreased size 381
lesions 383-384
topography 379
epididymitis 384
erysipelas 201, 202
esophageal cancer
lymph node invasion 203
metastases 91
thyroid gland metastases 437
esophageal varices 39, 40, 43
esophagus 225
morphology 226
fallopian tubes
blood in 390
carcinoma 402
hypoechoic mass 402-403
pregnancy 403
tumors 402
fat, peripancreatic 144,145
femoral arteries
arteriovenous fistula 22
complex protruding lesions 20
embolism 15
pseudoaneuiysms 10
stenosis 13-14
femoral veins
incompetence 28
thrombosis 29, 30
venous valves 31
fibrin 257, 258, 259
fluttering strands 267
pleural bodies 457, 458
pleural effusion 464, 467
fibrothorax 467
fine-needle aspiration, adrenal glands 323
fistula, arteriovenous 22-23
flow velocity, diabetic foot 14
focal nodular hyperplasia, hepatic 84, 85,
87-88,92
diagnosis 99
follicular cysts 404
foreign bodies
bile duct 112-113
bowel 247
hepatic 95
urinary bladder 358
uterine 396-397
Index 491
gallbladder
abscess 125,126
acute hepatitis 69
adenoma 131,132
adenomyomatosis 130,132
agenesis 123, 137
anatomy 119-120
atrophic calculous 138
atrophy 123, 124,125
carcinoma 110,130,133
liver parenchyma 74
cholesterol pseudopolyps 131,132
color-flow duplex scanning 129
comet-tail artifacts 130
cystic duct 119,120
doubling 121
flaccid 122
fluid level 123,124
hemobilia 136
hepatic cirrhosis 73
hepatized 89
hydrops 122,123
hypoplasia 123
intrahepatic 123
intraluminal changes 134-136
isoechogenicity with surrounding
tissue 138-139
Index 492
gallbladder, kinking 121
large 122
malformation 121
malposition 139
metastases 133
missing 123-125, 137
nonvisualized 137-139
obscured 137-139
papilloma 131,132
perforation 125,126
cholehthic 127-128
polyps 131
porcelain 128,129
pseudopolyps 131,132
pseudotumor 136
septations 121
shape variants 119,121
size 119
change 122-123
sludge 122,134,135, 136, 138
small 123-125
stomach impression 234
strawberry 130
topography 120
torsion 121
tumors 129-133
infiltration 138
wall
changes 125-133
differential diagnosis of change 127
focal hyper-/hypo-echogenicity 128-129
hyperechogenicity 127-128
hypoechogenicity 125-127
inflammation 128-129
thickening 126,127
thickness 119,124,125
varicosity 129
gallstones 134-136
bile duct obstruction 109-110
cholelithic perforation 127-128
cholesterol 134,135
composition 134
cystic duct obstruction 123
differential diagnosis 134, 135
gallbladder
atrophy 124,125
carcinoma 133
intrahepatic bile ducts 95,108,109
microliths 134
small intestine 238
spherocytosis 178
gas abscess 266
gastric antrum tumors 235
see also stomach
gastric artery 6
stenosis 11
gastric outlet obstruction 234, 270
gastric polyps 229
gastric vein, enlarged 39
gastrinoma 155,156
gastritis 232
autoimmune 425
gastroduodenal artery 144,154
gastrointestinal tract
anatomy 225-226
extraluminal fluid 269-271
intraluminal fluid 269-271
morphology 226-228
perforation 261
topography 225-226
tumors
abdominal lymph nodes 206
stromal 229
see also named regions/organs
gastrosplenic ligament 174
genital tract
female 389
see also named organs
giant cell arteritis 18
glomerulonephritis
acute 285, 292
chronic 288-289, 292
glucagonoma 155, 156
goiter 419-420
acromegaly 423
amiodarone-induced 428
de Quervain thyroiditis 422, 435
diffuse colloid 420
diffuse parenchymatous 419-420
lithium-induced 428
nodular 434,441-442
regressive 442
Riedel 422
see also Basedow hyperthyroidism,
immunogenic; Hashimoto thyroiditis
gonorrhea
epididymitis 384
prostatitis 370
grafts, synthetic 19
graft-versus-host disease, asplenia 180,181
granulomatous disease, spleen benign
nonhomogeneity 176
granulomatous prostatitis 370
Graves disease 421-422
groin lymph nodes 210-212
gut signature 227
criteria 226, 228
morphology 226
ulcerative colitis 243
H
halo sign 81
Hashimoto thyroiditis 420, 443
autoimmune 420
atrophic 423-424
hypertrophic 420
Hashimoto-type autoimmune thyroiditis 423
head/neck lymph nodes 200, 207-210
heart failure
gallbladder changes 124
inferior vena cava congestion 290
peritoneal cavity changes 257
pleural effusion 464
renal congestion 285
right-sided 266
Helicobacter pylori 232
HELPP syndrome 78
hemangiomatosis, splenic 193
hematocele 386
hematocolpos 390
hematological malignancy
spleen 190
splenomegaly 177,179-180
see also chronic lymphocytic leukemia; chronic
myelocytic leukemia
hematometra 390, 397
hematosalpinx 390, 402
hematothorax
pleural effusion differential diagnosis 464
pleuial fibrosis 460
hemihepatectomy 68
hemobilia 110, 136
hemochromatosis 70,146
pancreas 149
hemoperitoneum 258, 260
hepatic acinus 51
see also liver
hepatic artery
aneurysm 214
common 6
hepatic cirrhosis 36
variants 104
hepatic cirrhosis 256
alcoholic 256
ascites 253, 256, 259, 266
atrophic 67
cardiac 68
cholestasis 115-116
diagnosis 62
diagnostic criteria 67
extrahepatic changes 73-74
fatty 65, 66, 68
flow reversal 35
gallbladder changes 124
hepatic artery 36
hepatic surface 55
hepatic vein 59
dilatation 36
liver size 67
parenchymal changes 73-74
inflammatory 56
peritoneum 266
portal vein flow 61
posthepatic 68
splenic mass 183
splenomegaly 179
with spontaneous bacterial peritonitis 259
vascular changes 39
hepatic hilar lymph nodes 38
hepatic lobule 51
hepatic peliosis 79, 80
hepatic segments 52
hepatic veins 54, 58
Budd-Chiari syndrome 31-32
distended 63
engorgement 26
fatty liver hepatitis 65-66
flow profile 37, 58-59, 63
heart failure 257
hepatic cirrhosis 59
inflammatory disease 60
liver congestion 59
rarefied 60
thrombosis 87
veno-occlusive disease 60
hepatitis
acute 69
autoimmune 55, 73
cholestasis 115
chronic 72-73
cytomegalovirus 77
fatty liver 56, 65-66
gallbladder changes 124
inflammatory lymph nodes 124, 213
toxic fatty liver 65, 66
hepatocellular adenoma 83
hepatocellular carcinoma 48, 84, 86, 91
bile duct dilatation 109,110
calcification 95
diagnosis 99
gallbladder infiltration 138
hepatic vein infiltration 60
hyperechoic 92
irregular mass 97
isoechoic 88
liver parenchyma 74
hepatocytes, iron deposits 70
hepatoduodenal stents 112,113
hepatopetal flow 37
hepatosteatosis 59
hernia, abdominal wall 240
heroin-induced nephropathy 286
hilar artery 175
hypoechoic transformation 185,186
hilar sign 202, 203
hilar vein, hypoechoic transformation 185,186
histiocytoma, malignant 482
Hodgkin disease 80
bile duct dilatation 109
chest wall cutaneous metastases 454
lymph nodes 202, 205, 208, 211
spleen 176,185, 186
splenomegaly 180
thyroid gland 435
Horner syndrome 455
hydatid cysts 79-80
alveolar 98
calcification 95
focal nodular hyperplasia differential
diagnosis 85
pancreatic 152
renal 297
spleen 184
hydrocele 385
hydronephrosis 300, 339
sac 336, 340
hymen, imperforate 390
hypercalcemia, pleural calcification 458
hypertension, tortuous aorta 6
hyperthyroidism 428
autonomy 443-445
bifocal autonomy 443, 444
clinical classification 443
differential diagnosis 443-445
disseminated autonomy 443, 444
multifocal autonomy 443, 444
transient 427
unifocal autonomy 443, 444
hypoalbuminemia 124, 257
hypocortisolism 319
hypogonadism 381
hyposplenism, functional 180-181
hypothyroidism 426
amiodarone-induced 428
lithium-induced 428
neonatal 425
radiation-induced 426-427, 429
hysterectomy, vaginal changes 391-392
ileitis, terminal 242
ileocolic valve 227
ileum, morphology 226
ileus 245-246
chronic 227
mechanical 227, 246
paralytic 246
iliac arteries
embolism 15
occlusion 244
stenosis 14
iliac veins, congenital anomalies 26
infections
bacterial
peritonitis 257, 258, 267
prostatitis 370
spleen 178
benign nonhomogeneity 176
urinary tract obstruction 342-343
viral in de Quervain thyroiditis 422
see also abscess
infectious mononucleosis
hepatitis 69
lymph node enlargement 205
splenomegaly 178
inferior vena cava
anatomy 4
cardiac congestion 26
compression 31-32
congenital anomalies 25, 26
congestion 59
heart failure 290
course 4
dilatation 26-28
duplication 25
engorgement 26-27
heart failure 257, 290
hepatic caudate lobe enlargement 31
infiltration 31-32
intraluminal mass 28-30
leiomyoma 43
lumen diameter 4
malignant tumors 32
metastases 32
microanatomy 4, 31, 32
retroperitoneal branches 4
splanchnic branches 4
stenosis 27
thrombosis 27, 29
topography 4
inflammatory bowel disease 105, 242, 243
insulinoma 155,156
interlobar arteries, renal 311-312
intestinal loop 24
intra-abdominal abscess 264
intra-abdominal gas 261-262
intrahepatic block, collaterals 39-42
intraperitoneal fluid
differential diagnosis 255
see also ascites
intraperitoneal lymph nodes 200
intrauterine contraceptive device (IUD)
396-397, 398
infected 400
iodine deficiency 417
J
Jaffe-Lichtenstein dysplasia of bone 453
jejunum 227
morphology 226
jugular vein
internal 418, 419
ectasia 27
thrombosis 30
К
Kerckring’s folds 245, 246, 270-271
kidneys
aberrant vessels 281, 335
abscess 299, 302, 305, 307, 309, 344
acromegaly 283
adenoma 307
agenesis
AIDS-induced nephropathy 286
amyloidosis 286, 294
analgesic nephropathy 288, 293, 295
calcifications 312
anatomy 275
anechoic structure 296-301
angiomyolipoma 310
anomalies 276-282
number/position/rotation 278-280
aplasia 276-277, 283
arcuate arteries 311-312
atrophic 295
bacterial gas bubbles 312
caliceal diverticula 281, 335
caliceal stones 281, 300, 346
caliectasis 335
carbuncles 309
cavities 299
chronic glomerulonephritis 288-289
circumscribed changes 296-313
collecting system anomaly 281
complex structure 307-308
congestion 285
cortex 275
cystic malformation 277-278
cysts 296-297, 319
hemorrhagic 302, 309
lymph 298
parapelvic 305
simple 278
types 278
diabetic nephropathy 283-284, 288-289.
290-292
calcifications 312
diffuse changes 282-296
dromedary hump 301
duplex 278-279, 283, 305. 334
dysplastic cystic 278
echogenic structure 311-313
ectopic 279
fetal lobulation 301
fresh infarcts 302
fusion anomaly 280
heart failure 290
hematoma 300, 303, 308
heroin-induced nephropathy 286
horseshoe 24, 280
hydrocalices 300-301
Index 493
Index 494
kidneys, hyperechoic structure 290-295,
309-311
hyperperfusion 291
hypoechoic structure 289-290, 301-307
hypoplasia 276-277, 277, 287
hypoxemic shock 290
infected obstruction 305
interlobar arteries 311-312
intracystic carcinoma 286
intracystic hemorrhage 308
irregular structure 295-296
isoechoic structure 301-307
large 282-287
light-chain deposition disease 294
lymphoma 306, 308
infiltration 294
malformations 276-282
malrotation 280
medulla 275
calcification 311
medullary pyramids 275, 284, 289, 299
medullary sponge 278, 300
megacalices 335-336
megacalicosis 281, 335
metabolic disorders 294
metastases 306
nephrocalcinosis 300, 312
papillary calcification 311
papillary necrosis 299
paraprotein 286
parenchymal calcification 312
parenchymal notching 310-311
parenchymal-pelvic ratio 283
pelvis
dilated 336-344
hypoechoic mass 344-345
mass 344-348
obstruction by uterine myoma 395
stone 337, 346
suppurative inflammation 343-344
perirenal cystic masses 297
polycystic/polycystic disease 277-278, 284,
296-297
putty 313
pyelocaliceal system 339
dilatation 343
stones 313,339
pyonephrosis 286, 296, 307
renal cell carcinoma 286, 303-304, 306, 308
cystic 298-299, 308
hyperechoic 309
metastases 304, 324
operated 425
ureteral clots 345
renal pelvis
carcinoma 306
shape 331
renal sinus echo complex 305-306, 347
renal stone colic 342-343
renal tubule scarring 297
renovascular malformations 282
scars 310-311
septic-toxic 284, 293
single 283
sinus lipomatosis 305
size determination 282-283
small 287-289
staghorn calculi 313, 342, 346-347
topography 275-276
transplants 287
tuberculosis 299, 313
scars 311
tumors 286, 310
diffuse infiltration 295
inflammatory 307
parenchymal 303
vascular anomalies 281-282
vascular dilatations 300
vascular ectasia 282
vessels 275
Waldenstrom disease 294
see also renal entries
Kimmelstiel-Wilson syndrome 290
Klatskin tumor 44,108
classification 111
Kupffer cells 51
kyphoscoliosis 139
laparoscopy
focal liver lesion differential diagnosis 99
hepatic metastases 100
Laplace’s law 7
large intestine 235-248
amyloidosis 243
atrophy 248
carcinoma 236
diverticula 238
foreign body 247
hematoma 237
hypertrophy of wall 244
inflammation 245
intussusception 237
ischemia 243-244, 248
lumen
dilated 245-247
narrowed 247-248
lymphoma 236, 244
obstruction 271
peristalsis 228
physiological dilatation 245
polyps 237
tumors 244, 247
wall
extended changes 241 -244
focal changes 236-240
layers 226
leukemia see chronic lymphocytic leukemia;
chronic myelocytic leukemia
life periods, female 389
ligamentum teres 52
hepatis 93
hpoma 80, 85
light-chain deposition disease 294
limb ischemia, arterial stenosis 15
lipid plaques 17
lipoma, hepatic 80, 85
liposaicoma, chest wall cutaneous metasta-
ses 454
lithium 424
liver
abscess 77, 78, 83, 263
amebic 78
cholangitis 115
gas formation 96
hyperechoic 93
adenoma 83-84
amyloidosis 69
anatomical variants 53. 54
anatomy 52-62
atrophy 67
calcification 95
cancer 82
capsule injuries 77
caudate lobe
enlargement 31
size 62
chemotherapy 75
cholangiofibroma 91
comet-tail artifacts 94
congestion 59
acute 63, 64
cholestasis 115
chronic 63-64
contour 53
cysts 76, 78
complicated 83
stomach impression 234
diaphragmatic incisures 93
diffuse infiltration 66
dynamic criteria 54, 57, 58
enlarged 62-64
extrinsic criteria 53-54
fatty 63-66, 70
fatty degeneration 56
fatty focal change 87, 94
fatty focal infiltration 65, 71-72
fibrosis 70
focal lesion diagnosis 98-100
focal nodular hyperplasia 84, 85, 87-88, 92
diagnosis 99
foreign bodies 95
function 51
gas accumulation 95-96
gas embolism 241
hemangioma
atypical 86, 88, 91
differential diagnosis 91
focal 99
giant 90
hyperechoic 89-91
hematoma 83, 88
hemorrhage/hematoma 77
homogeneous texture
hyperechoic 70
hypoechoic 68-69
hydatid cysts 79-80
alveolar 98
inflammatory disease 60
inflammatory parenchymal changes 56. 59
inhomogeneous texture
diffuse 72-74
regional 71-72
intrahepatic masses 74-75
intrinsic criteria 54-58
lipoma 80, 85
lymphatic infiltration 80
lymphoma 80, 82
metastases 74. 75, 81, 82, 91
ascites 269
cholestasis 115
diagnosis 99-100
diffuse 97
hyperechoic 93
isoechoic 88
surface 55
necrosis 72, 93
parenchyma 56, 57
anechoic masses 76-87
diffuse changes 61-62
echodense masses 94-96
homogeneous texture 68-70
hyperechoic 89-94
inhomogeneous texture 71-74
irregular masses 97-98
isoechoic masses 87-89
localized changes 74-75
pathological findings 59-61
polycystic disease 76-77, 78, 263
porphyria 92
portovenous gas embolism 241
prehepatic block 38
regenerative nodules 92
resection 68
Riedel's lobe 53, 54
segments 52
shape 53
size 53, 62
small 67-68
sonographic assessment criteria 54, 57
surface 53, 55
thorotrastosis 97
topography 51
tumors
diffuse growth 74
primary 82
vascularization 82
venous flow pattern 58
see also hepatic entries
lung
abscess 472, 473, 483, 486-487
cancer and lymph node metastases 202
empyema 486-487
fluid collection 486
liquefying processes 472, 473, 486
masses 471-487
anechoic 472-474
complex 483-487
evaluation criteria 471
hypoechoic 474-483
metastases 481-483
morphology 471
percutaneous biopsy 481
topography 471
tuberculosis 486
tumors 481-483
respiration movement 482
see also atelectasis; bronchial carcinoma;
pulmonary entries
lutein cyst 405
lymph nodes
abdominal 204-207
hepatic portal 212-214
iliac 220, 222
mesenteric 216-219
para-aortic 220, 222
retroperitoneal 219-222
splenic hilum 215-216
staging of involvement 206
anatomy 199
assessment 201
axillary 200, 203, 210-212
chronic lymphocytic leukemia 208
calcification 202
celiac in non-Hodgkin lymphoma 206
cervical 203
lymphoma 209
echogenicity 202, 203
enlargement 110
esophageal cancer invasion 203
extremities 210-212
groin 210-212
false aneurysm 212
head/neck 200, 207-210, 209
Hodgkin disease 202, 208, 211
inflammatory 207, 213, 215, 217
retroperitoneal 219-220
inflammatory pancreatic 156
intraperitoneal 200
invasion patterns 205, 206
location 201
lymphoma 202, 206, 209
hepatic portal 214
mesenteric 218
letroperitoneal 220, 221
splenic hilum 215-216
metastases 202, 203, 206, 207-209
axillary 211
groin 211
mesenteric 217, 218
prostate cancer 205
retroperitoneal 220, 221
splenic hilum 215
morphology 201, 202
nonperipheral 200
parapelvic cysts 297, 298
parietal 207
peripheral 199-200, 207-212
calcification 204
reactive enlargement 205
retroperitoneal 200-201
splanchnic 207
splenic hilum 215-216
supraclavicular 209
topography 199-201
vascularization 202, 204, 205
lymphadenitis, mesenteric 217
lymphadenopathy
cervical 207
differential diagnosis 199
inflammatory 207
mesenteric 241
non-Hodgkin lymphoma 206
reactive 201
lymphangioma, benign cystic 298
lymphocele, intra-/pen-renal 298
lymphoma
inferior vena cava compression 32
kidney infiltration 294
lymph node calcification 204
peripheral vein compression 32
uterus 394
lymphoma, malignant
adienal 322
aortic 24
arterial stenosis 16
bowel wall 244
cervical lymph nodes 209
chest wall
cutaneous metastases 454
infiltration 482
hepatic involvement 80, 82
infiltrating 80
large intestine 236
lymph nodes 202, 203, 206, 209
axillary 212
groin 212
hepatic portal 214
mesenteric 218
retroperitoneal 220, 221
splenic hilum 215-216
pancreas 156,158
pleural carcinomatosis 460
pleural effusion 465, 467
renal 306,308
small intestine 236
spleen 176,183,194
invasive 184-186
splenic vein thrombosis 46
splenomegaly 177, 179-180
stomach 230, 232
thyroid gland 435
lymphoproliferative disorder, splenic infarc-
tion 186
Index 495
M
magnetic resonance imaging (MRI) 99
malabsorption, gallbladder changes 124
malignancy
gallbladder infiltration 138
pancreas 145
vena cava infiltration 32
malignant melanoma
lymph nodes 203
metastases
lymph nodes 211
splenic 192
thyroid gland 438
malignant mesothelioma 457
diffuse 462
pleural fibrosis 460, 461
Marine-Lenhart syndrome 421, 443, 445
median arcuate ligament syndrome 11
megacalicosis 335
megaureter 335-336
Menetrier disease 232
mesenteric artery, inferior 11,12
mesenteric artery, superior 6
embolism 15
stenosis 11,12
mesenteric lymph nodes 216-219
enlargement 217
mesenteric vein, superior 34
acute abdomen 47
lumen enlargement 36
thrombosis 46-47
mesoaortitis syphilitica 18
metabolic disorders, kidneys 294
metastases 81
adrenal 321, 324
aorta 24
breast cancer 60, 74, 82
lymph nodes 211
calcification 95
Index 496
metastases, celiac lymph nodes 206
cervical lymph nodes 203
chest wall 453-454. 473
cutaneous 453-454
echogenicity 82
focal nodular hyperplasia differential
diagnosis 85
gallbladder 133
hepatic 74, 75, 81, 82, 91
ascites 269
cholestasis 115
diagnosis 99-100
diffuse 97
hyperechoic 93
isoechoic 88
surface 55
hepatic portal lymph nodes 213
hepatic vein 60
inferior vena cava 32
lung 481-483
lymph nodes 207-209
axillary 211
groin 211
malignant melanoma 211
mesenteric 217, 218
prostate cancer 205
retroperitoneal 220, 221
malignant melanoma 211
ovarian 409
ovarian cancer 341
pancreas 144, 155, 156
peritoneal 267-268
pleural, differential diagnosis 458
prostate cancer 354, 355, 374
lymph nodes 205
rectal cancer lymph nodes 211
renal 306
renal cell carcinoma 304, 324
rib 452-453
seminal vesicles 376, 378
spleen 176,190, 192
calcification 195
sternum 452-453
stomach 230
thyroid gland 437-438
uieters 341
vena cava infiltration 32
meteonsm 227
Meyenburg complexes 92
microalbuminuria 291
microliths 134
Mirizzi syndrome 109, 127
Monckeberg’s arteriosclerosis 19
Morrison’s pouch 253
multiple endocrine neoplasia (MEN) 325, 436
Murphy’s sign 123
myelofibrosis, splenomegaly 177,179-180
myeloproliferative disorders
intrasplenic varicosity 42
spleen 194
splenic infarction 186
splenomegaly 177, 179-180
myometrium 392
changes 394-396
myosarcoma, metastases 91
myxedema 420, 424
N
neck see head/neck lymph nodes
needle biopsy, focal liver lesion differential
diagnosis 99
nephrectasia, hydronephrotic 263
nephritis, acute 289
nephrocalcinosis 300, 312
nephroma, cystic 298
nephronophthisis, familial 278
nephropathy
adult polycystic 278
AIDS-induced 286
analgesic 288, 292, 293, 295
calcifications 312
heroin-induced 286
infantile polycystic 278
see also diabetic nephropathy
neuroblastoma 327
non-Hodgkin lymphoma 82
celiac lymph nodes 206
hepatic 80
lymphadenopathy 206
pancreatic 156
pleural carcinomatosis 460
pleural effusion 467
spleen 186
О
orchitis 380
Ormond disease 340
Osler disease 79, 80
outflow obstruction, acute 285
ovaries
anatomy 403
anechoic cystic mass 404-406
cancer/carcinoma 406, 408-409, 410
ascites 263, 269
peritoneal carcinomatosis 259
cystadenocarcinoma 406, 409, 410
cystadenoma 406,410
cysts
endometriotic 407
functional 404-405
dermoid tumors 412
dysgerminoma 412
endometriosis 407
fibroma 411
follicles 404
follicular cysts 404
germ ceil tumors 412
histology 403
inflammatory adnexal mass 408
metastases 341, 409
pleural effusion 466
splenic 192, 215
morphology 403-404
mucinous cystadenocarcinoma 410
mucinous cystoma 406, 410
nonhomogenous masses 407-414
paraovarian cyst 405
polycystic 405
retention cysts 405
sarcoma 411
solid echogenic masses 407-414
struma ovarii 412
teratomas 412
theca-lutein cyst 405
thecoma 411
thecomatosis 407
topography 403
tumors
classification 409
clear cell 410
complications 413
cystic 406
diagnosis 413
endometrioid 410
epithelial 409-410
germ cell 410
granulosa cell 411
histological criteria 409-414
imaging 413
prognosis 414
sex cord-stromal 410,411
steroid cell 411
symptoms 413
transitional cell 410
treatment 414
yolk sac 412
pampiniform process 385
panarteritis nodosa 18
Pancoast tumor 455, 481
pancreas
abscess 154,156
adenoma 156
aging 146
anatomy 143
anechoic lesions 152-154
annular 159-160
atrophy 146
blood supply 143-144
borders 143
calcification 161
cancer/carcinoma 16, 41,155-156,158
acinar cell 156
cystic 263
differential diagnosis 157
diffuse 145
ductal dilatation 168-169
head 111
hepatic metastases 88, 97
lymph node metastases 213
mucinous ductal 164
papillary 112
periampullary 107, 112,155, 167
splenic metastases 192
venous infiltration 48
congenitalanomalies 159
congenital cysts 152, 153
cystadenocarcinoma 164, 263, 319
cystadenoma 156, 164
cysts 152,153,163
calcified 156
congenital 152,153
hemorrhagic 156
macrocysts 148,153
microcysts 148,153,154
neoplastic 153
retention 152, 153,163
stomach impression 234
diffuse change 144-151
divisum 151,159,166
duct system 154
endocrine 143
exocrine 143
fat necrosis 147
fibrolipomatosis 148, 150
fibromatosis 148
fibrosis 146, 148, 149,151
focal changes 152-157
function 143
head 160
cancer 167
enlarged 32,159
hemangioma 162
hemochromatosis 149
hydatid cysts 152
hyperechoic lesions 148-151,160-162
hypoechoic lesions 147,154-157
inflammatory lymph nodes 156
irregular lesions 163-164
isoechoic lesions 158-160
juvenile 147
large 144-145
lipoma 162
lipomatosis 148
lymphatics 144
lymphoma 16, 156, 158
macrocysts 148,153
malignancy 145
mass 216
metastases 144, 155,156
microcysts 148,153,154
microstructure 143
necrosis 153-154,154
neoplastic cysts 153
pseudocysts 111.153, 156, 163, 263
malignant 164
renal/adrenal cyst differential diagno-
sis 319
retention cysts 152, 153,163
siderosis 148
small 145-146
topography 143-144
tumors
benign 156
cystic 164
invasion 145
mesenchymal 156
neuroendocrine 155, 156
vena cava compression 32
vessels 154
pancreatectomy 146
pancreatic duct
calculi 168
cancer 155-156,164
cysts 154
differential diagnosis of changes 165
dilatation 148,164-169
causes 165
marginal/mild 166
marked 167-169
prestenotic 169
gas 162
intraductal calculus 161
mass 168
mucinous carcinoma 164
obstruction 112,154
stent 162
pancreaticoduodenal artery stenosis 11
pancreatitis 267
acute 46,47,144-145,147
calcium soap 162
ductal dilatation 166
focal 158
pseudocysts 163
splenic infarction 187
alcohol-associated 145, 148
autoimmune 146,168
biliary obstruction 111
chronic 145,146,149-151,167
autoimmune 168
calcifying 149,150,151,161
calculi 151
classification 149, 150
differential diagnosis 149,150
ductal dilatation 167-168
ductal obstruction 154
early 148
fibrosis 151
focal 158,163
irregular lesions 163
microcalcification 162
obstructive 151
recurrent 148
retention cyst 163
classification 147, 149, 150
edema 144, 145
fibrin strands 267
focal 157,158
groove 157
hemorrhagic 258
microcalcification 162
mild 147
necrosis 146, 151,153-154, 265
necrotizing 144, 258, 263, 267
parenchymal changes 149
recurrent 258
ductal dilatation 166
severe 147, 235
paracentesis, fine-needle 255, 256, 258, 259
paraovarian cyst 405
paraprotein kidney 286
parasites 113
parathyroid glands 418
parietal lymph nodes 207
peliosis, hepatic 79, 80
periampullary carcinoma 108
pericardial effusion 37
peripancrearic fat 144,145
peripheral arteries, stenosis 13-14
peripheral lymph nodes 204
peripheral veins, duplication 26
peristalsis 228, 246
peritoneal cavity
anatomy 251
anechoic structure 256-258, 263-264
collections 254
diffuse changes 254-256
extraperitoneal location 252, 253-254
exudate 255
fluid collections 252, 253, 255
gas collections 252, 253
hemorrhage 255
hyperechoic structure 261-263
hypoechoic structure 258-261, 264-265
intragastric processes 269-271
intraintestmal processes 270-271
intraperitoneal location 252, 253-254
inegular margin 267-269
localized perforation 265
morphology 252-254
retroperitoneal space 252, 253-254
smooth margin 266-267
topography 251-252
transudate 255
wall structures 266-269
see also carcinomatosis, peritoneal
peritoneum
hematoma 265
hyperechoic structure 265-266
metastases 267-268
reflections 251
tumor masses 269
see also carcinomatosis, peritoneal
peritonitis 257
bacterial 257, 258, 267
purulent 258, 260
viral 257
pheochromocytoma 325, 327
phlebohths 30
Phrygian cap 119,121
inflammation 128, 129
piano key phenomenon 245, 246, 270-271
placental polyps 398
plasmacytoma
chest wall cutaneous metastases 454
rib destruction 453
pleura
anatomy 449
calcifications 458-459
carcinomatosis 459-460
fibrosis 460-461
location 449
metastases 458
morphology 449-450
nodular masses 456-459
differential diagnosis 456
parietal 456-462
plaque 458-459
scar stage 460
thickening 459-462
thickness 449
topography 449
pleural cavity, mass lesions 462
pleural effusion 458, 460, 462-463
anechoic 463-464
atelectasis 475
basal inflammatory 465
benign 464
bronchial carcinoma 465
metastases 466
causes 463
complex 466-467
differential diagnosis 463
echogenic 464-466
exudative 464
fibrothorax 467
inflammatory 465,467
liquefaction 473
loculated 472
lymphoma 467
Index 498
pleural effusion, malignant 465, 466, 467, 477
ovarian cancer metastases 466
parainfectious 458
peripheral inflammatory 465
pneumonia 486
transudative 463-464
volumetry 462
pleural empyema 486-487
differential diagnosis 487
pleural fibrosis 460, 461
pleurisy 484
pleuropneumonia 484
pneumobilia 96, 110, 112-113, 238
pneumoconiosis, pleural calcification 458
pneumonectomy, pyothorax 461
pneumonia 483
air bronchogram 484
cavitating 473
interstitial 484, 485
liquefying processes 486
lobar 484, 485
pleural effusion 486
postinfarction 480
pneumonitis, obstructive 477
pneumoperitoneum 254,261-262
pneumothorax 467
polycystic kidney disease 277-278, 284
polyglandular autoimmune syndrome 423
acquired autoimmune thyroiditis 424, 425
disseminated autonomy 444
polyneuropathy 122
popliteal aiteiу embolism 15
popliteal vein
duplication 26
incompetence 28
thrombosis 29
venectasia 27
porphyria, hepatic 92
portal hypertension 35-43
ascites 268
cirrhosis 116
collateral formation 35
intrasplenic varicosity 42
ligamentum teres hepatis 93
posthepatic block 42-43
spleen benign nonhomogeneity 176,177
splenomegaly 179
portal vein 33-34, 51, 54, 58,116
aplastic 38
bifurcation 61
cavernous transformation 44-45
flow profile 37, 58, 61
gas embolism 72
gas pockets 95
hepatic cirrhosis 73, 74
hypoplasia 38
lumen enlargement 35-43
occlusion 44
paraportal recanalization 44
periportal cuffing 186
reduced flow 36
reflux 37
thrombosis 43-46, 48, 87, 89, 94
cholestasis 115
topographic anatomy 33-34
portovenous system
gas embolism 57, 96, 241
tumor infiltration 48
positron emission tomography (PET) 99
posthepatic block 42-43
post-pancreatitic necrosis 146
Potter disease 278
pregnancy 397
cervical 398
ectopic 396, 398, 403
multiple 405
tubal 403
prostate
abscess 372
adenoma 356, 373
anatomy 367
anechoic 372-373
calcifications 375
cancer/carcinoma 368-369, 370-371, 374
diagnosis 369
lymph node metastases 205
metastases 354, 355, 374
screening 369
staging 368
cavity 372
changes 367
circumscribed lesions 372-375
disease 367
echogenic 372, 375
enlarged 368-371
hypoechoic 373-374
operated 371-372
radiation therapy 372
small 371-372
stones 375
surgical capsule 373, 375
topography 367
transurethral resection 371-372, 373
prostatectomy, transabdominal total 371-372
prostatic hyperplasia, benign (BPH) 356, 368,
370, 372, 373
prostatic carcinoma differential diagno-
sis 369
urinary bladder wall hypertrophy 360
prostatitis
acute 369-370
chronic 371, 372
proteinuria 291
proton pump inhibitors 232
pseudoaneurysms 8,10, 22
femoral artery 10
groin lymph nodes 212
spleen 187, 188
pseudoascites 262-263
pseudomembranous enterocolitis 244
pseudomyxoma peritonei 409
pulmonary artery 485
occlusion 478
pulmonary cyst 457, 472, 473
see also lung
pulmonary embolism 477-481
entry echo 478-479
hypoechoic transformation 480-481
structural transformation 479-480
wedge-shaped lesions 479
pulmonary fibrosis, pleural fibrosis 460, 461
pulmonary infarction 477-481, 479
pneumonia 480
pulmonary nodule, peripheral 473
pulmonary vein 485
pulsatility index 14
lung mass evaluation 471
pulsatility index (Pl) 287
pyelectasis 281, 300, 336-338
causes 336
pyelitis, suppurative 343
pyelonephritis
acute 285-286
chronic 288, 292, 293
emphysematous 312
renal abscess 302
scars 311
suppurative 296
xanthomatous 307
pyloric stenosis, hypertrophic 231
pyometra 397
pyonephrosis 286, 296, 307, 343-344
purulent sediment 353
pyosalpinx 402
pyothorax
pleural effusion differential diagnosis 464
pleural fibrosis 461
R
radiotherapy
asplenia 181
prostate 372
testicular atrophy 381
thyroid gland 426-427, 429
rectal cancer metastases 211
renal agenesis 276-277
see also kidneys
renal allografts 287
renal arcuate ligament syndrome 11
renal arteries 6, 7, 275
aneurysms 300
arteriosclerosis/arteriolosclerosis 288
arteriovenous malformations 282
duplicated 6, 7
embolism 287
stenosis 11,12,13,287
renal cell carcinoma 286, 303-304, 306, 308
adrenal incidentaloma differential diagno-
sis 323
cystic 298-299, 308
hyperechoic 309
metastases 304, 324
operated 425
ureteral clots 345
renal cysts 296-297, 319
hemorrhagic 302, 309
parapelvic 305
renal dysplasia, hypoplastic 277
renal failure 284
acute 289
diabetic nephropathy 291
pleural calcification 458
renal infarcts, fresh 302
renal insufficiency 196
renal pelvic carcinoma 306
renal shock, hypoxemic 290
renal stone colic 342-343
renal tubules, scarring 297
renal veins 275
congestion 300
heart failure 290
duplication 26
ectasia 300
thrombosis 285, 287, 290
resistance index (RI) 287
lung mass evaluation 471
reticuloendothelial system 51
retroperitoneal fibrosis 24, 340
vena cava compression 32
retroperitoneal lymph nodes 200-201
retroperitoneal space 252, 253-254
ribs
bone destruction 453
fibrous dysplasia 453
fractures 451-452
metastases 452-453
morphology 449-450
Pancoast tumor 455
Riedel goiter 422
Riedel lobe of liver 53, 54
Rokitansky-Kustner syndrome 394
S
sactosalpinx 402
salpingitis, purulent 240
saphenofemoral junction incompetence 28
saphenopopliteal junction incompetence 27,
28
saphenous vein
arteriovenous fistula 22
insufficiency 27, 28
phleboliths 30
thrombosis 30
sarcoidosis 177
scar tissue, stellate 84, 85
scintigraphy, focal liver lesion differential
diagnosis 99
scrotum
hernia 386
mass 385-386
scybala 227
sea anemone phenomenon 253, 254, 268, 269
seminal vesicles
abscess 377
anechoic 377
calcifications 378
changes 367
circumscribed change 377-378
cysts 377
diffuse change 376
dilatation 377
echogenic 378
hypoechoic 376
prostate carcinoma infiltration 374
stones 378
tumor infiltration 376, 378
vesiculitis 376, 378
sepsis, asplenia 181
seroma 300
serometra 397
seropneumothorax 467
Sertoli stromal cell tumors 411
sickle-cell anemia
asplenia 180, 181
splenic calcification 195
splenic infarction 186
siderosis, pancreatic 148
sigmoid carcinoma 247-248
signet-ring carcinoma 230
sinus lipomatosis 305
small intestine 225, 235-248
amyloidosis 243
atrophy 248
bezoars 238
carcinoma 236
diverticula 238
foreign body 247
gallstones 238
hematoma 237
hypertrophy of wall 244
inflammation 245
intussusception 237
ischemia 243-244, 248
loops 227
lumen
dilated 245-247
narrowed 247-248
lymphoma 236, 244
obstruction 270-271
peristalsis 228
physiological dilatation 245
polyps 237
tumors 244, 247
wall
extended changes 241-244
focal changes 236-240
layers 226
spermatocele 383-384
spheiocytosis, spleen 178
spiral valve of Heister 119,120
splanchnic arteries, stenosis 11-13
splanchnic lymph nodes 207
spleen
abscess 183,188-190
treatment 189
accessory 216
adrenal mass differential diagnosis 323
aged 180
anatomy 173
anechoic mass 182-184
arteriovenous fistula 187,188
benign nonhomogeneity 176-177
calcification 195-196
candidiasis 189, 190
chronic lymphocytic leukemia 194
congenital cleft 173
cysts 182-184
dysontogenic 182,183
hydatid 184
infective 183-184
dearterialization 186
diffuse calcification 195
focal calcification 195
focal changes 182-196
hamartoma 194
hemangioma 193-194
hematological malignancy 190
Hodgkin disease 185,186
hyperechoic mass 193-194
hypoechoic mass 184-192
infarction 183,186-188
complications 187,188
healing 187
infections 178
intrasplenic varicosity 42
lymphoma 176,183,194
invasive 184-186
macroabscess 188-189
malignant invasion 176
metastases 176,190,192, 215
calcification 195
microabscess 189-190
myeloproliferative disorders 194
nonfocal changes 176-181
non-Hodgkin lymphoma 186
parenchyma diffuse changes 176-177
parenchymal vessels 175
pseudoaneurysm 187, 188
pseudocysts 183
segmental arteries 175
shape 173
size 173
small 180-182
spherocytosis 178
subcapsular hematoma 191,192
subsegmental arteries 175
topography 173-175
trauma 190, 191
tumor
benign 193-194
solid 176
vascular appearance 174,175
vascular calcification 196
see also splenomegaly
splenic artery 6,154,174,175
calcified 161
ectasia 319
obstruction 176
tortuous 319
splenic hilum
collaterals 45
varicosities 39, 41
splenic vein 34,174,175
ectasia 319
flow 37
pancreatic cancer spread 169
recanalization 46
thrombosis 46,179
tortuous 319
trunk 174
splenomegaly 36, 82,177-180
causes 177,178
hematological malignancy 177,179-180
hepatic cirrhosis 256
lymphatic infiltration 80
splenorenal ligament 174
splenorenal shunt 39, 41
spontaneous bacterial peritonitis (SBP) 257,258
sprue 227, 242
starvation gut 247, 248
steatohepatitis, non-alcohohc 65
steatosis hepatis see liver, fatty
Stein-Leventhal syndrome 405
stents 19
bile duct 112-113
carotid artery 16
dilated bile duct 117
draining varicosities 39
endovascular 21
hepatoduodenal 112,113
iatrogenic foreign body 95
pancreatic duct 162
sternum
fractures 451-452
metastases 452-453
Index 499
Index 500
steroid cell tumors 411
stimulated acoustic emission (SAE) 89
stomach 225, 229-235
adenocarcinoma 230
cancer/carcinoma 230
hepatic hilar lymph nodes 38
hepatic vein infiltration 60
lymph node invasion 205, 217
malignant ascites 257
peritoneal carcinomatosis 259, 267
scirrhus 232, 234, 235
splenic metastases 192
compression 235
congestion 233
diverticulum 231
edema 233
emptying 234
functional disorders 234
gastritis 232
gut signature 227
impression 234
inflammation 233
lumen
dilated 233-234
narrowed 234-235
postoperative status 235
lymphoma 230, 232
metastases 230
morphology 226
outlet obstruction 234, 270
peristalsis 228
peritoneal carcinomatosis 233
physiological dilatation 233
stromal tumor 229
ulceration 231
varices 231
wall changes
extended 232-233
focal 229-231
pancreatic cancer 41
see also gastric entries
supraclavicular lymph nodes 209
syphilis, epididymitis 384
tampons 391
target sign 237
temporal arteritis 19
testes
abscess 382
anatomy 379
atrophy 381
changes 367
circumscribed lesions 381-383
cysts 381
decreased size 381
hematoma 382
infarction 382
microlithiasis 383
orchitis 380
topography 379
torsion 380
tumors 382-383
theca-lutein cyst 405
thecomatosis 407
thoracic ultrasound
limitations 471
pulmonary embolism 478
Thoi otrast exposure
liver 97
spleen 176,177
thorotrastosis 97
thrombi
calcified 30
red 21
white 17.18, 20, 21
thrombocytopenia, heparin-induced 263
thromboembolism, splenic infarction 186
thrombophilia, splenic infarction 186
thrombosis see venous thrombosis
thrombus, white 20-21
thymus carcinoid, lymph node calcification 204
thyroid arteries 418, 419
thyroid gland
abscess 431, 435
adenoma 431-432
macrofollicular 440
microfollicular 436
normofollicular 438
oncocytic 432-433
parathyroid 434
regressive change 439
amyloidosis 423
anatomy 417-418
anechoic 429-431
calcifications 441
carcinoma 436-437, 442-443
lymph node calcification 204
strumectomy 425
circumscribed changes 429-443
colloid cysts 430, 439, 440
cysts 429-431, 439, 440
diffuse changes 419-429
enlarged 419-423
follicular carcinoma 436, 442
function 417
hemangioma 440
hemorrhagic cysts 430, 439, 440
hyperechoic structure 429, 439-441
hypoechoic structure 427-428, 431-438
irregular lesions 441-443
isoechoic 438-439
lipoma 434
location 418
lymph cysts 430
lymphoma 435
malignant melanoma metastases 438
medullary C-cell carcinoma 436, 437
metastases 437-438
microanatomy 417
microcalcifications 441
multiple cysts 430
myolipoma 440
neonatal hypothyroidism 425
nodules 436, 437
adenomatous 431-432,439
autonomous 421
cold 436
isoechoic 439
macrofollicular 440
regressive changes 440
papillary carcinoma 436, 443
postoperative aplasia 425-426
radioiodine-treated 426
radiotherapy 426-427, 429
regressive changes 440
shape 417
size 417
small 423-427
solitary cysts 429-430
topography 418
tumors 431-438,442-443
unilateral aplasia 425-426
vessels 418, 431
volume 417-418
see also goiter; hyperthyroidism; hypo-
thyroidism
thyroiditis
amiodarone-induced 424, 428
atrophic lymphocytic 423-424
autoimmune 421
acquired 423-425
autonomous adenomas 445
disseminated autonomy 444
chronic 423
with transient hyperthyroidism 427
invasive sclerosing 422
lithium-induced 424, 428
postpartum 423, 427
silent 427-428
see also de Quervain thyroiditis; Hashimoto
thyroiditis
thyroid-stimulating hormone (TSH) 417
thyroxine (T4) 417
tibial veins, posterior 29
tracheobronchial carcinoma, thyroid gland
metastases 437
transurethral resection of prostate 371-372,
373
transvaginal ultrasound 389
trauma
adrenal hematoma 319
blunt abdominal 258
pleural calcification 458
spleen 190,191
urinary tract hemorrhage 342
triiodothyronine (T3) 417
Tripus Halleri 6
tuberculosis
abscess 454
ascites 260
epididymitis 384
lymphadenitis 217
pleural calcifications 458-459
pleural fibrosis 460
prostate cavity 372
prostatitis 370
pulmonary 486
renal 299, 313
calcifications 312
scars 311
salpingitis 400
splenic calcification 195
urinary 350
tumbler phenomenon 227, 242
tympanites 138
U
ulcerative colitis 105, 243
asplenia 181
umbilical vein wall sarcoma 396
posthepatic block 43 changes 359-362 serometra 397
recanalized 39, 40 concavities/convexities 362 size/shape abnormalities 393-394
ureteral bud 332 edema 361 small 394
ureteral jet 357 hypertrophy 359, 360 tumors 394
ureterocele 279, 333, 341, 357, 362 indentations 357 see also endometrium; myometrium
ureteropelvic junction 332 thickening 359-361 utricular cyst 373
obstruction 336, 341 see also urothelial carcinoma
tortuosity 341 urinary catheters 355
ureters urinary retention 347-348 V
bifid 334 acute 285
clots 345 urinary stasis, chronic 339-340, 341 vagina
course 332, 333 urinary stone colic 338-339 aplasia 394
diameter 331 urinary tract carcinoma 391
dilated 336-344 anatomy 331-332 double 391
diverticula 335 anechoic 336-342 masses 390-391
duplex 333, 334 dilatations 334-336 morphology 390
ectopic 373 duplication anomalies 333-334 postoperative changes 391-392
hypoechoic mass 344-345 hemorrhage 342 septate 391
length 331 hyperechoic 345-348 size/shape abnormalities 391-392
mass 344-348 hypoechoic 342-344 wall cyst 390
metastases 341 infected obstruction 342-343 Valsalva maneuver 28
obstruction 279, 334 intracavitary mass 352-358 varicocele 385
orifices 332 echogenic 358 vas deferens 379
stones 339, 341, 342, 347-348 hyperechoic 355-357 vasculitis, autoimmune 205
strictures 341 hypoechoic 352-355 veins
subpelvic stenosis 338 malformations 333-336 compiession 31-32
tumors 341 reflux 341-342 dilatation 26-28
urethra, foreign bodies 358 stenoses 334-336 filling 28
urinary bladder topography 332-333 incompressibility 29
artifacts 357 tuberculosis 350 infiltration 31-32
blood clots 352-353, 356, 361 urinoma 300, 347 intraluminal mass 28-30, 43-48
calculi 358 urolithiasis 346 phlebohths 30
carcinoma 355, 361 uiothehal carcinoma 286, 304-306, 338, tumor infiltration 48
polypoid 354-355, 356 344-345, 355 valves 31
diverticulum 351, 362 bladder wall changes 361 venectasia 27-28
empty 350 uterus venous malformations, intramural 110
foreign bodies 358 adenomyomatosis 395-396 venous star 54, 58, 63
ileal substitute 352 anatomy 392 venous thrombosis 27, 28-30, 43-47
indented 352 angiomyoma 394 criteria 28
mesenchymal tumors 355 aplasia 394 superficial 30
neurogenic 349 atresia 394 see also named veins
overflow 349 bicornuate 393 vesicorenal reflux 279, 341-342
papilloma 353-354, 356 blood in 390 vesicoureteral reflux 341-342
partially contracted 351 blood supply 392 vesiculitis 376
polypoid tumors 356 carcinosarcoma 396 chronic 378
carcinoma 354-355, 356 cervix 392 VIPoma 155,156
pseudodiverticulum 351, 362 carcinoma 401 Virchow sentinel node 201
purulent sediment 353 endometrial inflammation 400 Virchow triad 27
reconstructed 352 polyps 398
residual urine 350 chonoepithelioma 401
shape 331 corpus carcinoma 400-401 W
changes 347-352 diffuse myomatosis 395
shrunken 350 endometrial polyps 398 Waldenstrom disease 294
side-lobe artifact 357 foreign bodies 396-397 Weigert-Meyer rule 333
size 331 hemangioma 394 Wilms tumor 303
changes 347-352 histology 392
sludge 353,361 hypoplasia 394
small 349-350 induration 395 V
tamponade 352353 intracavitary changes 396-398
topography 332-333 lymphoma 394 yersiniosis 241
tumors 341, 353-355 malacia 394 yolk sac tumor 412
flat 359-360 malformations 393
polypoid 354-355, 356 morphology 392-393
wall hypertrophy 360 mucocele 397 Z
ureteral jet 357 myoma 394-395, 396
volume 331 prolapse 393 Zuckerlandl organ 325
estimation 347, 348 pyometra 397
Index 501
The sure way to an accurate diagnosis
With more than 2500 illustrations, this one-of-a-kind book offers an entirely new
system for using ultrasound imaging to achieve the correct diagnosis quickly and reliably.
Covering the full spectrum of normal and pathologic finding's in the human body, the
authors—all experts in the field—present a color-coded system of more than 250 “drop-
down" menus, which lay out all possible diagnoses at a glance and then guide the user
swiftly and surely to an accurate diagnosis.
Sample menu
► Non-Focal Parenchymal Change
▼ Focal Changes
* ► Anechoic Mass
" ► Hypoechoic Mass
Hyperechoic Mass
^=»"Tplenic Calcification
Invasive Lymphoma
Splenic Infarction
Splenic Abscess
Splenic Trauma
Splenic Metastasis
The book’s clear layout, flow charts, and text boxes make it possible to approach a
diagnosis from several different starting points, such as sonographic criteria (echo-
genic? Anechoic?) or with the most likely diagnosis (pancreatitis? Splenic infarction?).
The detailed information, plus all of the images required for the correct diagnosis,
is always at your fingertips.
Organized anatomically, chapters each begin with a handy review of important
sonographic characteristics and normal findings. The essential information for each
possible abnormal finding follows, along with concise discussions of supplemental
techniques, such as В-Mode images, Doppler imaging, and the use of contrast media.
Elegantly crafted, concise, and accessible, Differential Diagnosis in Ultrasound Imaging
is a tried and tested aid in making the most of ultrasound as a highly efficient diagnostic
tool.
The Americas
ISBN 1-58890-179-3
9 781588 901798
ISBN 3-13-131891-0 (GTV)
ISBN 1-58890-179-3 (TNY)
www.thieme.com
Rest of World
ISBN 3-13-131891-0
lllllllllllllllllllllll
9 783131 318916