


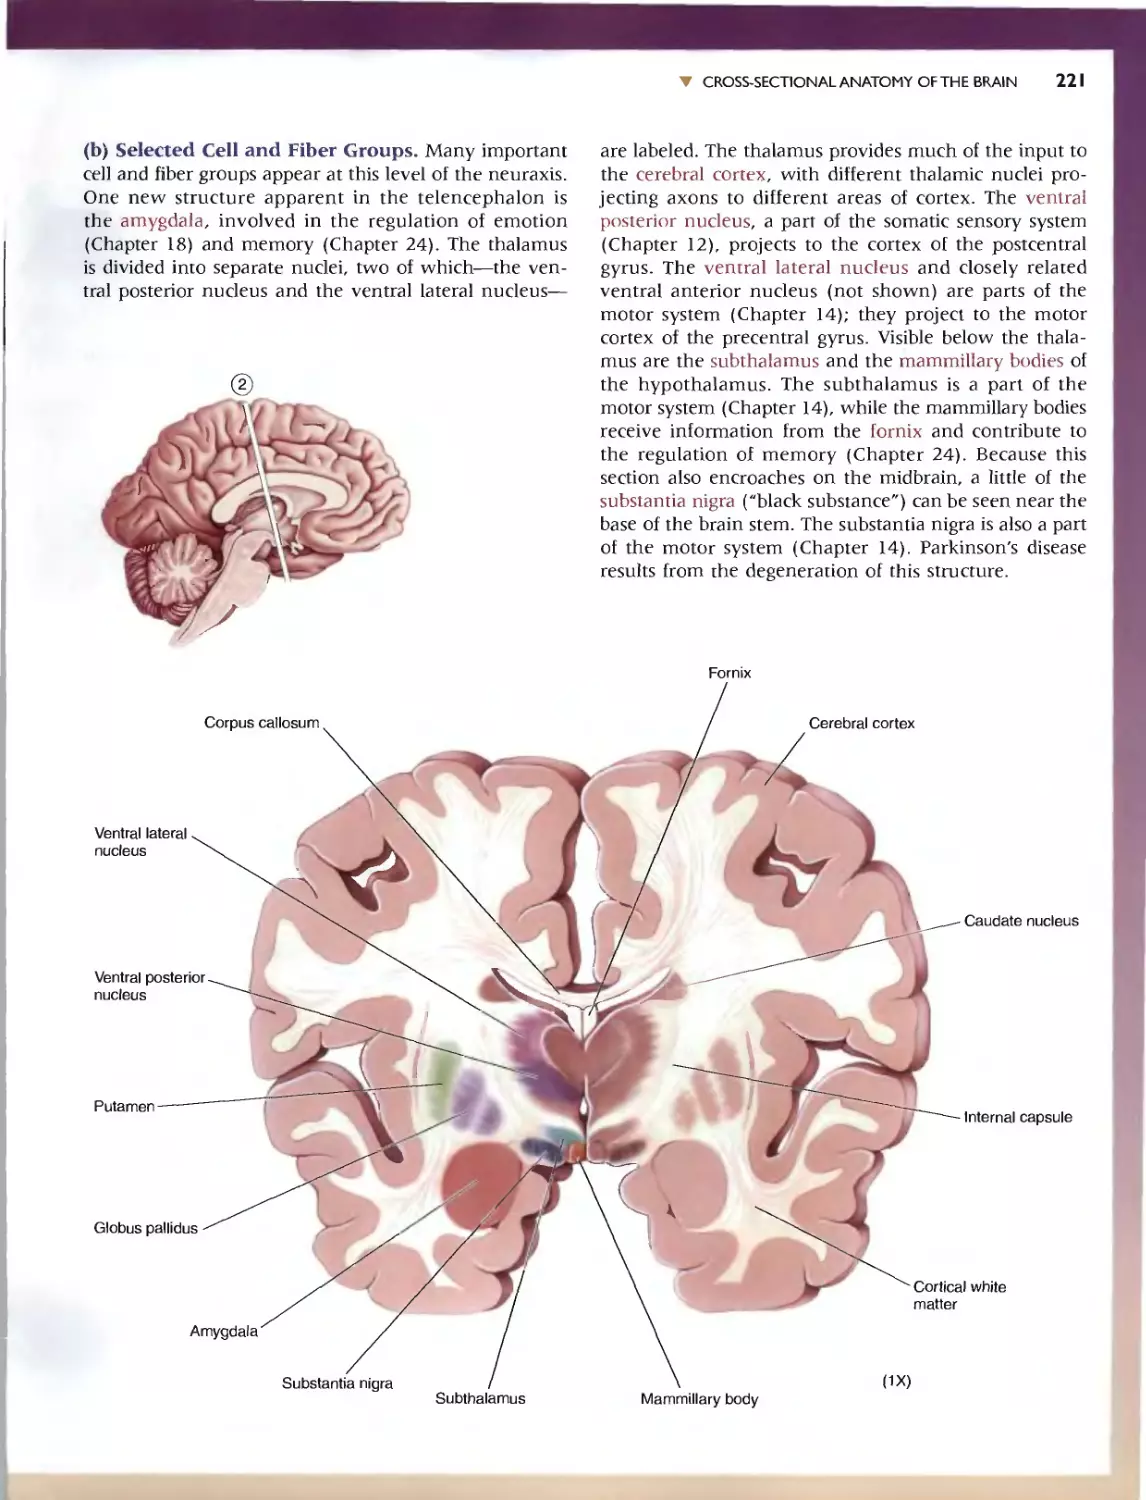
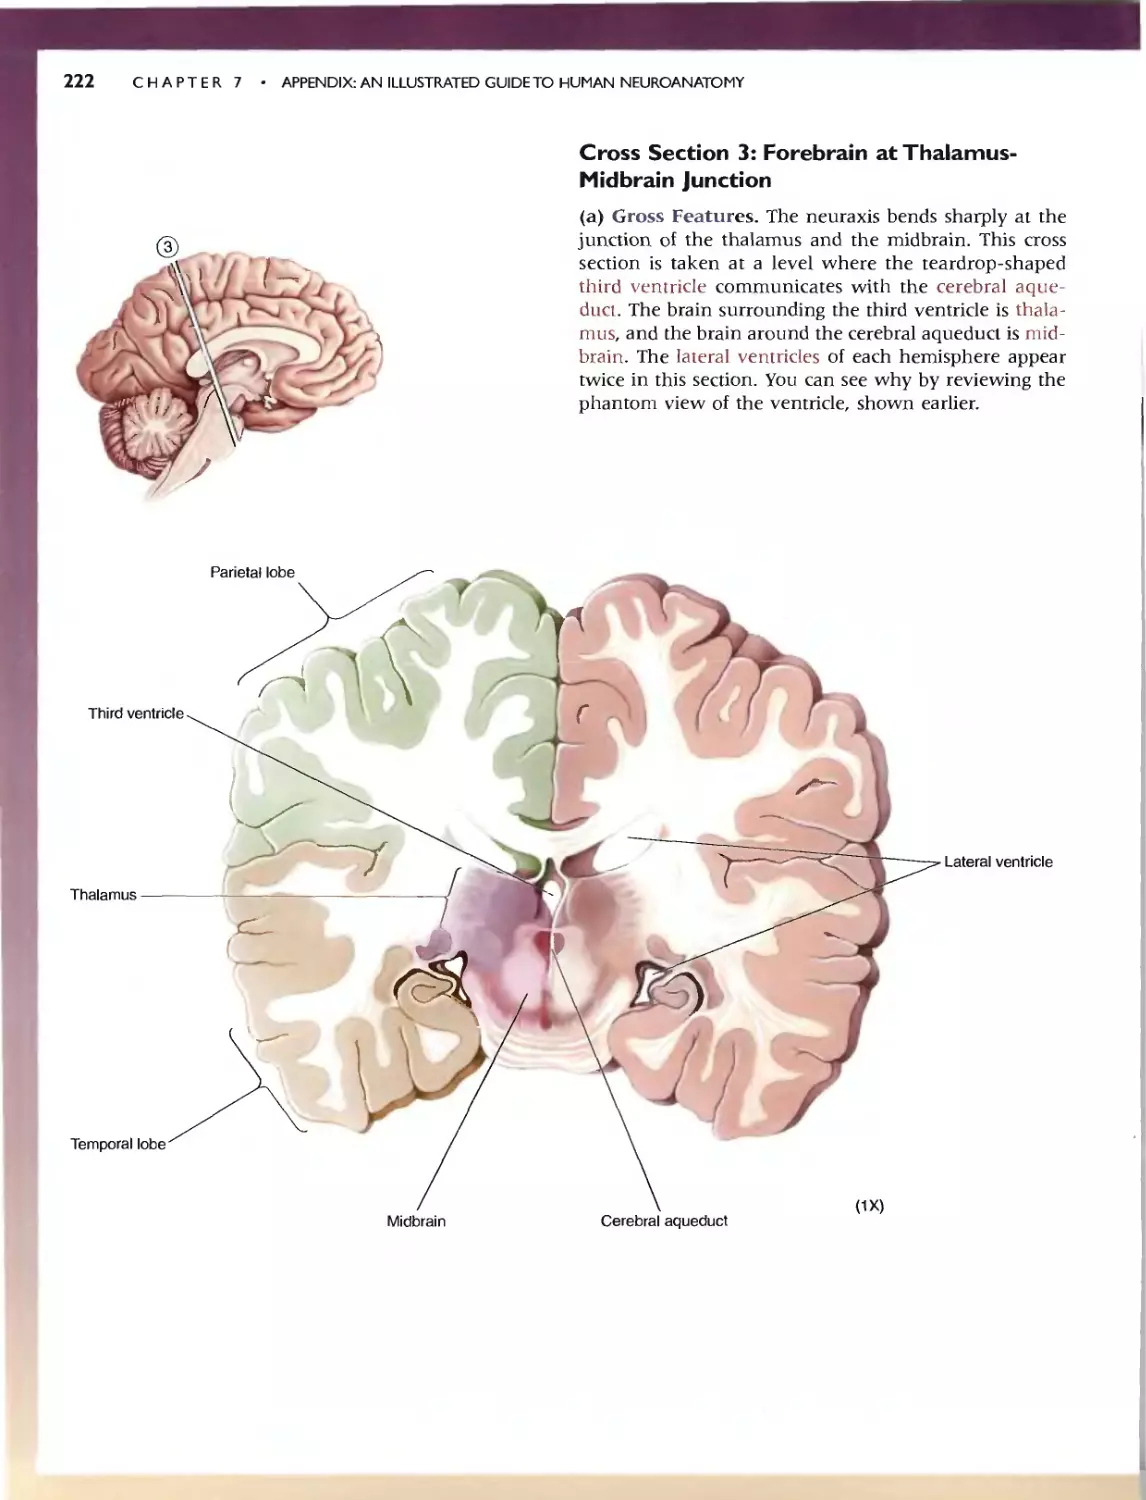
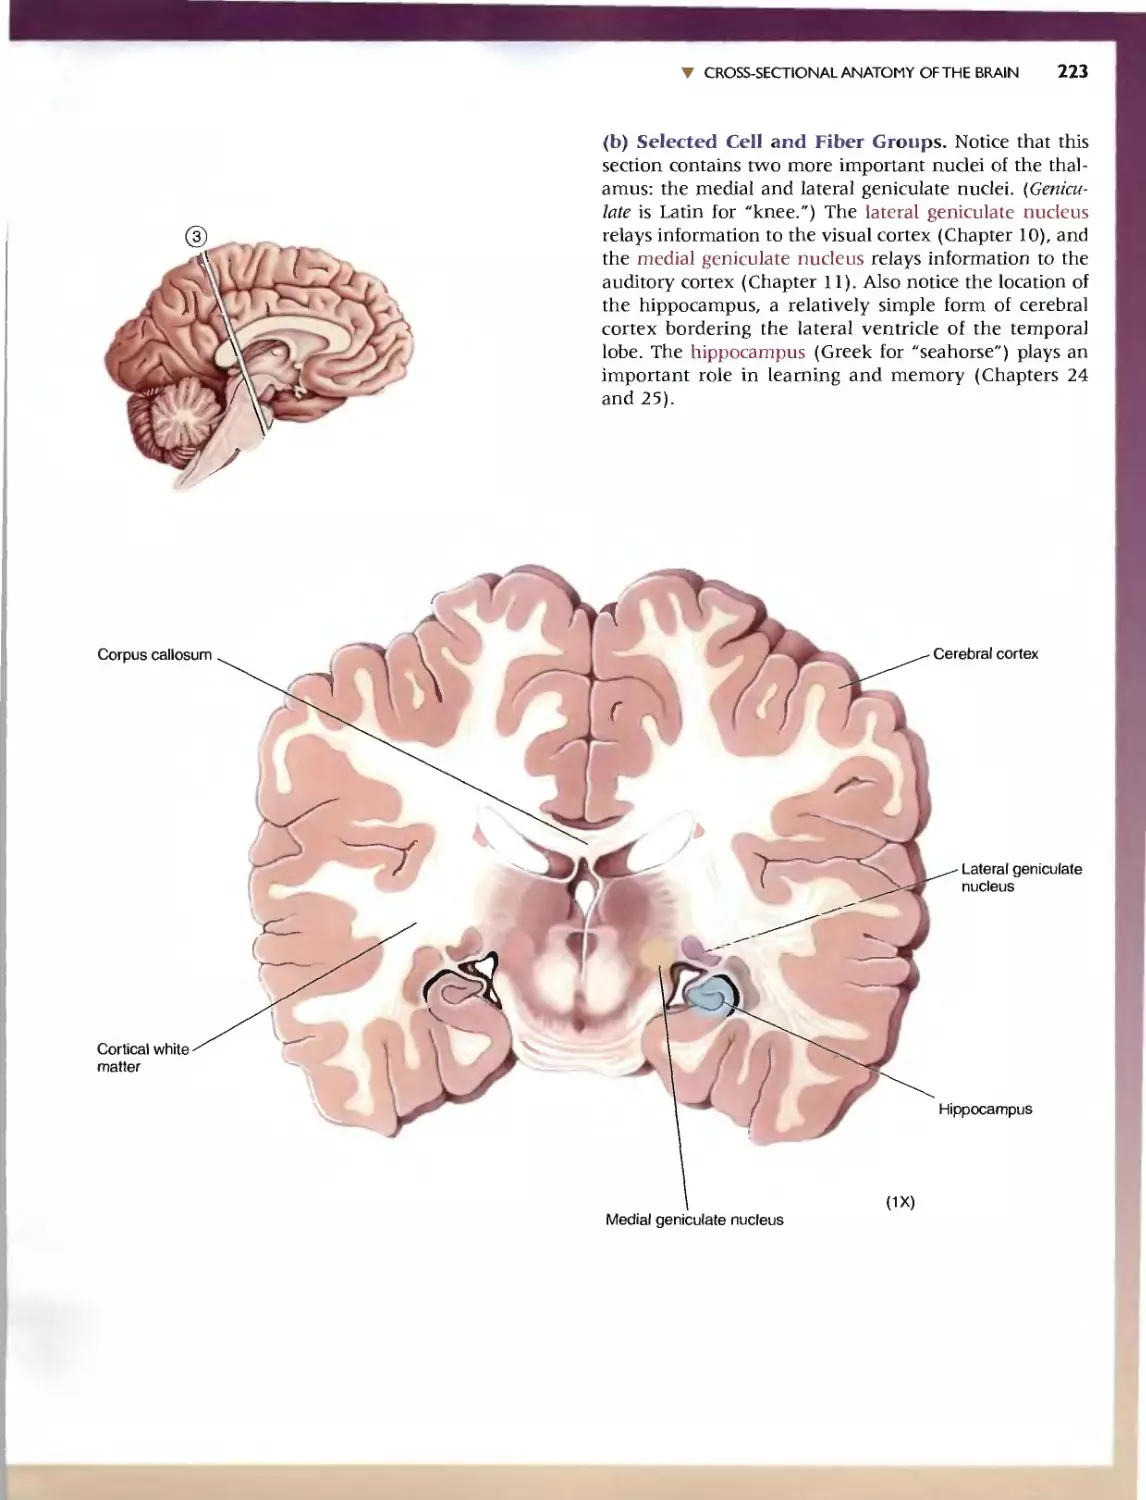


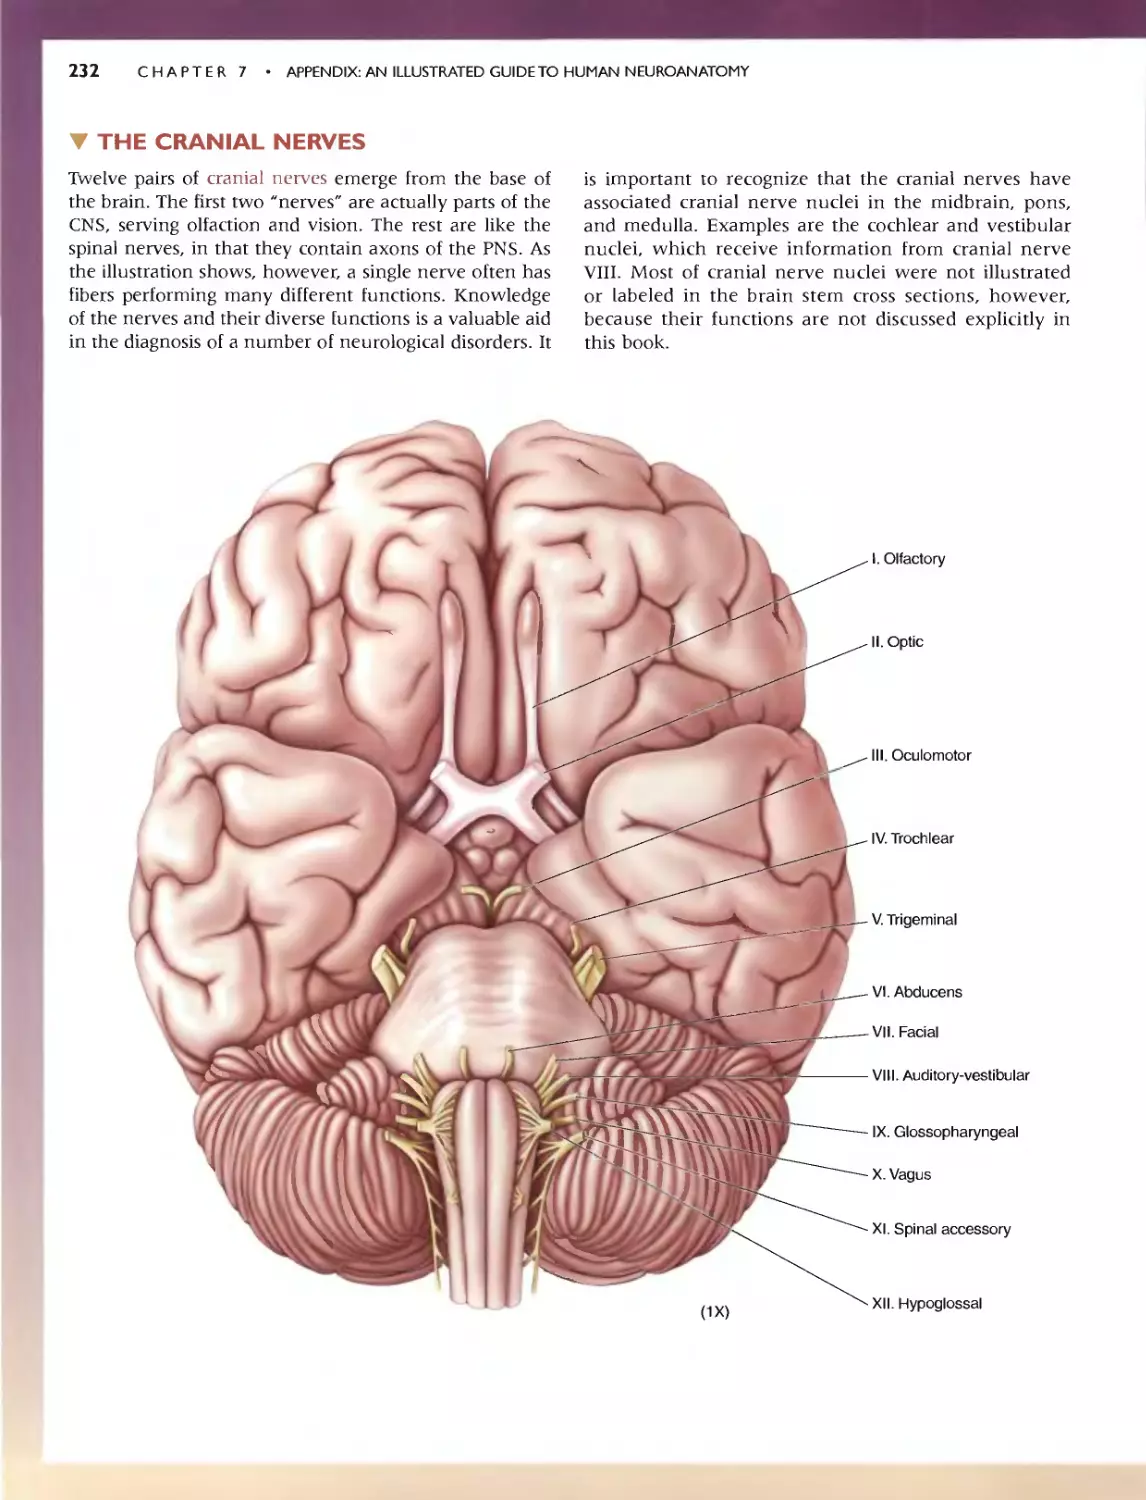


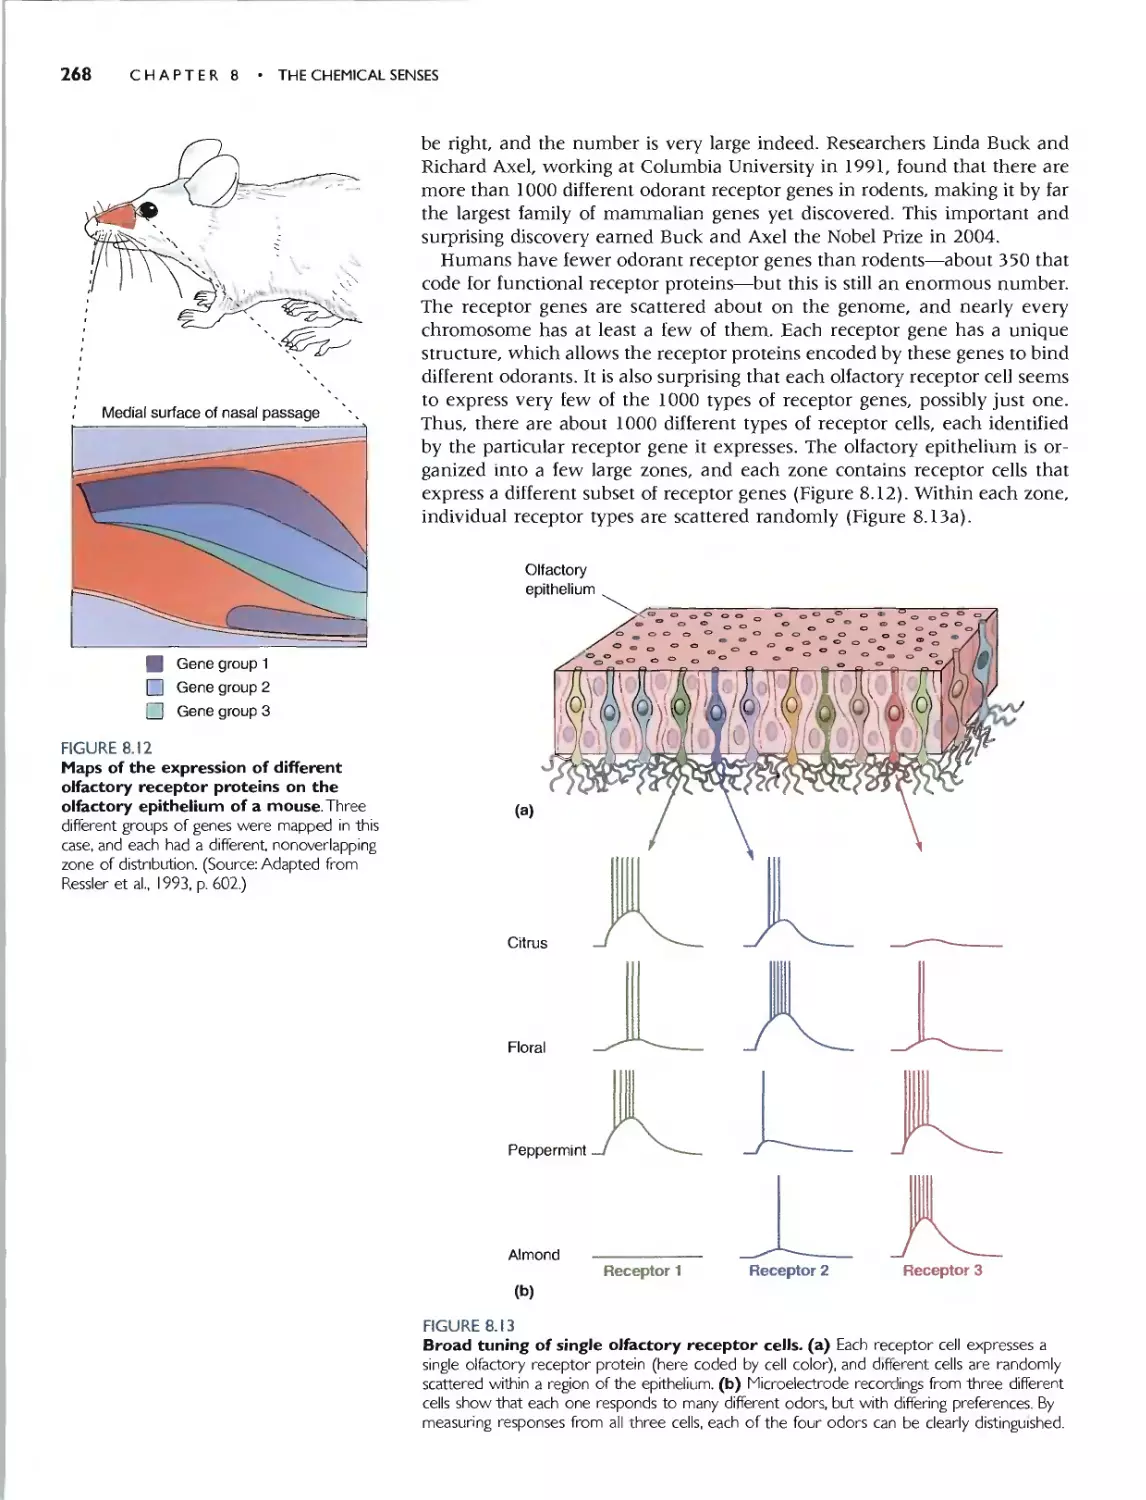
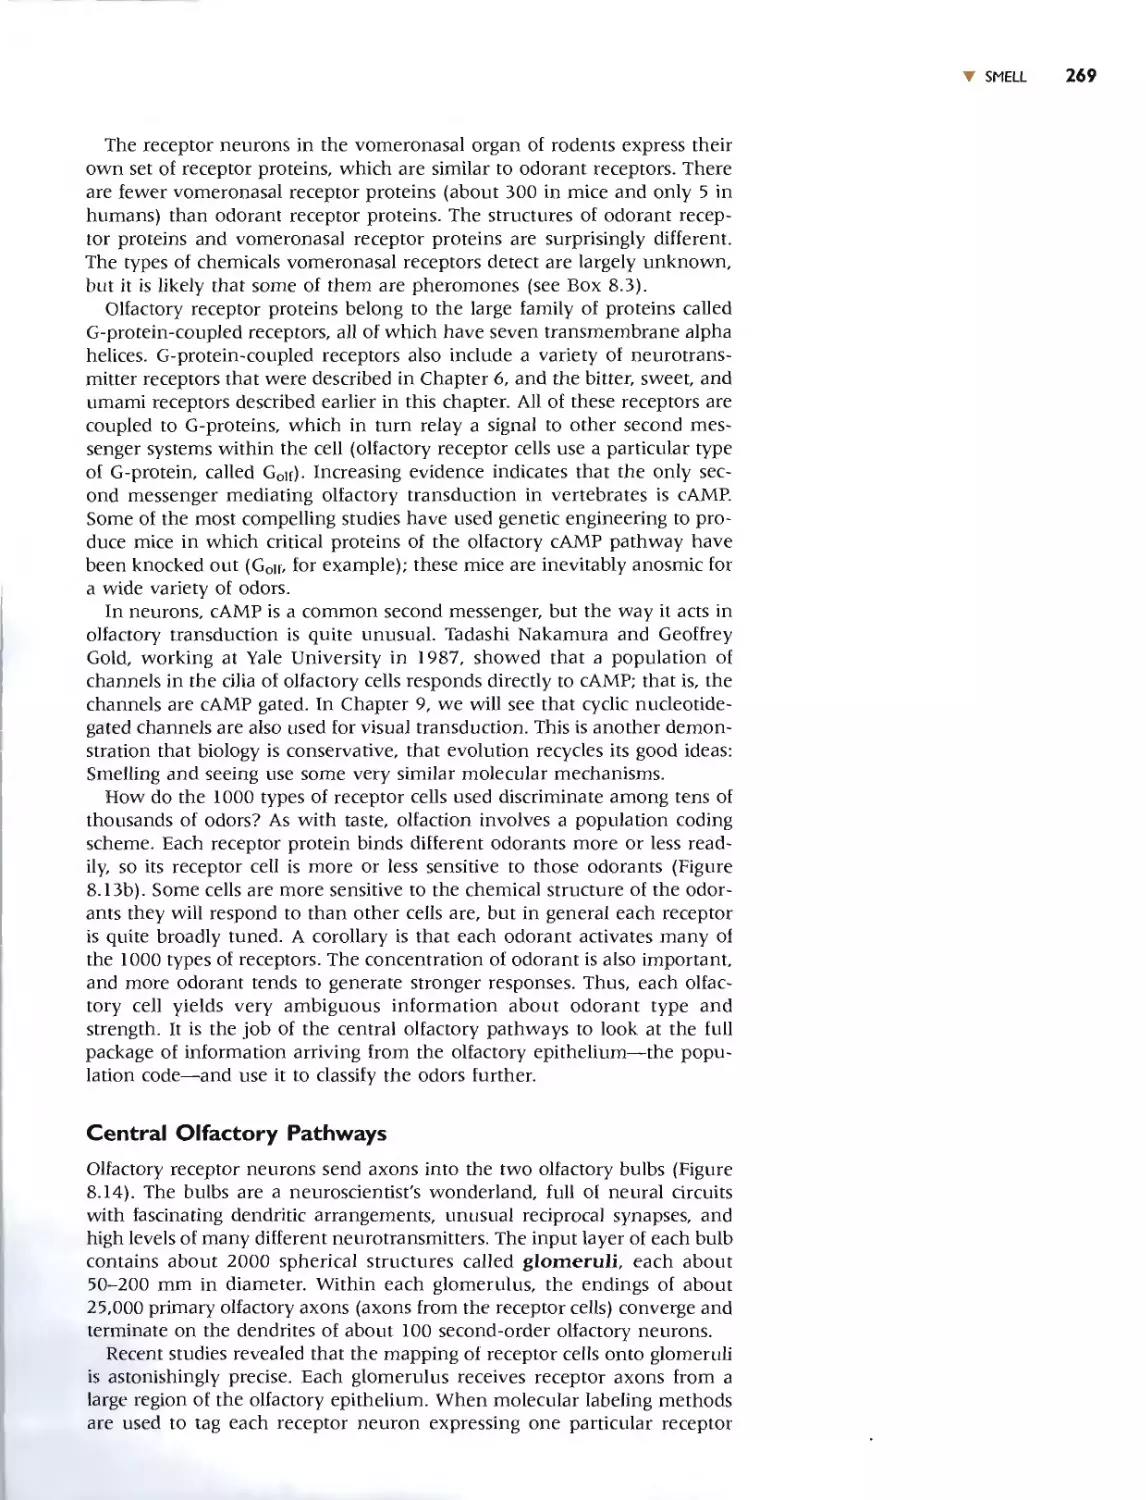

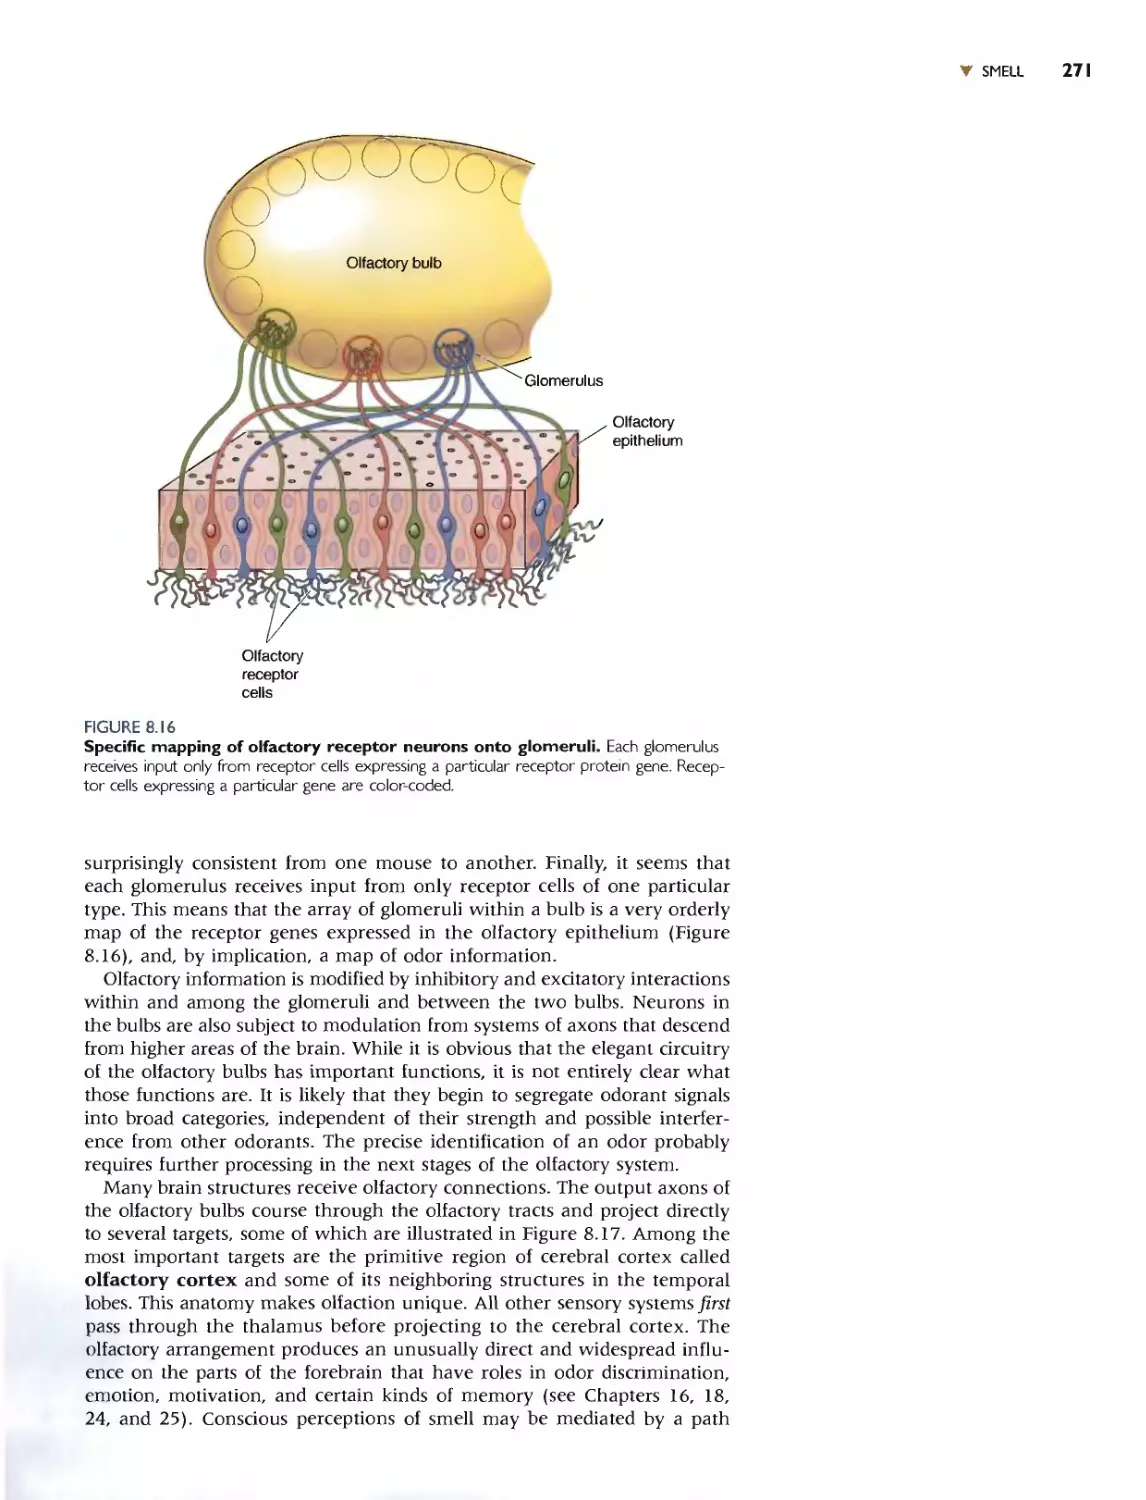
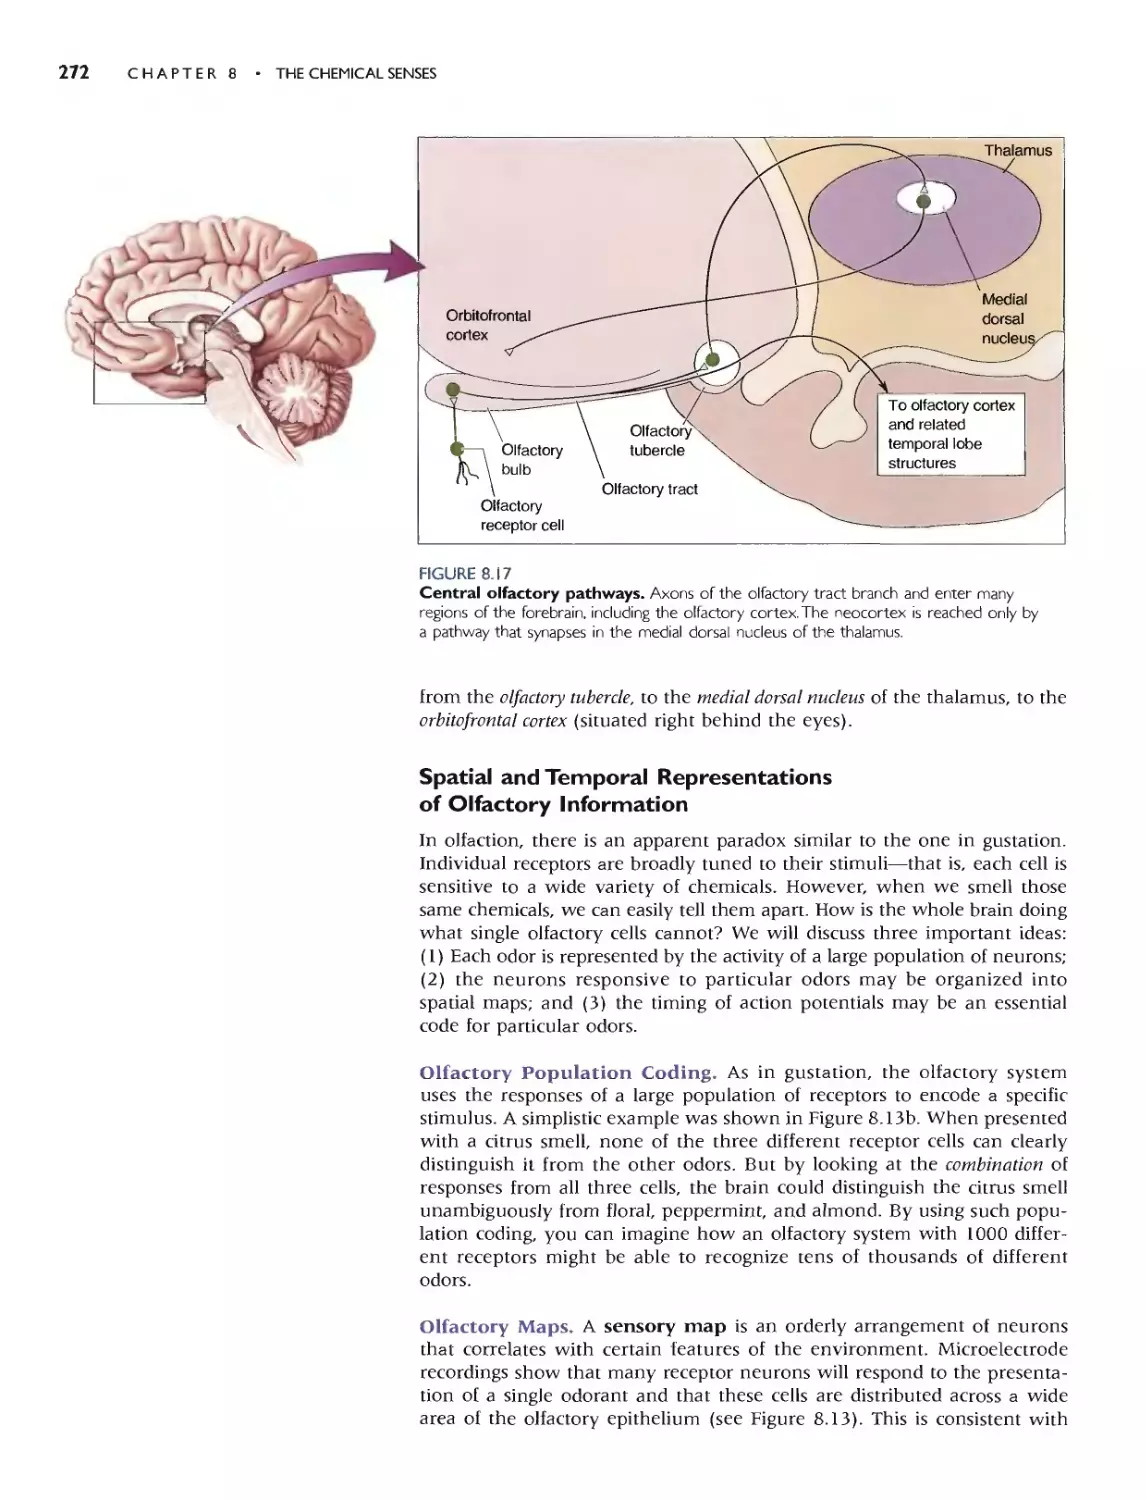


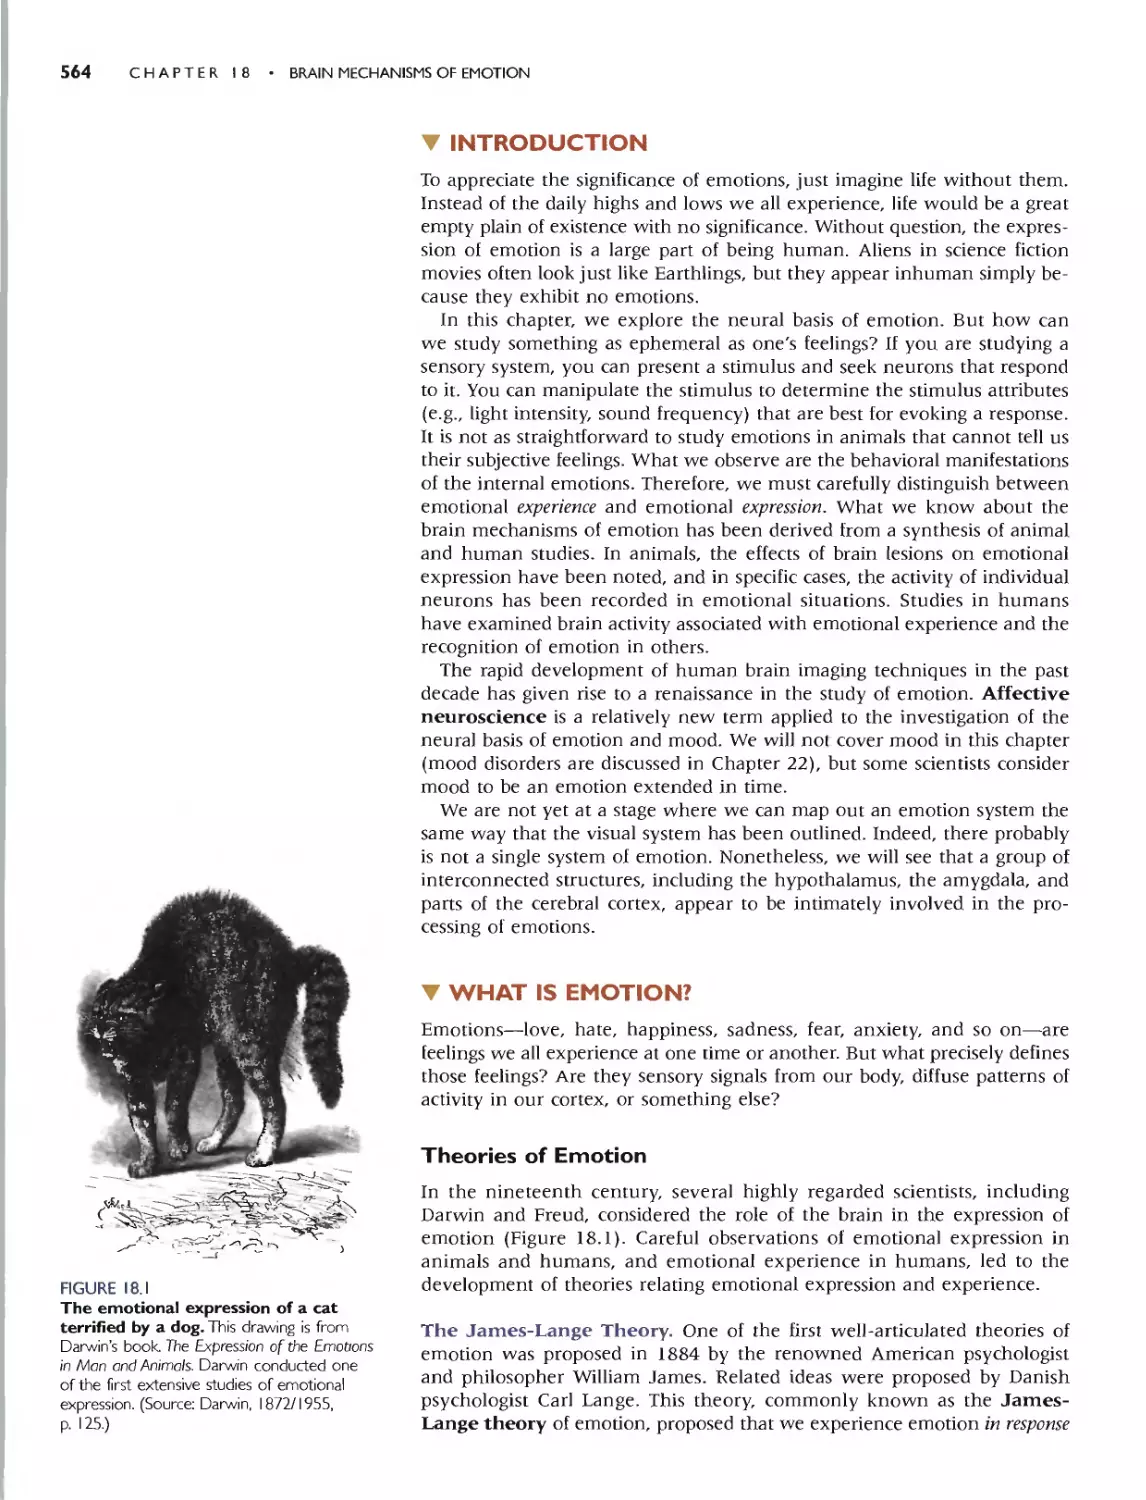


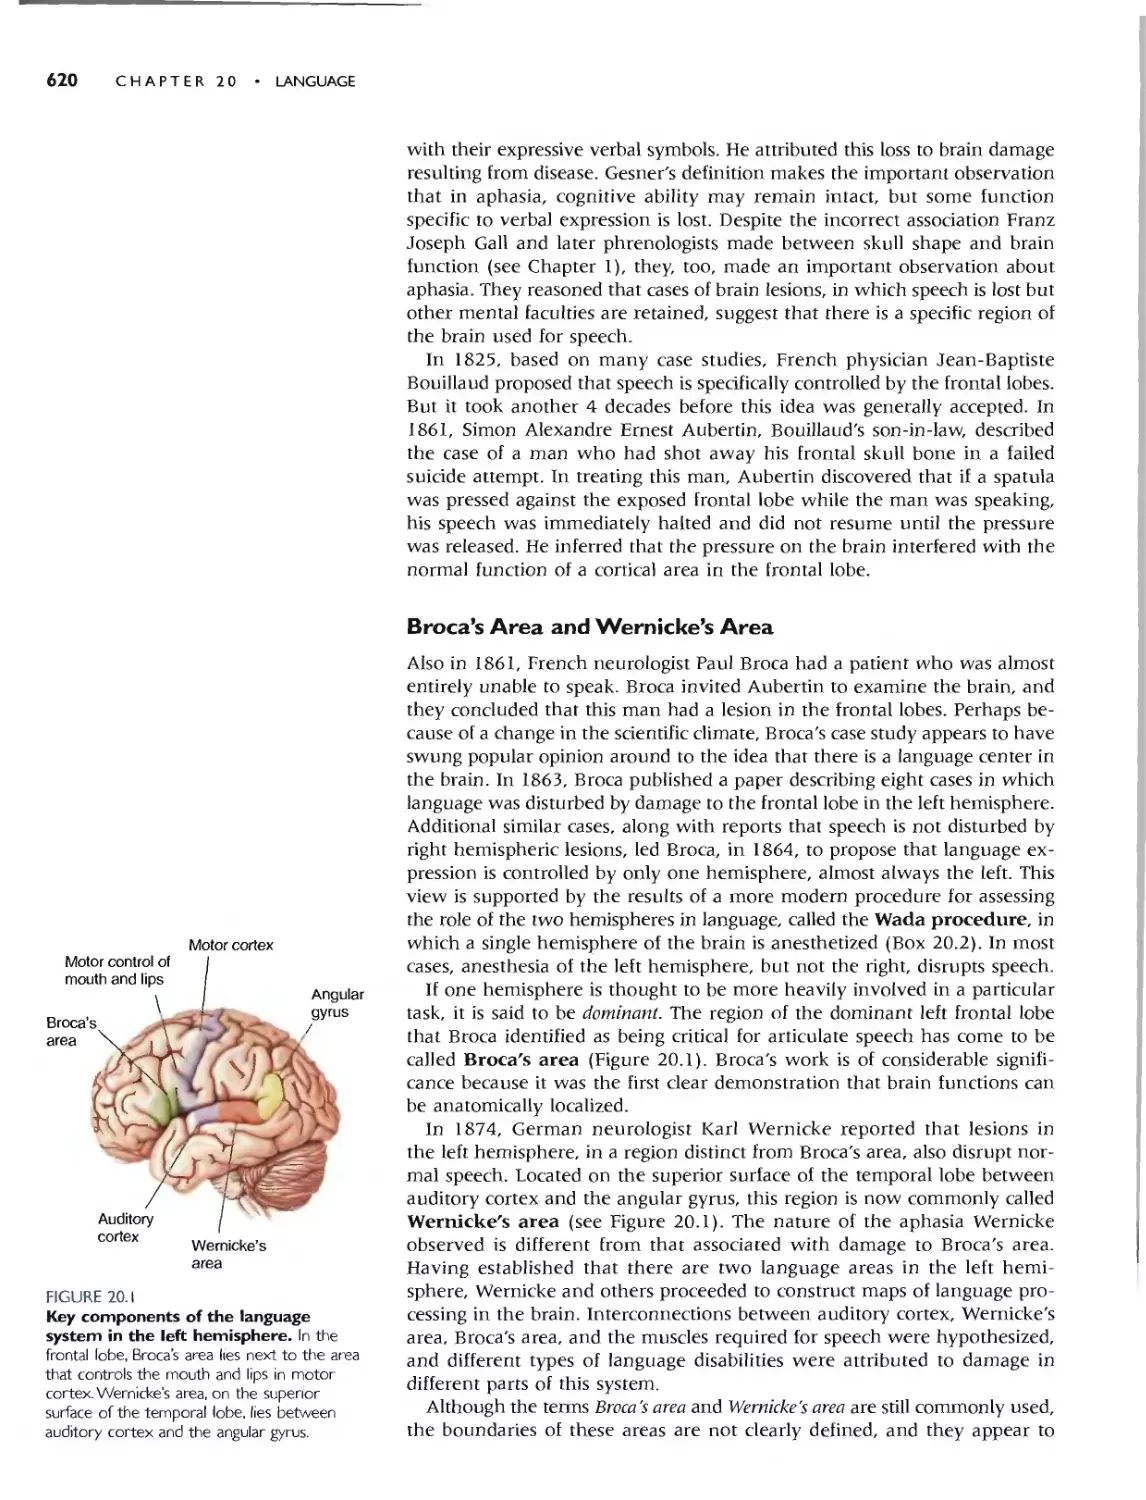


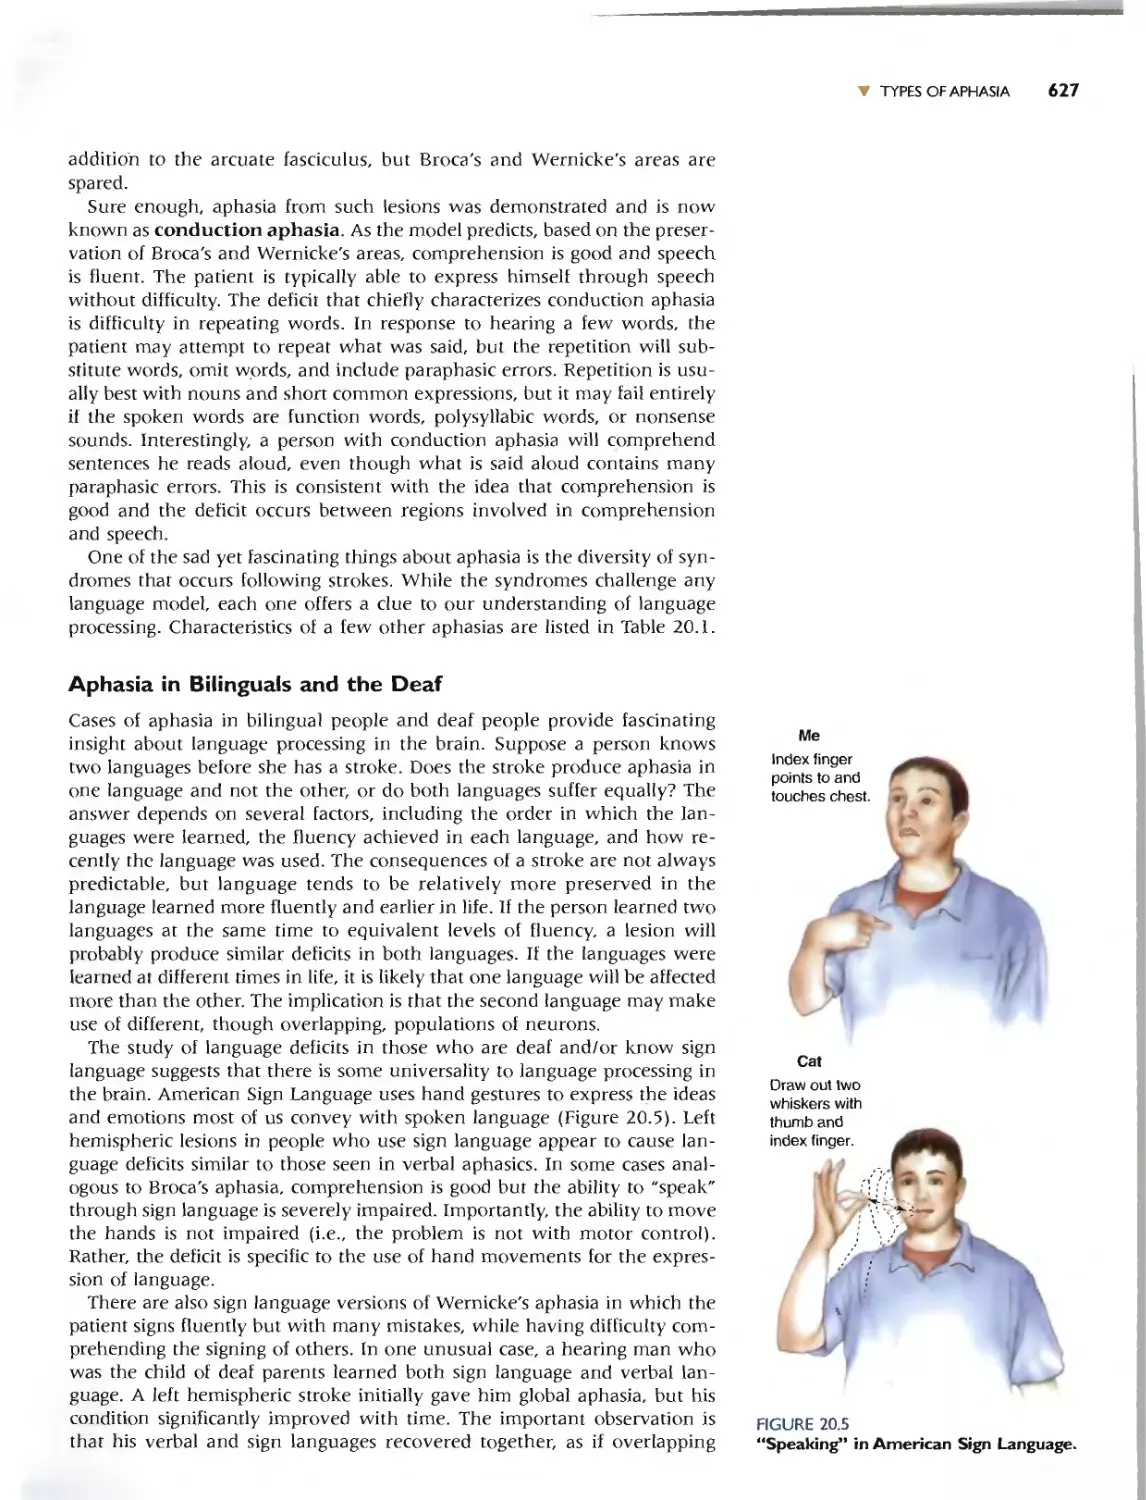


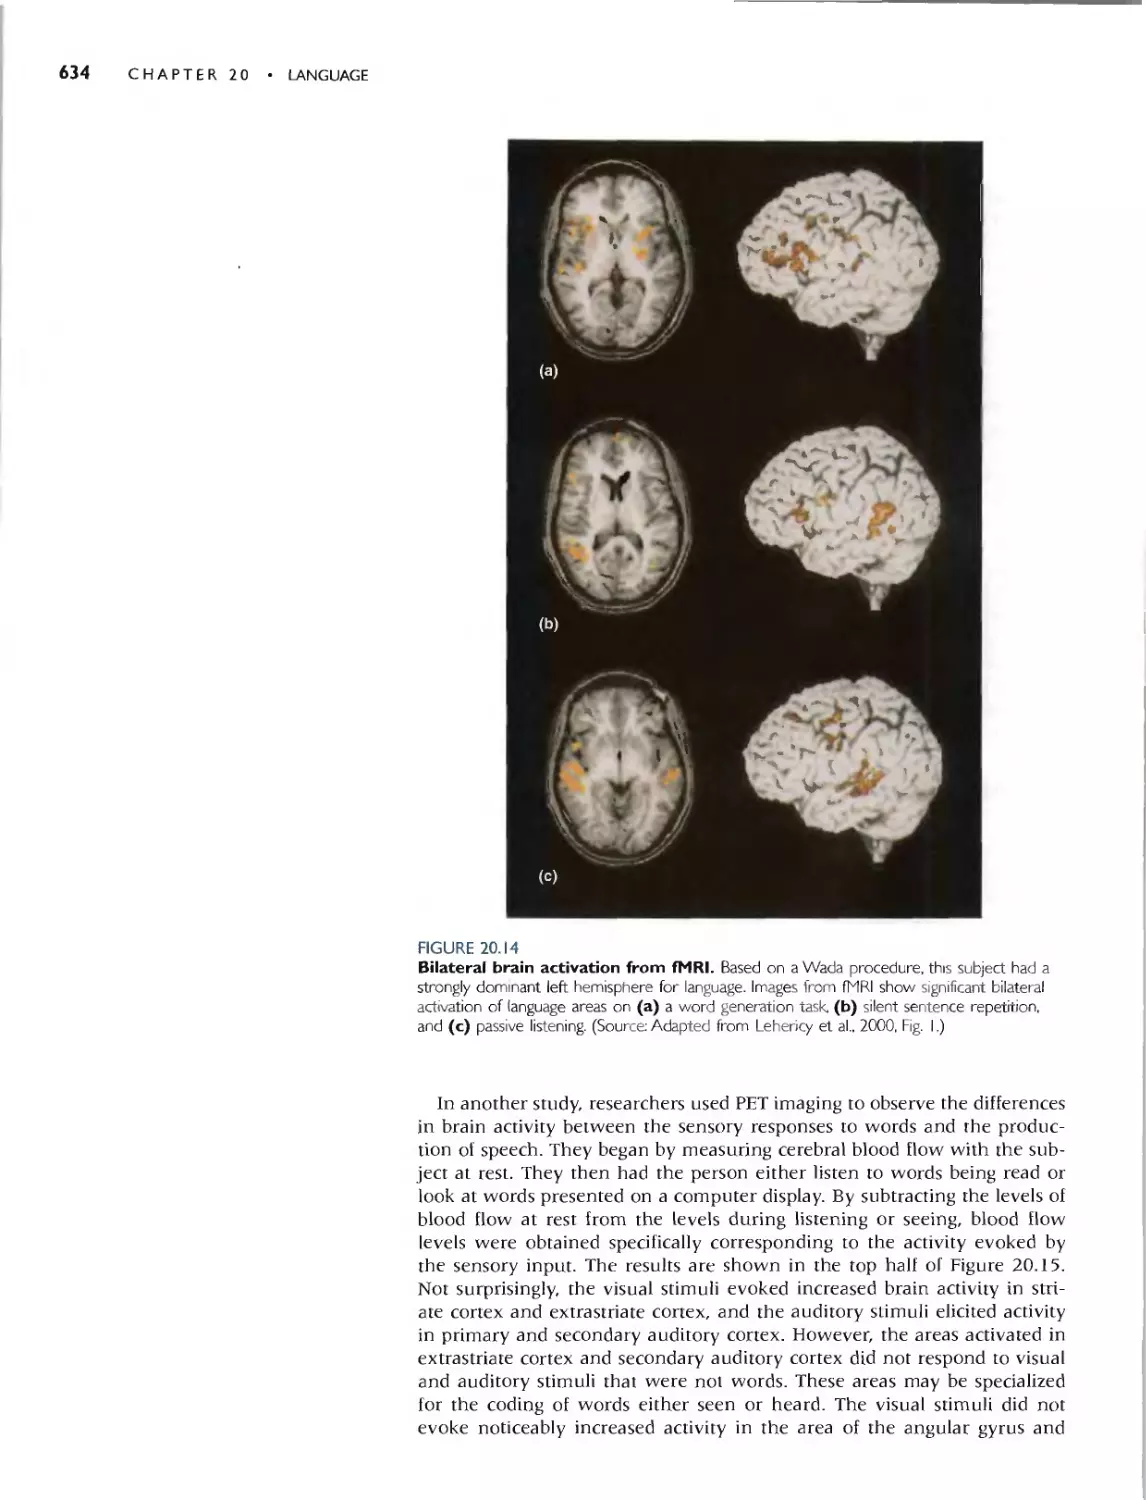
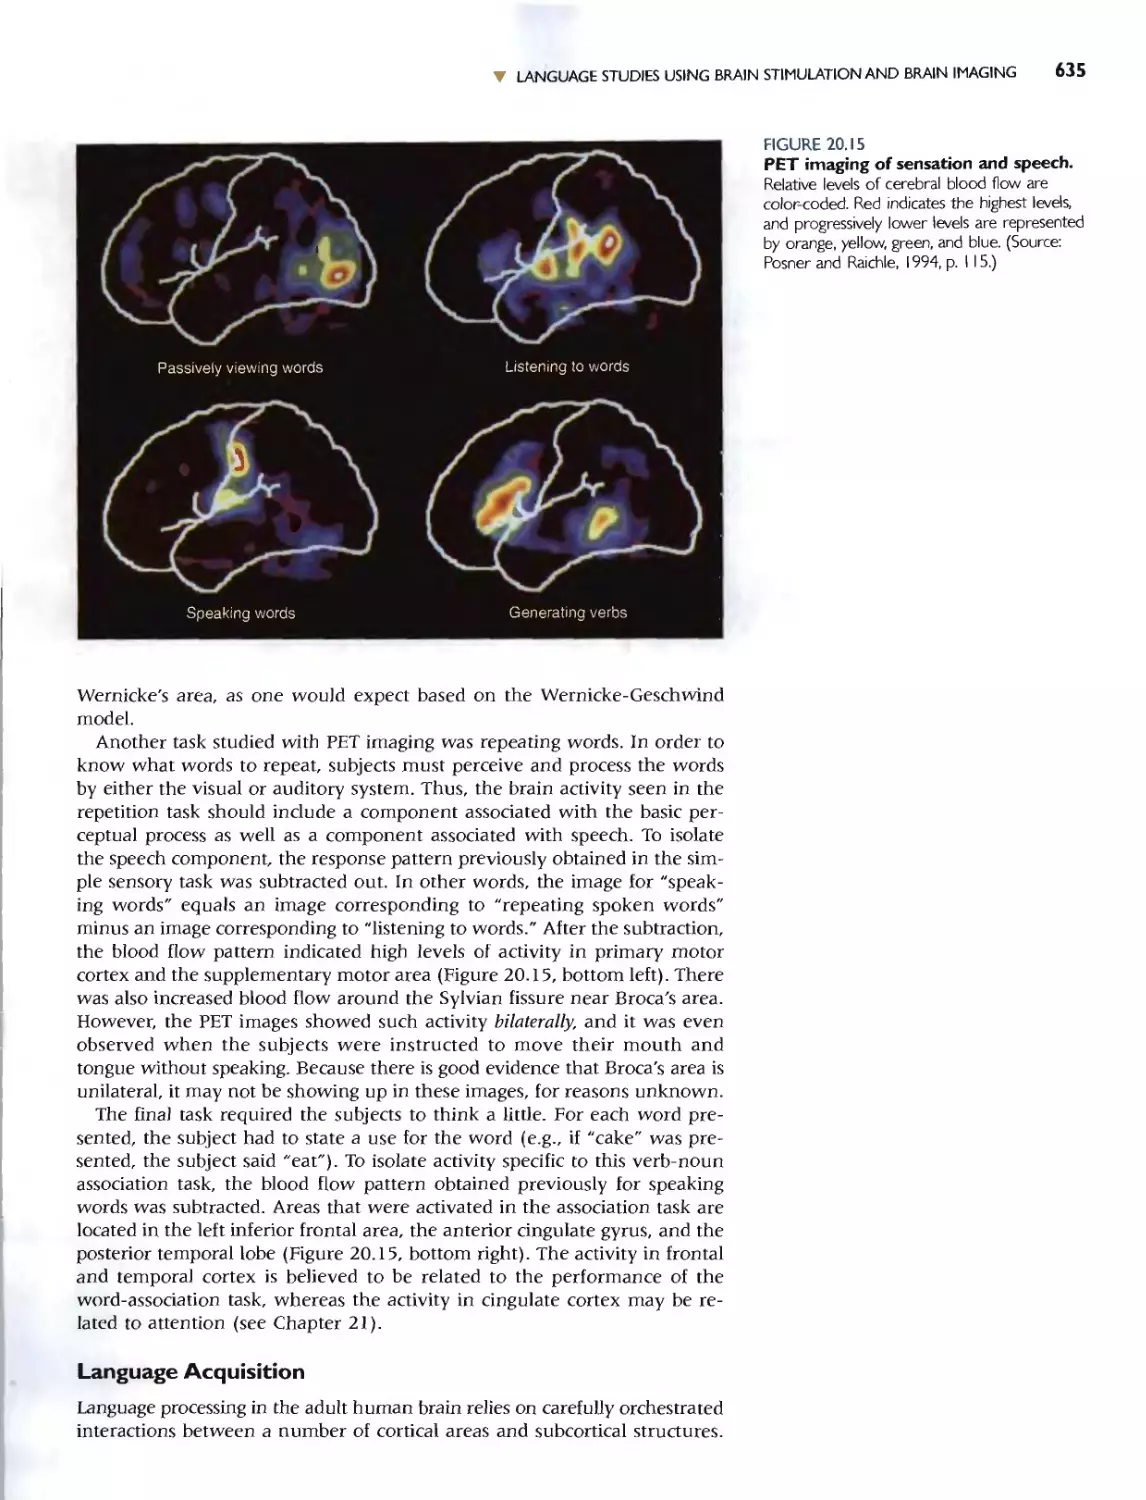


Автор: Bear M.F. Connors B.W. Paradiso M.A.
Теги: medicine biology microbiology science neuroscience exploring the brain brain
Год: 2007


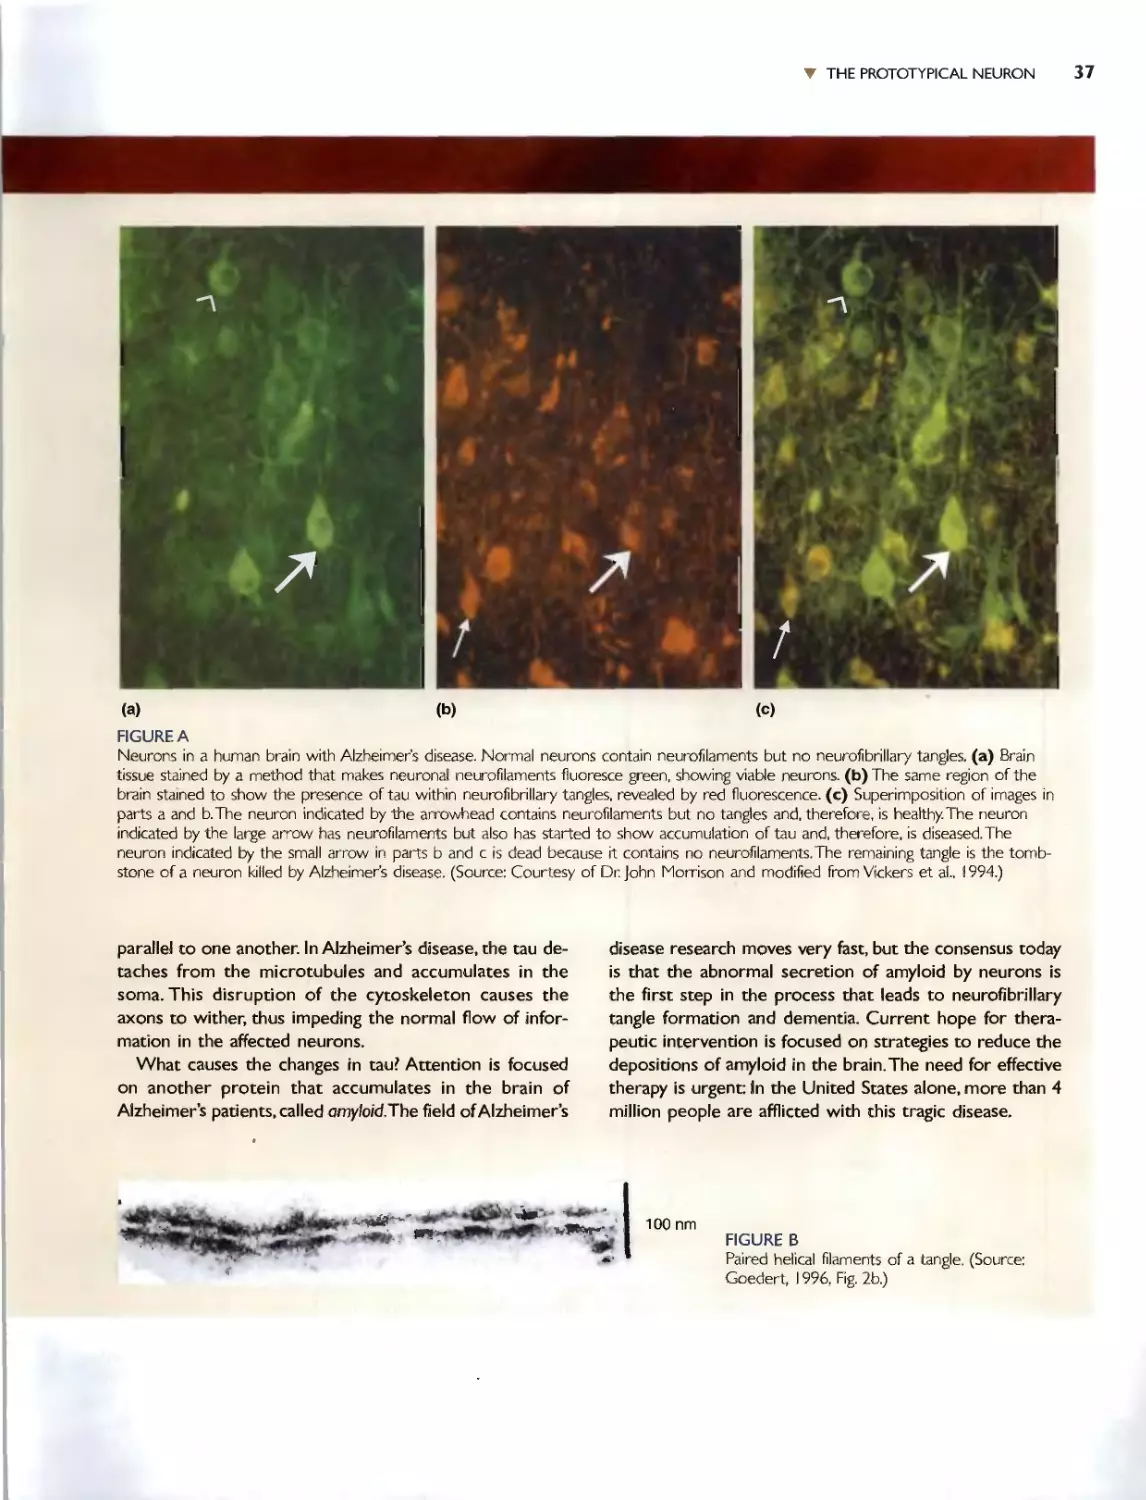
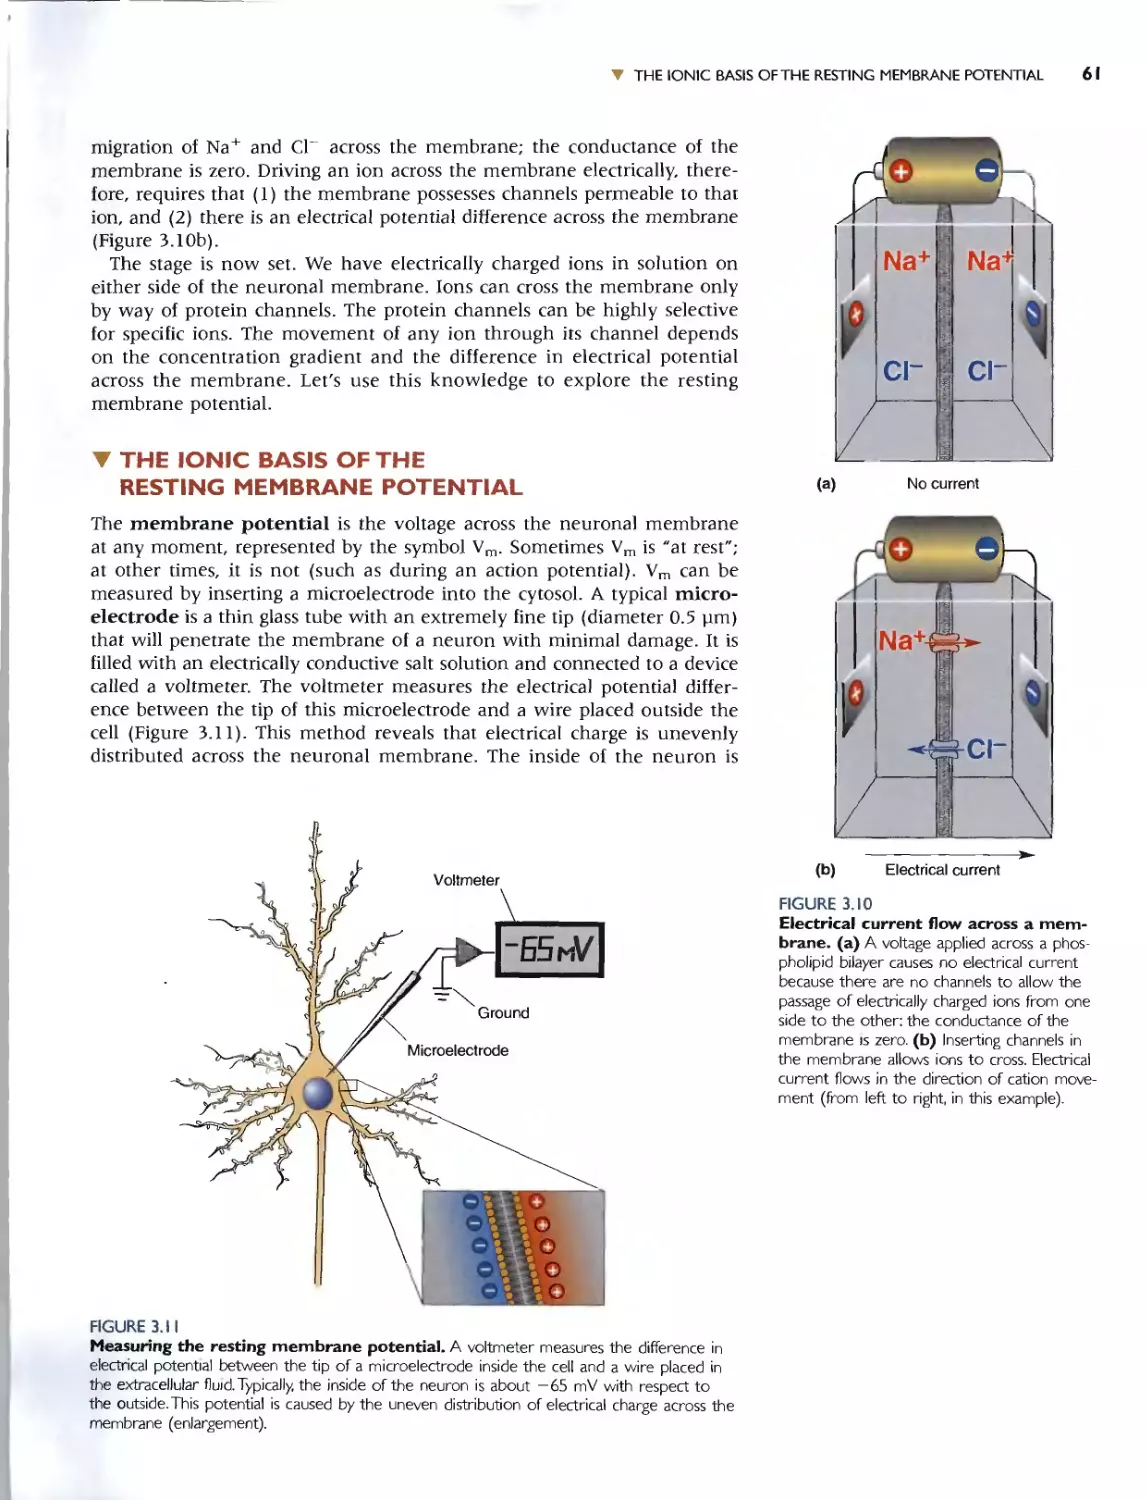
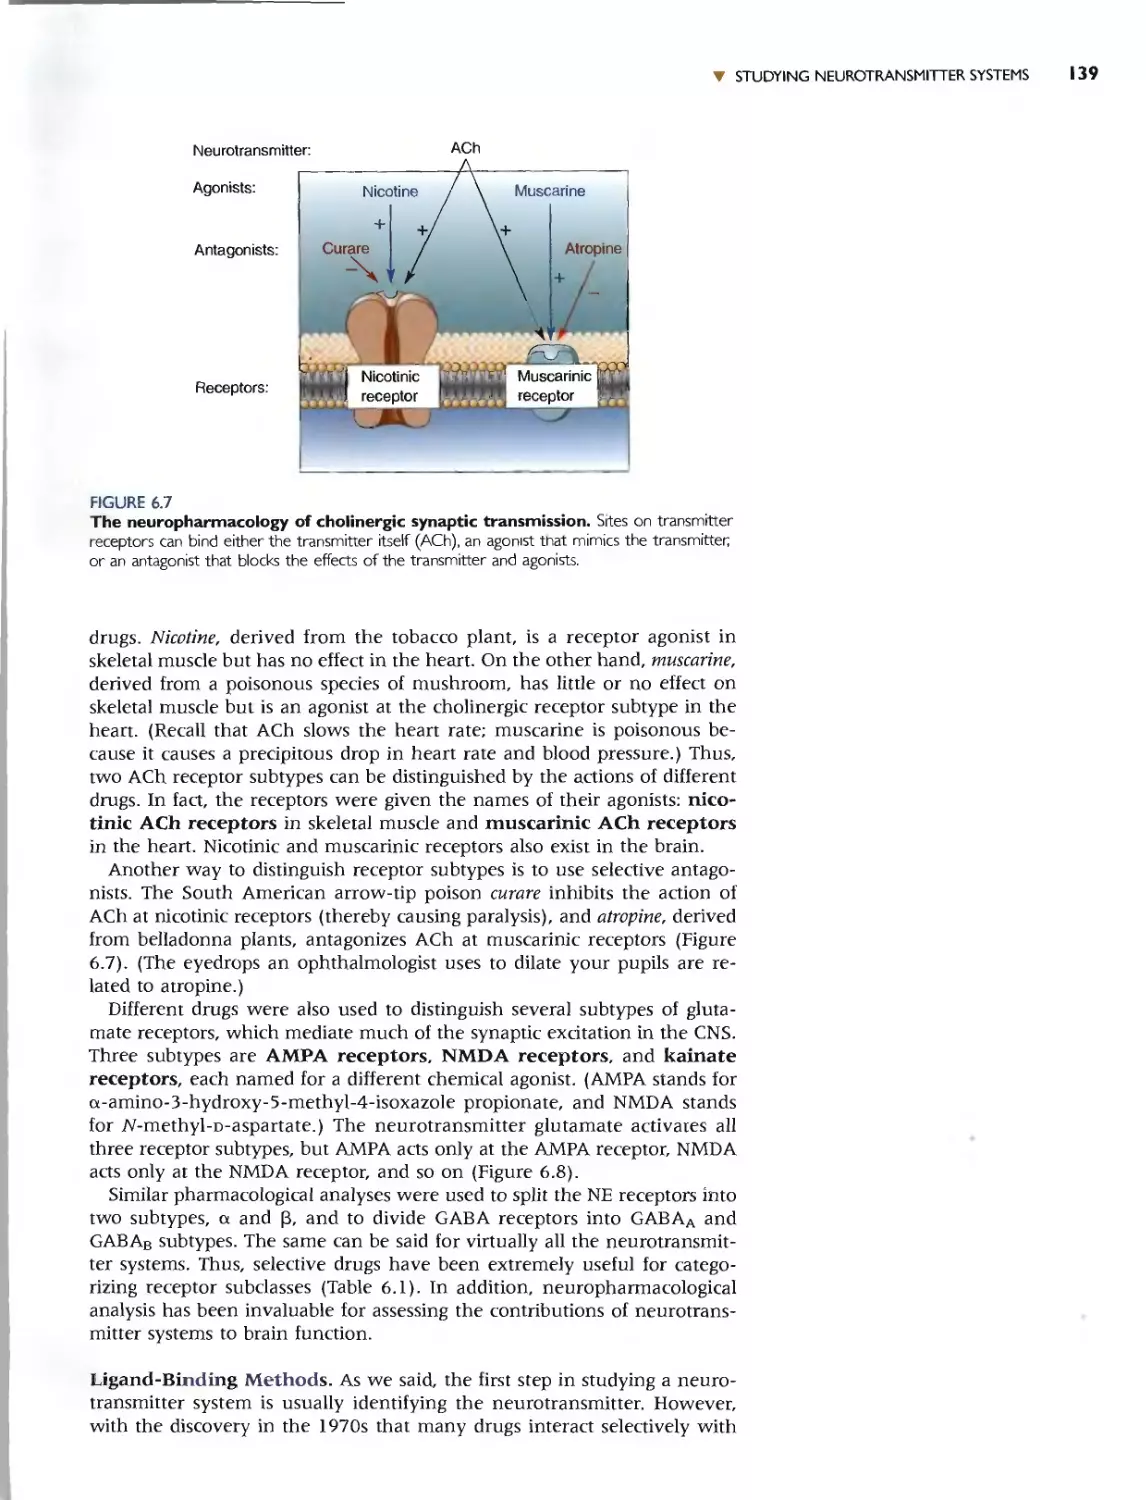
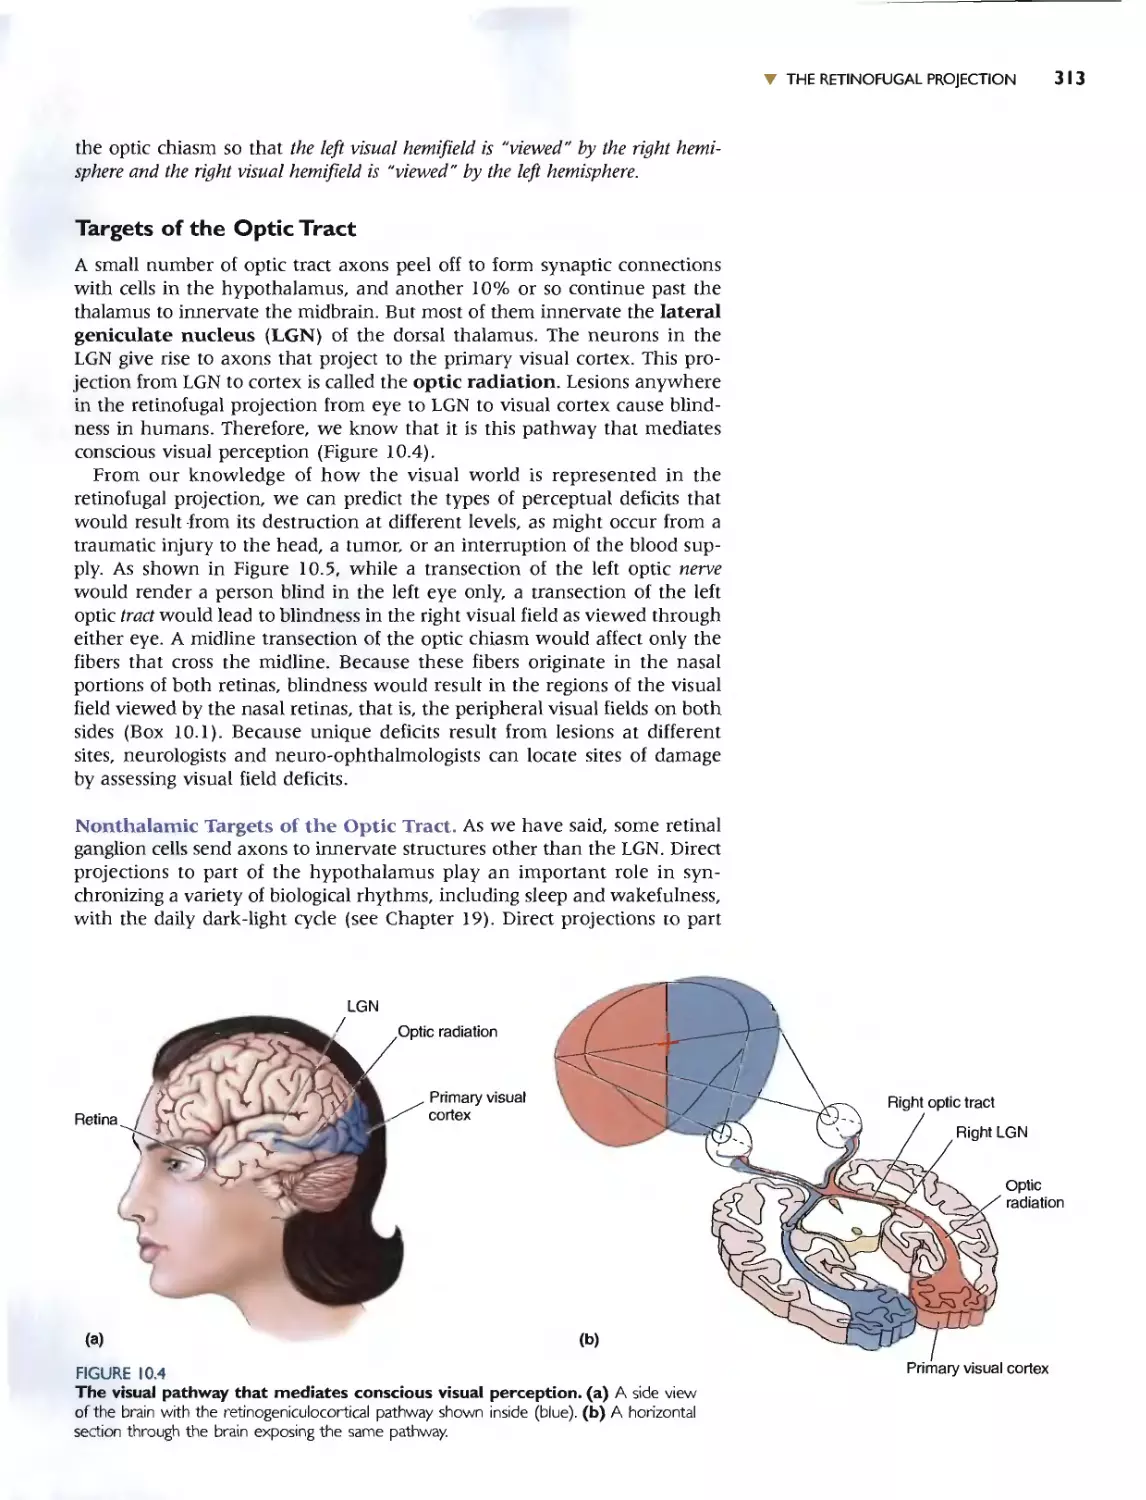
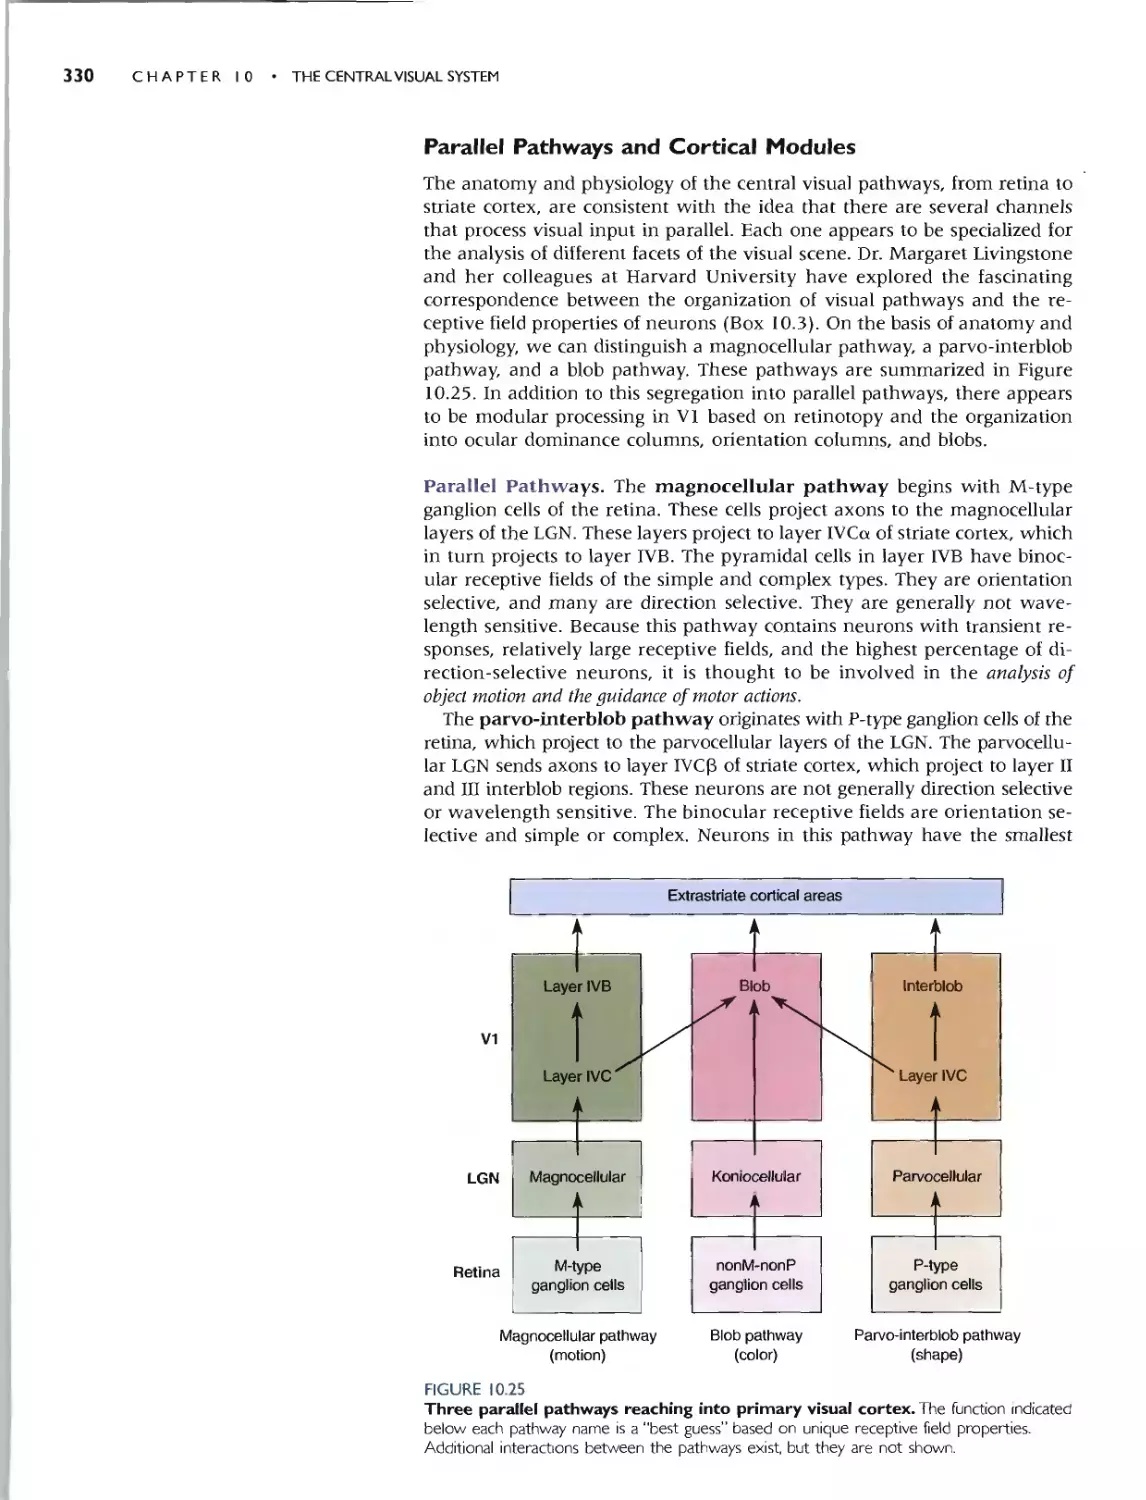
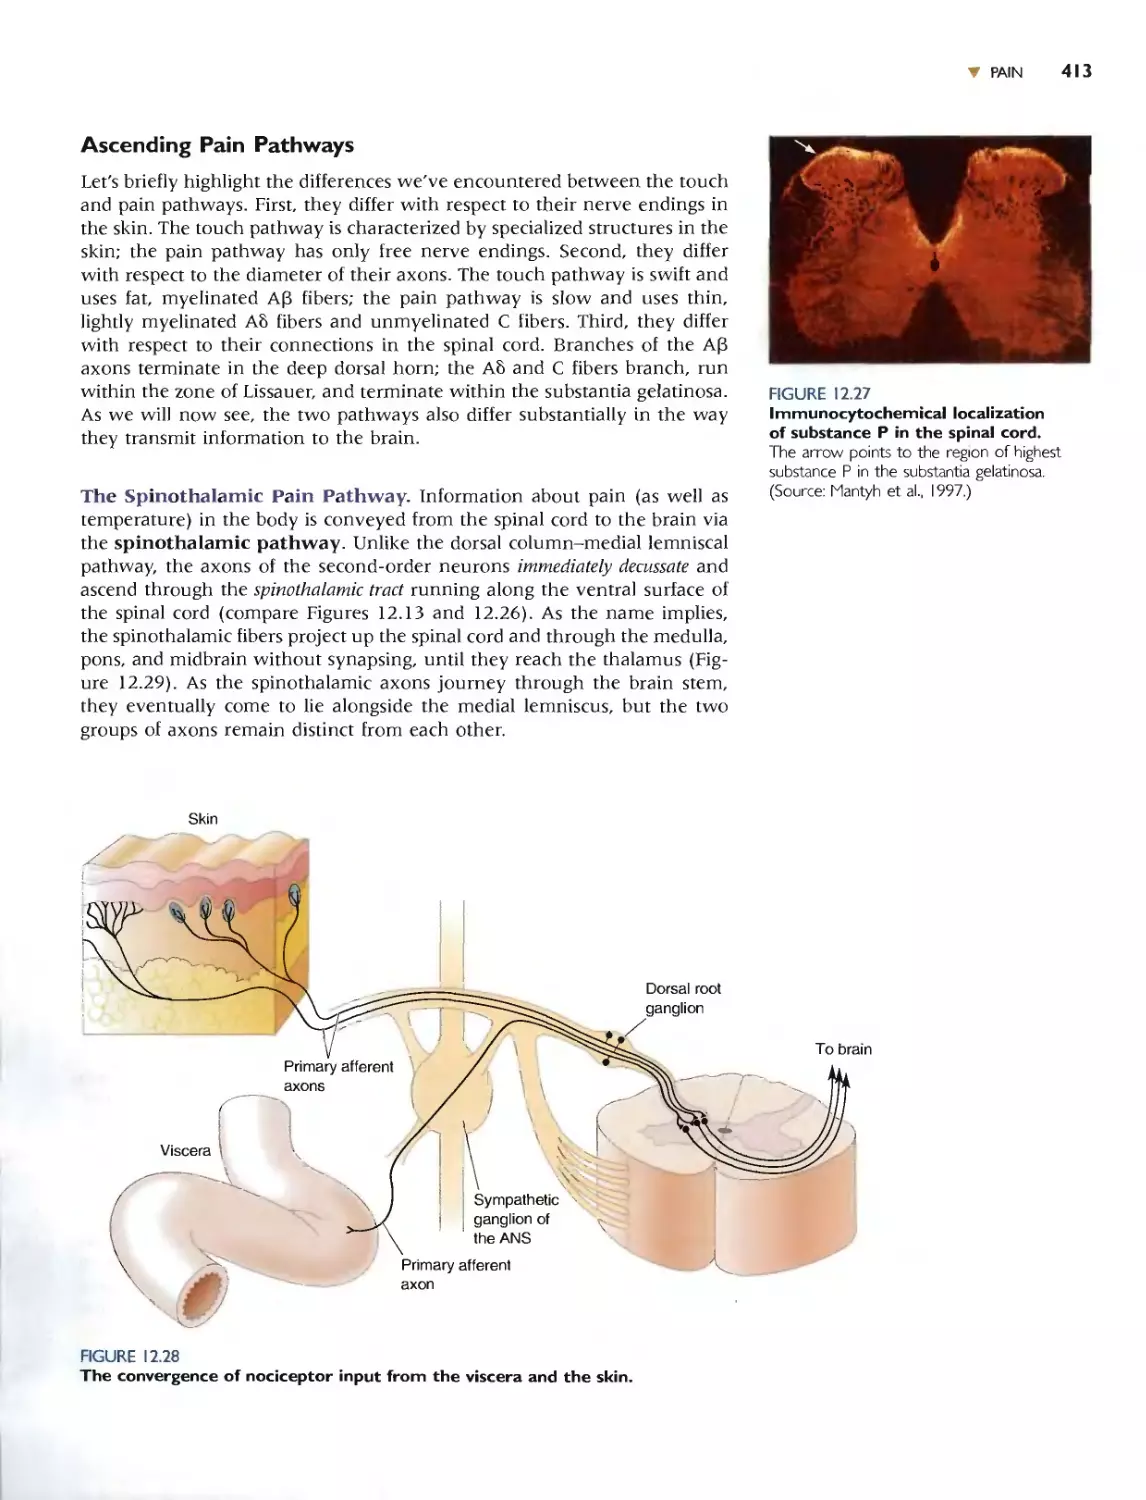
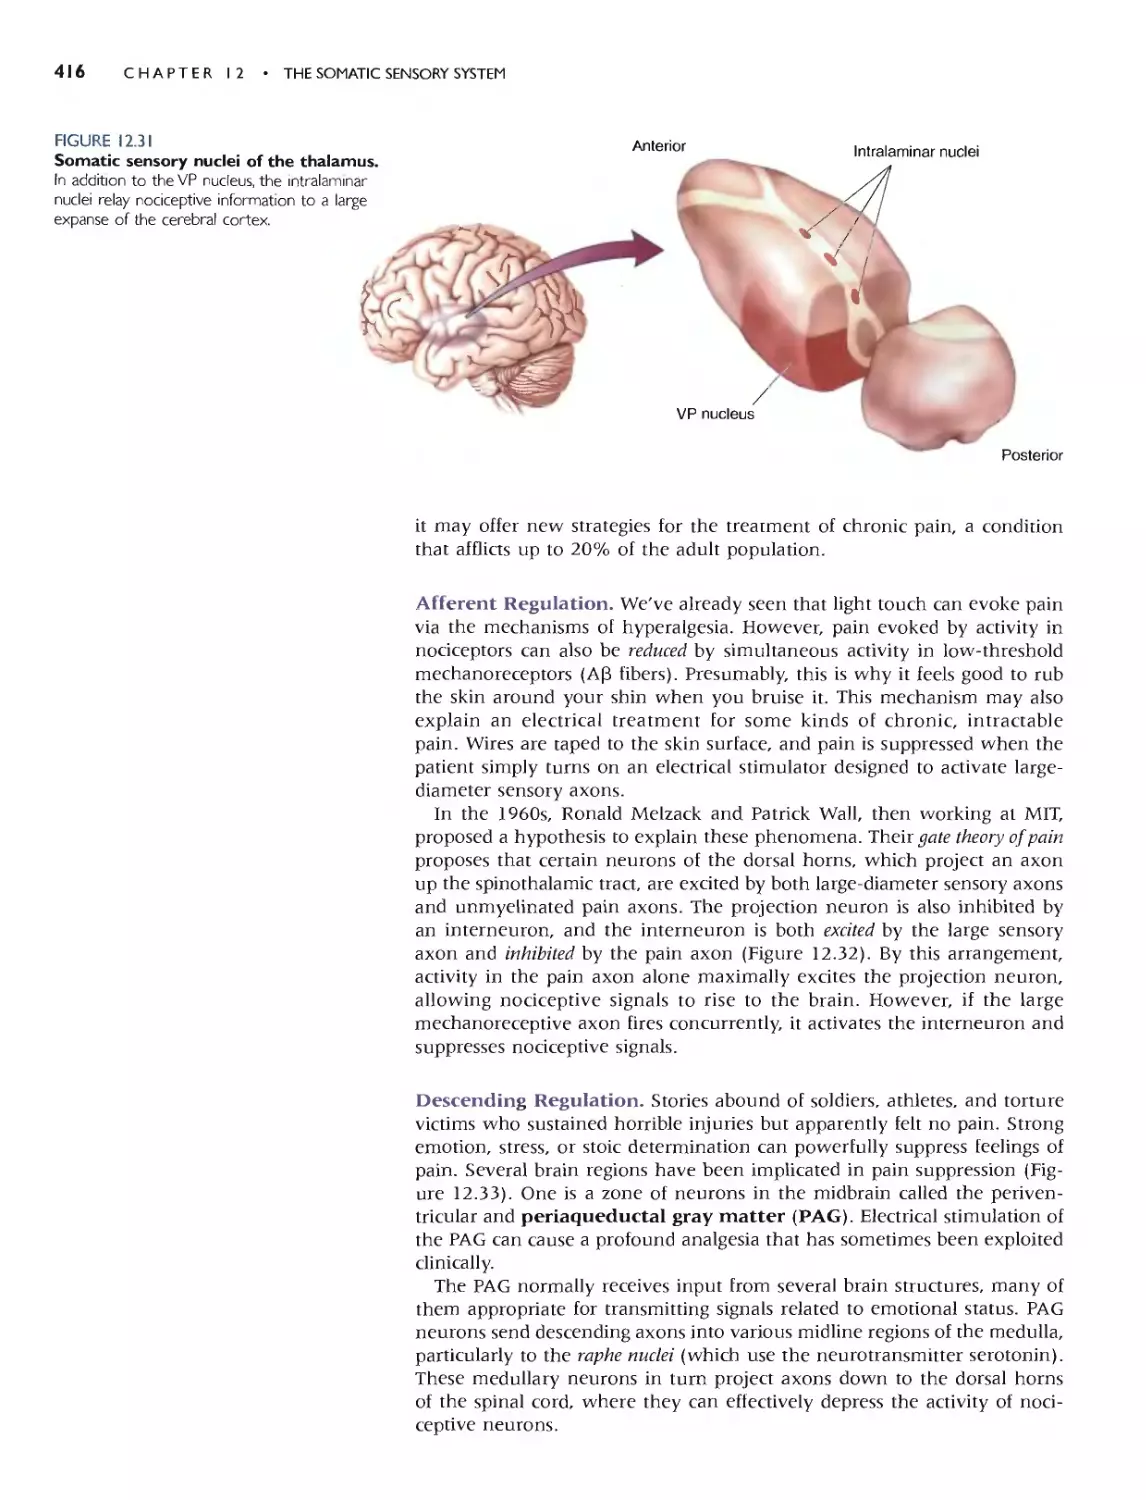
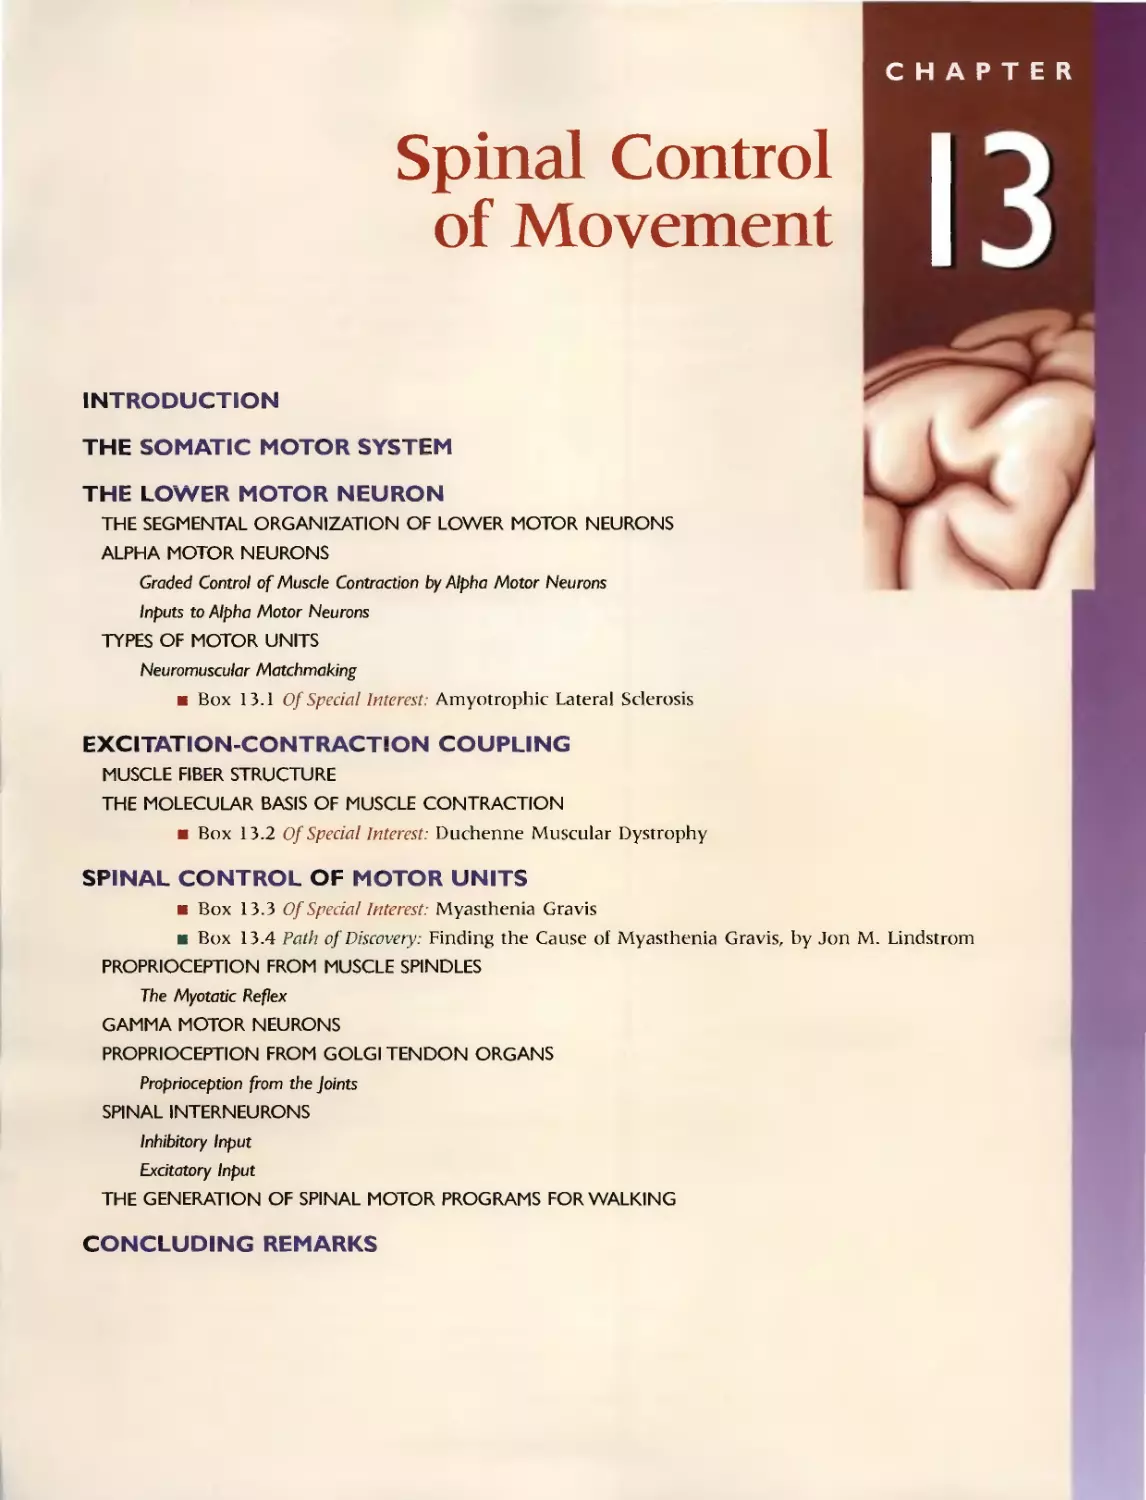
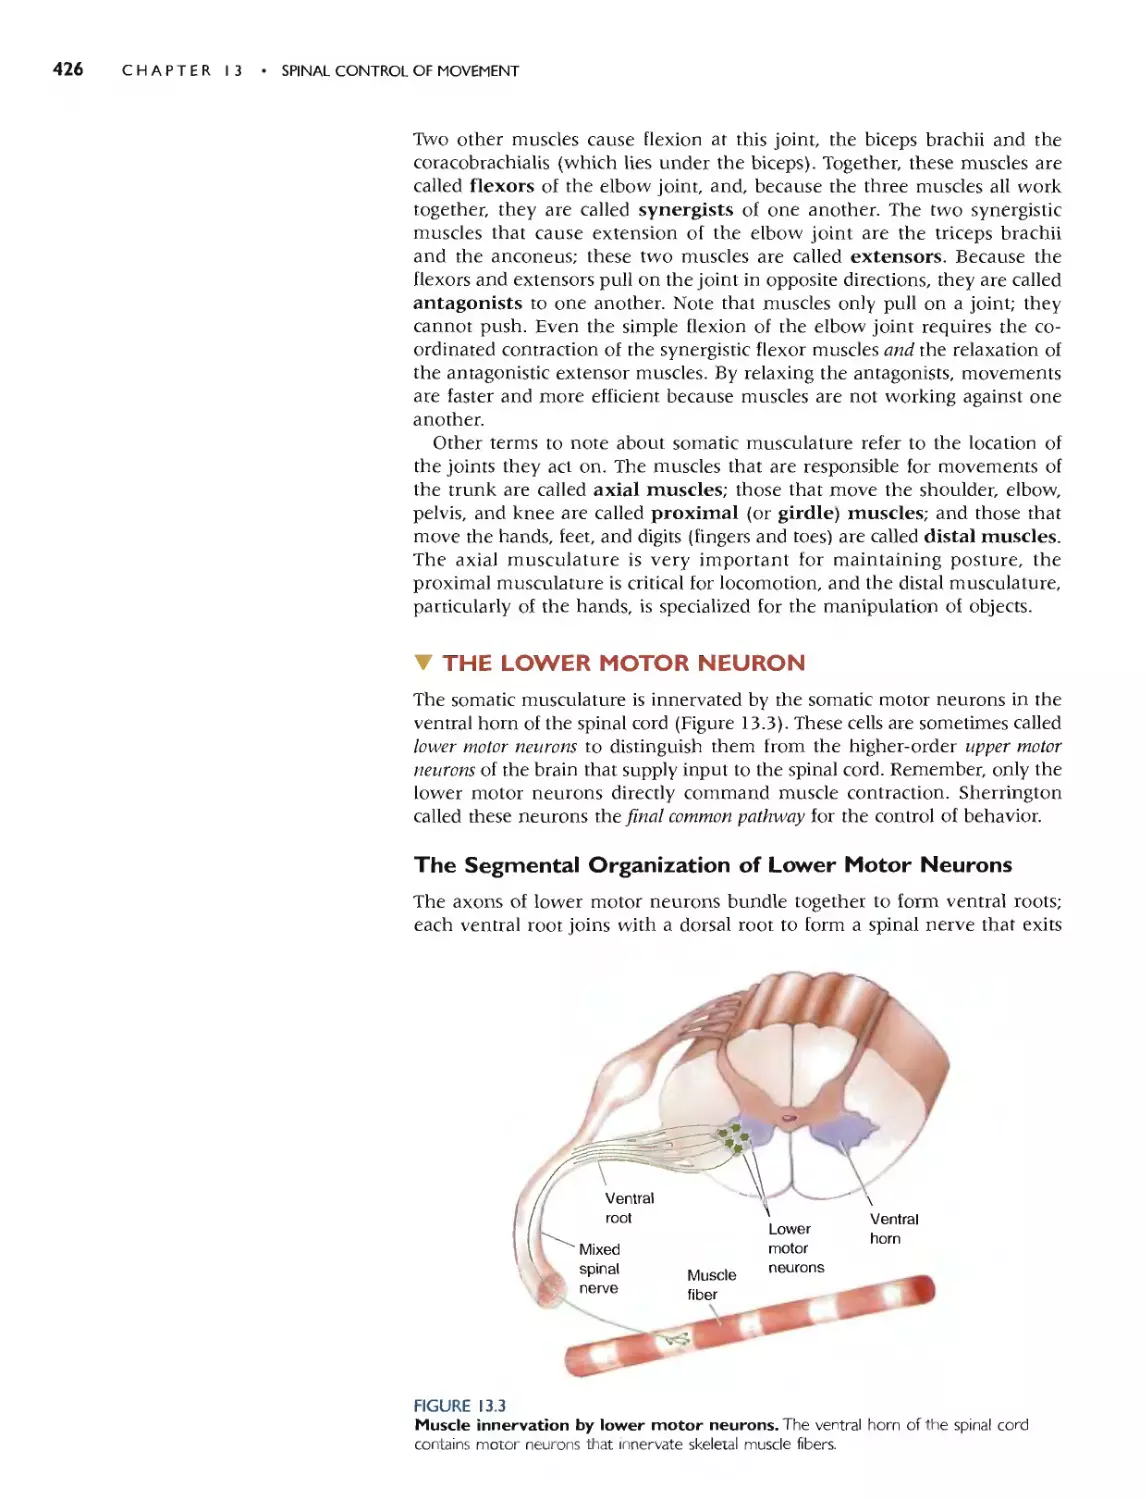
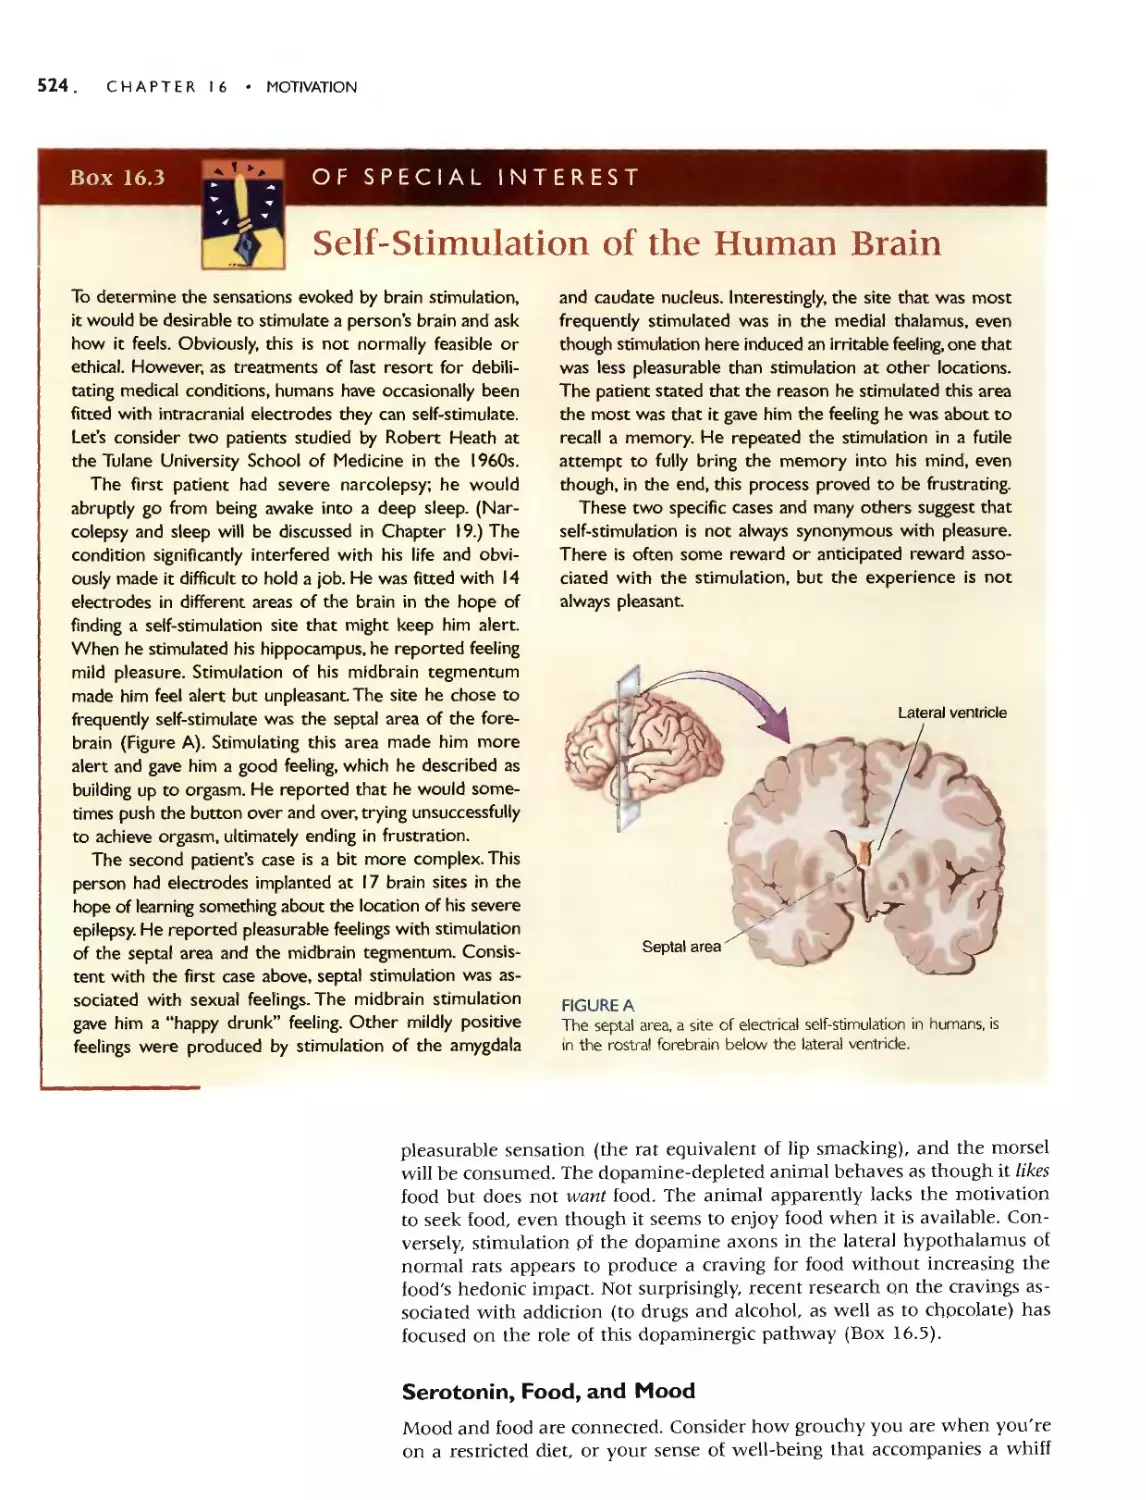
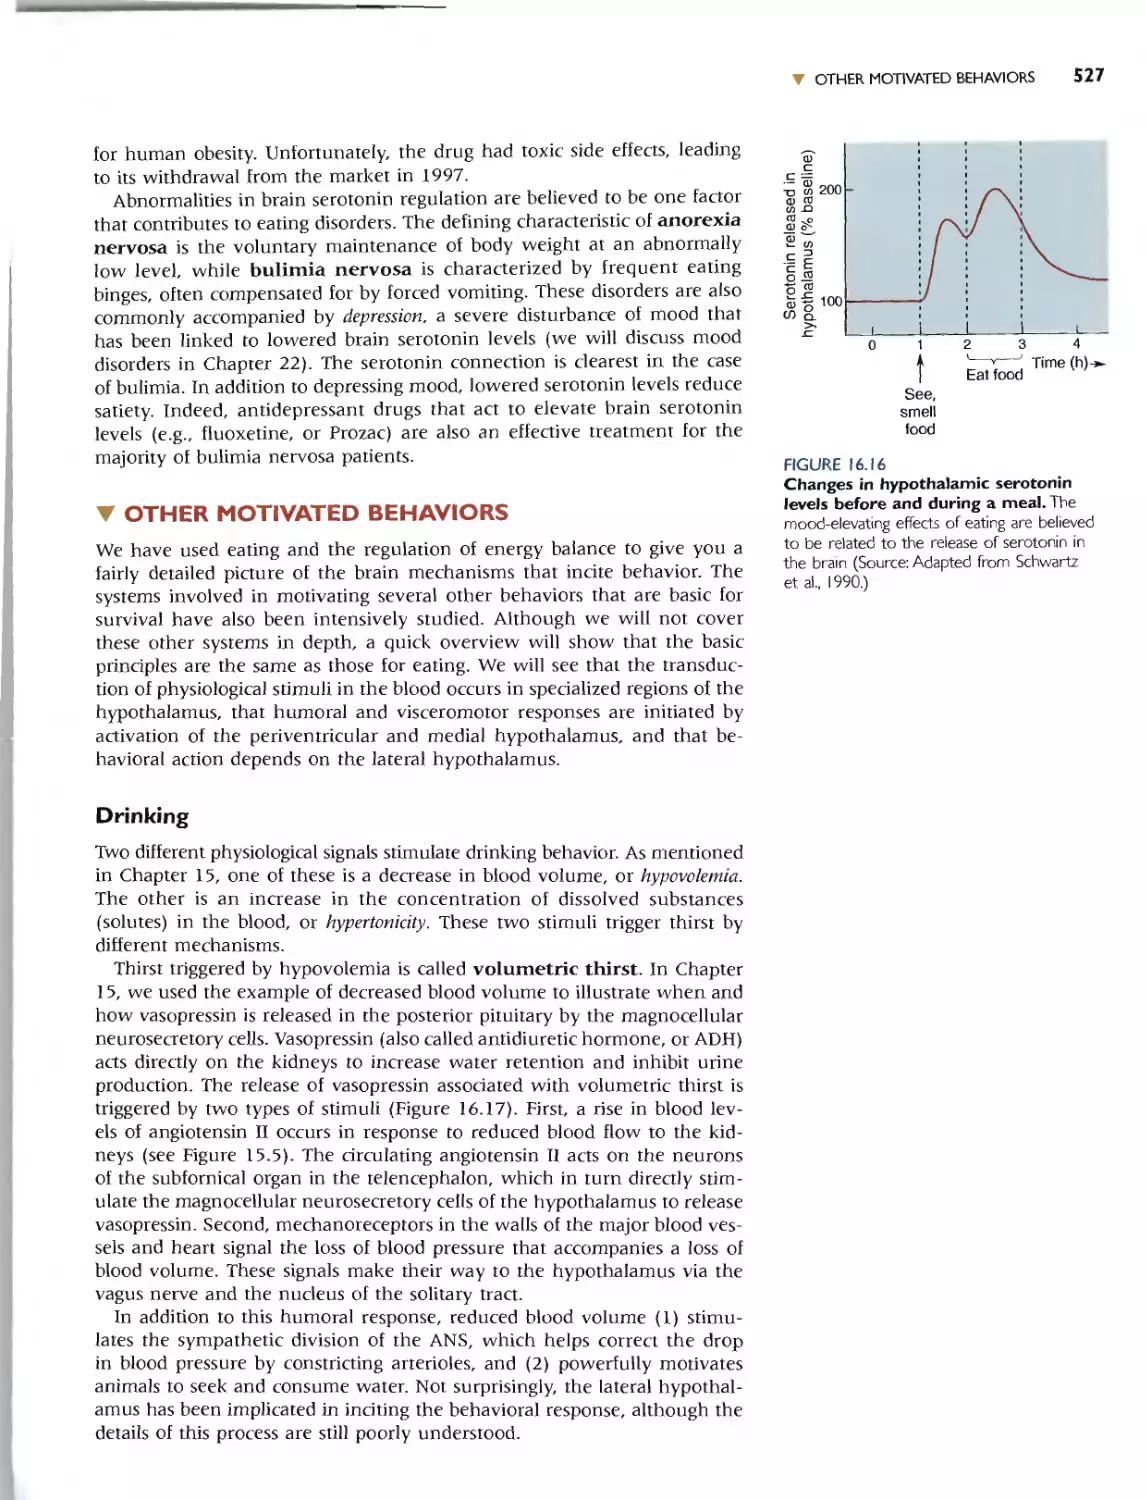
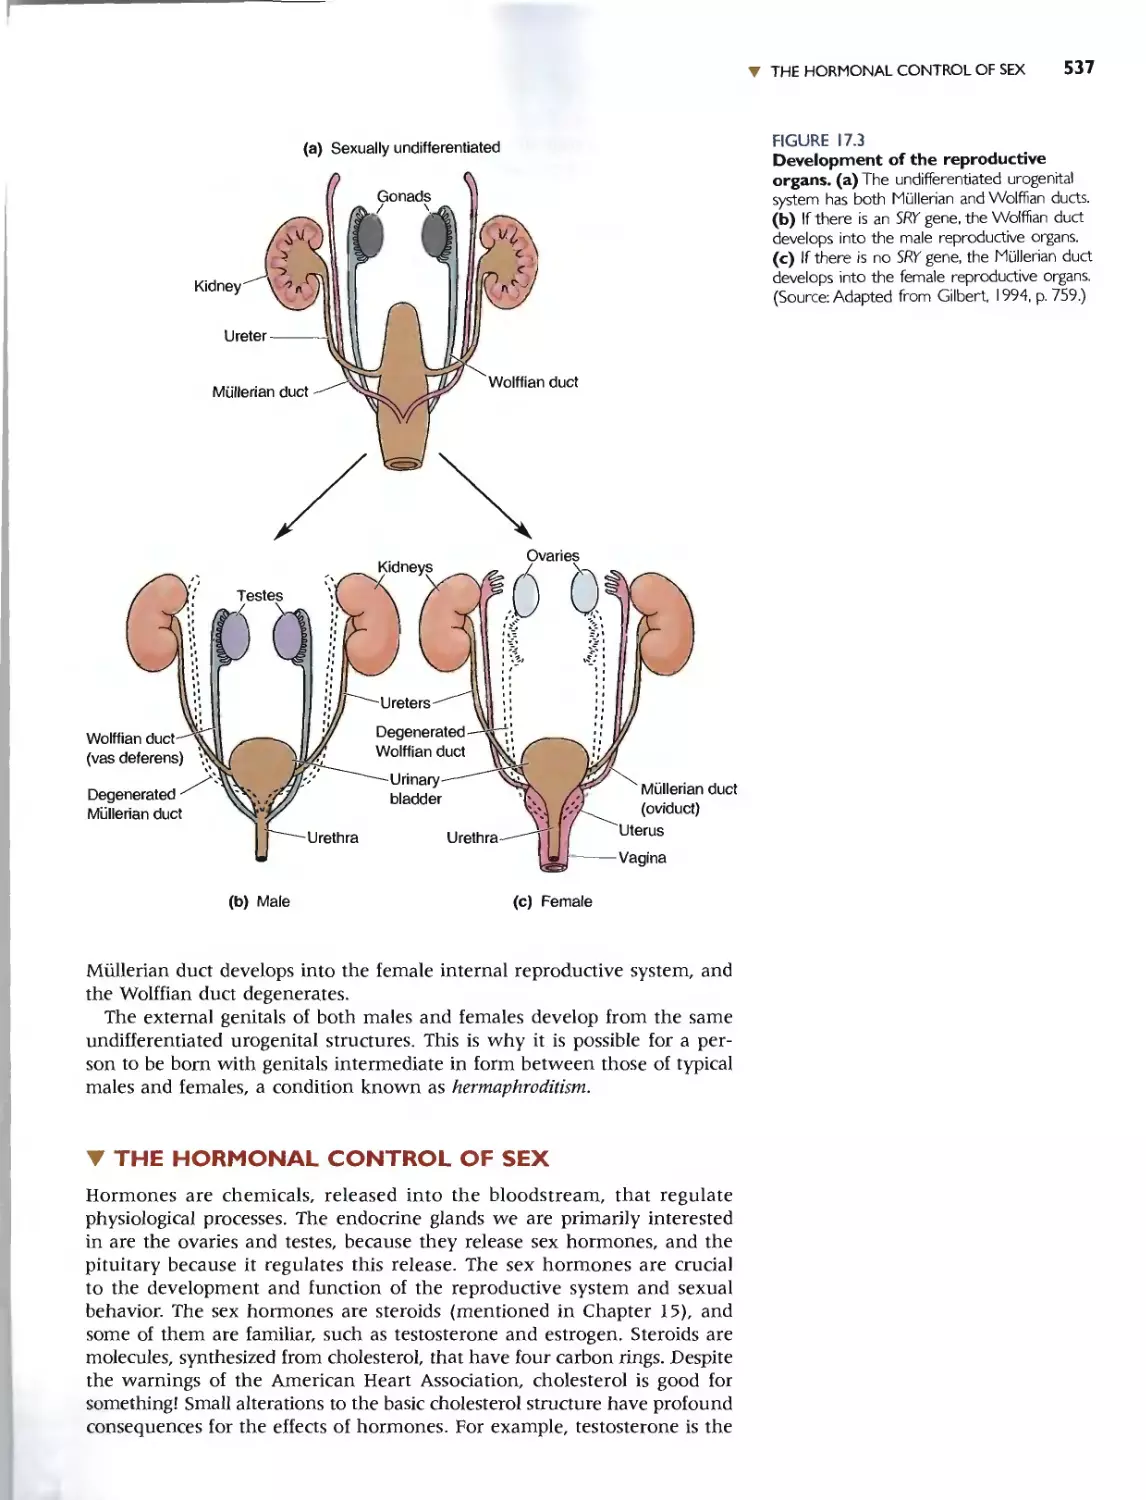
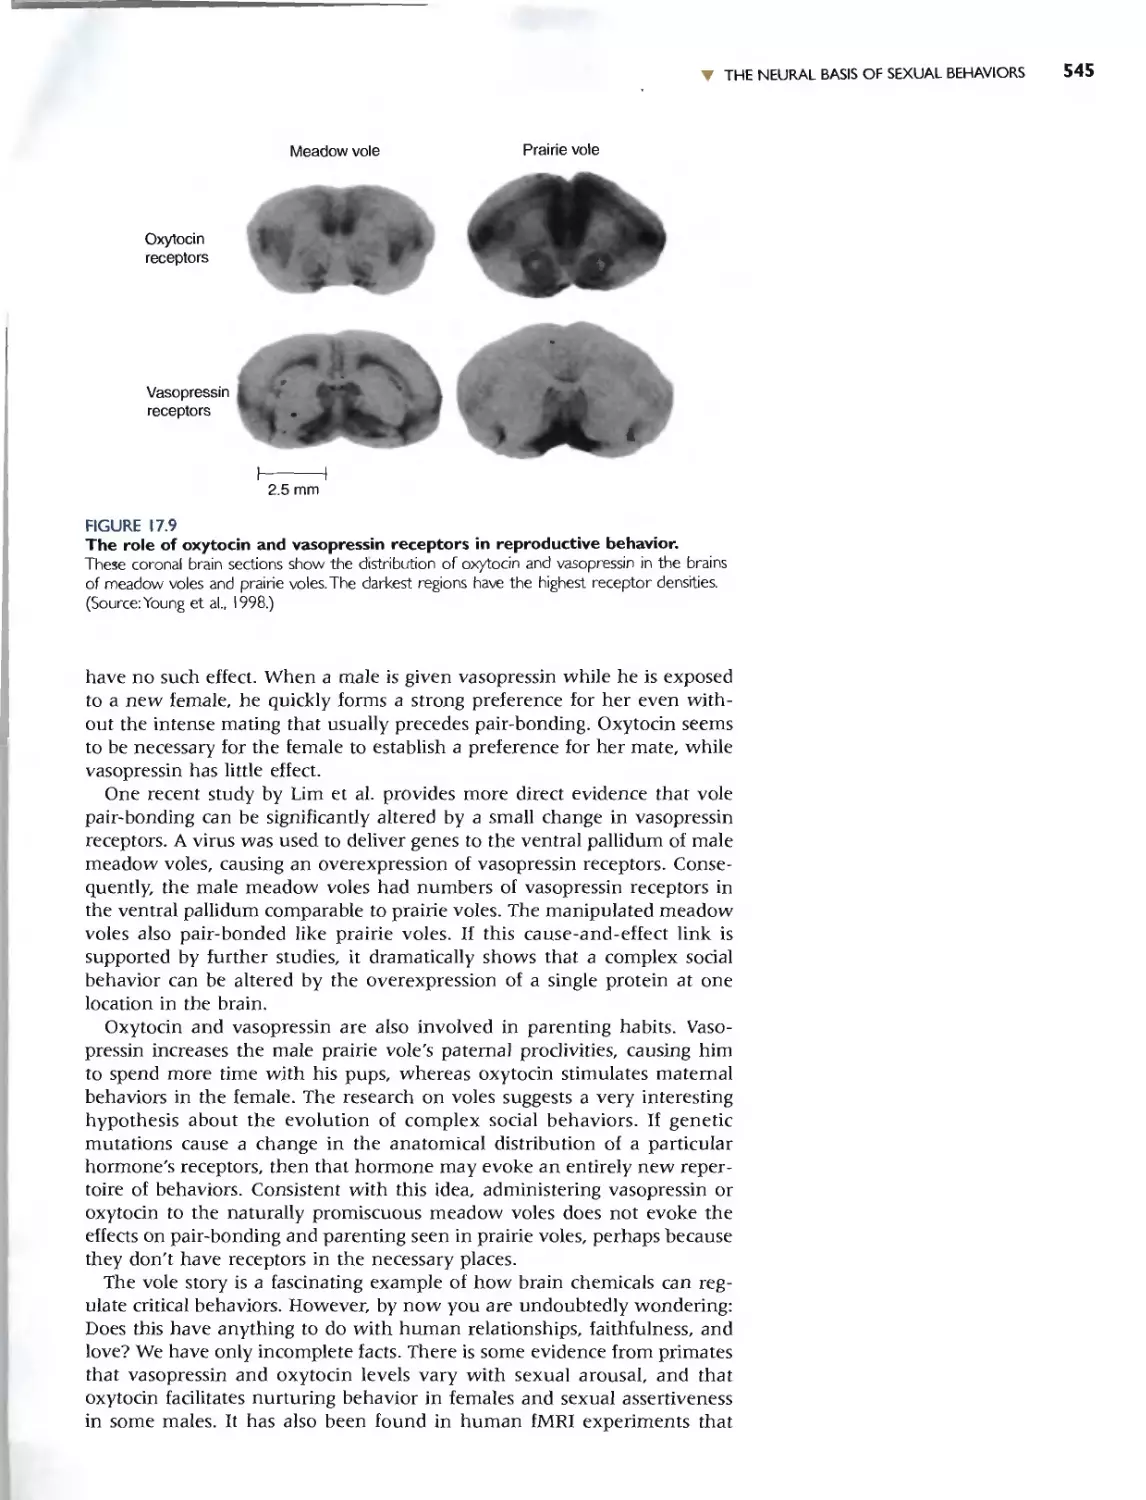
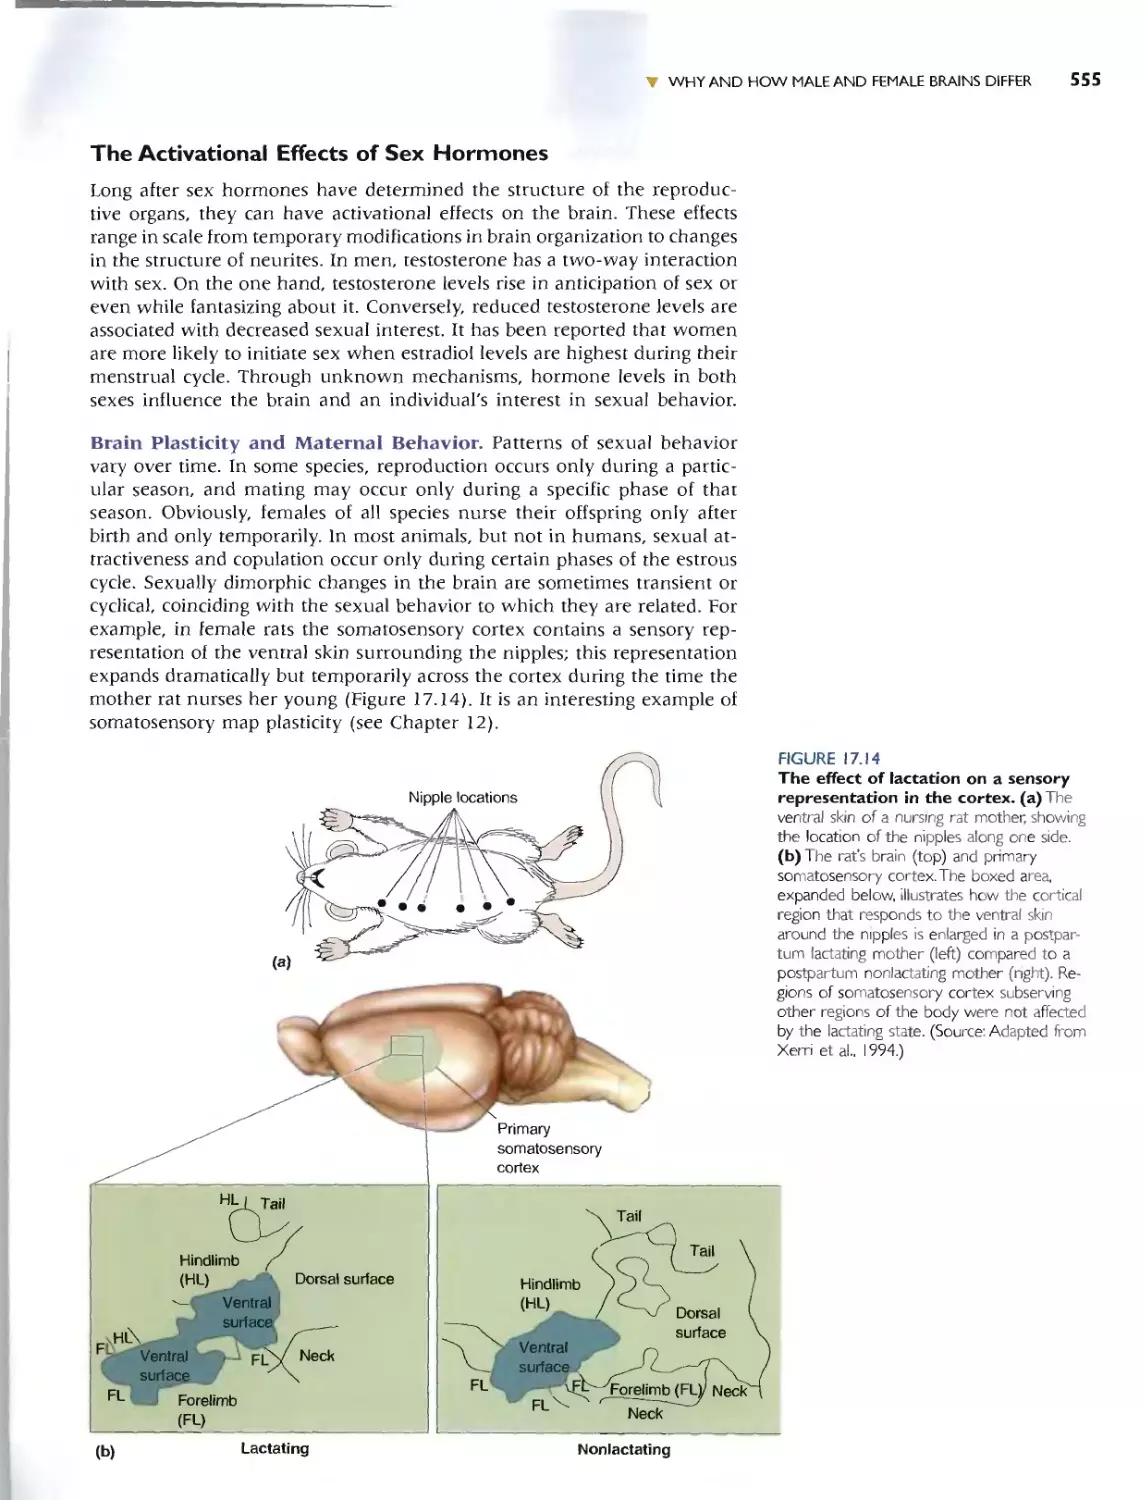
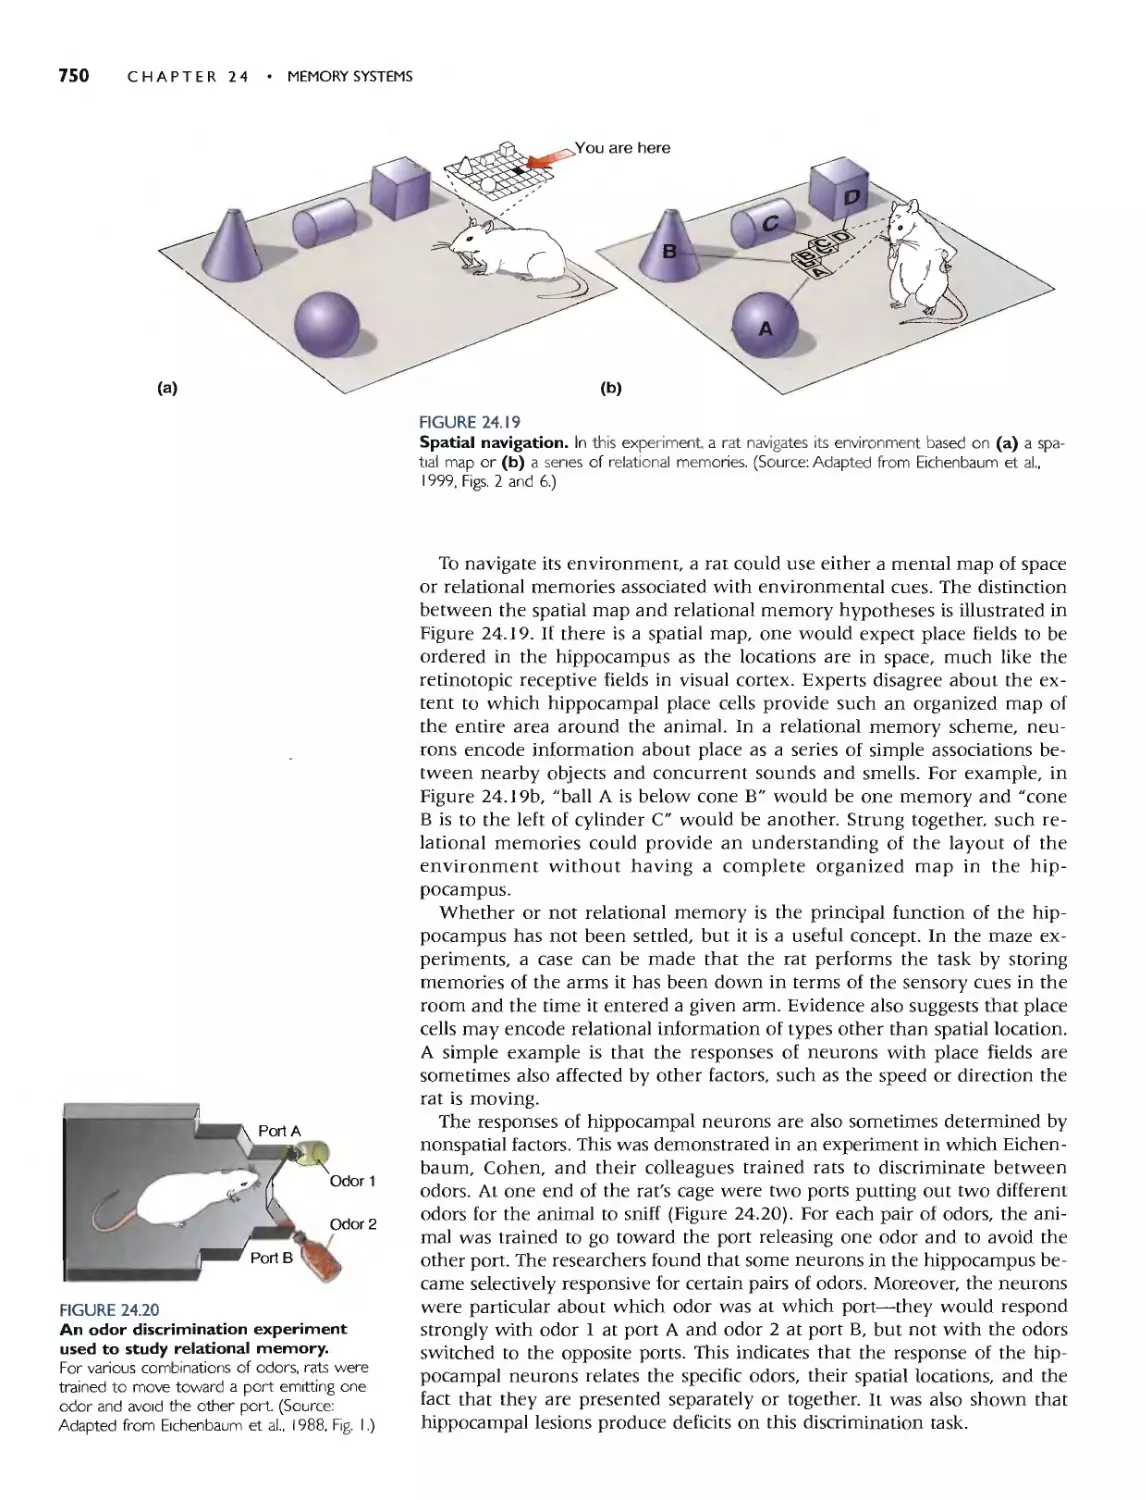
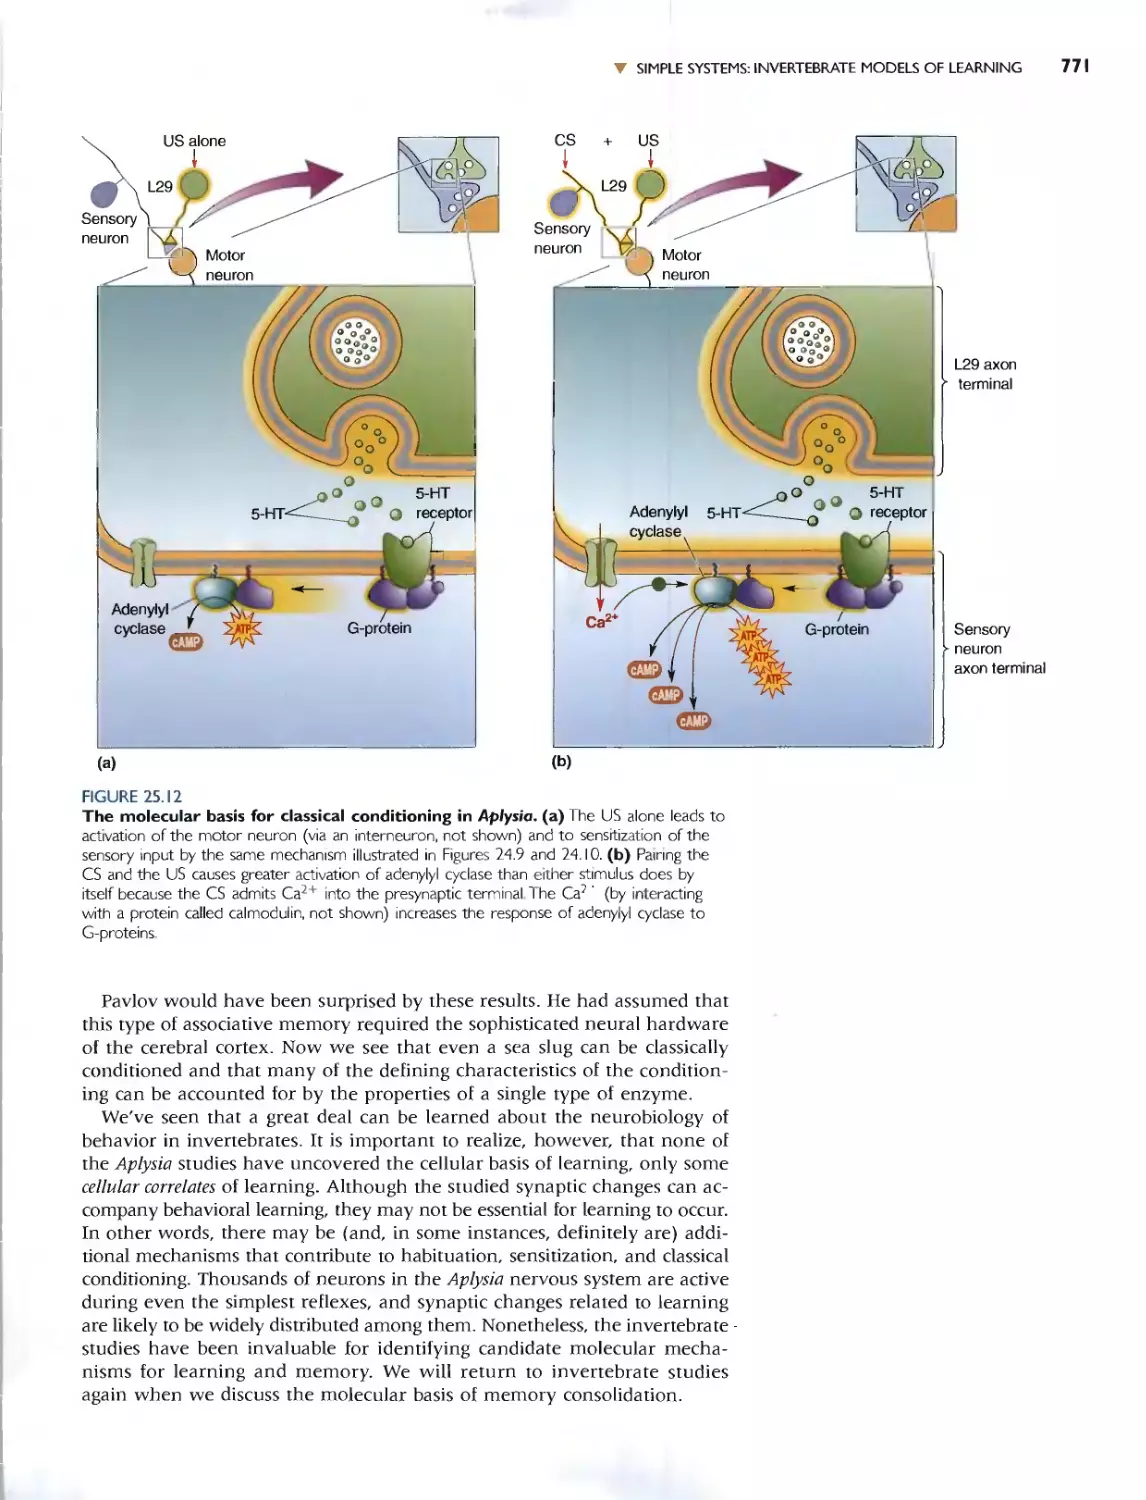
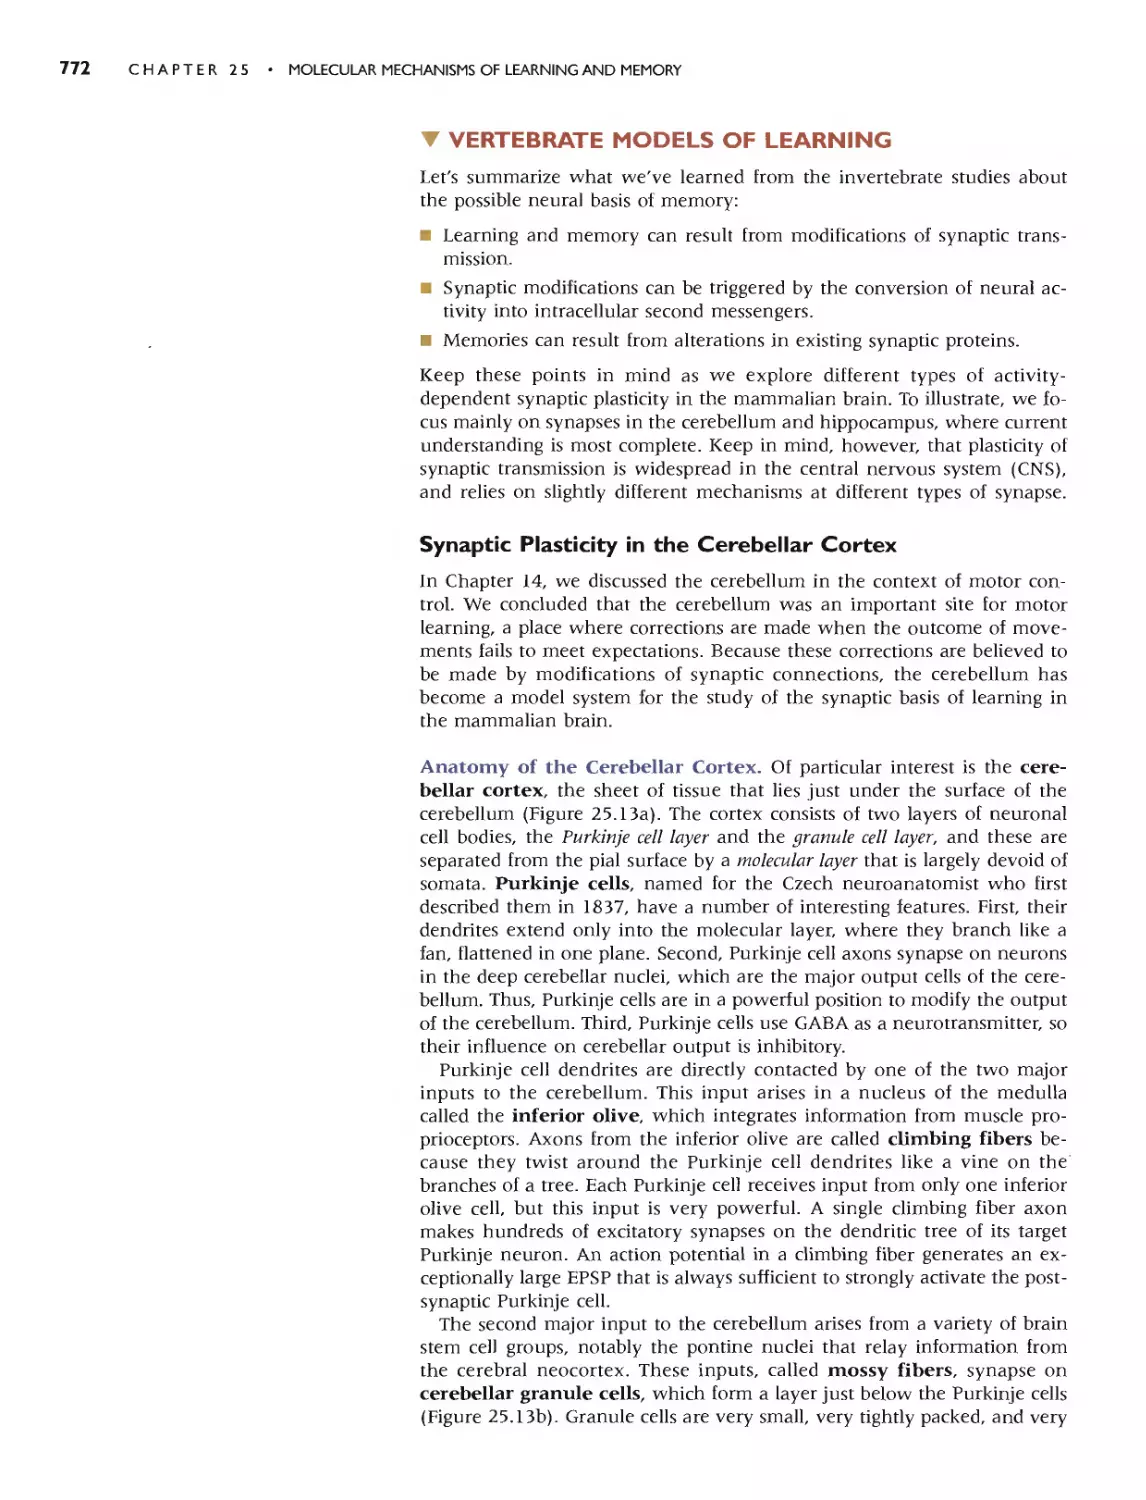
Текст
NEUROSCIENCE
Exploring the Brain
THIRD EDITION
MARK F. BEAR, Ph.D.
Picower Professor of Neuroscience
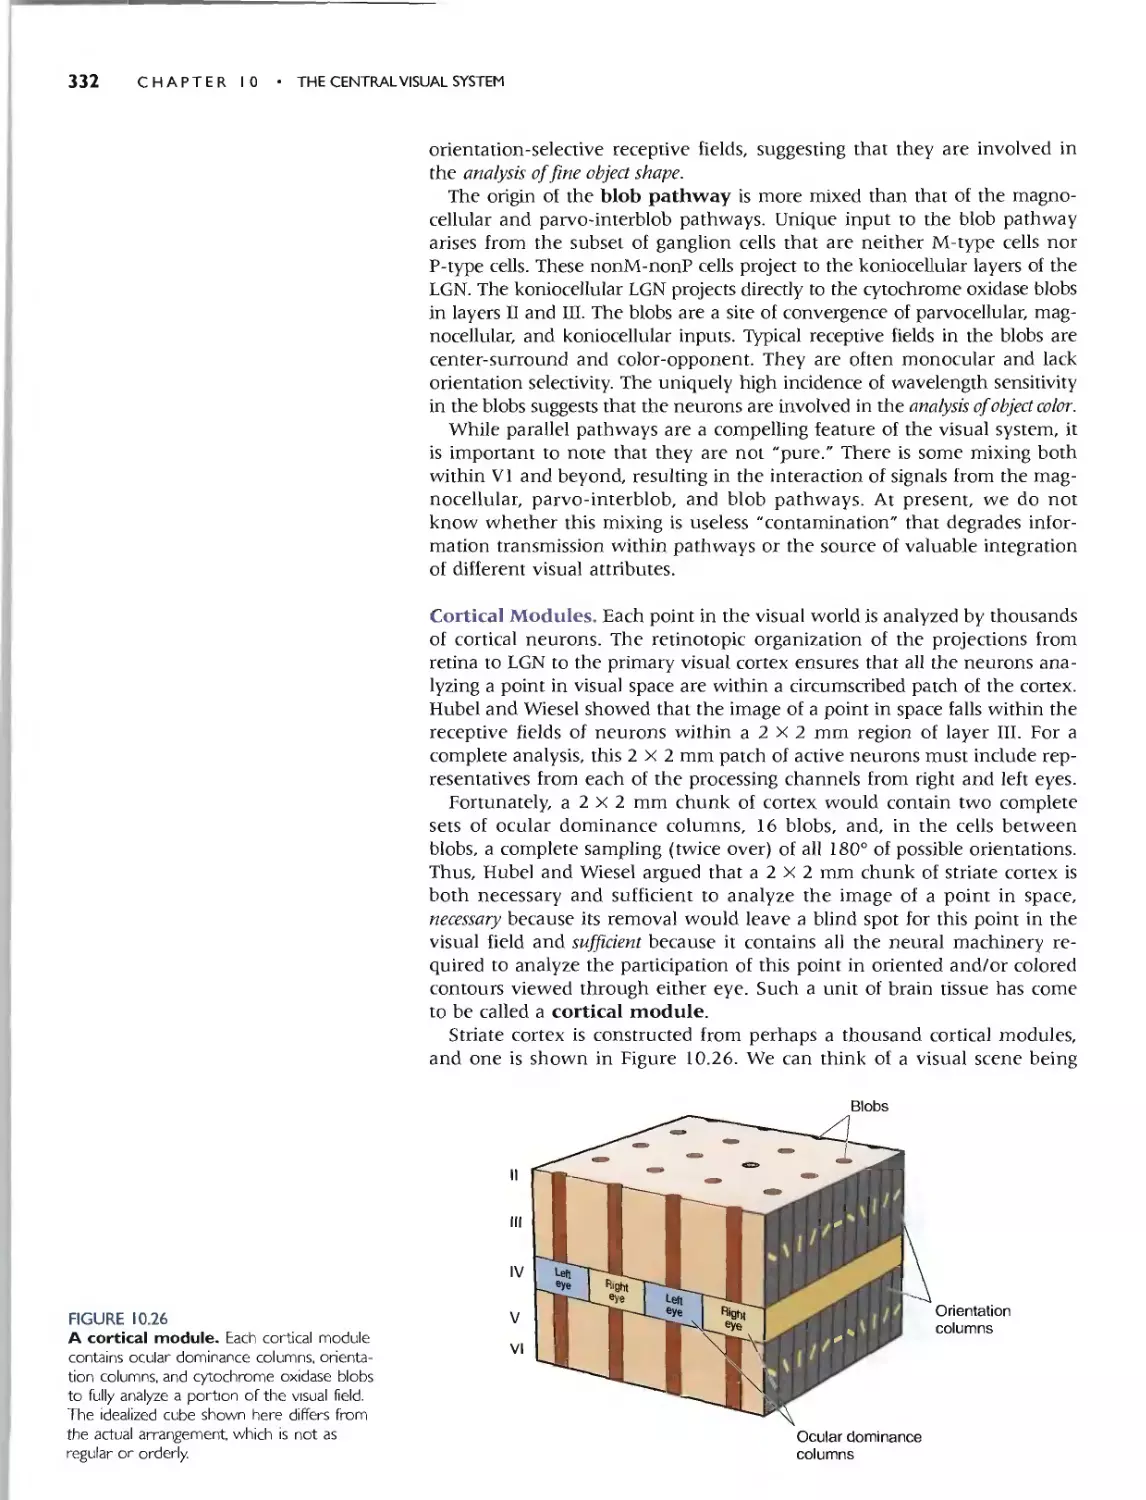
Howard Hughes Medical Institute
Massachusetts Institute of Technology
Cambridge, Massachusetts
BARRY W. CONNORS, Ph.D.
Professor of Neuroscience
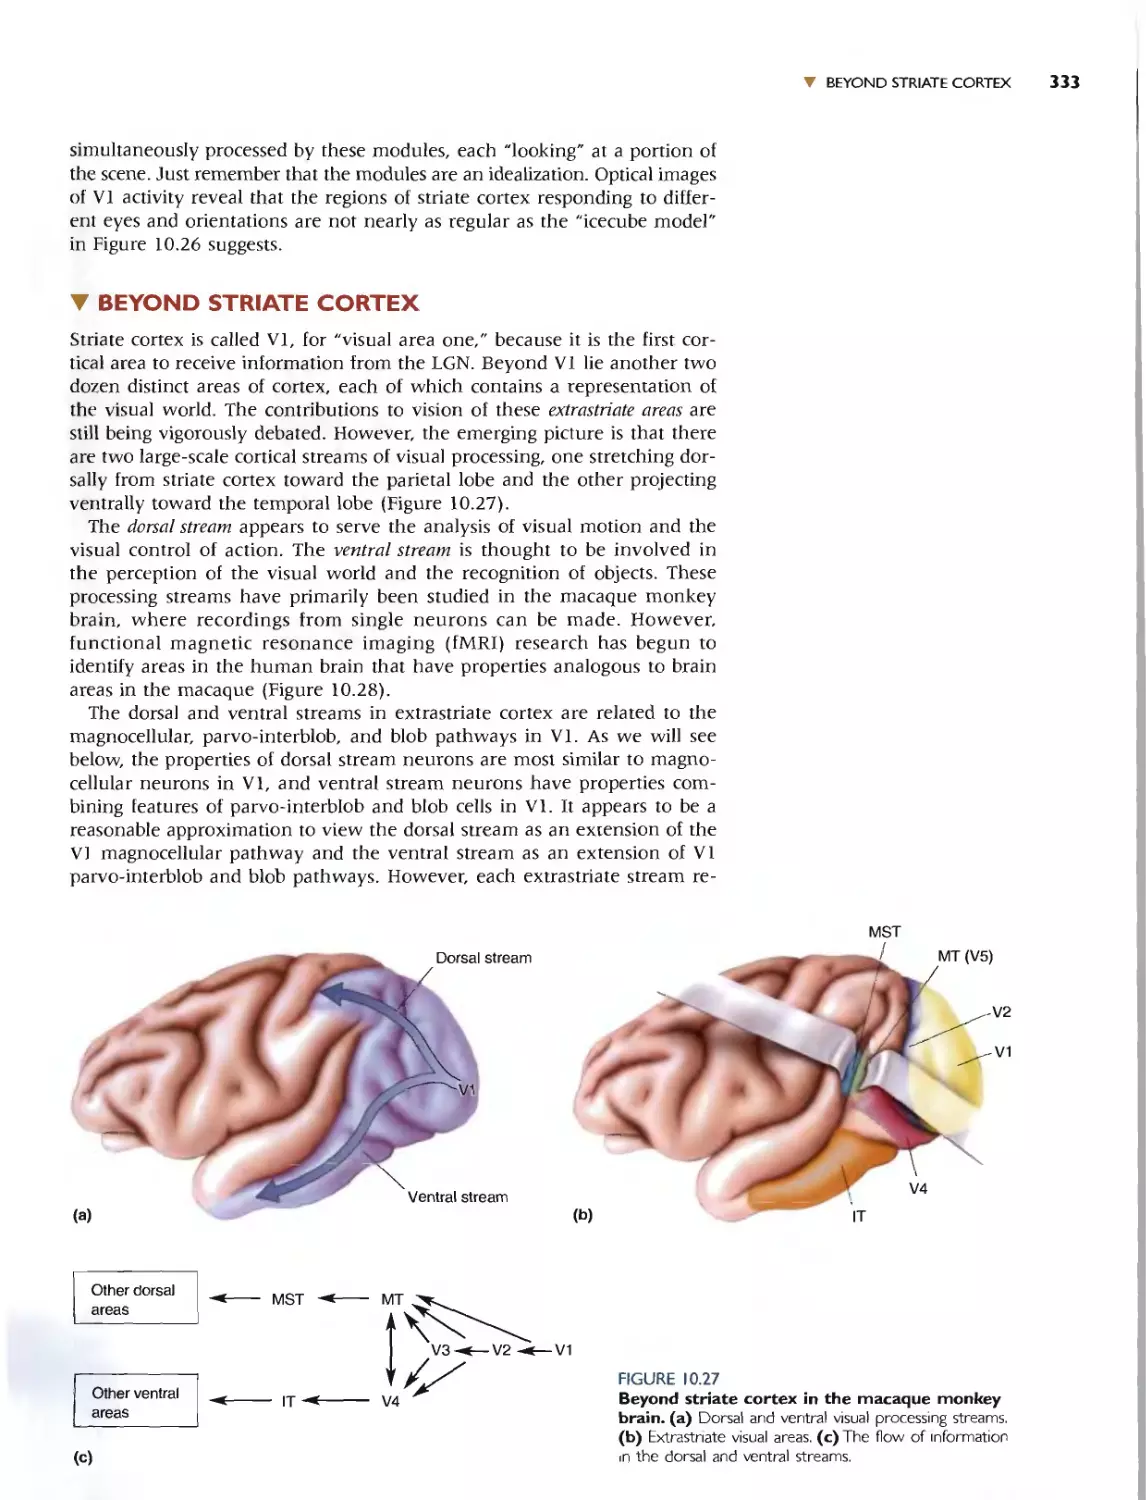
Brown University
Providence, Rhode Island
MICHAEL A. PARADISO, Ph.D.
Professor of Neuroscience
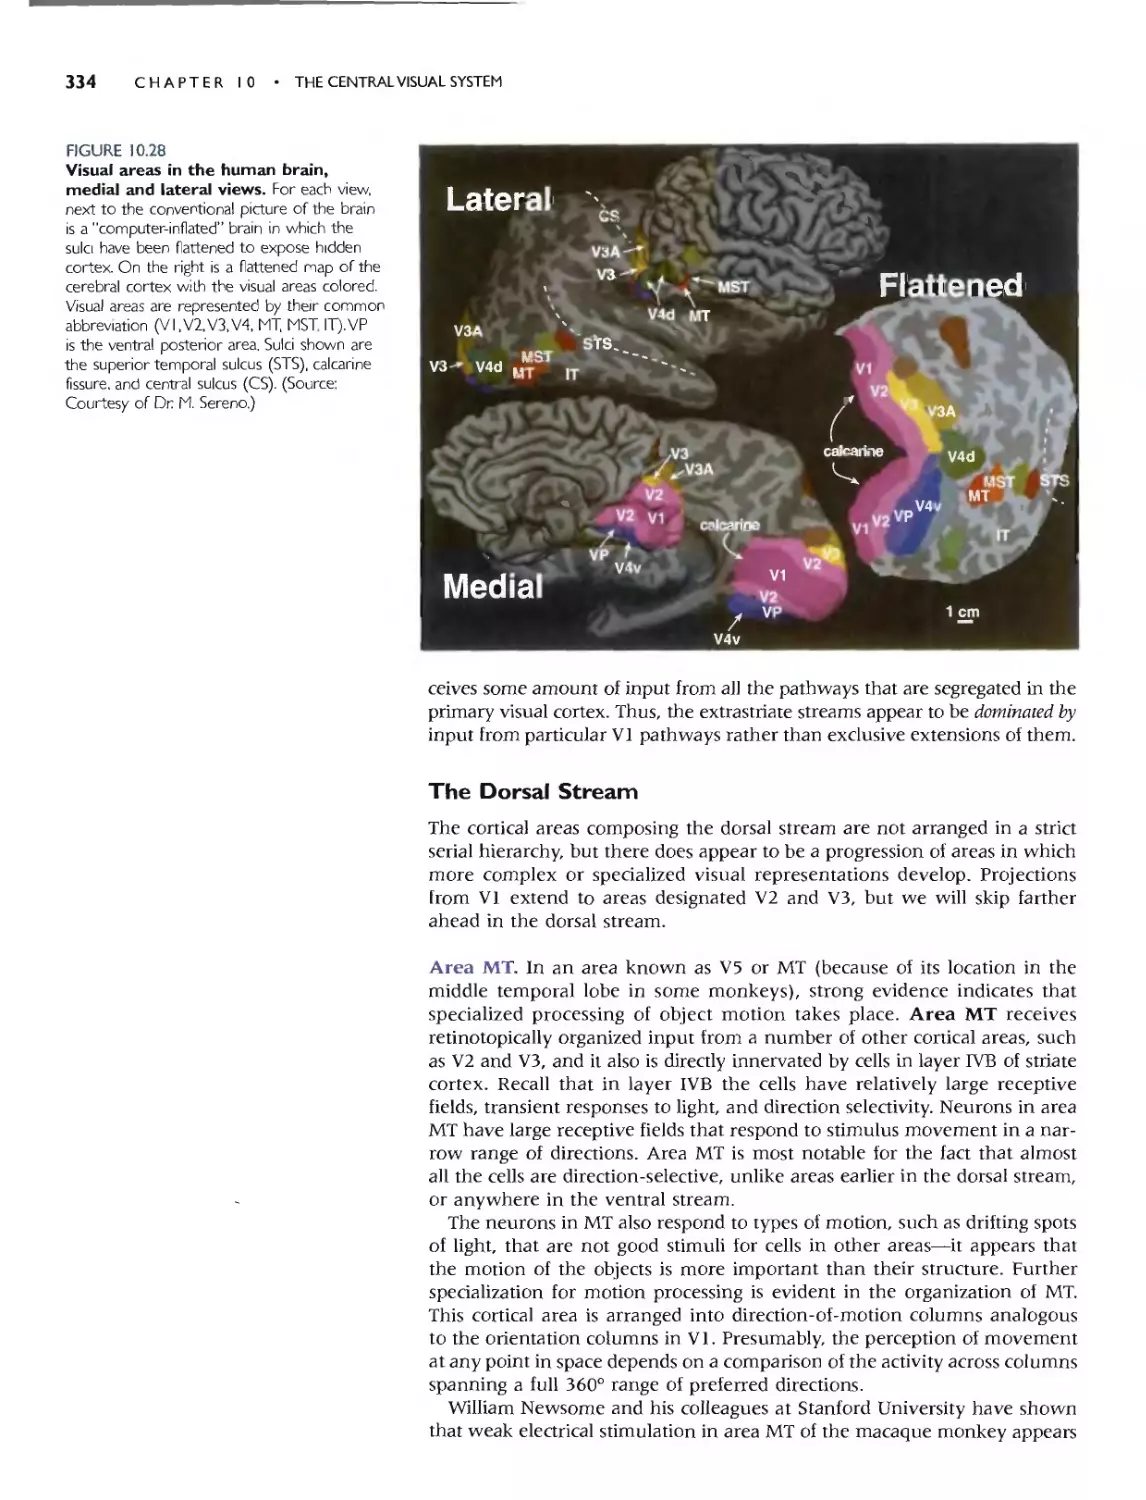
Brown University
Providence, Rhode Island
@ Lippincott Williams & Wilkins
a Wolters Kluwer business
Philadelphia. Baltimore. New York. London
Buenos Aires. Hong Kong. Sydney' Tokyo
Acquisitions Editor: Emily Lupash
Development Editors: Elizabeth Connolly/Betsy Dilernia
Marketing Manager: Mary Martin
Production Editor: Paula C. Williams
Designer: Risa Clow
Prepress: Hearthside Publishing Services
Compositor: Maryland Composition. Ine.
Printer: R.R. Donnelley
Copyright (Q 2007 Lippmcott Williams f" Wilkins
351 West Camden Street
Baltimore. MD 21201
530 Walnut Street
Philadelphia. PA 19106
All righ(s reserved. This book is pro(ecred by copyrighL No part of this book may be repro-
duced in any form or by any means. including photocopying. or utilized by any information
storage and retrieval system without written permission from the copyright owner.
The publisher is not responsible (as a matter 01 product liability. negligence, or otherwise) for
any injury resulLing from any material contained herein. This publication contains informa-
tion relating to general principles of medical care that should not be construed as specific
instructions for individual patients Manufacturers' product information and package inserts
should be reviewed for currenr information. including contraindications. dosages. and precau-
tions.
Printed in China
First Edition. J 996
Second Edition. 200 I
Library of Congress Cataloging-in-Publication Data
Bear. Mark F.
Neuroscience: exploring the brain / Mark F. Bear. Barry W. Conners
Michael A. Paradiso.-3rd ed.
p.; em.
Includes bibliographical references and index.
TSBNl3: 978-0-7817-6003-4
ISBN: 0-78J 7-6003-8 (alk. paper)
1. Neurosciences. 2. Brain. I. Connors. Barry W.
II. Paradiso. Michael A. III. Title
[DNLM: I. Brain. 2. Neurosciences. 3. Spinal Cord. WL 300 B368n 2006]
QP355.2.B422006
612.8-dc22
2005034900
The publishers have made every effort to trace the copyright holders for borrowed material. If they have
inadvertently overlooked any. lhey will be pleased to make the necessary arrangemenlS al the fim oppor-
tunity.
To purchase additional copies of (his book. call our customer service department at (800) 638-
3030 or fax orders to (301) 223-2320. Interna(ional customers should call (301) 223-2300.
Visit LippincoN Williams & Wilkins on the Internet: hNp:/Iwww.LWW.com. LippincOIt
Williams 5. Wilkins customer service representatives are available from 8:30 am to 6:00 pm.
EST.
10
789 JO
..,.
o
o
en
a:
a:
to Terry, Ashley, and [(endall -mfb
to Rebecca, Maia, and Nina -bwc
to Wendy, Bear, and Luca Boo -map
v
......
Preface
THE ORIGINS OF NEUROSCIENCE: EXPLORING THE
BRAIN
For over 25 years, we have taught a course called Neuroscience 1: An
Introduction to the Nervous System. The course has been remarkably suc-
cessful-at Brown University, where the course originated, approximately
one out of every four undergraduates takes it. For a few students, this is the
beginning of a career in neuroscience; for others, it is the only science
course he or she takes in college.
The success of introductory neuroscience reflects the fascination and
curiosity everyone has for how we sense, move, feel, and think. However,
the success of our course also derives from the way it is taught and what is
emphasized. First, there are no prerequisites, so the elements of biology,
chemistry, and physics required for understanding neuroscience are covered
as the course progresses. This approach ensures that no students are left
behind as the course progresses. Second, liberal use of commonsense
metaphors, reaJ-world examples, humor, and anecdotes remind students
that science is interesting, approachabJe, exciting, and fun. Third, the course
does not survey all of neurobiology. Instead, the focus is on mammaJian
brains and, whenever possibJe, the human brain. In this sense, the course
closely resembles what is taught to most beginning medical students.
Similar courses are now offered at many colleges and universities by psy-
chology, biology, and neuroscience departments.
The first edition of Neuroscience: Exploring the Brain was written to provide
a suitable textbook for Neuro 1, incorporating the subject matter and phi-
losophy that made this course successful. Based on feedback from our stu-
dents and colleagues at other universities, we expanded the second edition
to include more topics in behavioraJ neuroscience and some new features to
help students understand the structure of the brain. We must have gotten it
right, because the book now ranks as one of the most popular introductory
neuroscience books in the world. It has been particuJarly gratifying to see
our book used as a catalyst for the creation of new courses in introductory
neuroscience.
NEW IN THE THIRD EDITION
Our main goals for the third edition were to incorporate the many discov-
eries of the past five years without increasing the length of the text, to short-
en chapters when possible by emphasizing principles more and details less,
and to make the book even more user-friendly by improving the layout and
clarity of the illustrations.
Writing the third edition gave us the opportunity to review the
research accomplishments of the past five years, and they are truly aston-
ishing. Perhaps the most significant development has been the sequenc-
ing of the human genome, suggesting new avenues for understanding the
neural basis of individuality, as well as neurological and psychiatric dis-
eases. The book has been revised to incorporate these and many other
new findings.
vii
viii PREFACE
We authors are all active neuroscientists, and we want our readers to
understand the allure of research. A unique feature of our book is the Path
of Discovery boxes, in which famous neuroscientists teJl stories about their
own research. These essays serve severaJ purposes: to give a flavor of the
thrill of discovery; to show the importance of hard work and patience, as
well as serendipity and intuition; to reveal the human side of science; and
to entertain and amuse. We have continued this tradition in the third edi-
tion, with new contributions from 24 esteemed scientists. Included in this
illustrious group are recent NobeJ laureates Roderick MacKinnon and Arvid
Carlsson.
AN OVERVIEW OFTHE BOOK
Neuroscience: ExpLoring the Brain surveys the organization and function of the
human nervous system. We present material at the cutting edge of neuro-
science, in a way that is accessible to both science and nonscience students
alike. The level of the material is comparable to an introductory college text
in general biology.
The book is divided into four parts: Part 1, Foundations; Part II, Sensory
and Motor Systems; Part III, The Brain and Behavior; and Part IV, The
Changing Brain. We begin Part I by introducing the modern field of neu-
roscience and tracing some of its historical antecedents. Then we take a
close look at the structure and function of individuaJ neurons, how they
communicate chemically, and how these building blocks are arranged to
form a nervous system. In Part II, we go inside the brain to examine the
structure and function of the systems that serve the senses and command
voluntary movements. In Part Ill, we explore the neurobiology of human
behavior, including motivation, sex, emotion, sleep, language, attention.
and mental illness. Fina]]y, in Part IV, we lpok at how the environment
modifies the brain, both during development and in adult Jearning and
memory.
The human nervous system is examined at several different scales, rang-
ing from the molecules that determine the functional properties of neurons
to the large systems in the brain that underlie cognition and behavior. Many
disorders of the human nervous system are introduced as the book pro-
gresses, usually within the context of the specific neural system under dis-
cussion. Indeed, many insights into the normal functions of neural systems
have come from the study of diseases that cause specific malfunctions of
these systems. In addition, we discuss the actions of drugs and toxins on the
brain, using this information to illustrate how different brain systems con-
tribute to behavior and how drugs may alter brain function.
Organization of Part I: Foundations (Chapters 1-7)
The goal of Part I is to build a strong base of general knowledge in neurobi-
oJogy. The chapters should be covered sequentially, although Chapters I
and 6 can be skipped without a loss of continuity.
In Chapter 1, we use a historical approach to review some basic principles
of nervous system function and then turn to the topic of how neuroscience
research is conducted today. We directly confront the ethics of neuroscience
research, particularJy that which invoJves animals.
In Chapter,2, we focus mainly on the ce]] biology of the neuron. This is
essential information for students inexperienced in biology, and we find that
even those with a strong bioJogy background find this review helpfuL After
touring the cell and its organelles, we go on to discuss the structural features
that make neurons and their supporting cells unique, emphasizing the cor-
relation of structure and function.
... PREFACE ix
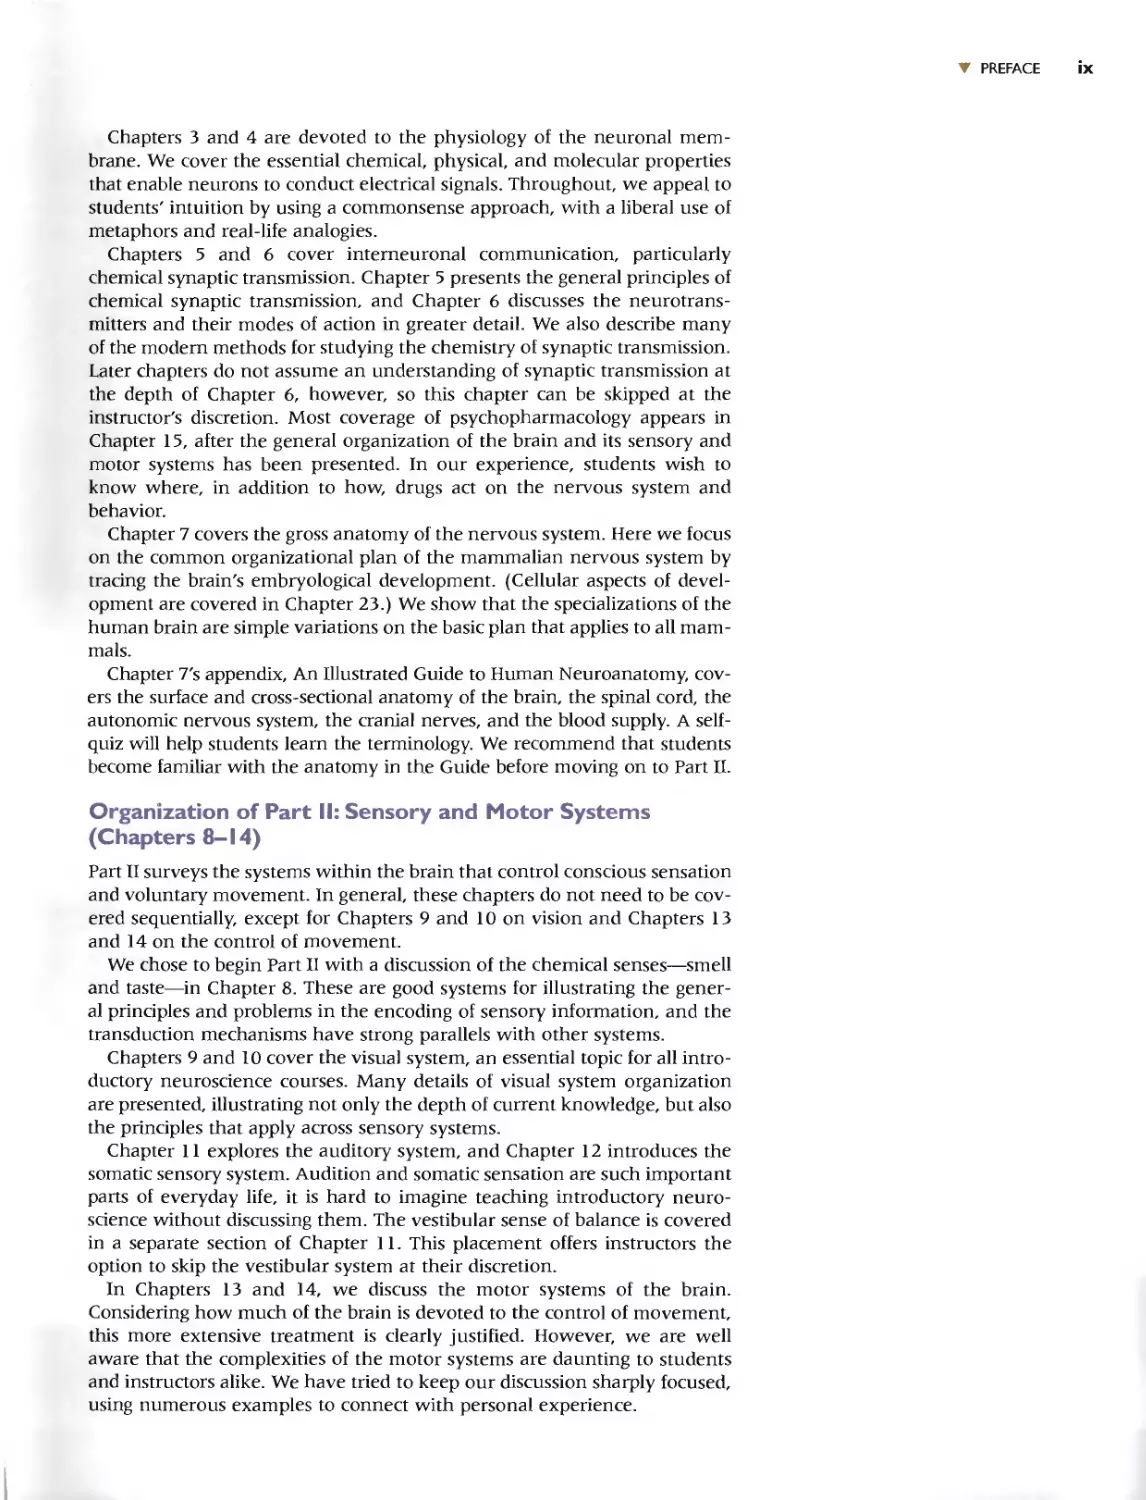
Chapters 3 and 4 are devoted to the physiology of the neuronal mem-
brane. We cover the essential chemical. physical. and molecular properties
that enable neurons to conduct electrical signaJs. Throughout, we appeal to
students' intuition by using a commonsense approach, with a liberaJ use of
metaphors and real-Jife analogies.
Chapters 5 and 6 cover interneuronal communication, particularly
chemical synaptic transmission. Chapter 5 presents the general principJes of
chemical synaptic transmission, and Chapter 6 discusses the neurotrans-
mitters and their modes of action in greater detail. We also describe many
of the modern methods for studying the chemistry of synaptic transmission.
Later chapters do not assume an understanding of synaptic transmission at
the depth of Chapter 6, however, so this chapter can be skipped at the
instructor's discretion. Most coverage of psychopharmacology appears in
Chapter 15, after the general organization of the brain and its sensory and
motor systems has been presented. In our experience, students wish to
know where, in addition to how, drugs act on the nervous system and
behavior.
Chapter 7 covers the gross anatomy of the nervous system. Here we focus
on the common organizational plan of the mammalian nervous system by
tracing the brain's embryological development. (CeUular aspects of devel-
opment are covered in Chapter 23.) We show that the specializations of the
human brain are simple variations on the basic plan that applies to aU mam-
mals.
Chapter 7's appendix, An IJlustrated Guide to Human Neuroanatomy, cov-
ers the surface and cross-sectional anatomy of the brain, the spinal cord, the
autonomic nervous system, the cranial nerves, and the blood supply. A seU-
quiz will help students learn the terminology. We recommend that students
become familiar with the anatomy in the Guide before moving on to Part n.
Organization of Part II: Sensory and Motor Systems
(Chapters 8-14)
Part II surveys the systems within the brain that control conscious sensation
and voluntary movement. In general. these chapters do not need to be cov-
ered sequentiaUy, except for Chapters 9 and lOon vision and Chapters 13
and 14 on the control of movement.
We chose to begin Part II with a discussion of the chemical senses-smell
and taste-in Chapter 8. These are good systems for ilJustrating the gener-
al principJes and problems in the encoding of sensory information, and the
transduction mechanisms have strong parallels with other systems.
Chapters 9 and 10 cover the visual system, an essential topic for all intro-
ductory neuroscience courses. Many details of visual system organization
are presented, illustrating not only the depth of current knowledge, but also
the principJes that apply across sensory systems.
Chapter 11 explores the auditory system, and Chapter 12 introduces the
somatic sensory system. Audition and somatic sensation are such important
parts of everyday life, it is hard to imagine teaching introductory neuro-
science without discussing them. The vestibular sense of balance is covered
in a separate section of Chapter 11. This placement offers instructors the
option to skip the vestibular system at their discretion.
In Chapters 13 and 14, we discuss the motor systems of the brain.
Considering how much of the brain is devoted to the control of movement,
this more extensive treatment is clearly justified. However, we are well
aware that the complexities of the motor systems are daunting to students
and instructors alike. We have tried to keep our discussion sharply focused,
using numerous examples to connect with personal experience.
x PREFACE
Organization of Part III:The Brain and Behavior (Chapters
15-22)
Part III expJores how different neural systems contribute to different behav-
iors, focusing on the systems where the connection between the brain and
behavior can be made most strongJy. We cover the systems that controJ vis-
ceral function and homeostasis, simpJe motivated behaviors (such as eating
and drinking), sex, mood, emotion, sleep, consciousness, language, and
attention. FinalJy, we discuss what happens when these systems fail during
mental illness.
Chapters 15-19 describe a number of neural systems that orchestrate
widespread responses throughout the brain and the body. In Chapter 15,
we focus on three systems that are characterized by their broad influence
and their interesting neurotransmitter chemistry: the secretory hypothala-
mus, the autonomic nervous system, and the diffuse moduJatory systems of
the brain. We discuss how the behavioral manifestations of various drugs
may result from disruptions of these systems.
In Chapter 16, we Jook at the physioJogical factors that motivate specific
behaviors, focusing mainly on recent research on the control of eating
habits. Chapter 17 investigates the influence of sex on the brain and the
influence of the brain on sexuaJ behavior. Chapter 18 examines the neural
systems beJieved to underlie emotional experience and expression, specifi-
cally emphasizing fear and anxiety, anger and aggression.
In Chapter 19, we investigate the systems that give rise to the rhythms of
the brain, ranging from the rapid eJectrical rhythms of the brain during
sleep and wakefulness to the sJow circadian rhythms controJling honnones,
temperature, alertness, and metaboJism. Part III ends with a discussion of
the neuroscience of Janguage and attention in Chapters 20 and 21 and of
mental illness in Chapter 22.
Organization of Part IV:The Changing Brain (Chapters
23-25)
Part IV explores the celJular and molecular basis of brain development, and
learning and memory. These subjects represent two of the most exciting
frontiers of modem neuroscience.
Chapter 23 examines the mechanisms used during brain development
to ensure that the correct connections are made between neurons. The
ceJlular aspects of development are discussed here rather than in Part I
for several reasons. First, by this point in the book, students fuJly appre-
ciate that normaJ brain function depends on its precise wiring. Because
we use the visual system as a concrete exampJe, the chapter also must
foHow a discussion of the visuaJ pathways in Part II. Second, we survey
aspects of experience-dependent development of the visual system that
are regulated by the diffuse modulatory systems of the brain, so this
chapter is pJaced after the early chapters of Part III. FinaJly, an expJo-
ration of the role of the sensory environment in brain deveJopment in
Chapter 23 is foJlowed in the next two chapters by discussions of how
experience-dependent modifications of the brain form the basis for learn-
ing and memory. We see that many of the mechanisms are similar, illus-
trating the unity of bioJogy.
Chapters 24 and 25 cover learning and memory. Chapter 24 focuses on
the anatomy of memory, exploring how different parts of the brain con-
tribute to the storage of different types of information. Chapter 25 takes a
deeper Jook into the molecular and ceJluJar mechanisms of learning and
memory, focusing on changes in synaptic connections.
... PREFACE xi
HELPING STUDENTS LEARN
Neuroscience: Exploring the Brain is not an exhaustive study. It is intended to
be a readable textbook that communicates to students the important prin-
ciples of neuroscience clearly and effectively. To help students Jearn neuro-
science, we include a number of features designed to enhance comprehen-
sion:
· Chapter Outlines, and Introductory and Concluding Remarks.
These elements preview the organization of each chapter, set the stage,
and place the material into broader perspective.
· Key Terms and Glossary. Neuroscience has a language of its own,
and to comprehend it, one must learn the vocabulary. In the text of
each chapter, important terms are highlighted in boldface type. To facili-
tate review, these terms appear in a list at the end of each chapter, in
the order in which they appeared in the text, along with page refer-
ences. The same terms are assembled at the end of the book, with defi-
nitions, in a gJossary.
· Review Questions. At the end of each chapter, a brief set of questions
for review are specifically designed to provoke thought and help stu-
dents integrate the material.
· Internal Reviews of NeuroanatomicaI Terms. In Chapter 7, where
nervous system anatomy is discussed, the narrative is interrupted peri-
odicaJly with brief self-quiz vocabulary reviews to enhance understand-
ing. In Chapter 7's appendix, an extensive self-quiz is provided in the
form of a workbook with labeling exercises.
· Further Reading. New to the third edition, we include a list of several
recent review articles at the end of each chapter to guide study beyond
the scope of the textbook.
· References and Resources. At the end of the book, we provide
selected readings and online resources that will lead students into the
research literature associated with each chapter. Rather than including
citations in the body of the chapters, where they would compromise
the readability of the text, we have organized the references and
resources by chapter and listed them at the end of the book.
· Full-Color Illustrations. We believe in the power of illustrations-not
those that "speak a thousand words," but those that each make a single
point. The first edition of this book set a new standard for illustrations
in a neuroscience text. The third edition reflects improvements in the
pedagogical design of many figures from earlier editions and incJudes
many superb new illustrations as well.
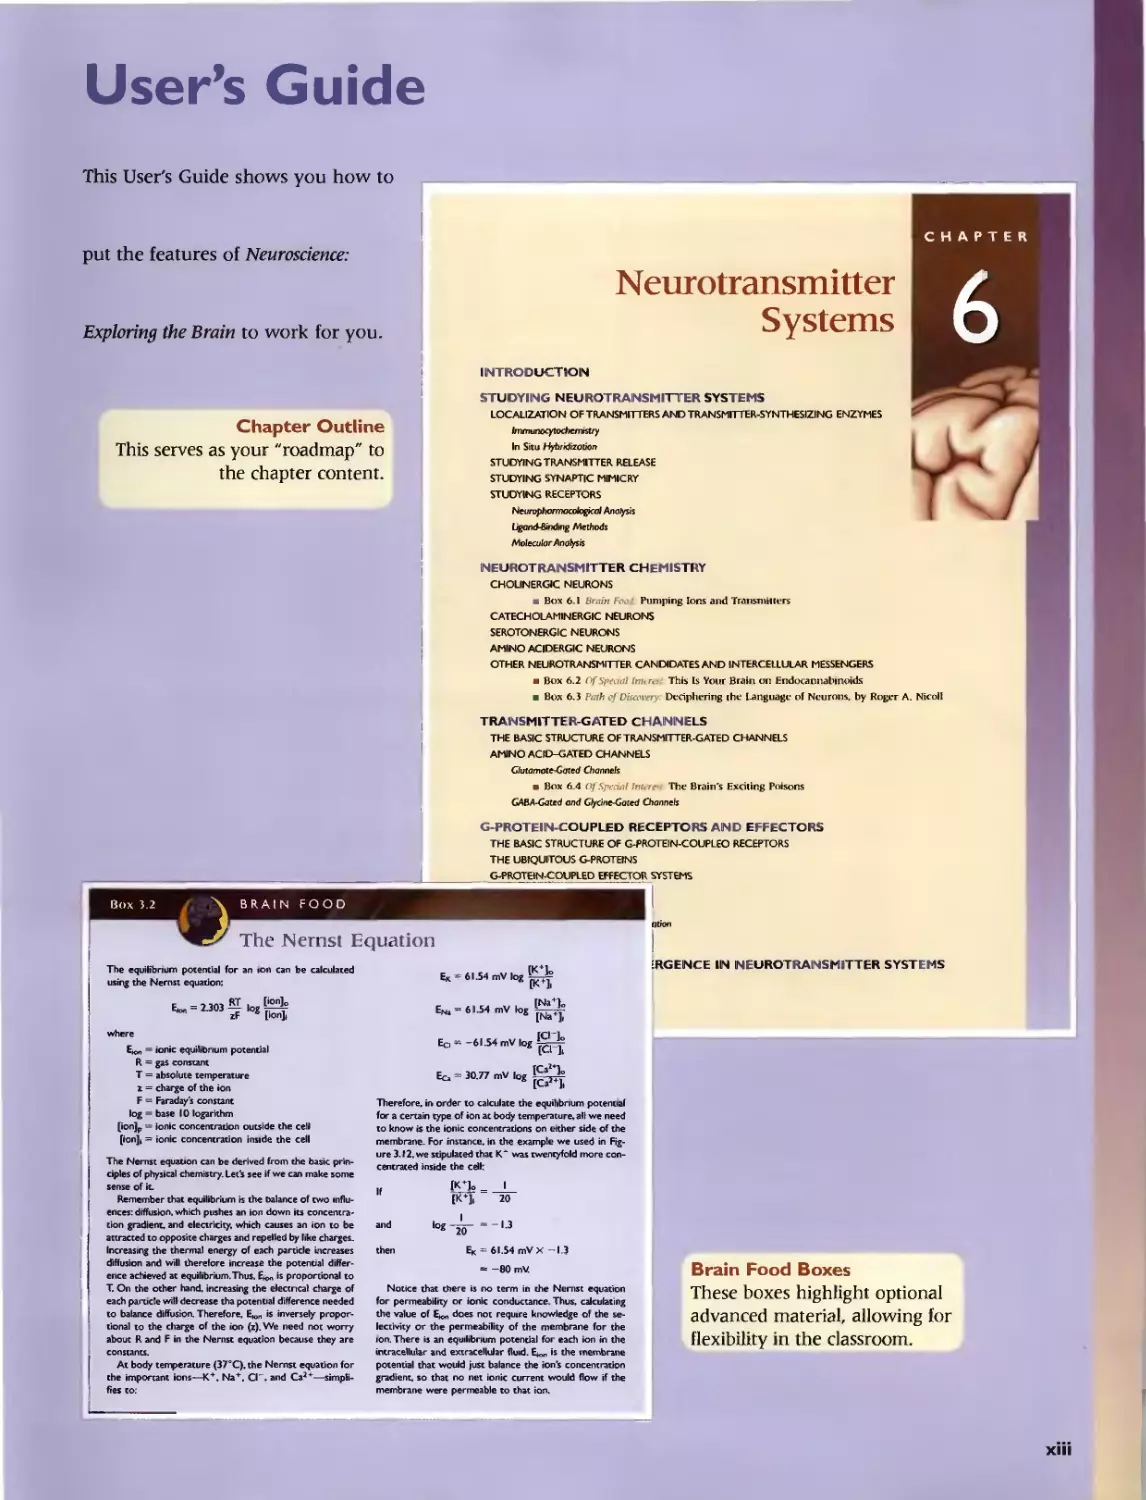
User's Guide
This User's Guide shows you how to
put the features of Neuroscience:
Exploring the Brain to work for you.
Chapter Outline
This serves as your "roadmap" to
the chapter content.
CHAPTER
Neurotransmitter
Systems
6
IINTRODUCTIOIN
STUDYIING NEUROTRAINSMllTER SYSTEMS
LOCALIZATION OF TRANSMITTERS AND TRANSMITTER-SYNTHESIZING ENZYMES
Imtmmoq1ochemis
In Situ Hybridizotion
STUDYING TRANSMITTER RELEASE
STUDYING SYNAPTIC MIMICRY
STUDYING RECEPTORS
Neurophonr>o«>loea/ AnalySis
Ugan6-&ndlngMethods
MoJecular Anofysis
INEUROTRAINSMITTER CHEMISTRY
CHOLINERGIC NEURONS
. Box 6_1 Brain F(Ij] Pumping Ions and Tr.'lnsmillt'TS
CATECHOLAMINERGIC NEURONS
SEROTONERGIC NEURONS
AMINO ACIDERGIC NEURONS
OTHER NEUROTRANSMITTER CANDIDATES AND INTERCELLULAR MESSENGERS
. Box 6.2 Of S,'taal fml.Td This Is Your Brain on EndoGmn,abmoids
. Box 6.3 Path ,"if Disa.11TI)'. Dcdphering rhe language of Neurons, by Roger A. Nicoll
TRANSMITTER-GATED CHAININELS
THE BASIC STRUCTURE OF TRANSMITTER-GATED CHANNELS
AMINO ACID-GATED CHANNELS
Gtutamole-.G01'ed Channels
. Box 6.4 Of Sl'l:cit111P11I.r The Brain's Exd1ing Poisons
GABA-Gaud and Glycine-Gated Channels
G-PROTEIIN-COUPLED RECEPTORS AIND EffECTORS
THE BASIC STRUCTURE OF G_PROTEIN-COUPLEO RECEPTORS
THE UBIQUlcrOUS G-PROTEINS
G-PROTEIN-CQUPLED EfFECTOR SYSTEMS
----------- I
i
Box 3.2
) BRAIN FOOD
The Nernst Equation
The equilibrll!lm potential for an Ion can be calculated
using the Nernst equation:
E.,. = 2.303 10 [i,on]o
zF g [Ion],
where
E.on = ionic equj.libnum potential
R = gas constant.
T = absolute temperature
z = charge of the ion
F = Faraday's constant
log = ba$e 10 logarithm
[ion]p = Ionic concentration outside the celli
[ion]1 = ionic concentration inside the cell
The Nernst equiltlon can be derived from the basic prin-
ciples of physical chemistry. Let's see if we can make some
sense of iL
Remember that equilibrium is the balance of [wo influ-
ences: diffusjon. which pushes an ion down its concentra
tion gradient. and electricity. which causes an ion to be
attracted to opposite charges and repetled by Jike charges_
Increasing the thermal energy of each particle increases
d'dfusion and wiD therefore increase the potential differ-
ence achieved at equilibrium. Thus. E.on is proportional to
T. On the other hand. increasing the elecmcal charge of
each parude will decrease tha potential difference needed
to balance diffusion. Therefore. EIOI1 is inversely propor-
tional to the charge of the ion (z). We need not worry
about Rand F in the Nernst equation because they are
constants.
At body temperature (3rC). the Nernst equation for
the important ions--K+, Na+. CI-. and Ca2+-simpli.
fies to;
[K+]o
EK = 61.54 mV log [K +],
_ [N.+]o
EN> - 61.54 mV log [N. +],
_ 10-]0
Eo - -61.54 mV log [Cn,
< - 30 77 mV lo g ICa'10
'-Co. [Ca1+],
,RGEINCE IIN INEUROTRAINSMITTER SYSTEMS
Therefore. in order to calculate the equilibrium potentlaf
for it certain type of ion at body temperature, all we need
to know is the ionic concentrations on either side of the
membrane. For instance, in the example we used in Fig-
ure 3. '2. we stipulated that K'" was, twentyfold more con-
centrated inside the cell:
If
IK+]o _ I
IK+]. - 20
10g-do -1.3
E K = 61.54 mVX -1.3
= -80 m\l
Brain Food Boxes
These boxes highlight optional
advanced material, allowing for
flexibility in the classroom.
and
then
Notice that there is no term in the Nemst equation
for permeability or ionic conductance. Thus. calculating
the value of E.on does not require knowledge of the se-
lectivity or the permeability of the membrane for the
Ion. There is an equllibnum potential (or each k)n in the
intraceUuta.r and extracellular flUId. e..,., is the membrane
potential that would juSt balance the ion's concentration
gradient, so that no net ionic current would flow if the
membrane were permeable to that ion.
xiii
xiv USER'S GUIDE
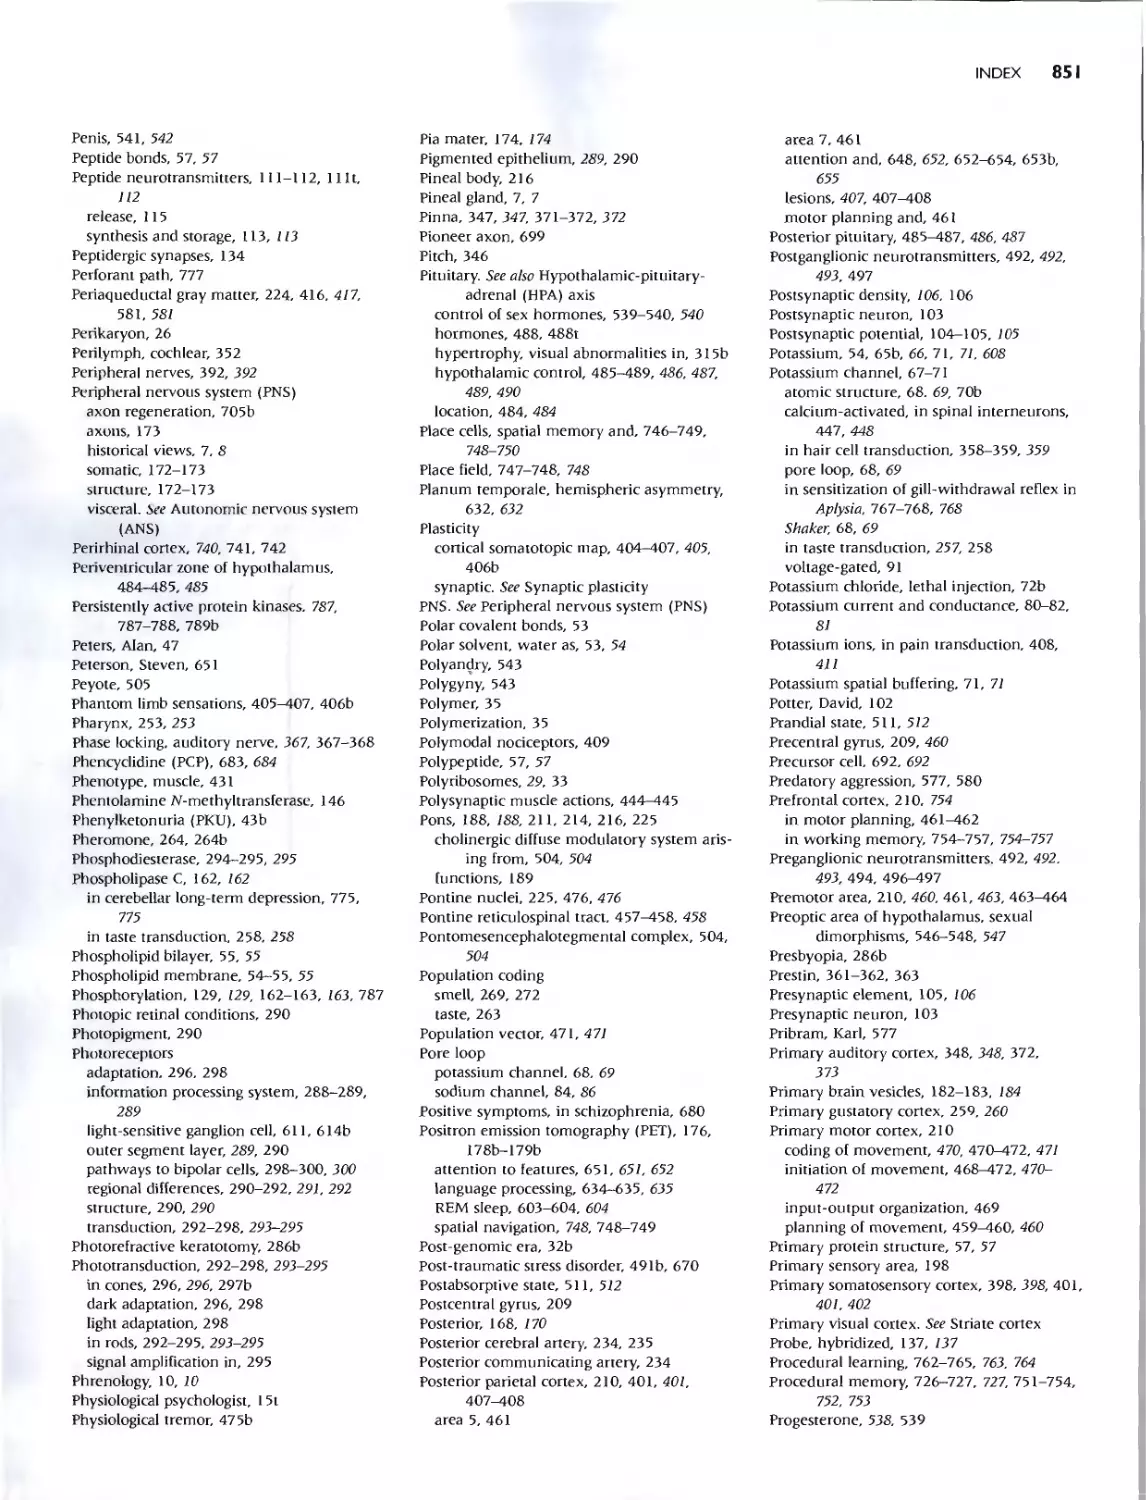
Box 17.1
...' -..
OF SPECIAL INTEREST
Bird Songs and Bird Brains
To Qur ears, the sil"lging of birds may be simply 3 pleas.ant
harbinger of spring. but for birds. It is pan of the serious
business of sex and reproduction. Sn'lglng is stri<:t1y a male
function fa.- many speCIes:, performed for the purpose of
attracr.ng and keeping a mate and far warning off poten-
tial nvaJs. Studies of tWO bird specie5 with different habiu
Qr reproduction and singing ha\le reveaJed some fascinating
dues about the control and diversity of sexual dimor-
phisms in the brain.
Zebra finches are popular pe£s, but theIr wild hab.trtt IS
the harsh Australl;m desert. To breed successfully. birds
require depenchble sources of food. but il1 the desert.
food (:ornes only with sporadic aod unpredictable n.ins.
Zebr.t finches must therefore be ready and willing to
br-eed whenever food and it mate are available, in any sea-
son. Wild canane . on the other hand. live in the more
predictable el1\llronment of the Azores al1d (where els.e!)
the Canary Islands. They breed seasonally during spril1g
and summer. and do not reproduce during fall and wil1ter.
The males of both species are passionate sJl1gers, but they
differ greatly in the Size of their repertow€s. Zebr.J. finches
bdt out one simple ditty all their live5. and annot learn
new ones. Caoaf"!e5 learn many elaborate songs. and they
add n ones each spnng, The different behaviors of zebra
finches and cananes reqUIre dIfferent mechanIsms of neural
control.
The birds' sexu;lIly dimorphic behavlor- singing-is
generated by dramatic 4 11y dimorphic l1£ural Structures.
Birds sing by forcing air past a special muscularized organ
called the synnx, which encircles the air passage. The
muscles of the syrinx are <f.ctivated by motor neurons of
the nucleus of cranial nerve XII. which are in turn COfl
troUed by a set of higher !1uclei collectively called the vocal
;..-'
:
c'.n a' .
nerve XII
/-
Syrinx
Of Special Interest Boxes
This content complements the
text by enhancing the connection
between neuroscience and real
life, with discussion of brain
disorders, human case studies,
drugs, new technology, and more.
COn(rol regions, or VCRs (Figure A). In zebra finches and
canaries. VCR size is five or more tim s larger- In males
than in fem"des..
The development of VCRs and sm,gll1g behavior IS under
the control of steroid hormones_ However. the very differ-
ent seasol131 requirements of zebra Finches and canaries
are paralleled by distioctly different modes of steroidal
control. Zebra. t'in«::hes apparently require early doses of
steroids to organize their VCRs. 3nd later androgens to
cctivate them. If a h tchltng female zebra finch is expo d
to testosterone or estradiol. its VCRs will be larger thar'!
those of normal females when It reaches adulthood. If the
masculinized female IS given more testOsterone as an
adult. its VCRs will grow larger still, and she will then sing
like a male. Females that are not exposed to sterQld$
when young are unresponsive (0 testosterone <1$ adults.
By contrast. the song system In canaries seems (0 be
Independent of e3rty steroid exposure. yet it bursts Into
full serviCE e3d1 spring. If femafe canaries are giver) an-
drogens for the first time as adults, tlley will begm
!iiflging withm a few weeks. The androgens of males surge
n.uurally each spring; theirVCRs double in size as neurons
grow larger dendrites and more syn;1pses. and singing
commences. Remarkably. neurogeoesis. the birth of neu-
rons, continues throughout adulthood in songbird
brains, further (:ontnbutil1g to the VCR circuitry dunng
the mating season. By fall. male a.ndrogen levels drop. and
th canary sons, system shrinks If"! size as his singmg abates.
In a sense. the m:de canary rebuilds much of his song
control system .anew each year as courtship begins. This
may enable him to lfi:arn new songs more easily and. with
tus enlarged repertoire. gain some advanuge In attractins,
a mate.
r-::d
r.erv1O!XII.. _
I
AGlJRE A
Blue Circles nt the voc.aI control reg.ons .... and female zebra finches.
Path of Discovery Boxes
24 new boxes, written by leading
neuroscience researchers, high-
light current discoveries and
achievements of individuals in
the field of neuroscience. Path of
Discovery boxes from the previ-
ous two editions are available on
the Instructor's Resource CD and
online at http://
con nection.lww.com/ go/bear.
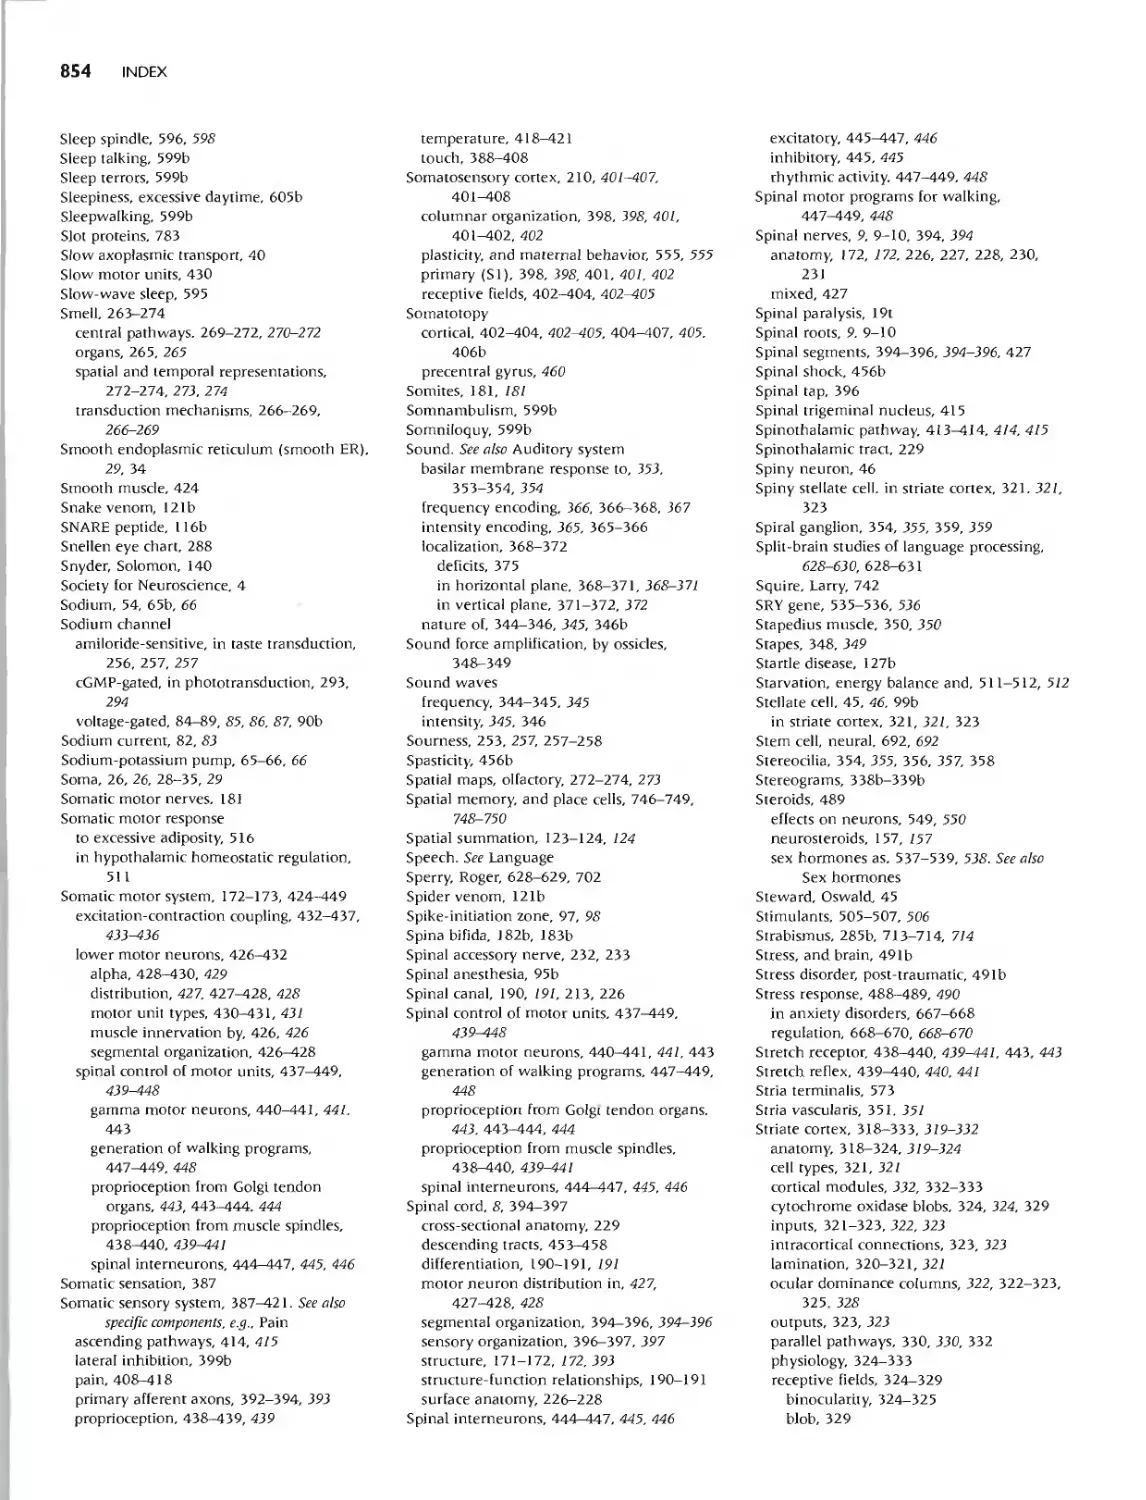
1Iox 3.4
PATH OF DISCOVERY
...
t\.
.
The Atomic Structure of a
Potassium Channel
1
i
It should never be too late to follow 3 new idea. That IS
what I told mysclf when. at nearly thirty years old. I aban-
doned my career as a medical doctor. realiZIng I would be
happier as a scientist. In Chris Miller's laboratol')' at Bran-
deIs University, I was Introduced to potassium channels.
That was the begInning of an exciting ad....enture for me----
a mIxture of "chance and design," to use Alan Hodgkin's
words. I think in my case it was mostly chance.
The year was 1986. when biophysicists imagined Ion
charmels to be membrane pores with selectivity filters
and gate5_ This essentially correct view had been deduced:
by Clay Armstrong, Bertil Hille. and others through
thoughtful analysis of el(!;ctrophysiolog!cal recordings. But
ion channels were not quite "molc(;ular" In the same way
bIochemists viewed enzymes. No one had ever visualized
a potaSSium chanl1el proteIn. In fact, potassium channel
genes had not yet been identified. so even their amino
acid sequences were a mystery. I began to study what are
knowrl as high-conductance Ca 2 . -activated potassium
channels, which we Isolated from mammalian skeletal mus-
cle and reconstituted Into lipid membranes. My question
was a humble one: How does a scorpion toxin inhibit
these potaSsium channe1sr Admittedly. this was not a vel')'
hot topic. in (act you migf1t say it was cord. but that
made no difference to me. I was having fun learnins, chan-
nel biOphysIcs. and I found the mechanism of toxin inhi-
bitIon interesong, even if it seemed unimporr.,anL It be-
c.amF; clear to me that the toxin functIons as a plug on
the pore. and it interacts with ions inside the pore. I spent
long hours trying to Imagine what the channe1 might I.oo'k
like, and how it could selectively conducr Ions at such a
high rate
About a year into my toxin studies. the potassium chan-
net field got a huge boost when the laboratories of lily
and Yuh Nung Jan. Mark T;mouye, and Olaf Pongs reponed
the cloning of the Shaker «::hannel from Drosophila. As luck
would have It. I found dunng a Iiltc nigh1:: experiment at a
Cold Sprins, Harbor course that the Shaker channel was
sensitive to scorpion toxlOS. I knew immediately that I
could use scorpion toxins together wlt.h site-directed
muugenesis to identify which amino acids form the ion
conduction pore. That would be valuable information be
cause the amino aCid sequence had no assigned function.
The toxin led me directly to the pore and to other in-
teresting aspects of potdssium channels. such as how m:my
by RCld 'rick MafKimwu
$ubunits they have. After a few years at Harvard Medical
School. where I had taken a (",culty pos.ltion. my labora-
tory defined which amino aCIds form the selectivity filter
of the Shaker «::hanneL Conserv;uion of these amino acids
in different potassium channels seemed to underSI;Qre the
fact that nature had arrived at a single solution for selec-
tive K conduction across the cell membrane. I began to
realize then that I would not understand nawre's solutIon
without actually seeing the atomic structure (Figure A).
I needed to become a membrane protein biochemist and
X-ray crystallographer. I abandoned my nicely advancing
career as an elecu-ophysiologist at Harvard and moved to
Rockefeller University to corCentr;lte on learning the
new techniques. I was told that I was committins, career
suicide because of the difficulty with membrane proteins
and my complete lack of expenence. But it made little dif-
ference tQ me_ My reasoning was simple: I would rather
crash and burn trying to solvc the problem than not try
at <lit Though the I3.b was initla'ly sm"lI. we were vel')' de-
termined. It was a thnllms, time because we knew we
w re working on a good problcm. and we were passion-
ate about iL Through hard work. perseverance. and more
than a litt1e luck. a vel')' beautiful piece of nature slowly
revealed itself to liS. It was in fact more beauuful than I
e....er could have imagined.
2 f
r-; . !' I
j...... ,
... 1
.....
FIGURE A
The protelll slructure of the: potasSIUm se'ectMty filter-
(from two of fotr sutKnts) is. yoellow: oxygen atorm are red
. Bertran density (tL! ) shows K+ IOI)S (green
spheres) I up ollong the .lnSide the filter.: each K+ 100
blndwlg ide IS u; eight c:<yger' atom which appe....
IQ mlT\lC the wat€f" sulTOl..J"lding the hytYated K IOn
below tht! ft!l.er (Ccxrtesy of Dr Hoderick Mad<I1oot1)
111
VI
w Z
0
>
w I-
a:: VI
w
=>
0
6d
USER'S GUIDE XV
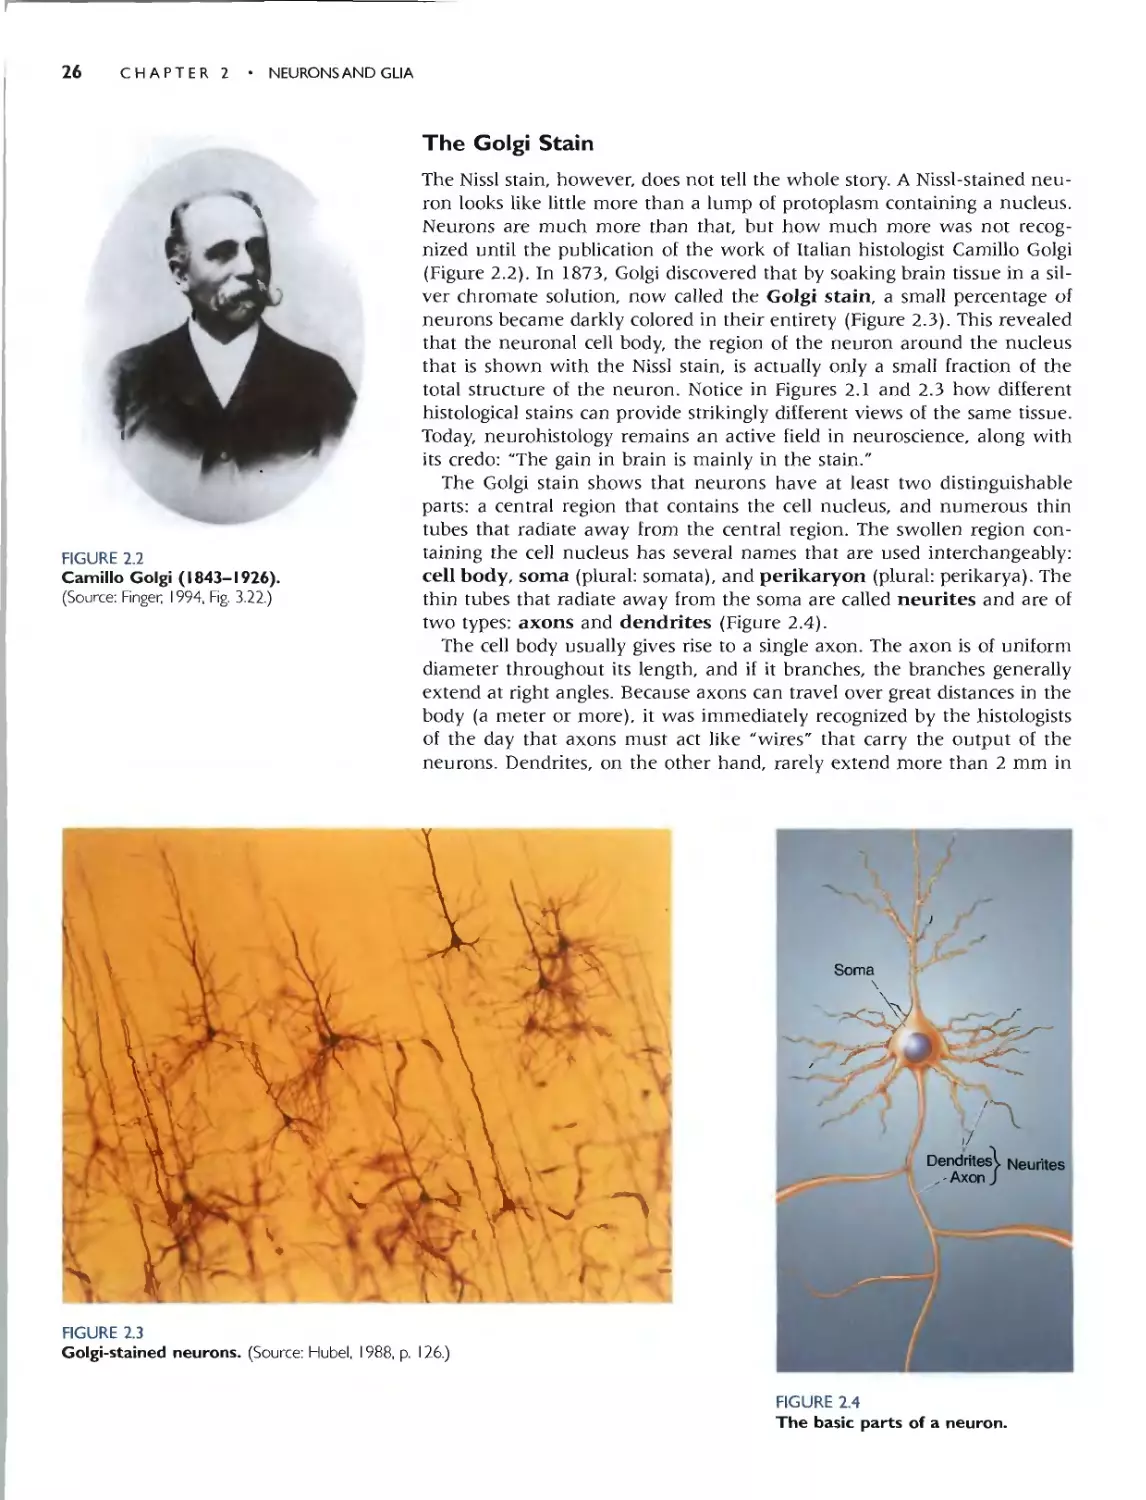
The Goigi Stain
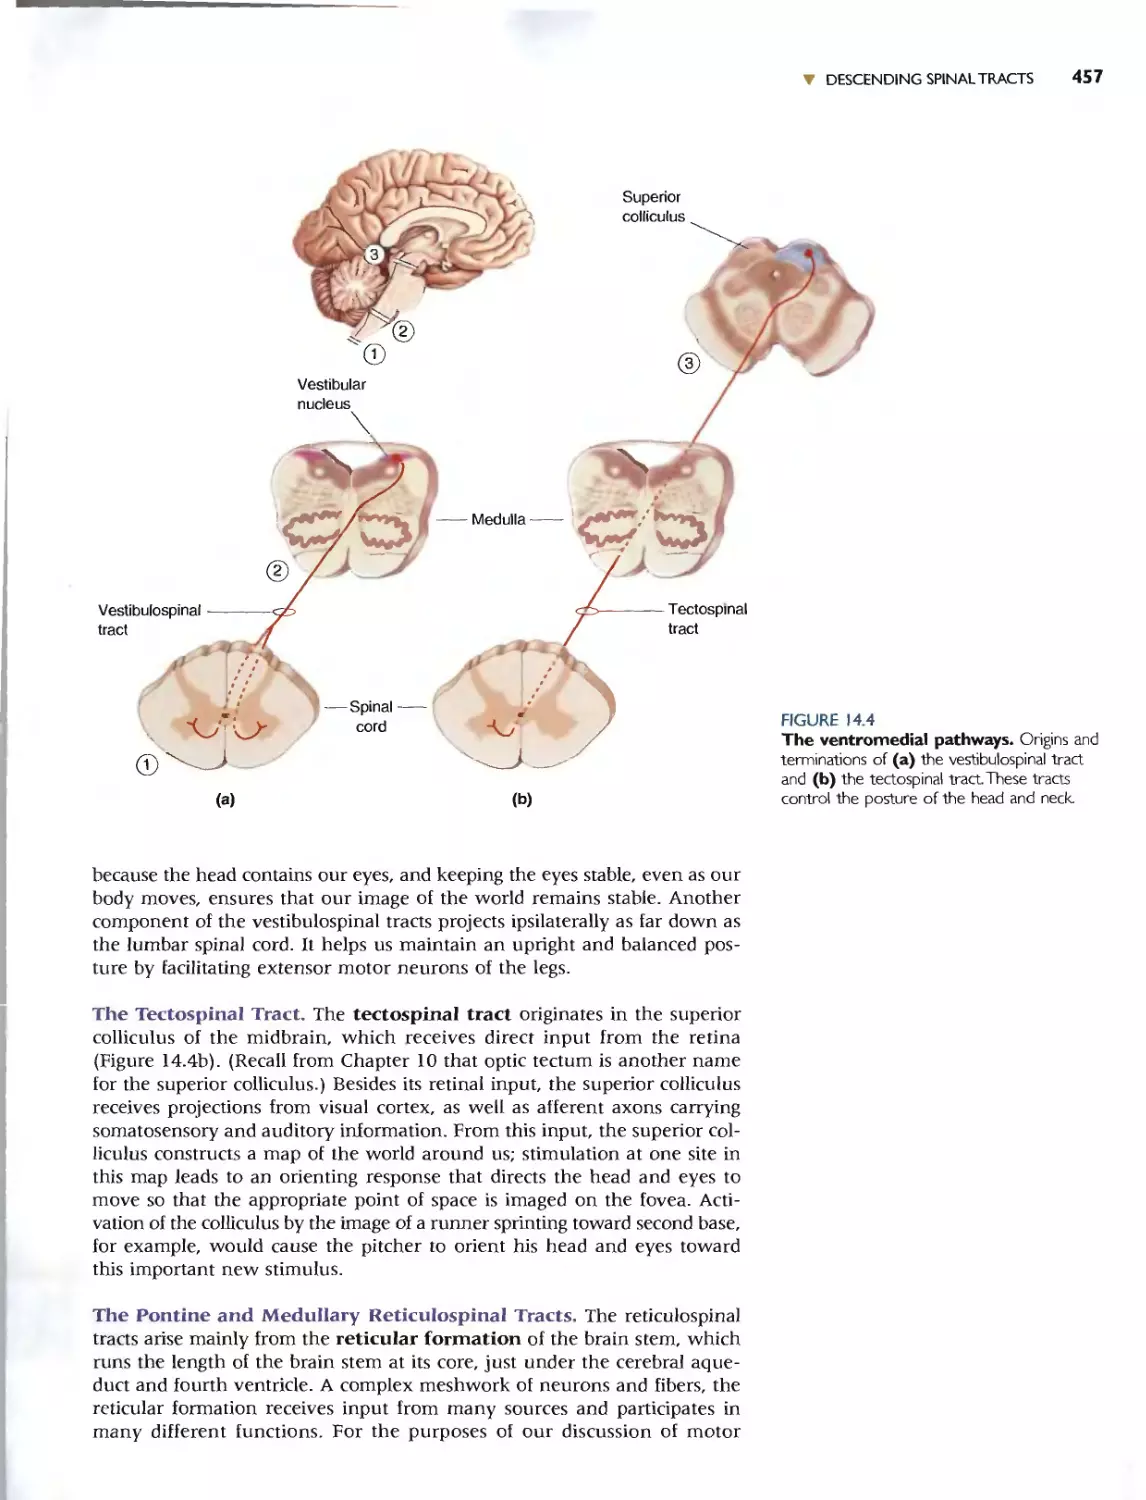
pinal cord runs anterior 10 posterioL The lOp side of the spinal cord is the
dor::.al sidc. and the bouom side is the ventral side.
[f WL' look down on (he nervuus syslt'm, we see tbal it rnay be dividt'd
into two equal halves (Figure 7.2b). The right side of (he bram cmd pina[
cord is (hI.:: mirror image of the: lerr sidt.:. This characterislic is known as.
bilateral symmcuy. With just a few l'Xccplions. most strudures within the
_I)er\'olls system come in pairs. one on [he righl <;idc and (hI.' other on the
1ft. Tht invi:-.ible line funning down (he middle of [he nervous system is
ilkd the m.idline, and tbis gives us another way to describe anafl)mical
'ferenccs. Strucwre.. clo'Scr [0 the midline are mediaJ; SilructurC"i fJt1her
{..'ay from the midline are lateral. In o[hcr words, tht= nose is m(:d 1 10
'le eyes, (he eyes are medjal 10 Ihe ears. and so on. In addilion. [WO Siruc-
.Ires thaI arc on lhe same side are said 10 be ipsilateral 10 each olher; for
['ample, t.he right I..'ar is ip"iilaleral 10 Ihe righl eyc. If lhl- SlrUClUres an' on
ppm.itc sides or th(.' midHne, Ihq' are said to be contralateral 10 each
Iher; the right car is comrahltnallo the lelt ear.
I To view the internal s[ruCtlirc of the brain, it is usually necessary 10 slice
i up. In [he language or ana:1Omi'sts, a slio. I is called a Si'ttiort; [0 ,lice is to
cl;on. Ahhough one could imagine an infinite number of ways we might
UI imo the brain. the standard approach is [Q make cuts parallcllO one of
:11' Ihree anatomical planes ofSt'reion. The plane of the t.'ction resulting (rom
:,Iiuing the brain imo eQual right and lefr halves is called [he midsagitta.l
iJane (Figure 7.3a). Scc[jons parallel 10 the:: midsagiu.af plane are in the
gittal plane.
I The two other anarornical plant..'s are perpcncticular 10 thl' sagittal pJane and
> one anmh('r_ The horizontal plane is parallel 10 the ground (Figure
:3b). A single section in this plane could pass through bOlh the eYt'_'S and
lc cars Thus. horizontal sections. split [he brain inw dorsal and ven[ral
pns. The coronal plane is perpendicular [Q the ground and (0 the sagil-
H plane (Figure 7.3c). A single section in Ihis plane coutd pas through
pth ('yc or borh ear.. bUl not through all four a[ the same lime. Thus, tbe
\-ronal plane split the brain inw anterior and posterior parts;.
I _
r The Nissl50I'aift however. does nOI {elilhe whole slOry. A Nis l-sI3inc-d neu-
ron looks like.... Hille more lhan a lump of protoplasm containing a nucleus.
NCUfnns c1In much more [han that, bur how much more was not rccog-
ni7---cd un[iI the publication of the work of halian hislOlogist Camillo Golgi
(Figure 2.2)., Tn IS73, Gotgi discovered thai by ..u.a.kmg brain IJSSuc in a iI-
ver chromate soluiiun. now caHed the Goigi stain. a smal1 pcrcen!age or
neuron.. bccam(: dJrkly colored in thl'ir ('m n_'IY (Figure 2.3). This fcn'alcd
[hat rh{' neuronal cell body, thl' region of the neuron around thl..' nucleus
thar is sho\-'m with the Nissl stain, i, actually only a small fraclion of [he
I Ioral struClUrt: of the neuron. Notice in Fi.gnres 2.1 (,I,nd 2.3 how dif[.errm
hislOlo ical slains can provide Mrikingly diffcrcnr views of [he same tbsuc.
TodJ}T, ncurohh[o(ogy remain:-. an adivl." field in neuroscience. along with
i[s credo: "The gain in brain is mainly in the s[ain.-
The Go gj stain hows thaI neurons have al leas.l twO disllnguishable
paris: a cemral region [hat comain the cell nuch:us. and numerous Ihin
mbt"\ (hal radime away rrom Ow ct..'nrral region. The swollen region con-
laining the cell nuckus has :"evnal naml..... Ihat are u:'l.'d inrcrchangcably:
cell body. 50ma (plural: ,ornata), and perikaryon (ploral: I",rikarya). The
(,hin tubes Ihat radiate a\'\'ay from the "ioma art:' called tl.€urites and are of
uvo IYpCS: axons and dendrites (Figure 2.4).
The cell body usually gives rise to a ingk axon_ The axon is of uniform
diamdef throughou[ ii, length. and if it branchc . Ihe branches generally
cxtt'nd at righl angle..._ Because aXonS can t'r'J\.d o\'cr grCcl[ distances in [he
budy {a meter or ffil.}reL if was immediately recugnized by [he hbwloglsts
of the day that ilxons must act like "wirc..." [hat carry the output of the
.... ..... I'U.-.D.anLIxlLou:.--..£lJ:1. '" h,n..l .... _I. .xx...n.<l....n"-O-r.._ t.h.;. T.I.-
Key Terms
Appearing in bold throughout the
text, key terms are also listed at
the end of each chapter and
defined in the glossary.
\
r Vl
wI:
:Ita::
w
I-
Types of Memory
and Amnesia
learning (p. 726)
memory (p. 726)
declaratNe memory (p.726)
nondedarative memory (p. 726)
procedural memory (p. 726)
long-term memory (p. 727)
short-term memory (p. 729)
memory consolidation (p. 729)
working memory (p. 729)
amnesia (p. 729)
retrograde amnesia (p. 730)
anterograde amnesia (p. 730)
Korsakoff's syndrome (p_ 744)
Morris water maze (p. 746)
place cell (p. 747)
rctatlona!: memory (p. 749)
The Search for the Engram
engram (p. 731)
ce" assembly (p. 733)
The Temporal Lobes and
Declarative Memory
hippocampus (p. 740)
emorhinal cortex (p. 741)
perirhinal cortex (p. 741)
parahippocampal COrtCX (p. 741)
rornix (p.741)
delayed non-match to sample
(DNM5) (p. 741)
recogn.tion memory (p. 742)
The Striatum and
ProcedUral Memory
striatum (p. 75 I)
The Neocortex and
Working Memory
prefrontal cortex (p. 754)
lateral Intraparietal cortex (area
lip) (p. 757)
I. If )'ou try to recall how many windows there are in your house by mentally walking from room to room.
are you using dec1aracive memory. procedora. memory. OJ" bothr
2. What evidence is there (hat declaratIve and nondeclarative memory use distinct drcuitsr
3. What am1ic.res am:! d sabilities do you t ink a person comp\ctely lack)ng working memory would have!
4. Why did Lashley conclude that aU corrical areas contribute equally [0 le&lrnrng and memoryr Why was [hiS
conclusion later catled Into qu.estlonr
S,. What evidence indicates that (ong-term memories are stored in neoconex!
6. If you were using a microelectrode to record from the brain and you suspected that a neuron you en-
countered was in-vowed in storing ong-tel'Jn memories. how would YOlJl test that hypothes sr
7. If 3 neuron in visual cortex responds to faces. ow couW you determine whether it s mvotved In percep-
tion or storing memories for f-aces
8. What are place cells. and where are they found In what ways 3!"e the response chara.cterisucs of place cells
different from the receptive fields of sensory neurons!
9. What role does the hippocampus pia)' in spatial memo,ry. working memory. and! relationa' memory
10. What is working memory. and in what brain areas have neural correlates of working memory been
obser....ed!
Review Questions
Chapter review questions provoke
thought and help students test
their comprehension of each
chapter's major concepts.
a::l:)
wz
I_
I-Q
a::<{
=>w
u...a::
Baddeley A 2003. Working memory: looking back
:and looking forward. Nature Reviews Neurosc;ence
4;829-839.
Corkin S. 2002. What's new with the amnesic
patient H.Ml Nature RevIews Neuroscience
3:153-160.
Eichenbaum H. 2000. A cortical-hippocampal system
for declarative memory. Nature Reviews Neuro-
science 1:41-50.
Haxby J'J. Pettt L, Ungerleidcr LG. Courtney SM.
2000. Distinguishing the functional roles of multi-
ple regions in distributed neural systems for visual
working memory. Neuroimage J 1:380-391_
Passingham D. Sakai K. 2004. The prefrontal cortex
and working memory: physiology and brain
imaging. Currenr Opimon in Neurobiology
14:163-168-
SqUIre lR,5tark CEL Clark RE. 2004. The medial
temporal lobe. Annual Review of Neuroscience
27:279-306.
Further Reading
Recent review articles are identi-
fied at the end of each chapter to
guide further study.
xvi USER'S GUIDE
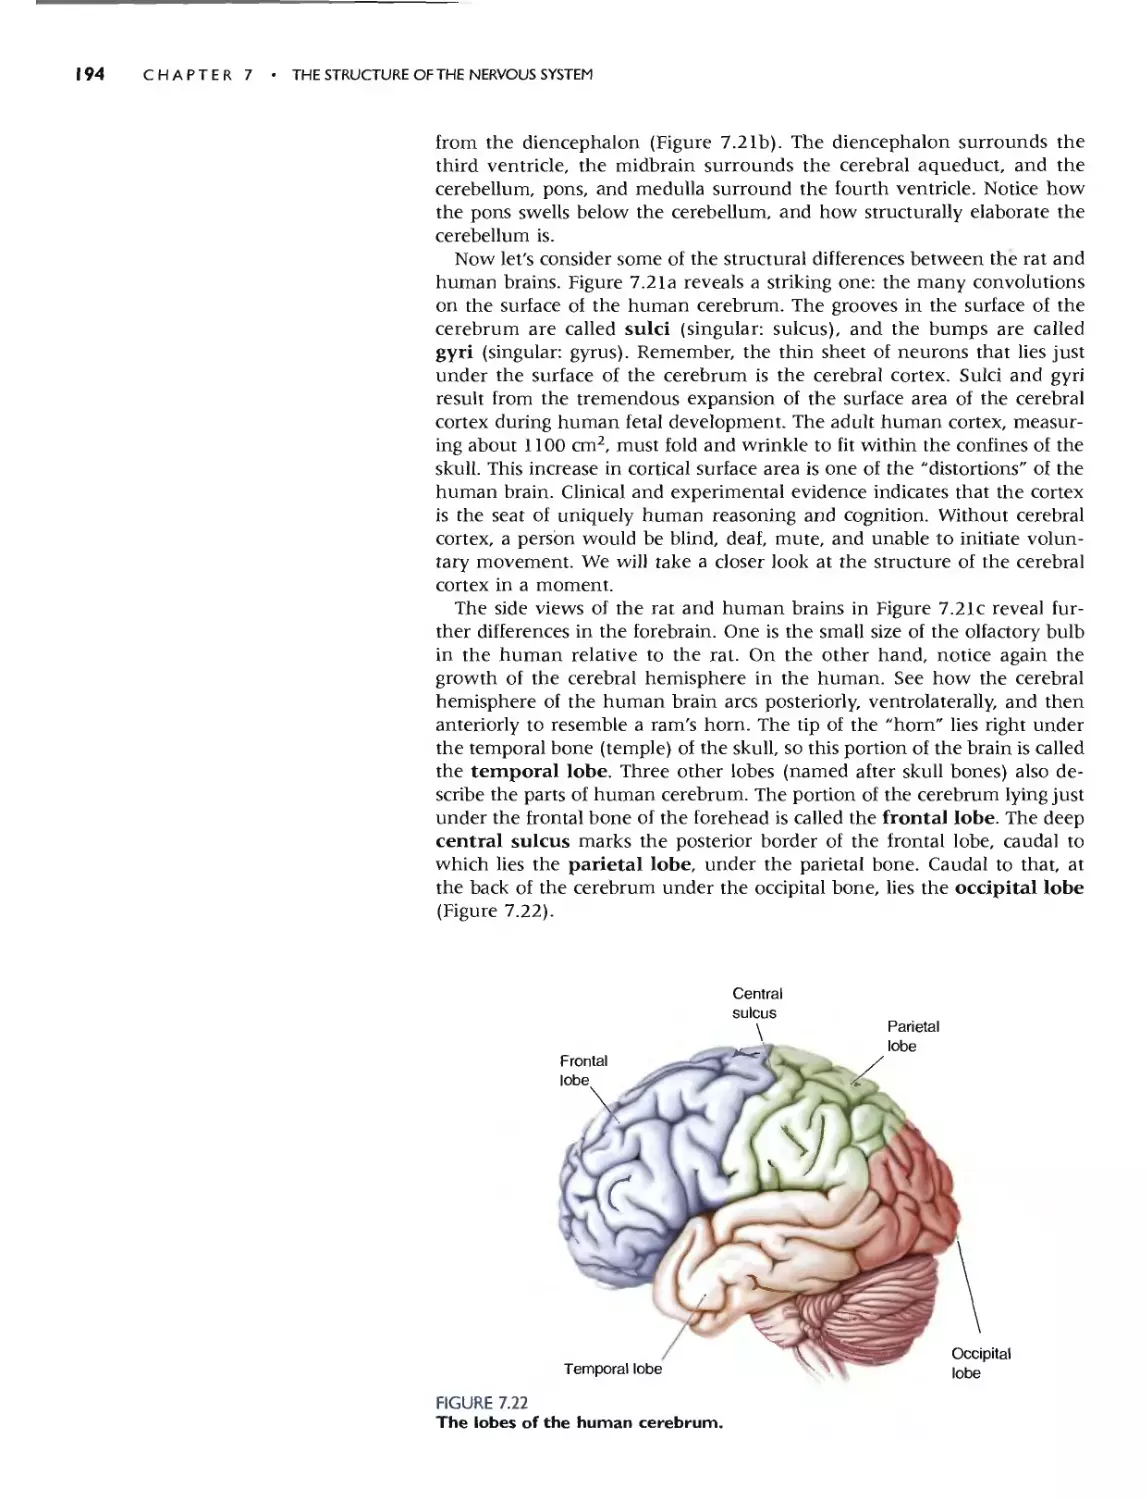
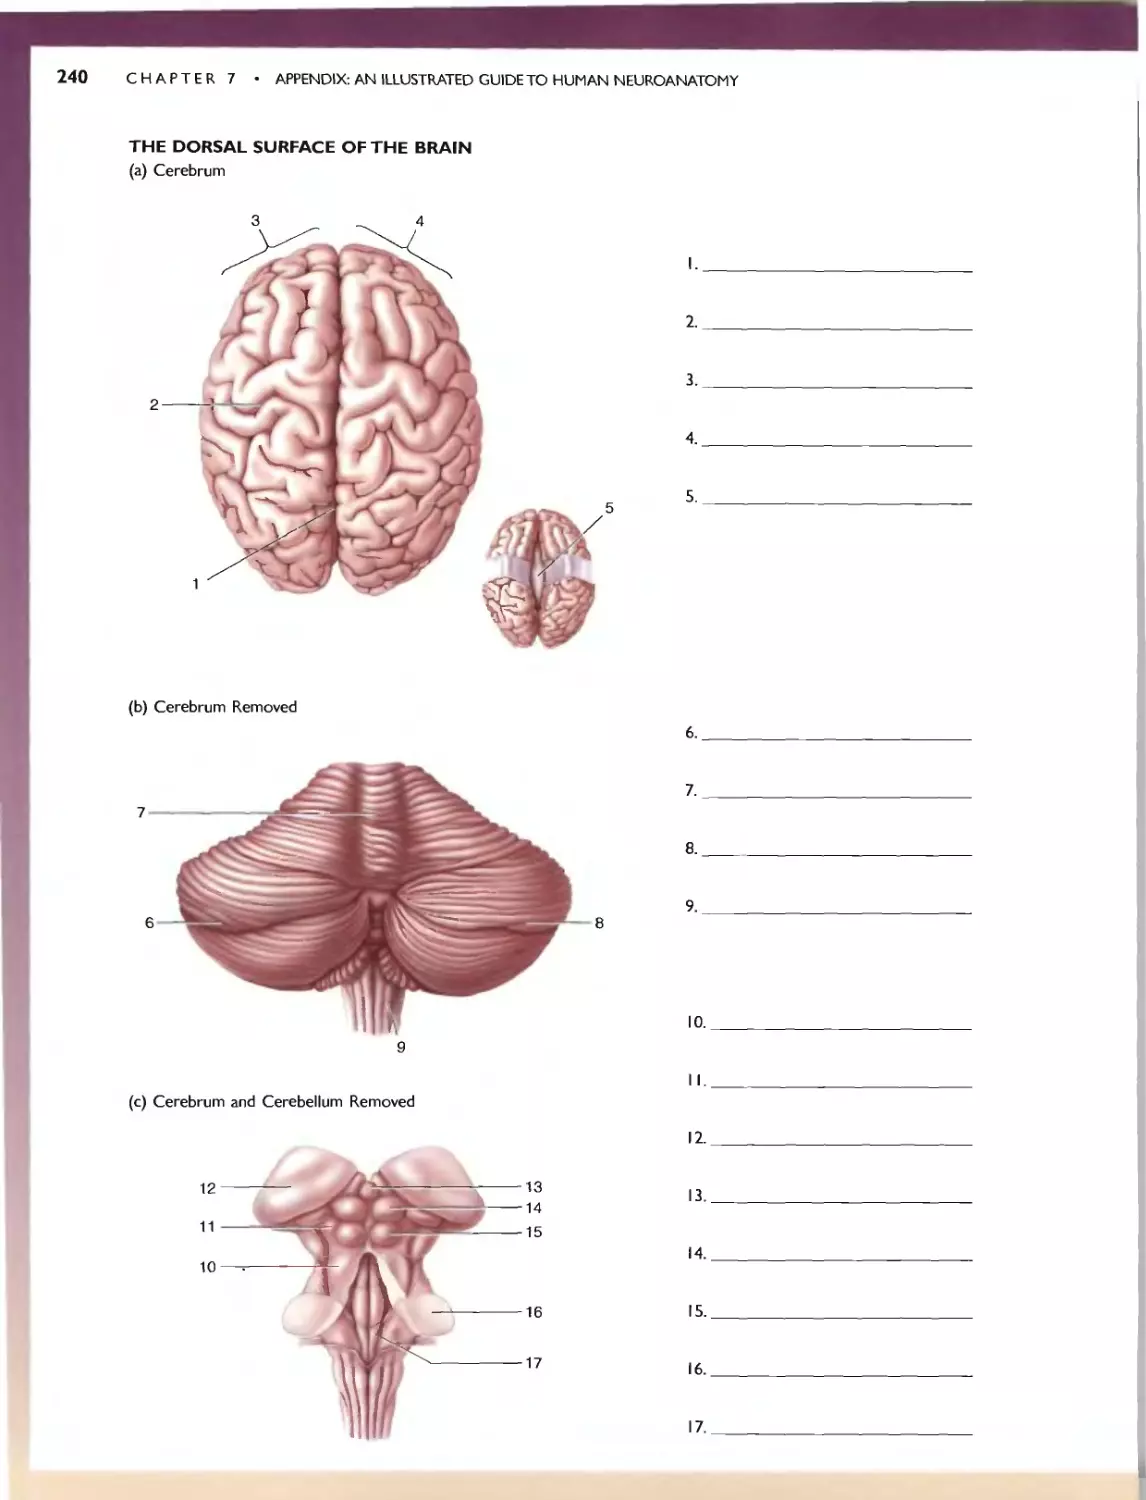
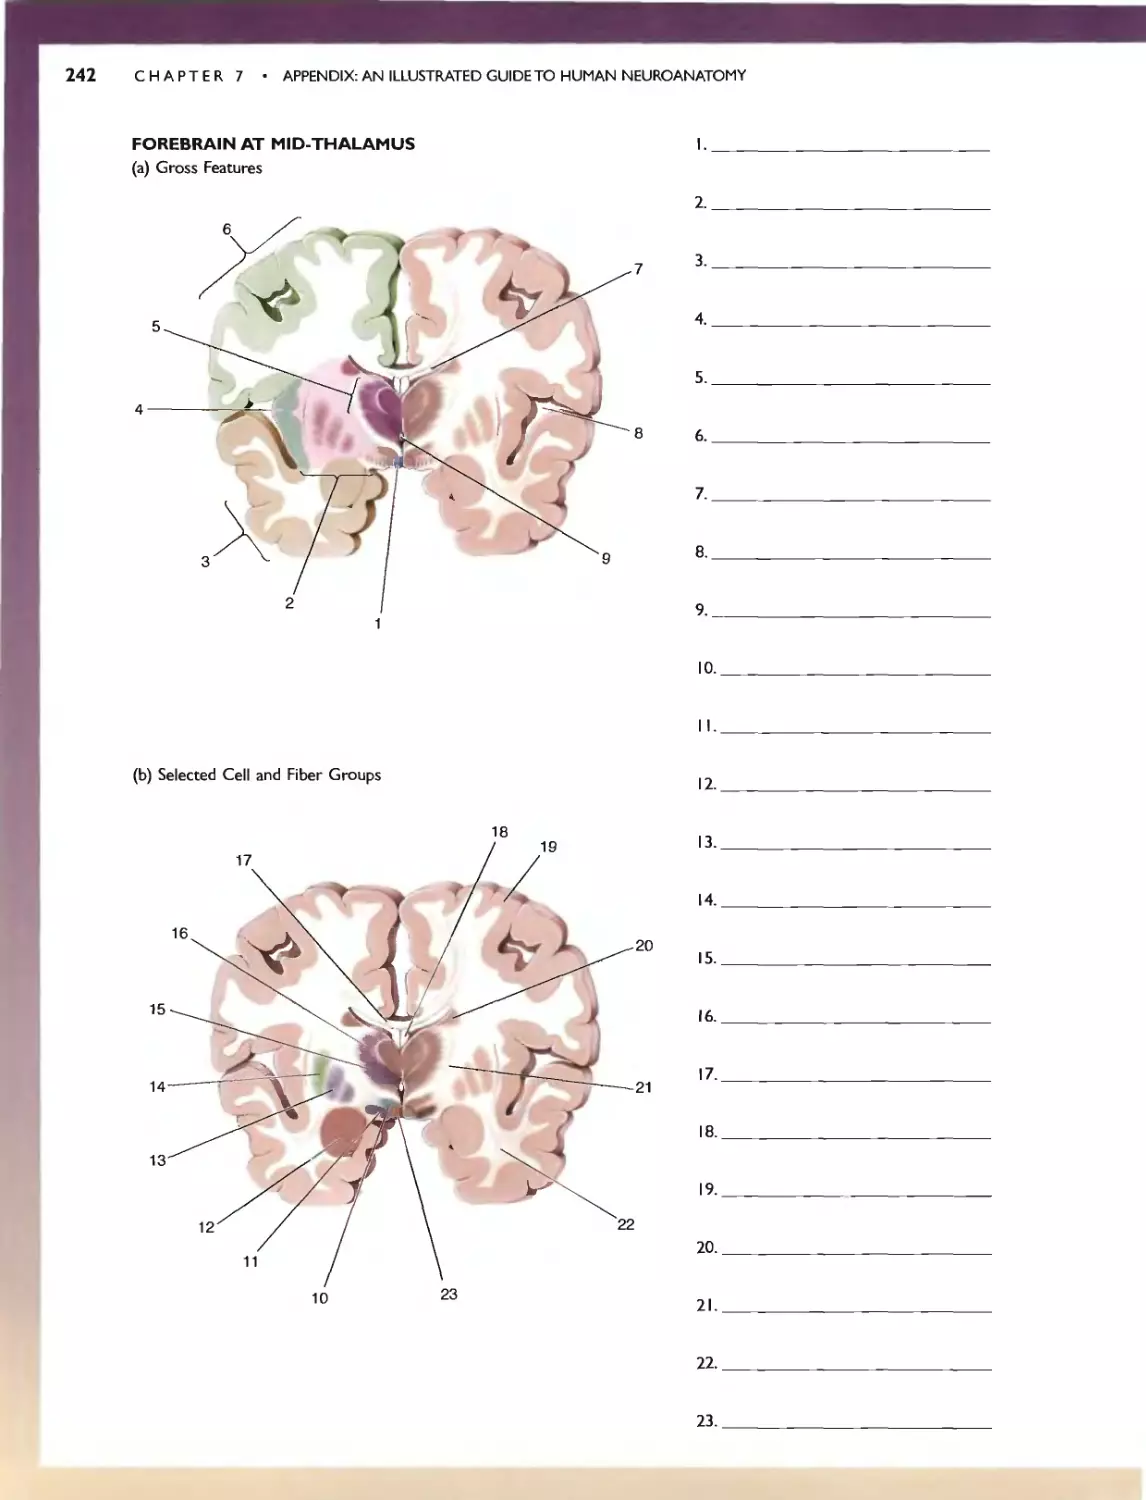
236 C HAP T E R 7 . APP:ENDlX:AN IllUSTRATED GUIDETO HUMAN NEUROANATOMY
'" SELF-QUIZ
This n viC'w workbook is dL'Signed to help you learn the neuroanatomy thai
has bcc.:n prest"med. Here wc: have reproduced the images from Ihe.:: Guide;
instead of labels. hO\'\.'c\lt'r. numbcn:d leadc:r lines (anangcd clockwi<;c)
point to tht.. '1TU'-tlln's of imeresL Test your k.omvJedge by rming: '0 the.' ap-
propriate' names in the "paces provid d. To f(:view whal you na\'e IC?lml'd,
Quiz yourself by pUlling your hand over Ihe: names. This technique greatly
CadliliHn du." h arnin}!: and rCIcnl10n of anatomical terms. Maslery or the
vocabulary uf neuroanatomy WI)I serve you well as you learn abolll the
runCtlonal organization of the brain in the remainder of the book.
2'7 "
h\
,/
,) Jl
--:
An Illustrated Guide to Human
Neuroanatomy
This exceptional appendix to Chapter
7 includes an extensive self-quiz with
labeling exercises that enable
students to assess their knowledge of
neuroanatomy.
THE LATERAL SURFACE OF THE BRAIN
C<I.) G Fearures
"-
3
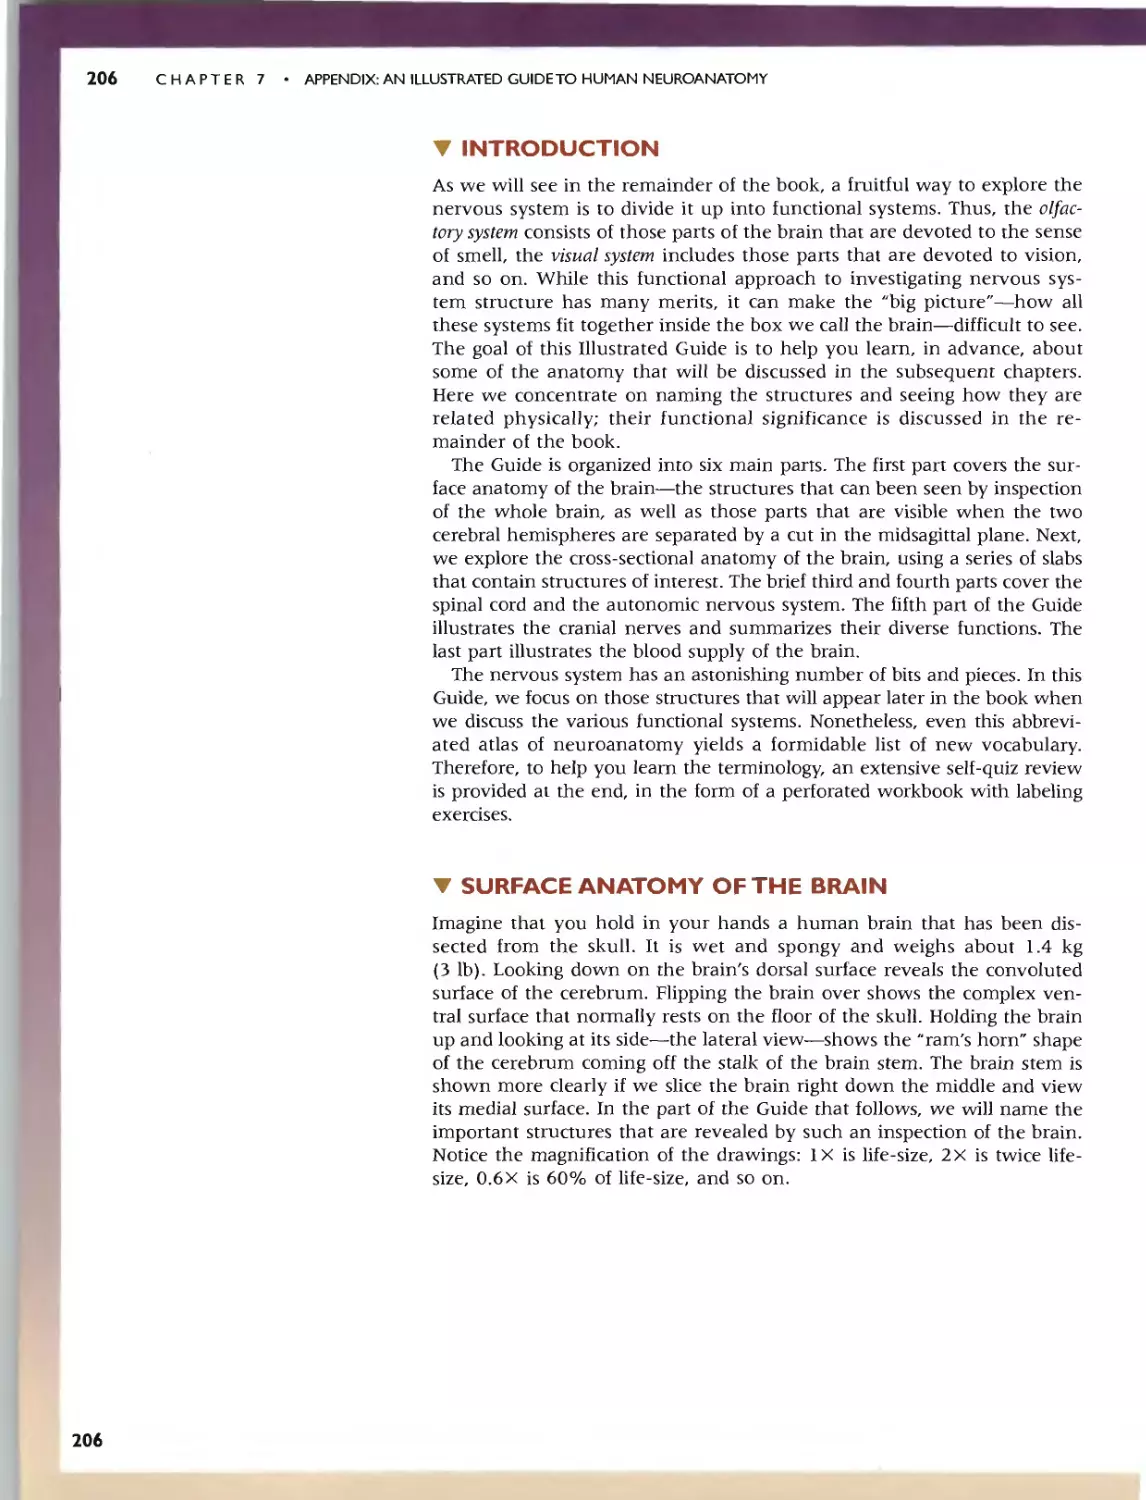
.. SURFACE ANATOMY OF THE BRAJN 209
7 B
B, \ ,/_
;'t.
/ "'9
5 .......:::-
(b) Sdl lcd Gyri Suh.t and Fi'i unc' . Th... ctrebml1l is
noteworthy for its convoluted surface:_ Th(' bumps arc
called )'ri. and (he grOO\'l''' arc callL"<1 sulci or. if they are
1,:!.pC'lially dct:p. fi5<;;urt'<;. TIll' prt.'c1SC patlern of m'rt and
'Sulci C.1n vary considt'rably from individual (0 individual.
bur many fealuR"S arc.: common 10 all human brains. Some
of the imponam landmarks are labeled hen:. The po<,J-
ll"nlroll gyr.., Lies imm.t:dia cly pos erior (0 l:he t:enlral..ul.
l U', and the pn-l,"nrr.lI ) HI" lie..: inm1t:lhatt:\y anfcriur to
the cenlral SUICll-.. The nt'lmms of Ihe pust{'cntral gym..
arc involved in somatic sensation (touch; Chapt("f 12).
and those of t he precentral gyrus conlrol volunrary movc-
mt.'nl fChaplcl'" 14). Neurons in tht. 'U, .rilll'" tl.lIlporal
,ru... an.' .nvolved in audition (hearing; Charm."r II).
(b) Selected Gyri. Sulci. and Fissures
k
Centralsulcw;.
P",cen'",' gyru\ I , /Pos,cen,,,,, gyrus
"
':,- \ ,
'r-
-. -............ Superior lempornl
gyrus
/"'
Lateral (SyMa"i
hssure
. - -
(O.5X)
Self-Quiz
These brief vocabulary reviews found
in Chapter 7 enhance students'
understanding of nervous system
anatomy.
Ie) Cereh.-al Loht.... .and the (n..uta. By convC'nlion,
[h(' o."rcbrum is subdivided imo lobc!O narned aftel'" [he
bmlcs of the skuU that lie O\'t:f thc'm. The ccnual sulcus
dividl' the IInlllallul.". Jwm the r."lrIC...t< llql ""_ The tCIII-
rur,]1 IHI lie immedimdy ventra' to (he dcep lakrL
(S,I\I']111 Ih"'lIre. The nUlpilal Illhc: lie.. althe vl.'ry biuk
of the cerebrum, bordtTing horh parictal and temporal
lobes_ A burk.-d piece of Ihe n."rehraL cortex. called the
ill"'u " (Latin for "'.sla:.nd N ). is H.'waled if [hI..'" margins of
thr: lalcral fis:o.urc are gently pulled apart (mst:t). -rhe
insula borders and c;l.:paraies Ihe temporal and frontaf
lobc'!..
"-'
./p.,""""""
....
FrOn'allobe
anterior ventral contralater.ll
rostral midline midsagttcd plane
posterior medial sagitcJl plane
caudal lateral horizontal plane
do 1 ipsilateral coronal plane
h(
\
"
I
\
"
\
"'\
... SELF-QUIZ
ldkl.: a few moments right now and be sure you understand the mt:aning
of Ihese terms:
...-
Insula.
V
/
/
TomponiJ lobe
"k- _
'C\'( .....--
- ,, : .......
.
" , (OBX)
OCCljJlt.allob6
Comprehensive Art Program
Exceptional artwork engages
readers and illuminates content.
')
(
/1//
)/'1; /
\/\
1\ ' f lAxon
\... hillock
LA
'1'
I
,
"--'
"',-
--' f
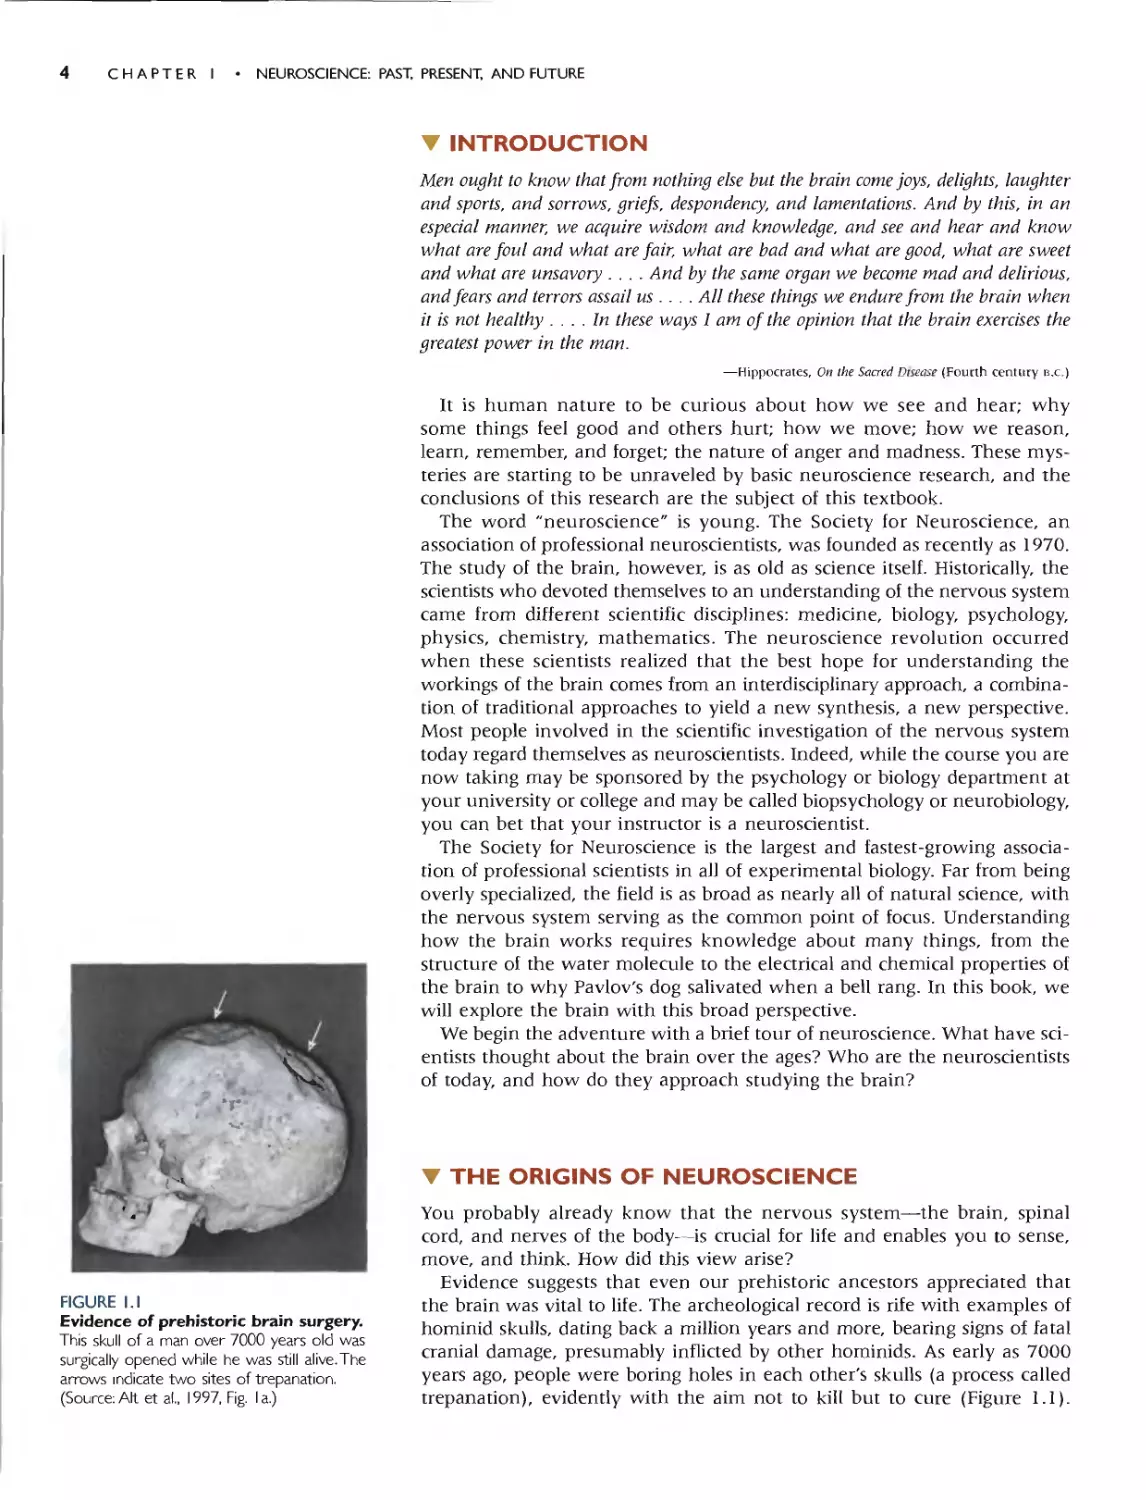
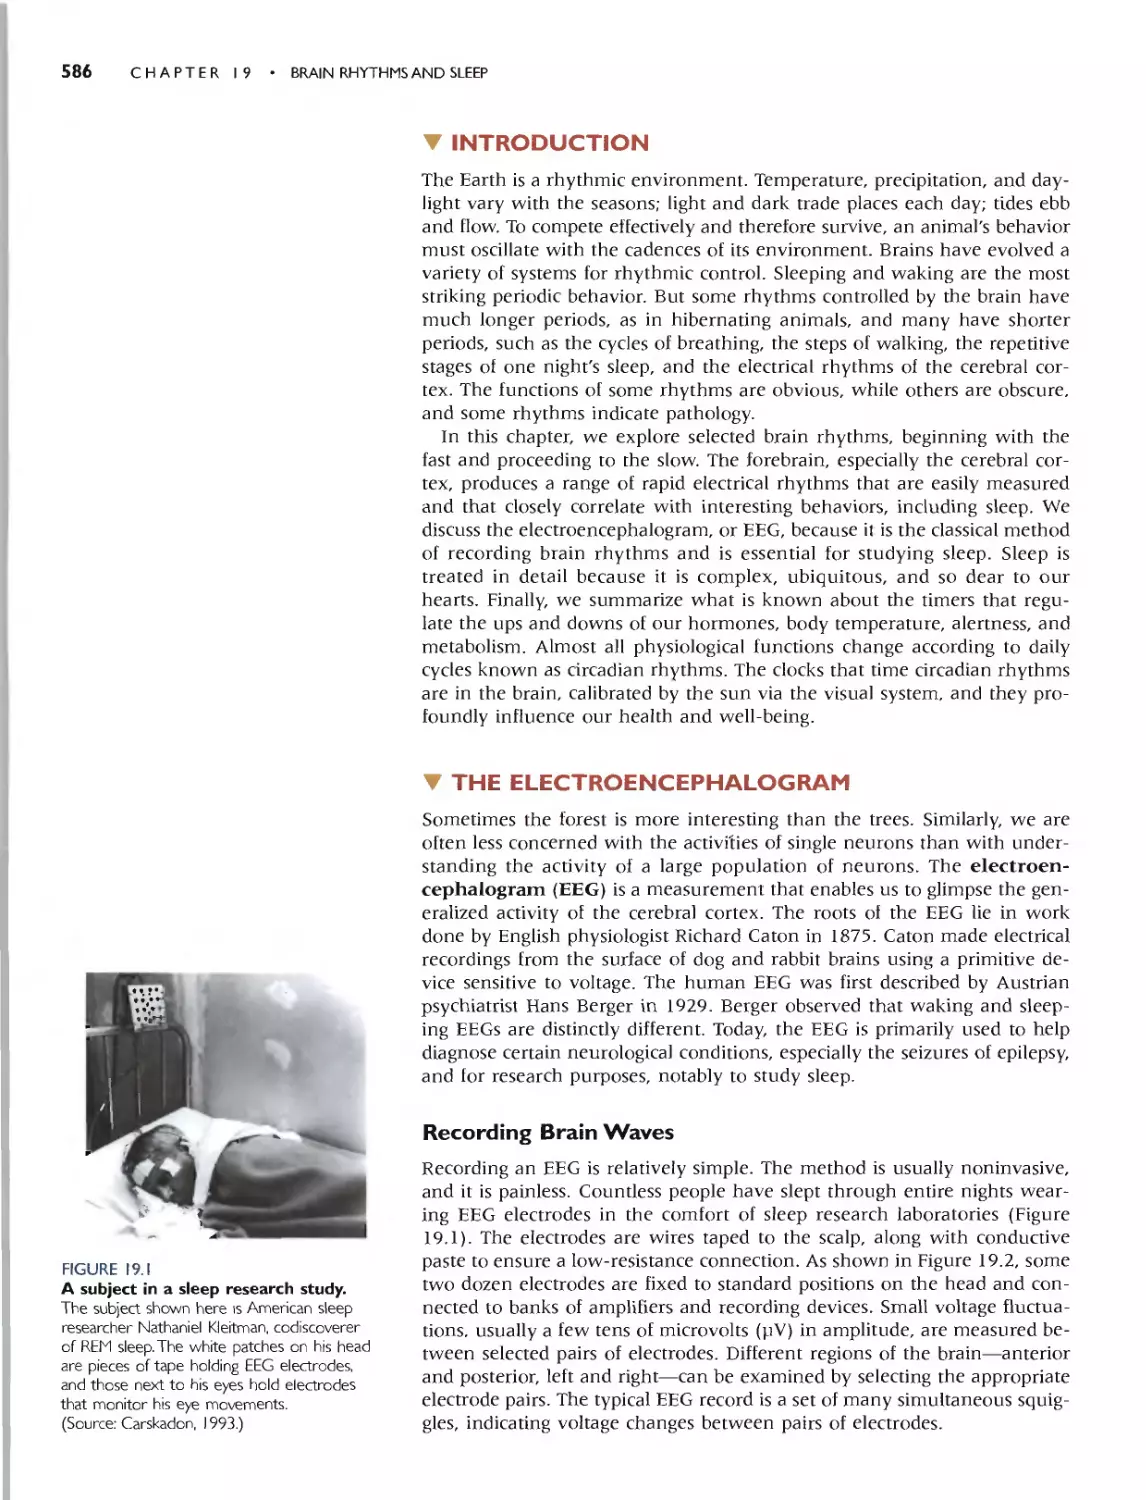
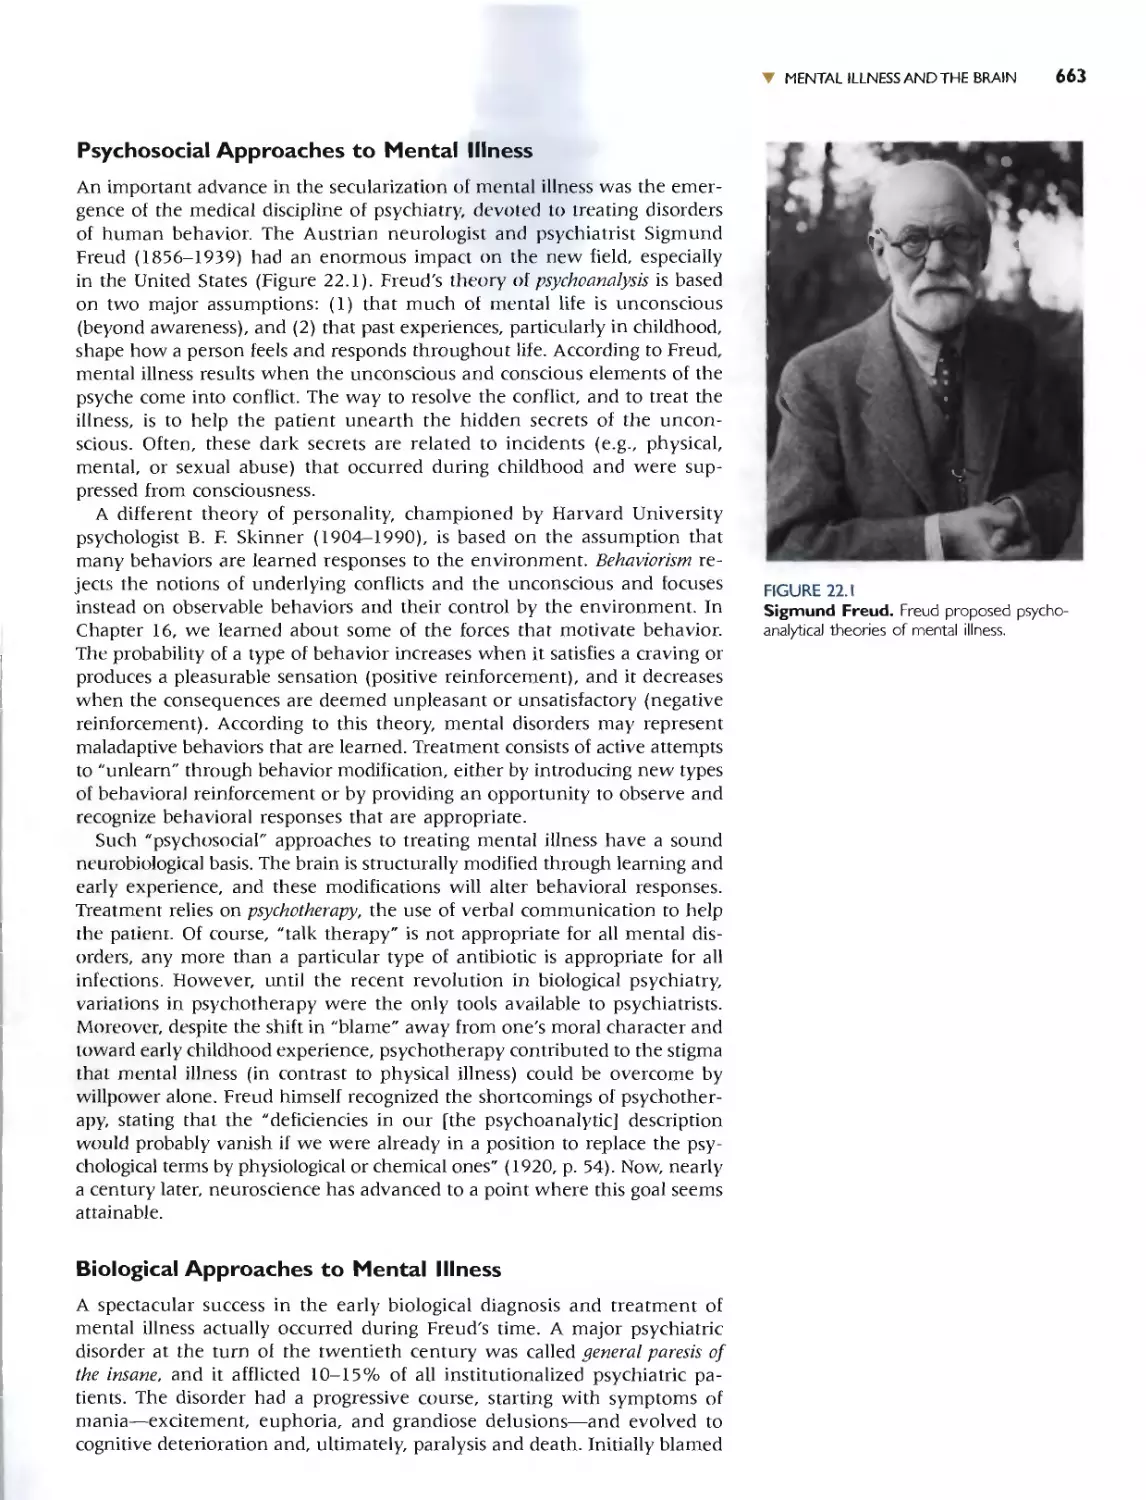
I FIGURE 1.1
The Intemal structure of a typical neuron.
ADDITIONAL LEARNING RESOURCES
This powerful learning suite also includes:
Live
dvise
Neuroscience
LiveAdvise Neuroscience
This online student tutoring service offers
access to live help from experienced
neuroscience tutors. You can chat with
expert educators and get help while
studying for tests or working on
assignments. See the LiveAdvise code
packaged with this text for more
information on this free service.
USER'S GUIDE xvii
I
....I
"
'\
...;....
/
-.r
\ ' '
\ \
Mitochondrion ) ,
/ I i
, _US( I ./
'\J '''' / J'
f''' > _./
:-
/
"-
" ,
. ",-
. .' \
. -: ') I)
\
'-.
V SmooIhER
'-
Mlcro1ubules
)
Axon
Student Resource CD-ROM
Features Answers to Review Questions, Labeling
Exercises, Glossary of Key Terms, and Video Clips
from Acland's Video Atlas of Human Anatomy.
Materials are also available on the companion
website: http://connection.lww.com/go/bear.
Slu(k>nt CD ROM
10 Anump.vry
N[UROHI[NU
\Jfl..IQf1 I 0
Marl< E _
BaITy W. (01111OI'
MId1aO/ A._
11f'I'h.11
....--
. ...
'-...............
- 1
'.-ch-,,>(",I'>IIp.pcM"1
I IWO 6.111 IOro o. ..11t"(hw w.(Om
'......."""'...-L.........'_...__
..-..... _.-
...............-
Acknowledgments
Back in 1993, when we began in earnest to write the first
edition, we had the good fortune to work closely with a
remarkably dedicated and talented group of individu-
als-Betsy Dilernia, Caitlin Duckwall, and Suzanne
Meagher-who helped us bring the book to fruition.
Remarkably, the team is still intact 12 years later, and,
we modestly suggest, practice makes perfect. We are
proud of the third edition, and very grateful to the con-
tinuing invaluable contributions of Betsy, Caitlin, and
Suzanne.
Betsy is our developmental editor. As always, she kept
us in line with her purple pencil. We are especially grate-
ful for the standard of excellence that Betsy established
and held us to. The clarity and consistency of the writing
are due to her remarkable efforts. In addition, she helped
us improve the layout of the book to make it more read-
er-friendly. Caitlin's studio produced the new art, and
the results speak for themselves. Caitlin took our some-
times fuzzy concepts and made them a beautiful reality.
Finally, we are forever indebted to Suzanne, who assist-
ed us at every step. It is no exaggeration to say that with-
out her incredible assistance, loyalty, and dedication to
this project, the book would never have been completed.
Suzanne, you are the best!
For the current edition, we have the pleasure of
acknowledging a new "team member," Elizabeth
Connolly. Elizabeth is an associate development editor at
Lippincott Williams & Wilkins. She worked very closely
with us from start to finish, helping us to meet a
demanding schedule. Her efficiency, flexibility, and good
humor were greatly appreciated.
In the publishing industry, editors seem to come and
go with alarming frequency. Yet two senior editors at
Lippincott Williams & Wilkins have stayed the course
and been unwavering advocates for our project: Nancy
Evans and Susan Katz. Thanks to you and the entire staff
under your direction. It has been a pleasure working
with you.
We again acknowledge the architects and current
trustees of the undergraduate neuroscience curriculum
at Brown University. We thank Mitchell Glickstein, Ford
Ebner, James McIlwain, Leon Cooper, James Anderson,
Leslie Smith, John Donoghue, and John Stein for all they
did to make undergraduate neuroscience great at Brown.
We gratefully acknowledge the research support provid-
ed to us over the years by the National Institutes of
Health, the Whitehall Foundation, the Alfred P. Sloan
Foundation, the Klingenstein Foundation, the Charles A.
Dana Foundation, the National Science Foundation, the
Keck Foundation, the Human Frontiers Science
Program, the Office of Naval Research, and the Howard
Hughes Medical Institute. We thank our colleagues in
the Brown University Department of Neuroscience and
in the Department of Brain and Cognitive Science at the
Massachusetts Institute of Technology for their support
of this project and for helpful advice. A key feature of the
book is the Path of Discovery boxes in which neurosci-
entists describe their research. We thank our new
Discovery authors for these fascinating contributions. We
also thank the anonymous, but very helpful, colleagues
at other institutions who gave us comments on the ear-
lier editions. We are grateful to the scientists who pro-
vided us with figures illustrating their research results. In
addition, many students and colleagues helped us to
improve the new edition by informing us about recent
research, pointing out errors in the first edition, and sug-
gesting better ways to describe or i.llustrate concepts. We
thank them all, including Gul Dolen, Nancy Kanwisher,
Chris Moore, Steve Mouldin, Luiz Pessoa, Wolfram
Shultz, and Dick Wurtman.
We thank our loved ones for standing by us despite the
countless weekends and evenings lost to preparing this
book.
Last, but not least, we wish to thank the thousands of
students we have had the privilege to teach neuroscience
to over the past 25 years.
xviii
-
Path of Discovery Authors
Michael V. L. Bennett, D.Phil.
Albert Einstein College of Medicine
Bronx, New York
John E. Lisman, Ph.D.
Brandeis University
Waltham, Massachusetts
Kent C. Berridge, Ph.D.
University of Michigan
Ann Arbor, Michigan
David Berson, Ph.D.
Brown University
Providence, Rhode Island
Arvid Carlsson, M.D., Ph.D.
University of G6teborg
G6teborg, Sweden
David P. Corey, Ph.D.
Harvard Medical School
Boston, Massachusetts
Margaret Livingstone, Ph.D.
Harvard Medical School
Boston, Massachusetts
Steven E. Hyman, M.D.
Harvard University
Cambridge, Massachusetts
Leah A. Krubitzer, Ph.D.
University of California
Davis, California
Roderick MacKinnon, Ph.D.
Howard Hughes Medical Institute
The Rockefeller University
New York, New York
Richard Morris, D.Phil.
University of Edinburgh
Edinburgh, Scotland
Toshio Narahashi, Ph.D.
The Feinberg School of Medicine
Northwestern University
Chicago, Illinois
Roger A. Nicoll, M.D..
University of California
San Francisco, California
Vilayanur S. Ramachandran, M.D., Ph.D.
University of California, San Diego
La Jolla, California
Marc Tessier-Lavigne, Ph.D.
Genentech
San Frandsco, California
John P. Donoghue, Ph.D.
Brown University
Providence, Rhode Island
John Dowling, Ph.D..
Harvard University
Cambridge, Massachusetts
William T. Greenough, Ph.D.
Beckman Institute
University of Illinois
Urbana, Illinois
Catherine Woolley, Ph.D.
Northwestern University
Evanston, Illinois
Patricia Kuhl, Ph.D.
University of Washington
Seattle, Washington
Joseph LeDoux, ph.D.
New York University
New York, New York
Jon M. Lindstrom, Ph.D.
University of Pennsylvania
Philadelphia, Pennsylvania
Robert H. Wurtz, Ph.D.
National Eye Institute
National Institutes of Health
Washington, D.C.
Charles S. Zuker, ph.D.
University of California, San Diego
La Jolla, California
xix
Preface vii
User's Guide xiii
Acknowledgments xviii
Path of Discovery Authors xix
Part I
Chapter I
Chapter 2
Chapter 3
Chapter 4
Chapter 5
Chapter 6
Chapter 7
Part II
Chapter 8
Chapter 9
Chapter 1 0
Chapter I I
Chapter 12
Foundations
Neuroscience: Past, Present, and
Fu ture 3
Neurons and Glia 23
The Neuronal Membrane at
Rest 51
The Action Potential 75
Synaptic Transmission 101
Neurotransmitter Systems 133
The Structure of the Nervous
System 167
Appendix: An Illustrated Guide to
Human Neuroanatomy 205
Sensory and Motor
Systems 249
The Chemical Senses 251
The Eye 277
The Central Visual System 309
The Auditory and Vestibular
Systems 343
The Somatic Sensory
System 387
Contents
in Brief
Chapter 13 Spinal Control of
Movement 423
Chapter 14 Brain Control of
Movement 451
Part "I
Chapter 15
Chapter 16
Chapter 17
Chapter 18
Chapter 19
Chapter 20
Chapter 21
Chapter 22
Part IV
Chapter 23
Chapter 24
Chapter 25
The Brain and
Behavior 479
Chemical Control of the Brain
and Behavior 481
Motivation 509
Sex and the Brain 533
Brain Mechanisms of
Emotion 563
Brain Rhythms and Sleep 585
Language 617
Attention 643
Mental Illness 661
The Changing Brain 687
Wiring the Brain 689
Memory Systems 725
Molecular Mechanisms of
Learning and Memory 761
Glossary 795
References and Resources 817
Index 837
xxi
Preface vii
User's Guide xiii
Acknowledgments xviii
Path of Discovery Authors xix
Part I Foundations
Chap ter I
Neuroscience: Past, Present, and
Future 3
INTRODUCTION 4
THE ORIGINS OF NEUROSCIENCE 4
VIEWS OFTHE BRAIN IN ANCIENT GREECE 5
VIEWS OFTHE BRAIN DURING THE ROMAN
EMPIRE 5
VIEWS OF THE BRAIN FROM THE RENAISSANCE TO
THE NINETEENTH CENTURY 6
NINETEENTH-CENTURY VIEWS OFTHE BRAIN 8
Nerves As Wires 9
Localization of Specific Funaions to Different Parts of the
Brain I 0
The Evolution of Nervous Systems I I
The Neuron: The Bosic Funaionol Unit of the Brain 12
NEUROSCIENCE TODAY 13
LEVELS OF ANALYSIS 13
Molecular Neuroscience I 3
Cellular Neuroscience 13
Systems Neuroscience I 3
Behavioral Neuroscience I 3
Cognitive Neuroscience 14
NEUROSCIENTISTS 14
THE SCIENTIFIC PROCESS 15
Observation I 5
Replication I 5
Interpretotion I 5
Verification 16
Expanded
Contents
THE USE OF ANIMALS IN NEUROSCIENCE
RESEARCH 16
The Animals 16
Animal Welfare 17
Animal Rights 17
THE COST OF IGNORANCE: NERVOUS SYSTEM
DISORDERS 19
CONCLUDING REMARKS 20
Chapter 2
Neurons and Glia 23
INTRODUCTION 24
THE NEURON DOCTRINE 24
THE GOLGI STAIN 26
CAJAL'S CONTRIBUTION 27
. Box 2.1 Of Special Interest: Advances in
Microscopy 28
THE PROTOTYPICAL NEURON 28
THE SOMA 28
The Nucleus 30
. Box 2.2 Brain Food: Expressing One's Mind in
the Post-Genomic Era 32
Rough Endoplasmic Reticulum 31
Smooth Endoplasmic Reticulum and the Go/gi Apparatus 34
The Mitochondrion 34
THE NEURONAL MEMBRANE 35
THE CYTOSKELETON 35
Microtubu/es 35
. Box 2.3 Of Speciallmerest: Alzheimer's Disease
and the Neuronal Cytoskeleton 36
Microfilaments 38
Neurofilaments 38
THE AXON 38
The Axon Terminal 39
The Synapse 40
Axoplasmic Transport 40
. Box 2.4 Of Special Interest: Hitching a Ride With
Retrograde Transport 42
DENDRITES 41
xxiii
xxiv EXPANDED CONTENTS
. Box 2.5 or Speciallntercst: Mental Retardation
and Dendritic Spines 43
. Box 2.6 Path of Discot'clY: Spines and the
Structural Basis of Memory, by William
Greenough 44
CLASSIFYING NEURONS 45
CLASSIFICATION BASED ON THE NUI"IBER OF
NEURITES 45
CLASSIFICATION BASED ON DENDRITES 45
CLASSIFICATION BASED ON CONNECTIONS 46
CLASSIFICATION BASED ON AXON LENGTH 46
CLASSIFICATION BASED ON
NEUROTRANSI"IITTER 46
GLiA 46
ASTROCYTES 46
I"IYELINATING GLiA 47
OTHER NON-NEURONAL CELLS 48
CONCLUDING REI"IARKS 48
Chapter 3
The Neuronal Membrane at Rest 51
INTRODUCTION 52
THE CAST OF CHEI"IICALS 53
CYTOSOL AND EXTRACELLULAR FLUID 53
Water 53
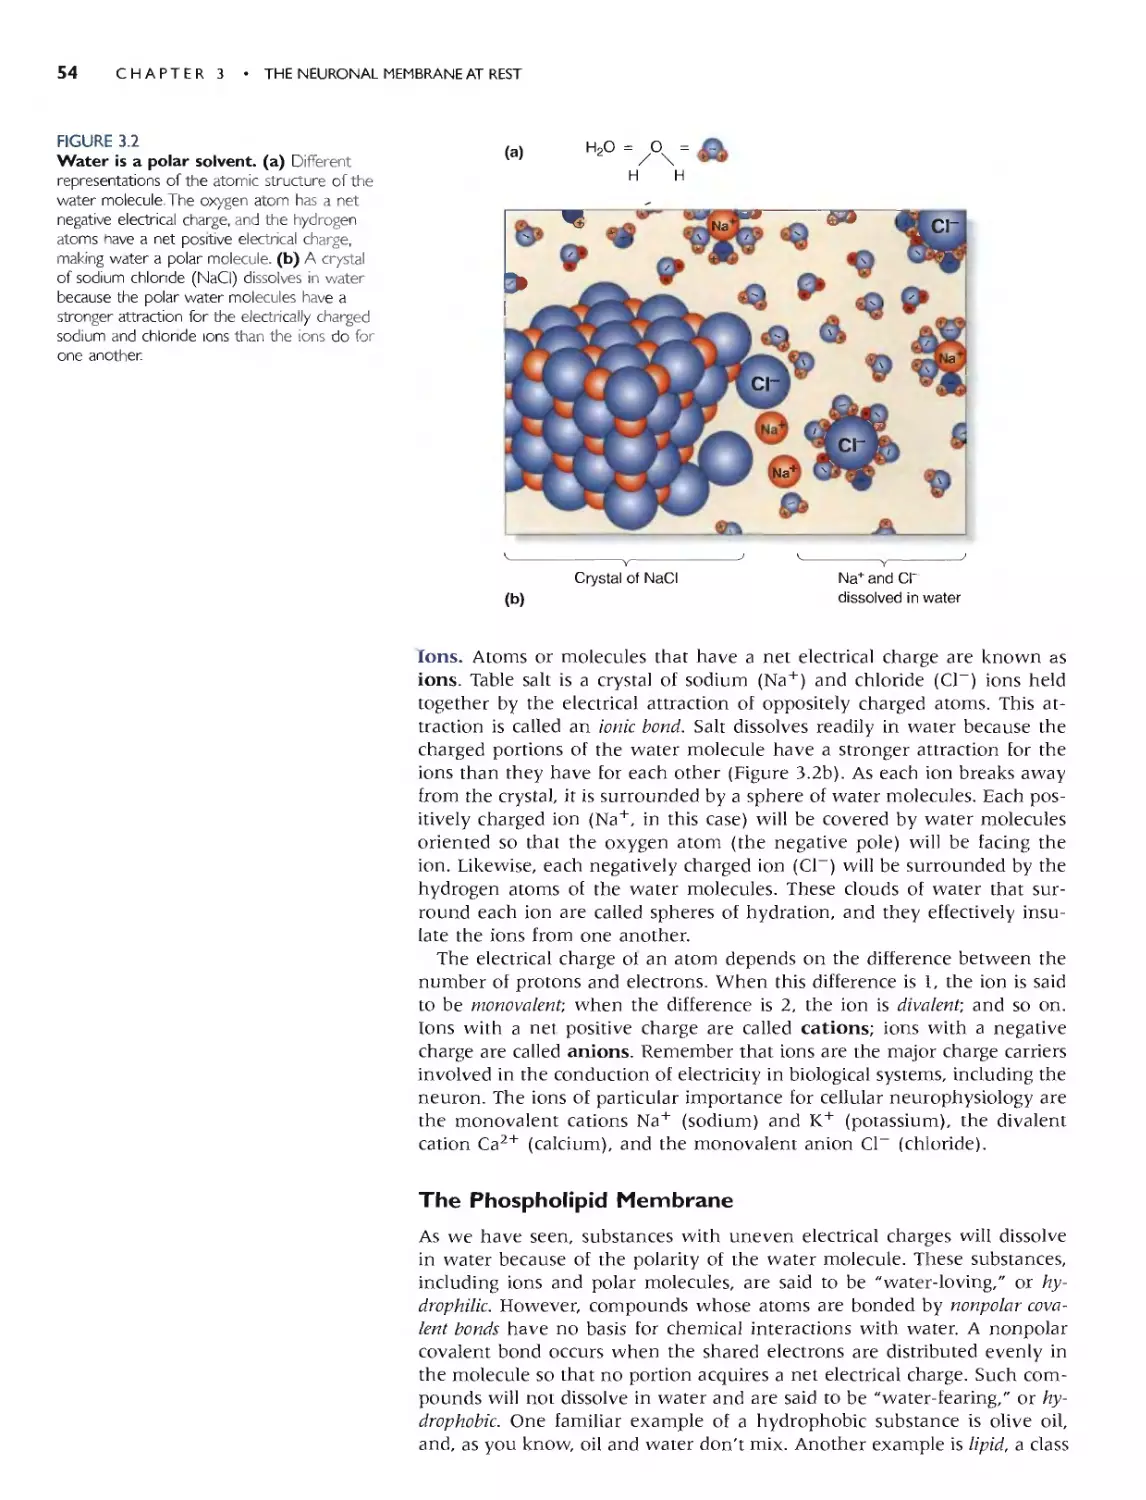
Ions 54
THE PHOSPHOLIPID I"IEI"IBRANE 54
The Phospholipid Bilayer 55
PROTEIN 55
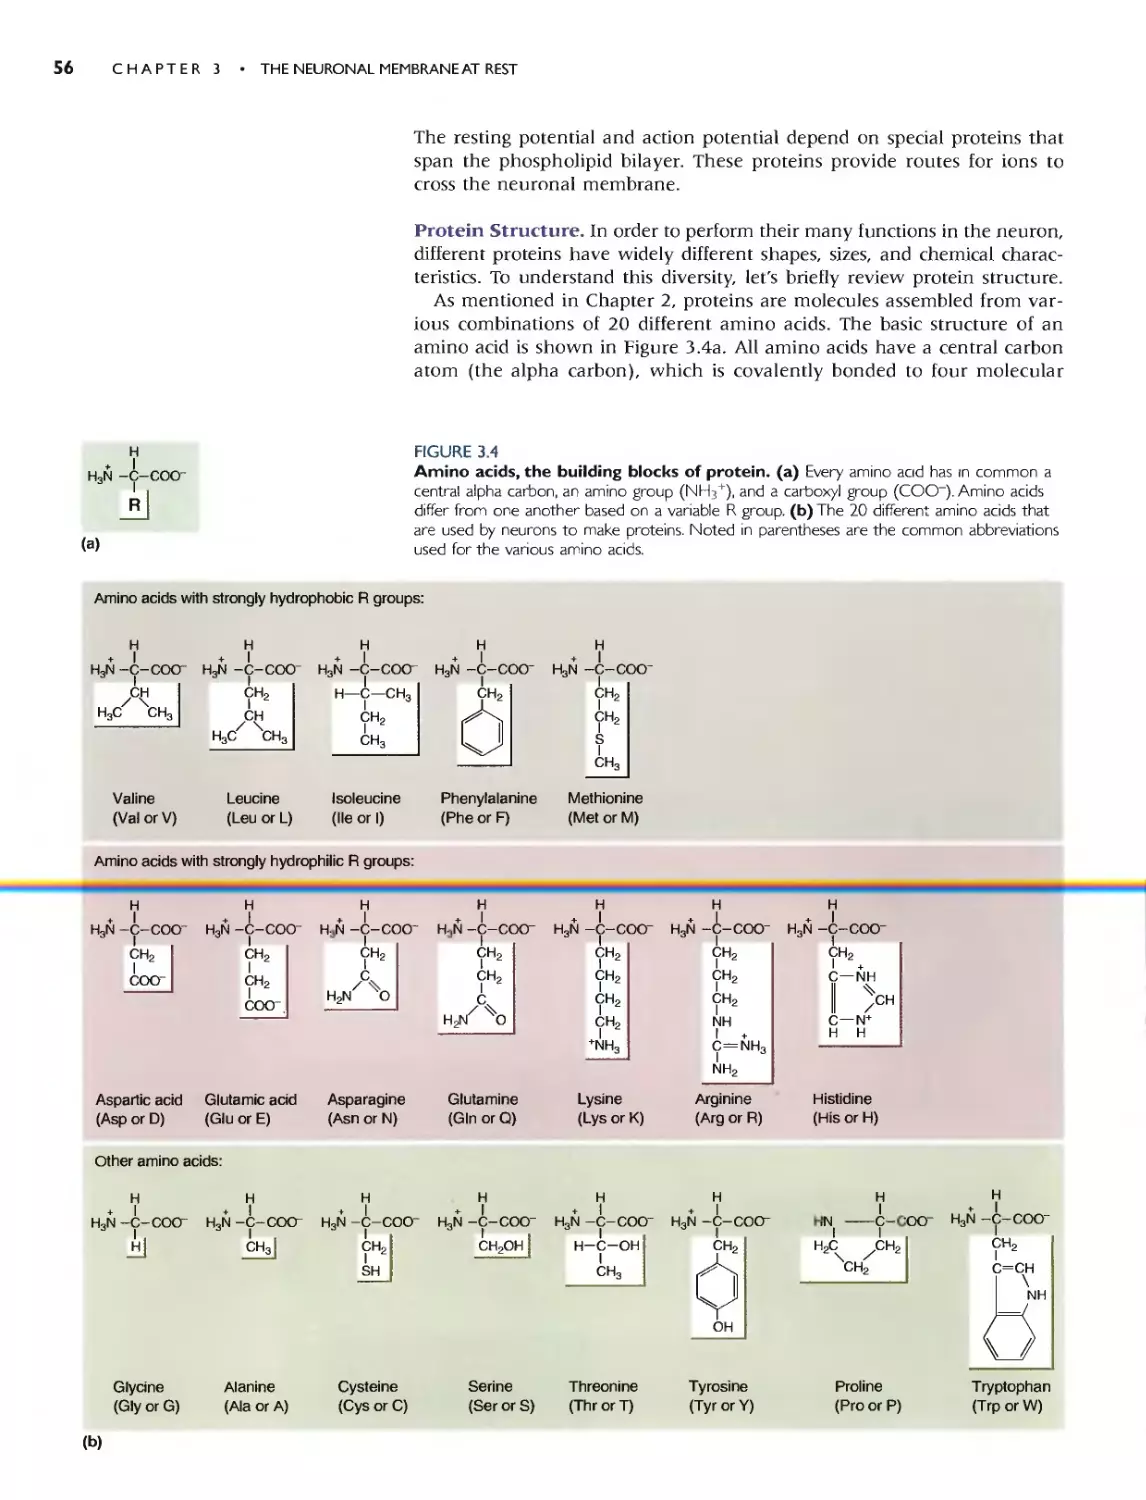
Protein Structure 56
Channel Proteins 58
Ion Pumps 59
THE I"IOVEI"IENT OF IONS 59
DIFFUSION 59
. Box 3.1 Brain Food: A Review of Moles and
Molarity 60
ELECTRICITY 59
THE IONIC BASIS OFTHE RESTING MEMBRANE
POTENTIAL 61
EQUILIBRIUM POTENTIALS 62
The Nernst Equotion 64
. Box 3.2 Brain Food: The Nemst Equation 65
THE DISTRIBUTION OF IONS ACROSS THE
MEI"IBRANE 65
RELATIVE ION PERMEABILITIES OF THE MEI"IBRANE AT
REST 67
. Box 3.3 Brain Food: The Goldman
Equation 68
The Wide World of Potassium Channels 67
. Box 3.4 Path t 1 ( Di cOL'C1V: The Atomic Structure
of a Potassium ChanneL by Roderick
MacKinnon 70
The Importance of Regulating the External Potassium
Concentration 71
. Box 3.5 Of Special Interest: Death by Lethal
Injection 72
CONCLUDING REMARKS 71
h apter 4
The Action Potential 75
INTRODUCTION 76
PROPERTIES OF THE ACTION POTENTIAL 76
THE UPS AND DOWNS OF AN ACTION
POTENTIAL 76
. Box 4.1 Brain Food Methods of Recording
Action Potentials 78
THE GENERATION OF AN ACTION POTENTIAL 76
THE GENERATION OF I"IULTIPLE ACTION
POTENTIALS 77
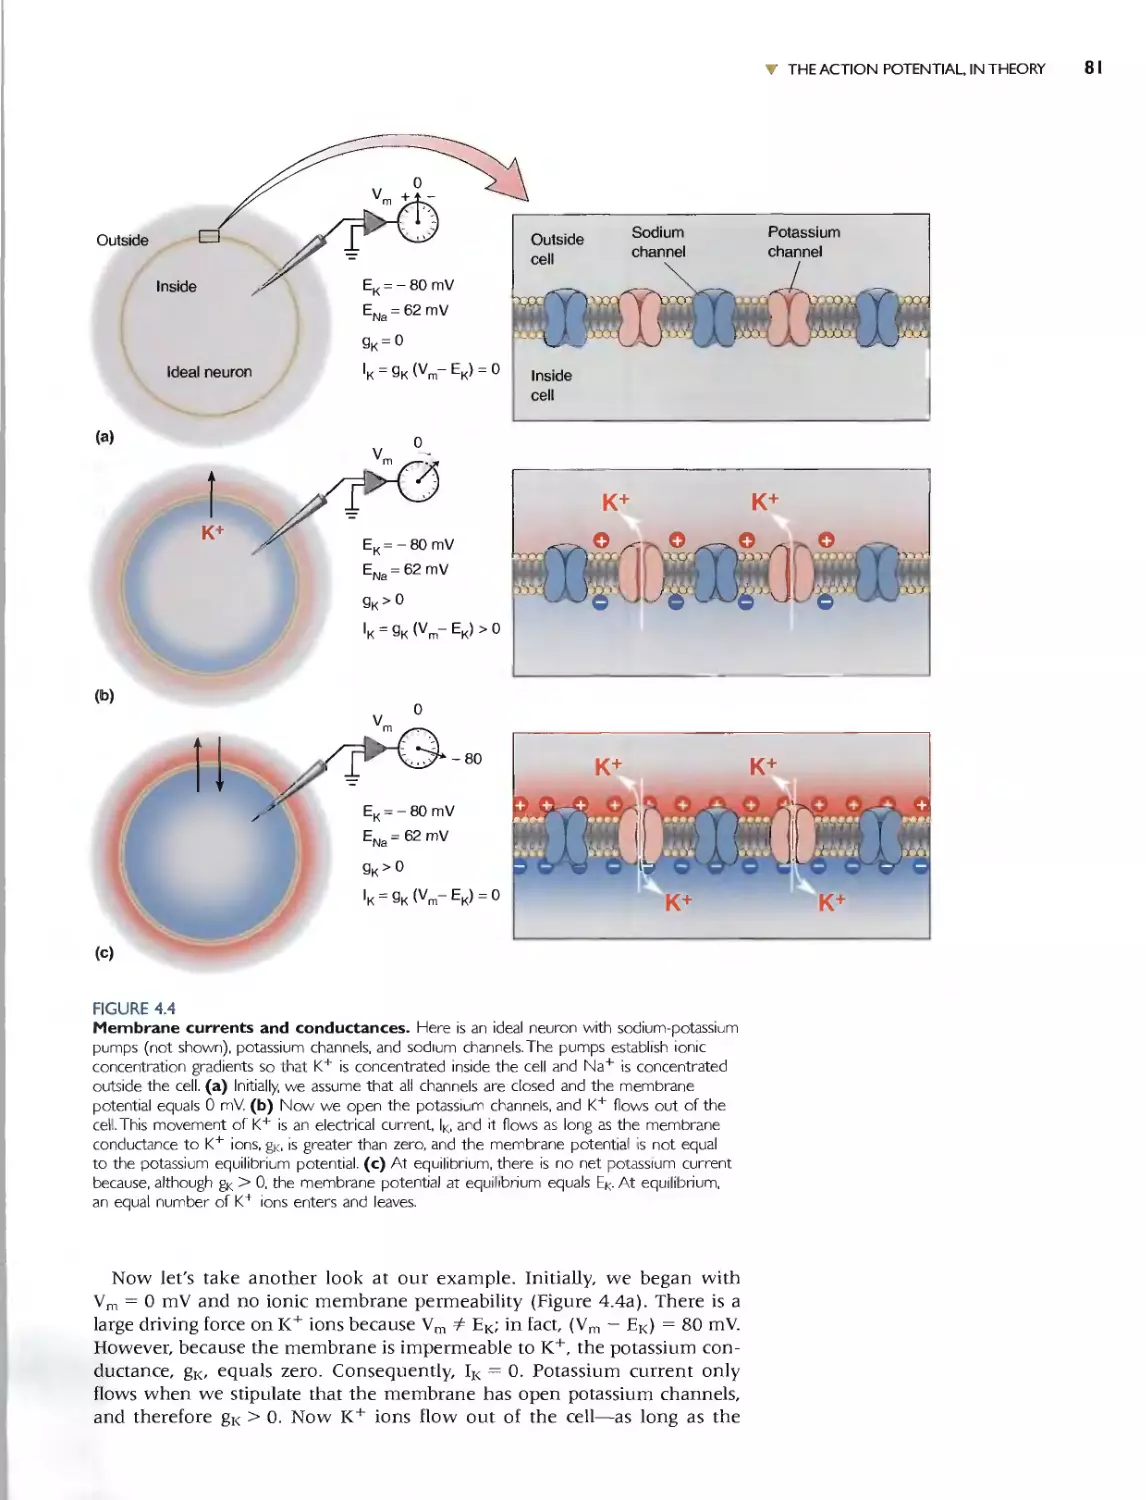
THE ACTION POTENTIAL. IN THEORY 80
I"IEI"IBRANE CURRENTS AND CONDUCTANCES 80
THE INS AND OUTS OF AN ACTION
POTENTIAL 82
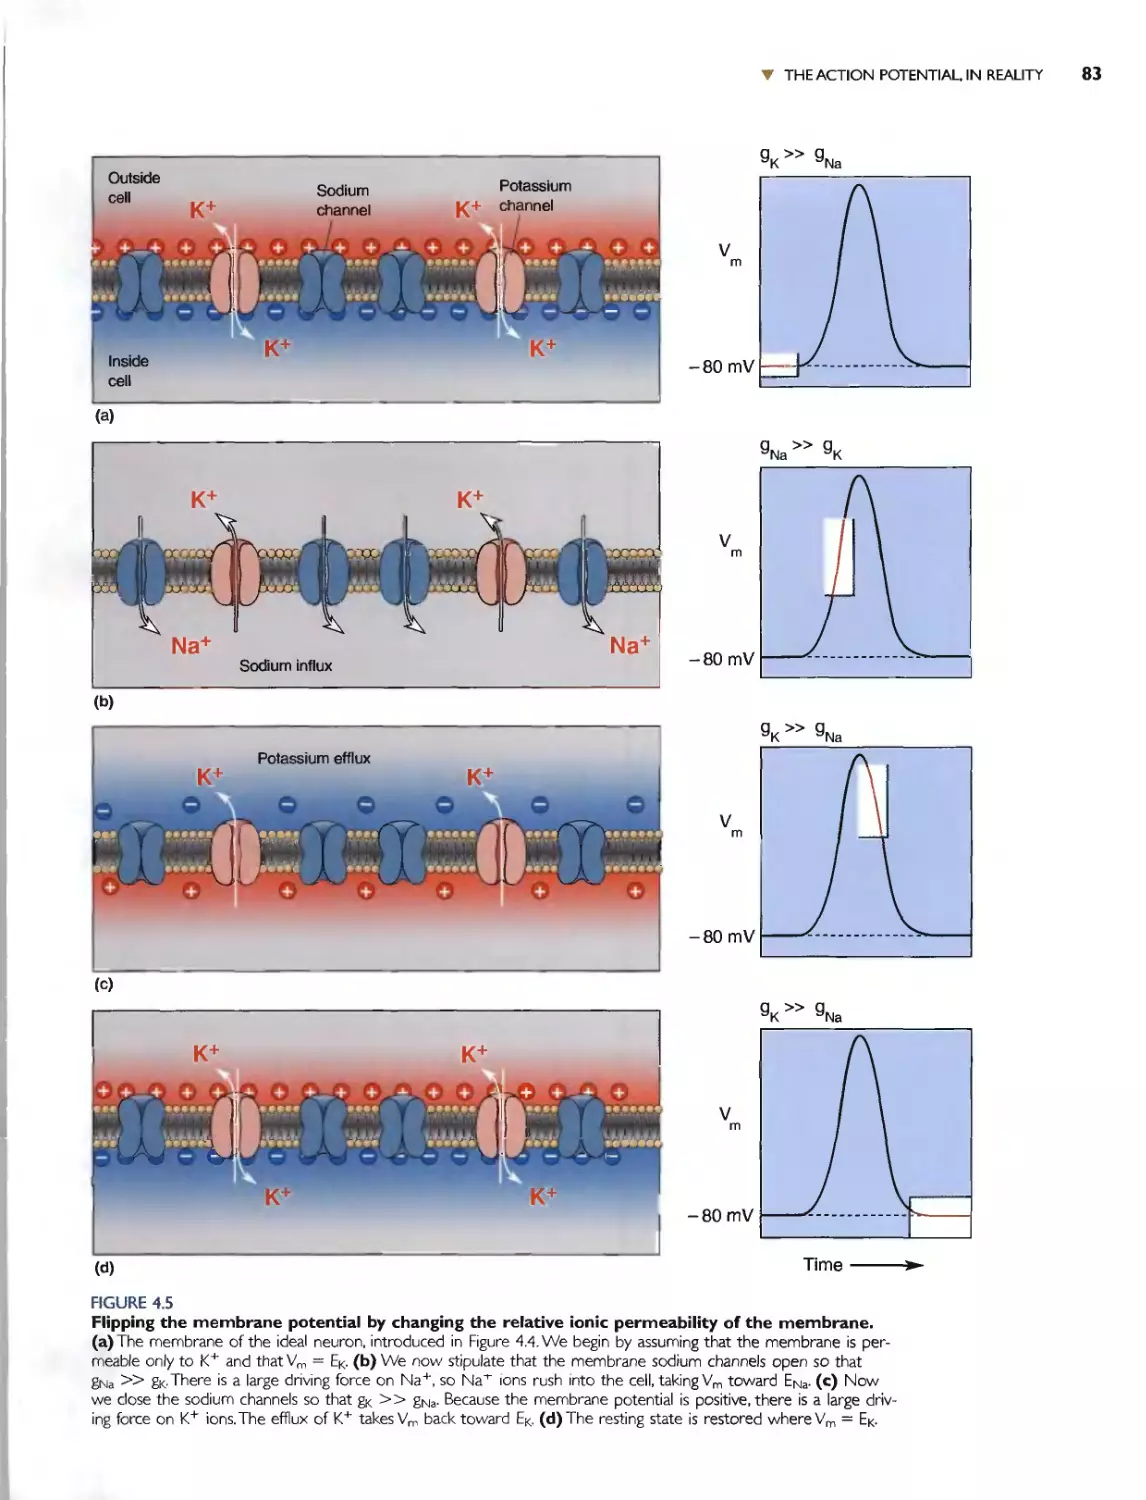
THE ACTION POTENTIAL. IN REALITY 82
THE VOLTAGE-GATED SODIUI"I CHANNEL 84
Sodium Channel Structure 84
Functional Properties of the Sodium Channel 86
. Box 4.2 Brain Food: The Patch-Clamp
Method 88
The Effects of Toxins on the Sodium Channel 89
. Box 4.3 Path of Discover). Tetrodotoxin and the
Dawn of Ion Channel Pharmacology, by Toshio
Narahashi 90
VOLTAGE-GATED POTASSIUI"I CHANNELS 91
PUTTING THE PIECES TOGETHER 91
ACTION POTENTIAL CONDUCTION 93
FACTORS INFLUENCING CONDUCTION
VELOCITY 94
. Box 4.4 Of Special 11lterest: Local Anesthesia 95
MYELIN AND SALTATORY CONDUCTION 96
. Box 4.5 Of Special Interest: Multiple Sclerosis, a
Demyelinating Disease 96
ACTION POTENTIALS,AXONS.AND DENDRITES 97
. Box 4.6 Of Special Interest. The Eclectic Electric
Behavior of Neurons 99
CONCLUDING REMARKS 98
Chapter 5
Synaptic Transmission 101
INTRODUCTION 102
. Box 5.1 Of Special Interest: Otto Loewi and
Vagusstoff 103
TYPES OF SYNAPSES 103
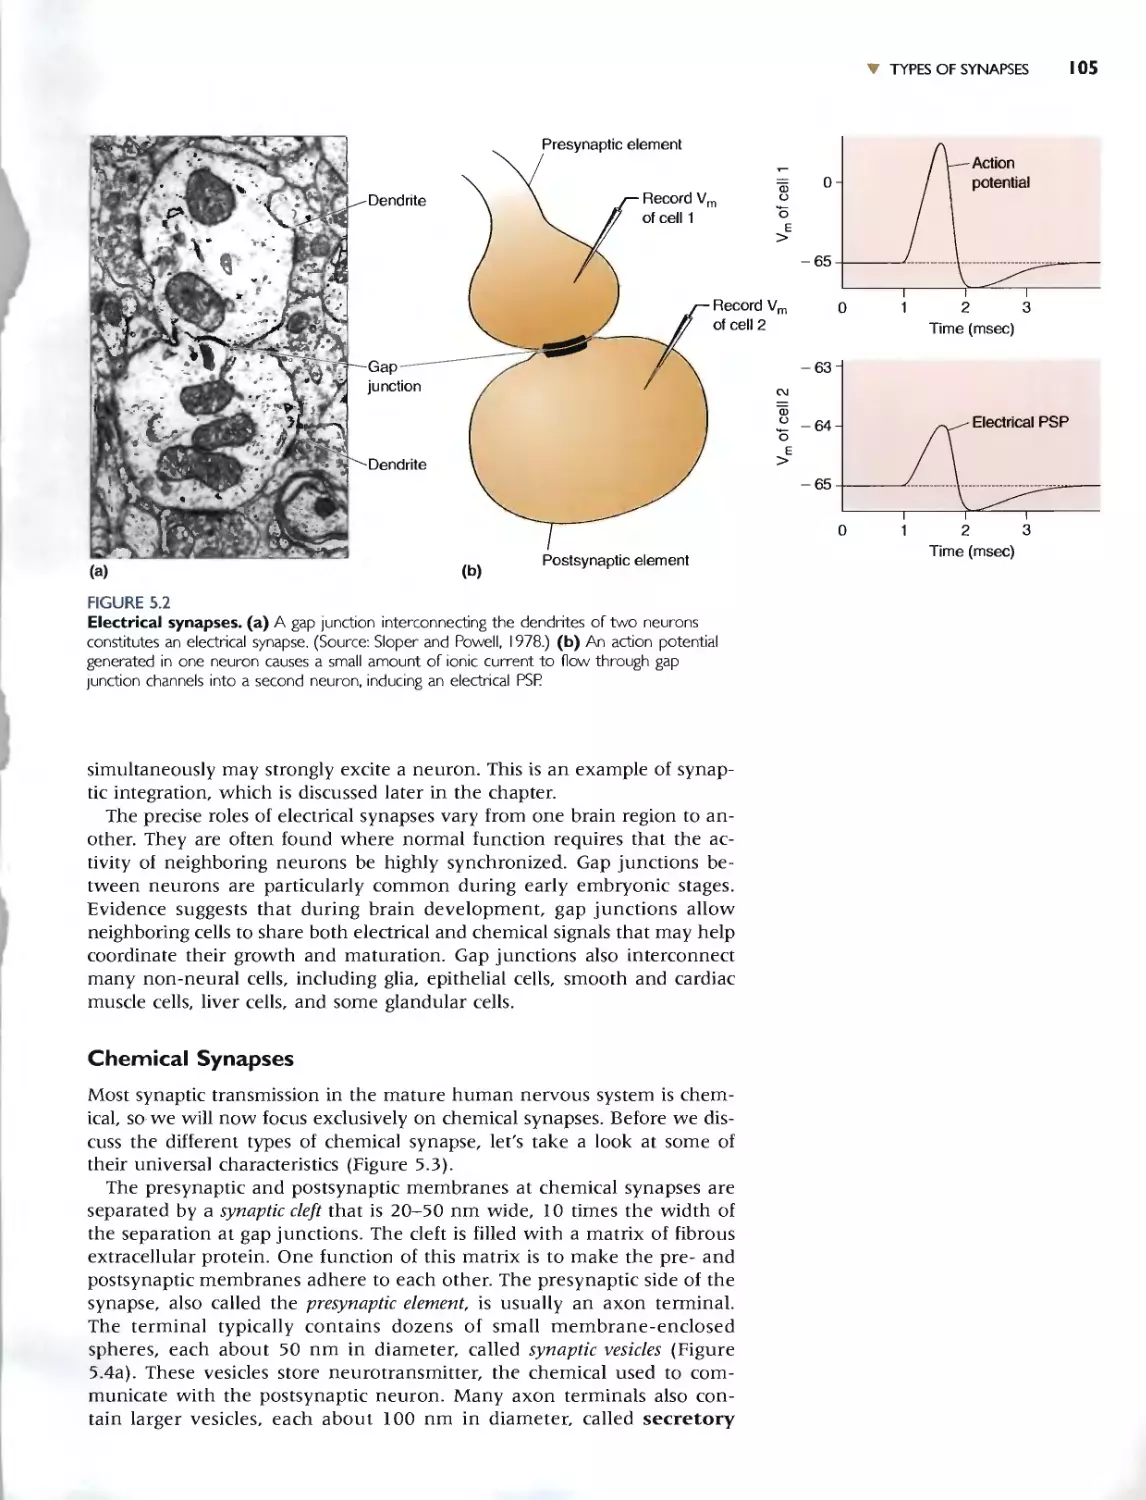
ELECTRICAL SYNAPSES 103
. Box 5.2 Path of Discovery: Electrical Synapses, by
Michael V. L Bennett 108
CHEMICAL SYNAPSES 105
CNS Synopses 106
The Neuromuscular Junction 109
PRINCIPLES OF CHEMICAL SYNAPTIC
TRANSMISSION III
NEUROTRANSMITTERS III
NEUROTRANSMITTER SYNTHESIS AND
STORAGE \12
NEUROTRANSMITTER RELEASE 113
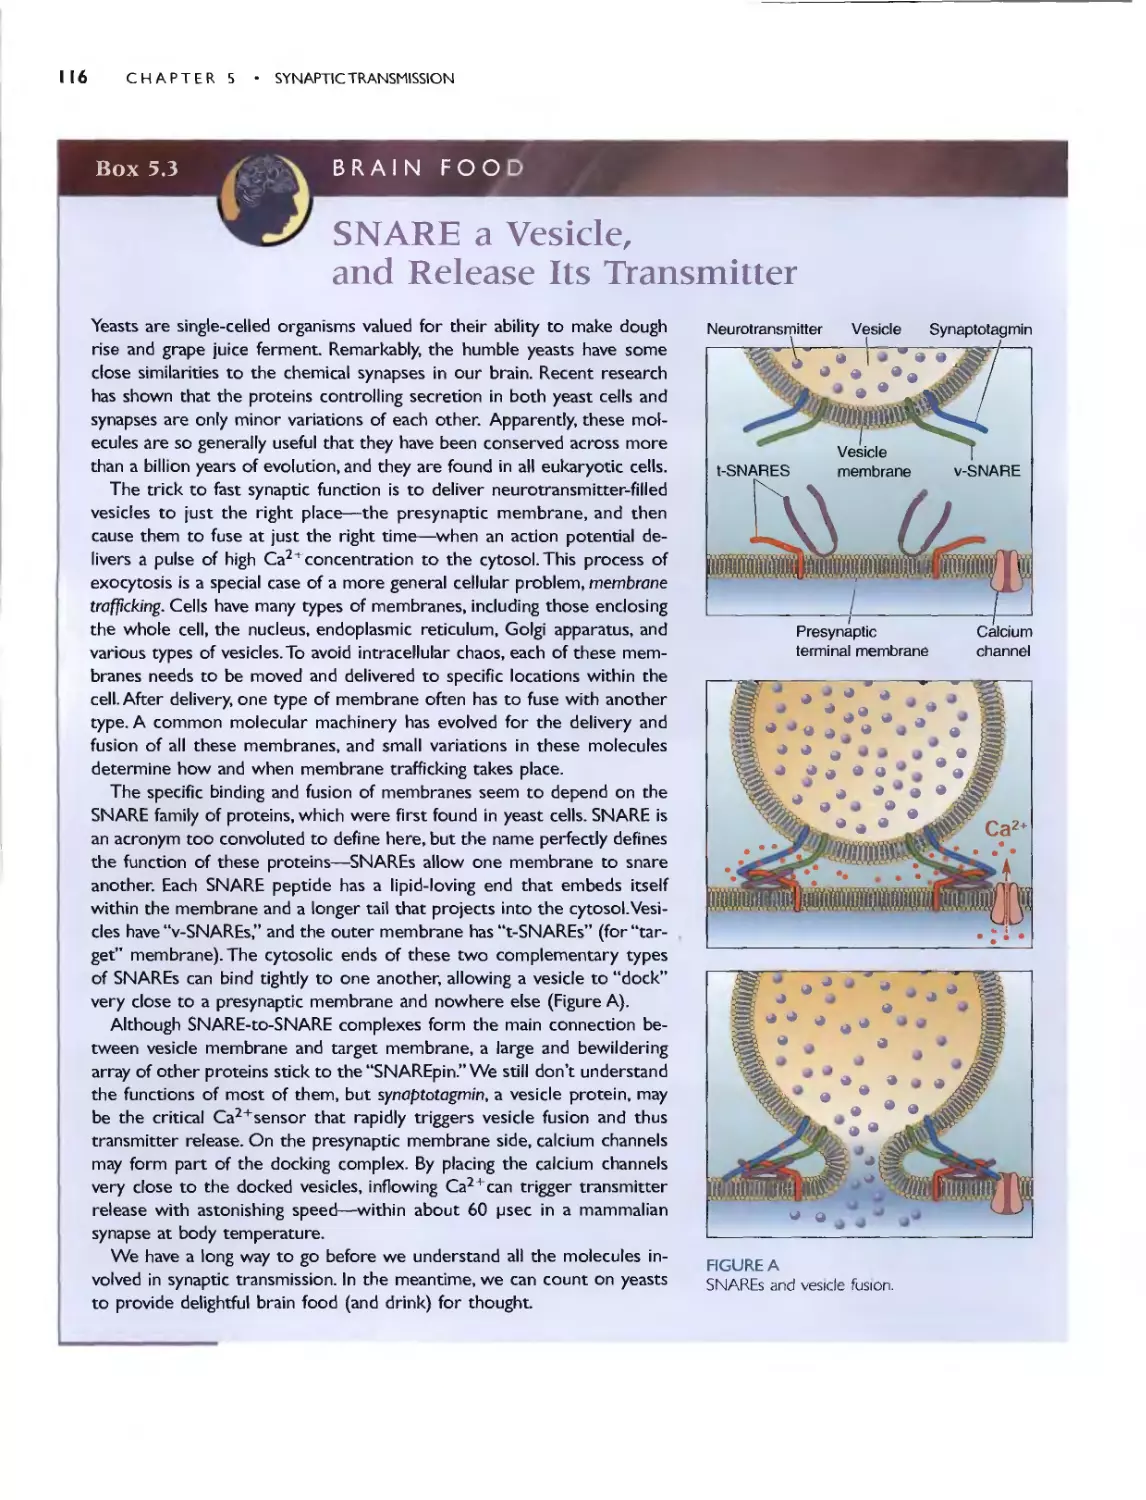
. Box 5.3 Brain Food: SNARE a Vesicle, and
Release Its 1ransmitter 116
NEUROTRANSMITTER RECEPTORS AND
EFFECTORS 115
Transmitter-Gated Ion Channels I 15
. Box 5.4 Brain Food.- Reversal Potentials 120
G-Protein-Coupled Receptors I I 8
Autoreceptors I I 9
NEUROTRANSMITTER RECOVERY AND
DEGRADATION 119
NEUROPHARMACOLOGY 121
. Box 5.5 Of Speciallnterest: Bacteria, Spiders,
Snakes, and You 121
PRINCIPLES OF SYNAPTIC INTEGRATION 122
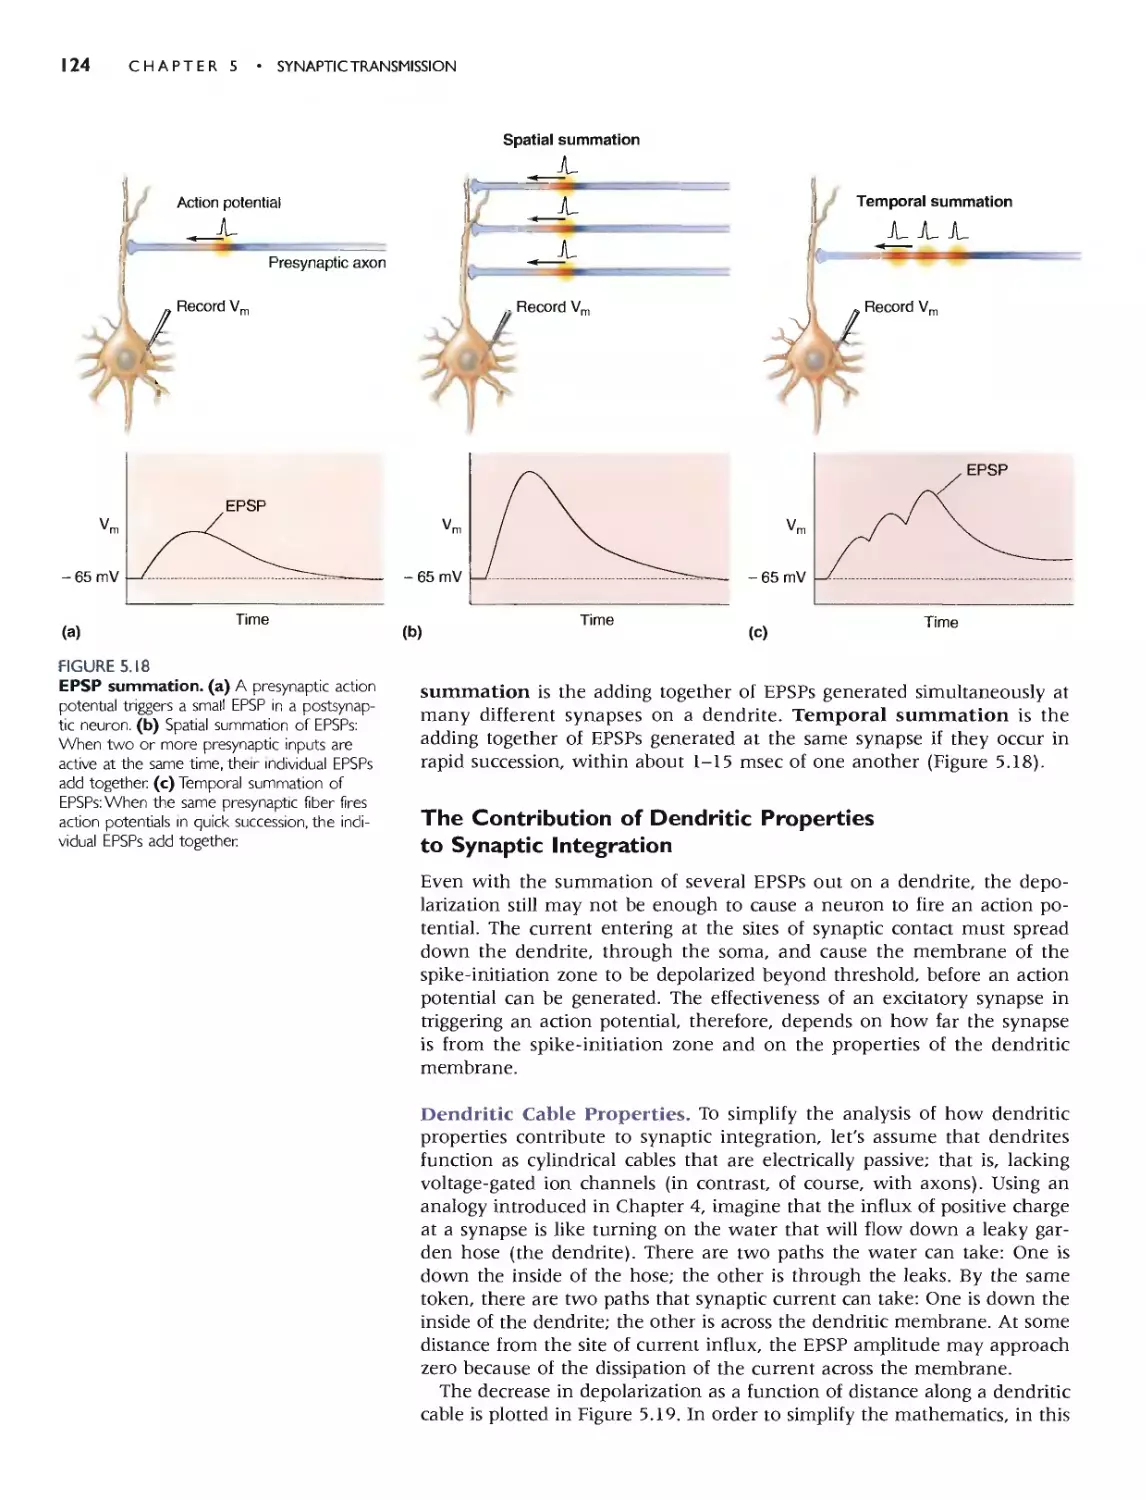
THE INTEGRATION OF EPSPs 122
Quantal Analysis of EPSPs 122
EPSP Summation 123
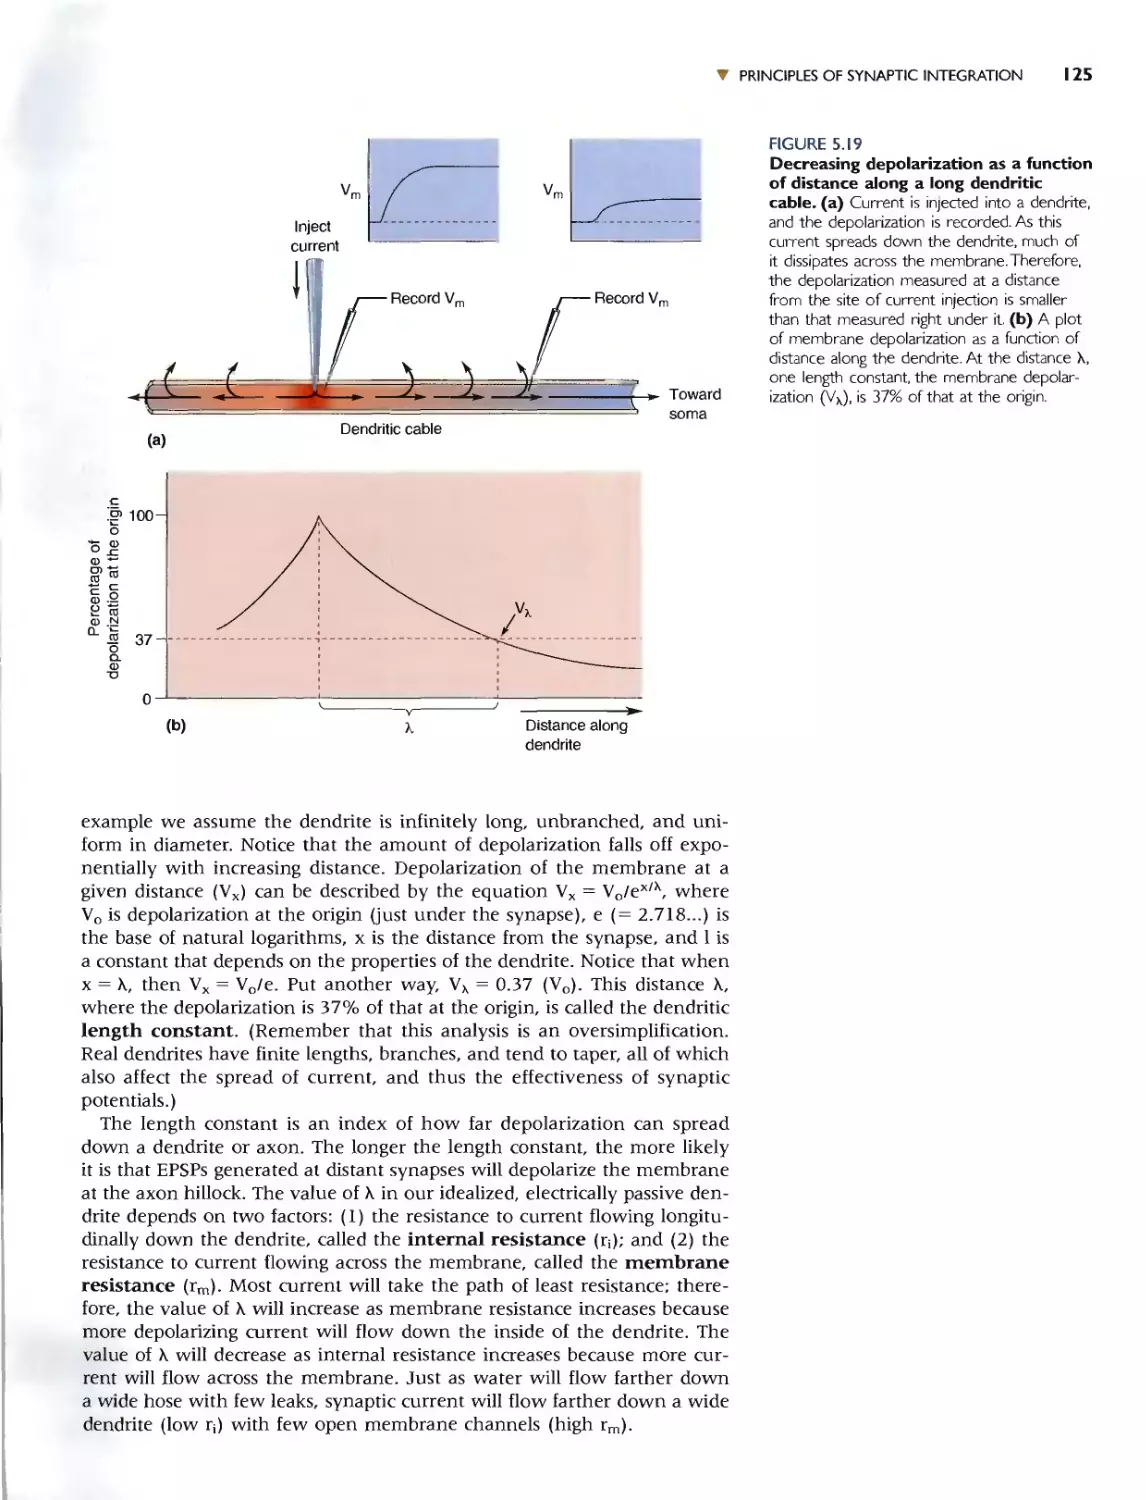
THE CONTRIBUTION OF DENDRITIC PROPERTIES TO
SYNAPTIC INTEGRATION 124
Dendritic Coble Properties 124
Excitable Dendrites 126
INHIBITION 126
. Box 5.6 Of Special Interest: Startling Mutations
and Poisons 127
IPSPs and Shunting Inhibition 126
'Y EXPANDED CONTENTS xxv
The Geometry of Excitatory and Inhibitory Synopses 128
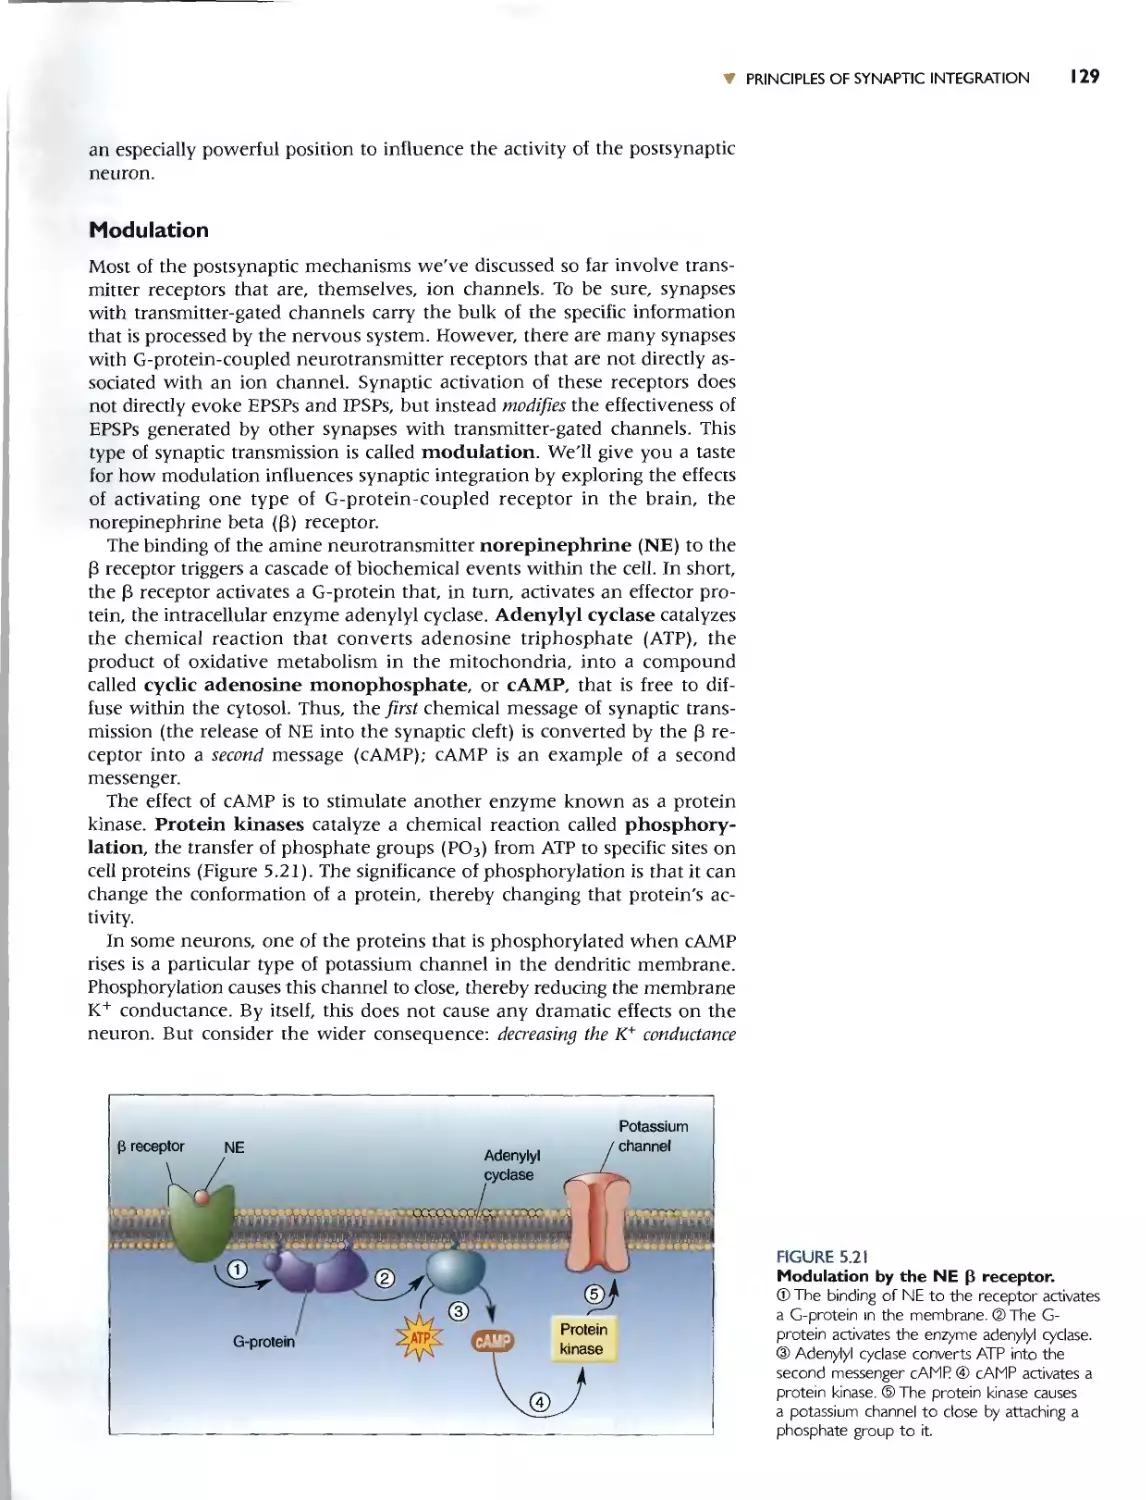
MODULATION 129
CONCLUDING REMARKS 130
Chap ter 6
Neurotransmitter Systems 133
INTRODUCTION 134
STUDYING NEUROTRANSMITTER SYSTEMS 135
LOCALIZATION OF TRANSMITTERS AND
TRANSMITTER-SYNTHESIZING ENZYMES 135
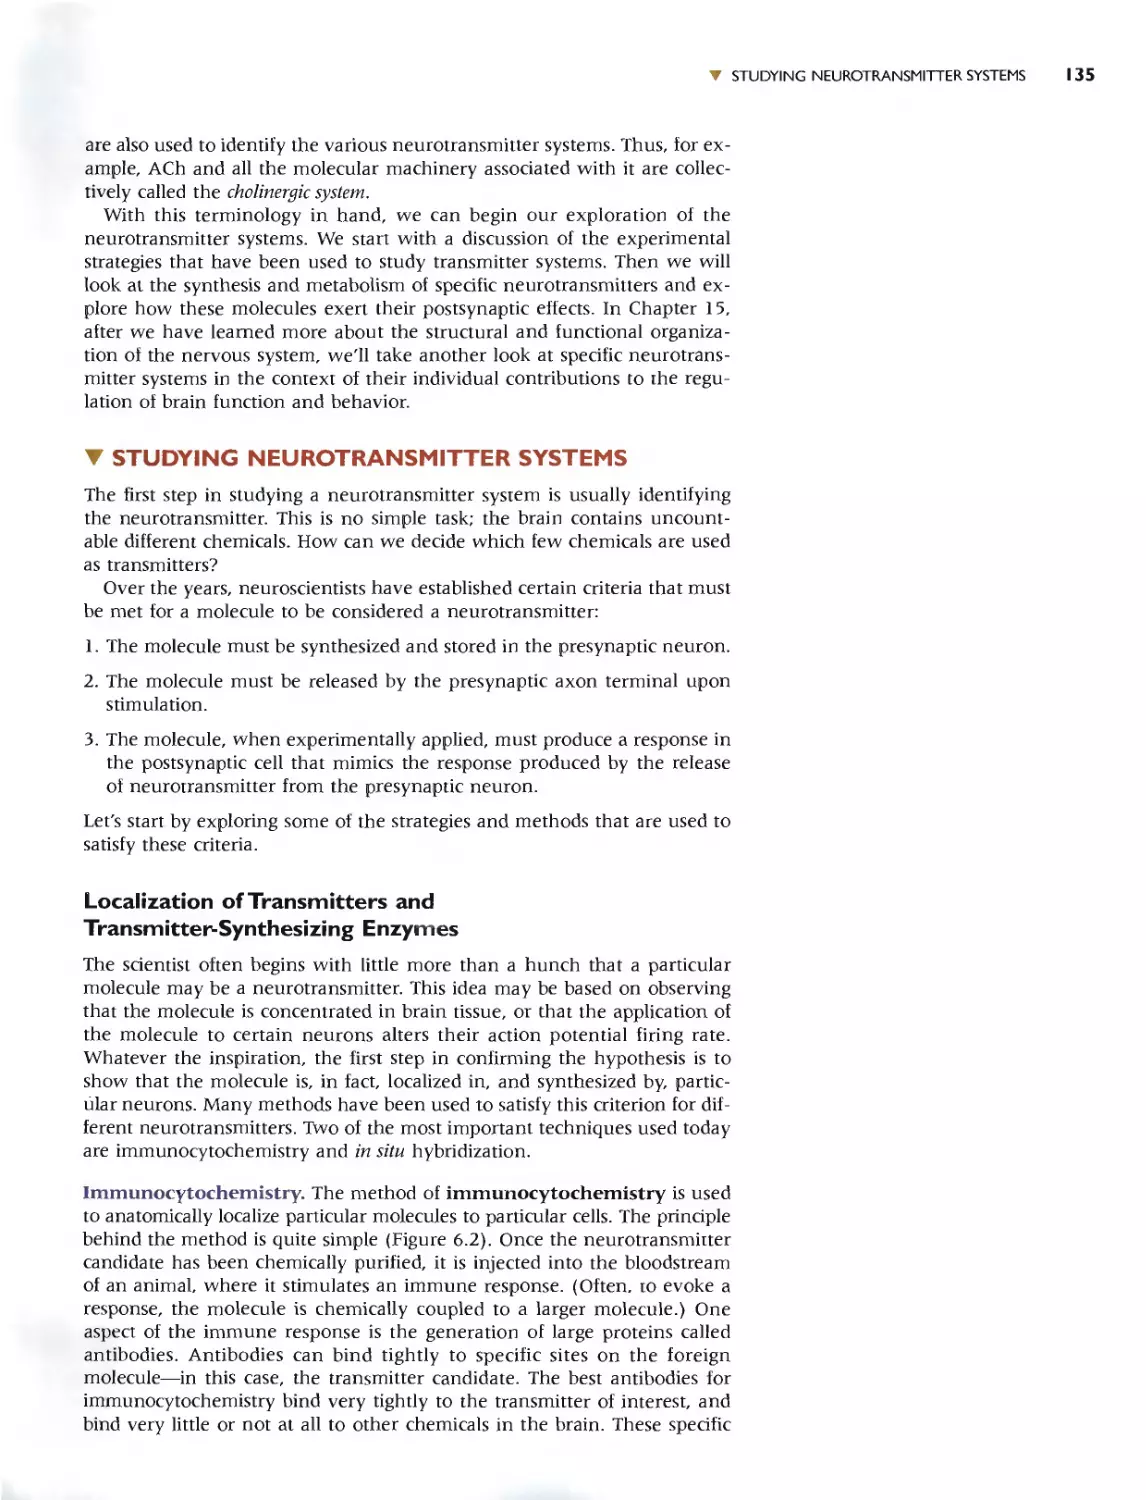
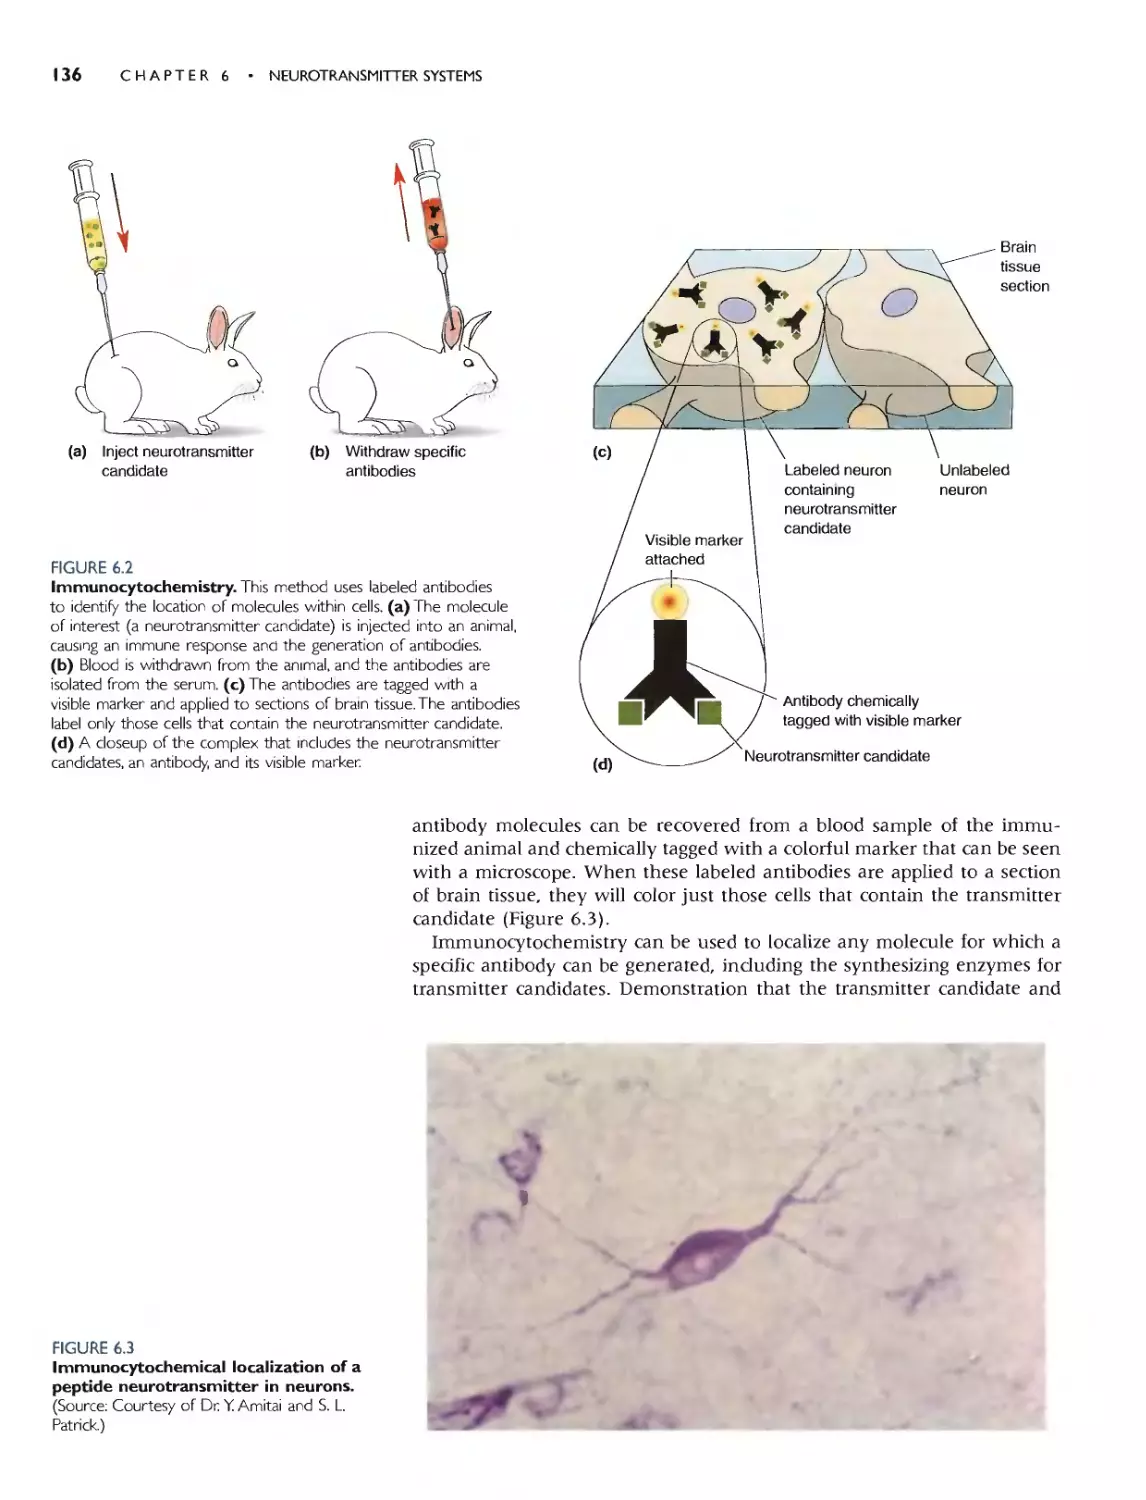
Immunocytochemistry 135
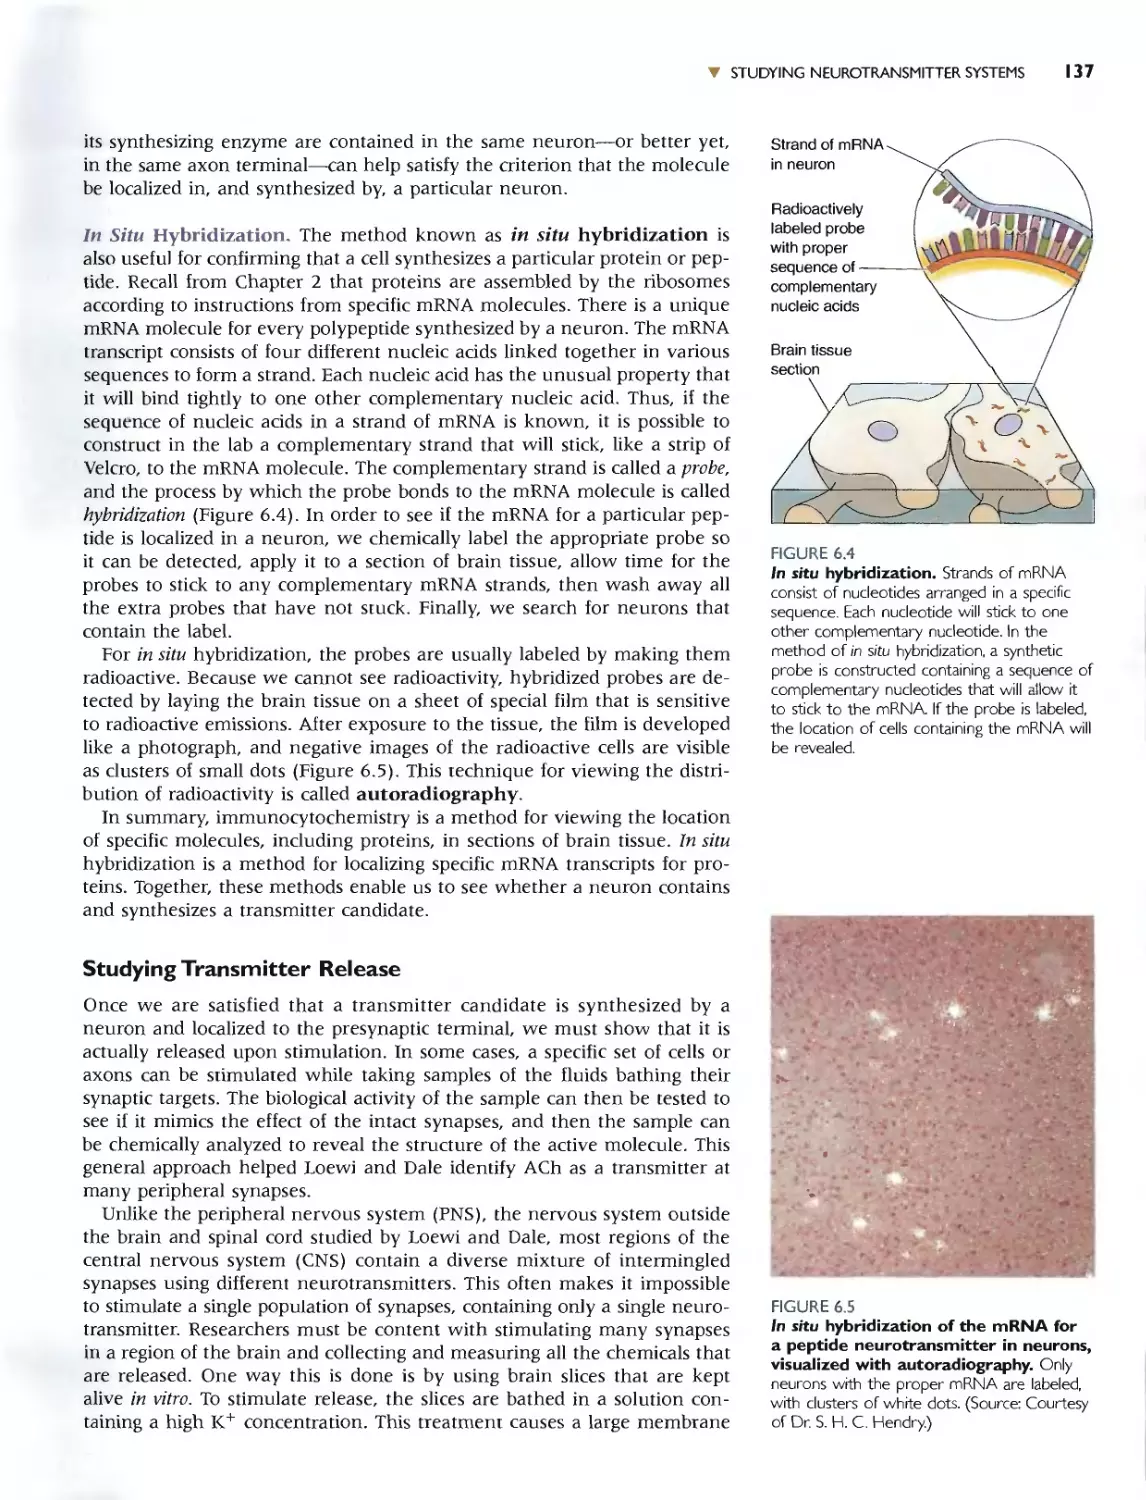
In Situ Hybridization 137
STUDYING TRANSMITTER RELEASE 137
STUDYING SYNAPTIC MIMICRY 138
STUDYING RECEPTORS 138
Neuropharmacological Analysis 138
Ligand-Binding Methods 139
Molecular Analysis 141
NEUROTRANSMITTER CHEMISTRY 141
CHOLINERGIC NEURONS 142
. Box 6.1 Brain Food: Pumping Ions and
1ransmitters 144
CATECHOLAMINERGIC NEURONS 143
SEROTONERGIC NEURONS 146
AMINO ACIDERGIC NEURONS 146
OTHER NEUROTRANSMITTER CANDIDATES AND
INTERCELLULAR MESSENGERS 147
. Box 6.2 Of Special Interest: This Is Your Brain on
Endocannabinoids 149
. Box 6.3 Path of Discovery: Deciphering
the Language of Neurons,
by Roger A. NicoH 150
TRANSMITTER-GATED CHANNELS 152
THE BASIC STRUCTURE OF TRANSMITTER-GATED
CHANNELS 152
AMINO ACID-GATED CHANNELS 154
Glutamate-Gated Channels 156
. Box 6.4 Of Special Interest: The Brain's Exciting
Poisons 156
GABA-Gated and Glycine-Gated Channels 156
G-PROTEIN-COUPLED RECEPTORS AND
EFFECTORS 157
THE BASIC STRUCTURE OF G-PROTEIN-COUPLED
RECEPTORS 157
THE UBIQUITOUS G-PROTEINS 158
G-PROTEIN-COUPLED EFFECTOR SYSTEMS 160
The Shortcut Pathway 160
xxvi EXPANDED CONTENTS
Second Messenger Cascades 161
Phosphorylation and Dephosphorylation 162
The Function of Signal Cascades I 63
DIVERGENCE AND CONVERGENCE iN
NEUROTRANSMITTER SYSTEMS 164
CONCLUDING REMARKS 164
Chapter 7
The Structme of the Nervous
System 167
INTRODUCTION 168
GROSS ORGANIZATION OFTHE MAMMALIAN
NERVOUS SYSTEM 168
ANATOMICAL REFERENCES 168
THE CENTRAL NERVOUS SYSTEM 171
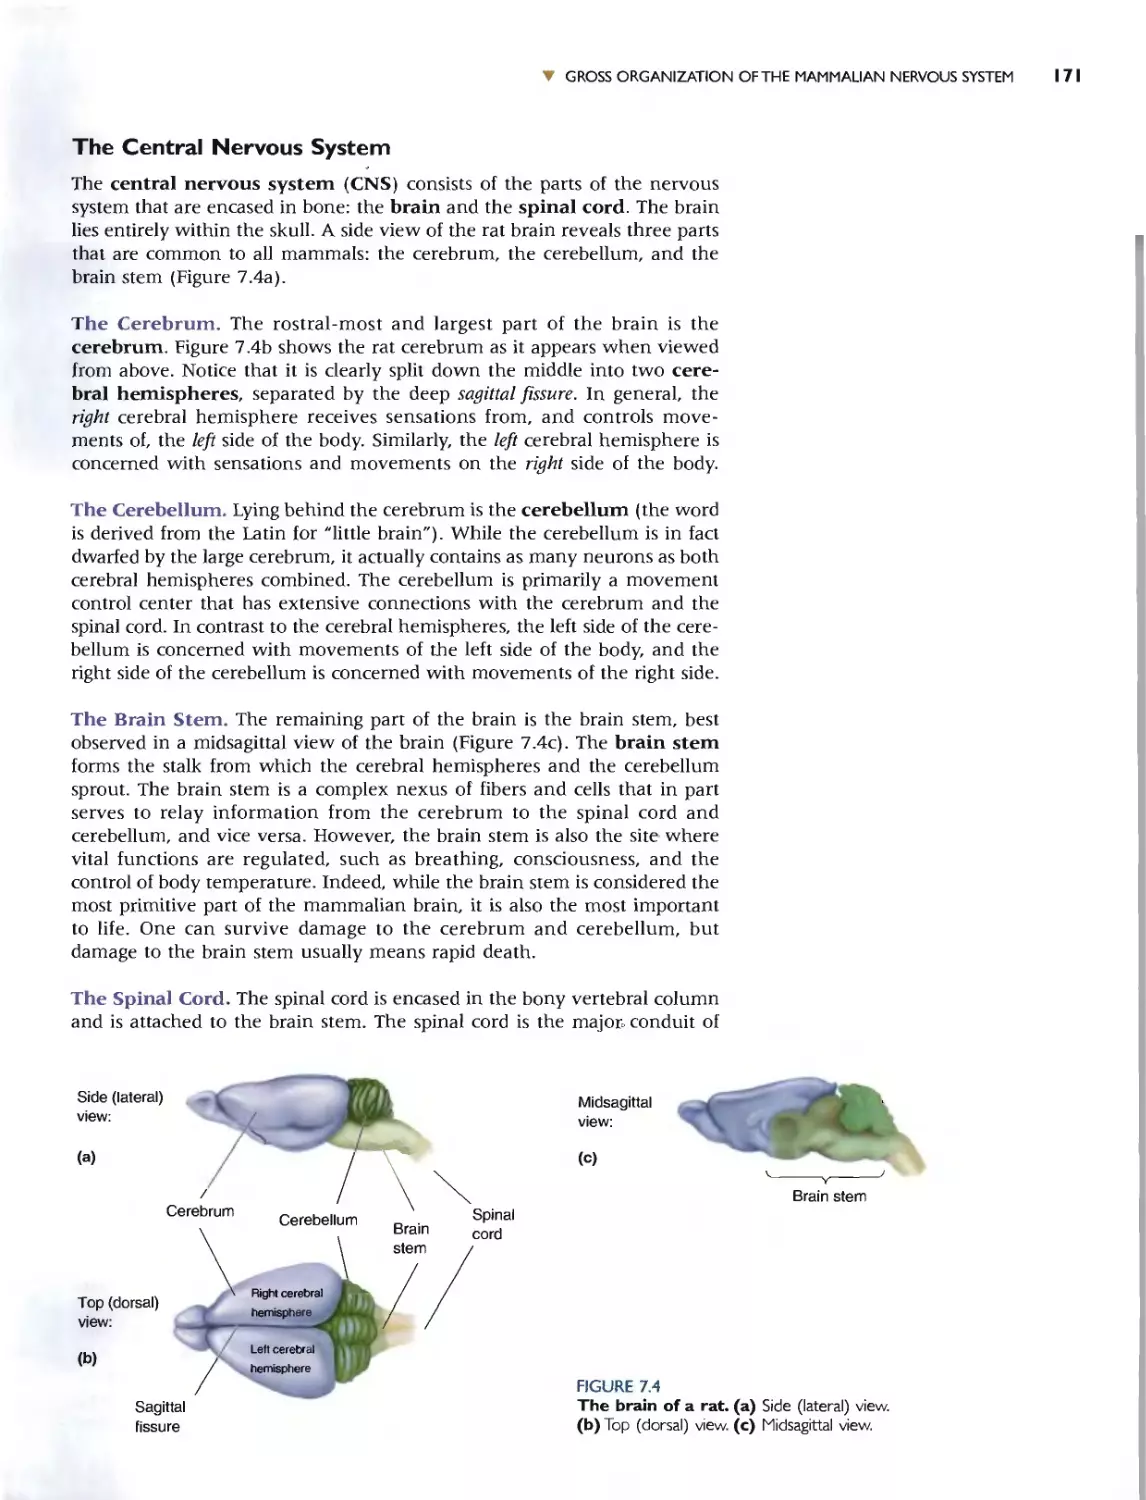
The Cerebrum 171
The Cerebellum 171
The Brain Stem 171
The Spinal Cord 171
THE PERIPHERAL NERVOUS SYSTEM 172
The Somatic PNS 172
The Visceral PNS 173
Afferent and Efferent Axons I 73
THE CRANIAL NERVES 173
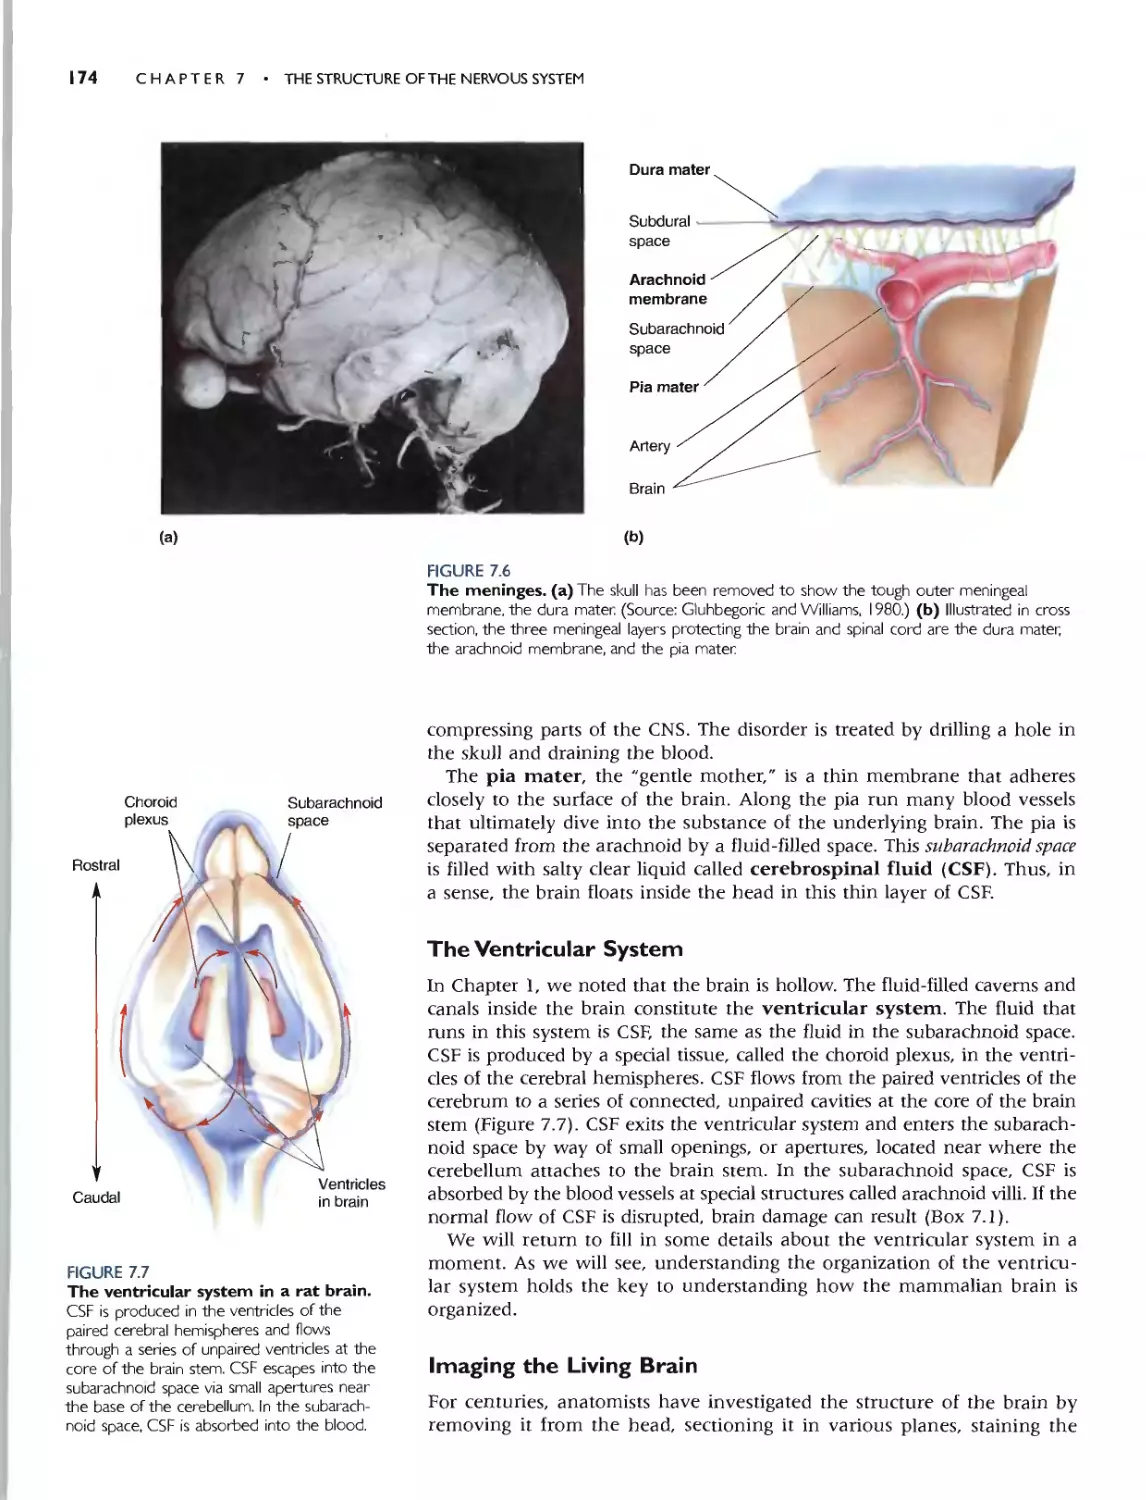
THE MENINGES 173
THE VENTRICULAR SYSTEM 174
. Box 7.1 Of Special Tmerest: Water on the
Brain 175
IMAGING THE LIVING BRAIN 174
Computed Tomography 175
Magnetic Resonance Imaging 176
. Box 7.2 Brain Food: Magnetic Resonance
Imaging 177
Functional Brain Imaging 176
. Box 7.3 Brain Food: Functional Imaging of Brain
Activity: PET and fMRI 178
UNDERSTANDING CNS STRUCTURE THROUGH
DEVELOPMENT 178
FORMATION OF THE NEURAL TUBE 180
. Box 7.4 OJ Special Tnterest: Nutrition and the
Neural Tube 182
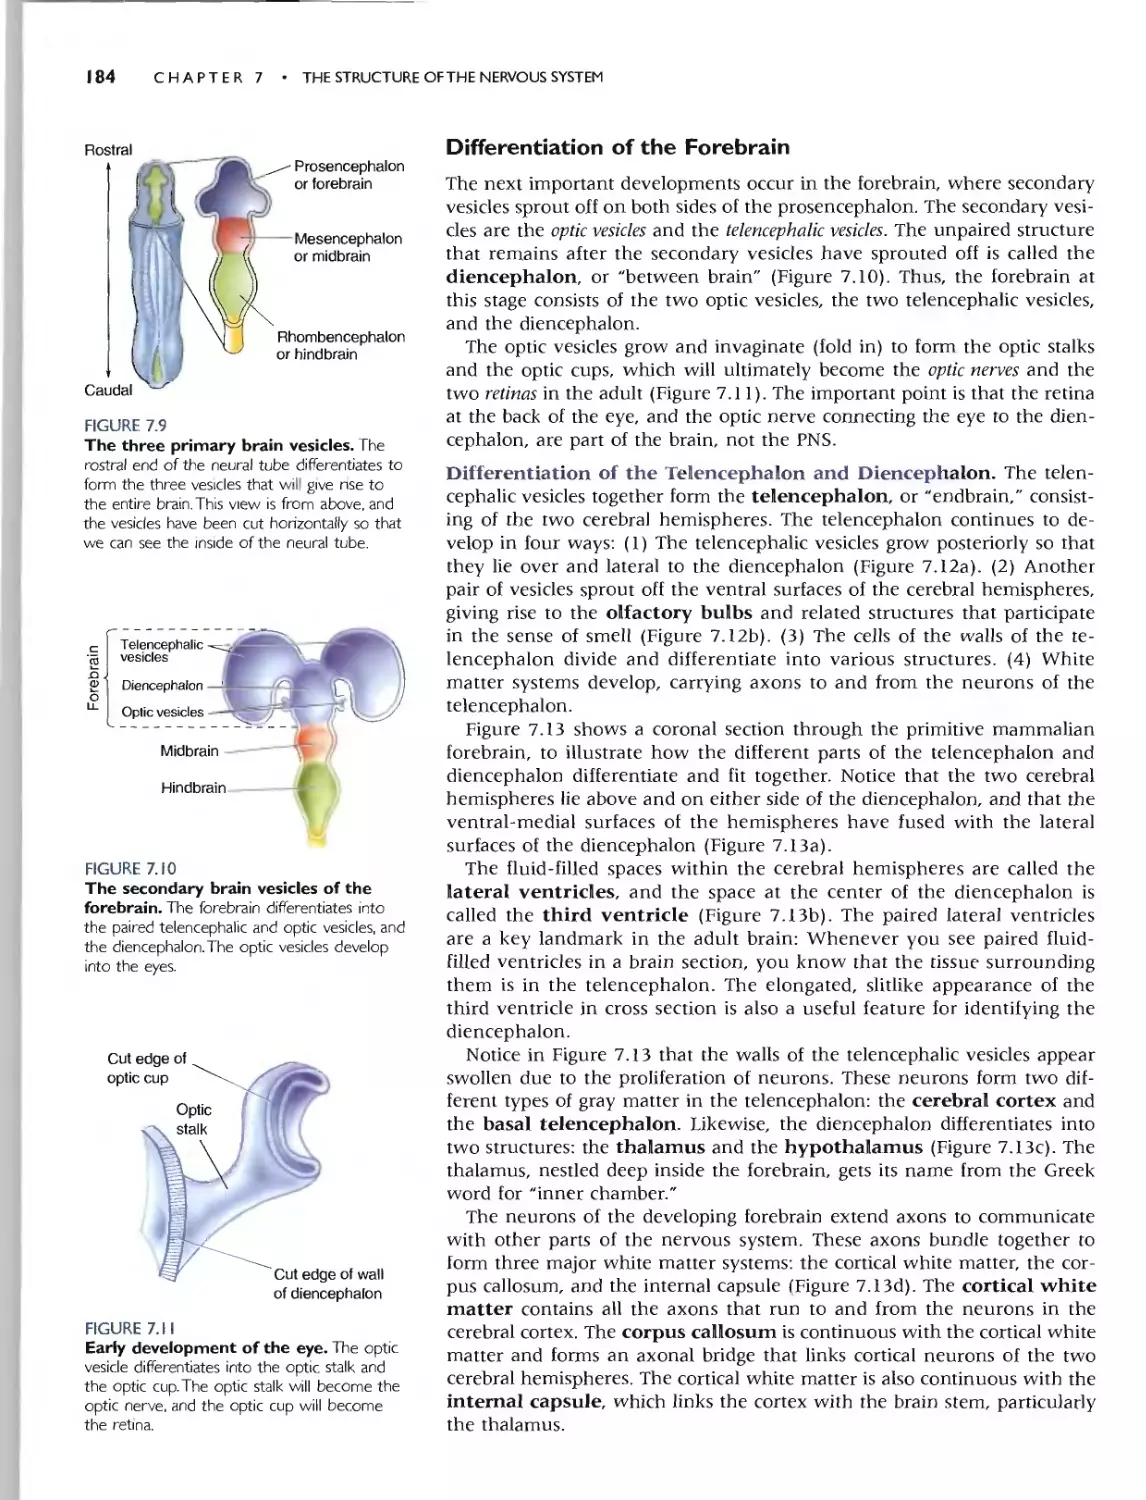
THREE PRIMARY BRAIN VESICLES 182
DIFFERENTIATION OFTHE FOREBRAIN 184
Differentiotion of the Telencephalon and Diencephalon 184
Forebrain Structure-Function Relationships 185
DIFFERENTIATION OFTHE MIDBRAIN 187
Midbrain Structure-Function Relationships 187
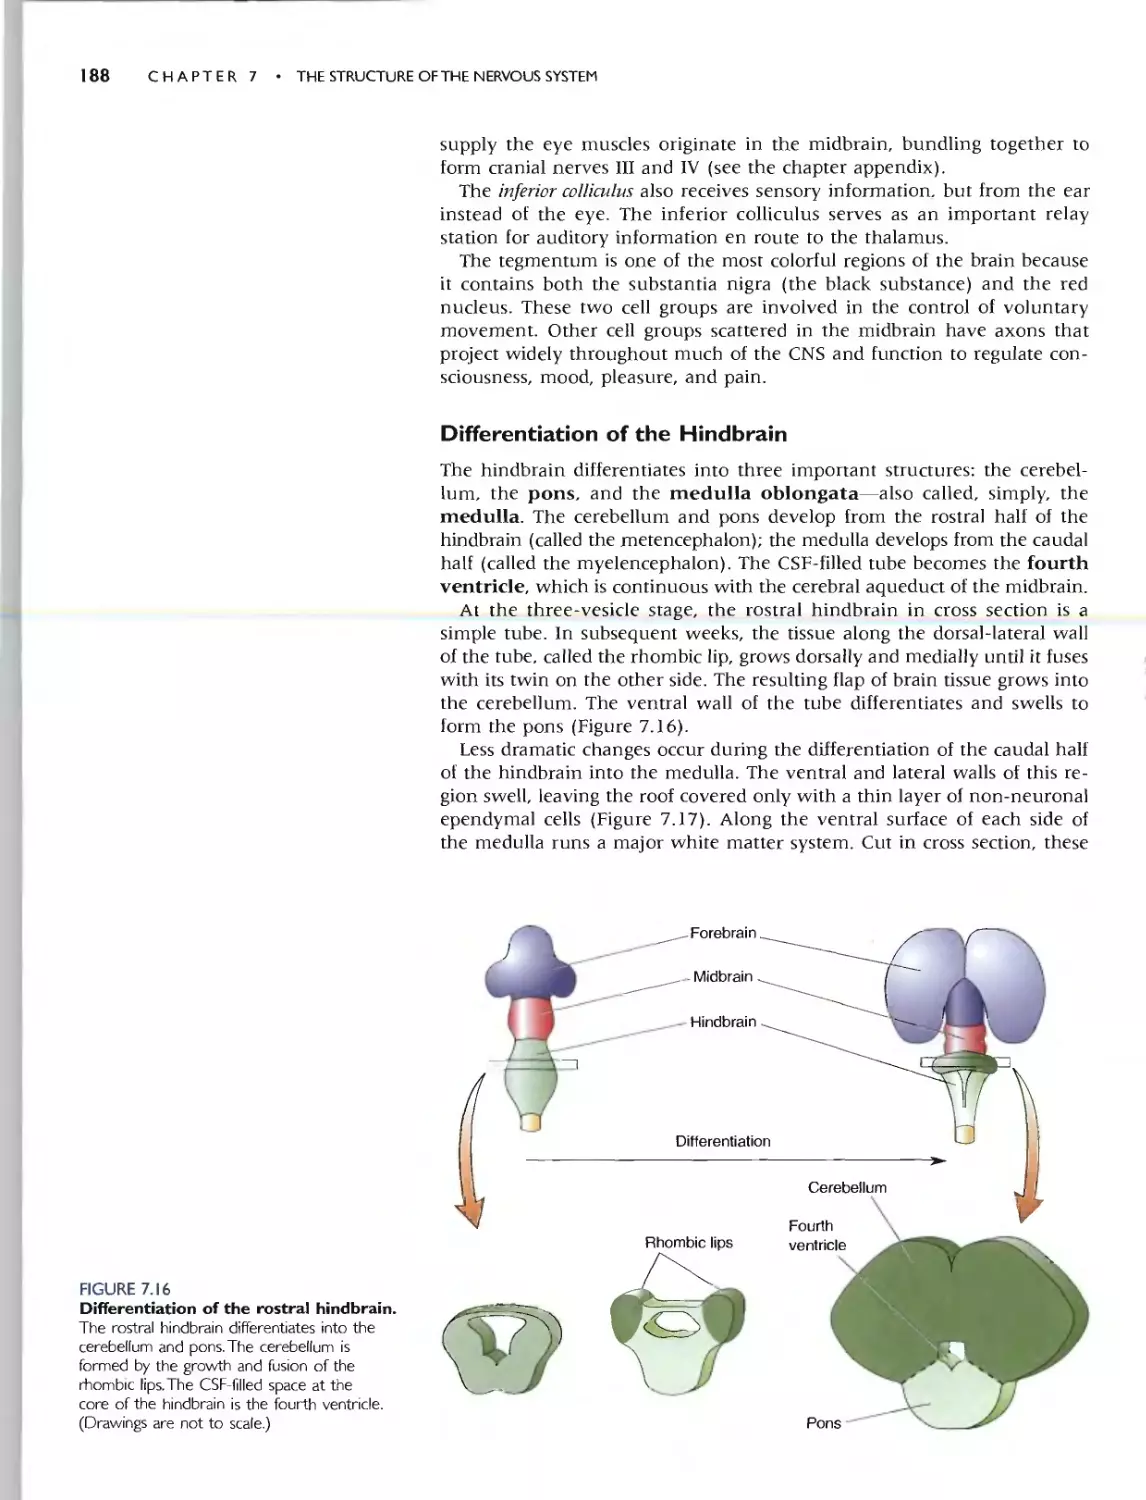
DIFFERENTIATION OF THE HINDBRAIN 188
Hindbrain Structure-Function Relationships 189
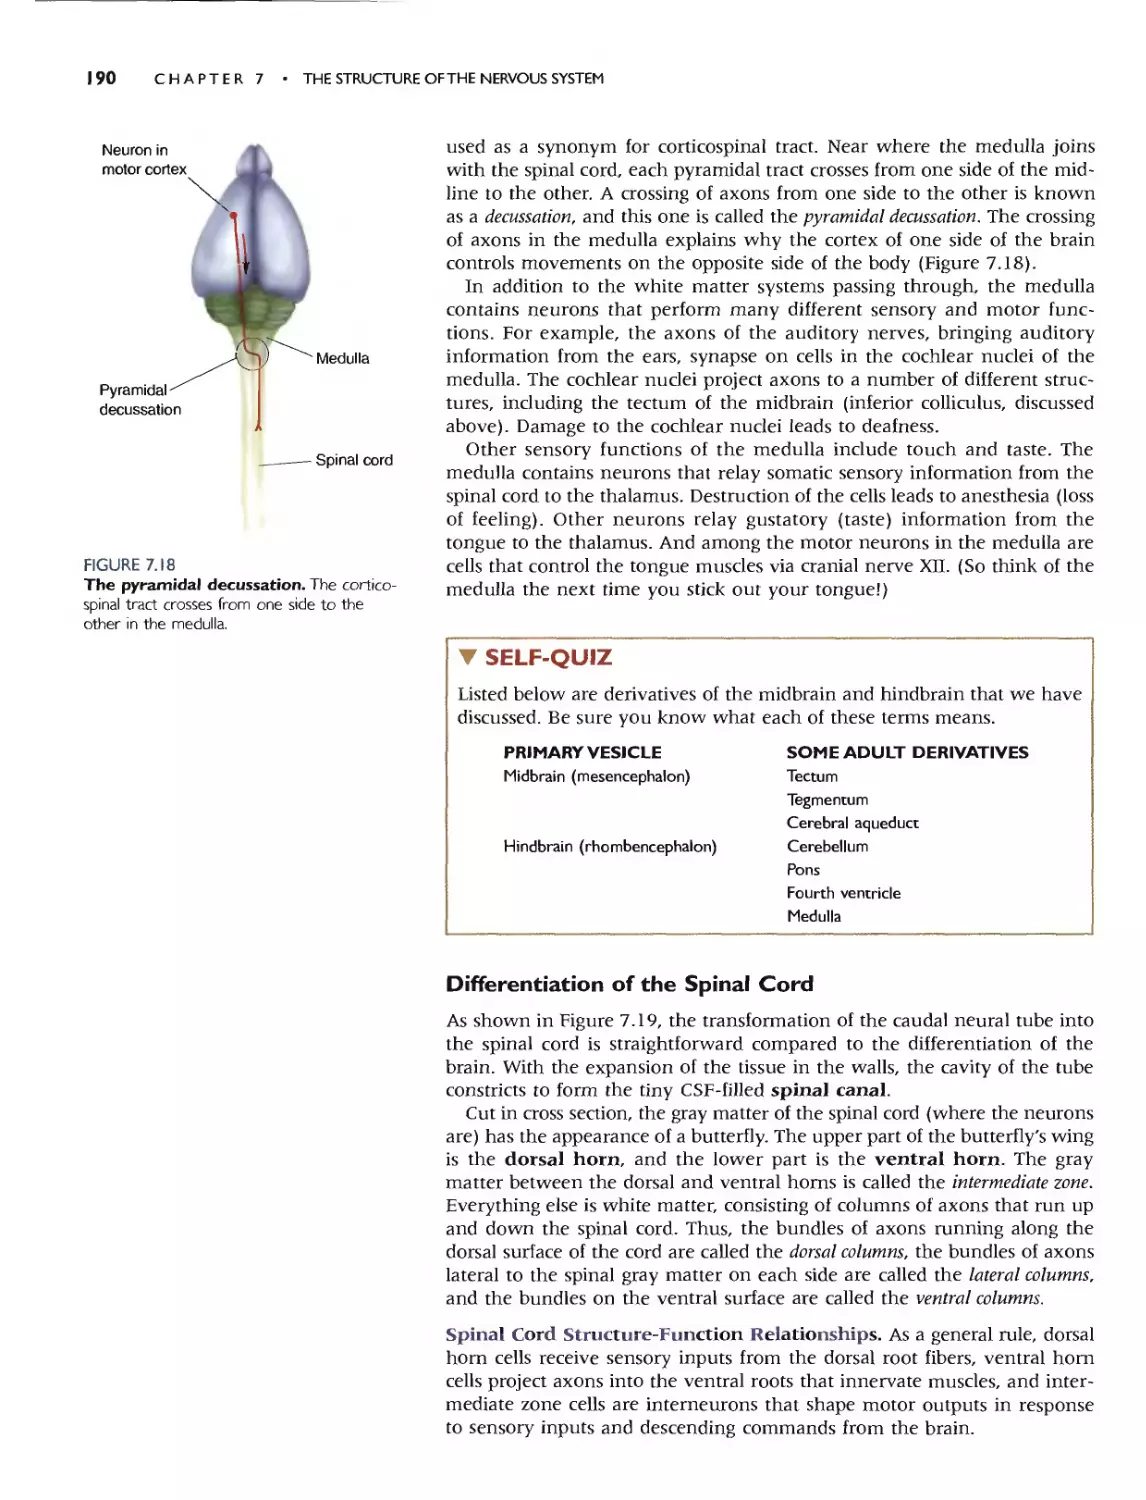
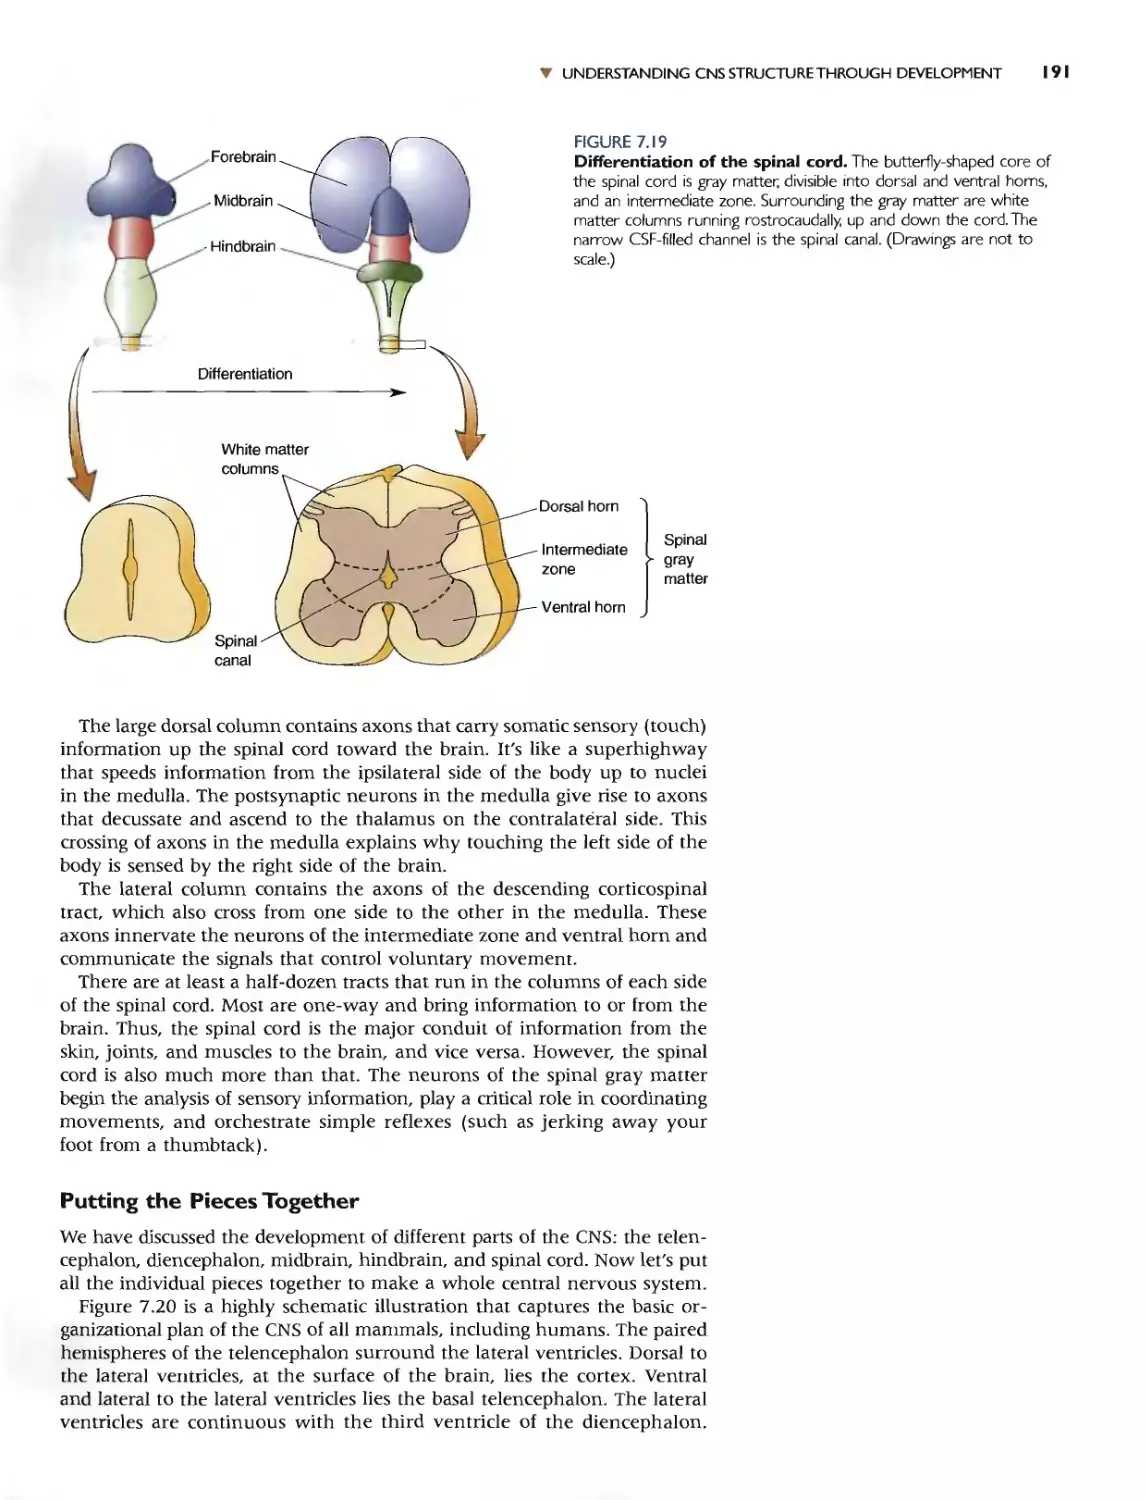
DIFFERENTIATION OF THE SPINAL CORD 190
Spinal Cord Structure-Function Relationships 190
PUTTING THE PIECES TOGETHER 191
SPECIAL FEATURES OF THE HUMAN CNS 192
A GUIDE TO THE CEREBRAL CORTEX 195
TYPES OF CEREBRAL CORTEX 195
AREAS OF NEOCORTEX 197
Neocortical Evolution and Structure-Function
Relationships 198
. Box 7.5 Path of Discovery: Evolution of My
Brain, by Leah A. Krubitzer 200
CONCLUDING REMARKS 199
APPENDIX:AN ILLUSTRATED GUIDETO HUMAN
NEUROANATOMY 205
Part II Sensory and Motor
Systems 249
Chapter 8
The Chemical Senses 251
INTRODUCTION 252
TASTE 252
THE BASIC TASTES 253
THE ORGANS OF TASTE 253
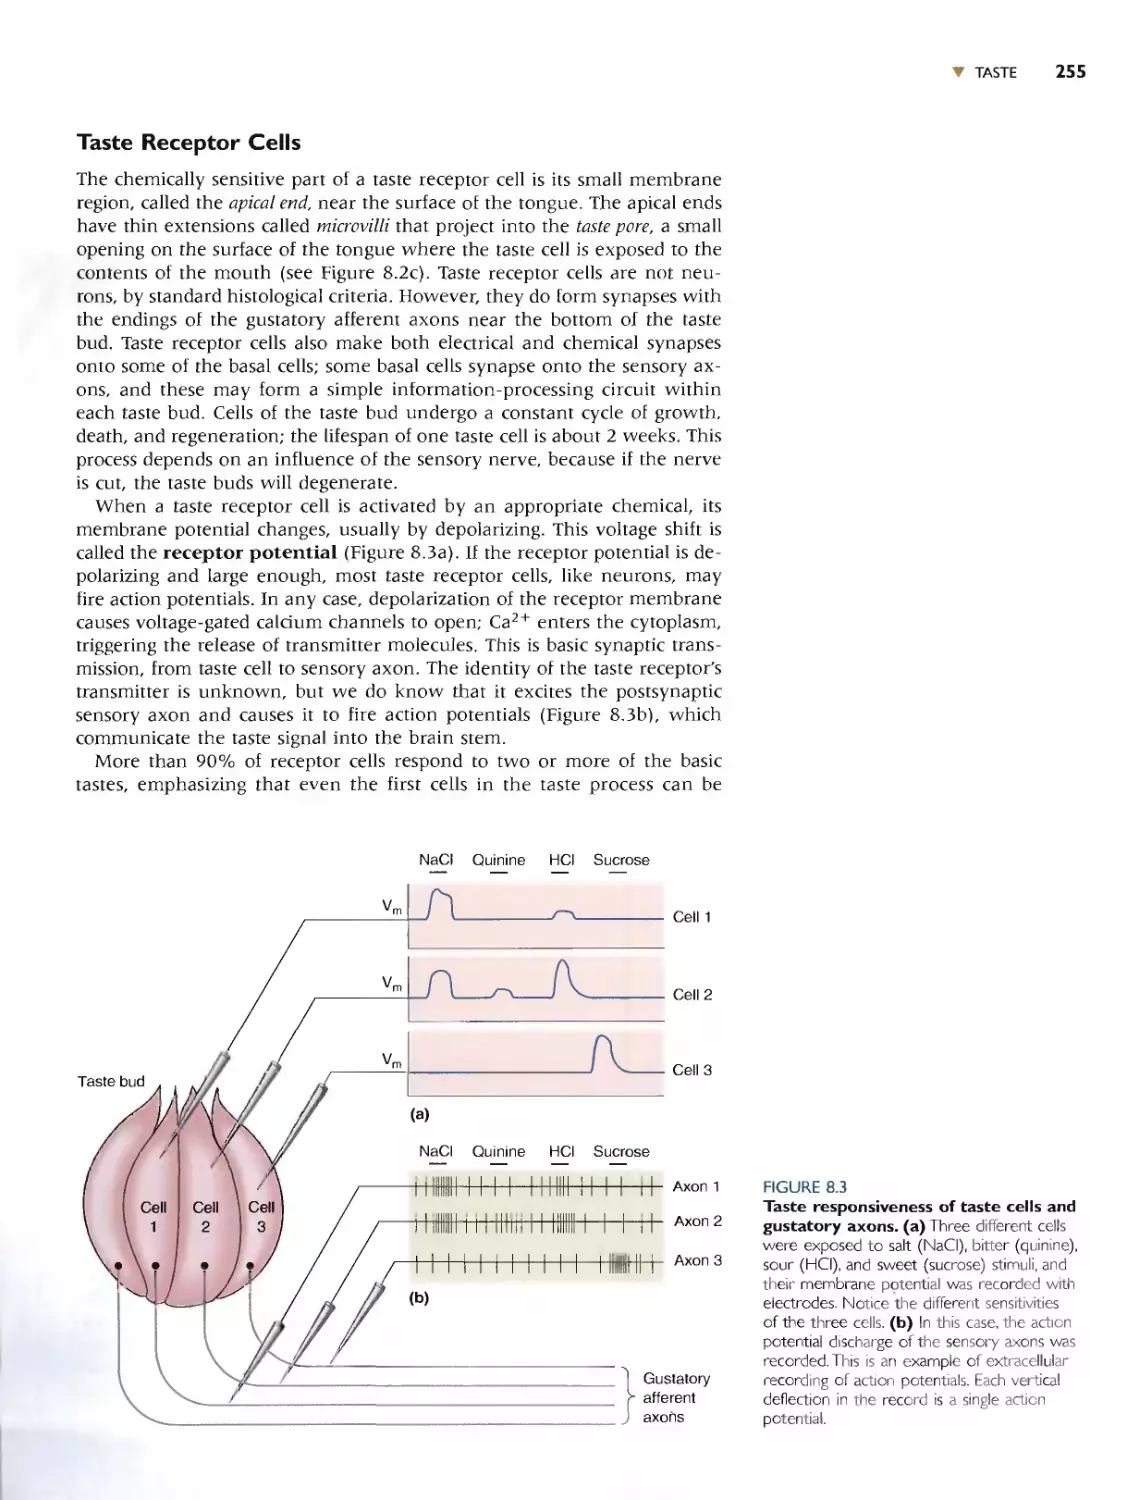
TASTE RECEPTOR CELLS 255
MECHANISMS OF TASTE TRANSDUCTION 256
Saltiness 256
Sourness 257
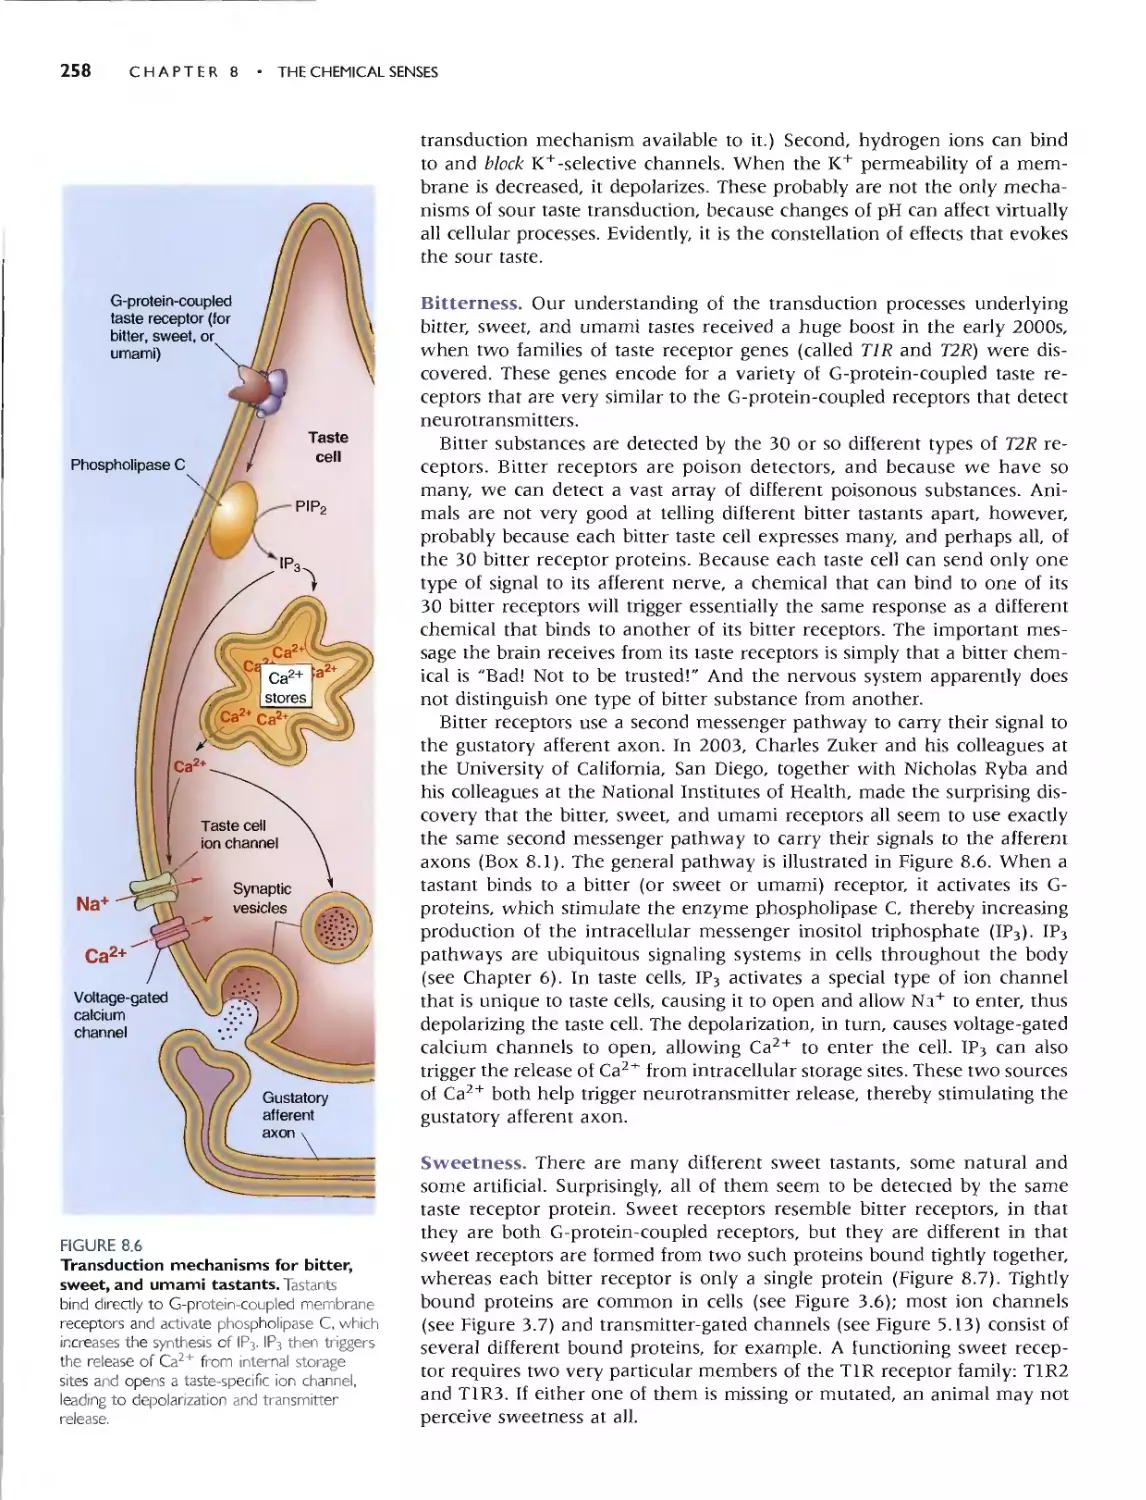
Bitterness 258
Sweetness 258
Umami (Amino Acids) 259
. Box 8.1 Path o( DisLovcry: A Journey Through
the Senses, by Charles S. Zuker 261
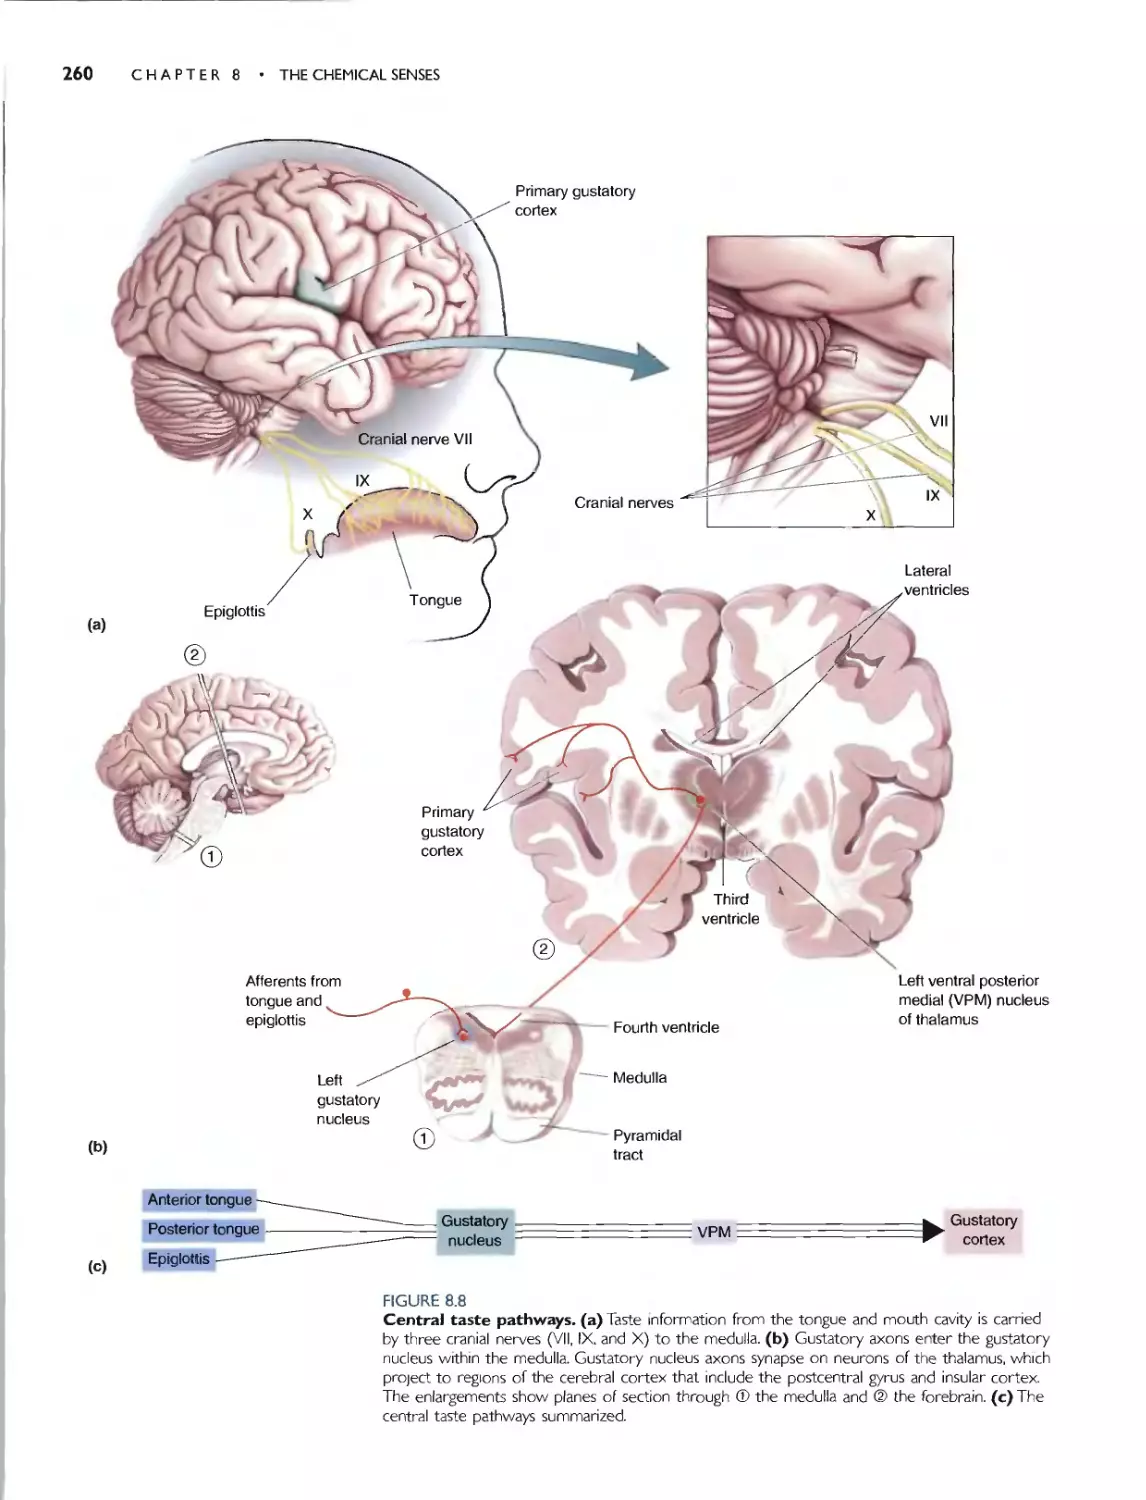
CENTRAL TASTE PATHWAYS 259
. Box 8.2 Of Special Tmerest: Memories of a Very
Bad Meal 262
THE NEURAL CODING OF TASTE 262
SMELL 263
. Box 8.3 Of Special/merest: Human
Pheromones? 264
THE ORGANS OF SMELL 265
OLFACTORY RECEPTOR NEURONS 266
Olfactory Transduction 266
CENTRAL OLFACTORY PATHWAYS 269
SPATIAL AND TEMPORAL REPRESENTATIONS OF
OLFACTORY INFORMATION 272
Olfoaory Populotion Coding 272
Olfoaory Mops 272
Temporol Coding in the Olfoaory System 274
CONCLUDING REMARKS 274
Chapter 9
The Eye 277
INTRODUCTION 278
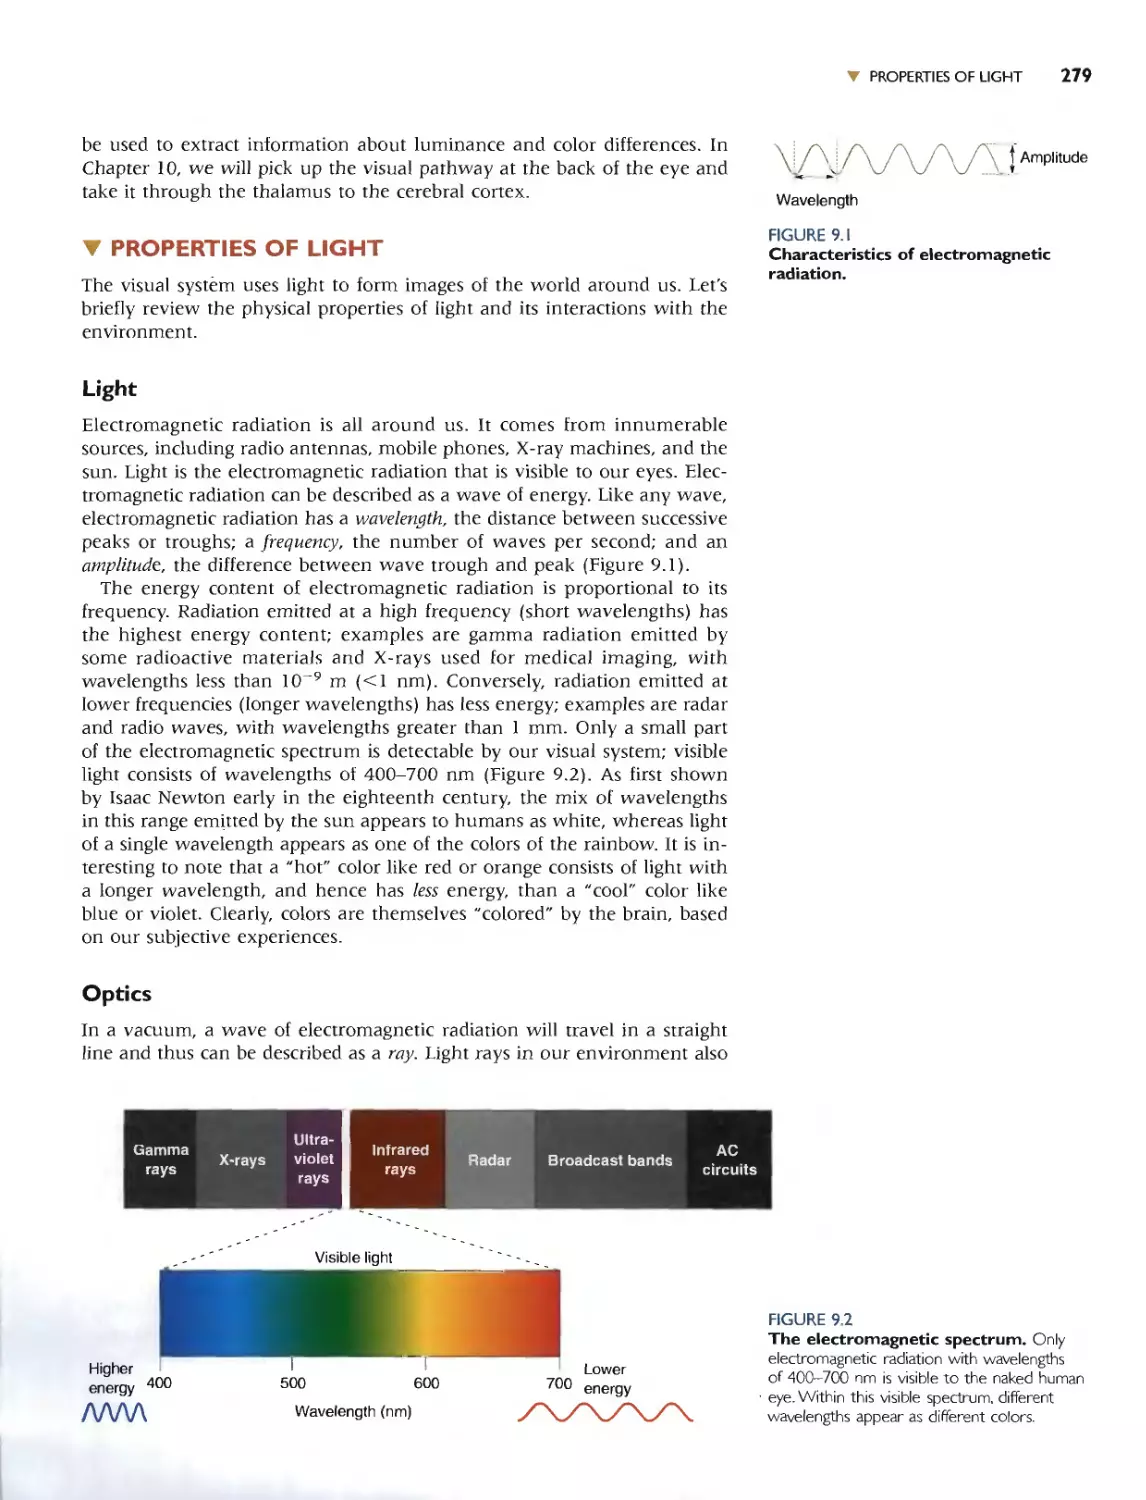
PROPERTIES OF LIGHT 279
LIGHT 279
OPTICS 279
THE STRUCTURE OF THE EYE 280
GROSS ANATOMY OFTHE EYE 280
OPHTHALMOSCOPIC APPEARANCE OF THE EYE 281
. Box 9.1 OfSpeciallnterest: Demonstrating the
Blind Regions of Your Eye 282
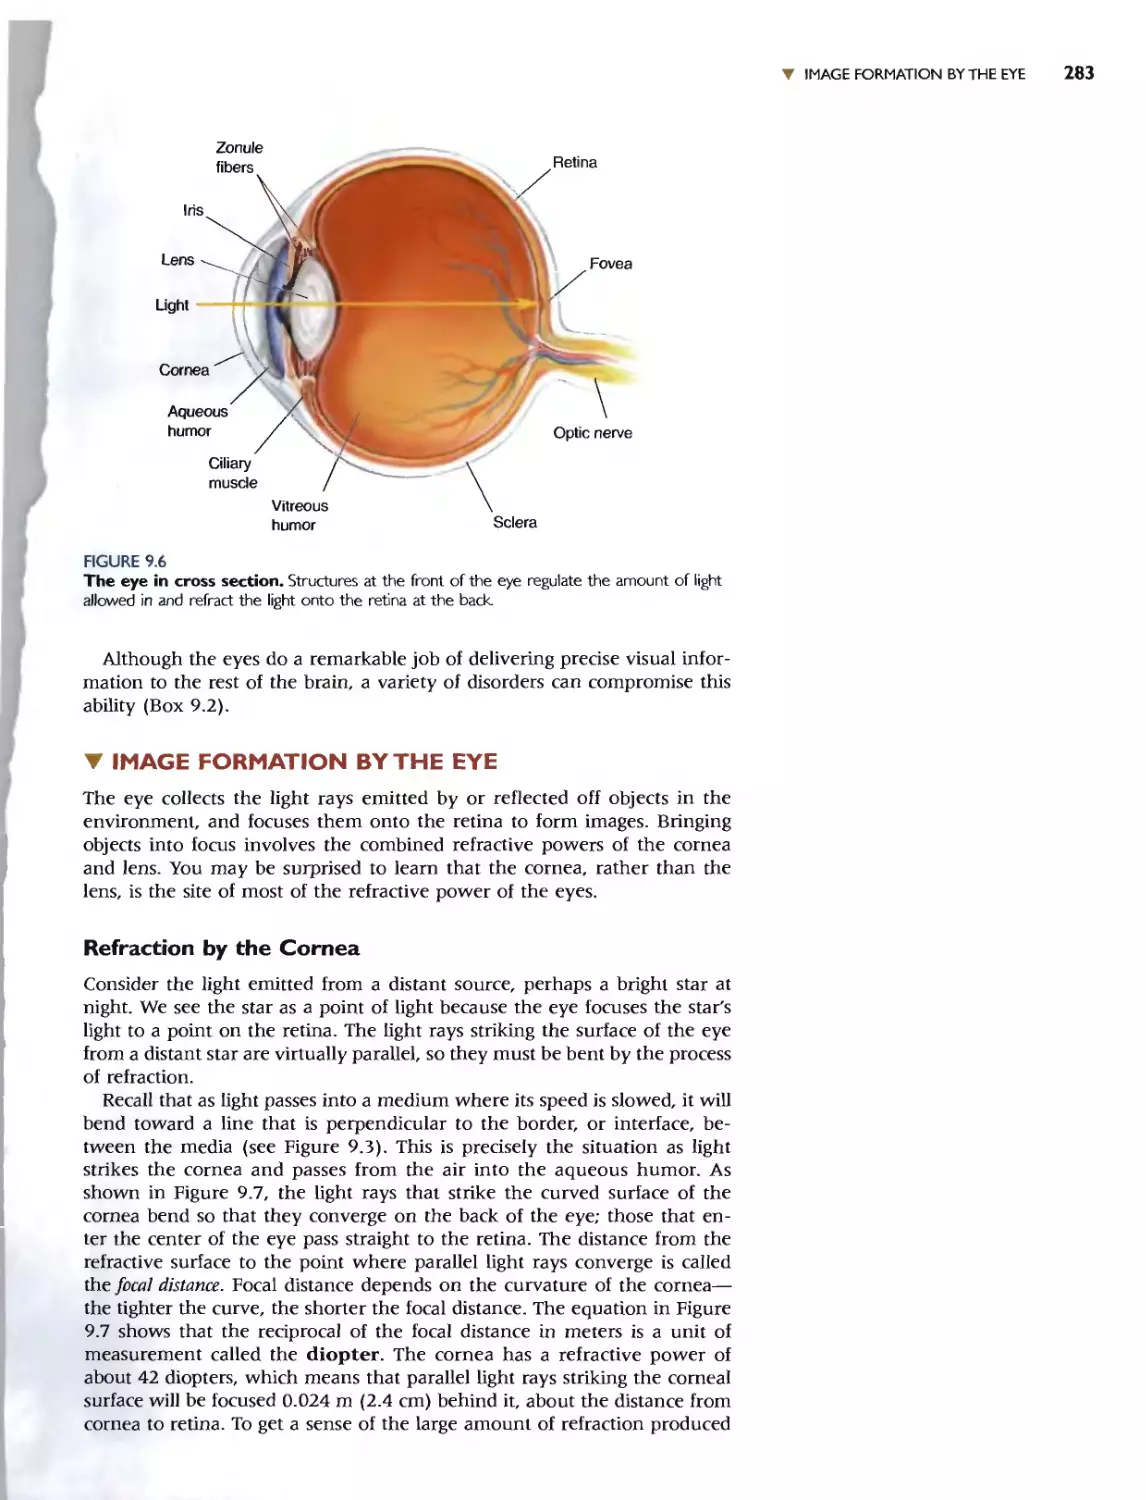
CROSS-SECTIONAL ANATOMY OF THE EYE 282
. Box 9.2 Of Speciallmerest: Eye
Disorders 285
IMAGE FORMATION BY THE EYE 283
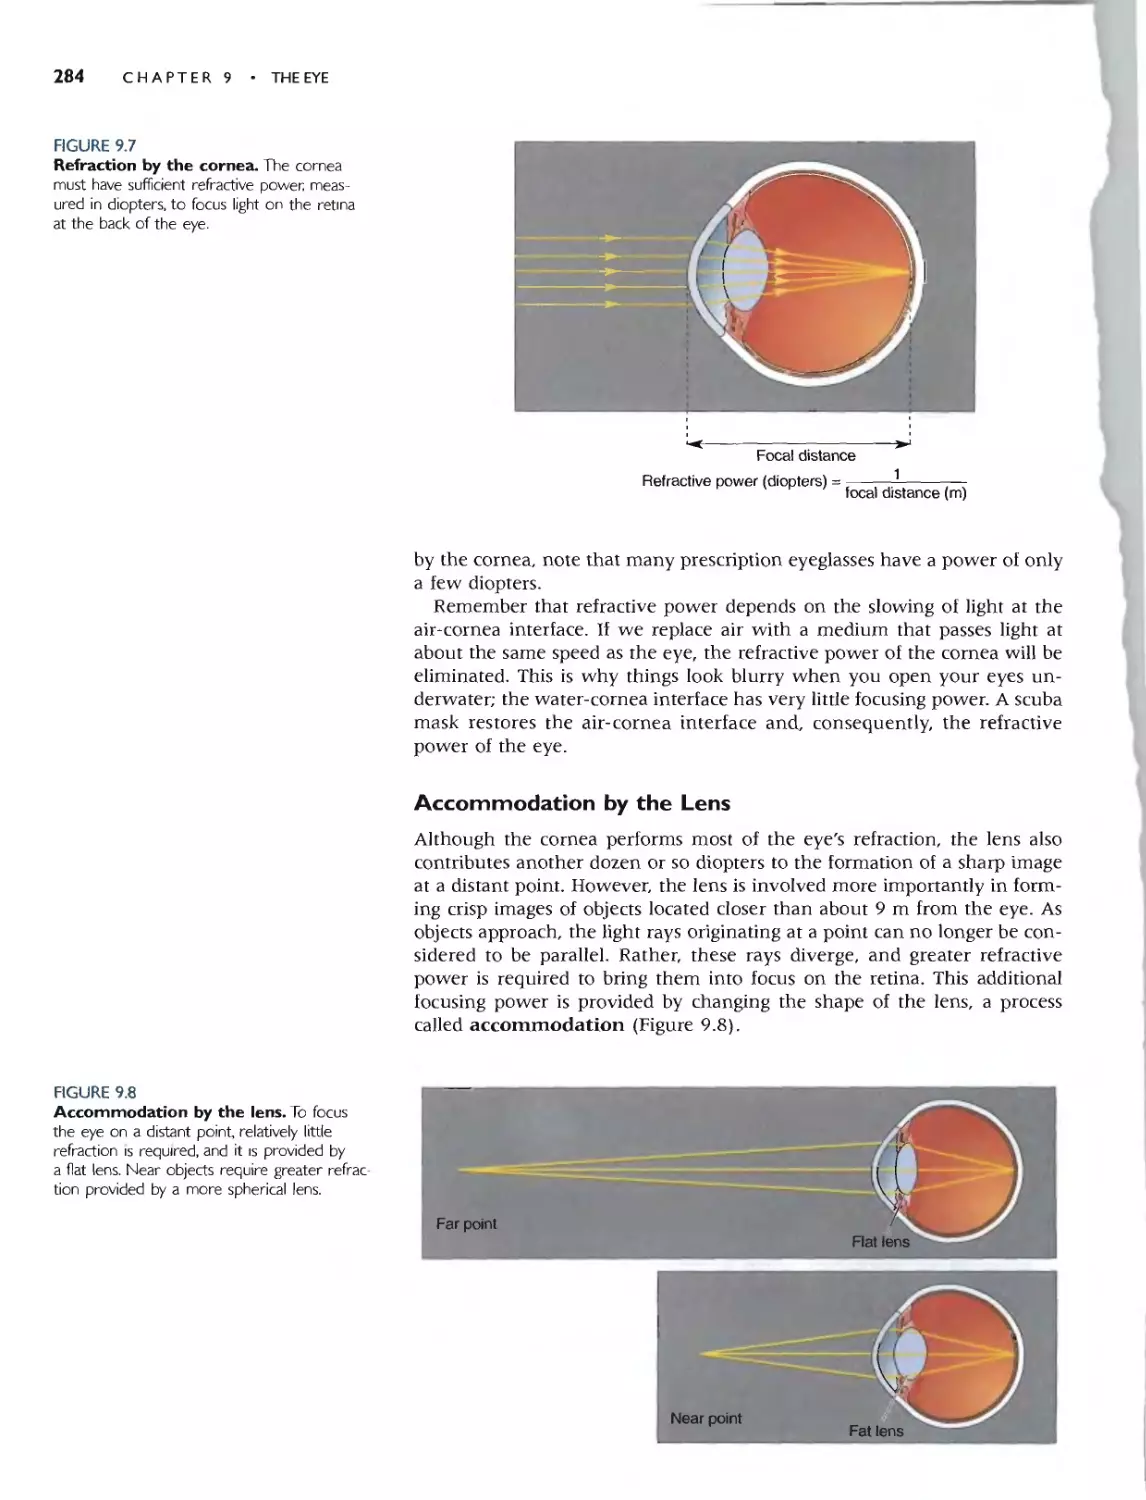
REFRACTION BY THE CORNEA 283
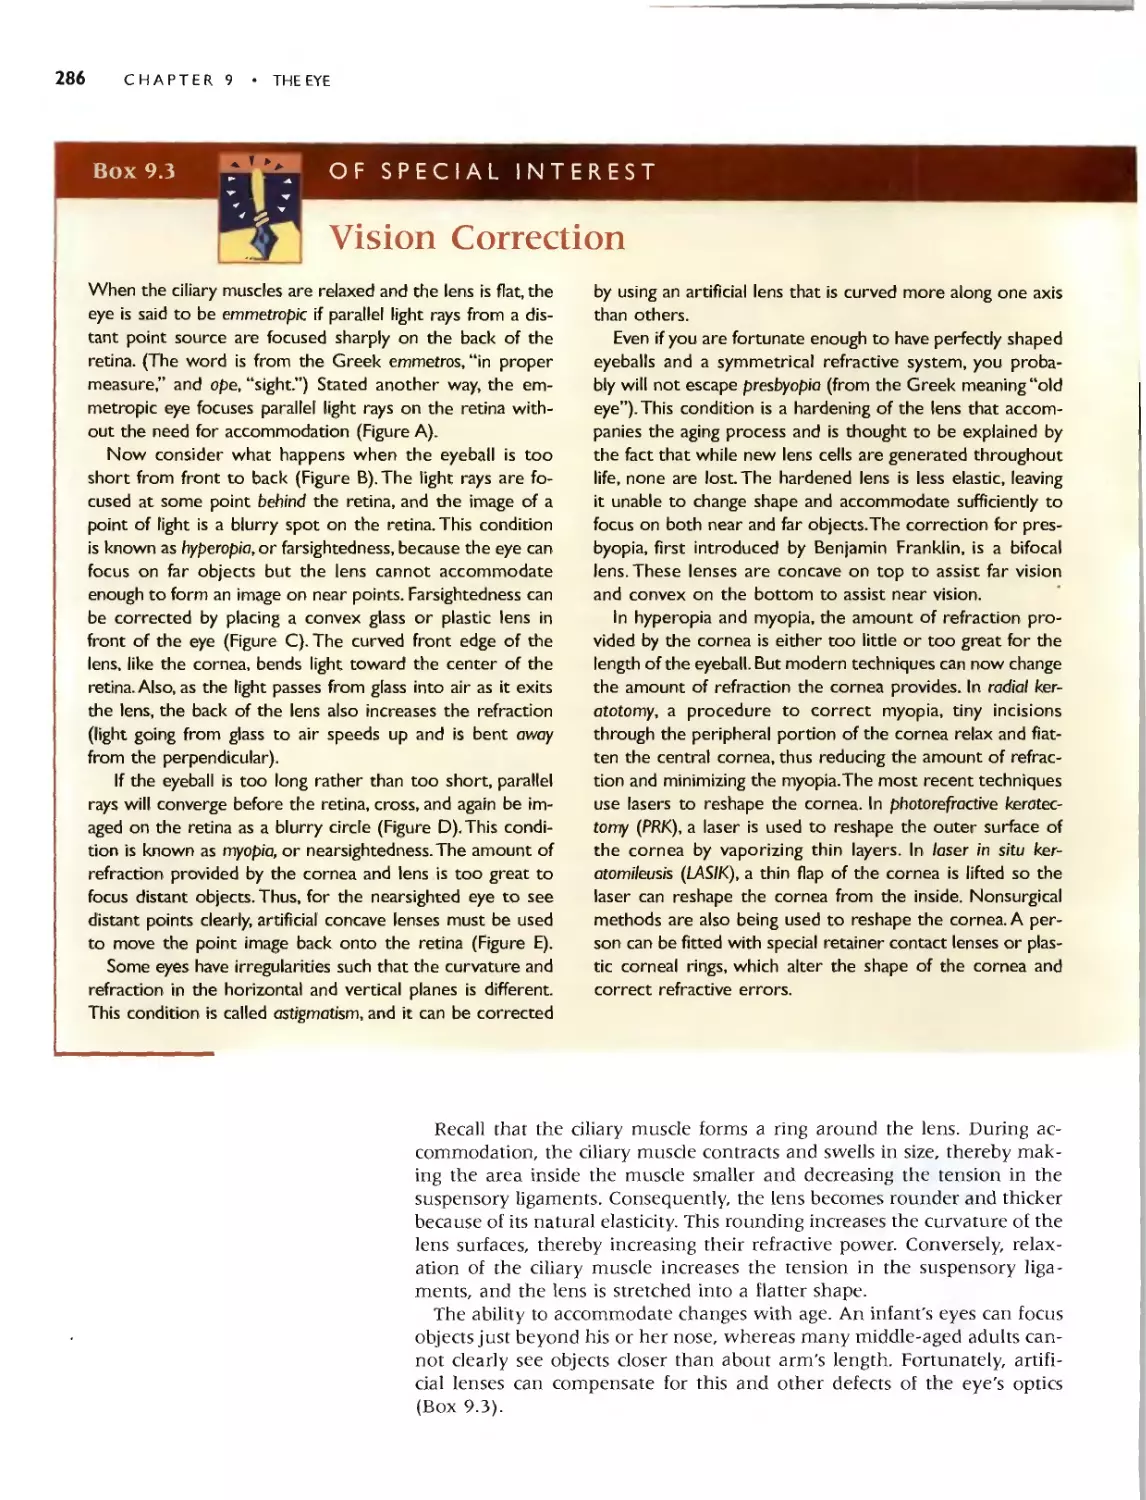
ACCOMMODATION BY THE LENS 284
. Box 9.3 Of Speciallnterest: Vision
Correction 286
THE PUPILLARY LIGHT REFLEX 287
THE VISUAL FIELD 288
VISUAL ACUITY 288
MICROSCOPIC ANATOMY OF THE RETINA 288
THE LAMINAR ORGANIZATION OF THE
RETINA 289
PHOTORECEPTOR STRUCTURE 290
REGIONAL DIFFERENCES IN RETINAL
STRUCTURE 290
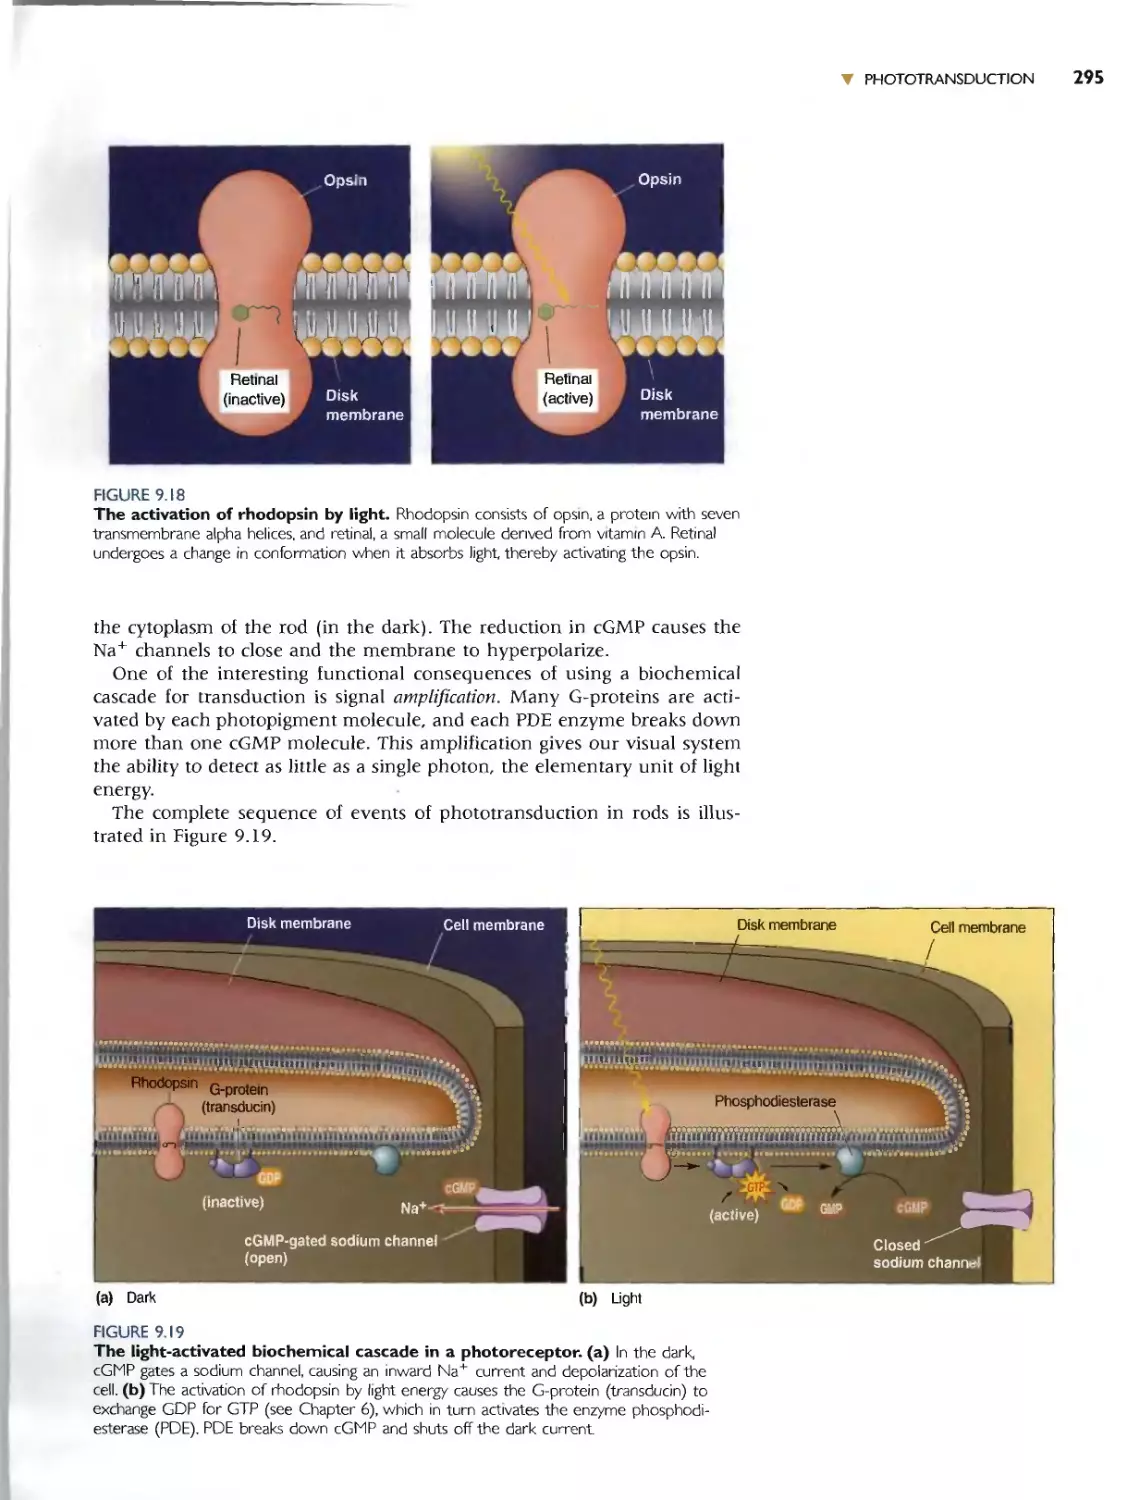
PHOTOTRANSDUCTION 292
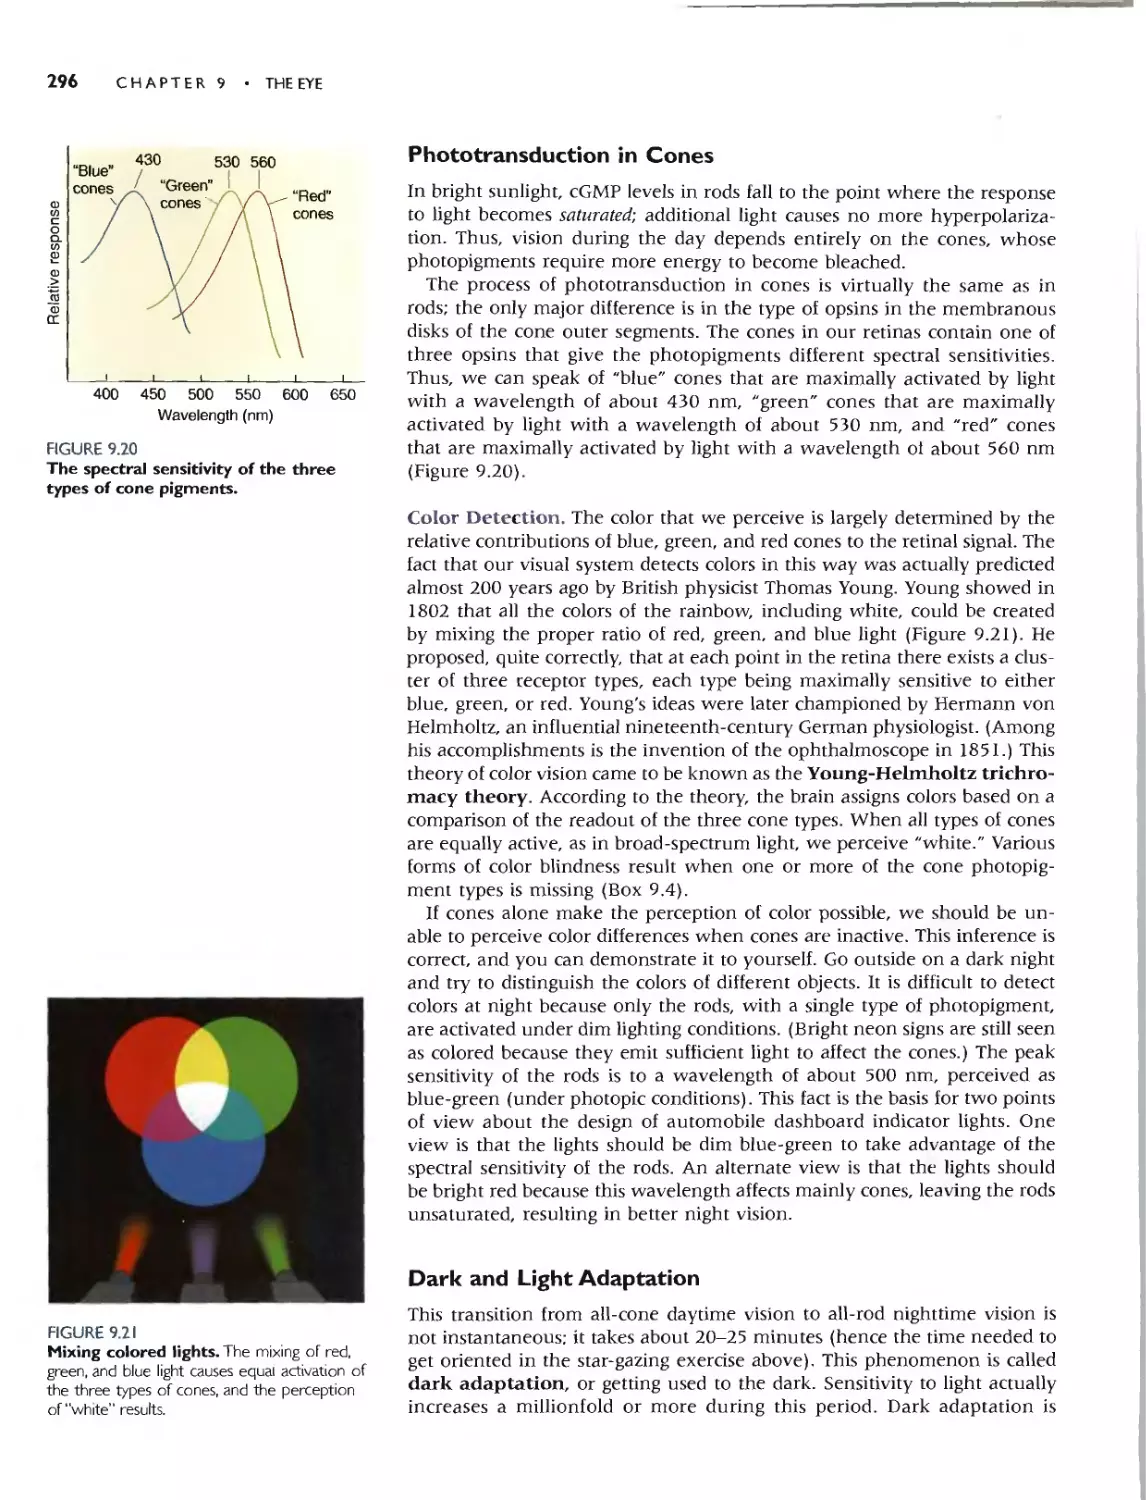
PHOTOTRANSDUCTION IN RODS 292
PHOTOTRANSDUCTION IN CONES 296
Color Detection 296
. Box 9.4 Of Specialll1terest: The Genetics of Color
Vision 297
DARK AND LIGHT ADAPTATION 296
Colcium's Role in Light Adoptotion 298
RETINAL PROCESSING 298
. Box 9.5 Path of Discovery: A Glimpse into the
Retina, by John Dowling 301
Y EXPANDED CONTENTS xxvii
TRANSFORMATIONS IN THE OUTER
PLEXIFORM LAYER 299
Bipolor Cell Receptive Fields 299
RETINAL OUTPUT 300
GANGLION CELL RECEPTIVE FIELDS 302
TYPES OF GANGLION CELLS 303
Color-Opponent Gonglion Cells 304
PARALLEL PROCESSING 306
CONCLUDING REMARKS 306
Chapter 10
The Central Visual System 309
INTRODUCTION 3 10
THE RETINOFUGAL PROJECTION 310
THE OPTIC NERVE, OPTIC CHIASM, AND OPTIC
TRACT 311
RIGHT AND LEFT VISUAL HEMIFIELDS 312
TARGETS OF THE OPTIC TRACT 313
. Box 10.1 Of Special Interest: David and
Goliath 315
Nontholomic Torgets of the Optic Troa 3 I 3
THE LATERAL GENICULATE NUCLEUS 315
THE SEGREGATION OF INPUT BY THE EYE AND BY
GANGLION CELL TYPE 316
RECEPTIVE FIELDS 317
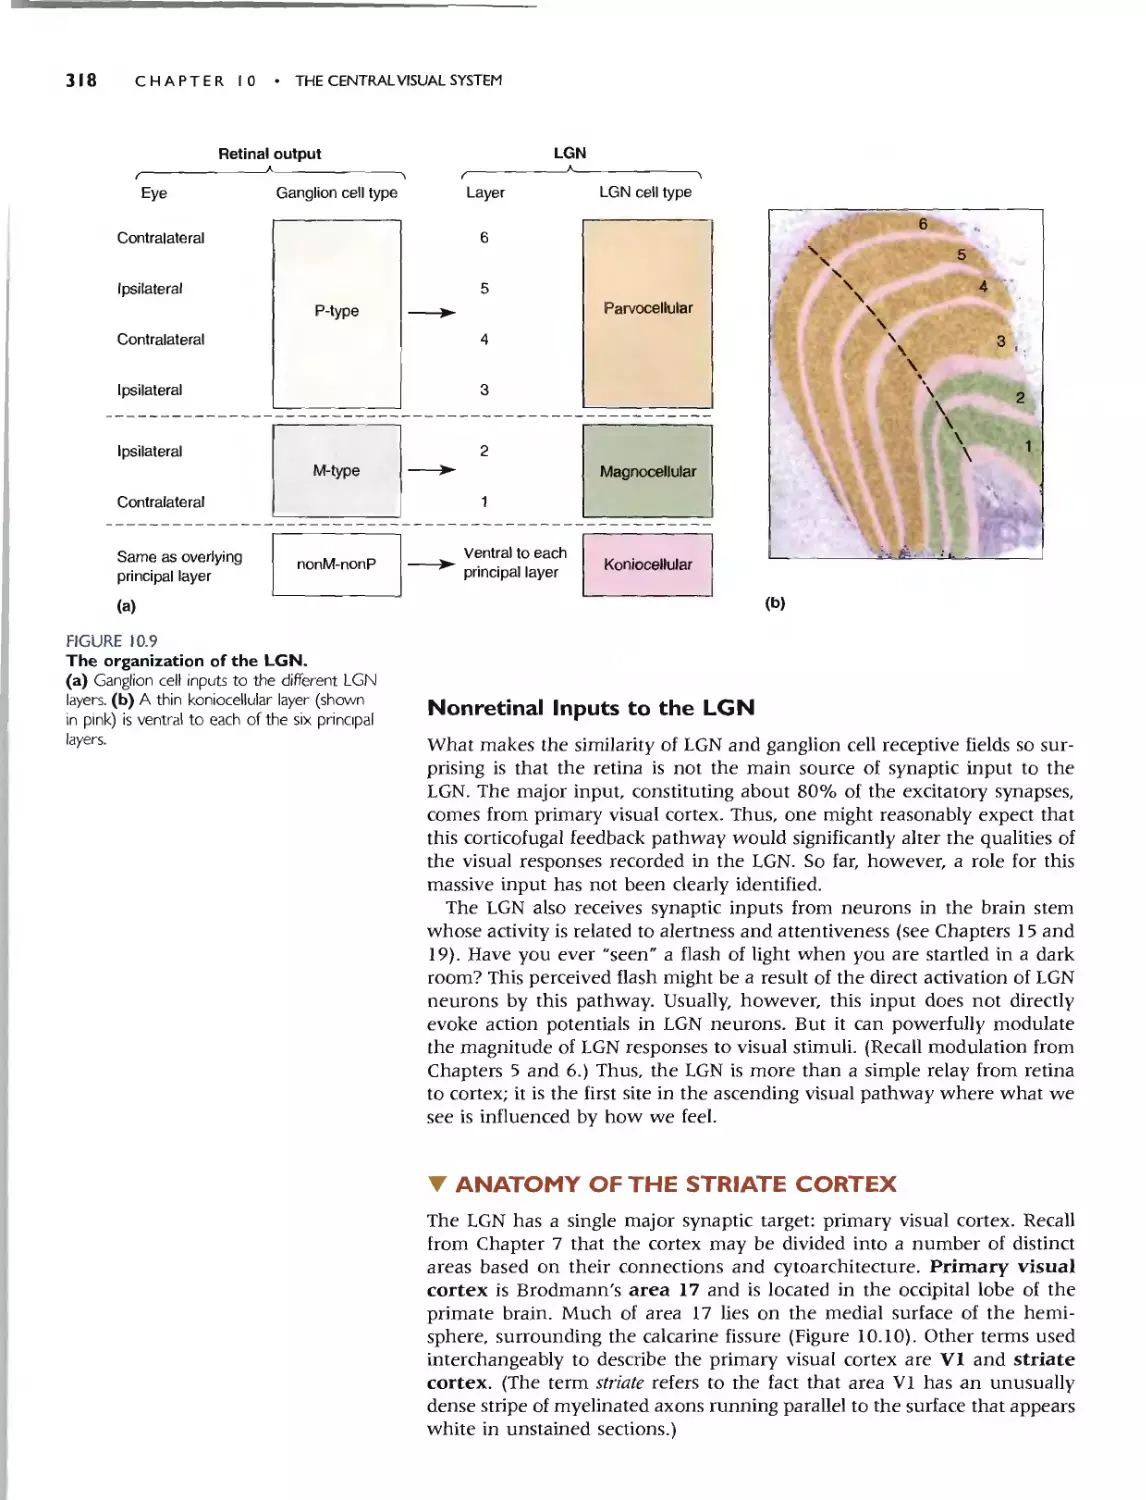
NON RETINAL INPUTS TO THE LGN 318
ANATOMY OF THE STRIATE CORTEX 318
RETINOTOPY 319
LAMINATION OF THE STRIATE CORTEX 320
The Cells of Different Loyers 321
INPUTS AND OUTPUTS OFTHE STRIATE CORTEX 321
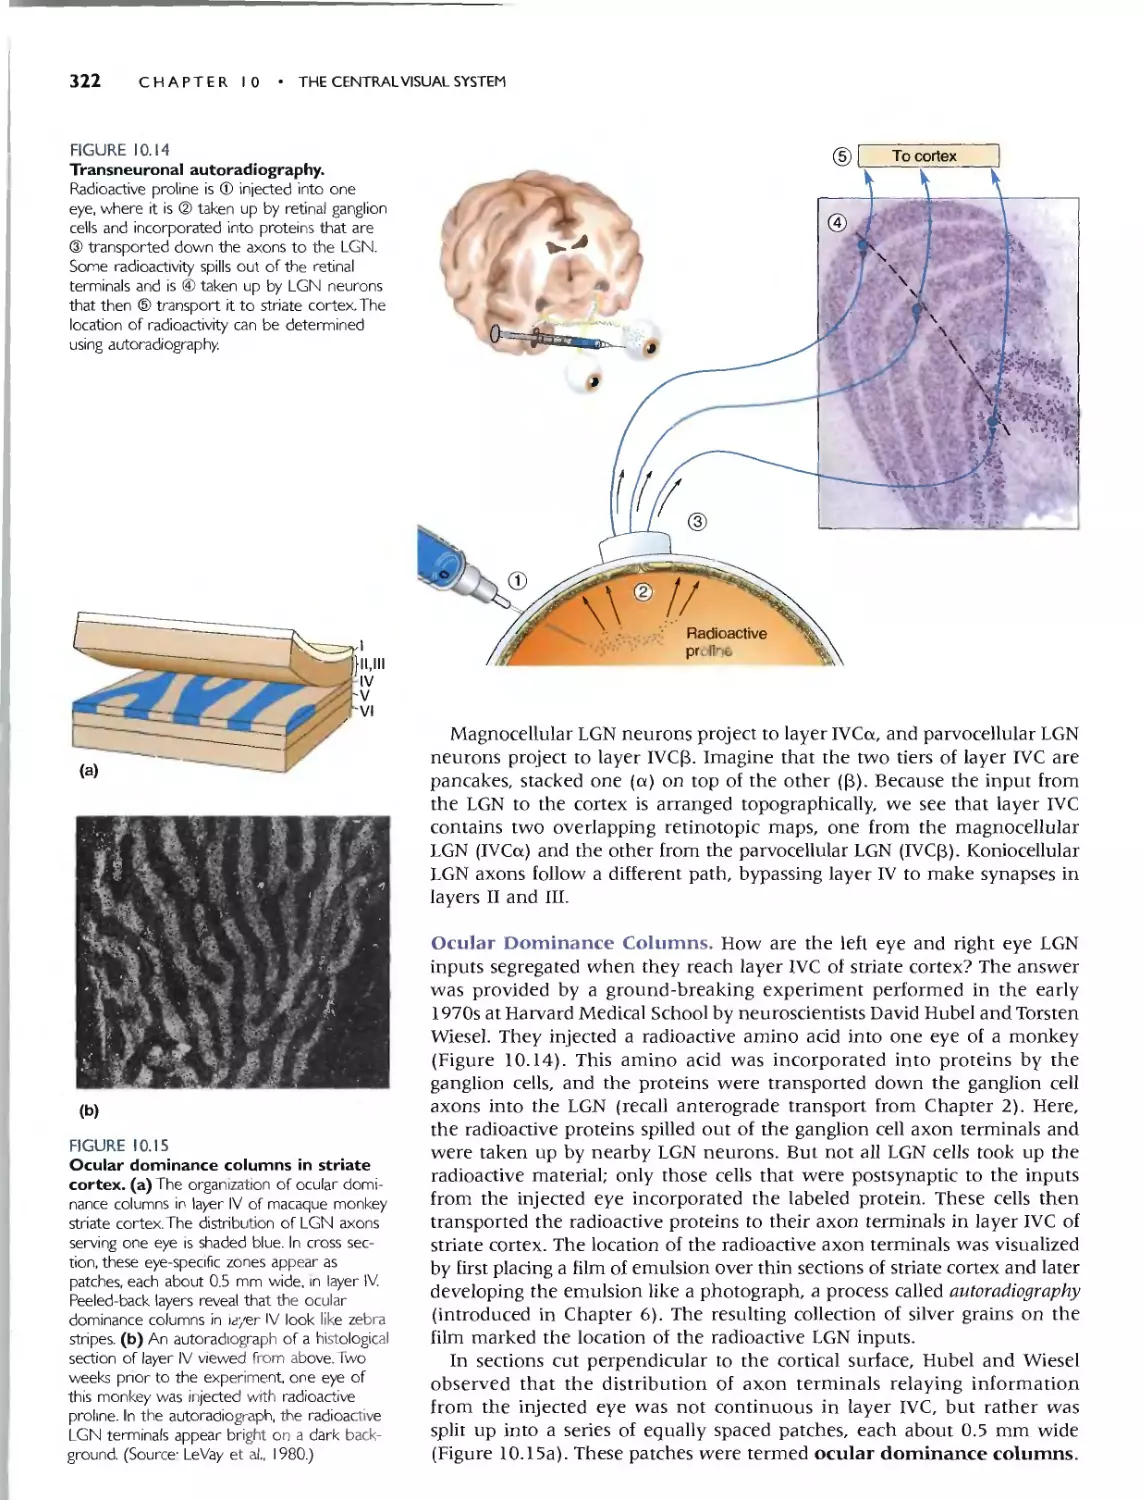
Oculor Dominonce Columns 322
Innervotion of Other Corticol Loyers from Loyer IVC 323
Striote Cortex Outputs 323
CYTOCHROME OXIDASE BLOBS 324
PHYSIOLOGY OFTHE STRIATE CORTEX 324
RECEPTIVE FIELDS 324
Binoculority 324
Orientotion Seleaivity 325
. Box 10.2 Brain Food: Optical Imaging of Neural
Activity 328
Direaion Seleaivity 326
Simple ond Complex Receptive Fields 327
Blob Receptive Fields 329
xxviii EXPANDED CONTENTS
PARALLEL PATHWAYS AND CORTICAL
MODULES 330
. Box 10.3 Path of Discovery: Vision and Art, by
Margaret Livingstone 331
Parallel Pathways 330
Cortical Modules 332
BEYOND STRIATE CORTEX 333
THE DORSAL STREAM 334
Area MT 334
Dorsal Areas and Motion Processing 335
THE VENTRAL STREAM 336
Area V4 336
Area IT 336
FROM SINGLE NEURONS TO PERCEPTION 337
. Box 10.4 Of Specialillterest: The Magic of Seeing
in 3D 338
FROM PHOTORECEPTORS TO GRANDMOTHER
CELLS 337
PARALLEL PROCESSING AND PERCEPTION 339
CONCLUDING REMARKS 340
Chae ter I I
The Auditory and Vestibular
Systems 343
INTRODUCTION 344
THE NATURE OF SOUND 344
. Box 11.1 Of Specil1llnterest: Ultrasound and
Infrasound 346
THE STRUCTURE OF THE AUDITORY SYSTEM 347
THE MIDDLE EAR 348
COMPONENTS OF THE MIDDLE EAR 348
SOUND FORCE AMPLIFICATION BY THE
OSSICLES 348
THE ATTENUATION REFLEX 350
THE INNER EAR 351
ANATOMY OF THE COCHLEA 351
PHYSIOLOGY OF THE COCHLEA 352
The Response of the Basilar Membrane to Sound 353
The Organ of Corti and Associated Structures 354
. Box 11.2 Of Special Interest: The Deaf Shall Hear:
Cochlear Implants 356
Transduction by Hair Cells 356
. Box 11.3 Path of Discovery: From Sound to
Sensation. by David P. Corey 360
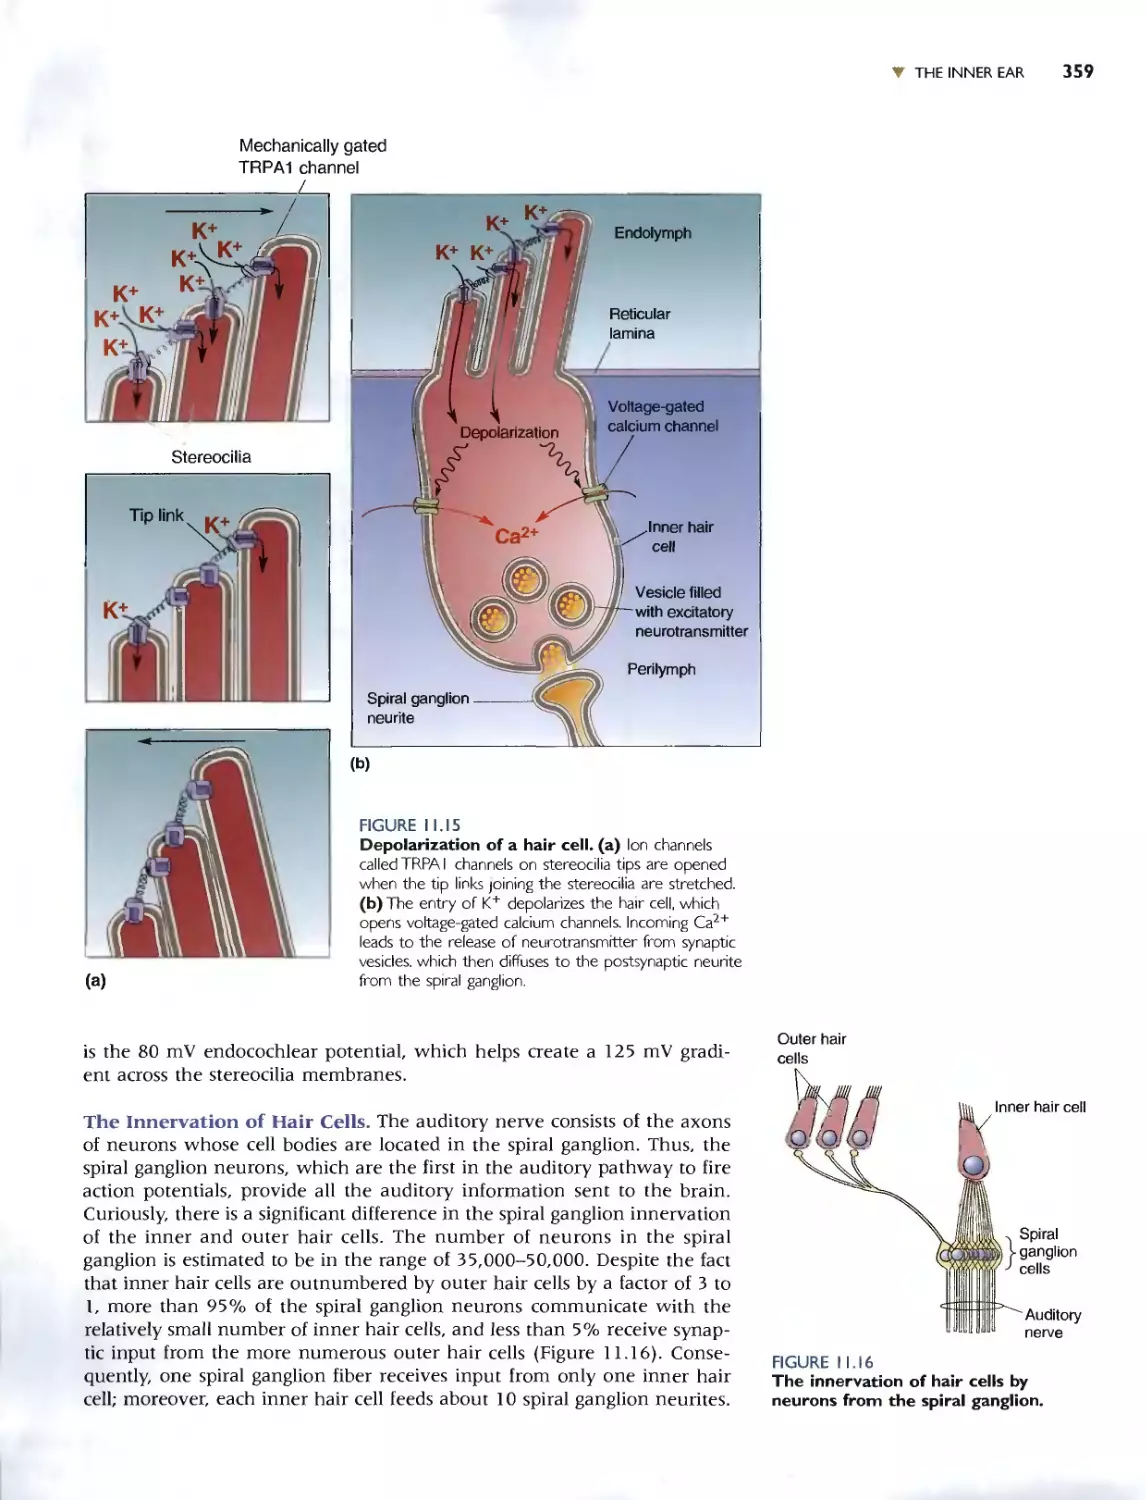
The Innervation of Hair Cells 359
Amplification by Outer Hair Cells 361
. Box 11.4 Uf Specil1l Interest: Noisy Ears:
Otoacoustic Emissions 362
CENTRAL AUDITORY PROCESSES 363
THE ANATOMY OF AUDITORY PATHWAYS 363
RESPONSE PROPERTIES OF NEURONS IN THE
AUDITORY PATHWAY 365
ENCODING SOUND INTENSITY AND
FREQUENCY 365
STIMULUS INTENSITY 365
STIMULUS FREQUENCY,TONOTOPY,AND PHASE
LOCKING 366
Tonotopy 366
Phase Locking 367
MECHANISMS OF SOUND LOCALIZATION 368
LOCALIZATION OF SOUND IN THE HORIZONTAL
PLANE 368
The Sensitivity of Binaural Neurons to Sound Location 369
LOCALIZATION OF SOUND IN THE VERTICAL
PLANE 371
AUDITORY CORTEX 372
NEURONAL RESPONSE PROPERTIES 373
. Box 11.5 Of Srecil1llllterest: How Does
Auditory Cortex Work? Consult a
Specialist 374
THE EFFECTS OF AUDITORY CORTICAL LESIONS
AND ABLATION 374
. Box 11.6 Of Speciall1ztt?rest. Auditory Disorders
and Their Treatments 376
THE VESTIBULAR SYSTEM 376
THE VESTIBULAR LABYRINTH 376
THE OTOLITH ORGANS 378
THE SEMICIRCULAR CANALS 379
CENTRAL VESTIBULAR PATHWAYS AND VESTIBULAR
REFLEXES 381
The Vestibulo-Ocular Reflex (VOR) 382
VESTIBULAR PATHOLOGY 384
CONCLUDING REMARKS 384
Ch aeter 12
The Somatic Sensory System 387
INTRODUCTION 388
TOUCH 388
MECHANORECEPTORS OF THE SKIN 389
Vibration and the Pacinian Corpuscle 391
Two-Point Discrimination 392
PRIMARY AFFERENT AXONS 392
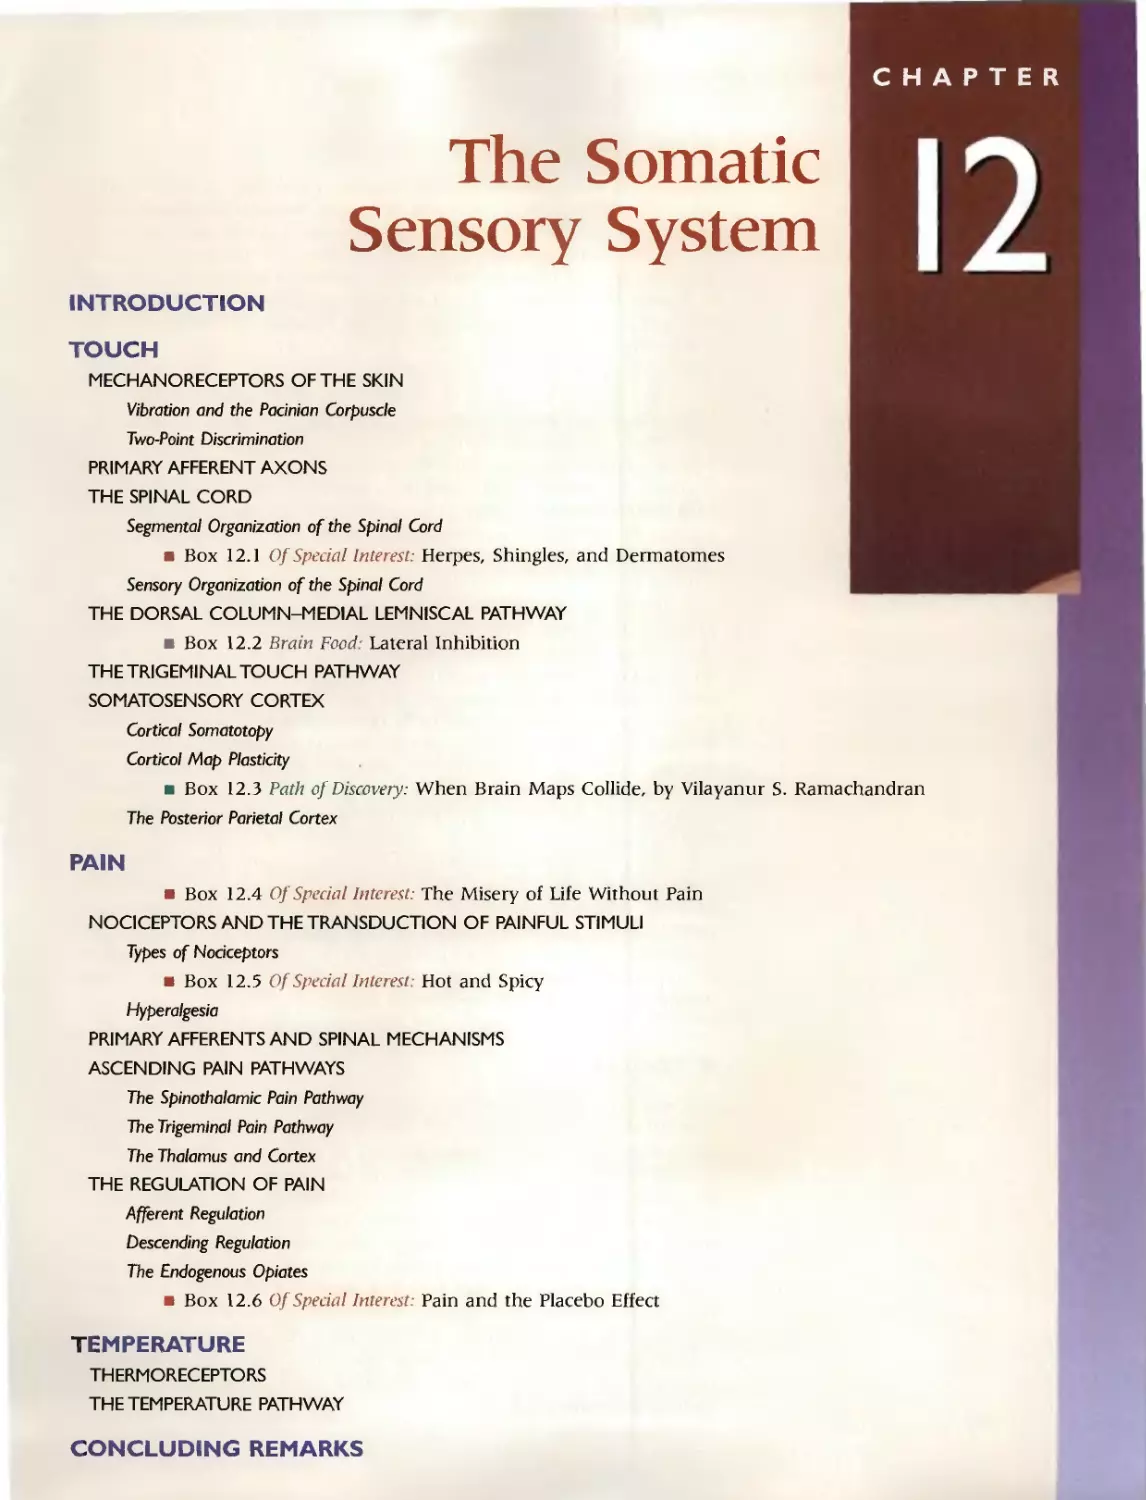
THE SPINAL CORD 394
Segmental Organization of the Spinal Cord 394
. Box 12.1 Of Speciallmerest: Herpes, Shingles,
and Dermatomes 396
Sensory Organization of the Spinal Cord 396
THE DORSAL COLUMN-MEDIAL LEMNISCAL
PATHWAY 397
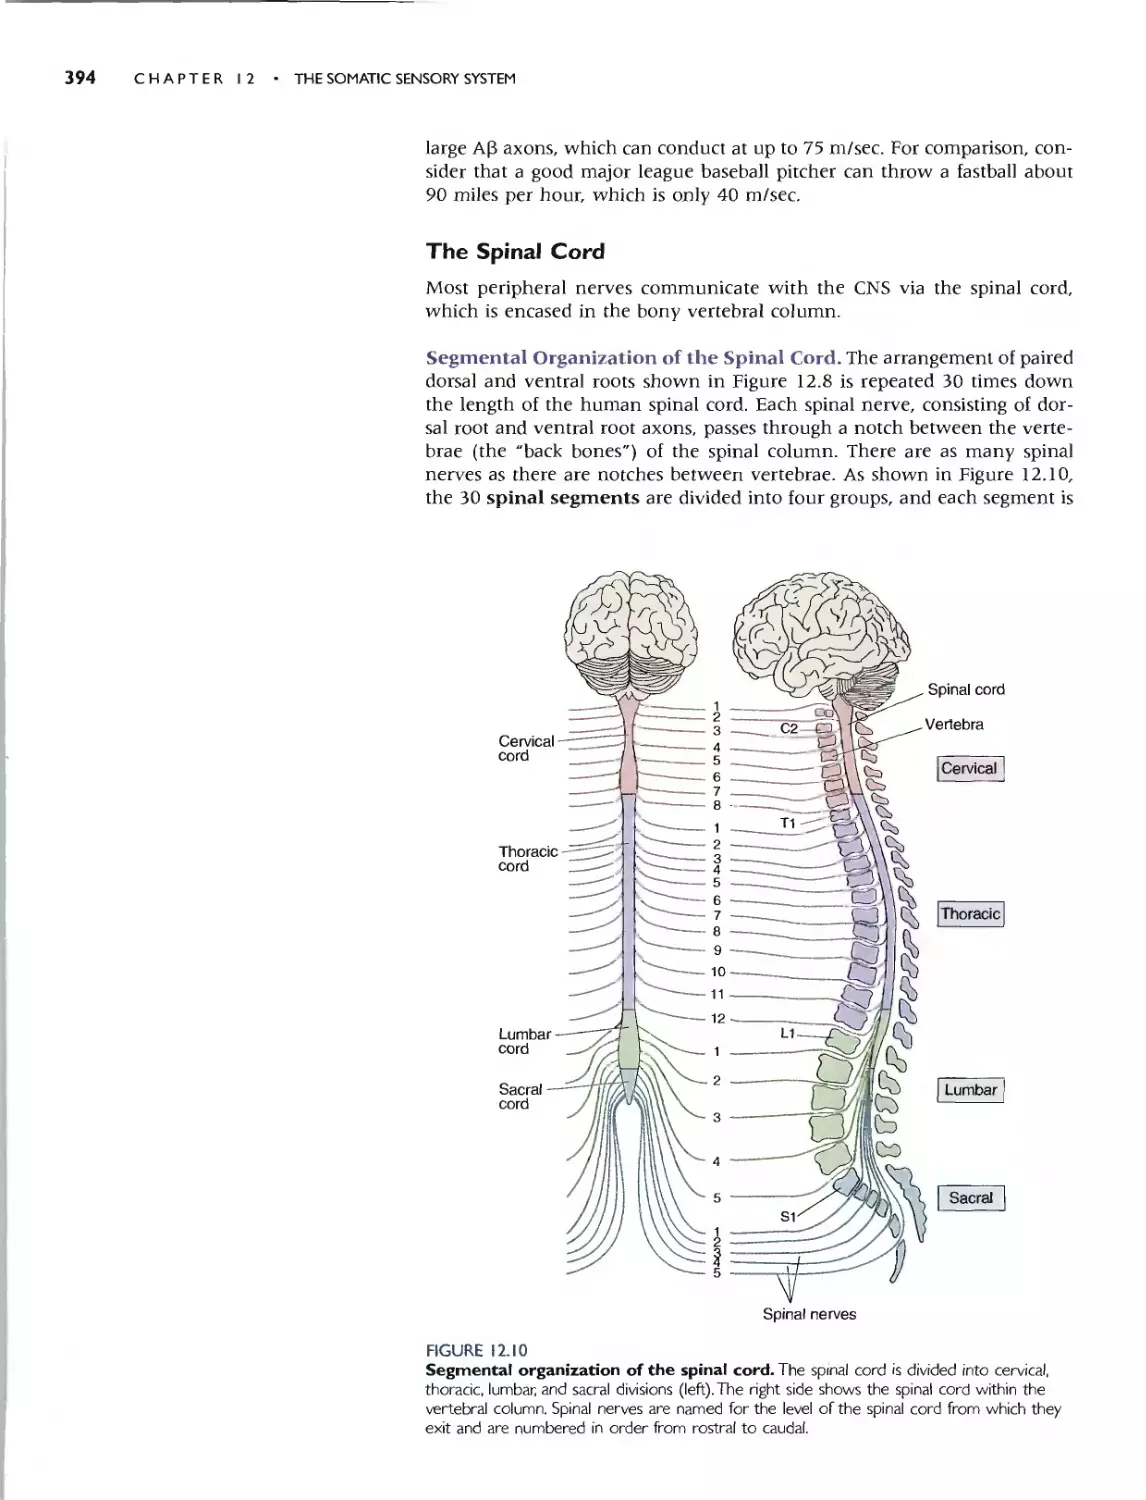
. Box 12.2 Brain Food: Lateral Inhibition 399
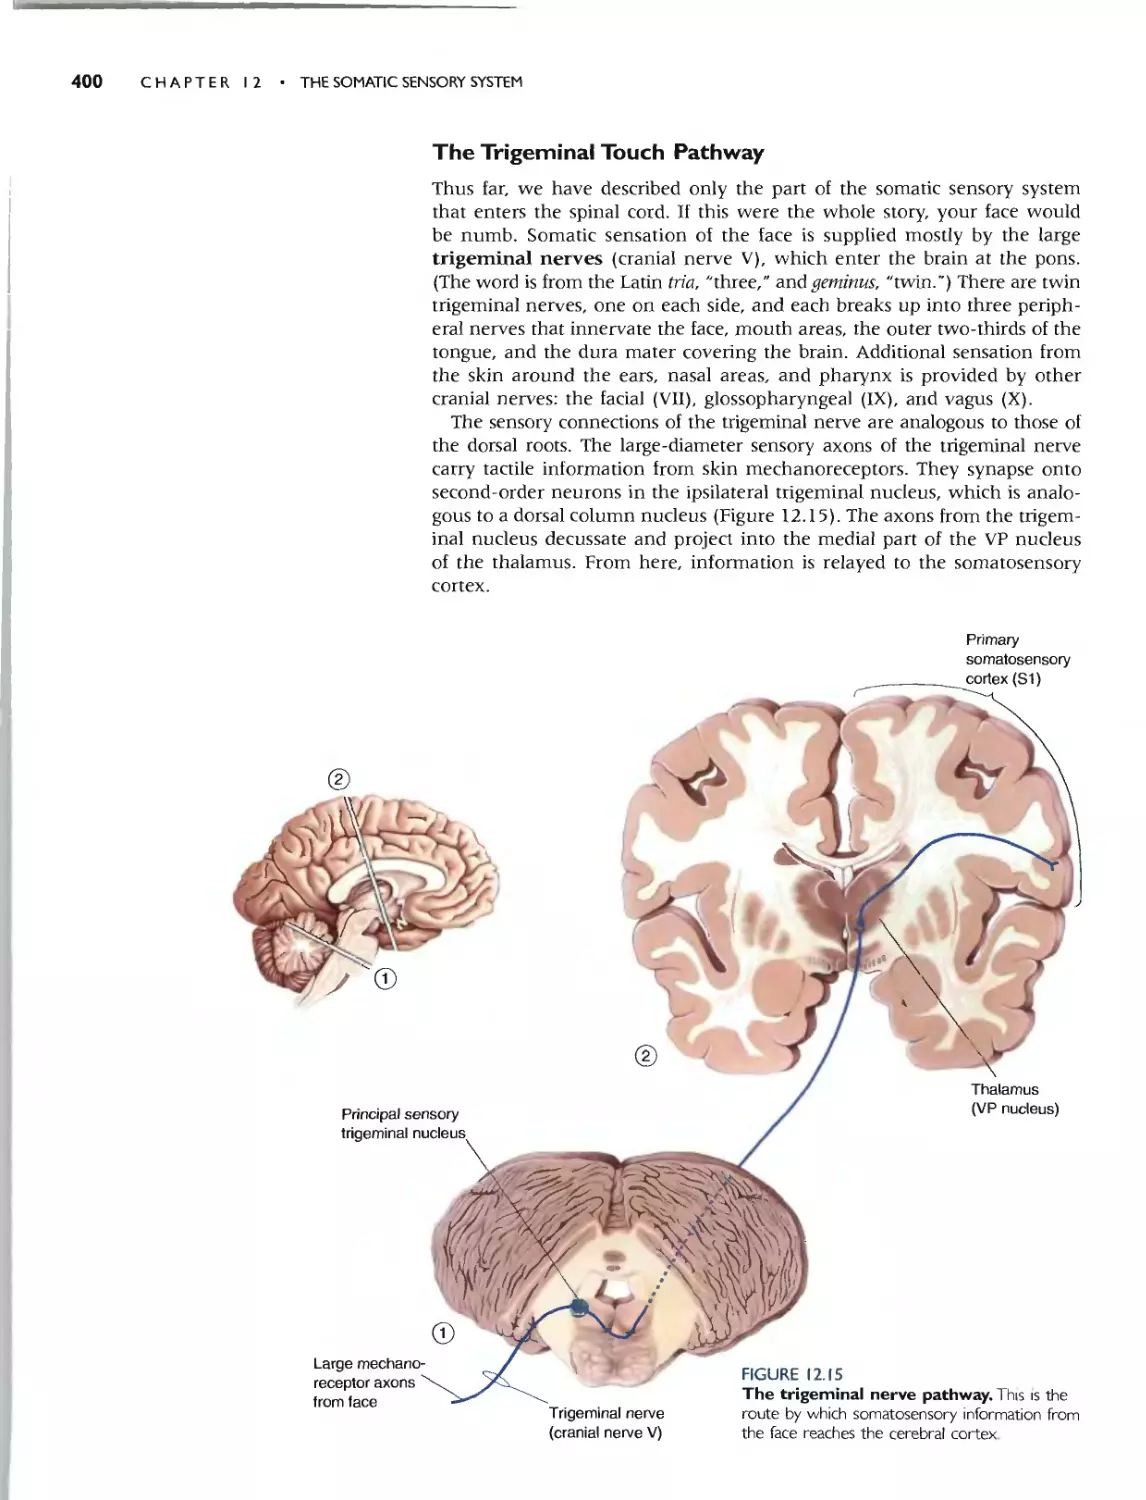
THE TRIGEMINAL TOUCH PATHWAY 400
SOMATOSENSORY CORTEX 40 I
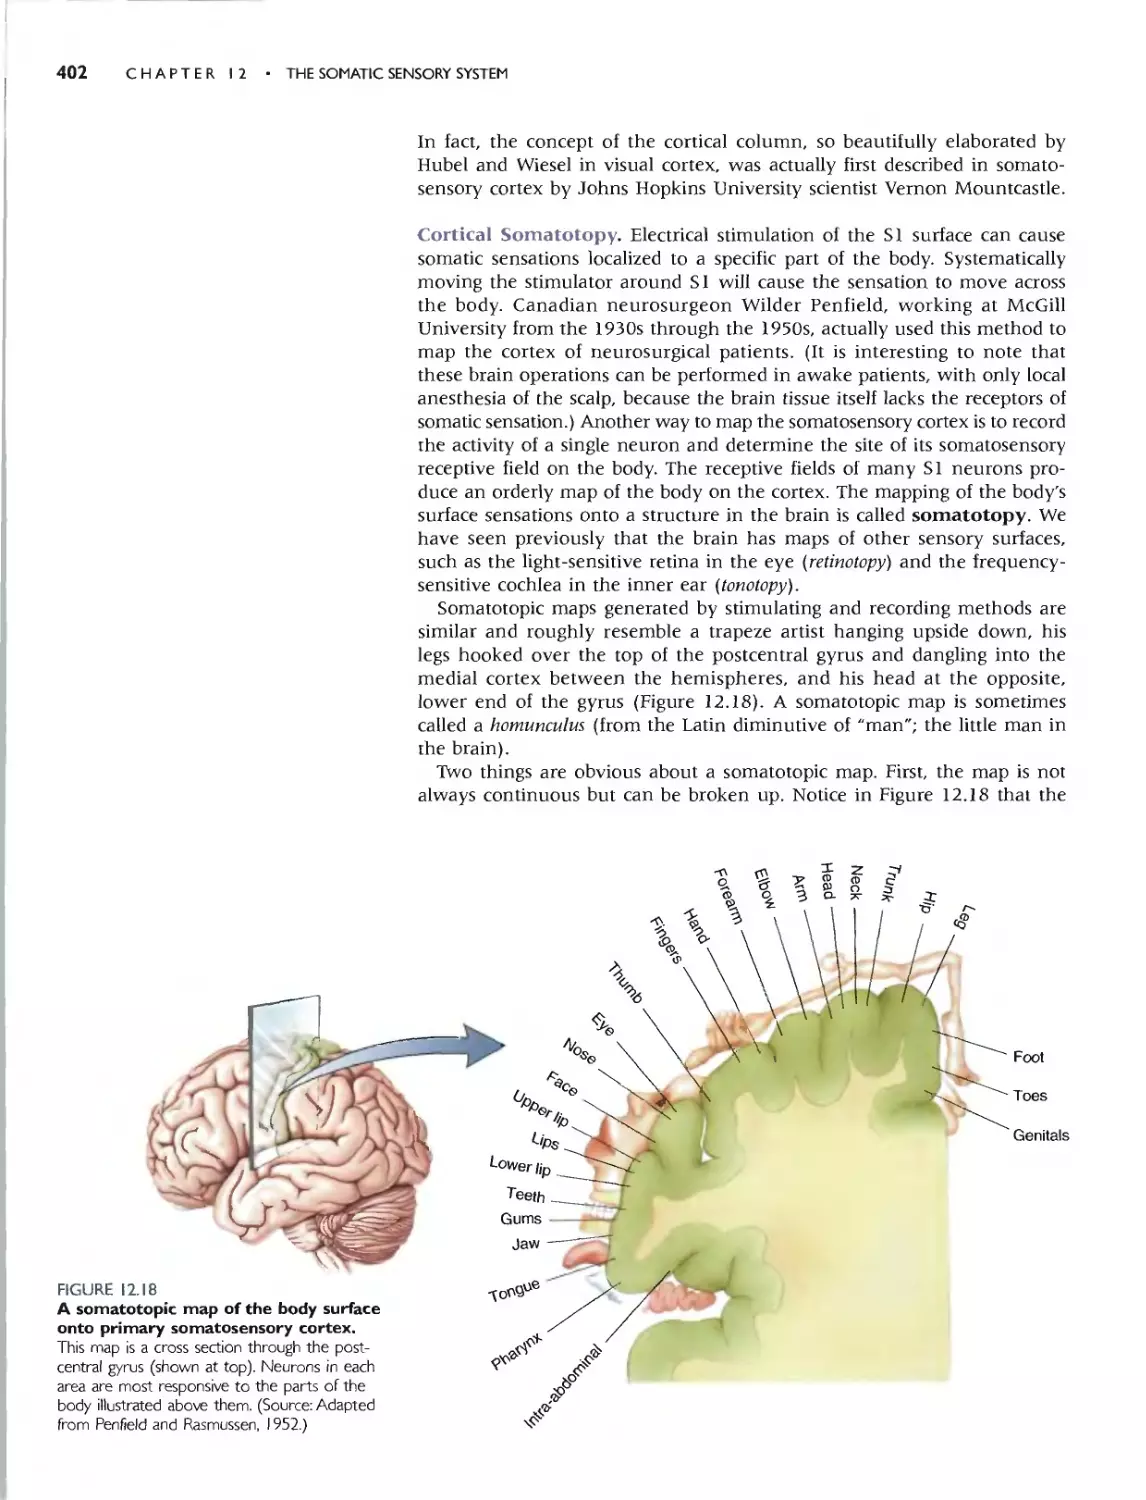
Cortical Somatotopy 402
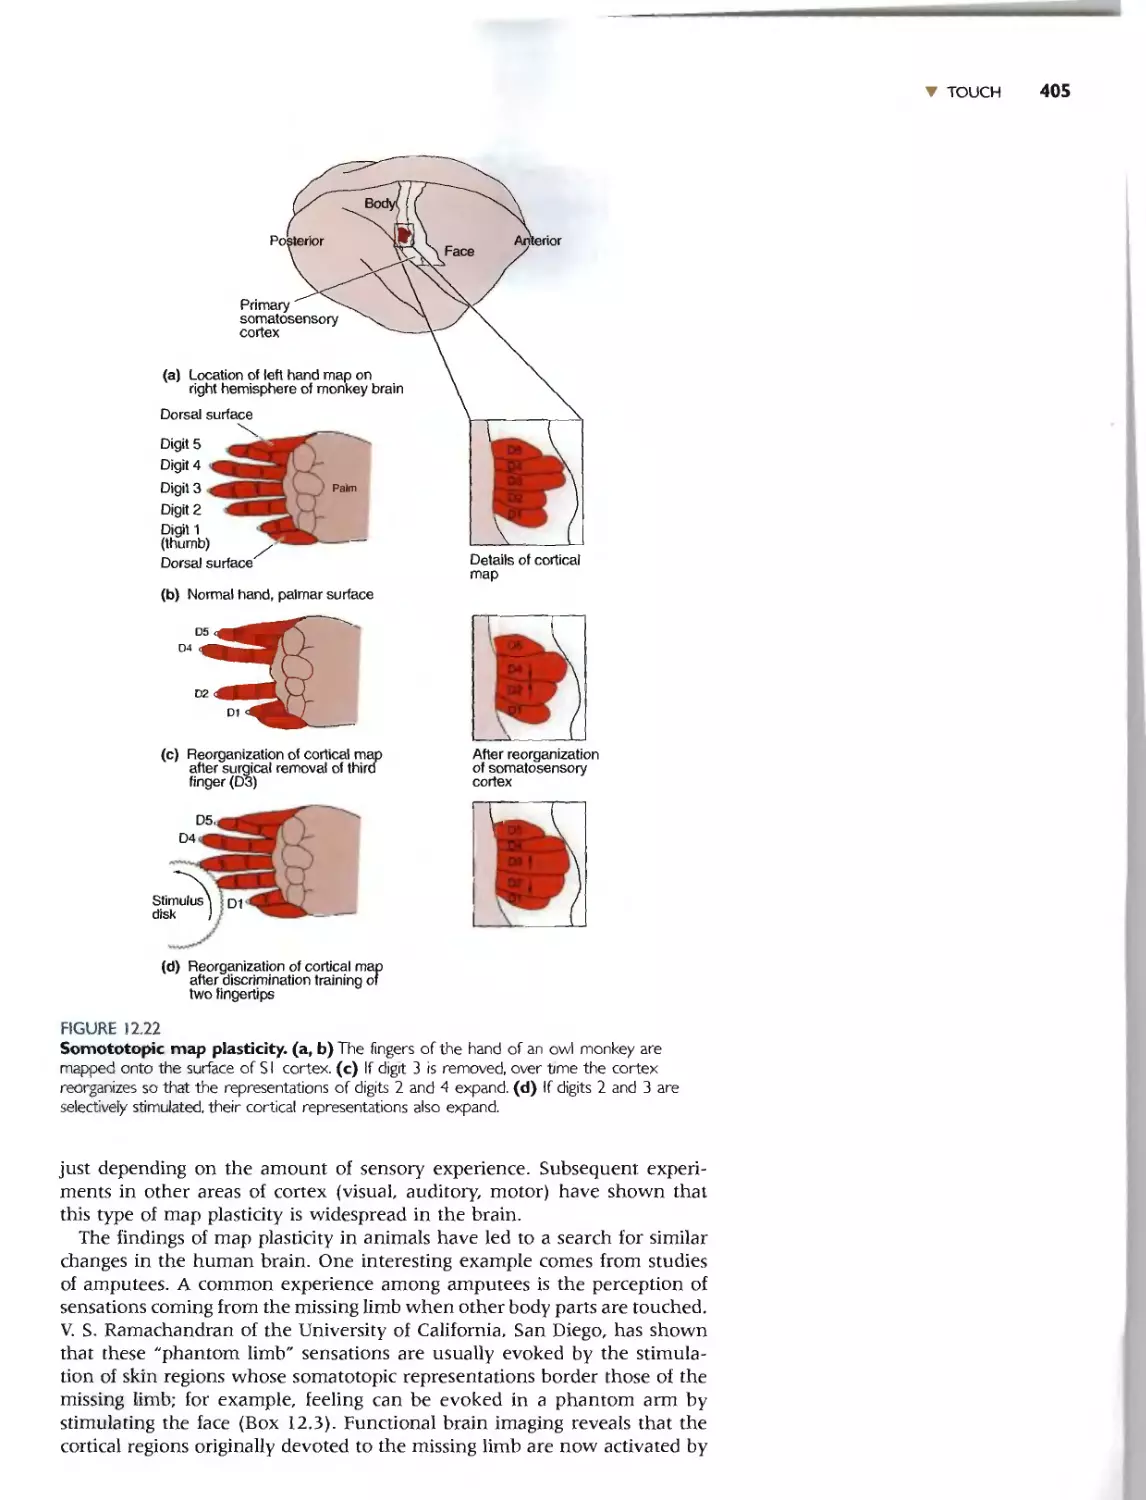
Cortical Map Plasticity 404
. Box 12.3 Path of Discovery: When Brain Maps
Collide, by Vilayanur S. Ramachandran 406
The Posterior Parietal Cortex 407
PAIN 408
. Box 12.4 Of Special Interest: The Misery of Life
Without Pain 409
NOCICEPTORS AND THE TRANSDUCTION OF
PAINFUL STIMULI 408
Types of Nociceptors 409
. Box 12.5 Of Speciallmeresl: Hot and Spicy 410
Hyperalgesia 41 0
PRIMARY AFFERENTS AND SPINAL MECHANISMS 412
ASCENDING PAIN PATHWAYS 413
The Spinothalamic Pain Pathway 41 3
The Trigeminal Pain Pathway 415
The Thalamus and Cortex 415
THE REGULATION OF PAIN 415
Afferent Regulation 41 6
Descending Regulation 416
The Endogenous Opiates 41 7
. Box 12.6 Of Speciallmerest: The Placebo
Effect 418
TEMPERATURE 418
THERMORECEPTORS 418
THE TEMPERATURE PATHWAY 420
CONCLUDING REMARKS 421
Chapte r I 3
Spinal Control of Movement 423
INTRODUCTION 424
THE SOMATIC MOTOR SYSTEM 424
THE LOWER MOTOR NEURON 426
THE SEGMENTAL ORGANIZATION OF LOWER
MOTOR NEURONS 426
ALPHA MOTOR NEURONS 428
" EXPANDED CONTENTS xxix
Graded Control of Muscle Contraction by Alpha Motor
Neurons 428
Inputs to Alpha Motor Neurons 430
TYPES OF MOTOR UNITS 430
Neuromuscular Matchmaking 431
. Box 13.1 Of Special Interest: Amyotrophic Lateral
Sclerosis 432
EXCITATION-CONTRACTION COUPLING 432
MUSCLE FIBER STRUCTURE 433
THE MOLECULAR BASIS OF MUSCLE
CONTRACTION 434
. Box 13.2 Of Special/merest: Duchenne Muscular
Dystrophy 437
SPINAL CONTROL OF MOTOR UNITS 437
. Box 13.3 Of Special/merest: Myasthenia
Gravis 438
. Box 13.4 Path of Discovery: Finding the
Cause of Myasthenia Gravis,
by Jon M. Lindstrom 442
PROPRIOCEPTION FROM MUSCLE SPINDLES 438
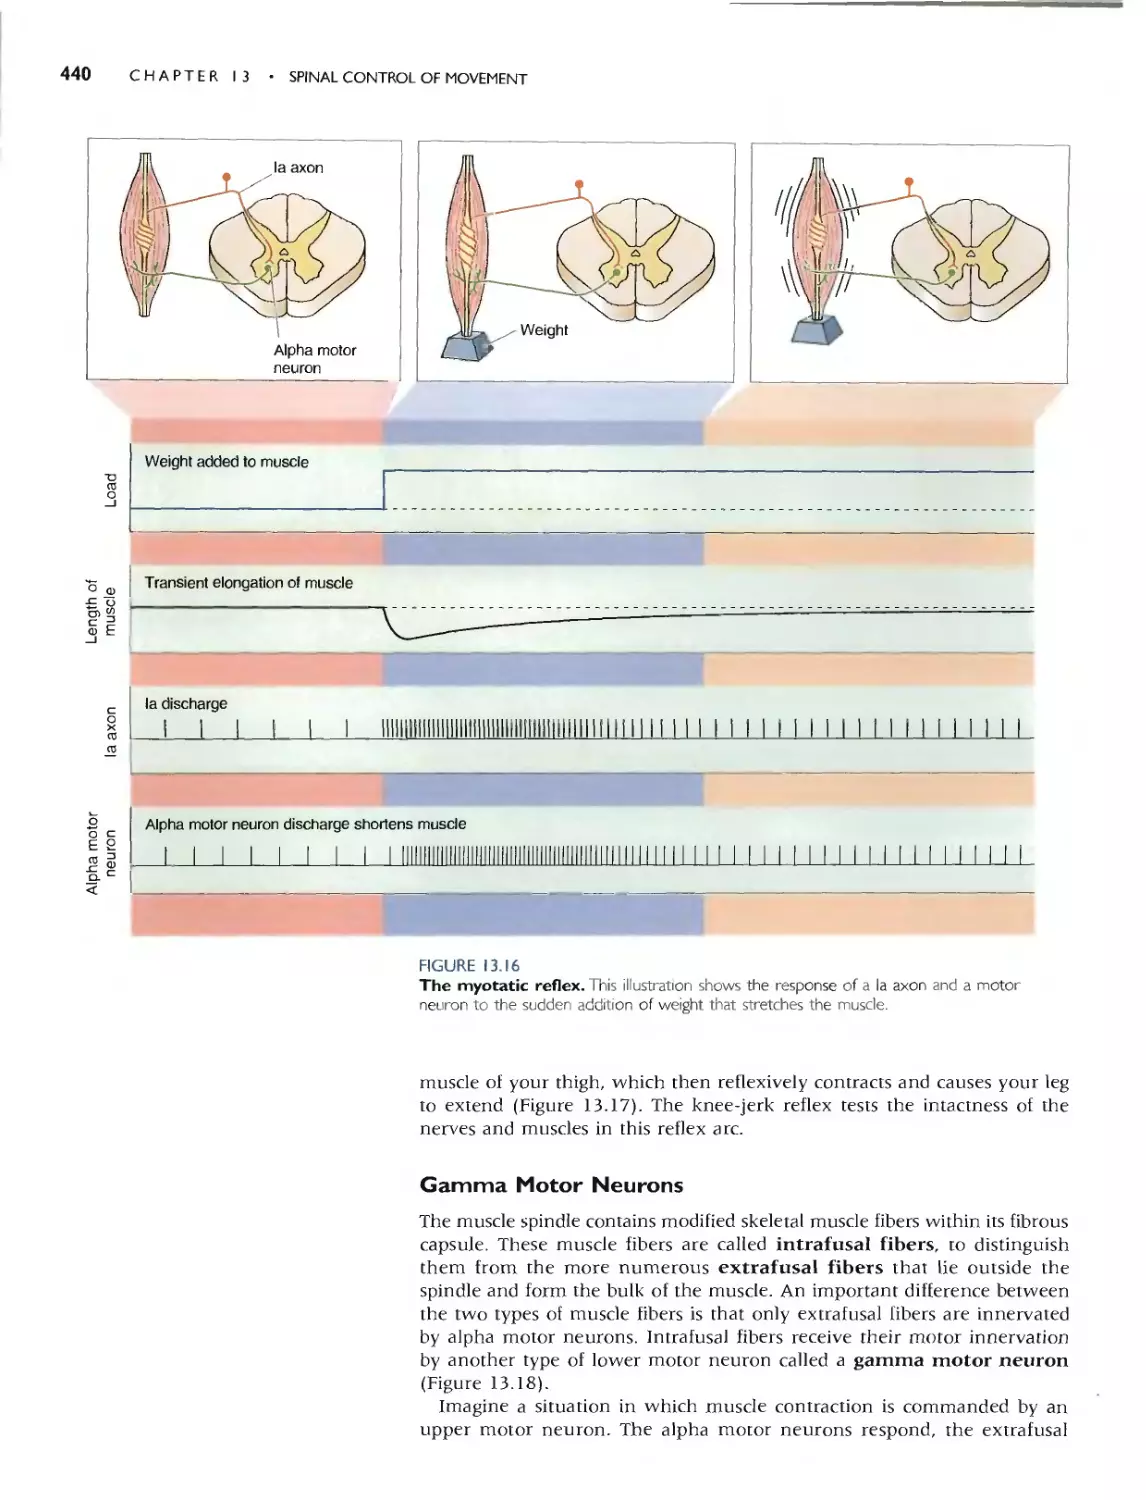
The Myotatic Reflex 439
GAMMA MOTOR NEURONS 440
PROPRIOCEPTION FROM GOLGI TENDON
ORGANS 443
Proprioception from the Joints 444
SPINAL INTERNEURONS 444
Inhibitory Input 445
Excitatory Input 445
THE GENERATION OF SPINAL MOTOR PROGRAMS
FOR WALKING 447
CONCLUDING REMARKS 449
hapter 14
Brain Control of Movement 451
INTRODUCTION 452
DESCENDING SPINAL TRACTS 453
THE LATERAL PATHWAYS 454
The Effects of Lateral Pathway Lesions 454
. Box 14. I Of Special/nterest: Paresis, Paralysis,
Spasticity, and Babinski 456
THE VENTROMEDIAL PATHWAYS 455
The Vestibulospinal Trocts 456
The TectosPinal Tract 457
The Pontine and Medullary ReticulospinalTracts 457
THE PLANNING OF MOVEMENT BYTHE CEREBRAL
CORTEX 459
MOTOR CORTEX 459
xxx EXPANDED CONTENTS
THE CONTRIBUTIONS OF POSTERIOR PARIETAL AND
PREFRONTAL CORTEX 461
NEURONAL CORRELATES OF MOTOR
PLANNING 462
. Box 14.2 Of Special/nterest: Behavioral
Neurophysiology 462
THE BASAL GANGLIA 464
ANATOMY OFTHE BASAL GANGLIA 464
THE MOTOR LOOP 466
Basal Ganglia Disorders 466
. Box 14.3 Of Special/merest: Do Neurons in
Diseased Basal Ganglia Commit Suicide? 468
THE INITIATION OF MOVEMENT BY PRIMARY MOTOR
CORTEX 468
THE INPUT-OUTPUT ORGANIZATION OF M I 469
THE CODING OF MOVEMENT IN M I 470
The Malleable Motor Map 472
. Box 14.4 Path of Discovery: Neurotechnology:
Merging Mind and Machines, by John P.
Donoghue 473
THE CEREBELLUM 472
. Box 14.5 Of Special/nterest: Involuntary
Movements, Normal and Abnormal 475
ANATOMY OF THE CEREBELLUM 474
THE MOTOR LOOP THROUGH THE LATERAL
CEREBELLUM 476
Programming the Cerebellum 477
CONCLUDING REMARKS 477
Part III The Brain and Behavior 479
Chapter 15
Chemical Control of the Brain and
Behavior 481
INTRODUCTION 482
THE SECRETORY HYPOTHALAMUS 484
AN OVERVIEW OF THE HYPOTHALAMUS 484
Homeostasis 484
Structure and Connections of the Hypothalamus 484
PATHWAYS TO THE PITUITARY 485
Hypothalamic Control of the Posterior Pituitary 485
Hypothalamic Control of the Anterior Pituitary 487
. Box 15.1 Of Special/merest: Stress and the
Brain 491
THE AUTONOMIC NERVOUS SYSTEM 490
ANS CIRCUITS 491
Sympathetic and Parasympathetic Divisions 492
The Enteric Division 495
Central Control of the ANS 496
NEUROTRANSMITTERS AND THE PHARMACOLOGY
OF AUTONOMIC FUNCTION 496
Preganglionic Neurotransmitters 496
Postganglionic Neurotransmitters 497
THE DIFFUSE MODULATORY SYSTEMS OFTHE
BRAIN 498
ANATOMY AND FUNCTIONS OFTHE DIFFUSE
MODULATORY SYSTEMS 498
. Box 15.2 Of Special/merest: You Eat What You
Are 499
The Noradrenergic Locus Coeruleus 498
The Serotonergic Raphe Nudei 50 I
The Dopaminergic Substantia Nigra and Ventral Tegmental
Area 50 I
. Box 15.3 Path of Discovery.- Awakening to
Dopamine, by Arvid Carlsson 502
The Cholinergic Basal Forebrain and Brain Stem
Camplexes 503
DRUGS AND THE DIFFUSE MODULATORY
SYSTEMS 504
Hallucinogens 505
Stimulants 505
CONCLUDiNG REMARKS 507
C hapt er 16
Motivation 509
INTRODUCTION 510
THE HYPOTHALAMUS. HOMEOSTASIS.AND MOTIVATED
BEHAVIOR 510
THE LONG-TERM REGULATION OF FEEDING
BEHAVIOR 511
ENERGY BALANCE 511
HORMONAL AND HYPOTHALAMIC REGULATION OF
BODY FAT AND FEEDING 512
Body Fat and Food Consumption 512
. Box 16.1 Of Special/nterest: The Starving Brains
of the Obese 514
The Hypothalamus and Feeding 5 14
The Effects of Bevated Leptin Levels on the
Hypothalamus 5 15
The Effects of Decreased Leptin Levels on the
Hypothalamus 516
The Control of Feeding by Lateral Hypothalamic
Peptides 5 18
THE SHORT-TERM REGULATION OF FEEDING
BEHAVIOR 519
APPETITE, EATING, DIGESTION,AND SATIETY 519
Gastric Distension 520
Cholecystokinin 521
Insulin 521
. Box 16.2 Of Speciall11terest: Diabetes Me1Jitus
and Insulin Shock 521
WHY DO WE EAT? 522
REINFORCEMENT AND REWARD 522
. Box 16.3 Of Speciallnterest: Self-Stimulation of
the Human Brain 524
THE ROLE OF DOPAMINE IN MOTIVATION 523
. Box 16.4 Path of Discovery: Just Rewards, by
Kent C. Berridge 525
. Box 16.5 Of Speciallnterest: Dopamine and
Addiction 526
SEROTONIN, FOOD,AND MOOD 524
OTHER MOTIVATED BEHAVIORS 527
DRINKING 527
TEMPERATURE REGULATION 529
CONCLUDING REMARKS 530
Chapter 17
Sex and the Brain 533
INTRODUCTION 534
SEX AND GENDER 534
THE GENETICS OF SEX 535
SEXUAL DEVELOPMENT AND
DIFFERENTIATION 536
THE HORMONAL CONTROL OF SEX 537
THE PRINCIPAL MALE AND FEMALE
HORMONES 538
THE CONTROL OF SEX HORMONES BY THE
PITUITARY AND HYPOTHALAMUS 539
THE NEURAL BASIS OF SEXUAL BEHAVIORS 541
REPRODUCTIVE ORGANS AND THEIR
CONTROL 541
MAMMALIAN MATING STRATEGIES 543
THE NEUROCHEMISTRY OF REPRODUCTIVE
BEHAVIOR 544
WHY AND HOW MALE AND FEMALE BRAINS
DIFFER 546
SEXUAL DIMORPHISMS OF THE CENTRAL NERVOUS
SYSTEM 546
SEXUAL DIMORPHISMS OF COGNITION 548
SEX HORMONES,THE BRAIN,AND BEHAVIOR 549
. Box 17.1 Of Speciallnterest: Bird Songs and Bird
Brains 552
... EXPANDED CONTENTS xxxi
Mismatches Between Genetic Sex and Hormone Action 551
. Box 17.2 Of Speciallllterest: John/Joan and the
Basis of Gender Identity 554
Direct Genetic Effects on Sexual Differentiation of the
Brain 553
THE ACTIVATIONAL EFFECTS OF SEX
HORMONES 555
Brain Plasticity and Maternal Behavior 555
Estrogens, Neurite Growth, and Disease 556
. Box 17.3 Path of Discovery: Estrogen and
Synapses in the Hippocampus, by Catherine
Woolley 558
SEXUAL ORIENTATION 559
CONCLUDING REMARKS 560
Chapter 18
Brain Mechanisms of Emotion 563
INTRODUCTION 564
WHAT IS EMOTION? 564
THEORIES OF EMOTION 564
The james-Lange Theory 564
The Cannon-Bard Theory 565
Unconscious Emotions 567
THE LIMBIC SYSTEM CONCEPT 568
BROCA'S LIMBIC LOBE 568
THE PAPEZ CIRCUIT 568
. Box 18.1 Of Speciallnterest: Phineas
Gage 570
DIFFICULTIES WITH THE SINGLE EMOTION SYSTEM
CONCEPT 571
THE KLUVER-BUCY SYNDROME 571
THE AMYGDALA AND ASSOCIATED BRAIN
CIRCUITS 572
ANATOMY OF THE AMYGDALA 572
THE AMYGDALA AND FEAR 573
A Neural Circuit for Learned Fear 574
. Box 18.2 Path of Discovery: Brains Through the
Back Door, by Joseph LeDoux 576
THE AMYGDALA AND AGGRESSION 576
Surgery to Reduce Human Aggression 577
. Box 18.3 Of Special lnterest: The Frontal
Lobotomy 578
NEURAL COMPONENTS OF AGGRESSION BEYOND
THE AMYGDALA 579
The Hypothalamus end A$gression 579
The Midbrain and Aggression 580
SEROTONIN AND AGGRESSION 581
xxxiv EXPANDED CONTENTS
SYNAPTIC CONVERGENCE 712
SYNAPTIC COMPETITION 713
MODULATORY INFLUENCES 714
ELEMENTARY MECHANISMS OF CORTICAL SYNAPTIC
PLASTICITY 716
EXCITATORY SYNAPTIC TRANSMISSION IN THE
IMMATURE VISUAL SYSTEM 717
LONG-TERM SYNAPTIC POTENTIATION 718
LONG-TERM SYNAPTIC DEPRESSION 718
WHY CRITICAL PERIODS END 720
CONCLUDING REMARKS 722
Chapte r 24
Memory Systems 725
INTRODUCTION 726
TYPES OF MEMORY AND AMNESIA 726
DECLARATIVE AND NON DECLARATIVE
MEMORY 726
. Box 24.1 Of Special [merest: An Extraordinary
Memory 728
LONG-TERM, SHORT- TERM,AND WORKING
MEMORY 727
AMNESIA 729
. Box 24.2 Of Special Interest: A Fish Tale of
Memory Loss 731
THE SEARCH FOR THE ENGRAM 731
LASHLEY'S STUDIES OF MAZE LEARNING IN
RATS 731
HEBB AND THE CELL ASSEMBLY 733
. Box 24.3 Brain Food: A Model of a Distributed
Memory 736
LOCALIZATION OF DECLARATIVE MEMORIES IN THE
NEOCORTEX 733
Studies in Monkeys 733
Studies in Humans 735
ELECTRICAL STIMULATION OF THE HUMAN
TEMPORAL LOBES 737
THE TEMPORAL LOBES AND DECLARATIVE
MEMORY 738
THE EFFECTS OF TEMPORAL LOBECTOMY 738
A Human Case Study: H.M. 738
THE MEDIAL TEMPORAL LOBES AND MEMORY
PROCESSING 740
An Animal Model of Human Amnesia 741
THE DIENCEPHALON AND MEMORY
PROCESSING 743
A Human Case Study: N.A. 743
Korsakoff's Syndrome 744
MEMORY FUNCTIONS OFTHE HIPPOCAMPUS 744
The Effects of Hippocampal Lesions in Rats 745
Spatial Memory and Place Cells 746
. Box 24.4 Path of Discovery: A Brief History of the
Water Maze, by Richard Morris 747
Spatial Memory, Working Memory, and Relational
Memory 749
THE STRIATUM AND PROCEDURAL MEMORY 751
RODENT RECORDINGS AND LESIONS IN THE
STRIATUM 751
HABIT LEARNING IN HUMANS AND NONHUMAN
PRIMATES 752
THE NEOCORTEX AND WORKING MEMORY 754
THE PREFRONTAL CORTEX AND WORKING
MEMORY 754
Imaging Working Memory in the Human Brain 756
AREA LIP AND WORKING MEMORY 757
CONCLUDING REMARKS 758
Chapter 2S
Molecular Mechanisms of Learning
and Memory 761
iNTRODUCTION 762
PROCEDURAL LEARNING 763
NONASSOCIATIVE LEARNING 763
Habituation 763
Sensitization 763
ASSOCIATIVE LEARNING 763
Classical Conditioning 763
Instrumental Conditioning 764
SIMPLE SYSTEMS: INVERTEBRATE MODELS OF
LEARNING 765
NONASSOCIATIVE LEARNING IN APLYSIA 765
Habituation of the Gill-Withdrawal Reflex 766
Sensitization of the Gill-Withdrawal Reflex 767
ASSOCIATIVE LEARNING IN APLYSIA 768
VERTEBRATE MODELS OF LEARNING 772
SYNAPTIC PLASTICITY IN THE CEREBELLAR
CORTEX 772
Anatomy of the Cerebellar Cortex 772
Long- Term Depression in the Cerebellar Cortex 774
Mechanisms of Cerebellar LTD 775
SYNAPTIC PLASTICITY IN THE HIPPOCAMPUS 776
Anatomy of the Hippocampus 777
Properties of LTP in CA I 778
Mechanisms of LTP in CA I 779
. Box 25.1 Brain Food." Synaptic Plasticity: Timing
Is Everything 782
Long- Term Depression in CA I 781
LTp, LTD, and Glutamate Receptor Trafficking 783
LTp, LTD, and Memory 784
. Box 25.2 Of Special Interest: Memory
Mutants 786
THE MOLECULAR BASIS OF LONG-TERM
MEMORY 787
... EXPANDED CONTENTS xxxv
PERSISTENTLY ACTIVE PROTEIN KINASES 787
CaMKI/ and LTP 787
. Box 25.3 Path of Discovery: A Memorable Walk
on the Beach, by John E. Lisman 789
PROTEIN SYNTHESIS 788
Protein Synthesis and Memory Consolidation 788
CREB and Memory 790
Structural Plasticity and Memory 791
CONCLUDING REMARKS 792
List of Boxes
( ) Brain Food
Expressing One's Mind in the Post-Genomic Era 32
A Review of Moles and Molarity 60
The Nernst Equation 65
The Goldman Equation 68
Methods of Recording Action Potentials 78
The Patch-Clamp Method 88
SNARE a Vesicle, and Release Its Transmitter 116
Reversal Potentials 120
Pumping Ions and Transmitters 144
Magnetic Resonance Imaging 177
Functional Imaging of Brain Activity: PET and
fMRI 178
Optical Imaging of Neural Activity 328
Lateral Inhibition 399
Ocular Dominance Columns and Other Oddities 711
The Critical Period Concept 715
A Model of a Distributed Memory 736
Synaptic Plasticity: Timing Is Everything 782
M Of Special Interest
Advances in Microscopy 28
Alzheimer's Disease and the Neuronal
Cytoskeleton 36
Hitching a Ride With Retrograde Transport 42
Mental Retardation and Dendritic Spines 43
Death by Lethal Injection 72
Local Anesthesia 95
Multiple Sclerosis, a Demyelinating Disease 96
The Eclectic Electric Behavior of Neurons 99
Otto Loewi and Vagusstoff 103
Bacteria, Spiders, Snakes, and You 121
Startling Mutations and Poisons 127
This Is Your Brain on Endocannabinoids 149
The Brain's Exciting Poisons 156
Water on the Brain 175
Nutrition and the Neural Tube 182
Memories of a Very Bad Meal 262
Human Pheromones? 264
Demonstrating the Blind Regions of Your Eye 282
Eye Disorders 285
Vision Correction 286
The Genetics of Color Vision 297
David and Goliath 315
The Magic of Seeing in 3D 338
Ultrasound and Infrasound 346
The Deaf Shall Hear: Cochlear Implants 356
Noisy Ears: Otoacoustic Emissions 362
How Does Auditory Cortex Work? Consult a
Specialist 374
Auditory Disorders and Their Treatments 376
Herpes, Shingles, and Dermatomes 396
The Misery of Life Without Pain 409
Hot and Spicy 410
The Placebo Effect 418
Amyotrophic Lateral Sclerosis 432
Duchenne Muscular Dystrophy 437
Myasthenia Gravis 438
Paresis, Paralysis, Spasticity, and Babinski 456
xxxvii
xxxviii
LIST OF BOXES
Behavioral Neurophysiology 462
Do Neurons in Diseased Basal Ganglia Commit
Suicide? 468
Involuntary Movements, Normal and Abnormal 475
Stress and the Brain 49 I
You Eat What You Are 499
The Starving Brains of the Obese 5 14
Diabetes Mellitus and Insulin Shock 521
Self-Stimulation of the Human Brain 524
Dopamine and Addiction 526
Bird Songs and Bird Brains 552
John/Joan and the Basis of Gender Identity 554
Phineas Gage 570
The Frontal Lobotomy 578
Walking, Talking, and Screaming in Your Sleep 599
The Longest All-Nighter 600
Narcolepsy 605
Mutant Hamster Clocks 613
Is Language Unique to Humans? 619
The Wada Procedure 621
Hearing Sight and Seeing Touch 636
The Search for Language Genes 640
Attention-Deficit Hyperactivity Disorder 644
Agoraphobia with Panic Attacks 667
A Magical Orange Grove in a Nightmare 675
Neurogenesis in the Adult Neocortex 693
Why Our CNS Axons Don't Regenerate 705
The Mystery of Autism 706
An Extraordinary Memory 728
A Fish Tale of Memory Loss 731
Memory Mutants 786
IAI Path of Discovery
Spines and the Structural Basis of Memory,
by William Greenough 44
The Atomic Structure of a Potassium Channel.
by Roderick MacKinnon 70
Tetrodotoxin and the Dawn of Ion Channel
Pharmacology, by Toshio Narahashi 90
Electrical Synapses, by Michael V L. Bennett 108
Deciphering the Language of Neurons,
by Roger A. Nicoll 150
Evolution of My Brain, by Leah A. Krubiczer 200
A Journey Through the Senses,
by Charles S. Zuker 261
A Glimpse into the Retina, by John Dowling 301
Vision and Art. by Margaret Livingstone 331
From Sound to Sensation, by David P Corey 360
When Brain Maps Collide, by
Vilayanur S. Ramachandran 406
Finding the Cause of Myasthenia Gravis,
by Jon M. Lindstrom 442
Neurotechnology: Merging Mind and Machines,
by John P. Donoghue 473
Awakening to Dopamine, by Arvid Carlsson 502
Just Rewards, by Kent C. Berridge 525
Estrogen and Synapses in the Hippocampus,
by Catherine Woolley 558
Brains Through the Back Door,
by Joseph LeDoux 576
Strange Vision, by David Berson 614
The Origins of Language: A Tale of Two Species,
by Patricia Kuhl 639
Finding Neuronal Correlates of Attention,
by Robert Wurtz 653
Neuroscience, Genes, and Mental Illness,
by Steven E. Hyman 664
All Roads Lead to Netrin,
by Marc Tessier-Lavigne 70]
A Brief History of the Water Maze,
by Richard Morris 747
A Memorable Walk on the Beach,
by John E. Lisman 789
PART I
FOUNDATIONS
Neuroscience:
Past, Present, and Future
INTRODUCTION
THE ORIGINS OF NEUROSCIENCE
VIEWS OF THE BRAIN IN ANCIENT GREECE
VIEWS OF THE BRAIN DURING THE ROMAN EMPIRE
VIEWS OF THE BRAIN FROM THE RENAISSANCE TO THE NINETEENTH CENTURY
NINETEENTH-CENTURY VIEWS OF THE BRAIN
Nerves As Wires
Localization of Specific Functions to Different Parts of the Brain
The Evolution of Nervous Systems
The Neuron: The Basic Functional Unit of the Brain
NEUROSCIENCE TODAY
LEVELS OF ANALYSIS
Molecular Neuroscience
Cellular Neuroscience
Systems Neuroscience
Behavioral Neuroscience
Cognitive Neuroscience
NEUROSCIENTISTS
THE SCIENTIFIC PROCESS
Observation
Replication
Interpretation
Verification
THE USE OF ANIMALS IN NEUROSCIENCE RESEARCH
The Animals
Animal Welfare
Animal Rights
THE COST OF IGNORANCE: NERVOUS SYSTEM DISORDERS
CONCLUDING REMARKS
CHAPTER
"
4 C HAP T E R I . NEUROSCIENCE: PAST, PRESENT, AND FUTURE
"r
......
(......
FIGURE 1.1
Evidence of prehistoric brain surgery.
This skull of a man over 7000 years old was
surgically opened while he was still alive. The
anrows Indicate two sites of trepanation.
(Source: Alt et al.. 1997, Fig. I a.)
.... INTRODUCTION
Men ought to know that from nothing else but the brain come joys, delights, laughter
and sports, and sorrows, griefs, despondency, and lamentations. And by this, in an
especial manner, we acquire wisdom and knowledge. and see and hear and know
what are foul and what are fair, what are bad and what are good, what are sweet
and what are unsavory. . . . And by the same organ we become mad and delirious,
and fears and terrors assail us . . . . All these things we endure from the brain when
iT is not healthy. . . . In these ways I am of the opinion that the brain exercises the
greatest power in the man.
-Hippocrates. On/he Sacred DIsease (Fourth century B.C.)
It is human nature to be curious about how we see and hear; why
some things feel good and others hurt; how we move; how we reason,
learn, remember, and forget; the nature of anger and madness. These mys-
teries are starting to be unraveled by basic neuroscience research, and the
conclusions of this research are the subject of this textbook.
The word "neuroscience" is young. The Society for Neuroscience, an
association of professional neuroscientists, was founded as recently as 1970.
The study of the brain, however, is as old as science itself. Historically, the
scientists who devoted themselves to an understanding of the nervous system
came from different scientific disciplines: medicine, biology, psychology,
physics, chemistry, mathematics. The neuroscience revolution occurred
when these scientists realized that the best hope for understanding the
workings of the brain comes from an interdisciplinary approach, a combina-
tion of traditional approaches to yield a new synthesis, a new perspective.
Most people involved in the scientific investigation of the nervous system
today regard themselves as neuroscientists. Indeed, while the course you are
now taking may be sponsored by the psychology or biology department at
your university or college and may be called biopsychology or neurobiology,
you can bet that your instructor is a neuroscientist.
The Society for Neuroscience is the largest and fastest-growing associa-
tion of professional scientists in a1l of experimental biology. Far from being
overly specialized, the field is as broad as nearly all of natural science, with
the nervous system serving as the common point of focus. Understanding
how the brain works requires knowledge about many things, from the
structure of the water molecule to the electrical and chemical properties of
the brain to why Pavlov's dog salivated when a bell rang. In this book, we
will explore the brain with this broad perspective.
We begin the adventure with a brief tour of neuroscience. What have sci-
entists thought about the brain over the ages? Who are the neuroscientists
of today, and how do they approach studying the brain?
.... THE ORIGINS OF NEUROSCIENCE
You probably already know that the nervous system-the brain, spinal
cord, and nerves of the body- -is crucial for life and enables you to sense,
move, and think. How did this view arise?
Evidence suggests that even our prehistoric ancestors appreciated that
the brain was vital to life. The archeological record is rife with examples of
hominid skulls, dating back a million years and more, bearing signs of fatal
cranial damage, presumably inflicted by other hominids. As early as 7000
years ago, people were boring holes in each other's skulls (a process called
trepanation), evidently with the aim not to kill but to cure (Figure 1.1).
The skulls show signs of healing after the operation, indicating that this
procedure was carried out on live subjects and was not merely a ritual
conducted after death. Some individuals apparently survived multiple skull
surgeries. What early surgeons hoped to accomplish is nor clear, although
some have speculated that this procedure may have been used to treat
headaches or mental disorders, perhaps by giving the evil spirits an escape
route.
Recovered writings from the physicians of ancient Egypt, dating back
almost 5000 years, indicate that they were well aware of many symptoms
of brain damage. However, it is also very clear that the heart, not the
brain, was considered to be the seat of the soul and the repository of
memories. Indeed, while the rest of the body was carefully preserved for
the afterlife, the brain of the deceased was simply scooped out through
the nostrils and discarded! The view that the heart was the seat of con-
sciousness and thought was not seriously challenged until the time of
Hippocrates.
Views of the Brain in Ancient Greece
Consider the notion that the different parts of your body look different
because they serve different purposes. The structures of the feet and hands
are very different, and they perform very different functions: We walk on
our feet and manipulate objects with our hands. Thus, we can say that
there appears to be a very clear correlation between structure and function.
Differences in appearance predict differences in function.
What can we glean about function from the structure of the head?
Quick inspection and a few simple experiments (like closing your eyes)
reveal that the head is specialized for sensing the environment. In the
head are your eyes and ears, your nose and tongue. Even crude dissec-
tion shows that the nerves from these organs can be traced through the
skull into the brain. What would you conclude about the brain from these
observa tions?
If your answer is that the brain is the organ of sensation, then you have
reached the same conclusion as several Greek scholars of the fourth cen-
tury B.C. The most influential scholar was Hippocrates (460-379 B.C.), the
father of Western medicine, who stated his belief that the brain not only
was involved in sensation but also was the seat of intelligence.
However, this view was not universally accepted. The famous Greek
philosopher Aristotle (384-322 B.C.) clung to the belief that the heart was
the center of intellect. What function did Aristotle reserve for the brain? He
proposed it to be a radiator for the cooling of blood that was overheated by
the seething heart. The rational temperament of humans was thus explained
by the large cooling capacity of our brain.
Views of the Brain During the Roman Empire
The most important figure in Roman medicine was the Greek physician and
writer Galen (130-200 A.D.), who embraced the Hippocratic view of brain
function. As physician to the gladiators, he must have witnessed the unfor-
tunate consequences of spinal and brain injury. However, Galen's opinions
about the brain probably were influenced more by his many careful animal
dissections. Figure 1.2 is a drawing of the brain of a sheep, one of Galen's
favorite subjects. Two major parts are evident: the cerebrum in the front and
the cerebellum in the back. (The structure of the brain is the subject of
Chapter 7.) Just as we were able to deduce (unction from the structure of
"f' THE ORIGINS OF NEUROSCIENCE 5
Cerebrum
\
\' CT""m
1 em
f------1
""
Side view
- -
..
-
Top view
FIGURE 1.2
The brain of a sheep. Notice the location
and appearance of the cerebrum and the
cerebellum.
6 C HAP T E R I . NEUROSCIENCE: PAST, PRESENT, AND FUTURE
Ventricles
\
FIGURE 1.3
A dissected sheep brain showing the
ventricles.
the hands and feet. Galen tried to deduce function From the structure of the
cerebrum and the cerebeJlum. Poking the Freshly dissected brain with a
finger reveals the cerebellum to be rather hard and the cerebrum to be
rather soft. From this observation, Galen suggested that the cerebrum must
be the recipient of sensations and the cerebellum must command the
muscles. Why did he propose this distinction? He recognized that to form
memories, sensations must be imprinted onto the brain. Naturally, this
must occur in the doughy cerebrum.
As improbable as his reasoning may seem, Galen's deductions were not
that far [rom the truth. The cerebrum. in fact. is largely concerned with
sensation and perception, and the cerebellum is primarily a movement con-
trol center. Moreover, the cerebrum is a repository of memory. We will see
that this is not the only example in the history of neuroscience in which
the right general conclusions were reached for the wrong reasons.
How does the brain receive sensations and move the limbs? Galen cut
open the brain and found that it is hollow (Figure 1.3). In these hollow
spaces, called ventricles (like the similar chambers in the hean). there is
fluid. To Galen, this discovery fit perfectly with the prevailing theory that
the body functioned according to a balance of four vital fluids, or humors.
Sensations were registered and movements initiated by the movement of
humors to or from the brain ventricles via the nerves, which were believed
to be hollow tubes, like the blood vessels.
Views of the Brain From the Renaissance
to the Nineteenth Century
Galen's view of the brain prevailed for almost 1500 years. More detail was
added to the structure of the brain by the great anatomist Andreas Vesal-
ius (1514-1564) during the Renaissance (Figure 1.4). However. ventricular
localization of brain function remained essentially unchallenged. Indeed,
the whole concept was strengthened in the early seventeenth century,
when French inventors began developing hydraulically controlled me-
chanical devices. These devices supported the notion that the brain could
be machinelike in its function: Fluid forced out of the ventricles through
the nerves might literally "pump you up" and cause the movement of the
limbs. AFter all, don't the muscles bulge when they contract?
FIGURE 1.4
Human brain ventricles depicted
during the Renaissance. This drawing is
from De humani corporis fabnco by Vesalius
(/543). The subject was probably a decapitated
criminal. Great care was taken to be anatomi-
cally correct in depiding the ventricles.
(Source: Finger. 1994, Fig. 2.8.)
,\.
L.
'.
t.. .'. .
, \:.{.:i. " ..
<
,,') ,
FIGURE 1.5
The brain according to Descartes.
This drawing appeared In a I 662 publication
by Descartes. Hollow nerves from the eyes
project to the brain ventricles. The mind influ-
ences the motor response by controlling the
pineal gland (H). which works like a valve to
control the movement of animal spirits
through the nerves that Inflate the muscles.
(Source: Finger. 1994, Fig. 2. 16.)
A chief advocate of this fluid-mechanical theory of brain function was
the French mathematician and philosopher Rene Descartes (1596-1650).
Although he thought this theory could explain the brain and behavior of
other animals, it was inconceivable to Descartes that it could account for
the full range of human behavior. He reasoned that unlike other animals,
people possess intellect and a God-given soul. Thus, Descartes proposed
that brain mechanisms control human behavior only to the extent that
this behavior resembles that of the beasts. Uniquely human mental capa-
bilities exist outside the brain in the "mind." Descartes believed that the
mind is a spiritual entity that receives sensations and commands move-
ments by communicating with the machinery of the brain via the pineal
gland (Figure 1.5). Today, some people still believe that there is a "mind-
brain problem," that somehow the human mind is distinct from the brain.
However, as we shall see in Part Ill, modern neuroscience research sup-
ports another conclusion: The mind has a physical basis, which is the
brain.
Fortunately, other scientists during the seventeenth and eighteenth cen-
turies broke away from Galen's tradition of focusing on the ventricles and
began to give the substance of the brain a closer look. One of their obser-
vations was that brain tissue is divided into two parts: the gray matter and
the white matter (Figure 1.6). What structure-function relationship did they
propose? White matter, because it was continuous with the nerves of the
body, was correctly believed to contain the fibers that bring information to
and from the gray matter.
By the end of the eighteenth century, the nervous system had been
completely dissected, and its gross anatomy had been described in detail.
Scientists recognized that the nervous system has a central division, con-
sisting of the brain and spinal cord, and a peripheral division, consisting of
the network of nerves that course through the body (Figure 1.7). An im-
portant breakthrough in neuroanatomy was the observation that the same
general pattern of bumps (called gyri) and grooves (called sulci and fissures)
could be identified on the surface of the brain in every individual (Figure
1.8). This pattern, which enables the parceling of the cerebrum into lobes,
was the basis for speculation that different functions might be localized to
the different bumps on the brain. The stage was now set for the era of
cerebral localization.
.. THE ORIGINS OF NEUROSCIENCE 7
r;--
;t \ I,)
Gray matter
\
..... '-r
\(
)
{
(I{ .:S=" ._
f \: --
. -=-
---
.....,
). WhO. mm'.'
I
'---'
y,
FIGURE 1.6
White matter and gray matter.
The brain has been cut open to reveal these
two types of tissue.
8 C HAP T E R I . NEUROSCIENCE: PAST. PRESENT. AND FUTURE
FIGURE 1.7
The basic anatomical subdivisions of the nervous system.
The nervous system consists of two divisions, the central nervous
system (CNS) and the peripheral nervous system (PNS) The CNS
consists of the brain and spinal cord. The three major parts of
the brain are the cerebrum, the cerebellum, and the brain stem.
The PNS consists of the nerves and nerve cells that lie outside the
brain and spinal cord.
Frontal
lobe
Central
sulcus
\
\"
-'
=
---2::-
Parietal
lobe
/
/
,)
= ,o 1
Temporal lobe
\..
Occipital
lobe
I
\
( t _
., --
."' '--
.... ,
Cerebellum
FIGURE 1.8
The lobes of the cerebrum. Notice the
deep Sylvian fissure, dividing the frontal lobe
from the temporal lobe, and the central
sulcus, dividing the frontal lobe from the
parietal lobe. The occipital lobe lies at the
back of the brain. These landmarks can be
found on all human brains.
/
Cerebrum }
. Cerebellum Brain
Brain stem
Central
nervous I
system I
1 ;
!}ll/l
J) ,
if;
'.
R.t.
\-' ,
f
I,
Nineteenth-Century Views of the Brain
Let's review the state of understanding of the nervous system at the end of
the eighteenth century:
. Injury to the brain can disrupt sensations, movement, and thought and
can cause death.
. The brain communicates with the body via the nerves.
. The brain has different identifiable parts, which probably perform dif-
ferent functions.
. The brain operates like a machine and follows the laws of nature.
During the next 100 years, more would be learned about the function of
the brain than had been learned in all of previously recorded history. This
work provided the solid foundation on which modern neuroscience rests.
Below, we'll review four key insights gained during the nineteenth century.
Nerves As Wires. In 1751, Benjamin Franklin published a pamphlet titled
Experiments and Observations on Electricity, which heralded a new under-
standing of electrical phenomena. By the turn of the century, Italian scien-
tist Luigi Galvani and German biologist Emil du Bois-Reymond had shown
that muscles can be caused to twitch when nerves are stimulated electri-
cally and that the brain itself can generate electricity. These discoveries
rinally displaced the notion that nerves communicate with the brain by the
movement of fluid. The new concept was that the nerves are "wires" that
conduct electrical signals IO and from the brain.
Unresolved was whether the signals to the muscles causing movement
use the same wires as those that register sensations from the skin. Bidirec-
tional communication along the same wires was suggested by the observa-
tion that when a nerve in the body is cut, there is usually a loss of both
sensation and movement in the affected region. However, it was also known
that within each nerve of the body there are many thin filaments, or nerve
fibers, each one of which could serve as an individual wire carrying infor-
mation in a different direction.
This question was answered around 1810 by Scottish physician Charles
Bell and French physiologist Franc;ois Magendie. A curious anatomical fact
is that just before the nerves attach to the spinal cord, the fibers divide into
two branches, or roots. The dorsal root enters toward the back of the spinal
cord, and the ventral root enters toward the front (Figure 1.9). Bell tested
the possibility that these two spinal roots carry information in different
directions by cutting each root separately and observing the consequences
in experimental animals. He found that cutting only the ventral roots
caused muscle paralysis. Later, Magendie was able to show that the dorsal
roots carry sensory information into the spinal cord. Bell and Magendie
!-----
"
Spinal
:! \. cord
,' \ Ventral roots
r'
, "
/' /' - Dorsal
f 'Q " " roots
/' , "
...." Nerve
Muscle
Skin
\
' L
!
----
'
'"""
-.., k
'- Nerve fibers J--- \
(axons)
}
ft..
f-
[qi
!a:i
.;o:1Ii'
,)
Vertebra
....
.. THE ORIGINS OF NEUROSCIENCE 9
FIGURE 1.9
Spinal nerves and spinal nerve roots.
Thirty-one pairs of nerves leave the spinal
cord to supply the skin and the muscles.
Cutting a spinal nerve leads to a loss of sen-
sation and a loss of movement in the affected
region of the body. Incoming sensory fibers
(red) and outgoing motor fibers (blue) divide
Into spinal roots where the nerves attach to
the spinal cord. Bell and Magendie found that
the ventral roots contain only motor fibers
and the dorsal roots contain only sensory
fibers.
10 C HAP T E R I . NEUROSCIENCE: PAST, PRESENT. AND FUTURE
FIGURE 1.10
A phrenological map. According to Gall
and his followers, different behavioral traits
could be related to the size of different parts
of the skull. (Source: Clarke and O'Malley.
1968. Fig. I 18.)
'\
-
('" I
- I
-..J,'
,
,,-
;7"
'
I,
FIGURE 1.11
Paul Broca (1824-1880). By carefully
studying the brain of a man who had lost
the faculty of speech after a brain lesion (see
Figure 1.12), Broca became convinced that dif-
ferent functions could be localized to different
parts of the cerebrum. (Source: Clarke and
O'Malley. 1968. Fig. /21.)
concluded that within each nerve there is a mixture of many wires, some
of which bring information into the brain and spinal cord and others that
send information out to the muscles. In each sensory and motor nerve
fiber, transmission is strictly one-way. The two kinds of fibers are bundled
together for most of their length, but they are anatomically segregated
when they enter or exit the spinal cord.
Localization of Specific Functions to Different Parts of the Brain. If
difEerent functions are localized in different spinal roots, then perhaps dif-
ferent functions are also localized in different parts of the brain. In 1811,
Bell proposed that the origin of the motor fibers is the cerebellum and the
destination of the sensory fibers is the cerebrum.
How would you test this proposal? One way is to use the same approach
that Bell and Magendie employed to identify the functions of the spinal
roots: to destroy these parts of the brain and test for sensory and motor
deficits. This approach, in which parts of the brain are systematically de-
stroyed to determine their function, is called the experimental ablation method.
In 1823, the esteemed French physiologist Marie-Jean-Pierre Flourens used
this method in a variety of animals (particularly birds) to show that the
cerebellum does indeed playa role in the coordination of movement. He
also concluded that the cerebrum is involved in sensation and perception,
as Bell and Galen before him had suggested. Unlike his predecessors, how-
ever, Flourens provided solid experimental support for his conclusions.
What about all those bumps on the brain's surface? Do they perform dif-
ferent functions as well? The idea that they do was irresistible to a young
Austrian medical student named Franz Joseph Gall. Believing that bumps
on the surface of the skull reflect the bumps on the surface of the brain, Gall
proposed in 1809 that the propensity for certain personality traits, such as
generosity, secretiveness, and destructiveness, could be related to the di-
mensions of the head (Figure 1.] 0). To support his claim, Gall and his fol-
lowers collected and carefully measured the skulls of hundreds of people
representing the extensive range of personality types, from the very gifted
to the criminally insane. This new "science" of correlating the structure of
the head with personality traits was called phrenology. Although the claims
of the phrenologists were never taken seriously by the mainstream scientific
community, they did capture the popular imagination of the time. In fact, a
textbook on phrenology published in 1827 sold over 100,000 copies.
One of the most vociferous critics of phrenology was Flourens, the same
man who had shown experimentally that the cerebellum and cerebrum
perform different functions. His grounds for criticism were sound. For one
thing, the shape of the skull is nor correlated with the shape of the brain.
In addition, Flourens performed experimental ablations showing that par-
ticular traits are not isolated to the portions of the cerebrum specified by
phrenology. Flourens also maintained, however, that all regions of the cere-
brum participate equally in all cerebral functions, a conclusion that later
was shown to be erroneous.
The person usually credited with tilting the scales of scientific opinion
firmly toward localization of function in the cerebrum was French neurol-
ogist Paul Broca (Figure 1.11). Broca was presented with a patient who
could understand language but could not speak. Following the man's death
in 186 L Broca carefully examined his brain and found a lesion in the left
frontal lobe (Figure 1.12). Based on this case and several others like it.
Broca concluded that this region of the human cerebrum was specifically
responsible for the production of speech.
Solid experimental support for cerebral localization in animals quickly
followed. German physiologists Gustav Fritsch and Eduard Hitzig showed
in 1870 that applying small electrical currents to a circumscribed region of
the exposed surface of the brain of a dog could elicit discrete movements.
Scottish neurologist David Ferrier repeated these experiments with mon-
keys. In 1881, he showed that removal of this same region of the cerebrum
causes paralysis of the muscles. Similarly, German physiologist Hermann
Munk using experimental ablation presented evidence that the occipital
lobe of the cerebrum was specifically required for vision.
As you will see in Part II of this book, we now know that there is a very
clear division of labor in the cerebrum, with different parts performing
very different functions. Today's maps of the functional divisions of the
cerebrum rival even the most elaborate of those produced by the phrenol-
ogists. The big difference is that unlike the phrenologists, scientists today
require solid experimental evidence before attributing a specific function
to a portion of the brain. All the same, Gall seems to have had the right
idea. It is natural to wonder why Flourens, the pioneer of brain localiza-
tion of function, was misled into believing that the cerebrum acted as a
whole and could not be subdivided. There are many reasons that this
gifted experimentalist may have missed cerebral localization, but it seems
clear that one reason was his visceral disdain for Gall and phrenology. He
could not bring himself to agree even remotely with Gall, whom he viewed
as a lunatic. This reminds us that science, for better or worse, was and still
is a distinctly human endeavor.
The Evolution of Nervous Systems. In 1859, English biologist Charles
Darwin (Figure 1.13) published On the Origin of Species. In this landmark
work, he articulated a theory of evolution: that species of organisms evolved
from a common ancestor. According to his theory, differences among
species arise by a process Darwin called natural selection. As a result of the
mechanisms of reproduction, the physical traits of the offspring are some-
times different from those of the parents. If these traits represent an advan-
tage for survival. the offspring themselves will be more likely to reproduce,
thus increasing the likelihood that the advantageous traits are passed on to
the next generation. Over the course of many generations, this process has
led to the development of traits that distinguish species today: flippers on
harbor seals, paws on dogs, hands on raccoons, and so on. This single insight
revolutionized biology. Today, scientific evidence ranging from anthropology
to molecular genetics overwhelmingly supports the theory of evolution by
natural selection.
Darwin included behavior among the heritable traits that could evolve.
For example, he noticed that many mammalian species show the same re-
action when frightened: The pupils of [he eyes get bigger, the heart races,
hairs stand on end. This is as true for a human as it is for a dog. To Dar-
win, the similarities of this response pattern indicated that these different
species evolved from a common ancestor, which possessed the same be-
havioral trait (advantageous presumably because it facilitated escape from
predators). Because behavior reflects the activity of the nervous system, we
can infer that the brain mechanisms that underlie this fear reaction may be
similar, if not identical, across these species.
The idea that the nervous systems of different species evolved from com-
mon ancestors and may have common mechanisms is [he rationale for relat-
ing the results of animal experiments to humans. Thus, for example, many of
the details of electrical impulse conduction along nerve fibers were worked
out first in the squid but are now known to apply equally well to humans.
Most neuroscientists today use animal models to examine the process they wish
to understand in humans. For example, rats show clear signs of addiction if
they are given the chance to self-administer cocaine repeatedly. Consequently,
. THE ORIGINS OF NEUROSCIENCE I I
Central sulcus
I
*
. o
\ f
,-,'
Jio.< \
'\
FIGURE 1.12
The brain that convinced Broca of
localization of function in the cerebrum.
This is the preserved brain of a patient who
had lost the ability to speak before he died in
1861. The lesion that produced this deficit is
circled. (Source: CorsI, 1991, Fig. 111,4.)
,
FIGURE 1.13
Charles Darwin (1809-1882). Darwin
proposed his theory of evolution, explaining
how species evolve through the process of
natural selection. (Source: The Bettman
Archive.)
12 C HAP T E R I . NEUROSCIENCE: PAST, PRESENT, AND FUTURE
7cm
..
y
'
"
\
(a) Monkey brain
3cm
(b) Rat brain
--
FIGURE 1.14
Different brain specializations in monkeys and rats. (a) The brain of the macaque
monkey has a highly evolved sense of sight. The boxed region receives information from the
eyes. When this region is sliced open and stained to show metabolically active tissue. a
mosaic of "blobs" appears. The neurons within the blobs are speCialized to analyze colors In
the visual world. (b) The brain of a rat has a highly evolved sense of touch to the face. The
boxed region receives information from the whiskers. When this region is sliced open and
stained to show the location of the neurons, a mosaic of "barrels" appears. Each barrel is
specialized to receive inout from a single whisker on the rat's face. (Photomicrographs cour-
tesy of Dr. S. H. C. Hendr y.)
rats are a valuable animal model for research focused on understanding how
psychoactive drugs exert their effects on the nervous system.
On the other hand, many behavioral traits are highly specialized for the
environment (or niche) a species normally occupies. For example, mon-
keys swinging from branch to branch have a keen sense of sight, while rats
slinking through underground tunnels have poor vision but a highly
evolved sense of touch using the whiskers on the snout. Adaptations are
reflected in the structure and function of the brain of every species. By
comparing the specializations of the brains of different species, neurosci-
entists have been able to identify which parts of the brain are specialized
for different behavioral functions. Examples for monkeys and rats are
shown in Figure 1.14.
The Neuron: The Basic Functional Unit of the Brain. Technical advances
in microscopy during the early 1800s gave scientists their first opportunity to
examine animal tissues at high magnifications. In 1839, German zoologist
Theodor Schwann proposed what came to be known as the cell theory: All
tissues are composed of microscopic units called cells.
Although cells in the brain had been identified and described, there was
still controversy about whether the individual "nerve ceB" was actually
the basic unit of brain function. Nerve cells usually have a number of thin
projections, or processes, that extend from a central cell body (Figure
1.15). Initially, scientists could not decide whether the processes from dif-
ferent cells fuse together like the blood vessels of the circulatory system.
If this were true, then the "nerve net" of connected nerve cells would rep-
resent the elementary unit of brain function.
Chapter 2 presents a brief history of how this issue was resolved. Suffice
it to say that by 1900, the individual nerve cell, now called the neuron, was
recognized to be the basic functional unit of the nervous system.
... NEUROSCIENCE TODAY
The history of modern neuroscience is still being written, and the accom-
plishments, ro date, form the basis for this textbook. We will discuss the
most recent developments throughout the book. Now let's take a look at
how brain research is conducted today and why its continuation is impor-
tant to society.
levels of Analysis
History has clearly shown that understanding how the brain works is a big
challenge. To reduce the complexity of the problem, neuroscientists break
it into smaller pieces for systematic experimental analysis. This is called the
reductionist approach. The size of the unit of study defines what is often
called the level of analysis. In ascending order of complexity, these levels are
molecular, cellular, systems, behavioral, and cognitive.
Molecular Neuroscience. The brain has been called the most complex
piece of matter in the universe. Brain matter consists of a fantastic vari-
ety of molecules, many of which are unique to the nervous system. These
different molecules play many different roles that are crucial for brain
function: messengers that allow neurons to communicate with one an-
other, sentries that control what materials can enter or leave neurons,
conductors that orchestrate neuron growth, archivists of past experiences.
The study of the brain at this most elementary level is called molecular
neuroscience.
Cellular Neuroscience. The next level of analysis is cellular neuroscience,
which focuses on studying how all those molecules work together to give
the neuron its special properties. Among the questions asked at this level
are: How many different types of neurons are there, and how do they differ
in function? How do neurons influence other neurons? How do neurons
become "wired together" during fetal development? How do neurons per-
form computations?
Systems Neuroscience. Constellations of neurons form complex circuits
that perform a common function: vision, for example, or voluntary move-
ment. Thus, we can speak of the "visual system" and the "motor system,"
each of which has its own distinct circuitry within the brain. At this level
of analysis, called systems neuroscience, neuroscientists study how differ-
ent neural circuits analyze sensory information, form perceptions of the
external world, make decisions, and execute movements.
Behavioral Neuroscience. How do neural systems work together to pro-
duce integrated behaviors? For example, are different forms of memory
accounted for by different systems? Where in the brain do "mind-altering"
drugs act. and what is the normal contribution of these systems ro the reg-
ulation of mood and behavior? What neural systems account for gender-
... NEUROSCIENCE TODAY 13
---7<"
;/-
.....
...,
\,
\
\
.
\
,
. \
o
/
A'
h
;;
;)
!J
FIGURE 1.15
An early depiction of a nerve cell.
Published in 1865, this drawing by German
anatomist Otto Deiters shows a nerve cell,
or neuron, and its many projections, called
neurites. For a time it was thought that the
neuntes from different neurons might fuse
together like the blood vessels of the circula-
tory system. We now know that neurons are
distinct entities that communicate using
chemical and electrical signals. (Source: Clarke
and O'Malley. 1968, Fig. I 6.)
14 C HAP T E R I . NEUROSCIENCE: PAST, PRESENT, AND FUTURE
specific behaviors? Where in the brain do dreams come from? These ques-
tions are studied in behavioral neuroscience.
Cognitive Neuroscience. Perhaps the greatest challenge of neuroscience
is understanding the neural mechanisms responsible for the higher levels
of human mental activity, such as self-awareness, mental imagery, and
language. Research at this level, called cognitive neuroscience, studies how
the activity of the brain creates the mind.
Neuroscientists
"Neuroscientist" sounds impressive, kind of like "rocket scientist." But we
were all students once, just like you. For whatever reason-maybe we
wanted to know why our eyesight was poor, or why a family member
suffered a loss of speech after a stroke-we came to share a thirst for
knowledge of how the brain works. Perhaps you will, too.
Being a neuroscientist is rewarding, but it does not come easily. Many
years ot training are required. One may begin by helping out in a research
lab during or after college and then going to graduate school to earn an ad-
vanced degree, either a Ph.D. or an M.D. (or both). Several years ot post-
doctoral training usually follow, to learn new techniques or ways of think-
ing under the direction of an established neuroscientist. Finally, the "young"
neuroscientist is ready to set up shop at a university, institute, or hospital.
Broadly speaking, neuroscience research (and neuroscientists) may be di-
vided into two types: clinical and experimental. Clinical research is mainly
conducted by physicians (M.D.s). The main medical specialties associated
with the human nervous system are neurology, psychiatry, neurosurgery,
and neuropathology (Table 1.1). Many who conduct clinical research con-
tinue in the tradition of Broca, attempting to deduce [rom the behavioral
effects of brain damage the [unctions of various parts of the brain. Others
conduct studies to assess the beneIits and risks of new types of treatment.
Despite the obvious value of clinical research, the foundation for all
medical treatments of the nervous system was and continues to be laid by
experimental neuroscientists, who may hold either an M.D. or a Ph.D. The
experimental approaches to studying the brain are so broad that they in-
clude almost every conceivable methodology. Neuroscience is highly inter-
disciplinary; however, expertise in a particular methodology may be used to
distinguish one neuroscientist {rom another. Thus, there are neuroanatomists,
who use sophisticated microscopes to trace connections in the brain; neuro-
physiologists, who use electrodes, amplifiers, and oscilloscopes to measure the
Table 1.1 Medical Specialists Associated With the
Nervous System
SPECIALIST DESCRIPTION
Neurologist
Psychiatrist
An M.D. trained to diagnose and treat diseases of the
nervous system
An M.D. trained to diagnose and treat disorders of
mood and personality
An M.D. trained to perform surgery on the brain and
spinal cord
An M.D. or Ph.D. trained to recognize the changes in
nervous tissue that result from disease
Neurosurgeon
Neuropathologist
... NEUROSCIENCE TODAY 15
TYPE
Table 1.2 Types of Experimental Neuroscientists
DESCRIPTION
Computational neuroscientist
Developmental neurobiologist
Molecular neurobiologist
Neuroanatomist
Neurochemist
Neuroethologist
Neuropharmacologist
Neurophysiologist
Physiological psychologist
(Biological psychologist,
psychobiologist)
Psychophysicist
Uses mathematics and computers to
construct models of brain functions
Analyzes the development and maturation
of the brain
Uses the genetic material of neurons to
understand the structure and function
of brain molecules
Studies the structure of the nervous system
Studies the chemistry of the nervous system
Studies the neural basis of species-specific
animal behaviors in natural settings
Examines the effects of drugs on the nerv-
ous system
Measures the electrical activity of the nerv-
ous system
Studies the biological basis of behavior
Quantitatively measures perceptual abilities
brain's electrical activity; neuropharmacologists, who use "designer drugs" to
study the chemistry of brain function; molecular neurobiologists, who probe
the genetic material of neurons to find clues about the structure of brain
molecules; and so on. Table 1.2 lists some of the types of experimental
neuroscientists. Ask your instructor what type or types he or she is.
The Scientific Process
Neuroscientists of all stripes endeavor to establish truths about the nervous
system. Regardless of the level of analysis they choose, they work accord-
ing to a scientific process, which consists of four essential steps: observa-
tion, replication, interpretation, and verification.
Observation. Observations typically are made during experiments designed
to test a particular hypothesis. For example, Bell hypothesized that the ven-
tra roots contain the nerve fibers that control the muscles. To test this idea,
he performed the experiment in which he cut these fibers and then observed
whether or not muscular paralysis resulted. Other types of observation
derive from carefully watching the world around us, or from introspection,
or from human clinical cases. For example, Broca's careful observations led
him to correlate left frontal lobe damage with the loss of the ability to speak.
Replication. Whether the observation is experimental or clinical, it is es-
sential that it be replicated before it can be accepted by the scientist as fact.
Replication simply means repeating the experiment on different subjects or
making similar observations in different patients, as many times as neces-
sary to rule out the possibility that the observation occurred by chance.
Interpretation. Once the scientist believes the observation is correct, he
or she makes an interpretation. Interpretations depend on the state of
16 C HAP T E R I . NEUROSCIENCE: PAST. PRESENT. AND FUTURE
knowledge (or ignorance) at the time the observation was made and on the
preconceived notions (the "mind set") of the scientist who made it. As
such, interpretations do not always withstand the test of time. For exam-
ple, at the time he made his observations, Flourens was unaware that the
cerebrum of a bird is fundamentally different from that of a mammal. Thus,
he wrongly concluded from experimental ablations in birds that there was
no localization of certain functions in the cerebrum of mammals. Moreover,
as mentioned before, his profound distaste for Gall surely also colored his
interpretation. The point is that the correct interpretation often remains
unrecognized until long after the original observations were made. Indeed,
major breakthroughs are sometimes made when old observations are
reinterpreted in a new light.
Verification. The final step of the scientific process is verification. This step
is distinct from the replication performed by the original observer. Verifica-
tion means that the observation is sufficiently robust that it will be repro-
duced by any competent scientist who precisely follows the protocols of the
original observer. Successful verification generally means that the observa-
tion is accepted as fact. However, not all observations can be verified, some-
times because of inaccuracies in the original report or insufficient replication.
But failure to verify usually stems from the fact that additional variables,
such as temperature or time of day, contributed to the original result. Thus,
the process of verification, if affirmative, establishes new scientific fact, and,
if negative, suggests new interpretations for the original observation.
Occasionally, one reads in the popular press about a case of "scientific
fraud." Researchers face keen competition for limited research funds and
feel considerable pressure to "publish or perish." In the interest of expedi-
ency, a few have actually published "observations" that were never made.
Fortunately, such instances of fraud are rare, thanks to the scientific process.
Before long, other scientists find they are unable to verify the fraudulent
observations and begin to question how they could have been obtained in
the first place. The material you will learn in this book stands as a strong
testament to the success of the scientific process.
The Use of Animals in Neuroscience Research
Most of what we know about the nervous system has come from experi-
ments on animals. In most cases, the animals are killed so their brains can
be examined neuroanatomically, neurophysiologically, and/or neuro-
chemically. The fact that animals are sacrificed for the pursuit of human
knowledge raises questions about the ethics of animal research.
The Animals. Let's begin by putting the issue in perspective. Throughout
history, humans have considered animals and animal products as renew-
able natural resources to be used for food, clothing, transportation, recre-
ation, sport, and companionship. The animals used for research, education,
and testing have always been a small fraction of the total used for other
purposes. For example. in the United States, the number of animals used
for all types of biomedical research is less than 1 % of the number that
are killed for food alone. I The number used specifically for neuroscience
research is much smaller still.
Neuroscience experiments are conducted using many different species,
ranging from snails to monkeys. The choice of animal species is generally
dictated by the question under investigation, the level of analysis, and
the extent to which the knowledge gained at this level can be related to
I According to the National Academy of Sciences Institute of Medicine, 1991.
.,. NEUROSCIENCE TODAY I 7
humans. As a rule, the more basic the process under investigation, the
more distant can be the evolutionary relationship with humans. Thus,
experiments aimed at understanding the molecular basis of nerve impulse
conduction can be carried out on a distantly related species, such as the
squid. On the other hand, understanding the neural basis of movement and
perceptual disorders in humans has required experiments on more closely
related species, such as the macaque monkey. Today, more than half of the
animals used for neuroscience research are rodents-mice and rats-that
are bred specifically for this purpose.
Animal Welfare. In the developed world today, most educated adults have
a concern for animal welfare. Neuroscientists share this concern and work
to ensure that animals are well treated. It must also be appreciated, how-
ever, that society has not always placed such value on animal welfare, as
reflected in some of the scientific practices of the past. For example, in his
experiments early in the nineteenth century, Magendie used unanesthetized
puppies (for which he was later criticized by his scientific rival Bell). Before
passing judgment. consider that the philosophy of Descartes was very influ-
ential in French society at that time. Animals of a1l types were believed to
be simple automata, biological machines that lacked any semblance of
emotion. As disturbing as this now seems, it is also worth bearing in mind
that humans scarcely had any more respect for one another than they did
for animals during this period (slavery was still practiced in the United
States, for example). Fortunately, some things have changed quite dramat-
ically since then. Heightened awareness of animal welfare in recent years
has led to significant improvements in how animals are treated in biomed-
ical research. Unfortunately, other things have changed little. Humans
around the world continue to abuse one another in myriad ways (child
abuse, violent crime, ethnic cleansing, and so on).
Today, neuroscientists accept certain moral responsibilities toward their
animal subjects:
1. Animals are used only for worthwhile experiments that promise to ad-
vance our knowledge of the nervous system.
2. All necessary steps are taken to minimize pain and distress experienced
by the experimental animals (use of anesthetics, analgesics, ete.).
3. A1I possible alternatives to the use of animals are considered.
Adherence to this ethical code is monitored in a number of ways. First.
research proposals must pass a review by the Institutional Animal Care and
Use Committee (IACUC). Members of this committee include a veterinarian,
scientists in other disciplines, and nonscientist community representatives.
After passing the IACUC review, proposals are evaluated for scientific merit
by a panel of expert neuroscientists. This step ensures that only the most
worthwhile projects are carried out. Then, when neuroscientists attempt to
publish their observations in the professional journals, the papers are care-
fully reviewed by other neuroscientists for scientific merit and for animal
welfare concerns. Reservations about either issue can lead to rejection of
the papers, which in turn can lead to a loss of funding for the research. In
addition to these monitoring procedures, federal law sets strict standards for
the housing and care of laboratory animals.
Animal Rights. Most people accept the necessity for animal experimenta-
tion to advance knowledge, as long as it is performed humanely and with
the proper respect for the animal's welfare. However, a vocal and increas-
ingly violent minority seeks the total abolition of animal use for human pur-
poses, including experimentation. These people subscribe to a philosophical
18 C HAP T E R I . NEUROSCIENCE: PAST. PRESENT, AND FUTURE
FIGURE 1.16
Our debt to animal research. This poster
counters the claims of animal rights activists
by raising public awareness of the benefits
of animal research. (Source: Foundation for
Biomedical Research.)
position called "animal rights." According to this way of thinking, animals
have the same legal and moral rights as humans do.
rt you are an animal lover. you may be sympathetic to this position. But
consider the following questions. Are you willing to deprive yourself and
your family of medical procedures that were developed using animals? Is
the death of a mouse equivalent to the death of a human being? Is keeping
a pet the moral equivalent of slavery? Is eating meat the moral equivalent
of murder? Is it unethical to rake the life of a pig to save the life of a child?
Is controlling the rodent population in the sewers or the roach population
in your home morally equivalent to the Holocaust? If your answer is no
to any of these questions, then you do not subscribe to the philosophy of
animal rights. Animal welfare-a concern that all responsible people share-
must not be confused with animal rights.
Animal rights activists have vigorously pursued their agenda against ani-
mal research, sometimes with alarming success. They have manipulated
public opinion with repeated allegations of cruelty in animal experiments
that are grossly distorted or blatantly false. They have vandalized laborato-
ries, destroying years of hard-won scientific data and hundreds of thousands
of dollars of equipment (that you, the raxpayer, had paid for). Using threats
of violence, they have driven some researchers out of sdence altogether.
Fortunately, the tide is turning. Thanks to the efforts of a number of
people, scientists and nonscientists alike, the false claims of the extremists
have been exposed, and the benefits to humankind of animal research have
been extolled (Figure L 16). Considering the staggering toll in terms of
Its the animals yoU don't see
that really lei her recover
.
..
t
.
,
Recently, a surgical technique perfected on animals was used to remove
a malignant tumor from a little girl's brain. We lost some lab animals.
But look what we saved.
NEUROSCIENCE TODAY 19
human suffering that results from disorders of the nervous system, neuro-
sdentists take the position that it is immoral not to wisely use all the resources
nature has provided, including animals, to gain an understanding of how
the brain functions in health and in disease.
The Cost of Ignorance: Nervous System Disorders
Modern neuroscience research is expensive, but the cost of ignorance about
the brain is far greater. Table 1.3 lists some of the disorders that affect the
nervous system. It is likely that your family has felt the impact of one or
more of these. Let's look at a few brain disorders and examine their effects
on society.
Alzheimer's disease and Parkinson's disease are both characterized by
progressive degeneration of specific neurons in the brain. 2 Parkinson's
disease, which results in a crippling impairment of voluntary movement,
currently affects approximately 1.5 million Americans. Alzheimer's disease
leads to dementia, a state of confusion characterized by the loss of ability
to learn new information and to recall previously acquired knowledge. It is
estimated that dementia affects 50% of people over age 85. The number of
Americans with dementia totals weJl over 4 million. Indeed, it is now rec-
ognized that dementia is not an inevitable outcome of aging, as was once
believed, but is a sign of brain disease. Alzheimer's disease progresses mer-
cilessly, robbing its victims first of their mind, then of control over basic
bodily functions, and finally of their life; the disease is always fatal. In the
United States, the annual cost of care for people with dementia is approx-
imately $100 billion.
DISORDER
Table 1.3 Some Major Disorders of the Nervous System
DESCRIPTION
Alzheimer's disease
Cerebral palsy
Depression
Epilepsy
Multiple sclerosis
Parkinson's disease
Schizophrenia
Spinal paralysis
Stroke
A progressive degenerative disease of the brain,
characterized by dementia and always fatal
A motor disorder caused by damage to the cere-
brum at the time of birth
A serious disorder of mood, characterized by insom-
nia, loss of appetite, and feelings of dejection
A condition characterized by periodic disturbances of
brain electrical activity that can lead to seizures,
loss of consciousness, and sensory disturbances
A progressive disease that affects nerve conduction,
characterized by episodes of weakness, lack of
coordination, and speech disturbance
A progressive disease of the brain that leads to diffi-
culty in initiating voluntary movement
A severe psychotic illness characterized by delusions,
hallucinations, and bizarre behavior
A loss of feeling and movement caused by traumatic
damage to the spinal cord
A loss of brain function caused by disruption of the
blood supply, usually leading to permanent sensory,
motor, or cognitive deficit
2S tat istics for disorders in this section were compiled by Dr. Steven O. Moldin, Di-
rector, Office of Human Genetics & Genomic Resources, National Institute of Men-
tal Health, 2004.
20 C HAP T E R I . NEUROSCIENCE: PAST. PRESENT. AND FUTURE
Depression and schizophrenia are disorders of mood and thought. Depres-
sion is characterized by overwhelming feelings of dejection, worthlessness,
and guilt. Over 33 million Americans will experience a major depressive
illness at some time in their lives. Depression is the leading cause of suicide,
which claims 31,000 lives each year in the United States.
Schizophrenia is a severe personality disorder characterized by delusions,
hallucinations, and bizarre behavior. This disease oIren strikes at the
prime of life-adolescence or early adulthood-and can persist for life.
Over 2 million Americans suffer from schizophrenia. The National Institute
of Mental Health (NIMH) estimates that mental disorders, such as depres-
sion and schizophrenia, cost the United States in excess of $148 billion
annually.
Stroke is the third leading cause of death in the United States. Stroke vic-
tims who do not die, some 530,000 per year, are likely to be permanently
disabled. The annual cost of stroke nationwide is $54 billion. Alcohol and
drug addiction affects virtually every family in the United States. The cost
in terms of treatment, lost wages, and other consequences approaches $246
billion per year. These few examples only scratch the surface. As many or
more Americans are hospitalized with neurological and mental disorders than with
any other major disease group, including heart disease and cancer.
The economic costs of brain dysfunction are enormous, but they pale in
comparison with the staggering emotional toll on victims and their families.
The prevention and treatment of brain disorders require an understanding
of normal brain function, and this basic understanding is the goal of neuro-
science. Neuroscience research has already contributed to the development
of increasingly effective treatments for Parkinson's disease, depression, and
schizophrenia. New strategies are being tested to rescue dying neurons in
people with Alzheimer's disease and those who have had a stroke. Major
progress has been made in our understanding of how drugs and alcohol
affect the brain and how they lead to addictive behavior. The material in
this book demonstrates that a lot is known about the function of the brain.
But what we know is insignificant compared with what is stilI left to be
learned.
... CONCLUDING REMARKS
In this chapter, we have emphasized that neuroscience is a distinctly human
endeavor. The historical foundations of neuroscience were established by
many people over many generations. Men and women today are working at
all levels of analysis, using all types of technology, to shed light on the func-
tions of the brain. The fruits of this labor form the basis for this textbook.
The goal of neuroscience is to understand how nervous systems function.
Many important insights can be gained from a vantage point outside the
head. Because the brain's activity is reflected in behavior, careful behavioral
measurements inform us of the capabilities and limitations of brain func-
tion. Computer models that reproduce the brain's computational properties
can help us understand how these properties might arise. From the scalp,
we can measure brain waves, which tell us something about the electrical
activity of different parts of the brain during various behavioral states. New
computer-assisted imaging techniques enable researchers to examine the
structure of the living brain as it sits in the head. And using even more
sophisticated imaging methods, we are beginning to see what different
pans of the human brain become active under different conditions. But
none of these noninvasive methods, old or new, can substitute for experi-
mentation with living brain tissue. We cannot make sense of remotely de-
tected signals without being able to see how they are generated and what
... CONCLUDING REMARKS 21
their significance is. To understand how the brain works, we must open the
head and examine what's inside-neuroanatomically, neurophysiologically,
and neurochemically.
The pace of neuroscience research today is truly breathtaking and
raises hopes that soon we will have new treatments for the wide range
of nervous system disorders that debilitate and cripple millions of people
annually. In recognition of the progress and promise of brain research,
the u.s. Congress designated the 1990s as the "Decade of the Brain." (An
esteemed colleague of ours has suggested that while this was a good idea,
Congress was perhaps overly optimistic; he suggests that we designate
the new century as the "Century of the Brain.") Despite the progress in
recent decades and the centuries preceding them, we still have a long
way to go before we fully understand how the brain performs all of its
amazing feats. But this is the fun of being a neuroscientist: Because our
ignorance of brain function is so vast, a startling new discovery lurks
around virtually every corner.
riA.
,
V')
w Z
o
>
wI-
ct:.V')
w
:J
a
I. What are brain ventricles. and what functions have been ascribed to them over the ages!
2. What experiment did Bell perform to show that the nerves of the body contain a mixture of sensory and
motor fibers?
3. What did Flourens' experiments suggest were the functions of the cerebrum and the cerebellum?
4. What is the meaning of the term animal model?
5. A region of the cerebrum is now called Broca's area. What function do you think this region performs.
and why?
6. What are the different levels of analysis in neuroscience research? What types of question do researchers
ask at each level?
7. What are the steps in the scientific process? Describe each one.
6d
ct:.l9
Wz
I-
1-0
ct:.«
:JW
LLct:.
Allman JM. 1999. Evolving Brains. New York: Scientific
American Library.
Clarke E. O'Malley C. 1968. The Human Brain and
Spinal Cord. 2nd ed. Los Angeles: University of
California Press.
Corsi P, ed. 1991. The Enchanted Loom. New York:
Oxford University Press.
Crick F. 1994. The Astonishing Hypothesis: The
Scientific Search for the Soul. New York:
Macmillan.
Finger S. 1994. Origins of Neuroscience. New York:
Oxford University Press.
Shepherd GM. Erulkar SD. 1997. Centenary of
the synapse: from Sherrington to the molecular
biology of the synapse and beyond. Trends in
Neurosciences 20:385-392.
CHAPTER
Neurons and Glia
INTRODUCTION
THE NEURON DOCTRINE
THE GOLGI STAIN
CAJAL'S CONTRIBUTION
. Box 2.1 Of Special Interest: Advances in Microscopy
THE PROTOTYPICAL NEURON
THE SOMA
The Nucleus
. Box 2.2 Brain Food: Expressing One's Mind in the Post-Genomic Era
Rough Endoplosmic Reticulum
Smooth Endoplosmic Reticulum ond the Golgi Apporatus
The Mitochondrion
THE NEURONAL MEMBRANE
THE CYTOSKELETON
Microtubules
. Box 2.3 Of Special Interest: Alzheimer's Disease and the Neuronal Cytoskeleton
Microfiloments
Neurofiloments
THE AXON
The Axon Terminol
The Synapse
Axoplosmic Transport
. Box 2.4 Of Special Interest: Hitching a Ride With Retrograde Transport
DENDRITES
. Box 2.5 Of Specialll1terest: Mental Retardation and Dendritic Spines
. Box 2.6 Path of Discovery: Spines and the Structural Basis of Memory, by William Greenough
CLASSIFYING NEURONS
CLASSIFICATION BASED ON THE NUMBER OF NEURITES
CLASSIFICATION BASED ON DENDRITES
CLASSIFICATION BASED ON CONNECTIONS
CLASSIFICATION BASED ON AXON LENGTH
CLASSIFICATION BASED ON NEUROTRANSMITTER
GLiA
ASTROCYTES
MYELINATING GLiA
OTHER NON-NEURONAL CELLS
CONCLUDING REMARKS
24 C HAP T E R 2 . NEURONS AND GLiA
... INTRODUCTION
All tissues and organs in the body consist of cells. The specialized functions
of cells and how they interact determine the functions of organs. The brain
is an organ-to be sure, the most sophisticated and complex organ that
nature has devised. But the basic strategy for unraveling its function is no
different from that used to investigate the pancreas or the lung. We must
begin by learning how brain cells work individually and then see how they
are assembled to work together. In neuroscience, there is no need to sepa-
rate mind from brain; once we fully understand the individual and con-
certed actions of brain cells, we will understand the origins of our mental
abilities. The organization of this book reflects this "neurophilosophy." We
start with the cells of the nervous system-their structure, function, and
means of communication. In later chapters, we will explore how these cells
are assembled into circuits that mediate sensation, perception, movement,
speech, and emotion.
In this chapter, we focus on the structure of the different types of cells
in the nervous system: neurons and g/ia. These are broad categories, within
which are many types of cells that differ based on their structure, chem-
istry, and function. Nonetheless, the distinction between neurons and glia
is important. Although there are many neurons in the human brain (about
100 billion), glia outnumber neurons by tenfold. Based on these numbers,
it might appear that we should focus our attention on glia for insights into
the cellular functions of the nervous system. However, neurons are the
most important cells for the unique functions of the brain. It is the neurons
that sense changes in the environment, communicate these changes to
other neurons, and command the body's responses to these sensations.
Glia, or glial cells, are thought to contribute to brain function mainly by
insulating, supporting, and nourishing neighboring neurons. If the brain
were a chocolate-chip cookie and the neurons were chocolate chips, the
glia would be the cookie dough that fills all the other space and ensures
that the chips are suspended in their appropriate locations. Indeed, the
term glia is derived from the Greek word for "glue," giving the impression
that the main [unction of these cells is to keep the brain from running out
of our ears! As we shall see later in the chapter, the simplicity of this
view is probably a good indication of the depth of our ignorance about glial
function. However, we still are confident that neurons perform the bulk of
information processing in the brain. Therefore, we will focus 90% of our
attention on 10% of brain cells: the neurons.
Neuroscience, like other fields, has a language all its own. To use this lan-
guage, you must learn the vocabulary. After you have read this chapter,
take a few minutes to review the key terms list and make sure you under-
stand the meaning of each term. Your neuroscience vocabulary will grow
as you work your way through the book.
... THE NEURON DOCTRINE
To study the structure of brain cells, scientists have had to overcome sev-
eral obstacles. The [jrst was the small size. Most cells are in the range of
0.01-0.05 mm in diameter. The tip of an unsharpened pencil lead is about
2 mm across; neurons are 40-200 times smaller. (For a review of the met-
ric system, see Table 2.1.) This size is at or beyond the limit of what can be
seen by the naked eye. Therefore, progress in ceHular neuroscience was not
possible before the development of the compound microscope in the late
seventeenth century. Even then, obstacles remained. To observe brain tissue
Y THE NEURON DOCTRINE 25
Table 2.1 Units of Size in the Metric System
METER
UNIT ABBREVIATION EQUIVALENT REAL-WORLD EQUIVALENT
Kilometer km 10 3 m About two-thirds of a mile
Meter m 1m About 3 feet
Centimeter cm 10- 2 m Thickness of your little finger
Millimeter mm 10- 3 m Thickness of your toenail
Micrometer IJm 10- 6 m Near the limit of resolution
for the light microscope
Nanometer nm 10- 9 m Near the limit of resolution
for the electron microscope
. ..
using a microscope, it was necessary to make very thin slices, ideally not
much thicker than the diameter of the cells. However, brain tissue has a
consistency like a bowl of lello: not fim1 enough to make thin slices. Thus,
the study of the anatomy of brain cells had to await the development of a
method to harden the tissue without disturbing its structure and an instru-
ment that could produce very thin slices. Early in the nineteenth century,
scientists discovered how to harden, or "fix," tissues by immersing them in
formaldehyde, and they developed a special device called a microtome to
make very thin slices.
These technical advances spawned the field of histology, the micro-
scopic study of the structure of tissues. But scientists studying brain struc-
ture faced yet another obstacle. Freshly prepared brain has a uniform,
cream-colored appearance under the microscope; the tissue has no differ-
ences in pigmentation to enable histologists to resolve individual cells.
Thus, the final breakthrough in neurohistology was the introduction of
stains that could selectively color some, but not all, parts of the cells in
brain tissue.
One stain, still used today, was introduced by the German neurologist
Franz Nissl in the late nineteenth century. Nissl showed that a class of basic
dyes would stain the nuclei of all cells and also stain clumps of material
surrounding the nuclei of neurons (Figure 2.1). These clumps are called
Nissl bodies, and the stain is known as the Nissl stain. The Nissl stain is ex-
tremely useful for two reasons. First. it distinguishes neurons and glia from
one another. Second, it enables histologists to study the arrangement. or
cytoarchitecture, of neurons in different parts of the brain. (The prefix
cyto- is from the Greek word for "ceJl.") The study of cytoarchitecture led
to the realization that the brain consists of many specialized regions. We
now know that each region performs a different function.
-. ., ..
. .
: ,
" . . t
.
.0 ,
, "
. -
.
-
. ..r
a
. ,
.". _L
111 .. "'.
.
FIGURE 2.1
Nissl-stained neurons. A thin slice of brain
tissue has been stained with cresyl violet, a
Nissl stain. The clumps of deeply stained
material around the cell nuclei are Nissl
bodies. (Source: Hammersen, 1980, Fig. 493.)
."
,.
.
.
. .
." ,.
. ",' .#
... ,.4...
.
.
....
.. ':.
.
.
. .
, · C. ·
. . ..
. .
26 C HAP T E R 2 . NEURONS AND GLiA
The Goigi Stain
The Nissl stain, however, does not tell the whole story. A Nissl-stained neu-
ron looks like little more than a lump of protoplasm containing a nucleus.
Neurons are much more than that, but how much more was not recog-
nized until the publication of the work of Italian histologist Camillo Golgi
(Figure 2.2). In 1873, Golgi discovered that by soaking brain tissue in a sil-
ver chromate solution, now called the Golgi stain, a small percentage of
neurons became darkly colored in their entirety (Figure 2.3). This revealed
that the neuronal cell body, the region of the neuron around the nucleus
that is shown with the Nissl stain, is actually only a small fraction of the
total structure of the neuron. Notice in Figures 2.1 and 2.3 how different
histological stains can provide strikingly different views of the same tissue.
Today, neurohistology remains an active field in neuroscience, along with
its credo: "The gain in brain is mainly in the stain."
The Golgi stain shows that neurons have at least two distinguishable
parts: a central region that contains the cell nucleus, and numerous thin
tubes that radiate away from the central region. The swollen region con-
taining the cell nucleus has several names that are used interchangeably:
cell body, soma (plural: somata), and perikaryon (plural: perikarya). The
thin tubes that radiate away from the soma are called neurites and are of
two types: axons and dendrites (Figure 2.4).
The ceU body usually gives rise to a single axon. The axon is of uniform
diameter throughout its length, and if it branches, the branches generaUy
extend at right angles. Because axons can travel over great distances in the
body (a meter or more). it was immediately recognized by the histologists
of the day that axons must act like "wires" that carry the output of the
neurons. Dendrites, on the other hand, rarely extend more than 2 mm in
,
FIGURE 2.2
Camillo Goigi (1843-1926).
(Source: Finger. 1994, Fig. 3.22.)
,1
..
, .
)..;
I
\ "' "-
.,. -c '\ \. "\ i<
-
"'
\ , \
'" '\ "" ,
'" .....
. ,t
" ,
Soma
"
.-4
T -'
-..
t.\.
1/
Dendrites\.. Neurites
,-Axon J
-
FIGURE 2.3
Golgi-stained neurons. (Source: Hubel. 1988, p. 126.)
FIGURE 2.4
The basic parts of a neuron.
length. Many dendrites extend from the cell body and generally taper to a
fine point. Early histologists recognized that because dendrites come in
contact with many axons, they must act as the antennae of the neuron to
receive incoming signals, or input.
Cajal's Contribution
Golgi invented the stain, but it was a Spanish contemporary of Golgi who
used it to greatest effect. Santiago Ramon y Cajal was a skilled histologist
and artist who learned about Golgi's method in 1888 (Figure 2.5). In a
remarkable series of publications over the next 25 years, Cajal used the
Golgi stain to work Out the circuitry of many regions of the brain (Figure
2.6). Ironically, Golgi and Cajal drew completely opposite conclusions about
neurons. Golgi championed the view that the neurites of different cells are
fused together to form a continuous reticulum, or network, similar to the
arteries and veins. of the circulatory system. According to this reticular theory,
the brain is an exception to the cell theory, which states that the individual
cell is the elementary functional unit of all animal tissues. Cajal, on the
other hand, argued forcefully that the neurites of different neurons are not
continuous with one another and must communicate by contact, not continuity.
This idea that the neuron adhered to the cell theory carne to be known as
the neuron doctrine. Although Golgi and Cajal shared the Nobel Prize in
1906, they remained rivals to the end.
The scientific evidence over the next 50 years weighed heavily in favor
of the neuron doctrine, but final proof had to wait until the development
of the electron microscope in the 1950s (Box 2.1). With the increased re-
solving power of the electron microscope, it was finally possible to show
that the neurites of different neurons are not continuous with one another.
Thus, our starting point in the exploration of the brain must be the indi-
vidual neuron.
FIGURE 2.6
One of Cajal's many drawings of brain
circuitry. The letters label the different ele-
ments Cajal identified in an area of the human
cerebral cortex that controls voluntary move-
ment. We will learn more about this part of
the brain in Chapter 14. (Source: DeFelipe
and Jones, 1998, Fig. 90.)
'" THE NEURON DOCTRINE 27
'\
II
\
F!GURE 2.5
Santiago Ramon y Cajal (1852-1934).
(Source: Finger. 1994, Fig. 3.26.)
28 C H A PT E R 2 . NEURONS AND GLiA
Box 2.1
.... , .
OF SPECIAL INTEREST
#
#
lJ Advances in Microscopy
The human eye can distinguish two points only if they are
separated by more than about one-tenth of a millimeter
(100 J.1m). Thus. we can say that 100 J.1m is near the limit
of resolution for the unaided eye. Neurons have a diame-
ter of about 20 J.1m. and neurites can measure as small as
a fraction of a micrometer. The light microscope. there-
fore, was a necessary development before neuronal struc-
ture could be studied. But this type of microscopy has a
.
. . ,0
- ,.....
. -
, ----
I . ....
<
---.'
FIGURE A
A laser microscope and computer. (Source: Olympus.)
theoretical limit imposed by the properties of microscope
lenses and visible light. With the standard light micro-
scope. the limit of resolution is about 0.1 J.1m. However.
the space between neurons measures only 0.02 J.1m (20
nm). No wonder two esteemed scientists. Golgi and Ca-
jal. disagreed about whether neurites were continuous
from one cell to the next. This question could not be an-
swered until the electron microscope was developed and
applied to biological specimens. which occurred only
within the past 60 years or so.
The electron microscope uses an electron beam in-
stead of light to form images, dramatically increasing the
resolving power. The limit of resolution for an electron
microscope is about 0.1 nm-a million times better than
the unaided eye. Our insights into the fine structure of
the inside of neurons-the ultrastructure-have all come
from electron microscopic examination of the brain.
Today. microscopes on the leading edge of technology
use laser beams to illuminate the tissue and computers
to create digital images (Figure A). Unlike the traditional
methods of light and electron microscopy. which re-
quire tissue fixation, these new techniques give neuro-
scientists their first chance to peer into brain tissue
that is still alive.
THE PROTOTYPICAL NEURON
As we have seen, the neuron (also called a nerve cell) consists of several
parts: the soma, the dendrites. and the axon. The inside of the neuron is
separated from the outside by the limiting skin, the neuronaL membrane,
which lies like a circus tent on an intricate internal scaffolding, giving each
part of the cell its special three-dimensional appearance. Let's explore the
inside of the neuron and learn about the functions of the different parts
(Figure 2.7).
The Soma
We begin our tour at the soma, the roughly spherical central part of the
neuron. The cell body of the typical neuron is about 20 pm in diameter.
The watery fluid inside the cell, called the cytosol, is a salty, potassium-
rich solution that is separated from the outside by the neuronal membrane.
Within the soma are a number of membrane-enclosed structures called
organelles.
The cell body of the neuron contains the same organelles that are found
in all animal cells. The most important ones are the nucleus, the rough
endoplasmic reticulum, the smooth endoplasmic reticulum, the Golgi ap-
paratus, and the mitochondria. Everything contained within the confines
29
... THE PROTOTYPICAL NEURON
j /
\
:)-. l
l , _
j 'lL
' \ '
I / , i / , _ f _ _ ='
- '- " '! - '; L '
J:;!/ ( ' ____----;1 ,
l'
. '" , \.'\
. (
\ J --:Y;;:- I '
. -::- / .J \
- /
- - "'=...--
. MnocOOOOOO"J
. / ".'- ) rv'/)
'" , (( " : : · ") J
'l7 ( \ \" __
'0:_ /I I '" " / ----- SmoothER
) 7?"J / V\\(" I ) '-,
! '; V\J(/ /
1 "1
I ,
(/
Microtubules I
I
I
\
---.
./
,
I
'"
>-....
"
\
'--
"
\
r
"'
,---r
\
l
r{
rJ \
\
)
Axon
FIGURE 2.7 I tructure of a typical neuron.
The interna 5
30 C H A PT E R 2 . NEURONS AND GLiA
of the cell membrane, including the organelles but excluding the nucleus,
is referred to collectively as the cytoplasm.
The Nucleus. Its name derived from the Latin word for "nut," the nucleus
of the cell is spherical, centrally located, and about 5-10 )Jm across. It is
contained within a double membrane called the nuclear envelope. The nuclear
envelope is perforated by pores that measure about 0.1 /-un across.
Within the nucleus are chromosomes, which contain the genetic mate-
riaL DNA (deoxyribonucleic acid). Your DNA was passed on to you from
your parents, and it contains the blueprint for your entire body. The DNA
in each of your neurons is the same, and it is the same as the DNA in the
cells of your liver and kidney. What distinguishes a neuron from a liver cell
are the specific parts of the DNA that are used to assemble the cell. These
segments of DNA are called genes.
Each chromosome contains an uninterrupted double-stranded braid of
DNA, 2 nm wide. If the DNA from the 46 human chromosomes were laid
out straight, end to end, it would measure more than 2 m in length. If
we were to consider this total length of DNA as analogous to the string
of letters that makes up this book, the genes would be analogous to the
individual words. Genes can measure anywhere from 0.1 )Jm to several
micrometers in length.
The "reading" of the DNA is known as gene expression. The final
product of gene expression is the synthesis of molecules called proteins,
which exist in a wide variety of shapes and sizes, perform many different
functions, and bestow upon neurons virtually all of their unique charac-
teristics. Protein synthesis, the assembly of protein molecules, occurs in
the cytoplasm. Because the DNA never leaves the nucleus, there must be
an intermediary that carries the genetic message to the sites of protein
synthesis in the cytoplasm. This function is performed by another long
molecule called messenger ribonucleic acid, or mRNA. Messenger RNA
consists of four different nudeic acids strung together in various sequences
to form a chain. The detailed sequence of the nudeic acids in the chain rep-
resents the information in the gene, just as the sequence of letters gives
meaning to a written word.
The process of assembling a piece of mRNA that contains the informa-
tion of a gene is called transcription, and the resulting mRNA is called the
transcript (Figure 2.8a). Protein-coding genes are flanked by stretches of
DNA that are not used to encode proteins but are important for regulating
transcription. At one end of the gene is the promoter, the region where
the RNA-synthesizing enzyme, RNA polymerase, binds to initiate transcrip-
tion. The binding of the polymerase to the promoter is tightly regulated by
other proteins called transcription factors. At the other end is a sequence
of DNA called the terminator that the RNA polymerase recognizes as the end
point for transcription.
In addition to the non-coding regions of DNA that flank the genes, there
are often additional stretches of DNA within the gene itself that cannot be
used to code for protein. These interspersed regions are called introns, and
the coding sequences are called exons. Initial transcripts contain both in-
trons and exons, but then, by a process called RNA splicing, the introns
are removed and the remaining exons are fused together (Figure 2.8b). In
some cases, specific exons are also removed with the introns, leaving an
"alternatively spliced" mRNA that actually encodes a different protein.
Thus, transcription of a single gene can ultimately give rise to several dif-
ferent mRNAs and protein products.
Messenger RNA transcripts emerge from the nucleus via pores in the
nuclear envelope and travel to the sites of protein synthesis elsewhere in
". THE PROTOTYPICAL NEURON J I
r , .. I I
')
,
. '
>-
t:. "
').
. . .' J
. . .
. .
. ,
\
, .
..
I
/
..J
/ Gene "
A ,
( 'I
DNA
FIGURE 2.8
Gene transcription. (a) RNA molecules are synthesized
by RNA poylmerase and then processed into messenger
RNA to carry the genetic instructions for protein assembly
from the nucleus to the cytoplasm. (b) Transcnptlon is initi-
ated at the promoter region of the gene and stopped at
the terminator region. The Initial RNA must be spliced to
remove the introns that do not code for protein.
(
Promotor
Gene
--
"\
Terminator
DNA
-- I
Exon 1 I Exon 2
Intron 1
--
Exon 3
Intron 2
DNA )QO(
RNA
"-
RNA polymerase
"
" 11 ';' .
RNA
@
t$=
mRNA
transcript
@ I rom nucleus I
(b)
mRNA
Cytoplasm .........
(a)
the neuron. At these sites, a protein molecule is assembled much as the
mRNA molecule was: by !inking together many small molecules into a
chain. In the case of protein, the building blocks are amino acids, of which
there are 20 different kinds. This assembling of proteins from amino acids
under the direction of the mRNA is called translation.
The scientific study of this process, which begins with the DNA of the nu-
cleus and ends with the synthesis of protein molecules in the cell, is known
as molecular biology. The "central dogma" of molecular biology is summa-
rized as [onows:
Transcription
Translation
DNA
> mRNA
> Protein
A new field within neuroscience is called molecular neurobiology. Molecu-
lar neurobiologists use the information contained in the genes to determine
the structure and functions of neuronal proteins (Box 2.2).
Rough Endoplasmic Reticulum. Not far from the nucleus are enclosed
stacks of membrane dotted with dense globular structures called ribosomes,
32 C H A PT E R 2 . NEURONS AND GLiA
Box 2.2
)
BRAIN FOOD
Expressing One's Mind
in the Post-Genomic Era
Sequencing the human genome-the entire length of
DNA that comprises the genetic information in our
chromosomes-was a truly monumental achieve-
ment, completed in 2003. The Human Genome Pro-
ject identifed all of the approximately 20.000 genes in
human DNA.We now live in what has been called the
"post-genomic era;' in which information about the
genes expressed in our tissues can be used to diag-
nose and treat diseases. Neuroscientists are now us-
ing this information to tackle long-standing questions
about the biological basis of neurological and psychi-
atric disorders, as well as to probe deeper into the
origins of individuality. The logic goes as follows. The
brain is the product of the genes expressed in it.
Differences in gene expression between a normal
brain and a diseased brain. or a brain of unusual ability,
can be used to identify the molecular basis of the
observed symptoms or traits.
The level of gene expression is usually defined as
the number of mRNA transcripts synthesized by
different cells and tissues to direct the synthesis of
specific proteins. Thus, the analysis of gene expression
requires a method to compare the relative abun-
dance of various mRNAs in the brains of two groups
of humans or animals. One way to perform such a
comparison is to use DNA microarrays, which are
created by robotic machines that arrange thousands
of small spots of synthetic DNA on a microscope
slide. Each spot contains a unique DNA sequence
that will recognize and stick to a different specific
mRNA sequence. To compare the gene expression in
two brains, one begins by collecting a sample of
mRNAs from each brain. The mRNA of one brain is
labeled with a chemical tag that fluoresces green, and
the mRNA of the other brain is labeled with a tag
that fluoresces red. These samples are then applied
to the microarray. Highly expressed genes will
produce brightly fluorescent spots, and differences in
the relative gene expression between the brains will
be revealed by differences in the color of the
fluorescence (Figure A).
/
Mix applied
ro ON'\ra..,
Brain 1
r -:j
1\( '\. ) \.
t
Vial of mRNA
from brain 1,
labeled red
41= ';
Gene with
reduced
expression
in brain 2
Brain 2
1f(Iar
.
I Vial of mRNA
J from brain 2,
labeled green
-
Spot of synthetic
DNA with gene-
specific sequence
I
I
Gene with
equivalent
expression
in both
brains
FIGURE A
Profiling differences In gene expression.
(/ \
Microscopic
slide
Gene with
reduced
expression
in brain 1
which measure about 25 nm in diameter. The stacks are called rough
endoplasmic reticulum, or rough ER (Figure 2.9). Rough ER abounds
in neurons, far more than in glia or most other non-neuronal cells. In fact,
we have already been introduced to rough ER by another name: Nissl
bodies. This organelle is stained with the dyes that Nissl introduced 100
years ago.
Rough ER is a major site of protein synthesis in neurons. RNA transcripts
bind to the ribosomes, and the ribosomes translate the instructions con-
tained in the mRNA to assemble a protein molecule. Thus, ribosomes take
raw material in the form of amino acids and manufacture proteins using
the blueprint provided by the mRNA (Figure 2.lOa).
Not all ribosomes are attached to the rough ER. Many are freely floating
and are called free ribosomes. Several free ribosomes may appear to be at-
tached by a thread; these are called polyribosomes. The thread is a single
strand of mRNA, and the associated ribosomes are working on it to make
multiple copies of the same protein.
What is the difference between proteins synthesized on the rough ER
and those synthesized on the free ribosomes? The answer appears to lie in
the intended fate of the protein molecule. If it is destined to reside within
the cytosol of the neuron, then the protein's mRNA transcript shuns the
ribosomes of the rough ER and gravitates toward the free ribosomes.
mRNA
mRNA
mRNA
Free
ribosome
I
I
Rough ER J
_ C:::::
I
I
mRNA being
translated
I ' Newl¥ created
W"
mRNA being
translated
-
/
I
- -7-> '
Newly synthesized
membrane-associated
protein
(a) Protein synthesis on a free
ribosome
(b) Protein synthesis on rough ER
... THE PROTOTYPICAL NEURON 33
\
\
.-
.... "
..
').
.."
/
. .
. .
. .
. . .
,'.
\
.
'/
\ .
\.....
J
--------' Ie
Nucleus
Nuclear
envelope
Nuclear
pore
r r r "
"
Rough ER
Ribosomes
FIGURE 2.9
Rough endoplasmic reticulum, or
rough ER.
'-.
FIGURE 2.10
Protein synthesis on a free ribosome
and on rough ER. Messenger RNA
(mRNA) binds to a ribosome. initiating pro-
tein synthesis. (a) Proteins synthesized on
free ribosomes are destined for the cytosol.
(b) Proteins synthesized on the rough ER
are destined to be enclosed by or inserted
into the membrane. Membrane-associated
proteins are inserted into the membrane as
they are assembled.
34 C H A PT E R 2 . NEURONS AND GLiA
FIGURE 2.11
The Goigi apparatus. This complex
organelle sorts newly synthesized proteins
for delivery to appropriate locations in the
neuron.
\ \
" \"
) "
"
. .
.
. . ) \
. .
.
Outer
membrane
I
I Inner
/membrane
/ Cristae
/ 1
/ / //
;? .
Matrix
(a)
...--+ °2 -+ ATP+
fPYruvi2
i<LJ
\ Protein } Dietary and stored
\ Sugar energy sources
Fat
(b)
FIGURE 2.12
The role of mitochondria. (a) Compo-
nents of a mitochondrion. (b) Cellular respira-
tion. ATP is the energy currency that fuels
biochemical reactions in neurons.
Rough ER
I
Newly synthesized Golgi
protein / apparatus
!
I
,j'
/
\
, /f
'/
. "."'"
. . j
\.
"\
. ,
/
I
/
/
----
\
( "0,- -.....
However, if the protein is destined to be inserted into the membrane of the
cell or an organelle, then it is synthesized on the rough ER. As the protein
is being assembled, it is threaded back and forth through the membrane of
the rough ER, where it is trapped (Figure 2.IGb). It is not surprising that
neurons are so well endowed with rough ER, because, as we shaH see in
later chapters, special membrane proteins are what give these ceHs their
remarka ble information - processing a bili ties.
Smooth Endoplasmic Reticulum and the Goigi Apparatus. The re-
mainder of the cytosol of the soma is crowded with stacks of membranous
organelles that look a lot like rough ER without the ribosomes, so much so
that one type is called smooth endoplasmic reticulum, or smooth ER.
Smooth ER is actually quite heterogeneous and performs different func-
tions in different locations. Some smooth ER is continuous with rough ER
and is believed to be a site where the proteins that jut out from the mem-
brane are carefully folded, giving them their three-dimensional structure.
Other types of smooth ER play no direct role in the processing of protein
molecules but instead regulate the internal concentrations of substances
such as calcium. (This organelle is particularly prominent in muscle cells,
where it is called sarcoplasmic reticulum, as we will see in Chapter 13.)
The stack of membrane-enclosed disks in the soma that lies farthest from
the nucleus is the Goigi apparatus, first described in 1898 by Camillo
Golgi (Figure 2.] I). This is a site of extensive "post-translational" chemical
processing of proteins. One important function of the Golgi apparatus is
believed to be the sorting of certain proteins that are destined for delivery
to different parts of the neuron, such as the axon and the dendrites.
The Mitochondrion. Another very abundant organelle in the soma is the
mitochondrion (plural: mitochondria). In neurons, these sausage-shaped
structures measure about I pm in length. Within the enclosure of their
outer membrane are multiple folds of inner membrane called cristae (singu-
lar: crista). Between the cristae is an inner space called matrix (Figure 2.12a).
Mitochondria are the site of cellular respiration (Figure 2.12b). When a
mitochondrion "inhales," it pulls inside pyruvic acid (derived from sugars
and digested proteins and fats) and oxygen, both of which are floating in the
cytosol. Within the inner compartment of the mitochondrion, pyruvic acid
enters into a complex series of biochemical reactions called the Krebs cycle,
named after the German-British scientist Hans Krebs, who first proposed it
in 1937. The biochemical products of the Krebs cycle provide energy that,
in another series of reactions within the cristae (called the electron-trans-
port chain), results in the addition of phosphate to adenosine diphosphate
(ADP), yielding adenosine triphosphate (ATP), the cell's energy source.
When the mitochondrion "exhales," 17 ATP molecules are released for
every molecule of pyruvic acid that had been taken in.
ATP is the energy currency of the cell. The chemical energy stored in ATP is
used to fuel most of the biochemical reactions of the neuron. For example,
as we shall see in Chapter 3, special proteins in the neuronal membrane
use the energy released by the breakdown of ATP into ADP to pump cer-
tain substances across the membrane to establish concentration differences
between the inside and the outside of the neuron.
The Neuronal Membrane
The neuronal membrane serves as a barrier to enclose the cytoplasm inside
the neuron and to exclude certain substances that float in the fluid that bathes
the neuron. The membrane is about 5 nm thick and is studded with proteins.
As mentioned earlier, some of the membrane-associated proteins pump sub-
stances from the inside to the outside. Others form pores that regulate which
substances can gain access to the inside of the neuron. An important char-
acteristic of neurons is that the protein composition of the membrane varies
depending on whether it is in the soma, the dendrites, or the axon.
The function of neurons cannot be understood without understanding the struc-
ture and function of the membrane and its associated proteins. In fact, this topic
is so important that we'll spend a good deal of the next four chapters look-
ing at how the membrane endows neurons with the remarkable ability to
transfer electrical signals throughout the brain and body.
The Cytoskeleton
Earlier, we compared the neuronal membrane to a circus tent that was draped
on an internal scaffolding. This scaffolding is called the cytoskeleton, and
it gives the neuron its characteristic shape. The "bones" of the cytoskeleton
are the microtubules, microfilaments, and neurofilaments (Figure 2.13). By
drawing an analogy with a scaffolding, we do not mean that the cytoskele-
ton is static. On the contrary, elements of the cytoskeleton are dynamically
regulated and are very likely in continual motion. Your neurons are proba-
bly squirming around in your head even as you read this sentence.
Microtubules. Measuring 20 nm in diameter, microtubules are big and
run longitudinally down neurites. A microtubule appears as a straight,
thick-walled hollow pipe. The wall of the pipe is composed of smaller
strands that are braided like rope around the hollow core. Each of the
smaller strands consists of the protein tubulin. A single tubulin molecule is
small and globular; the strand consists of tubulins stuck together like pearls
on a string. The process of joining small proteins to form a long strand is
called polymerization; the resulting strand is called a polymer. Polymerization
and depolymerization of microtubules and, therefore, of neuronal shape
can be regulated by various signals within the neuron.
One class of proteins that participate in the regulation of microtubule as-
sembly and function are microtubule-associated proteins, or MAPs. Among
other functions (many of which are unknown), MAPs anchor the micro-
tubules to one another and to other parts of the neuron. Pathological
changes in an axonal MAP, called tau, have been implicated in the de-
mentia that accompanies Alzheimer's disease (Box 2.3).
Tubulin
molecule
20
Microtubule
... THE PROTOTYPICAL NEURON 35
I(
"'"
,
)
. .
. .
. ."
o . '
\,
.
.
Actin-
molecule ,
'\*
10 nm 'y
Neurofilament
H
5nm
Microfilament
FIGURE 2.13
Components of the cytoskeleton.
The arrangement of microtubules. neurofila-
ments. and microfilaments gives the neuron
Its charactenstlc shape.
36 C H A PT E R 2 . NEURONS AND GLIA
Box 2.3
.... , .
I
.
..
OF SPECIAL INTEREST
'"
..
Alzheimer's Disease and
the Neuronal Cytoskeleton
Neurites are the most remarkable structura feature of a
neuron. Their elaborate branching patterns, critical for
information processing, reflect the organization of the
underlying cytoskeleton. It is therefore no surprise that
a devastating loss of brain function can result when the
cytoskeleton of neurons is disrupted. An example is
Alzheimer's disease, which is characterized by the disrup-
tion of the cytoskeleton of neurons in the cerebral cor-
tex, a region of the brain crucial for cognitive function.
This disorder and its underlying brain pathology were
first described in 1907 by the German physician A.
Alzheimer in a paper titled "A Characteristic Disease of
the Cerebral Cortex." Below are excerpts from the Eng-
lish translation.
One of the first disease symptoms of a 51-year-old
woman was a strong feeling of jealousy toward her
husband. Very soon she showed rapidly increasing
memory impairments; she could not find her way about
her home, she dragged objects to and fro, hid herself,
or sometimes thought that people were out to kill her,
then she would start to scream loudly.
During institutionalization her gestures showed a
complete helplessness. She was disoriented as to time
and place. From time to time she would state that she
did not understand anything, that she felt confused and
totally lost. Sometimes she considered the coming of
the doctor as an official visit and apologized for not
having finished her work, but other times she would
start to yell in the fear that the doctor wanted to op-
erate on her; or there were times that she would send
him away in complete indignation, uttering phrases that
indicated her fear that the doctor wanted to damage
her woman's honor. From time to time she was com-
pletely delirious, dragging her blankets and sheets to
and fro, calling for her husband and daughter, and seem-
ing to have auditory hallucinations. Often she would
scream for hours and hours in a horrible voice.
Mental regression advanced quite steadily. After four
and a half years of illness the patient died. She was
completely apathetic in the end, and was confined to
bed in a fetal position. (Bick et aI., 1987, pp. 1-2.)
following her death, Alzheimer examined the woman's
brain under the microscope. He made particular note of
changes in the "neurofibrils," elements of the cytoskele-
ton that are stained by a silver solution.
The Bielschowsky silver preparation showed very
characteristic changes in the neurofibrils. However,
inside an apparently normal-looking cel!, one or more
single fibers could be observed that became prominent
through their striking thickness and specific impreg-
nability. At a more advanced stage, many fibrils arranged
parallel showed the same changes. Then they accumu-
lated forming dense bundles and gradually advanced to
the surface of the cell. Eventually. the nucleus and cy-
toplasm disappeared, and only a tangled bundle of fib-
rils indicated the site where once the neuron had been
located.
As these fibrils can be stained with dyes different
from the normal neurofibrils, a chemical transforma-
tion of the fibril substance must have taken place. This
might be the reason why the fibrils survived the de-
struction of the cell. It seems that the transformation
of the fibrils goes hand in hand with the storage of an
as yet not closely examined pathological product of
the metabolism in the neuron. About one-quarter to
one-third of all the neurons of the cerebral cortex
showed such alterations. Numerous neurons, especially
in the upper cell layers, had totally disappeared. (Bick
et aI., 1987, pp. 2-3.)
The severity of the dementia in Alzheimer's disease is
well correlated with the number and distribution of what
are now commonly known as neuropbrillary tangles, the
"tombstones" of dead and dying neurons (Figure A). In-
deed, as Alzheimer speculated, tangle formation in the
cerebral cortex very likely causes the symptoms of the
disease. Electron microscopy reveals that the major
components of the tangles are paired helical plaments, long
fibrous proteins braided together like strands of a rope
(Figure B). It is now understood that these filaments
consist of the microtubule-associated protein tau.
Tau normally functions as a bridge between the micro-
tubules in axons, ensuring that they run straight and
.. THE PROTOTYPICAL NEURON 37
"\
"\
7'
!
(a) (b) (c)
FIGURE A
Neurons in a human brain with Alzheimer's disease. Normal neurons contain neurofilaments but no neurofibrillary tangles. (a) Brain
tissue stained by a method that makes neuronai neurofilaments fluoresce green, showing viabJe neurons. (b) The same region of the
brain stained to show the presence of tau within neurofibrillary tangles, revealed by red fluorescence. (c) Superimposition of images in
parts a and b. The neuron indicated by the arrowhead contains neurofilaments but no tangles and, therefore. is healthy. The neuron
indicated by the large arrow has neurofilaments but also has started to show accumulation of tau and. therefore, is diseased. The
neuron indicated by the small arrow in parts band c is dead because it contains no neurofilaments.The remaining tangle is the tomb-
stone of a neuron killed by Alzheimer's disease. (Source: Courtesy of Dr John Morrison and modified from Vickers et al.. i 994.)
parallel to one another. In Alzheimer's disease, the tau de-
taches from the microtubules and accumulates in the
soma. This disruption of the cytoskeleton causes the
axons to wither, thus impeding the normal fiow of infor-
mation in the affected neurons.
What causes the changes in tau Attendon is focused
on another protein that accumulates in the brain of
Alzheimer's patients. called amyloid. The field of Alzheimer's
disease research moves very fast, but the consensus today
is that the abnormal secretion of amyloid by neurons is
the first step in the process that leads to neurofibrillary
tangle formation and dementia. Current hope for thera-
peutic intervendon is focused on strategies to reduce the
deposidons of amyloid in the brain. The need for effecdve
therapy is urgent: In the United States alone, more than 4
million people are afflicted with this tragic disease.
. !x...,,/iir..... .
.
'. \.,....- I
...: .,' 100 nm
....
FIGURE B
Paired helical filaments of a tangle, (Source:
Goedert, I 996, Fig. 2b.)
. '.
4'
38 C H A PT E R 2 . NEURONS AND GLiA
j'
V
t
'1
Axon
collaterals
FIGURE 2.14
The axon and axon collaterals. The axon
functions like a telegraph wire to send electri-
cal impulses to distant sites in the nervous
system. The arrows indicate the direction of
information 1low.
Microfilaments. Measuring only 5 nm in diameter, microfilaments are
about the same thickness as the cell membrane. Found throughout the
neuron, they are particularly numerous in the neurites. Microfilaments are
braids of two thin strands, and the strands are polymers of the protein actin.
Actin is one of the most abundant proteins in cells of all types, including
neurons, and is believed to playa role in changing cell shape. Indeed, as
we shall see in Chapter 13, actin filaments are critically involved in the
mechanism of muscle contraction.
Like microtubules, actin microfilaments are constantly undergoing as-
sembly and disassembly, and this process is regulated by signals in the
neuron. Besides running longitudinally down the core of the neurites
like microtubules, microfilaments are also closely associated with the
membrane. They are anchored to the membrane by attachments with a
meshwork of fibrous proteins that line the inside of the membrane like
a spider web.
Neurofilaments. With a diameter of 10 nm, neurofilaments are inter-
mediate in size between microtubules and microfilaments. They exist in
all cells of the body as intermediate filaments; only in neurons arc they
called neurofilaments. The difference in name actually does reflect subtle
differences in structure from one tissue to the next. An example of an
intermediate filament from another tissue is keratin, which, when bundled
together, makes up hair.
Of the types of fibrous structure we have discussed, neurofilaments most
closely resemble the bones and ligaments of the skeleton. A neurofilament
consists of multiple subunits (building blocks) that are organized like a
chain of sausages. The internal structure of each subunit consists of three
protein strands woven together. Unlike microfilaments and micro tubules,
these strands consist of individual long protein molecules, each of which is
coiled in a tight, springlike configuration. This structure makes neurofila-
ments mechanically very strong.
The Axon
So far, we've explored the soma, organelles, membrane, and cytoskeleton.
However, none of these structures is unique to neurons; they are found in
all the cells in our body. Now we encounter the axon, a structure found
only in neurons that is highly specialized for the transfer of information
over distances in the nervous system.
The axon begins with a region called the axon hillock, which tapers to
(orm the initial segment of the axon proper (Figure 2.14). Two noteworthy
features distinguish the axon from the soma:
I. No rough ER extends into the axon, and there are few, if any, (ree ri-
bosomes.
2. The protein composition of the axon membrane is fundamentally differ-
ent from that of the soma membrane.
These structural difference.s translate into functional distinctions. Because
there are no ribosomes, there is no protein synthesis in the axon. This
means that all proteins in the axon must originate in the soma. And it is
the different proteins in the axonal membrane that enable it to serve as the
"telegraph wire" that sends information over great distances.
Axons may extend from less than a millimeter to over a meter long.
Axons often branch, and these branches are called axon collaterals. Oc-
casionally, an axon collateral will return to communicate with the same cell
that gave rise to the axon or with the dendrites of neighboring cells. These
axon branches are called recurrent collaterals.
The diameter of an axon is variable, ranging from less than 1 mm to about
25 mm in humans and to as large as 1 mm in the squid. This variation in axon
size is important. As will be explained in Chapter 4, the speed of the electri-
cal signal that sweeps down the axon-the nerve impulse-varies depending on
axonal diameter. The thicker the axon, the faster the impulse travels.
The Axon Terminal. All axons have a beginning (the axon hillock), a
middle (the axon proper), and an end. The end is called the axon termi-
nal or terminal bouton (French for "button"), reflecting the fact that it
usually appears as a swollen disk (Figure 2.15). The terminal is a site where
the axon comes in contact with other neurons (or other cells) and passes
information on to them. This point of contact is called the synapse, a word
derived from the Greek, meaning "to fasten together." Sometimes axons
have many branches at their ends, and each branch forms a synapse on
dendrites or cell bodies in the same region. These branches are collectively
called the terminal arbor. Sometimes axons form synapses at swollen
regions along their length and then continue on to terminate elsewhere.
Such swellings are called boutons en passant ("buttons in passing"). In either
case, when a neuron makes synaptic contact with another cell, it is said to
innervate that cell, or to provide innervation.
The cytoplasm of the axon terminal differs from that of the axon in
several ways:
1. Microrubules do not extend into the terminal.
2. The terminal contains numerous small bubbles of membrane, called
synaptic vesicles, that measure about 50 nm in diameter.
3. The inside surface of the membrane that faces the synapse has a partic-
ularly dense covering of proteins.
4. It has numerous mitochondria, indicating a high energy demand.
'\
Presynaptic
axon terminal
I
I !:;-V
.....
-- 7 Mitochondria
///
Synapse
J
1
f "",
\,;)1':..."...
0'"
,
-- Synaptic
vesicles
"' 1 '''-'£ ,=:- - -
i- - - - : - - '-
I
f
Receptors
Postsynaptic dendrite
Synaptic
cleft
. THE PROTOTYPICAL NEURON 39
FIGURE 2.15
The axon terminal and the synapse. Axon
terminals form synapses with the dendrites
or somata of other neurons. When a nerve
impulse arrives in the presynaptic axon termi-
nal. neurotransmitter molecules are released
from synaptic vesicles into the synaptic cleft.
Neurotransmitter then binds to specific
receptor proteins. causing the generation
of electrical or chemical signals in the post-
synaptic cell.
40 C H A PT E R 2 . NEURONS AND GLiA
The Synapse. Although Chapters 5 and 6 are devoted entirely to how
information is transferred from one neuron to another at the synapse, we
provide a preview here. The synapse has two sides: presynaptic and post-
synaptic (see Figure 2.15). These names indicate the usual direction of in-
formation flow, which is from "pre" to "post." The presynaptic side gener-
ally consists of an axon terminal, while the postsynaptic side may be the
dendrite or soma of another neuron. The space between the presynaptic
and postsynaptic membranes is called the synaptic deft. The transfer of
information at the synapse from one neuron to another is called synaptic
transmission.
At most synapses, information in the form of electrical impulses traveling
down the axon is converted in the terminal into a chemical signal that
crosses the synaptic cleft. On the postsynaptic membrane, this chemical sig-
nal is converted again into an electrical one. The chemical signal is called
a neurotransmitter, and it is stored in and released from the synaptic
vesicles within the terminal. As we wiU see, different neurotransmitters are
used by different types of neurons.
This electrical-to-chemical-to-electrical transformation of information
makes possible many of the brain's computational abilities. Modification of
this process is involved in memory and learning, and synaptic transmission
dysfunction accounts for certain mental disorders. The synapse is also the
site of action for many toxins and for most psychoactive drugs.
Axoplasmic Transport. As mentioned, one feature of the cytoplasm of
axons, including the terminal, is the absence of ribosomes. Because ribo-
somes are the protein factories of the cell, their absence means that the pro-
teins of the axon must be synthesized in the soma and then shipped down
the axon. Indeed, in the mid-nineteenth century, English physiologist Au-
gustus Waller showed that axons cannot be sustained when separated from
their parent cell body. The degeneration ofaxons that occurs when they
are cut is now called WalLerian degeneration. Because it can be detected with
certain staining methods, Wallerian degeneration is one way to trace ax-
onal connections in the brain.
Wallerian degeneration occurs because the normal flow of materials from
the soma to the axon terminal is interrupted. This movement of material
down the axon is called axoplasmic transport, first demonstrated directly
by the experiments of American neurobiologist Paul Weiss and his col-
leagues in the 1940s. They found that if they tied a thread around an axon,
material accumulated on the side of the axon closest to the soma. When
the knot was untied, the accumulated material continued down the axon
at a rate of 1-10 mm per day.
This was a remarkable discovery, but it is not the whole story. If all
material moved down the axon by this transport mechanism alone, it
would not reach the ends of the longest axons for at least half a year-too
long a wait to feed hungry synapses. In the late 1960s, methods were
developed to track the movements of protein molecules down the axon
into the terminal. These methods entailed injecting the somata of neurons
with radioactive amino acids. Recall that amino acids are the building
blocks of proteins. The "hot" amino acids were assembled into proteins, and
the arrival of radioactive proteins in the axon terminal was measured to
calculate the rate of transport. Bernice Grafstein of Rockefeller University
discovered that this fast axoplasmic transport (so named to distinguish it from
slow axoplasmic transport described by Weiss) occurred at a rate as high as
1000 mm per day.
Much is now known about how axoplasmic transport works. Material is
enclosed within vesicles, which then "walk down" the microtubules of the
FIGURE 2.16
A mechanism for the movement of material on
the microtubules of the axon. Trapped in membrane-
enclosed vesicles, material is transported from the soma to
the axon terminal by the action of the protein kinesin, which
"walks" along microtubules at the expense of ATP.
Direction of
anterograde
transport
Axon
..
Vesicle
1\
-\
,
, .-
.....
-- =-=-=
- "'.. ----. Kinesin
" J
.:i"-
/
Microtubules
axon. The "legs" are provided by a protein called kinesin, and the process is
fueled by ATP (Figure 2.16). Kinesin moves material only from the soma to
the terminal. All movement of material in this direction is called antero-
grade transport.
In addition to anterograde transport, there is a mechanism for the move-
ment of material up the axon from the terminal to the soma. This process
is believed to provide signals to the soma aboUl changes in the metabolic
needs of the axon terminal. Movement in this direction, from terminal to
soma, is called retrograde transport. The molecular mechanism is simi-
lar to anterograde transport, except the "legs" for retrograde transport are
provided by a different protein, dynein. Both anterograde and retrograde
transport mechanisms have been exploited by neuroscientists to trace con-
nections in the brain (Box 2.4).
Dendrites
The term dendrite is derived from the Greek for "tree," reflecting the fact that
these neurites resemble the branches of a tree as they extend from the soma.
The dendrites of a single neuron are collectively called a dendritic tree;
each branch of the tree is called a dendritic branch. The wide variety of shapes
and sizes of dendritic trees are used to classify different groups of neurons.
Because dendrites function as the antennae of the neuron, they are
covered with thousands of synapses (Figure 2.17). The dendritic membrane
under the synapse (the postsynaptic membrane) has many specialized pro-
tein molecules called receptors that detect the neurotransmitters in the
synaptic cleft.
.,. THE PROTOTYPICAL NEURON 41
"1:ot
\
FIGURE 2.17
Dendrites receiving synaptic inputs
from axon terminals. A neuron has been
made to fluoresce green. using a method
that reveals the distribution of a microtubule-
associated protein. Axon terminals have been
made to fluoresce orange-red, using a method
to reveal the distribution of synaptic vesicles.
The axons and cell bodies that contribute
these axon terminals are not visible in this
photomicrograph. (Source: Neuron 10 [Suppl.],
1993, cover image.)
42 C H APT E R 2 . NEURONS AND GLiA
Box 2.4
.... ,
..,
OF SPECIAL INTEREST
,
'
Hitching a Ride
With Retrograde Transport
The dendrites of some neurons are covered with specialized structures
called dendritic spines that receive some types of synaptic input. Spines
look like little punching bags that hang off the dendrite (Figure 2. I 8). The
unusual morphology of spines has fascinated neuroscientists ever since
their discovery by Cajal. They are believed ro isolate various chemical
reactions that are triggered by some types of synaptic activation. Spine
structure is sensitive ro the type and amount of synaptic activity. Unusual
changes in spines have been shown ro occur in the brains of individuals
with cognitive impairments (Box 2.5). William Greenough of the Univer-
sity of Illinois at Urbana discovered that spine number is also very sensitive
to the quality of the environment experienced during early development
and in adulthood (Box 2.6).
Fast anterograde transport of proteins in axons was
shown by injecting the soma with radioactive amino acids.
The success of this method immediately suggested a way
to trace connections in the brain. For example, to deter-
mine where neurons in the eye send heir axons, the eye
was injected with radioactive proline, an amino acid. The
proline was incorporated into proteins in the somata that
were then transported to the axon terminals. By use of a
technique called autoradiography, the location of radioac-
tive axon terminals could be detected, thereby revealing the
extent of the connection between the eye and the brain.
Researchers subsequently discovered that retrograde
transport could also be exploited to work out connec-
tions in the brain. Strangely enough, the enzyme horse-
radish peroxidase (HRP) is selectively taken up by axon
terminals and then transported retrogradely to the soma.
A chemical reaction can then be initiated to visualize the
location of the HRP in slices of brain tissue. This method
is commonly used to trace connections in the brain (Fig-
ure A).
Some viruses also exploit retrograde transport to in-
fect neurons. For example, the oral type of herpesvirus
enters axon terminals in the lips and mouth and is then
transported back to the parent cell bodies. Here the virus
usually remains dormant until physical or emotional stress
occurs (as on a first date), at which time it replicates and
returns to the nerve ending, causing a painful cold sore.
Similarly, the rabies virus enters the nervous system by
.
.
,
"
retrograde transport through axons in the skin. However,
once inside the soma, the virus wastes no time in repli-
cating madly, killing its neuronal host. The virus is then
taken up by other neurons within the nervous system,
and the process repeats itself again and again, usually until
the victim dies.
Two days later,
after retrograde
transport:
Inject HRP:
\
HRP
deposit
in brain
HRP-Iabeled
neurons
FIGURE A
FIGURE 2.18
Dendritic spines. This is a computer reconstruction of a segment of dendrite. showing the
variable shapes and sizes of spines, Each spine is postsynaptic to one or two axon terminals.
(Source: Harris and Stevens. 1989, cover image.)
Box 2.5
... , .
I
.. I
.. .
... THE PROTOTYPICAL NEURON 43
OF SPECIAL INTEREST
Mental Retardation and Dendritic Spines
The elaborate architecture of a neuron's dendritic tree is
a good reflection of the complexity of ts synaptic connec-
tions with other neurons. Brain function depends on these
highly precise synaptic connections, which are formed
during the fetal period and are refined during infancy and
early childhood. Not surprisingly, this very complex de-
velopmental process is vulnerable to disruption. Mental re-
tardation is said to have occurred if a disruption of brain
development results in subaverage cognitive functioning
that impairs adaptive behavior.
The use of standardized tests indicates that intelli-
gence in the general population is distributed along a
bell-shaped (Gaussian) curve. By convention, the mean in-
telligence quotient (IQ) is set to be 100. About two-
thirds of the total population falls within 15 points (one
standard deviation) of the mean, and 95% of the popula-
tion falls within 30 points (two standard deviations). Peo-
ple with intelligence scores below 70 are considered to
be mentally retarded if the cognitive impairment affects
the person's ability to adapt his or her behavior to the
setting in which he or she lives. Some 2-3% of humans
fit this description.
Mental retardation has many causes. The most severe
forms are associated with genetic disorders. An example
is a condition called phenylketonuria (PKU). The basic ab-
normaHty is a deficit in the liver enzyme that metabolizes
the dietary amino acid phenylalanine. Infants born with
PKU have an abnormally high leve! of the amino acid in
the blood and brain. If the condition goes untreated, brain
growth is stunted and severe mental retardation results.
Another example is Down syndrome, which occurs when the
fetus has an extra copy of chromosome 21, thus disrupt-
ing normal gene expression during brain development.
A second known cause of mental retardation is acci-
dents during pregnancy and childbirth. Examples are
maternal infections with German measles (rubella) and
asphyxia during childbirth. A third cause of mental re-
tardation is poor nutrition during pregnancy. An exam-
ple is fetal alcohol syndrome, a constellation of develop-
mental abnormalities that occur in children born to
alcoholic mothers. A fourth cause, thought to account
for the majority of cases, is environmental impoverish-
ment-the lack of good nutrition, socialization, and sen-
sory stimulation-during infancy.
While some forms of mental retardation have very
clear physical correlates (e.g., stunted growth; abnormali-
ties in the structure of the head, hands, and body), most
cases have only behavioral manifestations. The brains of
these individuals appear grossly normal. How, then, do
we account for the profound cognitive impairment? An
important clue came in the 1970s from the research of
Miguel Marin-Padilla, working at Dartmouth College, and
Dominick Purpura, working at the Albert Einstein College
of Medicine in New York City. Using the Golgi stain, they
studied the brains of retarded children and discovered
remarkable changes in dendritic structure. The dendrites
of retarded children had many fewer dendritic spines, and
the spines that they did have were unusually long and thin
(Figure A). The extent of the spine changes was well cor-
related with the degree of mental retardation.
Dendritic spines are an important target of synaptic
input. Purpura pointed out that the dendritic spines of
mentally retarded children resemble those of the normal
human fetus. He suggested that mental retardation re-
flects the failure of normal circuits to form in the brain.
In the 3 decades since this seminal work was published,
it has been established that normal synaptic development,
including maturation of the dendritic spines, depends crit-
ically on the environment during infancy and early child-
hood.An impoverished environment during an early"crit-
ical period" of development can lead to profound changes
in the circuits of the brain. However, there is some good
news. Many of the deprivation-induced changes in the
brain can be reversed if intervention occurs early enough.
In Chapter 22, we will take a closer look at the role of
experience in brain development.
Dendrite from a
normal infant
10 !!m
Dendrite from a
mentaUy retarded
infant
FIGURE A
Normal and abnormal dendrites. (Source: Purpua. 1974. Fig. 2A.)
44 C HAP T E R 2 . NEURONS AND GLIA
Box 2.6
-ATH OF DISCOVERY
lit
.i ""'-
.::;:: ..
Spines and the
Structural Basis of Memory
It is a frequent misconception that scientific research re-
sults in simple, clear answers to questions. The truth is
that almost every answer results in a whole battery of
new questions. But the research serves to increase our
understanding so that we know how to frame the new
questions, and try to tackle them.
When we first saw polyribosomes below synapses in
dendritic spines, we asked: "What are they doing away
from the soma, where mRNA is usually translated?" An
exciting possibility was that they might make special
proteins that were involved in remodeling the synapse.
I had seen that in animals exposed to enriched envi-
ronments, new spines were made and other spines were
remodeled from small to larger structures with-pre-
sumably-more efficient signaling. Could these synaptic
polyribosomes be manufacturing crucial proteins that
could account for the improved efficiency? Some kind
of "memory proteins"?
I recalled a paper by Hollingsworth, in which he figured
out a way to shear off synapses on spines, a preparation
called synaptoneurosomes (Figure A), and study them bio-
chemically. My colleague Ivan Jeanne Weiler and I at-
tempted to isolate the mRNA in synaptoneurosomes to
identify the crucial "memory proteins." Repeated failures,
due apparently to mRNA degradation, both frustrated
and slowed us. But eventually we found that some of the
mRNA was being incorporated into polyribosomes, mean-
ing that protein was being synthesized. We then discov-
ered that this protein synthesis was strongly increased
when we stimulated the synaptoneurosomes with the
neurotransmitter glutamate, and we were able to identify
the glutamate receptor that was responsible. We now
thought we were poised to isolate the "memory pro-
teins" from the newly assembled polyribosomes.
We set up to harvest polyribosomes from stimulated and
unstimulated synaptoneurosomes to see which mRNAs
were translated in response to glutamate. About this time,
Jim Eberwine (University of Pennsylvania) told us about the
mRNAs he had isolated from single dendrites. We looked
for their translation in our new system, and the first one
that was increased by stimulation turned out to be the
fragile X mental retardation protein (FMRP). This has led
-
by William Greenough
us to study brain abnormalities in fragile X syndrome, the
largest cause of inherited mental retardation.
Do we now, at last, have a "memory protein"? Not yet,
because FMRP is not a structural or receptor protein, but
a protein that binds mRNA. It seems to orchestrate the
translation of an impressive array of other mRNAs, few
of which, at first glance, look like "memory proteins." But,
if FMRP is a key to how the synapse changes itself, then
we think we are still on the right track to understand
synaptic remodeling. Indeed, people with fragile X syn-
drome have immature-appearing synapses.
So we have been wrong a lot of the time, and frus-
trated on a near-weekly basis. Nature is fun of surprises,
but we have increased our understanding of synaptic pro-
tein synthesis. Indeed, we are now asking new questions
that may help us understand and possibly treat the lead-
ing inherited form of mental retardation. It was worth the
effort.
"f
1
\ Spine
t
,.
'..
.
Synaptic
polyribosome
complex
Axon terminal
..
,
FIGURE A
Electron micrograph of a synaptoneurosome. The spine is
about I micron in diameter. (Courtesy of William Greenough.)
.... CLASSIFYING NEURONS 45
For the most part, the cytoplasm of dendrites resembles that ofaxons. It
is filled with cytoskeletal elements and mitochondria. One interesting dif-
ference was discovered by neuroscientist Oswald Steward. He found that
polyribosomes can be observed in dendrites, often right under spines. Stew-
ard's research suggests that synaptic transmission can actually direct local
protein synthesis in some neurons. In Chapter 25, we will see that synaptic
regulation of protein synthesis is crucial for information storage by the brain.
... CLASSIFYING NEURONS
It is unlikely that we can ever hope to understand how each of the hun-
dred billion neurons in the nervous system uniquely contributes to the
function of the brain. But what if we could show that all the neurons in
the brain can be divided into a small number of categories, and that within
each category, all neurons function identically? The complexity of the prob-
lem might then be reduced to understanding the unique contribution of
each category, rather than each cell. It is with this hope that neuroscien-
tists have devised schemes for classifying neurons.
Classification Based on the Number of Neurites
Neurons can be classified according to the total number of neurites (axons
and dendrites) that extend from the soma (Figure 2.19). A neuron that has
a single neurite is said to be unipolar. If there are two neurites, the cell is
bipolar, and if there are three or more, the cell is multipolar. Most neurons
in the brain are multipolar.
Classification Based on Dendrites
Dendritic trees can vary widely from one type of neuron to another. Some
have inspired elegant names like "double bouquet cells." Others have less
interesting names, such as "alpha cells." Classification is often unique to a
particular part of the brain. For example, in the cerebral cortex (the struc-
ture that lies just under the surface of the cerebrum), there are two broad
classes: stellate cells (star-shaped) and pyramidal cells (pyramid-shaped)
(Figure 2.20).
Unipolar
Multipolar
Bipolar
FIGURE 2.19
Classification of neurons based on the number of neurites.
46 C H A PT E R 2 . NEURONS AND GLiA
(
c
J, fri1_/
' J;4
'---1
3__ ....... J"
- ,-f_________
_J
'" - '--
___ .r \
' '"
-----/ f..
( Jr
Stellate cell
""'\
I
.If
i
"-
,
\
)
Pyramidal cell
-
-'\
r-
FIGURE 2.20
Classification of neurons based on
dendritic tree structure. Stellate cells
and pyramidal cells, distinguished by the
arrangement of their dendrites, are two types
of neurons found in the cerebral cortex.
Another simple way to classify neurons is according to whether their
dendrites have spines. Those that do are called spiny, and those that do
not are called aspinous. These dendritic classification schemes can overlap.
For example, in the cerebral cortex, all pyramidal cells are spiny. Stellate
cells, on the other hand, can be either spiny or aspinous.
Classification Based on Connections
Information is delivered to the nervous system by neurons that have neu-
rites in the sensory surfaces of the body, such as the skin and the retina of
the eye. Cells with these connections are called primary sensory neurons.
Other neurons have axons that form synapses with the muscles and com-
mand movements; these are called motor neurons. But most neurons in
the nervous system form connections only with other neurons. According
to this classification scheme. these cells are all called interneurons.
Classification Based on Axon Length
Some neurons have long axons that extend from one part of the brain to
the other; these are called Golgi type I neurons, or projection neurons. Other
neurons have short axons that do not extend beyond the vicinity of the ceJl
body; these are called Golgi type II neurons. or local circuit neurons. In the
cerebral cortex, for example, pyramidal cells usually have long axons that
extend to other parts of the brain and are therefore Golgi type I neurons.
In contrast, stellate cells have axons that never extend beyond the cerebral
cortex and are therefore Golgi type II neurons.
Classification Based on Neurotransmitter
The classification schemes presented so far are based on the morphology of
neurons as revealed by a Golgi stain. Newer methods that enable neuro-
scientists to identify which neurons contain specific neurotransmitters have
resulted in a scheme for classifying neurons based on their chemistry. For
example, the motor neurons that command voluntary movements all release
the neurotransmitter acetylcholine at their synapses. These cells are therefore
also classified as cholinergic, meaning that they use this particular neuro-
transmitter. Collections of cells that use a common neurotransmitter make
up the brain's neurotransmitter systems (see Chapters 6 and 15).
... GLiA
We have devoted most of our attention in this chapter to the neurons.
While this decision is justified by the state of current knowledge, some neu-
roscientists consider glia to be the "sleeping giants" of neuroscience. One
day, they suppose, it will be shown that glia contribute much more impor-
tantly to information processing in the brain than is currently appreciated.
At present, however, the evidence indicates that glia contribute to brain
function mainly by supporting neuronal functions. Although their role may
be subordinate, without glia, the brain could not function properly.
Astrocytes
The most numerous glia in the brain are called astrocytes (Figure 2.21).
These cells fill the spaces between neurons. The space that remains between
the neurons and the astrocytes in the brain measures only about 20 nm
wide. Consequently, astrocytes probably influence whether a neurite can
grow or retract. And when we speak of fluid "bathing" neurons in the brain,
it is more like a soaking from a hose than immersion in a swimming pool.
An essential role of astrocytes is regulating the chemical content of this
extracellular space. For example, astrocytes envelop synaptic junctions in the
brain, thereby restricting the spread of neurotransmitter molecules that
have been released. Astrocytes also have special proteins in their mem-
branes that actively remove many neurotransmitters from the synaptic
cleft. A recent and unexpected discovery is that astrocytic membranes also
possess neurotransmitter receptors that, like the receptors on neurons, can
trigger electrical and biochemical events inside the glial cell. Besides regu-
lating neurotransmitters, astrocytes also tightly control the extracellular
concentration of several substances that have the potential to interfere with
proper neuronal function. For example, astrocytes regulate the concentra-
tion of potassium ions in the extracellular fluid.
Myelinating Glia
Unlike astrocytes, the primary function of oligodendroglial and Schwann
cells is clear. These glia provide layers of membrane that insulate axons.
Boston University anatomist Alan Peters, a pioneer in the electron micro-
scopic study of the nervous system, showed that this wrapping, called
myelin, spirals around axons in the brain (Figure 2.22). Because the axon
fits inside the spiral wrapping like a sword in its scabbard, the name myelin
sheath describes the entire covering. The sheath is interrupted periodically,
leaving a short length where the axonal membrane is exposed. This region
is called a node of Ranvier (Figure 2.23).
cells
Myelin
sheath
t"", -=..:: 1--
.:'\\ -o"_
, __I!i/; .- :,- -
--=c.--==- . ' II
.: ..:::.'&) - . \ 7
'----y---l "- '
Cytoplasm of Node of
oligodendroglial cell Ranvier Mitochondrion
'" GLiA 47
\j
'-
--
'"
FIGURE 2.21
An astrocyte. Astrocytes fill most of the
space in the brain that IS not occupied by
neurons and blood vessels.
"J; \';--'- -' f
-..;... .I" -- ,,":;:-:-. =. ,- (
. '. . .
, . .:j-::-;-: . d..
'\ :';,:"-:.r:?', " "-
\ . .. 61' 'O.OoD .- ,\
(.;:\ -, . :.-:... .:'J) \\,,,
'". .>.' ' ,, ",.. _:: y{ "
--' S-:::: - .
. \.,... Q _ -'- '> \) ;;r ",_
\" C'. e (-
- ">; ..- j I!! ,I"'"" ..-: ::::.
,., '",. .. ..- I. I r--. M ."."::--"
" -" : '(.: " <:'-f.....
1,/ . .:..?... ;-.6:..).L.
/, ' . ,,\.. .... . c /
., \ 1, .fJ...... . . > .,'
... .. r .T.). \
Q' . -, Q !_>';:.", ./'\,
, . . , -' - -- -: ,;,:
" "t :' . "'''' \T >
''; . '. :..::,.-' ,
G' I, .
.. .. -,
/
-. -
.;; -"
'-. . ,;f.,
.:_. ;
FIGURE 2.22
Myelinated optic nerve fibers cut in
cross section. (Source: Courtesy of Dr. Alan
Peters.)
FIGURE 2.23
An oligodendroglia! cell. Like the
Schwann cells found in the nerves of the
body, oligodendroglia provide myelin sheaths
around axons in the brain and spinal cord.
The myelin sheath of an axon is Interrupted
periodically at the nodes of Ranvier.
48 C H A PT E R 2 . NEURONS AND GLiA
.-
>-V)
wI:
a:::
w
.....
Introduction
neuron (p. 24)
glial cell (p. 24)
The Neuron Doctrine
histology (p. 25)
Nissl stain (p. 25)
cytoarchitecture (p.25)
Golgi stain (p.26)
cell body (p.26)
soma (p.26)
perikaryon (p.26)
neurite (p. 26)
axon (p.26)
dendrite (p. 26)
neuron doctrine (p.27)
We will see in Chapter 4 that myelin serves to speed the propagation of
nerve impulses down the axon. Oligodendroglia and Schwann cells differ
in their location and some other characteristics. For example, oligoden-
droglia are found only in the central nervous system (brain and spinal
cord), while Schwann cells are found only in the peripheral nervous sys-
tem (parts outside the skull and vertebral column). Another difference is
that one oligodendroglial cell will contribute myelin to several axons, while
each Schwann cell myelinates only a single axon.
Other Non-Neuronal Cells
Even if we eliminated every neuron, every astrocyte, and every oligoden-
droglial cell, other cells would still remain in the brain. For the sake of com-
pleteness, we must mention these other cells. First, special cells called
ependymal cells provide the lining of fluid-filled ventricles within the
brain, and they also playa role in directing cell migration during brain de-
velopment. Second, a class of cells called microglia function as phagocytes
to remove debris left by dead or degenerating neurons and glia. Finally, the
vasculature of the brain-arteries, veins, and capillaries-would still be there.
T CONCLUDING REMARKS
Learning about the structural characteristics of the neuron provides insight
into how neurons and their different parts work, because structure corre-
lates with function. For example, the absence of ribosomes in the axon
correctly predicts thar proteins in the axon terminal must be provided by
the soma via axoplasmic transport. A large number of mitochondria in the
axon terminal correctly predicts a high energy demand. The elaborate
structure of the dendritic tree appears ideally suited for the receipt of in-
coming information, and indeed, this is where most of the synapses are
formed with the axons of other neurons.
From the time of Nissl, it has been recognized that an important feature
of neurons is the rough ER. What does this tell us about neurons? We have
said that rough ER is a site of the synthesis of proteins destined to be in-
serted into the membrane. We will now see how the various proteins in
the neuronal membrane give rise to the unique capabilities of neurons to
transmit, receive, and store information.
The Prototypical Neuron
cytosol (p. 28)
organelle (p. 28)
cytoplasm (p. 30)
nucleus (p. 30)
chromosome (p.30)
DNA (deoxyribonucleic acid)
(p. 30)
gene (p. 30)
gene expression (p. 30)
protein (p. 30)
protein synthesis (p. 30)
mRNA (messenger ribonucleic
acid) (p. 30)
transcription (p. 30)
promoter (p. 30)
transcription factor (p. 30)
RNA splicing (p. 30)
amino acid (p. 31)
translation (p. 3 I)
ribosome (p. 3 I)
rough endoplasmic reticulum
(rough ER) (p. 33)
polyribosome (p. 33)
smooth endoplasmic reticulum
(smooth ER) (p. 34)
Golgi apparatus (p. 34)
mitochondrion (p. 34)
ATP (adenosine triphosphate)
(p. 35)
neuronal membrane (p. 35)
cytoskeleton (p. 35)
.... CONCLUDING REMARKS 49
microtubule (p. 35)
microfilament (p. 38)
neurofilament (p. 38)
axon hillock (p. 38)
axon collateral (p. 38)
axon terminal (p.39)
terminal bouton (p. 39)
synapse (p.39)
terminal arbor (p. 39)
innervation (p. 39)
synaptic vesicle (p. 39)
synaptic cleft (p. 40)
synaptic transmission (p. 40)
neurotransmitter (p.40)
axoplasmic transport (p. 40)
anterograde transport (p. 41)
retrograde transport (p. 41)
dendritic tree (p. 41)
receptor (p. 41 )
dendritic spine (p. 42)
aspinous neuron (p. 46)
primary sensory neuron (p.46)
motor neuron (p. 46)
interneuron (p.46)
Glia
astrocyte (p. 46)
oligodendroglial cell (p. 47)
Schwann cell (p.47)
myelin (p. 47)
node of Ranvier (p. 47)
ependymal cell (p. 48)
microglial cell (p. 48)
Classifying Neurons
unipolar neuron (p. 45)
bipolar neuron (p. 45)
multipolar neuron (p. 45)
stellate cell (p.45)
pyramidal cell (p. 45)
spiny neuron (p.46)
,ftJ
V)
z
w
0
>
W .....
V)
w
::>
a
I. State the neuron doctrine in a single sentence. To whom is this insight credited
2. Which parts of a neuron are shown by a Golgi stain that are not shown by a Nissl stain
3. What are three physical characteristics that distinguish axons from dendrites?
4. Of the following structures. state which ones are unique to neurons and which are not: nucleus, mitochon-
dria, rough ER. synaptic vesicle. Golgi apparatus.
5. What are the steps by which the information in the DNA of the nucleus directs the synthesis of a
membrane-associated protein molecule?
6. Colchicine is a drug that causes microtubules to break apart (depolymerize). What effect would this drug
have on anterograde transport What would happen in the axon terminal
7. Classify the cortical pyramidal cell based on (a) the number of neurites, (b) the presence or absence of
dendritic spines. (c) connections. and (d) axon length.
8. What is myelin What does it do Which cells provide it in the central nervous system
DO
W z
I-
.....0
«
::>w
LL.
Jones EG. 1999. Golgi. Cajal and the Neuron Doc-
trine. Journal of the History of Neurosdence 8:
170-178.
Peters A. Palay SL. Webster H deF. 1991. The Fine
Structure of the Nervous System, 3rd ed. New York
Oxford University Press.
Purves WK. Sadava D. Orians GH. Heller HC 200 I.
Ufe: The Sdence of Biology. 6th ed. Sunderland. MA:
Sinauer.
Steward O. Schuman EM. 200 I. Protein synthesis
at synaptic sites on dendrites. Annual Review of
Neuroscience 24:299-325.
The Neuronal Membrane
at Rest
INTRODUCTION
THE CAST OF CHEMICALS
CYTOSOL AND EXTRACELLULAR FLUID
Water
Ions
THE PHOSPHOLIPID MEMBRANE
The Phospholipid Bilayer
PROTEIN
Protein Structure
Channel Proteins
Ion Pumps
THE MOVEMENT OF IONS
DIFFUSION
. Box 3.1 Brain Food: A Review of Moles and Molarity
ELECTRICITY
THE IONIC BASIS OF THE RESTING MEMBRANE POTENTIAL
EQUILIBRIUM POTENTIALS
The Nernst Equation
. Box 3.2 Brain Food: The Nernst Equation
THE DISTRIBUTION OF IONS ACROSS THE MEMBRANE
RELATIVE ION PERMEABILITIES OF THE MEMBRANE AT REST
. Box 3.3 Brain Food: The Goldman Equation
The Wide World of Potassium Channels
. Box 3.4 Path of Discovery: The Atomic Structure of a Potassium Channel,
by Roderick MacKinnon
The Importance of Regulating the External Potassium Concentration
. Box 3.5 Of Special Interest: Death by Lethal Injection
CONCLUDING REMARKS
CHAPTER
52 C HAP T E R 3 . THE NEURONAL MEMBRANE AT REST
FIGURE 3.1
A simple reflex. (j) A person steps on
a thumbtack. @ The breaking of the skin IS
translated into signals that travel up sensory
nerve fibers (the direction of information fiow,
indicated by the arrows). @ In the spinal cord,
the information is distributed to interneurons.
Some of these neurons send axons to the
brain where the painful sensation is registered
Others synapse on motor neurons, which
send descending signals to the muscles. @ The
motor commands lead to muscle contraction
and withdrawal of the foot.
CD
J.
'Y INTRODUCTION
Consider the problem your nervous system confronts when you step on a
thumbtack. Your reactions are automatic You shriek with pain as you jerk
up your (oot. In order (or this simple response to occur, breaking of the skin
by the tack must be translated into neural signals that travel rapidly and
reliably up the long sensory nerves of your leg. In the spinal cord, these
signals are transferred to interneurons. Some of these neurons connect
with the parts o( your brain that interpret the signals as being painful.
Others connect to the motor neurons that control the leg muscles that
withdraw your (oot. Thus, even this simple reflex, depicted in Figure 3.1,
requires the nervous system to collect, distribute, and integrate information. A
goal of cellular neurophysiology is to understand the biological mechanisms
that underlie these functions.
The neuron solves the problem of conducting information over a distance
by using electrical signals that sweep along the axon. In this sense, axons
act like telephone wires. However, the analogy stops here, because the type
of signal used by the neuron is constrained by the special environment of
the nervous system. In a copper telephone wire, information can be trans-
ferred over long distances at a high rate (about half the speed of light) be-
cause telephone wire is a superb conductor of electrons, is well insulated,
and is suspended in air (air being a poor conductor of electricity). Electrons
will, therefore, move within the wire instead of radiating away. In contrast,
electrical charge in the cytosol of the axon is carried by electrically charged
atoms (ions) instead of free electrons. This makes cytosol far less conduc-
tive than copper wire. Also, the axon is not especially well insulated and is
bathed in salty extracellular fluid, which conducts electricity. Thus, like
water flowing down a leaky garden hose, electrical current passively con-
ducting down the axon would not go very far before it would leak out.
Fortunately, the axonal membrane has properties that enable it to con-
duct a special type of signal-the nerve impulse, or action potential-that
Spinal
cord
- I
,
To brain
PI\
. @ t ;; '"OO
- cell body
'l Sensory neuron
cell body
'I
r
,
.),.
"j
i]
@
o
\.
. '
. - ""
Sensory
neuron axon
....-:
'-"
Motor
neuron axon
J.
. THE CAST OF CHEMICALS 53
overcomes these biological constraints. In contrast to passively conducted
electrical signals, action potentials do not diminish over distance; they are
signals of fixed size and duration. Information is encoded in the frequency
of action potentials of individual neurons, as well as in the distribution and
number of neurons firing action potentials in a given nerve. This type of
code is partly analogous to Morse code sent down a telegraph wire; infor-
mation is encoded in the pattern of electrical impulses. Cells capable of
generating and conducting action potentials, which include both nerve and
muscle cells, are said to have excitable membrane. The "action" in action
potentials occurs at the cell membrane.
When a cell with excitable membrane is not generating impulses, it is
said to be at rest. In the resting neuron, the cytosol along the inside sur-
face of the membrane has a negative electrical charge compared to the
outside. This difference in electrical charge across the membrane is called
the resting membrane potential (or resting potential). The action poten-
tial is simply a brief reversal of this condition, and for an instant-about a
thousandth of a second-the inside of the membrane becomes positively
charged with respect to the outside. Therefore, to understand how neurons
signal one another, we must learn how the neuronal membrane at rest sep-
arates electrical charge, how electrical charge can be rapidly redistributed
across the membrane during the action potential, and how the impulse can
propagate reliably along the axon.
In this chapter, we begin our exploration of neuronal signaling by tackling
the first question: How does the resting membrane potential arise? Under-
standing the resting potential is very important because it forms the foun-
dation for understanding the rest of neuronal physiology. And knowledge
of neuronal physiology is central to understanding the capabilities and
limitations of brain function.
THE CAST OF CHEMICALS
We begin our discussion of the resting membrane potential by introduc-
ing the three main players: the salty fluids on either side of the mem-
brane, the membrane itself, and the proteins that span the membrane.
Each of these has certain properties that contribute to establishing the
resting potential.
Cytosol and Extracellular Fluid
Water is the main ingredient of the fluid inside the neuron, the intracellu-
lar fluid or cytosol, and the fluid that bathes the neuron, the extracellular
fluid. Electrically charged atoms-ions-are dissolved in this water, and
they are responsible for the resting and action potentials.
Water. For our purpose here, the most important property of the water
molecule (H 2 0) is its uneven distribution of electrical charge (Figure 3.2a).
The two hydrogen atoms and the oxygen atom are bonded together cova-
lently, which means they share electrons. The oxygen atom, however, has
a greater affinity for electrons than does the hydrogen atom. As a result,
the shared electrons will spend more time associated with the oxygen atom
than with the two hydrogen atoms. Therefore, the oxygen atom acquires a
net negative charge (because it has extra electrons), and the hydrogen atoms
acquire a net positive charge. Thus, H 2 0 is said to be a polar molecule, held
together by polar covalent bonds. This electrical polarity makes water an
effective solvent of other charged or polar molecules; that is, other polar
molecules tend to dissolve in water.
54 C HAP T E R 3 . THE NEURONAL MEMBRANE AT REST
FIGURE 3.2
Water is a polar solvent. (a) Different
representations of the atomic structure of the
water molecule The oxygen atom has a net
negative electrical charge, and the hydrogen
atoms have a net positive electrical charge,
making water a polar molecule. (b) A crystal
of sodium chloride (NaCI) dissolves in water
because the polar water molecules have a
stronger attraction for the electrically charged
sodium and chloride Ions than the ions do for
one another
(a)
H 2 0 = 0 =
/"'"
H H
r
--
Na
CI-
+
, > -
a
CI-
,
'r
'I
CI- I,
Na+
,
,
y
Crystal of NaCI
Na+ and CI-
dissolved in water
(b)
Ions. Atoms or molecules that have a net electrical charge are known as
ions. Table salt is a crystal of sodium (Na+) and chloride (Cl-) ions held
together by the electrical attraction of oppositely charged atoms. This at-
traction is called an ionic bond. Salt dissolves readily in water because the
charged portions of the water molecule have a stronger attraction for the
ions than they have for each other (Figure 3.2b). As each ion breaks away
from the crystal, it is surrounded by a sphere of water molecules. Each pos-
itively charged ion (Na+, in this case) will be covered by water molecules
oriented so that the oxygen atom (the negative pole) wi)] be facing the
ion. Likewise, each negatively charged ion (Cl-) will be surrounded by the
hydrogen atoms of the water molecules. These clouds of water that sur-
round each ion are called spheres of hydration, and they effectively insu-
late the ions from one another.
The electrical charge ot an atom depends on the difference between the
number of protons and electrons. When this difference is 1, the ion is said
to be monovalent; when the difference is 2, the ion is divalent; and so on.
Ions with a net positive charge are called cations; ions with a negative
charge are called anions. Remember that ions are the major charge carriers
involved in the conduction of electricity in biological systems, including the
neuron. The ions of particular importance for cellular neurophysiology are
the monovalent cations Na+ (sodium) and K+ (potassium), the divalent
cation Ca H (calcium), and the monovalent anion Cl- (chloride).
The Phospholipid Membrane
As we have seen, substances with uneven electrical charges will dissolve
in water because of the polarity of the water molecule. These substances,
including ions and polar molecules, are said to be "water-loving," or hy-
drophilic. However, compounds whose atoms are bonded by nonpolar cova-
lent bonds have no basis for chemical interacrions with water. A nonpolar
covalent bond occurs when the shared electrons are distributed evenly in
the molecule so that no portion acquires a net electrical charge. Such com-
pounds wi)] not dissolve in water and are said to be "water-fearing," or hy-
drophobic. One familiar example of a hydrophobic substance is olive oil,
and, as you know, oil and water don't mix. Another example is lipid, a class
of water-insoluble biological molecules important to the structure of cell
membranes. The lipids of the neuronal membrane contribute to the resting
and action potentials by forming a barrier to water-soluble ions and, indeed,
to water itself.
The Phospholipid Bilayer. The main chemical building blocks of cell
membranes are phospholipids. Like other lipids, phospholipids contain long
nonpolar chains of carbon atoms bonded to hydrogen atoms. In addition,
however, a phospholipid has a polar phosphate group (a phosphorus
atom bonded to three oxygen atoms) attached to one end of the mole-
cule. Thus, phospholipids are said to have a polar "head" (containing
phosphate) that is hydrophilic, and a nonpolar "tail" (containing hydro-
carbon) that is hydrophobic.
The neuronal membrane consists of a sheet of phospholipids, two mole-
cules thick. A cross section through the membrane, shown in Figure 3.3,
reveals that the hydrophilic heads face the outer and inner watery envi-
ronments and the hydrophobic tails face each other. This stable arrangement
is called a phospholipid bilayer, and it effectively isolates the cytosol of
the neuron from the extracellular fluid.
Protein
The type and distribution of protein molecules distinguish neurons from
other types of cells. The enzymes that catalyze chemical reactions in the
neuron, the cytoskeleton that gives a neuron its special shape, the receptors that
are sensitive to neurotransmitters-all are made up of protein molecules.
/
, '
)
FIGURE 3.3
The phospholipid bilayer. The phospho-
lipid bilayer is the core of the neuronal
membrane and forms a barrier to water-
soluble Ions.
(l :\
/ '\;
-\
,
'. ..
,
.,
. .
.
..' \.... .
.
\
I"
!
/
/
/
--
\
\
\
ij
,/
;it ;t
\- ( (» ... .I
..> '., ..> '.,
.... . '., . .,
· . !i
I
(j f'Y n r-") 7)
,) )
eJ J ) .... .
.J':' .,'i' ,.
" , .. ) .- ..
_ .. .) ../ \. .: i';
. '. . ..)..'.)..
.-/1 ..)i · _ I -).-'
.-' .- 7
'e-'') l
.,..
-..
Outside cell
;/
/
" I }
I Illl
lf1 m P.hospholipid
'I p bilayer
,
I
/,
i I II " I
, U
I I
I nside cell
.. THE CAST OF CHEMICALS 55
Polar "head" containing
phosphate
Nonpolar "tail" containing
hydrocarbon
56 C HAP T E R 3 . THE NEURONAL MEMBRANE AT REST
H
. I
H3N -C-COO-
(a)
The resting potential and action potential depend on special proteins that
span the phospholipid bilayer. These proteins provide routes for ions to
cross the neuronal membrane.
Protein Structure. In order to perform their many functions in the neuron,
different proteins have widely different shapes, sizes, and chemical charac-
teristics. To understand this diversity, let's briefly review protein structure.
As mentioned in Chapter 2, proteins are molecules assembled from var-
ious combinations of 20 different amino acids. The basic structure of an
amino acid is shown in Figure 3.4a. All amino acids have a central carbon
atom (the alpha carbon), which is covalently bonded to four molecular
FIGURE 3.4
Amino acids, the building blocks of protein. (a) Every amino aCid has In common a
central alpha carbon, an amino group (NH 3 +), and a carboxyl group (COO-). Amino acids
differ from one another based on a variable R group. (b) The 20 different amino acids that
are used by neurons to make proteins. Noted in parentheses are the common abbreviations
used for the various amino acids.
Amino acids with strongly hydrophobic R groups:
H
. I
H3N -y-COO-
/C
H 3 C CH 3
Valine
(Valor V)
H
. I
H -y-COO-
yH2
CH
H 3 cf "CH 3
Leucine
(Leu or L)
H
+ I
H3N -C-COO-
I
H-C-CH 3
I
yH2
CH 3
Isoleucine
(lie or I)
H
+ I
H3N -C-COO-
g
Phenylalanine
(Phe or F)
Amino acids with strongly hydrophilic R groups:
H
. I
H3N -y-COO-
?H2 I
Aspartic acid
(Asp or D)
other amino acids:
H
. I
H3N -C-COO-
Ji1
Glycine
(Gly or G)
(b)
H
+ I
H3N -C-COO-
I
CH 2
I
CH 2
I
coo-
Glutamic acid
(Glu or E)
H
. I
H3N -y-COO-
CH 3 1
Alanine
(Ala or A)
H
. I
H N -C-COO-
I
CH 2
I
C
H 2 N/ '<::10
Asparagine
(Asn or N)
H
+ I
H N -C-COO-
3 I
yH21
SH
Cysteine
(Cys or C)
H
. I
H N -C-COO-
I
yH2
CH 2
I
C
H /'<::IO
Glutamine
(Gin or Q)
H
+ I
H3N -y-COO-
CH 2 0H I
Serine
(Ser or S)
H
+ I
N -c-coo-
I
CH 2
I
yH2
S
I
CH 3
Methionine
(Met or M)
H
+ I
H3N -y-COO-
yH2
CH 2
I
yH2
CH 2
I
' NH 3
Lysine
(Lys or K)
H
. I
H N -C-COO-
3 I
H-y-OH I
CH 3
Threonine
(Thr or T)
H
+ I
H N -C-COO-
3 I
yH2
yH2
CH 2
I
NH
I .
y= NH 3
NH 2
Arginine
(Arg or R)
H
+ I
H3N -C-COo-
!
Q
OH
Tyrosine
(Tyr or Y)
H
. I
H N -C-COO-
3 1
CH 2
I .
C-NH
II ;CH
c-w
H H
Histidine
(His or H)
H
I
,N -C- .00-
I I
H 2 C /CH 2
"CH 2
H
. I
H3N -y-COO-
CH 2
I
C=CH
8 "
Proline
(Pro or P)
Tryptophan
(Trp or W)
... THE CAST OF CHEMICALS 57
Peptide bond
j R2
+ I - I
H 3 N-C- C-N -C-COO-
III-I
R 1 0 H
H H
+ I ! I I
H3 N -- C- LC - Nj -c- Lc - Nj -C - L C - Nj -C - COO-
III-I III-I III-I I
R 1 0 H H 0 H R3 0 H H
(a) (b)
FIGURE 3.5
The peptide bond and a polypeptide. (a) Peptide bonds attach amino acids together.
The bond forms between the carboxyl group of one amino acid and the amino group of
another. (b) A polypeptide is a single chain of amino acids.
groups: a hydrogen arom, an amino group (NH3 +), a carboxyl group
(COO-), and a variable group called the R group (R for residue). The dif-
ferences between amino acids result from differences in the size and nature
of these R groups (Figure 3.4b). The properties of the R group determine
the chemical relationships in which each amino acid can participate.
Proteins are synthesized by the ribosomes of the neuronal cell body. In
this process, amino acids assemble into a chain connected by peptide
bonds, which join the amino group of one amino acid to the carboxyl
group of the next (Figure 3.5a). Proteins made of a single chain of amino
acids are also called polypeptides (Figure 3.5b).
The four levels of protein structure are shown in Figure 3.6. The primary
structure is like a chain, in which the amino acids are linked together by
peptide bonds. As a protein molecule is being synthesized, however, the
polypeptide chain can coil into a spiral-like configuration called an alpha
helix. The alpha helix is an example of what is called the secondary structure
of a protein molecule. Interactions among the R groups can cause the
molecule to change its three-dimensional conformation even further. In
this way, proteins can bend, fold, and assume a globular shape. This shape
is called tertiary structure. Finally, different polypeptide chains can bond ro-
gether to form a larger molecule; such a protein is said to have quaternary
1Nn;OO 0000
------
"
,
Serine
Serine
r
Leucine
(a)
(c)
7Subunits
-J
,)0)0. ---...y
..... . >-
r . . p..."
!i 'nfnf
,. ,UIU.UI\1II1MUIU'UlU u.
"
"N-
FIGURE 3.6
Protein structure. (a) Pnmary structure:
the sequence of amino acids in the polypep-
tide. (b) Secondary structure: coiling of a
polypeptide into an alpha helix. (c) Tertiary
structure: three-dimensional folding of a
polypeptide. (d) Quaternary structure: differ-
ent polypeptides bonded together to form a
larger protein.
..
(b)
1
(d)
58 C HAP T E R 3 . THE NEURONAL MEMBRANE AT REST
structure. Each of the different polypeptides contributing to a protein with
quaternary structure is called a subunit.
Channel Proteins. The exposed surface of a protein may be chemically
heterogeneous. Regions where nonpolar R groups are exposed will be
hydrophobic and will lend to associate readily with lipid. Regions with
exposed polar R groups will be hydrophilic and will tend to avoid a lipid
environment. Therefore, it is not difficult to imagine classes of rod-shaped
proteins with polar groups exposed at either end, but with only hydrophobic
groups showing on their middle surfaces. This type of protein could be sus-
pended in a phospholipid bilayer, with its hydrophobic portion inside the
membrane and its hydrophilic ends exposed to the watery environments
on either side.
Ion channels are made from just these sorts of membrane-spanning
protein molecules. Typically, a functional channel across the membrane re-
quires that 4-6 similar protein molecules assemble to form a pore between
them (Figure 3.7). The subunit composition varies from one type of chan-
nel to the next, and this is what specifies their different properties. One
important property of most ion channels, specified by the diameter of the
pore and the nature of the R groups lining it, is ion selectivity. Potassium
channels are selectively permeable to K+. Likewise, sodium channels are
permeable almost exclusively to Na+, calcium channels to Ca 2 +, and so on.
Another important property of many channels is gating. Channels with
this property can be opened and closed-gated-by changes in the local
microenvironment of the membrane.
Extracellular fluid
Polypeptide
. - subunit
. '
. '
!
{}
Cytosol
'---
} Phospholipid
bilayer
FIGURE 3.7
A membrane ion channel. Ion channels consist of membrane-spanning proteins that
assemble to form a pore. In this example. the channel protein has five pclypeptlde subunits.
Each subunrt has a hydrophobic surface neglon (shaded) that readily associates with the
phospholipid bilayer:
You will learn much more about channels as you work your way through
this book. Understanding ion channels in the neuronal membrane is key to under-
standing cellular neurophysiology.
Ion Pumps. In addition to those that form channels, other membrane-
spanning proteins come together to form ion pumps. Recall from Chapter
2 that ATP is the energy currency of cells. Ion pumps are enzymes that use
the energy released by the breakdown of ATP to transport certain ions
across the membrane. We will see that these pumps playa critical role in
neuronal signaling by transporting Na+ and Ca H from the inside of the
neuron to the outside.
... THE MOVEMENT OF IONS
A channel across a membrane is like a bridge across a river (or, in the case
of a gated channel, like a drawbridge): It provides a path to cross from one
side to the other. The existence of a bridge does not necessarily compel us
to cross it, however. The bridge we cross during the weekday commute
may lie unused on the weekend. The same can be said of membrane ion
channels. The existence of an open channel in the membrane does not
necessarily mean that there will be a net movement of ions across the
membrane. Such movement also requires that external forces be applied to
drive them across. Because the functioning nervous system requires the
movement of ions across the neuronal membrane, it is important that we
understand these forces. Ionic movements through channels are influenced
by two factors: diffusion and electricity.
Diffusion
Ions and molecules dissolved in water are in constant motion. This
temperature-dependent, random movement will tend to distribute the
ions evenly throughout the solution. In this way, there will be a net
movement of ions from regions of high concentration to regions of low
concentration; this movement is called diffusion. As an example, con-
sider adding a teaspoon of milk to a cup of hot tea. The milk tends to
spread evenly through the tea solution. If the thermal energy of the so-
lution is reduced, as with iced tea, the diffusion of milk molecules will
take noticeably longer.
Although ions typically will not pass through a phospholipid bilayer di-
rectly, diffusion will cause ions to be pushed through channels in the
membrane. For example, if NaCI is dissolved in the fluid on one side of a
permeable membrane (Le., with channels that allow Na+ and CI- passage),
the Na+ and CI- ions will cross until they are evenly distributed in the
solutions on both sides (Figure 3.8). As with the previous example, the net
movement is from the region of high concentration to the region of low
concentration. (For a review of how concentrations are expressed, see
Box 3.1.) Such a difference in concentration is called a concentration
gradient. Thus, we say that ions will flow down a concentration gradient.
Driving ions across the membrane by diffusion, therefore. happens when
(1) the membrane possesses channels permeable to the ions, and (2) there
is a concentration gradient across the membrane.
Electricity
Besides diffusion down a concentration gradient, another way to induce a
net movement of ions in a solution is to use an electrical field, because ions
... THE MOVEMENT OF IONS 59
:.. 1 .....
. .
: . Nci.+. i
. . .
-,,- -..:
. . .
. .
.. .-
. .. .
. . CI:- . > , '
. .. r-
..... 1
(a)
I. 0 "-
0/. ..0"'\ 1"-.
.. .1. ..JL
> I .::
. . .
'. .
. .
. ....
..CI- O ...
..
. . .
. 0 0
.- .... ...
.. .
. . .
(b)
(c)
FIGURE 3.8
Diffusion. (a) NaCi has been dissolved on
the left side of an impermeable membrane.
The sizes of the letters Na + and CI indicate
the relative concentrations of these ions.
(b) Channels are inserted in the membrane
that allow the passage of Na+ and CI-. Be-
cause there is a large concentration gradient
across the membrane, there will be a net
movement of Na+ and CI- from the region
of high concentration to the region of low
concentration. from left to right (c) In the
absence of any other factors. the net move-
ment of Na+ and CI- across the membrane
ceases when they are equally distributed on
both sides of the permeable membrane.
60 C HAP T E R 3 . THE NEURONAL MEMBRANE AT REST
Box 3.1
C)
BRAIN FOOD
A Review of Moles and Molarity
Concentrations of substances are expressed as the
number of molecules per liter of solution. The number of
molecules is usually expressed in moles. One mole is
6.02 X 10 23 molecules. A solution is said to be I Molar
(M) if it has a concentration of I mole per liter. A I mil-
Battery
((O_
f I
II ;.) -
An_' CI-
(Anion)
oo,
U'
FIGURE 3.9
The movement of ions influenced by
an electrical field.
limolar (mM) solution has 0.00 I moles per liter. The ab-
breviation for concentration is a pair of brackets. Thus,
we read [NaCI] = I mM as: "The concentration of the
sodium chloride solution is I millimolar."
are electrically charged particles. Consider the situation in Figure 3.9, where
wires from the two terminals of a battery are placed in a solution contain-
ing dissolved NaCl. Remember, opposite charges attract and like charges repel.
Consequently, there will be a net movement of Na+ toward the negative
terminal (the cathode) and of Cl- toward the positive terminal (the anode).
The movement of electrical charge is called electrical current, represented
by the symbol I and measured in units called amperes (amps). According
to the convention established by Benjamin Franklin, current is defined as
being positive in the direction of positive-charge movement. In this exam-
ple, therefore, positive current flows in the direction of Na+ movement
from the anode to the cathode.
Two important factors determine how much current will flow: electrical
potentia] and electrical conductance. Electrical potential, also called volt-
age, is the force exerted on a charged particle, and it reflects the difference
in charge between the anode and the cathode. More current will flow as
this difference is increased. Voltage is represented by the symbol V and is
measured in units called volts. As an example, the difference in electrical
potential between the terminals of a car battery is 12 volts; that is, the elec-
trical potential at one terminal is 12 volts more positive than that at the
other.
Electrical conductance is the relative ability of an electrical charge to
migrate from one point to another. It is represented by the symbol g and
measured in units called siemens (5). Conductance depends on the num-
ber of particles available to carry electrical charge and the ease with which
these particles can travel through space. A term that expresses the same
property in a different way is electrical resistance, the relative inability
of an electrical charge to migrate. It is represented by the symbol Rand
measured in units called ohms (Q). Resistance is simply the inverse of con-
ductance (Le., R = IIg).
There is a simple relationship between potential (V), conductance (g),
and the amount of current (I) that will flow. This relationship, known as
Ohm's law, may be written I = gV: Current is the product of the conduc-
tance and the potentia] difference. Notice that if the conductance is zero.
no current will flow even when the potential difference is very large. Like-
wise, when the potential difference is zero, no current will flow even when
the conductance is very large.
Consider the situation illustrated in Figure 3.10a, in which NaCI has been
dissolved in equal concentrations on either side of a phospholipid bilayer.
If we drop wires from the two terminals of a battery into the solution on
either side, we will generate a large potential difference across this mem-
brane. No current wiJJ flow, however, because there are no channels to allow
THE IONIC BASIS OF THE RESTING MEMBRANE POTENTIAL 61
migration of Na+ and CI- across the membrane; the conductance of the
membrane is zero. Driving an ion across the membrane electrically, there-
fore, requires that (1) the membrane possesses channels permeable to that
ion, and (2) there is an electrical potential difference across the membrane
(Figure 3.lOb).
The stage is now set. We have electrically charged ions in solution on
either side of the neuronal membrane. Ions can cross the membrane only
by way of protein channels. The protein channels can be highly selective
for specific ions. The movement of any ion through its channel depends
on the concentration gradient and the difference in electrical potential
across the membrane. Let's use this knowledge to explore the resting
membrane potential.
.... THE IONIC BASIS OF THE
RESTING MEMBRANE POTENTIAL
The membrane potential is the voltage across the neuronal membrane
at any moment. represented by the symbol V rn . Sometimes V rn is "at rest";
at other times, it is not (such as during an action potential). V rn can be
measured by inserting a microelectrode into the cytosol. A typical micro-
electrode is a thin glass tube with an extremely fine tip (diameter 0.5 pm)
that will penetrate the membrane of a neuron with minimal damage. It is
filled with an electrically conductive salt solution and connected to a device
caned a voltmeter. The voltmeter measures the electrical potential differ-
ence between the tip of this microelectrode and a wire placed outside the
cell (Figure 3.11). This method reveals that electrical charge is unevenly
distributed across the neuronal membrane. The inside of the neuron is
Voltmeter
l fi5MVI
.
. - .
. :.-
\ \ 0
\ ' 0
. .
\ -\ 0
, -\
:-\0
FIGURE 3.11
Measuring the resting membrane potential. A voltmeter measures the difference in
electrical potential between the tip of a microelectrode inside the cell and a wire placed in
the extracellular fJUld. Typically. the inside of the neuron is about -65 mV with respect to
the outside. This potential is caused by the uneven distribution of electrical charge across the
membrane (enlargement).
Ji
(a)
I ! I
, ,
Na+ i
h
1
Na+ [;1
1"',
1
o
""-
NaJ.
CI-
CI-
No current
o
CI-
J
(b) Electrical current
..
FIGURE 3.10
Electrical current flow across a mem-
brane. (a) A voltage applied across a phos-
pholipid bilayer causes no electrical current
because there are no channels to allow the
passage of electrically charged ions from one
side to the other: the conductance of the
membrane IS zero. (b) Inserting channels in
the membrane allows ions to cross. Electrical
current flows in the direction of cation move-
ment (from left to right, in this example).
62 C HAP T E R 3 . THE NEURONAL MEMBRANE AT REST
Inside Outside
"cell" "cell"
I r I
K+ . K+
I
I
A- A-
L-
(a)
/' I If-i\ !
I U ,iO
, L,
K+ ., - K
1 ["
to
- u
}-- f:; . ,
/ jO
"
A-
(b)
I
I i I
K +..c: =-- K+
I :!
I ;1
A- A-
\
(c)
electrically negative with respect to the outside. This steady <Ciifference,
the resting potential, is maintained whenever a neuron is not generating
impulses.
The resting potential of a typical neuron is about -65 millivolts (I mV =
0.001 volts). Stated another way, for a neuron at rest, V m = -65 mY. This
negative resting membrane potential inside the neuron is an absolute re-
quirement for a functioning nervous system. In order to understand the
negative membrane potential, we look to the ions that are available and
how they are distributed inside and outside the neuron.
Equilibrium Potentials
Consider a hypothetical cell in which the inside is separated from the out-
side by a pure phospholipid membrane with no proteins. Inside this cell, a
concentrated potassium salt solution is dissolved, yielding K+ and A - an-
ion, any molecule with a negative charge. Outside the cell is a solution with
the same salt, but diluted twentyfold with water. Although a large concen-
tration gradient exists between the inside of the cell and the outside, there
will be no net movement of ions because the phospholipid bilayer, having
no channel proteins, is impermeable to charged, hydrophilic atoms. Under
these conditions, a micro electrode would record no potential difference be-
tween the inside and the outside of the cell. In other words, V m would be
equal to 0 mV because the ratio of K+ to A-on each side of the membrane
equals I; both solutions are electrically neutral (Figure 3.12a).
Consider how this situation would change if potassium channels were in-
serted into the phospholipid bilayer. Because of the selective permeability
of these channels, K+ would be free to pass across the membrane, but A-
would not. Initially, diffusion rules: K+ ions pass through the channels out
of the cell, down the steep concentration gradient. Because A - is left be-
hind, however, the inside of the cell immediately begins to acquire a net
negative charge, and an electrical potential difference is established across
the membrane (Figure 3.12b). As the inside fluid acquires more and more
net negative charge, the electrical force starts to pull positively charged K+
ions back through the channels into the cell. When a certain potential dif-
ference is reached, the electrical force pulling K+ ions inside exactly coun-
terbalances the force of diffusion pushing them out. Thus, an equilibrium
state is reached in which the diffusional and electrical forces are equal and
opposite, and the net movement of K+ across the membrane ceases (Fig-
ure 3.12c). The electrical potential difference that exactly balances an ionic
concentration gradient is called an ionic equilibrium potential. or sim-
ply equilibrium potential, and it is represented by the symbol E ion . In
this example, the equilibrium potential will be about -80 mY.
The example in Figure 3.12 demonstrates that generating a steady elec-
trical potential difference across a membrane is a relatively simple matter.
All that is required is an ionic concentration gradient and selective ionic
FIGURE 3.12
Establishing equilibrium in a selectively permeable membrane. (a) An imperme-
able membrane separates two regions: one of high salt concentration (inside) and the other
of low salt concentration (outside). The relative concentrations of potassium (K+) and an
impermeable anion (A -) are represented by the sizes of the letters. (b) Inserting a channel
that is selectively permeable to K+ Into the membrane initially results In a net movement
of K+ ions down their concentration gradient. from left to right. (c) A net accumulation of
positive charge on the outside and negative charge on the inside retards the movement of
positively charged K+ ions from the Inside to the outside. An equilibnum is established such
that there is no net movement of Ions across the membrane, leaving a charge difference
between the two sides.
... THE IONIC BASIS OF THE RESTING MEMBRANE POTENTIAL 63
permeability. Before moving on to the situation in real neurons, however,
we can use this example to make four important points:
1. Large changes in membrane potential are caused by minuscule changes in ionic
concentrations. In Figure 3.12, channels were inserted, and K+ ions flowed
out of the cell until the membrane potential went from a mV to the
equilibrium potential of -80 mY. How much does this ionic redistribution
affect the K+ concentration on either side of the membrane? Not very
much. For a cell with a 50 pm diameter containing 100 mM K+, it can
be calculated that the concentration change required to take the mem-
brane from a to -80 mV is abom 0.00001 roM. That is, when the channels
were inserted and the K+ flowed out until equilibrium was reached, the
internal K+ concentration went from 100 mM to 99.99999 mM-a neg-
ligible drop in concentration.
2. The net difference in electrical charge occurs at the inside and outside surfaces of
the membrane. Because the phospholipid bilayer is so thin (less than 5 nm
thick), it is possible for ions on one side to interact electrostatically with
ions on the other side. Thus, the negative charges inside the neuron and
the positive charges outside the neuron tend to be mutually attracted to
the cell membrane. Consider how, on a warm summer evening, mos-
quitoes are attracted to the outside face of a window pane when the
inside lights are on. Similarly, the net negative charge inside the cell is
not distributed evenly in the cytosol, but rather is localized at the inner
face of the membrane (Figure 3.13). In this way, the membrane is said
to store electrical charge, a property called capacitance.
3. Ions are driven across the membrane at a rate proportional to the difference be-
tween the membrane potential and the equilibrium potential. Notice from our
example in Figure 3.12 that when the channels were inserted, there was
a net movement of K+ only as long as the electrical membrane poten-
tial differed from the equilibrium potential. The difference between the
real membrane potential and the equilibrium potential (V ill - E ion ) for a
particular ion is called the ionic driving force. We'll talk more about
this in Chapters 4 and 5 when we discuss the movement of ions across
the membrane during the action potential and synaptic transmission.
4. If the concentration difference across the membrane is known for an ion, an
equilibrium potential can be calculated for that ion. In our example in
Equal Equal Equal
+- +,- +,-
o
01 0 0
o 0 0
o 00
o
o 0 0
o 0 0
o 0 0
00 0
;\
O
000
o 0 0
00 0
o
000
00 0
o 0 0
00 0
FIGURE 3.13
The distribution of electrical charge
across the membrane. The uneven
charges Inside and outside the neuron line up
along the membrane because of electrostatic
attraction across this very thin barrier. Notice
that the bulk of the cytosol and extracellular
fluid is electncally neutral.
h
Cytosol
Extracellular
fluid
Membrane
64 C HAP T E R 3 . THE NEURONAL MEMBRANE AT REST
Inside Outside
"cell" "cell"
I Ir I
Na+ Na+
Ih
"4
}-,
A'-
(a)
FIGURE 3.14
Another example of establishing equi-
librium in a selectively permeable
membrane. (a) An impermeable mem-
brane separates t'-lVO regions: one of high salt
concentration (outside) and the other of low
salt concentration (inside). (b) Inserting a
channel that is selectively permeable to Na +
Into the membrane initially results In a net
movement of Na + ions down their concen
tration gradient. from right to left. (c) A net
accumulation of positive charge on the inside
and negative charge on the outside retards
the movement of positively charged Na + Ions
from the outside to the inside. An equilibrium
is established such that there is no net move-
ment of ions across the membrane. leaving a
charge difference between the two sides; in
this case, the inside of the cell is positively
charged with respect to the outside.
/i
, °It'IO I
Na+ ..:: M Na+
J
;.;\ I
I J ,. 0 I
Na+ -- - ...Na+
- 0
- 0
o
A- oAr
o
'} 0
_.
Ol:10
'--,,
A,-
f.
i
o f 0
n
(b)
(e)
Figure 3.12, we assumed that 1<.+ was more concentrated inside the
cell. From this knowledge, we were able to deduce that the equilibrium
potential would be negative if the membrane were selectively permeable
to K'-. Let's consider another example, in which Na+ is more concen-
trated outside the ce]] (Figure 3.14). If the membrane contained sodium
channels, Na+ would flow down the concentration gradient into the
cell. The entry of positively charged ions would cause the cytosol on the
inner surface of the membrane to acquire a net positive charge. The
positively charged interior of the cell would now repel Na + ions,
tending to push them back out through their channels. At a certain
potential difference, the electrical force pushing Na+ ions out would
exactly counterbalance the force of diffusion pushing them in. In this
example, the membrane potential at equilibrium would be positive on
the inside.
The examples in Figures 3.12 and 3.14 illustrate that if we know the
ionic concentration difference across the membrane, we can figure out the
equilibrium potentia] for any ion. Prove it to yourself. Assume that Ca H is
more concentrated on the outside of the cell and that the membrane is
selectively permeable to Ca H . See if you can figure out whether the inside
of the cell would be positive or negative at equilibrium. Try it again, as-
suming that the membrane is selectively permeable to Cl-, and that Cl- is
more concentrated outside the cell. (Pay attention here; note the charge of
the ion.)
The Nernst Equation. The preceding examples show that each ion has its
own equilibrium potential-the steady electrical potential that would be
achieved if the membrane were permeable only to that ion. Thus, we can
speak of the potassium equilibrium potentiaL E K ; the sodium equilibrium
potential, E Na ; the calcium equilibrium potential, Eca; and so on. And
knowing the electrical charge of the ion and the concentration difference
across the membrane, we can easily deduce whether the inside of the cell
would be positive or negative at equilibrium. In fact, the exact value of an
equilibrium potential in mY can be calculated using an equation derived
from the principles of physical chemistry, the Nernst equation, which
takes into consideration the charge of the ion, the temperature, and the
ratio of the external and internal ion concentrations. Using the Nernst
equation, we can calculate the value of the equilibrium potential for any
ion. For example, if K+ is concentrated twentyfold on the inside of a ceIL
the Nernst equation tells us that E K = -80 mY (Box 3.2).
Box 3.2
-
) ,
-.\.
BRAIN FOOD
'Y THE IONIC BASIS OF THE RESTING MEMBRANE POTENTIAL 65
The Nernst Equation
The equilibrium potential for an ion can be calculated
using the Nernst equation:
RT [ion]o
E;on = 2.303 - log _ f . ]
zF Ion i
where
E;on = ionic equilibrium potential
R = gas constant
T = absolute temperature
z = charge of the ion
F = Faraday's constant
log = base 10 logarithm
[ion ]0 = ionic concentration outside the cell
[ion]; = ionic concentration inside the cell
The Nernst equation can be derived from the basic prin-
ciples of physical chemistry. Let's see if we can make some
sense of it.
Remember that equilibrium is the balance of two influ-
ences: diffusion, which pushes an ion down its concentra-
tion gradient, and electricity, which causes an ion to be
attracted to opposite charges and repelled by like charges.
Increasing the thermal energy of each particle increases
diffusion and will therefore increase the potential differ-
ence achieved at equilibrium. Thus, E;on is proportional to
T. On the other hand, increasing the electrical charge of
each particle will decrease the potential difference needed
to balance diffusion. Therefore, E;on is inversely propor-
tional to the charge of the ion (z). We need not worry
about Rand F in the Nernst equation because they are
constants.
At body temperature (37°C), the Nernst equation for
the important ions-K+, Na+, 0-, and Ca2+ -simpli-
fies to:
The Distribution of Ions Across the Membrane
[K+]o
E K = 61.54 mV log [K+];
[Na +]0
E Na = 61.54 mV log [Na+];
[CI-]o
Eo = -61.54 mV log [0-];
[Ca2+]o
ECa = 30.77 mV log [Ca2+];
Therefore, in order to calculate the equilibrium potential
for a certain type of ion at body temperature, all we need
to know is the ionic concentrations on either side of the
membrane. For instance, in the example we used in Fig-
ure 3.12, we stipulated that K + was twentyfold more con-
centrated inside the cell:
If
[K+]o _ I
[K+]; - 20
I
log 20 = -1.3
EK = 61.54 mV X - L3
= -80 mY.
and
then
Notice that there is no term in the Nernst equation
for permeability or ionic conductance. Thus, calculating
the value of E;on does not require knowledge of the se-
lectivity or the permeability of the membrane for the
ion. There is an equilibrium potential for each ion in the
intracellular and extracellular fluid. E;on is the membrane
potential that would just balance the ion's concentration
gradient, so that no net ionic current would flow if the
membrane were permeable to that ion.
It should now be clear that the neuronal membrane potential depends on
the ionic concentrations on either side of the membrane. Estimates of these
concentrations appear in Figure 3.15. The important point is that K+ is
more concentrated on the inside, and Na+ and Ca 2 + are more concentrated on the
outside.
How do these concentration gradients arise? Ionic concentration gradients
are established by the actions of ion pumps in the neuronal membrane.
Two ion pumps are especially important in cellular neurophysiology: the
sodium-potassium pump and the calcium pump. The sodium-potassium
pump is an enzyme that breaks down ATP in the presence of internal
Na+. The chemical energy released by this reaction drives the pump, which
66 C HAP T E R 3 . THE NEURONAL MEMBRANE AT REST
Ion Concentration Concentration Ratio E ion
outside (in mM) inside (in mM) Out: In (at 37°C)
K+ 5 100 1: 20 -80 mV
Na+ 150 15 10; 1 62mV
Ca 2 + 2 0.0002 10,000: 1 123 mV
CI- 150 13 11.5 : 1 -65 mV
FIGURE 3.15
Approximate ion concentrations on
either side of a neuronal membrane.
E ion is the membrane potential that would be
achieved (at body temperature) if the mem-
brane were selectively permeable to that ion.
Outside
------------ --
/ 10000 )
exchanges internal Na + for external K +. The actions of this pump ensure
that K+ is concentrated inside the neuron and that Na+ is concentrated
outside. Notice that the pump pushes these ions across the membrane
against their concentration gradients (Figure 3.16). This work requires the
expenditure of metabolic energy. Indeed, it has been estimated that the
sodium-potassium pump expends as much as 70% of the total amount of
ATP utilized by the brain.
Extracellular
fluid
xY
IJ
. .
J-)
T
Membrane
Cytosol
FIGURE 3.16
The sodium-potassium pump. This ion pump is a membrane-associated protein that
transports ions across the membrane against their concentration gradients at the expense of
metabolic energy.
... THE IONIC BASIS OF THE RESTING MEMBRANE POTENTIAL 67
The calcium pump is also an enzyme that actively transports Ca H out
of the cytosol across the cell membrane. Additional mechanisms decrease
intracellular [Ca H ] to a very low level (0.0002 roM); these include intra-
cellular calcium-binding proteins and organelles, such as mitochondria and
types of endoplasmic reticulum, that sequester cytosolic calcium ions.
Ion pumps are the unsung heroes of cellular neurophysiology. They work
in the background to ensure that the ionic concentration gradients are es-
tablished and maintained. These proteins may lack the glamour of a gated
ion channel, but without ion pumps, the resting membrane potential would
not exist. and the brain would not function.
Relative Ion Permeabilities of the Membrane at Rest
The pumps establish ionic concentration gradients across the neuronal
membrane. With knowledge of these ionic concentrations, we can use the
Nernst equation to calculate equilibrium potentials for the different ions
(see Figure 3.15). Remember, though, that an equilibrium potential for
an ion is the membrane potential that results if a membrane is selectively
permeable to that ion alone. In reality, however, neurons are not perme-
able to only a single type of ion. How do we incorporate this detail into
our thinking?
Let's consider a few scenarios involving K+ and Na +. If the membrane of
a neuron were permeable only to K+, the membrane potential would equal
EK' which, according to Figure 3.15, is -80 mY. On the other hand, if the
membrane of a neuron were permeable only to Na+, the membrane poten-
tial would equal E Na , 62 mV. If the membrane were equally permeable to
K+ and Na+, however, the resulting membrane potential would be some
average of E Na and E K . What if the membrane were 40 times more perme-
able to K+ than it is to Na+? The membrane potential again would be
between E Na and EK' but much closer to E K than to ENa. This approximates
the situation in real neurons. The resting membrane potential of -65 mV
approaches, but does not achieve, the potassium equilibrium potential of
-80 mV. This difference arises because, although the membrane at rest is
highly permeable to K+, there is also a steady leak of Na + into the cell.
The resting membrane potential can be calculated using the Goldman
equation, a mathematical formula that takes into consideration the rela-
tive permeability of the membrane to different ions. If we concern our-
selves only with K+ and Na+, use the ionic concentrations in Figure 3.15,
and assume that the resting membrane permeability to K+ is fortyfold
greater than it is to Na +, then the Goldman equation predicts a resting
membrane potential of -65 mY, the observed value (Box 3.3).
The Wide World of Potassium Channels. As we have seen, the selec-
tive permeability of potassium channels is a key determinant of the resting
membrane potential and therefore of neuronal function. What is the mo-
lecular basis for this ionic selectivity? Selectivity for K+ ions derives from
the arrangement of amino acid residues that line the pore regions of the
channels. Thus, it was a major breakthrough in 1987 when Lily and Yuh
Nung Jan, and their students at the University of California at San Fran-
cisco, succeeded in determining the amino acid sequences of a family of
potassium channels. The search was conducted using the fruit fly Drosophila
melanogaster. While these insects may be annoying in the kitchen, they
are extremely valuable in the lab, because their genes can be studied and
manipulated in ways that are not possible in mammals.
Normal flies, like humans, can be put to sleep with ether vapors. While
conducting research on anesthetized insects, investigators discovered that
flies of one mutant strain responded to the ether by shaking their legs,
68 C HAP T E R 3 . THE NEURONAL MEMBRANE AT REST
Box 3.3
' -'
BRAIN FOOD
The Goldman Equation
If the membrane of a real neuron were permeable only
to K +. the resting membrane potential would equal E K .
about -80 mY. But it does not; the measured resting
membrane potential of a typical neuron is about -65 mY.
This discrepancy is explained because real neurons at rest
are not exclusively permeable to K+; there is also some
Na + permeability. Stated another way. the relative perme-
ability of the resting neuronal membrane is quite high to
K + and low to Na +. If the relative permeabilities are
known. it is possible to calculate the membrane potential
at equilibrium by using the Goldman equation. Thus. for a
membrane permeable only to Na+ and K+ at 3rc:
PK[K +]0 + PNa[Na +]0
Ym = 61.54 mY log PK[K+]i + PNa[Na+]i
where Y m is the membrane potential. P K and P Na are the
relative permeabilities to K + and Na +. respectively. and
the other terms are the same as for the Nernst equation.
If the resting membrane ion permeability to K + is 40
times greater than it is to Na+. then solving the Gold-
man equation using the concentrations in Figure 3.15
yields:
40 (5) + I (150)
Y m = 61.54 mY log 40 (100) + I (15)
350
= 61.54 mY log 4015
= -65 mY
wings, and abdomen. This strain of fly was designated Shaker. Detailed
studies soon showed that the odd behavior was explained by a defect in a
particular type of potassium channel (Figure 3.17a). Using molecular bio-
logical techniques, the Jans were able to map the gene that was mutated
in Shaker. Knowledge of the DNA sequence of what is now called the
Shaker potassium channel enabled researchers to find the genes for other
potassium channels based on sequence similarity. This analysis has revealed
the existence of a very large number of different potassium channels, in-
cluding those responsible for the maintenance of the resting membrane
potential in neurons.
Most potassium channels have four subunits that are arranged like the
staves of a barrel to form a pore (Figure 3.17b). Despite their diversity, the
subunits of different potassium channels have common structural features
that bestow selectivity for K-r ions. Of particular interest is a region called
the pore loop, which contributes to the selectivity filter that makes the chan-
nel permeable mostly to K+ ions (Figure 3.18).
In addition to flies, the deadly scorpion also made an important contri-
bution to the discovery of the pore loop as the selectivity filter. Brandeis
University biologist Chris Miller and his student Roderick MacKinnon
observed that scorpion toxin blocks potasssium channels (and poisons its
victims) by binding tightly to a site within the channel pore. They used the
toxin to identify the precise stretch of amino acids that forms the inside
walls and selectivity filter of the channel. After setting up his own laboratory
at Rockefeller University, MacKinnon went to solve the three-dimensional
atomic structure of a potassium channel (Box 3.4). This accomplishment
revealed, at long last, the physjcal basis of ion selectivity, and earned
MacKinnon the 2003 Nobel Prize in Chemistry. It is now understood that
mutations involving only a single amino acid in this region can severely
disrupt neuronal function.
An example of this is seen in a strain of mice called Weaver. These animals
have difficulty maintaining posture and moving normally. The defect has
been traced to the mutation of a single amino acid in the pore loop of a
'9 oJ:
.-.
-'i'
....,. ..
'...
..
-.. ..#-
=
"
";..-
'
'.
(a)
....
. '.
."'....
. ..
,'-
, \.
-.,. ."
.;. .
»-
. "'..
t
.-
,.
( : . . w "-'
, * .
. t:
'-
..
-..
.,
.....
.
.
r
t. '.
- 1(,'
41.':
..
.....
.. ,"
. .
,., .
... THE IONIC BASIS OFTHE RESTING MEMBRANE POTENTIAL 69
,
""'f
\'-
Shaker
1_ /' potassium
J oh"""'
1 " "'r- Membrane
0.Y:D' )
.
..
"
"
.
,.' ..
"
'.
...
I Extracellular
.:" "
.< -
> , . :r.I..'
Cytosol
/
1- ,
(b)
.
'\
"
.. ....
.. \.
.
. ? t_i
FIGURE 3.18
A view of the potassium channel pore. The atomic structure of potassium-
selective ion channels has recently been solved. Here we are looking into the pore
from the outside. The red ball in the middle is a K+ ion. (Source: Doyle et al.. 1998.)
'" -
\ .
'"
.
.' I"
,..
.. ....
"
..
..
.
.
-
...
r
.
..-
roo.
-
.
...
t.
'. ..
« 1.. ,,'
C... ..
,
...
.,.. ..,.
....
"
'.. .
,
" 1r.1
::Y'-
III
Pore loop
\
FIGURE 3.17
The structure of a potassium channel.
(a) Shaker potassium channels in the cell
membrane of the fruit fly Drosophila, viewed
from above with an electron microscope.
(Source: Li et al., '994; Fig. 2.) (b) The Shaker
potassium channel has four subunits arranged
like staves of a barrel to form a pore. Enlarge-
ment: The tertiary structure of the protein
subunit contains a pore loop, a part of the
polypeptide chain that makes a hairpin turn
within the plane of the membrane. The pore
loop is a critical part of the filter that makes
the channel selectively permeable to K+ ions.
70 C HAP T E R 3 . THE NEURONAL MEMBRANE AT REST
Box 3.4
PATH OF DISCOVERY
A
The Atomic Structure
of a Potassium Channel
It should never be too late to follow a new idea. That is
what I told myself when, at nearly 30 years old, I aban-
doned my career as a medical doctor, realizing I would be
happier as a scientist. In Chris Miller's laboratory at Bran-
deis University, I was introduced to potassium channels.
That was the beginning of an exciting adventure for me--
a mixture of "chance and design," to use Alan Hodgkin's
words. I think in my case it was mostly chance.
The year was 1986, when biophysicists imagined ion
channels to be membrane pores with selectivity filters
and gates. This essentially correct view had been deduced
by Clay Armstrong, Bertil Hille, and others through
thoughtful analysis of electrophysiological recordings. But
ion channels were not quite "molecular" in the same way
biochemists viewed enzymes. No one had ever visualized
a potassium channel protein. In fact, potassium channel
genes had not yet been identified, so even their amino
acid sequences were a mystery. I began to study what are
known as high-conductance Ca2+ -activated potassium
channels, which we isolated from mammalian skeletal mus-
cle and reconstituted into lipid membranes. My question
was a humble one: How does a scorpion toxin inhibit
these potassium channels? Admittedly, this was not a very
hot topic, in fact you might say it was cold, but that
made no difference to me. I was having fun learning chan-
nel biophysics, and I found the mechanism of toxin inhi-
bition interesting, even if it seemed unimportant. It be-
came clear to me that the toxin functions as a plug on
the pore, and it interacts with ions inside the pore. I spent
long hours trying to imagine what the channel might look
like and how it could selectively conduct ions at such a
high rate.
About a year into my toxin studies, the potassium chan-
nel field got a huge boost when the laboratories of Lily
and Yuh Nung Jan, Mark Tanouye, and Olaf Pongs reported
the cloning of the Shaker channel from Drosophila. As luck
would have it, I found during a late night experiment at a
Cold Spring Harbor course that the Shaker channel was
sensitive to scorpion toxins. I knew immediately that I
could use scorpion toxins together with site-directed
mutagenesis to identify which amino acids form the ion
conduction pore. That would be valuable information be-
cause the amino acid sequence had no assigned function.
The toxin led me directly to the pore and to other in-
teresting aspects of potassium channels, such as how many
t
.-..
by Roderick MacKil1llon
..
subunits they have. After a few years at Harvard Medical
School, where I had taken a faculty position, my labora-
tory defined which amino acids form the selectivity filter
of the Shaker channel. Conservation of these amino acids
in different potassium channels seemed to underscore the
fact that nature had arrived at a single solution for selec-
tive K + conduction across the cell membrane. I began to
realize then that I would not understand nature's solution
without actually seeing the atomic structure (Figure A).
I needed to become a membrane protein biochemist and
X-ray crystallographer. I abandoned my nicely advancing
career as an electrophysiologist at Harvard and moved to
Rockefeller University to concentrate on learning the
new techniques. I was told that I was committing career
suicide because of the difficul,ty with membrane proteins
and my complete lack of experience. But it made little dif-
ference to me. My reasoning was simple: I would rather
crash and burn trying to solve the problem than not try
at all. Though the lab was initially small, we were very de-
termined. It was a thrilling time because we knew we
were working on a good problem, and we were passion-
ate about it. Through hard work, perseverance, and more
than a little luck, a very beautiful piece of nature slowly
revealed itself to us. It was in fact more beautiful than I
ever could have imagined.
rr _
II .-:..
.'1 .
..
.
.":..,
. J:'
':' - r
'1 a..a!'
-...:.. '.
.--..-
.,,"-.. ..; .17
,....; .,.,., - .... ;: 'i
ii.. ... i .!:..
-.-, . . ..... "i .
&. .., '-'.: .
I ,a'J. ...'
0" . .{II...:" .
- .. _or
. a.:':.;.'" t.. _ t
.. .- -
.... &.
..
FIGURE A
The protein structure of the potassium channel selectivity filter
(from two of four subunits) is yellow; oxygen atoms are red
spheres. Electron density (blue mesh) shows K+ ions (green
spheres) lined up along the pore. Inside the filter; each K+ ion
binding site is surrounded by eight oxygen atoms, which appear
to mimic the water molecules surrounding the hydrated K+ ion
below the filter. (Courtesy of Dr. Roderick MacKinnon.)
potassium channel found in specific neurons of the cerebellum, a region of
the brain important for motor coordination. As a consequence of the mu-
tation, Na+ as well as K+ ions can pass through the channel. Increased
sodium permeability causes the membrane potential of the neurons to be-
come less negative, thus disrupting neuronal function. (Indeed, the absence
of the normal negative membrane potential in these cells is believed to be
the cause of their untimely death.) In recent years, it has become increas-
ingly clear that many inherited neurological disorders in humans, such as
certain forms of epilepsy, are explained by mutations of specific potassium
channels.
The Importance of Regulating the External Potassium Concentra-
tion. Because the neuronal membrane at rest is mostly permeable to K+,
the membrane potential is close to E K . Another consequence of high K+
permeability is that the membrane potential is particularly sensitive to
changes in the concentration of extracellular potassium. This relationship
is shown in Figure 3.19. A tenfold change in the K+ concentration outside
the cell, [K+]o, from 5 to 50 mM, would take the membrane potential
from -65 to -17 mY. A change in membrane potential from the normal
resting value (-65 mY) to a less negative value is called a depolarization
of the membrane. Therefore, increasing extracellular potassium depolarizes
neurons.
The sensitivity of the membrane potential to [K+10 has led to the evo-
lution of mechanisms that tightly regulate extracellular potassium concen-
trations in the brain. One of these is the blood-brain barrier, a special-
ization of the walls of brain capillaries that limits the movement of
potassium (and other bloodborne substances) into the extracellular fluid
of the brain.
Glia, particularly astrocytes, also possess efficient mechanisms to take up
extracellular K+ whenever concentrations rise. as they normally do during
periods of neural activity. Remember, astrocytes fill most of the space be-
tween neurons in the brain. Astrocytes have membrane potassium pumps
that concentrate K+ in their cytosol, and they also have potassium chan-
nels. When [K+]o increases, K+ ions enter the astrocyte through the potas-
sium channels, causing the astrocyte membrane to depolarize. The entry of
K+ ions increases the internal potassium concentration. [K ]i, which is
believed to be dissipated over a large area by the extensive network of
astrocytic processes. This mechanism for the regulation of [K+]o by astro-
cytes is called potassium spatial buffering (Figure 3.20).
It is important to recognize that not all excitable cells are protected from
increases in potassium. Muscle cells, for example, do not have a blood-
brain barrier or glial buffering mechanisms. Consequently, although the
brain is relatively protected, elevations of [K +] in the blood can still have
serious consequences on body physiology (Box 3.5).
... CONCLUDING REMARKS
We have now explored the resting membrane potential. The activity of the
sodium-potassium pump produces and maintains a large K+ concentration
gradient across the membrane. The neuronal membrane at rest is highly
permeable to K+, owing to the presence of membrane potassium channels.
The movement of K+ ions across the membrane, down their concentration
gradient, leaves the inside of the neuron negatively charged.
The electrical potential difference across the membrane can be thought
of as a battery whose charge is maintained by the work of the ion pumps.
In the next chapter, we'll see how this battery runs our brain.
... CONCLUDING REMARKS 71
20
>
.s
o
. -20
C
Q)
8.. -40
Q)
@ -60
.0
E
-80
-100
1
10
[K<]o (mM)
100
FIGURE 3.19
The dependence of membrane poten-
tial on external potassium concentra-
tion. Because the neuronal membrane at rest
is mostly permeable to potassium, a tenfold
change in [K+Jo' from 5 to 50 mM, causes a
48 mV depolarization of the membrane. This
function was calculated using the Goldman
equation (see Box 3.3).
K<
:. :
K<
'-
HK+Jo
/'
K<
- Astrocyte
K<
K<
FIGURE 3.20
Potassium spatial buffering by astro-
cytes. When brain [K4-Jo Increases as a result
of local neural activity, K+ enters astrocytes
via membrane channels. The extensive net-
work of astrocytic processes helps dissipate
the K+ over a large area.
72 C HAP T E R 3 . THE NEURONAL MEMBRANE AT REST
Box 3.5
.... , .
OF SPECIAL INTEREST
....
..
#
Death by Lethal Injection
On June 4. 1990. Dr. Jack Kevorkian shocked the medical
profession by assisting in the suicide of Janet Adkins. Ad-
kins. a 54-year-old. happily married mother of three. had
been diagnosed with Alzheimer's disease, a progressive
brain disorder that always results in senile dementia and
death. Mrs. Adkins had been a member of the Hemlock
Society. which advocates euthanasia as an alternative to
death by terminal illness. Dr. Kevorkian agreed to help
Mrs. Adkins take her own life. In the back of a 1968
Volkswagen van at a campsite in Oakland County. Michi-
gan. she was hooked to an intravenous line that infused a
harmless saline solution. To choose death. Mrs. Adkins
switched the solution to one that contained an anesthetic
solution, followed automatically by potassium chloride.
The anesthetic caused Mrs. Adkins to become uncon-
scious by suppressing the activity of neurons in part of
the brain called the reticular formation. However. cardiac
arrest and death were caused by the KCI injection. The
'"
-....
\
>-V>
wI:
a:::
w
Introduction
action potential (p. 52)
exci ble membrane (p. 53)
resting membrane potential (p.53)
The Cast of Chemicals
ion (p.54)
cation (p. 54)
anion (p.54)
phospholipid bilayer (p. 55)
peptide bond (p. 57)
polypeptide (p. 57)
ion channel (p. 58)
ionic basis of the resting membrane potential explains
why the heart stopped beating.
Recall that the proper functioning of excitable cells (in-
cluding those of cardiac muscle) requires that their mem-
branes be maintained at the resting potential whenever they
are not generating impulses. The negative resting potential
is a result of selective ionic permeability to K + and to the
metabolic pumps that concentrate potassium inside the
cell. However, as Figure 3.19 shows. membrane potential is
very sensitive to changes in the extracellular concentration
of potassium. A tenfold rise in extracellular K + would wipe
out the resting potential. Although neurons in the brain are
somewhat protected from large changes in [K +]0' other
excitable cells in the body. such as muscle cells. are not.
Without negative resting potentials. cardiac muscle cells can
no longer generate the impulses that lead to contraction.
and the heart immediately stops beating. Intravenous
potassium chloride is. therefore. a lethal injection.
ion selectivity (p. 58)
gating (p. 58)
ion pump (p. 59)
The Movement of Ions
diffusion (p. 59)
concentration gradient (p. 59)
electrical current (p. 60)
electrical potential (p. 60)
voltage (p. 60)
electrical conductance (p. 60)
electrical resistance (p. 60)
Ohm's law (p. 60)
The Ionic Basis of the Resting
Membrane Potential
membrane potential (p. 61)
microelectrode (p. 61)
ionic equilibrium potential
(equilibrium potential) (p. 61 )
ionic driving force (p. 63)
Nernst equation (p.64)
sodium-potassium pump (p. 65)
calcium pump (p. 67)
Goldman equation (p. 67)
depolarization (p. 71)
blood-brain barrier (p. 71)
flJ
V>
z
w
0
>
w I-
a:: V>
w
::>
a
T REVIEW QUESTIONS 13
I. What two functions do proteins in the neuronal membrane perform to establish and maintain the resting
membrane potential!
2. On which side of the neuronal membrane are Na + ions more abundant!
3. When the membrane is at the potassium equilibrium potential. in which direction (in or out) is there a net
movement of potassium ions?
4. There is a much greater K+ concentration inside the cell than outside. Why. then. is the resting membrane
potential negative!
5. When the brain is deprived of oxygen. the mitochondria within neurons cease producing ATP. What effect
would this have on the membrane potendal! Why?
60.
a::C)
Wz
I-
1-0
a:: <
::>w
u.a::
Hille B. 1992. Ionic Channels of Excitable Membranes,
2nd ed. Sunderland. MA: Sinauer.
MacKinnon R. 2003. Potassium channels. Federation of
European Biochemical Societies Letters 555:62-65.
Nicholls J. Wallace B. Fuchs P, Martin A. 200 I. From
Neuron to Brain. 4th ed. Sunderland. MA: Sinauer.
Somjen GG.2004. Ions in the Brain: Normal Function,
Seizures, and Stroke. New York: Oxford University
Press.
The Action Potential
INTRODUCTION
PROPERTIES OF THE ACTION POTENTIAL
THE UPS AND DOWNS OF AN ACTION POTENTIAL
. Box 4.1 Brain Food: Methods of Recording Action Potentials
THE GENERATION OF AN ACTION POTENTIAL
THE GENERATION OF MULTIPLE ACTION POTENTIALS
THE ACTION POTENTIAL, IN THEORY
MEMBRANE CURRENTS AND CONDUCTANCES
THE INS AND OUTS OF AN ACTION POTENTIAL
THE ACTION POTENTIAL, IN REALITY
THE VOLTAGE-GATED SODIUM CHANNEl
Sodium Channel Struaure
Funaional Properties of the Sodium Channel
. Box 4.2 Brain Food: The Patch-Clamp Method
The Effeas of Toxins on the Sodium Channel
. Box 4.3 Path of Discovery: Tetrodotoxin and the Dawn of Ion
Channel Pharmacology, by Toshio Narahashi
VOLTAGE-GATED POTASSIUM CHANNElS
PUTTING THE PIECES TOGETHER
ACTION POTENTIAL CONDUCTION
FACTORS INflUENCING CONDUCTION VElOCITY
. Box 4.4 Of Special Interest: Local Anesthesia
MYELIN AND SALTATORY CONDUCTION
. Box 4.5 Of Special Interest: Multiple Sclerosis, a
Demyelinating Disease
ACTION POTENTIALS,AXONS,AND DENDRITES
. Box 4.6 Of Special Interest: The Eclectic Electric Behavior
of Neurons
CONCLUDING REMARKS
CHAPTER
.......
76 C HAP T E R 4 . THE ACTION POTENTIAL
T INTRODUCTION
Now we come to the signal that conveys information over distances in the
nervous system-the action potential. As we saw in Chapter 3, the cytosol
in the neuron at rest is negatively charged with respect to the extracellular
fluid. The action potential is a rapid reversal of this situation such that, for
an instant, the inside of the membrane becomes positively charged with
respect to the outside. The action potential is also often called a spike, a
nerve impulse, or a discharge.
The action potentials generated by a cell are all similar in size and dura-
tion, and they do not diminish as they are conducted down the axon. Keep
in mind the big picture: The frequency and pattern of action potentials con-
stitute the code used by neurons to transfer information from one location
to another. In this chapter, we discuss the mechanisms that are responsible
for the action potential and how it propagates down the axonal membrane.
T PROPERTIES OF THE ACTION POTENTIAL
Action potentials have certain universal properties, features that are shared
by axons in the nervous systems of every beast, from a squid to a college
student. Let's begin by exploring some of these properties. What does the
action potential look like? How is it initiated? How rapidly can a neuron
generate action potentials?
The Ups and Downs of an Action Potential
In Chapter 3, we saw that the membrane potential, V m, can be determined
by inserting a microelectrode in the cell. A voltmeter is used to measure
the electrical potential difference between the tip of this intracellular micro-
electrode and another placed outside the cell. When the neuronal mem-
brane is at rest, the voltmeter reads a steady potential difference of about
-65 mY. During the action potential, however, the membrane potential
briefly becomes positive. Because this occurs so rapidly-lOa times faster
than the blink of an eye-a special type of voltmeter, called an oscilloscope,
is used to study action potentials. The oscilloscope records the voltage as it
changes over time (Box 4.1).
An action potential, as it would appear on the display of an oscilloscope,
is shown in Figure 4.1. This graph represents a plot of membrane potential
versus time. NOtice that the action potential has certain identifiable parts.
The first part, called the rising phase, is characterized by a rapid depolar-
ization of the membrane. This change in membrane potential continues
until V m reaches a peak value of about 40 mY. The part of the action po-
tential where the inside of the neuron is positively charged with respect
to the outside is called the overshoot. The falling phase of the action
potential is a rapid repolarization until the membrane is actually more neg-
ative than the resting potential. The last part of the faIling phase is called
the undershoot, or after-hyperpolarization. Finally, there is a gradual
restoration of the resting potential. From beginning to end, the action
potential lasts about 2 milliseconds (msec).
The Generation of an Action Potential
In Chapter 3, we said that breaking of the skin by a thumbtack was sufficient
to generate action potentials in a sensory nerve. Let's use this example to
see how an action potential begins.
The perception of sharp pain when a thumbtack enters your foot is
caused by the generation of action potentials in certain nerve fibers in the
40 t
20 r
:;- t
E- O
<ii
E
Q) t
15 -20
0-
Q)
c
ro [
15
E -40
Q)
:2:
-60
!
-80
0
(a)
.... PROPERTIES OFTHEACTJON POTENTIAL 77
Overshoot
OmV -----------------------------------------
Rising
phase -
Resting
potential
2
3
Time (msec)
(b)
skin. (We'll learn more about pain in Chapter 12.) The membrane of these
fibers is believed to possess a type of gated sodium channel that opens
when the nerve ending is stretched. The initial chain of events is therefore:
(1) the thumbtack enters the skin, (2) the membrane 01 the nerve fibers in
the skin is stretched, (3) Na+ -permeable channels open. Because of the
large concentration gradient and the negative charge o{ the cytosoL Na t-
ions enter the fiber through these channels. The entry of Na+ depolarizes
the membrane; that is, the cytoplasmic (inside) surface of the membrane
becomes less negative. If this depolarization, called a generator potential,
achieves a critical level, the membrane will generate an action potentiaL The
critical level of depolarization that must be crossed in order to trigger an
action potential is called threshold. Action potentials are caused by depoLar-
ization of the membrane beyond threshold.
The depolarization that causes action potentials arises in different ways in
different neurons. In our example above, depolarization was caused by the
entry of Na t- through specialized ion channels that were sensitive to mem-
brane stretching. In intemeurons, depolarization is usually caused by Na-t
entry through channels that are sensitive to neurotransmitters released by
other neurons. In addition to these natural routes, neurons can be depolar-
ized by injecting electrical current through a microelectrode, a method com-
monly used by neurosdentists to study action potentials in different cells.
Generating an action potential by depolarizing a neuron is something like
taking a photograph by pressing the shutter button on a camera. Applying
increasing pressure on the button has no effect until it crosses a threshold
value, and then "click" -the shutter opens and one frame of film is ex-
posed. Applying increasing depolarization to a neuron has no effect until it
crosses threshold, and then "pop" -one action potential. For this reason,
action potentials are said to be "all-or-none."
The Generation of Multiple Action Potentials
In the above example, we likened the generation of an action potential by
depolarization to taking a photograph by pressing the shutter button on a
camera. But what if the camera is one of those fancy motor-driven models
Falling
phase
Undershoot
FIGURE 4.1
An action potential. (a) An action pote'l-
tlal displayed by an oSCilloscope. (b) The parts
of an action potential.
78 C HAP T E R 4 . THE ACTION POTENTIAL
Box 4.1
1\
,'4.)
BRAIN FOO-
Methods of Recording Action Potentials
Methods for studying nerve impulses may be broadly divided
into two types: intracellular and extracellular (Figure A).
Intracellular recording requires impaling the neuron or axon
with a micro electrode. The small size of most neurons
makes this method challenging, and this explains why so
many of the early studies on action potentials were per-
formed on the neurons of invertebrates, which can be
50-100 times larger than mammalian neurons. Fortu-
nately, recent technical advances have made even the
smallest vertebrate neurons accessible to intracellular
recording methods, and these studies have confirmed that
much of what was learned in invertebrates is directly ap-
plicable to humans.
The goal of intracellular recording is simple: to meas-
ure the potential difference between the tip of the intra-
cellular electrode and another electrode placed in the
solution bathing the neuron (continuous with the earth,
and thus called ground). The intracellular electrode is
filled with a concentrated salt solution (often KCI) having
a high electrical conductivity. The electrode is connected
to an amplifier that compares the potential difference
between this electrode and ground. This
potential difference can be displayed
using an oscilloscope. The oscilloscope
sweeps a beam of electrons from left to
right across a phosphor screen. Vertical
deflections of this beam can be read as
changes in voltage. The oscilloscope is
really just a sophisticated voltmeter that
can record rapid changes in voltage
(such as an action potential).
As we shall see in this chapter, the
action potential is characterized by a
sequence of ionic movements across
the neuronal membrane. These electri-
cal currents can be detected without
impaling the neuron by placing an elec-
trode near the membrane. This is the
principle behind extracellular recording.
Again, we measure the potential differ-
jI
tt
" (
. I
'.
-
FIGURE A
ence between the tip of the recording electrode and
ground. The electrode can be a fine glass capillary filled
with a salt solution, but it is often simply a thin insulated
metal wire. Normally, in the absence of neural activity, the
potential difference between the extracellular recording
electrode and ground is zero. However, when the action
potential arrives at the recording position, positive charges
flow away from the recording electrode, into the neuron.
Then, as the action potential passes by, positive charges
flow out across the membrane toward the recording elec-
trode. Thus, the extracellular action potential is charac-
terized by a brief, alternating voltage difference between
the recording electrode and ground. (Notice the different
scale of the voltage changes produced by the action
potential recorded with intracellular and extracellular
recordings.) These changes in voltage can be seen using
an oscilloscope, but they can also be heard by connecting
the output of the amplifier to a loudspeaker. Each impulse
makes a distinctive "pop" sound. Indeed, recordjng the
activity of an active sensory nerve sounds just like mak-
ing popcorn.
Oscilloscope display
Amplifier
/
40mV
20mV
OmV
-20 mV
-40 mV
-60 mV
,
I
40!1V 1 0
20!1V
OIN
-20uV 0
-40 uV
- 60 IlV .
\
.".
Extracellular
electrode
that fashion and sports photographers use? In that case, continued
pressure on the shutter button beyond threshold would cause the cam-
era to shoot frame after frame. The same thing is true for a neuron. II,
for example, we pass continuous depolarizing current into a neuron
through a micro electrode, we will generate not one, but many action
potentials in succession (Figure 4.2).
'l-; I,
1 \ jl.' ___
Injected t) J Ii _
current \ 1 Jr >-
O '" ,/ I
O' / ",..r
O }a / v'"
rVJ A ' -= -Ground
t .
--......... Recording
Stim" ti I '" ) . electrode
electrode ' . I" .
y -
"'---. .- . ,:
(J- '/.' /, , -
l; r r -
L2 ' 1 r'
(aJ /1l-Axoo \
Amplifier
0
40 -
;;-
S
ro
0 -
Q)
0
a.
Q)
c
f:I --40 -
.c
E
Q)
:2: -65
-80
(b)
T PROPERTIES OFTHEACTION POTENTIAL 79
Injected
current
f / r--' 1,/ I'/ I'/
The rate of action potential generation depends on the magnitude of the
continuous depolarizing current. If we pass enough current through a
microelectrode to depolarize just to threshold, but not far beyond, we
might find that the cell generates action potentials at a rate of something
like one per second, or 1 hertz (Hz). If we crank up the current a little
bit more, however, we will find that the rate of action potential generation
increases, say, to 50 impulses per second (50 Hz). Thus, the firing frequency
of action potentials reflects the magnitude of the depolarizing current. This
is one way that stimulation intensity is encoded in the nervous system
(Figure 4.3).
Although firing frequency increases with the amount of depolarizing
current, there is a limit to the rate at which a neuron can generate action
potentials. The maximum firing frequency is about 1000 Hz; once an action
c L
no u__u__uuu____uuLJ um__u__ L
o -----------------.----. --
-65 mV
Time
If injected current does
not depolarize the
membrane to threshold,
no action potentials will
be generated.
If injected current
depolarizes the mem-
brane beyond threshold,
action potentials will be
generated.
The action potential
firing rate increases
as the depolarizing
current increases.
Time
FIGURE 4.2
The effect of injecting positive charge
into a neuron. (a) The axon hillock is
Impaled by two electrodes, one for recording
the membrane potential relative to ground
and the other for stimulating the neuron with
electrical current, (b) vVhen electrical current
is injected Into the neuron (top trace), the
membrane IS depolarized suffiCiently to fire
action potentials (bottom trace),
FIGURE 4.3
The dependence of action potential
firing frequency on the level of
depolarization.
80 C HAP T E R 4 . THE ACTION POTENTIAL
potential is initiated, it is impossible to initiate another for about 1 msec.
This period of time is called the absolute refractory period. In addition,
it can be relatively difficult to initiate another action potential for several
milliseconds after the end of the absolute refracrory period. During this
relative refractory period, the amount of current required to depolarize
the neuron to action potential threshold is elevated above normal.
We will now take a look at how the movement of ions across the
membrane through specialized protein channels causes a neural signal with
these properties.
... THE ACTION POTENTIAL, IN THEORY
The action potential is a dramatic redistribution of electrical charge across
the membrane. Depolarization of the cell during the action potential is caused by
the influx of sodium ions across the membrane, and repolarization is caused by the
efflux of potassium ions. Let's apply some of the concepts introduced in
Chapter 3 to help us understand how ions are driven across the membrane
and how these ionic movements affect the membrane potential.
Membrane Currents and Conductances
Consider the ideal neuron illustrated in Figure 4.4. The membrane of this cell
has three types of protein molecules: sodium-potassium pumps, potassium
channels, and sodium channels. The pumps work continuously to establish
and maintain concentration gradients. As in all our previous examples,
we'll assume that K+ is concentrated twentyfold inside the cell and that
Na+ is concentrated tenfold outside the cell. According to the Nernst equa-
tion, at 37°C, E K = -80 mV and E Na = 62 mY. Let's use this cell to explore
the factors that govern the movement of ions across the membrane.
We begin by assuming that both the potassium channels and the sodium
channels are closed, and that the membrane potential, Vm, is equal to 0 mV
(Figure 4.4a). Now let's open the potassium channels only (Figure 4.4b).
As we learned in Chapter 3, K+ ions will flow out of the cell, down their
concentration gradient, until the inside becomes negatively charged, and
V m = E K (Figure 4.4c). Here we want to focus our attention on the move-
ment of K+ that took the membrane potential from 0 mV to -80 mY. Con-
sider these three points:
1. The net movement of K+ ions across the membrane is an electrical cur-
rent. We can represent this current using the symbol I K .
2. The number of open potassium channels is proportional to an electrical
conductance. We can represent this conductance by the symbol gI<.
3. Membrane potassium currem, I K , will flow only as long as V m *- E K . The
driving force on K + is defined as the difference between the real membrane
potential and the equilibrium potential, and it can be written as V m - E K .
There is a simple relationship between the ionic driving force, ionic con-
ducrance, and the amount of ionic current that will flow. For K+ ions, this
may be written:
I K = gK (V m - E K ).
More generally, we write:
lioo = gioo (V m - E ioo ).
If this sounds familiar, that is because it is simply an expression of Ohm's
law, I = gV, which we learned abom in Chapter 3.
THE ACTION POTENTIAL. IN THEORY 81
Outside D
E K = - 80 mV
E Na = 62 mV
gK= 0
I K = gK (V m - E K ) = 0
Potassium
channel
-. Y 'N1T'o ..'<; ;:J:-. y IIY
--- W\X\' \ t_1'b_ ,':i:J!J:b' pj
Sodium
channel
Inside
Ideal neuron
Inside
cell
(a) 0
r LJ} ;: J
E, -oomv K+
K+ "1fJ 0
E Na = 62 mV ,y./ .J: '
gK> 0 ) i,- :.,' N -OJ
I K = gK (V m - E K ) > 0
(b)
0
l' 1 ' "..: -80 K+ K+
/
'" E K = - 80 mV II l
'" '\1'
1 "111
E Na = 62 mV J I ! fg!l:l
. u C .... J- . '} }-y "
\
gK> 0 I_
lK = gK (V m - E K ) = 0 K+ K+
(c)
FIGURE 4.4
Membrane currents and conductances. Here is an ideal neuron with sodium-potassium
pumps (not shown), potassium channels, and sodium channels. The pumps establish ionic
concentration gradients so that K+ is concentrated inside the cell and Na+ is concentrated
outside the cell. (a) Initially, we assume that all channels are closed and the membrane
potential equals 0 mY. (b) Now we open the potassium channels, and K+ flows out of the
cell. This movement of K+ is an electrical current, I K , and it flows as long as the membrane
conductance to K+ ions. gK, is greater than zero, and the membrane potential is not equal
to the potassium equilibrium potential. (c) At equilibnum, there is no net potassium current
because, although > 0, the membrane potential at equilibrium equals E K . At equilibrium,
an equal number of K+ ions enters and leaves.
Now let's take another look at our example. Initially, we began with
Y m = 0 mY and no ionic membrane permeability (Figure 4.4a). There is a
large driving force on K+ ions because Y m =I E K ; in fact, (Y m - E K ) = 80 mY.
However, because the membrane is impermeable to K+, the potassium con-
ductance, gK, equals zero. Consequently, I K = O. Potassium current only
flows when we stipulate that the membrane has open potassium channels,
and therefore gK > O. Now K+ ions flow out of the cell-as long as the
82 C HAP T E R 4 . THE ACTION POTENTIAL
membrane potential differs from the potassium equilibrium potential (Figure
4.4b). Notice that the current flow is in the direction that takes V m toward
E K . When V m = EI(, the membrane is at equilibrium, and no net current will
flow. In this condition. although there is a large potassium conductance, gK,
there is no longer any net driving force on the K+ ions (Figure 4.4c).
The Ins and Outs of an Action Potential
Let's pick up the action where we left off in the last section. The membrane
of our ideal neuron is permeable only to K+, and V m = E K = -80 mY.
What's happening with the Na+ ions concentrated outside the cell? Because
the membrane potential is so negative with respect to the sodium equilib-
rium potential. there is a very large driving force on Na+ ([V m - E Na ] =
[-80 mV - 62 mY] = -142 mY). Nonetheless, there can be no net Na+
current as long as the membrane is impermeable to Na+. But now let's open
the sodium channels and see what happens to the membrane potential.
At the instant we change the ionic permeability of the membrane, gNa is
high, and, as we said above, there is a large driving force pushing on Na +.
Thus, we have what it takes to generate a large sodium current, I Na , across
the membrane. Na+ ions pass through the membrane sodium channels in
the direction that takes V m toward E Na ; in this case, the sodium current,
I Na , is inward across the membrane. Assuming the membrane permeability
is now far greater to sodium than it is to potassium, this influx of Na+
depolarizes the neuron until V m approaches E Na , 62 mY.
Notice that something remarkable happened here. Simply by switching
the dominant membrane permeability from K+ to Na+, we were able to
rapidly reverse the membrane potential. In theory, then, the rising phase
of the action potential could be explained if, in response to depolarization
of the membrane beyond threshold, membrane sodium channels opened.
This would allow Na+ to enter the neuron, causing a massive depolariza-
tion until the membrane potential approached ENa.
How could we account for the falling phase of the action potential? Sim-
ply assume that sodium channels quickly close and the potassium channels
remain open. so the dominant membrane ion permeability switches back
from Na+ to K+. Then K+ would flow out of the cell until the membrane
potential again equals E K . Notice that if gK increased during the faIling
phase, the action potential would be even briefer.
Our model for the ins and outs, ups and downs of the action potential
in an ideal neuron is shown in Figure 4.5. The rising phase of the action
potential is explained by an inward sodium current, and the faIling phase
is explained by an outward potassium current. The action potential there-
fore could be accounted for simply by the movement of ions through
channels that are gated by changes in the membrane potential. If you un-
derstand this concept. you understand a lot about the ionic basis of the
action potential. What's left now is to see how this actually happens-in
a real neuron.
... THE ACTION POTENTIAL, IN REALITY
Let's quickly review our theory of the action potential. When the mem-
brane is depolarized to threshold, there is a transient increase in gNa' The
increase in gNa allows the entry of Na t- ions, which depolarizes the neuron.
And the increase in gNa must be brief in duration to account for the short
duration of the action potential. Restoring the negative membrane poten-
tial would be further aided by a transient increase in gK during the falling
phase, allowing K+ ions to leave the depolarized neuron faster.
..,. THE ACTION POTENTIAL. IN REALITY 83
gK» gNa
Outside
cell
I! II I J\
JL" J
"'n "
V
m
K+
Sodium
channel
Potassium
K + channel
' 11 '1, I
· 1
1 ' II 1
11111"
.....
Inside
cell
K+
K+
-80 mV
(a)
gNa» gK
r
, l '1;: -
JJJJ
Na+
t - w t
. fll
::lil
l
Na+
V
m
K+
K+
Sodium influx
-80 mV
(b)
gK» gNa
!' 1
..
'-
J , .... J
; .:
.. . \
, [...:r
V
m
Potassium efflux
K+
K+
1"
-80 mV
(c)
gK» gNa
(
I "
'J
! .1 1
,
!II
.,
-" I
,,,,.J " 1
1,1 I
......
I-
V
m
I
K+
K+
-\
K+
K+
-80 mV
(d)
FIGURE 4.5
Flipping the membrane potential by changing the relative ionic permeability of the membrane.
(a) The membrane of the ideal neuron, introduced in Figure 4.4. We begin by assuming that the membrane is per-
meable only to K+ and thatV m = E K . (b) We now stipulate that the membrane sodium channels open so that
gNa » gK.There is a large driving force on Na+, so Na-r Ions rush Into the cell, takingV m toward ENa. (c) Now
we close the sodium channels so that gK > > gNa' Because the membrane potential is positive, there is a large driv-
ing force on K+ ions. The efflux of K+ takes V m back toward E K . (d) The resting state is restored where V m = E K .
Time
..
84 C HAP T E R 4 . THE ACTION POTENTIAL
Testing this theory is simple enough in principle. All one has to do is
measure the sodium and potassium conductances of the membrane dur-
ing the action potential. In practice, however, such a measurement proved
to be quite difficult in real neurons. The key technical breakthrough was
the introduction of a device called a voltage clamp, invented by the
American physiologist Kenneth C. Cole, and the decisive experiments us-
ing it were performed by Cambridge University physiologists Alan Hodgkin
and Andrew Huxley around 1950. The voltage clamp enabled Hodgkin and
Huxley to "clamp" the membrane potential of an axon at any value they
chose. They could then deduce the changes in membrane conductance
that occur at different membrane potentials by measuring the currents that
flowed across the membrane. In an elegant series of experiments, Hodgkin
and Huxley showed that the rising phase of the action potential was in-
deed caused by a transient increase in gNa and an influx of Na+ ions, and
that the falling phase was associated with an increase in gK and an efflux
of K+ ions. Their accomplishments were recognized with the Nobel Prize
in 1963.
To account for the transient changes in gNa, Hodgkin and Huxley pro-
posed the existence of sodium "gates" in the axonal membrane. They hy-
pothesized that these gates are "activated" -opened-by depolarization
above threshold and "inactivated"-closed and locked-when the mem-
brane acquires a positive membrane potential. These gates are "deinacti-
vated"-unlocked and enabled to be opened again-only after the mem-
brane potential returns to a negative value.
It is a tribute to Hodgkin and Huxley that their hypotheses about mem-
brane gates predated by more than 20 years the direct demonstration of
voltage-gated channel proteins in the neuronal membrane. We have a new
understanding of gated membrane channels, thanks to two more recent sci-
entific breakthroughs. First, new molecular biological techniques have en-
abled neuroscientists to determine the detailed structure of these proteins.
Second, new neurophysiological techniques have enabled neuroscientists
to measure the ionic currents that pass through single channels. We will
now explore the action potential from the perspective of these membrane
ion channels.
The Voltage-Gated Sodium Channel
The voltage-gated sodium channel is aptly named. The protein forms
a pore in the membrane that is highly selective to Na + ions, and the
pore is opened and closed by changes in the electrical potential of the
membrane.
Sodium Channel Structure. The voltage-gated sodium channel is created
from a single long polypeptide. The molecule has four distinct domains,
numbered I-IV; each domain consists of six transmembrane alpha helices,
numbered SI-S6 (Figure 4.6). The four domains are believed to clump to-
gether to form a pore between them. The pore is closed at the negative rest-
ing membrane potential. When the membrane is depolarized to threshold,
however, the molecule twists into a configuration that allows the passage
of Na + through the pore (Figure 4.7).
Like the potassium channel, the sodium channel has pore loops that are
assembled into a selectivity filter. This filter makes the sodium channel 12
times more permeable to Na+ than it is to K+. Apparently, the Na+ ions
are stripped of most, but not all, of their associated water molecules as they
pass into the channel. The retained water serves as a sort of molecular chap-
erone for the ion, and is necessary for the ion to pass the selectivity filter.
Outside cell
Inside cell
N
(a)
II
1
I
mn
\ "'1
t
IV
'uuu t''ol
c
S1 S2 S3 S4 S5 S6
'L
+
) +
+
.. + /
,
(b) Pore
loop
I Selectivity filter
' '!f: )/
..
..... ..... ..
. . . ..
II St\ iI"nr II" I;I I +
+ +
11 1 ""1'11/,,1111 III + +
"' . ' , , C
t VOliage ""00'
(c)
Gate
." THE ACTION POTENTIAL, IN REALITY 85
FIGURE 4.6
The structure of the voltage-gated sodium channel. (a) A depiction of how the
sodium channel polypeptide chain is believed to be woven into the membrane. The mole-
cule consists of four domains. I-IV Each domain consists of six alpha helices (represented by
the blue cylinders). which pass back and forth across the membrane. (b) An expanded view
of one domain. showing the voltage sensor of alpha helix S4 and the pore loop (red). which
contributes to the selectivity filter. (c) A view of the molecule showing how the domains
may arrange themselves to form a pore between them. (Source: Adapted from Armstrong
and Hille. 1998. Fig. I.)
86 C HAP T E R 4 . THE ACTION POTENTIAL
FIGURE 4.7
A hypothetical model for changing the
configuration of the sodium channel by
depolarizing the membrane.
[ - -- - -1+- , l
ofH H o :
0 , ,
, i._( + ___
,
(Na+ ,
--- -- --
Size of Size of Size of
sodium partially partially
channel hydrated hydrated
selectivity Na+ ion K+ion
filter
FIGURE 4.8
Dimensions of the sodium channel se-
lectivity filter. Water accompanies the ions
as they pass through the channel. Hydrated
Na+ fits; hydrated K+ does not. (Source:
Adapted from Hille, 1992, Figs. 5, 6.)
Closed pore
Open pore
.. : .... - )- r ? X"
I ..." ( ;><
[' 11 !\jt ( I
) " +
+
I
J
- 65 mV
. . -40 mV
The ion-water complex can then be used to select Na+ and exclude K+
(Figure 4.8).
The sodium channel is gated by a change in voltage across the membrane.
It has now been established that the voltage sensor resides in segment 54
of the molecule. In this segment, positively charged amino acid residues are
regularly spaced along the coils of the helix. Thus, the entire segment can
be forced to move by changing the membrane potential. Depolarization
twists S4, and this conformational change in the molecule causes the gate
to open.
Functional Properties of the Sodium Channel. Research performed
around 1980 in the laboratory of Erwin Neher at the Max Planck Insti-
tute in Goettingen, Germany, revealed the functional properties of the
voltage-gated sodium channel. A new method was used, called the patch
clamp, to study the ionic currents passing through individual ion chan-
nels (Box 4.2). The patch-clamp method entails sealing the tip of an elec-
trode to a very small patch of neuronal membrane. This patch then can
be torn away from the neuron, and the ionic currents across it can be
measured as the membrane potential is clamped at any value the experi-
menter selects. With luck, the patch will contain only a single channel.
and the behavior of this channel can be studied. Patch clamping enabled
Neher and his colleagues to study the functional properties of the voltage-
gated sodium channel.
Changing the membrane potential of a patch of axonal membrane
from -80 to -65 mV has little effect on the voltage-gated sodium chan-
nels. They remain closed because depolarization of the membrane has
not yet reached threshold. Changing the membrane potential from -65
to -40 mY, however. causes these channels to pop open. As shown in
Figure 4.9. voltage-gated sodium channels have a characteristic pattern
of behavior:
I. They open with little delay.
2. They stay open for about 1 msec and then close (inactivate).
3. They cannot be opened again by depolarization until the membrane
potential returns to a negative value near threshold.
A hypothetical model for how conformational changes in the voltage-
gated sodium channel could account for these properties is illustrated in
Figure 4.9c.
A single channel does not an action potential make. The membrane of an
axon may contain thousands of sodium channels per square micrometer
(pm 2 ), and the concerted action of all these channels is required to gener-
ate what we measure as an action potential. Nonetheless, it is interesting
i
I
V -40mV p
m _ 65 mV ,
(a)
5 msec
Channel closed
:
T
Inward
current
T
Inward
current
T CD
Inward
cu rrent (b)
'Channel open
4
Sodium
channel Na+
---I=r--- ....-----.->--
I ;;' , :::::: r'.f }1 I J . fl.: ';
nil :,,( :' 'I' II I I'"
, ......
Membrane (
1
e
4
2
(c)
FIGURE 4.9
The opening and closing of sodium channels upon membrane depolarization.
(a) This trace shows the electrical potential across a patch of membrane. When the mem-
brane potential is changed from -65 to -40 mV, the sodium channels pop open. (b) These
traces show how three different channels respond to the voltage step. Each line is a record
of the electrical current that flows through a single channel. <D At -65 mV, the channels are
closed, so there is no current. (2) When the membrane is depolarized to -40 mV, the chan-
nels briefly open and current flows inward, represented by the downward deflection in the
current traces. Although there IS some variability from channel to channel, all of them open
with little delay and stay open for less than I msec. Notice that after they have opened
once, they close and stay closed as long as the membrane IS maintained at a depolarized V m
@ The closure of the sodium channel by steady depolarization is called inactivation. @ To
deinactivate the channels, the membrane must be returned to -65 mV again. (c) A model
for how changes in the conformation of the sodium channel protein might yield its functional
properties. <D The closed channel (2) opens upon membrane depolarization. @ Inactivation
occurs when a globular portion of the protein swings up and occludes the pore. @ Oeinacti-
vation occurs when the globular portion swings away and the pore closes by movement of
the transmembrane domains.
to see how many of the properties of the action potential can be ex-
plained by the properties of the voltage-gated sodium channel. For exam-
ple, the fact that single channels do not open until a critical level of
membrane depolarization is reached explains the action potential thresh-
old. The rapid opening of the channels in response to depolarization explains
why the rising phase of the action potential occurs so quickly. And the
... THE ACTION POTENTIAL. IN REALITY 87
88 C HAP T E R 4 . THE ACTION POTENTIAL
Box 4.2
L "
' I
BRAIN FOO-
The Patch-Clamp Method
The very existence of voltage-gated channels in the neu-
ronal membrane was merely conjecture until the develop-
ment of methods to study individual channel proteins. A
revolutionary new method, the patch damp, was developed
by German neuroscientists Bert Sakmann and Erwin Neher
in the mid-1970s. In recognition of their contribution,
Sakmann and Neher were awarded the 1991 Nobel Prize.
Patch clamping enables one to record ionic currents
through single channels (Figure A). The first step is gently
lowering the fire-polished tip of a glass recording elec-
trode, 1-5 J..Im in diameter, onto the membrane of the
neuron (part a), and then applying suction through the
electrode tip (part b). A tight seal forms between the
walls of the electrode and the underlying patch of mem-
brane. This "gigaohm" seal (so named because of its high
electrical resistance, > 10 9 Q) leaves the ions in the elec-
Pipette /
\
trode only one path to take, through the channels in the
underlying patch of membrane. If the electrode is then
withdrawn from the cell, the membrane patch can be torn
away (part c), and ionic currents can be measured as
steady voltages are applied across the membrane (part d).
With a little luck. one can resolve currents flowing
through single channels. If the patch contains a voltage-
gated sodium channel, for example, then changing the
membrane potential from -65 to -40 mV will cause the
channel to open, and current (I) will flow through it (part
e). The amplitude of the measured current at a constant
membrane voltage reflects the channel conductance, and
the duration of the current reflects the time the channel
is open.
Patch-damp recordings reveal that most channels flip
between two conductance states that can be interpreted as
open or dosed. The time they remain open can vary, but the
single-channel conductance value stays the same and is there-
fore said to be unitary. Ions can pass through single channels
at an astonishing rate--well over a million per second.
Sodium
channel (closed)
Sodium
channel (open)
"
Neuron
(a)
Gigaohm
seal
(b)
V m
-65 mV
Out
I
In
FIGURE A (e)
(c)
(d)
Voltage change across a patch of membrane
Channel closed
\
short time the channels stay open before inactivating (about 1 msec)
partly explains why the action potential is so brief. Furthermore, inacti-
vation of the channels can account for the absolute rdractory period:
Another action potential cannot be generated until the channels are
deinactivated.
There are several djIferent sodium channel genes in the human genome.
Differences in the expression of these genes among neurons can give rise
to subtle but important variations in the properties of the action potential.
Recently, single amino acid mutations in the extracellular regions of one
sodium channel have been shown to cause a common inherited disorder
in human infants known as generalized epilepsy with febrile seizures. Epileptic
seizures result from explosive, highly synchronous electrical activity in the
brain. (Epilepsy is discussed in detail in Chapter 19.) The seizures in this
disorder occur in response to fever (febrile is derived from the Latin word
I'or "fever"). They are usually confined to early childhood, between 3 months
and 5 years of age. Although precisely how the seizures are triggered by an
increase in brain temperature is not clear, among other effects, the muta-
tions slow the inactivation of the sodium channel, prolonging the action
potential. Generalized epilepsy with febrile seizures is a channelopathy, a
human genetic disease caused by alterations in the structure and I'unction
of ion channels.
The Effects of Toxins on the Sodium Channel. Toshio Narahashi,
working at Duke University in the early 1960s, made the seminal discov-
ery that a toxin isolated from the ovaries of the puffer fish could selectively
block the sodium channel (Box 4.3). Tetrodotoxin (TTX) clogs the Na+-
permeable pore by binding tightly to a specific site on the outside of the
channel. TIX blocks all sodium-dependent action potentials, and therefore
is usually fatal if ingested. Nonetheless, puffer fish are considered a delicacy
in Japan. Sushi chefs train for years, and are licensed by the government,
to prepare puffer fish in such a way that eating them causes numbness
around the mouth. Talk about adventurous eating!
TIX is one of a number of natural toxins that interfere with the function
of the voltage-gated sodium channel. Another channel-blocking toxin is
saxitoxin, produced by dinoflagellates of the genus Gonyaulax. Saxitoxin is
concentrated in clams, mussels, and other shellfish that Ieed on these marine
protozoa. Occasionally, the dinoflagellates bloom, causing what is known
as a "red tide." Eating shellfish at these times can be fatal, because of the
unusually high concentration of the toxin.
In addition to the toxins that block sodium channels, certain compounds
interfere with nervous system function by causing the channels to open
inappropriately. In this category is batrachotoxin, isolated from the skin of a
species of Colombian frog. Batrachotoxin causes the channels to open at
more negative potentials and to stay open much longer than usual, thus
scrambling the information encoded by the action potentials. Toxins pro-
duced by lilies (veratridine) and buttercups (aconitine) have a similar mech-
anism of action. Sodium channel inactivation is also disrupted by toxins
from scorpions and sea anemones.
What can we learn from these toxins? First, the different toxins disrupt
channel function by binding to different sites on the protein. Information
about toxin binding and its consequences have helped researchers deduce
the three-dimensional structure of the sodium channel. Second, the toxins
can be used as experimental tools to study the consequences of blocking
action potentials. For example, as we shall see in later chapters, TIX is
commonly used for experiments that require the blocking of impulses in a
nerve or muscle. The third and most important lesson from studying toxins?
Be careful what you put in your mouth!
... THE ACTION POTENTIAL. IN REALITY 89
90 C HAP T E R 4 . THE ACTION POTENTIAL
Box 4.3
PATH OF DISCOVERY
'">
...
.
Tetrodotoxin and the Dawn
of Ion Channel Pharmacology
Puffer fish is regarded as the most delicious fish in japan
(Figure A). However, the tetrodotoxin (TTX) it contains
makes the fish very dangerous to eat, and a special license
is required to serve puffer fish at a restaurant in japan. Yet
some "fish lovers" try to achieve ecstasy through the
numb feeling on the lips that comes from eadng a small
piece of ovary or liver containing TTX. This sometimes
results in accidental death, which is caused by paralysis of
the diaphragm due to nerve and muscle block. TTX has
now been a source of scientific ecstasy in neurophysiology.
Shortly after starting my scientific career at the Uni-
versity of Tokyo, 1 came across fascinating papers by
Hodgkin, Huxley, and Katz in which they extensively uti-
lized the voltage clamp technique originally invented by
Cole. This was the dawn of the ion channel theory of
nerve excitation. Since that time, I have cherished a dream
of explaining the mechanism of action of various drugs
in terms of changes in ion channel function. However,
voltage clamp was an extremely difficult technique at
that time.
. ....
.. ..
.... ..
..
'.
.
'--
.
. ,
I'
..'
. .
...
.
;,P.,
FIGURE A
A puffer fish blows out when irritated. (Courtesy of Dr. T Narahashi.)
,
"
by Toshio Narahashi
In 1959, I encountered a very specific and potentially
important action of the puffer fish toxin TTX. Using the
intracellular microelectrode recording of action potentials
from frog skeletal muscle, we found that TTX blocked
action potentials through selective inhibition of sodium
channels without any changes in potassium channels.
However, the ultimate conclusion awaited voltage clamp
experimentation.
I reported the TTX study at the japanese Pharmacology
Society Meeting in Tokyo in 1960. There were only two
young pharmacologists in the audience who were familiar
with ion channels, and intense discussions ensued. Drs.
Masanori Otsuka and Makoto Endo have remained very
good friends since that time.
The day I left for the United States in 1961, Dr. Norimoto
Urakawa, a collaborator in the TTX study, slipped a small
vial of TTX in my pocket. We were hoping that someday
we would be able to prove the validity of our hypothesis
of TTX action by the voltage clamp technique.
The chance finally arrived in late 1962 when I was at
Duke University Medical Center. Dr. john W. Moore, an
expert in voltage clamp, and I thought we could finish the
TTX experiments before my return to japan to obtain an
immigrant visa. Experiments using lobster giant axons were
performed literally day and night during the Christmas
season, with the help of William Scott (then a medical
student). The technique was extremely difficult, yet we
managed to obtain results sufficient for publication. I took
the freshly developed 35 mm films of ionic current records,
which had barely dried (no computer at that time), to
japan for analysis. After submitting a manuscript, I re-
ceived the first request for a TTX sample--jotted down
with the signature at the end of the referee's comments.
This 1964 paper, clearly demonstrating TTX's selective
and potent block of sodium channels, marked the begin-
ning of a new era. In the early I 960s, it was inconceivable
to utilize any chemicals and toxins as tools for the study
of ion channel function. TTX has since been used as a
popular chemical tool to characterize sodium channels
and other channels, because of its highly specific action.
The TTX study indeed opened a new concept of studying
the mechanism of action of various drugs, toxins, and chem-
icals on neuronal receptors and ion channels, a neuro-
science field now flourishing in biomedical science.
Voltage-Gated Potassium Channels
Hodgkin and Huxley's experiments indicated that the falling phase of the
action potential was explained only partly by the inactivation of gNa. They
found there was also a transient increase in gK that functioned to speed the
restoration of a negative membrane potential after the spike. They pro-
posed the existence of membrane potassium gates that, like sodium gates,
open in response to depolarization of the membrane. Unlike sodium gates,
however, potassium gates do not open immediately upon depolarization; it
takes about 1 msec for them to open. Because of this delay, and because this
potassium conductance serves to rectify, or reset, the membrane potential,
they called this conductance the delayed rectifier.
We now know that there are many different types of voltage-gated potas-
sium channels. Most of them open when the membrane is depolarized
and function to diminish any further depolarization by giving K+ ions a
path to leave the cell across the membrane. The known voltage-gated
potassium channels have a similar structure. The channel proteins consist
of four separate polypeptide subunits that come together to form a pore be-
tween them. Like the sodium channel, these proteins are sensitive to
changes in the electrical field across the membrane. When the membrane
is depolarized, the subunits are believed to twist into a shape that allows
K+ ions to pass through the pore.
,
Putting the Pieces Together
We can now use what we've learned about ions and channels to explain
the key properties of the action potential (Figure 4.10).
. Threshold. Threshold is the membrane potential at which enough volt-
age-gated sodium channels open so that the relative ionic permeability
of the membrane favors sodium over potassium.
. Rising phase. When the inside of the membrane has a negative electrical
potential, there is a large driving force on Na+ ions. Therefore, Na+ ions
rush into the cell through the open sodium channels, causing the mem-
brane to rapidly depolarize.
. Overshoot. Because the relative permeability of the membrane greatly
favors sodium, the membrane potential goes to a value close to E Na ,
which is greater than 0 mY.
. Falling phase. The behavior of two types of channel contributes to the
falling phase. First, the voltage-gated sodium channels inactivate. Sec-
ond, the voltage-gated potassium channels finally open (triggered to do
so 1 msec earlier by the depolarization of the membrane). There is a
great driving force on K+ ions when the membrane is strongly depolar-
ized. Therefore, K'- ions rush out of the cell through the open channels,
causing the membrane potential to become negative again.
. Undershoot. The open voltage-gated potassium channels add to the rest-
ing potassium membrane permeability. Because there is very little sodium
permeability, the membrane potential goes toward EK' causing a hyper-
polarization relative to the resting membrane potential until the voltage-
gated potassium channels close again.
. Absolute refractory period. Sodium channels inactivate when the mem-
brane becomes strongly depolarized. They cannot be activated again, and
another action potential cannot be generated, until the membrane
potential goes sufficiently negative to deinactivate the channels.
,
.... THE ACTION POTENTIAL. IN REALITY 91
92 C HAP T E R 4 . THE ACTION POTENTIAL
FIGURE 4.10
The molecular basis of the action potential. (a) The mem-
brane potential as it changes In time during an action potential. The
rising phase of the action potential IS caused by the Infiux of Na+
ions through hundreds of voltage-gated sodium channels. The falling
phase IS caused by sodium channel inactivation and the efflux of K+
ions through voltage-gated potassium channels. (b) The inward cur-
rents through three representative voltage-gated sodium channels.
Eacn channel opens with little delay when the membrane is depolar-
ized to threshold. The channels stay open for no more than I msec
and then inactivate. (c) The summed Na+ current fiowing through all
the sodium channels. (d) The outward currents through three repre-
sentative voltage-gated potassium channels. Voltage-gated potassium
channels open about I msec after the membrane is depolanzed to
threshold and stay open as long as the membrane is depolarized. The
high potassium permeability causes the membrane to hyperpolarize
bnefiy. VVhen the voltage-gated potassium channels close. the mem-
brane potential relaxes back to the resting value, around -65 mV
(e) The summed K+ current fiowing through all the potassium chan-
nels. (f) The net transmembrane current during the action potential
(the sum of parts c and e).
Currents
through
voltage-gated
sodium
channels
Summed
Na+ current
through all
channels
:Ie
:J
;:
.s III
+ :=
C
,.,
,
,
--r------
(a)
I:\m
I : l"" , : T Inward
.n. . _
" . j t
" : t curren
:T
(c)
,
Currents rl 1
through I . - : 1 Outward
voltage-gated -0; , t
. I'. curren
potassium t'1 Jl'..... 11\ : 1
channels "
(d)" '
Summed
K+ current
through all
channels
(e)
K+ efflux
Net
transmembrane
current \'
(f) :
,
t Outward
current
, Inward
current
Na+ influx
. Relative refractory period. The membrane potential stays hyperpolarized
until the voltage-gated potassium channels close. Therefore, more depo-
larizing current is required to bring the membrane potential to threshold.
We've seen that channels and the movement of ions through them
can explain the properties of the action potential. Bur it is important to
remember that the sodium-pOIassium pump also is working quieIly in
the background. Imagine that the entry of Na+ during each anion po-
tential is like a wave coming over the bow of a boat making way in
heavy seas. Like the continuous anion of the boat's bilge pump, the
sodium-potassium pump works all the time to transport Na+ back across
the membrane. The pump maintains the ionic concentration gradients that
drive Na + and K+ through their channels during the action potential.
T ACTION POTENTIAL CONDUCTION
In order to transfer information from one point to another in the nervous
system, it is necessary that the action potential, once generated, be conducted
down the axon. This process is like the burning of a fuse. Imagine you're
holding a firecracker with a burning match held under the fuse. The fuse
ignites when it gets hot enough (beyond some threshold). The tip of the
burning fuse heats up the segment of {use immediately ahead of it until it
ignites. In this way, the flame steadily works its way down the {use. Note
that the {use lit at one end only burns in one direction; the flame cannot
turn back on itself because the combustible material just behind it is spent.
Propagation of the action potential along the axon is similar to the prop-
agation of the flame along the fuse. When the axon is depolarized suffi-
ciently to reach threshold, voltage-gated sodium channels open, and the
action potential is initiated. The influx of positive charge depolarizes the
segment o{ membrane immediately before it until it reaches threshold and
generates its own action potential (Figure 4.11). In this way, the action
potential works its way down the axon until it reaches the axon terminal,
thereby initiating synaptic transmission (the subject of Chapter 5).
An action potential initiated at one end of an axon propagates only in one
direction; it does nOl turn back On itself. This is because the membrane just
behind it is refractory, due to inactivation of the sodium channels. But, just
like the fuse, an action potential can be generated by depolarization at either
end of the axon and therefore can propagate in either direction. (Normally,
action potentials conduct only in one direction; this is called orthodromic
conduction. Backward propagation, sometimes elicited experimentally, is
o
o .-
o
tj o_
(
Time zero
c
(
1 msec later
o
t
0-
(
,
2 msec later
o
t L-
(
(:
-
3 msec later
FIGURE 4./1
Action potential conduction. The entry of positive charge during the action potential
causes the membrane just ahead to depolarize to threshold.
... ACTION POTENTIAL CONDUCTION 93
94 C HAP T E R 4 . THE ACTION POTENTIAL
called antidromic conduction.) Note that because the axonal membrane is
excitable (capable of generating action potentials) along its entire length,
the impulse will propagate without decrement. The fuse works the same
way, because it is combustible along its entire length. Unlike the fuse, how-
ever, the axon can regenerate its firing ability.
Action potential conduction velocities vary, but 10 m/sec is a typical rate.
Remember. from start to finish the action potential lasts about 2 msec.
From this, we can calculate the length of membrane that is engaged in the
action potential at any instant in time:
10 m/sec X 2 X 10- 3 sec = 2 X 10- 2 m.
Therefore, an action potential traveling at 10 mlsec occurs over a 2 cm
length of axon.
Factors Influencing Conduction Velocity
Remember that the inward Na+ current during the action potential depolar-
izes the patch of membrane just ahead. If this patch reaches threshold, it will
fire an action potential, and the action potential will "burn" on down the
membrane. The speed with which the action potential propagates down the
axon depends on how far the depolarization ahead of the action potential
spreads, which in turn depends on certain physical characteristics of the axon.
Imagine that the influx of positive charge into an axon during the action
potential is like turning on the water to a leaky garden hose. There are two
paths the water can take: one, down the inside of the hose; the other,
across the hose through the leaks. How much water goes along each path
depends on their relative resistance; most of the water will take the path
of least resistance. If the hose is narrow and the leaks are numerous and
large, most of the water will flow out through the leaks. If the hose is wide
and the leaks are few and tiny, most of the water will flow down the in-
side of the hose. The same principles apply to positive current spreading
down the axon ahead of the action potential.
There are two paths that positive charge can take: one, down the inside
of the axon; the other, across the axonal membrane. If the axon is narrow
and there are many open membrane pores, most of the current will flow
out across the membrane. If the axon is wide and there are few open
membrane pores, most of the current will flow down inside the axon. The
farther the current goes down the axon, the farther ahead of the action
potential the membrane will be depolarized, and the faster the action poten-
tial will propagate. As a rule, therefore, action potential conduction velocity
increases with increasing axonal diameter.
As a consequence of this relationship between axonal diameter and
conduction velocity, neural pathways that are especially important for sur-
vival have evolved unusually large axons. An example is the giant axon of
the squid, which is part of a pathway that mediates an escape reflex in
response to strong sensory stimulation. The squid giant axon can be 1 mm
in diameter, so large that originally it was thought to be part of the ani-
mal's circulatory system. Neuroscience owes a debt to British zoologist J. Z.
Young, who, in 1939, called attention to the squid giant axon as an exper-
imental preparation for studying the biophysics of the neuronal membrane.
Hodgkin and Huxley used this preparation to elucidate the ionic basis of
the action potential, and the giant axon continues to be used today for a
wide range of neurobiological studies.
It is interesting to note that axonal size, and the number of voltage-gated
channels in the membrane, also affect axonal excitability. Smaller axons
require greater depolarization to reach action potential threshold and are
more sensitive to being blocked by local anesthetics (Box 4.4).
Box 4.4
.... ' ...
OF SPECIAL INTEREST
...
...
Local Anesthesia
Although you've tried to tough it out, you just can't take
it anymore. You finally give in to the pain of the toothache
and head for the dentist. Fortunately, the worst part of
having a cavity filled is the pinprick in the gum caused by
the injection needle. After the injection, your mouth is
numb and you daydream while the dentist drills and re-
pairs your tooth. What was injected, and how did it work?
Local anesthetics are drugs that temporarily block ac-
tion potentials in axons. They are called "local" because
they are injected directly into the tissue where anesthe-
sia-the absence of sensation-is desired. Small axons,
firing a lot of action potentials, are most sensitive to con-
duction block by local anesthetics.
The first local anesthetic introduced into medical prac-
tice was cocaine. The chemical was originally isolated from
the leaves of the coca plant in 1860 by the German physi-
cian Albert Niemann. According to the custom of the phar-
macologists of his day, Niemann tasted the new compound
and discovered that it caused his tongue to go numb. It was
soon learned that cocaine had toxic and addictive proper-
ties. (The mind-altering effect of cocaine was studied by
another well-known physician of that era, Sigmund Freud.
Cocaine alters mood by a mechanism distinct from its
local anesthetic action, as we shall see in Chapter IS.)
The search for a suitable synthetic substitute for co-
caine led to the development of lidocaine. which is now
the most widely used local anesthetic. Lidocaine can be
dissolved into a jelly and smeared onto the mucous mem-
branes of the mouth (and elsewhere) to numb the nerve
endings (called topical anesthesia); it can be injected di-
rectly into a tissue (infiltration anesthesia) or a nerve (nerve
block); it can even be infused into the cerebrospinal fluid
bathing the spinal cord (sPinal anesthesia). where it can
numb large parts of the body.
Lidocaine and other local anesthetics prevent action po-
tentials by binding to the voltage-gated sodium channels.
The binding site for lidocaine has been identified as the S6
alpha helix of domain IV of the protein (Figure A). Lido-
caine cannot gain access to this site from the outside. The
anesthetic first must cross the axonal membrane and then
pass through the open gate of the channel to find its bind-
ing site inside the pore. This explains why active nerves are
blocked faster (the sodium channel gates are open more
often). The bound lidocaine interferes with the flow of
Na + that normally results from depolarizing the channel.
Smaller axons are affected by local anesthetics before
larger axons because their action potentials have less of
a safety margin; more of the voltage-gated sodium channels
..,. ACTION POTENTIAL CONDUCTION 95
must function to ensure that the action potential doesn't
fizzle out as it conducts down the axon. This increased
sensitivity of small axons to local anesthetics is fortuitous
in clinical practice. As we will discover in Chapter 12, it
is the smaller fibers that convey information about painful
stimuli-like a toothache.
n
{l'
Nl
C 2 H.'--. ........C 2 H s
N
I
fH2
o=c
I
15r
Lidocaine
II n III Cl
IL : I I
lJlc
86 alpha helix
_ lidocaine
-....... . .
/btndlng
sites
//
---
../
FIGURE A
Lidocaine's mechanism of action. (Source: Adapted fi"Ofn Hard-
man et aI., 1996, Fig. 15-3.)
96 C HAP T E R 4 . THE ACTION POTENTIAL
Myelin and Saltatory Conduction
The good thing about fat axons is that they conduct action potentials faster;
the bad thing about them is that they take up a lot of space. If all the ax-
ons in your brain were the diameter of a squid giant axon, your head
would be too big to fit through a barn door. Fortunately, vertebrates evolved
another solution for increasing action potential conduction velocity: wrap-
ping the axon with insulation called myelin (see Chapter 2). The myelin
sheath consists of many layers of membrane provided by glial support
cells-Schwann cells in the peripheral nervous system (outside the brain
and spinal cord) and oJigodendroglia in the central nervous system. Just as
wrapping the leaky garden hose with duct tape facilitates water flow down
the inside of the hose, myelin facilitates current flow down the inside of
the axon, thereby increasing action potential conduction velocity (Box 4.5).
The myelin sheath does not extend continuously along the entire length
of the axon. There are breaks in the insulation where ions cross the
membrane, to generate action potentials. As you'll recall from Chapter 2,
these breaks in the myelin sheath are the nodes of Ranvier (Figure 4.12).
Voltage-gated sodium channels are concentrated in the membrane of the
nodes. The distance between nodes is usually 0.2-2.0 mm, depending on
the size of the axon (fatter axons have larger internodal distances).
Imagine that the action potential traveling along the axon membrane is
like you traveling down a sidewalk. Action potential conduction without
myelin is like walking down the sidewalk in small steps, heel-to-toe, using
Box 4.5
.... , ...
I
OF SPECIAL INTEREST
., I ",,"
--
Multiple Sclerosis, a
Demyelinating Disease
The critical importance of myelin for the normal transfer
of information in the human nervous system is revealed
by the neurological disorder known as multiple sclerosis
(MS). Victims of MS often complain of weakness, lack of
coordination, and impaired vision and speech. The disease
is capricious, usually marked by remissions and relapses
that occur over a period of many years. Although the
precise cause of MS is still poorly understood, the cause
of the sensory and motor disturbances is now quite clear.
MS attacks the myelin sheaths of bundles ofaxons in the
brain, spinal cord, and optic nerves. The name is derived
from the Greek word for "hardening:' which describes
the lesions that develop around bundles ofaxons; and the
sclerosis is multiple because the disease attacks many
sites in the nervous system at the same time.
Lesions in the brain can now be viewed noninvasively
using new methods such as magnetic resonance imaging
(MRI). However. neurologists have been able to diagnose
MS for many years by taking advantage of the fact that
myelin serves the nervous system by increasing the veloc-
ity of axonal conduction. One simple test involves stimu-
lating the eye with a checkerboard pattern, then measuring
the elapsed time until an electrical response occurs from
the scalp over the part of the brain that is a target of the
optic nerve. People who have MS are characterized by a
marked slowing of the conduction velocity of their optic
nerve.
Another; more common demyelinating disease is called
Cuil/oin-Barre syndrome, which attacks the myelin of the
peripheral' nerves that innervate muscle and skin. This
disease may follow minor infectious illnesses and inocula-
tions, and it appears to result from an anomalous immuno-
logical response against one's own myelin. The symptoms
stem directly from the slowing and/or failure of action
potential conduction in the axons that innervate the
muscles. This conduction deficit can be demonstrated
clinically by stimulating the peripheral nerves electrically
through the skin, then measuring the time it takes to
evoke a response (a twitch of a muscle. for instance). Both
MS and Guillain-Barre syndrome are characterized by a
profound slowing of the response time, because saltatory
conduction is disrupted.
.... ACTION POTENTIALS. AXONS. AND DENDRITES 97
--------
)
\.
y
Myelin sheath
Myelin
sheath
o /
t .
OV
;}
/
Node of Axon
Ranvier
. /f/jfI(
:.
..
\ \
Time zero
,
o
. 'n,
.\t /
.
. / , .
J
lilt
.
-.
) ,
,
- /J
- I
,/
/
1 msec later
every inch of the sidewalk to creep along. Conduction with myelin, in
contrast, is like skipping down the sidewalk. In myelinated axons, action
potentials skip from node to node (Figure 4.13). This type of action poten-
tial propagation is called saltatory conduction (from the Latin meaning
"to leap").
... ACTION POTENTIALS, AXONS, AND DENDRITES
Action potentials of the type discussed in this chapter are a feature mainly
ofaxons. As a rule, the membranes of dendrites and neuronal cell bodies
do not generate sodium-dependent action potentials because they have
very few voltage-gated sodium channels. Only membrane that contains
these specialized protein molecules is capable of generating action poten-
tials, and this type of excitable membrane is usually found only in axons.
Therefore, the part of the neuron where an axon originates from the soma,
the axon hillock, is often also called the spike-initiation zone. In a typi-
cal neuron in the brain or spinal cord, the depolarization of the dendrites
and soma caused by synaptic input from other neurons leads to the gener-
ation of action potentials if the membrane of the axon hillock is depolarized
beyond threshold (Figure 4.I4a). In most sensory neurons, however, the
spike-initiation zone occurs near the sensory nerve endings, where the depo-
larization caused by sensory stimulation leads to the generation of action
potentials that propagate up the sensory nerves (Figure 4.I4b).
FIGURE 4.12
The myelin sheath and node of
Ranvier. The electrical Insulation provided
by myelin helps speed action potential
conduction from node to node. Voltage-gated
sodium channels are concentrated in the
axonal membrane at the nodes of Ranvier.
FIGURE 4.13
Saltatory conduction. Myelin allows
current to spread farther and faster between
nodes. thus speeding action potential conduc-
tion. Compare this figure with Figure 4. I I.
98 C HAP T E R 4 . THE ACTION POTENTIAL
FIGURE 4.14
The spike-initiation zone. Membrane
proteins specity the function of different parts
of the neuron. Depicted here are (a) a corti-
cal pyramidal neuron and (b) a pnmary sen-
sory neuron. Despite the diversity of neuronal
structure. the axonal membrane can be identi-
fied at the molecular level by its high denSity
of voltage-gated sodium channels. This molec-
ular distinction enables axons to generate
and conduct aGlon potentials. The region of
membrane where action potentials are nor-
mally generated is the spike-Initiation zone.
The arrows indicate the normal direction of
action potential propagation in these two
types of neuron.
Pyramidal cell
_ Membrane
with high density
of voltage-gated
sodium channels
(
Sensory
neuron
--
ike-initiation
zone: sensory nerve ending
------
(a)
(b)
In Chapter 2, we learned that axons and dendrites differ in their mor-
phology. We now see that they are functionally different, and that this dif-
ference in function is specified at the molecular level by the type of protein
in the neuronal membrane. Differences in the types and density of mem-
brane ion channels also can account for the characteristic electrical proper-
ties of different types of neuron (Box 4.6).
1
... CONCLUDING REMARKS
Let's return briefly to the example in Chapter 3 of stepping on a thumb-
tack. The breaking of the skin caused by the tack stretches the sensory
nerve endings of the foot. Special ion channels that are sensitive to the
stretching of the membrane open and allow positively charged sodium ions
to enter the nerve endings. This influx of positive charge depolarizes the
membrane of the spike-initiation zone to threshold, and the action poten-
tial is generated. The positive charge that enters during the rising phase of
the action potential spreads down the axon and depolarizes the membrane
ahead to threshold. In this way, the action potential is continuously regen-
erated as it sweeps like a wave up the sensory axon. We now come to the
step where this information is distributed and integrated by other neurons
in the central nervous system. This transfer of information from one neu-
ron to another is called synaptic transmission, the subject of the next two
chapters.
It should come as no surprise that synaptic transmisslOn, like the action
potential, depends on specialized proteins in the neuronal membrane.
Thus, a picture begins to emerge of the brain as a complicated mesh of
interacting neuronal membranes. Consider that a typical neuron with all
its neurites has a membrane surface area of about 250,000 ]Jm z . The sur-
face area of the 100 billion neurons that make up the human brain comes
to 25,000 mZ-roughly the size of four soccer fields. This expanse of
membrane, with its myriad specialized protein molecules, constitutes the
fabric of our minds.
Box 4.6
.... , .
OF SPECIAL INTEREST
4
J. The Eclectic Electric Behavior
of Neurons
I
,
Neurons are not all alike; they vary in shape, size, and
connections. Neurons also differ from one another
in their electrical properties. A few examples of the
diverse behavior of neurons are shown in Figure A.
The cerebral cortex has two major types of neu-
rons, as defined by morphology: aspinous stellate cells
and spiny pyramidal cells. A steHate cell typically re-
sponds to a steady depolarizing current injected into
its soma by firing action potentials at a relatively steady
frequency throughout the stimulus (part a). However;
most pyramidal cells cannot sustain a steady firing rate.
Instead. they fire rapidly at the beginning of the stimu-
lus and then slow down, even if the stimulus remains
strong (part b). This slowing over time is called adap-
tation, and it is a very common property among ex-
citable cells. Another firing pattern is the burst, a rapid
cluster of action potentials followed by a brief pause.
Some cells, including a particular subtype of large py-
ramidal neuron in the cortex, can even respond to a
steady input with rhythmic, repetitive bursts (part c).
Variability of firing patterns is not confined to the cere-
bral cortex. Surveys of many areas of the brain imply
that neurons have just as large an assortment of elec-
trical behaviors as morphologies.
What accounts for the diverse behavior of differ-
ent types of neurons? Ultimately, each neuron's phys-
iology is determined by the properties and numbers
of the ion channels in its membrane. There are many
more types of ion channels than the few described in
this chapter; and each has distinctive properties. For
example, some potassium channels activate only very
slowly. A neuron with a high density of these will
show adaptation because during a prolonged stimu-
lus, more and more of the slow potassium channels
will open, and the outward currents they progres-
sively generate will tend to hyperpolarize the mem-
brane. When you realize that a single neuron may ex-
press more than a dozen types of ion channels, the
source of diverse firing behavior becomes clear. It is
the complex interactions of multiple ion channels
that create the eclectic electric signature of each
class of neuron.
V m
\
... CONCLUDING REMARKS 99
--.J ""'-oepOlariZing injected current
(a)
I I
25 msec
w
I !
50 msec
L-
(b)
LJ
I;
I
I I
50 msec
L
(c)
FIGURE A
The diverse behavior of neurons (Source: Adapted from Agmon and
Connors, 1992.)
100 C HAP T E R 4 . THE ACTION POTENTIAL
\
>-(/')
w:E
o:::
w
...-
Properties of the Action
Potential
rising phase (p. 76)
overshoot (p. 76)
falling phase (p.76)
undershoot (p. 76)
after-hyperpolarization (p.76)
threshold (p. 77)
absolute refractory period (p. 80)
relative refractory period (p. 80)
JtJ
., '"
(/')
z
w
0
>
W ...-
0::: (/')
w
::>
a
The Action Potential, in
Reality
voltage clamp (p. 84)
voltage-gated sodium channel
(p.84)
patch clamp (p.86)
channelopathy (p. 89)
tetrodotoxin (TTX) (p. 89)
voltage-gated potassium channel
(p.91)
Action Potential Conduction
saltatory conduction (p. 97)
Action Potentials, Axons, and
Dendrites
spike-initiation zone (p. 97)
I. Define membrane potential (V m) and sodium equilibrium potential (E Na ). Which of these, if any, changes
during the course of an action potential?
2. What ions carry the early inward and late outward currents during the action potential?
3. Why is the action potential referred to as "all-or-none"?
4. Some voltage-gated K+ channels are known as delayed rectifiers because of the timing of their opening
during an action potential. What would happen if these channels took much longer than normal to open?
5. Imagine we have labeled tetrodotoxin (TTX) so that it can be seen using a microscope. If we wash this TTX
onto a neuron, what parts of the cell would you expect to be labeled? What would be the consequence of
applying TTX to this neuron?
6. How does action potential conduction velocity vary with axonal diameter? Why?
6d
0:::C)
Wz
I-
"'-0
0:::4:
::>W
u...o:::
Hille B. 1992. Ionic Channels of Excitable Membranes,
2nd ed. Sunderland, MA: Sinauer.
Hodgkin A. 1976. Chance and design in electro-
physiology: an informal account of certain experi-
ments on nerves carried out between 1942 and
I 952. journal of Physiology (London) 263: 1-21.
Kullmann D. 2002. The neuronal channelopathies.
Brain 125:1177-1195.
Neher E. 1992. Nobel lecture: ion channels or
communication between and within cells. Neuron
8:605-612.
Neher E, Sakmann B. 1992. The patch clamp tech-
nique. Scientiffc American 266:28-35.
Nicholls J, Wallace B, Fuchs P, Martin A. 200 I. From
Neuron to Brain, 4th ed. Sunderland, MA: Sinauer.
Synaptic Transmission
INTRODUCTION
. Box 5.1 Of Special Interest: Otto Loewi and Vagusstoff
t TYPES OF SYNAPSES
ELECTRICAL SYNAPSES
. Box 5.2 Path of Discovery: Electrical Synapses, by Michael V. L. Bennett
CHEMICAL SYNAPSES
CNS Synapses
The Neuromuscular Junction
PRINCIPl.ES OF CHEMICAL SYNAPTIC TRANSMISSION
NEUROTRANSMITTERS
NEUROTRANSMITTER SYNTHESIS AND STORAGE
NEUROTRANSMITTER RELEASE
. Box 5.3 Brain Food: SNARE a Vesicle, and Release Its Transmitter
NEUROTRANSMITTER RECEPTORS AND EFFECTORS
Transmitter-Gated Jon Channels
. Box 5.4 Brain Food: Reversal Potentials
G-Protein-Coupled Receptors
Autoreceptors
NEUROTRANSMITTER RECOVERY AND DEGRADATION
NEUROPHARMACOLOGY
. Box 5.5 Of Special Interest: Bacteria, Spiders, Snakes, and You
PRINCIPLES OF SYNAPTIC INTEGRATION
THE INTEGRATION OF EPSPS
Quantal Analysis of EPSPs
EPSP Summation
THE CONTRIBUTION OF DENDRITIC PROPERTIES TO SYNAPTIC INTEGRATION
Dendritic Cable Properties
Excitable Dendrites
INHIBITION
. Box 5.6 Of Special Imerest: Startling Mutations and Poisons
IPSPs and Shunting Inhibition
The Geometry of Excitatory and Inhibitory Synapses
MODULATION
CONCLUDING REMARKS
CHAPTER
102 C HAP T E R 5 . SYNAPTIC TRANSMISSION
... INTRODUCTION
In Chapters 3 and 4, we discussed how mechanical energy, such as a thumb-
tack entering your foot, can be converted into a neural signal. First, spe-
cialized ion channels of the sensory nerve endings allow positive charge to
enter the axon. If this depolarization reaches threshold, then action poten-
tials are generated. Because the axonal membrane is excitable and has
voltage-gated sodium channels, action potentials can propagate without
decrement up the long sensory nerves. For this information to be processed
by the rest of the nervous system, it is necessary that these neural signals
be passed on to other neurons-for example, the motor neurons that con-
trol muscle contraction, as well as neurons in the brain and spinal cord that
lead to a coordinated reflex response. By the end of the nineteenth cen-
tury, it was recognized that this transfer of information from one neuron
to another occurs at specialized sites of contact. In 1897, English physiolo-
gist Charles Sherrington gave these sites their name: synapses. The process
of information transfer at a synapse is called synaptic transmission.
The physical nature of synaptic transmission was argued for almost a
century. One attractive hypothesis, which nicely explained the speed of
synaptic transmission, was that it was simply electrical current flowing
from one neuron to the next. The existence of such electrical synapses
was finally proven in 1959 by Edwin Furshpan and David Potter, Harvard
University physiologists who were studying the nervous system of cray-
fish. We now know that electrical synapses are common in the mam-
malian brain.
An alternative hypothesis about the nature of synaptic transmission, also
dating back to the 1800s, was that chemical neurotransmitters transfer
information from one neuron to another at the synapse. Solid support for
the concept of chemical synapses was provided in 1921 by Otto Loewi,
then the head of the Pharmacology Department at the University of Graz
in Austria. Loewi showed that electrical stimulation ofaxons innervating
the frog's heart caused the release of a chemical and that this chemical
could mimic the effects of neuron stimulation on the heartbeat (Box 5.1).
Later, Bernard Katz and his colleagues at University College London,
conclusively demonstrated that fast transmission at the synapse between a
motor neuron axon and skeletal muscle was chemically mediated. By 1951,
John Eccles of the Australian National University was able to study the
physiology of synaptic transmission within the mammalian central nervous
system (CNS) using a new toot the glass microelectrode. These experi-
ments indicated that many CNS synapses also use a chemical transmitter.
Chemical synapses comprise the majority of synapses in the brain. During
the last decade, new methods of studying the molecules involved in synap-
tic transmission have revealed that synapses are far more complex than
most neuroscientists anticipated.
Synaptic transmission is a large and fascinating topic. The actions of
psychoactive drugs, the causes of mental disorders, the neural bases of
learning and memory-indeed, all the operations of the nervous system-
cannot be understood without knowledge of synaptic transmission. There-
fore, we've devoted several chapters to this topic, mainly focusing on chem-
ical synapses. In this chapter, we begin by exploring the basic mechanisms
of synaptic transmission. What do different types of synapse look like? How
are neurotransmitters synthesized and stored, and how are they released
in response to an action potential in the axon terminal? How do neuro-
transmitters act on the postsynaptic membrane? How do single neurons
integrate the inputs provided by the thousands of synapses that impinge
upon them?
Box 5.1
.... , .
OF SPECIAL INTEREST
'Y TYPES Of SYNAPSES I 03
Otto Loewi and Vagusstoff
One of the more colorful stories in the history of neuro-
science was contributed by Otto Loewi, who, working in
Austria in the I 920s, showed definitively that synaptic
transmission between nerve and heart is chemically medi-
ated. The heart is supplied with two types of innervation;
one type speeds the beating of the heart, and the other
slows it. The latter type of innervation is supplied by the
vagus nerve. Loewi isolated a frog heart with the vagal
innervation left intact, stimulated the nerve electrically,
and observed the expected effect, the slowing of the
heartbeat. The critical demonstration that this effect was
chemically mediated came when he took the solution that
bathed this heart, applied it to a second isolated frog
heart, and found that the beating of this one also slowed.
The idea for this experiment had actually come to
Loewi in a dream. Below is his own account:
In the night of Easter Sunday, 1921, I awoke, turned on
the light, and jotted down a few notes on a tiny slip of
paper. Then, I fell asleep again. It occurred to me at
six o'clock in the morning that during the night I had
written down something most important, but I was un-
able to decipher the scrawl. That Sunday was the most
desperate day in my whole scientific life. During the
T TYPES OF SYNAPSES
next night, however, I awoke again, at three o'clock, and
1 remembered what it was. This time I did not take any
risk; I got up immediately, went to the laboratory, made
the experiment on the frog's heart, described above,
and at five o'clock the chemical transmission of the
nervous impulse was conclusively proved. . . . Careful
consideration in daytime would undoubtedly have re-
jected the kind of experiment I performed, because it
would have seemed most unlikely that if a nervous im-
pulse released a transmitting agent, it would do so not
just in sufficient quantity to influence the effector or-
gan, in my case the heart, but indeed in such an excess
that it could partly escape into the fluid which filled the
heart, and could therefore be detected. Yet the whole
nocturnal concept of the experiment was based on
this eventuality, and the result proved to be positive,
contrary to expectation. (Loewi, 1953, pp. 33, 34)
The active compound, which Loewi called vagusstoff,
turned out to be acetylcholine. As we shall see in this
chapter, acetylcholine is also a transmitter at the synapse
between nerve and skeletal muscle. Here, unlike at the
heart, acetylcholine causes excitation and contraction of
the muscle.
We introduced the synapse in Chapter 2. A synapse is the specialized junc-
tion where one part of a neuron contacts and communicates with another
neuron or cell type (such as a muscle or glandular cell). Information tends
to flow in one direction, from a neuron to its target cell. The first neuron
is said to be presynaptic and the target cell is said to be postsynaptic. Let's take
a closer look at the different types of synapse.
Electrical Synapses
Electrical synapses are relatively simple in structure and function, and they
allow the direct transfer of ionic current from one cell to the next. Elec-
trical synapses occur at specialized sites called gap junctions. At a gap
junction, the membranes of two cells are separated by only about 3 nm,
and this narrow gap is spanned by clusters of special proteins called con-
nexins. Six connexins combine to form a channel called a connexon, and
two connexons (one from each cell) combine to form a gap junction chan-
nel (Figure 5.1). The channel allows ions to pass directly from the cyto-
plasm of one cell to the cytoplasm of the other. The pore of most gap junc-
tion channels is relatively large. Its diameter is about 1-2 nm, big enough
for aU the major cellular ions, and many small organic molecules, to pass
through.
104 C HAP T E R 5 . SYNAPTIC TRANSMISSION
Cell 1
Gap junction
FIGURE 5.1
A gap junction. (a) Neurites of two cells connected by a gap junction. (b) An enlarge-
ment showing gap junction channels, which bridge the cytoplasm of the two cells. Ions and
small molecules can pass in both directions through these channels. (c) S'x connexin
subunits comprise one connexon, two connexons comprise one gap junction channel, and
many gap Junction channels comprise one gap junction.
(a)
Cell 1
cytoplasm
.
Gap junction channels
1\
-....
'';f;' f/' ' '/"" ,- ',:
10',#4-.;',.... " .,
- "ffD1"1 'l ,-
h - -:-. '-I- r ,....:...,.........
'.., l . .
o ..P ! .,\" '.
li: II,iI,l. ftt.... ,.., '}-
, 1................... ..............
..JJUiiJ,u' J \...... n n n n 1nnnn
, -. \ .' .\," ,." IJr! "'"' IJ",. t-
2 _ _\.: _ _' . .. .......
. -. -"' 1 ' .
. -
.:0. _. . .'
, 3.5 nm .. _ ;,
$" -..., .
i\_."\ - - - - , "f?l'lAf{V, 1
lnnnnln ,n' uu u J
III
'i----
J) I
Gap
junction
Cell 2
cytoplasm
.-,. ,-
. n ;....-.- .""' .. ., -. . .j tWl l " Wi:
'4., ''', '. . "Y-ii\.\i,
"t ,. .. !J ,- It' i
;1 , 7 IJ. nJ:" " '''.::::; n,u U I U u
. :J r 1.. . . '" 20 nm ..
" I ( , -- . . 1-".1 .. .".
} J Ii ., 1 r 'I · .b t "
j 1.IT r.( Ir.r,n.r. r,
)L L, , I)
\
Ions and Channel formed by pores
small molecules in each membrane
Connexon
Connexin
(b)
(c)
Most gap junctions allow ionic current to pass equally well in both di-
rections; therefore, unlike the vast majority of chemical synapses, elec-
trical synapses are bidirectional. Because electrical current (in the form
of ions) can pass through these channels, cells connected by gap junc-
tions are said to be electrically coupled. Transmission at electrical synapses
is very fast and, if the synapse is large, fail-safe. Thus, an action poten-
tial in the presynaptic neuron can produce, almost instantaneously, an
action potential in the postsynaptic neuron. In invertebrate species, such
as the crayfish, electrical synapses are sometimes found between sensory
and motor neurons in neural pathways mediating escape reflexes. This
mechanism enables an animal to beat a hasty retreat when faced with a
dangerous situation.
Electrical synapses also occur in the vertebrate brain (Box 5.2). Studies
over the past few years have revealed that electrical synapses are common
in every part of the mammalian CNS (Figure 5.2a). When two neurons are
electrically coupled, an action potential in the presynaptic neuron causes a
small amount of ionic current to flow across the gap junction channels into
the other neuron. This current causes a postsynaptic potential (PSP) in
the second neuron (Figure S.2b). Because most electrical synapses are bidi-
rectional, note that when the second neuron generates an action potential,
it will in turn induce a PSP in the first neuron. The PSP generated by a sin-
gle electrical synapse in the mammalian brain is usually small-about I mV
or less at its peak-and may not, by itself, be large enough to trigger an ac-
tion potential in the postsynaptic cell. One neuron usually makes electrical
synapses with many other neurons, however, so several PSPs occurring
. ;,q{??
, :'
. '. "7".
" 1
- . ' <.r' . , -. ) . ;;J (t. . .,' Dendrite
"j P. '-
, Il.' _ ....
.\. ,....
-, . . .
. "','" ..9_.
..
Presynaptic element
Qj 0
()
0
E
>
-65
Record V m 0
of cell 2
-63
C\J
Qj
() -64
0
E
>
-65
0
.
." :
. ;"
, .
. " r.
'" .,
'0
I
It,-. -:;r', .
. .- '.
,;- .
.'
. .
Dendrite
'; \
. '
4
" ..:o... { ,
" ,
-:.. .J.,....
... '. .
.. ' -
,..:'" f\ " -; -"
, : , "";
Postsynaptic element
(a)
FIGURE 5.2
Electrical synapses, (a) A gap junction interconnecting the dendrites of two neurons
constitutes an electrical synapse. (Source: Sloper and Powell, 1978.) (b) An action potential
generated in one neuron causes a small amount of ionic current to flow through gap
Junction channels into a second neuron, inducing an electrical PSp.
(b)
simultaneously may strongly excite a neuron, This is an example of synap-
tic integration, which is discussed later in the chapter.
The precise roles of electrical synapses vary from one brain region to an-
other. They are often found where normal function requires that the ac-
tivity of neighboring neurons be highly synchronized. Gap junctions be-
tween neurons are particularly common during early embryonic stages.
Evidence suggests that during brain development, gap junctions allow
neighboring cells to share both electrical and chemical signals that may help
coordinate their growth and maturation. Gap junctions also interconnect
many non-neural cells, including glia, epithelial cells, smooth and cardiac
muscle cells, liver cells, and some glandular cells.
Chemical Synapses
Most synaptic transmission in the mature human nervous system is chem-
ical, so we will now focus exclusively on chemical synapses. Before we dis-
cuss the different types of chemical synapse, let's take a look at some of
their universal characteristics (Figure 5.3).
The presynaptic and postsynaptic membranes at chemical synapses are
separated by a synaptic cleft that is 20-50 nm wide, 10 times the width of
the separation at gap junctions. The cleft is filled with a matrix of fibrous
extracellular protein. One function of this matrix is to make the pre- and
postsynaptic membranes adhere to each other. The presynaptic side of the
synapse, also called the presynaptic element, is usually an axon terminal.
The terminal typically contains dozens of small membrane-enclosed
spheres, each about 50 nm in diameter, called synaptic vesicles (Figure
5.4a). These vesicles store neurotransmitter, the chemical used to com-
municate with the postsynaptic neuron. Many axon terminals also con-
tain larger vesicles, each about 100 nm in diameter. called secretory
.. TYPES OF SYNAPSES 105
Action
potential
2 3
Time (msec)
Electrical PSP
2 3
Time (msec)
106 C HAP T E R 5 . SYNAPTIC TRANSMISSION
FIGURE 5.3
The components of a chemical synapse.
"
Axon terminal
(presynaptic
""moot) \
--
....
"
,
Secretory
granules
'....
- Mitochondria
l't"a /'
'''J- -
..j
....
Synaptic
cleft
/ .
1> / ,.... :=--
/ ..............-
Synaptic j-y- -:- - -
vesicles y
Receptors
Active zone }
Membrane
posts . ynaptic differentiations
density
Postsynaptic dendrite
granules. Secretory granules contain soluble protein that appears dark in
the electron microscope, so they are sometimes called large, dense-core
vesicles (Figure 5.4b).
Dense accumulations of protein adjacent to and within the membranes
on either side of the synaptic cleft are collectively called membrane dif-
ferentiations. On the presynaptic side, proteins jutting into the cytoplasm
of the terminal along the intracellular face of the membrane sometimes
look like a field of tiny pyramids. The pyramids, and the membrane asso-
ciated with them, are the actual sites of neurotransmitter release, called ac-
tive zones. Synaptic vesicles are clustered in the cytoplasm adjacent to the
active zones (see Figure 5.3).
The protein thickly accumulated in and just under the postsynaptic mem-
brane is called the postsynaptic density. The postsynaptic density con-
tains the neurotransmitter receptors, which convert the intercellular chem-
ical signal (i.e., neurotransmitter) into an intracellular signal (i.e., a change
in membrane potential, or a chemical change) in the postsynaptic cell. As
we shall see, the nature of this postsynaptic response can be quite varied,
depending on the type of protein receptor that is activated by the neuro-
transmitter.
CNS Synapses. In the CNS, different types of synapse may be distin-
guished by which pan of the neuron is postsynaptic to the axon terminal.
If the postsynaptic membrane is on a dendrite, the synapse is said to be ax-
odendritic. If the postsynaptic membrane is on the cell body, the synapse is
said to be axosomatic. In some cases, the postsynaptic membrane is on an-
other axon, and these synapses are called axoaxonic (Figure 5.5). In certain
specialized neurons, dendrites actually form synapses with one another;
... TYPES OF SYNAPSES 107
)000.
....
. -
...
-
,";
, i,, ...' ..
\ \.<\: '- I .....
.r.
}
c'
.
!;: 0 -:
t> \' ...
. 't& 4
. -'
)- :;
. ."
'Ci .
-"C
.... -
"ClJ!i ' ". Mitochondria
..
.co
('
/
Presynaptic -............. .
terminal --.......
.
.O'
',. ) L ":) _
P, <.
'1;1. _Ii
D
I .. .... -.
. '1 ' fl.
" .... 6
....
-
/ '
/
Q..
........ . ..
...
Postsynaptic ---;. c - - ___ ir -
cell ' .
-
Active zone
(a)
Synaptic I
vesicles
;0 ,."........
'"
-- .
- Dense-core
...... '_________ vesicles
-.. .
. .r-
{.
...
-..
.
.... '
.
'\.
I
..
,
6'
:
.....
..
ott
,. . .. ."
. .... r. .
"'-£.- I tat
.' ''-\!
\ ' -!"\tf
$"
...
. .
.\
-.
"-
"""-
--
.. -"-
(b)
FIGURE 5.4
Chemical synapses, as seen with the electron microscope. (a) A fast excitatory
synapse in the CNS. (Source: Adapted from Heuser and Reese, 1977, p. 262.) (b) A synapse
in the PNS, with numerous dense-core vesicles. (Source: Adapted from Heuser and Reese,
1977, p. 278.)
I
FIGURE 5.5
Synaptic arrangements in the CNS. (a) An axodendritlC synapse. (b) An axosomatic
synapse. (c) An axoaxonic synapse.
I 08 C HAP T E R 5 . SYNAPTIC TRANSMISSION
Box 5.2
PATH OF DISCOVERY
41
Electrical Synapses
The question of soup versus sparks, not so recent slang
for chemical transmission versus electrical transmission,
goes back to the 1800s. The pharmacologists, who applied
drugs to their experimental preparations, favored soup.
The electrophysiologists, who used electrical stimuli and
studied action potentials favored sparks. They argued that
chemicals were too slow, and besides, if electrical current
was good enough for axons, it should work for synapses
as well. Eventually, intracellular electrodes demonstrated
that synaptic transmission was indeed chemical at the
neuromuscular junction and at synapses on spinal moto-
neurons, and people were convinced. The vote was in-
all synaptic transmission was chemical; case closed.
In that context I started postdoctoral work with Harry
Grundfrest at the College of Physicians and Surgeons, in
New York City. Every summer he transported his labora-
tory to the Marine Biological Laboratory (MBL), in Woods
Hole, Massachusetts; I accompanied him and have been
going ever since. He proposed that I and Stanley Crain
work on the supramedullary neurons of the pufferfish.
These brain stem neurons are large, even visible to the
naked eye. We soon found that they send their axons to
the skin and are excited by cutaneous inputs. Each cell is
large enough to permit penetration by two microelec-
trodes, for current application and voltage recording. Now
and then our electrodes accidentally penetrated adjacent
cells, which led to the discovery that all cells give the
same number of impulses in response to stimuli, and that
an impulse evoked in one cell could spread to other cells;
the cells are mutually excitatory. At first, and for several
wrong reasons, it seemed that the mutual excitation was
chemically mediated; I thought that the spike in the initial
part of the axon was an excitatory postsynaptic potential.
Jack Eccles, subsequently Sir John, was passing through
the lab. He looked at a spike on the oscilloscope screen,
in the sort of live demonstration that rarely works, and
said, no, that potential is the spike from the initial axon
segment; push your electrode deeper and record from
the axons. Damned if he wasn't right, but there was more.
Recording in an axon, I found the soma of a different
neuron that was electrically coupled to it for hyperpolar-
ization as well as depolarization. This was impossible to
ignore, even for the unprepared mind: there were electri-
cal synapses between the two cells. Several important bio-
physical properties of electrical transmission were exem-
by Michael V L. Bennett
'L
plified by these giant neurons. Some years later Yasuko
Nakajima, using electron microscopy (EM) and working
with George Pappas, found gap junctions between axons
of the supramedullary neurons.
A couple of years later I was working on fish electric
organs in Harry's lab, and he pointed me to the question
of neural control. Emilio Aljure and I looked at the spinal
cord of a mormyrid electric fish. The neurons fire highly
synchronously, and the synchrony is mediated by electrical
coupling between the cells. Mutually excitatory chemical
synapses would not be adequate to synchronize their firing
because of their characteristic delay. Nakajima and Pappas
showed that the dendrites were connected by gap junc-
tions (although they did not yet have that name). We sug-
gested in a brief Science paper that EM identification of
electrical synapses might be useful in examining dendritic
regions.We were pleased when 10 years later John Sloper
and Thomas Powell, using EM, found dendrodendritic gap
junctions in primate neocortex.
The early work on electrical synapses was done almost
entirely in fishes and invertebrates; many mammalian phys-
iologists regarded electrical transmission as primitive com-
pared to chemical transmission and unsuited for the sub-
tle neural processing of the mammalian brain. (Ironically,
current work suggests that vertebrate electrical synapses
actually evolved later than chemically mediated transmis-
sion.) During the I 980s, a few examples of electrical cou-
pling of neurons became known in mammals, such as in-
ferior olive cells and retinal horizontal cells. Now technical
advances have led to a burgeoning of knowledge about
electrical synapses in mammals.
Electrical synapses exist where they are useful.Although
their numbers are small compared to chemical synapses,
any description of how the nervous system works re-
quires their inclusion. In general in mammals, the speed of
ellectrical transmission is not the only explanation for its
being there. A more likely selective advantage is its ability
to synchronize neural activity by reciprocal action and
transmission of sub-threshold voltages.
Ramon y Cajal was right when he concluded that the
nervous system is made of individual, discontinuous
neurons. But he also wrote that the neuron doctrine
could withstand some exceptions. The direct connection
between cell interiors provided by gap junctions could be
viewed as an exception.
Presynaptic . __________
terminals )
,.,000
r
? /
II j
Active zones
these are called dendrodendritic synapses. The sizes and shapes of CNS
synapses also vary widely (Figure 5.6).
CNS synapses may be further classified into two general categories based
on the appearance of their presynaptic and postsynaptic membrane
differentiations, under the powerful magnification of the electron
microscope. Synapses in which the membrane differentiation on the
postsynaptic side is thicker than that on the presynaptic side are called
asymmetrical synapses, or Gray's type I synapses; those in which the
membrane differentiations are of similar thickness are called symmetrical
synapses, or Gray's type II synapses (Figure 5.7). As we shall see later in the
chapter, these structural differences predict functional differences. Gray's
type I synapses are usually excitatory, while Gray's type II synapses are
usually inhibitory.
The Neuromuscular Junction. Synaptic junctions also exist outside the
central nervous system. For example, axons of the autonomic nervous sys-
tem innervate glands, smooth muscle, and the heart. Chemical synapses
also occur between the axons of motor neurons of the spinal cord and
skeletal muscle. Such a synapse is called a neuromuscular junction, and
it has many of the structural features of chemical synapses in the CNS
(Figure 5.8).
... TYPES OF SYNAPSES I 09
FIGURE 5.6
Various sizes of CNS synapses. Notice
that larger synapses have more active zones.
Asymmetrical Symmetrical
(a)
membrane
differentiations (b)
membrane
differentiations
FIGURE 5.7
Two categories of CNS synaptic mem-
brane differentiations. (a) A Gray's type I
synapse is asymmetrical and usually excitatory.
(b) A Gray's type II synapse is symmetrical
and usually inhibitory.
I 10 C HAP T E R 5 . SYNAPTIC TRANSMISSION
FIGURE 5.8
The neuromuscular junction. The postsynaptic membrane, known as the motor end-
plate, contains junctional folds with numerous neurotransmitter receptors.
Motor neuron
-.
Muscle fibers
\
Myelin
/
''''
1
'
Axon
Neuromuscular /
/ junction
t
Synaptic . ' I
vesicles --------
Active zone
I Synaptic ---
) cleft ---{ . .
fl. .-.-. .
T
Receptors ': f"lt..
. --
J""ction fold . ..
..
.111.
Postsynaptic . .
muscle fiber
Presynaptic Motor end-plate
terminals region
Neuromuscular synaptic transmission is fast and reliable. An action po-
tential in the motor axon always causes an action potential in the muscle
cell it innervates. This reliability is accounted for, in part, by structural
specializations of the neuromuscular junction. Its most important special-
ization is its size-it is one of the largest synapses in the body. The presy-
naptic terminal also contains a large number of active zones. In addition, the
post-synaptic membrane, also called the motor end-plate. contains a series
PRINCIPLES OF CHEMICAL SYNAPTIC TRANSMISSION II I
of shallow folds. The presynaptic active zones are precisely aligned with
these junctional folds, and the postsynaptic membrane of the folds is packed
with neurotransmitter receptors. This structure ensures that many neuro-
transmitter molecules are focally released onto a large surface of chemi-
cally sensitive membrane.
Because neuromuscular junctions are more accessible to researchers than
CNS synapses, much of what we know about the mechanisms of synaptic
transmission was first established here. Neuromuscular junctions are also
of considerable clinical significance; diseases, drugs, and poisons that inter-
fere with this chemical synapse have direct effects on vital bodily functions.
.. PRINCIPLES OF
CHEMICAL SYNAPTIC TRANSMISSION
Consider the basic requirements of chemical synaptic transmission. There
must be a mechanism for synthesizing neurotransmitter and packing it into
the synaptic vesicles, a mechanism for causing vesicles to spill their con-
tents into the synaptic cleft in response to a presynaptic action potential, a
mechanism for producing an electrical or biochemical response to neuro-
transmitter in the postsynaptic neuron, and a mechanism for removing
neurotransmitter from the synaptic cleft. And, to be useful for sensation,
perception, and the control of movement, all these things must occur very
rapidly. No wonder physiologists initially were skeptical about the existence
of chemical synapses in the brain!
Fortunately, thanks to several decades of research on the topic, we now
understand how many of these aspects of synaptic transmission are so
efficiently carried out. Here we present a general survey of the basic prin-
ciples. In Chapter 6, we will take a more detailed look at the individual
neurotransmitters and their modes of postsynaptic action.
Neurotransmitters
Since the discovery of chemical synaptic transmission, researchers have been
identifying neurotransmitters in the brain. Our current understanding is that
most neurotransmitters fall into one of three chemical categories: (1) amino
acids, (2) amines, and (3) peptides (Table 5.1). Some representatives of these
categories are shown in Figure 5.9. The amino acid and amine neurotrans-
mitters are all small organic molecules containing at least one nitrogen atom,
and they are stored in and released from synaptic vesicles. Peptide neuro-
transmitters are large molecules stored in and released from secretory
Table 5.1 The Major Neurotransmitters
AMINO ACIDS
AMINES
Gamma-aminobutyric acid (GABA)
Glutamate (Glu)
Glycine (Gly)
Acetylcholine (ACh)
Dopamine (DA)
Epinephrine
Histamine
Norepinephrine (NE)
Serotonin (5-HT)
PEPTIDES
Cholecystokinin (CCK)
Dynorphin
Enkephalins (Enk)
N-acetylaspartylglutamate (NAAG)
Neuropeptide Y
Somatostatin
Substance P
Thyrotropin-releasing hormone
Vasoactive intestinal polypeptide (VIP)
I 12 C HAP T E R 5 . SYNAPTIC TRANSMISSION
FIGURE 5.9
Representative neurotransmitters.
(a) The amino acid neurotransmitters gluta-
mate. GABA. and glycine. (b) The amine
neurotransmitters acetylcholine and norepi-
nephrine. (c) The peptide neurotransmitter
substance P. (For the abbreviations and chemi-
cal structures of amino acids in substance P.
see Figure 3.4b.)
COOH
I
CH 2
I
CH2
I
NH 2 -CH-COOH
COOH
I
CH 2
I
CH 2
I
NH 2 -CH
NH 2 -CH 2 -COOH
( ..-J
tJi\
(a)
Glu
GABA
Gly
o CH 3
" I
CH 3 - C - 0 - CH 2 - CH 2 - W - CH 3
I
CH 3
HO h OH
H0-o-tH - CH 2 - NH 2
(
!
(b)
ACh
NE
,
( \
CL ...
y
U
M
) ,' -
V
. Carbon
. Oxygen
. Nitrogen
0 Hydrogen
0 Sulfur
Arg
y .
U
o
Pro Lys Pro Gin
Phe Phe Gly Leu Met
Gin
(c)
Substance P
granules. As mentioned above, secretory granules and synaptic vesicles are
frequently observed in the same axon terminals. Consistent with this obser-
vation, pep tides often exist in the same axon terminals that contain amine
or amino acid neurotransmitters. And, as we'H discuss in a moment, these
different neurotransmitters are released under different conditions.
Different neurons in the brain release different neurotransmitters. Fast
synaptic transmission at most CNS synapses is mediated by the amino acids
glutamate (Glu), gamma-amino butyric acid (GABA), and glycine
(Gly). The amine acetylcholine (ACh) mediates fast synaptic transmis-
sion at all neuromuscular junctions. Slower forms of synaptic transmission
in the CNS and in the periphery are mediated by transmitters from all three
chemical categories.
Neurotransmitter Synthesis and Storage
Chemical synaptic transmission requires that neurotransmitters be synthe-
sized and ready for release. Different neurotransmitters are synthesized in dif-
ferent ways. For example, glutamate and glycine are among the 20 amino
acids that are the building blocks of protein (see Figure 3.4b); consequently,
they are abundant in all cells of the body, including neurons. In contrast,
GABA and the amines are made only by the neurons that release them. These
neurons contain specific enzymes that synthesize the neurotransmitters from
.. PRINCIPLES OF CHEMICAL SYNAPTIC TRANSMISSION 1 13
Active peptide
neurotransmitter
Nucleus
Rough ER
(a)
FIGURE 5.10
The synthesis and storage of different types of neurotransmitter. (a) Peptides:
<D A precursor peptide is synthesized in the rough ER. @ The precursor peptide is split in
the Golgi apparatus to yield the active neurotransmitter: Q) Secretory vesicles containing the
peptide bud off from the Golgi apparatus. @ The secretory granules are transported down
the axon to the tenninal where the peptide is stored. (b) Amine and amino acid neuro-
transmitters: <D Enzymes convert precursor molecules Into neurotransmitter molecules in
the cytosol. @ Transporter proteins load the neurotransmitter into synaptic vesicles in the
terminal, where they are stored.
various metabolic precursors. The synthesizing enzymes for both amino acid
and amine neurotransmitters are transported to the axon terminal. where
they locally and rapidly direct transmitter synthesis.
Once synthesized in the cytosol of the axon terminal. the amino acid and
amine neurotransmitters must be taken up by the synaptic vesicles. Con-
centrating these neurotransmitters inside the vesicle is the job of trans-
porters, special proteins embedded in the vesicle membrane.
Quite different mechanisms are used to synthesize and store peptides in
secretory granules. As we learned in Chapters 2 and 3, pep tides are formed
when amino acids are strung together by the ribosomes of the cell body.
In [he case of peptide neurotransmitters, this occurs in the rough ER.
Generally, a long peptide synthesized in the rough ER is split in the Golgi
apparatus, and one of the smaller peptide fragments is the active neuro-
transmitter. Secretory granules containing the peptide neurotransmitter
bud off from the Golgi apparatus and are carried to the axon terminal by
axoplasmic transport. Figure 5. I 0 compares the synthesis and storage of
amine and amino acid neurotransmitters with that of peptide neuro-
transmitters.
Neurotransmitter Release
Neurotransmitter release is triggered by the arrival of an action potential in
the axon terminal. The depolarization of the terminal membrane causes
voltage-gated calcium channels in the active zones to open. These
Synaptic
vesicles
x::: - @
/' I&:d
/ G @ @
. {i! @ "" ..'QI
.. ....
ft . . ..
{D
Ge{D
e
Synaptic
vesicle
(b)
114 C HAP T E R 5 . SYNAPTIC TRANSMISSION
FIGURE 5.11
The release of neurotransmitter by
exocytosis. CD A synaptic vesicle loaded with
neurotransmitter, in response to @ an influx
of Ca2+ through voltage-gated calCium chan-
nels. @ releases its contents Into the synaptic
cleft by the fusion of the vesicle membrane
with the presynaptic membrane, and @ is
eventually recycled by the process of
endocytosis.
Presynaptic
@
Synaptic
vesicle
Postsynaptic
membrane channels are very similar to the sodium channels we discussed
in Chapter 4, except they are permeable to Ca2+ ions instead of Na+ ions.
There is a large inward driving force on Ca2+. Remember that the internal
calcium ion concentration-[Ca2+]j-at rest is very low, only 0.0002 mM;
therefore, Ca2+ will flood the cytoplasm of the axon terminal as long as the
calcium channels are open. The resulting elevation in [Ca2+]j is the signal
that causes neurotransmitter to be released from synaptic vesicles.
The vesicles release their contents by a process called exocytosis. The
membrane of the synaptic vesicle fuses to the presynaptic membrane at
the active zone, allowing the contents of the vesicle to spill out into the
synaptic cleft (Figure 5.1I). Studies of a giant synapse in the squid nervous
system showed that exocytosis can occur very rapidly-within 0.2 msec of
the Ca2+ influx into the terminal. Synapses in mammals, which generally
operate at higher temperatures, are even faster. Exocytosis is quick because
Ca2+ enters at the active zone, precisely where synaptic vesicles are ready
and waiting to release their contents. In this local "microdomain" around
the active zone, calcium can achieve very high concentrations (greater
than O. I mM).
The precise mechanism by which [Ca2+]j stimulates exocytosis is poorly
understood, but it is currently under intensive investigation. The speed of
neurotransmitter release suggests that the vesicles involved are those al-
ready "docked" at the active zones. Docking is believed to involve interac-
tions between proteins in the synaptic vesicle membrane and the active
zone (Box 5.3). In the presence of high [Ca2+]j, these proteins alter their
conformation so that the lipid bilayers of the vesicle and presynaptic mem-
branes fuse, forming a pore that allows the neurotransmitter to escape into
the cleft. The mouth of this exocytotic fusion pore continues to expand
until the membrane of the vesicle is fully incorporated into the presynap-
tic membrane (Figure 5.12). The vesicle membrane is later recovered by the
process of endocytosis, and the recycled vesicle is refilled with neuro-
transmitter (see Figure 5.1 I). During periods of prolonged stimulation,
vesicles are mobilized from a "reserve pool" that is bound to the cytoskeleton
of the axon terminal. The release of these vesicles from the cytoskeleton,
and their docking to the active zone. is also triggered by elevations of
[Ca2+]j.
'Y PRINCIPLES OF CHEMICAL SYNAPTIC TRANSMISSION 115
.
.. ,I
--_.1 Presumed
:---- calcium
channels
".
-
(a)
.
.
-;.-
.....
--___ Exocytotic
------ fusion
pore
.
... .
.
.
. .
(b)
Secretory granules also release peptide neurotransmitters by exocytosis,
in a caldum-dependent fashion, but typically not at the active zones. Be-
cause the sites of granule exocytosis occur at a distance from the sites of
Ca H entry, peptide neurotransmitters are usually not released in response
to every action potential invading the terminal. Instead, the release of pep-
tides generally requires high-frequency trains of action potentials, so that
the [Ca H ]; throughout the terminal can build to the level required to trig-
ger release away from the active zones. Unlike the fast release of amino
acid and amine neurotransmitters, the release of pep tides is a leisurely
process, taking 50 msec or more.
Neurotransmitter Receptors and Effectors
Neurotransmitters released into the synaptic cleft affect the postsynaptic
neuron by binding to specific receptor proteins that are embedded in the
postsynaptic density. The binding of neurotransmitter to the receptor is like
inserting a key in a lock; this causes conformational changes in the protein,
and the protein can then function differently. Although there are well over
100 different neurotransmitter receptors, they can be classified into two
types: transmitter-gated ion channels and G-protein-coupled receptors.
Transmitter-Gated Ion Channels. Receptors known as transmitter-
gated ion channels are membrane-spanning proteins consisting of four or
five subunits that come together to form a pore between them (Figure 5.13).
In the absence of neurotransmitter, the pore is usually closed. When neuro-
transmitter binds to spedfic sites on the extracellular region of the channel,
it induces a conformational change-just a slight twist of the subunits-
FIGURE 5.12
A "receptor's eye" view of neurotrans-
mitter release. (a) This is a view of the
extracellular surface of the active zone of a
neuromuscular junction In a frog. The particles
are believed to be calcium channels. (b) In
this view. the presynaptic terminal had been
stimulated to release neurotransmitter. The
exocytotic fusion pores are where synaptic
vesicles have fused with the presynaptic
membrane and released their contents.
(Source: Heuser and Reese, 1973.)
.
,. ...........
ntn
Membrane
U U
n
U U
Cytoplasm
(a)
+ 1\ J
, (
): .
......
(b)
FIGURE 5.13
The struc:ture of a transmitter-gated
ion channel. (a) Side view of an ACh-gated
Ion channel, as it IS believed to appear.
(b) Top view of the channel. showing the
pore at the center of the five subunits.
116 C HAP T E R 5 . SYNAPTIC TRANSMISSION
Box 5.3
BRAIN FOO-
-
t..
SNARE a Vesicle,
and Release Its Transmitter
Yeasts are single-celled organisms valued for their ability to make dough
rise and grape juice ferment. Remarkably, the humble yeasts have some
close similarities to the chemical synapses in our brain. Recent research
has shown that the proteins controlling secretion in both yeast cells and
synapses are only minor variations of each other. Apparently, these mol-
ecules are so generally useful that they have been conserved across more
than a billion years of evolution, and they are found in all eukaryotic cells.
The trick to fast synaptic function is to deliver neurotransmitter-filled
vesicles to just the right place-the presynaptic membrane, and then
cause them to fuse at just the right time-when an action potential de-
livers a pulse of high Cahconcentration to the cytosol. This process of
exocytosis is a special case of a more general cellular problem. membrane
trafficking. Cells have many types of membranes. including those enclosing
the whole cell. the nucleus. endoplasmic reticulum. Golgi apparatus, and
various types of vesicles. To avoid intracellular chaos. each of these mem-
branes needs to be moved and delivered to specific locations within the
cell. After delivery, one type of membrane often has to fuse with another
type. A common molecular machinery has evolved for the delivery and
fusion of all these membranes, and small variations in these molecules
determine how and when membrane trafficking takes place.
The specific binding and fusion of membranes seem to depend on the
SNARE family of proteins. which were first found in yeast cells. SNARE is
an acronym too convoluted to define here, but the name perfectly defines
the function of these proteins-SNAREs allow one membrane to snare
another. Each SNARE peptide has a lipid-loving end that embeds itself
within the membrane and a longer tail that projects into the cytosol.Vesi-
cles have "v-SNAREs:' and the outer membrane has "t-SNAREs" (for "tar_
get" membrane). The cytosolic ends of these two complementary types
of SNAREs can bind tightly to one another, allowing a vesicle to "dock"
very close to a presynaptic membrane and nowhere else (Figure A).
Although SNARE-to-SNARE complexes form the main connection be-
tween vesicle membrane and target membrane, a large and bewildering
array of other proteins stick to the "SNAREpin." We still don't understand
the functions of most of them, but synoptotagmin. a vesicle protein, may
be the critical CaHsensor that rapidly triggers vesicle fusion and thus
transmitter release. On the presynaptic membrane side. calcium channels
may form part of the docking complex. By placing the calcium channels
very close to the docked vesicles, innowing Ca 2 +can trigger transmitter
release with astonishing speed-within about 60 IJsec in a mammalian
synapse at body temperature.
We have a long way to go before we understand all the molecules in-
volved in synaptic transmission. In the meantime, we can count on yeasts
to provide delightful brain food (and drink) for thought.
Neurotransmitter Vesicle Synaptotagmin
I
- " I - .
'.. " . ..
. .
\))
Vesicle
RE
!
I
Presynaptic
terminal membrane
Calcium
channel
". . 1 '
." " .
"
" . ..
" ..
jt
· ". · Ca 2 +
.."-... 'k\ '. .
.. ,'.. . .
.. . . +
· O!¥ (IIy,J))
. . . .
\ . ,,, " "',,,,:
-. iii
iii. a ..
....
.,
JAIl ::ul!i ', fIJjj 0
...
IJ Q
FIGURE A
SNAREs and vesicle fusion.
... PRINCIPLES OF CHEMICAL SYNAPTIC TRANSMISSION 117
FIGURE 5. i4
The generation of an EPSP. (a) An Impulse
arriving in the presynaptic terminal causes the
release of neurotransmitter. (b) The molecules
bind to transmitter-gated ion channels in the
postsynaptic membrane. If Na + enters the post-
synaptic cell through the open channels. the
membrane will become depolarized. (c) The
resulting change in membrane potential (Ym).
as recorded by a microelectrode In the cell. is
the EPSP
Impulse1L-
(
(a)
;;,)
.
apti' { .. ·
N + 0
a <)
Na+
o
InQ -
Cytosol-
(b)
Transmitter-gated
ion channels
o
2 4
Time from presynaptic action potential (msec)
I
8
(c)
which within microseconds causes the pore to open. The functional conse-
quence of this depends on which ions can pass through the pore.
n-ansmitter-gated channels generally do not show the same degree of ion
selectivity as do voltage-gated channels. For example, the ACh-gated ion
channels at the neuromuscular junction are permeable to both Na+ and K+
ions. Nonetheless, as a rule, if the open channels are permeable to Na +, the
net effect will be to depolarize the postsynaptic cell from the resting mem-
brane potential (Box 5.4). Because it tends to bring the membrane poten-
tial toward threshold for generating action potentials, this effect is said to
be excitatory. A transient postsynaptic membrane depolarization caused by
the presynaptic release of neurotransmitter is called an excitatory post-
synaptic potential (EPSP) (Figure 5.14). Synaptic activation of ACh-
gated and glutamate-gated ion channels causes EPSPs.
If the transmitter-gated channels are permeable to Cl-, the net effect
wi1l be to hyperpolarize the postsynaptic cell from the resting membrane
potential (because the chloride equilibrium potential is negative; see Chap-
ter 3). Because it tends to bring the membrane potential away from thresh-
old for generating action potentials, this effect is said to be inhibitory. A
transient hyperpolarization of the postsynaptic membrane potential caused
by the presynaptic release of neurotransmitter is caned an inhibitory
postsynaptic potential (IPSP) (Figure 5.15). Synaptic activation of
glycine-gated or GABA-gated ion channels cause an IPSE We'll discuss
EPSPs and IPSPs in more detail when we explore the principles of synap-
tic integration shortly.
/ Axon
/ Axon terminal
Postsynaptic
dendrite
R'OO'dVm
EPSP
I 18 C HAP T E R 5 . SYNAPTIC TRANSMISSION
FIGURE 5.15
The generation of an IPSP. (a) An impulse
arriving in the presynaptic terminal causes the
release of neurotransmitter. (b) The molecules
bind to transmitter-gated ion channels in the
postsynaptic membrane. If CI- enters the post-
synaptic cell through the open channels, the
membrane will become hyperpolarized. (c) The
resulting change in membrane potential 01 m), as
recorded by a microelectrode in the cell, is the
IPSP.
SynaPlic { ..» m CI : ;t CI-
cleft
I ..»
'= L G L
l - !
(b)
Transmitter-gated
ion channels
Impulsell-
(
/ Axon
Axon terminal
(a)
/
..\
____ Postsynaptic
dendrite
':0."), J .
Neurotransmitter
molecules
CI · > 1
. ) . ,
'-
RecordVm
IPSP
o 2 4 6 8
(c) Time from presynaptic action potential (msec)
G-Protein-Coupled Receptors. Fast chemical synaptic transmission is
mediated by amino acid and amine neurotransmitters acting on transmit-
ter-gated ion channels. However, all three types of neurotransmitter, acting
on G-protein-coupled receptors, can also have slower, longer-lasting,
and much more diverse postsynaptic actions. This type of transmitter action
involves three steps:
1. Neurotransmitter molecules bind to receptor proteins embedded in the
postsynaptic membrane.
2. The receptor proteins activate small proteins, called G-proteins, that are
free to move along the intracellular face of the postsynaptic membrane.
3. The activated G-proteins activate "effector" proteins.
Effector proteins can be G-protein-gated ion channels in the membrane
(Figure 5.16a), or they can be enzymes that synthesize molecules called
second messengers that diffuse away in the cytosol (Figure 5.16b). Sec-
ond messengers can activate additional enzymes in the cytosol that can
regulate ion channel function and alter cellular metabolism. Because G-
protein-coupled receptors can trigger widespread metabolic effects, they are
often referred to as metabotropic receptors.
We'll discuss the different neurotransmitters, their receptors, and their
effectors in more detail in Chapter 6. However, you should be aware that
the same neurotransmitter can have different postsynaptic actions, depend-
ing on what receptors it binds to. An example is the effect of ACh on the
heart and on skeletal muscles. ACh slows the rhythmic contractions of the
... PRINCIPLES OF CHEMICAL SYNAPTIC TRANSMISSION 1 19
Receptor Neurotransmitter
,
G-protein-gated
ion channel
rJn
Receptor
Neurotransmitter
Enzyme
/
"
.
.,.,.,.,.
....'..
· .,',.,..,'ft'l.t.' ..'.'."I.'.'..''''''.'.'!.'!' eM:
. I ''''' ....1'1'114.. "ll ... . '+l-u.l. 1
A1H AW.
'iIi'" ....
....,...,
it .tA'\
.,.,', ..,'..M. '.1.t."" .'.' I.t ."I. ",'., ,.,.,Wt.t y,.,;.,Yt .....
....... t .............. ... .... ......... ... ,. N.'"'' .. ") .JtJt.'i .....,................
G-protein
'm
Second
messengers
(a)
(b)
heart by causing a slow hyperpolarization of the cardiac muscle cells. In
contrast, in skeletal muscle, ACh induces contraction by causing a rapid
depolarization of the muscle fibers. These different actions are explained by
different receptors. In the heart, a metabotropic ACh receptor is coupled by
a G-protein to a potassium channel. The opening of the potassium channel
hyperpolarizes the cardiac muscle fibers. In skeletal muscle, the receptor is
a transmitter-gated ion channel, specifically an ACh-gated ion channel,
permeable to Na +. The opening of this channel depolarizes the muscle
fibers.
FIGURE 5.16
Transmitter actions at G-protein-
coupled receptors. The binding of neuro-
transmitter to the receptor leads to the acti-
vation of G-proteins. Activated G-proteins
activate effector proteins, which may be
(a) ion channels, or (b) enzymes that gener-
ate intracellular second messengers.
Autoreceptors. Besides being a part of the postsynaptic density, neuro-
transmitter receptors are also commonly found in the membrane of the
presynaptic axon terminal. Presynaptic receptors that are sensitive to the
neurotransmitter released by the presynaptic terminal are called autore-
ceptors. Typically, autoreceptors are G-protein-coupled receptors that stim-
ulate second messenger formation. The consequences of activating these re-
ceptors vary. but a common effect is inhibition of neurotransmitter release
and, in some cases. neurotransmitter synthesis. This allows a presynaptic
terminal 10 regulate itself. Autoreceptors appear to function as a sort of
safety valve to reduce release when the concentration of neurotransmitter
in the synaptic cleft gets too high.
Neurotransmitter. Recovery and Degradation
Once the released neurotransmitter has interacted with postsynaptic re-
ceptors, it must be cleared from the synaptic cleft to allow another round
of synaptic transmission. One way this happens is by simple diffusion of the
transmitter molecules away from the synapse. For most of the amino acid
and amine neurotransmitters, however, diffusion is aided by their reuptake
into the presynaptic axon terminal. Reuptake occurs by the action of spe-
cific neurotransmitter transporter proteins located in the presynaptic mem-
brane. Once inside the cytosol of the terminal, the transmitters may be en-
zymatically destroyed, or they may be reloaded into synaptic vesicles.
Neurotransmitter transporters also exist in the membranes of glia sur-
rounding the synapse, which assist in the removal of neurotransmitter from
the cleft.
Another way neurotransmitter action can be terminated is by enzymatic
destruction in the synaptic cleft itself. This is how ACh is removed at the
neuromuscular junction, for example. The enzyme acetylcholinesterase
120 C HAP T E R 5 . SYNAPTIC TRANSMISSION
Box 5.4
(i)
BRAIN FOO-
Reversal Potentials
In Chapter 4, we saw that when the membrane voltage-
gated sodium channels open during an action potential,
Na+ enters the cell, causing the membrane potential to
rapidly depolarize until it approaches the sodium equilib-
rium potential, E Na , about 40 mY. Unlike the voltage-gated
channels. however. many transmitter-gated ion channels
are not permeable to a single type of ion. For example,
the ACh-gated ion channel at the neuromuscular junction
is permeable to both Na + and to K +. Let's explore the
functional consequence of activating these channels.
In Chapter 3, we learned that the membrane potential,
V m' can be calculated using the Goldman equation, which
takes into account the relative permeability of the mem-
brane to different ions (see Box 3.3). If the membrane
were equally permeable to Na + and K +, as it would be if
the ACh-gated channels were open, then V m would have
a value between E Na and EK' around 0 mY. Therefore,
ionic current would flow through the channels in a direc-
tion that brings the membrane potential toward 0 mY. If
the membrane potential were <0 mV before ACh was ap-
pHed, as is usually the case, the direction of net current
flow through the ACh-gated ion channels would be in-
ward. causing a depolarization. However, if the membrane
potential were >0 mV before ACh was applied, the di-
rection of net current flow through the ACh-gated ion
channels would be autward, causing the membrane po-
tential to become less positive.
Ionic current flow at different membrane voltages can
be graphed, as shown in Figure A. Such a graph is called
an I-V plot (I: current; V: voltage). The critical value of
membrane potential at which the direction of current
flow reverses is called the reversal potential. In this case,
the reversal potential would be 0 mY. The experimental
determination of a reversal potential, therefore, helps tell
us which types of ions the membrane is permeable to.
If, by changing the relative permeability of the mem-
brane to different ions, a neurotransmitter causes V m to
move toward a value that is more positive than the action
potential threshold, the neurotransmitter action would
be termed excitatory. As a rule, neurotransmitters that
open a channel permeable to Na+ are excitatory. If a
neurotransmitter causes V m to take on a value that is
more negative than the action potential threshold. the
neurotransmitter action would be termed inhibitory.
Neurotransmitters that open a channel permeable to CI-
tend to be inhibitory, as are neurotransmitters that open
a channel permeable only to K +.
At positive membrane
potentials, ACh causes
outward current
"
Membrane
,""em
Membrane
voltage
\
lout I
Reversal
potential
y
At negative membrane
potentials, ACh causes
inward current
FIGURE A
(AChE) is deposited in the cleft by the muscle cells. AChE cleaves the ACh
molecule, rendering it inactive at the ACh receptors.
The importance of transmitter removal from the cleft should not be
underestimated. At the neuromuscular junction, for example, uninter-
rupted exposure to high concentrations of ACh after several seconds leads
to a process called desensitization, in which, despite the continued presence
of ACh, the transmitter-gated channels close. This desensitized state can
persist for many seconds even after the neurotransmitter is removed. The
rapid destruction of ACh by AChE normally prevents desensitization from
T PRINCIPLES OF CHEMICAL SYNAPTIC TRANSMISSION 121
occurring. However, if the AChE is inhibited, as it is by various nerve gases
used as chemical weapons, the ACh receptors will become desensitized and
neuromuscular transmission will fail.
Neuropharmacology
Each of the steps of synaptic transmission we have discussed so far-neuro-
transmitter synthesis, loading into synaptic vesicles, exocytosis, binding and
activation of receptors, reuptake, and degradation-is chemical, and there-
fore can be affected by specific drugs and toxins (Box 5.5). The study of the
effects of drugs on nervous system tissue is called neuropharmacology.
Box 5.5
.... , .
OF SPECIAL INTEREST
....
I...
#
__l(
Bacteria, Spiders, Snakes, and You
What do the bacteria Clostridium botulinum, black widow
spiders, cobras, and humans have in common They all
produce toxins that attack the chemical synaptic trans-
mission that occurs at the neuromuscular junction. Botu-
lism is caused by several kinds of botulinum neurotoxins
that are produced by the growth of C. botulinum in im-
properly canned foods. (The name comes from the Latin
word for "sausage" because of the early association of the
disease with poorly preserved meat.) Botulinum toxins
are very potent blockers of neuromuscular transmission;
it has been estimated that as few as 10 molecules of the
toxins are enough to inhibit a cholinergic synapse. Botu-
linum toxins are extraordinarily specific enzymes that de-
stroy certain of the SNARE proteins in the presynaptic
terminals, which are critical for transmitter release (see
Box 5.3). Ironically. this specific action of the toxins made
them important tools in the early research on SNAREs.
Although its mechanism of action is different, black
widow spider venom also exerts deadly effects by affect-
ing transmitter release (Figure A). The venom first in-
creases. and then eliminates, ACh release at the neuro-
muscular junction. Electron microscopic examination of
synapses poisoned with black widow spider venom re-
veals that the axon terminals are swollen and the synap-
tic vesicles are missing. The action of the venom, a pro-
tein molecule, is not entirely understood. Venom binds
with proteins on the outside of the presynaptic mem-
brane, perhaps forming a membrane pore that depolarizes
the terminal and allows Ca2+ to enter and trigger rapid
and total depletion of transmitter. In some cases, the
venom can induce transmitter release even without the
need for Ca2+.
The bite of the Taiwanese cobra also results in the
blockade of neuromuscular transmission in its victim, but
by yet another mechanism. One of the active compounds
in the snake's venom, called ex-bungarotoxin. is a peptide
molecule that binds so tightly to the postsynaptic nico-
tinic ACh receptors that it takes days to be removed.
Often, there is not time for its removal, however, because
cobra toxin prevents the activation of nicotinic receptors
by ACh, thereby paralyzing the respiratory muscles of its
victims.
We humans have synthesized a large number of chem-
icals that poison synaptic transmission at the neuromus-
cular junction. Originally motivated by the search for
chemical warfare agents, this effort led to the develop-
ment of a new class of compounds called organophos-
phates. These are irreversible inhibitors of AChE, and by
preventing the degradation of ACh, they probably kill their
victims by causing a desensitization of ACh receptors.
The organophosphates used today as insecticides, like
parathion, are toxic to humans only in high doses.
\.. J )
.
, / . . .
..,
-
FIGURE A
Black widow spiders. (Source: Matthews. 1995. p. 174.)
122 C HAP T E R 5 . SYNAPTIC TRANSMISSION
Above, we mentioned that nerve gases can interfere with synaptic trans-
mission at the neuromuscular junction by inhibiting the enzyme AChE.
This interference represents one class of drug action, which is to inhibit the
normal function of specific proteins involved in synaptic transmission; such
drugs are called inhibitors. Inhibitors of neurotransmitter receptors, called
receptor antagonists, bind to the receptors and block (antagonize) the
normal action of the transmitter. An example of a receptor antagonist is cu-
rare, an arrow-tip poison traditionally used by South American Indians to par-
alyze their prey. Curare binds tightly to the ACh receptors on skeletal muscle
cells and blocks the actions of ACh, thereby preventing muscle contraction.
Other drugs bind to receptors, but instead of inhibiting them, they mimic
the actions of the naturally occurring neurotransmitter. These drugs are
called receptor agonists. An example of a receptor agonist is nicotine, de-
rived from the tobacco plant. Nicotine binds to, and activates, the ACh re-
ceptors in skeletal muscle. In fact, the ACh-gated ion channels in muscle
are also called nicotinic ACh receptors, to distinguish them from other
types of ACh receptors, such as those in the heart, that are not activated
by nicotine. There are also nicotinic ACh receptors in the CNS, and these
are involved in the addictive effects of tobaccco use.
The immense chemical complexity of synaptic transmission makes it es-
pecially susceptible to the medical corollary of Murphy's law, which states
that if a physiological process can go wrong, it will go wrong. When chem-
ical synaptic transmission goes wrong, the nervous system malfunctions.
Defective neurotransmission is believed to be the root cause of a large num-
ber of neurological and psychiatric disorders. The good news is that thanks
to our growing knowledge of the neuropharmacology of synaptic transmis-
sion, clinicians have new and increasingly effective therapeutic drugs for
treating these disorders. We'll discuss the synaptic basis of some psychiatric
disorders, and their neuropharmacological treatment, in Chapter 22.
'Y PRINCIPLES OF SYNAPTIC INTEGRATION
Most CNS neurons receive thousands of synaptic inputs that activate dif-
ferent combinations of transmitter-gated ion channels and G-protein-cou-
pled receptors. The postsynaptic neuron integrates all these complex ionic
and chemical signals and gives rise to a simple form of output: action po-
tentials. The transformation of many synaptic inputs to a single neuronal
output constitutes a neural computation. The brain performs billions of
neural computations every second we are alive. As a first step toward un-
derstanding how neural computations are performed, let's explore some
basic principles of synaptic integration. Synaptic integration is the process
by which multiple synaptic potentials combine within one postsynaptic
neuron.
The Integration of EPSPs
The most elementary postsynaptic response is the opening of a single
transmitter-gated channel (Figure 5.17). Inward current through these
channels depolarizes the postsynaptic membrane, causing the EPSP. The
postsynaptic membrane of one synapse may have from a few tens to sev-
eral thousands of transmitter-gated channels; how many of these are acti-
vated during synaptic transmission depends mainly on how much neuro-
transmitter is released.
Quantal Analysis of EPSPs. The elementary unit of neurotransmitter re-
lease is the contents of a single synaptic vesicle. Vesicles each contain about
'Y PRINCIPLES OF SYNAPTIC INTEGRATION 123
Channels closed
/ I
-'-- --- '- D rtr= i
Channels /
open
20 msec
6"
-
:::J
<0
..
Application of neurotransmitter to membrane patch
FIGURE 5.17
A patch-clamp recording from a transmitter-gated ion channel. Ionic current
passes through the channels when the channels are ODen. In the presence of neurotrans-
mitter. they rapidly alternate between open and closed states. (Source: Adapted from
Neher and Sakmann, 1992.)
the same number of transmitter molecules (several thousand); the total
amount of transmitter released is some multiple of this number. Conse-
quently, the amplitude of the postsynaptic EPSP is some multiple of the re-
sponse to the contents of a single vesicle. Stated another way, postsynaptic
EPSPs at a given synapse are quantized; they are multiples of an indivisible
unit, the quantum, that reflects the number of transmitter molecules in a
single synaptic vesicle and the number of postsynaptic receptors available
at the synapse.
At many synapses, exocytosis of vesicles occurs at some very low rate in
the absence of presynaptic stimulation. The size of the postsynaptic re-
sponse to this spontaneously released neurotransmitter can be measured
electrophysiologically. This tiny response is a miniature postsynaptic
potential, often called simply a "mini." Each mini is generated by the
transmitter contents of one vesicle. The amplitude of the postsynaptic EPSP
evoked by a presynaptic action potential, then, is simply an integer multi-
ple (i.e., 1 x, 2x, 3x, ete.) of the mini amplitude.
Quantal analysis, a method of comparing the amplitudes of miniature
and evoked postsynaptic potentials, can be used to determine how many
vesicles release neurotransmitter during normal synaptic transmission.
Quantal analysis of transmission at the neuromuscular junction reveals that
a single action potential in the presynaptic terminal triggers the exocytosis
of about 200 synaptic vesicles, causing an EPSP of 40 mV or more. At many
CNS synapses, in striking contrast, the contents of only a single vesicle are
released in response to a presynaptic action potential, causing an EPSP of
only a few tenths of a millivolt.
EPSP Summation. The difference between excitatory transmission at
neuromuscular junctions and CNS synapses is not surprising. The neuro-
muscular junction has evolved to be fail-safe; it needs to work every time,
and the best way to ensure this is to generate an EPSP of a huge size. On
the other hand, if every CNS synapse were, by itself, capable of triggering
an action potential in its postsynaptic cell (as the neuromuscular junction
can), then a neuron would be little more than a simple relay station. In-
stead, most neurons perform more sophisticated computations, requiring
that many EPSPs add together to produce a significant postsynaptic depo-
larization. This is what is meant by integration of EPSPs.
EPSP summation represents the simplest form of synaptic integration
in the CNS. There are two types of summation: spatial and temporal. Spatial
124 C HAP T E R 5 . SYNAPTIC TRANSMISSION
Action potential
{ _A.-
i
I Presynaptic axon
/
I
I RecordV m
I
EP5P
V m
- 65 mV
Time
(a)
FIGURE 5.18
EPSP summation. (a) A presynaptic action
potential triggers a small EPSP in a postsynap-
tic neuron. (b) Spatial summation of EPSPs:
When two or more presynaptic inputs are
active at the same time, thew Individual EPSPs
add together. (c) Temporal summation of
EPSPs: When the same presynaptic fiber fires
action potentials In quick succession, the indi-
vidual EPSPs add together.
Spatial summation
A.-
r---- =A.-
, _A.-
,l..
I Tem ..t .t;O"
I -
) (ero'd V o
. Record V m
/
"
V m V m
- 65 mV - 65 mV
Time Time
(b) (c)
summation is the adding together of EPSPs generated simultaneously at
many different synapses on a dendrite. Temporal summation is the
adding together of EPSPs generated at the same synapse if they occur in
rapid succession, within about L-15 msec of one another (Figure 5.18).
The Contribution of Dendritic Properties
to Synaptic Integration
Even with the summation of several EPSPs out on a dendrite, the depo-
larization still may not be enough to cause a neuron to fire an action po-
tential. The current entering at the sites of synaptic contact must spread
down the dendrite, through the soma, and cause the membrane of the
spike-initiation zone to be depolarized beyond threshold, before an action
potential can be generated. The effectiveness of an excitatory synapse in
triggering an action potential, therefore, depends on how far the synapse
is from the spike-initiation zone and on the properties of the dendritic
membrane.
Dendritic Cable Properties. To simplify the analysis of how dendritic
properties contribute to synaptic integration, let's assume that dendrites
function as cylindrical cables that are electrically passive; that is, lacking
voltage-gated ion channels (in contrast, of course, with axons). Using an
analogy introduced in Chapter 4, imagine that the influx of positive charge
at a synapse is like turning on the water that will flow down a leaky gar-
den hose (the dendrite). There are two paths the water can take: One is
down the inside of the hose; the other is through the leaks. By the same
token, there are two paths that synaptic current can take: One is down the
inside of the dendrite; the other is across the dendritic membrane. At some
distance from the site of current influx, the EPSP amplitude may approach
zero because of the dissipation of the current across the membrane.
The decrease in depolarization as a function of distance along a dendritic
cable is plotted in Figure 5.19. In order to simplify the mathematics, in this
Inject
current
J J
r R"xxd V m r R.<xxd V m
l' . -L-l-X
f L_
\ .. Toward
, soma
(a)
Dendritic cable
c
:Q> 1 00
o
o
0)-
ro
.Q
ro
0) .
Q. ro
(5 37
c-
O)
-0
o
Distance along
dendrite
y
(b)
A
example we assume the dendrite is infinitely long, unbranched, and uni-
form in diameter. Notice that the amount of depolarization falls off expo-
nentially with increasing distance. Depolarization of the membrane at a
given distance (V x ) can be described by the equation V x = VoletA, where
V o is depolarization at the origin (just under the synapse), e (= 2.718...) is
the base of natural logarithms, x is the distance from the synapse, and I is
a constant that depends on the properties of the dendrite. Notice that when
x = A, then V x = Vole. Put another way, VA = 0.37 (V o ). This distance A,
where the depolarization is 37% of that at the origin, is called the dendritic
length constant. (Remember that this analysis is an oversimplification.
Real dendrites have finite lengths, branches, and tend to taper, all of which
also affect the spread of current, and thus the effectiveness of synaptic
potentials.)
The length constant is an index of how far depolarization can spread
down a dendrite or axon. The longer the length constant, the more likely
it is that EPSPs generated at distant synapses will depolarize the membrane
at the axon hillock. The value of A in our idealized, electrically passive den-
drite depends on two factors: (1) the resistance to current flowing longitu-
dinally down the dendrite, called the internal resistance (ri); and (2) the
resistance to current flowing across the membrane, called the membrane
resistance (r m ). Most current will take the path of least resistance; there-
fore, the value of A will increase as membrane resistance increases because
more depolarizing current will flow down the inside of the dendrite. The
value of A will decrease as internal resistance increases because more cur-
rent will flow across the membrane. Just as water will flow farther down
a wide hose with few leaks, synaptic current will flow farther down a wide
dendrite (low ri) with few open membrane channels (high rm).
.. PRINCIPLES OF SYNAPTIC INTEGRATION 125
FIGURE 5.19
Decreasing depolarization as a function
of distance along a long dendritic
cable. (a) Current is injected into a dendrite,
and the depolarization is recorded. As this
current spreads down the dendrite, much of
it dissipates across the membrane. Therefore,
the depolarization measured at a distance
from the site of current injection is smaller
than that measured right under it. (b) A plot
of membrane depolarization as a function of
distance along the dendrite. At the distance h,
one length constant, the membrane depolar-
ization (VA)' is 37% of that at the origin.
I 26 C HAP T E R 5 . SYNAPTIC TRANSMISSION
The internal resistance depends only on the diameter of the dendrite and
the electrical properties of the cytoplasm; consequently, it is relatively con-
stant in a mature neuron. The membrane resistance, in contrast, depends on
the number of open ion channels, which changes from moment to moment
depending on what other synapses are active. The dendritic length con-
stant, therefore, is not constant at all! As we will see in a moment, tluctu-
ations in the value of I are an important factor in synaptic integration.
Excitable Dendrites. Our analysis of dendritic cable properties made an-
other important assumption: The dendrite's membrane is electrically pas-
sive, which means it lacks voltage-gated channels. Some dendrites in the
brain have nearly passive and inexcitable membranes, and thus follow the
simple cable equations. The dendrites of spinal motor neurons, for exam-
ple, are very close to passive. However, many other neuronal dendrites are
decidedly not passive. A variety of neurons have dendrites with significant
numbers of voltage-gated sodium, calcium, and potassium channels. Den-
drites rarely have enough ion channels to generate [ully propagating action
potentials, as in axons. But the voltage-gated channels in dendrites can act
as important amplifiers of small postsynaptic potentials generated far out
on dendrites. EPSPs that would diminish to near nothingness in a long, pas-
sive dendrite may nevertheless be large enough to trigger the opening of
voltage-gated sodium channels, which in turn would add current to boost
the synaptic signal along toward the soma.
Paradoxically, in some cells dendritic sodium channels may also serve to
carry electrical signals in the other direction-from the soma outward along
dendrites. This may be a mechanism by which synapses on dendrites are
informed that a spike occurred in the soma, and it has relevance for hy-
potheses about the cellular mechanisms of learning that will be discussed
in Chapter 25.
Inhibition
So far, we've seen that whether or not an EPSP contributes to the action
potential output of a neuron depends on several factors, including the
number of coactive excitatory synapses, the distance the synapse is from
the spike-initiation zone, and the properties of the dendritic membrane. Of
course, not all synapses in the brain are excitatory. The action of some
synapses is to take the membrane potential away from action potential
threshold; these are called inhibitory synapses. Inhibitory synapses exert a
powerful control over a neuron's output (Box 5.6).
IPSPs and Shunting Inhibition. The postsynaptic receptors under most
inhibitory synapses are very similar to those under excitatory synapses;
they're transmitter-gated ion channels. The only important differences are
that they bind different neurotransmitters (either GABA or glycine) and
that they allow different ions to pass through their channels. The trans-
mitter-gated channels of most inhibitory synapses are permeable to only
one natural ion, 0-. Opening of the chloride channel allows CI- ions to
cross the membrane in a direction that brings the membrane potential to-
ward the chloride equilibrium potential, Eo, about -65 mY. If the mem-
brane potential were less negative than -65 mV when the transmitter was
released, activation of these channels would cause a hyperpolarizing IPSE
Notice that if the resting membrane potential were already -65 mY, no
IPSP would be visible after chloride channel activation because the value of
the membrane potential would already equal Eo (Le., the reversal poten-
tia] for that synapse; see Box 5.4). If there is no visible IPSP, is the neuron
Box 5.6
,,'.
OF SPECIAL INTEREST
I .."
t
.. PRINCIPLES OF SYNAPTIC INTEGRATION 127
Startling Mutations and Poisons
A flash of lightning. . . a thunderclap. . . a tap on the shoul-
der when you think you're alone! If you are not expecting
them. any of these stimuli can make you jump. grimace,
hunch your shoulders, and breathe faster. We all know the
brief but dramatic nature of the startle response.
Luckily. when lightning strikes twice or a friend taps our
shoulder again. we tend to be much less startled the sec-
ond time. We quickly habituate, and relax. However, for
an unfortunate minority of mice, cows, dogs, horses, and
people, life is a succession of exaggerated startle responses.
Even normally benign stimuli. such as hands ciapping or a
touch to the nose, may trigger an uncontrollable stiffen-
ing of the body. an involuntary shout. flexion of the arms
and legs, and a fall to the ground. Worse yet, these over-
done responses don't adapt when the stimuli are repeated.
The clinical term for startle disease is hyperekpJexia, and
the first recorded cases were members of a community
of French-Canadian lumberjacks in 1878. Hyperekplexia is
an inherited condition, seen worldwide, and its sufferers
are known by colorful local names: the "Jumping French-
men of Maine" (Quebec), "my ria chit" (Siberia), "latah"
(Malaysia). and "Ragin' Cajuns" (Louisiana).
We now know the molecular basis for two general
types of startle diseases. Remarkably. both involve defects
of inhibitory glycine receptors. The first type, identified In
humans and in a mutant mouse called spasmodic, is caused
by a mutation of a gene for the glycine receptor. The
change is the smallest one possible-the abnormal re-
ceptors have only one amino acid (out of more than 400)
coded wrong-but the result is a chloride channel that
opens less frequently when exposed to the neurotrans-
mitter glycine. The second type of startle disease is seen
in the mutant mouse spastic and in a strain of cattle. In
these animals, normal glycine receptors are expressed, but
in fewer than normal numbers. The two forms of startle
disease thus take different routes to the same unfortunate
end: The transmitter glycine is less effective at inhibiting
neurons in the spinal cord and brain stem.
Most neural circuits depend on a delicate balance of
synaptic excitation and inhibition for normal functioning.
If excitation is increased or inhibition reduced, then a tur-
bulent and hyperexcitable state may result. An impairment
of glycine function yields exaggerated startles; reduced
GABA function can lead to the seizures of epilepsy (as
discussed in Chapter 14). How can such diseases be
treated There is often a clear and simple logic. Drugs that
enhance inhibition can be very helpful.
The genetic mutations of the glycine system resemble
strychnine poisoning. Strychnine is a powerful plant toxin,
first isolated in the early nineteenth century. It has tradi-
tionally been used by farmers to eradicate pesky rodents
and by murderers. Strychnine has a simple mechanism of
action: It is an antagonist of glycine at its receptor. Mild
strychnine poisoning enhances startle and other reflexes,
and resembles hyperekplexia. High doses nearfy eliminate
glycine-mediated i,nhibition in circuits of the spinal cord and
brain stem. This leads to uncontrollable seizures and
unchecked muscular contractions. spasm and paralysis of
the respiratory muscles, and ultimately death from asphyx-
iation. It is a painful, agonizing way to die; because glycine is
not a transmitter in the higher centers of the brain. strych-
nine itself does not impair cognitive or sensory functions.
really inhibited? The answer is yes. Consider the situation illustrated in Fig-
ure 5.20, with an excitatory synapse on a distal segment of dendrite and
an inhibitory synapse on a proximal segment of dendrite, near the soma.
Activation or the excitatory synapse leads to the influx of positive charge
into the dendrite. This current depolarizes the membrane as it flows toward
the soma. At the site of the active inhibitory synapse, however, the mem-
brane potential is approximately equal to Eo, -65 mY. Positive current
therefore flows outward across the membrane at this site to bring V m to
-65 mY. This synapse acts as an electrical shunt, preventing the current
from flowing through the soma to the axon hillock. This type of inhibition
is called shunting inhibition. The actual physical basis of shunting inhi-
bition is the inward movement of negatively charged chloride ions, which is for-
mally equivalent to outward positive current flow. Shunting inhibition is like
cutting a big hole in the leaky garden hose-all the water flows down this
path of least resistance, out of the hose, before it gets to the nozzle where
it can "activate" the flowers in your garden.
I 28 C HAP T E R 5 . SYNAPTIC TRANSMISSION
Dendrite
Excitatory synapse
Ai;")
"
Vmof
dendrite
Vmof
soma
(a)
Excitatory synapse
(active)
o.ed"\ /
c=-::r\::
/
Record V m
Vmof
dendrite
Vmof
soma
(b)
1 ::::: eye::)
1) / , some
,_/
Record V m 1 oe hmod<
11 ,
)} II
...
1 . Inhibitory synapse I
(active) /
" ! / Some
> " [' ""Axoe hmook
ReooroV m ! ) \
FIGURE 5.20
Shunting inhibition. A neuron receives one excitatory and one inhibitory Input (a) StIm-
ulation of the excitatory input causes inward postsynaptic current that spreads to the soma,
where it can be recorded as an EPSP. (b) When the Inhibitory and eXCitatory Inputs are
stimulated together. the depolanzing current leaks out before It reaches the soma.
Thus. you can see that the action of inhibitory synapses also contributes
to synaptic integration. The IPSPs can be subtracted from EPSPs, making
the postsynaptic neuron less likely to fire action potentials. In addition,
shunting inhibition acts to drastically reduce r m and consequently A, thus
allowing positive current to flow out across the membrane instead of in-
ternally down the dendrite toward the spike-initiation zone.
The Geometry of Excitatory and Inhibitory Synapses. Inhibitory
synapses in the brain that use GABA or glycine as a neurotransmitter always
have a morphology characteristic of Gray's type II (see Figure 5.7b). This
structure contrasts with excitatory synapses that use glutamate, which always
have a Gray's type I morphology. This correlation between structure and
function has been useful for working out the geometric relationships among
excitatory and inhibitory synapses on individual neurons. In addition to
being spread over the dendrites. inhibitory synapses on many neurons are
found clustered on the soma and near the axon hillock. where they are in
an especially powerful position to influence the activity of the postsynaptic
neuron.
Modulation
Most of the postsynaptic mechanisms we've discussed so far involve trans-
mitter receptors that are, themselves, ion channels. To be sure, synapses
with transmitter-gated channels carry the bulk of the specific information
that is processed by the nervous system. However, there are many synapses
with G-protein-coupled neurotransmitter receptors that are not directly as-
sociated with an ion channel. Synaptic activation of these receptors does
not directly evoke EPSPs and IPSPs, but instead modifies the effectiveness of
EPSPs generated by other synapses with transmitter-gated channels. This
type of synaptic transmission is called modulation. We'll give you a taste
for how modulation influences synaptic integration by exploring the effects
of activating one type of G-protein-coupled receptor in the brain, the
norepinephrine beta (13) receptor.
The binding of the amine neurotransmitter norepinephrine (NE) to the
13 receptor triggers a cascade of biochemical events within the cell. In short
the 13 receptor activates a G-protein that in turn, activates an effector pro-
tein, the intracellular enzyme adenylyl cyclase. Adenylyl cyclase catalyzes
the chemical reaction that converts adenosine triphosphate (ATP), the
product of oxidative metabolism in the mitochondria, into a compound
called cyclic adenosine monophosphate, or cAMP, that is free to dif-
fuse within the cytosol. Thus, the first chemical message of synaptic trans-
mission (the release of NE into the synaptic cleft) is converted by the 13 re-
ceptor into a second message (cAMP); cAMP is an example of a second
messenger.
The effect of cAMP is to stimulate another enzyme known as a protein
kinase. Protein ldnases catalyze a chemical reaction called phosphory-
lation, the transfer of phosphate groups (P03) from ATP to specific sites on
cell proteins (Figure 5.21). The significance of phosphorylation is that it can
change the conformation of a protein, thereby changing that protein's ac-
tivity.
In some neurons, one of the proteins that is phosphorylated when cAMP
rises is a particular type of potassium channel in the dendritic membrane.
Phosphorylation causes this channel to close, thereby reducing the membrane
K+ conductance. By itself, this does not cause any dramatic effects on the
neuron. But consider the wider consequence: decreasing the K+ conductance
Potassium
hannel
Adenylyl
cyclase
, ' "'I I"! '!'!' ' '\ I ' ' I ll, -: , k - ;"lX.'."I I \"'1. :;;-" 1'1
'i', J. J J i J J J ii I ,u ii-iiiiiiii' i, J J.U 'iiii1iiii. J J'ii i,,' u ,
13 receptor NE
r/
' .n -,,., I
u',JJnJ'
; @A
@
w. prolein
kinase
@
G-protein
.. PRINCIPLES OF SYNAPTIC INTEGRATION 129
FIGURE 5.21
Modulation by the NE preceptor.
CD The binding of NE to the receptor activates
a G-protein In the membrane. @ The G-
protein activates the enzyme adenylyl cyclase.
<ID Adenylyl cyclase converts ATP into the
second messenger cAMP @ cAMP activates a
protein kinase. @The protein kinase causes
a potassium channel to close by attaching a
phosphate group to it.
130 C HAP T E R 5 . SYNAPTIC TRANSMISSION
increases the dendritic membrane resistance and therefore increases the length con-
stant. It is like wrapping the leaky garden hose in duct tape; more water can
flow down the inside of the hose and less leaks out the sides. As a Conse-
quence of increasing "11., distant or weak excitatory synapses will become
more effective in depolarizing the spike-initiation zone beyond threshold;
the cell will become more excitable. Thus, the binding of NE to 13 receptors
produces little change in membrane potential but greatly increases the
response produced by another neurotransmitter at an excitatory synapse.
Because this effect involves several biochemical intermediaries, it can last
far longer than the presence of the modulatory transmitter itself.
We have described one particular G-protein-coupIed receptor and the
consequences of activating it in one type of neuron. But it is important to
recognize that other types of receptor can lead to the formation of other
types of second messenger molecules. Activation ot each of these receptor
types will initiate a distinct cascade of biochemical reactions in the post-
synaptic neuron that do not always include phosphorylation and decreases
in membrane conductauce. In fact, cAMP in a different cell type with dif-
ferent enzymes may produce functionally opposite changes in the ex-
citability of cells.
In Chapter 6, we will describe more examples of synaptic modulation
and their mechanisms. However, you can already see that modulatory
forms of synaptic transmission offer an almost limitless number of ways
that information encoded by presynaptic impulse activity can be trans-
formed and used by the postsynaptic neuron.
.. CONCLUDING REMARKS
In this chapter, we have covered the basic principles of chemical synaptic
transmission. The action potential that arose in the sensory nerve when
you stepped on that thumbtack in Chapter 3, and swept up the axon in
Chapter 4, has now reached the axon terminal in the spinal cord. The de-
polarization of the terminal triggered the presynaptic entry of Ca H through
voltage-gated calcium channels, which then stimulated exocytosis of the
contents of synaptic vesicles. Liberated neurotransmitter diffused across the
synaptic cleft and attached to specific receptors in the postsynaptic mem-
brane. The transmitter (probably glutamate) caused transmitter-gated chan-
nels to open, which allowed positive charge to enter the postsynaptic den-
drite. Because the sensory nerve was firing action potentials at a high rate,
and because many synapses were activated at the same time, the EPSPs
summed to bring the spike-initiation zone of the postsynaptic neuron to
threshold, and this cell then generated action potentials. If the pustsynap-
tic cell were a motor neuron, this activity would cause the release of ACh
at the neuromuscular junction and muscle contraction. If the postsynaptic
cell were an interneuron that used GABA as a neurotransmitter. the activity
of the cell would result in inhibition of its synaptic targets. 1£ this cell used
a modulatory transmitter such as NE, the activity could cause lasting changes
in the excitability or metabolism of its synaptic targets. It is this rich diver-
sity of chemical synaptic interactions that allows complex behaviors (such
as shrieking with pain as you jerk up your foot) to emerge from simple
stimuli (such as stepping on a thumbtack).
Although we surveyed chemical synaptic transmission in this chapter, we
did not cover the chemistry of synaptic transmission in any detail. In Chap-
ter 6, we'll take a closer look at the chemical "nuts and bolts" of different
neurotransmitter systems. In Chapter 15, after we've examined the sensory
and motor systems in Part II, we'll explore the contributions of several dif-
ferent neurotransmitters to nervous system function and behavior. You'll
see that the chemistry of synaptic transmission warrants all this attention
because defective neurotransmission is the basis for many neurological and
psychiatric disorders. And virtually all psychoactive drugs, both therapeu-
tic and illicit, exert their effects at chemical synapses.
In addition to providing explanations for aspects of neural information
processing and the effects of drugs, knowledge of chemical synaptic trans-
mission is also the key to understanding the neural basis of learning and
memory. Memories of past experiences are established by modification of the
effectiveness of chemical synapses in the brain. Material discussed in this
chapter suggests possible sites of modification, ranging from changes in presy-
naptic Ca H entry and neurotransmitter release to alterations in postsynaptic
receptors or excitability. As we shall see in Chapter 25, all of these changes
are likely to contribute to the storage of information by the nervous system.
>-V)
wI:
e:::
w
I-
Introduction
synaptic transmission (p. I 02)
electrical synapse (p. 102)
chemical synapse (p. 102)
Types of Synapses
gap junction (p. 103)
postsynaptic potential (PSP) (p. 104)
secretory granule (p. 105)
dense-core vesicle (p. I 06)
membrane differentiation (p. 106)
active zone (p. I 06)
postsynaptic density (p. 106)
neuromuscular junction (p. I 09)
motor end-plate (p. I I 0)
Principles of Chemical
Synaptic Transmission
glutamate (Glu) (p. 112)
gamma-aminobutyric acid (GABA)
(p. "2)
glycine (Gly) (p. 112)
acetylcholine (ACh) (p. 112)
f1J
., ""
V)
Z
w
0
>
w l-
e::: V)
w
::>
a
transporter (p. 113)
voltage-gated calcium channel
(p. "3)
exocytosis (p. 114)
endocytosis (p. 114)
transmitter-gated ion channel
(p. 115)
excitatory postsynaptic potential
(EPSP) (p. I 17)
inhibitory postsynaptic potential
(IPSP) (p. 117)
G-protein-coupled receptor
(p. 118)
G-protein (p. I 18)
second messenger (p. I 18)
metabotropic receptor (p. I 18)
auto receptor (p. I 19)
neuropharmacology (p. 121)
inhibitor (p. 122)
receptor antagonist (p. 122)
receptor agonist (p. 122)
nicotinic ACh receptor (p. 122)
... CONCLUDING REMARKS 13 I
Principles of Synaptic
Integration
synaptic integration (p. 122)
miniature postsynaptic potential
(p. 123)
quantal analysis (p. 123)
EPSP summation (p. 123)
spatial summation (p. 123)
temporal summation (p. 124)
length constant (p. 125)
internal resistance (p. 125)
membrane resistance (p. 125)
shunting inhibition (p. 127)
modulation (p. 129)
norepinephrine (NE) (p. 129)
adenylyl cyclase (p. 129)
cyclic adenosine monophosphate
(cAMP) (p. 129)
protein kinase (p. 129)
phosphorylation (p. 129)
I. What is meant by quantal release of neurotransmitter?
2. You apply ACh and activate nicotinic receptors on a muscle cell. Which way will current flow through the
receptor channels when V m = -60 mY? When V m = 0 mY? When V m = 60 mY? Why?
3. In this chapter. we discussed a GABA-gated ion channel that is permeable to 0-. GABA also activates a
G-protein-coupled receptor, called the GABAB receptor. which causes potassium-selective channels to open.
What effect would GABA B receptor activation have on the membrane potential?
4. You think you have discovered a new neurotransmitter, and you are studying its effect on a neuron. The reversal
potential for the response caused by the new chemical is - 60 mY. Is this substance excitatory or inhibitory? Why?
5. A drug called strychnine. isolated from the seeds of a tree native to India and commonly used as rat poison.
blocks the effects of glycine. Is strychnine an agonist or an antagonist of the glycine receptor?
132 C HAP T E R 5 . SYNAPTIC TRANSMISSION
6. How does nerve gas cause respiratory paralysis?
7. Why is an excitatory synapse on the soma more effective in evoking action potentials in the postsynaptic
neuron than an excitatory synapse on the tip of a dendrite?
8. What are the steps that lead to increased excitability in a neuron when NE is released presynaptically?
6d
C:!l9
Wz
I-
J-O
C:!«
::>w
L.L.C:!
Connors BW, Long MA. 2004. Electrical synapses in
the mammalian brain. Annual Review of Neuro-
science 27:393--418.
Cowan WM, Sudhof TC, Stevens CF. 200 I. Synapses.
Baltimore: Johns Hopkins University Press.
Johnston D, Wu SM-S. 1994. Foundations of Cellular
Neurophysiology. Cambridge, MA: MIT Press.
Levitan IB, Kaczmarek LK. 2001. The Neuron: Cell and
Molecular Biology, 3rd ed. New York: Oxford Uni-
versity Press.
Stevens CF. 2004. Presynaptic function. Current Opin-
ion in Neurobiology 14:341-345.
Stuart G, Spruston N, Hausser M. 1999. Dendrites.
New York: Oxford University Press.
SudhofTC. 2004. The synaptic vesicle cycle. Annual
Review of Neurosdence 27:509-547.
CHAPTER
Neurotransmitter
Systems
INTRODUCTION
STUDYING NEUROTRANSMITTER SYSTEMS
lOCALIZATION OF TRANSMITTERS AND TRANSMITTER-SYNTHESIZING ENZYMES
Immunocytochemistry
In Situ Hybridization
STUDYING TRANSMITTER RELEASE
STUDYING SYNAPTIC MIMICRY
STUDYING RECEPTORS
NeurophannacorogkalAnao/s
Ligand-Binding Methods
Molecular Analysis
NEUROTRANSMITTER CHEMISTRY
CHOLINERGIC NEURONS
. Box 6.1 Brain Food: Pumping Ions and Transmitters
CATECHOLAMINERGIC NEURONS
SEROTONERGIC NEURONS
AMINO ACiDERGIC NEURONS
OTHER NEUROTRANSMITTER CANDIDATES AND INTERCEllULAR MESSENGERS
. Box 6.2 Of Special Imerest: This Is Your Brain on Endocannabinoids
. Box 6.3 Path of Discovery: Deciphering the Language of Neurons, by Roger A. Nicoll
TRANSMITTER-GATED CHANNELS
THE BASIC STRUCTURE OF TRANSMITTER-GATED CHANNELS
AMINO ACID-GATED CHANNELS
Glutamate-Gated Channels
. Box 6.4 Of Special Imerest: The Brain's Exciting Poisons
GABA-Gated and Glycine-Gated Channels
G-PROTEIN-COUPLED RECEPTORS AND EFFECTORS
THE BASIC STRUCTURE OF G-PROTEIN-COUPlED RECEPTORS
THE UBIQUITOUS G-PROTEINS
G-PROTEIN-COUPlED EFFECTOR SYSTEMS
The Shortcut Pathway
Second Messenger Cascades
Phosphorylation and Dephosphorylation
The Function of Signal Cascades
DIVERGENCE AND CONVERGENCE IN NEUROTRANSMITTER SYSTEMS
CONCLUDING REMARKS
134 C HAP T E R 6 . NEUROTRANSMITTER SYSTEMS
FIGURE 6.1
Elements of neurotransmitter systems.
'Y INTRODUCTION
The normal human brain is an orderly set of chemical reactions. As we
have seen, some of the brain's most important chemical reactions are those
associated with synaptic transmission. Chapter 5 introduced the general
principles of chemical synaptic transmission, using a few specific neuro-
transmitters as examples. In this chapter, we will explore in more depth the
variety and elegance of the major neurotransmitter systems.
Neurotransmitter systems begin with neurotransmitters. In Chapter 5,
we discussed the three major classes: amino acids, amines, and pep tides. Even
a partial list of the known transmitters, such as that appearing in Table 5.1,
has more than 20 different molecules. Each of these molecules can define
a particular transmitter system. In addition to the molecule itself, a neuro-
transmitter system includes all the molecular machinery responsible for
transmitter synthesis, vesicular packaging, reuptake and degradation, and
transmitter action (Figure 6.1).
The first molecule positively identified as a neurotransmitter by Otto
Loewi in the 1920s was acetylcholine, or ACh (see Box 5.1). To describe
the cells that produce and release ACh, British pharmacologist Henry Dale
introduced the term cholinergic. (Dale shared the 1936 Nobel Prize with
Loewi, in recognition of his neuropharmacological studies of synaptic trans-
mission.) Dale termed the neurons that use the amine neurotransmitter
norepinephrine (NE) noradrenergic. (NE is known as noradrenaline in
Great Britain.) The convention of using the suffix -ergic continued when
additional transmitters were identified. Therefore, today we speak of glu-
tamatergic synapses that use glutamate, GABAergic synapses that use
GAB A, peptidergic synapses that use pep tides, and so on. These adjectives
Presynaptic
/ axon terminal
Neurotransmitter-synthesizing
enzymes IT
Synaptic vesicle transporters
Reuptake transporters
Degradative enzymes
.. -
... - ..
.
Transmitte -gated ion chann s
.. ..-
G-protein- upled receptors
G-proteins
Postsynaptic
dendrite
G-protein-gated ion channels
Second messenger cascades
.,. STUDYING NEUROTRANSMITTER SYSTEMS 135
are also used to identify the various neurotransmitter systems. Thus, for ex-
ample, ACh and all the molecular machinery associated with it are collec-
tively called the cholinergic system.
With this terminology in hand, we can begin our exploration of the
neurotransmitter systems. We start with a discussion of the experimental
strategies that have been used to study transmitter systems. Then we will
look at the synthesis and metabolism of specific neurotransmitters and ex-
plore how these molecules exert their postsynaptic effects. In Chapter IS,
after we have learned more about the structural and functional organiza-
tion of the nervous system, we'll take another look at specific neurotrans-
mitter systems in the context of their individual contributions to the regu-
lation of brain function and behavior.
T STUDYING NEUROTRANSMITTER SYSTEMS
The first step in studying a neurotransmitter system is usually identifying
the neurotransmitter. This is no simple task; the brain contains uncount-
able different chemicals. How can we decide which few chemicals are used
as transmitters?
Over the years, neuroscientists have established certain criteria that must
be met for a molecule to be considered a neurotransmitter:
1. The molecule must be synthesized and stored in the presynaptic neuron.
2. The molecule must be released by the presynaptic axon terminal upon
stimulation.
3. The molecule, when experimentally applied, must produce a response in
the postsynaptic cell that mimics the response produced by the release
of neurotransmitter from the presynaptic neuron.
Let's start by exploring some of the strategies and methods that are used to
satisfy these criteria.
Localization of Transmitters and
Transmitter-Synthesizing Enzymes
The scientist often begins with little more than a hunch that a particular
molecule may be a neurotransmitter. This idea may be based on observing
that the molecule is concentrated in brain tissue, or that the application of
the molecule to certain neurons alters their action potential firing rate.
Whatever the inspiration, the first step in confirming the hypothesis is to
show that the molecule is, in fact, localized in, and synthesized by, partic-
ular neurons. Many methods have been used to satisfy this criterion for dif-
ferent neurotransmitters. Two of the most important techniques used today
are immunocytochemistry and in situ hybridization.
Immuno<:ytochemistry. The method of immunocytochemistry is used
to anatomically localize particular molecules to particular cells. The principle
behind the method is quite simple (Figure 6.2). Once the neurotransmitter
candidate has been chemically purified, it is injected into the bloodstream
of an animaL where it stimulates an immune response. (Often. to evoke a
response, the molecule is chemically coupled to a larger molecule.) One
aspect of the immune response is the generation of large proteins called
antibodies. Antibodies can bind tightly to specific sites on the foreign
molecule-in this case, the transmitter candidate. The best antibodies for
immunocytochemistry bind very tightly to the transmitter of interest, and
bind very little or not at all to other chemicals in the brain. These specific
136 C HAP T E R 6 . NEUROTRANSMITTER SYSTEMS
(a) Inject neurotransmitter
candidate
\
(b) Withdraw specific
antibodies
FIGURE 6.2
Immunocytochemistry. This method uses labeled antibodies
to identify the location of molecules within cells. (a) The molecule
of interest (a neurotransmitter candidate) is injected into an animal,
causing an immune response and the generation of antibodies.
(b) Blood is withdrawn from the animal. and the antibodies are
isolated from the serum. (c) The antibodies are tagged with a
visible marker and applied to sections of brain tissue. The antibodies
label only those cells that contain the neurotransmitter candidate.
(d) A closeup of the complex that Includes the neurotransmitter
candidates. an antibody, and its visible marker.
Brain
tissue
section
Labeled neuron
containing
neurotransmitter
candidate
neuron
Antibody chemically
tagged with visible marker
antibody molecules can be recovered from a blood sample of the immu-
nized animal and chemically tagged with a colorful marker that can be seen
with a microscope. When these labeled antibodies are applied to a section
of brain tissue. they will color just those cells that contain the transmitter
candidate (Figure 6.3).
Immunocytochemistry can be used to localize any molecule for which a
specific antibody can be generated. induding the symhesjzing enzymes for
transmitter candidates. Demonstration that the transmitter candidate and
FIGURE 6.3
Immunocytochemical localization of a
peptide neurotransmitter in neurons.
(Source: Courtesy of Dr. Y. Amitai and S. L.
Patrick. )
,
..
its synthesizing enzyme are contained in the same neuron-or better yet,
in the same axon terminal-can help satisfy the criterion that the molecule
be localized in, and synthesized by, a particular neuron.
In Situ Hybridization. The method known as in situ hybridization is
also useful for confirming that a cell synthesizes a particular protein or pep-
tide. Recall from Chapter 2 that proteins are assembled by the ribosomes
according to instructions from specific mRNA molecules. There is a unique
mRNA molecule for every polypeptide synthesized by a neuron. The mRNA
transcript consists of four different nucleic acids linked together in various
sequences to form a strand. Each nucleic acid has the unusual property that
it will bind tightly to one other complementary nucleic acid. Thus, if the
sequence of nucleic acids in a strand of mRNA is known, it is possible to
construct in the lab a complementary strand that will stick, like a strip of
Velcro, to the mRNA molecule. The complementary strand is called a probe,
and the process by which the probe bonds to the mRNA molecule is called
hybridization (Figure 6.4). In order to see if the mRNA for a particular pep-
tide is localized in a neuron, we chemically label the appropriate probe so
it can be detected, apply it to a section of brain tissue, allow time for the
probes to stick to any complementary mRNA strands, then wash away all
the extra probes that have not Stuck. Finally, we search for neurons that
contain the label.
For in situ hybridization, the probes are usually labeled by making them
radioactive. Because we cannot see radioactivity, hybridized probes are de-
tected by laying the brain tissue on a sheet of special film that is sensitive
to radioactive emissions. After exposure to the tissue, the film is developed
like a photograph, and negative images of the radioactive cells are visible
as clusters of small dots (Figure 6.5). This technique for viewing the distri-
bution of radioactivity is called autoradiography.
In summary, immunocytochemistry is a method for viewing the location
of specific molecules, including proteins, in sections of brain tissue. In situ
hybridization is a method for localizing specific mRNA transcripts for pro-
teins. Together, these methods enable us to see whether a neuron contains
and synthesizes a transmitter candidate.
Studying Transmitter Release
Once we are satisfied that a transmitter candidate is synthesized by a
neuron and localized to the presynaptic terminal, we must show that it is
actually released upon stimulation. In some cases, a specific set of cells or
axons can be stimulated while taking samples of the fluids bathing their
synaptic targets. The biological activity of the sample can then be tested to
see if it mimics the effect of the intact synapses, and then the sample can
be chemically analyzed to reveal the structure of the active molecule. This
general approach helped Loewi and Dale identify ACh as a transmitter at
many peripheral synapses.
Unlike the peripheral nervous system (PNS), the nervous system outside
the brain and spinal cord studied by Loewi and Dale, most regions of the
central nervous system (CNS) contain a diverse mixture of intermingled
synapses using different neurotransmitters. This often makes it impossible
to stimulate a single population of synapses, containing only a single neuro-
transmitter. Researchers must be content with stimulating many synapses
in a region of the brain and collecting and measuring all the chemicals that
are released. One way this is done is by using brain slices that are kept
alive in vitro. To stimulate release, the slices are bathed in a solution con-
taining a high K+ concentration. This treatment causes a large membrane
... STUDYING NEUROTRANSMITTER SYSTEMS 137
Strand of mRNA
in neuron
Radioactively
labeled probe
with proper
sequence of
complementary
nucleic acids
FIGURE 6,4
In situ hybridization. Strands of mRNA
consist of nucleotides arranged in a specific
sequence. Each nucleotide will stick to one
other complementary nucleotide. In the
method of in situ hybridization. a synthetic
probe is constructed containing a sequence of
complementary nucleotides that will allow it
to stick to the mRNA. If the probe is labeled,
the location of cells containing the mRNA will
be revealed.
.,
:0-.
'.
FIGURE 6.5
In situ hybridization of the mRNA for
a peptide neurotransmitter in neurons,
visualized with autoradiography. Only
neurons with the proper mRNA are labeled,
with clusters of white dots. (Source: Courtesy
of Dr. S. H. C. Hendry.)
138 C HAP T E R 6 . NEUROTRANSMITTER SYSTEMS
Presynapti
terminal
Postsynaptic
dendrite
Drug-containing
I m;"oy'
/
t __ Stimulate
(::::==8= axon
{
- Record V m
Apply drug
by passing
electrical
current
Ie
/
"
FIGURE 6.6
Microionophoresis. This method enables a
researcher to apply drugs or neurotransmitter
candidates In very small amounts to the sur-
face of neurons. The responses generated by
the drug can be compared to those gener-
ated by synaptic stimulation.
depolarization (see Figure 3.19), thereby stimulating transmitter release
from the axon terminals in the tissue. Because transmitter release requires
the entry of Ca2+ into the axon terminal, it must also be shown that the
release of the neurotransmitter candidate from the tissue slice after depo-
larization occurs only when Ca2+ ions are present in the bathing solution.
Even when it has been shown that a transmitter candidate is released
upon depolarization in a calcium-dependent fashion, we still cannot be
sure that the molecules collected in the fluids were released [rom the axon
terminals; they may have been released as a secondary consequence o[
synaptic activation. These technical difficulties make the second criterion-
that a transmitter candidate must be released by the presynaptic axon
terminal upon stimulation-the most difficult to satisfy unequivocally in
the CNS.
Studying Synaptic Mimicry
Establishing that a molecule is localized in, synthesized by, and released
from a neuron is still not sufficient to qualify it as a neurotransmitter. A
third criterion must be met: The molecule must evoke the same response
as that produced by the release of naturally occurring neurotransmitter
from the presynaptic neuron.
To assess the postsynaptic actions of a transmitter candidate, a method
called microionophoresis is often used. Most neurotransmitter candidates
can be dissolved in solutions that will cause them to acquire a net electrical
charge. A glass pipette with a very fine tip, just a few micrometers across,
is filled with the ionized solution. The tip of the pipette is carefully posi-
tioned next to the postsynaptic membrane of the neuron, and the trans-
mitter candidate is ejected in very small amounts by passing electrical cur-
rent through the pipette. A microelectrode in the postsynaptic neuron can
be used to measure the effects of the transmitter candidate on the mem-
brane potential (Figure 6.6).
If ionophoretic application of the molecule causes electrophysiological
changes that mimic the effects of transmitter released at the synapse, and
if the other criteria of localization, synthesis, and release have been met,
then the molecule and the transmitter usually are considered to be the
same chemical.
Studying Receptors
Each neurotransmitter exerts its postsynaptic effects by binding to specific
receptors. As a rule, no two neurotransmitters bind to the same receptor;
however, one neurotransmitter can bind to many different receptors. Each
o[ the different receptors a neurotransmitter binds to is called a receptor
subtype. For example, in Chapter 5 we learned that ACh acts on two dif-
ferent cholinergic receptor subtypes: One type is present in skeletal muscle,
and the other is in heart muscle. Both subtypes are also present in many
other organs and within the CNS.
Researchers have tried almost every method of biological and chemical
analysis to study the different receptor subtypes of the various neurotrans-
mitter systems. Three approaches have proved to be particularly useful:
neuropharmacological analysis o[ synaptic transmission, ligand-binding
methods, and, most recently, molecular analysis of receptor proteins.
Neuropharmacological Analysis. Much of what we know about receptor
subtypes was first learned using neuropharmacological analysis. For instance,
skeletal muscle and heart muscle respond differently to various cholinergic
... STUDYING NEUROTRANSMITTER SYSTEMS 139
Neurotransmitter: ACh
Agonists: I- N;oo\;", Muscarine
+1 +
Antagonists: Curare Atropine
+
<0
;;;fl Nicotinic .:,:)., ,.-;;
" ,
Receptors: receptor "I'l.ll
,
'-
FIGURE 6:7
The neuropharmacology of cholinergic synaptic transmission. Sites on transmitter
receptors can bind either the transmitter itself (ACh). an agonist that mimics the transmitter;
or an antagonist that blocks the effects of the transmitter and agonists.
drugs. Nicotine, derived from the tobacco plant, is a receptor agonist in
skeletal muscle but has no effect in the heart. On the other hand, muscarine,
derived from a poisonous species of mushroom, has little or no effect on
skeletal muscle but is an agonist at the cholinergic receptor subtype in the
heart. (Recall that ACh slows the heart rate; muscarine is poisonous be-
cause it causes a precipitous drop in heart rate and blood pressure.) Thus,
two ACh receptor subtypes can be distinguished by the actions of different
drugs. In fact, the receptors were given the names of their agonists: nico-
tinic ACh receptors in skeletal muscle and muscarinic ACh receptors
in the heart. Nicotinic and muscarinic receptors also exist in the brain.
Another way to distinguish receptor subtypes is to use selective antago-
nists. The South American arrow-tip poison curare inhibits the action of
ACh at nicotinic receptors (thereby causing paralysis), and atropine, derived
from belladonna plants, antagonizes ACh at muscarinic receptors (Figure
6.7). (The eyedrops an ophthalmologist uses to dilate your pupils are re-
lated to atropine.)
Different drugs were also used to distinguish several subtypes of gluta-
mate receptors, which mediate much of the synaptic excitation in the CNS.
Three subtypes are AMPA receptors. NMDA receptors. and kainate
receptors, each named for a different chemical agonist. (AMPA stands for
a-amino-3-hydroxy-5-methyl-4-isoxazole propionate, and NMDA stands
for N-methyl-D-aspartate.) The neurotransmitter glutamate activares all
three receptor subtypes, but AMPA acts only at the AMPA receptor, NMDA
acts only at the NMDA receptor, and so on (Figure 6.8).
Similar pharmacological analyses were used to split the NE receptors into
two subtypes, a and 13, and to divide GABA receptors into GABA A and
GABA B subtypes. The same can be said for virtually all the neurotransmit-
ter systems. Thus, selective drugs have been extremely useful for catego-
rizing receptor subclasses (Table 6.1). In addition, neuropharmacological
analysis has been invaluable for assessing the contributions of neurotrans-
mitter systems to brain function.
Ligand-Binding Methods. As we said, the first step in studying a neuro-
transmitter system is usually identifying the neurotransmitter. However,
with the discovery in the 1970s that many drugs interact selectively with
140 C HAP T E R 6 . NEUROTRANSMITTER SYSTEMS
FIGURE 6.8
The neuropharmacology of gluta-
matergic synaptic transmission. There
are three main subtypes of glutamate recep-
tors, each of which binds glutamate, and each
of which is activated selectively by a different
agonist
.}.
i " - ;.'. .).
"" - ,
. "". ;.",
. -- "
"
. : ':'! (
, I
I' . ",,-.:
L
-- .
... -: _0"
>-
FIGURE 6.9
Opiate receptor binding to a slice of
rat brain. Special film was exposed to a
brain section that had radioactive opiate re-
ceptor ligands bound to it. The dark regions
contain more receptors. (Source: Snyder, 1986,
p.44.)
Neurotransmitter:
Glutamate
Receptors:
VMOA
Agonists: AMPA
\
,.-----<\-- -
,
Kainate
/
f
,,->
( I
neurotransmitter receptors, researchers realized that they could use these
compounds to begin analyzing receptors, even before the neurotransmitter
itself had been identified. A pioneer of this approach was Solomon Snyder
at Johns Hopkins University, who was interested in studying compounds
called opiates. Opiates are a broad class of drugs that are both medically im-
portant and commonly abused. Their effects include pain relief, euphoria,
depressed breathing, and constipation.
The question Snyder originally set out to answer WaS how heroin, mor-
phine, and other opiates exert their effects on the brain. They hypothesized
that opiates might be agonists at specific receptors in neuronal membranes.
To test this idea, they radioactively labeled opiate compounds and applied
them in small quantities to neuronal membranes that had been isolated
from different parts of the brain. If receptors existed in the membrane, the
labeled opiates should bind tightly to them. This is just what they found.
The radioactive drugs labeled specific sites on the membranes of some, but
not all, neurons in the brain (Figure 6.9). Following the discovery of opiate
receptors, the search was on to identify endogenous opiates, or endorphins,
the naturally occurring neurotransmitters that act on these receptors. Two
peptides called enkephalins were soon isolated from the brain, and they
eventually proved to be opiate neurotransmitters.
Table 6.1 Th. N. uropharmacology of S . me Receptor Subtypes
NEUROTRANSMITTER RECEPTOR SUBTYPE AGONIST ANTAGONIST
Acetylcholine (ACh) Nicotinic receptor Nicotine Curare
Muscarinic receptor Muscarine Atropine
Norepinephrine (NE) a receptor Phenylephrine Phenoxybenzamine
13 receptor Isoproterenol Propranolol
Glutamate (Glu) AMPA AMPA CNQX
NMDA NMDA AP5
GABA GABA A Muscimol Bicucu/line
GABA B Baclofen Phaclofen
ATP P 2X ATP Suramin
A type Adenosine Caffeine
Any chemical compound that binds to a specific site on a receptor is
called a ligand for that receptor (from the Latin meaning "to bind"). The
technique of studying receptors using radioactively labeled ligands is called
the ligand-binding method. Notice that a ligand for a receptor can be an
agonist, an antagonist, or the chemical neurotransmitter itself. Specific ligands
were invaluable for isolating neurotransmitter receptors and determining
their chemical structure. Ligand-binding methods have been enormously
important for mapping the anatomical distribution of different neurotrans-
mitter receptors in the brain.
Molecular Analysis. There has been an explosion of information about
neurotransmitter receptors in the last 25 years, thanks to modern methods
for studying protein molecules. Information obtained with these methods
has enabled us to divide the neurotransmitter receptor proteins into two
groups: transmitter-gated ion channels and G-protein-coupled (metabotropic)
receptors (see Chapter 5).
Molecular neurobiologists have determined the structure of the polypep-
tides that make up many proteins, and these studies have led to some star-
tling conclusions. Receptor subtype diversity was expected from the actions
of different drugs. but the broad extent of the diversity was not appreciated
until researchers determined how many different polypeptides could serve
as subunits of functional receptors.
Consider as an example the GABA A receptor. a transmitter-gated chlo-
ride channel. Each channel requires five subunits, and there are five major
classes of subunit proteins, designated a, 13, 'Y, B, and p. At least six differ-
ent polypeptides (designated al-6) can substitute for one another as an a
subunit. Four different polypeptides (designated 131--4) can substitute as a
13 subunit, and four different polypeptides ('YI--4) can be used as a 'Y sub-
unit. Although this is not the complete tally, let's make an interesting cal-
culation. If it takes five subunits to form a GABA A receptor-gated channel
and there are 15 possible subunits to choose from, then there are 151,887
possible combinations and arrangements of subunits. This means there are
at least 151,887 potential subtypes of GABA A receptors!
It is important to recognize that the vast majority of the possible subunit
combinations are never manufactured by neurons and, even if they were,
they would not work properly. Nonetheless, it is clear that receptor classi-
fications like those appearing in Table 6.1, while still useful, underestimate
the diversity of receptor subtypes in the brain.
... NEUROTRANSMITTER CHEMISTRY
Research using methods such as those discussed above has led to the
conclusion that the major neurotransmitters are amino acids, amines, and
peptides. Evolution is conservative and opportunistic, and it often puts
common and familiar things to new uses. This seems to be true about the
evolution of neurotransmitters. For the most part, they are similar or iden-
tical to the basic chemicals of life, the same substances that cells in all
species, from bacteria to giraffes, use for metabolism. Amino acids, the
building blocks of protein, are essential to life. Most of the known neuro-
transmitter molecules are either (1) amino acids, (2) amines derived from
amino acids, or (3) peptides constructed from amino acids. ACh is an ex-
ception; but it is derived from acetyl CoA, a ubiquitous product of cellular
respiration in mitochondria, and choline, which is important for fat metab-
olism throughout the body.
Amino acid and amine transmitters are generally each stored in and
released by separate sets of neurons. The convention established by Dale
... NEUROTRANSMITTER CHEMISTRY 141
142 C HAP T E R 6 . NEUROTRANSMITTER SYSTEMS
classifies neurons into mutually exclusive groups by neurotransmitter
(cholinergic, glutamatergic, GABAergic, and so on). The idea that a neuron
has only one neurotransmitter is often called Dale's principle. Many pep-
tide-containing neurons violate Dale's principle because these cells usually
release more than one neurotransmitter: an amino acid or amine and a
peptide. When two or more transmitters are released from one nerve ter-
minal, they are called co-transmitters. Many examples of neurons with
co-transmitters have been identified in recent years. Nonetheless, most
neurons seem to release only a single amino acid or amine neurotransmit-
ter, which can be used to assign them to distinct, nonoverlapping classes.
Let's take a look at the biochemical mechanisms that differentiate these
neurons.
Cholinergic Neurons
Acetylcholine (ACh) is the neurotransmitter at the neuromuscular junc-
tion and therefore is synthesized by all the motor neurons in the spinal cord
and brain stem. Other cholinergic cells contribute to the functions of spe-
cific circuits in the PNS and CNS, as we will see in Chapter 15.
ACh synthesis requires a specific enzyme, choline acetyltransferase (ChAT)
(Figure 6.10). Like all presynaptic proteins, ChAT is manufactured in the
soma and transported to the axon terminal. Only cholinergic neurons con-
tain ChAT, so this enzyme is a good marker for cells that use ACh as a neu-
rotransmitter. Immunocytochemistry with ChAT-specific antibodies, for ex-
ample, can be used to identify cholinergic neurons. ChAT synthesizes ACh
in the cytosol of the axon terminal, and the neurotransmitter is concen-
trated in synaptic vesicles by the actions of an ACh transporter (Box 6.1).
ChAT transfers an acetyl group from acetyl CoA to choline (Figure 6.11a).
The source of choline is the extracellular fluid, where it exists in low micro-
molar concentrations. Choline is taken up by the cholinergic axon termi-
nals via a specific transporter. Because the availability of choline limits how
I
) Presynaptic cell
Choline
Na+ transporter
ACh
I transporter ChAT I Cho . line I
\ -- +
. . : I Acetyl CoA l
: Ac l
V."".
AChE
..
I Choline I
+
0Cidl
ACh receptors
Postsynaptic ceil
FIGURE 6.10
The life cycle of ACh.
... NEUROTRANSMITTER CHEMISTRY 143
o
"
, CH 3 C"
CoAl
Acetyl CoA
+
Choline
Choline
acetyltransferase
(ChAT)
..
°
II +
CH 3 C-OCH 2 CH 2 N(CH 3 b + CoA I
ACh
+
HOCH 2 CH 2 N(CH 3 b
(a)
°
II +
CH 3 C-OCH 2 CH 2 N(CH 3 b
ACh
..
Acetylcholinesterase
°
II
CH 3 C- OH
+
HOCH 2 CH 2 N(CH 3 h
Acetic acid
+ Choline
(b)
FIGURE 6.11
Acetylcholine. (a) ACh synthesis. (b) ACh degradation.
much ACh can be synthesized in the axon terminal, the transport of choline
into the neuron is said to be the rate-limiting step in ACh synthesis. For
certain diseases in which a deficit in cholinergic synaptic transmission has
been noted, dietary supplements of choline are sometimes prescribed to
boost ACh levels in the brain.
Cholinergic neurons also manufacture the ACh degradative enzyme
acetylcholinesterase (AChE). AChE is secreted into the synaptic cleft and is
associated with cholinergic axon terminal membranes. However, AChE is
also manufactured by some noncholinergic neurons, so this enzyme is not
as useful a marker for cholinergic synapses as ChAT.
AChE degrades ACh into choline and acetic acid (Figure 6.11 b). This
happens very quickly, because AChE has one of the fastest catalytic rates
among all known enzymes. Much of the resulting choline is taken up by
the cholinergic axon terminal and reused for ACh synthesis. In Chapter 5,
we mentioned that AChE is the target of many nerve gases and insecticides.
Inhibition of AChE prevents the breakdown of ACh, disrupting transmis-
sion at cholinergic synapses on skeletal muscle and heart muscle. Acute
effects include marked decreases in heart rate and blood pressure; however,
death from the irreversible inhibition of AChE is typically a result of respi-
ratory paralysis.
(a)
H0'h I
CH2CH2NH2
Dopamine (DA)
Catecholaminergic Neurons
The amino acid tyrosine is the precursor for three different amine neuro-
transmitters that contain a chemical structure called a catechol (Figure
6.12a). These neurotransmitters are collectively called catecholamines.
The catecholamine neurotransmitters are dopamine (DA), norepineph-
rine (NE), and epinephrine, also called adrenaline (Figure 6.12b). Cat-
echolaminergic neurons are found in regions of the nervous system in-
volved in the regulation of movement, mood, attention, and visceral
function (discussed further in Chapter 15).
All catecholaminergic neurons contain the enzyme tyrosine hydroxylase
(TH), which catalyzes the first step in catecholamine synthesis, the conver-
sion of tyrosine to a compound called dopa (L-dihydroxyphenylalanine)
o
HO f "\ CHCH 2 NH 2
- I
OH
Norepinephrine (NE)
(Noradrenaline)
o
of' CHCH 2 NHCH 3
- I
(b) OH
Epinephrine
(Adrenaline)
FIGURE 6.12
The catecholamines. (a) A catechol group.
(b) The catecholamine neurotransmitters.
Box 6.1
) ' f)
, : I
BRAIN Faa-
Pumping Ions and Transmitters
Neurotransmitters may lead an exciting life, but the most
mundane part of it would seem to be the steps that re-
cycle them back from the synaptic cleft and eventually
into a vesicle. Where synapses are concerned, the exotic
proteins of exocytosis and the innumerable transmitter
receptors get most of the publicity. Yet the neurotrans-
mitter transporters are very interesting for at least two
reasons: They succeed at an extraordinarily djfficult job,
and they are the molecular site at which many important
psychoactive drugs act.
The hard job of transporters is to pump transmitter mol-
ecules across membranes so effectively that they become
highly concentrated in very small places. There are two gen-
eral types of neurotransmitter transporter. One type, the
neuronal membrane transporter, shuttles transmitter from the
extracellular fluid, including the synaptic cleft, and concen-
trates it up to 10,000 times higher within the cytosol of the
presynaptic terminal. A second type, the vesicular transporter,
then crams transmitter into vesicles at concentrations that
may be 100,000 times higher than in the cytosol. Inside
cholinergic vesicles, for example, ACh may reach the in-
credible concentration of 1000 mM, or I molar-in other
words, about twice the concentration of salt in seawater!
How do transporters achieve such dramatic feats of
concentration? Concentrating a chemical is like carrying a
weight uphill; both are extremely unlikely to occur unless
energy is applied to the task. Recall from Chapter 3 that
ion pumps in the plasma membrane use ATP as their
source of energy to transport Na +. K -1-, and Ca 2 + against
their concentration gradients. These ion gradients are
essential for setting the resting potential, and for power-
ing the ionic currents that underlie action and synaptic
potentials. Notice, however, that once ionic gradients are
Presynaptic:
GABAergic
GABA
transporter
Vesicular
GABA
transporter
8
GABA
established across a membrane, they can themselves be
tapped as sources of energy. Just as the energy spent in
pulling up the weights on a cuckoo clock can be reclaimed
to turn the gears and hands of the clock (as the weights
slowly fall down again). transporters use transmembrane
gradients of Na+ or H+ as an energy source for moving
transmitter molecules up steep concentration gradients.
The transporter lets one transmembrane gradient, that of
Na+ or H+. run down a bit in order to build up another
gradient, that of the transmitter.
The transporters themselves are large proteins that
span membranes. There can be several transporters for
one transmitter (e.g., at least four subtypes are known for
GABA). Figure A shows how they work. Plasma mem-
brane transporters use a cotransport mechanism, carrying
two Na+ ions along with one transmitter molecule. By
contrast, vesicular membrane transporters use a counler-
transport mechanism that trades a transmitter molecule
from the cytosol for a H+ from inside the vesicle. Vesicle
membranes have ATP-driven H+ pumps that keep their
contents very acidic, or high in protons (Le., H+ ions).
What is the relevance of all this to drugs and disease?
Many psychoactive drugs, such as amphetamines and co-
caine, potently block certain transporters. By altering the
normal recycling process of various transmitters, the drugs
lead to chemical imbalances in the brain that can have
profound effects on mood and behavior. It is also possible
that defects in transporters can lead to psychiatric or
neurological disease; certainly some of the drugs that are
therapeutically useful in psychiatry work by blocking trans-
porters. The numerous links between transmitters, drugs,
disease. and treatment are tantalizing but complex, and
will be discussed further in Chapters 15 and 22.
Glutamate
transporter
Presynaptic:
Glutamatergic
Glu
Postsynaptic membrane
FIGURE A
I Tyrosine
hYd : 1
(TH)
(a)
L-Dihydroxy-
phenylalanine
(dopa)
Dopa l
decarboxylase
(b)
Dopamine
(DA)
Dopamine 1
-hydroxylase
(DBH)
(c)
Norepinephrine
(NE)
Phentolamine 1
N-methyltransferase
(PNMT)
(d) ! Epinephrine I
COOH
1
H o--O- CH 2 tHNH 2
'OH
HO-(J- CH)NH 2
HO-(J- CH 2 CH 2 NH 2
:0- 0
H f"\ CHCH 2 NH 2
- !
OH
HO
H n CHCH 2 NH CH 3 1
I
OH
FIGURE 6.13
The synthesis of catecholamines from tyrosine. The catecholamine neurotransmIt-
ters are in boldface type.
(Figure 6.13a). The activity of TH is rate limiting for catecholamine syn-
thesis. The enzyme's activity is regulated by various signals in the cytosol
of the axon terminal. For example, decreased catecholamine release by the
axon terminal causes the catecholamine concentration in the cytosol to
rise, thereby inhibiting TH. This type of regulation is called end-product
inhibition. On the other hand, during periods when catecholamines are
released at a high rate, the elevation in [Ca2+]; that accompanies neuro-
transmitter release triggers an increase in the activity of TH, so transmitter
supply keeps up with demand. In addition, prolonged periods of stimula-
tion actually cause the synthesis of more mRNA that codes for the enzyme.
Dopa is converted into the neurotransmitter dopamine by the enzyme
dopa decarboxylase (Figure 6.13b). Dopa decarboxylase is abundant in cate-
cholaminergic neurons, so the amount of dopamine synthesized primarily
depends on the amount of dopa available. In the movement disorder known
as Parkinson's disease, dopaminergic neurons in the brain slowly degenerate
and eventually die. One strategy for treating Parkinson's disease is the
administration of dopa, which causes an increase in DA synthesis in the
... NEUROTRANSMITTER CHEMISTRY 145
146 C HAP T E R 6 . NEUROTRANSMITTER SYSTEMS
surviving neurons, increasing the amount of DA available for release. (We
will learn more about dopamine and movement in Chapter 14.)
Neurons that use NE as a neurotransmitter contain, in addition to TH and
dopa decarboxylase, the enzyme dopamine {3-hydroxylase (DBH), which con-
verts dopamine to norepinephrine (Figure 6.13c). It is interesting to note
that DEH is not found in the cytosol, but instead is located within the
synaptic vesicles. Thus, in noradrenergic axon terminals, DA is transported
from the cytosol to the synaptic vesicles, and there it is made into NE.
The last in the line of catecholamine neurotransmitters is epinephrine
(adrenaline). Adrenergic neurons contain the enzyme phentolamine N-
methyltransferase (PNMT), which converts NE to epinephrine (Figure 6.13d).
Curiously, PNMT is in the cytosol of adrenergic axon terminals. Thus, NE
must first be synthesized in the vesicles, released into the cytosol for con-
version into epinephrine, and then the epinephrine must again be trans-
ported into vesicles for release. In addition to serving as a neurotransmit-
ter in the brain, epinephrine is released by the adrenal gland into the
bloodstream. As we shall see in Chapter 15, circulating epinephrine acts at
receptors throughout the body to produce a coordinated visceral response.
The catecholamine systems have no fast extracellular degradative en-
zyme analagous to AChE. Instead, the actions of catecholamines in the
synaptic cleft are terminated by selective uptake of the neurotransmitters
back into the axon terminal via Na + -dependent transporters. This step is
sensitive to a number of different drugs. For example. amphetamine and
cocaine block catecholamine uptake and therefore prolong the actions of
the neurotransmitter in the cleft. Once inside, the axon terminal, the cat-
echolamines may be reloaded into synaptic vesicles for reuse, or they may
be enzymatically destroyed by the action of monoamine oxidase (MAD), an
enzyme found on the outer membrane of mitochondria.
Serotonergic Neurons
The amine neurotransmitter serotonin, also called 5-hydroxytryptamine and
abbreviated 5-HT, is derived from the amino acid tryptophan. Serotoner-
gic neurons are relatively few in number, but, as we shall see in Part III,
they appear to play an important role in the brain systems that regulate
mood, emotional behavior, and sleep.
The synthesis of serotonin occurs in two steps, just like the synthesis of
dopamine (Figure 6.14). Tryptophan is converted first into an intermediary
called 5-HTP (5-hydroxytryptophan) by the enzyme tryptophan hydroxylase.
The 5-HTP is then converted to 5-HT by the enzyme 5-HTP decarboxylase.
Serotonin synthesis appears to be limited by the availability of tryptophan
in the extracellular fluid bathing neurons. The source of brain tryptophan is
the blood, and the source of blood tryptophan is the diet (grains, meat and
dairy products are particularly rich in tryptophan). Thus, a dietary deficiency
of tryptophan can quickly lead to a depletion of serotonin in the brain.
Following release from the axon terminal, 5-HT is removed from the
synaptic cleft by the action of a specific transporter. The process of serotonin
reuptake, like catecholamine reuptake, is sensitive to a number of different
drugs. For example, several clinically useful antidepressant drugs, including
fluoxetine (trade name Prozac). are selective inhibitors of serotonin reup-
take. Once it is back in the cytosol of the serotonergic axon terminal, the
transmitter is either reloaded into synaptic vesicles or degraded by MAO.
Amino Acidergic Neurons
The amino acids glutamate (Glu), glycine (Gly), and gamma-
aminobutyric acid (GABA) serve as neurotransmitters at most CNS
COOH
-r--
CH2CHNH2
N)
Tryptophan
1 Tryptophan
hydroxylase
OOHI
HO CH2CHNH2
N)
5-Hydroxytryptophan
(5-HTP)
l S-HTP
decarboxylase
5-Hydroxytryptamine
(Serotonin, 5-HT)
CH2CH2NH2
N)
FIGURE 6.14
The synthesis of serotonin from tryptophan.
synapses (Figure 6.15). Of these, only GABA is unique to those neurons
that use it as a neurotransmitter; the others are among the 20 amino acids
that make up proteins.
Glutamate and glycine are synthesized from glucose and other precursors
by the action of enzymes that exist in all cells. Differences among neurons
in the synthesis of these amino acids are therefore quantitative rather than
qualitative. For example, the average glutamate concentration in the cy-
tosol of glutamatergic axon terminals has been estimated to be about 20
mM, two or three times higher than that in nonglutaniatergic cells. The
more important distinction between glutamatergic and nonglutamatergic
neurons, however, is the transporter that loads the synaptic vesicles. In
glutamatergic axon terminals, but not in other types, the glutamate trans-
porter concentrates glutamate until it reaches a value of about 50 mM in
the synaptic vesicles.
Because GABA is not one of the 20 amino acids used to construct pro-
teins, it is synthesized in large quantities only by the neurons that use it as
a neurotransmitter. The precursor for GABA is glutamate, and the key syn-
thesizing enzyme is glutamic acid decarboxylase (GAD) (Figure 6.16). GAD,
therefore, is a good marker for GABAergic neurons. Immunocytochemical
studies have shown that GABAergic neurons are distributed widely in the
brain. GABAergic neurons are the major source of synaptic inhibition in
the nervous system. Therefore, remarkably, in one chemical step. the
major excitatory neurotransmitter in the brain is converted into the major
inhibitory neurotransmitter in the brain!
The synaptic actions of the amino acid neurotransmitters are terminated
by selective uptake into the presynaptic terminals and glia, once again via
specific Na+ -dependent transporters. Inside the terminal or glial celL GABA
is metabolized by the enzyme GABA transaminase.
Other Neurotransmitter Candidates
and Intercellular Messengers
In addition to the amines and amino acids, a few other small molecules
serve as chemical messengers between neurons. For instance. ATP, a key
molecule in cellular metabolism, is very likely to be a neurotransmitter.
.. NEUROTRANSMITTER CHEMISTRY 147
I Glutamate I
COOH
I
NH 3 CHCH 2 CH 2 COOH
I Glycine I
COOH
I
NH 3 CH 2
GABA
y-aminobutyric acid NH 3 CH 2 CH 2 CH 2 COOH
FIGURE 6.15
The amino acid neurotransmitters.
H
I Glutamate I NHiHCH 2 CH 2 COOH
Glutamic acid
decarboxylase
(GAD)
GABA I NH 3 CHCH 2 CH 2 COOH
FIGURE 6.16
-rhe synthesis of GABA from glutamate.
148 C HAP T E R 6 . NEUROTRANSMITTER SYSTEMS
ATP is concentrated in vesicles at many synapses in the CNS and PNS, and
it is released into the cleft by presynaptic spikes in a Ca2+ -dependent
manner, just as the classic transmitters are. ATP is often packaged in vesi-
cles along with another classic transmitter. For example, catecholamine-
containing vesicles may have 100 mM of ATP, an enormous quantity, in
addition to 400 mM of the catecholamine itself. In this case, the cate-
cholamine and ATP are probably co-transmitters.
ATP directly excites some neurons by gating a cation channel. In this
sense, some of the neurotransmitter functions of ATP may be similar to
those of glutamate. ATP binds to purinergic receptors, some of which are
transmitter-gated ion channels. There is also a large class of G-protein-
coupled purinergic receptors.
The most interesting discovery about neurotransrnjtters in the past few
years is that small lipid molecules, called endocannabinoids (endogenous
cannabinoids), can be released from postsynaptic neurons and act on presy-
naptic terminals (Box 6.2). Communication in this direction, from "post"
to "pre," is called retrograde signaling; thus, endocannabinoids are retro-
grade messengers. Retrograde messengers serve as a kind of feedback sys-
tem to regulate the conventional forms of synaptic transmission, which of
course go from "pre" to "post." The details about endocannabinoid signal-
ing are still emerging, but one basic mechanism is now clear (Figure 6.17).
Vigorous firing of action potentials in the postsynaptic neuron causes
Presynaptic terminal
o
HO
NH
- -
FIGURE 6.17
Retrograde signaling with endocannabinoids.
Endocannabinoid
Box 6.2
.... , .
OF SPECIAL INTEREST
........ I....
...
.
... NEUROTRANSMITTER CHEMISTRY 149
This Is Your Brain
on Endocannabinoids
Most neurotransmitters were discovered long before their
receptors, but new techniques have tended to reverse
this tradition. This is a story of receptors in search of
transmitters.
Cannabis sativa is the botanical name for hemp, a fibrous
plant used through the ages for making rope and cloth.
These days, cannabis is much more popular as dope than
rope; it is widely, and usually illegally, sold as marijuana or
hashish. The Chinese first recognized the potent psy-
choactive properties of cannabis 4000 years ago. but
Western society learned of its intoxicating properties
only in the nineteenth century, when Napoleon Ill's troops
returned to France with Egyptian hashish. As a member
of Napoleon's Commission of Sciences and Arts reported
in 1810: "For the Egyptians, hemp is the plant par excel-
lence, not for the uses they make of it in Europe and
many other countries, but for its peculiar effects. The
hemp cultivated in Egypt is indeed intoxicating and nar-
cotic" (cited in Piomelli, 2003, p. 873).
At low doses, the effects of cannabis can be euphoria,
feelings of calm and relaxation, altered sensations, re-
duced pain, increased laughter, talkativeness, hunger, and
lightheadedness, as well as decreased problem-solving
ability, short-term memory, and psychomotor perform-
ance (i.e., the skills necessary for driving). High doses of
cannabis can cause profound personality changes, and
even hallucinations. In recent years, forms of cannabis
have been approved for limited medicinal use in the United
States, primarily to treat nausea and vomiting in cancer
patients undergoing chemotherapy, and to stimulate ap-
petite in some AIDS patients.
The active ingredient in cannabis is an oily chemical
called 6,9- tetra hydrocannabinol, or THe. During the late
1 980s, it became apparent that THC can bind to specific
G-protein-coupled "cannabinoid" receptors in the brain,
particularly in motor control areas, the cerebral cortex,
and pain pathways. At about the same time, a group at
the National Institute of Mental Health cloned the gene
for an unknown (or "orphan") G-protein-coupled recep-
tor: Further work showed that the mystery receptor was
a cannabinoid (CB) receptor.Two types of cannabinoid re-
ceptors are now known: CB I receptors are in the brain,
and CB2 receptors are mainly in immune tissues else-
where in the body.
Remarkably, the brain has more CB I receptors than
any other G-protein-coupled receptor. What are they
doing there? We are quite certain they did not evolve to
bind the THC from hemp. The natural ligand for a recep-
tor is never the synthetic drug, plant toxin, or snake
venom that might have helped us identify that receptor in
the first place. It is much more likely that the cannabinoid
receptors exist to bind some signaling molecule made
naturally by the brain: THC-like neurotransmitters called
endocannabinoids. Recent research has identified several
molecules that are possible endocannabinoids.Among the
most promising are anandamide (from ananda, the San-
skrit word for "internal bliss") and arachidonylglycerol (2-
AG).Anandamide and 2-AG are both small lipid molecules
(Figure A), quite different from' any other known neuro-
transmitter:
As the search for new transmitters continues, the hunt
is also on for further subtypes of CB receptors, and for
more selective compounds that bind to them. Cannabi-
noids are potentially useful for relieving nausea, suppress-
ing pain, relaxing muscles, treating seizures, and decreas-
ing the intraocular pressure of glaucoma. As we write
this, a cannabinoid receptor antagonist is being tested as
an appetite suppressant in human clinical trials. Cannabi-
noid therapies might be more practical if new drugs can
be developed that retain the therapeutic benefits without
causing psychoactive side effects.
OH
7"0 #
1'.9-THC
o
NH/'v'OH
Anandamide
o
-C::
2-Arachidonoylglycerol (2-AG)
FIGURE A
Endocannabinoids.
.
150 C HAP T E R 6 . NEUROTRANSMITTER SYSTEMS
voltage-gated calcium channels to open, Ca2+ enters the cell in large quan-
tities, and intracellular [Ca2+] rises. The elevated [Ca2+] then somehow
stimulates the synthesis of endocannabinoid molecules from membrane
lipids. There are several unusual qualities about endocannabinoids:
1. They are not packaged in vesicles like most other neurotransmitters;
instead, they are manufactured rapidly and on-demand.
2. They are small and membrane pecrneable; once synthesized, they can
diffuse rapidly across the membrane of their cell of origin to contact
neighboring cells.
3. They bind selectively to the CB 1 type of cannabinoid receptor, which is
mainly located on certain presynaptic tecminals.
CB 1 receptors are G- protein -coupled receptors, and their main effect is
often to reduce the opening of presynaptic calcium channels. With its
calcium channels inhibited, the ability of the presynaptic terminal to re-
lease its neurotransmitter (usually GABA or glutamate) is impaired. Thus,
when a postsynaptic neuron is very active, it releases endocannabinoids,
which suppress either the inhibitory or excitatory drive onto the neuron (de-
pending on which presynaptic terminals have the CB1 receptors). This gen-
Box 6.3
PATH OF DISCOVERY
Ii"
.J1lF-
Deciphering the Language
of Neurons
In the first year of medical school, I was introduced to
the human brain, the crowning achievement of evolution.
I immediately wanted to know how it worked, but how
do you study such a complex and mysterious organ? My
epiphany came with two discoveries. First, I saw Cajal's
beautiful drawings of various types of neurons. It seemed
to me that the most tractable approach to understand-
ing the brain was to focus on these individual building
blocks. However, as beautiful as these drawings are, by
themselves they cannot tell us what the cells and circuits
are actually doing. Second, I discovered the work of
Nobel laureate John Eccles, who showed that with intra-
cellular recording, one could go deep into the brain
and eavesdrop on the private synaptic communication
between individual identified neurons. With this tech-
nique, one could take the beautiful, but static, cellular
architecture of Cajal and literally make it come to life. It
was my good fortune to work with Eccles after medical
school.
At this time, the identity of the neurotransmitters in the
brain was completely unknown. In contrast, the neuro-
transmitters acetylcholine and norepinephrine in the PNS
by Roger A. Nicoll
had already been identified. This knowledge inspired the
development of a rich and rational pharmacology that
allowed precise control of normal and abnormal synaptic
functions, such as heartbeat, intestinal motility, hyper-
tension, and asthma. Why couldn't we understand the
brain equally well and develop a rational pharmacology for
such disorders as schizophrenia, depression, Parkinson's
disease, and Alzheimer's disease? My goal, then, was to
identify the neurotransmitters used by the various
synapses in the brain and understand how neurons in the
CNS talk to one another.
The complexity of the brain and the fact that experi-
ments could be done only on intact anesthetized animals
at that time excluded most of the obvious experiments.
As a result, many investigators had turned to "simple" in-
vertebrate nervous systems where very elegant experi-
ments were possible and the pace of discovery was faster.
However, my interests were in the mammalian brain.
Reports had shown that thin slices of brain could be
made and maintained for many hours in vitro. I was quickly
seduced by this technique, because one could now carry
out experiments that were as clever and informat.ive as
. NEUROTRANSMITTER CHEMISTRY 15 I
eral endocannabinoid mechanism is used throughout the CNS, for a wide
range of functions that we are only beginning to understand (Box 6.3).
One of the more exotic chemical messengers to be proposed for inter-
cellular communication is actually a gaseous molecule, nitric oxide (NO).
Carbon monoxide (CO) has also been suggested as a messenger, although
evidence is meager. These are the same nitric oxide and carbon monoxide
that are major air pollutants from internal combustion engines. NO is syn-
thesized from the amino acid arginine by many cells of the body. and it has
powerful biological effects, particularly in the regulation of blood flow. In
the nervous system, NO may be another example of a retrograde messen-
ger. Because NO is small and membrane permeable, similar to endo-
cannabinoids, it can diffuse much more freely than most other transmitter
molecules, even penetrating through one cell to affect another beyond it.
Its influence may spread throughout a small region of local tissue, rather
than being confined to the site of the cells that released them. On the other
hand, NO is evanescent and breaks down very rapidly. The functions of
gaseous transmitters are being extensively studied and hotly debated.
Before leaving the topic of neurotransmitter chemistry, we point out,
once again, that many of the chemicals we call neurotransmitters may
also be present in high concentrations in non-neural parts of the body. A
those in simple systems and yet actually be working on
the mammalian brain itself.
My recent work on the brain's own marijuana. the endo-
cannabinoids, is a good example of my research approach,
for two reasons. First, I have been working on neuronal
signaling for close to 40 years, and I was beginning to
think that all the low-lying fruit had been picked. What is
so exciting about the work on endocannabinoids is that
an entirely novel form of neuronal communication lies
hidden in the neuronal thickets of the brain. Thus, there
are still many more fundamental discoveries to be made
about the brain. We have barely scratched the surface.
Second, one of the most satisfying aspects of science for
me is sharing with students and postdoctoral fellows
both the frustration and the excitement associated with
the process of discovery. My work on endocannabinoids
involves individuals with whom I have worked from the
beginning of my career to the present.
A few years ago, Rachel Wilson. a student in my lab,
decided to work on a curious phenomenon in the hip-
pocampus referred to as depolarization-induced suppression
of inhibition (DSI), which had been discovered by Bradley
Alger a number of years earlier. Brad was my first post-
doctoral fellow; after he had set up his own lab, he dis-
covered OSI. Remarkably, Brad's thorough experiments
showed that OSI was induced by postsynaptic depolariza-
tion, but it was expressed as an inhibition of GABA re-
lease. This was extremely interesting because it was the
first compelling example of retrograde transmission, in
which a signal is released from a postsynaptic cell and
travels backward to act on a presynaptic terminal. Rachel
began by characterizing some of the properties of OSI,
showing, for example, that a rise in postsynaptic calcium
was sufficient to trigger it, and that the mysterious mes-
senger molecules could spread no more than a few tens
of microns. However, identifying the messenger was pro-
ceeding slowly.
Ouring a discussion with former student Jeffry Isaacson,
the idea that an endocannabinoid might be involved came
up. These small fatty acids had many of the properties
expected for the messenger. Furthermore, others had dis-
covered a variety of agonists and antagonists of cannabi-
noid receptors. Specific drugs are essential for identifying
the messengers that mediate particular physiological
processes. When we applied the agonists, they precisely
mimicked OSI by presynaptically inhibiting GABA release.
Most importantly, applying the antagonists completely
abolished OSI.
Much to our surprise, we had great difficulty publishing
our findings. That experience reminded me of the remark
that asking a scientist what he thinks about reviewers is
like asking a lamppost how it feels about dogs. Scientists
are often resistant to new ideas. When faced with over-
whelming evidence for a new idea, however, even the
most reluctant scientists can be quickly converted.
152 C HAP T E R 6 . NEUROTRANSMITTER SYSTEMS
chemical may serve dual purposes, mediating communication in the nerv-
ous system but doing something entirely different elsewhere. Amino acids,
of course, are used to make proteins throughout the body. ATP is the en-
ergy source for all cells. Nitric oxide is released from endothelial cells and
causes the smooth muscle of blood vessels to relax. (One consequence in
males is penile erection.) The cens with the highest levels of ACh are not
in the brain but in the cornea of the eye, where there are no ACh recep-
tors. Likewise, the highest serotonin levels are not in neurons, but in blood
platelets. These observations underscore the importance of rigorous analy-
sis before a chemical is assigned a neurotransmitter role.
The operation of a neurotransminer system is like a play with two acts.
Act I is presynaptic and culminates in the transient elevation of neuro-
transmitter concentration in the synaptic cleft. We are now ready to move
on to Act II, the generation of electrical and biochemical signals in the
postsynaptic neuron. The main players are transmitter-gated channels and
G- protein -coupled receptors.
.. TRANSMITTER-GATED CHANNELS
In Chapter 5, we learned that ACh and the amino acid neurotransmitters
mediate fast synaptic transmission by acting on transmitter-gated ion
channels. These channels are magnificent minuscule machines. A single
channel can be a sensitive detector of chemicals and voltage, it can regu-
late the flow of surprisingly large currents with great precision, it can sift
and select between very similar ions, and it can be regulated by other re-
ceptor systems. Yet each channel is only about 11 nm long, just barely
visible with the best computer-enhanced electron microscopic methods.
Although the secrets of these channels are now being revealed, we still
have much to learn.
The Basic Structure of Transmitter-Gated Channels
The most thoroughly studied transmitter-gated ion channel is the nicotinic
ACh receptor at the neuromuscular junction in skeletal muscle. It is a pen-
tamer, an amalgam of five protein subunits arranged like the staves of a
barrel to form a single pore through the membrane (Figure 6.18a). Four
different types of polypeptides are used as subunits for the nicotinic recep-
tor, and they are designated a, 13, -y, and 8. A complete mature channel is
made from two a subunits, and one each of 13, -y, and 8 (abbreviated a213-y8).
There is one ACh binding site on each of the a subunits; the simultaneous
binding of ACh to both sites is required for the channel to open (Figure
6.18b). The nicotinic ACh receptor on neurons is also a pentamer, but, un-
like the muscle receptor, most of them are comprised of a and 13 subunits
only (in a ratio of a3(32).
Although each type of receptor subunit has a different primary structure,
there are stretches where the different polypeptide chains have a similar se-
quence of amino acids. For example, each subunit polypeptide has four
separate segments that will coil into alpha helices (see Figure 6.18a). Be-
cause the amino acid residues of these segments are hydrophobic, the four
alpha helices are believed to be where the polypeptide is threaded back and
forth across the membrane, similar to the pore loops of potassium and
sodium channels (see Chapters 3 and 4).
The primary structures of the subunits of other transmitter-gated chan-
nels in the brain are also known, and there are obvious similarities (Figure
6.19). Most comain the four hydrophobic segments that are thought to
... TRANSMITTER-GATED CHANNELS 153
;:
(
b I f\ I
. I C;::
!o: I .
« .'!. ZI'" "":...
'II ,f'l
AlMUf1 I 11 IlI1
L
M1 -.::
(a)
------------
ACh binding sites
I
>, V- \J
. "y a
)
b
(t
rq1
FIGURE 6.18
The subunit arrangement of the nicotinic ACh recep-
tor. (a) Side view. with an enlargement showing how the four
alpha helices of each subunit are packed together. (b) Top view,
showing the location of the two ACh binding sites.
M1 M2 M3 M4 Receptor Subunit
\ I / / ACh
11111 -- 1 . a
Iii III 81 GABA A a1
111111 . GABA A 131 Extra-
cellular
I 1111-:1 . GABA A Y2 side
. , I! I! I! n
IIUII I::..JI Gly a Membrane ,,,. . I
I I
-
1 IT'D I .. Gly 13 Intra-
cellular
side
J 11.1 I . I Kainate
II I II I ----.J Kainate 2
(b)
-.::
-I
.-- "-
.. -' "-
. 1 "-
' M3
'-
'-
. . '-
. '--
M2
w
FIGURE 6.19
Similarities in the structure of subunits for different transmitter-gated ion channels. (a) If the polypeptides for
vanous channel subunits were stretched out in a line, this is how they would compare. They have in common the four regions
called M I-M4, which are segments where the polypeptides will coil into alpha helices to span the membrane. Kainate necep-
tors are subtypes of glutamate receptors. (b) M I-M4 regions of the ACh a subunit, as they are believed to be threaded
through the membrane.
I S4 C HAP T E R 6 . NEUROTRANSMITTER SYSTEMS
span the membrane. Most of the channels are also thought to be pen-
tameric complexes. with close similarities to the nicotinic ACh receptor. The
most important exceptions are the glutamate-gated channels. It is very
likely that glutamate receptors are tetramers, having [our subunits that
comprise a functional channel. The M2 region of the glutamate subunits
does not span the membrane. but instead forms a hairpin that both enters
and exits from the inside of the membrane. The structure of the glutamate
receptors resembles that of potassium channels (see Figure 3.17), and this
has inspired the surprising hypothesis that glutamate receptors and potas-
sium channels evolved from a common ancestral ion channel. The puriner-
gic (ATP) receptors also have an unusual structure. Each subunit has only
two membrane-spanning segments. and the number of subunits that make
up a complete receptor is not known.
The most interesting variations among channel structures are the ones
that account for their differences. Different transmitter binding sites let one
channel respond to Glu while another responds to GAB A; certain amino
acids around the narrow ion pore allow only Na+ and K+ to flow through
some channels, Ca2+ through others, and only 0- through yet others.
Amino Acid-Gated Channels
Amino acid-gated channels mediate most of the fast synaptic transmission
in the CNS. Let's take a closer look at their functions, because they are cen-
tral to topics as diverse as sensory systems, memory, and disease. Several
properties of these channels distinguish them from one another and define
their functions within the brain.
. The pharmacology of their binding sites describes which transmitters affect
them and how drugs interact with them.
. The kinetics of the transmitter binding process and channel gating deter-
mine the duration of their effect.
. The selectivity of the ion channels determines whether they produce ex-
citation or inhibition and whether Ca2+ enters the cell in significant
amounts.
. The conductance of open channels helps determine the magnitude of their
effects.
All these properties are a direct result of the molecular structure of the
channels.
Glutamate-Gated Channels. As we discussed previously, three glutamate
receptor subtypes bear the names of their selective agonists: AMPA. NMDA.
and kainate. Each of these is a glutamate-gated ion channel. The AMPA-
gated and NMDA-gated channels mediate the bulk of fast excitatory synap-
tic transmission in the brain. Kainate receptors also exist throughout the
brain, but their functions are not clearly understood.
AMPA-gated channels are permeable to both Na+ and K+, and most of
them are not permeable to Ca2+. The net effect of activating them at nor-
mal, negative membrane potentials is to admit Na+ ions into the cell, caus-
ing a rapid and large depolarization. Thus, AMPA receptors at CNS synapses
mediate excitatory transmission in much the same way as nicotinic recep-
tors mediate synaptic excitation at neuromuscular junctions.
AMPA receptors coexist with NMDA receptors at many synapses in the
brain, so most glutamate-mediated EPSPs have components contributed by
both (Figure 6.20). NMDA-gated channels also cause excitation of a cell by
/ lmpulse1L- /" Axon
/ Axon terminal
FIGURE 6.20
The coexistence of NMDA and AMPA receptors
in the postsynaptic membrane of a CNS synapse.
(a) An impulse arriving in the presynaptic terminal causes
the release of glutamate. (b) Glutamate binds to AMPA-
gated and NMDA-gated channels in the postsynaptic
membrane. (c) The entry of Na+ through the AMP A
channels. and Na+ and Ca2+ through the NMDA channels,
causes an EPSP.
(a)
'.
" : _:....
Glutamate
molecule
Ca 2 +
/ \ - 65 mV
K+
g
Na+
lL,
(
Na+
![
lL a +
( ,
V m
,
j
u....u x "): x... I
J\
/
K+
(b)
NMDA
receptor
AMPA
receptor
o
(c)
admitting Na+, but they differ from AMP A receptors in two very important
ways: (1) NMDA-gated channels are permeable to Ca2+, and (2) inward
ionic current through NMDA-gated channels is voltage dependent. We'll
discuss each of these properties, in turn.
It is hard to overstate the importance of intracellular Ca2+ to cell func-
tions. We have already seen that Ca 2 + can trigger presynaptic neurotrans-
mitter release. Postsynaptically, Ca2+ can also activate many enzymes, reg-
ulate the opening of a variety of channels, and affect gene expression; in
excessive amounts, Ca2+ can even trigger the death of a cell (Box 6.4).
Thus, activation of NMDA receptors can, in principle, cause widespread and
lasting changes in the postsynaptic neuron. Indeed, as we wHl see in Chap-
ter 25, Ca H entry through NMDA-gated channels may cause the changes
that lead to long-term memory.
When the NMDA-gated channel opens, Ca2+ and Na+ enter the cell (and
K+ leaves), but the magnitude of this inward ionic current depends on the
postsynaptic membrane potential in an unusual way, for an unusual rea-
son. When glutamate binds to the NMDA receptor, the pore opens as usual.
However, at normal negative resting membrane potentials, the channel
becomes clogged by Mg H ions, and the Umagnesium block u prevents other
ions from passing freely through the NMDA channel. Mg H pops out of the
pore only when the membrane is depolarize<l which usually follows the
activation of AMPA channels at the same and neighboring synapses. Thus,
inward ionic current through the NMDA channel is voltage dependent, in
addition to being transmitter gated. Both glutamate and depolarization
must coincide before the channel will pass current (Figure 6.21). This
T TRANSMITTER-GATED CHANNELS 155
....
Postsynaptic
dendrite
"
Rero'dVm
EPSP
2
6
8
4
Time from presynaptic action potential (msec)
V m =-65mV
V m =-30mV
Glutamate
Mg 2 +
Ca 2 +
N
M:2+
I r
1'1111
} 1
,)\.
NMDA
receptor
(a) Glutamate
(b) Glutamate and
depolarization
FIGURE 6.2 i
Inward ionic current through the
NMDA-gated channel. (a) Glutamate
alone causes the channel to open, but at
the resting membrane potential, the pore
becomes blocked by Mg2+ ions. (b) Depolar-
ization of the membrane relieves the Mg2+
block and allows Na+ and Ca2+ to enter.
156 C HAP T E R 6 . NEUROTRANSMITTER SYSTEMS
Box 6.4
... , .
I.
OF SPECIAL INTEREST
"
The Brain's Exciting Poisons
Neurons of the brain do not regenerate, so each dead
neuron is one less we have for thinking. One of the fas-
cinating ironies of neuronal life and death is that gluta-
mate. the most essential neurotransmitter in the brain. is
also one of the biggest killers of neurons. A large per-
centage of the brain's synapses releases glutamate, which
is stored in large quantities. Even the cytosol of nonglu-
tamatergic neurons has a very high glutamate concentra-
tion, greater than 3 mM. An ominous observation is that
when you apply this same amount of glutamate to the
outside of isolated neurons, they die within minutes.
The voracious metabolic rate of the brain demands a
continuous supply of oxygen and glucose. If blood flow
ceases, as in cardiac arrest. neural activity will stop within
seconds, and permanent damage will result within a few
minutes. Disease states such as cardiac arrest, stroke,
brain trauma, seizures, and oxygen deficiency can initiate
a vicious cycle of excess glutamate release. Whenever
neurons cannot generate enough ATP to keep their ion
pumps working hard, membranes depolarize, and Ca H
leaks into cells. The entry of Ca H triggers the synaptic
release of glutamate. Glutamate further depolarizes neurons,
which further raises intracellular Ca 2 + and causes still
more glutamate to be released. At this point. there may
even be a reversal of the glutamate transporter, further
contributing to the cellular leakage of glutamate.
When glutamate reaches high concentrations, it kills
neurons by overexciting them, a process called excitotoxi-
city. Glutamate simply activates its several types of recep-
tors, which allow excessive amounts of Na+, K+. and
Ca H to flow across the membrane. The NMDA subtype
of the glutamate-gated channel is a critical player in exci-
totoxicity, because it is the main route for Ca 2 + entry.
Neuron damage or death occurs because of swelling
resulting from water uptake and stimulation by Ca 2 + of
intracellular enzymes that degrade proteins, lipids, and
nucleic acids. Neurons literally digest themselves.
Excitotoxicity has been implicated in several progressive
neurodegenerative human diseases such as amyotrophic lat-
eral sclerosis (ALS, also known as Lou Gehrig's disease), in
which spinal motor neurons slowly die, and Alzheimer's dis-
ease, in which brain neurons slowly die. The effects of var-
ious environmental toxins mimic aspects of these diseases.
Eating large quantities of a certain type of chickpea can
cause lathyrism, a degeneration of motor neurons. The pea
contains an excitotoxin called l3-oxalylaminoaJanine, which
activates glutamate receptors. A toxin called domoic acid.
found in contaminated mussels. is also a glutamate recep-
tor agonist. Ingesting small amounts of domoic acid causes
seizures and brain damage.And another plant excitotoxin,
l3-methylaminoalanine, may cause a hideous condition that
combines signs of ALS, Alzheimer's disease, and Parkinson's
disease in individual patients on the island of Guam.
As researchers sort out the tangled web of excitotox-
ins, receptors, enzymes, and neurological disease, new
strategies for treatment emerge. Already, glutamate re-
ceptor antagonists that can obstruct these excitotoxic
cascades and minimize neuronal suicide show clinical
promise. Genetic manipulations may eventually thwart
neurodegenerative conditions in susceptible people.
property has a significant impact on synaptic integration at many locations
in the CNS.
GABA-Gated and Glycine-Gated Channels. GABA mediates most
synaptic inhibition in the CNS, and glycine mediates most of the rest. Both
the GABA A receptor and the glycine receptor gate a chloride channel. Sur-
prisingly, inhibitory GABA A and glycine receptors have a structure very
similar to that of excitatory nicotinic ACh receptors, despite the fact that
the first two are selective for anions while the last is selective for cations.
Each receptor has a subunits that bind the transmitter and 13 subunits that
do not.
Synaptic inhibition must be tightly regulated in the brain. Too much
causes a loss of consciousness and coma; too little leads to a seizure. The need
to control inhibition may explain why the GABA A receptor has, in addition
to its GAB A binding site. several other sites where chemicals can dramati-
cally modulate its function. For example. two classes of drugs, benzodi-
azepines (such as the tranquilizer diazepam. or Valium) and barbiturates
G-PROTEIN-COUPLED RECEPTORS AND EFFECTORS 157
(including phenobarbital and other sedatives and anticonvulsants), each
bind to their own distinct site on the outside face of the GABA A channel
(Figure 6.22). By themselves, these drugs do very little to the channel. But
when GABA is present, benzodiazepines increase the frequency of channel
openings, while barbiturates increase the duration of channel openings.
The result in each case is more inhibitory CI current, stronger IPSPs, and
the behavioral consequences of enhanced inhibition. The actions of benzo-
diazepines and barbiturates are selective for the GABA A receptor, and the
drugs have no effect on glycine receptor function. Some of this selectivity
can be understood in molecular terms; only receptors with the 'Y type of
GABA A subunit, in addition to a and 13 subunits, respond to benzodi-
azepines.
Another popular drug that strongly enhances the function of the GABA A
receptor is ethanol, the form of alcohol imbibed in beverages. Ethanol has
complex actions that include effects on NMDA, glycine, nicotinic ACh, and
serotonin receptors. its effects on GABA A channels depend on their specific
structure. Evidence indicates that particular a, 13, and 'Y subunits are nec-
essary for constructing an ethanol-sensitive GABA A receptor, similar to the
structure that is benzodiazepine sensitive. This explains why ethanol en-
hances inhibition in some brain areas but not others. By understanding this
molecular and anatomical specificity, we can begin to appreciate how drugs
like ethanol lead to such powerful, and addictive, effects on behavior.
These myriad drug effects present an interesting paradox. Surely the
GABA A receptor did not evolve modulatory binding sites just for the ben-
efit of our modern drugs. The paradox has motivated researchers to search
for endogenous ligands, natural chemicals that might bind to benzodi-
azepine and barbiturate sites and serve as regulators of inhibition. Sub-
stantial evidence indicates that natural benzodiazepine-like ligands exist,
although identifying them and understanding their functions are proving
difficult. Other good candidates as natural modulators of GABA A receptors
are the neurosteroids, natural metabolites of steroid hormones that are syn-
thesized from cholesterol primarily in the gonads and adrenal glands, but
also in glial cells of the brain. Some neurosteroids enhance inhibitory func-
tion while others suppress it, and they seem to do so by binding to their
own site on the GABA A receptor (see Figure 6.22), distinct from those of
the other drugs we've mentioned. The functions of natural neurosteroids
are also obscure, but they suggest a means by which brain and body phys-
iology could be regulated in parallel by the same chemicals.
... G-PROTEIN-COUPLED RECEPTORS
AND EFFECTORS
There are multiple subtypes of G-protein-coupled receptors in every known
neurotransmitter system. In Chapter 5, we learned that transmission at
these receptors involves three steps: (1) binding of the neurotransmitter
to the receptor protein, (2) activation of G-proteins, and (3) activation of
effector systems. Let's focus on each of these steps.
The Basic Structure of G-Protein-Coupled Receptors
Most G-protein-coupled receptors are simple variations on a common plan,
consisting of a single polypeptide containing seven membrane-spanning
alpha helices (Figure 6.23). Two of the extracellular loops of the polypep-
tide form the transmitter binding sites. Structural variations in this region
determine which neurotransmitters, agonists, and antagonists bind to the
receptor. Two of the intracellular loops can bind to and activate G-proteins.
GABA
B J
. .:JIIIr\
Ethanol \ - {
J J. ..J.
, Jr!
/
Barbiturate
,,7
steroidS
I
'J1lii I )i'
U,HII I 'I'I
JI::X:Y" -,- J:D -
GABA-gated CI- channel
(GABA A receptor)
FIGURE 6.22
The binding of drugs to the GABA A
receptor. The drugs by themselves do not
open the channel, but they change the effect
that GABA has when it binds to the channel
at the same time as the drug.
158 C HAP T E R 6 . NEUROTRANSMITTER SYSTEMS
Neurotransmitter
Neurotransmitter binding site
G-protein-coupled
receptor
Extracellular
side
I {j--Y"r'('{YY'
ICC/IiAlln
tj )'! ,- U I
Intracellular
side
G-p ;o tein
FIGURE 6.23
The basic structure of a G-protein-coupled receptor. Most metabotropic receptors
have seven membrane-spanning alpha helices, a transmitter binding site on the extracellular
side, and a G-protein binding site on the intracellular side.
Structural variations here determine which G-proteins and, consequently,
which effector systems are activated in response to transmitter binding.
A partial list of G-protein-coupled receprors appears i.n Table 6.2. About
100 such receptors have been described. Most of these were unknown
about 15 years ago, before the powerful methods of molecular neurobiol-
ogy were appJied to the problem.
The Ubiquitous G-Proteins
G-proteins are the common link in most signaling pathways that start with
a neurotransmitter receptor and end with effector proteins. G-protein is
short for guanosine triphosphate (GTP) binding protein, which is actually
a diverse family of about 20 types. There are many more transmitter re-
ceptors than G-proteins, so some types of G-proteins can be activated by
many receptors.
G-proteins all have the same basic mode of operation (Figure 6.24):
1. Each G-protein has three subunits, termed a, 13, and 'Y. In the resting
state, a guanosine diphosphate (GDP) molecule is bound to the G"
Table 6.2 Some G-Protein-Coupled
Neurotransmitter Receptors
NEUROTRANSMITTER RECEPTOR(S)
Acetylcholine (ACh)
Glutamate (Glu)
GABA
Serotonin (5-HT)
Dopamine (DA)
Norepinephrine (NE)
Enkephalin
Cannabinoid
ATP
Muscarinic receptors (M ,. M 2 . M3. M 4 . M5)
Metabotropic glutamate receptors (mGluRI-8)
GABABR I. GABA B R2
5-HT I (A. B. C. Do:. DI3. E. F) 5-HT 2. 2F. 5-HT 4. 5-HT 50:.513
DI A . B. 02. 03. 04
a" (X2. 13 (, 132. 133
1J.8.K
CBI. CB2
A I. A2a. A2b. A3. P2y. P2z. P2t. P2u
Effector
protein 2
:p.,"dv n ::\)) ?QJ T):' Vl
I Illn,W..Hn I nnn'o'i, "'j"111
J!! ,' " "'''''*I: I IIU11," I ' I'I JI '1U. " J. J 'I, \
'. ..')')..')" J.} CfY
r
/ I'
G-protein
(a)
'Y G-PROTEIN-COUPLED RECEPTORS AND EFFECTORS 159
_ G-protein-coupled
receptor
1() ..!'-.'.:._." ;D;;'<? .
, , m brane t' ' " Ii I
')')) '):"i5551IY ..1
/
Effector
protein 1
Transmitter Q..
Effector .,
protein 2 \..
:yy,\ J') ..,J j _. .. """""'XA)'):)\
m . 1 I" T, IfI1tntntn n'n I""'-I 1 I I
. " .,. :'\'\. I ,,H,' 1»..1':" d
L
III ntflIntt'n..; Wntflfrtl!tll...
"''11', '''8''''' '' ".:'
2.GTP
Activated Go binds GTP I' V'-
(b)
I II III' II- ""'r II ; I ?II'I0'J
1 1 'f.,'b!/ 1
J
,III I IIIIII"JII"'III
, l%ill.I J 1\sJ(
"'l N , I
.--
GfI"{ -stimulated
effector protein
-- /
G a (GTP)-stimulated
effector protein
(c)
k
,, :J
...
,
.. " I ....... Wl
Ii
:: ... utl...
..,
(d)
.
+ P0 4
subunit and the whole complex floats around on the inner surface of
the membrane.
2. If this GDP-bound G-protein bumps into the proper type of receptor and if
that receptor has a transmitter molecule bound to it then the G-protein re-
leases its GDP and exchanges it for a GTP that it picks up from the cytosol.
3. The activated GTP-bound G-protein splits into two parts: the Go subunit
plus GTp, and the G 13 )' complex. Both can then move on to influence var-
ious effector proteins.
4. The Go subunit is itself an enzyme that eventually breaks down GTP into
GDP. Therefore, G" eventually terminates its own activity by converting
the bound GTP to GDP.
FIGURE 6.24
The basic mode of operation of
G-proteins. (a) In its Inactive state, the
a subunit of the G-protein binds GDP
(b) When activated by a G-protein-coupled
receptor, the GDP is exchanged for GTP
(c) The activated G-protein splits, and both
the Go (GTP) subunit and the G 13 'Y subunit
become available to activate effector proteins,
(d) The Go subunit slowly removes phosphate
(P0 4 ) from GTP. converting GTP to GDP and
terminating its own activity.
160 C HAP T E R 6 . NEUROTRANSMITTER SYSTEMS
5. The Go and G(3)' subunits come back together, allowing the cycle to be-
gin again.
The first G-proteins that were discovered had the effect of stimulating
effector proteins. Subsequently, it was found that other G-proteins could
inhibit these same effectors. Thus, the simplest scheme for subdividing the
G-proteins is G s , designating that the G-protein is stimulatory, and G j , des-
ignating that the G-protein is inhibitory.
G-Protein-Coupled Effector Systems
In Chapter 5, we learned that activated G-proteins exert their effects by
binding to either of two types of effector proteins: G-protein-gated ion
channels and G-protein-activated enzymes. Because the effects do not in-
volve any other chemical intermediaries, the first route is sometimes caHed
the shortcut pathway.
The Shortcut Pathway. A variety of neurotransmitters use the shortcut
pathway, from receptor to G-protein to ion channel. One example is the
muscarinic receptors in the heart. These ACh receptors are coupled via
G-proteins to potassium channels, explaining why ACh slows the heart
rate (Figure 6.25). In this case, the 131' subunits migrate laterally along the
membrane until they bind to the right type of potassium channel. Another
example is neuronal GABAB receptors, also coupled by the shortcut path-
way to potassium channels.
Shortcut pathways are the fastest of the G-protein-coupled systems,
having responses beginning within 30-100 msec of neurotransmitter
binding. Although not quite as fast as a transmitter-gated channel. which
uses no intermediary between receptor and channel, this is faster than the
Potassium channel
(closed)
\
Muscarinic J
receptor {/ ACh
, Wii??-!'J"r'-P' "
' ').., I '.l)" ¥ I J I, ,;!, ' ,J!, ')J!.I
G-protein
"
r .
(a)
Potassium channel
(open) ACh
\ I
<V , ' 1 ,
)II :. II _,, ..I'Jf." r!". U lie. "r.
0(
..
.
I
(b)
FIGURE 6.25
The shortcut pathway. (a) G-proteins in heart muscle are activated by ACh binding to
muscarinic receptors. (b) The activated G 13 "y subunit directly gates a potassium channel.
... G-PROTEIN-COUPLED RECEPTORS AND EFFECTORS 161
Receptor f Neurotransmitter Membrane-bound
f '0 / enzyme
--v
J
I, J.A . ,- , M -! v V' U,J jJ, VJV)- J,J '-VJ.1J.,'--} I
I' J' 111'1 11 ,'t?,W"111111 'II ;/Y,IIIIIII,I,!'I,I, f'11 . 'I'H
1.»1 1 v 1 t 11 L>1.1t.1u. 1,1, ,t 1! I 1 I I. 1,1 ) I I" I I
J.- ' ( k...LCU-.AY) J I r I) J: I. J) f
.-/ '
G
(
/
G-protein
'>GTP .......
J','y;. .
ft'
Intermediate
chemical
reactions
Activation
of downstream
enzyme
second messenger cascades we describe next. The shortcut pathway is also
very localized compared with other effector systems. As the G-protein dif-
fuses within the membrane, it apparently cannot move very far, so only
channels nearby can be affected.
Second Messenger Cascades. G-proteins can also exert their effects by
directly activating certain enzymes. Activation of these enzymes can trigger
an elaborate series of biochemical reactions, a cascade that often ends in
the activation of other "downstream" enzymes that alter neuronal function.
Between the first enzyme and the last are several second messengers. The
whole process that couples the neurotransmitter, via multiple steps, to ac-
tivation of a downstream enzyme is caJled a second messenger cascade
(Figure 6.26).
In Chapter 5, we introduced the cAMP second messenger cascade initi-
ated by the activation of the NE r3 receptor (Figure 6.27a). It begins with
FIGURE 6.26
The components of a second messen-
ger cascade.
NE
'0
,,,J
J
j\
Stimulatory
receptor
/
Adenylyl
cyclase
,x
I
=--ar
, ,
.. -.. ... .O...:-LJ.X)...
.
.
J J,J./!' J J' ,','
U J ' J J J ,J,J oJ J. . I i J.
o . (
J J J J J J J J J J J J J.J J J. J J J
)0
o
/
Stimulatory
G-protein
(G s )
t Z
S
Lf/f
,
-
+0
(a)
Protein
kinase A
FIGURE 6.27
The stimulation and inhibition of adenylyl cyclase by different G-proteins.
(a) Binding of NE to the () receptor activates G s , which in turn activates adenylyl cyclase.
Adenylyl cyclase generates cAMP. which activates the downstream enzyme protein kinase A.
(b) Binding of NE to the al receptor activates G i . which inhibits adenylyl cyclase.
. .-
/NE
Inhibitory 0
a2 receptor I
.., ':>T-Y'
, ,
J I J ' I JJ.JJJ.J
.
(
s'GTP<..
'Mr'
f"t.
\
Inhibitory
G-protein
(Gi)
(b)
162 C HAP T E R 6 . NEUROTRANSMITTER SYSTEMS
G-protein-coupled Neuronal
receptor membrane
)J7,' T;)J ""'" JJf '}--' }nJn»-. -vY' <;:' D--VV}-:L"'-Y- 7 "V
1'1'111111"11111111 II 1111 n"lllill 1"111111111. I111I 111'1''1'1113 II II'
111.11.1' ',I!IIIV.......'.....'. , _ ."1 I " "; .1111' 1 I.. II.
m'{-lw S(@ 'YYYYY'tfY)
CD PIP 2 PLC 0............ DAG
.. IP 3 '-",
GT 0 n
. "",
Activated ,, .!-', Ilj.....'c.
-,, \ 'h
G-protein ,\ ,f f " +
, - , : / /, ='-\
Smooth ER , ,'. .,"'. Ca 2 + . .)
r\ '0
Neurotransmitter
, ".-qnY r"t
111II I II A V
I I JW-b.
FIGURE 6.28
Second messengers generated by the
breakdown of PIP 2 , a membrane phos-
pholipid. Q) Activated G-proteins stimulate
the enzyme phospholipase C (PLC). @ PLC
splits PIP 2 into DAG and IP 3 . <ID DAG stimu-
lates the downstream enzyme protein kinase
C (PKC). @ IP 3 stimulates the release of Ca2+
from intracellular stores. The Ca2+ can go on
to stimulate various downstream enzymes.
'}7 ,
1lJ:)}#A
PKC
the 13 receptor activating the stimulatory G-protein, G s , which proceeds to
stimulate the membrane-bound enzyme adenylyl cyclase. Adenylyl cyclase
converts ATP to cAMP. The subsequent rise of cAMP in the cytosol aaivates
a specific downstream enzyme called protein kinase A (PKA).
Many biochemical processes are regulated with a push-pull method, one
to stimulate them and one to inhibit them, and cAMP production is no ex-
ception. The activation of a second type of NE receptor, called the a2 re-
ceptor, leads to the aaivation of G j (the inhibitory G-protein). G j suppresses
the activity of adenylyl cyclase, and this effect can take precedence over the
stimulatory system (Figure 6.27b).
Some messenger cascades can branch. Figure 6.28 shows how the acti-
vation of various G-proteins can stimulate phospholipase C (PLC) , an
enzyme that floats in the membrane-like adenylyl cyclase. PLC acts on a
membrane phospholipid (PIP 2 , or phosphatidylinositol-4,5-bisphosphate),
splitting it to form two molecules that serve as second messengers: diacyl-
glycerol (DAG) and inositol-I,4,5-triphosphate (IP}). DAG. which is
lipid-soluble, stays within the plane of the membrane where it activates a
downstream enzyme, protein kinase C (PKC). At the same time, the wa-
ter-soluble IP 3 diffuses away in the cytosol and binds to specific receptors
on the smooth ER and other membrane-enclosed organelles in the cell.
These receptors are IPrgated calcium channels, so IP 3 causes the organelles
to discharge their stores of Ca H . As we have said, elevations in cytosolic
Ca H can trigger widespread and long-lasting effeas. One effea is activation
of the enzyme calcimn-cahnodulin-dependent protein kinase, or CaMK.
CaMK is an enzyme implicated in, among other things, the molecular
mechanisms of memory (see Chapter 25).
Phosphorylation and Dephosphorylation. The preceding examples
show that key downstream enzymes in many of the second messenger
cascades are protein kinases (PKA, PKC, CaMK). As mentioned in Chapter
5, protein kinases transfer phosphate from ATP floating in the cytosol to
proteins, a reaaion called phosphorylation. The addition of phosphate groups
to a protein changes its conformation slightly, thereby changing its biolog-
ical activity. The phosphorylation of ion channels, for example, can strongly
influence the probability that they will open or close.
Consider the consequence of activating the 13 type of NE receptors on
cardiac muscle cells. The subsequent rise in cAMP activates PKA, which
phosphorylates the cell's voltage-gated calcium channels, and this enhances
their activity. More Ca H flows, and the heart beats more strongly. By con-
trast, the stimulation of 13-adrenergic receptors in many neurons seems to
... G-PROTEIN-COUPLED RECEPTORS AND EFFECTORS 163
have no effect on calcium channels, but instead causes inhibition of certain
potassium channels. Reduced K+ conductance causes a slight depolariza-
tion, increases the length constant, and makes the neuron more excitable
(see Chapter 5).
If transmitter-stimulated kinases were allowed to phosphorylate without
some method of reversing the process, all proteins would quickly become
saturated with phosphates, and further regulation would become impossi-
ble. Enzymes called protein phosphatases save the day, because they act
rapidly to remove phosphate groups. The degree of channel phosphorylation
at any moment therefore depends on the dynamic balance of phosphoryla-
tion by kinases and dephosphorylation by phosphatases (Figure 6.29).
The Function of Signal Cascades.. Synaptic transmission using transmitter-
gated channels is simple and fast. Transmission involving G-protein-coupled
receptors is complex and slow. What are the advantages of having such
long chains of command? One important advantage is signaL ampLiji"cation:
The activation of one G-protein-coupled receptor can lead to the activation
of not one, but many, ion channels (Figure 6.30).
Transmitter "'0
,. 'D
Transmitter
activates
receptor
(
Receptor activates
G-protein
/ Adenylyl
cyclase
cyclase
,-/
Adenylyl
cyclase
G-protein stimulates
adenylyl cyclase to
convert ATP to cAMP
An
m
An
g
c" t'J rn
.--........
cAMP activates
protein kinase A \....
PKA
PKA
1tm
J L 111\ n"nare A
phosphorylates
potassium channels
rIm
Protein
kinase
I Protein I .. I Protein a
Protein
phosphatase
FIGURE 6.29
Protein phosphorylation and dephos-
phorylation.
FIGURE 6.30
Signal amplification by G-protein-
coupled second messenger cascades.
When a transmitter activates a G-protein-
coupled receptor. there can be amplifica-
tion of the messengers at several stages
of the cascade. so that ultimately many
channels are affected.
164 C HAP T E R 6 . NEUROTRANSMITTER SYSTEMS
Signal amplification can occur at several places in the cascade. A single
neurotransmitter molecule, bound to one receptor, can activate perhaps
10-20 G-proteins; each G-protein can activate an adenylyl cyclase, which
can make many cAMP molecules that can spread to activate many kinases;
each kinase can then phosphorylate many channels. If all cascade compo-
nents were tied together in a clump, signaling would be severely limited.
The use of small messengers that can diffuse quickly (such as cAMP) also
allows signaling at a distance, over a wide stretch of cell membrane. Signal
cascades also provide many sites for further regulation, as well as interaction
between cascades. Finally, signal cascades can generate very long-lasting
chemical changes in cells, which may form the basis for, among other
things, a lifetime of memories.
.. DIVERGENCE AND CONVERGENCE
IN NEUROTRANSMITTER SYSTEMS
Glutamate is the most common excitatory neurotransmitter in the brain,
while GABA is the pervasive inhibitory neurotransmitter. But this is only
part of the story, because any single neurotransmitter can have many dif-
ferent effects. A molecule of glutamate can bind to any of several kinds of
glutamate receptors, and each of these can mediate a different effect. The
ability of one transmitter to activate more than one subtype of receptor,
and cause more than one type of postsynaptic response, is called divergence.
Divergence is the rule among neurotransmitter systems. Every known
neurotransmitter can activate multiple receptor subtypes, and evidence
indicates that the number of receptors will continue to escalate as the
powerful methods of molecular neurobiology are applied to each system.
Because of the multiple receptor subtypes, one transmitter can affect dif-
ferent neurons (or even different parts of the same neuron) in very differ-
ent ways. Divergence also occurs at points beyond the receptor level, de-
pending on which G-proteins and which effector systems are activated.
Divergence may occur at any stage in the cascade of transmitter effects
(Figure 6.31a).
Neurotransmitters can also exhibit convergence of effects. Multiple trans-
mitters, each activating their own receptor type, can converge to affect the
same effector systems (Figure 6.31b). Convergence in a single cen can occur
at the level of the G-protein, the second messenger cascade, or the type of
ion channel. Neurons integrate divergent and convergent signaling systems,
resulting in a complex map of chemical effects (Figure 6.31c). The wonder
is that it ever works; the challenge is to understand how.
.. CONCLUDING REMARKS
Neurotransmitters are the essential links between neurons, and between
neurons and other effector cells, such as muscle cells and glandular cens.
But it is important to think of transmitters as one link in a chain of events,
inciting chemical changes both fast and slow, divergent and convergent.
You can envision the many signaling pathways onto and within a single
neuron as a kind of information network. This network is in delicate bal-
ance, shifting its effects dynamically as the demands on a neuron vary with
changes in the organism's behavior.
The signaling network within a single neuron resembles in some ways
the neural networks of the brain itself. It receives a variety of inputs, in the
form of transmitters bombarding it at different times and places. These in-
puts cause an increased drive through some signal pathways and a de-
creased drive through others, and the information is recombined to yield
Transmitter
/ Receptor subtype 1 ./ Effector
/ / system X
.. Receptor subtype 2 ... Effector
systemY
Receptor subtype 3 Effector
system Z
(a)
Transmitter A
.. A receptor
Transmitter B
... B receptor .. Effector system
. C ""ep"" /
Transmitter C
(b)
Transmitter A ... A 1 receptor / Effector 1
y<:'Effector2
A 2 receptor X /Effector 3
b ....r Effector 4
Transmitter B .. B receptor Effector 5
(c)
FIGURE 6.31
Divergence and convergence in 'neurotransmitter signaling systems.
(a) Divergence. (b) Convergence, (c) Integrated divergence and convergence.
a particular output that is more than a simple summation of the inputs.
Signals regulate signals, chemical changes can leave lasting traces of their
history, drugs can shift the balance of signaling power-and, in a literal
sense, the brain and its chemicals are one.
\-
>-V1
wI:
c:::
w
......
-
Introduction
cholinergic (p. 134)
noradrenergic (p. 134)
glutamatergic (p. 134)
GABAergic (p. 134)
peptidergic (p. 134)
nicotinic ACh receptor (p. 139)
muscarinic ACh receptor
(p. 139)
AMPA receptor (p. 139)
NMDA receptor (p. 139)
kainate receptor (p. 139)
ligand-binding method (p. 141)
Studying Neurotransmitter
Systems
immunocytochemistry (p. 135)
in situ hybridization (p. 137)
autoradiography (p. 137)
microionophoresis (p. 138)
receptor subtype (p. I 38)
Neurotransmitter Chemistry
Dale's principle (p. 142)
co-transmitter (p. 142)
acetylcholine (ACh) (p. 142)
transporter (p. 142)
rate-limiting step (p. 143)
.. CONCLUDING REMARKS 165
catecholamines (p. 143)
dopamine (DA) (p. 143)
norepinephrine (NE) (p. 143)
epinephrine (adrenaline) (p. 143)
dopa (p. 143)
serotonin (5-HT) (p. 146)
serotonergic (p. 146)
glutamate (Glu) (p. 146)
glycine (Gly) (p. 146)
gamma-aminobutyric acid (GABA)
(p. 146)
endocannabinoid (p. 148)
retrograde messenger (p. 148)
nitric oxide (NO) (p. 151)
166 C HAP T E R 6 . NEUROTRANSMITTER SYSTEMS
Transmitter-Gated Channels
benzodiazepine (p. 156)
barbiturate (p. 156)
G-Protein-Coupled Receptors
and Effectors
second messenger cascade (p. 161)
protein kinase C (PKC) (p. 162)
calcium-calmodulin-dependent
protein kinase (CaMK)
(p. I 62)
protein phosphatase (p. 163)
protein kinase A (PKA) (p. 162)
phospholipase C (PLC) (p. 162)
diacylglycerol (DAG) (p. 162)
inositol-I,4,5-triphosphate (IP 3 )
(p. 162)
ctJ
.., .., .
V)
z
w
0
>
w l-
e::: V)
w
::::>
0
I. If you could place microelectrodes into both a presynaptic and a postsynapdc neuron, how would you de-
termine whether the synapse between them was chemically or electrically mediated?
2. List the criteria that are used to determine whether a chemical serves as a neurotransmitter. What are the
various experimental strategies you could use to show that ACh fulfills the criteria of a neurotransmitter at
the neuromuscular junction
3. What are three methods that could be used to show that a neurotransmitter receptor is synthesized or
localized in a particular neuron?
4. Compare and contrast the properties of (a) AMPA and NMDA receptors, and (b) GABA A and GABA B
receptors.
5. Synaptic inhibition is an important feature of the circuitry in the cerebral cortex. How would you determine
whether GABA or Gly, or both, or neither, is the inhibitory neurotransmitter of the cortex?
6. Glutamate activates a number of different metabotropic receptors. The consequence of activating one
subtype is the inhibition of cAMP formation. A consequence of activating a second subtype is octivotion of
protein kinase C. Propose mechanisms for these different effects.
7. Do convergence and divergence of neurotransmitter effects occur in single neurons?
8. CaH ions are considered to be second messengers. Why?
60.
e:::(.9
Wz
I-
1-0
e:::«
::::>w
u.e:::
Cooper JR. Bloom FE, Roth RH. 2002. The Biochemi-
cal Basis of Neuropharmacology, 8th ed. New York:
Oxford University Press.
Cowan WM. SiidhofTC, Stevens CF. 200 I. Synopses.
Baltimore: Johns Hopkins University Press.
Feldman RS. Meyer JS, Quenzer IF. 1997. Principles of
Neuropsychophormacology. Sunderland, MA: Sinauer:
Hille B. 200 I. Ion Channels of Excitoble Membranes.
Sunderland, MA: Sinauer:
Pierce KL Premont RT, Lefkowitz RJ. 2002. Seven-
transmembrane receptors. Noture Reviews Molecu-
lor ond Cell Biology 3:639-650.
Piomelli D. 2003. The molecular logic of en do-
cannabinoid signalling. Noture Reviews Neuroscience
4:873-884.
Wilson RI, Nicoll RA. 2002. Endocannabinoid signal-
ing in the brain. Science 296:678-682.
Wollmuth Lp, Sobolevsky AI. 2004. Strucwre and
gating of the glutamate receptor ion channel.
Trends in Neurosciences 27:321-328.
The Structure of the
Nervous System
INTRODUCTION
GROSS ORGANIZATION OF THE MAMMALIAN NERVOUS SYSTEM
ANATOMICAL REFERENCES
THE CENTRAL NERVOUS SYSTEM
The Cerebrum
The Cerebellum
The Brain Stem
The Spinal Cord
THE PERIPHERAL NERVOUS SYSTEM
The Somatic PNS
The Visceral PNS
Afferent and Efferent Axons
THE CRANIAL NERVES
THE MENINGES
THE VENTRICULAR SYSTEM
. Box 7.1 Of Special Interest: Water on the Brain
IMAGING THE LIVING BRAIN
Computed Tom grophy
Magnetic Resonance Imaging
. Box 7.2 Brain Food: Magnetic Resonance Imaging
Functional Brain Imaging
. Box 7.3 Brain Food: Functional Imaging of Brain Activity: PET and fMRI
UNDERSTANDING CNS STRUCTURE THROUGH DEVELOPMENT
FORMATION OF THE NEURAL TUBE
. Box 7.4 Of Special Interest: Nutrition and the Neural Tube
THREE PRIMARY BRAIN VESICLES
DIFFERENTIATION OF THE FOREBRAIN
Differentiation of the Telencephalon and Diencephalon
Forebrain Structure-Function Relationships
DIFFERENTIATION OF THE MIDBRAIN
Midbrain Structure-Function Relationships
DIFFERENTIATION OF THE HINDBRAIN
Hindbrain Structure-Function Relationships
DIFFERENTIATION OF THE SPINAL CORD
Spinal Cord Structure-Function Relationships
PUTTING THE PIECES TOGETHER
SPECIAL FEATURES OF THE HUMAN CNS
A GUIDE TO THE CEREBRAL CORTEX
TYPES Of CEREBRAL CORTEX
AREAS OF NEOCORTEX
Neocortical Evolution and Structure-Function Relationships
. Box 7.5 Path of Discovery: Evolution of My Brain. by Leah A. Krubitzer
CONCLUDING REMARKS
APPENDIX:AN ILLUSTRATED GUIDE TO HUMAN NEUROANATOMY
CHAPTER
'"
168 C HAP T E R 7 . THE STRUCTURE OFTHE NERVOUS SYSTEM
'Y INTRODUCTION
In previous chapters, we saw how individual neurons function and com-
municate. Now we are ready to assemble them into a nervous system that
sees, hears, feels, moves, remembers, and dreams. Just as an understand-
ing of neuronal structure is necessary for understanding neuronal function,
we must understand nervous system structure in order to understand brain
function.
Neuroanatomy has challenged generations of students-and for good
reason: The human brain is extremely complicated. However, our brain is
merely a variation on a plan that is common to the brains of all mammals
(Figure 7.1). The human brain appears complicated because it is distorted
as a result of the selective growth of some parts within the confines of the
skull. But once the basic mammalian plan is understood, these specializa-
tions of the human brain become transparent.
We begin by introducing the general organization of the mammalian
brain and the terms used to describe it. Then we take a look at how the
three-dimensional structure of the brain arises during embryological and
fetal development. Following the course of development makes it easier to
understand how the parts of the adult brain fit together. Finally, we explore
the cerebral neocortex, a structure that is unique to mammals and pro-
portionately the largest in humans. An Illustrated Guide to Human
Neuroanatomy follows the chapter as an appendix.
The neuroanatomy presented in this chapter provides the canvas on which
we will paint the sensory and motor systems in Chapters 8-14. Because you
will encounter a lot of new terms, self-quizzes within the chapter provide
an opportunity for review.
'Y GROSS ORGANIZATION OF
THE MAMMALIAN NERVOUS SYSTEM
The nervous system of all mammals has two divisions: the central nervous
system (CNS) and the peripheral nervous system (PNS). In this section, we
identify some of the important components of the CNS and the PNS. We
also discuss the membranes that surround the brain and the fluid-filled
ventricles within the brain. We then explore some new methods of examin-
ing the structure of the living brain. But first, we need to review some
anatomical terminology.
Anatomical References
Getting to know your way around the brain is like getting to know your
way around a city. To describe your location in the city, you would use
points of reference such as north, south, east, and west, up and down. The
same is true for the brain, except that the terms-called anatomical refer-
ences-are different.
Consider the nervous system of a rat (Figure 7.2a). We begin with the
rat because it is a simplified version that has all the general features of
mammalian nervous system organization. In the head lies the brain, and
the spinal cord runs down inside the backbone toward the tail. The direc-
tion, or anatomical reference, poinring toward the rat's nose is known as
anterior or rostral (from the Latin for "beak"). The direction pointing
toward the rat's tail is posterior or caudal (from the Latin for "taW). The
direction pointing up is dorsal (from the Latin for "back"), and the direc-
tion pointing down is ventral (from the Latin for "belly"). Thus, the rat
1 em
Rat
Rabbit
",
Cat
.
10-
Sheep
Dolphin
...
.......
,
Chimpanzee
--i7L.J
.\ ' 1IJJli2' .
..
Human
Human
..r-
r->':'
.<r:'" ,-,
\.-
--
A'
..-.:., .
\
J
\...;.
Dolphin
Y GROSS ORGANIZATION OF THE MAMMALIAN NERVOUS SYSTEM 169
Rat
"
........
....... ""-.: . -......
A _ .......
" .. .. p 1 t. , ,.
... . . L-\A
!.-.;
6 ' J. '1\
f -
.,... "
/
.....
\,:11 J
-
Rabbit
'-
Cat
Sheep
--.
....
---. .
-i-
---....
" ,
,,\
"\
\
\
l' \),-
\...
,
.
..
,
..
""-
FIGURE 7.1
Mammalian brains. Despite differences in complexity, the brains of all these species have
many features in common. The brains have been drawn to appear approximately the same size:
their relative sizes are shown in the inset on the left.
"
......
Chimpanzee
-
.. '-.
,
..
\
\.
.....
170 C HAP T E R 7 . THE STRUCTURE OF THE NERVOUS SYSTEM
Brain
Anterior \
or rostral
Spinal
cord
t
Dorsal
\
--- --------------- -------
--
(a)
Ventral
FIGURE 7.2
Basic anatomical references in the
nervous system of a rat. (a) Side view.
(b) Top view.
caudal
----------=== .....
""'" -----
Rostral
(a) Midsagit1al
(b) Horizontal
}'
(c) Coronal
""-
FIGURE 7.3
Anatomical planes of section.
Brain
Spinal
cord
Lateral
t
t
, \ Medial
--- ------ ---.----
Posterior
or caudal
Midline
/
-
-------
--;---
...
(b)
spinal cord runs anterior to posterior. The top side of the spinal cord is the
dorsal side, and the bottom side is the ventral side.
If we look down on the nervous system, we see that it may be divided
into two equal halves (Figure 7.2b). The right side of the brain and spinal
cord is the mirror image of the left side. This characteristic is known as
bilateral symmetry. With just a few exceptions, most structures within the
nervous system come in pairs, one on the right side and the other on the
left. The invisible line running down the middle of the nervous system is
called the midline, and this gives us another way to describe anatomical
references. Structures closer to the midline are medial; structures farther
away from the midline are lateral. [n other words, the nose is medial to
the eyes, the eyes are medial to the ears, and so on. In addition, two struc-
tures that are on the same side are said to be ipsilateral to each other; for
example, the right ear is ipsilateral to the right eye. If the structures are on
opposite sides of the midline, they are said to be contralateral to each
other; the right ear is contralateral to the left ear.
To view the internal structure of the brain, it is usually necessary to slice
it up. In the language of anatomists, a slice is called a section; to slice is to
section. Although one could imagine an infinite number of ways we might
cut into the brain, the standard approach is to make cuts parallel to one of
the three anatomical planes of section. The plane of the section resulting from
splitting the brain into equal right and left halves is called the midsagittal
plane (Figure 7.3a). Sections parallel to the midsagittal plane are in the
sagittal plane.
The two other anatomical planes are perpendicular to the sagittal plane and
to one another. The horizontal plane is parallel to the ground (Figure
7.3b). A single section in this plane could pass through both the eyes and
the ears. Thus, horizontal sections split the brain into dorsal and ventral
parts. The coronal plane is perpendicular to the ground and to the sagit-
tal plane (Figure 7.3c). A single section in this plane could pass through
both eyes or both ears, but not through all four at the same time. Thus, the
coronal plane splits the brain into anterior and posterior parts.
'Y SELF-QUIZ
Take a few moments right now and be sure you understand the meaning
of these terms:
anterior ventral contralateral
rostral midline midsagittal plane
posterior medial sagittal plane
caudal lateral horizontal plane
dorsal ipsilateral coronal plane
'Y GROSS ORGANIZATION OF THE MAMMALIAN NERVOUS SYSTEM 171
The Central Nervous System
The central nervous system (CNS) consists of the parts of the nervous
system that are encased in bone: the brain and the spinal cord. The brain
lies entirely within the skull. A side view of the rat brain reveals three parts
that are common to all mammals: the cerebrum, the cerebellum, and the
brain stem (Figure 7.4a).
The Cerebrum. The rostral-most and largest part of the brain is the
cerebrum. Figure 7.4b shows the rat cerebrum as it appears when viewed
from above. Notice that it is clearly split down the middle into two cere-
bral hemispheres, separated by the deep sagittaL fissure. In general, the
right cerebral hemisphere receives sensations from, and controls move-
ments of, the Left side of the body. Similarly, the Left cerebral hemisphere is
concerned with sensations and movements on the right side of the body.
The Cerebellum. Lying behind the cerebrum is the cerebellum (the word
is derived from the Latin for "little brain"). While the cerebellum is in fact
dwarfed by the large cerebrum, it actually contains as many neurons as both
cerebral hemispheres combined. The cerebellum is primarily a movement
control center that has extensive connections with the cerebrum and the
spinal cord. In contrast to the cerebral hemispheres, the left side of the cere-
bellum is concerned with movements of the left side of the body, and the
right side of the cerebellum is concerned with movements of the right side.
The Brain Stem. The remaining part of the brain is the brain stem, best
observed in a midsagittal view of the brain (Figure 7 .4c). The brain stem
forms the stalk from which the cerebral hemispheres and the cerebellum
sprout. The brain stem is a complex nexus of fibers and cells that in part
serves to relay information from the cerebrum to the spinal cord and
cerebellum, and vice versa. However, the brain stem is also the site where
vital functions are regulated, such as breathing, consciousness, and the
control of body temperature. Indeed, while the brain stem is considered the
most primitive part of the mammalian brain, it is also the most important
to life. One can survive damage to the cerebrum and cerebellum, but
damage to the brain stem usually means rapid death.
The Spinal Cord. The spinal cord is encased in the bony vertebral column
and is attached to the brain stem. The spinal cord is the major, conduit of
Side (lateral)
view:
Midsagittal
view:
"'"
/\'"
Cerebellum . Spinal
\ / t ; / cord
RighI cerebral "t-
hemisphere
(c)
(a)
/
Cerebrum
'--------y--l
Brain stem
Top (dorsal)
view:
\
(b)
/
Left cerebral
hemisphere
Sagittal
fissure
FIGURE 7.4
The brain of a rat. (a) Side (lateral) view.
(b) Top (dorsal) view. (c) Midsagittal view.
172 C HAP T E R 7 . THE STRUCTURE OF THE NERVOUS SYSTEM
Dorsal
roots
--
Dorsal
root
ganglia
'\
/
'
· \! 'n"
nerves
Ventral
roots
FIGURE 7.5
The spinal cord. The spinal cord runs inside the vertebral column. Axons enter and exit
the spinal cord via the dorsal and ventral roots, respectively. These roots come together to
form the spinal nerves that course through the body.
information from the skin, joints, and muscles of the body to the brain, and
vice versa. A transection of the spinal cord results in anesthesia (lack of
feeling) in the skin and paralysis of the muscles in parts of the body caudal
to the cut. Paralysis in this case does not mean that the muscles cannot
function but that they cannot be controlled by the brain.
The spinal cord communicates with the body via the spinal nerves,
which are part of the peripheral nervous system (discussed below). Spinal
nerves exit the spinal cord through notches between each vertebra of the
vertebral column. Each spinal nerve attaches to the spinal cord by means
of two branches, the dorsal root and the ventral root (Figure 7.5). Recall
from Chapter 1 that Franc;ois Magendie showed that the dorsal root con-
tains axons bringing information into the spinal cord, such as those that
signal the accidental entry of a thumbtack into your foot (see Figure 3.1).
Charles Bell showed that the ventral root contains axons carrying infor-
mation away from the spinal cord-for example, to the muscles that jerk
your foot away in response to the pain of the thumbtack.
The Peripheral Nervous System
All the parts of the nervous system other than the brain and spinal cord
comprise the peripheral nervous system (PNS). The PNS has two parts:
the somatic PNS and the visceral PNS.
The Somatic PNS. All the spinal nerves that innervate the skin, the joints,
and the muscles that are under voluntary control are part of the somatic
PNS. The somatic motor axons, which command muscle contraction, de-
rive from motor neurons in the ventral spinal cord. The cell bodies of the
motor neurons lie within the CNS, but their axons are mostly in the PNS.
The somatic sensory axons, which innervate and collect information
from the skin, muscles, and joints, enter the spinal cord via the dorsal roots.
The cell bodies of these neurons lie outside the spinal cord in clusters called
... GROSS ORGANIZATION OFTHE MAMMALIAN NERVOUS SYSTEM 173
dorsal root ganglia. There is a dorsal root ganglion for each spinal nerve
(see Figure 7.5).
The Visceral PNS. The visceral PNS, also called the involuntary, vegeta-
tive, or autonomic nervous system (ANS), consists of the neurons that
innervate the internal organs, blood vessels, and glands. Visceral sensory
axons bring information about visceral function to the CNS, such as the
pressure and oxygen content of the blood in the arteries. Visceral motor
fibers command the contraction and relaxation of muscles that form the
walls of the intestines and the blood vessels (called smooth muscles), the
rate of cardiac muscle contraction, and the secretory function of various
glands. for example, the visceral PNS controls blood pressure by regulating
the heart rate and the diameter of the blood vessels.
We will return to the structure and function of the ANS in Chapter 15.
for now, remember that when one speaks of an emotional reaction that is
beyond voluntary control-like "butterflies in the stomach" or blushing-
it usually is mediated by the visceral PNS (the ANS).
Afferent and Efferent Axons. Our discussion of the PNS is a good place
to introduce two terms that are used to describe axons in the nervous system.
Derived from the Latin, afferent ("carry to") and efferent ("carry from")
indicate whether the axons are transporting information toward or away
from a particular point. Consider the axons in the PNS relative to a point
of reference in the CNS. The somatic or visceral sensory axons bringing
information into the CNS are afferents. The axons that emerge from the CNS
to innervate the muscles and glands are efferents.
The Cranial Nerves
In addition to the nerves that arise from the spinal cord and innervate the
body, there are 12 pairs of cranial nerves that arise from the brain stem
and innervate (mostly) the head. Each cranial nerve has a name and a
number associated with it (originally numbered by Galen. about 1800 years
ago, from anterior to posterior). Some of the cranial nerves are part of the
CNS, others are part of the somatic PNS, and still others are part of the vis-
ceral PNS. Many cranial nerves contain a complex mixture ofaxons that
perform different functions. The cranial nerves and their various functions
are summarized in the chapter appendix.
The Meninges
The CNS, that part of the nervous system encased in the skull and verte-
bral column. does not come in direct contact with the overlying bone. It is
protected by three membranes collectively called the meninges (singular:
meninx), from the Greek for "covering." The three membranes are the dura
mater, the arachnoid membrane, and the pia mater (figure 7.6).
The outermost covering is the dura mater, from the Latin words meaning
"hard mother," an accurate description of the dura's leatherlike consistency.
The dura forms a tough, inelastic bag that surrounds the brain and spinal
cord. Just under the dura lies the arachnoid membrane (from the Greek
for "spider"). This meningeal layer has an appearance and a consistency
resembling a spider web. While there normally is no space between the
dura and the arachnoid, if the blood vessels passing through the dura are
ruptured, blood can collect here and form what is called a subdural hematoma.
The buildup of fluid in this subdural space can disrupt brain function by
174 C HAP T E R 7 . THE STRUCTURE OF THE NERVOUS SYSTEM
Dura mater
:'0:'"' -
r- ;
t Arachnoid /
membrane /
/\
r ..,
\
(a)
Rostral
\\
Subarachnoid
space
/
(
Caudal
Ventricles
in brain
FIGURE 7.7
The ventricular system in a rat brain.
CSF is produced in the ventricles of the
paired cerebral hemispheres and fiows
through a series of unpaired ventricles at the
core of the brain stem. CSF escapes into the
subarachnoid space via small apertures near
the base of the cerebellum. In the subarach-
noid space, CSF is absorbed into the blood.
0'
.. -.
>to.
(b)
FIGURE 7.6
The meninges. (a) The skull has been removed to show the tough outer meningeal
membrane, the dura mater. (Source: Gluhbegoric and Williams. 1980.) (b) Illustrated in cross
section, the three meningeal layers protecting the brain and spinal cord are the dura mater;
the arachnoid membrane, and the pia mater.
compressing parts of the CNS. The disorder is treated by drilling a hole in
the sku1l and draining the blood.
The pia mater, the "gentle mother," is a thin membrane that adheres
closely to the surface of the brain. Along the pia run many blood vessels
that ultimately dive into the substance of the underlying brain. The pia is
separated from the arachnoid by a fluid-filled space. This subarachnoid space
is filled with salty clear liquid called cerebrospinal fluid (CSF). Thus, in
a sense, the brain floats inside the head in this thin layer of CSF.
The Ventricular System
In Chapter 1, we noted that the brain is hollow. The fluid-filled caverns and
canals inside the brain constitute the ventricular system. The fluid that
runs in this system is CSF, the same as the fluid in the subarachnoid space.
CSF is produced by a special tissue, called the choroid plexus, in the ventri-
cles of the cerebral hemispheres. CSF flows from the paired ventricles of the
cerebrum to a series of connected, unpaired cavities at the core of the brain
stem (Figure 7.7). CSF exits the ventricular system and enters the subarach-
noid space by way of small openings, or apertures, located near where the
cerebellum attaches to the brain stem. In the subarachnoid space, CSF is
absorbed by the blood vessels at special structures called arachnoid villi. If the
normal flow of CSF is disrupted, brain damage can result (Box 7.1).
We will return to fill in some details about the ventricular system in a
moment. As we will see, understanding the organization of the ventricu-
1ar system holds the key to understanding how the mammalian brain is
organized.
Imaging the Living Brain
For centuries, anatomists have investigated the structure of the brain by
removing it from the head, sectioning it in various planes, staining the
.. GROSS ORGANIZATION OFTHE MAMMALIAN NERVOUS SYSTEM 175
Box 7.1
.... , ,.
OF SPECIAL INTEREST
....
...
4
.
Water on the Brain
If the flow of CSF from the choroid plexus through the
ventricular system to the subarachnoid space is impaired,
the fluid will back up and cause a swelling of the ven-
tricles. This condition is called hydrocephQlus. meaning
"water head:'
Occasionally, babies are born with hydrocephalus. How-
ever, because the skull is soft and not completely formed,
the head will expand in response to the increased in-
tracranial fluid, sparing the brain from damage. Often, this
condition goes unnoticed until the size of the head reaches
enormous proportions.
In adults, hydrocephalus is a much more serious situa-
tion because the skull cannot expand, and intracranial
pressure increases as a result. The soft brain tissue is
then compressed, impairing function and leading to death
if left untreated. Typically, this "obstructive" hydrocephalus
is also accompanied by severe headache. caused by the
distention of nerve endings in the meninges. Treatment
consists of inserting a tube into the swollen ventricle and
draining off the excess fluid (Figure A).
Tube inserted into '\: ")
lateral ventricle
through hole in '" " '\
skull -
J -
"
"
h
,
I
Drainage tube, - \
usually introduced
;oto ,_oem ca""Y. J . ""'" \j.
with extra length to
allow for growth of child
FIGURE A
sections, and examining the stained sections. Much has been learned by
this approach, but there are some limitations. Most obviously, the brain re-
moved from the head is dead. This, to say the least, limits the usefulness of
this method for examining the brain, and for diagnosing neurological dis-
orders, in living individuals. Neuroanatomy has been revolutionized by the
introduction of exciting new methods that enable one to produce images
of the living brain. Here we briefly introduce them.
Computed Tomography. Some types of electromagnetic radiation, like
X-rays, penetrate the body and are absorbed by various "radiopaque" tissues.
Thus, using X-ray-sensitive film, one can make two-dimensional images
of the shadows formed by the radiopaque structures within the body.
This technique works well for the bones of the skull, but not for the
brain. The brain is a complex three-dimensional volume of slight and
varying radiopacity, so little information can be gleaned from a single two-
dimensional X-ray image.
An ingenious solution, called computed tomography (CT), was developed by
Godfrey Hounsfields and Allan Cormack, who shared the Nobel Prize in
1979. The goal of CT is to generate an image of a slice of brain. (The word
tomography is derived from the Greek for "cut.") To accomplish this, an X-ray
source is rotated around the head within the plane of the desired cross sec-
tion. On the other side of the head, in the trajectory of the X-ray beam, are
sensitive electronic sensors of X-irradiation. The information about relative
radiopacity obtained with different "viewing" angles is fed to a computer
\
""
176 C HAP T E R 7 . THE STRUCTURE OF THE NERVOUS SYSTEM
that executes a mathematical algorithm on the data. The end result is a dig-
ital reconstruction of the position and amount of radiopaque material
within the plane of the slice. CT scans noninvasively revealed, (or the first
time, the gross organization of gray and white matter, and the position of
the ventricles, in the living brain.
Magnetic Resonance Imaging. While stilI used widely, CT is gradually
being replaced by a newer imaging method, called magnetic resonance imag-
ing (MRl). The advantages of MRI are that it yields a much more detailed
map of the brain than CT, it does not require X-irradiation, and images of
brain slices can be made in any plane desired. MRI uses information about
how hydrogen atoms in the brain respond to perturbations of a strong
magnetic held (Box 7.2). The electromagnetic signals emitted by the atoms
are detected by an array of sensors around the head and fed to a powerful
computer that constructs a map of the brain. The information from an MRI
scan can be used to build a strikingly detailed image of the whole brain.
Functional Brain Imaging. CT and MRI are extremely valuable for de-
tecting structural changes in the living brain, such as brain swelling after a
head injury and brain tumors. Nonetheless, much of what goes on in the
brain-healthy or diseased-is chemical and electrical in nature, and not
observable by simple inspection of the brain's anatomy. Amazingly, how-
ever, even these secrets are beginning to yield to the newest imaging
techniques.
The two "functional imaging" techniques now in widespread use are
positron emission tomography (PET) and functional magnetic resonance imaging
(fMRl). While the technical details differ, both methods detect changes in
regional blood flow and metabolism within the brain (Box 7.3). The basic
principle is simple. Neurons that are acrive demand more glucose and
oxygen. The brain vasculature responds to neural activity by directing more
blood to the active regions. Thus, by detecting changes in blood flow, PET
and (MRI reveal the regions of brain that are most active under different
circumstances.
The advent of imaging techniques has offered neuroscientists the ex-
traordinary opportunity of peering into the living, thinking brain. As you
can imagine, however, even the most sophisticated brain images are use-
less unless you know what you are looking at. Next, let's take a closer look
at how the brain is organized.
... SELF-QUIZ
Take a few moments right now, and be sure you understand the meaning
of these terms:
central nervous system (CNS)
brain
spinal cord
cerebrum
cerebral hemispheres
cerebellum
brain stem
spinal nerve
dorsal root
ventral root
peripheral nervous system (PNS)
somatic PNS
dorsal root ganglia
visceral PNS
autonomic nervous system (ANS)
afferent
efferent
cranial nerve
meninges
dura mater
arachnoid membrane
pia mater
cerebrospInal fluid (CSF)
ventricular system
Box 7.2
Y "
&:>
-.
BRAIN FOOD
T GROSS ORGANIZATION OF THE MAMMALIAN NERVOUS SYSTEM 111
Magnetic Resonance Imaging
Magnetic resonance imaging (MRI) is a general technique
that can be used for determining the amount of certain
atoms at different locations in the body. It has become an
important tool in neuroscience because it can be used
noninvasively to obtain a detailed picture of the nervous
system, particularly the brain.
In the most common form of MRI, the hydrogen atoms
are quantified-for instance, those located in water or fat
in the brain. An important fact of physics is that when a
hydrogen atom is put in a magnetic field, its nucleus (which
consists of a single proton) can exist in either of two
states: a high-energy state or a low-energy state. Because
hydrogen atoms are abundant in the brain, there are many
protons in each state.
The key to MRI is making the protons jump from one
state to the other. Energy is added to the protons by
passing an electromagnetic wave (i.e., a radio signal)
through the head while it is positioned between the poles
of a large magnet. When the radio signal is set at just the
right frequency, the protons in the low-energy state will
absorb energy from the signal and hop to the high-energy
state. The frequency at which the protons absorb energy
is called the resonant frequency (hence the name mag-
netic resonance). When the radio signal is turned off,
some of the protons fall back down to the low-energy
state, thereby emitting a radio signal of their own at a par-
ticular frequency. This signal can be picked up by a radio
receiver.The stronger the signal, the more hydrogen atoms
between the poles of the magnet.
Central sulcus
/
L/
'"
Cerebellum
FIGURE A
If we used the procedure described above, we would
simply get a measurement of the total amount of hy-
drogen in the head. However, it is possible to measure
hydrogen amounts at a fine spatial scale by taking ad-
vantage of the fact that the frequency at which protons
emit energy is proportional to the size of the magnetic
field. In the MRI machines used in hospitals, the mag-
netic fields vary from one side of the magnet to the
other. This gives a spatial code to the radio waves emit-
ted by the protons: High-frequency signals come from
hydrogen atoms near the strong side of the magnet, and
low-frequency signals come from the weak side of the
magnet.
The last step in the MRI process is to orient the gradi-
ent of the magnet at many different angles relative to the
head and measure the amount of hydrogen. It takes about
15 minutes to make all the measurements for a typical
brain scan. A sophisticated computer program is then
used to make a single image from the measurements,
resulting in a picture of the distribution of hydrogen atoms
in the head.
Figure A is an MRI image of a lateral view of the brain
in a living human. In Figure B, another MRI image, a slice
has been made in the brain. Notice how clearly you can
see the white and gray matter. This differentiation makes
it possible to see the effects of demyelinating diseases on
white matter in the brain. MRI images also reveal lesions
in the brain because tumors and inflammation generally
increase the amount of extracellular water.
FIGURE B
178 C HAP T E R 7 . THE STRUCTURE OF THE NERVOUS SYSTEM
Box 7.3
( )
BRAIN FOOD
Functional Imaging of Brain Activity:
PET and fMRI
Until recently, "mind reading" has been beyond the reach of
science. However, with the introduction of positron emission
tomography (PET) and functional magnetic resonance imaging
(fMRI), it is now possible to observe and measure changes
in brain activity associated with the planning and execution
of specific tasks.
PET imaging was developed in the 1970s by two groups
of physicists, one at Washington University led by M. M.
Ter-Pogossian and M. E. Phelps, and a second at UCLA led
by Z. H. Cho. The basic procedure is very simple. A radioac-
tive solution containing atoms that emit positrons (posi-
tively charged electrons) is introduced into the bloodstream.
Positrons, emitted wherever the blood goes, interact with
electrons to produce photons of electromagnetic radiation.
The locations of the positron-emitting atoms are found by
detectors that pick up the photons.
One powerful application of PET is the measurement of
metabolic activity in the brain. In a technique developed by
Louis Sokoloff and his colleagues at the National Institute of
Mental Health, a positron-emitting isotope of fluorine or
oxygen is attached to 2-deoxyglucose (2-DG). This radioac-
tive 2-DG is injected into the bloodstream, and it travels to
the brain. Metabolically active neurons, which normally use
glucose, also take up the 2-DG. The 2-DG is phosphorylated
by enzymes inside the neuron, and this modification prevents
the 2-DG from leaving. Thus, the amount of radioactive
2-DG accumulated in a neuron, and the number of positron
emissions, indicate the level of neuronal metabolic activity.
In a typical PET application, a person's head is placed in
an apparatus surrounded by detectors (Figure A). Using
computer algorithms, the photons (resulting from positron
emissions) reaching each of the detectors are recorded.
With this information, levels of activity for populations of
neurons at various sites in the brain can be calculated.
Compiling these measurements produces an image of the
brain activity pattern. The researcher monitors brain activity
while the subject performs a task, such as moving a finger
or reading aloud. Different tasks "light up" different brain
areas. In order to obtain a picture of the activity induced by
a particular behavioral or thought task, a subtraction tech-
nique is used. Even in the absence of any sensory stimula-
tion, the PET image will contain a great deal of brain activ-
ity. To create an image of the brain activity resulting from a
specific task, such as a person looking at a picture, this back-
ground activity is subtracted out (Figure B).
Although PET imaging has proven to be a valuable tech-
nique, it has significant limitations. Because the spatial reso-
lution is only 5-10 mm 3 , the images show the activity of many
thousands of cells. Also, a single PET brain scan may take
one to many minutes to obtain. This, along with concerns
about radiation exposure, limits the number of obtainable
scans from one person in a reasonable time period. Thus,
the work of S. Ogawa at Bell Labs, showing that MRI tech-
niques could be used to measure local changes in blood
oxygen levels that result from brain activity, was an impor-
tant advance.
The fMRI method takes advantage of the fact that oxy-
hemoglobin (the oxygenated form of hemoglobin in the
blood) has a different magnetic resonance than deoxyhe-
moglobin (hemoglobin that has donated its oxygen). More
active regions of the brain receive more blood, and this
blood donates more of its oxygen. Functional MRI detects
the locations of increased neural activity by measuring
the ratio of oxyhemoglobin to deoxyhemoglobin. It has
emerged as the method of choice for functional brain im-
aging because the scans can be made rapidly (50 msec), they
have good spatial resolution (3 mm 3 ), and they are com-
pletely noninvasive.
... UNDERSTANDING CNS STRUCTURE
THROUGH DEVELOPMENT
The entire CNS is derived from the walls of a fluid-fiUed tube that is formed
at an early stage in embryonic development. The tube itself becomes the
adult ventricular system. Thus, by examining how this tube changes dur-
ing the course of fetal development we can understand how the brain is
organized and how the different parts fit together. In this section, we focus
on development as a way to understand the structural organization of the
brain. In Chapter 23, we will revisit the topic of development to see how
neurons are born, how they find their way to their final locations in the
Y UNDERSTANDING CNS STRUCTURE THROUGH DEVELOPMENT I 79
...1
"
\\
. \
"- -,
. I::; \
'.)
-- ,
t& .,.
.
I
, \
f'.
I
emission
FIGURE A
The PET procedure. (Source: Posner and Raichle. 1994. p. 61.)
Stimulation
Control
Difference
== ' '
W
.
FIGURE B
A PET image. (Source: Posner and Raichle. 1994. p. 65.)
CNS, and how they make the appropriate synaptic connections with one
another.
As you work your way through this section, and through the rest of
the book, you will encounter many different names used by anatomists to
refer to groups of related neurons and axons. Some common names for
describing collections of neurons and axons are given in Tables 7.1 and 7.2.
Take a few moments to familiarize yourself with these new terms before
continuing.
Anatomy by itself can be pretty dry. It really comes alive only after the
functions of different structures are understood. The remainder of this book
180 C HAP T E R 7 . THE STRUCTURE OF THE NERVOUS SYSTEM
Table 7.1 Collections of Neurons
Gray matter
NAME DESCRIPTION AND EXAMPLE
Cortex
Nucleus
Substantia
Locus
(plural: loci)
Ganglion
(plural: ganglia)
A generic term for a collection of neuronal cell bodies in the CNS. When a freshly dissected brain is
cut open, neurons appear gray.
Any collection of neurons that form a thin sheet, usually at the brain's surface. Cortex is Latin for
"bark." Example: cerebral cortex, the sheet of neurons found just under the surface of the cerebrum.
A clearly distinguishable mass of neurons, usually deep in the brain (not to be confused with the
nucleus of a cell). Nucleus is from the Latin word for "nut:' Example: laterol geniculate nucleus, a cell
group in the brain stem that relays information from the eye to the cerebral cortex.
A group of related neurons deep within the brain, but usually with less distinct borders than those of
nuclei. Example: substantia nigro (from the Latin for "black substance"), a brain stem cell group in-
volved in the control of voluntary movement.
A small, well-defined group of cells. Example: locus coeruleus (Latin for "blue spot"), a brain stem cell
group involved in the control of wakefulness and behavioral arousal.
A collection of neurons in the PNS. Ganglion is from the Greek for "knot:' Example: the dorsal root
ganglia, which contain the cells bodies of sensory axons entering the spinal cord via the dorsal roots.
Only one cell group in the CNS goes by this name: the basal ganglia, which are structures lying deep
within the cerebrum that control movement.
is devoted to explaining the functional organization of the nervous system.
However, we have punctuated this section with a preview of some structure-
function relationships to provide you with a general sense of how the
different parts contribute, individually and c01lective1y, to the function of
the CNS.
Formation of the Neural Tube
The embryo begins as a flat disk with three distinct layers of cells called
endoderm, mesoderm, and ectoderm. The endoderm ultimately gives rise to
the lining of many of the internal organs (viscera). From the mesoderm arise
the bones of the skeleton and the muscles. The nervous system and the skin
derive entirely from the ectoderm.
Our focus is on changes in the part of the ectoderm that gives rise to the
nervous system: the neural plate. At this early stage (about 17 days from
NAME
Table 7.2 Collections ofAxons
DESCRIPTION AND EXAMPLE
Nerve
White matter
Tract
Bundle
Capsule
Commissure
Lemniscus
A bundle ofaxons in the PNS. Only one collection of CNS axons is called a nerve: the optic nerve.
A generic term for a collection of CNS axons. When a freshly dissected brain is cut open, axons
appear white.
A collection of CNS axons having a common site of origin and a common destination. Example:
corticospinal troct, which originates in the cerebral cortex and ends in the spinal cord.
A collection ofaxons that run together but do not necessarily have the same origin and destination.
Example: medial forebroin bundle, which connects cells scattered within the cerebrum and brain stem.
A collection ofaxons that connect the cerebrum with the brain stem. Example: internal capsule, which
connects the brain stem with the cerebral cortex.
Any collection ofaxons that connect one side of the brain with the other side.
A tract that meanders through the brain like a ribbon. Example: medial lemniscus, which brings touch
information from the spinal cord through the brain stem.
.,. UNDERSTANDING CNS STRUCTURE THROUGH DEVELOPMENT 181
Rostral
I
I
---
\ II \\ \ l \
\ j\ '\ Caudal It
Neural Somites Neural Neural
Mesoderm I crest tube
(a)
(b)
(e)
Endoderm
FIGURE 7.8
Formation of the neural tube and neural crest. These schematic illustrations follow
the early development of the nervous system in the embryo. The drawings above are dorsal
views of the embryo; those below are cross sections. (a) The primitive embryonic CNS
begins as a thin sheet of ectoderm. (b) The first important step in the development of the
nervous system IS the formation of the neural groove. (c) The walls of the groove. called
neural folds. come together and fuse. forming the neural tube. (d) The bits of neural ecto-
derm that are pinched off when the tube rolls up is called the neural crest, from which the
PNS will develop. The somites are mesoderm that will give rise to much of the skeletal
system and the muscles.
conception in humans), the brain consists only of a flat sheet of cells (Fig-
ure 7.8a). The next event of interest is the formation of a groove in the
neural plate that runs rostral to caudal, called the neural groove (Figure
7.8b). The walls of the groove are called neural folds, which subsequently
move together and fuse dorsally, forming the neural tube (Figure 7 .8c).
The entire central nervous system develops from the walls of the neural tube. As the
neural folds come together, some neural ectoderm is pinched off and comes
to lie just lateral to the neural tube. This tissue is called the neural crest
(Figure 7.8d). All neurons with cell bodies in the peripheral nervous system derive
from the neural crest.
The neural crest develops in close association with the underlying
mesoderm. The mesoderm at this stage in development forms prominent
bulges on either side of the neural tube called somites. From these somites,
the n individual vertebrae of the spinal column and the related skeletal
muscles will develop. The nerves that innervate these skeletal muscles are
therefore called somatic motor nerves.
The process by which the neural plate becomes the neural tube is called
neurulation. Neurulation occurs very early in embryonic development
about 22 days after conception in humans. A common birth defect is the
(d)
182 C HAP T E R 7 . THE STRUCTURE OF THE NERVOUS SYSTEM
Box 7.4
.... , .
OF SPECIAL INTEREST
..
Nutrition and
the Neural Tube
Neural tube formation is a crucial event in the development
of the nervous system. It occurs early-only 3 weeks after
conception-when the mother may be unaware she is preg-
nant. Failure of the neural tube to close correctly is a
common birth defect, occurring in approximately lout. of
every 500 live births. A recent discovery of enormous pub-
lic health importance is that many neural tube defects can
be traced to a deficiency of the vitamin folic acid (or folate)
in the maternal diet during the weeks immediately after
conception. It has been estimated that dietary supplemen-
tation of folic acid during this period could reduce the inci-
dence of neural tube defects by 90%.
Formation of the neural tube is a complex process
(Figure A). It depends on a precise sequence of changes in
the three-dimensional shape of individual cells, as well as on
changes in the adhesion of each cell to its neighbors. The
timing of neurulation also must be coordinated with simul-
taneous changes in non-neural ectoderm and the meso-
derm. At the molecular level, successful neurulation de-
pends on specific sequences of gene expression that are
controlled, in part, by the position and local chemical envi-
ronment of the cell. It is not surprising that this process is
highly sensitive to chemicals. or chemical deficiencies, in the
maternal circulation.
The fusion of the neural folds to form the neural tube
occurs first in the middle. then anteriorly and posteriorly
(Figure B). Failure of the anterior neural tube to close re-
suits in anencephaly, a condition characterized by degenera-
tion of the forebrain and skull that is always fatal. Failure
of the posterior neural tube to close results in a condition
called spina bifrda. In its most severe form, spina bifida is
characterized by the failure of the posterior spinal cord to
form from the neural plate (bifrda is from the Latin word
meaning "cleft in two parts"). Less severe forms are char-
acterized by defects in the meninges and vertebrae overly-
ing the posterior spinal cord. Spina bifida. while usually not
fatal, does require extensive and costly medical care.
Folic acid plays an essential role in a number of metabolic
pathways, including the biosynthesis of DNA, which natu-
rally must occur during development as cells divide. Al-
though we do not precisely understand why folic acid defi-
ciency increases the incidence of neural tube defects, one
can easily imagine how it could alter the complex choreog-
raphy of neurulation. The name is derived from the Latin
word for "leaf;' reflecting the fact that folic acid was first
isolated from spinach leaves. Besides green leafy vegetables,
good dietary sources of folic acid are liver, yeast, eggs, beans.
and oranges. Many breakfast cereals are now fortified with
folic acid. Nonetheless. the folic acid intake of the average
American is only half of what is recommended to prevent
birth defects (0.4 mg/day). The U.S. Centers for Disease
Control and Prevention recommends that women take mul-
tivitamins containing 0.4 mg of folic acid before planning
pregnancy.
FIGURE A
Scanning electron micrographs of neurulation.
(Source: Smith and Schoenwolf. 1997.)
failure of appropriate closure of the neural tube. Fortunately, recent research
suggests that most cases of neural tube defects can be avoided by ensuring
proper maternal nutrition during this period (Box 7.4).
Three Primary Brain Vesicles
The process by which structures become more complex and functionally
specialized during development is called differentiation. The first step in
the differentiation of the brain is the development, at the rostral end of the
'Y UNDERSTANDING CNS STRUCTURE THROUGH DEVELOPMENT 183
Rostral
..
,
Caudal
'-
(a)
-,
-
-..........
...
..
-.;
,-" "
Normal
(b)
_1
" r,
. '!r
.,"
""""'":.
...
>
, 4
\....
"c _
...... -
.:!o <Q'Q...
-. . ..
--"r' ..
,-'" .
-4
, '\"
22 days
J
Anencephaly
1---1
0.180 mm
FIGURE B
(a) Neural tube closure. (b) Neural tube defects.
neural tube, of three swellings called the primary vesicles (Figure 7.9). The
entire brain derives from the three primary vesicles of the neural tube.
The rostral-most vesicle is called the prosencephalon. Pro is Greek for "be-
fore"; encephalon is derived from the Greek for "brain." Thus, the prosen-
cephalon is also called the forebrain. Behind the prosencephalon lies an-
other vesicle called the mesencephalon, or midbrain. Caudal to this is the
third primary vesicle. the rhombencephalon, or hindbrain. The rhomben-
cephalon connects with the caudal neural rube, which gives rise to the
spinal cord.
23 days
..
\\
(I
t
Spina bifida
-..........
J 84 C HAP T E R 7 . THE STRUCTURE OF THE NERVOUS SYSTEM
Rostral
________ Prosencephalon
or forebrain
I
\
"'---
r{1
) \
Caudal
Mesencephalon
¥ or midbrain
Rhombencephalon
or hindbrain
FIGURE 7.9
The three primary brain vesicles. The
rostral end of the neural tube differentiates to
form the three vesicles that will give nse to
the entire brain. This view is from above, and
the vesicles have been cut horizontally so that
we can see the Inside of the neural tube.
c t e e ;e h-al C- - ----- \
'ro vesicles
.0
Diencephalon' r
o
-- - -
Midbrain \
Hindbrain
FIGURE 7.10
The secondary brain vesicles of the
forebrain. The forebrain differentiates into
the paired telencephalic and optic vesicles, and
the diencephalon. The optic vesicles develop
into the eyes.
Cut edge of
optic cup
Optic )
stalk
\
Cut edge of wall
of diencephalon
FIGURE 7.11
Early development of the eye. The optic
vesicle differentiates into the optic stalk and
the optic cup. The optic stalk will become the
optic nerve, and the optic cup will become
the retina.
Differentiation of the Forebrain
The next important developments occur in the forebrain, where secondary
vesicles sprout off on both sides of the prosencephalon. The secondary vesi-
cles are the optic vesicles and the telencephalic vesicles. The unpaired structure
that remains after the secondary vesicles have sprouted off is called the
diencephalon, or "between brain" (Figure 7.10). Thus, the forebrain at
this stage consists of the two optic vesicles, the two telencephalic vesicles,
and the diencephalon.
The optic vesicles grow and invaginate (fold in) to form the optic stalks
and the optic cups, which will ultimately become the optic nerves and the
two retinas in the adult (Figure 7.11). The imporrant point is that the retina
at the back of the eye, and the optic nerve connecting the eye to the dien-
cephalon' are part of the brain, not the PNS.
Differentiation of the Telencephalon and Diencephalon. The telen-
cephalic vesicles together form the telencephalon, or "endbrain." consist-
ing of the two cerebral hemispheres. The telencephalon continues to de-
velop in four ways: (1) The telencephalic vesicles grow posteriorly so that
they lie over and lateral to the diencephalon (Figure 7.12a). (2) Another
pair of vesicles sprout off the ventral surfaces of the cerebral hemispheres.
giving rise to the olfactory bulbs and related structures that participate
in the sense of smell (Figure 7.12b). (3) The cells of the walls of the te-
lencephalon divide and differentiate into various structures. (4) White
matter systems develop, carrying axons to and from the neurons of the
telencephalon.
Figure 7.13 shows a coronal section through the primitive mammalian
forebrain, to illustrate how the different parts of the telencephalon and
diencephalon differentiate and fit together. Notice that the two cerebral
hemispheres lie above and on either side of the diencephalon, and that the
ventral-medial surfaces of the hemispheres have fused with the lateral
surfaces of the diencephalon (Figure 7 .13a).
The fluid-filled spaces within the cerebral hemispheres are called the
lateral ventrides, and the space at the center of the diencephalon is
called the third ventricle (Figure 7 .13b). The paired lateral ventricles
are a key landmark in the adult brain: Whenever you see paired fluid-
filled ventricles in a brain section, you know that the tissue surrounding
them is in the telencephalon. The elongated, slitlike appearance of the
third ventricle in cross section is also a useful feature for identifying the
diencephalon.
Notice in Figure 7.13 that the walls of the telencephalic vesicles appear
swollen due to the proliferation of neurons. These neurons form two dif-
ferent types of gray matter in the telencephalon: the cerebral cortex and
the basal telencephalon. Likewise, the diencephalon differentiates into
two structures: the thalamus and the hypothalamus (Figure 7.13c). The
thalamus, nestled deep inside the forebrain, gets its name from the Greek
word for "inner chamber."
The neurons of the developing forebrain extend axons to communicate
with other parts of the nervous system. These axons bundle together to
form three major white matter systems: the cortical white matter, the cor-
pus callosum, and the internal capsule (Figure 7.13d). The cortical white
matter contains all the axons that run to and from the neurons in the
cerebral cortex. The corpus callosum is continuous with the cortical white
matter and forms an axonal bridge that links cortical neurons of the two
cerebral hemispheres. The cortical white matter is also continuous with the
internal capsule, which links the cortex with the brain stem, particularly
the thalamus.
UNDERSTANDING CNS STRUCTURE THROUGH DEVELOPMENT 185
Rostral
Telencephalon
(2 cerebral hemispheres)
Dorsal Cerebral
+ hemispheres
Caudal /\
Rostral .
Ventral
Diencephalon
j
Midbrain
Hindbrain
Diencephalon
t/
Olfactory
bulbs
Caudal
Optic cups
:.
(a)
Differentiation
(b)
FIGURE 7.12
Differentiation of the telencephalon. (a) As development proceeds, the cerebral
hemispheres swell and grow posteriorly and laterally to envelop the diencephalon.
(b) The olfactory bulbs sprout off the ventral surfaces of each telencephalic vesicle.
Forebrain Structure-Function Relationships. The forebrain is the seat
of perceptions, conscious awareness, cognition, and voluntary action. AU
this depends on extensive interconnections with the sensory and motor
neurons of the brain stem and spinal cord.
Arguably the most important structure in the forebrain is the cerebral
cortex. As we will see later in this chapter, the cortex is the brain structure
that has expanded the most over the course of human evolution. Cortical
neurons receive sensory information, form perceptions of the outside world,
and command voluntary movements.
Neurons in the olfactory bulbs receive information [rom cells that sense
chemicals in the nose (odors) and relay this information caudaUy to a part
'
t \
\
Telencephalon
Diencephalon
Cerebral cortex
VI
Hypothalamus
Thalamus
(a) Main divisions
(c) Gray matter structures
Third ventricle
Corpus callosum
Internal capsule
Cortical white
matter
(b) Ventricles
(d) White matter structures
FIGURE 7.13
Structural features of the forebrain.
186 C HAP T E R 7 . THE STRUCTURE OF THE NERVOUS SYSTEM
Cerebral
/ cortex,
I I l Thalam
!
1 1+ !r
Eye
Skin
Ear
FIGURE 7.14
The thalamus: gateway to the cerebral
cortex. The sensory pathways from the eye,
ear. and skin all relay in the thalamus before
terminating in the cerebral cortex. The arrows
indicate the direction of information flow.
of the cerebral cortex for further analysis. Information from the eyes, ears,
and skin is also brought to the cerebral cortex for analysis. However, each
of the sensory pathways serving vision, audition (hearing), and somatic
sensation relays (i.e., synapses upon neurons) in the thalamus en route to
the cortex. Thus, the thalamus is often referred to as the gateway to the
cerebral cortex (Figure 7. 14).
Thalamic neurons send axons to the cortex via the internal capsule. As
a general rule, the axons of each internal capsule carry information to the
cortex about the contralateral side of the body. Therefore, if a thumbtack
entered the right foot, it would be relayed to the left cortex by the left thal-
amus via axons in the left internal capsule. But how does the right foot
know what the left foot is doing? One important way is by communication
between the hemispheres via the axons in the corpus callosum.
Cortical neurons also send axons through the internal capsule, back to
the brain stem. Some cortical axons course all the way to the spinal cord,
forming the corticospinal tract. This is one important way cortex can
command voluntary movement. Another way is by communicating with
neurons in the basal ganglia, a collection of cells in the basal telencephalon.
The term basal is used to describe structures deep in the brain, and the basal
ganglia lie deep within the cerebrum. The functions of the basal ganglia are
poorly understood, but it is known that damage to these structures disrupts
the ability to initiate voluntary movement. Other structures, contributing
to other brain functions, are also present in the basal telencephalon. For
example, in Chapter 18 we'll discuss a structure called the amygdala that
is involved in fear and emotion.
Although the hypothalamus lies just under the thalamus, functionally it
is more closely related to certain telencephalic structures, like the amyg-
dala. The hypothalamus performs many primitive functions and therefore
has not changed much over the course of mammalian evolution. "Primitive"
does not mean unimportant or uninteresting, however. The hypothalamus
controls the visceral (autonomic) nervous system, which regulates bodily
functions in response to the needs of the organism. For example, when you
are faced with a threatening situation, the hypothalamus orchestrates the
body's visceral fight-or-flight response. Hypothalamic commands to the
ANS will lead to (among other things) an increase in the heart rate, in-
creased blood flow to the muscles for escape, and even the standing of your
hair on end. Conversely, when you're relaxing after Sunday brunch, the
... SELF-QUIZ
Listed below are derivatives of the forebrain that we have discussed. Be
sure you know what each of these terms means.
PRIMARY VESICLE SECONDARY VESICLE SOME ADULT DERIVATIVES
Forebrain
(prosencephalon)
Optic vesicle
Retina
Optic nerve
Dorsal thalamus
Hypothalamus
Third ventricle
Olfactory bulb
Cerebral cortex
Basal telencephalon
Corpus callosum
Cortical white matter
Internal capsule
Thalamus
(diencephalon)
Telencephalon
... UNDERSTANDING CNS STRUCTURE THROUGH DEVELOPMENT 187
hypothalamus ensures that the brain is well-nourished via commands to
the ANS, which will increase peristalsis (movement of material through
the gastrointestinal tract) and redirect blood to your digestive system. The
hypothalamus also plays a key role in motivating animals to find food,
drink, and sex in response to their needs. Aside from its connections to the
ANS, the hypothalamus also directs bodily responses via connections with the
pituitary gland located below the diencephalon. This gland communicates
to many parts of the body by releasing hormones into the bloodstream.
Differentiation of the Midbrain
Unlike the forebrain, the midbrain differentiates relatively little during
subsequent brain development (Figure 7.15). The dorsal surface of the
mesencephalic vesicle becomes a structure called the tectum (Latin for
"roof"). The floor of the midbrain becomes the tegmentum. The eSF-filled
space in between constricts into a narrow channel called the cerebral
aqueduct. The aqueduct connects rostrally with the third ventricle of the
diencephalon. Because it is small and circular in cross section, the cerebral
aqueduct is a good landmark for identifying the midbrain.
Midbrain Structure-Function Relationships. For such a seemingly
simple structure, the functions of the midbrain are remarkably diverse. Be-
sides serving as a conduit for information passing from the spinal cord to
the forebrain and vice versa, the midbrain contains neurons that contribute
to sensory systems, the control of movement, and several other functions.
The midbrain contains axons descending from the cerebral cortex to the
brain stem and the spinal cord. For example, the corticospinal tract courses
through the midbrain en route to the spinal cord. Damage to this tract in
the midbrain on one side produces a loss of voluntary control of movement
on the opposite side of the body.
The tectum differentiates into two structures: the superior colliculus and
the inferior colliculus. The superior colliculus receives direct input from the
eye, so it is also called the optic tectum. One function of the optic tectum
is to control eye movements, which it does via synaptic connections with
the motor neurons that innervate the eye muscles. Some of the axons that
-J
@
Cerebral
aqueduct
Tectum
Forebrain
Midbrain
Hindbrain
Differentiation
Tegmentum
FIGURE 7.15
Differentiation of the midbrain. The midbrain differentiates Into the tectum and the
tegmentum. The eSF-filied space at the core of the midbrain is the cerebral aqueduct
(Drawings are not to scale.)
188 C HAP T E R 7 . THE STRUCTURE OF THE NERVOUS SYSTEM
FIGURE 7.16
Differentiation of the rostral hindbrain.
The rostral hindbrain differentiates into the
cerebellum and pons. The cerebellum is
formed by the growth and fusion of the
rhombic lips. The CSF-filled space at the
core of the hindbrain is the fourth ventricle.
(Drawings are not to scale.)
supply the eye muscles originate in the midbrain, bundling together to
form cranial nerves III and IV (see the chapter appendix).
The inferior colliculus also receives sensory information. but from the ear
instead of the eye. The inferior colliculus serves as an important relay
station for auditory information en route to the thalamus.
The tegmentum is one of the most colorful regions of the brain because
it contains both the substantia nigra (the black substance) and the red
nucleus. These two cell groups are involved in the control of voluntary
movement. Other cell groups scattered in the midbrain have axons that
project widely throughout much of the CNS and function to regulate con-
sciousness, mood, pleasure, and pain.
Differentiation of the Hindbrain
The hindbrain differentiates into three important structures: the cerebel-
lum, the pons, and the medulla oblongata-also called, simply, the
medulla. The cerebellum and pons develop from the rostral half of the
hindbrain (called the metencephalon); the medulla develops from the caudal
half (called the myelencephalon). The CSF-filled tube becomes the fourth
ventricle, which is continuous with the cerebral aqueduct of the midbrain.
At the three-vesicle stage, the rostral hindbrain in cross section is a
simple tube. In subsequent weeks, the tissue along the dorsal-lateral wall
of the tube, called the rhombic lip, grows dorsally and medially until it fuses
with its twin on the other side. The resulting flap of brain tissue grows into
the cerebellum. The ventral wall of the tube differentiates and swells to
form the pons (Figure 7.16).
Less dramatic changes occur during the differentiation of the caudal half
of the hindbrain into the medulla. The ventral and lateral walls of this re-
gion swell, leaving the roof covered only with a thin layer of non-neuronal
ependymal cells (Figure 7.17). Along the ventral surface of each side of
the medulla runs a major white matter system. Cut in cross section, these
)
____Forebrain
-------- - Midbrain l
Hindbrain --....... I
f
- I
Differentiation
Cerebellum
Fourth
ventricle
Rhombic lips
",
y
"
Pons
... UNDERSTANDING CNS STRUCTURE THROUGH DEVELOPMENT 189
Medulla
Forebrain
Midbrain
Hindbrain
---
Differentiation
..
Fourth
ventricle
w
Medullary
pyramids
FIGURE 7.17
Differentiation of the caudal hindbrain. The caudal hindbrain differentiates into the
medulla. The medullary pyramids are bundles ofaxons coursing caudally toward the spinal
cord. The CSF-filled space at the core of the medulla is the fourth ventricle. (Drawings are
not to scale.)
bundles ofaxons appear somewhat triangular in shape, explaining why
they are called the medullary pyramids.
Hindbrain Structure-Function Relationships, Like the midbrain, the
hindbrain is an important conduit for information passing from the fore-
brain to the spinal cord, and vice versa. In addition, neurons of the hind-
brain contribute to the processing of sensory information, the control of
voluntary movement, and regulation of the ANS.
The cerebellum, the "little brain," is an important movement control
center. It receives massive axonal inputs from the spinal cord and the pons.
The spinal cord inputs provide information about the body's position in
space. The inputs from the pons relay information from the cerebral cortex,
specifying the goals of intended movements. The cerebellum compares
these types of information and calculates the sequences of muscle contrac-
tions that are required to achieve the movement goals. Damage to the cere-
bellum results in uncoordinated and inaccurate movements.
Of the descending axons passing through the midbrain, more than 90%-
about 20 million axons in the human-synapse on neur0l!s in the pons.
The pontine cells relay all this information [0 the cerebellum on the oppo-
site site. Thus, the pons serves as a massive switchboard connecting the
cerebral cortex [0 the cerebellum. (The word pons is from the Latin word
for "bridge.") The pons bulges out from the ventral surface of the brain
stem to accommodate all this circuitry.
The axons that do not terminate in the pons continue caudally and enter
the medullary pyramids. Most of these axons originate in the cerebral cor-
tex and are part of the corticospinal tract. Thus. "pyramidal tract" is often
190 C HAP T E R 7 . THE STRUCTURE OF THE NERVOUS SYSTEM
Neuron in
motor cortex
'II
:4 Medulla
Pyramidal
decussation
_ Spinal cord
FIGURE 7.18
The pyramidal decussation. The cortico-
spinal tract crosses from one side to the
other in the medulla.
used as a synonym for corticospinal tract. Near where the medulla joins
with the spinal cord, each pyramidal tract crosses from one side of the mid-
line to the other. A crossing ofaxons from one side to the other is known
as a decussation, and this one is called the pyramidal decussation. The crossing
ofaxons in the medulla explains why the cortex of one side of the brain
controls movements on the opposite side of the body (Figure 7.18).
In addition to the white matter systems passing through, the medulla
contains neurons that perform many different sensory and motor func-
tions. For example, the axons of the auditory nerves, bringing auditory
information from the ears, synapse on cells in the cochlear nuclei of the
medulla. The cochlear nuclei project axons to a number of different struc-
tures, including the tectum of the midbrain (inferior colliculus, discussed
above). Damage to the cochlear nuclei leads to deafness.
Other sensory functions of the medulla include touch and taste. The
medulla contains neurons that relay somatic sensory information from the
spinal cord to the thalamus. Destruction of the cells leads to anesthesia (loss
of feeling). Other neurons relay gustatory (taste) information from the
tongue to the thalamus. And among the motor neurons in the medulla are
cells that control the tongue muscles via cranial nerve XII. (So think of the
medulla the next time you stick out your tongue!)
.... SELF-QUIZ
Listed below are derivatives of the midbrain and hindbrain that we have
discussed. Be sure you know what each of these terms means.
PRIMARY VESICLE
Midbrain (mesencephalon)
SOME ADULT DERIVATIVES
Tectum
Tegmentum
Cerebral aqueduct
Cerebellum
Pons
Fourth ventricle
Medulla
Hindbrain (rhombencephalon)
Differentiation of the Spinal Cord
As shown in Figure 7.19, the transformation of the caudal neural tube into
the spinal cord is straightforward compared to the differentiation of the
brain. With the expansion of the tissue in the walls, the cavity of the tube
constricts to form the tiny CSF-filled spinal canal.
Cut in cross section, the gray matter of the spinal cord (where the neurons
are) has the appearance of a butterfly. The upper part of the butterfly's wing
is the dorsal horn, and the lower part is the ventral horn. The gray
matter between the dorsal and ventral horns is called the intermediate zone.
Everything else is white matter, consisting of columns ofaxons that run up
and down the spinal cord. Thus, the bundles ofaxons running along the
dorsal surface of the cord are called the dorsal columns, the bundles ofaxons
lateral to the spinal gray matter on each side are called the lateral columns,
and the bundles on the ventral surface are called the ventral columns.
Spinal Cord Structure-Function Relationships. As a general rule, dorsal
horn cells receive sensory inputs from the dorsal root fibers, ventral horn
cells project axons into the ventral roots that innervate muscles, and inter-
mediate zone cells are interneurons that shape motor outputs in response
to sensory inputs and descending commands from the brain.
Y UNDERSTANDING CNS STRUCTURE THROUGH DEVELOPMENT 191
Forebrain
\
,
FIGURE 7.19
Differentiation of the spinal cord. The butterfly-shaped core of
the spinal cord is gray matter. divisible Into dorsal and ventral homs.
and an intermediate zone. Surrounding the gray matter are white
matter columns running rostrocaudally. up and down the cord. The
narrow CSF-filled channel is the spinal canal. (Drawings are not to
scale.)
- Midbrain
- Hindbrain
White matter
columns
y!
-b )
>--
---
-
Differentiation
Dorsal horn
Intermediate
zone
Spinal
gray
matter
Ventral horn
Spinal
canal
The large dorsal column contains axons that carry somatic sensory (touch)
information up the spinal cord toward the brain. It's like a superhighway
that speeds information from the ipsilateral side of the body up to nuclei
in the medulla. The postsynaptic neurons in the medulla give rise to axons
that decussate and ascend to the thalamus on the contralateral side. This
crossing ofaxons in the medulla explains why touching the left side of the
body is sensed by the right side of the brain.
The lateral column contains the axons of the descending corticospinal
tract which also cross from one side to the other in the medulla. These
axons innervate the neurons of the intermediate zone and ventral horn and
communicate the signals that control voluntary movement.
There are at least a half-dozen tracts that run in the columns of each side
of the spinal cord. Most are one-way and bring information to or from the
brain. Thus, the spinal cord is the major conduit of information from the
skin, joints, and muscles to the brain, and vice versa. However, the spinal
cord is also much more than that. The neurons of the spinal gray matter
begin the analysis of sensory information, playa critical role in coordinating
movements, and orchestrate simple reflexes (such as jerking away your
foot from a thumbtack).
Putting the Pieces Together
We have discussed the development of different parts of the CNS: the telen-
cephalon, diencephalon, midbrain, hindbrain, and spinal cord. Now let's put
all the individual pieces together to make a whole central nervous system.
Figure 7.20 is a highly schematic illustration that captures the basic or-
ganizational plan of the CNS of all mammals, including humans. The paired
hemispheres of the telencephalon surround the lateral ventricles. Dorsal to
the lateral ventricles, at the surface of the brain, lies the cortex. Ventral
and lateral to the lateral ventricles lies the basal telencephalon. The lateral
ventricles are continuous with the third ventricle of the diencephalon.
192 C HAP T E R 7 . THE STRUCTURE OF THE NERVOUS SYSTEM
Rostral .00(
.. Caudal
Basal
telencephalon
Cortex
Mesencephalon
(midbrain)
Thalamus
rm
Cerebellum
L Spinal
cord
Olfactory
bulb
/
/
Diencephalon
(thalamus)
Rhombencephalon
(hindbrain)
(b)
Hypothalamus
Tegmentum
Pons
y
(a)
Forebrain
Lateral ventricle
Cerebral
aqueduct
,
(c) Third ventricle Fourth ventricle
Spinal
canal
\
FIGURE 7.20
The brainship enterprise. (a) The basic plan of the mammalian
brain, with the major subdivisions indicated. (b) Major structures
within each division of the brain. Note that the telencephalon con-
sists of two hemispheres. although only one is illustrated. (c) The
ventricular system.
Surrounding this ventricle are the thalamus and the hypothalamus. The
third ventricle is coninuous with the cerebral aqueduct. Dosal to the aque-
duct is the tectum. Ventral to the aqueduct is the midbrain tegmentum. The
aqueduct connects with the fourth ventricle that lies at the core of the
hindbrain. Dorsal to the fourth ventricle sprouts the cerebellum. Ventral to
the fourth ventricle lie the pons and the medulla.
You should see by now that finding your way around the brain is easy if
you can identify which parts of the ventricular system are in the neighbor-
hood (Table 7.3). Even in the complicated human brain, the ventricular
system holds the key to understanding brain structure.
Special Features of the Human CNS
SO far, we've explored the basic plan of the CNS as it applies to all mam-
mals. Figure 7.2] compares the brains of the rat and the human. You can
Table 7.3 The Ventricular System of the Brain
COMPONENT
RELATED BRAIN STRUCTURES
lateral ventricles
Fourth ventricle
Cerebral cortex
Basal telencephalon
Thalamus
Hypothalamus
Tectum
Midbrain tegmentum
Cerebellum
Pons
Medulla
Third ventricle
Cerebral aqueduct
t
Rat
Cerebral
/rm. '
I
I
(a)
Third Cerebral
ventricle aqueduct
Telencephalon \ I
I
I'
//\
Diencephalon /
rl
Midbrain Pons
(b)
/
Olfactory
bulb
(c)
T UNDERSTANDING CNS STRUCTURE THROUGH DEVELOPMENT 193
Relative
size:
-c' {\) 1A
\
Human
.....
Cerebral
hemispheres
/1
/A
I
Cerebellum
.I
11
i
/
'-
Fourth
ventricle
Third Cerebral
ventricle aqueduct
Telence n \ I II
/ ',
. (
1
;
,\ /
,- \\. \,
<' '"''=" \
\/
-'
Fourth
ventricle
/
/y......
,
I Cerebellum
/
........--- Medulla
\
/
/
/
""
'/\
DiencePhalo / \
Midbrain /
Pons
'.
\
'\
.\
\
Cerebellum
f\.
'\(
/
Medulla
'" -
> " ,
t
. G
, -- --
/ - (
((
Olfactory ,
bulb
FIGURE 7.21
The rat brain and human brain compared. (a) Dorsal view.
(b) Midsagittal view. (c) Lateral view. (Brains are not drawn to the same scale.)
see immediately that there are indeed many similarities, but also some
obvious differences.
Let's start by reviewing the similarities. The dorsal view of both brains
reveals the paired hemispheres of the telencephalon (Figure 7.lla). A mid-
sagittal view of the two brains shows the telencephalon extending rostrally
194 C HAP T E R 7 . THE STRUCTURE OF THE NERVOUS SYSTEM
from the diencephalon (Figure 7.21b). The diencephalon surrounds the
third ventricle, the midbrain surrounds the cerebral aqueduct, and the
cerebellum, pons, and medulla surround the fourth ventricle. Notice how
the pons swells below the cerebellum, and how structurally elaborate the
cerebellum is.
Now let's consider some of the structural differences between the rat and
human brains. Figure 7.21a reveals a striking one: the many convolutions
on the surface of the human cerebrum. The grooves in the surface of the
cerebrum are called sulci (singular: sulcus), and the bumps are called
gyri (singular: gyrus). Remember, the thin sheet of neurons that lies just
under the surface of the cerebrum is the cerebral cortex. Sulci and gyri
result from the tremendous expansion of the surface area of the cerebral
cortex during human fetal development. The adult human cortex, measur-
ing about 1100 cm 2 , must fold and wrinkle to fit within the confines of the
skull. This increase in cortical surface area is one of the hdistortions h of the
human brain. Clinical and experimental evidence indicates that the cortex
is the seat of uniquely human reasoning and cognition. Without cerebral
cortex, a person would be blind, deaf, mute, and unable to initiate volun-
tary movement. We will take a closer look at the structure of the cerebral
cortex in a moment.
The side views of the rat and human brains in Figure 7.21c reveal fur-
ther differences in the forebrain. One is the small size of the olfactory bulb
in the human relative to the rat. On the other hand, notice again the
growth of the cerebral hemisphere in the human. See how the cerebral
hemisphere of the human brain arcs posteriorly, ventrolaterally, and then
anteriorly to resemble a ram's horn. The tip of the hhorn" lies right under
the temporal bone (temple) of the skull, so this portion of the brain is called
the temporal lobe. Three other lobes (named after skull bones) also de-
scribe the parts of human cerebrum. The portion of the cerebrum lying just
under the frontal bone of the forehead is called the frontal lobe. The deep
central sulcus marks the posterior border of the frontal lobe, caudal to
which lies the parietal lobe, under the parietal bone. Caudal to that, at
the back of the cerebrum under the occipital bone, lies the occipital lobe
(Figure 7.22).
Frontal
lobe
\
Central
sulcus
\
J>-.c
Parietal
lobe
/
(
,'.)
Temporal lobe
. ' -
"
, '" ---- --
\ """""=--
.:" -
\
-
Occipital
lobe
FIGURE 7.22
The lobes of the human cerebrum.
Lateral
ventlicles
\
,
'\
\
-
"
,.
Third
ventricle
\
Fourth
ventricle
FIGURE 7.23
The human ventricular system. Although the ventricles are distorted by the growth of
the brain, the basic relationships of the ventricles to the surrounding brain are the same as
those illustrated in Figure 7.20c.
It is important to realize that, despite the disproportionate growth of the
cerebrum, the human brain still follows the basic mammalian brain plan laid
out during embryonic development. Again. the ventricles are key. Although
the ventricular system is distorted, particularly by the growth of the tem-
porallobes, the relationships that relate the brain to the different ventricles
still hold (Figure 7.23).
A GUIDE TO THE CEREBRAL CORTEX
Considering its prominence in the human brain, the cerebral cortex deserves
further description. As we will see repeatedly in subsequent chapters, the
systems in the brain that govern the processing of sensations, perceptions,
voluntary movement, learning, speech, and cognition all converge in this
remarkable organ.
Types of Cerebral Cortex
Cerebral cortex in the brain of all vertebrate animals has several common
features, as shown in Figure 7.24. First, the cell bodies of cortical neurons
are always arranged in layers, or sheets, that usually lie parallel to the sur-
face of the brain. Second, the layer of neurons closest to the surface (the
most superficial cell layer) is separated from the pia mater by a zone that
lacks neurons; it is called the molecular layer, or simply layer l. Third, at
least one cell layer contains pyramidal cells that emit large dendrites, called
apical dendrites, that extend up to layer I, where they form multiple branches.
Thus, we can say that the cerebral cortex has a characteristic cytoarchitec-
ture that distinguishes it, for example, from the nuclei of the basal telen-
cephalon or the thalamus.
... A GUIDE TO THE CEREBRAL CORTEX 195
196 C HAP T E R 7 . THE STRUCTURE OF THE NERVOUS SYSTEM
FIGURE 7.24
General features of the cerebral
cortex. On the left IS the structure of
cortex in an alligator: on the right. a rat.
In both species, the cortex lies just under
the pia matter of the cerebral hemisphere.
contains a molecular layer. and has pyramidal
cells arranged in layers.
Alligator
Rat
{
\.
......
'"
"
Pia mater
/M ;;la
) ,,', . '''':'::' ' . " 1 " , : ".--;;:"-L)J:..;.
. p- Y'
J APical I 1..' '.J'
.... """"'Ie' ';i,"A... J\i
! ' .,},.! \,
Pyramidal " ,\. .. .!t.
cell Lr '--- 1
r -.j ........,
Layer
II
III
IV
V
.....
4-;.
'\..
. .
...
VI
,
Figure 7.25 shows a Nissl-stained coronal section through the caudal tel-
encephalon of a rat brain. You don't need to be Cajal to see that different
types of cortex can also be discerned based on cytoarchitecture. Medial to
the lateral ventricle is a piece of cortex that is folded onto itself in a pecu-
liar shape. This structure is called the hippocampus. which, despite its
bends. has only a single cell layer. (The term is from the Greek for "sea-
horse,") Connected to the hippocampus ventrally and laterally is another
type of cortex that has only two cell layers. It is called the olfactory cor-
tex. because it is continuous with the olfactory bulb. which sits farther an-
terior. The olfactory cortex is separated by a sulcus. called the rhinal fissure.
from another more elaborate type of cortex that has many cell layers. This
remaining cortex is called neocortex. Unlike the hippocampus and olfactory
cortex. neocortex is found only in mammals. Thus. when we said previously
that the cerebral cortex has expanded over the course of human evolution.
we really meant that the neocortex has expanded. Similarly. when we said
that the thalamus is the gateway to the cortex. we meant that it is the gate-
way to the neocortex. Most neuroscientists are such neocortical chauvin-
ists (ourselves included) that the term cortex. if left unqualified. is usually
intended to refer to the cerebral neocortex.
Rhinal fissure
"'\
II
Olfactory
bulb
Neocortex
Hippocampus \
-
Lateral
1 ventricle
I
a
.
/
/
Brain stem
Rhinal
fissure
Olfactory
cortex
FIGURE 7.25
Three types of cortex in a mammal. In this section of a rat brain. the lateral ventricles
lie between the neocortex and the hippocampus on each side. The ventricles are not obvi-
ous because they are very long and thin in this region. Below the telencephalon lies the
brain stem. What region of brain stem IS this. based on the appearance of the fluid-filled
space at its core?
In Chapter 8, we will discuss the olfactory cortex in the context of the
sense of smell. Further discussion of the hippocampus is reserved until later
in this book. when we will explore its role in the limbic system (Chapter
18) and in memory and learning (Chapters 24 and 25). The neocortex will
figure prominently in our discussions of vision, audition, somatic sensation,
and the control of voluntary movement in Part II, so let's examine its
structure in more detail.
Areas of Neocortex
Just as cytoarchitecture can be used to distinguish the cerebral cortex from
the basal telencephalon, and the neocortex from the olfactory cortex, it can
be used to divide the neocortex up into different zones. This is precisely
what the famous German neuroanatomist Korbinian Brodmann did at the
beginning of the twentieth century. He constructed a cytoarchitectural
map of the neocortex (Figure 7.26). In this map, each area of cortex having
a common cytoarchitecture is given a number. Thus, we have "area I T' at
the tip of the occipital lobe, "area 4" just anterior to the central sulcus in
the frontal lobe, and so on.
What Brodmann guessed, but could not show, was that cortical areas that
look different perform different functions. We now have evidence that this is
. A GUIDE TO THE CEREBRAL CORTEX 197
198 C HAP T E R 7 . THE STRUCTURE OF THE NERVOUS SYSTEM
3 1 2
\ '/
4 5
8 6
9 'l \l
10 .
44 1
42 17'
Hi 22
37
21
t
0
FIGURE 7.26
Brodmann's cytoarchitectural map of the human cerebral cortex.
true. For instance, we can say that area 17 is visual cortex because it receives
signals from a nucleus of the thalamus that is connected to the retina at
the back of the eye. Indeed, without area 17, a human is blind. Similarly,
we can say that area 4 is motor cortex, because neurons in this area proj-
ect axons directly to the motor neurons of the ventral horn that command
muscles to contract. Notice that the different functions of these two areas
are specified by their different connections.
Neocortical Evolution and Structure-Function Relationships. A
problem that has fascinated neuroscientists since the time of Brodmann is
how neocortex has changed over the course of mammalian evolution. The
brain is a soft tissue, so there is not a fossil record of the cortex of our early
mammalian ancestors. Nonetheless, considerable insight can be gained by
comparing the cortex of different living species (see Figure 7.1). The sur-
face area of the cortex varies tremendously among species; for example, a
comparison of mouse, monkey, and human cortex reveals differences in
size on the order of 1: 100: 1000. On the other hand, there is little differ-
ence in the thickness of the neocortex in different mammals, varying by
no more than a factor of two. Thus, we can conclude that the amount of
cortex has changed over the course of evolution, but not in its basic
structure.
Brodmann proposed that neocortex expanded by the insertion of new
areas. Leah Krubitzer at the University of California, Davis, has addressed
this issue by studying the structure and function of different cortical areas
in many different species (Box 7.5). Her research suggests that the pri-
mordial neocortex consisted mainly of three types of cortex-cortex that
also exists to some degree in all living species. The first type consists of pri-
mary sensory areas, which are first to receive signals from the ascending sen-
sory pathways. For example, area 17 is designated as primary visual cortex,
or VI. because it receives input from the eyes via a direct path: retina to
thalamus to cortex. The second type of neocortex consists of secondary sen-
sory areas, so designated because of their heavy interconnections with the
primary sensory areas. The third type of cortex consists of motor areas,
which are intimately involved with the control of voluntary movement.
These cortical areas receive inputs from thalamic nuclei that relay infor-
mation from the basal telencephalon and the cerebellum, and they send
Motor Somatic
\ / sensory
k \,
, (
Y! 1 14
/ '--
Sensorimotor
\
\
\
Visual
/
/ Visual
/
Olfactory
bulb
Auditory
Auditory
Human
Cat
FIGURE 7.27
A lateral view of the cerebral cortex in three species. Notice the expansion of the
human cortex that is neither strictly primary sensory nor strictly motor.
outputs to motor control neurons in the brain stem and spinal cord. For
example, because cortical area 4 sends outputs directly to motor neurons
in the ventral horn of the spinal cord, it is designated primary motor conex,
or Ml. Krubitzer's analysis suggests that the common mammalian ancestor
had on the order of about 20 different areas that could be assigned to these
three categories.
Figure 7.27 shows views of the brain of a rat, a cat and a human, with
the primary sensory and motor areas identified. It is plain to see that when
we speak of the expansion of the cortex in mammalian evolution, what has
expanded is the region that lies in between these areas. Research by Jon
Kaas at Vanderbilt University and others has shown that much of the "in-
between" cortex reflects expansion of the number of secondary sensory
areas devoted to the analysis of sensory information. For example, in pri-
mates that depend heavily on vision, such as humans, the number of sec-
ondary visual areas has been estimated to be between 20 and 40. However,
even after we have assigned primary sensory, motor, and secondary sen-
sory functions to large regions of cortex, a considerable amount of area
remains in the human brain, panicularly in the frontal and temporal lobes.
These are the association areas of cortex. Association cortex is a more recent
development a notewonhy characteristic of the primate brain. The emer-
gence of the "mind"-our unique ability to interpret behavior (our own
and that of others) in terms of unobservable mental states, such as desires,
intentions, and beliefs-correia res best with the expansion of rhe frontal
cortex. Indeed, as we will see in Chapter 18, lesions of the frontal conex
can profoundly alter an individual's personality.
... CONCLUDING REMARKS
Although we have covered a lot of new ground in this chapter, we have
only scratched the surface of neuroanatomy. Clearly, the brain deserves its
status as the most complex piece of matter in the universe. What we have
presented here is a shell, or scaffold, of the nervous system and some of its
conrents.
Understanding neuroanatomy is necessary for understanding how the
brain works. This statement is just as true for an undergraduate first-time
neuroscience student as it is for a neurologist or a neurosurgeon. In fact,
... CONCLUDING REMARKS 199
7--
Olfactory
bulb
Sensorimotor
,..
Visual
I..
Auditory
Rat
I
200
C HAP T E R 7 . THE STRUCTURE OF THE NERVOUS SYSTEM
Box 7.5
PATH OF DI COVERY
.' ..
I r -.
X'
,.
Evolution of My Brain
\
,
,-
\
- )
How does evolution build a complex brain? How did some
mammals, like humans, come to posses a brain with so many
parts? Can I make one myself?
Let me assure you, this mad scientist did not hatch
from an egg into a fully formed intellectual with questions
in hand. My journey is probably not unlike your own. My
direction was based on decisions made with little or no in-
formation, on taking roads that were somewhat off the
beaten path and, most importantly, on a burning desire to
find something I could be passionate about, something I
could create, something that would help me make sense of
the world.
I attended Pennsylvania State University as an under-
graduate, a decision based primarily on the fact that I liked
their football team. Like most undergraduates, I was faced
with the dilemma of deciding what I was going to do with
the rest of my life. My initial decision. prompted by meeting
someone I thought was interesting at a wedding, after
having consumed several glasses of champagne. was to
major in speech pathology. By the time I realized that I was
not a clinical sort of girl, that it was ridiculous to even con-
sider helping others utter coherent sentences when I could
barely do the same myself, and that I was simply not pre-
pared to wear pantyhose every day for the rest of my life,
it was too late. Upon graduation, although I did not know
exactly what I wanted to do, I was sure I did not want to
be a speech pathologist.
I decided to attend graduate school. mainly to postpone
having to make the next big decision about my future.To my
by Leah Krubitzer ,
good fortune, at Vanderbilt University I met Jon Kaas, one
of the forerunners in studies of brain evolution in primates.
Since that day, my life has never been the same. I had finally
found something that inspired me. It was in Jon's laboratory
that I learned to critically think about how the neocortex
might work and to interpret data in light of brain evolution.
I immersed myself in the brain and allowed my thinking
about evolution to become completely intertwined with
my thoughts on every aspect of life, both scientific and per-
sonal. Science consumed me, and it was glorious. During
this time, I also had a glimmer of an idea that there were
underlying principles of brain construction that dictated
how brains were made. While I did not know what these
rules were, I was convinced that in order to understand
them, one must consider the brain from an evolutionary
perspective. Ironically, however, scientists who worked on
brain evolution were becoming increasingly rare by 1988.
New technologies such as single unit recordings in awake
monkeys were aU the rage in systems neuroscience, and
these types of techniques, and the questions they addressed,
seemed to eclipse the comparative approach to under-
standing brain evolution. As a result, most neuroscientists
were not particularly interested in how brains evolved.
Shocking, but true.
I pulled my head OUt of the clouds for a brief period
and accepted a post-doctoral position at MIT to polish my
pedigree with some cutting-edge technology. I was at the
top of the heap, had quite a few publications for a new grad-
uate student. had the world on a string-and was com-
neuroanatomy has taken on a new relevance with the advent of methods
of imaging the Jiving brain (Figure 7.28).
An Illustrated Guide to Human Neuroanatomy appears as an appendix
to this chapter. Use the Guide as an atlas to locate various structures of
interest. Labeling exercises are also provided to help you learn the names
of the parts of the nervous system you will encounter in this book.
In Part II, Sensory and Motor Systems, the anatomy presented in
Chapter 7 and its appendix will come alive, as we explore how the brain
goes about the tasks of smelling, seeing, hearing, sensing touch, and
moving.
T CONCLUDING REMARKS 20 I
pletely miserable. Although I knew this was a path I should
follow for all of the obvious reasons, my heart wasn't in it.
t made a major decision. I surrendered my position at MIT,
followed my heart, and moved to Australia so that I could
work on monotremes. such as the duck-billed platypus
(Figure A) and spiny anteater. My reasoning was that if I
wanted to study how the mammalian neocortex became
really complex, the place to start was with the brain of an
animal that diverged very early in mammalian evolution and
still retained reptilian characteristics, such as egg-laying. I
thought that perhaps the monotreme neocortex would bet-
ter reflect that of the ancestral neocortex of all mammals,
and I could have a better starting point for understanding
how a basic plan was modified in different lineages.
It was there. in collaboration with Mike Calford and jack
Pettigew, that I really came to understand the evolution of
the neocortex at a much deeper level. We worked on a
number of amazing mammals, including monotremes, mar-
supials, and even large megachirpteran bats. I began to have
an appreciation for the whole animal and its behaviors,
rather than just the brain. In my mind, this work was criti-
cally important, and I spent far greater than an allotted
two-year post-doc period in Australia. I remained there for
more than 6 years.
Around 1994. the Australian government changed, and it
became increasingly difficult to get funding to study brain
evolution. Luckily. a new Center for Neuroscience at the
University of California, Davis, had an opening for an evolu-
tionary neurobiologist. I flew to Davis. gave a talk, and got
the job. At u.c. Davis (1995 to the present), we began in
earnest to test our theories of cortical evolution by manip-
ulating the nervous system in developing animals. in an at-
tempt to apply the rules of brain construction I envisioned
from my work in Australia. Fortunately. recent advances in
"
". i
"
,
FIGURE A
A duck-billed platypus.
molecular developmental neurobiology have led to a resur-
gence of interest in brain evolution. Our goal is to mimic the
evolutionary process to make new cortical areas, and then
to determine how these changes result in alterations in be-
havior. This is a tall order, but a girl has got to have a dream.
.J#
>-V>
wI:
o:::
w
.....
Gross Organization of the
Mammalian Nervous System
anterior (p. 168)
rostral (p. 168)
posterior (p. /68)
caudal (p. 168)
dorsal (p. 168)
ventral (p. 168)
midline (p. 170)
medial (p. 170)
lateral (p. 170)
ipsilateral (p. 170)
contralateral (p. 170)
midsagittal plane (p. 170)
sagittal plane (p. 170)
horizontal plane (p. /70)
coronal plane (p. 170)
central nervous system (CNS) (p.
171)
brain (p. 171)
spinal cord (p. 171)
cerebrum (p. 171)
cerebral hemispheres (p. 171)
cerebellum (p. 171)
202 C HAP T E R 7 . THE STRUCTURE OF THE NERVOUS SYSTEM
...
"-
...
" ...
.
. ..
.......... I
.
-
)
'\
,tI
t -
ow
FIGURE 7.28
MRI scans of the authors. How many structures can you label?
--
-
...
At
,
I
,
..
-.....
\.
brain stem (p. 171)
spinal nerve (p. 172)
dorsal root (p. 172)
ventral root (p. 172)
peripheral nervous system (PNS)
(p. 172)
somatic PNS (p. 172)
dorsal root ganglion (p. 173)
visceral PNS (p. 173)
autonomic nervous system (ANS)
(p. 173)
afferent (p. 173)
efferent (p. 173)
cranial nerve (p. 173)
meninges (p. 173)
dura mater (p. 173)
arachnoid membrane (p. 173)
pia mater (p. 174)
cerebrospinal fluid (CSF) (p. 174)
ventricular system (p. 174)
Understanding CNS Structure
Through Development
gray matter (p. 180)
cortex (p. 180)
nucleus (p. 180)
substantia (p. 180)
,I1J
V>
w Z
o
>
wI-
cr.v>
w
:J
a
locus (p. 180)
ganglion (p. 180)
nerve (p. 180)
white matter (p. 180)
tract (p. 180)
bundle (p. 180)
capsule (p. 180)
commissure (p. 180)
lemniscus (p. 180)
neural wbe (p. 181)
neural crest (p. 181)
neurulation (p. 181)
differentiation (p. 182)
forebrain (p. 183)
midbrain (p. 183)
hindbrain (p. 183)
diencephalon (p. 184)
telencephalon (p. 184)
olfactory bulb (p. 184)
lateral ventricle (p. 184)
third ventricle (p. 184)
cerebral cortex (p. 184)
basal telencephalon (p. 184)
thalamus (p. 184)
hypothalamus (p. 184)
cortical white matter (p. 184)
CONCLUDING REMARKS 203
corpus callosum (p. 184)
internal capsule (p. 184)
tectum (p. 187)
tegmentum (p. 187)
cerebral aqueduct (p. 187)
pons (p. 188)
medulla oblongata (medulla)
(p. 188)
fourth ventricle (p. 188)
spinal canal (p. 190)
dorsal horn (p. 190)
ventral horn (p. 190)
sulcus (p. 194)
gyrus (p. 194)
temporal lobe (p. 194)
frontal lobe (p. 194)
central sulcus (p. 194)
parietal lobe (p. 194)
oCcipital lobe (p. 194)
A Guide to the Cerebral
Cortex
hippocampus (p. 196)
olfactory cortex (p. 196)
neocortex (p. 196)
cytoarchitectural map (p. 197)
I. Are the dorsal root ganglia in the central or peripheral nervous system?
2. Is the myelin sheath of optic nerve axons provided by Schwann cells or oligodendroglia? Why?
3. Imagine that you are a neurosurgeon, about to remove a tumor lodged deep inside the brain. The top of the
skull has been removed. What now lies between you and the brain? Which layer(s) must be cut before you
reach the CSF?
4. What is the fate of tissue derived from the embryonic neural tube? Neural crest?
5. Name the three main parts of the hindbrain. Which of these are also part of the brain stem?
6. Where is CSF produced? What path does it take before it is absorbed into the bloodstream? Name the parts
of the CNS it will pass through in its voyage from brain to blood.
7. What are three features that characterize the structure of cerebral cortex?
204 C HAP T E R 7 . THE STRUCTURE OF THE NERVOUS SYSTEM
60.
0:::1.9
Wz
I-
1-0
0:::«
:JW
u...o:::
Creslin E. 1974. Development of the nervous system:
a logical approach to neuroanatomy. ClBA Clinical
Symposium 26: 1-32.
Johnson KA, Becker JA The whole brain atlas.
http://www.med.harvard.edu/AANLIB/home.htmi
Krubitzer l. 1995. The organization of neocortex in
mammals: are species really so different? Trends in
Neurosciences 18:408-418.
Nauta W, Feirtag M. 1986. Fundamental Neuroanatomy.
New York: W H. Freeman.
Watson C. 1995. Basic Human Neuroanatomy: An
Introductory Atlas. 5th ed. New York: Little, Brown.
INTRODUCTION
SURFACE ANATOMY OFTHE BRAIN
THE LATERAL SURFACE OF THE BRAIN
(a) Gross Features
(b) Seleaed Gyri, Sulci, and Fissures
(e) Cerebral lobes and the Insula
(d) Major Sensory, Motor, and Association Areas of Cortex
THE MEDIAL SURFACE OF THE BRAIN
(a) Brain Stem Struaures
(b) Forebrain Struaures
(e) Ventricles
THE VENTRAL SURFACE OF THE BRAIN
THE DORSAL SURFACE OF THE BRAIN
(a) Cerebrum
(b) Cerebrum Removed
(e) Cerebrum and Cerebellum Removed
CROSS-SECTIONAL ANATOMY OF THE BRAIN
CROSS SECTION I: FOREBRAIN AT THALAMUS- TELENCEPHALON JUNCTION
(a) Gross Features
(b) Seleaed Cell and Fiber Groups
CROSS SECTION 2: FOREBRAIN AT MID-THALAMUS
(a) Gross Features
(b) Seleaed Cell and Fiber Groups
CROSS SECTION 3: FOREBRAIN AT THALAMUS-MIDBRAIN JUNCTION
(a) Gross Features
(b) Seleaed Cell and Fiber Groups
CROSS SECTION 4: ROSTRAL MIDBRAIN
CROSS SECTION 5: CAUDAL MIDBRAIN
CROSS SECTION 6: PONS AND CEREBELLUM
CROSS SECTION 7: ROSTRAL MEDULLA
CROSS SECTION 8: MID-MEDULLA
CROSS SECTION 9: MEDULLA-SPINAL CORD JUNCTION
THE SPINAL CORD
THE DORSAL SURFACE OF THE SPINAL CORD AND SPINAL NERVES
THE VENTRAL-LATERAL SURFACE
CROSS-SECTIONAL ANATOMY
THE AUTONOMIC NERVOUS SYSTEM
THE CRANIAL NERVES
THE BLOOD SUPPLY OF THE BRAIN
VENTRAL VIEW
LATERAL VIEW
MEDIAL VIEW (BRAIN STEM REMOVED)
SELF-QUIZ
CHAPTER 7 APPENDIX
An Illustrated
Guide to Human
Neuroanatomy
206 C HAP T E R 7 . APPENDIX: AN ILLUSTRATED GUIDE TO HUMAN NEUROANATOMY
.... INTRODUCTION
As we will see in the remainder of the book, a fruitful way to explore the
nervous system is to divide it up into functional systems. Thus, the olfac-
tory system consists of those parts of the brain that are devoted to the sense
of smell, the visual system includes those parts that are devoted to vision,
and so on. While this functional approach to investigating nervous sys-
tem structure has many merits, it can make the "big picture"-how all
these systems fit together inside the box we call the brain-difficult to see.
The goal of this Illustrated Guide is to help you learn, in advance, about
some of the anatomy that will be discussed in the subsequent chapters.
Here we concentrate on naming the structures and seeing how they are
related physically; their functional significance is discussed in the re-
mainder of the book.
The Guide is organized into six main parts. The first part covers the sur-
face anatomy of the brain-the structures that can been seen by inspection
of the whole brain, as well as those parts that are visible when the two
cerebral hemispheres are separated by a cut in the midsagittal plane. Next,
we explore the cross-sectional anatomy of the brain, using a series of slabs
that contain structures of interest. The brief third and fourth parts cover the
spinal cord and the autonomic nervous system. The fifth part of the Guide
illustrates the cranial nerves and summarizes their diverse functions. The
last part illustrates the blood supply of the brain.
The nervous system has an astonishing number of bits and pieces. In this
Guide, we focus on those structures that will appear later in the book when
we discuss the various functional systems. Nonetheless, even this abbrevi-
ated atlas of neuroanatomy yields a formidable list of new vocabulary.
Therefore, to help you learn the terminology, an extensive self-quiz review
is provided at the end, in the form of a perforated workbook with labeling
exercises.
.... SURFACE ANATOMY OF THE BRAIN
Imagine that you hold in your hands a human brain that has been dis-
sected from the skull. It is wet and spongy and weighs about 1.4 kg
(3 lb). Looking down on the brain's dorsal surface reveals the convoluted
surface of the cerebrum. Flipping the brain over shows the complex ven-
tral surface that normally rests on the floor of the skull. Holding the brain
up and looking at its side-the lateral view-shows the "ram's horn" shape
of the cerebrum coming off the stalk of the brain stem. The brain stem is
shown more clearly if we slice the brain right down the middle and view
its medial surface. In the part of the Guide that follows, we will name the
important structures that are revealed by such an inspection of the brain.
Notice the magnification of the drawings: 1 X is life-size, 2 X is twice life-
size, 0.6X is 60% of life-size, and so on.
206
Y OFTHE BRAIN
'Y SURFACE ANA TOM
207
Dorsal view
Anterior
!
Posterior
Ventral view
r
Posterior
,f \
--l
-
...,-
c
"
-y
1
\
/'
---
"-
")
r ii 1')fl
, \ (O.5X)
-
(O.5X)
Lateral view
(
Medial view
\ \\
...
10. )
" \.
"-
1',,\,
-..... f "
\ " '
- \
, )
(O.5X)
.. Posterior
Anterior 001(
"
\.
-
-
--
((
f,
, --=-
'
"
Anterior .
.. Posterior
(O.5X)
208 C HAP T E R 7 . APPENDIX: AN ILLUSTRATED GUIDE TO HUMAN NEUROANATOMY
The Lateral Surface of the Brain
(a) Gross Features. This is a life-size drawing of the
brain. Gross inspection reveals the three major parts: the
large cerebrum. the brain stem that forms its stalk. and
the rippled cerebellum. The diminutive olfaclOry bulb of
the cerebrum can also be seen in this lateral view.
Cerebrum
\
\0.... '"""-
\..
/
Olfactory bulb
"
"
\
-...'--
-
C".bell"m
(1X)
(b) Selected Gyri, Sulci" and Fissures. The cerebrum is
noteworthy for its convoluted surface. The bumps are
called gyri, and the grooves are called sulci or, if they are
especially deep, fissures. The precise pattern of gyri and
sulci can vary considerably (rom individual to individual,
but many features are common to all human brains. Some
of the important landmarks are labeled here. The post-
... SURFACE ANATOMY OF THE BRAIN 209
central gyrus lies immediately posterior to the central sul-
cus, and the precentral gyrus lies immediately anterior to
the central sulcus. The neurons of the postcentral gyrus
are involved in somatic sensation (touch; Chapter 12),
and those of the precentral gyrus control voluntary move-
ment (Chapter 14). Neurons in the superior temporal
gyrus are involved in audition (hearing; Chapter 11).
Central sulcus
P' nl"" """
1
('
/ /
/'
./
Lateral (Sylvian)
fissu re
(c) Cerebral Lobes and the Insula. By convention,
the cerebrum is subdivided into lobes named after the
bones of the skull that lie over them. The central sulcus
divides the frontal lobe (rom the parietal lobe. The tem-
poral lobe lies immediately ventral to the deep lateral
(Sylvian) fissure. The occipital lobe lies at the very back
Fmnlal be
/
(
\
,
-
/
If
_ f,'
-
/ Postcentral gyrus
,
"
f"---- Superior temporal
gyrus
-
\,
(0.5X)
of the cerebrum, bordering both parietal and temporal
lobes. A buried piece of the cerebral cortex, called the
insula (Latin for "island"), is revealed if the margins of
the lateral fissure are gently pulled apart (inset). The
insula borders and separates the temporal and frontal
lobes.
/Pillielal be
-
"\
\
(\
/' -
/I
ns"'a y"
Occipital lobe
)
.(
-
-
\
,
.....
Temporal lobe
(06X)
210 C HAP T E R 7 . APPENDIX: AN ILLUSTRATED GUIDE TO HUMAN NEUROANATOMY
(d) Major Sensory, Motor, and Association Areas of
Cortex. The cerebral cortex is organized like a patch-
work quilt. The various areas, first identified by Brod-
mann, differ from one another in terms of microscopic
structure and function. Vi.,ual areas 17, 18, and 19
(Chapter 10) are in the occipital lobe, somatic sensory
areas 3, 1, and 2 (Chapter 12) are in the parietal lobe,
Pnmary motor cortex
(area 4)
Supplementary motor area I
(area 6)
Premotor area ...... , /
(area 6) ___--;.:
- .
. '
, ,
3 1 2
"I
'4 5
8 6
, 7' i
9
10 e 41 42 .,
"'\ q"b 22 .....
21 'r-
38 (O.4X)
Brodmann's map
,
7-
Prefrontal cortex
/
Inferotemporal cortex
(areas 20, 21, 37)
. Motor areas
. Sensory areas
. Association areas
Auditory cortex
(areas 41. 42)
and auditory areas 41 and 42 (Chapter 11) are in the
temporal lobe. On the inferior surface of the parietal
lobe (the operculum) and buried in the insula is gusta-
tory area 43, devoted to the sense of taste (Chapter 8).
In addition to the analysis of sensory information, the
cerebral cortex plays an important role in the control of
voluntary movement. The major motor control areas-
primary motor cortex (area 4), the supplementary motor
area, and the premotor area-lie in the frontal lobe, an-
terior to the central sulcus (Chapter 14). In the human
brain, large expanses of cortex cannot be simply assigned
to sensory or motor functions. These constitute the as-
sociation areas of cortex. Some of the more important
areas are the prefrontal cortex (Chapters 21 and 24), the
posterior parietal cortex (Chapters 12, 21, and 24), and
the inferotemporal cortex (Chapter 24).
Somatosensory cortex
(areas 3, 1, 2)
/
/
/
Posterior parietal cortex
(areas 5, 7)
,/
Visual cortex
/" (areas 17, 18, 19)
/"
\
(0.7X)
}(1'
/ < 1 'I\.
(; \ -
/ -
Gustatory cortex ,
(area 43)
- \ \\
\
Thalamus
,
(
/
/
m"m/ \ / '
Midbrain ectum /
Pons X
Med"' \
'
/
Hypothalamus
... SURFACE ANATOMY OFTHE BRAIN 21 1
The Medial Surface of the Brain
(a) Brain Stem Structures. Splitting the brain down
the middle exposes the medial surface of the cerebrum,
shown in this life-size illustration. This view also shows
the midsagittal cut surface of the brain stem, consisting
of the diencephalon (thalamus and hypothalamus), the
midbrain (tectum and tegmentum), the pons, and the
medulla. (Some anatomists define the brain stem as con-
sisting only of the midbrain, pons, and medulla.)
(
\
Pineal body
\
\
..
{ \
/"
./
.-/:
,
I
\
\
,-
/
-----.
------
.., "
If
...........
............... Cerebellum
(1X)
212 C HAP T E R 7 . APPENDIX: AN ILLUSTRATED GUIDE TO HUMAN NEUROANATOMY
(b) Forebrain Structures. Shown here are the im-
portant forebrain structures that can be observed by
viewing the medial surface of the brain. Notice the
cut surface of the corpus callosum, a huge bundle of
axons that connects the two sides of the cerebrum.
The unique contributions of the two cerebral hemi-
spheres to human brain function can be studied in
patients in which the callosum has been sectioned
(Chapter 20). The fornix is another prominent fiber
bundle that connects the hippocampus on each side
with the hypothalamus. (Fornix is Latin tor "arch.")
Cingulate gyrus
(
Fornix
"""' .
-,
/
Olfactory bUlb/
Opl< Oh;"m/
Some of the axons in the fornix regulate memory
storage (Chapter 24).
In the lower illustration, the brain has been tilted
slightly to show the positions of the amygdala and hip-
pocampus. These are "phantom views" of these struc-
tures, because they cannot be observed directly from the
surface. Both lie deep to the overlying cortex. We will
see them again in cross section later in the Guide. The
amygdala (Latin tor "almond") is important for regulat-
ing emotional states (Chapter 18), and the hippocampus
is important for memory (Chapters 24 and 25).
\
\\
Corpus callosum
( / I'"' edge)
\/
l,,-
"'-
\ \\
\
.........
Calcarine fissure
,
)
, (O.7X)
\ \\ (
) I \,
"
1 ,
"- "
I.
- /
(beneath overlying cortex)
/
I
(O.7X)
Brain stem and cerebellum
removed and brain
rotated slightly
Hippocampus
(beneath overlying cortex)
,'-
h...
\.
'\\\r
""
/ \ '-
,,\ ) ))
(O.7X)
Spinal canal '
(c) Ventricles. The lateral walls of the unpaired parts of
the ventricular system-the third ventricle, the cerebral
aqueduct, the fourth ventricle, and the spinal canaJ-
can be observed in the medial view of the brain. These
are handy landmarks, because the thalamus and hypo-
thalamus lie next to the third ventricle; the midbrain lies
next to the aqueduct; the pons, cerebellum, and medulla
lie next to the fourth ventricle; and the spinal cord forms
the walls of the spinal canal.
\
\
(
Thlro veo,,;,le / \
Cerebral aqueduct
Fourth ventricle
... SURFACE ANATOMY OF THE BRAIN 213
The lateral ventricles are paired structures that sprout
like antlers from the third ventricle. A phantom view
of the right lateral ventricle, which lies underneath the
overlying cortex, is shown in the lower illustration.
The two cerebral hemispheres surround the two lateral
ventricles. Notice how a coronal section of the brain at
the thalamus-midbrain junction will intersect the
"horns" of the lateral ventricle of each hemisphere
twice.
\ \ (
y
,'-
'\ I "
"- ...."
'-
Lateral ventricle
(beneath overlying cortex)
(O.7X)
Brain stem and cerebellum
removed and brain
rotated slightly
214 C HAP T E R 7 . APPENDIX: AN ILLUSTRATED GUIDE TO HUMAN NEUROANATOMY
The Ventral Surface of the Brain
The underside of the brain has a lor of distinct anatomi-
cal features. Notice the nerves emerging from the brain
stem; these are the cranial nerves, which are illustrated in
more detail later in the Guide. Also notice the X-shaped
optic chiasm just anterior to the hypothalamus. The chi-
asm is the place where many axons from the eyes decus-
sate (cross) from one side to another. The bundles of ax-
ons anterior to the chiasm, which emerge from the backs
Olfactory bulb
\
Optic nerve -
-
Cranial nerves
of the eyes, are the optic nerves. The bundles lying pos-
terior to the chiasm, that disappear into the thalamus, are
called the optic tracts (Chapter 10). The paired mammil-
lary bodies (Latin for "nipple") are a prominent feature of
the ventral surface of the brain. These nuclei of the hy-
pothalamus are part of the circuitry that stores memory
(Chapter 24) and are a major target of the axons of the
fornix (seen in the medial view). Notice also the olfactory
bulbs (Chapter 8) and the midbrain, pons, and medulla.
"
Optic chiasm
/
Midbrain
,
,
Optic tract
------
Hypothalamus
Mammillary
body
\ )
' -------- Pons
\.
---
Medulla (1X)
Y
}\
Corpus callosum ..
Central sulcus
l.,h
'--
Left hemisphere
'-I
Longitudinal cerebral
fissure
(
"
...............
'"
... SURFACE ANATOMY OF THE BRAIN 215
The Dorsal Surface of the Brain
(a) Cerebrum. The dorsal view of the brain is domi-
nated by the large cerebrum. Notice the paired cerebral
hemispheres. These are connected by the axons of the
corpus callosum (Chapter 20), which can be seen if the
hemispheres are retracted slightly. The medial view of
the brain, illustrated previously, showed the caUosum in
cross section.
Right hemisphere
\
'\
\
-
'-
"\
(1X)
216 C HAP T E R 7 . APPENDIX: AN ILLUSTRATED GUIDE TO HUMAN NEUROANATOMY
(b) Cerebrum Removed. The cerebellum dominates
the dorsal view of the brain if the cerebrum is removed
and the brain is tilted slightly forward. The cerebellum,
an imponant motor control structure (Chapter 14), is di-
vided into two hemispheres and a midline region called
the vermis (Latin for "worm"\.
.....
V'--......
..
....
,\
"
"
Vermis
............
--
"'-
..........
;, ---
,
Right cerebellar
hemisphere
"
Left cerebellar
hemisphere
(O.95X)
Spinal cord
(c) Cerebrum and Cerebellum Removed. The top sur-
face of the brain stem is exposed when both the cerebrum
and the cerebellum are removed. The major divisions of
the brain stem are labeled on the left side, and some spe-
cific structures are labeled on the right side. The pineal
body, lying atop the thalamus, secretes melatonin and is
involved in the regulation of sleep and sexual behavior
(Chapters 17 and 19). The superior colIiculus receives
direct input from the eyes (Chapter 10) and is involved in
the control of eye movements (Chapter 14), while the in-
ferior colliculus is an important component of the auditory
system (Chapter 11). (Colliculus is Latin for "mound.") The
cerebellar peduncles are the large bundles ofaxons that
connect the cerebellum and the brain stem (Chapter 14).
Thalamus Pineal body
Superior colliculus
Midbrain
Inferior colliculus
Pons
L '\ Cerebellar peduncle
l ) (cut surface)
""
"'\
Fourth ventricle (floor)
-....:: \\
\to
(1X)
Y CROSS-SECTIONAL ANATOMY
OF THE BRAIN
Understanding the brain requires that we peer inside it,
and this is accomplished by making cross sections. Cross
sections can be made physically with a knife or, in the
case of noninvasive imaging of the living brain, digitally
with an MRI or a CT scan. For learning the internal or-
ganization of the brain, the best approach is to make
cross sections that are perpendicular to the axis defined
by the embryonic neural tube, called the neuraxis. The
neuraxis bends as the human fetus grows, particularly at
Forebrain Sections
@
@
\,
CD
I
--....
-\
\
?r \0
_\I{ \
/ [\ .:- , ;
,/
(O.6X)
... CROSS-SECTIONAL ANATOMY OF THE BRAIN 217
the junction of the midbrain and thalamus. Conse-
quently, the best plane of section depends on exactly
where along the neuraxis we are looking.
In this part of the Guide, we take a look at drawings
of a series of cross-sectional slabs of the brain, showing
the internal structure of the forebrain (cross sections
1-3), the midbrain (cross sections 4 and 5), the pons and
cerebellum (cross section 6), and the medulla (cross sec-
tions 7-9). The drawings are schematic, meaning that
structures within the slab are sometimes projected onto
the slab's visible surface.
J
Brain Stem Sections
\)l
;;,
\
")
.,.
..(/ I. (
4/
/ r-- 4
1/ J 5
(O.6X)
.-
@
l\.. '-
(])
@@
218 C HAP T E R 7 . APPENDIX: AN ILLUSTRATED GUIDE TO HUMAN NEUROANATOMY
",,1
f.\. 1
,1 \ II
\ -'
,
,
I /
Insula
Lateral (Sylvian)
fissure
CD
,
<
I
Frontal lobe
Basal forebrain
---
Cross Section I: Forebrain at
Thalamus-Telencephalon Junction
(a) Gross Features. The telencephalon surrounds the
lateral ventricles. and the thalamus surrounds the third
ventricle. In this section, the lateral ventricles can be
seen sprouting from the slitlike third ventricle. The hy-
pothalamus, forming the f100r of the third ventricle. is a
vital control center for many basic bodily functions
(Chapters 15-17). The insula (Chapter 8) lies at the base
of the lateral (Sylvian) fissure, here separating the frontal
lobe from the temporal lobe. The heterogeneous region
lying deep within the telencephalon, medial to the in-
sula and lateral to the thalamus, is called the basal fore-
brain.
/ Lateral ventricle
t
J(1
r'
Third ventricle
Hypothalamus
Coq>u' m
/J
(
,)
\..)
(\. -
II', .
.,.\ .f
'"
s::::- /
.-..:::
,
Fiber groups:
Fornix
Cortical
white matter
Internal capsule
CD
........
'p \)
"Y CROSS-SECTIONAL ANATOMY OF THE BRAIN 219
(b) Selected Cell and Fiber Groups. Here we take a
more detailed look at the structures of the forebrain. The
internal capsule is the large collection ofaxons connect-
ing the cortical white matter with the thalamus, and the
corpus callosum is the enormous sling ofaxons con-
necting the cerebral cortex of the two hemispheres. The
fornix, shown earlier in the medial view of the brain, is
shown here in cross section where it loops around the
stalk of the lateral ventricle. The neurons of the closely
associated septal area (from saeptum, Latin for "parti-
tion") contribute axons to the fornix and are involved in
memory storage (Chapter 24). Three important coIlec-
tions of neurons in the basal telencephalon are also
shown: the caudate nucleus, the putamen, and the
globus pallidus. Collectively, these structures are calJed
the basal ganglia and are an important part of the brain
systems that control movement (Chapter 14).
Cell groups:
./
Ce'ebml 00""
Septal area
"
Caudate nucleus
-(
I
I
>
\.
Putamen
Globus pallidus
220 C HAP T E R 7 . ApPENDIX: AN ILLUSTRATED GUIDE TO HUMAN NEUROANATOMY
Cross Section 2: Forebrain at Mid. Thalamus
(a) Gross Features. As we move slightly caudal in the
neuraxis, we see the heart-shaped thalamus (Greek for
"inner chamber") surrounding the small third ventricle
at the brain's core. Just ventral to the thalamus lies the
hypothalamus. The telencephalon is organized much
like what we saw in cross section 1. Because we are
slightly posterior, the lateral fissure here separates the
parietal lobe from the temporal lobe.
0
>
) -.
)\ \ \
\
.,1
,
\ -
' /
Parietal lobe
\
T
'\
I
"
f
:J
Lateral ventricle
Insula
Thalamus
Tem ooA
\
.
( ..
l
)
Lateral (Sylvian)
fissure
,
\
,
-
Third ventricle
"
Basal forebrain
Hypothalamus
(1X)
)
:\ \.
( Caudate nucleus
"-
-....
\
,
Internal capsule
(b) Selected Cell and Fiber Groups. Many important
cell and fiber groups appear at this level of the neuraxis.
One new structure apparent in the telencephalon is
the amygdala, involved in the regulation of emotion
(Chapter 18) and memory (Chapter 24). The thalamus
is divided into separate nuclei, two of which-the ven-
tral posterior nucleus and the ventral lateral nucleus-
))
@
)
\
--.
_-.:.11' .
,;;:
--=
,/
Corpus callosum
Ventral lateral
nucleus
Ventral posterior
nucleus
Putamen
GIOb",pa"'d", ·
/
Amygdala
Substantia nigra
Subthalamus
.... CROSS-SECTIONAL ANATOMY OFTHE BRAIN 221
are labeled. The thalamus provides much of the input to
the cerebral cortex, with different thalamic nuclei pro-
jecting axons to different areas of cortex. The ventral
posterior nucleus, a part of the somatic sensory system
(Chapter 12), projects to the cortex of the postcentral
gyrus. The ventral lateral nucleus and closely related
ventral anterior nucleus (not shown) are parts of the
motor system (Chapter 14); they project to the motor
cortex of the precentral gyrus. Visible below the thala-
mus are the subthalamus and the mammillary bodies of
the hypothalamus. The subthalamus is a part of the
motor system (Chapter 14), while the mammillary bodies
receive information from the fornix and contribute to
the regulation of memory (Chapter 24). Because this
section also encroaches on the midbrain, a little of the
substantia nigra ("black substance") can be seen near the
base of the brain stem. The substantia nigra is also a part
of the motor system (Chapter 14). Parkinson's disease
results from the degeneration of this structure.
Fornix
Cerebral cortex
/
Co";""Whll'
matter
(1X)
Mammillary body
222 C HAP T E R 7 . APPENDIX: AN ILLUSTRATED GUIDE TO HUMAN NEUROANATOMY
@
'\' I
')' .\
,
.. \_,, ' J-
.t l ", .
? _ \ 1/-,
i ."
, - /
II>.
, ..:.. -
\ .
Parietal lobe
Third ventricle
)
\'
I
-./
Thalamus
/
!
\
C-
(
Temporal lobe
\
Midbrain
Cross Section 3: Forebrain at Thalamus-
Midbrain Junction
(a) Gross Features. The neuraxis bends sharply at the
junction of the thalamus and the midbrain. This cross
section is taken at a level where the teardrop-shaped
third ventricle communicates with the cerebral aque-
duct. The brain surrounding the third ventricle is thala-
mus, and the brain around the cerebral aqueduct is mid-
brain. The lateral ventricles of each hemisphere appear
twice in this section. You can see why by reviewing the
phantom view of the ventricle, shown earlier.
1 1
(
;-
---
r-- _
Lateral ventricle
(1X)
Cerebral aqueduct
III.
,
,
@
')1\
\
\
l--
'-
... CROSS-SECTIONAL ANATOMY OF THE BRAIN 223
\
(b) Selected Cell and Fiber Groups. Notice that this
section contains two more important nuclei of the thal-
amus: the medial and lateral geniculate nuclei. (Genicu-
late is Latin for "knee.") The lateral geniculate nucleus
relays information to the visual cortex (Chapter 10), and
the medial geniculate nucleus relays information to the
auditory cortex (Chapter 11). Also notice the location of
the hippocampus, a relatively simple form of cerebral
cortex bordering the lateral ventricle of the temporal
lobe. The hippocampus (Greek for "seahorse") plays an
important role in learning and memory (Chapters 24
and 25).
I ::E
\'
/
':\
r 1
Corpus callosum \ Cerebral cortex
( f
Cortical white
matter
I
"'-
,
.
""---
')--- _____ Lateral geniculate
( nucleus
----
--
----
---
0
\..
-
"
)
,
Hippocampus
(1X)
Medial geniculate nucleus
224 C HAP T E R 7 . APPENDIX: AN ILLUSTRATED GUIDE TO HUMAN NEUROANATOMY
Cross Section 4: Rostral Midbrain
We are now at the midbrain. The plane of section has
been angled relative to the forebrain sections, so that it
remains perpendicular to the neuraxis. The core of the
midbrain is the smalJ cerebral aqueduct. Here, the roof
of the midbrain, also called the tectum (Latin for "roof"),
consists of the paired superior colliculi. As discussed
earlier, the superior colliculus is a part of the visual
system (Chapter 10) and the substantia nigra is a part of
the motor system (Chapter 14). The red nucleus is also
a motor control structure (Chapter 14), while the peri-
aqueductal gray is important in the control of somatic
pain sensations (Chapter 12).
\
'),}
(\
...
--.
Superior colliculus
\
\
Periaqueductal gray
'\
/
\.
!I.' -- ,'4
.r ,
. ,/
(
\
S"'''lao" olg"
Red nUcieus/'
Cross Section 5: Caudal Midbrain
The caudal midbrain appears very similar to the rostral
midbrain. At this level, however, the roof is formed by
the inferior colliculi (part of the auditory system; Chap-
ter II) instead of by the superior collicuJi. Review the
dorsal view of the brain stem to see how the superior
and inferior colliculi are situated relative to each other.
)'1 \
---...
Inferior colliculus
\
....
Periaqueductal gray
I
..f
)
_/1
." 5
"1 ;:::- ,/
/
S""'lao,," o;g,,/
/ C'..b'" 'q"'O""
\
"---
\
(2X)
/ C'..b'" 'q""'"d
"
,
(2X)
-----
/
Cerebellar cortex / /.?
( =
. 1\(
Po",oo _.,,:
formation /'
Pontine nuclei
Cross Section 6: Pons and Cerebellum
This section shows the pons and cerebellum, parts of the
rostraI hindbrain that border the fourth ventricle. As
mentioned earlier, the cerebellum is important in the
control of movement. Much of the input to the cerebel-
lar cortex derives from the pontine nuclei, while the
output of the cerebellum is from neurons of the deep
cerebellar nuclei (Chapter 14). The reticular formation
)\)
--.
\
'-
.....
.r
r J
-------
.
I @
/
Deep cerebellar
nuclei
Cross Section 7: Rostral Medulla
As we move farther caudally along the neuraxis, the
brain surrounding the fourth ventricle becomes the
medulla. The medulla is a compIex region of the brain.
Here we focus only on those structures whose functions
are discussed later in the book. At the very floor of the
medulla lie the medullary pyramids, huge bundles of ax-
ons descending from the forebrain toward the spinal
cord. The pyramids contain the corticospinal tracts,
)')
--.
Ventral cochlear __
nucleus
Raphe nucleus
--
Inferior olive \
Medullary pyramid /
.,1
,
&/0
.... CROSS-SECTIONAL ANATOMY OFTHE BRAIN 225
(reticulum is Latin for Unet U ) runs from the midbrain 10
the medulla at the core of the brain stem, just under the
cerebral aqueduct and fourth ventricle. One function of
the reticular formation is 10 regulate sleep and wake-
fulness (Chapter 19). In addition, a function of the pon-
tine reticular formation is to control body posture
(Chapter 14).
Fourth ventricle
-- .' "
0-' " '\
,, . , ,.
'"
. \ \). II)
' rk I
(0.8><)
which are involved in the control of voluntary move-
ment (Chapter 14). Several nuclei that are important for
hearing are also found in the rostral medulla: the dorsal
and ventral cochlear nuclei and the superior olive (Chap-
ter II). Also shown are the i.nferior olive, important for
motor control (Chapter [4), and the raphe nucleus, im-
portant for the modulation of pain, mood, and wakeful-
ness (Chapters 12, 19, and 22).
Dorsal cochlear nucleus Fourth ventricle
') - -
(2)<)
226 C HAP T E R 7 . APPENDIX: AN ILLUSTRATED GUIDE TO HUMAN NEUROANATOMY
Cross Section 8: Mid-Medulla
The mid-medulla contains some of the same structures
labeled in cross section 7. Notice also the mediallemnis-
cus (Latin for "ribbon"). The rnediallemniscus contains
axons bringing information about somatic sensation to
the thalamus (Chapter 12). The gustatory nucleus,
,\'
\..}'
--.""'"""
,
,
11 1 :
(
).
"'
. I ,
"/j Y
@
Cross Section 9: Medulla-Spinal Cord
Junction
As the medulla disappears, so does the fourth ventricle,
now replaced by the beginning of the "pinal canal. Notice
the dorsal column nuclei, which receive somatic sensory
I
(\ ')
,
.rl , j
" I..
(
Medial lemniscus
I '-
I IItiO::- /'---..
/ -@
... THE SPINAL CORD
The Dorsal Surface of the Spinal Cord
and Spinal Nerves
The spinal cord lies within the vertebral column. The
spinal nerves, a part of the somatic PNS, communicate
with the cord via notches between the vertebrae. The
vertebrae are described according to their location. In
the neck, they are called cervical verrebrae and are
numbered from Cl to C7. The vertebrae attached to ribs
are called thoracic vertebrae and are numbered from Tl
to T12. The five vertebrae of the lower back are called
serving the sense of taste (Chapter 8), is part of a larger
nucleus of the solitary tract, which regulates aspects of
visceral function (Chapters I5 and 16). The vestibular
nuclei serve the sense of balance (Chapter 11).
Fourth ventricle
Vestibular nucleus /
Nucleus of the
solitary tract
/
(gustatory nucleus)
.
Medullary relicular
formation I
'0,.,10' orr,e---;/?
M""" 'emo""" /
Medullary pyramid
(2X)
information from the spinal cord (Chapter 12). Axons
arising from the neurons in each dorsal column nucleus
cross to the other side of the brain (decussate) and ascend
to the thalamus via the medial lemniscus.
Dorsal column nuclei
""
Spinal canal
/
Medullary pyramid /
L
(2.5X)
lumbar, and those within the pelvic area are called
sacral.
The spinal nerves and the associated segments of the
spinal cord adopt the names of the vertebrae; eight cer-
vical nerves are associated with seven cervical vertebrae.
Also, the spinal cord in the adult human ends at about
the level of the third lumbar vertebra. This disparity
arises because the spinal cord does not grow after birth,
whereas the spinal column does. The bundles of spinal
nerves streaming down within the lumbar and sacral
vertebral column are called the cauda equina (Latin for
"horse's tail").
.,. THE SPINAL CORD 227
.
1 st cervical nerve
1st cervical vertebra (C1)
v
7th cervical vertebra (C7)
8
," -'" ".
/'
( I ,
1/
'. ")
....--
/'
,:1' I':
-...
/ "J -,-. \:-
/'
/
/"
i i "
I
I
5th lumbar vertebra (L5)
, , ,
:;
5th lumbar nerve
1st sacral vertebra (S1)
1 st sacral nerve
':JJ::7
"-
228 C HAP T E R 7 . APPENDIX: AN ILLUSTRATED GUIDE TO HUMAN NEUROANATOMY
The Ventral-Lateral Surface
This view shows how the spinal nerves attach to the
spinal cord and how the spinal meninges are organized.
As the nerve passes into the vertebral notch (not shown),
it splits into two roots. The dorsal root carries sensory
aXOns whose cell bodies lie in the dorsal root ganglia.
The ventral root carries motor axons arising from the
gray matter of the ventral spinal cord. The butterfly-
shaped core of the spinal cord is gray matter consisting
Dorsal horn
Lale"" ""omo \
/
Ventral horn
Ventral column
--........
'----
!
Spinal pia mater ---------r- "---
Subarachnoid
space \
Spinal arachnoid
Spinal dura mater ---------------
)
VENTRAL
of neuronal cell bodies. The gray matter is divided into
the dorsal. lateral. and ventral horns. Notice how the
organization of gray and white matter in the spinal cord
differs from that in the forebrain. In the forebrain, the
gray matter surrounds the white matter; in the spinal
cord, it is the other way around. The thick shell of white
matter. containing the long axons that run up and down
the cord, is divided into three columns: the dorsa]
culumns, the lateral columns, and the ventral columns.
Lateral horn
---- Spinal nerve
--
Ventral root
Ventral root
filaments
(6X)
Cross-Sectional Anatomy
Illustrated in this view are some of the important tracts
ofaxons running up and down the spinal cord. On the
left side, the major ascending sensory pathways are in-
dicated. The entire dorsal column consists of sensory ax-
ons ascending to the brain. This pathway is important
for the conscious appreciation of touch. The spinothala-
mic tract carries information about painful stimuli and
temperature. The somatic sensory system is the topic of
Chapter 12.
On the right side are some of the descending tracts im-
Ascending Sensory Pathways
A
Dorsal column
Spinothalamic tract
... THE SPINAL CORD 229
portant for the control of movement (Chapter 14). The
names of the tracts accurately describe their origins and
terminations (e.g., the vestibulospinal tract originates in
the vestibular nuclei of the medulla and terminates in
the spinal cord). The descending tracts contribute to two
pathways: the lateral and ventromedial pathways. The
lateral pathway carries the commands for voluntary
movements, especially of the extremities. The ventro-
medial pathway participates primarily in the mainte-
nance of posture and certain reflex movements.
Descending Motor Pathways
.
corticosPinal tract \ Lateral
, pathway
A Rubrospinal tract
) (9XI
Medullary reticulospinal
tract
Tectospinal tract
Pontine reticulospinal tract
Ventromedial
pathway
230 C HAP T E R 7 . APPENDIX: AN ILLUSTRATED GUIDE TO HUMAN NEUROANATOMY
THE AUTONOMIC NERVOUS SYSTEM
In addition to the somatic PNS, which is devoted largely
to the voluntary control of movement and conscious
skin sensations, there is the visceral PNS, devoted to the
regulation of the internal organs, glands, and vascula-
ture. Because this regulation occurs automatically and is
not under direct conscious control, this system is called
the autonomic nervous system, or ANS. The two most
important divisions of the ANS are the sympathetic and
parasympathetic divisions.
The illustration OD the facing page shows the cavity of
the body as it appears when it has been sectioned sagit-
tally at the level of the eye. Notice the vertebral column,
which is encased in a thick wall of connective tissue. The
spinal nerves can be seen emerging from the column.
Notice that the sympathetic division of the ANS consists
of a chain of ganglia that runs along the side of the ver-
tebral column. These sympathetic ganglia communicate
with the spinal nerves. with one another. and with a
large number of internal organs.
The parasympathetic division of the ANS is organized
quite differently. Much of the parasympathetic innerva-
tion of the viscera arises from the vagus nerve, one of
the cranial nerves emerging from the medulla. The other
major source of parasympathetic fibers is the sacral spinal
nerves.
The two divisions of the ANS exert opposite effects
on body physiology. For example, the sympathetic nerv-
ous system speeds heart rate, while the parasympa-
thetic nervous system slows it down. In general, the
sympathetic division is activated to prepare the body
for stressful conditions, such as escaping danger,
whereas the parasympathetic division is most active
under vegetative conditions, such as digesting a large
meal. (The functional organization of the ANS is dis-
cussed in Chapter 15.)
Plane of
section
(
I
\
" , -----
I
Vagus nerve ""--
('-
I 1
..
, \,
I,t ,
-
,
- I
,.
\ \. 'KJ
"' :
7"",
) '\,
... 1<:1" ....\
\\..
'
\/t
Vertebral column
Ribs of the
right side (cut)
Kidney
Sympathetic ganglia
(
"-
,
-
... THE AUTONOMIC NERVOUS SYSTEM 23 I
Heart
Stomach
Small intestine
Urinary bladder
,
Prostate gland
Sympathetic fibers
Parasympathetic fibers
232 C H A PT E R 7 . APPENDIX: AN ILLUSTRATED GUIDETO HUMAN NEUROANATOMY
'Y THE CRANIAL NERVES
Twelve pairs of cranial nerves emerge from the base of
the brain. The first two "nerves" are actually parts of the
CNS, serving olfaction and vision. The rest are like the
spinal nerves, in that they contain axons of the PNS. As
the illustration shows, however, a single nerve often has
fibers performing many different functions. Knowledge
of the nerves and their diverse functions is a valuable aid
in the diagnosis of a number of neurological disorders. It
is important to recognize that the cranial nerves have
associated cranial nerve nuclei in the midbrain, pons,
and medulla. Examples are the cochlear and vestibular
nuclei, which receive information from cranial nerve
VIII. Most of cranial nerve nuclei were not illustrated
or labeled in the brain stem cross sections, however,
because their functions are not discussed explicitly in
this book.
----
'-
,
I. Olfactory
)
,
".OpOC
._____111. Oculomotor
IV. Trochlear
'-
-- ---" __ V. Trigeminal
...L- VI. Abducens
......
\
,
.
(
\\
\
t r "
\,
{ · · TI1Jl X V,"",
, - XI. Spinal accessory
,
"'-
(1X) XII. Hypoglossal
IX. Glossopharyngeal
NERVE NUMBER AND NAME
I. Olfactory
II. Optic
III. Oculomotor
IV Trochlear
V. Trigeminal
VI. Abducens
VII. Facial
VIII. Auditory-vestibular
IX. Glossopharyngeal
X. Vagus
XI. Spinal accessory
XII. Hypoglossal
TYPES OFAXONS
Special sensory
Special sensory
Somatic motor
Visceral motor
Somatic motor
Somatic sensory
Somatic motor
Somatic motor
Somatic sensory
Special sensory
Special sensory
Somatic motor
Visceral motor
Special sensory
Visceral sensory
Visceral motor
Visceral sensory
Somatic motor
Somatic motor
Somatic motor
..... THE CRANIAL NERVES 233
IMPORTANT FUNCTIONS
Sensation of smell
Sensation of vision
Movements of the eye and eyelid
Parasympathetic control of pupil size
Movements of the eye
Sensation of touch to the face
l'1ovement of muscles of mastication (chewing)
l'1ovements of the eye
l'1ovement of muscles of facial expression
Sensation of taste in anterior two-thirds of
the tongue
Sensation of hearing and balance
Movement of muscles in the throat
(oropharynx)
Parasympathetic control of the salivary glands
Sensation of taste in posterior one-third of
the tongue
Detection of blood pressure changes in the
aorta
Parasympathetic control of the heart, lungs,
and abdominal organs
Sensation of pain associated with viscera
Movement of muscles in the throat
(oropharynx)
l'1ovement of muscles in the throat and neck
l'1ovement of the tongue
234 C HAP T E R 7 . APPENDIX: AN ILLUSTRATED GUIDE TO HUMAN NEUROANATOMY
T THE BLOOD SUPPLY OF THE BRAIN
Ventral View
Two pairs of arteries supply blood to the brain: the ver-
tebral arteries and the internal carotid arteries. The ver-
tebral arteries converge near the base of the pons to
form the unpaired basilar artery. At the level of the
midbrain, the basilar artery splits into the right and left
superior cerebellar arteries and the posterior cerebral
arteries. The posterior cerebral arteries send branches,
called posterior communicating arteries, that connect
them to the internal carotids. The internal carotids
/
Anterior cerebral artery
Anterior communicating
artery
\
Middle cerebral )
artery
'.
\
)
Internal carotid
artery
-
,
"
.I
Posterior ---------------
communicating
artery
.
R.
\
(
Basilar artery
,
branch to form the middle cerebral arteries and the
anterior cerebral arteries. The anterior cerebral arteries
of each side are connected by the anterior communicat-
ing artery. Thus, there is a ring of connected arteries at
the base of the brain, formed by the posterior cerebral
and communicating arteries, the internal carotids, and
the anterior cerebral and communicating arteries. This
ring is called the circle oj Willis.
"
"'
\
\
"
"",
-=. \ ' _";0' 0'''''''",
, '_ --.......... artery
- _ '\. "" Sope,;o< ""rob,"a,
. ... 0\\\ " artery
:, , )) I ,
"
'
..
'\ \
" .,
I
7 ...... l..
A_
(1X)
'V
Vertebral arteries
.,. THE BLOOD SUPPLY OFTHE BRAIN 235
Lateral View
Terminal cortical
branches of anterior
cerebral artery
Most of the lateral surface of the cerebrum is supplied
by the middle cerebral artery. This artery also feeds the
deep structures of the basal forebrain.
)
" "\... )
t . I
\
\
'-
/ -\
M d" ",..b,", arte"'/ I
\
,
_ J J
"'
.
\
t
..,
(O.7X)
Terminal cortical
branches of posterior
cerebral artery
Medial View (Brain Stem Removed)
Most of the medial wall of the cerebral hemisphere is
supplied by the anterior cerebral artery. The posterior
cerebral artery feeds the medial wall of the occipital lobe
and the inferior part of the temporal lobe.
'i
\ }--- ) \ {
I f 1 '
--
\
" ':::::,... "- '- J "-
\ ......
--.
-
/
.""'... ",..b,", arte", /
'-
\ .\ - ,
\ .... \: (O.7X)
Posterior
cerebral artery
Posterior
communicating artery
236 C HAP T E R 7 . APPENDIX: AN ILLUSTRATED GUIDE TO HUMAN NEUROANATOMY
T SELF-QUIZ
This review workbook is designed to help you learn the neuroanatomy that
has been presented. Here we have reproduced the images from the Guide;
instead of labels, howevec numbered leader lines (arranged clockwise)
point to the structures of interest. Test your knowledge by filling in the ap-
propriate names in the spaces provided. To review what you have learned,
quiz yourself by putting your hand over the names. This technique greatly
facilitates the learning and retention of anatomical terms. Mastery of the
vocabulary of neuroanatomy will serve you well as you learn about the
functional organization of the brain in the remainder of the book.
THE LATERAL SURFACE OF THE BRAIN
(a) Gross Features
-
2
-
I.
"
2.
(
3.
-
1/
"> ((
, .
: '\
4.
3
(b) Selected Gyri. Sulci. and Fissures
7 8
6 5.
6.
\
7.
8.
9
( ( ( .....-- - 9.
I r ,..
5 '\
... SELF-QUIZ 237
THE LATERAL SURFACE OF THE BRAIN
(c) Cerebral Lobes and the Insula
3
-- /
2 I
/
"" '-
( '\ \
Y
10-. _
f( f_
-
';.- r ---
" "
I.
2.
3.
4
4.
5
/.
..
G
5.
(d) Major Sensory, Motor, and Association Areas of Cortex
11 12 6.
10 \
/13
9 / 7. ---
/
..._.. , ...
8.
'> /14 9.
( 10.
,/ II.
--
/ 12.
8 I
I _ /,15 13.
>
7 6 / ,
, 14.
G' .
15.
238 C HAP T E R 7 . APPENDIX: AN ILLUSTRATED GUIDE TO HUMAN NEUROANATOMY
THE MEDIAL SURFACE OF THE BRAIN
(a) Brain Stem Structures
)...
8
/
\......
""
/ ' ,\ I j"\\o
6/ " I,..
.-/ T .'
3 ,/ /-'
....
\ \ ) ((
I.
2.
3.
4.
5.
6.
9 7.
8.
9.
7
"\..
(b) Forebrain Structures
12
13
, ,r;;-=
"\..{
/'-- ./
11
14
10.
\.
\......
)
i; "'"
""'15
"
II.
10
12.
13.
14.
15.
\- ,-- \ \\ )
(lr
.'-.
16.
,
"
17.
,
7'
/
17
16
Brain stem and cerebellum
removed and brain
rotated slightly
... SELF-QUIZ 239
THE MEDIAL SURFACE OF THE BRAIN
(c) Ventricles
, \ \\ J ((
).- -
f ,'-
'" ....
\
). \ \ \ /'\1' I.
4 " . ""
X. '.
I '. 2.
3 " - "
2 /,\ 3.
1
\ 4.
\
5.
...
,'-
) ...
,
5
Brain stem and cerebellum
removed and brain
rotated slightly
6.
THE VENTRAL SURFACE OF THE BRAIN
(a) Gross features
7.
8
8.
9.
10.
II.
12.
7
15
13.
14.
15.
240 C HAP T E R 7 . APPENDIX: AN ILLUSTRATED GUIDE TO HUMAN NEUROANATOMY
THE DORSAL SURFACE OF THE BRAIN
(a) Cerebrum
y
l
2-
\Y/
/\. '
1
,(
(b) Cerebrum Removed
7
--
.......
6
;
9
(c) Cerebrum and Cerebellum Removed
12 " '-- 13
14
11 ) -15
10
t
16
\\ I 17
5
/
8
I.
2.
3.
4.
5.
6.
7.
8.
9.
10.
II.
12.
13.
14.
IS.
16.
17.
... SELF-QUIZ 241
FOREBRAIN AT THALAMUS-TELENCEPHALON JUNCTION
(a) Gross Features
I.
XriI 7 2.
--- ..
, X . . 3.
t I \f 8 4.
5 ( "I 5.
4 6.
\. \d 9
X 7.
3
8.
9.
(b) Selected Cell and Fiber Groups
10.
13 14
/ II.
12 /V 12.
(
('- 13.
11
14.
10 15.
18
t-
16.
17.
lB.
242 C HAP T E R 7 . APPENDIX: AN ILLUSTRATED GUIDE TO HUMAN NEUROANATOMY
FOREBRAIN AT MID-THALAMUS
(a) Gross Features
5
-<
4
) ;J--- a
3 A
2
(b) Selected Cell and Fiber Groups
15
11
10
..
9
18
19
/
7
\ -
--- 17.
-----21
19.
22
23
I.
2.
3.
4.
5.
6.
7.
8.
9.
10.
II.
12.
13.
14.
15.
16.
18.
20.
21.
22.
23.
... SelF-QUIZ 243
FOREBRAIN AT THALAMUS-MIDBRAIN JUNCTION
(a) Gross Features
I.
)(
r
1
r
--
r
+
2.
4
3.
r
\
':"..j
/ J
s:J \
n /
4.
. 6
- '.
....
JEJ
/
s.
3
.
F-
2 A
6.
7.
7
(b) Selected Cell and Fiber Groups
.: t 8.
9 \ _____10
f 9.
,....
../ - 10.
---; ' 11
II.
. Y "
11l. -
12.
\ 13.
12
13
244 C HAP T E R 7 . APPENDIX: AN ILLUSTRATED GUIDE TO HUMAN NEUROANATOMY
ROSTRAL MIDBRAIN
4 5
\ / I.
3 _________ 2.
/
'\ 3.
2 / "- 4.
"-
1 5.
CAUDAL MIDBRAIN
7
6\_ /'
6.
I
...I
7.
8.
6/
'.
9.
PONS AND CEREBELLUM
14
L
...... %,
. .'\. '
'\\ '
( : ) \'\.
. ",,\\, ,'I)'
1 1t'¥,1 I
10.
-------
r
13___ / d ' /?
{ i'i/(
12 {
11/
,,/ /
10
II.
12.
13.
14.
... SELF-QUIZ 245
ROSTRAL MEDULLA I.
7 2.
6 '-)/ -
\
5 ------, 3.
4 4.
3
2// 5.
6.
1
7.
MID-MEDULLA
14 8.
13 -/
12 9.
.
10.
11 I
/f/
II.
10
./ 12.
8 13.
14.
MEDULLA-SPINAL CORD JUNCTION
17 /18
/ 15.
16- 16.
/ 17.
L--/
15 18.
246 C HAP T E R 7 . APPENDIX: AN ILLUSTRATED GUIDE TO HUMAN NEUROANATOMY
SPINAL CORD. VENTRAL-LATERAL SURFACE
8 9
7 \ 10 DORSAL
6 XO 11
5 . _
\
\
\
. ...... ______14
'-- 11
:--t,--- -15
2
_ _ _...... , 16
1------
...
]
"-
.
a
VENTRAL
SPINAL CORD, CROSS-SECTIONAL ANATOMY
20
.
21
.
22\ 24
y:: 23 \
co
U /
7---- 25
16-->< ::
28
12
13
17
I.
2.
3.
4.
5.
6.
7.
8.
9.
10.
II.
12.
13.
14.
15.
16.
17.
18.
19.
20.
21.
22.
23.
24.
25.
26.
27.
28.
29.
THE CRANIAL NERVES
-,.--.
}
\
-
'-
.
__4
5
\1)
:/lJ
, 11ft 7
1 -" . 8
\\ --
1 r---= 9
I 1 1 111/ 1 ' 10
"-
.... SELF-QUIZ
247
I.
2.
3.
4.
5.
6.
7.
6
8.
9.
11
10.
12
II.
12.
248 C HAP T E R 7 . APPENDIX: AN ILLUSTRATED GUIDE TO HUMAN NEUROANATOMY
THE BLOOD SUPPLY OFTHE BRAIN
-
I.
5
t
2.
3.
:J \, --l ,
.
__ ." 7
1 ; ., I ,t ) : 8
I J
, I , -
(
4.
5.
6.
7.
8.
9
11
,
j
\.1
-,
'--
9.
-- ,
//' "-
10
I J
\- 10.
1
< :j II.
12.
12
} \ J I \
13.
" \ 1,
I 14.
'-, '- (
'. -,
'--. '. ,
\ '-
... \ 1::.. 15.
/',
13/ \
14
15
SENSORY AND
MOTOR SYSTEMS
PART II
I
The Chemical Senses
INTRODUCTION
TASTE
THE BASIC TASTES
THE ORGANS OF TASTE
TASTE RECEPTOR CELLS
MECHANISMS OF TASTE TRANSDUCTION
Saltiness
Sourness
Bitterness
Sweetness
Umami (Amino Acids)
. Box 8.1 Path of Discovery: A Journey Through the Senses, by Charles S. Zuker
CENTRAL TASTE PATHWAYS
. Box 8.2 Of Special Interest: Memories of a Very Bad Meal
THE NEURAL CODING OF TASTE
SMELL
. Box 8.3 Of Special [nterest: Human Pheromones?
THE ORGANS OF SMELL
OLFACTORY RECEPTOR NEURONS
Olfactory Transduction
CENTRAL OLFACTORY PATHWAYS
SPATIAL AND TEMPORAL REPRESENTATIONS OF OLFACTORY INFORMATION
Olfactory Population Coding
Olfactory Maps
Temporal Coding in the Olfactory System
CONCLUDING REMARKS
CHAPTER
252 C HAP T E R 8 . THE CHEMICAL SENSES
... INTRODUCTION
life evolved in a sea of chemicals. From the beginning, organisms have
floated or swum in water containing chemical substances that signal food,
poison, or sex. In this sense, things have not changed much in 3 billion
years. Animals, including humans, depend on the chemical senses to help
identify nourishment (the sweetness of honey, the aroma of pizza), nox-
ious substances (the bitterness of plant poisons), or the suitability of a po-
tential mate. Chemical sensation is the oldest and most common of the sen-
sory systems. Even brainless bacteria can detect, and tumble toward, a
favorable food source.
Multicellular organisms must derect chemicals in both their internal and
external environments. The variety of chemical detection systems has ex-
panded considerably over the course of evolution. Humans live in a sea
of air, full of volarile chemicals; we put chemicals into our mouth for a va-
riety of reasons, and we carry a complex sea wirhin us in the form of blood
and the other fluids that bathe our cells. We have specialized detection sys-
tems for the chemicals in each milieu. The mechanisms of chemical sensa-
tion that originally evolved to detect environmental substances now serve
as the basis for chemical communication between cells and organs, using
hormones and neurotransmitters. Virtually every cell in every organism is
responsive to many chemicals.
In this chapter, we consider the most familiar of our chemical senses:
taste, or gustation, and smell, or olfaction. Although taste and smell
reach our awareness most often, they are not the only important chemical
senses we have. Many types of chemically sensitive cells, called chemore-
ceptors, are distribured throughout the body. For example, some nerve
endings in skin and mucous membranes warn us of irritating chemicals. A
wide range of chemoreceptors report subconsciously and consciously about
our internal state: Nerve endings in the digestive organs detect many types
of ingested substances. receptors in arteries of the neck measure carbon
dioxide and oxygen levels in our blood, and sensory endings in muscles
respond to acidity, giving us the burning feeling that comes with exertion
and oxygen debt.
Gustation and olfaction have a similar task: rhe detection of environ-
mental chemicals. In fact, only by using both senses can the nervous sys-
tem perceive flavor. Gustation and olfaction have unusually strong and direct
connections with our most basic internal needs, including thirst, hunger,
emotion, sex, and certain forms of memory. However, the systems of gus-
tation and olfaction are separate and different-from the structures and
mechanisms of their chemoreceptors, to the gross organization of their cen-
tral connections, to their effects on behavior. The neural information from
each system is processed in parallel and is merged at rather high levels in
the cerebral cortex.
... TASTE
Humans evolved as omnivores (from the Latin omnis, "all:' and vorare, "to
eat"), opportunistically eating the plants and animals they could gather,
scavenge, or kill. A sensitive and versatile system of taste was necessary to
distinguish between new sources of food and potential toxins. Some of
our taste preferences are inborn. We have an innate preference for sweet-
ness, satisfied by mother's milk. Bitter substances are instinctively rejected
and, indeed, many kinds of poisons are bitter. However, experience can
strongly modify our instincts, and we can learn to tolerate and even enjoy
the bitterness of such substances as coffee and quinine. The body also has
the capacity to recognize a deficiency of cerrain key nutrients and develop
an appetite for them. For example, when deprived of essential salt, we may
crave salty foods.
The Basic Tastes
Although the number of different chemicals is endless and the variety of
flavors seems immeasurable, it is likely that we can recognize only a few
basic tastes. Most neuroscientists put the number at five. The four obvious
taste qualities are saltiness, sourness, sweetness, and bitterness. The more
unfamiliar fifth taste quality is umami, meaning "delicious" in Japanese. It
is defined by the savory taste of the amino acid glutamate; monosodium
glutamate, or MSG, is the familiar culinary form. The five categories of taste
qualities seem to be common across human cultures.
The correspondence between chemistry and taste is obvious in some
cases. Most acids taste sour, and most salts taste salty. But the chemistry of
substances can vary considerably, while their basic taste remains the same.
Many substances are sweet from familiar sugars (like fructose, present in
fruits and honey, and sucrose, which is white table sugar) to certain pro-
teins (monellin, from the African serendipity berry) to artificial sweeteners
(saccharin and aspartame, the second of which is made from two amino
acids). Surprisingly, sugars are the least sweet of all of these; gram for gram,
the artificial sweeteners and proteins are 10,000-100,000 times sweeter
than sucrose. Bitter substances range from simple ions like K+ (KCl actually
evokes both bitter and salty tastes) and Mg2+ to complex organic molecules
such as quinine and caffeine. Many bitter organic compounds can be tasted
even at very low concentrations, down to the nanomolar range. There is
an obvious advantage to this, as poisonous substances are often bitter.
How, then, do we perceive the countless flavors of food, such as choco-
late, strawberries, and barbecue sauce? First each food activates a different
combination of the basic tastes, helping make it unique. Second, most foods
have a distinctive flavor as a result of their taste and smell, occurring simul-
taneously. For example, without the sense of smell, a bite of onion can be
easily mistaken for the bite of an apple. Third, other sensory modalities
contribute to a unique food-tasting experience. Texture and temperature
are important and pain sensations are essential to the hot spicy flavor of
foods laced with capsaicin, the key ingredient in hot peppers. Therefore, to
distinguish the unique flavor of a food, our brain actually combines sensory
information about its taste, its smell, and its feel.
The Organs of Taste
Experience tells us that we taste with our tongue, but other areas of the
mouth, such as the palate, pharynx, and epiglottis, are also involved (Fig-
ure 8.1). Odors from the food we are eating can also pass, via the pharynx,
into the nasal cavity, where they can be detected by olfactory receptors. The
tip of the tongue is most sensitive to sweetness, the back of it to bitterness,
and the sides to saltiness and sourness. This does not mean, however, that
we taste sweetness only with the tip of our tongue. Most of the tongue is
sensitive to all basic tastes.
Scattered about the surface of the tongue are small projections called
papillae (Latin for "bumps"). Papillae are shaped like ridges (foliate papillae),
pimples (vallate papillae), or mushrooms (fungiform papillae) (Figure 8.2a).
Facing a mirror, stick your tongue out and shine a flashlight on it, and you
will see your papillae easily-small, rounded ones at the front and sides,
and large ones in the back. Each papilla has from one to several hundred
... TASTE 253
Palate
Epiglottis
\
FIGURE 8.1
Anatomy of the mouth, throat, and
nasal passages. Taste is primarily a function
of the tongue, but regions of the pharynx,
palate. and epiglottis have some sensitivity.
Notice how the nasal passages are located
so that odors from ingested food can enter
through the nose or the pharynx. thereby
easily contributing to perceptions of flavor
through olfaction.
254 C HAP T E R 8 . THE CHEMICAL SENSES
FIGURE 8.2
The tongue, its papillae, and its taste
buds. (a) Papillae are the taste-sensitive
structures. The largest and most posterior are
the vallate papillae. Foliate papillae are elon-
gated. Fungiform papillae are relatively large
toward the back of the tongue and much
smalier along the sides and tip. (b) A cross-
sectional view of a vallate papilla. showing the
locations of taste buds. (c) A taste bud is a
cluster of taste cells (the receptor cells), gusta-
tory afferent axons and their synapses with
taste cells, and basal cells. i1icrovilli at the api-
cal end of the taste cells extend into the taste
pore, the site where chemicals dissolved in
saliva can interact directly with taste cells.
Vallate
papillae
Basal cells
\ Taste cells
Taste pore
\
I '\ 'l..
\ \
\
tr- \
-
r\- ....
p -...
G"talo'Y /
afferent
axons
Synapse Microvilli
(c) \
Papilla
"
Foliate
papillae
I
II
/ ,
.
\ .
.'
\
\ '
/
j/
/
Fungiform
papillae
Tongue
(a)
Taste buds
(b)
taste buds, visible only with a microscope (Figure B.2b). Each taste bud
has 50-150 taste receptor cells, or taste cells, arranged within the bud
like the sections of an orange. Taste cells are only about 1 % of the tongue
epithelium. Taste buds also have basal cells that surround the taste cells,
plus a set of gustatory afferent axons (Figure B.2c). A person typically has
2000-5000 taste buds, although exceptional cases have as few as 500 or as
many as 20,000.
Using tiny droplets, it is possible to expose a single papilla on a person's
tongue to low concentrations of various basic taste stimuli (something almost
purely sour, like vinegar, or almost purely sweet. like a sucrose solution).
Concentrations too low will not be tasted, but at some critical concentra-
tion, the stimulus will evoke a perception of taste-this is the threshold
concentration. At concentrations just above threshold, most papillae tend
to be sensitive to only one basic taste; there are sour-sensitive papillae and
sweet-sensitive papillae, for example. When the concentrations of the taste
stimuli are increased, however. most papillae become less selective. Whereas
a papilla might have responded only to sweet when all stimuli were weak,
it may also respond to sour and salt if they are made stronger.
This relative lack of specificity is a common phenomenon in sensory
systems. Many sensory receptors are surprisingly indiscriminate about the
things that excite them. This presents a paradox: It single taste receptors
show only small differences in response to ice cream and bananas, how can
we distinguish reliably between differences as subtle as two kinds of choco-
late? The answer lies in the brain.
Taste Receptor Cells
The chemically sensitive part of a taste receptor cell is its small membrane
region, called the apical end, near the surface of the tongue. The apical ends
have thin extensions called microvilli that project into the taste pore, a small
opening on the surface of the tongue where the taste cell is exposed to the
contents of the mouth (see Figure 8.2c). Taste receptor cells are not neu-
rons, by standard histological criteria. However, they do form synapses with
the endings of the gustatory afferent axons near the bottom of the taste
bud. Taste receptor cells also make both electrical and chemical synapses
onto some of the basal cells; some basal cells synapse onto the sensory ax-
ons, and these may form a simple information-processing circuit within
each taste bud. Cells of the taste bud undergo a constant cycle of growth.
death, and regeneration; the lifespan of one taste cell is about 2 weeks. This
process depends on an influence of the sensory nerve, because if the nerve
is cut, the taste buds will degenerate.
When a taste receptor cell is activated by an appropriate chemical, its
membrane potential changes, usually by depolarizing. This voltage shift is
called the receptor potential (Figure 8.3a). If the receptor potential is de-
polarizing and large enough, most taste receptor cells, like neurons, may
fire action potentials. In any case, depolarization of the receptor membrane
causes voltage-gated calcium channels to open; Ca2+ enters the cytoplasm,
triggering the release of transmitter molecules. This is basic synaptic trans-
mission, from taste cell to sensory axon. The identity of the taste receptor's
transmitter is unknown, but we do know that it excites the postsynaptic
sensory axon and causes it to fire action potentials (Figure 8.3bL which
communicate the taste signal into the brain stem.
More than 90% of receptor cells respond to two or more of the basic
tastes, emphasizing that even the first cells in the taste process can be
NaCI Quinine HCI Sucrose
V m Cell 1
Vm l Cell 2
V m Cell 3
(a)
NaCI Quinine HCI Sucrose
Axon 1
Axon 2
I 1 1 I 1 I 1 1 1 1 1 1111111111111 Axon 3
(b)
} Gustatory
afferent
axofls
... TASTE 255
FIGURE 8.3
Taste responsiveness of taste cells and
gustatory axons. (a) Three different cells
were exposed to salt (NaCI), bitter (quinine),
sour (HCI), and sweet (sucrose) stimuli, and
their membrane potential was recorded with
electrodes. Notice the different sensitivities
of the three cells. (b) In this case, the action
potential discharge of the sensory axons was
recorded. This is an example of extracellular
recording of action potentials. Each vertical
deflection in the record is a single action
potential.
256 C HAP T E R 8 . THE CHEMICAL SENSES
<..)
(I)
({)
.'£!
({)
(ij
'E 50
(I)
(5
D-
c
o
TI
«
100
o
Sucrose NaCI
HCI
I
Quinine
FIGURE 8.4
Action potential firing rates of four
different primary gustatory nerve
axons in a rat. The taste stimuli were sweet
(sucrose), salt (NaCl), sour (HCI), and bitter
(quinine). Each colored line represents meas-
urements from a single axon. Notice the dIf-
ferences in selectivity between axons. (Source:
Adapted from Sato, 1980, p. 23.)
relatively unselective to chemical types. An example is cell 2 in Figure 8.3a,
which gives strong depolarizing responses to both salt (NaCl) and sour
(HCl, hydrochloric acid) stimuli. Taste cells and gustatory axons differ
widely in their response preferences, however. Each of the gustatory axons
in Figure 8.3b is influenced by four of the basic tastes, but each has a clearly
different bias.
Figure 8.4 shows the resuhs of similar recordings from four gustatory
axons in a rat. One responds strongly only to salt, one only to sweet, and
two to all but sweet. Why will one cell respond only to a single chemical
type, while another responds to three or four categories of chemicals? The
answer is that the responses depend on the particular transduction mech-
anisms present in each cell.
Mechanisms of Taste Transduction
The process by which an environmental stimulus causes an electrical re-
sponse in a sensory receptor cell is called transduction (from the Latin
transducere, "to lead across"). The nervous system has myriad transduction
mechanisms, which make it sensitive to chemicals, pressures, sounds, and
light. The nature of the transduction mechanism determines the specific
sensitivity of a sensory system. We see because our eyes have photorecep-
tors. If our tongue had photoreceptors, we might see with our mouth.
Some sensory systems have a single basic type of receptor cell that uses
one transduction mechanism (e.g., the auditory system). However, taste
transduction involves several different processes, and each basic taste uses
one or more of these mechanisms. Taste stim uli, or tastants, may (l) directly
pass through ion channels (salt and sour), (2) bind to and block ion chan-
nels (sour), or (3) bind to G-protein-coupled receptors in the membrane
that activate second messenger systems that, in turn, open ion channels
(bitter, sweet, and umami). These are familiar processes, very similar to the
basic signaling mechanisms present in all neurons and synapses, which
were described in Chapters 4, 5, and 6.
Saltiness. The prototypical salty chemical is table salt (NaCl), which, apart
from water, is the major component of blood, the ocean, and chicken soup.
The taste of salt is mostly the taste of the cation Na+, and its concentration
must be quite high in order to taste it (at least 10 mM). Salt-sensitive taste
cells have a special Na+ -selective channel that is common in other epithe-
lial cells and that is blocked by the drug amiloride (Figure 8.5a). The
amiloride-sensitive sodium channel is quite different from the voltage-
gated sodium channel that generates action potentials; the taste channel is
insensitive to voltage, and it stays open all the time. When you sip chicken
soup, the Na+ concentration rises outside the receptor cell, and the gradi-
ent for Na+ across the membrane is made steeper. Na+ then diffuses down
its concentration gradient, which means it flows into the cell, and the re-
sulting inward current causes the membrane to depolarize. This depolar-
ization-the receptor potential-in turn causes voltage-gated sodium and
calcium channels to open near the synaptic vesicles, triggering the release
of neurotransmitter molecules onto the gustatory afferent axon.
The anions of salts affect the taste of the cations. For example, NaCI tastes
saltier than Na acetate, apparently because the larger an anion is, the more
it inhibits the salt taste of the cation. The mechanisms of anion inhibition
are poorly understood. Another complication is that as the anions become
larger, they tend to take on tastes of their own. Sodium saccharin tastes
sweet because the Na+ concentrations are far too low for us to taste the
saltiness, and the saccharin potently activates sweetness receptors.
""--
Potassium
channel
I
II
( Q
iii
::J
/I)
fj
"0
o
iii"
""
;::;"
a
0-
Amiloride-
sensitive
sodium
channel
Amiloride-
sensitive
sodium
channel
I
e
G:
::J
/I)
fj
'tI
o
iii"
""
N"
!!I-
0.
Taste
cell
Taste
cell
Ca 2 +
(a)
(b)
Sourness. Foods taste sour because of their high acidity (otherwise known
as low pH). Acids, such as HCt dissolve in water and generate hydrogen
ions (protons, or H+). Thus, protons are the causative agents of acidity and
sourness. They are known to affect sensitive taste receptors in at least two
ways (Figure B.5b). First, H+ can permeate the amiloride-sensitive sodium
channel, the same channel that mediates the taste of salt. This causes an
inward H+ current and depolarizes the cell. (Note that the cell would not
be able to distinguish a hydrogen ion from a sodium ion if this was the only
... TASTE 257
FIGURE 8.5
Transduction mechanisms of (a) salt
and (b) sour tastants. Tastants can interact
directly with ion channels, by either passing
through them (Na+ and H+) or blocking
them (H+ blocking the potassium channel).
Then, the membrane voltage influences cal-
Cium channels on the basal membrane, which
in turn influence the intracellular [Ca 2 +] and
transmitter release.
258 C HAP T E R 8 . THE CHEMICAL SENSES
G-protein-coupled
taste receptor (for
bitter, sweet, or
umami)
Phospholipase C
'"
)
Taste
cell
PIP 2
Voltage-gated
calcium
channel
FIGURE 8.6
Transduction mechanisms for bitter,
sweet, and umami tastants. Tastants
bind directly to G-protein-coupled membrane
receptors and activate phospholipase C. which
increases the synthesis of 1P3' IP3 then triggers
the release of Ca2+ from internal storage
sites and opens a taste-specific ion channel.
leading to depolanzation and transmitter
release.
transduction mechanism available to it.) Second, hydrogen ions can bind
to and block K+ -selective channels. When the K+ permeability of a mem-
brane is decreased, it depolarizes. These probably are not the only mecha-
nisms of sour taste transduction, because changes of pH can affect virtually
all cellular processes. Evidently, it is the constellation of effects that evokes
the sour taste.
Bitterness. Our understanding of the transduction processes underlying
bitter, sweet, and umami tastes received a huge boost in the early 2000s,
when two families of taste receptor genes (called Tl Rand T2R) were dis-
covered. These genes encode for a variety of G-protein-coupled taste re-
ceptors that are very similar to the G-protein-coupled receptors that detect
neurotransmitters.
Bitter substances are detected by the 30 or so different types of T2R re-
ceptors. Bitter receptors are poison detectors, and because we have so
many, we can detect a vast array of different poisonous substances. Ani-
mals are not very good at telling different bitter tastants apart, however,
probably because each bitter taste cell expresses many, and perhaps all, of
the 30 bitter receptor proteins. Because each taste cell can send only one
type of signal to its afferent nerve, a chemical that can bind to one of its
30 bitter receptors will trigger essentially the same response as a different
chemical that binds to another of its bitter receptors. The important mes-
sage the brain receives from its taste receptors is simply that a bitter chem-
ical is "Bad! Not to be trusted!" And the nervous system apparently does
not distinguish one type of bitter substance from another.
Bitter receptors use a second messenger pathway to carry their signal to
the gustatory afferent axon. In 2003, Charles Zuker and his colleagues at
the University of California, San Diego, together with Nicholas Ryba and
his colleagues at the National Institutes of Health, made the surprising dis-
covery that the bitter, sweet, and umami receptors all seem to use exactly
the same second messenger pathway to carry their signals to the afferent
axons (Box 8.1). The general pathway is illustrated in Figure 8.6. When a
tastant binds to a bitter (or sweet or umami) receptor, it activates its G-
proteins, which stimulate the enzyme phospholipase C. thereby increasing
production of the intracellular messenger inositol triphosphate (IP3)' IP 3
pathways are ubiquitous signaling systems in cells throughout the body
(see Chapter 6). In taste cells, IP 3 activates a special type of ion channel
that is unique to taste cells, causing it to open and allow NJ.+ to enter, thus
depolarizing the taste cell. The depolarization, in turn, causes voltage-gated
calcium channels to open, allowing Ca2+ to enter the cell. IP 3 can also
trigger the release of Ca 2 + from intracellular storage sites. These two sources
of Ca2+ both help trigger neurotransmitter release, thereby stimulating the
gustatory afferent axon.
Sweetness. There are many different sweet tastants, some natural and
some artificial. Surprisingly, all of them seem to be detected by the same
taste receptor protein. Sweet receptors resemble bitter receptors, in that
they are both G-protein-coupled receptors, but they are different in that
sweet receptors are formed from two such proteins bound tightly together,
whereas each bitter receptor is only a single protein (Figure 8.7). Tightly
bound proteins are common in cells (see Figure 3.6); most ion channels
(see Figure 3.7) and transmitter-gated channels (see Figure 5.13) consist of
several different bound proteins, for example. A functioning sweet recep-
tor requires two very particular members of the TIR receptor family: TIR2
and TIR3. If either one of them is missing or mutated, an animal may not
perceive svveetness at all.
Chemicals binding to the TlR2 + TlR3 receptor (i.e., the sweet receptor)
activate exactly the same second messenger system that the bitter receptors
activate (see Figure 8.6). So, why don't we confuse bitter chemicals with
sweet ones? The reason is that bitter receptor proteins and sweet receptor
proteins are expressed in different taste cells. Bitter taste cells and sweet
taste cells, in turn, connect to different gustatory axons. The activity of dif-
ferent gustatory axons reflects the chemical sensitivities of the taste cells
that drive them, so the messages about sweetness and bitterness are deliv-
ered to the central nervous system (CNS) along different transmission lines.
Umami (Amino Acids). "Amino acids" may not be the answer at the tip
of your tongue when asked to list your favorite tastes, but recall that pro-
teins are made from amino acids and that they are also excellent energy
sources. In short. amino acids are the foods your mother would want you
to eat. Most amino acids also taste good. although some taste bitter.
The transduction process for umami is identical to that for sweetness,
with one exception. The umami receptor, like the sweet receptor, is com-
prised of two members of the TlR protein family, but in this case, it is TlRl
+ TlR3 (see Figure 8.7). The sweet and umami receptors share the TlR3
protein, so it is the other TIR that determines whether the receptor is
sensitive to amino acids or sweet tastants. Mice that lack the gene encod-
ing the TIRI protein are unable to taste glutamate and other amino acids,
although they still demonstrate a sense for sweet chemicals and other
tastants.
Considering how similar the umami receptor is to the sweet and bitter
receptors, it will not surprise you that all three use exactly the same sec-
ond messenger pathways (see Figure 8.6). Then why don't we confuse the
taste of amino acids with sweet or bitter chemicals? Once again, the taste
cells selectively express only one class of taste receptor protein. There are
umami-specific taste cells, just as there are sweet-specific taste cells and
bitter-specific taste cells. The gustatory axons they stimulate are, in turn,
delivering messages of umami, sweetness, or bitterness to the brain.
Central Taste Pathways
The main flow of taste information is from taste buds, to the primary gus-
tatory axons. into the brain stem, up to the thalamus, to the cerebral cor-
tex (Figure 8.8). Three cranial nerves carry primary gustatory axons and
bring taste information to the brain. The anterior two-thirds of the tongue
and the palate send axons into a branch of cranial nerve VII, the facial nerve.
The posterior third of the tongue is innervated by a branch of cranial nerve
IX, the glossopharyngeal nerve. The regions around the throat, including the
glottis, epiglottis, and pharynx, send taste axons to a branch of cranial
nerve X, the vagus nerve. These nerves are involved in a variety of other
sensory and motor functions, but their taste axons all enter the brain stem,
bundle together, and synapse within the slender gustatory nucleus, a part
of the solitary nucleus in the medulla.
From the gustatory nucleus, taste pathways diverge. The conscious expe-
rience of taste is presumably mediated by the cerebral cortex. The path to
the neocortex via the thalamus is a common one for sensory information.
Neurons of the gustatory nucleus synapse on a subset of small neurons in
the ventral posterior medial (VPM) nucleus, a portion of the thalamus
that deals with sensory information from the head. The VPM taste neurons
then send axons to the primary gustatory cortex (located in Brodmann's
area 36 and the insula-operculum regions of cortex). The taste pathways to
the thalamus and cortex are primarily ipsilateral to the cranial nerves that
... TASTE 259
Bitter receptors: the T2Rs
S
11n"11nfnl
J UI!IIUI!II,
, .....
"
I Xf, - I
"tutU U I: D \ I ,I ,
. .. llX). '-
yy,
:'b
"'
l'
, ,
. '
1 n ' I
" U,..,
..n ,1,
",u ,
n
..':k)
(a)
Sweet receptor: T1 R2 + T1 R3
,!n I"
"U,UIUtU,UIQIUIUIU U
, . .... .....,
, JB
(b)
Umami receptor: T1R1 + T1R3
'!' I '!I!I..!',
.fUIiiIU,UIU U-.i
. ...............,
I
ll,
... I. .
t
(c)
FIGURE 8.7
Taste receptor proteins. (a) There are
about 30 types of bitter receptors, comprising
a family ofT2R proteins. (b) There is only one
type of sweet receptor; fonmed from the
combination of a T2RI and TI R3 protein. (c)
There is only one type of umami receptor;
formed from the combination of a T I R2 and
T I R3 protein.
260 C HAP T E R 8 . THE CHEMICAL SENSES
Primary gustatory
cortex
,
1,
----
......
"
(a)
IX
X ,-
n;
/
Epiglottis
VII
"
,
Cranial nerves..e= . \ IX
X
-
Cranial nerve VII
@
'\I
}7\
""
..
Lateral
/ventricles
)
/ '0/ CD
Primary /'
gustatory
cortex
"
I ""
I(
Third
ventricle
...
@
'"
Afferents from
tongue and '" _
epiglottis )..
Left
gustatory
nucleus
Fourth ventricle
Left ventral posterior
medial (VPM) nucleus
of thalamus
- Medulla
(b)
CD
Pyramidal
tract
Anterior tongue _____
Posterior tongue Gustatory
- ___ nucleus
Epiglottis -----
Gustatory
cortex
VPM
(c)
FIGURE 8.8
Central taste pathways. (a) Taste Information from the tongue and mouth cavity is carried
by three cranial nerves (VII, IX. and X) to the medulla. (b) Gustatory axons enter the gustatory
nucleus within the medulla. Gustatory nucleus axons synapse on neurons of the thalamus, which
prOject to regions of the cerebral cortex that include the postcentral gyrus and insular cortex.
The enlargements show planes of section through CD the medulla and (2) the forebrain. (c) The
central taste pathways summarized.
Box 8.1
PATH OF DISCOVERY
.
lit
I .",,
.;:::
-
.........
A Journey Through
the Senses
After completing my graduate studies on the molecular
biology of a simple mold in 1983,1 wanted to explore the
workings of complex regulatory circuits in animal cells. I
moved to the laboratory of Gerald Rubin at the Univer-
sity of California, Berkeley, right after Rubin and Spradling
developed germ line transformation in fruit fiies. With this
new technology, it became feasible to design and reintro-
duce genes that had been modified in vitro back into the
animat and thus manipulate cell function and regulatory
networks in vivo, in their normal organismaJ environment.
This landmark discovery led to a renaissance in molecular
neurobiology, and thus I began my work in the genetics
and physiology of photo transduction in the fruit fly,
Drosophila melanogaster.
Although much was known about the biochemistry of
rhodopsin function and the visual cascade in vertebrates at
that time, little was known about how complex G-protein-
coupled receptor (GPCR) transduction pathways are
choreographed in vivo. Our studies, which spanned a decade
of great fun, discovery, and camaraderie with a group of
extraordinary students, yielded a comprehensive view of
how a photoreceptor neuron detects a photon of light and
transforms it into a neural signal. Some exciting by-products
of this work were the development of new strategies to
study neuronal signaling in DrosoPhila, the demonstration
that transduction pathways use a common logic across
evolutionary lines even when appearance is very different,
and, perhaps most importantly, the discovery that GPCR
pathways are organized as macromolecular complexes
(akin to molecular machines) containing all the critical
components for the generation. modulation, and termina-
tion of the sensory response.
In 1992, I began to work on mechanosensory trans-
duction, the signaling modality that underlies our senses
of hearing. balance, proprioception, and touch. While we
understood much about the function and signaHng in
vestibular and cochlear hair cells-work pioneered largely
by Jim Hudspeth and his colleagues-we knew little about
the nature of the underlying mechanically gated channels.
Together with Maurice Kernan, a postdoctoral associate
in my lab, we set out to search for DrosoPhila mutants
with defects in mechanosensory transduction as a strat-
egy to identify genes encoding components involved in
mechanosensation. The advantage of such genetic screens
is that they make no assumption about the nature (or
abundance) of the gene product, other than that they are
involved in the sensory process.
Our screens, which first relied on hitting larvae on the
head with an eyebrow hair and looking for nonresponders
..
"....,:-
by Charles S. Zuker
(mechano-insensitive mutants), and later on screening for
uncoordinated fiies (mutants with defects in balance and
proprioception), allowed my students Richard Walker,
Aarron Willingham, and Maurice Kernan to identify, clone,
and characterize our "dream mechanosensory molecule" in
1999. This molecule was the principal ion channel that ac-
counts for mechanosensation in flies. Importantly, this
channel was then shown to be the founding member of
the vertebrate ion channel family that mediates our sense
of hearing. This work illustrated the power of using genet-
ics and model organisms to solve challenging biological
problems.
Early in 1998, I began a long-term collaboration with
my friend Nick Ryba at the National Institutes of Health
to dissect the function of our sense of taste. This shift
in our research program was prompted largely by our
distress over the extraordinary lack of scientific consen-
sus and clarity about the basic principles governing the
organization and function of the sense of taste in
mammals.
The work of our students and postdoctoral fellows led
to the identification and characterization of two families
of GPCRs (the T I Rs and T2Rs) that function as the
mammalian receptors for sweet, bitter, and umami tastes.
We also showed that each of these three taste modalities
is encoded independently of the others. and demonstrated
that cells expressing attractive (sweet and umami; T I R
receptors) versus aversive (bitter; T2R receptors) tastes
are "hard wired" to mediate stereotypical behavioral re-
sponses. Thus, when we engineered mice to express a
bitter receptor in the sweet cells. instead of their natural
bitter cells, the animals became strongly attracted, rather
than averse, to the tastant for this otherwise "bitter"
receptor. Similarly, by expressing a novel GPCR in either
T I R- or T2R-expressing cells, we could manipulate the
behavior of the animals by making them attracted or
averse to the otherwise "tasteless" ligand for this recep-
tor. Together, these studies demonstrated that taste
coding at the periphery operates via labeled lines and
proved that the "taste" of a sweet or a bitter compound
(Le., the perception of sweet and bitter) is a refiection of
the selective activation of T I R cells versus T2R cells,
rather than a property of the receptors or even the tas-
tant molecules.
After nearly 20 years in neurobiology, I look forward to
discoveries that lie ahead with the same excitement and
fervor I had when I first examined the eye of a fiy under
a dissecting microscope.
262 C HAP T E R 8 . THE CHEMICAL SENSES
Box 8.2
,,'.
,,-'
...
...
OF SPECIAL INTEREST
Memories of a Very Bad Meal
When one of us was 14 years old, he ended an entertain-
ing day at an amusement park by snacking on one of his
favorite New England foods-fried clams. Within an hour,
he became nauseated, vomited, and had a most unpleasant
bus ride home. Presumably, the clams had been spoiled.
Sadly, for years afterward he could not even imagine eat-
ing another fried clam, and the smell of them alone was
repulsive. The fried clam aversion was quite specific. It did
not affect his enjoyment of other foods, and he felt no
prejudice for amusement park rides, buses, or the friends
he had been with the day he got sick.
By the time the author reached his thirties, he could
happily dine on fried clams again. He also read about re-
search that John Garcia, working at Harvard Medical
School, had done just about the same time as the original
bad-clam experience. Garcia fed rats a sweet liquid, and in
some cases, he then gave them a drug that made them
briefly feel ill. After even one such trial, rats that had re-
ceived the drug avoided the sweet stimulus forever.The rats'
aversion was specific for the taste stimulus; they did not
avoid sound or light stimuli under the same conditions.
Extensive research has shown that flavor aversion learn-
ing results in a particularly robust form of associative
memory. It is most effective for food stimuli (taste and
smell both contribute), it requires remarkably little expe-
rience (as little as one trial), and it can last a very long
time-more than 50 years in some people! And learning
occurs even when there is a very long delay between the
food (the conditioned stimulus) and the nausea (the un-
conditioned stimulus). This is obviously a useful form of
learning in the wild. An animal can't afford to be a slow
learner when new foods might be poisonous. For modern
humans, this memory mechanism can backfire; many
perfectly good fried clams have remained uneaten. Food
aversion can be a more serious problem for patients
undergoing radiation or chemotherapy for cancer, when
the nausea induced by their treatments makes many foods
unpalatable. On the other hand, taste aversion learning
has also been used to prevent coyotes from stealing do-
mestic sheep and to help people reduce their dependence
on alcohol and cigarettes.
supply them. Lesions within the VPM thalamus or the gustatory cortex-
as a result ot a stroke, for example-can cause ageusia, the loss of taste
perception.
Gustation is important to basic behaviors such as the control of feeding and
digestion, both of which involve additional taste pathways. Gustatory nucleus
cells project to a variety of brain stem regions, largely in the medulla, that are
involved in swallowing, salivation, gagging, vomiting, and basic physiological
functions such as digestion and respiration. In addition, gustatory information
is distributed to the hypothalamus and related parts of the basal telencephalon
(structures of the limbic system; see Chapter 18). These structures seem
to be involved in the palatability of foods and the forces that motivate us
to eat (Box 8.2). Localized lesions of the hypothalamus or amygdala, a
nucleus of the basal telencephalon, can cause an animal to either chron-
ically overeat or ignore food, or alter its preferences for food types.
The Neural Coding of Taste
If you were going to design a system for coding tastes, you might begin with
many specific taste receptors for many basic tastes (e.g., sweet, sour, salty,
bitter, chocolate, banana, mango, beef, Swiss cheese). Then you might con-
nect each receptor type, by separate sets ofaxons, to neurons in the brain
that also responded to only one specific taste. All the way up to the cortex,
you would expect to find specific neurons responding to "sweet" and
"chocolate," and the flavor of chocolate ice cream would involve the rapid
firing of these cells and very few of the "salty," "sour," and "banana" cells.
.... SMELL 263
This concept is the labeled line hypothesis, and it seems simple and rational.
At the start of the gustatory system-the taste receptor cells-something
like labeled lines are used. As we have seen, individual taste receptor cells
are often selectively sensitive to particular classes of stimuli: sweet, bitter,
Or umami. Many of them. however. are more broadly tuned to stimuli; that
is, they are not very specitic in their responses. They may be excited by
both salt and sour, for example (see Figure 8.3). Primary taste axons are
even less specific than receptor cells, and most central taste neurons con-
tinue to be broadly responsive all the way into the cortex. In other words,
the response ot a single taste ceIl is often ambiguous about the food being
tasted; the labels on the taste lines are uncertain rather than distinct.
Cells in the taste system are broadly tuned for several reasons. If one taste
receptor cell has two different transduction mechanisms, it will respond to
two types of tastants (although it may still respond most strongly to one of
them). In addition, there is convergence of receptor cell input onto affer-
ent axons. Each receptor cell synapses onto a primary taste axon that also
receives input from several other receptors, in that papilla as well as its
neighbors. This means that one axon may combine the taste information
from several papillae. If one of those receptors is mostly sensitive to sour
stimuli and another to salt stimuli, then the axon will respond to salt and
sour. This pattern continues into the brain: Neurons of the gustatory nucleus
receive synapses from many axons of different taste speciIicities, and they
may become less selective for tastes than the primary taste axons.
All of this mixing of taste information might seem like an inefficient way
to design a coding system. Why not use many taste cells that are highly
specific? In part, the answer might be that we would need an enormous
variety of receptor types, and even then we could not respond to new
tastes. So, when you taste chocolate ice cream, how does the brain sort
through its apparently ambiguous information about the flavor to make
clear distinctions between chocolate and thousands of other possibilities?
The likely answer is a scheme that includes features of roughly labeled lines
and population coding, in which the responses ot a large number of
broadly tuned neurons, rather than a small number of precisely tuned
neurons, are used to specify the properties of a particular stimulus, such as
a taste.
Population coding schemes seem to be used throughout the sensory and
motor systems of the brain, as we shall see in later chapters. In the case of
taste, receptors are not sensitive to all tastes; most respond broadly-to salt
and sour but not to bitter and sweet for example. Only with a large pop-
ulation of taste cells, with ditferent response patterns, can the brain distin-
guish between alternative tastes. One food activates a certain subset of
neurons, some of them firing very strongly, some moderately, some not at
all, others perhaps even inhibited below their spontaneous firing rates (i.e.,
theiLnonstimulated rates); a second food excites some of the cells activated
by the first food, but also others; and the overall patterns of discharge rates
will be distinctly different. The relevant population may even include
neurons activated by the olfactory, temperature, and textural features ot a
food; certainly the creamy cold of chocolate ice cream contributes to our
ability to distinguish it from chocolate cake.
SMELL
Olfaction brings both good news and bad news. It combines with taste to
help us identify toods, and it increases our enjoyment of many of them.
But it can also warn of potentially harmful substances (spoiled meat) or
places (smoke-filled rooms). In olfaction, the bad news may outweigh the
264 C HAP T E R 8 . THE CHEMICAL SENSES
good; by some estimates, we can smell several hundred thousand substances,
but only about 20% of them smell pleasant. Practice helps in olfaction, and
professional perfumers and whiskey blenders can actually distinguish be-
tween thousands of different odors.
Smell is a Iso a mode of communication. Chemicals released by the
body, called pheromones, are important signals for reproductive behav-
iors, and they may also be used to mark territories, identify individuals,
and indicate aggression or submission. (The term is from the Greek pherein,
"to carry," and horman, "to excite.") Although systems of pheromones are
well developed in many animals, their importance to humans is not clear
(Box 8.3).
Box 8.3
..... , . #
OF SPECIAL INTEREST
I ..
...
.
Human Pheromones?
Smells are surer than sounds and sights to make your heart-
strings crack.
-Rudyard Kipling
Odors can certainly sway emotions and arouse memories,
but just how important are they to human behavior? Each
of us has a distinctive set of odors, which marks our iden-
tity as surely as our fingerprints or genes do. In fact, vari-
ations in body odor are probably genetically determined.
Bloodhounds have great difficulty distinguishing between
the smells of identical twins, but not between those of fra-
ternal siblings. For some animals, odor identity is essen-
tial: When her !amb is born, the ewe establishes a long-
term memory of its specific smell and develops an
enduring bond based largely on olfactory cues. In a newly
inseminated female mouse, the smell of a strange male
(but not the smell of her recent mate, which she re-
members) will trigger an abortion of the pregnancy.
Humans have the ability to recognize the scents of
other humans. Infants as young as 6 days old show a clear
preference for the smell of their own mother's breast
over that of other nursing mothers. The mothers, in turn,
can usually identify the odor of their own infant from
among several choices.
About 30 years ago, researcher Martha McClintock
reported that women who spend a lot of time together
(college roommates, for example) often find that their
menstrual cycles synchronize. This effect is probably
mediated by pheromones. In 1998, McClintock and Kath-
leen Stern, working at the University of Chicago, found
that odorless compounds from one group of women
(the "donors") could influence the timing of the men-
strual cycles of other women (the "recipients"). Body
chemicals were collected by placing cotton pads under
the arms of the donors for a least 8 hours.The pads were
then wiped under the noses of the recipients, who agreed
not to wash their faces for 6 hours. The recipients were
not told the source of the chemicals on the pads and did
not consciously perceive any odor from them except the
alcohol used as a carrier. Nevertheless, depending on the
donor's time in her menstrual cycle, the recipient's cycle
was either shortened or lengthened. These dramatic re-
sults are the best evjdence yet that humans can commu-
nicate with pheromones.
Many animals use the accessory olfactary system to detect
pheromones and mediate a variety of social behaviors in-
volving mother, mating, territory, and food. The accessory
system runs parallel to the primary olfactory system. It
consists of a separate chemically sensitive region in the
nasal cavity, the vameronasal organ, which projects to the
accessory olfactory bulb, and from there provides input to
the hypothalamus. Researchers thought for a long time
that the vomeronasal organ in mature humans was absent
or vestigial, but recent studies indicate that it is present
in adults. Its precise function in humans is not clear,
however, and there is no strong evidence that it even has
receptor neurons.
Napoleon Bonaparte once wrote to his love Josephine,
asking her not to bathe for the 2 weeks until they would
next meet, so he could enjoy her natural aromas. The
scent of a woman may indeed be a source of arousal for
sexually experienced males, presumably because of learned
associations. But there is not yet any hard evidence for
human pheromones that might mediate sexual attraction
(for members of either sex) via innate mechanisms. Con-
sidering the commercial implications of such a substance,
we can be sure the search will continue.
... SMELL 265
The Organs of Smell
We do not smell with our nose. Rathec we smell with a smalt thin sheet
of cells high up in the nasal cavity called the olfactory epithelium (Fig-
ure 8.9). The olfactory epithelium has three main cell types. Olfactory recep-
tor cells are the site of transduction. Unlike taste receptor cells, olfactory re-
ceptors are genuine neurons, with axons of their own that penetrate into
the central nervOus system. Supporting cells are similar to glia; among other
things, they help produce mucus. Basal cells are the source of new receptor
cells. Olfactory receptors (similar to taste receptors) continually grow, die,
and regenerate, in a cycle that lasts about 4-8 weeks. In fact, olfactory recep-
tor cells are one of the very few types of neurons in the nervous system
that are regularly replaced throughout life.
Sniffing brings air through the convoluted nasal passages, but only a small
percentage of that air passes over the olfactory epithelium. The epithelium
exudes a thin coating of mucus, which flows constantly and is replaced
about every 10 minutes. Chemical stimuli in the aic called odorants, dissolve
in the mucus layer before they reach receptor cells. Mucus consists of a
water base with dissolved mucopolysaccharides (long chains of sugars); a
variety of proteins, including antibodies, enzymes, and odorant binding
proteins; and salts. The antibodies are critical because olfactory cells can be
a direct route by which some viruses (such as the rabies virus) and bacte-
ria enter the brain. Also imponant are odorant binding proteins, which are
small and soluble and may help concentrate odorants in the mucus.
The size of the olfactory epithelium is one indicator of an animal's olfac-
tory acuity. Humans are relatively weak smellers (although even we can
detect some odorants at concentrations as low as a few parts per trillion).
The surface area of the human olfactory epithelium is only abom 10 cm 2 .
The olfactory epithelium of certain dogs may be more than 170 cm 2 , and
dogs have over 100 times more receptors in each square centimeter than hu-
mans. By sniffing the aromatic air above the ground, dogs can detect the
few molecules left by someone walking there hours before. Humans may
only be able to smell the dog when he licks their face.
OlfactOry
bulb
- " \
---
Brain
J, j j
or",. A Cribriform plate
- 8- Basal cell
\ ' t
Olfactory
) \ Y receptor cell
I" I' I S"pport;", "'"
.\1, I
.L====-- Cilia of
- I olfactory cells
Mucus layer
Olfactory nerve
Cribriform \ .
plate \.
OlfactOry
epithelium
-----
£..
10..,'/ 1/ r:-
\
air
"
Palate
FIGURE 8.9
The location and structure of the olfactory epithelium. The olfactory epithelium
consists of a layer of olfactory receptor cells. supporting cells, and basal cells. Odorants dis-
solve in the mucus layer and contact the cilia of the olfactory cells. Axons of the olfactory
cells penetrate the bony cribriform plate on their way to the CNS.
266 C HAP T E R 8 . THE CHEMICAL SENSES
Olfactory Receptor Neurons
Olfactory receptor neurons have a single, thin dendrite that ends \Yith a small
knob at the surface of the epithelium (see Figure 8.9). Waving from the knob,
within the mucus layer, are several long, thin cilia. Odorants dissolved in the
mucus bind to the surface of the cilia and activate the transduction process.
On the opposite side of the olfactory receptor cell is a very thin, unmyelinated
axon. Collectively, the olfactory axons constitute the olfactory nerve (cranial
nerve I). The olfactory axons do not all come together as a single nerve bun-
dle, as in other cranial nerves. Instead, after leaving the epithelium, sma]!
clusters of the axons penetrate a thin sheet of bone called the cribriform plate,
then course into the olfactory bulb (see Figure 8.9). The olfactory axons are
fragile, and during traumatic injury, such as a blow to the head, the forces
between the cribriform plate and surrounding tissue can permanently sever
the olfactory axons. The result is anosmia, the inability to smell.
Olfactory Transduction. Although taste receptor cells use several different
molecular signaling systems for transduction, olfactory receptors probably
use only one (Figure 8.10). All of the transduction molecules are located in
the thin cilia. The olfactory pathway can be summarized as follows:
Odorants ---'»
Binding to membrane odorant receptor proteins ---'»
G-protein (Golf) stimulation ---'»
Activation of adenylyl cyclase ---'»
Formation of cyclic AMP (CAMP) ---'»
Binding of cAMP to specific cation channel ---'»
Opening of cation channels and influx of Na+ and Ca2+ ---'»
Opening of Ca2+ -activated chloride channels ---'»
Current flow and membrane depolarization (receptor
potential).
Moc", {
\ \ To olfactory
/ bulb
Olfactory
receptor
cell
Ca 2 + Na+
Golf-protein
Adenylyl
cyclase
Odorant
receptor
o oo protein
o Odorant molecules
Cilium of
olfactory cell
FIGURE 8.10
Transduction mechanisms of vertebrate olfactory receptor cells. This drawing shows
a single cilium of an olfactory receptor cell and the signaling molecules of olfactory transduction
that it contains. Golf is a special form of G-protein found only In olfacto y receptor cells.
'Y SMELL 267
Olfactory
nerve
I SOmV
Dendrite
Action
potentials
Olfactory
receptor
cell
I 00 mV
Cilia
Receptor
/ pote""al
I 00 mV
1 sec
FIGURE 8.11
Voltage recordings from an olfactory receptor cell during stimulation. Odorants
generate a slow receptor potential in the cilia; the receptor potential propagates down the
dendrite and triggers a series of action potentials within the soma of the olfactory receptor
cell. Finally. the action potentials (but not the receptor potential) propagate continuously
down the olfactory nerve axon.
Once the cation-selective cAMP-gated channels open, current flows in-
ward, and the membrane of the olfactory neuron depolarizes (Figures B.IO
and B.ll). Besides Na+, the cAMP-gated channel allows substantial amounts
of ea H to enter the cilia. In turn, the ea H triggers a ea H -activated chlo-
ride current that may amplify the olfactory receptor potential. (This is a
switch from the usual effect of el- currents, which inhibit neurons; in ol-
factory cells, the internal el- concentration must be unusually high so that
a el- current tends to depolarize rather than hyperpolarize the membrane.)
If the resulting receptor potential is large enough, it will exceed the thresh-
old for action potentials in the cell body, and spikes will propagate out
along the axon into the eNS (see Figure B.ll).
The olfactory response may terminate for several reasons. Odorants dif-
fuse away, scavenger enzymes in the mucus layer often break them down,
and cAMP in the receptor cell may activate other signaling pathways that
end the transduction process. Even in the continuing presence of an odor-
ant, the strength of a smell usually fades. This is because the response of
the receptor cell itself adapts to an odorant within about a minute. De-
creased response despite the continuing presence of a stimulus is called
adaptation, and we will see that it is a common feature of sensory receptors
across modalities.
This signaling pathway has two unusual features: the receptor binding pro-
teins at the beginning, and the cAMP-gated channels near the end. Receptor
proteins have odorant binding sites on their extracellular surface. Because of
your ability to discriminate thousands of different odorants, you might guess
that there are many different types of odorant receptor proteins. You would
268 C HAP T E R 8 . THE CHEMICAL SENSES
Medial surface of nasal passage
. Gene group 1
o Gene group 2
o Gene group 3
FIGURE 8.12
Maps of the expression of different
olfactory receptor proteins on the
olfactory epithelium of a mouse. Three
different groups of genes were mapped in this
case, and each had a different. nonoverlapping
zone of distribution. (Source: Adapted from
Ressler et aI., 1993, p. 602.)
be right, and the number is very large indeed. Researchers Linda Buck and
Richard Axel, working at Columbia University in 1991, found that there are
more than 1000 different odorant receptor genes in rodents, making it by far
the largest family of mammalian genes yet discovered. This important and
surprising discovery earned Buck and Axel the Nobel Prize in 2004.
Humans have fewer odorant receptor genes than rodents-about 350 that
code for functional receptor proteins-but this is still an enormous number.
The receptor genes are scattered about on the genome, and nearly every
chromosome has at least a few of them. Each receptor gene has a unique
structure, which allows the receptor proteins encoded by these genes to bind
different odorants. It is also surprising that each olfactory receptor cell seems
to express very few of the 1000 types of receptor genes, possibly just one.
Thus, there are about 1000 different types of receptor cells, each identified
by the particular receptor gene it expresses. The olfactory epithelium is or-
ganized into a few large zones, and each zone contains receptor cells that
express a different subset of receptor genes (Figure 8.12). Within each zone,
individual receptor types are scattered randomly (Figure 8.13a).
Olfactory
epithelium
Q 0 00 00 0 0 Co 0 Co o. 0 e C> Co C>
o : 0-0 °0 0 0 0 coo 0 0 ° 0 0 CI : :: (;) 0 Co :00
o CI 0 <::I co - ClO 0 c:> 0 Co 0 C) °0 Q :: 0
C) Co <:I 0 0 COo 10 . C) CI 0 _ <:> 0 'I
Cleo 0 CO> C <::I
(a)
Citrus
Jl
LJlL
Lk
L
-
Floral
P'ppe,miot
Almond
Receptor 1
Receptor 2
Receptor 3
(b)
FIGURE 8.13
Broad tuning of single olfactory receptor cells. (a) Each receptor cell expresses a
single olfactory receptor protein (here coded by cell color), and different cells are randomly
scattered within a region of the epithelium. (b) Microelectrode recordings from three different
cells show that each one responds to many different odors, but with differing preferences. By
measuring responses from all three cells, each of the four odors can be clearly distinguished.
... SMELL 269
The receptor neurons in the vomeronasal organ of rodents express their
own set of receptor proteins, which are similar to odorant receptors. There
are fewer vomeronasal receptor proteins (about 300 in mice and only 5 in
humans) than odorant receptor proteins. The structures of odorant recep-
tor proteins and vomeronasal receptor proteins are surprisingly different.
The types of chemicals vomeronasal receptors detect are largely unknown,
but it is likely that some of them are pheromones (see Box 8.3).
Olfactory receptor proteins belong to the large family of proteins called
G-protein-coupled receptors, all of which have seven transmembrane alpha
helices. G-protein-coupled receptors also include a variety of neurotrans-
mitter receptors that were described in Chapter 6, and the bitter, sweet, and
umami receptors described earlier in this chapter. All of these receptors are
coupled to G-proteins, which in turn relay a signal to other second mes-
senger systems within the cell (olfactory receptor cells use a particular type
of G-protein, called Golf). Increasing evidence indicates that the only sec-
ond messenger mediating olfactory transduction in vertebrates is cAMP.
Some of the most compelling studies have used genetic engineering to pro-
duce mice in which critical proteins of the olfactory cAMP pathway have
been knocked out (Golf, for example); these mice are inevitably anosmic for
a wide variety of odors.
In neurons, cAMP is a common second messenger, but the way it acts in
olfactory transduction is quite unusuaL Tadashi Nakamura and Geoffrey
Gold, working at Yale University in 1987, showed that a population of
channels in the cilia of olfactory cells responds directly to cAMP; that is, the
channels are cAMP gated. In Chapter 9, we will see that cyclic nucleotide-
gated channels are also used for visual transduction. This is another demon-
stration that biology is conservative, that evolution recycles its good ideas:
Smelling and seeing use some very similar molecular mechanisms.
How do the 1000 types of receptor cells used discriminate among tens of
thousands of odors? As with taste, olfaction involves a population coding
scheme. Each receptor protein binds different odorants more or less read-
ily, so its receptor cell is more or less sensitive to those odorants (Figure
8.13b). Some cells are more sensitive to the chemical structure of the odor-
ants they will respond to than other cells are, but in general each receptor
is quite broadly tuned. A corollary is that each odorant activates many of
the 1000 types of receptors. The concentration of odorant is also important,
and more odorant tends to generate stronger responses. Thus, each olfac-
tory cell yields very ambiguous information about odorant type and
strength. It is the job of the central olfactory pathways to look at the full
package of information arriving from the olfactory epithelium-the popu-
lation code-and use it to classify the odors further.
Central Olfactory Pathways
Olfactory receptor neurons send axons into the two olfactory bulbs (Figure
8.14). The bulbs are a neuroscientist's wonderland, full of neural circuits
with fascinating dendritic arrangements, unusual reciprocal synapses, and
high levels of many different neurotransmitters. The input layer of each bulb
contains about 2000 spherical structures called glomeruli, each about
50-200 mm in diameter. Within each glomerulus, the endings of about
25,000 primary olfactory axons (axons from the receptor cells) converge and
terminate on the dendrites of about 100 second-order olfactory neurons.
Recent studies revealed that the mapping of receptor cells onto glomeruli
is astonishingly precise. Each glomerulus receives receptor axons from a
large region of the olfactory epithelium. When molecular labeling methods
are used to tag each receptor neuron expressing one particular receptor
270 C HAP T E R 8 . THE CHEMICAL SENSES
FIGURE 8.14
The location and structure of an olfac-
tory bulb. Axons of olfactory receptor cells
penetrate the cribriform plate and enter the
olfactory bulb. After multiple branching, each
olfactory axon synapses upon second-order
neurons within a spherical glomerulus. The
second-order neurons send axons through
the olfactory tract further into the brain.
)'-
\,
.. .
L
{)
Olfactory bulb
Olfactory tract
Glomerulus
"
( )-- '\ - --c ,
, \ I L\,'/ -, \
It r r h ' '1. I ' ,,- ,
'. yf./y,' : ' 'J" 'W ' " '1}:
, / \ /;\ I
.... -,," ',,",,' 7/'
1- ) -
''', '-,:i:: (J[JUf]ffj1f) '. : ;
IJ1 r V ' (j 0 't
Cribriform
plate
Olfactory
receptor cells
gene of the mouse-in this case, a gene called P2-we can see that the P2-
labeled axons all converge onto only two glomeruli in each bulb, one of
which is shown in Figure 8.15a. No axons seem to be out of place; such
accuracy challenges our knowledge about axonal pathfinding during de-
velopment (see Chapter 23).
This precision mapping is also consistent across the two olfactory bulbs;
each bulb has only two P2-targeted glomeruli, in symmetrical positions
(Figure 8.15b). The positions of the P2 glomeruli within each bulb are
___ Olfactory receptor
___ neuron axon
. ,
.....- ,
Glomerulus
,"
--
" --------- Olfactory receptor
neuron axon
..
... ..
\.
(a)
...
:. -
...
-v.
,
.
,
Iii".......
- Olfactory
bulb
.
(b)
Glomeruli receiving input from
P2-expressing receptor neurons
FIGURE 8.15
The convergence of olfactory neuron axons onto the olfactory bulb. Olfactory
receptor neurons expressing a particular receptor gene all send their axons to the same
glomeruli. (a) In a mouse, receptor neurons expressing the P2 receptor gene were labeled
blue, and every neuron sent its axon to the same glomerulus in the olfactory bulb. (b) When
the two bulbs were cut in cross section. it was possible to see that the P2-containing recep-
tor axons project to symmetrically placed glomeruli in each bulb. (Source: Adapted from
Mombaerts et aI., 1996, p. 680.)
,.. SMEll 271
OOl
Olfactory bulb
)
lomerUIUS
Olfactory
: -: ? rr epithelium
- -. Q
) J
O J V
1'V
? J '1.. f ' -}'i t
-
-
- -
r
v
) J
Olfactory
receptor
cells
FIGURE 8.16
Specific mapping of olfactory receptor neurons onto glomeruli. Each glomerulus
receives input only from receptor cells expressing a particular receptor protein gene. Recep-
tor cells expressing a particular gene are color-coded.
surprisingly consistent from one mouse to another. Finally, it seems that
each glomerulus receives input from only receptor cells of one particular
type. This means that the array of glomeruli within a bulb is a very orderly
map of the receptor genes expressed in the olfactory epithelium (Figure
8.16), and, by implication, a map of odor information.
Olfactory information is modified by inhibitory and excitatory interactions
within and among the glomeruli and between the two bulbs. Neurons in
the bulbs are also subject to modulation from systems ofaxons that descend
from higher areas of the brain. While it is obvious that the elegant circuitry
of the olfactory bulbs has important functions, it is not entirely clear what
those functions are. It is likely that they begin to segregate odorant signals
into broad categories, independent of their strength and possible interfer-
ence from other odorants. The precise identification of an odor probably
requires further processing in the next stages of the olfactory system.
Many brain structures receive olfactory connections. The output axons of
the olfactory bulbs course through the olfactory tracts and project directly
to several targets, some of which are illustrated in Figure 8.17. Among the
most important targets are the primitive region of cerebral cortex called
olfactory cortex and some of its neighboring structures in the temporal
lobes. This anatomy makes olfaction unique. All other sensory systems first
pass through the thalamus before projecting to the cerebral cortex. The
olfactory arrangement produces an unusually direct and widespread influ-
ence on the parts of the forebrain that have roles in odor discrimination,
emotion, motivation, and certain kinds of memory (see Chapters 16, 18,
24, and 25). Conscious perceptions of smell may be mediated by a path
272 C HAP T E R 8 . THE CHEMICAL SENSES
"
Orbitofrontal
cortex
Medial
dorsal
nucleu
I
Z Q' /
,
\
,
To olfactory cortex
and related
temporal lobe
structures
FIGURE 8. i 7
Central olfactory pathways. Axons of the olfactory tract branch and enter many
regions of the forebrain. including the olfactory cortex. The neocortex is reached only by
a pathway that synapses in the medial dorsal nucleus of the thalamus.
from the olfactory tubercle, to the medial dorsal nucleus of the thalamus, to the
orbitofrontal cortex (situated right behind the eyes).
Spatial and Temporal Representations
of Olfactory Information
In olfaction, there is an apparent paradox similar to the one in gustation.
Individual receptors are broadly tuned to their stimuli-that is, each cell is
sensitive to a wide variety of chemicals. However, when we smell those
same chemicals, we can easily tell them apart. How is the whole brain doing
what single olfactory cells cannot? We will discuss three important ideas:
(1) Each odor is represented by the activity of a large population of neurons;
(2) the neurons responsive to particular odors may be organized into
spatial maps; and (3) the timing of action potentials may be an essential
code for particular odors.
Olfactory Population Coding. As in gustation, the olfactory system
uses the responses of a large population of receptors to encode a specific
stimulus. A simplistic example was shown in Figure 8.13b. When presented
with a citrus smell, none of the three different receptor cells can clearly
distinguish it from the other odors. Bur by looking at the combination of
responses from all three cells, the brain could distinguish the citrus smell
unambiguously from floral, peppermint, and almond. By using such popu-
lation coding, you can imagine how an olfactory system with 1000 differ-
ent receptors might be able to recognize tens of thousands of different
odors.
Olfactory Maps. A sensory map is an orderly arrangement of neurons
that correlates with certain features of the environment. Microelectrode
recordings show that many receptor neurons will respond to the presenta-
tion of a single odorant and that these cells are distributed across a wide
area of the olfactory epithelium (see Figure 8.13). This is consistent with
... SMELL 213
. .
FIGURE 8.18
Maps of neural activation of the olfactory bulb. The activity of
many olfactory neurons in a salamander olfactory bulb was recorded with a
specialized optical method. The cells were stained with dyes that are sensi-
tive to membrane voltage, and neural activity was then signaled by changes
in the amount of light emitted by the dye. The colors on the maps repre-
sent diffenng levels of neural activity; hotter colors imply more activity. Dif-
ferent olfactants evoked different spatial patterns of neural activation in the
bulb: (a) amyl acetate (banana), (b) limonene (citrus), (c) ethyl-n-butyrate
(pineapple). (Source: Adapted from Kauer, 1991, p. 82.)
Olfactory
bulbs \
.. ...-
..,
- I ,..-
..
, .- L . . ,.
. ." , ,
)
,
...
t 1 ,
" -
(a) (b) (c)
the widespread distribution of each receptor gene. However, we have seen
that the axons of each receptor cell type synapse upon particular glomeruli
in the olfactory bulbs. Such an arrangement yields a sensory map, where
neurons in a specific place in the bulb respond to particular odors. The
maps of regions activated by one chemical stimulus can be visualized
with special recording methods. Experiments reveal that while many bulb
neurons are activated by one odor, the neurons' positions form complex
but reproducible spatial patterns, as shown in Figure 8.18. Thus, the smell
of a particular chemical is converted into a specific map within the "neural
space" of the bulbs, and the form of the map depends on the nature and
concentration of the odorant.
You will see in subsequent chapters that every sensory system uses spa-
tial maps, perhaps for many different purposes. In most cases, the maps
correspond obviously to features of the sensory world. For example, in the
visual system, there are maps of visual space, and in the somatic sensory
system, there are maps of the body surface. The maps of the chemical
senses are unusual in that the stimuli themselves have no meaningful
spatial properties. Although seeing a skunk walking in front of you may tell
you what and where it is, smell by itself can reveal only the what. (By
moving your head about. you can localize smells only crudely.) Because the
olfactory system does not have to map the spatial pattern of an odor in the
same way that the visual system has to map the spatial patterns of light.
neural odor maps may be available for other purposes, such as discrimina-
tion among a huge number of different chemicals.
But are neural odor maps actually used by the brain to distinguish between
chemicals? We don't know the answer. For a map to be useful. there must
be something that reads and understands it. With practice and very spe-
cialized goggles, we might be able to read the "alphabet" of odors mapped
on the surface of the olfactory bulb with our eyes. This may roughly ap-
proximate what higher regions of the olfactory system do, but so far there
is no evidence that the olfactory cortex has this capability. An alternative
idea is that spatial maps do not encode odors at all, but are simply the
most efficient way for the nervous system to form appropriate connections
between related sets of neurons (e.g., receptor cells and glomerular cells).
The Eye
INTRODUCTION
PROPERTIES OF LIGHT
LIGHT
OPTICS
THE STRUCTURE OF THE EYE
GROSS ANATOMY OF THE EYE
OPHTHALMOSCOPIC APPEARANCE OF THE EYE
. Box 9.1 Of Special Interest: Demonstrating the Blind Regions of Your Eye
CROSS-SECTIONAL ANATOMY OF THE EYE
. Box 9.2 Of Special Interest: Eye Disorders
IMAGE FORMATION BY THE EYE
REFRACTION BY THE CORNEA
ACCOMMODATION BY THE LENS
. Box 9.3 Of Special Interest: Vision Correction
THE PUPILLARY LIGHT REFLEX
THE VISUAL FIELD
VISUAL ACUITY
MICROSCOPIC ANATOMY OF THE RETINA
THE LAMINAR ORGANIZATION OF THE RETINA
PHOTORECEPTOR STRUCTURE
REGIONAL DIFFERENCES IN RETINAL STRUCTURE
PHOTOTRANSDUCTION
PHOTOTRANSDUCTION IN RODS
PHOTOTRANSDUCTION IN CONES
Color Detection
. Box 9.4 Of Special Interest: The Genetics of Color Vision
DARK AND LIGHT ADAPTATION
Calcium's Role in Light Adaptation
RETINAL PROCESSING
. Box 9.5 Path of Discovery: A Glimpse into the Retina, by John Dowling
TRANSFORMATIONS IN THE OUTER PLEXIFORM LAYER
Bipolar Cell Receptive Fields
RETINAL OUTPUT
GANGLION CELL RECEPTIVE FIELDS
TYPES OF GANGLION CELLS
Color-Opponent Ganglion Cells
PARALLEL PROCESSING
CONCLUDING REMARKS
CHAPTER
278 C HAP T E R 9 . THE EYE
. INTRODUCTION
Vision is remarkable-it lets us detect things as tiny and close as a mosquito
on the tip of our nose, or as immense and far away as a galaxy near the
fringes of the universe. Sensitivity to light enables animals, including humans,
to detect prey, predators, and mates. Based on the light bounced into our
eyes from objects around us, we somehow make sense of a complex world.
While this process seems effortless, it is in reality extremely complicated.
Indeed, it has proven quite difficult to make computer visual systems with
even a small fraction of the capabilities of the human visual system.
Light is electromagnetic energy that is emitted in the form of waves. We
live in a turbulent sea of electromagnetic radiation. Like any ocean, this sea
has large waves and small waves, short wavelets and long roHers. The
waves crash into objects and are absorbed, scattered, reflected, and bent.
Because o[ the nature of electromagnetic waves and their interactions with
the environment, the visual system can extract information about the
world. This is a big job, and it requires a lot of neural machinery. However,
the mastery of vision over the course of vertebrate evolution has had
surprising rewards. It has provided new ways to communicate, given rise
to brain mechanisms [or predicting the trajectory of objects and events in
time and space, allowed for new for!lls of mental imagery and abstraction,
and led to the creation of a world of art. The significance of vision is perhaps
best demonstrated by the fact that about half of the human cerebral cortex
is involved with analyzing the visual world.
The mammalian visual system begins with the eye. At the back of the
eye is the retina, which contains photoreceptors specialized to conven
light energy imo neural activity. The rest of the eye acts like a camera and
forms crisp, clear images o[ the world on the retina. Like a camera, the eye
automatically adjusts to differences in illumination and automatically focuses
itself on objects of interest. The eye has some additional features not yet
available on cameras, such as the ability to track moving objects (by eye
movement) and the ability to keep its transparent surfaces clean (by tears
and blinking).
While much of the eye functions like a camera, the retina is much more
than film. In fact, as mentioned in Chapter 7, the retina is actually part of
the brain. (Think about that the next time you look deeply into someone's
eyes.) In a sense, each eye has two overlapping retinas: one specialized for
low light levels that we encounter from dusk to dawn, and another spe-
cialized for higher light levels and for the detection of color, from sunrise
to sunset. Regardless of the time of day, however, the output of the retina
is not a faithful reproduction of the intensity of the light falling on it.
Rather, the retina is specialized to detect differences in the intensity of light
falling on different parts of it. Image processing is well under way in the
retina, before any visual information reaches the rest of the brain.
Axons of retinal neurons are bundled into optic nerves, which distribute
visual information (in the form of action potentials) to several brain struc-
tures that perform different functions. Some targets of the optic nerves are
involved in regulating biological rhythms, which are synchronized with the
light-dark daily cycle; others are involved in the control of eye position and
optics. However, the first synaptic relay in the pathway that serves visual
perception occurs in a cell group of the dorsal thalamus called the lateral
geniculate nucleus, or LGN. From the LGN, visual information ascends to the
cerebral cortex, where it is interpreted and remembered.
In this chapter, we explore the eye and the retina. We'll see how light
carries information to our visual system, how the eye forms images on the
retina, and how the retina converts light energy into neural signals that can
be used to extract information about luminance and color differences. In
Chapter 10, we will pick up the visual pathway at the back of the eye and
take it through the thalamus to the cerebral cortex.
... PROPERTIES OF LIGHT
The visual system uses light to form images of the world around us. Let's
briefly review the physical properties of light and its interactions with the
environment.
Light
Electromagnetic radiation is aU around us. It comes from innumerable
sources, including radio antennas, mobile phones, X-ray machines, and the
sun. Light is the electromagnetic radiation that is visible to our eyes. Elec-
tromagnetic radiation can be described as a wave of energy. Like any wave,
electromagnetic radiation has a wavelength, the distance between successive
peaks or troughs; a frequency, the number of waves per second; and an
amplitude, the difference between wave trough and peak (Figure 9.1).
The energy content of electromagnetic radiation is proportional to its
frequency. Radiation emitted at a high frequency (short wavelengths) has
the highest energy content; examples are gamma radiation emitted by
some radioactive materials and X-rays used for medical imaging, with
wavelengths less than 10- 9 m «1 nm). Conversely, radiation emitted at
lower frequencies (longer wavelengths) has less energy; examples are radar
and radio waves, with wavelengths greater than 1 mm. Only a small part
of the electromagnetic spectrum is detectable by our visual system; visible
light consists of wavelengths of 400-700 nm (Figure 9.2). As first shown
by Isaac Newton early in the eighteenth century, the mix of wavelengths
in this range emitted by the sun appears to humans as white, whereas light
of a single wavelength appears as one of the colors of the rainbow. It is in-
teresting to nOte that a "hot" color like red or orange consists of light with
a longer wavelength, and hence has less energy, than a "cool" color like
blue or violet. Clearly, colors are themselves "colored" by the brain, based
on our subjective experiences.
Optics
In a vacuum, a wave of electromagnetic radiation will travel in a straight
line and thus can be described as a ray. Light rays in our environment also
Gamma
rays
Ultra- I
violet I
rays
Broadcast bands
Infrared
rays
X-rays
Radar
Visible light
Higher
energy 400
NW\
I 1
500 600
Wavelength (nm)
Lower
700 energy
... PROPERTIES OF LIGHT 279
\i/\if\/V\r\
f Amplitude
.j
Wavelength
FIGURE 9.1
Characteristics of electromagnetic
radiation.
AC
circuits
FIGURE 9.2
The electromagnetic spectrum. Only
electromagnetic radiation with wavelengths
of 400-700 nm is visible to the naked human
. eye. Within this visible spectrum. different
wavelengths appear as different colors.
280 C HAP T E R 9 . THE EYE
Reflection
Absorption
I
-E
Refraction
Air Water
FIGURE 9.3
Interactions between light and the en-
vironment. Reflection and absorption deter-
mine what light enters the eye. Images are
formed in the eye by refraction. In this exam-
ple of light passing through air and then water.
the light rays bend toward a line perpendicu-
lar to the air-water interface.
Pupil
/
COOjUnct l
\
".
Scfera
/ 'OPtiC
nerve
/
I
(
/
/ t'\_
Comea "'
Extraocular
muscles
FIGURE 9.4
Gross anatomy of the human eye.
travel in straight lines until they interact with the atoms and molecules of
the atmosphere and objects on the ground. These interactions include re-
flection, absorption, and refraction (Figure 9.3). The study of light rays and
their interactions is called optics.
Reflection is the bouncing of light rays off a surface. The manner in which
a ray of light is reflected depends on the angle at which it strikes the surface.
A ray striking a mirror perpendicularly is reflected 180° back upon itself, a
ray striking the mirror at a 45° angle is reflected 90°, and so on. Most of
what we see is light that has been reflected off objects in our environment.
Absorption is the transfer of light energy to a particle or surface. You can
feel this energy transfer on your skin on a sunny day, as visible light is
absorbed and warms you up. Surfaces that appear black absorb the energy
of all visible wavelengths. Some compounds absorb light energy only in a
limited range of wavelengths, then reflect the remaining wavelengths. This
property is the basis for the colored pigments of paints. For example, a blue
pigment absorbs long wavelengths but reflects a range of short wavelengths
centered on 430 nm that are perceived as blue. As we will see in a moment,
light-sensitive photoreceptor cells in the retina contain pigments and use the
energy absorbed from light to generate changes in membrane potential.
Tmages are formed in the eye by refraction, the bending of light rays
that can occur when they travel from one transparent medium to another.
Consider a ray of light passing from the air into a pool of water. If the ray
strikes the water surface perpendicularly, it will pass through in a straight
line. However, if light strikes the surface at an angle, it will bend toward a
line that is perpendicular to the surface. This bending of light occurs because
the speed of light differs in the two media; light passes through air more
rapidly than through water. The greater the difference between the speed
of light in the two media, the greater the angle of refraction. The trans-
parent media in the eye bend light rays to form images on the retina.
Y THE STRUCTURE OFTHE EYE
The eye is an organ specialized for the detection, localization, and analysis
of light. Here we introduce the structure of this remarkable organ in terms
of its gross anatomy, ophthalmoscopic appearance, and cross-sectional
anatomy.
Gross Anatomy of the Eye
When you look into someone's eyes, what are you really looking at? The
main structures are shown in Figure 9.4. The pupil is the opening that
allows light to enter the eye and reach the retina; it appears dark because
of the light-absorbing pigments in the retina. The pupil is surrounded by
the iris, whose pigmentation provides what we call the eye's color. The iris
contains two muscles that can vary the size of the pupil; one makes it
smaller when it contracts, the other makes it larger. The pupil and iris are
covered by the glassy transparent external surface of the eye, the cornea.
The cornea is continuous with the sclera, the "white of the eye," which
forms the tough wall of the eyeball. The eyeball sits in a bony eye socket
in the skull, also called the eye's orbit. Inserted into the sclera are three
pairs of extraocular muscles, which move the eyeball in the orbit. These
muscles normally are not visible because they lie behind the conjunctiva,
a membrane that folds back from the inside of the eyelids and attaches to
the sclera. The optic nerve, carrying axons from the retina, exits the back
of the eye. passes through the orbit. and reaches the base of the brain near
the pituitary gland.
Ophthalmoscopic Appearance of the Eye
Another view of the eye is afforded by the ophthalmoscope, a device that
enables one to peer into the eye through the pupil to the retina (Figure 9.5).
The most obvious feature of the retina viewed through an ophthalmoscope
is the blood vessels on its surface. These retinal vessels originate from a pale
circular region called the optic disk which is also where the optic nerve
fibers exit the retina.
It is interesting to note that the sensation of light cannot occur at the
optic disk because there are no photoreceptors here, nor can it occur where
the large blood vessels exist because the vessels cast shadows on the retina.
And yet our perception of the visual world appears seamless. We are not
aware of any holes in our field of vision because the brain fills in our per-
ception of these areas. However, there are tricks by which we can demon-
strate the "blind" retinal regions (Box 9.1).
At the middle of each retina is a darker-colored region with a yellowish
hue. This is the macula (from the Latin word for "spot"), the part of the
retina for central (as opposed to peripheral) vision. Besides its color, the
macula is distinguished by the relative absence of large blood vessels. No-
tice in Figure 9.5 that the vessels arc from the optic disk to the macula; this
is also the trajectory of the optic nerve fibers from the macula en route to
the optic disk. The relative absence of large blood vessels in this region of
the retina is one of the specializatioDs that improves the quality of central
vision. AD other specialization of the central retina can sometimes be dis-
cerned with the ophthalmoscope: the fovea, a dark spot about 2 mm in
diameter. The term is from the Latin for "pit" and the retina is thinner in
the fovea than elsewhere. Because it marks the center of the retina, the
fovea is a convenient anatomical reference point. Thus, the pan of the
retina that lies closer to the nose than the fovea is called nasal, the part that
lies near the temple is called temporal, the part of the retina above the
fovea is called superior, and that below it is called inferior.
Optic disk
(blind spot)
Macula
,
4
Fovea
Blood
vessels
Nasal .01( , . Temporal
retina retina
FIGURE 9.5
The retina, viewed through an ophthalmoscope. The dotted line through the fovea
represents the demarcation between the side of the eye nearer the nose (nasal retina) and
the side of the eye nearer the ear (temporal retina).
T THE STRUCTURE OF THE EYE 281
282 C HAP T E R 9 . THE EYE
Box 9.1
,,'.
OF SPECIAL INTEREST
#
__ Demonstrating the
Blind Regions of Your Eye
A look through an ophthalmoscope reveals that there is
a sizable hole in the retina. The region where the optic
nerve axons exit the eye and the retinal blood vessels
enter the eye, the optic disk, is completely devoid of
photoreceptors. Moreover, the blood vessels coursing
across the retina are opaque and block the light from
falling on photoreceptors beneath them. Although we
normally don't notice them, these blind regions can be
demonstrated. Look at Figure A. Hold the book about
1.5 ft away, close your right eye, and fixate on the cross
with your left eye. Move the book (or your head) around
slightly, and eventually you will find a position where the
black circle disappears. At this position, the spot is imaged
on the optic disk of the left eye. This region of visual space
is called the blind spot for the left eye.
The blood vessels are a little tricky to demonstrate, but
give this a try. Get a standard household flashlight. In a
dark or dimly lit room, close your left eye (it helps to hold
the eye closed with your finger so you can open your
.
FIGURE A
right eye further). Look straight ahead with the open right
eye, and shine the flashlight at an angle into the corner of
the eye from the side. Jiggle the light back and forth, up and
down. If you're lucky, you'll see an image of your own reti-
nal blood vessels. This is possible because the illumination of
the eye at this oblique angle causes the retinal blood vessels
to cast long shadows on the adjacent regions of retina.
For the shadows to be visible, they must be swept back
and forth on the retina, hence the jiggling of the light.
If we have all these light-insensitive regions in the retina,
why does the visual world appear uninterrupted and seam-
less? The answer is that mechanisms in the visual cortex
appear to "fill in" the missing regions. Perceptual filling-in
can be demonstrated with the stimulus shown in Figure
B. Fixate on the cross with your left eye and move the
book closer and farther from your eye. You'll find a dis-
tance at which you will see a continuous uninterrupted
line. At this point, the space in the line is imaged on the
blind spot, and your brain fills in the gap.
+
+
FIGURE B
Cross-Sectional Anatomy of the Eye
A cross-sectional view of the eye shows the path taken by light as it passes
through the cornea toward the retina (Figure 9.6). The cornea lacks blood
vessels and is nourished by the fluid behind it the aqueous humor. This
view reveals the transparent lens located behind the iris. The lens is sus-
pended by ligaments (called zonule fibers) attached to the ciliary muscles,
which are attached to the sclera and form a ring inside the eye. As we shall
see, changes in the shape of the lens enable our eyes to adjust their focus
to different viewing distances.
The lens also divides the interior of the eye into two compartments con-
taining slightly different fluids. The aqueous humor is the watery fluid that
lies between the cornea and the lens. The more viscous, jellylike vitreous
humor Jies between the lens and the retina; its pressure serves to keep the
eyeball spherical.
Zonule _
::
-1(-
Cornea /' '
Aqueous / \.
humor
Ciliary
muscle /--
Retina
..../
\ Fovea
:/
l__
'-
\
Optic nerve
\
Vitreous
humor
Sclera
FIGURE 9.6
The eye in cross section. Structures at the front of the eye regulate the amount of light
allowed in and refract the light onto the retina at the back
Although the eyes do a remarkable job of delivering precise visual infor-
mation to the rest of the brain, a variety of disorders can compromise this
ability (Box 9.2).
Y IMAGE FORMATION BY THE EYE
The eye collects the light rays emitted by or reflected off objects in the
environment, and focuses them onto the retina to form images. Bringing
objects into focus involves the combined refractive powers of the cornea
and lens. You may be surprised to learn that the cornea, rather than the
lens, is the site of most of the refractive power of the eyes.
Refraction by the Cornea
Consider the light emitted from a distant source, perhaps a bright star at
night. We see the star as a point of light because the eye focuses the star's
light to a point on the retina. The light rays striking the surface of the eye
from a distant star are virtually parallel, so they must be bent by the process
of refraction.
Recall that as light passes into a medium where its speed is slowed, it will
bend toward a line that is perpendicular to the border, or interface, be-
tween the media (see Figure 9.3). This is precisely the situation as light
strikes the cornea and passes from the air into the aqueous humor. As
shown in Figure 9.7, the light rays that strike the curved surface of the
cornea bend so that they converge on the back of the eye; those that en-
ter the center of the eye pass straight to the retina. The distance from the
refractive surface to the point where parallel light rays converge is called
the focal distance. Focal distance depends on the curvature of the cornea-
the tighter the curve, the shorter the focal distance. The equation in Figure
9.7 shows that the reciprocal of the focal distance in meters is a unit of
measurement called the diopter. The cornea has a refractive power of
about 42 diopters, which means that parallel light rays striking the corneal
surface will be focused 0.024 m (2.4 em) behind it, about the distance from
cornea to retina. To get a sense of the large amount of refraction produced
'Y IMAGE FORMATION BY THE EYE 283
284 C HAP T E R 9 . THE EYE
FIGURE 9.7
Refraction by the cornea. The cornea
must have sufficient refractive power. meas-
ured in diopters, to focus light on the retina
at the back of the eye.
FIGURE 9.8
Accommodation by the lens. To focus
the eye on a distant point, relatively little
refraction IS required. and it IS provided by
a flat lens. Near objects require greater refrac
tion provided by a more spherical lens.
---
---
---
p-
(
I
I
\
..
J,
-
'--C:
.'
Focal distance
Refractive power (diopters) = 1
focal distance (m)
by the cornea, note that many prescription eyeglasses have a power of only
a few diopters.
Remember that refractive power depends on the slowing of light at the
air-cornea interface. If we replace air with a medium that passes light at
about the same speed as the eye, the refractive power of the cornea will be
eliminated. This is why things look blurry when you open your eyes un-
derwater; the water-cornea interface has very little focusing power. A scuba
mask restores the air-cornea interface and, consequently, the refractive
power of the eye.
Accommodation by the Lens
Although the cornea performs most of the eye's refraction, the lens also
contributes another dozen or so diopters to the formation of a sharp image
at a distant point. However, the lens is involved more importantly in form-
ing crisp images of objects located closer than about 9 m from the eye. As
objects approach, the light rays originating at a point can no longer be con-
sidered to be parallel. Rather, these rays diverge, and greater refractive
power is required to bring them into focus on the retina. This additional
focusing power is provided by changing the shape of the lens, a process
called accommodation (Figure 9.8).
Far point
/
Flat lens
Near point
Fat lens
Box 9.2
.... , ....
... IMAGE FORMATION BY THE EYE 285
...
OF SPECIAL INTEREST
,
4
· Eye Disorders
Once you know the basic structure of the eye, you can
understand how a partial or complete loss of vision results
from abnormalities in various components. For example.
if there is an imbalance in the extraocular muscles of the
two eyes, the eyes will point in different directions. Such
a misalignment or lack of coordination between the two
eyes is called strabismus, and there are two varieties. In
esotropia, the directions of gaze of the two eyes cross, and
the person is said to be cross-eyed. In exotropia, the direc-
tions of gaze diverge, and the person is said to be wall-
eyed (Figure A). In most cases, strabismus of either type
is congenital; it can and should be corrected during early
childhood. Treatment usually involves the use of prismatic
glasses or surgery to the extraocular muscles to realign
the eyes. Without treatment, conflicting images are sent to
the brain from the two eyes, degrading depth perception,
and, more importantly, causing the person to suppress
input from one eye. The dominant eye will be normal but
the suppressed eye will become omblyoPic, meaning that
it has poor visual acuity. If medical intervention is delayed
until adulthood, the condition cannot be corrected.
A common eye disorder among older adults is cataract,
a clouding of the lens (Figure B). Many people over 65
years of age have some degree of cataract; if it significantly
impairs vision, surgery is usually required. In a cataract
operation, the lens is removed and replaced with an arti-
ficial plastic lens. Although the artificial lens cannot adjust
its focus like the normal lens. it provides a dear image, and
glasses can be used for near and far vision (see Box 9.3).
Gloucomo, a progressive loss of vision associated with
elevated intraocular pressure, is a leading cause of blind-
ness. Pressure in the aqueous humor plays a crucial role
in maintaining the shape of the eye. As this pressure in-
creases, the entire eye is stressed, ultimately damaging the
relatively weak point where the optic nerve leaves the
eye. The optic nerve axons are compressed. and vision is
FIGURE A
Exotropia. (Source: Newell, 1965.
p. 330.)
gradually lost from the periphery inward. Unfortunately,
by the time a person notices a loss of more central vision,
the damage is advanced and a significant portion of the
eye is permanently blind. For this reason, early detection
and treatment with medication or surgery to reduce
intraocular pressure are essential.
The light-sensitive retina at the back of the eye is the
site of numerous disorders that pose a significant risk of
blindness. You may have heard of a professional boxer hav-
ing a detached retina. As the name implies, the retina pulls
away from the underlying wall of the eye from a blow to
the head or by shrinkage of the vitreous humor. Once the
retina has started to detach, fluid from the vitreous space
flows through small tears in the retina resulting from the
trauma. thereby causing more of the retina to separate.
Symptoms of retinal detachment include abnormal per-
ception of shadows and flashes of light. Treatment often
involves laser surgery to scar the edge of the retinal tear,
thereby reattaching the retina to the back of the eye.
Retinitis pigmentoso is characterized by a progressive de-
generation of the photo receptors. The first sign is usually a
loss of peripheral vision and night vision. Subsequently, total
blindness may result. The cause of this disease is unknown.
In some forms, it dearly has a strong genetic component, and
more than I 00 genes have been identified that can contain
mutations leading to retinitis pigmentosa. There is currently
no cure, but taking vitamin A may slow its progression.
In contrast to the tunnel vision typically experienced by
patients with retinitis pigmentosa, people with moculor
degeneration lose only central vision. The condition is quite
common, affecting more than 25% of all Americans over
65 years of age. While peripheral vision usually remains
normal, the ability to read. watch television. and recognize
faces is lost as central photoreceptors gradually deterio-
rate.laser surgery can sometimes minimize further vision
loss. but the disease currently has no known cure.
.
FIGURE B
Cataract. (Source:
Schwab. 1987. p. 22.)
286 C HAP T E R 9 . THE EYE
Box 9.3
..' ;.
...
4
...
OF SPECIAL INTEREST
Vision Correction
When the ciliary muscles are relaxed and the lens is flat, the
eye is said to be emmetropic if parallel light rays from a dis-
tant point source are focused sharply on the back of the
retina. (The word is from the Greek emmetros, "in proper
measure," and ope. "sight.") Stated another way, the em-
metropic eye focuses parallel light rays on the retina with-
out the need for accommodation (Figure A).
Now consider what happens when the eyeball is too
short from front to back (Figure B). The light rays are fo-
cused at some point behind the retina, and the image of a
point of light is a blurry spot on the retina. This condition
is known as hyperoPia. or farsightedness, because the eye can
focus on far objects but the lens cannot accommodate
enough to form an image on near points. Farsightedness can
be corrected by placing a convex glass or plastic lens in
front of the eye (Figure C). The curved front edge of the
lens. like the cornea, bends light toward the center of the
retina. Also, as the light passes from glass into air as it exits
the lens, the back of the lens also increases the refraction
(light going from glass to air speeds up and is bent away
from the perpendicular).
If the eyeball is too liong rather than too short. parallel
rays will converge before the retina, cross. and again be im-
aged on the retina as a blurry circle (Figure D). This condi-
tion is known as myopia, or nearsightedness. The amount of
refraction provided by the cornea and lens is too great to
focus distant objects. Thus. for the nearsighted eye to see
distant points clearly, artificial concave lenses must be used
to move the point image back onto the retina (Figure E).
Some eyes have irregularities such that the curvature and
refraction in the horizontal and vertical planes is different.
This condition is called astigmatism, and it can be corrected
by using an artificial lens that is curved more along one axis
than others.
Even if you are fortunate enough to have perfectly shaped
eyeballs and a symmetrical refractive system, you proba-
bly will not escape presbyopia (from the Greek meaning "old
eye").This condition is a hardening of the lens that accom-
panies the aging process and is thought to be explained by
the fact that while new lens cells are generated throughout
life. none are lost. The hardened lens is less elastic. leaving
it unable to change shape and accommodate sufficiently to
focus on both near and far objects. The correction for pres-
byopia. first introduced by Benjamin Franklin. is a bifocal
lens. These lenses are concave on top to assist far vision
and convex on the bottom to assist near vision. .
In hyperopia and myopia. the amount of refraction pro-
vided by the cornea is either too little or too great for the
length of the eyeball. But modern techniques can now change
the amount of refraction the cornea provides. In radial ker-
atotomy, a procedure to correct myopia, tiny incisions
through the peripheral portion of the cornea relax and fiat-
ten the central cornea. thus reducing the amount of refrac-
tion and minimizing the myopia.The most recent techniques
use lasers to reshape the cornea. In photore(mctive keratec-
tomy (PRK), a laser is used to reshape the outer surface of
the cornea by vaporizing thin layers. In laser in situ ker-
atomileusis (LASIK). a thin flap of the cornea is lifted so the
laser can reshape the cornea from the inside. Nonsurgical
methods are also being used to reshape the cornea. A per-
son can be fitted with special retainer contact lenses or plas-
tic corneal rings, which alter the shape of the cornea and
correct refractive errors.
Recall that the ciliary muscle forms a ring around the lens. During ac-
commodation, the ciliary muscle contracts and swells in size, thereby mak-
ing the area inside the muscle smaller and decreasing the tension in the
suspensory ligaments. Consequently, the lens becomes rounder and thicker
because of its natural elasticity. This rounding increases the curvature of the
lens surfaces, thereby increasing their refractive power. Conversely, relax-
ation of the ciliary muscle increases the tension in the suspensory liga-
ments, and the lens is stretched into a flatter shape.
The ability to accommodate changes with age. An infant's eyes can focus
objects just beyond his or her nose, whereas many middle-aged adults can-
not clearly see objects closer than about arm's length. Fortunately, artifi-
cial lenses can compensate for this and other defects of the eye's optics
(Box 9.3).
T IMAGE FORMATION BY THE EYE 287
I ' i
/
( \
'I'
..,
Emmetropia
FIGURE A
I Q f "-
. \
--- B I t. \t 1
--- /.
.., '---"
_At
Hyperopia Hyperopia correction
FIGURE B FIGURE C
I I
; c: ; I
I
!
i
I
I
L I
Myopia Myopia correction __J
---
FIGURE D FIGURE E
The Pupillary Light Reflex
In addition to the cornea and the lens, the pupil contributes to the optical
functioning of the eye by continuously adjusting for different ambient light
levels. To check this for yourself, stand in from of a bathroom mirror with
the lights out for a few seconds, and then watch your pupils change size
when you turn the lights on. This pupillary light reflex involves con-
nections between the retina and neurons in the brain stem that control the
muscles that constrict the pupils. An interesting property of this reflex is
that it is consensual; shining a light into only one eye causes the constric-
tion of the pupils of both eyes. It is unusual, indeed, when the pupils are
not the same size; the lack of a consensual pupillary light reflex is often
taken as a sign of a serious neurological disorder involving the brain stem.
288 C HAP T E R 9 . THE EYE
..- 150°--.
Right eye
FIGURE 9.9
The visual field for one eye. The visual
field is the total amount of space that can be
viewed by the retina when the eye is fixated
straight ahead. Notice how the image of an
object in the visual field (pencil) is inverted on
the retina.
Moon
.
0.5 0 of
visual angle
\
"
140 !Am
FIGURE 9.10
Visual angle. Distances across the retina can
be expressed as degrees of visual angle.
Constriction of the pupil has the effect of increasing the depth of focus,
just like decreasing the aperture size (increasing the f-stop) on a camera
lens. To understand why this is true, consider two points in space, one close
and the other far away. When the eye accommodates to the closer point,
the image of the farther point on the retina no longer forms a point, but
rather a blurred circle. Decreasing the aperture-constricting the pupil-
reduces the size of this blurred circle so that its image more closely ap-
proximates a point. In this way, distant objects appear to be less out of
focus.
The Visual Field
The structure of the eyes, and where they sit in our head, limits how much
of the world we can see at anyone time. Let's investigate the extent of the
space seen by one eye. Holding a pencil in your right hand, dose your left
eye and look at a point straight ahead. Keeping your eye fixated on this
point, slowly move the pencil to the right (toward your right ear) across
your field of view until the pencil disappears. Repeat this exercise, moving
the pencil to the left where it will disappear behind your nose, and then
up and down. The points where you can no longer see the pencil mark the
limits of the visual field for your right eye. Now look at the middle of the
pencil as you hold it horizontally in front of you. Figure 9.9 shows how
the light reflected off this pencil falls on your retina. Notice that the image
is inverted; the left visual field is imaged on the right side of the retina, and
the right visual field is imaged on the left side of the retina.
Visual Acuity
The ability of the eye to distinguish two nearby points is called visual
acuity. Acuity depends on several factors, but especially on the spacing of
photoreceptors in the retina and the precision of the eye's refraction.
Distance across the retina can be described in terms of degrees of visual
angle. A right angle sub tends (spans) 90°, and the moon, for example, sub-
tends an angle of about 0.5° (Figure 9.10). We can speak of the eye's abil-
ity to resolve points that are separated by a certain number of degrees of
visual angle. The Snellen eye chart, which we have all read at the doctor's
office, tests our ability to discriminate letters and numbers at a viewing dis-
tance of 20 feet. Your vision is 20/20 when you can recognize a letter that
subtends an angle of 0.083° (equivalent to 5 minutes of arc. where I
minute is 1/60 of a degree).
MICROSCOPIC ANATOMY OF THE RETINA
Now that we have an image formed on the retina, we can get to the neuro-
science of vision: the conversion of light energy into neural activity. To begin
our discussion of image processing in the retina, we must introduce the
cellular architecture of this bit of brain.
The basic system of retinal information processing is shown in Figure
9.11. The most direct pathway for visual information to exit the eye is from
photo receptors to bipolar cells to ganglion cells. The ganglion cells fire
action potentials in response to light, and these impulses propagate down
the optic nerve to the rest of the brain. Besides the cells in this direct path
from photoreceptor to brain, retinal processing is influenced by two addi-
tional cell types. Horizontal cells receive input from the photoreceptors
and project neurites laterally to influence surrounding bipolar cells and
photoreceptors. Amacrine cells receive input from bipolar cells and project
laterally to influence surrounding ganglion cells, bipolar cells, and other
amacrine cells.
There are two important points to remember here:
1. The only light-sensitive cells in the retina are the photoreceptors. All other cells
are influenced by light only via direct and indirect synaptic interactions
with the photoreceptors. (We will see in Chapter 19 that there is one
exception to this rule involving neurons that control circadian rhythms.
However, these unusual photoreceptive cells do not appear to be in-
volved in visual perception.)
2. The ganglion cells are the only source of output from the retina. No other retinal
cell type projects an axon through the optic nerve.
Now Jet's take a look at how the different cell types are arranged in the
retina.
The laminar Organization of the Retina
Figure 9.12 shows that the retina has a laminar organization: Cells are organ-
ized in layers. Notice that the layers are seemingly inside-out; light must
pass from the vitreous humor through the ganglion cells and bipolar cells
before it reaches the photoreceptors. Because the retinal cells above the
Light
....
"
,
"
\
//
Retina
\"
,
--.
I
I
r
"
Optic
nerve
FIGURE 9.12
The laminar organization of the retina.
Notice how light must pass through several cell
layers before it reaches the photoreceptors at
the back of the retina.
... MICROSCOPIC ANATOMY OFTHE RETINA 289
Ganglion cell axons
projecting to forebrain
Bipolar
cell
Amacrine
cell
Horizontal
cell
Photo receptors
FIGURE 9.11
The basic system of retinal information
processing. Information about light flows
from the photoreceptors to bipolar cells to
ganglion cells, which project axons out of the
eye in the optic nerve. Horizontal cells and
amacrine cells modify the responses of bipolar
cells and ganglion cells via lateral connections.
"
'""
Ganglion cell
layer
"
} Inner plexiform
layer
} Inner nuclear
layer
} Outer plexiform
layer
t.
Outer nuclear
layer
} Layer of
photoreceptor
outer segments
} Pigmented
epithelium
290 C HAP T E R 9 . THE EYE
!III
=
=
=
=
=
=
=
=
=,-,
=
=-
=
:=:=-'
I l
I --
-,
=
=
Cone
photo-
receptor
} Synaptic
terminals
Cell
bodies
Inner
segments
Outer
segments
Rod Membranous disks
photoreceptor containing photopigment
FIGURE 9.13
A rod and a cone. Rods make vision possi-
ble in low light, and cones enable us to see in
daylight.
photo receptors are relatively transparent, image distortion is minimal as
light passes through them. One reason the inside-out arrangement is advan-
tageous is that the pigmented epithelium that lies below the photo receptors
plays a critical role in the maintenance of the photoreceptors and photopig-
ments. The pigmented epithelium also absorbs any light that passes entirely
through the retina, thus minimizing the reflection of light within the eye
that would blur the image.
The cell layers of the retina are named in reference to the middle of the
eyeball. Thus, the innermost layer is the ganglion cell layer, which con-
tains the cell bodies of the ganglion cells. Next is the inner nuclear layer,
which contains the cell bodies of the bipolar cells, the horizontal and
amacrine cells. The next layer is the outer nuclear layer, which contains
the cell bodies of the photoreceptors. Finally, the layer of photoreceptor
outer segments contains the light-sensitive elements of the retina. The
outer segments are embedded in the pigmented epithelium.
Between the ganglion cell layer and the inner nuclear layer is the inner
plexiform layer, which conrains the synaptic contacts between bipolar
cells, amacrine cells, and ganglion cells. Between the outer and inner nuclear
layers is the outer plexiform layer, where the photoreceptors make
synaptic conract with the bipolar and horizontal ceJls.
Photoreceptor Structure
The conversion of electromagnetic radiation into neural signals occurs in the
125 million photoreceptors at the back of the retina. Every photoreceptor
has four regions: an ourer segment, an inner segment, a cell body, and a
synaptic terminal. The ourer segment contains a stack of membranous
disks. Light-sensitive photopigments in the disk membranes absorb light,
thereby triggering changes in the photoreceptor membrane potential (dis-
cussed below). Figure 9.13 shows the two types of photoreceptor in the
retina, easily distinguished by the appearance of their outer segments. Rod
photoreceptors have a long, cylindrical outer segment, containing many
disks. Cone photoreceptors have a shorter, tapering outer segment with
fewer membranous disks.
The structural differences between rods and cones correlate with impor-
tant functional differences. For example, the greater number of disks and
higher photopigment concentration in rods makes them over 1000 times
more sensitive to light than cones. Indeed, under nighttime lighting, or
scotopic conditions. only rods contribute to vision. Conversely, under day-
time lighting, or photopic conditions, cones do the bulk of the work. For this
reason, the retina is said to be duplex-a scotopic retina using only rods, and
a photopic retina using mainly cones.
Rods and cones differ in other respects as well. All rods contain the same
photopigment. but there are three types of cone, each containing a differ-
ent pigment. The variations among pigments make the different cones sen-
sitive to different wavelengths of light. As we shall see in a moment, only
the cones, not the rods, are responsible for our ability to see color.
Regional Differences in Retinal Structure
Retinal structure varies from the fovea to the retinal periphery. In general,
the peripheral retina has a higher ratio of rods to cones (Figure 9.14). It
also has a higher ratio of photoreceptors to ganglion ceJls. The combined
effect of this arrangement is that the peripheral retina is more sensitive to
light, because (1) rods are specialized for low light, and (2) there are more
photoreceptors feeding information to each ganglion cell. You can prove
... MICROSCOPIC ANATOMY OFTHE RETINA 291
N
E
E
-g
.c
E
:;J
z
70° 50° 30° 10° 0 10° 30° 50° 70° 90°
(a) .... Distance across retina
Temporal Central Nasal
periphery retina periphery
(c)
0'
o
:: 1-
- - -
-0- L =
(b) Peripheral retina
o
Central retina
o
Peripheral retina
(d)
FIGURE 9.14
Regional differences in retinal structure. (a) Cones are found primarily in the central
retina, within 10° of the fovea. Rods are absent from the central fovea and are found mainly
in the peripheral retina. (b) In the central retina, relatively few photoreceptors feed informa-
tion directly to a ganglion cell; in the penpheral retina, many photoreceptors provide input.
This arrangement makes the peripheral retina better at detecting dim light but the central
retina better for high-resolution vIsion. (c) This magnified cross section of the human central
retina shows the dense packing of cone Inner segments. (d) At a more peripheral location
on the retina. the cone inner segments are larger and appear as islands in a sea of smaller
rod inner segments. (Source for parts c and d: Curcio et al.. 1990, p. 500.)
this to yourself on a starry night. (It's fun; try it with a friend.) First. spend
about 20 minutes in the dark getting oriented, and then gaze at a bright
star. Fixating on this star, search your peripheral vision for a dim star. Then
move your eyes to look at this dim star. You will find that the faint star dis-
appears when it is imaged on the central retina (when you look straight at
it) but reappears when it is imaged on the peripheral retina (when you look
slightly to the side of it).
The same characteristics that enable the peripheral retina to detect faint
stars at night make it relatively poor at resolving fine details in daylight.
This is because daytime vision requires cones, and because good visual acuity
292 C HAP T E R 9 . THE EYE
} Ganglion cell
layer
-' \
/
I
.....
,
....
\
} Inner nuclear
layer
} Outer nuclear
layer
I
,
Cones
,
,
Rods
FIGURE 9.15
The fovea in cross section. The ganglion cell layer and the inner nuclear layer are
displaced laterally to allow light to strike the foveal photoreceptors directly.
requires a low ratio of photoreceptors to ganglion cells. The region of retina
most highly specialized for high-resolution vision is the fovea. Recall that
the fovea is a thinning of the retina at the center of the macula. In cross
section, the fovea appears as a pit in the retina. Its pitlike appearance is due
to the lateral displacement of the cells above the photoreceptors, allowing
light to strike the photoreceptors without passing through the other retinal
cell layers (Figure 9.15). This structural specialization maximizes visual acu-
ity at the fovea by pushing aside other cells that might scatter light and blur
the image. The central fovea also is unique because it contains no rods; all
the photo receptors are cones.
.... PHOTOTRANSDUCTION
The photoreceptors convert, or transduce, light energy into changes in
membrane potential. We begin our discussion of phototransduction with
rods, which outnumber cones in the human retina by 20 to I. Most of what
has been learned about phototransduction by rods has proven to be appli-
cable to cones as well.
Phototransduction in Rods
As we discussed in Part L one way information is represented in the nerv-
ous system is as changes in the membrane potential of neurons. Thus, we
look for a mechanism by which the absorption of light energy can be trans-
duced into a change in the photoreceptor membrane potential. In many
respects, this process is analogous to the transduction of chemical signals
into electrical signals that occurs during synaptic transmission. At a G-protein-
coupled neurotransmitter receptor, for example, the binding of transmitter
to the receptor activates G-proteins in the membrane, which in turn stim-
ulate various effector enzymes (Figure 9.16a). These enzymes alter the in-
tracellular concentration of cytoplasmic second messenger molecules, which
(directly or indirectly) change the conductance of membrane ion channels,
thereby altering membrane potential. Similarly, in the photoreceptor, light
stimulation of the photopigment activates G-proteins, which in turn acti-
vate an effector enzyme that changes the cytoplasmic concentration of a
second messenger molecule. This change causes a membrane ion channel
to close, and the membrane potential is thereby altered (Figure 9.16b).
... PHOTOTRANSDUCTION 293
Neurotransmitter
1
Light
G-protein-coupJed
receptor
Effector
enzyme
Photopigment Effector
Disk membrane enzyme
. I II { {Iii' n I 'f A:;n'f1nl" ;'.ltn' Inn n ,11 o(
_ H ' l "I"!U 'I III 1! 11 I IU 'q,g
/
I I'ln
-:') -
Cell membrane
/
nln'n n' 1'n 'n'n'l t I nln.ntn'ntn'ntn'l n'n'nln nt" l'nt!\I!It' f.
. 'NUlUI l .1 '. 'Or... I\IfJl.I 11 Ul11U1UI. J '" 0-\,
./
G-proteln
G ./
-protein
Second
messenger
Second
messenger
t
t
Ion channel
X
Ion channel
(a) G-protein-coupled
neurotransmitter receptor
(b) Photopigment
Stimulus:
Transmitter
Stimulus:
Light
Receptor
activation:
Change in protein
conformation
Receptor
activation:
Change in protein
conformation
G-protein
response:
Binds GTP
G-protein
response:
Binds GTP
Second
messenger
change:
. second messenger
Second
messenger
change:
second messenger
Ion channel
response:
Increase or decrease
conductance
Ion channel
response:
Decrease Na + conductance
FIGURE 9.16
Light transduction and G-proteins. G-protein-coupled receptors and photoreceptors
use similar mechanisms. (a) At a G-protein-coupled receptor. the binding of neurotransmitter
activates G-proteins and effector enzymes. (b) In a photoreceptor. light begins a similar
process using the G-protein transducin.
Recall from Chapter 3 that a typical neuron at rest has a membrane
potential of about -65 mY- close to the equilibrium potential for K+. In
contrast, in complete darkness, the membrane potential of the rod outer
segment is about - 30 m V. This depolarization is caused by the steady in-
flux of Na+ through special channels in the outer segment membrane (Fig-
ure 9.17a). The movement of positive charge across the membrane, which
occurs in the dark, is called the dark current. Sodium channels are stim-
ulated to open-are gated-by an intracellular second messenger called
cyclic guanosine monophosphate, or cGMP. Evidently, cGMP is con-
tinually produced in the photoreceptor by the enzyme guanylyl cyclase,
keeping the Na+ channels open. Light reduces cGMP, causing the Na+
channels to close, and the membrane potential becomes more negative (Fig-
ure 9.17b). Thus, photoreceptors hyperpolarize in response to light.
294 C HAP T E R 9 . THE EYE
(a) Dark
-30 mV
V m
-60 mV
'. .
.. .
\00\
lie
r
/
( \,\
....
o
I
I Inner
Membrane segment
hyperpolarization
l
r':
Outer
- , I
- c MP segment
I
'- /
(b) Light
Membrane
depolarization
P
-
Time-
FIGURE 9.17
The hyperpolarization of photo receptors in response to light. Photoreceptors are
continuously depolarized in the dark because of an inward sodium current the dark current.
(a) Sodium enters the photoreceptor through a cGMP-gated channel. (b) Light leads to
the activation of an enzyme that destroys cGMP. thereby shutting off the Na+ current and
hyperpolarizing the cell.
The hyperpolarizing response to light is initiated by the absorption of
electromagnetic radiation by the photopigment in the membrane of the
stacked disks in the rod outer segments. In the rods, this pigment is called
rhodopsin. Rhodopsin can be thought of as a receptor protein with a pre-
bound chemical agonist. The receptor protein is called opsin, and it has the
seven transmembrane alpha helices typical of G-protein-coupled receptors
throughout the body. The prebound agonist is called retinal, a derivative of
vitamin A. The absorption of light causes a change in the conformation of
retinal so that it activates the opsin (Figure 9.18). This process is called
bleaching because it changes the wavelengths absorbed by the rhodopsin
(the photopigment literally changes color from purple to yellow). The
bleaching of rhodopsin stimulates a G-protein called transducin in the
disk membrane, which in turn activates the effector enzyme phosphodi-
esterase (PDE), which breaks down the cGMP that is normally present in
... PHOTOTRANSDUCTJON 295
Ops',
Opsin
ii 'i Ii i Ji \
'J , ' l
11)1 iT
r l 11,( 'J1.'
I n ntn
U I U
Innnnn
\ UUUtU
\
Retanal
(active)
Disk
membrane
Retanal
(inactive)
Disk
membrane
FIGURE 9.18
The activation of rhodopsin by light. Rhodopsin consists of opsin, a protein with seven
transmembrane alpha helices, and retinal, a small molecule derived from vitamin A. Retinal
undergoes a change in conformation when it absorbs light, thereby activating the opsin.
the cytoplasm of the rod (in the dark). The reduction in cGMP causes the
Na+ channels to close and the membrane to hyperpolarize.
One of the interesting functional consequences of using a biochemical
cascade for transduction is signal am ph fie at ion. Many G-proteins are acti-
vated by each photopigment molecule, and each PDE enzyme breaks down
more than one cGMP molecule. This amplification gives our visual system
the ability to detect as little as a single photon, the elementary unit of light
energy.
The complete sequence of events of photo transduction in rods is illus-
trated in Figure 9.19.
Disk membrane
Cell membrane
----
Disk membrane
(
! --------=
--
Cell membrane
/
---
.,. "111-, .t e l.'.'.I...,...".l!ie.. -'..f..t. ,+4 I " I . . I tel-,' .,.. ..
,. · I II. ').' "n III:lIn I'.'.' ..: '... .... ......
Rhodopsin G-proteln ......
(transducin) ., ..
I . .
..,.. ...... ...... ........ .. ........ ..:,..
.. ".6"J. Of . · I .. ".'A ., · ...'i:.:....t: .
G
, 10,.,..,-, W ,...., .. ,. ...... . I I , , .. .....
II U II ' ':... .. ... ....1. '. I:. I I . I.. I ' I ..... .
..... ..... ..... ":,. '" '. .
. ..
Phosphodiesterase .... '':
I .. ........ . """'''''' '{{U{ffJ ............... i, J
If II II II "" . ,.
. ,.'. '."I.'.. ...'.e I .
-
I' GTP "
(active)
GMP
Closed
sodium chann
(inactive)
Na+
cGMP-gated sodium channel
(open)
(a) Dark
(b) Light
FIGURE 9.19
The light-activated biochemical cascade in a photoreceptor. (a) In the dark,
cGMP gates a sodium channel. causing an inward Na + current and depolarization of the
cell. (b) The activation of rhodopsin by light energy causes the G-protein (transducin) to
exchange GOP for GTP (see Chapter 6), which in turn activates the enzyme phosphodi-
esterase (POE). POE breaks down cGMP and shuts off the dark current.
296 C HAP T E R 9 . THE EYE
OJ
!/)
!:
o
C.
!/)
E:'
OJ
>
Qj
a:
560
I
400 450 500 550 600 650
Wavelength (nm)
FIGURE 9.20
The spectral sensitivity of the three
types of cone pigments.
FIGURE 9.21
Mixing colored lights. The mixing of red,
green, and blue light causes equal activation of
the three types of cones, and the perception
of "white" results.
Phototransduction in Cones
In bright sunlight, cGMP levels in rods fall to the point where the response
to light becomes saturated; additional light causes no more hyperpolariza-
tion. Thus, vision during the day depends entirely on the cones, whose
photopigments require more energy to become bleached.
The process of phototransduction in cones is virtually the same as in
rods; the only major difference is in the type of opsins in the membranous
disks of the cone outer segments. The cones in our retinas contain one of
three opsins that give the photopigments different spectral sensitivities.
Thus, we can speak of "blue" cones that are maximally activated by light
with a wavelength of about 430 nm, "green" cones that are maximally
activated by light with a wavelength of about 530 nm, and "red" cones
that are maximally activated by light with a wavelength 01 about 560 nm
(Figure 9.20).
Color Detection. The color that we perceive is largely determined by the
relative contributions of blue, green, and red cones to the retinal signal. The
fact that our visual system detects colors in this way was actually prediaed
almost 200 years ago by British physicist Thomas Young. Young showed in
1802 that all the colors of the rainbow, including white, could be created
by mixing the proper ratio of red, green, and blue light (Figure 9.21). He
proposed, quite correctly, that at each point in the retina there exists a clus-
ter of three receptor types, each type being maximally sensitive to either
blue, green, or red. Young's ideas were later championed by Hermann von
Helmholtz, an influential nineteenth-century German physiologist. (Among
his accomplishments is the invention of the ophthalmoscope in 1851.) This
theory of color vision came to be known as the Young-Helmholtz trichro-
macy theory. According to the theory, the brain assigns colors based on a
comparison of the readout of the three cone types. When all types of cones
are equally active, as in broad-spectrum light, we perceive "white." Various
forms of color blindness result when one or more of the cone photopig-
ment types is missing (Box 9.4).
If cones alone make the perception of color possible, we should be un-
able to perceive color differences when cones are inactive. This inference is
correct, and you can demonstrate it to yourself. Go outside on a dark night
and try to distinguish the colors of different objects. It is difficult to detect
colors at night because only the rods, with a single type of photopigment,
are activated under dim lighting conditions. (Bright neon signs are still seen
as colored because they emit sufficient light to affect the cones.) The peak
sensitivity of the rods is to a wavelength of about 500 nm, perceived as
blue-green (under photopic conditions). This fact is the basis for two points
of view about the design of automobile dashboard indicator lights. One
view is that the lights should be dim blue-green to take advantage of the
spectral sensitivity of the rods. An alternate view is that the lights should
be bright red because this wavelength affects mainly cones, leaving the rods
unsaturated, resulting in better night vision.
Dark and light Adaptation
This transition from all-cone daytime vision to all-rod nighttime vision is
not instantaneous; it takes about 20-25 minutes (hence the time needed to
get oriented in the star-gazing exercise above). This phenomenon is called
dark adaptation, or getting used to the dark. Sensitivity to light actually
increases a millionfold or more during this period. Dark adaptation is
Box 9.4
... , .
OF SPECIAL INTEREST
..
't' PHOTOTRANSDUCTION 297
The Genetics of Color Vision
The color we perceive is largely determined by the rela-
tive amounts of light absorbed by the red, green, and blue
visual pigments in our cones. This means it's possible to
perceive any color of the rainbow by mixing different
amounts of red, green, and blue light. For example, the
perception of yellow light can be matched by an appro-
priate mixture of red and green light. Because we use a
"three-color" system, humans are referred to as trichro-
mats. However, not all normal trichromats perceive colors
exactly the same. For example, if a group of people are
asked to choose the wavelength of light that most ap-
pears green without being yellowish or bluish, there will
be small variations in the choices. However, significant ab-
normalities of color vision extend well beyond this range
of normal trichromatic vision.
Most abnormalities in collor vision are the result of
small genetic errors that lead to the loss of one visual pig-
ment or a shift in the spectral sensitivity of one type of
pigment. The most common abnormalities involve red-
green color vision, and they are much more common in
men than women. The reason for this pattern is that the
genes encoding the red and green pigments are on the X
chromosome, whereas the gene that encodes the blue
pigment is on chromosome 7. Men will have abnormal
red-green vision if there is a defect on the single X chro-
mosome they inherit from their mother. Women will have
abnormal red-green vision only if both parents contribute
abnormal X chromosomes.
About 6% of men have a red or green pigment that
absorbs somewhat different wavelengths of light than the
pigments of the rest of the population. These men are
referred to as anomalous trichromats because they require
somewhat different mixtures of red, green, and blue to
see intermediate colors (and white) than other people
do. Most anomalous trichromats have normal genes to
encode the blue pigment and either the red or the green
pigment, but they also have a hybrid gene that encodes a
protein with an abnormal absorption spectrum between
that of normal red and green pigments. For example, a
person with an anomalous green pigment can match a
yellow light with a red-green mixture containing less red
than a normal trichromat. Anomalous trichromats per-
ceive the full spectrum of colors that normal trichromats
perceive, but in rare instances they will disagree about
the precise color of an object (e.g., bl,ue versus greenish
blue).
About 2% of men actually lack either the red or the
green pigment, making them red-green color-blind. Because
this leaves them with a "two-color" system, they are re-
ferred to as dichromats. People lacking the green pigment
are less sensitive to green, and they confuse certain red
and green colors that appear different to trichromats. A
"green dichromat" can match a yellow light with either
red or green light, no mixture is needed. In contrast to
the roughly 8% of men that are either missing one pig-
ment or have an anomalous pigment, only about I % of
women have such color abnormaliti.es.
People without one color pigment are considered color-
blind, but they actually perceive quite a colorful world.
Estimates of the number of people lacking all color vision
vary, but less than about 0.00 I % of the population is
thought to have this condition. In one type, both red and
green cone pigments are missing, in many cases because
mutations of the red and green genes make them non-
functional. These people are blue cone monochromats and
they live in a world that varies only in lightness, like a
trichromat's perception of a black-and-white movie.
Recent research has shown that, precisely speaking,
there may not be such a thing as normal color vision. In
a group of males classified as normal trichromats, it was
found that some require slightly more red than others to
perceive yellow in a red-green mixture. This difference,
which is tiny compared to the deficits discussed above,
results from a single alteration of the red pigment gene.
The 60% of males who have the amino add serine at site
180 in the red pigment gene are more sensitive to long-
wavelength light than the 40% who have the amino add
alanine at this site. Imagine what would happen if a woman
had different red gene varieties on her two X chromo-
somes. Both red genes should be expressed, leading to
different red pigments in two populations of cones. In
principle, such women should have a form of tetrachro-
matic color vision, a rarity among all animals.
298 C HAP T E R 9 . THE EYE
explained by a number of factors. Perhaps the most obvious is dilation of the
pupils, which allows more light to enter the eye. However, the diameter of
the human pupil only ranges from about 2-8 mm, meaning that changes
in its size can increase the pupil area by a factor of only 16. The larger com-
ponent of dark adaptation involves the regeneration of unbleached
rhodopsin and an adjustment of the functional circuitry of the retina so
that information [rom more rods is available to each ganglion cell. Because
of this tremendous increase in sensitivity, when the dark-adapted eye goes
back into bright light, it is temporarily saturated. This explains what hap-
pens when you first go outside on a bright day. Over the next 5-10 min-
utes, the eyes undergo light adaptation, reversing the changes in the
retina that accompanied dark adaptation. This light-dark adaptation in the
duplex retina gives our visual system the ability to operate in light intensities
ranging [rom moonless midnight to bright high noon.
Calcium's Role in Light Adaptation. In addition to the factors mentioned
above, the ability of the eye to adapt to changes in light level relies on
changes in calcium concentration within the cones. When you step out into
bright light from a dark theater, initially the cones are hyperpolarized as
much as possible (i.e., to E K , the equilibrium potential for K+). If the cones
stayed in this state, we would be unable to see changes in light level. As
we discussed above, the constriction of the pupil helps a bit in reducing the
light entering the eye. However, the most important change is a gradual
depolarization of the membrane back to about -35 mY.
The reason this happens stems from the fact that the cGMP-gated sodium
channels we discussed previously also admit calcium. In the dark, Ca 2 + enters
the cones and has an inhibitory effect on the enzyme (guanylyl cyclase) that
synthesizes cGMP. When the cGMP-gated channels close, the flow of Ca 2 +
into the photoreceptor is curtailed; as a result, more cGMP is synthesized
(because the synthetic enzyme is less inhibited), thereby allowing the
cGMp-gated channels to open again. Stated more simply, when the channels
close, a process is initiated that gradually reopens them even if the light level
does not change. Calcium also appears to affect photo pigments and phos-
phodiesterase in ways that decrease their response to light. These calcium-
based mechanisms ensure that the photoreceptors are always able to regis-
ter relative changes in light level, though information about the absolute
level is lost.
... RETINAL PROCESSING
Well before the discovery of how photoreceptors work, researchers were
able to explain some of the ways the retina processes visual images. Since
about 1950, neuroscientists have studied the action potential discharges of
retinal ganglion cells as the retina is stimulated with light. The pioneers of
this approach were neurophysiologists Keffer Hartline, Stephen Kumer,
and Horace Barlow, with Hartline and Kuffler working in the United States
and Barlow working in England. Their research uncovered which aspects
of a visual image were encoded as ganglion cell output. Early studies of
horseshoe crabs and frogs gave way to investigations of cats and monkeys.
Researchers learned that similar principles are involved in retinal process-
ing across a wide range of species.
Progress in understanding how ganglion cell properties are generated by
synaptic interactions in the retina has been slower. This is because only ganglion
cells fire action potentials; all other cells in the retina (except some amacrine
cells) respond to stimulation with graded changes in membrane potential.
The detection of such graded changes requires technically challenging
... RETINAL PROCESSING 299
intracellular recording methods, whereas action potentials can be detected
using simple extracellular recording methods (see Box 4.1). It was not until
the early 1970s that John Dowling and Frank Werblin at Harvard Univer-
sity were able to show how ganglion cell responses are built from the
interactions of horizontal and bipolar cells (Box 9.5).
The most direct path for information flow in the retina is from a cone
photoreceptor to bipolar cell to ganglion cell. At each synaptic relay, the
responses are modified by the lateral connections of horizontal cells and
amacrine cells. We first focus on how information is transformed as it
passes from photo receptors to bipolar cells and then explore ganglion cell
output in the last section.
Transformations in the Outer Plexiform Layer
Photoreceptors, like other neurons, release neurotransmitter when depo-
larized. The transmitter released by photoreceptors is the amino acid gluta-
mate. As we have seen, photoreceptors are depolarized in the dark and are
hyperpolarized by light. We thus have the counterintuitive situation in which
photo receptors actually release fewer transmitter molecules in the light
than in the dark. However, we can reconcile this apparent paradox if we
take the point of view that dark rather than light is the preferred stimulus
for a photoreceptor. Thus, when a shadow passes across a photoreceptor, it
responds by depolarizing and releasing neurotransmitter.
In the outer plexiform layer, each photoreceptor is in synaptic contact
with two types of retinal neuron: bipolar cells and horizontal cells. Recall
that bipolar cells create the direct pathway from photoreceptors to ganglion
cells; horizontal cells feed information laterally in the outer plexiform layer
to influence the activity of neighboring bipolar cells and photoreceptors
(see Figures 9.11 and 9.12).
Bipolar Cell Receptive Fields. Bipolar cells can be categorized into two
classes, based on their responses to the glutamate released by photoreceptors.
In OFF bipolar cells, glutamate-gated cation channels mediate a classical
depolarizing EPSP from the influx of Na+. ON biopolar cells have G-
protein-coupled receptors and respond to glutamate by hyperpolarizing.
Notice that the names OFF and ON refer to whether these cells depolarize
in response to light off (more glutamate) or to light on (less glutamate).
Each bipolar cell receives direct synaptic input from a cluster of photore-
ceptors. The number of photoreceptors in this cluster ranges from one at
the center of the fovea to thousands in the peripheral retina. In addition to
these direct connections with photoreceptors, bipolar cells also are con-
nected via horizontal cells to a circumscribed ring of photoreceptors that
surrounds this central cluster. The receptive field of a bipolar cell (or any
other cell in the visual system) is the area of retina that, when stimulated with
light, changes the ceLL's membrane potential. The receptive field of a bipolar cell
consists of two parts: a circular area of retina providing direct photorecep-
tor input, called the receptive field center, and a surrounding area of retina
providing input via horizontal cells, called the receptive field surround (Figure
9.22a). Receptive field dimensions can be measured in millimeters across
the retina or, more commonly, in degrees of visual angle. One millimeter
on the retina corresponds to a visual angle of about 3.5°. Bipolar cell re-
ceptive field diameters range from a fraction of a degree in the central
retina to several degrees in the peripheral retina.
The response of a bipolar cell's membrane potential to light in the re-
ceptive field center is opposite to that of light in the surround. For exam-
ple, if illumination of the center causes depolarization of the bipolar cell
300 C HAP T E R 9 . THE EYE
Photoreceptor
'>
{
. ,
(a)
Receptive field
center
\
Receptive field
surround
/
Light in
receptive field
center
Light in
receptive field
surround
-
'---
---lLJ/
GO
,
f
Photoreceptor
hyperpolarized
Photoreceptor
hyperpolarized
0,
Horizontal cell
0", hyperpolarized
Bipolar cell
hyperpolarized
,'"
(
\
' Horizontal cell
Bipolar cell
0",
Bipolar cell
depolarized
(b) Direct pathway
(c) Indirect pathway
FIGURE 9.22
Direct and indirect pathways from photoreceptor to bipolar cell. (a) Bipolar cells
receive direct synaptic input from a cluster of photo receptors, constituting the receptive field
center. In addition, they receive indirect input from surrounding photoreceptors via horizontal
cells. (b) An ON-center bipolar cell is depolarized by light in the receptive field center via
the direct pathway. (c) Light in the receptive field surround hyperpolarizes the ON-center
bipolar cell via the indirect pathway. Because of the intervening horizontal cell, the effect of
light on the surround photoreceptors is always opposite the effect of light on the center
photoreceptors
(an ON response), then illumination of the surround will cause an antago-
nistic hyperpolarization of the bipolar cell (Figure 9.22b, c). Likewise, if the
cell is depolarized by a spot turning from light to dark in the center of its
receptive field (an OFF response), it will be hyperpolarized by the same
dark stimulus applied to the surround. Thus, these cells are said to have
antagonistic center-surround receptive fields. The antagonistic surround
appears to come from a complex interaction of horizontal cells, photore-
ceptors, and bipolar cells at their synapses.
The center-surround receptive field organization is passed on from bipolar
cells to ganglion cells via synapses in the inner plexiform layer. The lateral
connections of the amacrine cells in the inner plexiform layer also con-
tribute to the elaboration of ganglion cell receptive fields and the integra-
tion of rod and cone input to ganglion cells. Numerous types of amacrine
cells have been identified, and their particular contributions to ganglion cell
responses are still being investigated.
... RETINAL OUTPUT
The sole source of output from the retina to the rest of the brain is the ac-
tion potentials arising from the million or so ganglion cells. The activity of
these cells can be recorded electrophysiologically not only in the retina but
also in the optic nerve where their axons travel.
... RETINAL OUTPUT 30 I
Box 9.5
PATH OF DISCOVERY
I .;
"'"
..?: .........
A Glimpse into
the Retina
Much of my scientific life has been spent studying the
functional organization of the vertebrate retina-how the
retinal cells are wired, how they respond when the retina
is illuminated, and how the retina processes visual infor-
mation. What led me to undertake this research? As both
an undergraduate and graduate student, I worked in
George Wald's laboratory at Harvard. Wald discovered
the role of vitamin A in vision (for which he won a Nobel
Prize) and had long been interested in photoreceptor
mechanisms. With Wald, I studied the effects of vitamin A
deficiency on photoreceptors, which brought me to the
question of how visual sensitivity relates to visual pigment
levels in photoreceptors. In other words, what mecha-
nisms underlie the loss of visual sensitivity in vitamin A
deficiency, and does this relate to the sensitivity changes
that occur during light and dark adaptation?
This early work was carried out in the rat, and I found
there is a relationship between visual pigment (rhodopsin)
levels and the logarithm of visual sensitivity in both vita-
min A deficiency and during dark adaptation. Rat retinas,
however, possess mainly rod photo receptors, and an
obvious next question was whether a similar relationship
between visual pigment levels and light sensitivity holds
also for cones. I decided to test this by switching to
ground squirrels, whose retinas possess mainly cones.
Among other things, I was curious about how cone
photoreceptors differ from rod photo receptors, and so I
examined the ground squirrel photoreceptors by electron
microscopy. What caught my eye one day were the cone
synaptic terminals and the realization that I could follow
an occasional process from a synaptic terminal back to
its cell of origin. Bipolar cell branches extended to the
synaptic terminals, as expected, but I could also identify
horizontal cell processes synapsing with the photorecep-
tors! This was new and exciting. Horizontal cells were
very much a mystery then; indeed, some investigators
thought they were glial cells, but the fact that they made
synapses with the photoreceptors clearly indicated they
were neurons.
What, then, is the neuronal circuitry of the retina,
and what is the role of the retinal interneurons-the
by John Dowling
horizontal and amacrine cells? This became an area of
intense interest and study. I joined forces with Brian
Boycott, and we explored the cellular (Brian) and synap-
tic organization (myself) of the outer and inner plexiform
layers of the retina. We found that the photoreceptor and
bipolar cell terminals make ribbon synapses onto multiple
postsynaptic targets, whereas amacrine cells and at least
some horizontal cell processes make conventional
synapses on single postsynaptic elements. In addition to
ground squirrel retinas, we examined monkey, human,
cat, frog, and goldfish retinas, and they all showed basic
similarities in retinal wiring.
The next step was to record from the various retinal
cells, and that work was undertaken in my laboratory by
Frank Werblin, a graduate student with training in elec-
trical engineering. We chose the mudpuppy retina as our
animal because of its large cells, and soon Frank had
recordings from all the retinal cell types. He confirmed
the identity of the recorded cells by staining them intra-
cellularly after the recording-a routine technique today,
but then very difficult and on occasion messy. More than
once, Frank emerged from the darkroom where the ex-
periments were carried out covered with the blue dye we
then used. What those experiments told us was that
there are both ON-center and OFF-center bipolar cells
in the retina and that bipolar cells have a center-surround
receptive field organization, with the horizontal cells ac-
counting for the antagonistic surround response. Further,
many amacrine cells respond transiently to illumination,
giving ON-OFF responses, and appear to be involved in
detecting movement.
These recordings, along with electron microscopic ob-
servations on the mudpuppy retina I made, enabled us to
suggest the main pathways of information flow through
the retina and the roles of the various cells and synapses.
Many questions remained, many of which are being explored
even today. However, being able to draw a diagram of the
functional organization of the retina at that time, however
imperfect and incomplete, was immensely satisfying, and it
has encouraged, I like to believe, numerous additional
studies on retinal mechanisms in the 35 years since.
302 C HAP T E R 9 . THE EYE
Ganglion Cell Receptive Fields
Most retinal ganglion cells have the concentric center-surround receptive
field organization discussed above for bipolar cells. ON-center and OFF-
center ganglion cells receive input from the corresponding type of bipolar
cell. Thus, an ON-center ganglion cell will be depolarized and respond with
a barrage of action potentials when a small spot of light is projected onto
the middle of its receptive field. Likewise, an OFF-center cell will respond
to a small dark spot presented to the middle of its receptive field. However.
in both types of celL the response to stimulation of the center is canceled
by the response to stimulation of the surround (Figure 9.23). The surpris-
ing implication is that most retinal ganglion cells are not particularly re-
sponsive to changes in illumination that include both the receptive field
center and the receptive field surround. Rather, it appears that the ganglion
ceBs are mainly responsive to differences in illumination that occur within
their receptive fields.
To illustrate this point, consider the response generated by an OFF-center
cell as a light-dark edge crosses its receptive field (Figure 9.24). Remember
that in such a cell, dark in the center of the receptive field causes the cell
to depolarize, whereas dark in the surround causes the cell to hyperpolar-
ize. In uniform illumination, the center and surround cancel to yield some
low level of response (Figure 9.24a). When the edge enters the surround
region of the receptive field without encroaching on the center, the dark
area has the effect of hyperpolarizing the neuron, leading to a decrease in
the cell's firing rate (Figure 9.24b). As the dark area begins to include the
center, however, the partial inhibition by the surround is overcome, and
the cell response increases (Figure 9.24c). But when the dark area finally
fills the entire surround, the center response is again canceled (Figure
9.24d). Notice that the cell response in this example is only slightly differ-
ent in uniform light and in uniform dark; the response is modulated mainly
by the presence of the light-dark edge in its receptive field.
Now let's consider the output of all the OFF-center ganglion cells that are
stimulated by a stationary light-dark edge imaged on the retina. The responses
will fall into the same four categories illustrated in Figure 9.24. Thus, the
cells that will register the presence of the edge are those with receptive field
centers and surrounds that are differentially affected by the light and dark
areas. The population of cells with receptive field centers "viewing" the
light side of the edge will be inhibited (Figure 9.24b). The population of cells
with centers "viewing" the dark side of the edge will be excited (Figure
Ganglion cell
receptive field
Patch of
'e';O / 7 I
(a) (b)
--------.......
)
- .
I
(c)
OFF-center
ganglion ---t--t---t-
cell output:
-++++-t+
FIGURE 9.23
A center-surround ganglion cell receptive field. (a, b) An OFF-center ganglion cell
responds with a barrage of action potentials when a dark spot is imaged on its receptive
field center. (c) If the spot is enlarged to include the receptive field surround, the response is
greatly reduced.
Ganglion cell
receptive field
Pffichof
ffi' jCff£;j
(a)
light-dark edge
/
(b)
(c)
OFF-center
ganglion
cell output:
--tttttttttmttt
f-
FIGURE 9.24
Responses to a light-dark edge crossing an OFF-center ganglion cell receptive
field. The response of the neuron is determined by the fraction of the center and surround
that are filled by light and dark. (See text for details.)
9.24c). In this way, the difference in illumination at a light-dark edge is nm
faithfully represented by the difference in the output of ganglion cells on
either side of the edge. Instead, the center-surround organization of the receptive
fields leads to a neural response that emphasizes the contrast at light-dark edges.
There are many visual illusions involving the perception of light level.
The organization of ganglion cell receptive fields suggests an explanation
for the illusion shown in Figure 9.25. Even though the two central squares
are the same shade of gray, the square on the left background appears
darker. Consider the two ON-center receptive fields shown on the gray
squares. In both cases, the same gray light hits the receptive field center.
However. the receptive field on the left has more light in its surround than
the receptive field on the right. This will lead to a lower response and may
be related to the darker appearance of the left gray square.
Types of Ganglion Cells
Most ganglion cells in the mammalian retina have a center-surround re-
ceptive field with either an ON or an OFF center. They can be further cat-
egorized based on their appearance. connectivity, and electrophysiological
properties. In the macaque monkey retina and human retina, two major
types of ganglion cells are distinguished: large M-type ganglion cells and
smaller P-type ganglion cells. (M stands for magno, from the Latin for
FIGURE 9.25
The influence of contrast on the perception of light and dark. The central boxes
are identical shades of gray. but because the surrounding area is lighter on the left, the left
central box appears darker. ON-center receptive fields are shown on the left and right of
the figure. Which would respond more?
... RETINAL OUTPUT 303
@:J
(d)
+H-+tt-
304 C HAP T E R 9 . THE EYE
.
(a) (
50 f!m
(b)
FIGURE 9.26
M-type and P-type ganglion cells in the
macaque monkey retina. (a) A small P
cell from the peripheral retina. (b) An 1'1 cell
from a similar retinal location is significantly
larger. (Source: Watanabe and Rodieck, 1989,
pp. 437, 439.)
"large"; P stands for panlG, from the Latin for "small.") Figure 9.26 shows
the relative sizes of M and P ganglion cells at the same location on the
retina. P cells constitute about 90% of the ganglion cell population. M cells
constitute about 5%, and the remaining 5% is made up of a variety of
nonM-nonP ganglion cell types that are less well characterized.
The visual response properties of M cells differ from those of P cells in
several ways. They have larger receptive fields, they conduct action poten-
tials more rapidly in the optic nerve, and they are more sensitive to low-
contrast stimuli. In addition, M cells respond to stimulation of their recep-
tive field centers with a transient burst of action potentials, while P cells
respond with a sustained discharge as long as the stimulus is on (Figure
9.27). We will see in Chapter 10 that the different types of ganglion cells
appear to play different roles in visual perception.
Color-Opponent Ganglion Cells. Another important distinction between
ganglion cell types is that some P cells and nonM-nonP cells are sensitive
to differences in the wavelength of Jight. The majority of these color-sensitive
neurons are called color-opponent cells, reflecting the fact that the re-
sponse to one wavelength in the receptive field center is canceled by show-
ing another wavelength in the receptive field surround. 1\vo types of op-
ponency are found, red versus green and blue versus yellow. Consider, for
example, a cell with a red ON center and a green OFF surround (Figure
9.28). The center of the receptive field is fed mainly by red cones; there-
fore, the cell responds to red light by firing action potentials. Note that even
a red light that bathes the entire receptive field is an effective stimulus.
However, the response is reduced because red light has some effect on
green cones (recall the overlap of the red and green sensitivity curves in
Figure 9.20) that feed into the green OFF surround. The response to red is
only canceled by green light on the surround. Shorthand notation for such
a cell is R+G-, meaning simply that it is excited by red in the receptive field
center, and this response is inhibited by green in the surround. What would
be the response to white light on the entire receptive field? Because white
light contains all visible wavelengths, both center and surround would be
equally activated, thereby canceling the response of the cell.
Blue-yellow color opponency works the same way. Consider a cell with
a blue ON center and a yellow OFF surround (B+Y-). Blue light drives blue
cones that feed the receptive field center, while yellow light activates both
M-type
ganglion cell
(ON center)
P-type
ganglion cell
(ON center)
Light in
receptive
field center ON
OFF
Action
potentials
per second
FIGURE 9.27
Different responses to light of M-type and P-type ganglion cells.
r
Ganglion cell
receptive field
A
Red ON Green OFF
:ro/Ckf); J
(8) (b)
(c)
Ganglion
cell output:
--tH+tt-H+t-
---++-+--
--tt#tttttttttt
FIGURE 9.28
A color-opponent center-surround receptive field of a P-type ganglion cell.
red and green cones that feed the surround. Again, diffuse blue light would
be an effective stimulus for this cell, but yellow on the surround would
cancel the response, as would diffuse white light. The lack of color oppo-
nency in M cells is accounted for by the fact that both the center and sur-
round of the receptive field receive input from more than one type of cone.
Perceived color is based on the relative activity of ganglion cells whose
receptive field centers receive input from red, green, and blue cones.
Demonstrate this to yourself by fixating on the cross in the middle of the
red box in Figure 9.29 for a minute or so. This will have the effect of light-
adapting some of your red cones. Then look at the white box. The activa-
tion of the green cones by the white light is unopposed, and you see a
green square. Similarly, if you fixate on the blue box, you will see yellow
when you shift your gaze to the white box. Thus, it appears that the
+
+
+
+
FIGURE 9.29
Color opponency revealed. Fixate on the cross in the red box on the left for 60 sec-
onds, then shift your gaze to the cross in the white box. What color do you see? Try it again
with the blue box.
. RETINAL OUTPUT 305
/
1
(d)
++++
306 C HAP T E R 9 . THE EYE
ganglion cells provide a stream of information to the brain that is involved
in the spatial comparison of three different opposing processes: light versus
dark, red versus green, and blue versus yellow.
Parallel Processing
One of the important concepts that emerges from our discussion of the
retina is the idea of parallel processing in the visual system. Here's why.
First, we view the world with not one but two eyes that provide two par-
allel streams of information. In the central visual system, these streams are
compared to give information about depth, the distance of an object from
the observer. Second, there appear to be independent streams of informa-
tion about light and dark that arise from the ON-center and OFF-center
ganglion cells in each retina. Third, ganglion cells of both ON and OFF va-
rieties have different types of receptive fields and response properties. M
cells can detect subtle contrasts over their large receptive fields and are
likely to contribute to low-resolution vision. P cells have small receptive
fields that are well suited for the discrimination of fine detail. P cells and
nonM-nonP cells are specialized for the separate processing of red-green
and blue-yellow information.
CONCLUDING REMARKS
In this chapter, we have seen how light emitted by or reflected off objects
in space can be imaged by the eye onto the retina. Light energy is first con-
verted into membrane potential changes in the mosaic of photoreceptors.
It is interesting to note that the transduction mechanism in photoreceptors
is very similar to that in olfactory receptor cells, both of which involve
cyclic nucleotide-gated ion channels. Photoreceptor membrane potential is
converted into a chemical signal (the neurotransmitter glutamate), which
is again converted into membrane potential changes in the postsynaptic
bipolar and horizontal cells. This process of electrical-to-chemical.to-electrical
signaling repeats again and again, until the presence of light or dark or
color is finally converted to a change in the action potential firing fre-
quency of the ganglion cells.
The information from the 125 million photoreceptors is funneled into
1 million ganglion cells. In the central retina. particularly the fovea, rela-
tively few photoreceptors feed each ganglion cell, whereas in the peripheral
retina, thousands of receptors do. Thus, the mapping of visual space OntO
the array of optic nerve fibers is not uniform. Rather, in "neural space,"
there is an overrepresentation of the central few degrees of visual space,
and signals from individual cones are more important. This specialization
ensures high acuity in central vision but also requires that the eye move to
bring the images of objects of interest onto the fovea.
As we shall see in the next chapter, there is good reason to believe that
the different types of information that arise from different types of ganglion
cells are, at least in the early stages, processed independently. Parallel
streams of information-for example, from the right and left eyes-remain
segregated at the first synaptic relay in the lateral geniculate nucleus of the
thalamus. The same can be said for the M-cell and P-cell synaptic relays in
the LGN. In the visual cortex, it appears that parallel paths may process
different visual attributes. For example, the distinction in the retina be-
tween neurons that do and do not convey information about color is pre-
served in the visual cortex. In general, each of the more than two-dozen
visual cortical areas may be specialized for the analysis of different types of
retinal Output.
' :'"
>-V'>
wI:
e::
w
I-
Introduction
vision (p. 278)
retina (p. 278)
Properties of Light
refraction (p. 280)
The Structure of the Eye
pupil (p. 280)
iris (p. 280)
cornea (p. 280)
sclera (p. 280)
extraocular muscle (p. 280)
conjunctiva (p.280)
optic nerve (p. 280)
optic disk (p. 281)
macula (p. 281)
fovea (p. 281)
aqueous humor (p. 282)
lens (p. 282)
ciliary muscle (p. 282)
vitreous humor (p.282)
,£11
V'>
Z
w
0
>
w l-
e:: V'>
w
:J
a
Image Formation by the Eye
diopter (p. 283)
accommodation (p. 284)
pupillary light reflex (p. 287)
visual field (p. 288)
visual acuity (p. 288)
visual angle (p. 288)
Microscopic Anatomy of
the Retina
photoreceptor (p. 288)
bipolar cell (p. 288)
ganglion cell (p. 288)
horizontal cell (p. 288)
amacrine cell (p. 288)
ganglion cell layer (p.290)
inner nuclear layer (p. 290)
outer nuclear layer (p. 290)
layer of photoreceptor outer
segments (p. 290)
inner plexiform layer (p. 290)
outer plexiform layer (p. 290)
rod photoreceptor (p. 290)
cone photoreceptor (p. 290)
CONCLUDING REMARKS 307
Phototransduction
dark current (p. 293)
cyclic guanosine monophosphate
(cGMP) (p. 293)
rhodopsin (p.294)
transducin (p. 294)
phosphodiesterase (PDE) (p. 294)
Young-Helmholtz trichromacy
theory (p. 296)
dark adaptation (p.296)
light adaptation (p. 298)
Retinal Processing
OFF bipolar cell (p.299)
ON bipolar cell (p. 299)
receptive field (p. 299)
center.surround receptive field
(p. 300)
Retinal Output
M-type ganglion cell (p. 303)
P-type ganglion cell (p. 303)
nonM-nonP ganglion cell (p. 304)
color-opponent cell (p. 304)
parallel processing (p. 306)
I. What physical property of light is most closely related to the perception of colorr
2. Name eight structures in the eye that light passes through before it strikes the photoreceptors.
3. Why is a scuba mask necessary for clear vision under waterr
4. What is myopia. and how is it correctedr
5. Give three reasons explaining why visual acuity is best when images fall on the fovea.
6. How does the membrane potential change in response to a spot of light in the receptive field center of a
photoreceptorr Of an ON bipolar cellr Of an OFF-center ganglion cellr Whyr
7. What happens in the retina when you "get used to the dark"r Why can't you see color at nighd
8. In what way is retinal output not a faithful reproduction of the visual image falling on the retinar
9. In retinitis pigmentosa, early symptoms include the loss of peripheral vision and night vision. The loss of what
type of cells could lead to such symptomsr
308 C HAP T E R 9 . THE EYE
6C},
a:: (.9
Wz
I-
t-C
a::«
::JW
LLa::
Arshavsky VY, Lamb TD, Pugh EN. 2002. G proteins
and phototransduction. Annual Review of Physiology
64:153-187. .
Burns ME, Baylor DA. 200 I. Activation, deactivation,
and adaptation in vertebrate photoreceptor cells.
Annual Review of Neuroscience 24:779-805.
Dacey DM, Packer OS. 2003. Colour coding in the
primate retina: diverse cell types and cone-specific
circuitry. Current Opinion in Neurobiology
13:421-427.
Masland RH. 200 I. The fundamental plan of the
retina. Nature Neuroscience 4:877-886.
Nathans J. 1999. The evolution and physiology of
human color vision: insights from molecular
genetic studies of visual pigments. Neuron
24:299-312.
The Central Visual System
INTRODUCTION
THE RETINOFUGAL PROJECTION
THE OPTIC NERVE, OPTIC CHIASM,AND OPTIC TRACT
RIGHT AND LEFT VISUAL HEMIFIELDS
TARGETS OF THE OPTIC TRACT
. Box 10.1 Of Special Interest: David and Goliath
Nonthalamic Targets of the Optic Tract
THE LATERAL GENICULATE NUCLEUS
THE SEGREGATION OF INPUT BY EYE AND BY GANGLION CELL TYPE
RECEPTIVE FIELDS
NONRETINAL INPUTS TO THE LGN
ANATOMY OF THE STRIATE CORTEX
RETINOTOPY
LAMINATION OF THE STRIATE CORTEX
The Cells of Different Layers
INPUTS AND OUTPUTS OF THE STRIATE CORTEX
Ocular Dominance Columns
Innervation of Other Cortical Layers from Layer IVC
Striate Cortex Outputs
CYTOCHROME OXIDASE BLOBS
PHYSIOLOGY OF THE STRIATE CORTEX
RECEPTIVE FIELDS
Binocularity
Orientation Selectivity
. Box 10.2 Brain Food: Optical Imaging of Neural Activity
Direction Selectivity
Simple and Complex Receptive Fields
Blob Receptive Fields
PARALLEL PATHWAYS AND CORTICAL MODULES
. Box 10.3 Path of Discovery: Vision and Art, by Margaret Livingstone
Parallel Pathways
Cortical Modules
BEYOND STRIATE CORTEX
THE DORSAL STREAM
Area MT
Dorsal Areas and Motion Processing
THE VENTRAL STREAM
Area V4
Area IT
FROM SINGLE NEURONS TO PERCEPTION
. Box 10.4 Of Special Interest: The Magic of Seeing in 3D
FROM PHOTORECEPTORS TO GRANDMOTHER CELLS
PARALLEL PROCESSING AND PERCEPTION
CONCLUDING REMARKS
CHAPTER
3 10 C HAP T E RIO . THE CENTRAL VISUAL SYSTEM
T INTRODUCTION
Although our visual system provides us with a unified picture of the world
around us, this picture has multiple facets. Objects we see have shape and
color. They have position in space, and sometimes they move. For us to see
each of these properties, neurons somewhere in the visual system must be
sensitive to them. Moreover, because we have two eyes, we actually have
two visual images in our head, and somehow they must be merged.
In Chapter 9, we saw that in many ways the eye acts like a camera. But
starting with the retina, the rest of the visual system is far more elaborate,
far more interesting, and capable of doing far more than any camera. For ex-
ample, we saw that the retina does not simply pass along information about
the patterns of light and dark that fall on it. Rather, the retina extracts infor-
mation about different facets of the visual image. There are more than 100
million photoreceptors in the retina but only 1 million axons leaving the eye
carrying information to the rest of the brain. What we perceive about the
world around us, therefore, depends on what information is extracted by the
retina and how this information is analyzed and interpreted by the rest of
the central nervous system (CNS). An example is color. There is no such
thing as color in the physical world; there is simply a spectrum of visible
wavelengths of light that are reflected by objects around us. Based on the in-
formation extracted by the three types of cone photoreceptors, however, our
brain somehow synthesizes a rainbow of colors and fills our world with it.
In this chapter, we explore how the information extracted by the retina
is analyzed by the central visual system. The pathway serving conscious
visual perception includes the lateral geniculate nucleus (LGN) of the thala-
mus and the primary visual cortex, also called area 17, Vi, or striate cortex.
We will see that the information funneled through this geniculoconical
pathway is processed in parallel by neurons specialized for the analysis of
different stimulus attributes. The striate cortex then feeds this information
to more than two dozen different extrastriate cortical areas in the tempo-
ral and parietal lobes, and many of these appear to be specialized for dif-
ferent types of analysis.
Much of what we know about the central visual system was first worked
out in the domestic cat and then extended to the rhesus monkey, Macaca
mulatta. The macaque monkey, as it is also called, relies heavily on vision
for survival in its habitat, as do we humans. In fact, tests of the perform-
ance of this primate's visual system show that in virtually all respects, it
rivals that of humans. Thus, although most of this chapter concerns the
organization of the macaque visual system, most neuroscientists agree that
it approximates very closely the situation in our own brain.
Although visual neuroscience cannot yet explain many aspects of visual
perception (some interesting examples are shown in Figure 10.1), signifi-
cant progress has been made in answering a more basic question: How do
neurons represent the different facets of the visual world? By examining
those stimuli that make different neurons in the visual cortex respond, and
how these response properties arise, we begin to see how the brain portrays
the visual world around us.
T THE RETINOFUGAL PROJECTION
The neural pathway that leaves the eye, beginning with the optic nerve, is
often referred to as the retinofugal projection. The suffix -fugal is from
the Latin word meaning "to flee" and is commonly used in neuroanatomy
ro describe a pathway that is directed away from a structure. Thus, a cen-
trifugal projection goes away from the center, a corticofugal projection goes
(a)
away from the cortex, and the retinofugal projection goes away from the
retina.
We begin our tour of the central visual system by looking at how the
retinofugal projection courses from each eye to the brain stem on each side,
and how the task of analyzing the visual world initially is divided among,
and organized within, certain structures of the brain stem. Then we focus
on the major arm of the retinofugal projection that mediates conscious visual
perception.
The Optic Nerve, Optic Chiasm, and Optic Tract
The ganglion cell axons "fleeing" the retina pass through three structures
before they form synapses in the brain stem. The components of this
retinofugal projection are, in order, the optic nerve, the optic chiasm, and
the optic tract (Figure 10.2). The optic nerves exit the left and right eyes
/ '-"1 Eye
Optic nerve
Optic chiasm
) \
Stalk of
pituitary
gland
)
"
,
"
f '"
Optic tract
"
Cut surface of
brain stem
\
-....
,
FIGURE 10.2
The retinofugal projection. This view of the base of the brain shows the optic nerves,
optic chiasm. and optic tracts.
... THE RETINOFUGAL PROJECTION 3 I I
)
-
j1
1;tR "".';:'J,]
\ / ,/
(b)
FIGURE 10.1
Perceptual illusions. (a) The two tabletops
are of identical dimensions and are imaged on
similarly sized patches of retina. but the per-
ceived sizes are quite different. (b) This is an
Illusory spiral. Try tracing It with your finger.
312 C HAP T E RIO . THE CENTRAL VISUAL SYSTEM
FIGURE 10.3
Right and left visual hemitields.
Ganglion cells in both retinas that are responsive
to visual stimuli in the right visual hemifield
project axons into the leh optiC tract. Similarly.
ganglion cells "viewing" the leh visual hemifield
project Into the right optiC tract.
at the optic disks, travel through the fatty tissue behind the eyes in their
bony orbits, then pass through holes in the floor of the skull. The optic
nerves from both eyes combine to form the optic chiasm (named for the
X shape of the Greek letter chi), which lies at the base of the brain, just
anterior to where the pituitary gland dangles down. At the optic chiasm,
the axons originating in the nasal retinas cross from one side to the other.
The crossing of a fiber bundle from one side of the brain to the other is
called a decussation. Because only the axons originating in the nasal
retinas cross, we say that a partial decussation of the retinofugal projection
occurs at the optic chiasm. Following the partial decussation at the optic
chiasm, the axons of the retinofugal projections form the optic tracts,
which run just under the pia along the lateral surfaces of the diencephalon.
Right and Left Visual Hemifields
To understand the significance of the partial decussation of the retinofugal
projection at the optic chiasm, let's review the concept of the visual field
introduced in Chapter 9. The full visual field is the entire region of space
(measured in degrees of visual angle) that can be seen with both eyes look-
ing straight ahead. Fix your gaze on a point straight ahead. Now imagine a
vertical line passing through the fixation point, dividing the visual field into
left and right halves. By definition, objects appearing to the left of the mid-
line are in the left visual hemifield, and objects appearing to the right of
the midline are in the right visual hemifield (Figure 10.3).
By looking straight ahead with both eyes open and then alternately clos-
ing one eye and then the other. you will see that the central portion of both
visual hemifields is viewed by both retinas. This region of space is therefore
called the binocular visual field. Notice that objects in the binocular region
of the left visual hemifield will be imaged on the nasal retina of the left eye
and on the temporal retina of the right eye. Because the fibers from the
nasal portion of the left retina cross to the right side at the optic chiasm,
all the information about the left visual hemifield is directed to the right
side of the brain. Remember this rule of thumb: Optic nerve fibers cross in
Binocular visual field
Fixation point
Right eye
Right optic nerve
Optic
chiasm
... THE RETINOFUGAL PROJECTION 3 13
the optic chiasm so that the left visual hemifield is "viewed" by the right hemi-
sphere and the right visual hemifield is "viewed" by the left hemisphere.
Targets of the Optic Tract
A small number of optic tract axons peel off to form synaptic connections
with cells in the hypothalamus, and another 10% or so continue past the
thalamus to innervate the midbrain. But most of them innervate the lateral
geniculate nucleus (LGN) of the dorsal thalamus. The neurons in the
LGN give rise to axons that project to the primary visual cortex. This pro-
jection from LGN to cortex is called the optic radiation. Lesions anywhere
in the retinofugal projection from eye to LGN to visual cortex cause blind-
ness in humans. Therefore, we know that it is this pathway that mediates
conscious visual perception (Figure 10.4).
From our knowledge of how the visual world is represented in the
retinofugal projection, we can predict the types of perceptual deficits that
would result -from its destruction at different levels, as might occur from a
traumatic injury to the head, a tumor, or an interruption of the blood sup-
ply. As shown in Figure 10.5, while a transection of the left optic nerve
would render a person blind in the left eye only, a transection of the left
optic tract would lead to blindness in the right visual field as viewed through
either eye. A midline transection of the optic chiasm would affect only the
fibers that cross the midline. Because these fibers originate in the nasal
portions of both retinas, blindness would result in the regions of the visual
field viewed by the nasal retinas, that is, the peripheral visual fields on both
sides (Box 10.1). Because unique deficits result from lesions at different
sites, neurologists and neuro-ophthalmologists can locate sites of damage
by assessing visual field deficits.
Nonthalamic Targets of the Optic Tract. As we have said, some retinal
ganglion cells send axons to innervate structures other than the LGN. Direct
projections to part of the hypothalamus play an important role in syn-
chronizing a variety of biological rhythms, including sleep and wakefulness,
with the daily dark-light cycle (see Chapter 19). Direct projections to part
LGN
- - / Optic radiation
\ / >
I ( I /' Primary visual
Retina ' "'\'"" / /' cortex
\ ""\--
. y
-..
(a)
(b)
Primary visual cortex
FIGURE 10.4
The visual pathway that mediates conscious visual perception. (a) A side view
of the brain with the retinogeniculocortical pathway shown inside (blue). (b) A horizontal
section through the brain exposing the same pathway.
3 14 C HAP T E RIO . THE CENTRAL VISUAL SYSTEM
+
"--.. --------------
--......
"
.
"
(a)
Transection of--c
left optic nerve
FIGURE 10.5
Visual field deficits from lesions in the retinofugal
projection. (a) If the optic nerve on the left side is cut,
vision will be lost completely In the left eye. The right eye
still sees a portion of the left visual field. (b) If the optic
tract on the left side IS cut, vision will be lost in the nght
visual field of each eye. (c) If the optic chiasm is split
down the middle, only the crossing fibers will be damaged.
and peripheral vision will be lost in both eyes.
..
Transection of
left optic tract
(b)
-""'"
(c)
of the midbrain, cal1ed the pretectum, control the size of the pupil and cer-
tain types of eye movement. And about 10% of the ganglion cells in the
retina project to a part of the midbrain tectum called the superior co 1-
liculus (Latin for "little hill") (Figure 10.6).
While 10% may not sound like much of a projection, bear in mind that
in primates, this is about 150,000 neurons, which is equivalent to the total
'-
, '
'''>'' , '\ \'-
"I / Midbrain
/
\\1
')'
FIGURE 10.6
The superior colliculus. Located In the tectum of the
midbrain, the superior colliculus is involved in generating
saccadic eye movements, the quick jumps in eye position
used to scan across a page while reading.
1
Thalamus
/Eye
Superior
/ colli cui us
Box 10.1
",.
OF SPECIAL INTEREST
... THE LATERAL GENICULATE NUCLEUS 315
...
...
. David and Goliath
Many of you are familiar with the famous story of David
and Goliath. which appears in the Hebrew scriptures (Old
Testament). The armies of the Philistines and the Israelites
were gathered for battle when Goliath, a Philistine, came
forth and challenged the Israelites to settle the dispute by
sending out their best man to face him in a fight to the
death. Goliath, it seems, was a man of great proportions.
measuring more than "six cubits" in height. If you consider
that a cubit is the distance from the elbow to the tip of
the middle finger, about 20 inches. this guy was more than
10 feet tall! Goliath was armed to the teeth with body ar-
mor, a javelin, and a sword. To face this giant, the Israelites
sent David, a young and diminutive shepherd, armed only
with a sling and five smooth stones. Here's how the ac-
tion is described in the Revised Standard Version of the
Bible (I Samuel 17: 48):
When the Philistine arose and came and drew near to
meet David. David ran quickly toward the battle line to
meet the Philistine. And David put his hand in his bag
and took out a stone. and slung it, and struck the Philis-
tine on his forehead; the stone sank into his forehead,
and he fell on his face to the ground.
Now why. you might ask, are we giving a theology lesson
in a neuroscience textbook The answer is that our under-
standing of the visual pathway offers an explanation, in
addition to divine intervention. for why Goliath was at a
disadvantage in this battle. Body size is regulated by the
secretion of growth hormone from the anterior lobe of
the pituitary gland. In some cases. the anterior lobe be-
comes hypertrophied (swollen) and produces excessive
amounts of the hormone, resulting in body growth to un-
usually large proportions. Such individuals are called pitu-
itary giants and can measure well over 8 feet tall.
Pituitary hypertrophy also disrupts normal vision. Recall
that the optic nerve fibers from the nasal retinas cross in
the optic chiasm, which butts up against the stalk of the
pituitary. Any enlargement of the pituitary compresses
these crossing fibers and results in a loss of peripheral
vision called bitemporal hemianopia. or tunnel vision. (See if
you can figure out why this is true from what you know
about the visual pathway.) We can speculate that David
was able to draw close and smite Goliath. because when
David raced to the battle line, the pituitary giant had
completely lost sight of him.
number of retinal ganglion cells in a cat! In fact, the tectum of the mid-
brain is the major target of the retinofugal projection in all nonmammalian
vertebrates (fish, amphibians, birds, and reptiles). In these vertebrate groups,
the superior colliculus is called the optic tectum. This is why the projec-
tion from the retina to the superior colliculus is often called the retino-
tectal projection, even in mammals.
In the superior colliculus, a patch of neurons activated by a point of light,
via indirea connections with motor neurons in the brain stem, commands
eye and head movements to bring the image of this point in space onto the
fovea. This branch of the retinofugal projection is thereby involved in orient-
ing the eyes in response to new stimuli in the visual periphery. We will re-
turn to the superior colliculus when we discuss motor systems in Chapter 14.
... THE LATERAL GENICULATE NUCLEUS
The right and left lateral geniculate nuclei, located in the dorsal thalamus,
are the major targets of the two optic tracts. Viewed in cross section, each
LGN appears to be arranged in six distinct layers of cells (Figure 10.7). By
convention, the layers are numbered 1 through 6, starting with the most
ventral layer, layer 1. In three dimensions, the layers of the LGN are
arranged like a stack of six pancakes, one on top of the other. The pancakes
do not lie flat, however; they are bent around the optic tract like a knee
joint. This shape explains the name geniculate, from the Latin geniculatus,
meaning "like a little knee."
3 16 C HAP T E RIO . THE CENTRAL VISUAL SYSTEM
FIGURE 10.7
The LGN of the macaque monkey.
The tissue has been stained to show cell
bodies. which appear as purple dots. Notice
particularly the six layers and the larger size
of the cells in the two ventral layers (layers I
and 2). (Source: Adapted from Hubel. 1988.
p.65.)
Level of section:
Thalamus
/
t
/1 .
,
,
,
"
"
\.
\
1 6
15
4
"'J,
\ '. I
" ..tt.. ..,:.. "\
df;. .. ' ..-' 2
\ '. ' .., ".
. .\{ "M' I
'';$ \\ J' .:t\,' 1
"IlL .,,-.#, #...
. f;) .
. .
It .
. -
.''i'' . .
. : ":
....
"
..
..
The LGN is the gateway to the visual cortex and, therefore, to conscious
visual perception. Let's explore the structure and function of this thalamic
nucleus.
The Segregation of Input by Eye and by Ganglion Cell Type
LGN neurons receive synaptic input from the retinal ganglion cells, and
most geniculate neurons project an axon to primary visual cortex via the
optic radiation. The segregation of LGN neurons into layers suggests that
differem types of retinal information are being kept separate at this synap-
tic relay, and indeed this is the case: Axons arising from M-type, P-type,
and nonM-nonP ganglion cells in the two retinas synapse on cells in dif-
ferem LGN layers.
Recall from our rule of thumb that the right LGN receives information
about the left visual field. The left visual field is viewed by both the nasal
left retina and the temporal right retina. At the LGN, input from the two
eyes is kept separate. In the right LGN, the right eye (ipsilateral) axons
synapse on LGN cells in layers 2, 3, and 5. The left eye (comralateral) ax-
ons synapse on cells in layers I, 4, and 6 (Figure 10.8).
A closer look at the LGN in Figure 10.7 reveals that the two ventral lay-
ers, 1 and 2, coma in larger neurons, and the four more dorsal layers, 3
through 6, contain smaller cells. The ventral layers are therefore called
magnocellular LGN layers, and the dorsal layers are called parvocellular
LGN layers. Recall from Chapter 9 that ganglion cells in the retina may
also be classified into magnocellular and parvocellular groups. As it turns
out, P-type ganglion cells in the retina project exclusively to the parvocel-
lular LGN, and M-type ganglion cells in the retina project entirely to the
magnocellular LGN.
In addition to the neurons in the six principal layers of the LGN, numer-
ous tiny neurons also lie just ventral to each layer. Cells in these konio-
Left LGN
!
Left
nasal
retina
Left
temporal
reti na
Right Right
temporal nasal
retina retina
cellular layers (konio is from the Greek for "dust") receive input from the
nonM-nonP types of retinal ganglion cells and also project to visual cortex.
Note that the koniocellular layers are not uniquely numbered, because
historically, the six thick layers were numbered before cells in the konio-
cellular layers were discovered. In Chapter 9, we saw that in the retina,
M-type, P-type, and nonM-nonP ganglion cells respond differently to light
and color. In the LGN, the different information derived from the three
categories of retinal ganglion cells from the two eyes remains segregated.
The anatomical organization of the LGN supports the idea that the retina
gives rise to streams of information that are processed in parallel. This or-
ganization is summarized in Figure 10.9.
Receptive Fields
By inserting a microelectrode into the LGN, it is possible to study the action
potential discharges of geniculate neurons in response to visual stimuli, just
as was done in the retina. The surprising conclusion of such studies is that
the visual receptive fields of LGN neurons are almost identical to those of
the ganglion cells that feed them. For example, magnocellular LGN neurons
have relatively large center-surround receptive fields, respond to stimulation
of their receptive field centers with a transient burst of action potentials,
and are insensitive to differences in wavelength. All in all, they are just like
M-type ganglion cells. Likewise, parvocellular LGN cells, like P-type retinal
ganglion cells, have relatively small center-surround receptive fields and re-
spond to stimulation of their receptive field centers with a sustained in-
crease in the frequency of action potentials; many of them exhibit color
opponency. Receptive fields of cells in the koniocellular layers are center-
surround and have either light/dark or color opponency. Within all layers
of the LGN. the neurons are activated by only one eye (i.e.. they are
monocular) and ON -center and OFF-center cells are intermixed.
... THE LATERAL GENICULATE NUCLEUS 317
FIGURE 10.8
Retinal inputs to the LGN layers.
3 18 C HAP T E RIO . THE CENTRAL VISUAL SYSTEM
Retinal output
A
Eye Ganglion cell type Layer
Contralateral 6
Ipsilateral 5
P-type ---..
Contralateral 4
Ipsilateral 3
B--'
--------------- ----------- ---------------- -----------
Same as overlying I nonM-nonP
principal layer
Ipsilateral
Contralateral
(a)
FIGURE 10.9
The organization of the LGN.
(a) Ganglion cell inputs to the different LGN
layers. (b) A thin koniocellular layer (shown
in pink) is ventral to each of the six prinCipal
layers.
LGN
A
LGN cell type
6
Parvocellular
"
"
"
"-
"-
,
,
,
,
3 I.
5
4 -,
,
<,;
,
\
\
\
\
\
2
Magnocellular
"
I Voo"" to ,ach
---.. principal layer
Koniocellular
(b)
Nonretinal Inputs to the LGN
What makes the similarity of LGN and ganglion cell receptive fields so sur-
prising is that the retina is not the main source of synaptic input to the
LGN. The major input, constituting about 80% of the excitatory synapses,
comes from primary visual cortex. Thus, one might reasonably expect that
this corticofugal feedback pathway would significantly alter the qualities of
the visual responses recorded in the LGN. So far, however, a role for this
massive input has not been clearly identified.
The LGN also receives synaptic inputs from neurons in the brain stem
whose activity is related to alertness and attentiveness (see Chapters 15 and
19). Have you ever "seen" a fJash of light when you are startled in a dark
room? This perceived flash might be a result of the direct activation of LGN
neurons by this pathway_ Usually, however, this input does not directly
evoke action potentials in LGN neurons. But it can powerfully modulate
the magnitude of LGN responses to visual stimuli. (Recall modulation from
Chapters 5 and 6.) Thus, the LGN is more than a simple relay from retina
to cortex; it is the first site in the ascending visual pathway where what we
see is infJuenced by how we feel.
.. ANATOMY OF THE STRIATE CORTEX
The LGN has a single major synaptic target: primary visual cortex. Recall
(rom Chapter 7 that the cortex may be divided into a number of distinct
areas based on their connections and cytoarchitecture. Primary visual
cortex is Brodmann's area 17 and is located in the occipital lobe of the
primate brain. Much of area 17 lies on the medial surface of the hemi-
sphere. surrounding the calcarine fissure (Figure lO.lO). Other terms used
interchangeably to describe the primary visual cortex are VI and striate
cortex. (The term striate refers to the fact that area VI has an unusually
dense stripe of myelinated axons running parallel to the surface that appears
white in unstained sections.)
h(
,)
,
\
Area 17
,/
\
Area 17
/
!-----l
1 cm
t----1
1 cm
-\
\\
\
("'-- '--
,
(
\
-\....
\
Calcarine
fissure
Macaque monkey
Human
We have seen that the axons of different types of retinal ganglion cells
synapse on anatomically segregated neurons in the LGN. In this section. we
look at the anatomy of the striate cortex and trace the connections differ-
ent LGN cells make with cortical neurons. In a later section. we explore
how this information is analyzed by cortical neurons. As we did in the LGN.
in striate cortex we'll see a close correlation between structure and func-
tion.
Retinotopy
The projection starting in the retina and extending to LGN and VI illustrates
a general organizational feature of the central visual system called retino-
topy. Retinotopy is an organization whereby neighboring cells in the
retina feed information to neighboring places in their target structures-in
this case. the LGN and striate cortex. In this way. the two-dimensional
surface of the retina is mapped onto the two-dimensional surface of the
subsequent structures (Figure 1O.lla).
There are three important points to remember about retinotopy. First. the
mapping of the visual field onto a retinotopically organized structure is
often distorted, because visual space is not sampled uniformly by the cells
in the retina. Recall from Chapter 9 that there are many more ganglion
cells with receptive fields in or near the fovea than in the periphery. Thus,
the representation of the visual field is distorted in striate cortex: The cen-
tral few degrees of the visual field are overrepresented, or magnified. in the
retinotopic map (Figure 1O.1l b).
The second point to remember is that a discrete point of light can acti-
vate many cells in the retina. and often many more cells in the target struc-
ture, due to the overlap of receptive fields. The image of a point of light on
the retina actually activates a large population of cortical neurons; every
neuron that contains that point in its receptive field is potentially activated.
Thus. when the retina is stimulated by a point of light the activity in stri-
ate cOrtex is a broad distribution with a peak at the corresponding retino-
topic location.
ANATOMY OFTHE STRIATE CORTEX 119
FIGURE 10.10
Primary visual cortex. Top views are
lateral; bottom views are medial.
320 C HAP T E RIO . THE CENTRAL VISUAL SYSTEM
(a)
8
9
Striate cortex
(layer IVC)
-
1i""
'6
1
:Ii!, "-
2
LGN
Left eye
Retina
Retinal
image
LGN (left)
(b)
!>
9 1
.. '-----
y
Striate cortex
FIGURE 10.11
The retinotopic map in striate cortex. (a) Neighboring locations on the retina project
to neignboring locations in the LGN. This retinotopic representation is preserved in the LGN
projection to V I. (b) The lower portion of V I represents information about the top half of
visual space. and the upper portion of V I represents the bottom half of visual space. Notice
also that the map is distorted, with more tissue devoted to analysIs of the central visual field.
Similar maps are found in the superior colliculus, LGN. and other visual cortical areas.
Finally, don't be misled by the word "map." There are no pictures in the
primary visual cortex for a little person in our brain to look at. While it's
true that the arrangement of connections establishes a mapping between
the retina and VI, perception is based on the brain's interpretation of dis-
tributed patterns of activity, not literal snapshots of the world. (We discuss
visual perception later in this chapter.)
lamination of the Striate Cortex
The neocortex in generaL and striate cortex in particular, have neuronal
cell bodies arranged into about a half-dozen layers. These layers can be seen
clearly in a Nissl stain of the cortex, which, as described Chapter 2, leaves
a deposit of dye (usually blue or violet) in the soma of each neuron. Start-
ing at the white matter (containing the cortical input and output fibers),
the cell layers are named by Roman numerals VI, V, IV, III, and II. Layer 1,
just under the pia mater, is largely devoid of neurons and consists almost
entirely ofaxons and dendrites of cells in other layers (Figure 10.12). The
full thickness of the striate cortex from white matter to pia is about 2 mm,
the height of the lowercase letter m.
As Figure 10.12 shows, describing the lamination of striate cortex as a
six-layer scheme is somewhat misleading. There are actually at least nine
distinct layers of neurons. To maintain Brodmann's convention that neo-
cortex has six layers. however, neuroanatomists combine three sublayers
into layer IV, labeled IVA, IVB, and IVe. Layer IVC is further divided into
two tiers called IVCa' and IVC(3. The anatomical segregation of neurons into
.. ANATOMY OFTHE STRIATE CORTEX 321
."
'. J
-I
-II
--III
- ,;.,
rot ! ..... .
. .. ... ir ' 'II'" I " > . - A 1
.",;;;- )o.r."-'" --,"
;St' J,...... . .f6. . 1I.:Jt,V-
. . 0.. r ",. - ...I .(- i
. . - ,..J ., « . '.:. ...r..... - B I IV
'lit ":..:..., ". :} ..4'" .;. : !;f . .. ...
. :.- .' . '..J; . --t. 'I j, ",'.I-a }
.f. . )
Y, ,",,' . C
, .. ,,. I . '"l , '\, ,, - f3
. r . _.. I.; I -tt .." . "'JJ .. ",. ..
.. , ", .. ..,,. ,..,.. - V
. .. 1..1 '.t: \. ': II
. ..'"'i) '; " . IO] - - VI
. .' ...."f";.. ....,... .... ....
. . , . -. .. .
FIGURE 10.12
The cytoarchitecture of the striate cortex. The tissue has been Nissl stained to show
cell bodies. which appear as dots. (Source: Adapted from Hubel. 1988, p. 97.)
layers suggests that there is a division of labor in the cortex, similar to
what we saw in the LGN. We can learn a lot about how the cortex handles
visual information by examining the structure and connections of its dif-
ferent layers.
The Cells of Different Layers. Many different neuronal shapes have been
identified in striate cortex, but here we focus on two principal types, defined
by the appearance of their dendritic trees (Figure 10.13). Spiny stellate cells
are small neurons with spine-covered dendrites that radiate out from the
cell body (recall dendritic spines from Chapter 2). They are seen primarily
in the two tiers of layer lYe. Outside layer IYC are many pyramidal cells.
These neurons are also covered with spines and are characterized by a single
thick apical dendrite that branches as it ascends toward the pia mater and
by multiple basal dendrites that extend horizontally.
Notice that a pyramidal cen in one layer may have dendrites extending
into other layers. It is important to remember that only pyramidal cells send
axons out of striate cortex to form connections with other parts of the brain.
The axons of stellate cells make local connections only within the cortex.
In addition to the spiny neurons, inhibitory neurons, which lack spines,
are sprinkled in all cortical layers as well. These neurons form only local
connections.
Inputs and Outputs of the Striate Cortex
The distinct lamination of the striate cortex is reminiscent of the layers we
saw in the LGN. In the LGN, every layer receives retinal afferents and sends
efferents to the visual cortex. In the visual cortex, the situation is different;
only a subset of the layers receives input from the LGN or sends output to
a different cortical or subcortical area.
Axons from the LGN terminate in several different cortical layers, with
the largest number going to layer lYe. We've seen that the output of the
LGN is divided into streams of information, for example, from the magno-
cellular and parvocellular layers serving the right and left eyes. These
streams remain anatomically segregated in layer lYe.
. .
-.,
- White
matter
II
III
IVA
IVB
IVC{;
:::JC:"
V
JT
VI r/
fiGURE 10.13
The dendritic morphology of some
cells in striate cortex. l\Jotice particularly
that pyramidal cells are found In layers III. IVB,
V, and VI and that spiny stellate cells are found
in layer IVC.
322 C HAP T E RIO . THE CENTRAL VISUAL SYSTEM
FIGURE 10. 14
Transneuronal autoradiography.
Radioactive proline is <D injected into one
eye, where it is @ taken up by retinal ganglion
cells and incorporated into proteins that are
Q) transported down the axons to the LGN.
Some radioactivity spills out of the retinal
terminals and is @ taken up by LGN neurons
that then @ transport it to striate cortex. The
location of radioactivity can be determined
using autoradiography.
I
'- j}1I,1I1
IV
-V
-VI
----=
(a)
"' i'
". "
.
'.
.
.......t
. "
.....,
.. .",:
'. ..
...
. '1
I. I'
.: '. '
. :{:', .::-.. ) f
.. .. . 'r'. - "'.. ,.
.\ "0:;'
",' p
, .
f. " .
\. .,.
.. l '-.
J:
.. .: . ,:. : . ::'.
,""
I. _ ....=...
. .
, .
.... _-J
\. . .;';: .
"-,;..
. ...
y'
(b)
FIGURE 10.15
Ocular dominance columns in striate
cortex. (a) The organization of ocular domi-
nance columns in layer IV of macaque monkey
striate cortex. The distribution of LGN axons
serving one eye IS shaded blue. In cross sec-
tion, these eye-speCific zones appear as
patches. each about 0.5 mm wide. In layer IV.
Peeled-back layers reveal that the ocular
dominance columns in Idi'er IV look like zebra
stripes. (b) An autoradlograph of a histological
section of layer IV viewed from above, Two
weeks pnor to the experiment. one eye of
this monkey was injected with radioactive
proline. In the autoradiograph, the radioactive
LGN terminals appear bright on a dark back-
ground, (Source' LeVay et al.. 1980.)
@ !
@
To cortex
...
.
..
() . - - .,
' n-..
" .
'\
\ .
\ .'1. .. _.
. """""'4 .
.... . . ( ".....
. !1": l" 1
'. !"J; \: -"'II"
\.' ':: - ;; "
. 17 1 ::.t, .
I \ ,......f
!,." " h",.i
.'¥' 1
- 0". J'\".-
r.
..
.
.'.
. ":;". ..
@/I'.
..;., r i ctive \
Magnocellular LGN neurons project to layer IVCa, and parvocellular LGN
neurons project to layer IVC[3. Imagine that the two tiers of layer IVC are
pancakes, stacked one (ex) on top of the other ([3). Because the input from
the LGN to the cortex is arranged topographically. we see that layer IVC
contains two overlapping retinotopic maps, one from the magnocellular
LGN (IVCa) and the other from the parvocellular LGN (IVC[3). Koniocellular
LGN axons follow a different path, bypassing layer IV to make synapses in
layers II and III.
Ocular Dominance Columns. How are the left eye and right eye LGN
inputs segregated when they reach layer IVC of striate cortex? The answer
was provided by a ground-breaking experiment performed in the early
1970s at Harvard Medical School by neuroscientists David Hubel and Torsten
Wiesel. They injected a radioactive amino acid into one eye of a monkey
(Figure 10.14). This amino acid was incorporated into proteins by the
ganglion cells, and the proteins were transported down the ganglion cell
axons into the LGN (recall anterograde transport from Chapter 2). Here,
the radioactive proteins spilled out of the ganglion cell axon terminals and
were taken up by nearby LGN neurons. But not all LGN cells took up the
radioactive material; only those cells that were postsynaptic to the inputs
from the injected eye incorporated the labeled protein. These cells then
transported the radioactive proteins to their axon terminals in layer IVC of
striate cortex. The location of the radioactive axon terminals was visualized
by first pladng a film of emulsion over thin sections of striate cortex and later
developing the emulsion like a photograph, a process called autoradiography
(introduced in Chapter 6). The resulting collection of silver grains on the
film marked the location of the radioactive LGN inputs.
In sections cut perpendicular to the cortical surface, Hubel and Wiesel
observed that the distribution of axon terminals relaying information
from the injected eye was not continuous in layer IVC, but rather was
split up into a series of equally spaced patches, each about 0.5 mm wide
(Figure 1 0.15a). These patches were termed ocular dominance columns.
In later experiments, the cortex was sectioned tangentially, parallel to
layer IV. This revealed that the left eye and right eye inputs to layer IV
are laid out as a series of alternating bands, like the stripes of a zebra (Fig-
ure 1O.15b).
Innervation of Other Cortical Layers from Layer IVe. Most intracor-
tical connections extend perpendicular to the cortical surface along radial
lines that run acrOss the layers, from white matter to layer I. This pattern
of radial connections maintains the retinotopic organization established in
layer IV. Therefore, a cell in layer VI. for example, receives information
from the same part of the retina as does a cell above it in layer IV (Figure
1O.16a). However, the axons of some layer III pyramidal cells extend col-
lateral branches that make horizontal connections within layer III (Figure
1O.16b). Radial and horizontal connections play different roles in the analy-
sis of the visual world, as we'll see later in the chapter.
Layer IVC stellate cells project axons radially up mainly to layers IVB and
III where, for the first time, information from the left eye and right eye
begins to mix (Figure 10.17). Whereas all layer IVC neurons receive only
monocular input, most neurons in layers II and III receive binocular input
coming from both eyes. Even so, there continues to be considerable anatom-
ical segregation of the magnocellular and parvocellular processing streams.
Layer IVC«, which receives magnocellular LGN input, projects mainly to
cells in layer IVB. Layer IVCI3, which receives parvocellular LGN input.
projects mainly to layer III. In layers III and IVB, an axon may form synapses
with the dendrites of pyramidal cells of all layers.
Striate Cortex Outputs. As previously mentioned, the pyramidal celis send
axons out of striate cortex into the white matter. The pyramidal cells in dif-
ferent layers innervate different structures. Layer II, III, and IVB pyramid?J
cells send their axons to other cortical areas. Layer V pyramidal cells send
axons all the way down to the superior colliculus and pons. Layer VI
pyramidal cells give rise to the massive axonal projection back to the LGN
(Figure 10.18). Pyramidal cell axons in all layers also branch and form local
connections in the cortex.
Binocular input Monocular input
'
/1\ 7 I
\
FIGURE 10.17
The mixing of information from the
two eyes. Axons project from layer IVC to
more superficial layers. Most layer III neurons
receive binocular Input from both left and
right eyes.
Layer III
'
\
\
Layer IVC
Layer VI
Left eye
input
Right eye
input
FIGURE 10.18
Patterns of outputs from the striate
cortex.
ANATOMY OFTHE STRIATE CORTEX 323
Layer VI
(a)
11
11 1
(F fPft =ILa";'"
H If 11 Laye"VC
-If rn
Layer VI
r
(b)
FIGURE 10.16
Patterns of intracortical connections.
(a) Radial connections. (b) Horizontal
connections.
I
II
11I1
IVA
IVB ...
IVC .
V II t
VI I
White matter ) \
Other Pons and LGN
. cortical superior
areas colliculus
324 C HAP T E RIO . THE CENTRAL VISUAL SYSTEM
r---
(b)
FIGURE 10.19
Cytochrome oxidase blobs. (a) The
organization of cytochrome oxidase blobs
in macaque monkey striate cortex. (b) A
photograph of a histological section of layer ill,
stained for cytochrome oxidase and viewed
from above. (Source: Courtesy of Dr S. H. C.
Hendry.)
Cytochrome Oxidase Blobs
As we have seen, layers II and III playa key role in visual processing, pro-
viding most of the information that leaves V 1 for other cortical areas.
Anatomical studies suggest that the VI output comes from two distinct
populations of neurons in the superficial layers. When striate cortex is
stained to reveal the presence of cytochrome oxidase, a mitochondrial
enzyme used for cel! metabolism, the stain is not uniformly distributed in
layers II and III. Rather, the cytochrome oxidase staining in cross sections
of striate cortex appears as a colonnade, a series of pillars at regular inter-
vals, running the full thickness of layers II and III and also in layers V
and VI (Figure 1O.I9a). When the cortex is sliced tangentially through
layer Ill, these pillars appear like the spots of a leopard (Figure 1O.I9b).
These pillars of cytochrome oxidase-rich neurons have come to be caBed
blobs. The blobs are in rows, each blob centered on an ocular dominance
stripe in layer IV. Between the blobs are "interblob" regions. The blobs
receive direct LGN input from the koniocellular layers, as well as parvocel-
lular and magnocellular input from layer IVC of striate cortex.
.... PHYSIOLOGY OF THE STRIATE CORTEX
Beginning in the early 1960s, Hubel and Wiesel were the first to systemat-
ically explore the physiology of striate cortex with microelectrodes. They
were students of Stephen Kuffler. who was then at Johns Hopkins Univer-
sity and later moved with them to Harvard. They extended Kuffler's inno-
vative methods of receptive field mapping to the central visual pathways.
After showing that LGN neurons behave much like retinal ganglion cells,
they turned their attention to striate cortex, initially in cats and later in
monkeys. (Here we focus on the monkey cortex.) The work that continues
today on the physiology of striate cortex is built on the solid foundation
provided by Hubel and Wiesel's pioneering studies. Their contributions to
our understanding of the cerebral cortex were recognized with the Nobel
Prize in 1981.
Receptive Fields
By and large, the receptive fields of neurons in layer IVC are similar to the
magnocellular and parvocellular LGN neurons providing their input. This
means they are generally small monocular center-surround receptive fields.
In layer IVCa the neurons are insensitive to the wavelength of light,
whereas in layer IVCI3 the neurons exhibit center-surround color oppo-
nency. Outside layer IVe, new receptive field characteristics, not observed
in the retina or LGN. are found. We wHl explore these in some depth, be-
cause they provide clues about the role VI plays in visual processing and
perception.
Binocularity. Each neuron in layers IVCa and IVCI3 receives afferents
from a layer of the LGN representing either eye. Monocular neurons from
either eye are also clumped together in VI rather than randomly inter-
mixed. This accounts for ocular dominance columns that can be visualized
in layer IVC with autoradiography. As we have already seen, the axons
leaving layer IVC diverge and innervate more superficial cortical layers. As
a consequence of the divergence, there is a mixing of inputs from the two
eyes (see Figure 10. I 7). Microelectrode recordings confirm this anatomical
fact; most neurons in layers superficial to IVC are binocular, responding to
light in either eye. We say that the neurons have binocular receptive
.,.. PHYSIOLOGY OFTHE STRIATE CORTEX 325
fields, meaning that they actually have two receptive fields, one in the
ipsilateral and one in the contralateral eye.
The construction of binocular receptive fields is essential in binocular
animals, such as humans. Without binocular neurons, we would probably
be unable to use the inputs from both eyes to form a single image of the
world around us. Retinotopy is preserved because the two receptive fields
of a binocular neuron are precisely placed on the retinas such that they are
"looking" at the same point in space. We still speak of ocular dominance
columns in superficial cortical layers. However, now instead of the sharp
monocular columns of layer rve, there are patches of neurons that are
more strongly driven by one eye than the other (i.e., they are dominated
by one eye), even though they are binocular.
Orientation Selectivity. Most of the receptive fields in the retina, LGN,
and layer Ive are circular and give their greatest response to a spot of
light matched in size to the receptive field center. Outside layer IVe, we
encounter cells that no longer follow this pattern. While small spots can
elicit a response from many conical neurons. it is usually possible to pro-
duce a much greater response with other stimuli. Rather by accident, Hubel
and Wiesel found that many neurons in VI respond best to an elongated
bar of light moving across their receptive fields. But the orientation of the
bar is critical. The greatest response is given to a bar with a particular
orientation; perpendicular bars generally elicit much weaker responses
(Figure 10.20). Neurons having this type of response are said to exhibit
orientation selectivity. Most of the V I neurons outside layer Ive (and
Border of
receptive field
Visual Receptive
stimulus field Cell discharge
Screen
$
Light stimulus
'-
'-3'
V" ,
' ,": .
...... -,.
M","eleo'rode 5"'
in striate cortex --\
recording action
potentials
-------ttt---
--+tttt-
-mI-
(a)
--Hffi--
FIGURE 10.20
Orientation selectivity. (a) The responses of an
orientation-selective neuron are monitored as visual stimuli
are presented in its receptive fiela. The visual stimulus is a
bar of light. (b) Light bars of various orientations (left) elicit
very different responses (right). The optimal orientation for
this neuron is 45° counterclockwise from vertical.
----tt-t--
(b)
326 C HAP T E RIO . THE CENTRAL VISUAL SYSTEM
FIGURE 10.21
Systematic variation of orientation \ -30
preferences across striate cortex. As an ,
electrode is advanced tangentially across layer -60
III of stnate cortex. the orientation preference 9D
of the neurons encountered is recorded and -
plotted. Notice that there is a penodic. regular ,. 60
shift in preferred orientation. (Source: Adapted Ui
OJ
from Hubel and Wiesel. 1968) I 30
01
OJ
:s I 0
c
0
. \ -30
C
OJ
a , -60
- 90
,. 60
I 30
0
Electrode track
..
..
. e..
.
1 mm
t--------I
.
...... t ,j '
.. .
.
...
..
.
..
.
.
.
..
..
.
.
.
.
.
.
.
.
..
.
..
.
.
. -..,:
Ie .
. \ .
"i -..
.,.
0.5
1 1.5
Track distance (mm)
2
some within) are orientation selective. The optimal orientation for a neuron
can be any angle around the clock.
If V 1 neurons can have any optimal orientation, you might wonder
whether the orientation selectivity of nearby neurons is related. From the
earliest work of Hubel and Wiesel, the answer to this question was an em-
phatic yes. As a microelectrode is advanced radially (perpendicular to the
surface) from one layer to the next, the preferred orientation remains the
same for all the selective neurons encountered from layer II down through
layer VI. Hubel and Wiesel called such a radial column of cells an orien-
tation column.
As an electrode passes tangentially (parallel to the surface) through the
cortex in a single layer, the preferred orientation progressively shifts. We
now know, from the use of a technique called optical imaging, that there
is a mosaiclike pattern of optimal orientations in striate cortex (Box 10.2).
If an electrode is passed at certain angles through this mosaic, the preferred
orientation rotates like the sweep of the minute hand of a clock, from the
top of the hour to ten past to twenty past. and so on (Figure 1 0.2l). If the
electrode is moved at other angles, more sudden shifts in preferred orien-
tation occur. Hubel and Wiesel found that a complete 180 0 shift in preferred
orientation required a traverse of about 1 mm, on average, within layer III.
The analysis of stimulus orientation appears to be onc of the most im-
portant functions of striate cortex. Orientation-selective neurons are
thought to be specialized for the analysis of object shape.
Direction Selectivity. Many V 1 receptive fields exhibit direction selec-
tivity; they respond when a bar of light at the optimal orientation moves
perpendicular to the orientation in one direction but not in the opposite
direction. Direction-selective cells in VI are a subset of the cells that are
orientation selenive. Figure 10.22 shows how a direnion-selective cell re-
sponds to a moving stimulus. Notice that the cell responds to an elongated
stimulus swept across the receptive field, but only in a particular direc-
tion of movement. Sensitivity to the direction of stimulus motion is a hall-
mark of neurons receiving input from the magnocellular layers of the LGN.
Direction-selective neurons are thought to be specialized for the analysis of
object motion.
-
Visual stimulus
I
Receptive
field
- -
Direction of
movement
Direction of
movement
-1
I
Layer IVB
cell discharge in response
to left-right stimulus movement
-1 ---1
Simple and Complex Receptive Fields. Neurons in the LGN have an-
tagonistic center-surround receptive fields, and this organization accounts
for the responses of neurons to visual stimuli. For example, a small spot in
the center of the receptive field may yield a much stronger response than
a larger spot also covering the antagonistic surround. What do we know
about the inputs to VI neurons that might account for binocularity, orien-
tation selectivity, and direction selectivity in their receptive tields? Binocu-
larity is easy; we have seen that binocular neurons receive afferents from
both eyes. The mechanisms underlying orientation and direction selectiv-
ity have proven more difficult to elucidate.
Many orientation-selective neurons have a receptive field elongated
along a particular axis, with an ON-center or OFF-center region flanked on
one or both sides by an antagonistic surround (Figure IO.23a). This linear
arrangement of ON and OFF areas is analogous to the concentric antago-
nistic areas seen in retinal and LGN receptive fields. One gets the impres-
sion that the cortical neurons receive a converging input from three or
more LGN cells with receptive fields that are aligned along one axis (Fig-
ure 1O.23b). Bubel and Wiesel called neurons of this type simple cells.
The segregation of ON and OFF regions is a defining property of simple
cells, and it is because of this receptive field structure that they are orien-
tation selective.
Other orientation selective neurons in VI do not have distinct ON and
OFF regions and are therefore not considered simple cells. Bubel and Wiesel
called most of these complex cells, because their receptive fields appeared
- " I
-- I
"
-
: ftW
: I
: llllfttHtlllj
: :Il
, :I -T
,
y PHYSIOLOGY OFTHE STRIATE CORTEX
327
I
H I-
I
Layer IVB
cell discharge in response
to right-left stimulus movement
FIGURE 10.22
Direction selectivity. With a bar stimulus
at the optimal orientation, the neuron re-
sponds strongly when the bar is swept to the
right but weakly when It is swept to the left.
Center-surround receptive fields
of 3 LGN neurons
--
ON
(a)
\
\
Simple cell receptive field
(b)
Light
OFF _
FIGURE 10.23
A simple cell receptive field. (a) fhe response of ,J simple cell to optimally oriented
bars of light at different locations in the receptive field. Notice that the response can be ON
or OFF depending on where the bar lies in the receptive field. (b) A possible construction
of a simple cell receptive field by the convergence of three LGN cell axons with center-
surround receptive fields.
I Patch of
I retina
!
. !/
.
LGN neurons
Layer IVCa
neuron
328 C HAP T E RIO . THE CENTRAL VISUAL SYSTEM
Box 10.2
)
BRAIN FOOD
Optical Imaging of Neural Activity
Most of what we know about the response properties of
neurons in the visual system, and every other system in
the brain. has been learned from intracellular and extra-
cellular recordings with microelectrodes.These recordings
give precise information about the activity of one or a few
cells. However, unless one inserts thousands of electrodes,
it is not possible to observe patterns of activity across
large populations of neurons.
What if we could simultaneously record signals from
thousands of neurons simply by aiming a camera at the
brain's surface? Incredibly, one can observe brain activity
with this optical recording approach, and the resulting im-
ages have yielded new insight about the organization of
the cerebral cortex. In one version of optical recording, a
voltage-sensitive dye is applied to the surface of the brain.
The molecules in the dye bind to cell membranes, and
they change their optical properties in proportion to vari-
ations in membrane potential. The change is detected with
either an array of photodetectors or a video camera. If
this technique is used to record from a single neuron, the
output of the optical. detector is similar to an intracellu-
lar recording. In recordings from the cerebral cortex, the
activity of individual neurons cannot be resolved, and the
optical signal represents a summation of the changes in
membrane potential of the neurons and gtial cells in an
area about 100 !-1m across.
A second way to optically study cortical activity is to
image intrinsic signals. When neurons are active, numer-
ous changes occur in the neurons themselves and in the
surrounding tissue. Examples of such changes are ion
movement, neurotransmitter release, and alterations in
blood volume and oxygenation. Because these factors are
correlated with the level of neural activity and they have
(very small) effects on the reflection of light from the
brain, they are called intrinsic signals for optical recording.
,
'"
FIGURE A
Vasculature on the surface of pnmary
visual cortex. (Source: T s'o et aI., 1990.
Fig. I A.)
Thus, when intrinsic signals are used to study brain activity,
membrane potentials or action potentials are not directly
measured. To record intrinsic signals, light is projected
onto the brain, and a video camera records the reflected
light. With the wavelengths of light usually used for illu-
mination, the intrinsic signal is dominated by changes as-
sociated with activity-dependent increases in blood vol-
ume or blood oxygen saturation. One disadvantage of this
technique is that its reliance on slow vascular changes
makes it incapable of the millisecond temporal resolution
possible with voltage-sensitive dyes.
Figure A shows the vasculature in a portion of primary
visual cortex. Figure B shows ocular dominance columns
in the same patch of striate cortex obtained by imaging
areas in which blood flow changes occurred during visual
stimulation. This figure is actually a subtraction of two im-
ages-one made when only the right eye was visually
stimulated, minus another when only the left eye was
stimulated. Consequently, the dark bands represent cells
dominated by the left eye, and the light bands represent
cells dominated by the right eye.
Figure C is a color-coded representation of preferred
orientation in the same patch of striate cortex. Four dif-
ferent optical images were recorded while bars of light at
four different orientations were swept across the visual
field. Each location in the figure is colored according to
the orientation that produced the greatest response at
each location on the brain (blue = horizontal; red = 45°;
yellow = vertical; turquoise = 135°). Consistent with ear-
lier results obtained with ellectrodes (see Figure 10.21), in
some regions, the orientation changes progressively along
a straight line. However, the optical recording technique
reveals that cortical organization based on orientation is
much more complex than an idealized pattern of parallel
"columns:'
..
- ..
FIGURE B
Ocular dominance columns.
(Source: T s'o et aI., 1990, Fig. I B.)
FIGURE C
A map of preferred orientations.
(Source: Ts'o et aI., 1990, Fig. I C.)
Visual I
stimulus ____ _
(){i-
----
Receptive _
field
Light:
o
Record
of action
potentials
Time__
to be more complex than those of simple cells. Complex cells give ON and
OFF responses to stimuli throughout the receptive field (Figure 10.24).
Hubel and Wiesel proposed that complex cells are constructed from the
input of several like-oriented simple cells. However. this remains a matter
of debate.
Simple and complex cells are typically binocular and sensitive to stimu-
lus orientation. While less is known about the mechanism, many are also
direction selective. In general, they are relatively insensitive to the wave-
length of light, although color sensitivity is sometimes observed.
Blob Receptive Fields. The old adage says, where there's smoke, there's
fire. This idea appropriately describes the connection between structure and
function in the brain. We have seen repeatedly in the visual system that
when two nearby structures label differently with some anatomical tech-
nique, there is good reason to suspect the neurons in the structures are
functionally different. For example, we have seen how the distinctive layers
of the LGN segregate different types of input. Similarly, the lamination of
striate cortex correlates with differences in the receptive fields of the neurons.
The presence of the distinct cytochrome oxidase blobs outside layer IY of
striate cortex immediately raises the question of whether the neurons in
the blobs respond differently from interblob neurons. The answer is clearly
yes. The neurons in the interblob areas have some or all of the properties
we discussed above: binocularity, orientation selectivity, and direction selec-
tivity. They are both simple cells and complex cells and generally are not
wavelength sensitive. Most blob cells, on the other hand, are wavelength
sensitive and monocular, and they lack orientation and direction selectiv-
ity. The blobs receive input directly from the koniocellular layers of the
LGN and magnocellular and parvocellular input via layer lYe. The visual
responses of blob cells most resemble those of the koniocellular and parvo-
cellular input.
The receptive fields of most blob neurons are circular. Some have the
color-opponent center-surround organization observed in the parvocellular
and koniocellular layers of the LGN. Other blob cell receptive fields have
red-green or blue-yellow color opponency in the center of their receptive
fields, with no surround regions at aIL Still other cells have both a color-
opponent center and a color-opponent surround; they are called double-
opponent cells. For present purposes, the most important thing to remem-
ber about blobs is that they contain the great majority of color-sensitive
neurons outside layer lYe. Thus, the blob channels appear to be specialized
for the analysis of object color. Without them, we might be color-blind.
... PHYSIOLOGY OFTHE STRIATE CORTEX 329
FIGURE 10.24
A complex cell receptive field. Like a
simple cell, a complex cell responds best to
a bar of light at a particular orientation.
However. responses occur to both light ON
and light OFF, regardless of position in the
receptive field.
L
330 C HAP T E RIO . THE CENTRAL VISUAL SYSTEM
Parallel Pathways and Cortical Modules
The anatomy and physiology of the central visual pathways, from retina to
striate cortex, are consistent with the idea that there are several channels
that process visual input in parallel. Each one appears to be specialized for
the analysis of different facets of the visual scene. Dr. Margaret Livingstone
and her colleagues at Harvard University have explored the fascinating
correspondence between the organization of visual pathways and the re-
ceptive field properties of neurons (Box 10.3). On the basis of anatomy and
physiology, we can distinguish a magnocellular pathway, a parvo-interblob
pathway, and a blob pathway. These pathways are summarized in Figure
10.25. In addition to this segregation into parallel pathways, there appears
to be modular processing in VI based on retinotopy and the organization
into ocular dominance columns, orientation columns, and blobs.
Parallel Pathways. The magnocelIuJar pathway begins with M-type
ganglion cells of the retina. These cells project axons to the magnocelIular
layers of the LGN. These layers project to layer IVCa of striate cortex, which
in turn projects to layer IVB. The pyramidal cells in layer IVE have binoc-
ular receptive fields of the simple and complex types. They are orientation
selective, and many are direction selective. They are generally not wave-
length sensitive. Because this pathway contains neurons with transient re-
sponses, relatively large receptive fields, and the highest percentage of di-
rection-selective neurons, it is thought to be involved in the analysis of
object motion and the guidance of motor actions.
The parvo-interblob pathway originates with P-type ganglion cells of the
retina, which project to the parvocellular layers of the LGN. The parvocelIu-
lar LGN sends axons to layer IVC\3 of striate cortex, which project to layer II
and III interblob regions. These neurons are not generally direction selective
or wavelength sensitive. The binocular receptive fields are orientation se-
lective and simple or complex. Neurons in this pathway have the smallest
Extrastriate cortical areas
--t
Layer IVB
i
Blob
Interblob
Layer Ive
i
V1
Layer Ive
LGN Magnocellular
Koniocelluiar
Parvocellular
Retina M-type
ganglion cells
nonM-nonP
ganglion cells
P-type
ganglion cells
Magnocellular pathway
(motion)
Blob pathway
(color)
Parvo-interblob pathway
(shape)
FIGURE 10.25
Three parallel pathways reaching into primary visual cortex. The function Indicated
below each pathway name is a "best guess" based on unique receptive field properties.
Additional interactions between the pathways exist, but they are not shown.
Box 10.3 it PAT H 0 F D I S C 0 V E R Y
Vision and Art
In thinking about what factors led to my favorite discov-
eries, I recall that there always seemed to be a combina-
tion of luck and having the right question percolating
around in my mind. David Hubel and I worked out the
interlacing connectivity between the different subdivisions
of V I and V2 because we had been recording from the
VI blobs and were very curious about their connectivity.
The lucky part was that a colleague gave us a very large
number of squirrel monkeys-otherwise, we would not
have had enough money to do the study.
We started looking at the roles of the magno and parvo
systems in perception after seeing Patrick Cavanagh's
astonishing demonstration of the slowing down of motion
perception at equiluminance (i.e., when the differently
colored object and background are equally bright). On
seeing the demo, I immediately said, "That's because the
magno system is color-blind:' David Hubel replied, "That's
ridiculous; if that were the case, then stereopsis (depth
perception from binocular vision) should be color-blind."
So we looked at some stereograms at equiluminance, and
sure enough, we couldn't see stereopsis at equiluminance.
Each time I thought we had settled the hypothesis that
magno functions should be diminished at equiluminance,
David would object, saying that some other visual task
should be similarly affected. After 2 years of arguing, and
doing every experiment he could think up, we finally con-
vinced ourselves that it was the case, and published a very
long paper on the parallel processing of form, color, mo-
tion, and depth.
We looked at all kinds of visual functions to see which
ones were diminished at equiluminance, to see whether
they might be carried selectively by the magno system, and
one of the things we found that was adversely affected at
equiluminance was reading.This got me interested in look-
ing at dyslexia. People with dyslexia often complain that
ordinary text seems jittery, just like what non-dyslexics
experience when reading equiJuminant text. I got lucky in
telling this idea to AI Galaburda because he turned out to
have an entire collection of dyslexic and control brains,
and this collaboration led to our developing a theory (still
disputed) about the etiology of dyslexia.
Whenever I would give scientific talks about the paral-
lel processing of form, color, motion, and depth, I would
use works of art to illustrate the points about how various
visual functions would disappear at equiluminance, because
a lot of op art uses just this principle. I found that people
in the audience were often more interested in the art
by Margaret Livingstone
J
than the science, so I started putting more art and less
science in my lectures. I also started collecting the best
examples I could find of works of art that illustrated
various points in my lectures. After a while, I had so many
of them that I started writing an article, thinking I would
publish it in Scientific American, but I had collected so many
examples that it turned into a book.
An editor I was working with on the book told me that
although it was obvious I knew a lot about art, it was
equally obvious that I knew nothing about art history, and
he recommended I read an art history book. So I did, and
when I got to the Renaissance, the author urged the
reader to look carefully at the Mona Lisa and observe
how lifelike she seemed, and how her expression seemed
to change. I noticed that her expression did change, but
it changed systematically with my gaze direction. I realized
this was because her smile was blurry and therefore more
visible to my low-resolution peripheral vision than to my
high-acuity central vision.
From my work on dyslexics, I got interested in the pos-
sibility that artistic talent might have some biological basis.
An astonishing number of talented artists, musicians, ac-
tors, and computer programmers contacted me and told
me that they were dyslexic. It became clear that some of
them were so talented that their success couldn't be sim-
ply compensation for being bad at reading, and the idea
that something that might be a disability in one realm of
life might be an asset in another was forced upon me.
I began thinking that one small component of artistic
talent in dyslexics might be poor depth perception, be-
cause a painter's job is to flatten the 3-D world onto a
flat canvas, and I started looking for evidence of poor
depth perception in artists. Mostly I looked at photo-
graphs of famous artists, because you can legitimately diag-
nose strabismus, which would result in stereoblindness,
from photographs. During vacation, I noticed that all four
of the Rembrandt self-portraits in the Louvre look wall-
eyed. I looked at a very large number of Rembrandt self-
portraits, but I couldn't see any pattern as to which eye
deviated outward, which you would expect if Rembrandt
had had one bad eye. One of my students, Bevil Conway,
is himself a stereoblind artist, and he pointed out that we
should look at etchings and paintings separately, because
etchings are mirror image reversed from the plate. Then
we saw the pattern!
So for me, Pasteur's maxim that luck favors the pre-
pared mind has repeatedly been true.
332 C HAP T E RIO . THE CENTRAL VISUAL SYSTEM
FIGURE 10.26
A cortical module. Each cortical module
contains ocular dominance columns, orienta-
tion columns, and cytochrome oxidase blobs
to fully analyze a portion of the visual field.
The idealized cube shown here differs from
the actual arrangement. which is not as
regular or orderly.
orientation-selective receptive fields, suggesting that they are involved in
the analysis of fine object shape.
The origin of the blob pathway is more mixed than that of the magno-
cellular and parvo-interblob pathways. Unique input to the blob pathway
arises from the subset of ganglion cells that are neither M-type cells nor
P-type cells. These nonM-nonP cells project to the koniocellular layers of the
LGN. The koniocellular LGN projects directly to the cytochrome oxidase blobs
in layers II and III. The blobs are a site of convergence of parvocellular, mag-
no cellular, and koniocellular inputs. Typical receptive fields in the blobs are
center-surround and color-opponent. They are often monocular and lack
orientation selectivity. The uniquely high incidence of wavelength sensitivity
in the blobs suggests that the neurons are involved in the analysis of objed color.
While parallel pathways are a compelling feature of the visual system, it
is important to note that they are not "pure." There is some mixing both
within VI and beyond, resulting in the interaction of signals from the mag-
nocellular, parvo-interblob, and blob pathways. At present, we do not
know whether this mixing is useless "contamination" that degrades infor-
mation transmission within pathways or the source of valuable integration
of different visual attributes.
Cortical Modules. Each point in the visual world is analyzed by thousands
of cortical neurons. The retinotopic organization of the projections from
retina to LGN to the primary visual cortex ensures that all the neurons ana-
lyzing a point in visual space are within a circumscribed patch of the cortex.
Bubel and Wiesel showed that the image of a point in space falls within the
receptive fields of neurons within a 2 X 2 mm region of layer III. For a
complete analysis, this 2 X 2 mm patch of active neurons must include rep-
resentatives from each of the processing channels from right and left eyes.
Fortunately, a 2 X 2 mm chunk of cortex would contain two complete
sets of ocular dominance columns, 16 blobs, and, in the cells between
blobs, a complete sampling (twice over) of all 180 0 of possible orientations.
Thus, Bubel and Wiesel argued that a 2 X 2 mm chunk of striate cortex is
both necessary and sufficient to analyze the image of a point in space,
necessary because its removal would leave a blind spot for this point in the
visual field and sufficient because it contains all the neural machinery re-
quired to analyze the participation of this point in oriented and/or colored
contours viewed through either eye. Such a unit of brain tissue has come
to be called a cortical module.
Striate cortex is constructed from perhaps a thousand cortical modules,
and one is shown in Figure 10.26. We can think of a visual scene being
Blobs
II
-
-
-
III
I
I ..
,1\
Orientation
columns
IV
..
V
VI
Ocular dominance
columns
.,. BEYOND STRIATE CORTEX 333
simultaneously processed by these modules, each "looking" at a portion of
the scene. Just remember that the modules are an idealization. Optical images
of VI activity reveal that the regions of striate cortex responding to differ-
ent eyes and orientations are not nearly as regular as the "icecube model"
in Figure 10.26 suggests.
... BEYOND STRIATE CORTEX
Striate cortex is called VI, for "visual area one," because it is the first cor-
tical area to receive information from the lGN. Beyond VI lie another two
dozen distinct areas of cortex, each of which contains a representation of
the visual world. The contributions to vision of these extrastriate areas are
still being vigorously debated. However, the emerging picture is that there
are two large-scale cortical streams of visual processing, one stretching dor-
sally from striate cortex toward the parietal lobe and the other projecting
ventrally toward the temporal lobe (Figure 10.27).
The dorsal stream appears to serve the analysis of visual motion and the
visual control of action. The ventral stream is thought to be involved in
the perception of the visual world and the recognition of objects. These
processing streams have primarily been studied in the macaque monkey
brain, where recordings from single neurons can be made. However,
functional magnetic resonance imaging (fMRI) research has begun to
identify areas in the human brain that have properties analogous to brain
areas in the macaque (Figure 10.28).
The dorsal and ventral streams in extrastriate cortex are related to the
magnocellular, parvo-interblob, and blob pathways in VI. As we will see
below, the properties of dorsal stream neurons are most similar to magno-
cellular neurons in VI, and ventral stream neurons have properties com-
bining features of parvo-interblob and blob cells in VI. It appears to be a
reasonable approximation to view the dorsal stream as an extension of the
VJ magnocellular pathway and the ventral stream as an extension of VI
parvo-interblob and blob pathways. However, each extrastriate stream re-
Dorsal stream
-
V<
MST
I
f
MT(V5)
/
V2
___-V1
Ventral stream
\'"
V4
(a)
(b)
IT
Other dorsal
areas
Other ventral
areas
.....-- MST .....-- MT
! V2 V1
V4¥
..
IT ..
FIGURE 10.27
Beyond striate cortex in the macaque monkey
brain. (a) Dorsal and ventral visual processing streams.
(b) Extrastnate visual areas. (c) The flow of Information
,n the dorsal and ventral streams.
(c)
334 C HAP T E RIO . THE CENTRAL VISUAL SYSTEM
FIGURE 10.28
Visual areas in the human brain,
medial and lateral views. For each view.
next to the convertional picture of the brain
is a "computer-inflated" brain in which the
sulCi have been flattened to expose hidden
cortex. On the right is a flattened r1ap of the
cerebral cortex with the visual areas colored.
Visual areas are represented by their commor
abbreviation 0/1. VI. V3. V4. MT. MST IT). VP
is the ventral posterior area. Sulci shown are
the superior temporal sulcus (STS), calcarine
fissure. and central sulcus (CS). (Source:
Courtesy of Dr. M. Sereno.)
....,
,
"""
.# i--
,
Later - I ,
....
3
,
V3. ,
'S.
V3 V4d a.'....
"
-
FI'. 'I - I ed '
T
.
,. - 1,-
"
Media v. V1
I V
V4v
( 3A '"
cs'carhe V4d
..
pV4 MT
1 em
ceives some amount of input from all the pathways that are segregated in the
primary visual cortex. Thus, the extrastriate streams appear to be dominaced by
input from particular VI pathways rather than exclusive extensions of them.
The Dorsal Stream
The cortical areas composing the dorsal stream are not arranged in a strict
serial hierarchy, but there does appear to be a progression of areas in which
more complex or specialized visual representations develop. Projections
from VI extend to areas designated V2 and V3, but we will skip farther
ahead in the dorsal stream.
Area MT. In an area known as V5 or MT (because of its location in the
middle temporal lobe in some monkeys), strong evidence indicates that
specialized processing of object motion takes place. Area MT receives
retinotopically organized input {rom a number of other cortical areas, such
as V2 and V3, and it also is directly innervated by cells in layer !VB of striate
cortex. Recall that in layer IVE the cells have relatively large receptive
fields, transient responses to light, and direction selectivity. Neurons in area
MT have large receptive fields that respond to stimulus movement in a nar-
row range of directions. Area MT is most notable for the fact that almost
all the cells are direction-selective, unlike areas earlier in the dorsal stream,
or anywhere in the ventral stream.
The neurons in MT also respond to types of motion, such as drifting spots
of light, that are not good stimuli for cells in other areas-it appears that
the motion of the objects is more important than their structure. Further
specialization for motion processing is evident in the organization of MT.
This cortical area is arranged into direction-of-motion columns analogous
to the orientation columns in VI. Presumably, the perception of movement
at any point in space depends on a comparison of the activity across columns
spanning a full 360 0 range of preferred directions.
William Newsome and his colleagues at Stanford University have shown
that weak electrical stimulation in area MT of the macaque monkey appears
to alter the perceived direction in which small dots of light move. For exam-
ple, if electrical stimulation is applied to cells in a direction column preferring
rightward movement, the monkey makes behavioral decisions suggesting
that it has perceived motion in that direction. The artificial motion signal
from electrical stimulation in MT appears to combine with visual motion
input. The fact that the monkey behaviorally reports a perceived direction
of motion based on the combination suggests that MT activity plays an
important role in motion perception.
Dorsal Areas and Motion Processing. Beyond area MT, in the parietal
lobe, are areas with additional types of specialized movement sensitivity.
For example. in an area known as MST, there are cells selective for linear
motion (as in MT), radial motion (either inward or outward from a central
point), and circular motion (either clockwise or counterclockwise). We do
not know how the visual system makes use of neurons with complex
motion-sensitive properties in MST or of the "simpler" direction-selective
cells in VI, MT, and other areas. However, three roles have been proposed:
1. Navigation: As we move through our environment, objects stream past
our eyes, and the direction and speed of objects in our peripheral vision
provide valuable information that can be used for navigation.
2. Directing eye movements: Our ability to sense and analyze motion must also
be used when we follow objects with our eyes and when we quickly move
our eyes to objects in our peripheral vision that catch our attention.
3. Motion perception: We live in a world filled with motion, and survival
sometimes depends on our interpretation of moving objects.
Striking evidence that cortical areas in the vicinity of MT and MST are
critical for motion perception in humans comes from extremely rare cases
in which brain lesions selectively disrupt the perception of motion. The
clearest case was reported in 1983 by Josef Zihl and his colleagues at the
Max Planck Institute for Psychiatry in Munich, Germany. Zihl studied a
woman who experienced a stroke at the age of 43, bilaterally damaging
portions of extrastriate visual cortex known to be particularly responsive to
motion (Figure 10.29). Although some ill effects of the stroke were evident,
'""
..
..
T BEYOND STRIATE CORTEX 335
FIGURE 10.29
Human brain activity in response to
visual motion. In this PET image, an area
on the lateral surface of the oCCipital lobe
(shown in red and yellow) is particularly
active. (Source: Zeki, 1993. Plate 2.)
336 C HAP T E RIO . THE CENTRAL VISUAL SYSTEM
such as difficulty naming objects, neuropsychological testing showed the
patient to be generally normal and to have relatively normal vision, ex-
cept for one serious deficit: She appeared to be incapable of visually per-
ceiving motion. Before you decide that not seeing motion would be a minor
impairment, imagine what it would be like to see the world in snapshots.
Zihl's patient complained that when she poured coffee into a cup, it ap-
peared at one moment to be frozen at the bottom of the cup and then sud-
denly it had filled the cup and covered the table. More ominously, she had
trouble crossing the street-one moment she would perceive cars to be
in the distance, and the next moment they would be right next to her.
Clearly, this seemingly minor loss of motion perception had profound ram-
ifications for the woman's lifestyle. The implication ot this case is that mo-
tion perception may be based on specialized mechanisms located beyond
striate cortex in the dorsal stream.
The Ventral Stream
In parallel with the dorsal stream, a progression of areas from VI, V2, and
V3 running ventraJIy toward the temporal lobes appears specialized for the
analysis of visual attributes other than motion.
Area V4. One of the most-studied areas in the ventral stream is area V4
(see Figures 10.27 and 10.28). V4 receives input from the blob and interblob
regions of striate cortex via a relay in V2. Neurons in area V4 have larger
receptive fields than cells in striate cortex, and many of the cells are both
orientation selective and color selective. Although there is a good deal of
ongoing speculation concerning the function of V4, this area appears to be
important for both shape perception and color perception. If this area is
damaged in monkeys, perceptual deficits involving both shape and color
result.
A rare clinical syndrome in humans known as achromatopsia is charac-
terized by a partial or complete loss of color vision despite the presence of
normal functional cones in the retina. People with this condition describe
their world as drab, consisting of only shades of gray. Imagine how unap-
petizing a gray banana would be! Because achromatopsia is associated with
cortical damage in the occipital and temporal lobes, without damage to VI,
the LGN, or the retina, the syndrome suggests that there is specialized color
processing in the ventral stream. Consistent with the coexistence of color-
sensitive and shape-sensitive cells in the ventral stream, achromatopsia is
usually accompanied by deficits in form perception. Some researchers have
proposed that V4 is a particularly critical area for color and form percep-
tion, but whether the lesions associated with achromatopsia correspond to
a human V4 area is controversial.
Area IT. Beyond V4 in the ventral stream are cortical areas that contain
neurons with complicated spatial receptive fields. A major output of V4 is
an area in the inferior temporal lobe known as area IT. A wide variety of
colors and abstract shapes have been found to be good stimuli for cells in
IT. As we will see in Chapter 24, this area appears to be important for both
visual perception and visual memory. One of the most intriguing findings
concerning IT is that a small percentage of the neurons responds strongly
to pictures of faces. These cells may also respond to stimuli other than faces,
but faces produce a particularly vigorous response, and some faces are more
effective stimuli than others. This finding in monkeys appears consistent
with images made using fMRI in humans, which indicate that there is a
small area in the human brain that is more responsive to faces than to other
... FROM SINGLE NEURONS TO PERCEPTION 337
t ..
--
a
..
FIGURE 10.30
Human brain activity elicited by pictures of faces. Using fMRI. brain activity was
recorded first in response to races and second in response to nonrace stimuli. The colored
area jl"' the brain section on the right showed significantly greater responses to faces.
(Source: Courtesy of Drs. I. Gauthier, J. c. Gore. and M. Tarr.)
stimuli (Figure 10.30). The finding o{ {ace-selective cells has sparked much
interest, in part because of a syndrome called prosopagnosia-difficulty rec-
ognizing {aces even though vision is otherwise normal. This rare syndrome
usually results from a stroke and is assodated with damage to extrastriate
visual cortex.
Could it be that our brains contain a group of cells highly specialized for
face recognition? The answer is not known. While most scientists agree
that faces are particularly good stimuli for a small percentage of cells, this
does not mean that these cells are not involved in processing other types
of information.
... FROM SINGLE NEURONS TO PERCEPTION
Visual perception-the task of identifying and assigning meaning to objects
in space-obviously requires the concerted action of many cortical neurons.
But which neurons in which cortical areas determine what we perceive?
How is the simultaneous activity of widely separated cortical neurons inte-
grated, and where does this integration take place? Neuroscience research
is only just beginning to tackle these challenging questions. However, some-
times basic observations about receptive fields can give us insight into how
we perceive (Box 10.4).
From Photoreceptors to Grandmother Cells
Comparing the receptive field properties of neurons at different points in
the visual system might provide insight about the basis of perception. The
receptive fields of photoreceptors are simply small patches on the retina.
whereas those of retinal ganglion cells have a center-surround structure.
The ganglion cells are sensitive to variables such as contrast and the wave-
length of light. In striate cortex, we encounter simple and complex receptive
fields that have several new properties, including orientation selectivity and
binocularity. We have seen that in extra striate cortical areas, cells are selec-
tively responsive to more complex shapes, object motion, and even faces.
It appears that the visual system consists of a hierarchy of areas in which
338 C HAP T E RIO . THE CENTRAL VISUAL SYSTEM
Box lOA
... , ,.
OF SPECIAL INTEREST
....
..
.
The Magic of Seeing in 3D
You have probably seen books or posters showing patterns
of dots or splotches of color that supposedly contain pic-
tures in 3D. if you contort your eyes just the right way.
But how is it possible to see three dimensions on a two-
dimensional piece of paper? The answer is based on the fact
that our two eyes always see slightly different images of the
world because of the distance between them in the head.
The closer objects are to the head, the greater the differ-
ence in the two images. You can easily demonstrate this to
yourself by holding a finger up in front of your eyes and al-
ternately viewing it, at different distances, with the left or
right eye closed.
Long before anything was known about binocular neu-
rons in visual cortex, stereograms were a popular form of
recreation. Two photographs were taken with lenses sepa-
rated by a distance roughly the same as that of human eyes.
By looking at the left photograph with the left eye and the
right photograph with the right eye (by relaxing the eye
muscles or with a stereoscope), the brain combines the im-
ages and interprets the different views as cues for distance
(Figure A).
In 1960, Bela Julesz, working at the Bell Telephone Labo-
ratories, invented random-dot stereograms (Figure B). These
paired images of random dots are, in principle, the same as
the nineteenth-century stereograms. The big difference is
that no image can be seen with normal binocular viewing.
To see the image in 3D, you must direct your left and right
eyes to left and right images. The principle in constructing
.
.
'1'_
.. ---'--
;00.
"".
...
. ......
.
,
.. !-"
"
'j
FIGURE A
A nineteenth-century stereogram. (Source: Horibuchi, 1994, p. 38.)
the stereo images is to create a background of randomly
spaced dots, and wherever an area should be closer or far-
ther away in the fused image, the dots shown to one eye
are horizontally shifted relative to those in the other eye.
Imagine looking at a white index card covered with random
black dots while you hold it in front of a large piece of white
paper covered with similar dots. By alternately closing your
eyes, the dots on the index card will shift horizontally more
than those on the more distant piece of paper. The pair of
stereo images captures tl1is difference in viewpoint and
erases any other indication that there is a square in front,
such as the edge of the index card. Random-dot stere-
ograms shocked many scientists, because in 1960, it was
receptive fields become increasingly more complex, moving away from VI.
Perhaps our perception of specific objects is based on the excitation of a
small number of specialized neurons in some ultimate perceptual area that
has not yet been identified. Is our recognition of our grandmother based
on the responses of 5 or 10 cells with receptive field properties so highly
refined that the cells respond only to one person? The closest approxima-
tion to this is the face-selective neurons in area IT. However, even these
fascinating cells do not respond to only one face.
While it is by no means settled, there are several arguments against the
idea that perception is based on extremely selective receptive fields such as
those of "grandmother cells." First, recordings have been made from most
parts of the monkey brain, but there is no evidence that a portion of cor-
tex has cells tuned to each of the millions of objects that we all recognize.
Second, such great selectivity appears to be counter to the general princi-
ple of broad tuning that exists throughout the nervous system. Photore-
ceptors respond to a range of wavelengths, simple cells respond to many
orientations, cells in MT respond to motion in a range of directions, and
face cells usually respond to many faces. Moreover, cells that are selective
for one property-orientation, color. or whatever-are always sensitive to
'" . &'." '. - "4
'.
'.' . . '......
t 'r ;I
.-
.,. 1 1-/ ..
+
i'
0..", _ '.j
.....
":.
!:.
FIGURE B
A random-dot stereogram and the perception that results from
binocularly fusing the images. (Source: julesz. 1971, p, 21.)
commonly thought that depth was perceived only after the
images in each eye were separately recognized.
In the I 970s, Christopher Tyler at the Smith-Kettlewell Eye
Research Institute created autostereograms. An autostere-
ogram is a single image that, when properly viewed, gives the
perception of objects in 3D (Figure C). The colorful, and
sometimes frustrating, autostereograms you see in books
are based on an old illusion called the wallpaper effect. If
you look at wallpaper that contains a repeating pattern, you
can cross (or diverge) your eyes and view one piece of the
pattern with one eye and the next cycle of the pattern with
the other eye. The effect makes the wallpaper appear to
be closer (or farther away). In an autostereogram, the wall-
paper effect is combined with random-dot stereograms. To
see the 3D skull in Figure C, you need to relax your eye
muscles so that the left eye looks at the left dot on top and
the right eye the right dot. You will know you are getting close
when you see three dots at the top of the image. Relax and
keep looking, and the picture will become visible.
'" FROM SINGLE NEURONS TO PERCEPTION 339
'.
.
M,
. .
,'1' r I'
.
\, d, ' J, , .
..\ I .11' ,
',: ."...... , \ I: \.'
"t f -
. I.
./ "- ,
,r, / /-,.
'. ,:::..... .' :::.....
.
.'
/-,.,
'/'
.',
. '
... '\
,:.
.... '.
, , .
... f ,. ... "< ..
, .. . ., .; ., . ; ".1: ; '! 1'
'.' '},. . t .
...
\ .
.. t ;r ¥
\,
... ' ..
,I- ,','"
,
. ::4"
, fo.
"
'. .
,..:! ,
: ' I
,
"
\
. . 1'-.,
" ,
. -
" I
r':;I '.
. /-,.,
. ,..'
y
""""I
,.,.1
y.
FIGURE C
An autostereogram. (Source: Horibuchi, 1994, p. 54.)
One of the fascinating things about stereograms is that
you often must look at them for tens of seconds or even
minutes, while your eyes become "properly" misaligned and
your visual cortex "figures out" the correspondence be-
tween the left and right eye views. We do not know what
is going on in the brain during this period, but presumably
it involves the activation of binocular neurons in the visual
cortex.
other properties. For example, we can focus on the orientation selectivity
of VI neurons and the way in which this might relate to the perception of
form, neglecting the fact that the same cells might selectively respond to
size, direction of motion, and so on. Finally, it might be too "risky" for the
nervous system to rely on extreme selectivity. A blow to the head might
kill all five grandmother cells, and in an instant. we would lose our ability
to recognize her.
Parallel Processing and Perception
If we do not rely on grandmother cells, how does perception work? One
alternative hypothesis is formulated around the observation that parallel
processing is used throughout the visual system (and other brain systems).
We encountered parallel processing in Chapter 9 when we discussed ON
and OFF and M and P ganglion cells. In this chapter, we saw three paral-
lel channels in VI. Extending away from VI are dorsal and ventral streams
of processing, and the different areas in these two streams are biased, or
spedalized, for various stimulus properties. Perhaps the brain uses a "division
of labor" principle for perception. Within a given cortical area, many broadly
340 C HAP T E RIO . THE CENTRAL VISUAL SYSTEM
--
os,
\-
>-V>
w:E
cx::
w
I-
tuned cells may serve to represent features of objects. At a bigger scale, a
relatively large group of cortical areas may contribute to perception, some
dealing more with color or form, others more with motion. In other words,
perception may be more like the sound produced by an orchestra of visual
areas than the end product of an assembly line.
... CONCLUDING REMARKS
In this chapter, we have outlined the organization of the sensory pathway
from eye to thalamus to cortex. We saw that vision actually involves the
perception of numerous different properties of objects-color, form, move-
ment-and these properties are processed in parallel by different cells of the
visual system. This processing of information evidently requires a strict
segregation of inputs at the thalamus, some limited convergence of infor-
mation in striate cortex, and Iinally a massive divergence of information as
it is passed on to higher cortical areas. The distributed nature of the corti-
cal processing of visual information is underscored when you consider that
the output of a million ganglion cells can recruit the activity of well over a
billion cortical neurons throughout the occipital, parietal, and temporal
lobes! Somehow, this widespread cortical activity is combined ro form a
single, seamless perception of the visual world.
Heed the lessons learned from the visual system. As we shall see in later
chapters, the basic principles of organization in this system-parallel pro-
cessing, ropographic mappings of sensory surfaces. synaptic relays in the
dorsal thalamus, cortical modules, and multiple cortical representations-
are also features of the sensory systems devoted to hearing and touch.
The Retinofugal
Projection
retinofugal projection (p. 310)
optic nerve (p. 31 I)
optic chiasm (p. 312)
decussation (p. 312)
optic tract (p. 312)
visual hemifield (p. 312)
binocular visual field (p. 312)
lateral geniculate nucleus (LGN)
(p. 313)
optic radiation (p. 313)
superior colliculus (p. 314)
optic tectum (p. 315)
retinotectal projection (p. 315)
The Lateral Geniculate
Nucleus
magnocellular LGN layer (p. 316)
parvocellular LGN layer (p. 316)
koniocellular LGN layer (p. 316)
Physiology of the Striate
Cortex
binocular receptive field (p. 324)
orientation selectivity (p. 325)
orientation column (p.326)
direction selectivity (p.26)
simple cell (p. 327)
complex cell (p. 327)
magnocellular pathway (p. 330)
parvo-interblob pathway (p. 330)
blob pathway (p. 332)
cortical module (p. 332)
Anatomy of the Striate
Cortex
primary visual cortex (p. 318)
area 17 (p. 318)
V I (p. 3 18)
striate cortex (p. 318)
retinotopy (p. 319)
ocular dominance column
(p. 322)
cytochrome oxidase (p. 324)
blob (p. 324)
Beyond Striate Cortex
area MT (p. 334)
area V4 (p. 336)
area IT (p. 336)
,111
V>
z
w
0
>
w r-
cr. V>
w
::J
a
... CONCLUDING REMARKS 341
I. Following a bicycle accident, you are disturbed to find that you cannot see anything in the left visual field.
Where has the retinofugal pathway been damaged?
2. What is the source of most of the input to the left LGN?
3. A worm has eaten part of one lateral geniculate nucleus. You can no longer perceive color in the right
visual field of the right eye. What layer(s) of which LGN have been damaged?
4. List the chain of connections that link a cone in the retina to a blob cell in striate cortex.
5. How are receptive fields transformed at each of the synaptic relays that connect an M-type retinal ganglion
cell to a neuron in striate cortical layer IVB?
6. Which pathway, magnocellular or parvocellular, provides a greater percentage of the input to striate cortex?
What are two analyses of the visual world that are thought to involve mainly this pathway? What about the
other pathway?
7. What is meant by parallel processing in the visual system? Give two examples.
8. If a child is born cross-eyed and the condition is not corrected before the age of 10, binocular depth per-
ception will be lost forever. This is explained by a modification in the circuitry of the visual system. From
your knowledge of the central visual system, where do you think the circuitry has been modified?
9. In what ways is area MT more specialized for the detection of visual motion than area VI?
10. For many years, it was thought that depth perception involved the recognition of objects in each eye
separately, followed by binocular integration. How do the stereograms discussed in Box 10.4 disprove this
hypothesis? What areas of the brain are possible sites for binocular integration?
6d
t9
Wz
I-
r-O
«
::Jw
u..a::
Alonso JM. 2002. Neural connections and receptive
field properties in the primary visual cortex.
Neuroscientist 8:443-456.
Callaway EM. 1998. Local circuits in primary visual
cortex of the macaque monkey. Annual Review of
Neuroscience 21 :47-74.
Courtney SM, Ungerleider LG. 1997. What fMRI has
taught us about human vision. Current Opinion in
Neurobiology 7:554-561.
Gegenfurtner KR. 2003. Cortical mechanisms of
colour vision. Nature Reviews Neuroscience
4:563-572.
Goodale MA, Westwood DA. 2004. An evolving view
of duplex vision: separate but interacting cortical
pathways for perception and action. Current Opin-
ion in Neurobiology 14:203-211.
Hendry SHC, Reid RC. 2000. The koniocellular
pathway in primate vision. Annual Review of
Neuroscience 23:127-153.
Paradiso MA. 2002. Perceptual and neuronal corre-
spondence in primary visual cortex. Current Opin-
ion in Neurobiology 12: 155-161.
Sherman SM, Guillery RW 2002. The role of the
thalamus in the flow of information to the cortex.
Philosophical Transactions of the Royal Society of
London B 357:1695-1708.
CHAPTER
The Auditory and
Vestibular Systems
INTRODUCTION
THE NATURE OF SOUND
. Box 11.1 Of Special Interest: Ultrasound and Infrasound
THE STRUCTURE OF THE AUDITORY SYSTEM
THE MIDDLE EAR
COMPONENTS OF THE MIDDLE EAR
SOUND FORCE AMPLIFICATION BY THE OSSICLES
THE ATTENUATION REFLEX
THE INNER EAR
ANATOMY OF THE COCHLEA
PHYSIOLOGY OF THE COCHLEA
The Response of the Basilar Membrane to Sound
The Organ of Corti and Associated Structures
. Box 11.2 Of Special [mereST: The Deaf Shall Hear: Cochlear Implants
Transduction by Hair Cells
. Box 11.3 Path of Discovery: From Sound to Sensation, by David P. Corey
The Innervation of Hair Cells
Amplification by Outer Hair Cells
. Box 11.4 Of Special Interest: Noisy Ears: Otoacoustic Emissions
CENTRAL AUDITORY PROCESSES
THE ANATOMY OF AUDITORY PATHWAYS
RESPONSE PROPERTIES OF NEURONS IN THE AUDITORY PATHWAY
ENCODING SOUND INTENSITY AND FREQUENCY
STIMULUS INTENSITY
STIMULUS FREQUENCY, TONOTOPY, AND PHASE LOCKING
Tonotopy
Phase Locking
MECHANISMS OF SOUND LOCALIZATION
LOCALIZATION OF SOUND IN THE HORIZONTAL PLANE
The Sensitivity of Binaural Neurons to Sound Location
LOCALIZATION OF SOUND IN THE VERTICAL PLANE
AUDITORY CORTEX
NEURONAL RESPONSE PROPERTIES
. Box 11.5 Of Special Interest: How Does Auditory Cortex Work? Consult a Specialist
THE EFFECTS OF AUDITORY CORTICAL LESIONS AND ABLATION
. Box 11.6 Of Special Interest: Auditory Disorders and Their Treatments
THE VESTIBULAR SYSTEM
THE VESTIBULAR LABYRINTH
THE OTOLITH ORGANS
THE SEMICIRCULAR CANALS
CENTRAL VESTIBULAR PATHWAYS AND VESTIBULAR REFLEXES
The Vestibulo-Ocular Reflex (VOR)
VESTIBULAR PATHOLOGY
CONCLUDING REMARKS
344 C HAP T E R I I . THE AUDITORY AND VESTIBULAR SYSTEMS
... INTRODUCTION
In this chapter, we explore two sensory systems that have very different
functions but surprising similarities of structure and mechanism: the sense
of hearing, also known as audition, and the sense of balance, regulated by
the vestibular system. Hearing is a vivid part of our conscious lives, while
balance is something we experience all day but rarely think about.
When we cannot see an object, we can often detect its presence, identify
its origin, and even receive a message from it just by hearing its sounds.
Anyone who has ever hiked through the forest in an area where there are
bears or snakes knows that the sound of rustling leaves can be a powerful
attention-grabber. Aside from the ability to detect and locate sound, we can
perceive and interpret its nuances. We can immediately distinguish the
bark of a dog, the voice of a particular friend, the crash of an ocean wave.
Because humans are able to produce a wide variety of sounds as well as
hear them, spoken language and its reception via the auditory system have
become an extremely important means of communication. Audition in
humans has even evolved beyond the strictly utilitarian functions of com-
munication and survival; musicians, for example, explore the sensations
and emotions evoked by sound.
In contrast to hearing, the sense of balance is strictly a personal, inter-
nalized process. The vestibular system informs our nervous system where
our head and body are and how they are moving. This information is used,
without conscious effort, to control muscular contractions that will put our
body where we want it to be, to reorient ourselves when something pushes
us aside, and to move our eyes so that our visual world stays fixed on our
retinas even when our head is bouncing around.
Here we explore the mechanisms within the ear and brain that translate
the sounds in our environment into meaningful neural signals and the
movements of our head into a sense of where we are. We will find that
these transformations are carried out in stages rather than all at once.
Within the inner ear, neural responses are generated by auditory receptors
from the mechanical energy in sound and by vestibular receptors from the
tilts and rotations of the head. At subsequent stages in the brain stem and
thalamus, signals from the receptors are integrated before they ultimately
reach auditory and vestibular cortex. By looking at the response proper-
ties of neurons at various points in the system, we will begin to understand
the relationship between neural activity and our perception of sound and
balance.
... THE NATURE OF SOUND
Sounds are audible variations in air pressure. Almost anything that can
move air molecules can generate a sound, including the vocal cords of the
human larynx, the vibration of a string on a guitar, and the explosion of a
firecracker. When an object moves toward a patch of air, it compresses the
air, increasing the density of the molecules. Conversely, the air is rarefied
(made less dense) when an object moves away. This is particularly easy to
visualize in the case of a stereo speaker, in which a paper cone attached to
a magnet vibrates in and out, alternately rarefying and compressing the air
(Figure 11.1). These changes in air pressure are transferred away from the
speaker at the speed of sound, which is about 343 m/sec (767 mph) for air
at room temperature.
Many sources of sound, such as vibrating strings or a stereo speaker
reproducing the sound of a stringed instrument, produce variations in air
pressure that are periodic. The frequency of the sound is the number of
... THE NATURE OF SOUND 345
Stereo
speaker Compressed air
-
-
() c \ \ , .', \.!/: r::}\:.:.. ,;...t?: !. ?J.}<i } : r
, . .j... ./{ :;' :" ..: : t! - //:\) jj;
.a". '\.........:......:.. -:... .... :........ ....:..... .........
Q)
:;
en
en
Q)
c..
One
cycle
Distance
FIGURE 11.1
The production of sound by variations in air pressure. When the paper cone of a
stereo speaker pushes out, It compresses the air; when the cone pulls in. it rarefies the air.
If the push and pull are periodic. there will also be a periodic variation in the air pressure.
as shown in the graph, The distance between successive compressed (high-pressure) patches
of air is one cycle of the sound (indicated by the vertical lines). The sound wave propagates
away from the speaker at the speed of sound The blue line is a graph of air pressure versus
distance.
compressed or rarefied patches of air that pass by our ears each second. One
cycle of the sound is the distance between successive compressed patches;
the sound frequency, expressed in units called hertz (Hz), is the number
of cycles per second. Because sound waves all propagate at the same speed,
high-frequency sound waves have more compressed and rarefied regions
packed into the same space than low-frequency waves (Figure 11.2a).
Our auditory system can respond to pressure waves over the remarkable
range of 20 Hz to 20,000 Hz (although this audible range decreases signif-
icantly with age and exposure to noise, especially at the high-frequency
Low frequency High frequency
!
(a)
Low intensity High intensity
!
(b)
Distance
Distance
FIGURE 11.2
The frequency and intensity of sound waves. (a) We perceive high-frequency waves
as having a higher pitch, (b) We perceive high-intensity waves as louder.
346 C HAP T E R I I . THE AUDITORY AND VESTIBULAR SYSTEMS
Box Il.I
.... , #-
...
..
OF SPECIAL INTEREST
Ultrasound and Infrasound-
Most people are familiar with ultrasound (sound above the
20 kHz limit of our hearing) because it has everyday ap-
plications, from ultrasonic cleaners to medical imaging.
Many animals can hear these high frequencies. For instance,
dog whistles work because dogs can hear up to about 40
kHz. Some bats vocalize at frequencies up to 100 kHz,
then listen to the echoes of their calls to locate objects
(see Box 11.5). Some fish in the shad and herring family
can detect sounds as high as 180 kHz, thereby enabling
them to hear the echo locating ultrasound generated by
dolphins that prey on them. Obviously, the dolphins can
hear their own ultrasonic calls. Similarly, nocturnal moths
listen for the ultrasound of hungry bats so they can evade
their predators.
Infrasound is sound at frequencies lower than humans
can hear, below about 20 Hz. Some animals can hear in-
frasonic frequencies; one is the elephant, which can detect
15 Hz tones at sound levels inaudible to humans. Whales
produce low-frequency sounds. which are thought to be
a means of communication over distances of many kilo-
meters. low-frequency vibrations are also produced by
the earth, and it is thought that some animals may sense
an impending earthquake by hearing such sound.
Even though we usually cannot hear very low frequencies
with our ears, they are present in the environment and
can have unpleasant subconscious effects. Infrasound is
produced by such devices as air conditioners, boilers, air-
craft, and automobiles. Though even intense infrasound
from these machines does not cause hearing loss, it can
cause dizziness, nausea, and headache. Many cars produce
low-frequency sound when they're moving at highway
speeds, making sensitive people carsick At very high levels,
low-frequency sound may also produce resonances in body
cavities such as the chest and stomach, which can damage
internal organs. You might want to think twice before
standing directly in front of a large speaker at a concert!
In addition to mechanical equipment, our own bodies
generate inaudible low-frequency sound. When muscle
changes length, individual fibers vibrate, producing low-
intensity sound at about 25 Hz. While we cannot normally
hear these sounds, you can demonstrate them to yourself
by carefully putting your thumbs in your ears and making
a fist with each hand. As you tighten your fist, you can
hear a low rumbling sound produced by the contraction
of your forearm muscles. Other muscles, including your
heart, produce inaudible sound at frequencies near 20 Hz.
It's probably just as well that we aren't more aware of
infrasound. It would be hard to get any work done if we
had to add the sounds of our bodies to the drone of
machinery.
end). Whether a sound is perceived to have a high or low tone, or pitch, is
determined by the frequency. To relate frequency to recognizable examples,
remember that a room-shaking low note on an organ is about 20 Hz and
an ear-piercing high note on a piccolo is about 10,000 Hz. Although hu-
mans can hear a great range of frequencies, there are high and low sound
wave frequencies our ears cannot hear, just as there are electromagnetic
waves of light our eyes cannot see (Box 11.1).
Another important property of a sound wave is its intensity, which is
the difference in pressure between compressed and rarefied patches of air
(Figure 11.2b). Sound intensity determines the loudness we perceive, loud
sounds having higher intensity. The range of intensities to which the human
ear is sensitive is astonishing: The intensity of the loudest sound that doesn't
damage our ears is about a trillion times greater than the intensity of the
faintest sound that can be heard. If our auditory system were any more
sensitive, we would hear a constant roar from the random movement of
air molecules.
Real-world sounds rarely consist of simple periodic sound waves at one
frequency and intensity. It is the simultaneous combination of different
frequency waves at different intensities that gives different musical instru-
ments and human voices their unique tonal qualities.
... THE STRUCTURE OF THE AUDITORY SYSTEM 347
.. THE STRUCTURE OF THE AUDITORY SYSTEM
Before exploring how variations in air pressure are translated into neural
activity, let's quickly survey the structure of the auditory system. The com-
ponents of the ear are shown in Figure 1l.3. The visible portion of the ear
consists primarily of cartilage covered by skin, forming a sort of funnel
called the pinna (from the Latin for "wing"), which helps collect sounds
from a wide area. The shape of the pinna makes us more sensitive to
sounds coming from ahead than from behind. The convolutions in the
pinna play a role in localizing sounds, something we discuss later in the
chapter. In humans, the pinna is more or less fixed in position, but ani-
mals such as cats and horses have considerable muscular control over the
position of their pinna and can orient it toward a source of sound.
The entrance to the internal ear is called the auditory canal, and it ex-
tends about 2.5 em (I inch) inside the skull before it ends at the tympanic
membrane, also known as the eardrum. Connected to the medial surface
of the tympanic membrane is a series of bones called ossicles (from the
Latin for "linle bones"; the ossides are indeed the smallest bones in the body).
Located in a small air':filled chamber, the ossicles transfer movements of the
tympanic membrane into movements of a second membrane covering a
hole in the bone of the skull called the oval window. Behind the oval
window is the fluid-filled cochlea, which contains the apparatus for trans-
forming the physical motion of the oval window membrane into a neuronal
response. Thus, the first stages of the basic auditory pathway look like this:
Sound wave moves the tympanic membrane --
Tympanic membrane moves the ossicles -
Ossicles move the membrane at the oval window -
Motion at the oval window moves fluid in the cochlea -
Movement of fluid in the cochlea causes a response in sensory
neurons.
Middle
I e
I ear
e ..
Inner
ear
-1
Outer
ear
,
Ossicles
' , \
" '4..",': ----: \
,"I ...t.r... r..
. "I :-....-, ......
p ;.!' .- ... - \ \.
\
Oval
window
\.....
"
'\
\ Auditory-
vestibular
nerve
Cochlea
.....'
. r-
/
Pinna
Auditory
canal
Tympanic
membrane
FIGURE 11.3
The outer, middle, and inner ear.
348 C HAP T E R I I . THE AUDITORY AND VESTIBULAR SYSTEMS
Visual cortex
LGN
Other retinal
ne ns
Photoreceptors
in eye
FIGURE 11.4
Auditory and visual pathways compared.
Following the sensory receptors, both systems
have early Integration stages, a thalamic relay.
and a projection to sensory cortex.
All the structures from the pinna inward are considered components of the
ear. and it is conventional to refer to the ear as having three main divisions.
The structures from the pinna to the tympanic membrane make up the
outer ear, the tympanic membrane and the ossicles constitute the middle
ear, and the apparatus medial to the oval window is the inner ear.
Once a neural response to sound is generated in the inner ear. the signal
is transferred to and processed by a series of nuclei in the brain stem. Out-
put from these nuclei is sent to a relay in the thalamus, the medial genic-
ulate nucleus (MGN). Finally, the MGN projects to primary auditory
cortex, or AI, located in the temporal lobe. In one sense, the auditory
pathway is more complex than the visual pathway because there are more
intermediate stages between the sensory receptors and cortex. However,
the systems have analogous components. Each starts with sensory receptors.
which connect to early integration stages (located in the retina for vision
and the brain stem for audition), then to a thalamic relay, and sensory cor-
tex (Figure 11.4).
T THE MIDDLE EAR
The outer ear funnels sound to the middle ear, an air-filled cavity contain-
ing the first elements that move in response to sound. In the middle ear.
variations in air pressure are converted into movements of the ossicles. In
this section, we explore how the middle ear performs an essential trans-
formation of sound energy.
Components of the Middle Ear
The structures within the middle ear are the tympanic membrane, the ossi-
cles, and two tiny muscles that attach to the ossicles. The tympanic mem-
brane is somewhat conical in shape, with the point of the cone extending
into the cavity of the middle ear. There are three ossicles, each named (from
the Latin) after an object it slightly resembles (Figure 11.5). The ossicle at-
tached to the tympanic membrane is the malleus ("hammer"), which
forms a rigid connection with the incus ("anvil"). The incus forms a flexi-
ble connection with the stapes ("stirrup"). The fiat bottom portion of the
stapes, the footplate, moves in and out like a piston at the oval window, thus
transmitting sound vibrations to the fluids of the cochlea in the inner ear.
The air in the middle ear is continuous with the air in the nasal cavities
via the Eustachian tube, although this tube is usually closed by a valve.
When you're in an ascending airplane or a car heading up a mountain, the
pressure of the surrounding air decreases. However, as long as the valve on
the Eustachian tube is closed, the air in the middle ear stays at the pres-
sure of the air before you started to climb. Because the pressure inside the
middle ear is higher than the air pressure outside, the tympanic membrane
bulges out, and you experience unpleasant pressure or pain in the ear. The
pain can be relieved by yawning or swallowing, either of which opens the
Eustachian tube, thereby equalizing the air pressure in the middle ear with
the ambient air pressure. The opposite can happen as you descend. The air
pressure outside is then higher than the pressure inside the middle ear, and
the discomfort you may feel can be relieved by opening the Eustachian
tube again.
Sound Force Amplification by the Ossicles
Sound waves move the tympanic membrane, and the ossicles move another
membrane at the oval window. Why isn't the ear arranged so that sound
Stapes
\
\ \' (
Malleus Incus
I,'
'\
,. .
. ..\, ...
I ...:. '"
\ \
/ '\
/ I \ r
.... .
r
0\\ \.. . ... c:
3
,
\
.'" '>..
... . .
"
\
'"
r" I
.. If';
-
., . t co-
. - "
..,
....
Auditory
canal
Tympanic
membrane
FIGURE 11.5
The middle ear. As the arrows indicate, when air pressure pushes the tympanic membrane.
the bottom of the malleus is pushed inward and the lever action of the ossicles makes the
footplate of the stapes push inward at the oval window. The pressure pushing at the oval
window is greater than that at the tympanic membrane. In part because the surface area of
the foot plate of the stapes is smaller than the surface area of the tympanic membrane.
waves simply directly move the membrane at the oval window? The
problem is that the cochlea is filled with fluid, not air. If sound waves im-
pinged directly on the oval window, the membrane would barely move,
and all but 0.1 % of the sound energy would be reflected because of the
pressure the cochlear fluid exerts at the back of the oval window. If you've
ever noticed how quiet it is under water, you know how well water reflects
sound coming from above. The fluid in the inner ear resists being moved
much more than air does (i.e., fluid has greater inertia), so more pressure
is needed to vibrate the fluid than the air can provide. The ossicles provide
this necessary amplification in pressure.
To understand the process, consider the definition of pressure. The
pressure on a membrane is defined as the force pushing it divided by its
surface area. The pressure at the oval window will become greater than the
pressure at the tympanic membrane if (1) the force on the oval window
membrane is greater than that on the tympanic membrane, or (2) the
surface area of the oval window is smaller than the area of the tympanic
membrane. The middle ear uses both mechanisms. It increases pressure at
the oval window by altering both the force and the surface area. The force
at the oval window is greater because the ossicles act like levers. Sound
causes large movements of the tympanic membrane, which are transformed
into smaller but stronger vibrations of the oval window. And the surface
area of the oval window is much smaller than that of the tympanic mem-
brane. These factors combine to make the pressure at the oval window
about 20 times greater than at the tympanic membrane, and this increase
is sufficient to move the fluid in the inner ear.
... THE MIDDLE EAR 349
Footplate of
stapes at
oval window
. / Cochlea
(
Iv"'"
Eustachian
tube
350 C HAP T E R I I . THE AUDITORY AND VESTIBULAR SYSTEMS
The Attenuation Reflex
Two muscles attached to the ossicles have a significant effect on sound
transmission to the inner ear. The tensor tympani muscle is anchored to bone
in the cavity of the middle ear at one end and attaches to the malleus at
the other end (Figure 11.6). The stapedius muscle also extends from a fixed
anchor of bone and attaches to the stapes. When these muscles contract,
the chain of ossicles becomes much more rigid, and sound conduction to
the inner ear is greatly diminished. The onset of a loud sound triggers a
neural response that causes these muscles to contract, a response called the
attenuation reflex. Sound attenuation is much greater at low frequencies
than at high frequencies.
A number of functions have been proposed for this reflex. One function
may be to adapt the ear to continuous sound at high intensities. Loud
sounds that would otherwise saturate the response of the receptors in the
inner ear could be reduced to a level below saturation by the attenuation
reflex, thus increasing the dynamic range we can hear. The attenuation re-
flex also protects the inner ear from loud sounds that would otherwise
damage it. Unfortunately, the reflex has a delay oJ 50-100 msec from the
time that sound reaches the ear, so it doesn't offer much protection from
very sudden loud sounds; damage might already be done by the time the
muscles contract. This is why, despite the best efforts of your attenuation
reflex, a loud explosion can still damage your cochlea. Because the atten-
uation reflex suppresses low frequencies more than high frequencies, it
tends to make high-frequency sounds easier to discern in an environment
with a lot of low-frequency noise. This capability enables us to understand
speech more easily in a noisy environment than we could without the reflex.
It is thought that the attenuation reflex is also activated when we speak, so
we don't hear our own voices as loudly as we otherwise would.
Ossicles
Labyrinth
Oval window
Tensor
tympani .... _ .
muscle . ,.._
III" . It
.
"
,
/
;
......... ).....
..
....
Tympanic
membrane
Stapedius
muscle
Round
window
Cochlea
FIGURE 11.6
The middle and inner ear. The stapedius muscle and the tensor tympani muscle are both
attached to the wall of the middle ear at one end and to the ossicles at the other ends
.... THE INNER EAR
Although considered part of the ear, not all of the inner ear is concerned
with hearing. The inner ear consists of the cochlea, which is part of the
auditory system, and the labyrinth, which is not. The labyrinth is an im-
portant part of the vestibular system, which helps maintain the body's equi-
librium. The vestibular system is discussed later in the chapter. Here we are
concerned only with the cochlea and the role it plays in transforming
sound into a neural signal.
Anatomy of the Cochlea
The cochlea (from the Latin for "snail") has a spiral shape resembling a
snail's shell. Figure 11.6 shows the cochlea cut in half. The structure of the
cochlea is similar to a drinking straw wrapped two and a half times around
the sharpened tip of a penctl. In the cochlea, the hollow tube (represented
by the straw) has walls made of bone. The central pillar of the cochlea (rep-
resented by the pencil) is a conical bony structure called the modiolus. The
actual dimensions are much smaller than the straw-and-penctI model, the
cochlea's hollow tube being about 32 mm long and 2 mm in diameter.
Rolled up, the human cochlea is about the size of a pea. At the base of the
cochlea are two membrane-covered holes: the oval window, which is below
the footplate of the stapes, as we have seen, and the round window.
If the cochlea is cut in cross section, we can see that the tube is divided
into three fluid-filled chambers: the scala vestibuli, the scala media, and
the scala tympani (Figure 11.7). The three scalae wrap around inside
the cochlea like a spiral staircase (scala is from the Latin for "stairway").
Reissner's membrane separates the scala vestibuli from the scala media,
and the basilar membrane separates the scala tympani from the scala
media. Sitting on the basilar membrane is the organ of Corti, which con-
tains auditory receptor neurons; hanging over this organ is the tectorial
membrane. At the apex of the cochlea, the scala media is closed off, and
the scala tympani becomes continuous with the scala vestibuli at a hole in
the membranes called the helicotrema (Figure 11.8). At the base of the
..\- - ..
..
. .
Reissner's
membrnne"
Tectorial
':":':f membrane
(' --
.
. .... Stria vascularis
----
"
..I't _
.... .... . ,..
. :t -
0""," of Com ---- )
Basilar
membrane
fI1'" .
P'
,I
...
-
FIGURE 11.7
The three scalae of the cochlea. Viewed in cross section. the cochlea contains three
small parallel chambers. These chambers. the scalae. are separated by Reissner's membrane
and the basilar membrane. The organ of Corti contains the auditory receptors; it sits on the
basilar membrane and is covered by the tectonal membrane.
.. THE INNER EAR 35 I
/' Scala vestibuli
"
Scala media
Scala tympani
352 C HAP T E R I I . THE AUDITORY AND VESTIBULAR SYSTEMS
Uncoiled
cochlea
Apex
Base
.....
Stapes
"
':-0
____. '_ Helicotrema
\. Scala vestibuli
/ --- \ Basilar membrane
Round window Scala tympani
FIGURE 11.8
The basilar membrane in an uncoiled cochlea. Although the cochlea narrows
from base to apex, the basilar membrane widens toward the apex. Notice that the basilar
membrane is the narrow blue band only. The helicotrema is a hole at the apex of the basilar
membrane, which connects the scala vestibuli and scala tympani.
cochlea, the scala vestibuli meets the oval window and the scala tympani
meets the round window.
The fluid in the scala vestibuli and scala tympani, called perilymph,
has an ionic content similar to that of cerebrospinal fluid: low K+ (7 mM)
and high Na+ (140 mM) concentrations. The scala media is filled with
endolymph, which is an unusual extracellular fluid in that it has ionic
concentrations similar to intracellular fluid, high K+ (150 mM) and low
Na+ (1 mM). This difference in ion content is generated by active transport
processes taking place at the stria vascularis, the endothelium lining one wall
of the scala media (see Figure 11.7). The stria vascularis reabsorbs sodium
and secretes potassium against their concentration gradients. Because of
the ionic concentration differences and the permeability of Reissner's
membrane, the endolymph has an electrical potential that is about 80 mV
more positive than that of the perilymph; this is called the endocochlear
potential. We shall see that the endocochlear potential is important because
it enhances auditory transduction.
Physiology of the Cochlea
The structure of the cochlea is complex, but its basic operation is fairly
simple. Look at Figure 11.8, and imagine what happens when the ossicles
move the membrane that covers the oval window. They work like a tiny
piston. Inward motion at the oval window pushes perilymph into the scala
vestibuli. If the membranes inside the cochlea were completely rigid, then
... THE INNER EAR 353
the increase in fluid pressure at the oval window would reach up the scala
vestibuli, through the helicotrema, and back down the scala tympani to the
round window. Because the fluid pressure has nowhere else to escape, the
membrane at the round window would bulge out in response to the inward
movement of the membrane at the oval window. Any motion at the oval
window must be accompanied by a complementary motion at the round
window. Such movement must occur because the cochlea is filled with
incompressible fluid held in a solid bony container. The consequence of
pushing in at the oval window is a bit like pushing in one end of a tubular
water balloon-the other end has to bulge out.
This simple description of the events in the cochlea is complicated by one
additional fact: Some structures inside the cochlea are not rigid. Most impor-
tantly, the basilar membrane is flexible and bends in response to sound.
The Response of the Basilar Membrane to Sound. The basilar mem-
brane has two structural properties that determine the way it responds to
sound. First. the membrane is wider at the apex than at the base by a factor
of about 5. Second, the stiffness of the membrane decreases from base to
apex, the base being about 100 times stiffer. Think of it as a flipper of the
sort used for swimming, with a narrow, stiff base and a wide, floppy apex.
When sound pushes the footplate of the stapes at the oval window, peri-
lymph is displaced within the scala vestibuli, and endolymph is displaced
within the scala media because Reissner's membrane is very flexible. Sound
can also pull the footplate, reversing the pressure gradient. Sound causes a
continual push-pull motion of the footplate; again, think of a tiny piston.
We owe much of our understanding of the response of the basilar
membrane to the research of Hungarian-American biophysicist Georg von
Bekesy. Von Bekesy determined that the movement of the endolymph
makes the basilar membrane bend near its base, starting a wave that prop-
agates toward the apex. The wave that travels up the basilar membrane is
similar to the wave that runs along a rope if you hold one end in your hand
and give it a snap (Figure 11.9). The distance the wave travels up the basilar
membrane depends on the frequency of the sound. If the frequency is high,
the stiffer base of the membrane will vibrate a good deal. dissipating most
of the energy, and the wave will not propagate very far (Figure lI.IOa).
However, low-frequency sounds generate waves that travel all the way up
to the floppy apex of the membrane before most of the energy is dissipated
(Figure 10. lOb). The response of the basilar membrane establishes a place
code in which different locations of membrane are maximally deformed at
Perilymph
o
,.,.- \\
'J ')'I!.
Basilar membrane
- I
_J
--I
=--
Helicotrema
FIGURE 11.9
A traveling wave in the basilar membrane. As the stapes moves in and out, It causes
perilymph to flow. as shown by the arrows. This generates a traveling wave in the basilar
membrane. (The size of the wave is magnified about I million times In this illustration.) At
this frequency. 3000 Hz. the fluid and membrane movement end abruptly about halfway be-
tween the base and the apex. Note that the scala media is not illustrated here. (Source:
Adapted from NObili, Mammano, and Ashmore, 1998. Fig. I.)
354 C HAP T E R I I . THE AUDITORY AND VESTIBULAR SYSTEMS
FIGURE 11.10
The response of the basilar membrane
to sound. The cochlea is again shown un-
coiled. (a) High-frequency sound produces
a traveling wave, which dissipates near the
narrow and stiff base of the basilar mem-
brane. (b) Low-frequency sound produces a
wave that propagates all the way to the apex
of the basilar membrane before dissipating.
(The flexing of the basilar membrane is greatly
exaggerated for the purpose of this illustra-
tion.) (c) There is a place code on the basilar
membrane for the frequency that produces
the maximum amplitude deflection.
500 Hz
16 kHz
Base: narrow
and stiff
(a) High frequency
(b) Low frequency
(c) Frequency producing
maximum amplitude
different sound frequencies (Figure 1 L lOc). As we shall see, the differences
in the traveling waves produced by different sound frequencies are respon-
sible for the neural coding of pitch.
The Organ of Corti and Associated Structures. Everything we have
discussed to this point involves the mechanical transformations of sound
energy that occur in the middle and inner ear. Now we come to the point
in the system where neurons are first involved. The auditory receptor cells,
which convert mechanical energy into a change in membrane polarization,
are located in the organ of Corti (named for the Italian anatomist who first
identified it). The organ of Corti consists of hair cells, the rods of Corti, and
various supporting cells.
The auditory receptors are called hair cells because each one has about
100 hairy-looking stereocilia extending from its top. The hair cells and
stereocilia are shown in Figure 11.11 as they appear when viewed with a
scanning electron microscope. The critical event in the transduction of
sound into a neural signal is the bending of these cilia. For this reason, we
want to examine the organ of Corti in more detail to see how flexing of
the basilar membrane leads to bending of the stereocilia.
The hair cells are sandwiched between the basilar membrane and a thin
sheet of tissue called the reticular lamina (Figure 1 L 12). The rods of Corti
span these two membranes and provide structural support. Hair cells be-
tween the modiolus and the rods of Corti are caBed inner hair cells (about
3500 form a single row), and cells farther out than the rods of Corti are
called outer hair cells (in humans, there are about 15,000-20,000 arranged
in three rows). The stereocilia at the tops of the hair cells extend above the
reticular lamina into the endolymph, and their tips end either in the gelat-
inous substance of the tectorial membrane (the outer hair cells) or just
below the tectorial membrane (the inner hair cells). To keep the mem-
branes within the organ of Corti straight in your mind, remember that the
basilar is at the base of the organ of Corti, the tectorial forms a roof over the
structure, and the reticular is in the middle, holding onto the hair cells.
Hair cells form synapses on neurons whose cell bodies are located in
the spiral ganglion within the modiolus. Spiral ganglion cells are bipolar,
with neurites extending to the bases and sides of the hair cells, where
they receive synaptic input. Axons from the spiral ganglion enter the audi-
tory nerve, a branch of the auditory-vestibular nerve (cranial nerve
VIII), which projects to the cochlear nuclei in the medulla. It is possible
to treat certain forms of deafness by using electronic devices to bypass
... THE INNER EAR 355
Outer hair 41
cell ___
.......
'\
FIGURE 11.11
Hair cells viewed through the scanning
electron microscope. (a) Hair cells and
their stereocilia. (b) A higher-resolution view
of the stereocilia on an outer hair cell. The
stereocilia are approximately 5 !-1m in length
(Source: Courtesy of I. Hunter-Duvar and
R. Harrison, The Hospital for Sick Children,
Toronto, Ontario, Canada.)
Reticular
lamina
------
L
Stereocilia of (a) /
outer hair cells
\
:\
Stereocilia of
inner hair cells
..
\
\
"
'.
oj
(b)
7---
Tectorial
membrane R . I
S.."",,;I;, I _ la ar
Outer hair \ / -
cell .
,
. .,
.'
, " ,
Modiolus
.
.
, . .
/ V / ... ,
SPiral ganglion
Basilar Rods of Inner hair
membrane Corti cell Auditory nerve
FIGURE 11.12
The organ of Corti. The basilar membrane supports tissue that includes the inner and
outer hair cells and the stiff rods of Corti. The tectorial membrane extends from the bony
modiolus to cover the stereoCilia that protrude from the tops of the haw cells.
356 C HAP T E R I I . THE AUDITORY AND VESTIBULAR SYSTEMS
the middle ear and the hair cells and activate the auditory nerve axons
directly (Box 11.2).
Transduction by Hair Cells. When the basilar membrane moves in re-
sponse to a motion at the stapes, the entire foundation supporting the hair
cells moves because the basilar membrane, rods of Corti, reticular lamina,
and hair cells are all rigidly connected. These structures move as a unit,
pivoting up toward the tectorial membrane or away from it. When the basi-
lar membrane moves up, the reticular lamina moves up and in toward the
modiolus. Conversely, downward motion of the basilar membrane causes
the reticular lamina to move down and away from the modiolus. When the
reticular lamina moves inward or outward relative to the modiolus, it also
moves in or out with respect to the tectorial membrane. Because the tec-
torial membrane holds the tips of the outer hair cell stereocilia, the lateral
motion of the reticular lamina relative to the tectorial membrane bends the
stereocilia on the outer hair cells one way or the other (Figure 11.13). The
tips of stereocilia from inner hair cells are also bent, probably because they
are pushed by moving endolymph. Aligned actin filaments make stereocilia
Box 11.2
.. 1 .
OF SPECIAL INTEREST
....
..
IRa The Deaf Shall Hear: Cochlear Implants
Hair cell damage or death is the most common cause of
human deafness (see Box 11.6). In most cases, the auditory
nerve remains intact, making it possible to restore some
hearing with a eochleor implont-essentially an artificial, elec-
tronic cochlea. The roots of this technology can be traced
back 2 centuries, to the pioneering work of the Italian physi-
cist Allesandro Yolta (after whom the electrical unit called
the volt was named). In 1800, shortly after he invented the
battery, Yolta gamely (some might say foolishly) inserted the
two contacts from a 50-volt battery into his ears. Here's
how he described the result:
At the moment when the circuit was comp!eted, I re-
ceived a shock in the head, and some moments after I
began to hear a sound, or rather noise in the ears, which
I cannot well define: it was a kind of crackling with
shocks, as if some paste or tenacious matter had been
boiling. . . . The disagreeable sensation, which I believe
might be dangerous because of the shock in the brain,
prevented me from repeating this experiment. . . . I
We strongly advise you not to try this at home.
The art of electrically stimulating the ears has improved
considerably since Yolta's singular experiment. In fact. in
recent years, cochlear implant systems have revolutionized
the treatment of inner ear damage for many people. Most
of the system is actually external to the body (Figure A). It
IQuoted in Zeng F-G. 2004. Trends in cochlear implants. Trends in
Amplificotion. 8: 1-34.
starts with a headpiece containing a microphone, which
receives sound and converts it to an electrical signal. This
signal is sent to a battery-powered digital processor. A small
radio transmitter placed over the scalp transmits the digital
code to a receiver that has been surgically implanted be-
neath the skin, in the mastoid bone behind the ear. The
transmitter and receiver are held close to one another with
magnets, and no wires penetrate the skin.
The receiver translates the code into a series of electri-
cal impulses that it sends to the cochlear implant itself-a
very thin, flexible bundle of wires that has been threaded
through a tiny hole and into the cochlea (Figure B). The
cochlear electrode array has 8-22 separate stimulation sites
that allow it to activate the auditory nerve at various places
along the cochlea, from the base toward the apex. The most
clever feature of the cochlear implant is that it can take
advantage of the tonotopic arrangement of auditory nerve
fibers; stimulation near the base of the cochlea evokes a
perception of high-frequency sounds, and stimulation toward
the apex evokes low-frequency sounds.
By 2004, there were more than 60,000 cochlear implant
users in the wodd, including about 20,000 children, and the
popularity of the devices is rapidly increasing. Unfortunately,
they are very expensive.
Coch ear implants can provide an extraordinary hearing
capacity for many previously deaf people. With training.
people can achieve a remarkably good understanding of
conversational speech, even when listening on a telephone.
The success of the implants varies widely. for reasons that
Tectonal
membrane
Modiolus
Reticular
lamina ___
St"- if
T-
Outer hair Basilar Rods of Inner hair
cells membrane Corti cell
(a)
... THE INNER EAR 357
Stereocilia
bending out
\
-4.
-y
I ,\
--/
1
___n __________
(b)
Basilar membrane
deflected up
FIGURE 11.13
The bending of stereocilia produced by the upward motion of the basilar
membrane. (a) At rest. the hair cells are held between the reticular lamina and the basilar
membrane. and the tips of the outer hair cell stereocilia are attached to the tectorial mem-
brane. (b) When sound causes the basilar membrane to deflect upward, the reticular lamina
moves up and inward toward the modiolus, causing the stereocilia to bend outward.
I
are often unclear. Researchers are working hard to improve
the technology of cochlear implants, to reduce their size, and
to determine the best ways to train patients in their use.
Young children are usually the best candidates for cochlear
implants (they are approved for use in children as young as
I year of age), as well as older children or adults whose deaf-
neSS was acquired after they learned some speech. For adults
whose deafness preceded any experience with speech, on
the other hand, cochlear implants seem to provide only a
crude perception of sounds. It seems that the auditory sys-
tem, like other sensory systems in the brain, needs to expe-
rience normal inputs at a young age in order to develop
properly. If it is deprived of exposure to sounds early in Hfe,
the auditory system can never develop completely normal
function even if hearing is restored later. The concept of crit-
ical periods in brain development is described in Chapter 23.
.
Transmitting coil ______
Processor
FIGURE A
The headpiece of a cochlear implant, positioned behind
the ear.
________ Receiver and
---<: stimulator
Wire to cochlear
electrode array
/
/
/
, -...._-
. '-
a f"dho OON'
-/
..., a,.-
"., .
---......
Cochlea
<' '
;'
Round window
\
Electrode array
FIGURE B
A cochlear implant In place inside the ear.
358 C H A PT E R I I . THE AUDITORY AND VESTIBULAR SYSTEMS
4
:> 3
.s
<U 2
OJ
<5 1
C-
O
a. 0
OJ
U
OJ
a: -1
-20 -10 0 10 20
(a) Displacement of cilia (nm)
-
Time
(b)
FIGURE I 1.14
Hair cell receptor potentials. (a) The
hair cell depolarizes or hyperpolanzes. depend-
ing on the direction in which the stereocilia
bend. (b) The hair cell receptor potential
closely follows the air pressure changes during
a low-frequency sound.
rigid rods, and they bend only at the base, where they attach to the top of
the hair cell. Cross-link filaments make the stereocilia stick to one another,
so all the cilia move as a unit. Now imagine a sound wave making the basi-
lar membrane jiggle between the two positions shown in Figure 11.13, and
it will be clear how the hair cell cilia are bent back and forth by the tecto-
rial membrane.
Determining how hair cells convert the bending of stereocilia into neural
signals was a very difficult problem. Because the cochlea is encased in bone,
it is difficult to record from the hair cells. In the 1980s, A. J. Hudspeth and
his colleagues, then at the California Institute of Technology, pioneered a
new approach in which hair cells are isolated from the inner ear and stud-
ied in vitro. The in vitro technique has revealed much about the transduc-
tion mechanism. Recordings from hair cells indicate that when the stere-
ocilia bend in one direction, the hair cell depolarizes, and when they bend
in the other direction, the cell hyperpolarizes (Figure II .14a). When a
sound wave causes the stereocilia to bend back and fonh, the hair cell gen-
erates a receptor potential that alternately hyperpolarizes and depolarizes
from the resting potential of -70 mV (Figure 11.14b).
To appreciate just how efficiently the ear works, take a moment to notice
the scale on the X axis of Figure 11.14a. Its unit is nm; recall that 1 nm
equals 10- 9 m. The graph shows that the receptor potential of the hair cell
is saturated by the time the tips of its stereocilia have moved about 20 nm
to the side; this is what an extremely loud sound might do. But the softest
sound you can hear moves the stereocilia only 0.3 nm to each side, which
is an astoundingly small distance-about the diameter of a large atom!
Since each stereocilium is about 500 nm (or 0.5 llm) in diameter, a very
soft sound needs to wiggle the stereocilia only about 1/ I 000 of their diam-
eter to produce perceptible noise. How does the hair cell transduce such in-
finitesimally small amounts of sound energy?
Recent experiments revealed that there is a special type of cation chan-
neL the TRPAI channel, on the tips of the stereocilia (Box] 1.3). TRPAI
channels are a member of the transient receptor potential (TRP) family of
ion channels. Other types of TRP channels play critical roles in taste cells
and in the somatic sensory nerve endings that sense hot and cold (see
Chapters 8 and 12). It is likely that TRPAI channels are induced to open
and close by the bending of stereocilia, thereby generating changes in the
hair cell receptor potential. Figure 11.15 shows how these channels are be-
lieved to function. Each channel is connected by an elastic filament. called
a tip link, to the wall of the adjacent cilium. When the cilia are straight, the
tension on the tip link holds the channel in a partially opened state, al-
lowing a small leak of K+ from the endolymph into the hair cell. Displace-
ment of the cilia in one direction increases tension on the tip link, in-
creasing the inward K+ current. Displacement in the opposite direction
relieves tension on the tip link, thereby allowing the channel to close com-
pletely, preventing inward K+ movement. The entry of K+ into the hair cell
causes a depolarization, which in turn activates voltage-gated calcium chan-
nels (Figure 11.15b). The entry of Ca 2 + triggers the release of neurotrans-
mitter, probably glutamate, which activates the spiral ganglion fibers lying
postsynaptic to the hair cell.
It is interesting that the opening of K+ channels produces a depolariza-
tion in the hair cell, whereas the opening of K+ channels hyperpolarizes
most neurons. The reason that hair cells respond differently than neurons
is the unusually high K+ concentration in endolymph, which yields a K+
equiJibrium potential of 0 mY, compared to the equilibrium potential of
-80 mV in typical neurons. Another reason that K+ is driven into hair cells
Mechanically gated
TRPA1 channel
K+ .. /
K ,,"K+ A
K+ 7)
K+ K+ ,t:;::j:'
K+ 1 'r I'
ti '
......
Stereocilia
Endolymph
K+
Reticular
lamina
TIPnnk +l
r
-,
/Inner hair
cell
Vesicle filled
with excitatory
neurotransmitter
K+
1
Spiral ganglion
neurite
Perilymph
01(
...
(b)
,
1: 1
FIGURE 11.15
Depolarization of a hair cell. (a) Ion channels
called TRPA I channels on stereocilia tips are opened
when the tip links Joining the stereocilia are stretched.
(b) The entry of K+ depolarizes the hair cell. which
opens voltage-gated calcium channels. Incoming Ca H
leads to the release of neurotransmitter from synaptic
vesicles. which then diffuses to the postsynaptic neurite
from the spiral ganglion.
{J,\
(a)
is the 80 mV endocochlear potential, which helps create a 125 mV gradi-
ent across the stereocilia membranes.
The Innervation of Hair Cells. The auditory nerve consists of the axons
of neurons whose cell bodies are located in the spiral ganglion. Thus, the
spiral ganglion neurons, which are the first in the auditory pathway to fire
action potentials, provide all the auditory information sent to the brain.
Curiously, there is a significant difference in the spiral ganglion innervation
of the inner and outer hair cells. The number of neurons in the spiral
ganglion is estimated to be in the range of 35,000-50,000. Despite the fact
that inner hair cells are outnumbered by outer hair cells by a factor of 3 to
1, more than 95% of the spiral ganglion neurons communicate with the
relatively small number of inner hair cells, and less than 5% receive synap-
tic input from the more numerous outer hair cells (Figure 11.16). Conse-
quently, one spiral ganglion fiber receives input from only one inner hair
cell; moreover, each inner hair cell feeds about 10 spiral ganglion neurites.
.,. THE INNER EAR 359
Outer hair
cells
Spiral
} ganglion
cells
Auditory
nerve
FIGURE 11.16
The innervation of hair cells by
neurons from the spiral ganglion.
360 C HAP T E R I I . THE AUDITORY AND VESTIBULAR SYSTEMS
PATH OF DISCOVERY
Box B.3 it
t
From Sound
to Sensation
I always expected to be a physicist, and studied physics
and electronics-but no biology-all through college.
Physics has an elegant simplicity that I found very appeal-
ing, and I admired its power to describe a complex phe-
nomenon with a few equations. It was only in my senior
year, when Amherst College hired the biophysicist Stephen
George to start a new undergraduate major in neuro-
science, that I realized physics might hope to describe
some complex phenomena in neurons.
Too late to apply to graduate schools in neuroscience,
I was fortunate to land a technician job with Ann Stuart
in the Neurobiology Department at Harvard Medical
School. It was an exciting intellectual environment.
Founded by Steve Kuffter, the department in the 1970s
held Kuffter's conviction that a complete understanding of
the nervous system would come only from a multidisci-
pi,i nary approach that combined biophysical, structural,
and molecular approaches. Also working in Ann's labora-
tory, and also holding this conviction, was Jim Hudspeth.
When Jim went to the California Institute of Technology
in 1975 to start his own lab and study hair cells, I followed
as his first graduate student.
At that time, tremendous progress in hearing research
had been made by scientists such as Georg von Bekesy,
who had been trained as electrical engineers and had
studied the cochlea as a whole organ. Hudspeth realized
that little was known about hair cells and that many com-
pelling questions could be asked about sensory transduc-
tion by studying hair cells individually. The first question,
"How does a hair cell respond to deflection of its stere-
ocilia?," was quickly answered when we observed a de-
polarization and an increase in membrane conductance
upon excitatory deflection and found that it corresponded
to the opening of nonselective ion channel,s. Hudspeth
also answered a structural question, when he found that
these channels were located in the tips of stereocilia. An-
other then followed: "How does mechanical stimulation
open ion channels?" I was at least smart enough to rec-
ognize a good question, and pursued it as a student and
later for most of my scientific career.
The answers are simultaneously biophysical, structural,
and molecular. First, by making very fast mechanical stim-
ulators, we found that the hair cell transduction channels
opened in miuoseconds and opened faster for larger
stimuli. A simple mechanical theory, involving a hypothet-
ical "gating spring" attached to a channel and stretched by
by David P Corey
stereocilia deflection, could account for the opening. Impor-
tantly, this theory assumed that the channel is itself
mechanosensitive--that it is directly opened by force. Jim
Hudspeth and Joe Howard confirmed this in 1988 with
extraordinarily sensitive mechanical measurements that
revealed the nanometer-scale movement associated with
channel opening.
Second,Jim Pickles, then at the University of Birmingham,
discovered in 1984 that the tips of stereocilia are connected
by very fine filaments called tip links, aligned along the
sensitive bundle axis. He immediately suggested how exci-
tatory deflection could stretch the links and pull on chan-
nels at the stereocilia tips. The importance of the tip links
was confirmed when we found that removing extracellular
Ca 2 + broke both the links and mechanosensitivity in sec-
onds. While the initial theory proposed that the tip links
were the structural equivalent of the biophysical gating
spring, recent work by Bechara Kachar and Peter Gillespie
has indicated that they are actually stiff and that the elastic
gating springs are somewhere inside the stereocilia.
The most difficult question has been, "What is the mo-
lecular basis for transduction?" A hair cell might have but a
few hundred transduction channels, precluding biochemical
purification.We guessed that the transduction channel might
be a member of the TRP family of ion channels, many of
which are involved in sensory transduction, some specifi-
cally in mechanical sensation. A genome screen identified all
33 TRP genes in the mouse, and we tested each TRP chan-
nel type to see which ones are made in hair cells. A few,
including one called TRPA I, appear to be. More work
showed that TRPA I protein is at the tips of stereocilia and
that TRPA I is needed for hair cell transduction. A unique
feature of the TRPA I architecture is a long chain of ankyrin
repeatsc---each composed of 33 amino acids-leading up to
the channel part. This feature occurs in only one other TRP
channel, TRPN I, which has also been implicated in mechan-
otransduction. Molecular dynamics simulations with Marcos
Sotomayor and Klaus Schulten at the University of Illinois
showed that these repeats coil spontaneously into a spring-
like shape and are rather elastic. Perhaps one part of TRPA I
forms the gating spring and another forms the channel.
Much work remains to be done in testing the involve-
ment of TRPA I in hair cell transduction; it is stilt just a
candidate. If it is confirmed, we will have many more
provocative questions to ask about the structure and bio-
physics of this molecule.
The situation is the opposite with outer hair cells. Because they outnumber
their spiral gangJion ceUs, one spiral gangJion fiber synapses with numerous
outer hair cells.
Simply based on these numbers, we can infer that the vast majority of
the information leaving the cochlea comes from inner hair cells. If that's
true, what are the outer hair cells for?
Amplification by Outer Hair Cells. Given that outer hair cells far out-
number inner hair cells, it seems paradoxical that most of the cochlear
output is derived from inner hair cells. However. ongoing research suggests
that outer hair cells playa very important role in sound transduction. Iron-
ically, one clue to the nature of this role was the discovery that the ear not
only transduces sound; it can create it. too (Box 11.4).
Outer hair cells seem to act like tiny motors that amplify the movement
of the basilar membrane during low-intensity sound stimuli. Because of
this action, the outer hair cells on the basilar membrane are referred to as
the cochlear amplifier. The keys to this function are motor proteins, found
in the membranes of outer hair cells (Figure 11.17a). Motor proteins can
change the length of outer hair cells, and it has been found that outer hair
cells respond to sound with both a receptor potential and a change in
length (Figure 11.17b). The motor proteins do not resemble any other sys-
tem of cellular movement. The hair cells' motor is driven by the receptor
potential, and it does not use ATP as an energy source. It is also extremely
fast. as it must be able to keep up with the movements induced by high-
frequency sounds. The hair cell's motor may be a protein called prestin
Motor proteins
(expanded)
Tectorial membrane
y
I Reticular lamina
Motor proteins
(compressed)
::::r--- Basilar membrane
(a)
(b)
"
Normal response
(with cochlear amplifier)
Basilar membrane
(c) Base
Response during
furosemide treatment
(without cochlear amplifier)
,
,
Basilar membrane
(d) Base
T THE INNER EAR 361
FIGURE 11.17
Amplification by outer hair cells.
(a) Motor proteins in the membranes of
outer hair cells. (b) Bending of the stereocilia
causes potassium to enter the hair cell,
depolarizing it, and triggering motor proteins
to activate and shorten the hair cell. (c) The
shortening and lengthening of the hair cell
increase the flexing of the basilar membrane.
(d) Furosemide decreases hair cell transduc-
tion, consequently reducing the flexing of the
basilar membrane. (Source: Adapted from
Ashmore and Kolston, 1994, Figs. 2, 3.)
362 C H A PT E R I I . THE AUDITORY AND VESTI BULAR SYSTEMS
Box 11.4
.... '
OF SPECIAL INTEREST
y
II
Noisy Ears: Otoacoustic Emissions
Sensory systems are supposed to detect stimulus energy
in the environment, not generate it. Can you imagine eyes
glowing in the dark, or noses smelling like roses? How
about ears buzzing loudly? The truth is that retinas don't
radiate light, and olfactory receptors don't emit odors.
but some ears can definitely generate sounds loud enough
for a bystander to hear! Such sounds are called otoacoustic
emissions. In one early description. a man sitting next to
his dog realized the animal was humming; after some
anxious investigation, he discovered that the sound came
from one of the dog's ears.
The ears of all vertebrates, including humans, can emit
sounds. Presenting a short sound stimulus, such as a
click. to a normal human ear causes an "echo" that can
be picked up with a sensitive microphone in the audi-
tory canal. We don't usually notice such echoes because
they are too faint to be heard over other sounds in the
environment.
Ears that emit relatively loud sounds spontaneously, in
the absence of any incoming sound, have usually sustained
cochlear damage as the result of exposure to extremely
loud sounds (from explosions, machines, rock bands),
drugs, or disease. If spontaneous otoacoustic emissions
are loud enough, they may cause one form of tinnitus-
ringing in the ears (see Box 11.6).
The mechanism that causes the ear to generate its own
sounds-the cochlear amplifier-is the same one that
functions to improve its detection of environmental sounds,
but operating in reverse. Normal outer hair cells, stimu-
lated with a click, react with a quick movement that drives
the cochlear fluids and membranes, which move the ossi-
cles, and ultimately vibrate the tympanic membrane to
produce sound in the outside air (the echo). Spontaneous
emissions occur because the sensitivity of the cochlear
amplifier is very high. Most people with normal hearing
can perceive them in an exceptionally quiet environment.
Damaged regions of the cochlea can somehow facilitate
the spontaneous movement of some outer hair cells, so
that they vibrate all the time. Strangely enough, most
people are unaware that their ears are broadcasting sounds.
Apparently, their central auditory neurons recognize the
spontaneous cochlear activity as noise and suppress the
perception of it. The benefit is that they are spared from
an otherwise maddening tinnitus. but the cost is a partial
hearing loss in the affected frequency range.
Because otoacoustic emissions are a normal attribute
of ears, they can be used as a quick and easy test of their
function. A series of sounds is played into the ears, and
the echoes they evoke are recorded and analyzed. The
characteristics of the echoes can tell us a lot about the
function of the middle and inner ears. This is especially
useful for testing people who are unable to tell the ex-
aminer whether or not they have heard test sounds-
newborn babies. for example.
(from the musical notation "presto," meaning fast). Prestin is tightly packed
into the membranes of the outer hair cells, and it is required for outer hair
cells to move in response to sound.
Because outer hair cells are attached to the basilar membrane and retic-
ular lamina, when motor proteins change the length of the hair celL the
basilar membrane is pulled toward or pushed away from the reticular lam-
ina and tectorial membrane. This is why the word "motor" is used-the
ourer hair cells actively change the physical relationship between the
cochlear membranes.
The motor effect of ourer hair cells makes a significant contribution to
the traveling wave that propagates down the basilar membrane. This was
demonstrated in ] 991 by Mario Ruggero and Nola Rich at the University of
Minnesota, who administered the chemical furosemide into experimental
animals. Furosemide temporarily decreases the transduction that normally
results from the bending of stereocilia on hair cells, and it was found to
significantly reduce [he movement of the basilar membrane in response to
sound (Figure 1].] 7c, d). This effect of furosemide is believed to result from
inactivation of the outer hair cell motor proteins and loss of the cochlear
amplifier. When the outer hair cells amplify the response of the basilar
membrane, the stereocilia on the inner hair cells will bend more, and the
increased transduction process in the inner hair cells will produce a greater
response in the auditory nerve. Through this feedback system, therefore,
outer hair cells contribute significantly to the output of the cochlea. With-
out the cochlear amplifier, the peak movement of the basilar membrane
would be about IOO-fold smaller.
The effect of outer hair cells on the response of inner hair cells can be
modified by neurons outside the cochlea. In addition to the spiral ganglion
afferents that project from the cochlea to the brain stem, there also are
about 1000 efferent fibers projecting from the brain stem toward the cochlea.
These efferents diverge widely, synapsing onto outer hair cells and releas-
ing acetylcholine. Stimulation of these efferents changes the shape of the
outer hair cells, thereby affecting the responses of inner hair cells. In this
way, descending input from the brain to the cochlea can regulate auditory
sensitivity.
The amplifying effect of outer hair cells explains how certain antibiotics
(e.g., kanamycin) that damage hair cells can lead to deafness. After exces-
sive exposure to antibiotics, the responses to sound of many inner hair cells
are reduced. However, the antibiotic almost exclusively damages outer hair
cells, not inner hair cells. For this reason, deafness produced by antibiotics
is thought to be a consequence of damage to the cochlear amplifier (i.e.,
outer hair cells). demonstrating how critical a role the amplifier plays.
Prestin, the protein that is essential for the outer hair cells' motor, is also
necessary for the cochlear amplifier to function. When the gene that encodes
prestin is eliminated from mice, the animals are nearly deaf; their ears are
100-fold less sensitive to sound than normal.
... CENTRAL AUDITORY PROCESSES
The auditory pathway appears more complex than the visual pathway be-
cause there are more synapses at nuclei intermediate between the sensory
organ and the cortex. Also, in contrast to the visual system, there are many
more alternative pathways by which signals can travel from one nucleus to
the next. Nonetheless, the amount of information processing in the two
systems is similar when you consider that the cells and synapses of the
auditory system in the brain stem are analogous to interactions in the
layers of the retina. We now look at auditory circuitry, focusing on the
transformations of auditory information that occur along the way.
The Anatomy of Auditory Pathways
Afferents from the spiral ganglion enter the brain stem in the auditory-
vestibular nerve. At the level of the medulla, the axons innervate the
dorsal cocWear nucleus and ventral cocWear nucleus ipsilateral to the
cochlea where the axons originated. Each axon branches so that it synapses
on neurons in both cochlear nuclei. From this point on, the system gets
more complicated, and the connections are less well understood, because
there are multiple parallel pathways. Rather than trying to describe all of
these connections, we will follow one particularly important pathway from
the cochlear nuclei to auditory cortex (Figure 11.18). Cells in the ventral
cochlear nucleus send out axons that project to the superior olive (also
called the superior olivary nucleus) on both sides of the brain stem. Axons of
the olivary neurons ascend in the lateral lemniscus (a lemniscus is a collec-
tion ofaxons) and innervate the inferior colIiculus of the midbrain. Many
efferents of the dorsal cochlear nucleus follow a route similar to the path-
way from the ventral cochlear nucleus, but the dorsal path bypasses the
superior olive. Although there are other routes from the cochlear nuclei to
... CENTRAL AUDITORY PROCESSES 363
364 C HAP T E R I I . THE AUDITORY AND VESTIBULAR SYSTEMS
@
Auditory
cortex
MGN
Inferior
colliculus
-Lat
Ie
Superior
olive
Ventral
cochlear
nucleus
-Au
ne
Spiral
ganglion
@
@
eral
mniscus
CD
CD
ditory
rve
...j
\
,1
(
(
-
@
Dorsal cochlear
nucleus \
Ventral cochlear
nucleus
.
1
,
"
J
\
\
\
\
MGN
.
Inferior
'\ colliculus
@
Lateral
lemniscus
Auditory nerve
fiber
Spiral
ganglion
",--
_______ Auditory
cortex
@)
/-.::.
,)\
\
1
J
, \
/CD
FIGURE 11.18
Auditory pathways. Neural signals can
travel from the spiral ganglion to auditory
cortex via numerous pathways. Here. a
primary pathway is shown schematically
(at left) and through brain stem cross sec-
tions. Notice that only the connections
from one side are illustrated.
the inferior colliculus, with additional intermediate relays, all ascending
auditory pathways converge onto the inferior colliculus. The neurons in the infe-
rior colliculus send out axons to the medial geniculate nucleus (MGN) of
the thalamus, which jn turn projects to auditory cortex.
Before moving on to the response properties of auditory neurons, we
should make several points:
1. Projections and brain stem nuclei other than the ones described con-
tribute to the auditory pathways. For instance, the inferior colliculus
sends axons not only to the MGN but also to the superior colliculus
.,. ENCODING SOUND INTENSITY AND FREQUENCY 365
(where the integration of auditory and visual information occurs) and to
the cerebellum.
2. There is extensive feedback in the auditory pathways. For instance, brain
stem neurons send axons that contact outer hair cells, and auditory cor-
tex sends axons to the MGN and inferior colJiculus.
3. Each cochlear nucleus receives input from just the one ear on the ipsi-
lateral side; all other auditory nuclei in the brain stem receive input from
both ears. This explains the clinically important fact that the only way
by which brain stem damage can produce deafness in one ear is if a
cochlear nucleus (or auditory nerve) on one side is destroyed.
Response Properties of Neurons in the Auditory Pathway
To understand the transformations of auditory signals that occur in the
brain stem, we must first consider the nature of the input from the neu-
rons in the spiral ganglion of the cochlea. Because most spiral ganglion cells
receive input from a single inner hair cell at a particular location on the
basilar membrane, they fire action potentials only in response to sound
within a limited frequency range. After all, hair cells are excited by defor-
mations of the basilar membrane, and each portion of the membrane is
maximally sensitive to a particular range of frequencies.
Figure 1 L 1 9 shows the results of an experiment in which action poten-
rials were recorded from a single auditory nerve fiber (i.e., the axon of a
spiral ganglion cell). The graph represents the firing rate in response to
sounds at different frequencies. The neuron is most responsive to sound at
one frequency, called the neuron's characteristic frequency, and it is less
responsive at neighboring frequencies. This type of frequency tuning is typ-
ical of neurons at each of the relays from cochlea to cortex.
As one ascends the auditory pathway in the brain stem, the response
properties of the cells become more diverse and complex, just as in the visual
pathway. For instance, some cells in the cochlear nuclei are especially sen-
sitive to sounds varying in frequency with time (think of the sound of a
trombone as it slides from a low note to a high note). In the MGN, there
are cells that respond to fairly complex sounds such as vocalizations, as well
as other cells that show simple frequency selectivity, as in the auditory
nerve. An important development in the superior olive is that cells receive
input from cochlear nuclei on both sides of the brain stem. As discussed be-
low, such binaural neurons are probably important for sound localization.
.... ENCODING SOUND INTENSITY AND FREQUENCY
If you stop reading this book for a moment, you can focus on the many sounds
around you. You can probably hear sounds you have been ignoring, and you
can selectively pay attention to different sounds occurring at the same time.
We are usually bathed in an amazing diversity of sounds-from chattering
people to cars to the radio to electrical noises-and our brain must be able to
analyze just the important ones while ignoring the noise. We cannot yet
account for the perception of each of these sounds by pointing to particular
neurons in the brain. However, most sounds have certain features in common,
including intensity, frequency, and a location from which they emanate. Each
of these features is represented differently in the auditory pathway.
Stimulus Intensity
Information about sound intensity is coded in two interrelated ways: the
firing rates of neurons and the number of active neurons. As a stimulus
""0
C
o
u
Q)
(/)
150
Q)
0-
(/)
Q) 100
..><
.0.
(/)
Characteristic
frequency
'0 50
3000
Response to high-
intensity sound
Response to low-
intensity sound
Q)
.c
E 0
:J
Z
FIGURE 11.19
The response of an auditory nerve
fiber to different sound frequencies.
This neuron is frequency-tuned and has its
greatest response at the characteristic fre-
quency. (Source: Adapted from Rose, Hind.
Anderson, and Brugge, 1971, Fig. 2.)
366 C HAP T E R I I . THE AUDITORY AND VESTIBULAR SYSTEMS
FIGURE 11.20
Tonotopic maps on the basilar mem-
brane and cochlear nucleus. From the
base to the apex of the cochlea. the basilar
membrane resonates with increasingly lower
frequencies. This tonotopy is preserved in the
auditory nerve and cochlear nucleus. In the
cochlear nucleus. there are bands of cells with
similar characteristic frequencies; characteristic
frequencies increase progressively from poste-
rior to anterior:
gets more intense, the basilar membrane vibrates with greater amplitude,
causing the membrane potential of the activated hair cells to be more de-
polarized or hyperpolarized. As a result the nerve fibers with which the hair
cells synapse fire action potentials at greater rates. In Figure 11.19, the
auditory nerve fiber fires faster to the same sound frequencies when the
intensity is increased. In addition, more intense stimuli produce move-
ments of the basilar membrane over a greater distance. which leads to the
activation of more hair cells. In a single auditory nerve fiber, this increase
in the number of activated hair cells causes a broadening of the frequency
range to which the fiber responds. The loudness we perceive is thought to
be correlated with the number of active neurons in the auditory nerve (and
throughout the auditory pathway) and their firing rates.
Stimulus Frequency, Tonotopy, and Phase Locking
From the hair cells in the cochlea through the various nuclei leading to
auditory cortex, most neurons are sensitive to stimulus frequency. They are
most sensitive at their characteristic frequency. How is frequency repre-
sented in the central nervous system?
Tonotopy. Frequency sensitivity is largely a consequence of the mechan-
ics of the basilar membrane, because different portions of the membrane
are maximally deformed by the sound of different frequencies. Moving
from the base to the apex of the cochlea, a progressive decrease occurs in
the frequency that produces a maximal deformation of the basilar mem-
brane. There is a corresponding representation of frequency in the auditory
nerve; auditory nerve fibers connected to hair cells near the apical basilar
membrane have low characteristic frequencies, and those connected to hair
cells near the basal basilar membrane have high characteristic frequencies
(Figure 11.20). When auditory axons in the auditory-vestibular nerve
synapse in the cochlear nuclei, they do so in an organized pattern based on
characteristic frequency. Nearby neurons have similar characteristic fre-
quencies. and a systematic relationship exists between position in the
cochlear nucleus and characteristic frequency. In other words, there is a
map of the basilar membrane within the cochlear nuclei. Systematic or-
ganization of characteristic frequency within an auditory structure is called
tonotopy, analogous to retinotopy in the visual system. Tonotopic maps
exist on the basilar membrane within each of the auditory relay nuclei. the
MGN, and auditory cortex.
Characteristic
frequency:
Anterior
@
@
€ @
@
\;/
16 kHz
@
@
@\
/
Spiral
ganglion
Posterior
Cochlear
nucleus
Base
Auditory
nerve
.. ENCODING SOUND INTENSITY AND FREQUENCY 367
Because of the tonotopy present throughout the auditory system, the
location of active neurons in auditory nuclei is one indication of the fre-
quency of the sound. However. frequency must be coded in some way
other than the site of maximal activation in tonotopic maps, for two reasons.
One reason is that these maps do not contain neurons with very low char-
acteristic frequencies, below about 200 Hz. As a result, the site of maximal
activation might be the same for a 50 Hz tone as for a 200 Hz tone, so there
must be some other way to distinguish them. The second reason that some-
thing other than tonotopy is needed is that the region of the basilar mem-
brane maximally ctisplaced by a sound depends on its intensity in addition
to its frequency (see Figure 11.19). At a fixed frequency, a more intense
sound will produce a maximal deformation at a point farther up the basi-
lar membrane than a less intense sound.
Phase Locking. The main source of information about sound frequency
that complements information derived from tonotopic maps is the timing
of neural firing. Recordings made from neurons in the auditory nerve show
phase locking, the consistent firing of a cell at the same phase of a sound
wave (Figure 1l.21). If you think of a sound wave as a sinusoidal variation
in air pressure, a phase-locked neuron would fire action potentials at either
the peaks, the troughs, or some other constant location on the wave. At
low frequencies, some neurons fire action potentials every time the sound
has a particular phase (Figure 1l.21a). This makes it easy to determine
the frequency of the sound; it is the same as the frequency of the neuron's
action potentials.
Phase locking can still occur even if an action potential has not fired on
every cycle (Figure 1l.21 b). For instance, a neuron may respond to a
1000 Hz sound with an action potential on only perhaps 25% of the cycles
Low-frequency sound wave
Response
phase locked
on every
cycle
Response
phase locked,
not on every
cycle
(b)
High-frequency sound wave
Response not
phase locked
(c)
FIGURE 11.21
Phase locking in the response of
auditory nerve fibers. Sound at a low
frequency can elicit a phase-locked response,
either (a) on every cycle of the stimulus or
(b) on some fraction of the cycles. (c) At
high frequencies, the response does not have
a fixed-phase relationship to the stimulus.
368 C HAP T E R I I . THE AUDITORY AND VESTIBULAR SYSTEMS
:\ >'
I ..l
- -:
!/
Sound
waves
(a)
o msec
(b)
FIGURE 11.22
Interaural time delay as a cue to the
location of sound. (a) Sound waves coming
from the right side will reach the right ear
first, and there will be a large interaural delay
before the sound propagates to the left ear.
(b) If the sound comes from straight ahead,
there is no interaural delay. Delays for three
different sound directions are shown.
of the input, but those action potentials will always occur at the same phase
of the sound. If you have a group of such neurons, each responding to dif-
ferent cycles of the input signal. it is possible to have a response to every
cycle (by some member of the group) and thus a measure of sound fre-
quency. It is likely that intermediate sound frequencies are represented by
the pooled activity of a number of neurons, each of which fires in a phase-
locked manner; this is called the volley principle. Phase locking occurs
with sound waves up to about 4 kHz. Above this point, the action poten-
tials fired by a neuron are at random phases of the sound wave (Figure
1l.21 c) because the intrinsic variability in the timing of the action poten-
tial becomes comparable to the time interval between successive cycles of
the sound. In other words, the sound waves cycle too fast for the action
potentials of single neurons to accurately represent their timing. Above
4 kHz, frequencies are represented by tonotopy alone.
To summarize, here is how different frequencies are represented. At very
low frequencies, phase locking is used; at intermediate frequencies, both
phase locking and tonotopy are useful; and at high frequencies, tonotopy
must be relied on to indicate sound frequency.
.. MECHANISMS OF SOUND LOCALIZATION
While the use of frequency information is essential for interpreting sounds
in our environment, sound localization can be of critical importance for
survival. If a predator is about to eat you, finding the source of a sudden
sound and running away are much more important than analyzing the
subtleties of the sound. Humans are not eaten by wild animals much any-
more, but there are other situations in which sound localization can be
helpful. If you carelessly try to cross the street, your localization of a car's
horn may be all that saves you. Our current understanding of the mecha-
nisms underlying sound localization suggests that we use different tech-
niques for locating sources in the horizontal plane (left-right) and vertical
plane (up-down).
If you close your eyes and plug one ear, you can locate a bird singing
as it flies overhead almost as well as with both ears open. But if you try to
locate the horizontal position of a duck quacking as it swims across a pond,
you'll find that you're much less able using only one ear. Thus, good hor-
izontal localization requires a comparison of the sounds reaching the two
ears, whereas good vertical localization does not.
Localization of Sound in the Horizontal Plane
An obvious cue to the location of a sound source is the time at which the
sound arrives at each ear. We have two ears, and if we aren't facing a
source directly, it will take the sound longer to reach one ear than the
other. For instance. if a sudden noise comes at you from the right, it will
reach your right ear first (Figure Il.22a); it will arrive at your left ear later,
after what is known as an interaural time delay. If the distance between your
ears is 20 cm, sound coming from the right, perpendicular to your head,
will reach your left ear 0.6 msec after reaching your right ear. If the sound
comes from straight ahead, there will be no interaural delay; and at angles
between straight ahead and perpendicular, the delay will be between 0 and
0.6 msec (Figure 1l.22b). Sounds from the left side yield delays opposite to
those on the right. Thus, there is a simple relationship between location
and interaural delay. Detected by specialized neurons in the brain stem, the
delay enables us to locate the source of the sound in the horizontal
plane. The interaural delays we can detect are impressively brief. People
can discriminate the direction of a sound source in the horizontal plane
with a precision of about 2°. This demands that they discriminate the II
psec difference between the time it takes a sound to reach their two ears.
If we don't hear the onset of a sound because it is a continuous tone
rather than a sudden noise, we cannot know the initial arrival times of the
sound at the two ears. Thus, continuous tones pose more of a problem for
sound localization because they are always present at both ears. However,
we can still use arrival time to localize the sound but in a slightly different
manner from localizing a sudden sound. The only thing that can be com-
pared between continuous tones is the time at which the same phase of the
sound wave reaches each ear. Imagine you are exposed to a 200 Hz sound
coming from the right. At this frequency, one cycle of the sound covers
172 em, which is much more than the 20 em distance between your ears.
After a peak in the sound pressure wave passes the right ear, you must wait
0.6 msec, the time it takes sound to travel 20 em, before detecting a peak
at the left ear. Of course, if the sound is straight ahead, peaks in the con-
tinuous tone will reach the ears simultaneously. Because the sound wave
is much longer than the distance between the ears, we can reliably use the
interaural delay of the peak in the wave to determine sound location.
Things are more complicated with continuous tones at high frequencies.
Suppose that the sound coming from the right now has a frequency of
20,000 Hz, which means that one cycle of the sound covers 1.7 em. After
a peak reaches the right ear, does it still take 0.6 msec before a peak arrives
at the left ear? No! It takes a much shorter time because many peaks of
such a high-frequency wave will fit between your ears. No longer is there
a simple relationship between the direction the sound comes from and the
arrival times of the peaks at the two ears. Interaural arrival time simply is
not useful for locating continuous sounds with frequencies so high that one
cycle of the sound wave is smaller than the distance between your ears
(i.e., greater than about 2000 Hz).
Fortunately, the brain has another process for sound localization at high
frequencies. An interaural intensity difference exists between the two ears be-
cause your head effectively casts a sound shadow (Figure 11.23). There is
a direct relationship between the direction the sound comes from and the
extent to which your head shadows the sound to one ear. If sound comes
directly from the right, the left ear will hear a significantly lower intensity
(Figure] 1.23a). With sound corning from straight ahead, the same intensity
reaches the two ears (Figure I1.23b), and with sound coming from inter-
mediate directions, there are intermediate intensity differences (Figure
I1.23c). Neurons sensitive to differences in intensity can use this informa-
tion to locate the sound. Intensity information cannot be used to locate
sounds at lower frequencies because sound waves at these frequencies dif-
fract around the head, and the intensities at the two ears are roughly equiv-
alent. There is no sound shadow at low frequencies.
Let's summarize the two processes for localizing sound in the horizontal
plane. With sounds in the range of 20-2000 Hz, the process involves inter-
aural time delay. From 2000-20,000 Hz, interaural intensity difference is
used. Together, these two processes constitute the duplex theory of sound
localization.
The Sensitivity of Binaural Neurons to Sound Location. From our
discussion of the auditory pathway, recall that neurons in the cochlear
nuclei only receive afferents from the ipsilateral auditory-vestibular nerve.
Thus, all of these cells are monaural neurons, meaning that they only respond
to sound presented to one ear. At all later stages of processing in the auditory
system, however, there are binaural neurons whose responses are influenced
T MECHANISMS Of SOUND lOCALIZATION 369
Sound
shadow
-
1I
Sound
waves
(a)
(b)
Sound
waves
L/
0'" b O -
q;! 'lj
<;:i
(c)
FIGURE 11.23
Interaural intensity difference as a cue
to sound location. (a) With high-frequency
sound. the head will cast a sound shadow to
the left when sound waves come from the
right. Lower-intensity sound in the left ear is
a cue that the sound came from the right
(b) If the sound comes from straight ahead.
a sound shadow is cast behind the head but
the sound reaches the two ears wrth the
same intensity. (c) Sound coming from an
oblique angle will partially shadow the left ear.
370 C HAP T E R I I . THE AUDITORY AND VESTIBULAR SYSTEMS
300
-0
<:
0
()
OJ
U)
CD
0-
U)
OJ
-"
'6-
U)
'0
CD
.D
E
z
0 2
Interaural time delay (msec)
FIGURE I ) .24
Responses of a neuron in the superior
olive sensitive to interaural time delay.
This neuron has an optimal delay of I msec.
by sound at both ears. The response properties of binaural neurons imply
that they play an important role in sound localization in the horizontal plane.
The first structure where binaural neurons are present is the superior
olive. Although some controversy exists about the relationship between the
activity of such neurons and the behavioral localization of sound, there are
several compelling correlations. Neurons in the superior olive receive input
from cochlear nuclei on both sides of the brain stem (see Figure 11.18).
Cells in the cochlear nuclei that project to the superior olive typically have
responses phase locked to lower-frequency sound input. Consequently, an
olivary neuron receiving spikes from the left and right cochlear nuclei can
compute interaural time delay. Recordings made in the superior olive show
that each neuron typically gives its greatest response to a particular inter-
aural delay (Figure 11.24). Because imeraural delay varies with sound
location, each of these neurons may be encoding a particular position in
the horizontal plane.
How can a neural circuit produce neurons sensitive to interaural delay?
One possibility is to use axons as delay lines and to measure small time dif-
ferences precisely. A sound hitting the left ear triggers action potentials in
the left cochlear nucleus, which propagate along afferent axons into the su-
perior olive (Figure 11.25). Within 0.6 msec of hitting the left ear, that sound
reaches the right ear (assuming the sound comes directly from the left) and
triggers action potentials in axons from the right cochlear nucleus. However,
because of the way the axons and neurons are arranged in the olive, the ac-
tion potentials from each side take different lengths of time to arrive at the
various postsynaptic neurons in the olive. For example, the axon from the
left cochlear nucleus has a longer path to travel to neuron 3 in Figure 11.25
than the axon from the right cochlear nucleus; therefore, the arrival of the
spike from the left side is delayed just enough that it coincides with the ar-
rival of the spike from the right side. By arriving at precisely the same time,
action potentials from the two sides produce excitatory postsynaptic poten-
tials (EPSPs) that summate, yielding a larger EPSP that more strongly excites
olivary neuron 3 than an EPSP from each ear could alone. When an inter-
aural delay is more or less than 0.6 msec, the spikes do not arrive together,
and thus the EPSPs they trigger do not summate as much.
Other neurons in the superior olive are tuned to other interaural times
because of systematic differences in the arrangement of axonal delay lines.
To measure timing differences as accurately as possible, many neurons and
synapses of the auditory system are specially adapted for rapid operation;
their action potentials and EPSPs are much faster than those of most other
neurons in the brain. There are limits to auditory time measurement of this
type, however. phase locking is essential for a precise comparison of the
timing of inputs, and because phase locking only occurs at relatively low
frequencies, it makes sense that interaural delays are useful only for local-
izing sounds of relatively low frequency.
The mechanism described in Figure 11.25 is clearly present in bird brains,
but it is less obvious that mammals calculate interaural delays this way.
Recent studies on gerbils have suggested that synaptic inhibition, rather
than axonal delay lines, generates the sensitivity of superior olivary neurons
to interaural delay. It is quite possible that inhibition and axonal delay lines
work together for this purpose. Only further research will clarify the mech-
anisms by which mammals compute interaural delay.
In addition to their sensitivity to interaural delay, neurons in the supe-
rior olive are sensitive to the other sound location cue, interaural intensity.
One type of neuron is moderately excited by sound presented to either ear
but only gives a maximal response when both ears are stimulated. The
other type of neuron is excited by sound in one ear but inhibited by sound
--- I Auditory-vestibular
_-. ... nerve
(:;, '..-:s ! ,. I 50perim olive
J
Sound from the left side initiates
activity in the left cochlear nucleus;
activity is then sent to the superior
olive.
Superior olive
S@
Axon from
right cochlear nucleus
f
Axon from
I left cochlear nucleus
Very soon, the sound reaches
the right ear, initiating
activity in the right cochlear
nucleus. Meanwhile, the first
impulse has traveled farther
along its axon.
-]1-
Both impulses reach olivary
neuron 3 at the same time, and
summation of synaptic potentials
generates an action potential.
in the other ear. Presumably, both types of neurons contribute to horizon-
tal localization of high-frequency sound by encoding differences in inter-
aural intensity.
Localization of Sound in the Vertical Plane
Comparing inputs to both ears is not very useful for localizing sounds in
the vertical plane because as a sound source moves up and down, neither
the interaural delay nor the interaural intensity changes. This is why, as
mentioned above, localizing sounds in the vertical plane is much less af-
fected by plugging one ear than localizing sounds in the horizontal plane.
To seriously impair vertical sound localization, one must place a tube into
the auditory canal to bypass the pinna. The sweeping curves of the outer
ear are essential for assessing the elevation of a source of sound. The bumps
and ridges apparently produce reflections of the entering sound. The delays
between the direct path and the reflected path change as a sound source
moves vertically (Figure 11.26). The combined sound, direct and reflected,
is subtly different when it comes from above or below. In addition, the
outer ear allows higher-frequency sounds to enter the auditory canal more
.
.. MECHANISMS OF SOUND LOCALIZATION 371
FIGURE 11.25
Delay lines and neuronal sensitivity to
interaural delay.
372 C HAP T E R J J . THE AUDITORY AND VESTIBULAR SYSTEMS
Pinna Path 2
\ - direct sound
" Path 2
reflected sound
\
\ \
\' Path 1
direct sound
Path 1
reflected sound
Path 3
reflected sound
Path 3
direct sound
FIGURE 11.26
Vertical sound localization based on reflections from the pinna.
effectively when they come from an elevated source. Vertical localization
of sound is seriously impaired if the convolutions of the pinna are covered.
Some animals are extremely good at vertical sound localization even
though they do not have a pinna. For example, a barn owl can swoop
down on a squeaking mouse in the dark, locating accurately by sound,
not sight. Although owls do not have a pinna, they can use the same
techniques we use for horizontal localization (interaural differences) be-
cause their ears are at different heights on their head. Some animals have
a more "active" system for sound localization than humans and owls. Cer-
tain bats emit sounds that are reflected off objects, and these echoes are
used to locate objects without sight. Reflected sound, analogous to the
sonar used by ships, is used by many bats to hunt insects. In 1989, lames
Simmons at Brown University made the startling discovery that bats can
discriminate time delays that differ by as little as 0.00001 msec. This find-
ing challenges our current understanding of how the nervous system, using
action potentials lasting almost a millisecond, can perform such fine tem-
poral discriminations.
"Y AUDITORY CORTEX
Axons leaving the MGN project to auditory cortex via the internal capsule
in an array called the acoustic radiation. Primary auditory cortex (AI) corre-
sponds to Brodmann's area 41 in the temporal lobe (Figure 11.27a). The
structure of Al and the secondary auditory areas is in many ways similar
to corresponding areas of the visual cortex. Layer I contains few cell bod-
ies, and layers II and III contain mostly small pyramidal cells. Layer IV,
where the medial geniculate axons terminate, is composed of densely
packed granule cells. Layers V and VI contain mostly pyramidal cells that
tend to be larger than those in the superficial layers. Let's look at how these
cortical neurons respond to sound.
/
...
/"')' \
L
\_-
-
(b)L-
(
'Y-J
------- Primary auditory
cortex
..-..
s .
econdary auditory
cortex
(a)
"
Neuronal Response Properties
In general, neurons in monkey (and presumably human) AI are relatively
sharply tuned for sound frequency and possess characteristic frequencies
covering the audible spectrum of frequencies_ In electrode penetrations
made perpendicular to the cortical surface in monkeys, the cells encoun-
tered tend to have similar characteristic frequencies, suggesting a columnar
organization on the basis of frequency_ In the tonotopic representation in
AI, low frequencies are represented rostrally and laterally, whereas high
frequencies are represented caudally and medially (Figure I L27b). Roughly
speaking, there are isofrequency bands running mediolaterally across AI. In
other words, strips of neurons running across AI contain neurons that have
fairly similar characteristic frequencies.
In the visual system, it is possible to describe large numbers of cortical
neurons as having some variation on a general receptive field that is either
simple or complex. So far, it has not been possible to place the diverse
auditory receptive fields into a similarly small number of categories. As
they do at earlier stages in the auditory pathway, cortical neurons have dif-
ferent temporal response patterns; some have a transient response to a brief
sound, and others have a sustained response.
In addition to the frequency tuning that occurs in most cells, some
neurons are intensity tuned, giving a peak response to a particular sound
intensity. Even within a vertical column perpendicular to the cortical sur-
face, considerable diversity can exist in the degree of tuning to sound fre-
quency. Some neurons are sharply tuned for frequency, and others are
barely tuned at all; the degree of tuning does not seem to correlate well with
cortical layers. Other sounds that produce responses in cortical neurons
include clicks. bursts of noise, frequency-modulated sounds, and animal
vocalizations. Attempting to understand the role of these neurons that
respond to seemingly complex stimuli is one of the challenges researchers
currently face (Box 11.5).
Given the wide variety of response types that neurophysiologists encounter
in studying auditory cortex, you can understand why it is reassuring to
see some sort of organization or unifying principle. One organizational
prindple already discussed is the tonotopic represenration in many auditory
'Y AUDITORY CORTEX )73
\
-
FIGURE \\.27
Primary auditory cortex. (a) Primary
auditory cortex (purple) and secondary audi-
tory areas (yellow) on the superior temporal
lobe. (b) Tonotopic organization within
primary auditory cortex. The numbers are
characteristic frequencies.
374 C HAP T E R I I . THE AUDITORY AND VESTIBULAR SYSTEMS
Box 11.5
.... ' ..
OF SPECIAL INTEREST
iii
How Does Auditory Cortex Work?
Consult a Specialist
The function of an animal's brain is to help it stay alive and
reproduce. Different species have vastly different habits and
needs, and some animals have evolved a sensory system
specialized for processing its favorite stimuli. The exagger-
ated systems of the sensory specialists, such as barn owls
and bats, sometimes help us understand how we sensory
generalists work.
Barn owls find their prey (a scurrying mouse, for example)
in the dark by listening very carefully. They are particularly
adept at identifying and localizing faint sounds, and some of the
neural mechanisms of sound localization were first under-
stood in owls. Bats have a more unique and active auditory
technique. They find their food (a fluttering moth, for exam-
ple) by echolocating it. The bats emit brief calls and listen
for the faint echoes reflected from the target. Bats require
their cortex for proper echolocation. Studying bat cortex
can certainly provide insight into how auditory cortex works
in bats, but it may also enlighten us about the human cortex.
The most interesting stimuli for echolocating bats are
their own calls and echoes. A bat's language is very limited.
To echolocate, most bats scream loudly at ultrasonic fre-
quencies (20-100 kHz) using essentially a one-word vocab-
ulary. The call of the mustached bat (Pteronotus parnellii) is
very brief, no more than 20 msec long, and consists of a
steady constant frequency (CF) part followed by a sweep of
descending frequency-the frequency modulated (FM) part.
Figure A is a graph of the bat's call and echo, showing the
frequencies of the sounds plotted against time.As it flies, the
bat rapidly and continually repeats the call. By listening to
its own calls and their echoes, and carefully comparing them
in many ways, the bat builds a remarkably detailed auditory
image of the nearby world. For example, the delay between
the call and its echo depends on the distance to a reflect-
ing target (I msec of delay for each 17 cm of distance). If
the target is moving toward or away from the bat, the fre-
quency of the echo is Doppler-shifted higher or lower (think
of the shifting pitch of an ambulance siren as it passes by
you; a I kHz shift corresponds to a speed of about 3 m/s).
A moth's beating wings cause a rhythm in the echoes. and
that helps the bat know there's a particular kind of insect
in front of it and not something less edible. Many other sub-
tle changes in the echo's frequency, timing, loudness, and
pattern tell the bat about other features of the targets.
The processing of call-echo information by the auditory
cortex of the mustached bat has been studied in great de-
tail by Nobuo Suga at Washington University. Suga found
that the bat's cortex is a mixture of distinct auditory areas.
Many are specialized for detecting particular features impor-
tant for echolocating, and others seem more generalized.
For example, a large region is devoted to processing Doppler
areas. A second organizational principle is the presence in auditory cortex
of columns of cells with similar binaural interaction. As at lower levels in
the auditory system, one can distinguish cells that respond more to stimu-
lation of both ears than to either ear separately, and cells that are inhibited
if both ears are stimulated. As we discussed for the superior olive, neurons
sensitive to interaural time delays and interaural intensity differences prob-
ably playa role in sound localization.
In addition to AI, other cortical areas located on the superior surface of the
temporal lobe respond to auditory stimuli. Some of these higher auditory
areas are tonotopically organized, and others do not seem to be. As in visual
cortex, there is a tendency for the stimuli that evoke the strongest responses
to be more complex than those that best excite neurons at lower levels in the
system. An example of specialization is Wernicke's area, which we will discuss
in Chapter 20. Destruction of this area does not interfere with the sensation
of sound, but it seriously impairs the ability to interpret spoken language.
The Effects of Auditory Cortical lesions and Ablation
Bilateral ablation of auditory cortex leads to deafness, but deafness is
more often the consequence of damage to the ears (Box 11.6). A surpris-
shifts of echoes right around 60 kHz, the loudest part of the
bat's can; this area processes information about target ve-
locity and location. Three separate areas detect call-echo
delays and yield information about target distance. We are
beginning to understand the neural mechanisms that extract
such information.
The basic features of a bat's calls and a human's spoken
words are similar, although human speech is much slower
and lower in pitch. Human syllables consist of particular
combinations of CF periods, FM sweeps, brief pauses, and
... AUDITORY CORTEX 375
bursts of noise. For example, the syllable "ka" differs from
"pa" because their initial FM sweeps bend in different direc-
tions (Figure B). The long "a" sounds different from the long
"i" because each one uses different combinations of CFs. It
is very likely that the neuronal circuits that process speech
sounds in human auditory cortex use principles very simi-
lar to those in the bat's cortex. Interpreting those speech
sounds as words, and understanding the concepts they
imply, is the realm of language, and the brain mechanisms of
language will be discussed in Chapter 20.
90 Doppler shift 2.0
Call LT_____ "ka"
N I N
I 60 I
t D; Y
>. CF >. 1.2 CF I
0 0
c: c:
0> 0>
=> :J "pa"
c- c-
O> 30 0> CF 2
u: u:
0.4
0 10 20 0 0.1 0.2 0.3
Time (msee) Time (see)
FIGURE A FIGURE B
A bat's call and echo. (Source: Adapted from A human's spoken words. (Source: Adapted
Suga. 1995, p. 302.) from Suga. 1995. p. 296.)
ing degree of nonnal auditory function is retained after unilateral lesions
in auditory cortex. This outcome is in marked contrast to the visual sys-
tem, in which a unilateral cortical lesion of striate cortex leads to com-
plete blindness in one visual hemifield. The reason for greater preserva-
tion of function after lesions in auditory cortex is that both ears send
output to cortex in both hemispheres. In humans, the primary deficit that
results from a unilateral loss of Al is the inability to localize the source
of a sound. It may be possible to determine which side of the head a
sound comes from, but there is little ability to locate the sound more pre-
cisely. Performance on such tasks as frequency or intensity discrimination
is near normal.
Srudies in experimental animals indicate that smaller lesions can pro-
duce rather specific localization deficits. Because of the tonotopic or-
ganization of AI, it is possible to make a restricted cortical lesion that
destroys neurons with characteristic frequencies within a limited fre-
quency range. Interestingly, there is a localization deficit only for sounds
roughly corresponding to the characteristic frequencies of the missing
cells. This finding reinforces the idea that information in different fre-
quency bands may be processed in parallel by tonotopically organized
structures.
-
] 76 C HAP T E R I I . THE AUDITORY AND VESTIBULAR SYSTEMS
Box 11.6
.... , ...
OF SPECIAL INTEREST
..
'"
..
Auditory Disorders
and Their Treatments
Although the effects of cortical lesions provide important
information about the role of auditory cortex in percep-
tion, the perceptual deficit we all associate with the audi-
tory system--deafness-usually results from problems in or
near the cochlea. Deafness is conventionally subdivided into
two categories: conduction deafness and nerve deafness.
Hearing loss caused by a disturbance in the conduction
of sound from the outer ear to the cochlea is called con-
duction deafness. This sensory deficit can be caused by
something as simple as excessive wax in the ear, to more
serious problems such as rupture of the tympanic mem-
brane or pathology of the ossicles. A number of diseases
cause binding of the ossicles to the bone of the middle
ear, impairing the transfer of sound. Fortunately, most of
the mechanical problems in the middle ear that interfere
with sound conduction can be treated surgically.
Nerve deafness is deafness associated with the loss of
either neurons in the auditory nerve or hair cells in the
cochlea. Nerve deafness sometimes results from tumors
affecting the inner ear. It also can be caused by drugs
that are toxic to hair cells, such as quinine and certain
antibiotics, or exposure to loud sounds, such as explo-
sions and loud music. Depending on the degree of cell
loss, different treatments are possible. If the cochlea or
auditory nerve on one side is completely destroyed,
deafness in that ear will be absolute. However, a partial
loss of hair cells is more common. In these cases, a hearing
aid can be used to amplify the sound for the remaining
hair cells. In more serious cases in which hearing loss is
bilateral and the auditory nerve is intact, cochlear im-
plants are an important option (see Box 11.2).
With deafness, a person hears less sound than normal.
With a hearing disorder called tinnitus, a person hears
noises in the ears even in the absence of any sound stim-
ulus. The subjective sensation can take many forms, in-
cluding buzzing, humming, and whistling. You may have ex-
perienced a mild and temporary form of tinnitus after
being at a party with really loud music; your brain may
have had fun, but your hair cells are in shock! Tinnitus is
a relatively common disorder that can seriously interfere
with concentration and work if it persists. You can imag-
ine how distracting it would be if you constantly heard
whispering or humming Or the crinkling of paper.
Tinnitus can be a symptom of a number of neurologi-
cal problems. Although it frequently accompanies diseases
involving the cochlea or auditory nerve, it may also result
from exposure to loud sounds or abnormal vasculature
of the neck, or simple aging. It now seems that many of
the phantoms sounds of tinnitus are caused by changes in
central auditory structures, including auditory cortex.
Damage to the cochlea or auditory nerve may induce
alterations in the brain, such as a down-regulation of
synaptic inhibition. Although clinical treatment of tinnitus
is often only partially successful, the annoyance of the
noise can often be lessened by using a device that con-
stantly produces a sound in the affected ear(s). For un-
known reasons, the constant real sound is less annoying
than the sound of the tinnitus that gets blocked.
.... THE VESTIBULAR SYSTEM
Strangely enough, listening to music and balancing on a bicycle both involve
sensations that are transduced by hair ceJls. The vestibular system monitors
the position and movement of the head, gives us our sense of balance and
equilibrium, and helps coordinate movements of the head and eyes, as
well as adjustments to body posture. When the vestibular system operates
normally, we are usually unaware of it. When its function is disrupted,
however, the results can include the unpleasant, stomach-turning feelings
we usually associate with motion sickness-vertigo and nausea, plus a
sense of disequilibrium and uncontrollable eye movements.
The Vestibular Labyrinth
The vestibular and auditory systems both use hair cells to transduce move-
ments. Common biological structures often have common origins. In this
Vestibular nerve
Semicircular
M'
,\
Scarpa's ganglion
\
f
- - Auditory nerve
).
/
I
'"
Cochlea
(a)
Utricle Saccule
Otoliltl
organs
-......
\
) 30 g
\
.....-
u
(b)
I
\
/'
Semicircular
canals
case, the organs of mammalian balance and hearing both evolved from the
lateral line organs present in all aquatic vertebrates. Lateral line organs are
small pits or tubes along an animal's sides. Each pit contains clusters of
hairlike sensory cells whose dlia project into a gelatinous substance that is
open to the water in which the animal swims. The purpose of lateral line
organs in many animals is to sense vibrations or pressure changes in the
water. In some cases, they are also sensitive to temperature or electrical
fields. Lateral line organs were lost as reptiles evolved, but the exquisite
mechanical sensitivity of hair cells was adopted and adapted for use in the
structures of the inner ear that derived from the lateral line.
In mammals, all hair cells are contained within sets of interconnected
chambers called the vestibular labyrinth (Figure 11.28a). We have al-
ready discussed the auditory portion of the labyrinth, the spiraling cochlea
(see Figure 11.6). The vestibular labyrinth includes two types of structures
.. THE VESTIBULAR SYSTEM 377
FIGURE 11.28
The vestiburar rabyrinth. (a) Locations of
the otolith organs (utricle and saccule) and
semicircular canals. (b) A vestibular labynnth
resides on each side of the head. with the
semicircular canals arranged in parallel planes.
, . ./ ,
, .
r'>-,. /J
C >'. ,
"f ....
, ,
, "
,
'-
'.
". f. "
/ \ ) )
"
378 C HAP T E R I I . THE AUDITORY AND VESTIBULAR SYSTEMS
with different functions: the otolith organs, which detect the force of
gravity and tilts of the head, and the semicircular canals, which are sen-
sitive to head rotation. The ultimate purpose of each structure is to transmit
mechanical energy, derived from head movement, to its hair cells. Each is
sensitive to different kinds of movement not because their hair cells differ,
but because of the specialized structures within which the hair cells reside.
The otolith organs are a pair of relatively large chambers, called the
saccule and the utricle, near the center of the labyrinth. The semicircular
canals are the three arcing structures of the labyrinth. They lie in approx-
imately orthogonal planes, which means that there is an angle of about 90°
between any pair of them (Figure I1.28b). A set of vestibular organs re-
sides on each side of the head, and they are mirror images of each other.
Each hair cell of the vestibular organs makes an excitatory synapse
with the end of a sensory axon from the vestibular nerve, a branch of the
auditory-vestibular nerve (cranial nerve VIll). There are about 20,000
vestibular nerve axons on each side of the head, and their cell bodies lie in
Scarpa's ganglion.
The Otolith Organs
The saccule and utricle detect changes of head angle, as well as linear accel-
eration of the head. When you tilt your head, the angle between your
otolith organs and the direction of the force of gravity changes. Linear ac-
celeration also generates force, in proportion to the mass of an object.
Forces due to linear acceleration are the sort you encounter when you ride
in an elevator or a car as it starts or stops. In contrast, when a car or ele-
vator moves at constant velocity, acceleration is zero, so there is no force
(apart from gravitational force). That's why you can fly steadily at 600 mph
in a jet, yet feel perfectly still; the sudden bouncing you experience during
air turbulence, however, is another good example of the forces generated
by linear acceleration, and of movements detected by your otolith organs.
Each otolith organ contains a sensory epithelium called a macula, which
is vertically oriented within the saccule and horizontally oriented within
the utricle when the head is upright. (Note that the vestibular macula and
the retinal macula are entirely different structures.) The vestibular macula
contains hair cells, which lie among a bed of supporting cells with their cilia
projecting into a gelatinous cap (Figure 11.29). Movements are transduced
by hair cells in the maculae when the hair bundles are deflected. The
unique feature of the otolith organs is the tiny crystals of calcium carbon-
ate called otoliths, 1-5 pm in diameter. (The word is Greek for "ear stone.")
Otoliths encrust the surface of the macula's gelatinous cap, near the tips of
the hair bundles, and they are the key to the tilt sensitivity of the macula.
The otoliths have a higher density than the endolymph that surrounds them.
When the angle of the head changes, or when the head accelerates, a
force is exerted on the otoliths; this exerts a force in the same direction on
the gelatinous cap, which moves slightly, and the cilia of the hair cells bend.
Not just any deflection will do, however. Each hair cell has one especially
tall cilium, called the kinocilium. The bending of hairs toward the kinocilium
results in a depolarizing, excitatory receptor potential. Bending the hairs
along the other direction of the kinocilium hyperpolarizes and inhibits the
cell. The cell is exquisitely direction selective. If the hairs are perpendicu-
lar to their preferred direction, they barely respond. The rransduction
mechanism of vestibular hair cells is essentially the same as that in audi-
tory hair cells (see Figure 11.15). As with auditory hair cells, only tiny hair
movements are needed. The response saturates when the hairs are bent less
than 0.5 pm, about the diameter of one cilium.
... THE VESTIBULAR SYSTEM 379
FIGURE 11.29
Macular hair cells responding to tilt. When the utricular
macula is level (the head is straight), the cilia from the hair cells
also stand straight. When the head and macula are tilted. gravity
pulls the otoliths. which deform the gelatinous cap, and the cilia
bend.
Gelatinous
cap
Otoliths
\\- .
.
'.'
'\ l'
}.\, ,',\ r ,
,,\ \ .\ J 1 \
- .:\' . . )\ Sj .. (I \Qj
\\ )\ '}I\\I.)\\ 'C) \-----
\ '
Kinocilium
/
"t \..L
..
" '1 n L
:',Ii R'
I ' ; J
!,'lJ , . . I
I 1 I \
Lt\ : ) b' I l
;,g if l(l \(li () () (li () d
Vestibular
nerve axons
l'
Hair cell
Head straight
Head tilted
The head can tilt and move in any direction, but the hair cells of the
utricle and saccule are oriented to transduce all of them effectively. The
saccular maculae are oriented more or less vertically, while the utricular
maculae are mostly horizontal (Figure 11.30). On each macula, the direc-
tion preferences of the hair cells vary in a systematic way. There are enough
hair cells in each macula to cover a full range of directions. Because of the
mirror-image orientation of the saccule and utricle on each side of the
head, when a given head movement excites hair cells on one side, it will
tend to inhibit hair cells in the corresponding location on the other. Thus,
any tilt or acceleration of the head will exdte some hair cells, inhibit others,
and have no effect on the rest. The central nervous system, by simultane-
ously using the information encoded by the full population of otolithic hair
cells, can unambiguously interpret all possible linear movements.
The Semicircular Canals
The semicircular canals detect turning movements of the head, such as
shaking your head from side to side or nodding up and down. As with
the otolith organs, the semicircular canals also sense acceleration, but of a
380 C HAP T E R I I . THE AUDITORY AND VESTIBULAR SYSTEMS
FIGURE 11.30
Macular orientation. (a) The macula in the
utricle is horizontal. (b) The macula In the saccule
is vertical The arrows on each macula show how
the hair cells are polarized. Bending the hairs in
the direction of the arrow depolanzes them.
-r
Direction for
depolarization
/
\
/,
(a) Utricular macula
.
r)/
(b) Saccular macula
different kind. Angular acceleration is generated by sudden rotational move-
ments, and it is the primary stimulus for the semicircular canals.
The hair cells of the semicircular canals are clustered within a sheet of
cells, the crista, located within a bulge along the canal called the ampulla
(Figure l1.31a). The cilia project into the gelatinous cupula, which spans
the lumen of the canal within the ampulla. All the hair cells in an ampulla
have their kinocilia oriented in the same direction, which means that they
all get excited or inhibited together. The semicircular canals are filled with
endolymph, the same fluid that fills the cochlea. Bending of the cilia occurs
when the canal is suddenly rotated about its axis like a wheel; as the waIl
of the canal and the cupula begin to spin, the endolymph tends to stay
behind because of inertia. The sluggish endolymph exerts a force upon
the cupula, much like wind upon a sail (Figure l1.31b). This force bows
the cupula. which bends the cilia, which (depending on the direction of the
rotation) either excites or inhibits the release of neurotransmitter from
the hair cells onto the vestibular nerve axons.
If head rotation is maintained at a constant velocity, the friction of en-
dolymph with the canal walls eventually makes the two move together,
thereby reducing and then eliminating the bending of the cupula after
15-30 seconds. Such adaptation to rotation can be seen clearly in the firing
rates of vestibular axons from the canals (Figure 11.32). (This sort of pro-
longed head rotation is not something you encounter very often, unless
you have a taste for certain disagreeable amusement park rides.) When
rotation of the head (and its canals) is finally stopped, the inertia of the
endolymph causes the cupula to bend in the other direction, generating
an opposite response from the hair cells and a temporary sensation of
counterrotation. This mechanism explains why you felt dizzy and unbal-
anced whenever, as a child, you stopped spinning your body like a top-
your semicircular canals were sending the message that your body was still
spinning, in the opposite direction.
Together, the three semicircular canals on one side of the head help sense
all possible head-rotation angles. This is further ensured because each canal
is paired with another on the opposite side of the head (see Figure 11.28b).
Ampulla
Cupula
/
i;;;;::-.... Cilia
( ,
l. /
Endolymph \
I I '\ Hair cells
I Vestibular
axons
(a)
Resting
,
/
Endolymph '. \'I
flow r ,
(b)
11(
Rotating left (clockwise)
FIGURE 11.31
A cross section through the ampula of a semicircular canal. (a) The cilia of hair
cells penetrate into the gelatinous cupula. which is bathed in the endolymph that fills the
canals. (b) When the canal rotates leftward, the endolymph lags behind and applies force
to the cupula, bending the cilia within it.
Each member of a pair sits within the same orientation plane as its panner
and responds to rotation about the same axis. However, while rotation
excites the hair cells of one canaL it inhibits the hair cells of its contralat-
eral partner canal. Vestibular axons fire at high rates even at rest. so their
activity can be driven either up or down depending on the direction of
rotation. This "push-pull" arrangement-each rotation causing excitation
on one side and inhibition on the other (see Figure 11.32)-optimizes the
ability of the brain to detect rotational movements.
Central Vestibular Pathways and Vestibular Reflexes
The central vestibular pathways coordinate and integrate information about
head and body movement and use it to control the output of motor neurons
that adjust head, eye, and body positions. Primary vestibular axons from
cranial nerve VIII make direct connections to the vestibular nucleus on
the same side of the brain stem, as well as to the cerebellum (Figure 11. 33).
The vestibular nuclei also receive inputs from other parts of the brain, in-
cluding the cerebellum, and the visual and somatic sensory systems, thereby
combining incoming vestibular information with data about the motor
system and other sensory modalities.
.. THE VESTIBULAR SYSTEM 381
io
\
100
OJU
- OJ
O>(/)
C OJ
.- -'"
. "6..
LL
o 60
Time (see)
120
i , r"
\'.
i o l
\
100
OJU
- OJ
<U (/)
--
O>(/)
C OJ
.- -'"
.= "0..
LL
o
60
Time (see)
120
FIGURE 11.32
Push-pull activation of the semicircular
canals. Head rotation causes the excitation
of hair cells in one horizontal semiCircular
canal and the inhibition of hair cells in the
other. The graphs show that long-lasting head
rotation leads to adaptation of the firing in
vestibular axons. When rotation is stopped.
the vestibular axons from each side begin
firing again, but with opposite patterns of
excitation and inhibition.
382 C HAP T E R I I . THE AUDITORY AND VESTIBULAR SYSTEMS
FIGURE J 1.33
A summary of the central vestibular
connections from one side.
Cerebellum VP nucleus
of thalamus
Extraocular
motor neurons
<"I,IV, VI)
r
....
Medial
:-- longitudinal
fasciculus
Limb motor
neurons
Neck motor
neurons
The vestibular nucleus, which has several subdivisions, in turn projects
to a variety of targets above it in the brain stem, and below it into the spinal
cord (see Figure 11.33). For example, axons from the otolith organs project
to the lateral vestibular nucleus, which then projects via the vestibulospinal
tract to excite spinal motor neurons controlling muscles in the legs that help
maintain posture (see Chapter 14). This pathway helps the body stay up-
right even on the rolling deck of a boat. Axons from the semicircular canals
project to the medial vestibular nucleus, which sends axons via the medial
longitudinal fasciculus to excite motor neurons of trunk and neck muscles
that orient the head. This pathway helps the head stay straight even as the
body cavorts around below it.
Similar to the other sensory systems, the vestibular system makes con-
nections to the thalamus and then to the neocortex. The vestibular nuclei
send axons into the ventral posterior (VP) nucleus of the thalamus, which
projects to regions close to the representation of the face in the primary
somatosensory and primary motor areas of cortex (see Chapters 12 and 14).
At the conical level, there is considerable integration of information about
movements of the body, the eyes, and the visual scene. It is likely that the
conex continually maintains a representation of body position and orien-
tation in space, which is essential for our perception of equilibrium and for
planning and executing complex, coordinated movements.
The Vestibulo-Ocular Reflex (VOR). One very important function of
the central vestibular system is to keep your eyes pointed in a panicular
direction, even while you are dancing like a fool. The vestibulo-ocular
reflex (V OR) performs this function. Recall that accurate vision requires
the image to remain stable on the retinas despite movement of the head
(see Chapter 9). Each eye can be moved by a set of six extraocular muscles.
Because the VOR works by sensing rotations of the head, it immediately
commands a compensatory movement of the eyes in the opposite direc-
tion. The movement helps keep your line of sight tightly fixed on a visual
target. Because the VOR is a reflex triggered by vestibular input rather than
visual input, it works amazingly well even in the dark or when your eyes
are closed.
Imagine driving down a very bumpy road. From constant adjustments by
the VOR, your view of the world ahead is quite stable because each bump,
and its consequent movement of your head, is compensated by an eye
movement. To appreciate how effective your VOR is, compare the stability
. THE VESTIBULAR SYSTEM 383
Turning motion of head
Direction of eye movements
Medial
recti
A
Lateral rectus
I ' ( RC .:. : m",o',
II /
/,
'0 0
+
Left abducens
(cranial nerve VI)
nucleus
Left vestibular @
nucleus
Right medial
longitudinal
fasciculus
(j)
@
+
+
.
I
(Q))
Left horizontal
semicircular canal
FIGURE 11.34
Vestibular connections mediating horizontal eye movements during the VOR.
These pathways are active when the head suddenly turns to the left. causing the eyes to
turn to the right. Excitatory connections are denoted by green plus signs; the inhibitory
connection is denoted by a red minus sign.
of a passing object during the bumpy drive as you look at it first with your
eyes alone, and then through the viewfinder of a camera. Unless you have
a very sophisticated camera (with the electromechanical equivalent of a
VOR), you'll find that your view jumps around hopelessly because your
arms are not nearly quick or accurate enough to move the camera with
each bump.
The effectiveness of the VOR depends on complicated connections from the
semidrcular canals, to the vestibular nucleus, to the cranial nerve nuclei
that excite the extraocular muscles. Figure 11.34 shows only half of the
horizontal component of this circuit and illustrates what happens when the
head turns to the left and the VOR induces both eyes to turn right. Axons
from the left horizontal canal innervate the left vestibular nucleus, which
sends excitatory axons to the contralateral (right) cranial nerve VI nucleus
(abducens nucleus). Motor axons from the abducens nucleus in turn excite
the lateral rectus muscle of the right eye. Another excitatory projection
384 C HAP T E R I I . THE AUDITORY AND VESTIBULAR SYSTEMS
from the abducens crosses the midline, back to the left side, and ascends
(via the medial longitudinal fasciculus) to excite the left cranial nerve III
nucleus (oculomotor nucleus), which excites the right medial rectus mus-
cle of the left eye.
Mission accomplished, so it would seem: Both eyes are turning right.
However. to further ensure speedy operation, the left medial rectus muscle
also gets excited via a projection from the vestibular nucleus directly to the
left oculomotor nucleus. Speed is also maximized by activating inhibitory
connections to the muscles that oppose this movement (the lateral rectus and
medial rectus, in this case). To respond to head rotations in any direction,
the complete VOR circuit includes similar connections between the right
horizontal canal, the other semicircular canals, and the other extraocu-
lar muscles that control eye movements.
Vestibular Pathology
The vestibular system can be damaged in a variety of ways-for example,
by the toxicity of high doses of antibiotics, such as streptomycin. People
with bilateral lesions of the vestibular labyrinths have enormous trouble
fixating on visual targets as they move about. Even the minute head pul-
sations from blood pressure surges of heartbeats can be disturbing in some
cases. When people with vestibular disturbances cannot stabilize an image
on their moving retinas, they may also experience the disconcerting feel-
ing that the world is constantly moving around them. The sensation can
make walking and standing difficult. Compensatory adjustments come with
time, as the brain learns to substitute more visual and proprioceptive cues
to help guide smooth and accurate movements.
... CONCLUDING REMARKS
Hearing and balance begin with nearly identical sensory receptors, the hair
cells, which are exquisitely sensitive to deflections of their stereocilia. These
movement detectors are surrounded by three sets of inner ear structures
that give them selectivity for three different kinds of mechanical energy:
periodic waves of air pressure (sound), rotational forces (head turns), and
linear forces (head tilt). Except for the similarity in transduction, and the
fact that the hair cells of both systems are located in the inner ear, the
auditory and vestibular systems are quite different. The sound that audi-
tion senses comes mainly from the external environment, while the vestibu-
lar system senses only the movements of itself. Auditory and vestibular
pathways are entirely separate except perhaps at the highest levels of the
cortex. Auditory information is often at the forefront of our consciousness,
while vestibular sensation usually operates unnoticed to coordinate and
calibrate our every movement.
We have followed the auditory pathways from the ear to the cerebral
cortex and seen the ways in which information about sound is transformed.
Variations in the density of air molecules are converted to movements of
the mechanical components of the middle and inner ear, which are trans-
duced into neural responses. The structure of the ear and cochlea are highly
specialized for the transduction of sound. However, this fact should not
blind us to the considerable similarities between the organization of the au-
ditory system and that of other sensory systems. Many analogies can be
made between the auditory and visual systems. In the sensory receptors of
both systems, a spatial code is established. In the visual system, the code in
the photoreceptors is retinotopic; the activity of a given photoreceptor in-
I
dicates light at a particular location. The receptors in the auditory system
establish a spatial code that is tonotopic because of the unique properties
of the cochlea. In each system, the retinotopy or tonotopy is preserved as
signals are processed in secondary neurons, the thalamus, and finally in
sensory cortex.
The convergence of inputs from lower levels produces neurons at higher
levels that have more complex response properties. Combinations of LGN
inputs give rise to simple and complex receptive fields in visual cortex;
similarly in the auditory system, the integration of inputs tuned to differ-
ent sound frequencies yields higher-level neurons that respond to complex
combinations of frequencies. Another example of increasing visual com-
plexity is the convergence of inputs from the two eyes, which yields binoc-
ular neurons that are important for depth perception. Analogously, in the
auditory system. input from the two ears is combined to create binaural
neurons, which are used for horizontal sound localization. These are just a
few of the many similarities in the two systems. Principles governing one
system can often help us understand other systems. Keep this in mind
while reading about the somatic sensory system in the next chapter, and
you'll be able to predict some features of cortical organization based on the
types of sensory receptors.
.I'
>-V')
WL
a::
W
.....
Introduction
audition (p. 344)
vestibular system (p. 344)
The Nature of Sound
frequency (p. 344)
hertz (Hz) (p.345)
intensity (p. 346)
The Structure of the
Auditory System
pinna (p. 347)
auditory canal (p. 347)
tympanic membrane (p. 347)
ossicle (p. 347)
oval window (p. 347)
cochlea (p. 347)
outer ear (p. 348)
middle ear (p. 348)
inner ear (p. 348)
medial geniculate nucleus (MGN)
(p. 348)
primary auditory cortex (A I)
(p. 348)
The Middle Ear
malleus (p. 348)
incus (p. 348)
stapes (p. 348)
Eustachian tube (p. 348)
attenuation reflex (p. 350)
The Inner Ear
round window (p. 351)
scala vestibuli (p. 351)
scala media (p. 351)
scala tympani (p. 351)
Reissner's membrane (p. 351)
basilar membrane (p. 351)
organ of Corti (p. 351)
tectorial membrane (p. 351)
helicotrema (p. 351)
perilymph (p. 352)
endolymph (p. 352)
hair cell (p. 354)
stereocilium (p. 354)
reticular lamina (p. 354)
inner hair cell (p. 354)
outer hair cell (p. 354)
spiral ganglion (p. 354)
auditory-vestibular nerve (p. 354)
cochlear amplifier (p. 361)
Central Auditory Processes
dorsal cochlear nucleus (p. 363)
ventral cochlear nucleus (p. 363)
... CONCLUDING REMARKS 385
superior olive (p. 363)
inferior colliculus (p. 363)
characteristic frequency (p. 365)
Encoding Sound Intensity
and Frequency
tonotopy (p. 366)
phase locking (p.367)
volley principle (p. 368)
Mechanisms of Sound
Localization
duplex theory of sound
localization (p. 369)
The Vestibular System
vestibular labyrinth (p.377)
otolith organs (p.378)
semicircular canals (p. 378)
macula (p. 378)
ampulla (p. 380)
vestibular nucleus (p. 381)
vestibulo-ocular reflex (VOR)
(p. 382)
386 C HAP T E R I I . THE AUDITORY AND VESTIBULAR SYSTEMS
,£1j
t/')
z
W
0
>
W .....
a::. t/')
W
=>
a
I. How is the conduction of sound to the cochlea facilitated by the ossicles of the middle ear
2. Why is the round window crudal for the function of the cochlea What would happen to hearing if it
suddenly didn't exist
3. Why is it impossible to predict the frequency of a sound simply by looking at which portion of the basilar
membrane is the most deformed
4. Why would the transduction process in hair cells fail if the stereocilia as well as the hair cell bodies were
surrounded by perilymph
5. If inner hair cells are primarily responsible for hearing, what is the function of outer hair cells
6. Why doesn't unilateral damage to the inferior colliculus or MGN lead to deafness in one ear
7. What mechanisms function to localize sounds in the horizontal and vertical planes
8. What symptoms would you expect to see in a person who had recently had a stroke affecting A I unilat-
erally How does the severity of these symptoms compare with the effects of a unilateral stroke involv-
ing V I?
9. What is the difference between nerve deafness and conduction deafness
10. Each macula contains hair cells with kinocilia arranged in all directions. What is the advantage of this arrange-
ment, compared to an arrangement of all the cells in the same direction
II. Imagine a semicircul'ar canal rotating in two different ways: around its axis (like a rolling coin) or end over
end (like a flipped coin). How well would its hair cells respond in each case, and why
12. How would you expect the functions of the otolith organs and the semidrcular canals to change in the
weightless environment of space
6d
a::.l:)
Wz
I-
.....0
a::.«
=>w
u..a::.
Hudspeth AJ. 1997. How hearing happens. Neuron
19:947-950.
Joris PX, Schreiner CE, Rees A. 2004. Neural pro-
cessing of amplitude-modulated sounds. Physiologi-
cal Reviews 84:541-577.
Konishi M. 2003. Coding of auditory space. Annual
Review of Neuroscience 26:31-55.
Un SY, Corey OP. 2005. TRP channels in
mechanosensation. Current Opinion in Neurobiology
15:350-357.
Middlebrooks JC, Green OM. 1991. Sound localiza-
tion by human listeners. Annual Review of Psychol-
ogy 42: 135-159.
Palmer AR. 2004. Reassessing mechanisms of low-
frequency sound localisation. Current Opinion in
Neurobiology 14:457-460.
Santos-Sacchi J. 2003. New tunes from Corti's organ:
the outer hair cell boogie rules. Current Opinion in
Neurobiology 13:459-468.
CHAPTER
The Somatic
Sensory System
INTRODUCTION
TOUCH
MECHANORECEPTORS OF THE SKIN
Vibration and the Pocinian Corpuscle
Two-Point Discrimination
PRIMARY AFFERENT AXONS
THE SPINAL CORD
Segmental Organization of the Spinal Cord
. Box 12.1 Of Special Interest: Herpes, Shingles, and Dermatomes
Sensory Organization of the Spinal Cord
THE DORSAL COLUMN-MEDIAL LEMNISCAL PATHWAY
. Box 12.2 Brain Food: Lateral Inhibition
THE TRIGEMINAL TOUCH PATHWAY
SOMATOSENSORY CORTEX
Cortical Somatotopy
Corticol Mop Plasticity
. Box 12.3 Path of Discovery: When Brain Maps Collide, by Vilayanur S. Ramachandran
The Posterior Parietal Cortex
PAIN
. Box 12.4 Of Special Il1tere. t: The Misery of Life Without Pain
NOCICEPTORS AND THE TRANSDUCTION OF PAINFUL STIMULI
Types of Nociceptors
. Box 12.5 Of Special Interest: Hot and Spicy
Hyperalgesia
PRIMARY AFFERENTS AND SPINAL MECHANISMS
ASCENDING PAIN PATHWAYS
The Spinothalamic Pain Pathway
The Trigeminal Pain Pathway
The Thalamus and Cortex
THE REGULATION OF PAIN
Afferent Regulation
Descending Regulation
The Endogenous Opiates
. Box 12.6 Of Special Interest: Pain and the Placebo Effect
TEMPERATURE
THERMO RECEPTORS
THE TEMPERATURE PATHWAY
CONCLUDING REMARKS
388 C HAP T E R I 2 . THE SOMATIC SENSORY SYSTEM
T INTRODUCTION
The somatic sensory system brings us some of life's most enjoyable experi-
ences, as well as some of the most aggravating. Somatic sensation enables
our body to feel, to ache, to chill, and to know what its parts are doing. It
is sensitive to many kinds of stimuli: the pressure of objects against the
skin, the position of joints and muscles, distension of the bladder, and the
temperature of the limbs and of the brain itself. When stimuli become so
strong that they may be damaging, somatic sensation is also responsible for
the feeling that is most offensive, but vitally important-pain.
The somatic sensory system is different from other sensory systems in
two interesting ways. First, its receptors are distributed throughout the
body rather than being concentrated at small, specialized locations. Sec-
ond, because it responds to many different kinds of stimuli, we can think
of it as a group of at least four senses rather than a single one: the senses
of touch, temperature, pain, and body position. In fact, those four can in
turn be subdivided into many more. The somatic sensory system is really
a catch-all name, a collective category for all the sensations that are not
seeing, hearing, tasting, sme)]jng, and the vestibular sense of balance. The
familiar idea that we have only five senses is obviously too simple.
If something touches your finger, you can accurately gauge the place,
pressure, sharpness, texture. and duration of the touch. If it is a pinprick,
there is no mistaking it for a hammer. If the touch moves from your
hand to your wrist and up your arm to your shoulder, you can track its
speed and position. Assuming you are not looking, this information must
be entirely described by the activity of the sensory nerves in your limb.
A single sensory receptor can encode stimulus features such as intensity,
duration. position, and sometimes direction. But a single stimulus usu-
ally activates many receptors. The central nervous system interprets the
activity of the vast receptor array and uses it to generate coherent per-
ceptions.
In this chapter, we divide our discussion of somatic sensation into two
main parts: the sense of touch and the sense of pain. As we shall see, these
different categories depend on different receptors and different axonal
pathways. We also briefly discuss how we sense changes in temperature.
Discussion of the sense of body position, also called proprioception, is reserved
for Chapter 13, where we will explore how this type of somatic sensory
information is used to control muscle reflexes.
T TOUCH
The sensation of touch begins at the skin (Figure 12.1). The two major
types of skin are called hairy and glabrous (hairless), as exemplified by the
backs and palms of your hands. Skin has an outer layer, the epidermis. and
an inner layer, the dermis. Skin performs an essential protective function,
and it prevents the evaporation of body fluids into the dry environment we
live in. But skin also provides our most direct contact with the world-in-
deed, skin is the largest sensory organ we have. Imagine the beach with-
out the squish of sand between your toes, or consider watching a kiss in-
stead of experiencing it yourself. Skin is sensitive enough that a raised dot
measuring only 0.006 mm high and 0.04 mm wide can be felt when stroked
by a fingertip. For comparison, a Braille dot is 167 times higher.
In this section, we will see how a touch of the skin is transduced into
neural signals, how these signals make their way to the brain, and how the
brain makes sense of them.
.. Hairy skin - - Glabrous skin - -,
I I
I I
I I
I I
I I
I I
Merkel's :
disk
\
-
\
Epidermis
u r u
Dermis
luLu
Epidermal-
dermal border ___ \
Fre nerve .-. ' J-
endIng t
Meissner's ---------
corpuscle _____ I
.. -' \ ..
... ---.
---- c
Hair follicle :
receptor
\ ,
I
Pacinian ----- I
corpuscle
..
...
. ,
-
RuHini's
ending
Mechanoreceptors of the Skin
Most of the sensory receptors in the somatic sensory system are
mechanoreceptors, which are sensitive to physical distortion such as
bending or stretching. Present throughout the body, they monitor contact
with the skin, as well as pressure in the heart and blood vessels, stretching
of the digestive organs and urinary bladder, and force against the teeth. At
the heart of each mechanoreceptor are unmyelinated axon branches. These
axons have mechanosensitive ion channels; their gating depends on stretching,
or changes in tension, of the surrounding membrane.
The mechanoreceptors of the skin are shown in Figure 12.1. Most of
them are named after the nineteenth century German and Italian histolo-
gists who discovered them. The largest and best studied receptor is the
Pacinian corpuscle, which lies deep in the dermis; it can be as long as
2 mm and almost 1 mm in diameter-big enough to be seen with your
naked eye. Ruffini's endings, found in both hairy and glabrous skin, are
slightly smaller than Pacinian corpuscles. Meissner's corpuscles are about one-
tenth the size of Pacinian corpuscles and are located in the ridges of glabrous
skin (the raised parts of your fingerprints, for example). Located within the
epidermis, Merkel's disks each consist of a nerve terminal and a flattened,
non-neural epithelial cell. In this case, it may be that the epithelial cell is
the mechanically sensitive part, because it makes a synapse-like junction
with the nerve terminal. In Krause end bulbs, which lie in the border re-
gions of dry skin and mucous membrane (around the lips and genitals, for
example), the nerve terminals look like knotted balls of string.
Skin can be vibrated, pressed, pricked, and stroked, and its hairs can
be bent or pulled. These are quite different kinds of mechanical energy,
yet we can feel them all and easily tell them apart. Accordingly, we have
mechanoreceptors that vary in their preferred stimulus frequencies. pres-
sures, and receptive field sizes. Swedish neuroscientist Ake Vallbo and his
colleagues developed methods to record from single sensory axons in the
human arm, so that they could simultaneously measure the sensitivity of
mechanoreceptors in the hand and evaluate the perceptions produced by
various mechanical stimuli (Figure 12.2a). When the stimulus probe was
... TOUCH 389
FIGURE 12.1
Somatic sensory receptors in the skin.
HairY and glabrous skin have a vanety of
sensory receptors within the dermal and
epidermal layers. Each receptor has an axon,
and except for free nerve endings, all of them
have assoCiated non-neural tissues.
390 C HAP T E R I 2 . THE SOMATIC SENSORY SYSTEM
11I11111111111
Recording
electrode
Meissner's corpuscles
(a)
(b)
Pacini an corpuscles
FIGURE 12.2
Testing the receptive fields of human sensory receptors. (a) By IntroduCing
a microelectrode Into the median nerve of the arm, it is possible to record the action
potentials from a single sensory axon and map its receptive field on the hand with a
fine stimulus probe. (b) Results show that receptive fields are either relatively small, as In
Meissner's corpuscles, or large, as in Pacinlan corpuscles. (Source: Adapted from Vallbo
and Johansson, 1984.)
touched to the surface of the skin and moved around, the receptive field
of a single mechanoreceptor could be mapped. Meissner's corpuscles and
Merkel's disks had small receptive fields, only a few millimeters wide,
while Pacinian corpuscles and Ruffini's endings had large receptive fields
that could cover an entire finger or half the palm (Figure 12.2b).
Mechanoreceptors also vary in the persistence of their responses to long-
lasting stimuli. If a stimulus probe is suddenly pressed against the skin
within the receptive field, some mechanoreceptors, such as Meissner's and
Pacinian corpuscles, tend to respond quickly at first but then SlOp firing
even though the stimulus continues; these receptors are said to be rapidly
adapting. Other receptors, such as Merkel's disks and Ruffini's endings, are
slowly adapting and generate a more sustained response during a long stim-
ulus. Figure 12.3 summarizes the receptive field size and adaptation rate for
four mechanoreceptors of the skin.
Hairs do more than adorn our head and keep a dog warm in winter.
Many hairs are part of a sensitive receptor system. To demonstrate this,
brush just a single hair on the back of your arm with the tip of a pencil; it
feels like an annoying mosquito. For some animals, hair is a major sensory
system. Imagine a rat slinking confidently through dark passageways and
alleys. The rat navigates in part by waving its facial vibrissae (whiskers) to
sense the local environment and derive information about the texture, dis-
tance, and shape of nearby objects.
FIGURE 12.3
Variations of four somatic sensory skin
receptors in receptive field size and
adaptation rate. (Source: Adapted from
Vallbo and Johansson, 1984.)
Receptive field size
Small Large
Meissne(s corpuscle Pacinian corpuscle
-
Rapid
c:
.2 I1II1 I I I II
co
0..
co Merkel's disk Ruffini's ending
"C
« Slow
1111111111111 II III I 1111111111111I1
Stimulus probe
movement
Axon firing
Hairs grow from follicles embedded in the skin; each follicle is richly in-
nervated by free nerve endings that either wrap around it or run parallel
to it (see Figure 12.1). There are several types of hair follicles, including
some with erectile muscles (essential for mediating the strange sensations
we know as goosebumps), and the details of their innervation differ. In all
cases, the bending of the hair causes a deformation of the follicle and sur-
rounding skin tissues. This, in turn, stretches, bends, or flattens the nearby
nerve endings, which then increase or decrease their action potential firing
frequency. The mechanoreceptors of hair follicles may be either slowly
adapting or rapidly adapting.
The different mechanical sensitivities of mechanoreceptors mediate dif-
ferent sensations. Pacinian corpuscles are most sensitive to vibrations of
about 200-300 Hz, while Meissner's corpuscles respond best around 50 Hz
(Figure 12.4). Place your hand against a speaker while playing your favorite
music loudly; you "feel" the music largely with your Pacinian corpuscles.
If you stroke your fingertips across the coarse screen covering the speaker,
each point of skin will hit the bumps at frequencies about optimal to acti-
vate Meissner's corpuscles. You feel this as a sensation of rough texture.
Stimulation of even lower frequency can activate Ruffini's endings and
Meissner's corpuscles and yields a "fluttering" feeling.
Vibration and the Padnian Corpuscle. The selectivity of a mechano-
receptive axon depends primarily on the structure of its special ending.
For example, the Pacinian corpuscle has a football-shaped capsule with
20-70 concentric layers of connective tissue, arranged like the layers of an
onion, with a nerve terminal in the middle (see Figure 12.1). When the
capsule is compressed. energy is transferred to the nerve terminaL its mem-
brane is deformed, and mechanosensitive channels open. Current flowing
through the channels generates a receptor potential, which is depolarizing
(Figure 12.5a). If the depolarization is large enough, the axon will fire an
Stimulus
probe
Axon
Capsule
.
. t
Intact
corpuscle
t
t
Receptor
potential
Time
(a)
Axon
\
.
t
.
Stripped
corpuscle
Receptor
potential
Time
...
(b)
... TOUCH 391
E
2-
<:
Q
1iJ
1: 1000
OJ
"0
E
<:
100
Meissner's corpuscle
o
1:
5 10
E
C\j
"0
<5
.<::
(/)
OJ
1:
f--
10 50 100 300 1000
Stimulus frequency (Hz)
FIGURE 12.4
Frequency sensitivity of two rapidly
adapting skin mechanoreceptors.
Pacinian corpuscles are most sensitive to hlgh-
frequency stimuli, and Meissner's corpuscles
are more sensitive to low-frequency stimulI.
The skin was Indented with a pressure probe,
at various frequencies, while recording from
the nerve. The amplitude of the stimulus was
increased until it generated action potentials;
threshold was measured as the amount of
skin indentation In micrometers (!-1m)
(Source; Adapted from Schmidt, 1978.)
FIGURE 12.5
Adaptation in the Pacinian corpuscle.
A single Pacinian corpuscle was isolated and
stimulated by a probe that indented it briefly.
The receptor potential was recorded from a
nearby portion of the axon, (a) In the intact
corpuscle, a large receptor potential was
generated at the onset and offset of the
stimulus; during maintained indentation, the
receptor potential disappears. (b) The onion-
like encapsulation was dissected away, leaving
a bare axon ending. When indented by the
probe, a receptor potential was again gener-
ated, so the capsule is not necessary for
mechanoreception. But while the normal cor-
puscle responded only to the onset or offset
of a long ,ndentation, the stripped version
gave a much more prolonged response; its
adaptation rate was slowed. Apparently, it is
the capsule that makes the corpuscle insensi-
tive to low-frequency stimuli.
392 C HAP T E R I 2 . THE SOMATIC SENSORY SYSTEM
Big toe
Sole
Calf
/ t
Y' "
, 42 mm
Forearm
FIGURE 12.6
Two-point discrimination on the
body surface. The pairs of dots show the
minimum distance necessdry to differentiate
between two points touching the body simul-
taneously. Notice the sensitivity of the finger-
tips compared to the rest of the body.
c..\ .
I
.'
{ .",
,1J L ; ,
1 '
A I( I ,
II {, 'I I.,
it l "?
...., \1
"t r '; f - - 4\
;I;, '" , \ .,
'! _-r- {\I
< ,'/ t
I. \ . ' 'I .
.. .'"
J' f
' "\1
1 4
,I ,
)\ ,
<
\\\\
FIGURE IV
The peripheral nerves.
action potential. But the capsule layers are slick, with viscous fluid between
them. If the stimulus pressure is maintained, the layers slip past one another
and transfer the stimulus energy in such a way that the axon terminal is
no longer deformed, and the receptor potential dissipates. When pressure
is released, the events reverse themselves; the terminal depolarizes again
and may fire another action potential.
In rhe 1960s, Werner Loewenstein and his colleagues, working at Colum-
bia University, stripped away the capsule from single corpuscles and found
that the naked nerve terminal became much less sensitive to vibrating
stimuli and much more sensitive to steady pressure (Figure 12.5b). Clearly,
it is the layered capsule (and not some property of the nerve ending itself)
that makes the Pacinian corpuscle exquisitely sensitive to vibrating, high-
frequency stimuli, and almost unresponsive to steady pressure.
Two-Point Discrimination. Our ability to discriminate the detailed fea-
tures of a stimulus varies tremendously across the body. A simple measure
o[ spatial resolution is the two-point discrimination test. You can do this
yourself with a paper clip bent into rhe shape of a U. Start with the ends
about an inch apart, and touch them to the tip of a finger; you should have
no problem telling that there are two separate points touching your finger.
Then bend the wire to bring the points closer together, and touch them to
your fingertip again. Repeat, and see how close the points have to be before
they [eel like a single point. (This test is best done with two people, one
testing and the other being tested without looking.) Now try it on the back
of your hand, on your lips, on your leg, and any other place that interests
you. Compare your results with those shown in Figure 12.6.
Two-point discrimination varies at least twentyfold across the body.
Fingertips have the highest resolution. The dots of Braille are 1 mm high
and 2.5 mm apart; up to six dots make a letter. An experienced Braille
reader can scan an index finger across a page of raised dots and read about
600 letters per minute, which is roughly as fast as someone reading aloud.
Several reasons explain why the fingertip is so much better than, say, the
elbow for Braille reading: (1) There is a much higher density of mechano-
receptors in the skin of the fingertip than on other pans of the body; (2)
the fingertips are enriched in receptor types that have small receptive fields;
(3) there is more brain tissue (and thus more raw computing power) de-
voted to the sensory information of each square millimeter of fingertip than
elsewhere; and (4) there may be special neural mechanisms devoted to
high - resol u tion discrimina tions.
Primary Afferent Axons
The skin is ri.chly innervated by axons that course through the vast network
of peripheral nerves on their way to the central nervous system (CNS) (Fig-
ure 12.7). Axons bringing information from the somatic sensory receptors to
the spinal cord or brain stem are the prim my afferent axons of the somatic sen-
sory system. The primary afferent axons enter the spinal cord through the
dorsal roots; their cell bodies lie in the dorsal root ganglia (Figure 12.8).
Primary afferent axons have widely varying diameters, and their size cor-
relates with the type of sensory receptor to which they are attached. Un-
fortunately, the terminology approaches absurdity here because the differ-
ent sizes 01 axons are designated by two sets of names, using Arabic and
Greek letters and Roman numerals. As shown in Figure 12.9, in order of
decreasing size, axons from skin sensory receptors are usually designated
Au, Af3, AO, and C; axons of similar size, but innervating the muscles and
tendons, are called groups I, II, Ill, and IV. Note that sensory nerves from
Gray matter
\
White matter
/
-
--
.
Dorsal root
/ Dorsal root ganglion
, _______ Dorsal root
\ "y 1 9angliOn cell
Sensory
""' receptor
'-J
\
----
Ventral
root
Spinal
nerve
the skin lack the largest (Au) group ofaxons. Group C (or IV) axons are,
by definition, unmyelinated axons. while all the rest are myelinated.
An interesting and simple point is hidden in the many axon names. Re-
call that the diameter of an axon, together with its myelin, determines its
speed of action potential conduction. The smallest axons, the so-called C
fibers, have no myelin and are less than about 1 pm in diameter. C fibers
mediate pain and temperature sensation, and they are the slowest ofaxons,
o conducting at about 0.5-2 m/see. To see how slow this' is, take a big step,
count to two, and then take another step. That's about how fast the action
potentials travel along C fibers. On the other hand, touch sensations, medi-
ated by the cutaneOus mechanoreceptors, are conveyed by the relatively
Axons Au AI3 AO C
from skin
Axons Group I II III IV
from
muscles
.(. -';. . ..
Diameter 13-20 6-12 1-5 0.2-1.5
(f.lIT1)
Speed 80-120 35-75 5-30 0.5-2
(m/sec)
Sensory Proprioceptors Mechanoreceptors Pain, Temperature,
receptors of skeletal muscle of skin temperature pain, itch
T TOUCH 393
FIGURE 12.8
The structure of a segment of the
spinal cord and its roots.
FIGURE 12.9
Various sizes of primary afferent axons.
The axons are drawn to scale. but they are
shown 2000 times larger than life size. The
diameter of an axon is correlated with its con-
duction velocity and with the type of sensory
receptor to which it is connected.
394 C HAP T E R I 2 . THE SOMATIC SENSORY SYSTEM
large AI3 axons, which can conduct at up to 75 m/see. For comparison, con-
sider that a good major league baseball pitcher can throw a fastball about
90 miles per hour, which is only 40 m/see.
The Spinal Cord
Most peripheral nerves communicate with the CNS via the spinal cord,
which is encased in the bony vertebral column.
Segmental Organization of the Spinal Cord. The arrangement of paired
dorsal and ventral roots shown in Figure 12.8 is repeated 30 times down
the length of the human spinal cord. Each spinal nerve, consisting of dor-
sal root and ventral root axons, passes through a notch between the verte-
brae (the "back bones") of the spinal column. There are as many spinal
nerves as there are notches between vertebrae. As shown in Figure 12.10,
the 30 spinal segments are divided into four groups, and each segment is
Spinal cord
---- Vertebra
Cervical
cord I Cervical I
-
.----'
Thoracic
cord ___
I Thoracic I
--'
Lumbar -
cord
Sacral I Lumbar I
cord
Spinal nerves
I
FIGURE 12.10
Segmental organization of the spinal cord. The spinal cord is divided into cervical,
thoracic. lumbar. and sacral divisions (left). The right side shows the spinal cord within the
vertebral column. Spinal nerves are named for the level of the spinal cord from which they
exit and are numbered in order from rostral to caudal.
C5
C6
C7
C8
.. TOUCH ]95
Cervical
C7
C8
Thoracic
C6
Lumbar
L5
S1
S2
L3
Sacral
L5
L4
FIGURE 12.11
Dermatomes. These illustrations show the mapping of the approximate boundaries of the
dermatomes on the body.
named after the vertebra adjacent to where the nerves originate: cervical
(C) 1-8, thoradc (T) 1-12, lumbar (L) 1-5, and sacral (S) 1-5.
The segmental organization of spinal nerves and the sensory innervation
of the skin are related. The area of skin innervated by the right and left dor-
sal roots of a single spinal segment is called a dermatome; thus, there is a
one-to-one correspondence between dermatomes and spinal segments. When
mapped, the dermatomes delineate a set of bands on the body surface, as
shown in Figure 12.11. The organization of the dermatomes is best revealed
when one bends over to stand on both hands and feet (Figure 12.12). This
organization presumably reflects our distant quadripedal ancestry.
396 C HAP T E R I 2 . THE SOMATIC SENSORY SYSTEM
Cervical
Thoracic
FIGURE '2.12
Dermatomes on all fours.
Box 12.1
.... , ..
OF SPECIAL INTEREST
When a dorsal root is cut, the corresponding dermatome on that side of the
body does not lose all sensation. The residual somatic sensation is explained
by the fact that the adjacent dorsal roots innervate overlapping areas. To lose
all sensation in one dermatome, therefore, three adjacent dorsal roots must
be cut. However, the skin innervated by the axons of one dorsal root is
plainly revealed by a condition called shingles, in which all the neurons of
a single dorsal root ganglion become infected with a virus (Box 12.1).
Notice in Figure 12.10 that the spinal cord in the adult ends at about the
level of the third lumbar vertebra. The bundles of spinal nerves streaming
down within the lumbar and sacral vertebral column are called the cauda
equina, Latin for "horse's tail." The cauda equina courses down the spinal
column within a sack of dura, filled with cerebral spinal fluid (CSF). In a
method called lumbar puncture, used to collect CSF for medical diagnostic
tests, a needle is inserted into this CSF-filled cistern at the midline (this pro-
cedure is also called a spinal tap). If the needle is inserted a little off cen-
ter, however, a nerve can be touched. Not surprisingly, this causes a sen-
sation of sharp pain in the dermatome supplied by that nerve.
Sensory Organization of the Spinal Cord. The basic anatomy of the
spinal cord was introduced in Chapter 7. The spinal cord is composed of an
inner core of gray matter, surrounded by a thick covering of white matter
tracts that are often called columns. Each half of the spinal gray matter is
divided into a dorsal horn, an intermediate zone, and a ventral horn (Figure
. ...
4 ...
Herpes, Shingles, and Dermatomes
As children, most of us were infected by the herpes zoster
virus. commonly known as chickenpox. After a week or
so covered with red. itchy spots on our skin, we usually
recovered. Out of sight is not out of body. however. The
virus remains in our primary sensory neurons, dormant
but viable. Most people never hear from it again, but in
some cases the virus revives decades later. wreaking havoc
with the somatic sensory system. The result is shingles, a
condition that can be agonizingly painful for periods of
months or even years. The reactivated virus increases the
excitability of the sensory neurons, leading to very low
thresholds of firing as well as spontaneous activity. The
pain is a constant burning. sometimes a stabbing sensa-
tion. and the skin is exquisitel,y sensitive to any stimulus.
People with shingles often shun clothes because of their
hypersensitivity. The skin itself becomes inflamed and blis-
tered. then scaly-hence, the name (Figure A).
Fortunately, the herpes virus usually reactivates only in
the neurons of one dorsal root ganglion. This means that
the symptoms are restricted to the skin innervated by the
axons of the affected dorsal root. In effect, the virus per-
forms an anatomical labeling experiment for us by dearly
marking the skin territory of one dermatome. Almost
"
FIGURE A
Skin lesions caused
by shingles, confined
to the L 4 dermatome
on the left side.
any dermatome may be involved, although the thoracic
and facial areas are most common. Observations of many
shingles patients and their infected areas were actually
useful in mapping the dermatomes (see Figure 12.11).
Neuroscientists are now learning to use herpes. and
other viruses. to their advantage. Viruses are valuable re-
search tools because they can be used to introduce new
genes into neurons.
T TOUCH 397
Dorsal COI .
Dorsal \
horn "-
\
To
brain
/
>< ; / \
. -/
Intermediate
zone Ventral horn
FIGURE 12.13
The trajectory of the touch-sensitive Ap axons in the spinal cord.
12.13). The neurons that receive sensory input from primary afferents are
caned second-order sensory neurons. Most of the second-order sensory neurons
of the spinal cord lie within the dorsal horns.
The large, myelinated Aj3 axons conveying information about a touch to
the skin enter the dorsal horn and branch. One branch synapses in the deep
part of the dorsal horn on second-order sensory neurons. These connec-
tions can initiate or modify a variety of rapid and unconscious reflexes. The
other branch of the A primary afferent axon ascends straight to the brain.
This ascending input is responsible for perception, enabling us to form
complex judgments about the stimuli touching the skin.
The Dorsal Column-Medial lemniscal Pathway
Information about touch or vibration of the skin takes a path to the brain
that is entirely distinct from that taken by information about pain and tem-
perature. The pathway serving touch is called the dorsal column-medial
lemniscal pathway, for reasons we will see in a moment. The organiza-
tion of this pathway is summarized in Figure 12.14.
The ascending branch of the large sensory axons (Aj3) enters the ipsilat-
eral dorsal column of the spinal cord, the white matter tract medial to the
dorsal horn (see Figure 12.13). The dorsal columns carry information about
tactile sensation (and limb position) toward the brain. They are composed
of primary sensory axons, as well as second-order axons from neurons in
the spinal gray matter. The axons of the dorsal column terminate in the
dorsal column nuclei, which lie at the junction of the spinal cord and
medulla. Consider that some of the axons terminating in the dorsal column
nuclei at the base of your head originate as far away as the skin of your big
toe! This is a fast, direct path that brings information from the skin to the
brain without an intervening synapse.
At this point in the pathway, information is still represented ipsilaterally;
that is, touch information from the left side of the body is represented in the
activity of cells in the left dorsal column nuclei. However, axons from cells
of the dorsal column nuclei arch toward the ventral and medial medulla,
and decussate. From this point onward, the somatic sensory system of one side of the
brain is concerned with sensations deriving from the other side of the body.
The axons of the dorsal column nuclei ascend within a conspicuous
white matter tract called the medial lemniscus. The medial lemniscus
rises through the medulla, pons, and midbrain, and its axons synapse
398 C HAP T E R I 2 . THE SOMATIC SENSORY SYSTEM
@
\,
\.)' ,\\
r --./'\
J (
. it :
I'.
2 /
CD
Large dorsal
root axons
Primary
somatosensory
cortex (S 1)
'--
,
-\)
\
'\
(.,
1
@
Dorsal column
nuclei
Thalamus
(VP nucleus)
.'
'2'
\6.!
. ---- Medulla
Medial
.L lemniscus
CD
Dorsal
column
1
..
I
___ Spinal cord
FIGURE 12.14
The dorsal column-medial lemniscal pathway.
This IS the major route by which touch and proprio-
ceptive Information ascend to the cerebral cortex.
upon neurons of the ventral posterior (VP) nucleus of the thalamus.
Remember that no sensory information goes directly into the neocortex
without first synapsing in the thalamus. Thalamic neurons of the VP nu-
cleus then project to specific regions of primary somatosensory cortex,
or 51.
ft is tempting to assume that sensory information is simply transferred,
unchanged, through nuclei in the brain stem and thalamus on its way to
the cortex, with the actual processing taking place only in the cortex. In
fact, this assumption is demonstrated by the term relay nuclei, which is of-
ten used to describe specific sensory nuclei of the thalamus such as the
VP nucleus. Physiological studies prove otherwise, however. In both dorsal
column and thalamic nuclei, considerable transformation of information
takes place. As a general rule, information is altered every time it passes
through a set of synapses in the brain. In particular, inhibitory interac-
tions between adjacent sets of inputs in the dorsal column-medial lem-
niscal pathway enhance the responses to tactile stimuli (Box 12.2). As
Box 12.2
(:)
BRAIN FOOD
Lateral Inhibition
Information is usually transformed as it is passed from
one neuron to the next in a sensory pathway. One com-
mon transformation is the amplification of differences in
the activity of neighboring neurons, also known as contrast
enhancement. We already saw this in retinal ganglion cell
receptive fields (see Chapter 9). If all the photoreceptors
providing input to a ganglion cell are evenly illuminated,
the cell hardly notices. However, if there is a contrast
border-a difference in illumination-within the cell's re-
ceptive field, the cell's response is strongly modulated.
Contrast enhancement is a general feature of information
processing in sensory pathways, including the somatic sen-
sory system. One general mechanism underlying contrast
enhancement is lateral inhibition, whereby neighboring
cells inhibit one another. Let's see how this works, using
a simple model.
Consider the situation in Figure A. Dorsal root ganglion
neurons lettered a through g relay information to dorsal
column nucleus neurons A through G. Let's assume that
.... TOUCH 399
the output of the dorsal column nucleus cells is simply
the presynaptic input multiplied by a synaptic gain factor
of I. If the input activity of cell d is 10, the output activ-
ity of cell D is also 10. This simple relay does nothing to
enhance the difference between the more active neuron,
d, and the others.
Now consider the situation in Figure B, where inhibitory
interneurons have been added that project laterally to
inhibit each cell's neighbor. The synaptic gain of the in-
hibitory synapses (black triangles) is -I, and we've ad-
justed the gain of the excitatory synapses, as shown in
the figure. Calculate the activity of each cell by multiply-
ing the input to each synapse by its synaptic gain, and then
summing the effect of all the synapses on the cell. If you
perform this calculation, you will see that there is signifi-
cant contrast enhancement: The difference between the
activity in cell d and its neighbors has been greatly ampli-
fied in the output of cell D.
Input in Output in Input in
spikes/see spikes/see spikes/see
-t+I-tt 5 1X <J 5 +tt+t +++++ 5
+tt+t 5 $ 1X <J @--- 5 ++-t--t+ +tttt 5
++-t--t+ 5 0 1X <J @-- 5 -t++t+ +tt+t 5
{ Stimulus { Stimulus
tttH-IHtt 10 1x <J @-- 10 tttH-IHtt tttItttHt 10
+++++ 5 1X <J @--- 5 +++++ +++++ 5
t+tt+ 5 CD 1X <J <D--- 5 +++++ +++++ 5
+++++ 5 1X <J @--- 5 +++t+ +++++ 5
FIGURE A FIGURE B
Output in
spikes/see
-t++t+
+t+t+
t!IIIIIIKflIIIt
+++t+
+++t+
we will see below, some synapses in these nuclei can also change their
strength, depending on their recent activity. Neurons of both the thala-
mus and the dorsal column nuclei are also control1ed by input from the
cerebral cortex. Accordingly, the output of the cortex can influence the
input of the cortex!
400 C HAP T E R I 2 . THE SOMATIC SENSORY SYSTEM
o
,-... 1\ tv.
Yr\
r
? \- .
/"0)
The Trigeminal Touch Pathway
Thus far. we have described only the part of the somatic sensory system
that enters the spinal cord. If this were the whole story, your face would
be numb. Somatic sensation of the face is supplied mostly by the large
trigeminal nerves (cranial nerve V), which enter the brain at the pons.
(The word is from the Latin tria, "three," andgeminus, "twin.") There are twin
trigeminal nerves, one on each side, and each breaks up into three periph-
eral nerves that innervate the face, mouth areas, the outer two-thirds of the
tongue, and the dura mater covering the brain. Additional sensation from
the skin around the ears, nasal areas, and pharynx is provided by other
cranial nerves: the facial (VII), glossopharyngeal (IX), and vagus (X).
The sensory connections of the trigeminal nerve are analogous to those of
the dorsal roots. The large-diameter sensory axons of the trigeminal nerve
carry tactile information from skin mechanoreceptors. They synapse onto
second-order neurons in the ipsilateral trigeminal nucleus, which is analo-
gous to a dorsal column nucleus (Figure 12.15). The axons from the trigem-
inal nucleus decussate and project into the medial part of the VP nucleus
of the thalamus. From here, information is relayed to the somatosensory
cortex.
Primary
somatosensory
cortex (S1)
...
--.'r-
..... -
"'
)
\
'\
.J
\
(
@
"
\
Thalamus
(VP nucleus)
Principal sensory
trigeminal nucleus
\
Large mechano-
receptor axons
from face
Trigeminal nerve
(cranial nerve V)
FIGURE 12.15
The trigeminal nerve pathway. This IS the
route by which somatosensory information from
the face reaches the cerebral cortex
Central
sulcus \
-
Somatosensory cortex
(areas 1, 2, 3a, 3b)
J
r'
Posterior parietal
cortex (areas 5, 7)
...
.
\
\.
( /
/
"k-
"' ostcentral \
gyrus
/
FIGURE 12.16
Somatic sensory areas of the cortex.
All of the illustrated areas lie in the parietal
lobe. The lower drawing shows that the
postcentral gyrus contains S I, area 3b.
Somatosensory Cortex
As with all other sensory systems, the most complex levels of somatosen-
sory processing occur in the cerebral cortex. Most of the cortex concerned
with the somatic sensory system is located in the parietal lobe (Figure
12.16). Brodmann's area 3b, now regarded as the primary somatosensory
cortex (Sl), is easy to find in humans because it lies on the postcentral
gyrus (right behind the central sulcus). Sl is flanked by other cortical areas
that also process somatic sensory information. These include areas 3a, 1,
and 2 on the postcentral gyrus, and areas 5 and 7 on the adjacent poste-
rior parietal cortex (see Figure 12.16).
Area 3b is the primary somatic sensory cortex because (1) it receives
dense inputs from the VP nucleus of the thalamus; (2) its neurons are
very responsive to somatosensory stimuli (but not to other sensory stim-
uli); (3) lesions here impair somatic sensation; and (4) electrically stimu-
lated, it evokes somatic sensory experiences. Area 3a also receives a dense
input from the thalamus; however, this region is concerned with the sense
of body position rather than touch.
Areas 1 and 2 receive dense inputs from area 3b. The projection from 3b
to area 1 sends mainly texture information, while the projection to area 2
emphasizes size and shape. Small lesions in area 1 or 2 produce predictable
deficiencies in discrimination of texture, size, and shape.
Somatosensory cortex. like other areas of neocortex, is a layered struc-
ture. As is the case for visual and auditory cortex, the thalamic inputs to
S 1 terminate mainly in layer IV. The neurons of layer IV project, in turn,
to cells in the other layers. Another important similarity with other regions
of cortex is that S 1 neurons with similar inputs and responses are stacked
vertically into columns that extend across the cortical layers (Figure 12.17).
T TOUCH 40 I
\\(
I
/ \
'k. ( { ..::!
D1
FIGURE 12.17
Columnar organization of S I. Each finger
(01-03) is represented by an adjacent area
of cortex. Within the area of each finger rep-
resentation are alternating columns of cells
with rapidly adapting (green) and slowly
adapting (red) sensory responses. (Source:
Adapted from Kaas et aI., 1981. Fig. 8.)
402 C HAP T E R I 2 . THE SOMATIC SENSORY SYSTEM
Jl
r"
( ,,(
"
- G
)
4[' .c-... " '
\
FIGURE 12.18
A somatotopic map of the body surface
onto primary somatosensory cortex.
This map is a cross section through the post-
central gyrus (shown at top). Neurons in each
area are most responsive to the parts of the
body illustrated above them. (Source: Adapted
from Penfield and Rasmussen, 1952.)
In fact, the concept of the cortical column, so beautifully elaborated by
Hubel and Wiesel in visual cortex, was actually first described in somato-
sensory cortex by Johns Hopkins University scientist Vernon Mountcastle.
Cortical Somatotopy. Electrical stimulation of the SI surface can cause
somatic sensations localized to a specific part of the body. Systematically
moving the stimulator around SI will cause the sensation to move across
the body. Canadian neurosurgeon Wilder Penfield, working at McGill
University from the 1930s through the 1950s, actually used this method to
map the cortex of neurosurgical patients. (It is interesting to note that
these brain operations can be performed in awake patients, with only local
anesthesia of the scalp, because the brain tissue itself lacks the receptors of
somatic sensation.) Another way to map the somatosensory cortex is to record
the activity of a single neuron and determine the site of its somatosensory
receptive field on the body. The receptive fields of many SI neurons pro-
duce an orderly map of the body on the cortex. The mapping of the body's
surface sensations onto a structure in the brain is called somatotopy. We
have seen previously that the brain has maps of other sensory surfaces,
such as the light-sensitive retina in the eye (retinotopy) and the frequency-
sensitive cochlea in the inner ear (tonotopy).
Somatotopic maps generated by stimulating and recording methods are
similar and roughly resemble a trapeze artist hanging upside down, his
legs hooked over the top of the postcentral gyrus and dangling into the
medial cortex between the hemispheres, and his head at the opposite,
lower end of the gyrus (Figure 12.18). A somatotopic map is sometimes
called a homunculus (from the Latin diminutive of "man"; the little man in
the brain).
Two things are obvious about a somatotopic map. First, the map is not
always continuous but can be broken up. Notice in Figure 12.18 that the
---
-1'\ :I:Z:-f
9.. 6' re
(\) Cl3a.",,,,";:r
.
" ,<:'." \ . \,'
c& "" \
&.0.0 .
&r Ii "-
/... . '""-..
IpS
Lowerlip
--
Teeth _
Gums
Jaw-
-{
---------- Foot
Toe'
Genitals
,# //
:(\'1- /
0
«'C' f
p
q;
,
representation of the hand separates that of the face and the head, while
the genitals are mapped onto the most hidden part of S L somewhere be-
low the toes. Second, the map is not scaled like the human body. Instead,
it looks like a caricature (Figure 12.19): The mouth, tongue, and fingers are
absurdly large, while the trunk, arms, and legs are tiny. The relative size of
cortex devoted to each body part is correlated with the density of sensory
input received from that part. Size on the map is also related to the impor-
tance of the sensory input from that part of the body; information from your
index finger is more useful than that from your elbow. The importance of
touch information from our hands and fingers is obvious, but why throw
so much cortical computing power at the mouth? 1\vo likely reasons are
that tactile sensations are important in the production of speech and that
your lips and tongue (feeling, as well as tasting) are the last line of defense
when deciding if a morsel is delicious, nutritious food, or something that
could choke you, break your tooth, or bite back. As we will see in a mo-
ment, the importance of an input, and the size of its representation in cor-
tex, are also reflections of how often it is used.
The importance of a body part can vary greatly in different species. For
example, the large facial vibrissae (whiskers) of rodents receive a huge
share of the territory in S 1, while the digits of the paws receive relatively
little (Figure 12.20). Remarkably, the sensory signals from each vibrissa
follicle go to one clearly defined cluster of S 1 neurons; such clusters are
called barrels. The somatotopic map of rodent vibrissae is easily seen in thin
sections of SI; the five rows of cortical barrels precisely match the five rows
of facial vibrissae.
Somatotopy in the cerebral cortex is not limited to a single map, Just as
the visual system builds multiple retinotopic maps, the somatic sensory
system has several maps of the body. Figure 12.21 shows the detailed
somatotopy of S 1 in an owl monkey, Carefully compare the maps in areas
\t L
- -,: \
..... .....- .'
. I .
.
Vibrissae
Follicles
'-
.
....... ). .
" .
.
...
t.'
(a)
FIGURE 12.20
A somatotopic map of the facial vibrissae on mouse cerebral
cortex. (a) The position of the major vibrissae on the face. (b) A somato-
topic map within S I of the mouse brain. (c) Barrels within S I. The cortex
has been thinly sectioned parallel to the surface and Nissl stained. The Inset
shows the pattern of barrels. laid out in five rows; compare with the five
rows of vibnssae in the photograph in part a. (Source: Adapted from
Woolsey and Van der Loos. 1970).
TOUCH 403
,, -'"
"'
\.
"
FIGURE 12.19
The homunculus.
. .",
.... ,*",
/. .
'. 1b ...,.
. "
. :.1."'" .:....
.
1r " .
I
(c)
.....
,
.' .
. '"f ..
1 ,," .,
' , f " ..: .....
.,. .
... t: '\0 '
. '. . "
Barrels
inS1
I
. :
.-t. 1IiI .
'')0
--
1 mm
.-.
"'-" .
"--:.!!Iii .
I ...-
.-"'lI;. I
. I
404 C HAP T E R I 2 . THE SOMATIC SENSORY SYSTEM
FIGURE 12.21
Multiple somatotopic maps. Recordings
were made from areas 3b and I of an owl
monkey. (a) Results show that each area
has Its own somatotopic map. (b) Detailed
examination of the hand area shows that the
two maps are mirror images. Shaded regions
represent the dorsal surfaces of the hands
and feet, unshaded regions the ventral
surfaces. (Source: Adapted from Kaas et aI.,
1981.)
Leg- -
Sole
)
Thigh
Trunk
Arm
Wrist
Palm
Chin
Caudal
vibrissae
Lower lip -
Area
3b
Upper lip
Teeth
1 mm
(a)
Fingers
3b and 1; they map the same parts of the body, literally in parallel along
adjacent strips of cortex. The two somatotopic maps are not identical, but
mirror images, as an enlargement oj the hand regions makes clear (Fig-
ure 12.21b).
Cortical Map Plasticity. What happens to the somatotopic map in cortex
when an input, such as the finger, is removed? Does the "finger area" of
cortex simply go unused? Does it atrophy? Or is this tissue taken over by
inputs from other sources? The answers to these questions could have
important implications for the recovery of function after peripheral nerve
injury. In the 1980s, University of California at San Francisco neuroscientist
Michael Merzenich and his associates began a series of experiments to test
the possibilities.
The key experiments are summarized in Figure 12.22. First, the regions
of S 1 sensitive to stimulation of the hand in an adult owl monkey were
carefully mapped with microelectrodes. Then, one finger (digit 3) on the
hand was surgically removed. Several months later, the cortex was again
mapped. The answer? The cortex originally devoted to the amputated digit
now responded to stimulation of the adjacent digits (Figure 12.22c). There
clearly had been a major rearrangement of the circuitry underlying cortical
somatotopy.
In the amputation experiment, the cause of this map rearrangement was
the absence of input from the missing digit. What happens when the input
aCIivity from a digit is increased? To answer this question, monkeys were
trained to use selected digits to perJorm a task for which they received a
food reward. After several weeks of this training, microelectrode mapping
experiments showed that the representation of the stimulated digits had
expanded in comparison with the adjacent, unstimulated ones (Figure
12.22d). These experiments reveal that cortical maps are dynamic and ad-
... TOUCH 405
(a) Location of left hand map on
right hemisphere of monkey brain
Dorsal surface
"'-.
Palm
Digits
Digit 4
Digit 3
Digit 2
Digit 1
(thumb) /'
Dorsal surface
Details of cortical
map
(b) Normal hand, palmar surface
IJ5
D4
02
(c) Reorganization of cortical map
after surgical removal of third
finger (03)
After reorganization
of somatosensory
cortex
DS,
04
Stim D1
diS UIUS )
(d) Reorganization of cortical ma r
after discrimination training 0
two fingertips
FIGURE 12.22
Somototopic map plasticity. (a, b) The fingers of the hand of an owl monkey are
mapped onto the surface of 51 cortex. (c) If digit 3 is removed, over tJme the cortex
reorganizes so that the representations of digits 2 and 4 expand. (d) If digits 2 and 3 are
selectively stimulated, their cortical representations also expand.
just depending on the amount of sensory experience. Subsequent experi-
ments in other areas of cortex (visuaL auditory, motor) have shown that
this type of map plasticity is widespread in the brain.
The findings of map plasticity in animals have led to a search for similar
changes in the human brain. One interesting example comes from studies
of amputees. A common experience among amputees is the perception of
sensations coming from the missing limb when other body parts are touched.
V. S. Ramachandran of the University of California. San Diego, has shown
that rhese "phantom limb" sensations are usually evoked by the stimula-
tion of skin regions whose somatotopic representations border rhose of the
missing limb; for example, feeling can be evoked in a phantom arm by
stimularing the face (Box 12.3). Functional brain imaging reveals that the
cortical regions originally devoted to the missing limb are now activated by
406 C HAP T E R I 2 . THE SOMATIC SENSORY SYSTEM
Box 12.3
PATH OF D SCOVERY
11
.
I tr:-
A
When Brain Maps
Collide
After having spent the first 15 years of my career in the
study of human vision, I turned to behavioral neurology-
my "first love:' I can think of at least two reasons for this.
First, in neurology it is still possible to do low-tech re-
search starting from first principles-play "Sherlock
Holmes" and come up with surprising answers to impor-
tant questions. Second, as human beings there is nothing
more fascinating to us than ourselves, and neurology is a
discipline that takes us right to the heart of the question
of who we are. I still remember the first patient I saw in
medical school; he had pseudo-bulbar palsy and would al-
ternately explode laughing or burst into tears within a
matter of minutes. Were these merely crocodile tears and
mirthless laughter? Or was the patient really feeling alter-
nately sad and happy the way a manic-depressive patient
might, but on a compressed time scale?
One of the first experiments I did was on a patient who
had a phantom left arm following amputation. Inspired by
work on monkeys, I simply touched various parts of his
body and face with a cotton swab. Imagine my astonish-
ment when I touched'the left cheek and he said he felt the
touch in his phantom hand! Further testing revealed a com-
plete map of the hand on the lower face. Why does this
happen? I knew that there was a systematic, topographically
organized map of the entire left side of the body surface
on the left postcentral gyrus in area 3b. The map is con-
tinuous except for the one odd fact that the face is near
the hand rather than near the neck. This gave me the clue.
Because the hand region of the cortex was now deprived
of input (due to the amputation), it was "hungry" for new
input, so the sensory input normally destined exclusively
for the adjacent hand cortex now "invades" the vacated
territory. Thus, a touch on the face is misinterpreted by
higher brain centers as arising from the hand. We then did
brain imaging on the same patient and found that touching
the face does indeed activate the hand cortex, and this was
the first demonstration of such large-scale reorganization
of sensory maps in the adult human cortex.
Many patients with phantom arms claim that the phantom
is "paralyzed" or frozen in a painfully awkward position. I
propped up a mirror vertically on the table in front of the
patient and had him look at the reflection of the normal
hand in the mirror, thereby conveying the illusion that the
phantom had been visually resurrected. Amazingly, if he
moved the normal hand, the phantom not only appeared
to move but also felt like it was moving-often for the first
by Vilayanur S. Ramachandran
time in years. Even in patients with intact arms paralyzed by
a stroke, the mirror generated vivid illusions of movement.
These two discoveries-the "map" on the face and the
mobilization of phantoms using mirrors-made in the
early 1 990s implied that there was a tremendous amount
of latent plasticity in the adult brain. Their clinical useful-
ness needs careful evaluation, but the general principle we
established-that input from an intact sensory system can
be used to access and recruit dormant neural circuits in
other brain regions-is here to stay and has ushered in a
whole new approach to rehabilitation in neurology.
Next I turned to synesthesia, a curious condition in which
an otherwise normal person sees individual numbers as
always having a specific color; for example, 5 is red and 2 is
blue. The condition is hereditary and seven times more
common among artists, poets, and novelists. For more
than 100 years, synesthesia had been dismissed as bogus
or as confabulatory in origin. We did some systematic
psychophysics to show that it is a genuine sensory ef-
fect-these people really do see the colors. Then we sug-
gested that, similar to our phantom limb patients, it re-
sults from abnormal cross-activation of color-coded
neurons by neurons in the "number area:' both of which
are in the fusiform gyrus. Subsequent fMRI experiments
confirmed our hunch. When we started research in synes-
thesia in 1997, it was regarded as little more than a cu-
riosity, but now there many groups doing exciting work.
We also suggested that if the "synesthesia gene" (or
genes) is expressed more diffusely everywhere in the
brain, it would result in greater cross-activation through-
out the brain. Because high-level concepts may also be
represented in brain maps, the net result will be a greater
propensity to link seemingly unrelated concepts-what
we call metaphors. Hence, the higher incidence of synes-
thesia in artists and poets. It's probably the reason why
this otherwise useless gene survived; the hidden agenda is
to encode information in ways that allow creativity and
abstract thinking. If so, one can begin with a gene (or
genes) and move on to brain anatomy, to systematic psy-
chophysics, all the way to creativity and abstract thought-
all by studying this "curiosity:' synesthesia.
This has been my overall research strategy: to revive in-
terest in old neurological syndromes by bringing them from
the clinic to the laboratory. Often, it's a wild goose chase,
but every now and then you hit on something really excit-
ing, and that's what makes the whole journey worthwhile.
stimulating the face. While this plasticity may be adaptive in the sense that
the cortex does not go unused, the mismatch between sensory stimulation
and perception in amputees shows that it can lead to confusion on how
signals from 51 should be interpreted.
While having more cortex devoted to a body part may not necessarily be
beneficial to amputees, it apparently is to musicians. Violinists and other
string instrument players must continually finger the strings with their left
hand; the other hand, holding the bow, receives considerably less stimula-
tion of individual fingers. Functional imaging of S I shows that the amount
of cortex devoted to the fingers of the left hand is greatly enlarged in string
musicians. It is likely that this is an exaggerated version of a continuous
remapping process that goes on in everyone's brain as each person's life
experiences vary.
The mechanisms of these types of map plasticity are not understood.
However, as we shall see in Chapter 25, they may be related to processes
involved in learning and memory.
The Posterior Parietal Cortex. As we have seen, the segregation of differ-
ent types of information is a general rule for the sensory systems, and the
somatic sensory system is no exception. However, information of different
sensory types cannot remain separate forever. When we feel for a key in
our pocket, we do not ordinarily sense it as a list of traits: a particular size
and shape, textured and smooth edges, hard and smooth flat surfaces, a
certain weight. Instead, without thinking much about it, we simply con-
firm with our fingers "key," as opposed to "coin" or "wad of old chewing
gum." Separate aspects of a stimulus come effortlessly together as a mean-
ingful object. We have a very poor understanding of how this occurs bio-
logically within any sensory system, much less between sensory systems.
After all, many objects have a distinct look, sound, feel, and smell, and the
melding of these sensations is necessary for the complete mental image of
something like your pet cat.
What we do know is that the character of neuronal receptive fields tends
to change as information passes through the cortex, and receptive fields
enlarge. For example, neurons below the cortex and in cortical areas 3a
and 3b are not sensitive to the direction of stimulus movement across the
skin, but cells in areas 1 and 2 are. The stimuli that neurons prefer become
increasingly complex. Certain cortical areas seem to be sites where simple,
segregated streams of sensory information converge to generate particularly
complex neural representations. When we discussed the visual system, we
saw this in the complex receptive fields of area IT. The posterior parietal
cortex is also such an area. Its neurons have large receptive fields, with
stimulus preferences that are a challenge to characterize because they are
so elaborate. Moreover, the area is concerned not only with somatic sen-
sation but also with visual stimuli and movement planning.
Damage to posterior parietal areas can yield some bizarre neurological
disorders. Among these is agnosia, the inability to recognize objects even
though simple sensory skills seem to be normal. People with astereognosia
cannot recognize common objects by feeling them (a key, for example),
though their sense of touch is otherwise normal and they may have no
trouble recognizing the object by sight or sound. Deficits are often limited
to the side contralateral to the damage.
Parietal cortical lesions may also cause a neglect syndrome, in which a
part of the body or a part of the world (the entire visual field left of the
center of gaze, for example) is ignored or suppressed, and its very existence
is denied (Figure 12.23). Neurologist Oliver Sacks described such a patient
in his essay, "The Man Who Fell Out of Bed." After suffering a stroke that
presumably damaged his cortex, the man insisted that someone was playing
Model
--T-
J
TOUCH 407
Patient's copy
I j
9J
\-liB
\0
'
C
FIGURE 12.23
An example of a neglect syndrome.
A patient who had had a stroke in the
posterior parietal cortex was asked to copy
the model drawing but was unable to repro-
duce many of the features on the left side of
the model. (Source: Springer and Deutsch.
1989, p. 193.)
408 C HAP T E R I 2 . THE SOMATIC SENSORY SYSTEM
a macabre joke on him by hiding an amputated leg under his blanket.
When he tried to remove the leg from his bed, he and the leg ended up on
the floor. Of course the leg in question was his own, still attached, but he
was unable to recognize it as part of his body. A neglect patient may ignore
the food on one half of his plate, or attempt to dress only one side of his
body. Neglect syndromes are most common following damage to the
right hemisphere, and, fortunately, they usually improve or disappear
with time.
In generaL the posterior parietal cortex seems to be essential for the per-
ception and interpretation of spatial relationships, accurate body image,
and the learning of tasks involving coordination of the body in space. These
functions involve a complex integration of somatosensory information with
that from other sensory systems, particularly the visual system.
... PAIN
Besides mechanoreceptors, somatic sensation depends strongly on noci-
ceptors, the free, branching, unmyelinated nerve endings that signal that
body tissue is being damaged or is at risk of being damaged. (The word is
from the Latin nocere, "to hurL") The information from nociceptors takes a
path to the brain that is largely distinct from the path taken by mechanore-
ceptors; consequently, the subjective experience elicited by activation of
these two pathways is different. Selective activation of nociceptors can lead
to the conscious experience of pain. Nociception, and pain, are vital to life
(Box 12.4).
It is important to realize, however, that nociception and pain are not the
same thing. Pain is the feeling, or the perception, of irritating, sore, stinging,
aching, throbbing, miserable, or unbearable sensations arising from a part
of the body. Nociception is the sensory process that provides the signals that
trigger pain. While nociceptors may fire away wildly and continually, pain
may come and go. The opposite may also happen. Pain may be agonizing,
even without activity in nociceptors. More than any other sensory system,
the cognitive qualities of nociception can be controlled from within, by the
brain itself.
Nociceptors and the Transduction of Painful Stimuli
Nociceptors are activated by stimuli that have the potential to cause tissue
damage. Tissue damage can result from strong mechanical stimulation,
extremes in temperature, oxygen deprivation, and exposure to certain
chemicals, among other causes. The membranes of nociceptors contain ion
channels that are activated by these types of stimuli.
Consider as an example the events that accompany your stepping on a
thumbtack (recall Chapter 3). The simple stretching or bending of the noci-
ceptor membrane activates mechanically gated ion channels that cause the
cell to depolarize and generate action potentials. In addition, damaged cells
at the site of injury can release a number of substances that cause ion chan-
nels on nociceptor membranes to open. Examples of released substances
are proteases (enzymes that digest proteins), ATP, and K-t ions. Pro teases
can break down an abundant extracellular peptide called kininogen to form
another peptide called bradykinin. Bradykinin binds to specific receptor
molecules that activate ionic conductances in some nociceptors. Similarly,
ATP causes nociceptors to depolarize by binding directly to ATP-gated ion
channels. And, as we learned in Chapter 3, the elevation of extracellular
[K+] directly depolarizes neuronal membranes.
Box 12.4
.... , .
OF SPECIAL INTEREST
... PAIN 409
....
.. I..
d The Misery of Life Without Pain
Pain teaches us to avoid harmful situations. It elicits with-
drawal reflexes from noxious stimuli. It exhorts us to rest
an injured part of our body. Pain is vital. The most con-
vincing arguments for the functional benefits of pain are
the very rare people who are born without the sensation
of pain. They go through life in constant danger of de-
stroying themselves, because they do not realize the harm
they are doing. They often die young.
A Canadian woman born with an indifference to painful
stimuli had no other sensory deficits and was quite intel-
ligent. Despite early training to avoid damaging situations,
she developed progressive degeneration of her joints and
spinal vertebrae, leading to skeletal deformation, degen-
eration, infection, and, finally, death at the age of 28.
Apparently, low levels of nociceptive activity are impor-
tant during everyday tasks to tell us when a particular
movement or prolonged posture is putting too much
strain on our body. Even during sleep, nociception may be
the prod that makes us toss and turn enough to prevent
bedsores or skeletal strain.
People with a congenital absence of pain reveal that
pain is a separate sensation, and not simply an excess of
the other sensations. Such people usually have a normal
ability to perceive other somatic sensory stimuli. The
causes can indude the failure of peripheral nociceptors to
develop, or altered synaptic transmission in the pain-
mediating pathways of the CNS. In any case, life without
pain is not a blessing.
Now consider leaning against a hot stove. Heat above 43°C causes tissues
to burn, and heat-sensitive ion channels in nociceptor membranes open at
this temperature. Of course, we also have nonpainful sensations of warmth
when the skin is heated from 37°C to 43°C. These sensations depend on
non-nociceptive thermoreceptors and their CNS connections. which we
discuss in a later section. But for now, note that the sensations of warmth
and scalding are mediated by separate neural mechanisms.
Imagine you are a middle-aged runner on the last mile of a marathon.
When your tissue oxygen levels do not meet the oxygen demand, your cells
use anaerobic metabolism to generate ATP. A consequence of anaerobic
metabolism is the release of lactic acid. The buildup of lactic acid leads
to an excess of H+ ions in the extracellular fluid, and these ions activate
H+ -gated ion channels on nociceptors. This mechanism causes the excru-
ciating dull ache associated with very hard exercise.
A bee stings you. Your skin and connective tissue contain mast cells, a
component of your immune system. Mast cells can be activated by expo-
sure to foreign substances (e.g., bee venom), causing them to release his-
tamine. Histamine binds to specific cell surface receptors on nociceptors and
causes membrane depolarization. Histamine also causes blood capillaries to
become leaky, which leads to swelling and redness at the site of an injury.
Creams containing drugs that block histamine receptors (antihistamines)
can be helpful for both the pain and the swelling.
Types of NodcepioTs. The transduction of painful stimuli occurs in the
free nerve endings of unmyelinated C fibers and lightly myelinated Ao
fibers. The majority of nociceptors respond to mechanical, thermal, and
chemical stimuli and are therefore called polymodal nociceptors. However, like
mechanoreceptors, many nociceptors show selectivity in their responses to
different stimuli. Thus, there are also mechanical nociceptors, showing se-
lective responses to strong pressure; thermal nociceptors, showing selective
responses to burnjng heat or extreme cold (Box 12.5); and chemical nodceptors,
showing selective responses to histamine and other chemicals. Indeed, re-
searchers recently discovered that the smallest of C fibers (conduction
410 C HAP T E R I 2 . THE SOMATIC SENSORY SYSTEM
Box 12.5
.... , .
.il
'"
OF SPECIAL INTEREST
Hot and Spicy
If you like spicy food, you should know that the active
ingredient in a wide variety of hot peppers is capsaicin
(Figure A). These peppers are "hot" because the capsaicin
activates the thermal nociceptors that also signall painful
elevations in temperature (above 43°C). Indeed, it was the
peculiar fact that these nocioceptive neurons are selec-
tively activated by capsaicin that led to the discovery of
the transduction mechanism for the sensation of hot.
David Julius at the University of California, San Francisco,
found that in some dorsal root ganglion cells, capsaicin
activates a particular ion channel, called Trpv I, that is also
activated by elevations in temperature greater than 43°C.
This ion channel causes the neuron to fire by admitting
Ca H and Na+. Trpvl is a member of a very large family
of related Trp channels, originally identified in photo-
receptors of the fruit fiy DrosoPhila (Trp stands for tran-
sient receptor potential). It is becoming clear that differ-
ent Trp channels contribute to many different types of
sensory transduction in organisms from yeast to humans.
Why would a temperature-gated ion channel also be
sensitive to hot peppers? Capsaicin appears to mimic the
effect of endogenous chemicals released by tissue dam-
age.These chemicals (and capsaicin) cause the TrpvI chan-
nel to open at lower temperatures, explaining the height-
ened sensitivity of injured skin to increases in temperature.
Indeed, infiammation-induced thermal hyperalgesia is ab-
sent in mice engineered to lack the Trpv I channel. While
all mammals normally express the Trpv I channel, birds do
not, thus explaining how birds can consume the hottest
of hot chile peppers. This fact also explains how birdseed
laced with capsaicin can be enjoyed by birds without in-
terference from raiding squirrels.
In addition to the protection of birdseed, and the wide-
spread culinary use, capsaicin has a seemingly paradoxical
clinical application. Appllied in large quantities, it can cause
analgesia, the absence of pain. The capsaicin desensitizes
pain fibers and depletes the peptide substance P from
their nerve terminals. Capsaicin therapy is currently one
of the treatments for the pain associated with arthritis,
mastectomy, and shingles (see Box 12.1).
Red chile
Habanera
Jalapeno
o
CH30 JCJ N
1# H II
HO
FIGURE A
Peppers containing capsaicin, and the molecule's chemical structure.
velocity of ::;0.5 m/sec) are selectively responsive to histamine and cause
the perception of itch.
Nociceptors are present in most body tissues, including skin, bone, muscle,
most internal organs, blood vessels, and the heart. They are notably absent
in the brain itself, except for the meninges.
Hyperalgesia. Nociceptors normally respond only when stimuli are strong
enough to damage tissue. But we all know that skin, joints, or muscles that
have already been damaged or inflamed are unusually sensitive. A light,
sympathetic mother's touch to a burned area of her child's skin may elicit
howls of excruciating pain. This phenomenon is known as hyperalgesia,
and it is the most familiar example of our body's ability to control its own
pain. Hyperalgesia can be a reduced threshold for pain, an increased in-
tensity of painful stimuli, or even spontaneous pain. Primary hyperalgesia
occurs within the area of damaged tissue, but tissues surrounding a
... PAIN 411
,
;}
Promotes
swelling
J
Dorsal root
f/..__, ganglion
Noxious
signal
Blood
vessel
Substance P
Spinal cord
FIGURE 12.24
Peripheral chemical mediators of pain and hyperalgesia.
damaged area may become supersensitive as well, by the process of second-
my hyperalgesia.
Many different mechanisms appear to be involved in hyperalgesia, some
in and around the peripheral receptors and others within the CNS. As noted
earlier, a variety of substances are released when skin is damaged. A number
of these chemicals modulate the excitability of nociceptors, making them
more sensitive to thermal or mechanical stimuli (see Box 12.5). Examples
of sensitizing chemicals are bradykinin, prostaglandins, and substance P
(Figure 12.24).
Bradykinin was discussed above as one of the chemicals that directly
depolarizes nodceptors. In addition to this effect, bradykinin stimulates
long-lasting intracellular changes that make heat-activated ion channels
more sensitive. Prostaglandins are chemicals generated by the enzymatic
breakdown of lipid membrane. While prostaglandins do not elicit overt
pain, they do increase greatly the sensitivity of nociceptors to other stim-
uli. Aspirin and other nonsteroidal anti-inflammatory drugs are a useful
treatment for hyperalgesia because they inhibit the enzymes required for
prostaglandin synthesis.
Substance P is a peptide synthesized by the nociceptors themselves. Acti-
vation of one branch of a nodceptor axon can lead to the secretion of
substance P by the other branches of that axon in the neighboring skin.
Substance P causes vasodilation (swelling of the blood capillaries) and
the release of histamine from mast cells. Sensitization of other nodcep-
tors around the site of injury by substance P is one cause of secondary
hyperalgesia.
412 C HAP T E R I 2 . THE SOMATIC SENSORY SYSTEM
i
c
'w
c
Q)
C
c
'ro
c...
t
Time--
Noxious
stimulus
Second pain
FIGURE 12.25
First and second pain. The first pain
sensation registered by noxious stimulation
is "1ediated by fast Ao axons. The second,
longer-lasting pain sensation is mediated by
slow C fibers.
CNS mechanisms also contribute to secondary hyperalgesia. Following
injury, the activation of mechanoreceptive AI3 axons by light touch can
evoke pain. Thus, another mechanism of hyperalgesia involves cross-talk
between the touch and pain pathways in the spinal cord.
Primary Afferents and Spinal Mechanisms
A'6 and C fibers bring information to the CNS at different rates, because of
differences in their action potential conduction velocities. Accordingly, the
activation of skin nociceptors produces two distinct perceptions of pain: a
fast sharp, first pain, followed by a duller, longer-lasting second pain. First
pain is caused by the activation of A'6 fibers; second pain is caused by the
activation of C fibers (Figure 12.25).
Like the AI3 mechanosensory fibers, the small-diameter fibers have their
cell bodies in the segmental dorsal root ganglia, and they enter the dorsal
horn of the spinal cord. The fibers branch immediately, travel a short dis-
tance up and down the spinal cord in a region called the zone of Lissauer,
and then synapse on cells in the outer part of the dorsal horn in a region
known as the substantia gelatinosa (Figure 12.26).
The neurotransmitter of the pain afferents is believed to be glutamate;
however, as mentioned previously, these neurons also contain the pep-
tide substance P (Figure 12.27). Substance P is contained within storage
granules in the axon terminals (see Chapter 5) and can be released by high-
frequency trains of action potentials. Recent experiments have shown that
synaptic transmission mediated by substance P is required to experience
moderate to intense pain.
It is interesting to note that nociceptor axons from the viscera enter
the spinal cord by the same route as the cutaneous nociceptors. Within
the spinal cord, there is substantial mixing of information from these
two sources of input. This cross-talk gives rise to the phenomenon of re-
ferred pain, where visceral nociceptor activation is perceived as a cuta-
neous sensation. The classic example of referred pain is angina, occur-
ring when the heart fails to receive sufficient oxygen. The pain is often
localized by the patient to the upper chest wall and the left arm. An-
other common example is the pain associated with appendicitis, which
in its early stages is referred to the abdominal wall around the navel
(Figure 12.28).
To brain Substantia gelatinosa
Zoneo! I /
Lissauer
\
\
Dorsal root
/
C fiber
/
-
\
Ventral root
FIGURE 12.26
Spinal connections of nociceptive axons.
Ascending Pain Pathways
Let's briefly highlight the differences we've encountered between the touch
and pain pathways. First, they differ with respect to their nerve endings in
the skin. The touch pathway is characterized by specialized structures in the
skin; the pain pathway has only free nerve endings. Second, they differ
with respect to the diameter of their axons. The touch pathway is swift and
uses fat, myelinated AI3 fibers; the pain pathway is slow and uses thin,
lightly myelinated A fibers and unmyelinated C fibers. Third, they differ
with respect to their connections in the spinal cord. Branches of the AI3
axons terminate in the deep dorsal horn; the A and C fibers branch, run
within the zone of Lissauer, and terminate within the substantia gelatinosa.
As we will now see, the two pathways also differ substantially in the way
they transmit information to the brain.
The Spinothalamic Pain Pathway. Information about pain (as well as
temperature) in the body is conveyed from the spinal cord to the brain via
the spinothalamic pathway. Unlike the dorsal column-mediallemniscal
pathway, the axons of the second-order neurons immediately decussate and
ascend through the spinothalamic tract running along the ventral surface of
the spinal cord (compare Figures 12.13 and 12.26). As the name implies,
the spinothalamic fibers project up the spinal cord and through the medulla,
pons, and midbrain without synapsing, until they reach the thalamus (Fig-
ure 12.29). As the spinothalamic axons journey through the brain stem,
they eventually come to lie alongside the medial lemniscus, but the two
groups ofaxons remain distinct from each other.
Skin
/-
Dorsal root
ganglion
/
\J I--
( " \
\
l \ ",
Sympathetic
ganglion of "
. the ANS
Primary afferent
axons
V; m l\
'-
( .........
)...."'
Primary afferent
axon
)
'-/
FIGURE 12.28
The convergence of nociceptor input from the viscera and the skin.
'Y PAIN 41 3
'"
.. ....
i.. b
,..
.
.
FIGURE 12.27
Immunocytochemical localization
of substance P in the spinal cord.
The arrow points to the region of highest
substance P in the substantia gelatinosa.
(Source: Mantyh et aI., 1997.)
To brain
414 C HAP T E R I 2 . THE SOMATIC SENSORY SYSTEM
Primary
somatosensory
cortex (S1)
\
I
@
'\
I
\
,--
-l
, )
.\
\
\
\
-(
. (
.'
2 /
CD
A
@
\
Thalamus
(intralaminar
and VP nuclei)
o
Medulla
Dorsal
:; a 1 COlu , mn
- '
,
__ :::0:::. \. ....
, '
cD'" __J - '
. Spinal cord
FIGURE 12.29
The spinothalamic pathway. This IS the
major mute by which pain and temperature
information ascend to the cerebral cortex.
Figure 12.30 summarizes the different ascending pathways for touch
and pain information. Notice that information about touch ascends ipsi-
laterally, while information about pain (and temperature) ascends con-
tralaterally. This organization can lead to a curious, but predictable, group
of deficits when the nervous system is impaired. For example, if half of
the spinal cord is damaged, certain deficits of mechanosensitivity occur on
the same side as the spinal cord damage: insensitivity to light touch, the
vibrations of a tuning fork on the skin, the position of a limb. On the
other hand, deficits in pain and temperature sensitivity will show up on
the side of the body opposite the cord damage. Other signs, such as motor
deficiency and the exact map of sensory deficits, give additional clues
about the site of spinal cord damage. For example, movements will be im-
paired on the ipsilateral side. The constellation of sensory and motor signs
following damage to one side of the spinal cord is called Brown-Sequard
syndrome.
... PAIN 415
Dorsal column-
mediallemniscal
pathway
Cerebral
cortex
Spinothalamic
pathway
L
.
.
Medial
lemniscus
Thalamus
:-
Dorsal
column
Lateral _
spinothalamic
tract
Medulla
Dorsal
column
nuclei
Spinal cord
Dorsal
root axon
(Aa,AJ},M)
"
Dorsal
root axon
(AI\C)
Midline
Midline
Touch, vibration, two-point
discrimination, proprioception
Pain, temperature,
some touch
FIGURE 12.30
An overview of the two major ascending pathways of somatic sensation.
The Trigeminal Pain Pathway. Pain (and temperature) information from
the face and head takes a path to the thalamus that is analogous to the
spinal path. The small-diameter fibers in the trigeminal nerve synapse first
on second-order sensory neurons in the spinal trigeminal nucleus of !he brain
stem. The axons of these cells cross and ascend to the thalamus in the
trigeminal Lemniscus.
In addition to the spinothalamic and trigeminothalamic pathways, other
closely related pain (and temperature) pathways send axons into a variety
of structures at all levels of the brain stem, before they reach the thalamus.
Some of these pathways are particularly important in generating sensations
of slow, burning, agonizing pain, while others are involved in arousal.
The Thalamus and Cortex. The spinothalamic tran and trigeminal
lemniscal axons synapse over a wider region of the thalamus than those of
the medial lemniscus. Some of the axons terminate in the VP nucleus, just
as the mediallemniscal axons do, but the touch and pain systems still remain
segregated there by occupying separate regions of the nucleus. Other
spinothalamic axons end in the small intralaminar nuclei of the thalamus
(Figure 12.31). From the thalamus. pain and temperature information is
projected to various areas of the cerebral cortex. As in the thalamus, this
pathway covers a much wider territory than the cortical connections of the
dorsal column-medial lemniscal pathway.
The Regulation of Pain
The fact that the perception of pain varies is well established. Depending
on the concurrent level of nonpainful sensory input and the behavioral
context, the same level of nociceptor activity can produce more pain or less
pain. Understanding this modulation of pain is of great importance, because
416 C HAP T E R I 2 . THE SOMATIC SENSORY SYSTEM
FIGURE 12.31
Somatic sensory nuclei of the thalamus.
In addition to the VP nucleus, the Intralamlnar
nuclei relay nociceptive information to a large
expanse of the cerebral cortex.
Anterior
Intralaminar nuclei
k ('
'"
/0
;'
/
.....
";::
--
-.-
','-
/
VP nucleus
Posterior
it may offer new strategies for the trearment of chronic pain, a condition
that afflicrs up to 20% of the adult population.
Afferent Regulation. We've already seen that light touch can evoke pain
via the mechanisms of hyperalgesia. However, pain evoked by activity in
nociceptors can also be reduced by simultaneous activity in low-threshold
mechanoreceptors (AI3 fibers). Presumably, this is why it feels good to rub
the skin around your shin when you bruise it. This mechanism may also
explain an electrical treatment for some kinds of chronic, intracrable
pain. Wires are raped to the skin surface, and pain is suppressed when the
patient simply turns on an electrical stimulator designed to activate large-
diameter sensory axons.
In the I960s, Ronald Melzack and Patrick Wall, then working at MIT,
proposed a hypothesis to explain these phenomena. Their gate theory of pain
proposes thar certain neurons of the dorsal horns, which project an axon
up the spinothalamic tract, are excited by both large-diameter sensory axons
and unmyelinated pain axons. The projection neuron is also inhibited by
an interneuron, and the interneuron is both excited by the large sensory
axon and inhibited by the pain axon (Figure 12.32). By this arrangement,
acrivity in the pain axon alone maximally excites the projection neuron,
allowing nociceptive signals to rise to the brain. However, if the large
mechanoreceptive axon fires concurrently, it activates the interneuron and
suppresses nociceptive signals.
Descending Regulation. Stories abound of soldiers. athletes. and torture
victims who sustained horrible injuries bur apparently felt no pain. Strong
emotion, stress, or stoic determination can powerfully suppress feelings of
pain. Several brain regions have been implicated in pain suppression (fig-
ure 12.33). One is a zone of neurons in the midbrain called the periven-
tricular and periaqueductal gray matter (PAG). Electric<ll stimulation of
the PAG can cause a profound analgesia that has sometimes been exploited
clinically.
The PAG normally receives input from several brain structures, many of
them appropriate for transmitting signals related to emotional status. PAG
neurons send descending axons into various midline regions of the medulla,
particularly to the raphe nuclei (which use the neurotransmitter serotonin).
These medullary neurons in turn project axons down to the dorsal horns
of the spinal cord, where they can effectively depress the activity of noci-
ceptive neurons.
FIGURE 12.32
The gate theory of pain. The relay of noci-
ceptive signals by the projection neuron is gated
by the activity of an inhibitory interneuron.
-'"-J
Aa or Aj3 axon
(non-nociceptive
mechanoreceptors)
To dorsal column
To spinothalamic tract
The Endogenous Opiates. Opium was probably known to the ancient
Sumerians around 4000 B.C. Their pictograph for the poppy roughly trans-
lates to "joy plant." By the seventeenth century, the therapeutic value of
opium was undisputed. Opium, its active narcotic ingredients, and their
analogues-induding morphine, codeine, and heroin-are used and abused
widely today, in most cultures of the world. Opioids produce profound
, /
\}
I
/PAG
')
Midbrain ___
3
l J . r::-
,
o
2
', ;,
'CD
')
Raphe nuclei
@
Spinal cord ______
r . \.
Dorsal horn
CD
_-.J-
T PAIN 417
FIGURE 12.33
Descending pain-control pathways.
A variety of brain structures, many of which
are affected by behavioral state, can influence
activity within the periaqueductal gray matter
(PAG) of the midbrain. The PAG can influence
the raphe nuclei of the medulla, whICh in
turn can modulate the flow of nociceptive
information through the dorsal horns of the
spinal caret
418 C HAP T E R I 2 . THE SOMATIC SENSORY SYSTEM
Box 12.6
.... , .
OF SPECIAL INTEREST
I ;
"
..
Pain and the Placebo Effect
To test the efficacy of a new drug, clinical trials are often
conducted in which one group of subjects receives the
drug and the other receives an inert substance. Both
groups of subjects believe they have been given the drug.
Surprisingly. the inert substance is often reported to have
the effect that patients are told to expect from the drug.
The term placebo is used to describe such substances (the
word is from the Latin meaning "I shall please"), and the
phenomenon is called the placebo effect.
Placebos can be highly effective analgesics. A majority
of patients suffering from postoperative pain have reported
getting relief from an injection of sterile saline! Does
this mean that these patients have only imagined their
pain? Not at all. The opioid receptor antagonist naloxone
can bllock the analgesic effect of the placebo, just as it
antagonizes the effects of morphine, a true analgesic. Ap-
parently. the belief that the treatment will work can be
enough to cause activation of the endogenous pain-relief
systems of the brain. The placebo effect is a likely expla-
nation for the success of other treatments for pain. such
as acupuncture. hypnosis, and. for children. a mother's
loving kiss.
analgesia when taken systemically. They can also produce mood changes,
drowsiness, mental clouding, nausea, vomiting, and constipation. The 1970s
brought the stunning discoveries that opioids act by binding tightly and
specifically to several types ot opioid receptors in the brain and that the
brain itself manufactures endogenous morphine-like substances, collec-
tively called endorphins. Endorphins are relatively small proteins, or
peptides.
Endorphins and their receptors are distributed widely in the CNS, but
they are particularly concentrated in areas that process or modulate noci-
ceptive information. Small injections of morphine or endorphins into the
PAG, the raphe nuclei, or the dorsal horn can produce analgesia. Because
this effect is prevented by administering the specific blocker of opioid re-
ceptors, naloxone, the injected drugs must have acted by binding to opioid
receptors in those areas. Naloxone can also block the analgesic effects
induced by electrically stimulating these areas. At the cellular level, endor-
phins exert multiple effects that include suppressing the release of gillta-
mate from presynaptic terminals and inhibiting neurons by hyperpolariz-
ing their postsynaptic membranes. In general, extensive systems of
endorphin-containing neurons in the spinal cord and brain stem prevent
the passage of nociceptive signals through the dorsal horn and into
higher levels of the brain where the perception of pain is generated
(Box 12.6).
TEMPERATURE
As is the case tor the sense of touch and pain, nonpainful temperature
sensations originate from receptors in the skin (and elsewhere), and they
depend on the neocortex for their conscious appreciation. Here we briefly
describe how this system is organized.
Thermoreceptors
Because the rate ot a chemical reaction depends on temperature, the func-
tioning of all cells is sensitive to temperature. However, thermoreceptors
are neurons that, due to specific membrane mechanisms, are exquisitely
sensitive to temperature. For example, we can perceive changes in our
average skin temperature of as little as O.Ol°C. Temperature-sensitive
neurons clustered in the hypothalamus and the spinal cord are important
in the physiological responses that maintain stable body temperature, but
it is the thermoreceptors in the skin that apparently contribute to our
perception of temperature.
Temperature sensitivity is not spread uniformly across the skin. You
could take a small cold or warm probe and map your skin's sensitivity to
temperature changes. Some spots about 1 mm wide are especially sensitive
to either hot or cold, but not both. The fact that the locations of hot and
cold sensitivity are different demonstrates that separate receptors encode
them. Also, small areas of skin in between the hot and cold spots are rela-
tively insensitive to temperature.
The sensitivity of a sensory neuron to a change in temperature depends
on the type of ion channels the neuron expresses. Discovery of the
channels responsive to painful increases in temperature above 43°C (see
Box 12.5) led researchers to wonder if other, closely related channels might
be tuned to sense other temperature ranges. Just as the active ingredient
in hot peppers was used to identify the "hot" receptor protein, called Trpv1,
the active ingredient in mint was used to identify a "cold" receptor. Menthol,
which produces a sensation of cold, was found to stimulate a receptor,
called TrpmS, that is also activated by nonpainful decreases in temperature
below 25°C.
We now understand that there are six distinct Trp channels in thermo-
receptors that confer different temperature sensitivities (Figure 12.34). As
Anktm1
T rpm8
Trpv3
Trpv4
Trpv1
Trpv2
T
trl : ' fW1:' 1 F
-.
(a)
.
.
.
.
.
.S:
rn
OJ Anktm 1 ...
c
c
rn
.c
U
Trpv2
(VrI1)
o 10
20 3'0
50
40
(b)
Temperature (0C)
... TEMPERATURE 419
FIGURE 12.34
Thermoreceptor Trp channels tuned
to detect different temperatures.
(a) The arrangement of the known thermo-
sensitive Trp channel protein molecules In
the neuronal membrane. Trpm8 and Trpv I
are responsive to menthol and capsaicin, re-
spectively (b) This graph plots the activation
of the vanous channels as a function of
temperature Dashed lines indicate expected
responses that have not yet been demon-
strated experimentally (Source: Adapted from
Patapoutian et al" 2003. Fig. 3.)
420 C HAP T E R I 2 . THE SOMATIC SENSORY SYSTEM
FIGURE 12.35
Adaptations of thermoreceptors. The
responses of cold and warm receptors to a
step reduction in skin temperature are shown
Both receptors are fY10st responsive to sud-
den changes In temperature, but they adapt
over several seconds.
a rule, different thermo receptive neurons appear to express only a single
type of channel, thus explaining how different regions of skin can show
distinctly different sensitivities to temperature. An exception appears to be
some cold receptors that also express Trpvl and are therefore also sensitive
to increases in temperature above 43°C. If such heat i.s applied to wide ar-
eas of skin, it is usually painful; but if the heat is restricted to small regions
of skin innervated by a cold receptor, it can produce a paradoxical feeling
of cold. This phenomenon emphasizes an important point: The (NS does
not know what kind of stimulus (in this case. heat) caused the receptor to
fire, but it continues to interpret all activity from its cold receptor as a re-
sponse to cold.
As with mechanoreceprors, the responses of thermo receptors adapt
during long-duration stimuli. Figure 12.35 shows that a sudden drop in
skin temperature causes a cold receptor to fire strongly, while it silences a
warm receptor. After a few seconds at 32°(, however, the cold receptor
slows its firing (but still fires faster than it did at 38°C), while the warm
receptor speeds up slightly. Notice that a return to the original warm skin
temperature causes opposite responses-transient silence of the cold receptor
and a burst of activity in the warm receptor-before both return to their
steady, adapted rates. Thus, the differences between the response rates of
warm and cold receptors are greatest during, and shortly after, temperature
changes. Our perceptions of temperature often reflect these skin receptor
responses.
Try a simple experiment. Fill two buckets with tap water, one cold and
one hot (but not painfully hot). Then plunge your right hand for 1 minute
into each of them in turn. Notice the striking sensations of hot and cold
that occur with each change, but also notice how transient the sensations
are. With thermoreception, as with most other sensory systems, it is the
sudden change in the quality of a stimulus that generates the most in-
tense neural and perceptual responses.
The Temperature Pathway
At this point, you may be relieved to learn that the organization of the
temperature pathway is virtually identical to that of the pain pathway
38°
38°
32"
Skin
temperature (0C)
Cold
receptor
Warm
receptor
5 sec
already described. Cold receptors are coupled to Ao and C fibers, while
warm receptors are coupled only to C fibers. As we learned previously,
small-diameter axons synapse within the substantia gelatinosa of the dor-
sal horn. The axons of second-order neurons immediately decussate and
ascend in the contralateral spinothalamic tract. Thus, if the spinal cord is
transected on one side, there will be a loss of temperature sensitivity (as
well as pain) on the opposite side of the body, specifically in those regions
of skin innervated by spinal segments below the cut.
CONCLUDING REMARKS
This concludes our discussion of the sensory systems. Although each one
has evolved to be the brain's interface with a different form of environ-
mental energy, the systems are strikingly similar in organization and func-
tion. Different types of somatic sensory information are necessarily kept
separate in the spinal nerves because each axon is connected to only one
type of sensory receptor ending. Segregation of sensory types continues
within the spinal cord and is largely maintained all the way to the cerebral
cortex. In this way, the somatic sensory system repeats a theme common
throughout the nervous system: Several flows of related, but distinct, in-
formation are passed in parallel through a series of neural structures. The
mixing of these streams occurs along the way, but only judiciously, until
higher levels of processing are reached in the cerebral cortex. We saw other
examples of parallel processing of sensory information in the chemical
senses, vision, and audition.
Exactly how the parallel streams of sensory data are melded into per-
ception, images, and ideas remains the Holy Grail of neuroscience. Thus,
the perception of any handled object involves the seamless coordination of
all facets of somatic sensory information. The bird in hand is rounded,
warm, soft, and light in weight; its heartbeat flutters against your finger-
tips; its claws scratch; and its textured wings brush against your palm.
Somehow your brain knows it's a bird, even without looking or listening,
and would never mistake it for a toad. In the chapters that follow, we
will describe how the brain begins to use sensory information to plan and
coordinate movement.
\
>-V>
WL
a::
W
J-
Introduction
somatic sensation (p. 388)
ventral posterior (VP) nucleus
(p. 398)
primary somatosensory cortex
(S I) (p. 398)
trigeminal nerve (p. 400)
posterior parietal cortex (p. 40 I )
somatotopy (p. 402)
agnosia (p. 407)
neglect syndrome (p. 407)
Touch
mechanoreceptor (p. 389)
Pacinian corpuscle (p. 389)
spinal segment (p. 394)
dermatome (p.395)
dorsal column-medial lemniscal
pathway (p. 397)
dorsal column (p. 397)
dorsal column nucleus (p. 397)
medial lemniscus (p. 397)
Pain
nociceptor (p. 408)
analgesia (p.410)
'If CONCLUDING REMARKS 421
hyperalgesia (p. 41 0)
substantia gelatinosa (p. 412)
referred pain (p. 412)
spinothalamic pathway (p. 413)
periaqueductal gray matter (PAG)
(p.416)
opioid receptor (p. 418)
endorphin (p. 418)
Temperature
thermoreceptor (p. 418)
422 C HAP T E R I 2 . THE SOMATIC SENSORY SYSTEM
ltJ
.., -
V>
Z
w
0
>
w l-
e::: V>
w
::>
a
I. Imagine rubbing your fingertips across a pane of smooth glass and then across a brick. What kinds of skin
receptors help you distinguish the two surfaces? As far as your somatic sensory system is concerned, what
is different about the two surfaces?
2. What purpose is served by the encapsulations around some sensory nerve endings in the skin?
3. If someone tossed you a hot potato and you caught it, which information would reach your CNS first: the
news that the potato was hot, or that it was relatively smooth? Why?
4. At what levels of the nervous system are all types of somatic sensory information represented on the
contralateral side: the spinal cord, the medulla, the pons, the midbrain, the thalamus, the cortex?
5. What lobe of the cortex contains the main somatic sensory areas? Where are these areas relative to the
main visual and auditory areas?
6. Where within the body can pain be modulated, and what causes its modulation?
7. Where in the CNS does information about touch, shape. temperature, and pain converge?
8. Imagine this experiment: Fill two buckets with water, one relatively cold and one hot. Fill a third bucket with
water of an intermediate, lukewarm temperature. Put your left hand into the hot water, your right hand into
the cold, and wait one minute. Now quickly plunge both hands into the lukewarm water. Try to predict what
sensations of temperature you will feel in each hand. Will they feel the same? Why?
60.
e:::(j
Wz
I
1-0
e:::«
::>w
u.e:::
Cesare P. McNaughton P. 1997. Peripheral pain
mechanisms. Current Opinion in Neurobiology
7(4):493-499.
Fields H. 2004. State-dependent opioid control of
pain. Nature Reviews Neuroscience 5(7):565-575.
Garcia-Anoveros J. Corey DP. 1997. The molecules
of mechanosensation. Annual Review of Neuro-
science 20:567-594.
Johnson KG. 200 I. The roles and functions of cuta-
neous mechanoreceptors. Current Opinion in
Neurobiology 11(4):455-461.
Julius D, Basbaum AL 200 I. Molecular mechanisms of
nociception. Nature 413:203-210.
Mountcastle VB. 1997. The columnar organization of
the neocortex. Brain 120:701-722.
Patapoutian A, Peier AM, Story GM, Viswanath V.
2003. Thermo Trp channels and beyond: mecha-
nisms of temperature sensation. Nature Reviews
Neuroscience 4:529-539.
Ramachandran VS. 1998. Consciousness and body
image: lessons from phantom limbs, Capgras syn-
drome and pain asymbolia. Philosophical Transaaions
of the Royal Society of London B: Biological Sciences
353(1377): 1851-1859.
CHAPTER
Spinal Control
of Movement
INTRODUCTION
THE SOMATIC MOTOR SYSTEM
THE LOWER MOTOR NEURON
THE SEGMENTAL ORGANIZATION OF LOWER MOTOR NEURONS
ALPHA MOTOR NEURONS
Graded Control of Muscle Contraction by Alpha Motor Neurons
Inputs to Alpha Motor Neurons
TYPES OF MOTOR UNITS
Neuromuscular Matchmaking
. Box 13.1 Of Special Interest: Amyotrophic Lateral Sclerosis
EXCITATION-CONTRACTION COUPLING
MUSCLE FIBER STRUCTURE
THE MOLECULAR BASIS OF MUSCLE CONTRACTION
. Box 13.2 Of Special Interest: Duchenne Muscular Dystrophy
SPINAL CONTROL OF MOTOR UNITS
. Box 13.3 Of Special Interest: Myasthenia Gravis
. Box 13.4 Path of Discovery: Finding the Cause of Myasthenia Gravis, by Jon M. Lindstrom
PROPRIOCEPTION FROM MUSCLE SPINDLES
The Myotatic Reflex
GAMMA MOTOR NEURONS
PROPRIOCEPTION FROM GOLGI TENDON ORGANS
Proprioception from the joints
SPINAL INTERNEURONS
Inhibitory Input
Excitatory Input
THE GENERATION OF SPINAL MOTOR PROGRAMS FOR WALKING
CONCLUDING REMARKS
424 C HAP T E R I 3 . SPINAL CONTROL OF MOVEMENT
INTRODUCTION
We are now ready to turn our attention to the system that actually gives rise
to behavior. The motor system consists of all our muscles and the neurons
that control them. The importance of the motor system was summarized
by the pioneering English neurophysiologist Charles Sherrington in the
Linacre lecture of 1924: "To move things is all that mankind can do . . . [or
such the sole executant is muscle, whether in whispering a syllable or in
felling a [orest" (p. 59). A moment's thought will convince you that the
motor system is also incredibly complex. Behavior requires the coordinated
action of various combinations of almost 700 muscles in a changing and
often unpredictable environment.
Have you ever heard the expression "running around like a chicken with
its head cut off"? It is based on the observation that complex patterns of
behavior (running around the barnyard) can be generated without the
participation of the brain. There is a considerable amount of circuitry within
the spinal cord for the coordinated control of movements, particularly
stereotyped (repetitive) ones such as those associated with locomotion. This
point was established early in this century by Sherrington and his English
contemporary Graham Brown, who showed that rhythmic movements
could be elicited in the hind legs of cats and dogs long after their spinal
cords had been severed from the rest of the central nervous system (CNS).
Today's view is that the spinal cord contains certain motor programs for the
generation of coordinated movements and that these programs are ac-
cessed, executed, and modified by descending commands [rom the brain.
Thus, motor control can be divided into two parts: (I) the spinal cord's
command and control of coordinated muscle contraction, and (2) the brain's
command and control of the motor programs in the spinal cord.
In this chapter, we explore the peripheral somatic motor system: the
joints, skeletal muscles, and spinal motor neurons and how they commu-
nicate with each other. In Chapter 14, we will take a look at how the brain
influences the activity of the spinal cord.
THE SOMATIC MOTOR SYSTEM
Based on their appearance under the microscope, the muscles in the body can
be described according to two broad categories: striated and smooth. But they
are also distinct in other ways. Smooth muscle lines the digestive tract, ar-
teries, and related structures and is innervated by nerve fibers from the auto-
nomic nervous system (see Chapter IS). Smooth muscle plays a role in peri-
stalsis (the movement of material through the intestines) and the control of
blood pressure and blood now. There are two types of striated muscle: car-
diac and skeletal. Cardiac muscle is heart muscle, and it contracts rhythmi-
cally even in the absence of any innervation. Innervation ot the heart from
the autonomic nervous system (ANS) functions to accelerate or slow down
the heart rate. (Recall Otto Loewi's experiment in Chapter 5.)
Skeletal muscle constitutes the bulk of the muscle mass of the body
and functions to move bones around joints, to move the eyes within the
head, to control respiration, to control facial expression, and to produce
speech. Each skeletal muscle is enclosed in a connective tissue sheath that,
at the ends of the muscle, forms the tendons. Within each muscle are
hundreds of muscle fibers-the cells of skeletal muscle-and each fiber is
innervated by a single axon branch from the CNS (Figure 13.1). Because
skeletal muscle is derived embryologically from 33 paired somites (see
Chapter 7), these muscles, and the parts of the nervous system that con-
trol them, are collectively called the somatic motor system. We focus our
Muscle
fibers
Axons from CNS
'
\ t t
'\ I
\ ------ Muscle j\
(biceps)
I
, I ' '\
\ I
'L --
,
attention on this system because it is under voluntary control and it gen-
erates behavior. (The visceral motor system of the ANS will be discussed in
Chapter 15.)
Consider the elbow joint (Figure 13.2). This joint is formed where the
humerus, the upper arm bone. is bound by fibrous ligaments to the radius
and ulna, the bones of the lower arm. The joint functions like a hinge on
a pocket knife. Movement in the direction that closes the knife is called
flexion, and movement in the direction that opens the knife is called
extension. The major muscle that causes flexion is the brachialis, whose
tendons insert into the humerus at one end and into the ulna at the other.
\
Humerus
I
\ \
Biceps brachii
Brachialis
I Rad;",
\ /Ulna
\
, \-
'-
"- /
j
Flexion
\
Triceps --i I
brachii
\
Anconeus
Extension
T THE SOMATIC MOTOR SYSTEM 425
FIGURE 13.1
The structure of skeletal muscle.
Each muscle fiber is innervated by a single
axon.
FIGURE 13.2
Major muscles of the elbow joint.
The biceps and triceps are antagonistic
muscles. Contraction of the biceps causes
flexion, and contraction of the triceps
causes extension of the elbow.
426 C HAP T E R I 3 . SPINAL CONTROL OF MOVEMENT
Two other muscles cause flexion at this joint, the biceps brachii and the
coracobrachialis (which lies under the biceps). Together, these muscles are
called flexors of the elbow joint, and, because the three muscles all work
together, they are called synergists of one another. The two synergistic
muscles that cause extension of the elbow joint are the triceps brachii
and the anconeus; these two muscles are called extensors. Because the
flexors and extensors pull on the joint in opposite directions, they are called
antagonists to one another. Note that muscles only pull on a joint; they
cannot push. Even the simple flexion of the elbow joint requires the co-
ordinated contraction of the synergistic flexor muscles and the relaxation of
the antagonistic extensor muscles. By relaxing the antagonists, movements
are faster and more efficient because muscles are not working against one
another.
Other terms to note about somatic musculature refer to the location of
the joints they act on. The muscles that are responsible for movements of
the trunk are called axial muscles; those that move the shoulder, elbow,
pelvis, and knee are called proximal (or girdle) muscles; and those that
move the hands, feet, and digits (fingers and toes) are called distal muscles.
The axial musculature is very important for maintaining posture, the
proximal musculature is critical for locomotion, and the distal musculature,
particularly of the hands, is specialized for the manipulation of objects.
... THE LOWER MOTOR NEURON
The somatic musculature is innervated by the somatic motor neurons in the
ventral horn of the spinal cord (Figure 13.3). These cells are sometimes called
lower motor neurons to distinguish them from the higher-order upper motor
neurons of the brain that supply input to the spinal cord. Remember, only the
lower motor neurons directly command muscle contraction. Sherrington
called these neurons the final common pathway for the control of behavior.
The Segmental Organization of Lower Motor Neurons
The axons of lower motor neurons bundle together to form ventral roots;
each ventral root joins with a dorsal root to form a spinal nerve that exits
-......
.;;lIP
(
...
.".,
/ \\
Ventral '\ '---
'\
Lower
motor
neurons
root
\
Ventral
horn
\ \
Mixed
spinal
nerve
Muscle
fiber
"
FIGURE 13.3
Muscle innervation by lower motor neurons. The ventral horn of the spinal cord
contains motor neurons that Innervate skeletal muscle fibers.
.. THE LOWER MOTOR NEURON 427
,/
Ventral
horn
#
Ventral
horn
Lomba, f
enrargem::1
(L1-S3)
FIGURE 13.4
The distribution of motor neurons in the spinal cord. The cervical
enlargement of the spinal cord contains the motor neurons that innervate
the arm muscles. The lumbar enlargement contains neurons that innervate
the muscles of the leg.
the cord through the notches between vertebrae. Recall from Chapter 12
that there are as many spinal nerves as there are notches between vertebrae;
in humans, this adds up to 30 on each side. Because they contain sensory
and motor fibers, they are called mixed spinal nerves. The motor neurons that
provide fibers to one spinal nerve are said to belong to a spinal segment,
named for the vertebra where the nerve originates. The segments are
cervical (C) 1-8, thoracic (T) 1-12, lumbar (1) 1-5, and sacral (S) 1-5 (see
Figure 12.10).
Skeletal muscles are not distributed evenly throughout the body, nor
are lower motor neurons distributed evenly within the spinal cord. For
example, innervation of the more than SO muscles of the arm originates
entirely from spinal segments C3-Tl. Thus, in this region of the spinal
cord, the ventral horns appear swollen to accommodate the large num-
ber of motor neurons that control the arm musculature (Figure 13.4).
428 C HAP T E R I 3 . SPINAL CONTROL OF MOVEMENT
/
/
--
Axial
muscles
Medial ...
i1
!
I
Ventral
horn
Flexors
Dorsal
-4..
Distal
muscles
Extensors
Ventral
. Lateral
FIGURE 13.5
The distribution of lower motor
neurons in the ventral horn. Motor
neurons controlling flexors lie dorsal to
those controlling extensors. Motor neurons
controlling aXial muscles lie medial to those
controlling distal muscles.
Similarly, spinal segments Ll-S3 have a swollen ventral horn because this
is where the motor neurons controlling the leg musculature reside. Thus,
we can see that the motor neurons that innervate distal and proximal
musculature are found mainly in the cervical and lumbar-sacral segments
of the spinal cord, whereas those innervating axial musculature are found
at all levels.
The lower motor neurons are also distributed within the ventral horn at
each spinal segment in a predictable way, depending on their function. The
cells innervating the axial muscles are medial to those innervating the
distal muscles, and the cells innervating flexors are dorsal to those inner-
vating extensors (Figure 13.5).
Alpha Motor Neurons
There are two categories of lower motor neurons of the spinal cord: alpha
motor neurons and gamma motor neurons (the latter are discussed later in
this chapter). Alpha motor neurons directly trigger the generation of
force by muscles. One alpha motor neuron and all the muscle fibers it
innervates collectively make up the elementary component of motor con-
trol; Sherrington called it the motor unit. Muscle contraction results from
the individual and combined actions of these motor units. The collection
of alpha motor neurons that innervates a single muscle (e.g., the biceps
brachii) is called a motor neuron pool (Figure 13.6).
Graded Control of Muscle Contraction by Alpha Motor Neurons. It
is important to exert just the right amount of force during movements: Too
much, and you'll crush the egg you just picked up, while also wasting
metabolic energy. Too little, and you may lose the swim race. Most of the
movements we make, such as walking, talking, and writing, require only
weak muscle contractions. Now and then we need to jog or lift a pile of
books, and stronger contractions are necessary. We reserve the maximal
contraction force of our muscles for rare events, such as competitive sprint-
ing or scrambling up a tree to escape a charging bear. The nervous system
uses several mechanisms to control the force of muscle contraction in a
finely graded fashion.
The first way the CNS controls muscle contraction is by varying the firing
rate of motor neurons. An alpha motor neuron communicates with a
muscle fiber by releasing the neurotransmitter acetylcholine (ACh) at the
neuromuscular junction, the specialized synapse between a nerve and a
skeletal muscle (see Chapter 5). Because of the high reliability of neuro-
muscular transmission, the ACh released in response to one presynaptic
action potential causes an excitatory postsynaptic potential (EPSP) in the
muscle fiber (sometimes also called an endplate potential) large enough to
trigger one postsynaptic action potential. By mechanisms we will discuss
in a moment, a postsynaptic action potential causes a twitch-a rapid se-
quence of contraction and relaxation-in the muscle fiber. A sustained
contraction requires a continual barrage of action potentials. High-fre-
quency presynaptic activity causes temporal summation of the postsy-
naptic responses, as it does for other types of synaptic transmission. Twitch
summation increases the tension in the muscle fibers and smoothes the
contraction (Figure 13.7). The rate of firing of motor units is therefore
one important way the CNS grades muscle contraction.
A second way the CNS grades muscle contraction is by recruiting addi-
tional synergistic motor units. The extra tension provided by the recruit-
ment of an active motor unit depends on how many muscle fibers are in
that unit. In the antigravity muscles of the leg (muscles that oppose the
force of gravity when standing upright), each motor unit tends to be quite
large, with an innervation ratio of more than 1000 muscle fibers per single
alpha motor neuron. In contrast, the smaller muscles that control the
movement of the fingers and the rotation of the eyes are characterized by
much smaller innervation ratios, as few as three muscle fibers per alpha
motor neuraD. In general, muscles with a large number of small motor
units can be more finely controlled by the CNS.
Most muscles have a range of motor unit sizes, and these motor units are
recruited in the order of smallest first, largest last. This orderly recruitment
explains why finer control is possible when muscles are under light loads
than when they are under greater loads. Small motor units have small alpha
=;rr;
d,', 'w
t
Record motor
neuron activity
Measure muscle contraction
(a)
I Muscle contraction
Q)
()
o
LL
I
5 Hz
Q)
()
o
LL
Motor neuron activity
I
Action potentials recorded extracellularty
Time-
Time_
20Hz
40 Hz
i
I
Q)
()
o
LL
Q)
()
o
LL
Time-
Time-
(b)
FIGURE 13.7
From muscle twitch to sustained contraction. (a) A single action potential in an alpha
motor neuron causes the muscle fiber to twitch. (b) The summation of twitches causes a
sustained contraction as the number and frequency of incoming action potentials increase
... THE LOWER MOTOR NEURON 429
/ :: r
/J:.
"
I
r Motor
unit
J
Muscle
fibers
(a)
,
,
't'
,
,
: " ...--- Motor
\ ,J :; :;00
:ft; J,
Muscle #
'\
\
"\
"
(b)
FIGURE 13.6
A motor unit and motor neuron pool.
(a) A motor unit is an alpha motor neuron
and all the muscle fibers it innervates. (b) A
motor neuron pool is all the alpha motor
neurons that Innervate one muscle.
430 C HAP T E R I 3 . SPINAL CONTROL OF MOVEMENT
Input from spinal Sensory input
interneurons from muscle
\; , "dI"
neurons In
."'" the brain
Alpha motor
neuron
FIGURE 13.8
An alpha motor neuron and its three
sources of input.
motor neurons, and large motor units have large alpha motor neurons.
Thus, one way that orderly recruitment might occur is if small neurons, as
a consequence of the geometry of their soma and dendrites, were more
easily excited by signals descending from the brain. The idea that the orderly
recruitment of motor neurons is due to variations in alpha motor neuron
size, first proposed in the late 1950s by Harvard University neurophysiolo-
gist Elwood Henneman, is called the size principle.
Inputs to Alpha Motor Neurons. Alpha motor neurons excite skeletal
muscles. Therefore, to understand the control of muscles, we must under-
stand what regulates motor neurons. Lower motor neurons are controlled
by synaptic inputs in the ventral horn. There are only three major sources of
input to an alpha motor neuron, as shown in Figure 13.8. The first source is
dorsal root ganglion cells with axons that innervate a specialized sensory
apparatus embedded within the muscle known as a muscle spindle. As we
shall see, this input provides feedback about muscle length. The second
source of input to an alpha motor neuron derives from upper motor neurons
in the motor cortex and brain stem. This input is important for the initia-
tion and control of voluntary movement and will be discussed in more de-
tail in Chapter 14. The third and largest input to an alpha motor neuron
derives from interneurons in the spinal cord. This input may be excitatory
or inhibitory and is part of the circuitry that generates the spinal motor
programs.
Types of Motor Units
If you have ever eaten different parts of chicken, you know that not all
muscle is the same; the leg has dark meat and the breast and wing have
white meat. The different appearance, and taste, of the various muscles are
due to the biochemistry of the constituent muscle fibers. The red (dark)
muscle fibers are characterized by a large number of mitochondria and en-
zymes specialized for oxidative energy metabolism. These fibers are rela-
tively slow to contract but can sustain contraction for a long time without
fatigue. They are typically found in the antigravity muscles of the leg and
in the flight muscles of birds that fly (as opposed to domesticated chickens).
In contrast, the pale (white) muscle fibers contain fewer mitochondria and
rely mainly on anaerobic (without oxygen) metabolism. These fibers con-
tract rapidly and powerfully, but they also fatigue rapidly. They are typical
of muscles involved in escape reflexes; for example, the jumping muscles
of frogs and rabbits. In humans, the arm muscles contain a large number
of white fibers.
Even though both types of muscle fiber can (and usually do) coexist
in a given muscle, each motor unit contains muscle fibers of only a sin-
gle type. Thus, fast motor units contain rapidly fatiguing white fibers,
and slow motor units contain slowly fatiguing red fibers. Just as the
muscle fibers of the two types of units differ, so do many of the proper-
ties of alpha motor neurons. For example, the motor neurons of fast
units are generally bigger and have larger-diameter, faster-conducting
axons; slow units have smaller-diameter, more slowly conducting axons.
The firing properties of the two types of motor neuron also differ. Fast
motor neurons tend to generate occasional high-frequency bursts of action
potentials (30-60 impulses per second), whereas slow motor neurons are
characterized by relatively steady, low-frequency activity (10-20 impulses
per second).
Normal
innervation
Crossed
innervation
Alpha motor
neuron type:
Slow
Fast
Slow
Fast
Q
o
Muscle name:
Muscle type:
Soleus
Slow
Soleus
Fast-like
Gastrocnemius
Slow-like
Gastrocnemius
Fast
FIGURE 13.9
A crossed-innervation experiment. Forcing slow motor neurons to innervate a fast
muscle causes the muscle to switch to assume slow properties.
Neuromuscular Matchmakiing. The precise matching of particular motor
neurons to particular muscle fibers raises an interesting question. Because
we've been talking about chickens, let's pose the question this way: Which
came first, the muscle fiber or the motor neuron? Perhaps during early
embryonic development there is a matching of the appropriate axons with
the appropriate muscle fibers. Alternatively, we could imagine that the
properties of the muscle are determined solely by the type of innervation
it gets. If it receives a synaptic contact horn a fast motor neuron, it becomes
a fast fiber, and vice versa for slow units.
This question was addressed in an experiment by John Eccles and his
colleagues in which the normal innervation of a fast muscle was removed
and replaced with a nerve that normally innervated a slow muscle (Figure
13.9). This procedure resulted in the muscle's acquiring slow properties,
including not only the type of contraction (slow, fatigue-resistant), but also
a switch in much of the underlying biochemistry. This change is referred to
as a switch of muscle phenotype-its physical characteristics-because the
types of proteins expressed by the muscle were altered by the new inner-
vation. Work by Terje L0mo and his colleagues in Norway suggests that this
switch in muscle phenotype can be induced simply by changing the activ-
ity in the motor neuron from a fast pattern (occasional bursts at 30-60
impulses per second) to a slow pattern (steady activity at 10-20 impulses
per second). These findings are particularly interesting because they raise
the possibility that neurons switch phenotype as a consequence of synaptic
activity (experience) and that this may be a basis for learning and memory
(see Chapters 24 and 25).
Besides the alterations imposed by patterns of motor neuron activity,
muscle fibers are also changed simply by varying the absolute amount of
activity. A long-term consequence of increased activity (especially due to
isometric exercise) is hypertrophy, or exaggerated growth, of the muscle
fibers, as seen in bodybuilders. Conversely, prolonged inactivity leads to at-
rophy, or degeneration, of muscle fibers, which can happen when joints are
immobilized in a cast following an injury. Clearly, there is an intimate re-
lationship between the lower motor neuron and the muscle fibers it in-
nervates (Box 13.1).
... THE LOWER MOTOR NEURON 43 I
432 C HAP T E R I 3 . SPINAL CONTROL OF MOVEMENT
Box 13.1
.... , .
....
OF SPECIAL INTEREST
#
Amyotrophic Lateral Sclerosis
Amyotrophic lateral sclerosis (ALS) is an especially cruel disease
that was first described in 1869 by the French neurolo-
gist Jean-Martin Charcot. The initial signs of the disease
are muscle weakness and atrophy. Usually over the course
of 1-5 years. all voluntary movement is lost-walking,
speaking. swallowing. and breathing gradually deteriorate.
Death is usually caused by failure of the respiratory
muscles. Because the disease does not affect sensations,
intellect, or cognitive function, patients are left to watch
their bodies slowly waste away, keenly aware of what is
happening. The disease is relatively rare, afflicting one out
of approximately every 20.000 individuals. Still. an esti-
mated 30,000 Americans are currently diagnosed with
AlS. Its most famous victim was Lou Gehrig, a star base-
ball player with the New York Yankees, who died of AlS
in 1936. In the United States, ALS is often called Lou
Gehrig's disease.
Muscle weakness and paralysis are characteristics of
motor unit damage. Indeed, the pathology associated with
ALS is the degeneration of the large alpha motor neurons.
The large neurons of the motor cortex that innervate
alpha motor neurons are also affected, but, curiously,
other neurons in the CNS are spared. The selective
damage to motor neurons explains the selective loss of
motor functions in AlS patients.
The exact cause of ALS is unknown. but a few clues have
emerged. A small percentage of ALS cases are genetic, and
screens for the defective gene have pointed to a mutation
affecting the enzyme superoxide dismutase. A toxic by-
product of cellular metabolism is the negatively charged
molecule O 2 -. called the superoxide radical. Superoxide
radicals are extremely reactive and can inflict irreversible
cellular damage. Superoxide dismutase is a key enzyme
that causes superoxide radicals to lose their extra elec-
trons, converting them back to oxygen. Thus, the loss of
superoxide dismutase would lead to a buildup of super-
oxide radicals and cellular damage. particularly in cells
that are metabolically very active. The death of motor
neurons seems to depend on the glial cells that surround
them. Research has also revealed that mutations of sev-
eral other genes can cause rare forms of AlS.
Another suspected cause of AlS is excitotoxicity. As
we learned in Chapter 6, overstimulation by the excita-
tory neurotransmitter glutamate and closely related amino
acids can cause the death of otherwise normal neurons
(see Box 6.2). Many AlS patients have elevated levels of
glutamate in their cerebrospinal fluid. Excitotoxicity has
been implicated in the unusually high incidence of ALS on
the island of Guam that occurred before World War II. It
has been suggested that one environmental cause may
have been the ingestion of cycad nuts, which contain an
excitotoxic amino acid. In addition, research indicates that
a glutamate transporter may be defective in ALS, thereby
prolonging the exposure of active neurons to extracellu-
lar glutamate. Thus, the first drug approved by the U.S.
Food and Drug Administration for the treatment of ALS
was riluzole, a blocker of glutamate release. The drug
treatment can slow the disease by a few months. but
unfortunately the long-term outcome is the same.
There is still much to be learned about selective motor
neuron loss in AlS. However. the slow accumulation of
damage from the toxic by-products of cellular metabolism
probably occurs in all neurons and contributes to neuronal
death over the lifespan of all people. But thi,s loss of
neurons may not be inevitable. Vitamins C and E read-
ily accept electrons from superoxide radicals and can be
neuroprotective. Dietary supplementation with these
vitamins may help retard the neuronal loss that occurs
in the brain as we grow older.
EXCITATION-CONTRACTION COUPLING
As we said, muscle contraction is initiated by the release of ACh from the
axon terminals of alpha motor neurons. ACh produces a large EPSP in the
postsynaptic membrane due to the activation of nicotinic ACh receptors.
Because the membrane of the muscle cell contains voltage-gated sodium
channels, this EPSP is sufficient to evoke an action potential in the muscle
fiber. By the process of excitation-contraction coupling, this action
potentiaL the excitation. triggers the release of Ca2+ from an organelle
inside the muscle fiber. which leads to contraction of the fiber. Relaxation
occurs when the Ca2+ levels are lowered by reuptake into the organelle.
.. EXCITATION-CONTRACTION COUPLING 433
To understand this process, we must take a closer look at the muscle
fiber.
Muscle Fiber Structure
The structure of a muscle fiber is shown in Figure 13.10. Muscle fibers are
formed early in fetal development by the fusion of muscle precursor cells,
or myoblasts, which are derived from the mesoderm (see Chapter 7). This
fusion leaves each cell with more than one cell nucleus, so individual
muscle cells are said to be multinucleated. The fusion elongates the cells
(hence the name fiber). Muscle fibers are enclosed by an excitable cell
membrane called the sarcolemma.
Within the muscle fiber are a number of cylindrical structures called
myofibrils, which contract in response to an action potential sweeping
down the sarcolemma. Myofibrils are surrounded by the sarcoplasmic
reticulum (SR), an extensive intracellular sac that stores Ca H (similar in
appearance to the smooth ER of neurons; see Chapter 2). Action potentials
sweeping along the sarcolemma gain access to the sarcoplasmic reticulum
deep inside the fiber by way of a network of tunnels called T tubules
(T for transverse). These are like inside-out axons; the lumen of each T
tubule is continuous with the extracellular fluid.
Where the T tubule comes in close apposition to the SR, there is a spe-
cialized coupling of the proteins in the two membranes. A voltage-sensitive
cluster of four calcium channels, called a tetrad, in the T tubule membrane
is linked to a calcium release channel in the SR. As illustrated in Figure 13.1 L
the arrival of an action potential in the T tubule membrane causes a con-
formational change in the voltage-sensitive tetrad of channels, which opens
the calcium release channel in the SR membrane. Some Ca H flows through
the tetrad channels, and even more Ca H flows through the calcium release
channel, and the resulting increase in free Ca H within the cytosol causes
the myofibril to contract.
Mitochondria
.
Myofibrils
/1
;
_" 'I
.-/
,
--,--. "
r '
. G 1
Ork" _olT tubules
' fjO I __ Sarcoplasmic
l I reticulum
I
I ' I
*'
Villi,
-.
.
I.
'. "
( "
.......... I J '
)
! lJ)(]OJ
o I
1 :>Openings of
T tubules
/
.
"- - Sarcolemma
--- _/
FIGURE 13.10
The structure of a muscle fiber. T tubules conduct electrical activity from the surface
membrane into the depths of the muscle fiber.
434 C HAP T E R I 3 . SPINAL CONTROL OF MOVEMENT
FIGURE 13.11
The release of Ca 2 + from the sarco-
plasmic reticulum. Depolarization of the
T tubule membrane causes conformational
changes in proteins that are linked to calCium
channels in the SR. releasing stored Ca 2 + into
the cytosol of the muscle fiber.
Zline
III
,
II
11"
."t,;\:, :(: '.
.,., ......"."
"/ i \' ,.;
. ' .
I "
III
Thick
filaments
Sarcomere
I' .
"'\11
Zline
FIGURE 13.12
The myofibril: a closer look.
'oiia
.:
-;.-.
, ,
.) IIII' I OU/) ..11.
III, "if
fjO I D
1'1 dO
OQO,'
Muscle fiber
....
. ----
.
. 0 '
( I ,
\ ?,').
" \
Myofibril
.
')
, .
..-
- - -_:...
4:: Sarcoplasmic
reticulum
....J.....-- T tu bu Ie
Sarcolemma
ill
./
/
"'
Calcium
release
channel
I
'l
Cytosol of
muscle fiber
Cut edge of
T tubule
..... } membrane
" a2+ Inside of
- T tubule
Cut edge of SR
membrane
Tetrad of
calcium
channels
Rest
Depolarized
The Molecular Basis of Muscle Contraction
A closer look at the myofibril reveals how Ca2+ triggers contraction (Fig-
ure 13 .12). The myofibril is divided into segments by disks called Z lines
(named for their appearance when viewed from the side). A segment com-
prised of two Z lines and the myofibril in between is called a sarcomere.
Anchored to each side of the Z lines is a series of bristles called thin fila-
ments. The thin filaments from adjacent Z lines face one another but do
not come in contact. Between and among the two sets of thin filaments are
a series of fibers called thick filaments. Muscle contraction occurs when
the thin filaments slide along the thick filaments, bringing adjacent Z lines
toward one another. In other words, the sarcomere becomes shorter in
length. This sliding-filament model of sarcomere shortening is shown in
Figure 13.13.
The sliding of the filaments with respect to one another occurs because
of the interaction between the major thick filament protein. myosin. and
the major thin filament protein, actin. The exposed "heads" of the myosin
molecules bind actin molecules and then undergo a conformational change
Zline
m
, I
""
.¥,'r . ,'r '
"'... "'"
J'" ,\, , t
. 11 I I "
'.: l i i1 1 1
. I( t..
" )fJ ,)
!' ji.' ;
... '! l\\
i:ii:j
..
,.," ,
'M MWr
"';' " i' '"
::rr: : . H:::
t 1'1' 1 1
III :
\ ' L '. I'
',) f:
J'\ ::,J . ' :I;!
HUJlPJl
.,1j,I':' ''''''
; .\':: w '''.:':i.'
I"" .
I'. ':
Thin
filaments
I; HI
; : I' .
, \ / I \ .
cl..; :
. :-;' 1
},'
1 1 I
" ).
't.":;\" f:\'
,'r ; ','fi. ,' '
,r; ,\'/i \'
., I, J
.. I r . 11
I II
I ": ,
; : ';
., ...:-., ..
t \"f " ,
, . ,
f1\r,
.
Thick
filaments
Ii L ,]1
l' '. 'I ,'t; .
/ ;".JA JA\.,
. ). :!;). \.
'r
Weight._
I
t
t
Fully relaxed
Ca 2 +
.. Fully contracted
that causes them to pivot (Figure 13.14). This pivoting causes the thick fil-
ament to move with respect to the thin filament. At the expense of ATp,
the myosin heads then disengage and "uncock" so that the process can re-
peat itself. Repeating this cycle enables the myosin heads to "walk" along
the actin filament.
When the muscle is at rest, myosin cannot interact with actin because
the myosin attachment sites on the actin molecule are covered by the pro-
tein troponin. Ca 2 + initiates muscle contraction by binding to troponin.
thereby exposing the sites where myosin binds to actin. Contraction con-
tinues as long as Ca2+ and ATP are available; relaxation occurs when the
Ca2+ is sequestered by the sarcoplasmic reticulum. The reuptake of Ca 2 +
by the SR depends on the action of a calcium pump and hence also re-
quires ATP.
... EXCITATION-CONTRACTION COUPLING 435
FIGURE 13.13
The sliding-filament model of muscle
contraction. Myofibrils shorten when the
thin filaments slide toward one another on
the thick filaments.
436 C HAP T E R I 3 . SPINAL CONTROL OF MOVEMENT
FIGURE 13.14
The molecular basis of muscle
contraction. The binding of Ca H to
troponln allows the myosin heads to bind
to the actin filament. Then the myosin heads
pivot, causing the filaments to slide with
respect to one another.
Actin
filament
Myosin
filament
.
Ii
-\
'
r I
j
Troponin
Ca 2 +
..
We can summarize the steps of excitation-contraction coupling as follows:
Excitation
1. An action potential occurs in an alpha motor neuron axon.
2. ACh is released by the axon terminal of the alpha motor neuron at the
neuromuscular junction.
3. Nicotinic receptor channels in the sarcolemma open. and the postsynap-
tic sarcolemma depolarizes (EPSP).
4. Voltage-gated sodium channels open, and an action potential is generated
in the muscle fiber. which sweeps down the sarcolemma and into the T
tubules.
5. Depolarization of the T tubules causes Ca 2 + release from the sarcoplas-
mic reticulum.
Contraction
1. Ca2+ binds to troponin.
2. Myosin binding sites on actin are exposed.
3. Myosin heads bind actin.
4. Myosin heads pivot.
5. Myosin heads disengage at the expense of ATP.
6. The cycle continues as long as Ca2+ and ATP are present.
Relaxation
1. As EPSPs end, the sarcolemma and T tubules return to their resting
potentials.
2. Ca2+ is sequestered by the sarcoplasmic reticulum by an ATP-driven
pump.
3. Myosin binding sites on actin are covered by troponin.
You can now understand why death causes stiffening of the muscles, a
condition known as rigor mortis. Starving the muscle cells of ATP prevents
Box 13.2
.... ,
'Y SPINAL CONTROL OF MOTOR UNITS 437
#
.
...
OF SPECIAL INTEREST
Duchenne Muscular Dystrophy
Muscular dystrophy describes a group of inherited dis-
orders, all of which are characterized by progressive weak-
ness and deterioration of muscle.The most common type,
Duchenne muscular dystrophy. afflicts about one in 3500
boys before adolescence. The disease is first detected as
a weakness of the legs and usually puts its victims in
wheelchairs by the time they reach age 12. The disease
continues to progress, and afflicted males typically do not
survive past the age of 30.
The characteristic hereditary pattern of this disease,
which afflicts only males but is passed on from their
mothers, led to a search for a defective gene on the X
chromosome. Major breakthroughs came in the late 1980s
when the defective region of the X chromosome was
identified. Researchers discovered that this region con-
tains the gene for the cytoskeletal protein dystrophin.
Boys with Duchenne muscular dystrophy lack the mRNA
encoding this protein. A milder form of the disease, called
Becker muscular dystrophy. was found to be associated
with an altered mRNA encoding only a portion of the
dystrophin protein.
Dystrophin is a large protein that contributes to the mus-
cle cytoskeleton lying just under the sarcolemma. The pro-
tein must not be strictly required for muscle contraction,
however, because movements in afflicted boys appear to be
normal during the first few years of life. Possibly the absence
of dystrophin leads to secondary changes in the contractile
apparatus, eventually resulting in muscle degeneration.
Whatever the normal function of dystrophin ultimately
proves to be, it's clear that our models of excitation-
contraction coupling are based on knowledge of only a
fraction of the proteins that are normally expressed by
neurons and muscle fibers. As we learn more about the
various proteins in the membrane and cytosol, we can
anticipate significant revisions of these models. It is inter-
esting to note that dystrophin is also concentrated in
axon terminals in the brain, where it might contribute to
excitation-secretion coupling.
Intensive efforts are now under way to find a strategy
for treating, or even curing, Duchenne muscular dystro-
phy by using some form of gene therapy. The essential
idea is to replace the defective dystrophin gene with an
artificial gene that replaces or mimics a normal dystrophin
gene. The biggest challenge is determining a way to get
the artificial gene into dystrophic muscle cells. One strat-
egy is to use specially engineered forms of viruses that
will carry the gene, infect muscle cells, and induce the
cells to express dystrophin.Another approach is to trans-
plant stem cells-immature cells that can grow and dif-
ferentiate into mature, normal muscle cells that express
dystrophin-into dystrophic muscles. Stem cell therapy
has been very promising when tested in mouse models of
muscular dystrophy. It is exciting to think that a devastat-
ing genetic disease such as Duchenne muscular dystrophy
might soon be treatable.
the detachment of the myosin heads and leaves the myosin attachment
sites on the actin filaments exposed for binding. The end result is the for-
mation of permanent attachments between the thick and thin filaments.
Since the proposal of the sliding-filament model in 1954 by English phys-
iologists Hugh Huxley and Andrew Huxley, there has been a tremendous
amount of progress in identifying the detailed molecular mechanisms of ex-
citation-contraction coupling in muscle. This progress has resulted from a
multidisciplinary approach to the problem, with critical contributions made
by the use of electron microscopy, as well as biochemical and biophysical
methods. The very recent application of molecular genetic techniques also
has added important new information to our understanding of muscle
function, in both health and disease (Box 13.2).
.. SPINAL CONTROL OF MOTOR UNITS
We've traced the action potentials sweeping down the axon of the alpha
motor neuron and activating the neuromuscular junction, triggering the
contraction of the muscle fibers in the motor unit. We've also described
some of the devastating disease processes that affect motor neurons and
438 C H A PT E R 13 . SPINAL CONTROL OF MOVEMENT
Box 13.3
,,'
....
OF SPECIAL INTEREST
...
. Myasthenia Gravis
The neuromuscular junction is an exceptionally reliable
synapse. A presynapdc action potential causes the con-
tents of hundreds of synaptic vesicles to be released into
the synaptic cleft. The liberated ACh molecules act at
densely packed nicotinic receptors in the postsynaptic
membrane. and the resulting EPSP is many times larger
than what is necessary to trigger an action potential, and
twitch, in the muscle fiber-normally, that is.
In a clinical condition called myasthenia gravis, released
ACh is far less effecdve, and neuromuscular transmission
often fails. The name is derived from the Greek for "se-
vere muscle weakness." The disorder is characterized by
weakness and fatigability of voluntary muscles, typically in-
cluding the muscles of facial expression, and it can be fa-
tal if respiration is compromised. The disease is not com-
mon, striking about one in 10,000 people of all ages and
ethnic groups. An unusual feature of myasthenia gravis is
that the severity of the muscle weakness fluctuates, even
over the course of a single day.
Myasthenia gravis is an autoimmune disease. For reasons
we are only beginning to understand, the immune system
of afflicted individuals generates antibodies against the
body's own nicotinic ACh receptors. The antibodies bind to
the receptors, interfering with the normal actions of ACh
at the neuromuscular junctions. In addition, the binding of
andbodies to the receptors leads to secondary, degener-
ative changes in the structure of the neuromuscular junc-
tions that also make transmission much less efficient.
An effective treatment for myasthenia gravis is the ad-
ministration of drugs that inhibit the enzyme acetyl-
cholinesterase (AChE). Recall from Chapters 5 and 6 that
AChE breaks down ACh in the synaptic cleft. In low doses,
AChE inhibitors can strengthen neuromuscular transmis-
sion by prolonging the life of released ACh. But the ther-
apeutic window is narrow. As we saw in Box 5.5, too
much ACh in the cleft leads to desensitization of the re-
ceptors and a block of neuromuscular transmission.
Another common treatment for myasthenia gravis in-
volves suppression of the immune system, either with
drugs or by surgical removal of the thymus gland. If man-
aged carefully, the long-term prognosis is good for patients
with this disease of the neuromuswlar junction.
muscles. The neuromuscular junction is vulnerable as weB (Box 13.3), and
scientific detective work has helped us understand why (Box 13.4).
Now let's explore how the activity of the motor neuron is itself con-
troBed. We begin with a discussion of the first source at synaptic input to
the alpha motor neuron introduced above-sensory teedback from the
muscles themselves.
Proprioception from Muscle Spindles
As we mentioned already, deep within most skeletal muscles are special-
ized structures caBed muscle spindles (Figure 13.15). A muscle spindle,
also called a stretch receptor, consists of several types of specialized skeletal
muscle £ibers contained in a fibrous capsule. The middle third of the capsule
is swollen, giving the structure the shape for which it is named. In this mid-
dle (equatorial) region, group la sensory axons wrap around the muscle
fibers of the spindle. The spindles and their associated la axons, specialized
tor the detection of changes in muscle length (stretch), are examples of
proprioceptors. These receptors are a component ot the somatic sensory
system that is specialized for "body sense," or proprioception (from the
Latin for "one's own"), which intorms us about how our body is positioned
and moving in space.
RecaB from Chapter 12 that group I axons are the thickest myelinated
axons in the body, meaning that they conduct action potentials very rap-
idly. Within this group, la axons are the largest and tastest. Ia axons enter
the spinal cord via the dorsal roots, branch repeatedly, and form excitatory
synapses upon both interneurons and alpha motor neurons of the ventral
"If SPINAL CONTROL OF MOTOR UNITS 439
Group la sensory axons
\
\
\
Fibrous
capsule I 1-
/"
6 J1 ,
_IIIII!!.;
.. ..,
'! :;
llr
Muscle
spindle
\
\
\ \
FIGURE 13.15
A muscle spindle and its sensory innervation.
horns. The la inputs are also very powerful. Neurophysiologist Lorne
Mendell, working at Harvard with Henneman, was able to show that a
single Ia axon synapses on virtually every alpha motor neuron in the pool
innervating the same muscle that contains the spindle.
The Myotatic Reflex. The function of this sensory input to the spinal cord
was first shown by Sherrington, who noted that when a muscle is pulled
on, it tends to pull back (contract). The fact that this myotatic reflex (myo
from the Greek for "muscle," tatic from the Greek for "stretch"), sometimes
called the stretch reflex, involves sensory feedback from the muscle was
shown by cutting the dorsal roots. Even though the alpha motor neurons
were left intact, this procedure eliminated the stretch reflex and caused a
loss of muscle tone. Sherrington deduced that the motor neurons must
receive a continual synaptic input from the muscles. Later work showed
that the discharge of Ia sensory axons is closely related to the length of the
muscle. As the muscle is stretched, the discharge rate goes up; as the
muscle is shortened and goes slack, the discharge rate goes down.
The Ia axon and the alpha motor neurons on which it synapses consti-
tute the monosynaptic myotatic reflex arc-"monosynaptic" because only one
synapse separates the primary sensory input from the motor neuron out-
put. Figure 13.16 shows how this reflex arc serves as an antigravity feed-
back loop. When a weight is placed on a muscle and the muscle starts to
lengthen, the muscle spindles are stretched. The stretching of the equato-
rial region of the spindle leads to depolarization of the Ia axon endings
due to the opening of mechanosensitive ion channels (see Chapter 12). The
resulting increased action potential discharge of the Ia axons synaptically
depolarizes the alpha motor neurons, which respond by increasing their
action potential frequency. This causes the muscle to contract, thereby
shortening it.
The knee-jerk reflex is one example of the myotatic reflex. When your
doctor taps the tendon beneath your kneecap, it stretches the quadriceps
440 C HAP T E R I 3 . SPINAL CONTROL OF MOVEMENT
Alpha motor
neuron
Weight added to muscle
"t:J
ro
o
--I
,
t ___________________________________________________________._______
- I Transient elon g ation of muscle
o Q)
t
E
--I
- ---- -- -- - - --- - - -- ---- - - -------- - - - - -- - -- - - -- ---- - - - - ----
C
o
x
ro
ro
o
"0 C
E e
ro :::J
.r:;Q)
o.C
<!
Alpha motor neuron discharge shortens muscle
1111111111111111111111111111111111111111111111111111111111111 1 1 I 1 1 I 1 I 1 I 1 I 1 I I I I 1 I I
FIGURE 13.16
The myotatic reflex. This illustration shows the response of a la axon and a motor
neuron to the sudden addition of weight that stretches the muscle.
muscle of your thigh, which then reflexively contracts and causes your leg
to extend (Figure 13.17). The knee-jerk reflex tests the intactness of the
nerves and muscles in this reflex arc.
Gamma Motor Neurons
The muscle spindle contains modified skeletal muscle fibers within its fibrous
capsule. These muscle fibers are called intrafusal fibers, to distinguish
them from [he more numerous extrafusal fibers [hat lie outside the
spindle and form the bulk of the muscle. An important difference between
the two types of muscle fibers is that only extrafusal fibers are innervated
by alpha motor neurons. Intrafusal fibers receive their motor innervation
by another type of lower motor neuron caned a gamma motor neuron
(Figure 13.18).
Imagine a situation in which muscle contraction is commanded by an
upper motor neuron. The alpha motor neurons respond, the extrafusal
... SPINAL CONTROL OF MOTOR UNITS 441
/
Alpha
motor
neuron
FIGURE 13.17
The knee-jerk reflex.
Quadriceps
/
/ Alpha motor
neuron
/
/
Gamma motor
neuron
"
\
\
)
Tendon Of
quadriceps
Muscle
spindle
I
, '. t
"'"
/ \
"JK / Extrafusal
. muscle fibers
/ Intrafusal
muscle fibers
L
FIGURE 13.1 B
Alpha motor neurons, gamma motor neurons,
and the muscle fibers they innervate.
fibers contract, and the muscle shortens. The response of the muscle spindles
is shown in Figure 13.19. If they went slack, the Ia axons would become
silent and the spindle would go "off the air," no longer providing informa-
tion about muscle length. This does not happen, however, because the
gamma motor neurons are also activated. Gamma motor neurons innervate
the intrafusal muscle fiber at the two ends of the muscle spindle. Activation
of these fibers causes a contraction of the two poles of the muscle spindle,
thereby pulling on the noncontractile equatorial region and keeping the Ia
Extrafusal fibers
I ntrafusal fibers
la axon
:::::J / Activate
/ alpha motor
neuron
.
Activate
gamma motor
neuron
.
FIGURE 13.19
The function of gamma motor neurons.
(a) Activation of alpha motor neurons causes
the extrafusal muscle fibers to shorten. (b) If
the muscle spindle becomes slack. it goes "off
the air" and no longer reports the length of
the muscle. (c) Activation of gamma motor
neurons causes the poles of the spindle to
contract, keeping it "on-the-air."
(a)
(b)
(c)
442 C HAP T E R I 3 . SPINAL CONTROL Of MOVEMENT
Box 13.4
PATH OF DISCOVERY
Ii't
I' "'-
.;:::; ....
Finding the Cause of
Myasthenia Gravis
By 1973. the physiological role of nicotinic ACh receptors
in neuromuscular transmission was clear. Several unlikely
animals proved to be critical for studying the biochem-
istry of the ACh receptor (AChR). The electric organs of
electric eels were a rich source of AChR protein. and la-
beling methods developed by Arthur Karlin and Jean-
Pierre Changeux were beginning to suggest that this trans-
mitter-gated ion channel is a protein. The ex toxins in the
venoms of cobras and kraits. initially characterized by
C. Y. Lee. turned out to bind with great specificity and
affinity to the ACh binding site of ACh receptors. The
cobra toxin could be used as a very discriminating "bait"
to isolate AChRs from extracts of eel electric organs. In
this way. I was able to purify several milligrams of AChR
protein in a single step. This was a huge improvement on
the methods I had used when I was a graduate student.
It was a "Eureka!" moment to finally have in hand large
quantities of protein that would allow molecular studies
of a neurotransmitter receptor. However. it was still nec-
essary to prove that the purified protein was in fact the
physiologically significant ACh receptor. Methods for
cloning and expressing functional receptors were still a
long way off.
Jim Patrick and I reasoned that if antibodies to our
purified protein could block the functions of ACh recep-
tors in electric organ cells, it would prove that the pro-
tein was at least part of the AChR. When we immunized
rabbits with the protein, they became profoundly weak; this
suggested that the rabbits' antibodies had cross-reacted
with AChRs in the rabbits' own muscles and impaired
their neuromuscular transmission. This was another
"Eureka!" moment. One of my graduate school mentors.
Ed Lennox. had long before given me a paper by John
Simpson. In 1960. Simpson had proposed that myasthenia
gravis was caused by autoantibodies (antibodies a patient
produces to his own proteins) that inhibit ACh from
binding to its receptor. Originally. we were thinking about
using these autoantibodies as a way to identify the AChR
protein. Things came full circle when we found that puri-
fying ACh receptors allowed us to prove that the weak-
ness characteristic of myasthenia gravis was caused by
autoantibodies to AChRs.
by Jon M. Lindstrom
The autoantibodies do not impair neuromuscular trans-
mission in the most obvious way. by acting as antagonists
of ACh. Instead. their primary effect is to decrease the
total number of AChRs by increasing the rate of receptor
destruction and by triggering degradation of the muscle
membrane. The pathological mechanisms that weakened
neuromuscular transmission in experimental autoimmune
myasthenia in rats and myasthenia gravis in humans were
discovered in collaboration with Yanda Lennon. Marjorie
Seybold. and Andy Engel. We developed an assay to quan-
tify antibodies against receptors in immunized animals and
measured the loss of ACh receptors from their muscles.
Using human muscle AChRs in the same assay provided a
diagnostic test for myasthenia gravis. Discovering the auto-
immune nature of myasthenia gravis has led to new im-
munosuppressive therapies and strategies for treating the
disease.
The autoimmune mechanism of myasthenia gravis has
parallels with other neurological diseases. Recently. inves-
tigators have found autoantibodies to other muscle and
nerve proteins that cause muscle weakness as well as
autoantibodies to the ACh receptors on neurons that im-
pair transmission in the ANS.
Recently. revolutionary methods for gene cloning. ex-
pression mutagenesis. single channel recording. and crys-
tallography have provided detailed insights into the struc-
ture of ACh receptors and how they function. Nonetheless.
the answers to basic questions remain elusive: What initi-
ates the autoimmune response in myasthenia gravis? How
can we specifically suppress this response?
My pursuit of AChRs has led from snake venom toxins.
to muscle-type ACh receptors in electric organs. to rev-
elations about myasthenia gravis, to investigations of
neuronal AChRs involved in addiction. to nicotine and
neurodegenerative dise ses. Nothing is more exciting
than "Eureka!" moments such as purifying a neurotrans-
mitter receptor for the first time or unexpectedly finding
the cause of a disease. Each revelation leads to more
questions. There can be a lot of work and frustration
between successes great and small. But. every now and
then, you are rewarded with the fleeting cosmic rush of
discovery.
... SPINAL CONTROL Of MOTOR UNITS 443
axons active. Notice that the activation of alpha and gamma motor neurons
has opposite effects on Ia output; alpha activation alone decreases Ia activity,
while gamma activation alone increases Ia activity.
RecaJl from our discussion above that the monosynaptic myotatic reflex
arc can be viewed as a feedback loop. The prindples of feedback control
systems are that a set point is determined (in this case, the desired muscle
length), deviations from the set point are detected by a sensor (the Ia axon
endings), and deviations are compensated for by an effector system (alpha
motor neurons and extrafusal muscle fibers), returning the system to the
set point. Changing the activity of the gamma motor neurons changes
the set point of the myotatic feedback loop. This circuit, gamma motor
neuron -+ intrafusal muscle fiber -+ Ia afferent axon-+ alpha motor
neuron -+ extrafusal muscle fibers, is sometimes called the gamma loop.
Alpha and gamma motor neurons are simultaneously activated by de-
scending commands from the brain. By regulating the set point of the my-
otatie feedback loop, the gamma loop provides additional control of alpha
motor neurons and muscle contraction.
Proprioception from Golgi Tendon Organs
Muscle spindles are not the only source of proprioceptive inputs from the
muscles. Another sensor in skeletal muscle is the Golgi tendon organ,
which acts like a strain gauge; that is, it monitors muscle tension, or the force
of contraction. Golgi tendon organs are located at the junction of the
muscle and the tendon and are innervated by group Ib sensory axons,
which are slightly smaller than the Ia axons innervating the muscle spin-
dles (Figure 13.20).
It is important to note that while spindles are situated in parallel with the
muscle fibers, Golgi tendon organs are situated in series (Figure 13.21). This
different anatomical arrangement is what distinguishes the types of in-
formation these two sensors provide the spinal cord: Ia activity from the
spindle encodes muscle length information, while Ib activity from the Golgi
tendon organ encodes muscle tension information.
The Ib axons enter the spinal cord, branch repeatedly, and synapse on
interneurons in the ventral horn. Some of these interneurons form inhibitory
Golgi tendon Ib axon Golgi tendon \ Ib axon
organ organ
la axon la axon
\"
I
Alpha motor
neuron axon
(inactive)
(a) (b)
FIGURE J 3.21
The organization of muscle proprioceptors. (a) Muscle spindles are arranged parallel
to the extrafusal fibers; Golgi tendon organs lie in series. between the muscle fibers and their
points of attachment. (b) Golgi tendon organs respond to increased tension on the muscle
and transmit this infonrnation to the spinal cord via group Ib sensory axons. Because the
activated muscle does not change length. the la axons remain silent in this example.
Muscle ----
Golgi tendon { ,
organ
Tendon -_
-----I
Bone__
FIGURE 13.20
A Golgi tendon organ.
Ib axon
Collagen
fibrils
444 C HAP T E R I 3 . SPINAL CONTROL OF MOVEMENT
. Bone
-...
Golgi tendon
) '\ organ
1\
Inhibitory
interneuron
)/
Ib axon
ij
f' tl
0>
\1
Alpha motor
neuron
FIGURE 13.22
Circuitry of the reverse myotatic reflex.
connections with the alpha mmor neurons innervating the same muscle.
This is the basis for another spinal reflex called the reverse myotatic reflex (Fig-
ure 13.22). In extreme circumstances, this ref1ex arc protects the muscle
from being overloaded. However, the normal function is to regulate muscle
tension within an optimal range. As muscle tension increases, the inhibition
of the alpha motor neuron slows muscle contraction; as muscle tension
falls, the inhibition of the alpha motor neuron is reduced, and muscle
contraction increases. This type of proprioceptive feedback is thought to be
particularly important for the proper execution of fine motor acts, such as
the manipulation of fragile objects with the hands, which require a steady,
but oot too powerful, grip.
Proprioception from the Joints. We have focused on the proprioceptors
that are involved in reflex control of the spinal mmor neurons. However,
besides muscle spindles and Golgi tendon organs, a variety of propriocep-
tive axons is present in the connective tissues of joints, especially within
the fibrous tissue surrounding the joints (joint capsules) and ligaments.
These mechanosensitive axons respond to changes in the angle, direction,
and velocity of movement in a joint. Most are rapidly adapting, meaning
that sensory information about a moving joint is plentiful, but nerves en-
coding the resting position of a joint are few. We are, nevertheless, quite
good at judging the position of a joint, even with our eyes closed. It seems
that information from joint receptors is combined with that from muscle
spindles and Golgi tendon organs, and probably from receptors in the
skin, to estimate joint angle. Removing one source of information can be
compensated for by the use of the other sources. When an arthritic hip is
replaced with a steel and plastic one, patients are still able to tell the angle
between their thigh and their pelvis, despite the fact that all their hip joint
mechanoreceptors are sitting in a jar of formaldehyde in another room.
Spinal Interneurons
The actions of Ib inputs from Golgi tendon organs on alpha motor neu-
rons are entirely polysynaptic-they are all mediated by intervening spinal
Inhibitory
interneuron
\
.
i'
\ """'" \'2- '.... /" Muscle
, spindle
\\,
,
, .
"'
Antagonist /
muscle
'\.
"' '
interneurons. Indeed, most of the input to the alpha motor neurons comes
from interneurons of the spinal cord. Spinal interneurons receive synaptic
input from primary sensory axons, descending axons from the brain, and
collaterals of lower motor neuron axons. The interneurons are themselves
networked together in a way that allows coordinated motor programs to be
generated in response to their many inputs.
Inhibitory Input. Interneurons playa critical role in the proper execu-
tion of even the simplest reflexes. Consider the myotatic reflex, for exam-
ple. Compensation for the lengthening of one set of muscles, such as the
flexors of the elbow, involves contraction of the flexors via the myotatic
reflex but also requires relaxation of the antagonist muscles, the exten-
sors. This process is called reciprocal inhibition, the contraction of one
set of muscles accompanied by the relaxation of the antagonist muscles.
The importance of this is obvious; imagine how hard it would be to lift
something if your own antagonist muscles were constantly opposing you.
In the case of the myotatic reflex, reciprocal inhibition occurs because
collaterals of the Ia axons synapse on inhibitory spinal interneurons that
contact the alpha motor neurons supplying the antagonist muscles (Fig-
ure 13.23).
Reciprocal inhibition is also used by descending pathways to overcome
the powerful myotatic reflex. Consider a situation in which the flexors of
the elbow are voluntarily commanded to contract. The resulting stretch of
the antagonist extensor muscles would activate their myotatic reflex arc,
which would strongly resist flexion of the joint. However, the descending
pathways that activate the alpha motor neurons controlling the flexors also
activate interneurons, which inhibit the alpha motor neurons that supply
the antagonist muscles.
Excitatory Input. Not all interneurons are inhibitory. An example of a
reflex mediated in part by excitatory interneurons is the flexor reflex (Figure
13.24). This is a complex reflex arc used to withdraw a limb from an aver-
sive stimulus (such as the withdrawal of your foot from the thumbtack in
Chapter 3). This reflex is far slower than the myotatic reflex, indicating that
a number of interneurons intervene between the sensory stimulus and the
coordinated motor act. The pain axons entering the spinal cord branch pro-
fusely and activate interneurons in several different spinal segments. These
cells eventually excite the alpha motor neurons that control all the flexor
muscles of the affected limb (and, needless to say, inhibitory interneurons
are also recruited to inhibit the alphas that control the extensors).
... SPINAL CONTROL OF MOTOR UNITS 445
FIGURE 13.23
Reciprocal inhibition of flexors and
extensors of the same joint.
446 C HAP T E R I 3 . SPINAL CONTROL OF MOVEMENT
FIGURE 13.24
Circuitry of the polysynaptic flexor reflex.
FIGURE 13.25
Circuitry of the crossed-extensor reflex.
Flexor
muscles
Excitatory
interneurons
,\
\\
\
-
Pain/"
axon
You're walking around barefoot, and you step on a tack. Thanks to the
flexor reflex, you reflexively yank your loot up. But where would that
leave the rest of your body if nothing else happened? Falling to the floor,
most likely. Luckily. an additional component of the reflex is recruited: the
activation of extensor muscles and the inhibition of flexors on the opposite
side. This is called the crossed-extensor reflex, and it is used to compensate for
the extra load imposed by limb withdrawal on the antigravity extensor
muscles of the opposite leg (Figure 13.25). Notice that this is another
, \
, ,
' J.l.\11
"-
.
.
,
.
,
/
->tN
FI J R
Extend
Extend
example of reciprocal inhibition, but in this case, activation of the flexors
on one side of the spinal cord is accompanied by inhibition oJ the flexors
on the opposite side.
The Generation of Spinal Motor Programs for Walking
The crossed-extensor reflex, in which one side extends as the other side
flexes, seems to provide a building block for locomotion. When you walk,
you alternately withdraw and extend your two legs. All that's lacking is a
mechanism to coordinate the timing. In principle, this could be a series of
descending commands from upper motor neurons. However, as we already
suspected from our consideration of headless chicken behavior, it seems
likely that this control is exerted from within the spinal cord. Indeed, a
complete transection of a cat's spinal cord at the mid-thoracic level leaves
the hind limbs capable of generating coordinated walking movements. The
circuit for the coordinated control of walking must reside, therefore, within
the spinal cord. In general, circuits that give rise to rhythmic motor activity
are ca1led central pattern generators.
How do neural circuits generate rhythmic patterns of activity? Different
circuits use different mechanisms. However, the simplest pattern generators
are individual neurons whose membrane properties endow them with
pacemaker properties. An interesting example comes from the work of Sten
Grillner and his co1leagues in Stockholm, Sweden. Based on the assump-
tion that the spinal central pattern generators for locomotion in different
species are variations on a plan that was established in a common ancestor,
Grillner focused on the mechanism for swimming in the lamprey, a jawless
fish that has evolved slowly over the course oJ the past 450 million years.
The lamprey spinal cord can be dissected and kept alive in vitro for several
days. Electrical stimulation oJ the stumps ofaxons descending from the brain
can generate alternating rhythmic activity in the spinal cord, mimicking
that which occurs during swimming. In an important series of experiments,
Grillner showed that the activation of NMDA receptors on spinal inter-
neurons was sufficient to generate this locomotor activity.
Reca1l from Chapter 6 that NMDA receptors are glutamate-gated ion
channels with two peculiar properties: (1) They allow more current to flow
into the ce1l when the postsynaptic membrane is depolarized, and (2) they
admit Ca H as well as Na+ into the cell. In addition to NMDA receptors,
spinal interneurons possess calcium-activated potassium channels. Now
imagine the cycle that is initiated when NMDA receptors are activated by
glutamate (Figure 13.26):
t. The membrane depolarizes.
2. Na+ and Ca 2 + flow into the cell through the NMDA receptors.
3. Ca2+ activates potassium channels.
4. K+ flows out of the cell.
5. The membrane hyperpolarizes.
6. Ca2+ stops flowing into the cell.
7. The potassium channels close.
8. The membrane depolarizes, and the cycle repeats.
It is easy to imagine how intrinsic pacemaker activity in spinal interneurons
might act as the primary rhythmic driving force for sets of motor neurons
that in turn command cyclic behaviors like walking. However, pacemaker
neurons are not solely responsible for generating rhythms in vertebrates.
SPINAL CONTROL OF MOTOR UNITS 447
448 C HAP T E R I 3 . SPINAL CONTROL OF MOVEMENT
(a)
Calcium-
activated
potassium
channel
NMDA
receptor
Apply glutamate
(b)
(d)
Glu
K+
m-
Lili u
Ca 2 +
Na+
..
___ 110 mV
2 sec
-
Ca 2 +
Na+
FIGURE 13.26
Rhythmic activity in a spinal interneuron. Some neurons respond to the activation of
I\JMDA receptors with rhythmic depolanzation. (a) In the resting state, the NMDA receptor
channels and the calCium-activated potassium channels are closed. (b) Glutamate causes the
NMDA receptors to open, the cell membrane to depolarize, and Ca 2 + to enter the cell.
(c) The nse in intracellular [Ca2+] causes the Ca 2 + -activated potassium channels to open.
Potassium Ions leave the neuron, hyperpolarizing the membrane. The hyperpolanzation allows
Mg2+ to enter and clog the NMOA channel, arresting the flow of Ca2+ (d) As [Ca2+] falls,
the potassium channels close, resetting the membrane for another oscillation.
(Source: Adapted from Wallen and Grillner, 1987.)
They are embedded within interconnected circuits, and it is the combina-
tion of intrinsic pacemaker properties and synaptic interconnections that
produces rhythm.
An example of a possible pattern-generating circuit for walking is shown
in Figure 13.27. According to this scheme, walking is initiated when a
steady input excites two interneurons that connect to the motor neurons
controlling the flexors and extensors, respectively. The inter neurons respond
Excitatory
interneuron
.
Excitatory
interneuron
FIGURE 13.27
A possible circuit for rhythmic alternating activity.
Flexor
motor neuron
J
Action potentials
..
Extensor
motor neuron
to a continuous input by generating bursts of outputs. The activity of the
two interneurons alternates because they inhibit each other via another
set of interneurons, which are inhibitory. Thus, a burst of activity in one
interneuron strongly inhibits the other, and vice versa. Then, using the
spinal cord drcuitry of the crossed-extensor reflex, the movements of the
opposite limb could be coordinated so that flexion on one side is accom-
panied by extension on the other. The addition of more interneuronal con-
nections between the lumbar and cervical spinal segments could account
for the swinging of the arms that accompanies walking.
Work on many vertebrate species, from lampreys to humans, has shown
that locomotor activity in the spinal cord and its coordination depend on
multiple mechanisms. Such complexity is not surprising when we consider
the demands on the system-for example, the adjustments necessary when
one foot strikes an obstacle while walking, or the changes in output that
are necessary to go from walking, to jogging, to running,_ to jumping.
... CONCLUDING REMARKS
We can draw several conclusions from the preceding discussion of the
spinal control of movement. First, a great deal has been learned about
movement and its spinal control by working at different levels of analysis,
ranging from biochemistry and biophysics to behavior. Indeed, a complete
understanding, whether of excitation-contraction coupling or central pattern
generation, requires knowledge derived from every approach. Second, sen-
sation and movement are inextricably linked even at the lowest levels of
the neural motor system. The normal function of the alpha motor neuron
depends on direct feedback from the muscles themselves and indirect infor-
mation from the tendons. joints, and skin. Third, the spinal cord contains
an intricate network of circuits for the control of movement; it is far more
than a conduit for somatic sensory and motor information.
Evidently, coordinated and complex patterns of activity in these spinal
circuits can be driven by relatively crude descending signals. This leaves the
question of precisely what the upper motor neurons contribute to motor
control-the subject of the next chapter.
..
The Somatic Motor System
smooth muscle (p.424)
striated muscle (p.424)
cardiac muscle (p.424)
skeletal muscle (p. 424)
muscle fiber (p. 424)
somatic motor system (p.424)
flexion (p. 425)
extension (p. 425)
flexor muscle (p.426)
synergist muscle (p.426)
extensor muscle (p. 426)
antagonist muscle (p. 426)
axial muscle (p.426)
proximal (girdle) muscle
(p.426)
distal muscle (p.426)
The Lower Motor Neuron
alpha motor neuron (p.428)
motor unit (p. 428)
motor neuron pool (p. 428)
fast motor unit (p. 430)
slow motor unit (p. 430)
>-V>
wI:
w
I-
Excitation-Contraction
Coupling
excitation-contraction coupling
(p. 432)
sarcolemma (p. 433)
myofibril (p. 433)
sarcoplasmic reticulum (p. 433)
T tubule (p.433)
Z line (p. 434)
sarcomere (p. 434)
... CONCLUDING REMARKS 449
thin filament (p. 434)
thick filament (p. 434)
myosin (p. 434)
actin (p. 434)
troponin (p. 435)
Spinal Control of Motor Units
muscle spindle (p. 438)
proprioceptor (p. 438)
proprioception (p. 438)
myotatic reflex (p. 439)
intrafusal fiber (p. 440)
extrafusal fiber (p. 440)
gamma motor neuron (p. 440)
Golgi tendon organ (p. 443)
reciprocal inhibition (p. 445)
central pattern generator (p.447)
450 C HAP T E R I 3 . SPINAL CONTROL OF MOVEMENT
,1tJ
V>
Z
w
0
>
W .....
0:: V>
w
:J
a
I. What did Sherrington call the "final common pathway," and why?
2. Define, in one sentence, motor unit. How does it differ from motor neuron pool?
3. Which is recruited first, a fast motor unit or a slow motor unit? Why?
4. When and why does rigor mortis occur?
5. Your doctor taps the tendon beneath your kneecap and your leg extends. What is the neural basis of this
reflex? What is it called?
6. What is the function of gamma motor neurons?
7. Lenny, a character in Steinbeck's classic book Of Mice and Men, loved rabbits, but when he hugged them, they
were crushed to death. Which type of proprioceptive input might Lenny have been lacking?
60.
o::
Wz
I-
.....0
0::«
:Jw
LLO::
Bruijn LI, Miller TM, Cleveland DW 2004. Unraveling
the mechanisms involved in motor neuron degen-
eration in ALS. Annual Review of Neuroscience
27:723-749.
Dalkilic I, Kunkel LM. 2003. Muscular dystrophies:
genes to pathogenesis. Current Opinion in Genetics
and Development 13:231-238.
Nicolle MW 2002. Myasthenia gravis. The Neurologist
8:2-21.
Poppele R, Bosco G. 2003. Sophisticated spinal con-
tributions to motor control. Trends in Neuro-
sciences 26:269-276.
Schouenborg 1, Kiehn 0, eds. 200 I. The Segerialk
symposium on principles of spinal cord function,
plasticity and repair: Brain Research Reviews
40:1-329.
Stein PSG, et aI., eds. 1999. Neurons, Networks, and
Motor Behavior. Cambridge, MA: MIT Press.
CHAPTER
Brain Control
of Movement
INTRODUCTION
DESCENDING SPINAL TRACTS
THE LATERAL PATHWAYS
The Effects of Lateral Pathway Lesions
. Box 14.1 Of Special Il1terest: Paresis, Paralysis, Spasticity, and Babinski
THE VENTROMEDIAL PATHWAYS
The Vestibulospinal Tracts
The T ectospinalTract
The Pontine and Medullary Reticu/ospinal Tracts
THE PLANNING OF MOVEMENT BY THE CEREBRAL CORTEX
MOTOR CORTEX
THE CONTRIBUTIONS OF POSTERIOR PARIETAL AND PREFRONTAL CORTEX
NEURONAL CORRELATES OF MOTOR PLANNING
. Box 14.2 Of Special Interest: Behavioral Neurophysiology
THE BASAL GANGLIA
ANATOMY OF THE BASAL GANGLIA
THE MOTOR LOOP
Basal Ganglia Disorders
. Box 14.3 Of Special Interest: Do Neurons in Diseased Basal Ganglia Commit Suicide?
THE INITIATION OF MOVEMENT BY PRIMARY MOTOR CORTEX
THE INPUT-OUTPUT ORGANIZATION OF M I
THE CODING OF MOVEMENT IN M I
The Malleable Motor Mop
. Box 14.4 Path of Discovery: Neurotechnology: Merging Mind and Machines, by John P. Donoghue
THE CEREBELLUM
. Box 14.5 Of Special Il1terest: Involuntary Movements, Normal and Abnormal
ANATOMY OF THE CEREBELLUM
THE MOTOR LOOP THROUGH THE LATERAL CEREBELLUM
Programming the Cerebellum
CONCLUDING REMARKS
452 C HAP T E R I 4 . BRAIN CONTROL OF MOVEMENT
11\ I \ \\I ,
'-11 ,;..,
\. ,#
....
\
..
FIGURE 14.\
The contributions of the motor control
hierarchy. As a baseball pitcher plans to
pitch a ball to a batter. decides what pitch to
throw, and then throws the ball, he engages
the three hierarchical levels of motor control.
... INTRODUCTION
In Chapter 13, we discussed the organization of the peripheral somatic
motor system: the joints, skeletal muscles, and their sensory and motor
innervation. We saw that the final common pathway for behavior is the
alpha motor neuron, that the activity of this cell is under the control of sen-
sory feedback and spinal interneurons, and that reflex movements reveal
the complexity of this spinal control system. In this chapter, we explore
how the brain influences the activity of the spinal cord to command vol-
untary movements.
The central motor system is arranged as a hierarchy of control levels,
with the forebrain at the top and the spinal cord at the bottom. It is useful
to think of this motor control hierarchy as having three levels (Table 14.1).
The highest level, represented by the association areas of neocortex and
basal ganglia of the forebrain, is concerned with strategy: the goal of the
movement and the movement strategy that best achieves the goal. The
middle level, represented by the motor cortex and cerebellum, is concerned
with tactics: the sequences of muscle contractions, arranged in space and
time, required to smoothly and accurately achieve the strategic goal. The
lowest level, represented by the brain stem and spinal cord, is concerned
with execution: activation of the motor neuron and interneuron pools that
generate the goal-directed movement and make any necessary adjustments
of posture.
To appreciate the different contributions of the three hierarchical levels
to movement, consider the actions of a basebaH pitcher preparing to pitch
to a batter (Figure 14.1). The cerebral neocOrtex has information-based on
vision, audition, somatic sensation, and proprioception-about precisely
where the body is in space. Strategies must be devised to move the body
from the current state to one in which a pitch is delivered and the desired
outcome is attained (a swing and a miss by the batter). Several options are
available to the pitcher-a curve ball, a fast ball, a knuckle ball, and so on-
and these alternatives are filtered through the basal ganglia and back to the
cortex until a final decision is made, based in large part on past experience
(e.g., "This batter hit a home run the last time I threw a fast baW). The mo-
tor areas of cortex and the cerebellum then make the tactical decision (to
throw the curve ball) and issue instructions to the brain stem and spinal
cord. Activation of neurons in the brain stem and spinal cord then causes
the movement to be executed. The properly timed activation of motor
neurons in the cervical spinal cord generates a coordinated movement of
the shoulder, elbow, wrist, and fingers. Simultaneously, brain stem inputs
to the thoracic and lumbar spinal cord command the appropriate postural
adjustments that keep the pitcher from falling over during the throw. In
addition, brain stem motor neurons are activated to keep the pitcher's eyes
fixed on the catcher, his target, as his head and body move about.
According to the laws of physics, the movement of a thrown baseball
through space is ballistic. referring to a trajectory that cannot be altered. The
movement of the pitcher's arm that throws the ball is also described as
Table 14.1 The Motor Control Hierarchy
LEVEl
STRUCTURES
FUNCTION
High
Middle
Low
Strategy
Tactics
Execution
Association areas of neocortex, basal ganglia
Motor cortex, cerebellum
Brain stem, spinal cord
ballistic because it cannot be altered once initiated. This type of rapid vol-
untary movement is not under the same type of sensory feedback control
that regulates antigravity postural reflexes (see Chapter 13). The reason is
simple: The movement is toO fast to be altered by sensory feedback. But the
movement does not occur in the absence of sensory information. Sensory
information before the movement was initiated was crucial to determine the
starting positions of the limbs and body and to anticipate any changes in
resistance during the throw. And sensory information during the movement
is also important-not necessarily for the movement at hand, but for im-
proving subsequent similar movements.
The proper functioning of each level of the motor control hierarchy relies
so heavily on sensory information that the motor system of the brain might
properly be considered a sensorimotor system. At the highest level, sensory
information generates a mental image of the body and its relationship to
the environment. At the middle level, tactical decisions are based on the
memory of sensory information from past movements. At the lowest level,
sensory feedback is used to maintain posture, muscle length, and tension
before and after each voluntary movement.
In this chapter, we investigate this hierarchy of motor control and how
each level contributes to the control of the peripheral somatic motor sys-
tem. We start by exploring the pathways that bring information to the
spinal motor neurons. From there, we ascend to the highest levels of the
motor hierarchy, and then we fill in the pieces of the puzzle that bring the
different levels together. Along the way, we describe how pathology in spe-
cific parts of the motor system leads to particular movement disorders.
T DESCENDING SPINAL TRACTS
How does the brain communicate with the motor neurons of the spinal
cord? Axons from the brain descend through the spinal cord along twO ma-
jor groups of pathways, shown in Figure 14.2. One is in the lateral column
of the spinal cord, and the other is in the ventromedial column. Remem-
ber this general rule: The lateral pathways are involved in voluntary
movement of the distal musculature and are under direct cortical control,
and the ventromedial pathways are involved in the control of posture
and locomotion and are under brain stem controL
/ cortiCOSPina' j
/ tract Lateral
pathways
Rubrospinal
tract
(
/
------
Tectospinal
tract
'"
Pontine
reticulospinal
tract
Vestibulospinal
tract
Ventromedial
pathways
. DESCENDING SPINAL TRACTS 453
FIGURE 14.2
The descending tracts of the spinal
cord. The lateral pathways. consisting of the
corticospinal and rubrospinal tracts, control
voluntary movements of the distal muscula-
ture. The ventromedial pathways, consisting
of the reticulosplnal. vestibulospinal, and
tectospinal tracts, control postural muscles.
454 C HAP T E R I 4 . BRAIN CONTROL OF MOVEMENT
The Lateral Pathways
The most important component of the lateral pathways is the corticospinal
tract (Figure 14.3a). Originating in the neocortex, it is the longest and one
of the largest central nervous system (CNS) tracts (10 6 axons). Two-thirds
of the axons in the tract originate in areas 4 and 6 of the frontal lobe, col-
lectively called motor cortex. Most of the remaining axons in the corti-
cospinal tract derive from the somatosensory areas of the parietal lobe and
serve to regulate the flow of somatosensory information to the brain (see
Chapter 12). Axons from the cortex pass through the internal capsule bridg-
ing the telencephalon and thalamus, course through the base of the cerebral
peduncle, a large collection ofaxons in the midbrain, then pass through the
pons, and collect to form a tract at the base of the medulla. The tract forms
a bulge, called the medullary pyramid, running down the ventral surface of
the medulla. When cut, the corticospinal tract's cross section is roughly tri-
angular, explaining why it is also called the pyramidal tract.
At the junction of the medulla and spinal cord, the pyramidal tract
crosses, or decussates, at the pyramidal decussation. This means that the
right motor cortex directly commands the movement of the left side of the
body, and the left motor cortex controls the muscles on the right side. As
the axons cross, they collect in the lateral column of the spinal cord and
form the lateral corticospinal tract. The corticospinal tract axons terminate
in the dorsolateral region of the ventral horns and intermediate gray matter,
the location of the motor neurons and interneurons that control the distal
muscles, particularly the flexors (see Chapter 13).
A much smaller component of the lateral pathways is the rubrospinal
tract, which originates in the red nucleus of the midbrain, named for its
distinctive pinkish hue in a freshly dissected brain (rubro is from the Latin
for "red"). Axons from the red nucleus decussate in the pons, almost imme-
diately, and join those in the corticospinal tract in the lateral column of the
spinal cord (Figure 14.3b). A major source of input to the red nucleus is
the very region of frontal cortex that also contributes to the corticospinal
tract. Indeed, it appears that over the course of primate evolution, this
indirect corticorubrospinal pathway has largely. been replaced by the direct
corticospinal path. Thus, while the rubrospinal tract contributes impor-
tantly to motor control in many mammalian species, in humans it appears
to be reduced, most of its functions subsumed by the corticospinal tract.
The Effects of Lateral Pathway Lesions. The foundation for the modern
view of the function of the lateral pathways was laid in the late 1960s by
Donald Lawrence and Hans Kuypers. Experimental lesions in both corti-
cospinal and rubrospinal tracts in monkeys rendered them unable to make
fractionated movements of the arms and hands; that is, they could not
move their shoulders, elbows, wrists, and fingers independently. For exam-
ple, they could grasp small objects with their hands, but only by using all
the fingers at once. Voluntary movements were also slower and less accurate.
Despite this, the animals could sit upright and stand with normal posture.
By analogy, a human with a lateral pathway lesion would be able to stand
on the pitcher's mound but be unable to throw the ball accurately.
Lesions in the corticospinal tracts alone caused a movement deficit as
severe as that observed after lesions in the lateral columns. Interestingly,
however, many functions gradually reappeared over the months following
surgery. In fact, the only permanent deficit was some weakness of the dis-
tal flexors and an inability to move the fingers independently. A subsequent
lesion in the rubrospinal tract completely reversed this recovery, however.
These results suggest that the corticorubrospinaJ pathway was able, over
time, to partially compensate for the loss of the corticospinal tract input.
.. DESCENDING SPINAL TRACTS 455
Motor
cortex
"
)1
/v\
L
o
\
.1/. _
,. ,
\
,
, ,,,-
CD
@
Thalamus
Internal
capsule
'-'
'-'
I
- Midbrain-
Base of /'
cerebral @
peduncle
:
,
" Right
red
nucleus
I
I
Medullary ------- '
pyramid
"'
.
" "
.
- Medulla
-
.
.
I;'yramidal
decussation
/ c
Corticospinal
tract
Spinal _ _ .
cord /
Rubrospinal ",-- ),
tract
(a)
(b)
FIGURE 14.3
The lateral pathways. Origins and termi-
nations of (a) the corticospinal tract and
(b) the rubrospinal tract. These tracts control
fine movements of the arms and fingers.
Strokes that damage the motor cortex or the corticospinal rract are
common in humans. Their immediate consequence can be paralysis on the
contralateral side, but considerable recovery of voluntary movements may
occur over time (Box 14.1). As in Lawrence and Kuypers' lesioned monkeys,
it is the fine, fractionated movements of the fingers that are least likely to
recover.
The Ventromedial Pathways
The ventromedial pathways contain four descending tracts that originate in
the brain stem and terminate among the spinal intemeurons controHing
proximal and axial muscles. These tracts are the vestibulospinal tract, the
456 C HAP T E R I 4 . BRAIN CONTROL OF MOVEMENT
Box 14.1
,,'.
OF SPECIAL INTEREST
... I ...
.
Paresis, Paralysis, Spasticity,
and Babinsl i
The neural components of the motor system extend from
the highest reaches of the cerebral cortex to the farthest
terminals of the motor axons in muscles. Its sheer size
makes the motor system uncommonly vulnerable to dis-
ease and trauma. The site of motor system damage has a
big effect on the types of deficits a patient experiences.
Damage to the lower parts of the motor system-
alpha motor neurons or their motor axons-Ieads to
easily predicted consequences. Partial damage may cause
paresis (weakness). Complete severing of a motor nerve
leads to paralysis (loss of movement) of the affected mus-
cles and areflexia, an absence of their spinal reflexes. The
muscles also have no tone, or resting tension; they are
flaccid and soft. Damaged motor neurons can no longer
exert their trophic influence on muscle fibers (see Chap-
ter i 3).The muscles profoundly atrophy (decrease in size)
with time, losing up to 70-80% of their mass.
Damage to the upper parts of the motor system-the
motor cortex and the various motor tracts that descend
into the spinal cord-can cause a distinctly different set
of motor problems. These are common after a stroke,
which damages regions of the cortex or brain stem by de-
priving them of their blood supply; traumatic injury, such
as a knife or gunshot wound; or even a demyelinating dis-
ease (see Box 4.5).
Immediately following severe upper motor system
damage. there is a period of spinal shock: reduced muscle
tone (hypotonia), areflexia, and paralysis, known as hemi-
plegio if it occurs on one side of the body, paraplegia if it
involves only the legs, and quadriplegia if it involves all
four limbs. With the loss of descending brain influences,
the functions of the spinal cord appear to shut down.
Over the next several days, some of its reflexive functions
mysteriously reappear. This is not necessarily a good
thing. A condition called spasticity sets in. often perma-
nently. Spasticity is characterized by a dramatic and some-
times painful increase of muscle tone (hypertonia) and
spinal reflexes (hyperreflexia), compared to normal. Over-
active stretch reflexes often cause clonus, rhythmic cycles
of contraction and relaxation when limb muscles are
stretched.
Another indication of motor tract damage is the Babinski
sign, described by the French neurologist Joseph Babinski
in 1896. Sharply scratching the sole of the foot from the
heel toward the toes causes reflexive upward flexion of
the big toe and an outward fanning of the other toes. The
normal response to this stimulus. for anyone older than
about 2 years, is to curl the toes downward. Normal in-
fants also exhibit the Babinski sign, presumably because
their descending motor tracts have not yet matured.
By systematically testing a patient's reflexes, muscle tone.
and motor ability across his body, a skilled neurologist
can often deduce the site and severity of motor system
damage with astonishing precision.
tectospinal tract, the pontine reticulospinal tract, and the medullary retic-
ulospinal tract. The ventromedial pathways use sensory information about
balance. body position. and the visual environment to reflexively maintain
balance and body posture.
The Vestibulospinal Tracts. The vestibulospinal and tectospinal tracts
function to keep the head balanced on the shoulders as the body moves
through space and to turn the head in response to new sensory stimuli. The
vestibulospinal tracts originate in the vestibular nuclei of the medulla.
which relay sensory information from the vestibular labyrinth in the inner
ear (Figure 14.4a). The vestibular labyrinth consists of fluid-filled canals and
cavities in the temporal bone that are closely associated with the cochlea
(see Chapter 11). The motion of the fluid in this labyrinth. which accom-
panies movement of the head. activates hair cells that signal the vestibular
nuclei via cranial nerve VIII.
One component of the vestibulospinal tracts projects bilaterally down the
spinal cord and activates the cervical spinal circuits that control neck and back
muscles. and thus guide head movement. Stability of the head is important
)\' '
'. ;;-3 T'
"\
Superior
colliculus
" ,
'jY(j)
"'CD
@
Vestibular
nucleus
""
"'
"
Vestibulospinal
tract
I '
-Medulla- :
.. -
/- ' Tectospinal
tract
: '
, '
, '
, '
. :
,
- Spinal --
cord
, .)
"--""; 0
CD
(a)
(b)
because the head contains our eyes, and keeping the eyes stable, even as our
body moves, ensures that our image of the world remains stable. Another
component of the vestibulospinal tracts projects ipsilaterally as far down as
the lumbar spinal cord. It helps us maintain an upright and balanced pos-
ture by facilitating extensor motor neurons of the legs.
The Tectospinal Tract. The tectospinal tract originates in the superior
colliculus of the midbrain, which receives direct input from the retina
(Figure 14.4b). (Recall from Chapter 10 that optic tectum is another name
for the superior colliculus.) Besides its retinal input, the superior colliculus
receives projections from visual cortex, as well as afferent axons carrying
somatosensory and auditory information. From this input, the superior col-
liculus constructs a map of the world around us; stimulation at one site in
this map leads to an orienting response that directs the head and eyes to
move so that the appropriate point of space is imaged on the fovea. Acti-
vation of the colliculus by the image of a runner sprinting toward second base,
for example, would cause the pitcher to orient his head and eyes toward
this important new stimulus.
The Pontine and Medullary Reticulospinal Tracts. The reticulospinal
tracts arise mainly from the reticular formation of the brain stem, which
runs the length of the brain stem at its core, just under the cerebral aque-
duct and fourth ventricle. A complex meshwork of neurons and fibers, the
reticular formation receives input from many sources and participates in
many different functions. For the purposes of our discussion of motor
'f' DESCENDING SPINAL TRACTS 457
FIGURE 14.4
The ventromedial pathways. Origins and
terminations of (a) the vestibulospinal tract
and (b) the tectospinal tract. These tracts
control the posture of the head and neck.
458 C HAP T E R I 4 . BRAIN CONTROL OF MOVEMENT
') I :
.>(
y @
@
CD
------ :;::;, -....
. '= , . '\
Id//'--: / 0 " \
Cerebellum - { '/ ;/ ( \ \
'//Itf/ ",\ , J) (!,I
l ;0ir )
Pons \ Pontine reticular
formation
l:s
Medulla
Medullary reticular
formation
. ' )
\ ;zi/
SPinal/CD ,
cord
Reticulospinal
tracts
FIGURE 14.5
The pontine (medial) and medullary (lateral) reticulospinal tracts. These compo-
nents of the ventromedial pathway control posture of the trunk and the antigravity muscles
of the limbs.
control, the reticular formation may be divided into two parts that give rise
to two different descending tracts: the pontine (medial) reticulospinal tract
and the medullary (lateral) reticulospinal tract (Figure 14.5).
The pontine reticulospinal tract enhances the antigravity reflexes of
the spinal cord. Activity in this pathway, by facilitating the extensors of the
lower limbs, helps maintain a standing posture by resisting the effects of
gravity. This type of regulation is an important component of motor con-
trol: Keep in mind that most of the time, the activity of ventral horn neu-
rons maintains, rather than changes, muscle length and tension. The
medullary reticulospinal tract, however, has the opposite effect; it lib-
erates the antigravity muscles from reflex control. Activity in both reticu-
lospinal tracts is controlled by descending signals from the cortex. A fine
balance between them is required as the pitcher goes from standing on the
mound to winding up and throwing the ball.
Figure 14.6 provides a simple summary of the major descending spinal
tracts. The ventromedial pathways originate from several regions of the
brain stem and participate mainly in the maintenance of posture and cer-
tain reflex movements. Initiation of a voluntary, ballistic movement, such
as throwing a baseball. requires instructions that descend from the motor
cortex along the lateral pathways. Motor cortex directly activates spinal
motor neurons and also liberates them from reflex comrol by communi-
cating with the nuclei of the ventromedial pathways. It is clear that the cor-
tex is critical for voluntary movement and behavior, so we now focus our
attention there.
'Y THE PLANNING OF MOVEMENT BYTHE CEREBRAL CORTEX 459
Motor
cortex
,--------I'----
Cortex
Cortico-
spinal
tract
Red
nucleus
Reticular Superior colliculus
nuclei and vestibular nuclei
lateral
pathways
o
I
Zl
Ventromedial
pathways
\
Spinal cord
.... THE PLANNING OF MOVEMENT
BY THE CEREBRAL CORTEX
Ahhough cortical areas 4 and 6 are called motor cortex, it is important to
recognize that the control of voluntary movement engages almost all of the
neocortex. Goal-directed movement depends on knowledge of where the
body is in space and where it intends to go and on the selection of a plan
to get it there. Once a plan has been selected, it must be held in memory
until the appropriate time. Finally, instructions must be issued to imple-
ment the plan. To some extent, these different aspects of motor control are
localized to different regions of the cerebral cortex. In this section, we
explore some of the cortical areas implicated in motor planning. Later, we
look at how a plan is converted into action.
Motor Cortex
The motor cortex is a circumscribed region of the frontal lobe. Area 4 lies
just anterior to the central sulcus on the precentral gyrus, and area 6 lies
just anterior to area 4 (Figure 14.7). The definitive demonstration that
these areas constitute motor cortex in humans came from the work of
Canadian neurosurgeon Wilder Penfield. Recall from Chapter 12 that Pen-
field electrically stimulated the cortex in patients who were undergoing
surgery to remove bits of brain thought to be inducing epileptic seizures.
The stimulation was used in an attempt to identify which regions of cortex
were so critical that they should be spared from the knife. In the course of
these operations, Penfield discovered that weak electrical stimulation of
area 4 in the precentral gyrus would elicit a twitch of the muscles in a par-
ticular region of the body on the contralateral side. Systematic probing of
this region established that there is a somatotopic organization in the human
precentral gyrus much like that seen in the somatosensory areas of the
FIGURE i 4.6
A summary of the major descending
spinal tracts and their origins.
462 C HAP T E R I 4 . BRAIN CONTROL OF MOVEMENT
that intention into a plan of action. Interestingly, when the subjects were
asked only to mentally rehearse the movement without actually moving
the finger. area 6 remained active, but area 4 did not.
Neuronal Correlates of Motor Planning
Recent experimental work on monkeys further supports the idea that area
6 (SMA and PMA) plays an important role in the planning of movement,
particularly complex movement sequences of the distal musculature. Using
a method developed in the late 1960s by Edward Evarts at the National
Institutes of Health, researchers have recorded the activity of neurons in
the motor areas of awake, behaving animals (Box 14.2). Cells in the SMA
typically increase their discharge rates about a second before the execution
of a hand or wrist movement, consistent with their proposed role in plan-
ning movement (recall Roland's findings in humans). An important feature
of this activity is that it occurs in advance of the movements of either hand,
suggesting that the supplementary areas of the two hemispheres are closely
linked via the corpus callosum. Indeed, movement deficits observed fol-
lowing an SMA lesion on one side, in both monkeys and humans, are par-
ticularly pronounced for tasks requiring the coordinated actions of the two
Box 14.2
.... , .
OF SPECIAL INTEREST
..
. f.__ Behavioral Neurophysiology
Showing that a brain lesion impairs movement and that
brain stimulation elicits movement does not tell us how
the brain controls movement. To address this problem, we
need to know how the activity of neurons relates to dif-
ferent types of voluntary movement in the intact organism.
PET scans and fMRI are extremely valuable in plotting out
the distribution of activity in the brain as behaviors are
performed, but they lack the resolution to track the
millisecond-by-millisecond changes in the activity of indi-
vidual neurons. The best method for this purpose is ex-
tracellular recording with metal microelectrodes (see
Box 4.1). But how is this done in awake, behaving animals?
This problem was solved by Edward Evarts and his
colleagues at the National Institutes of Health. Monkeys
were trained to perform simple tasks; when the tasks
were performed successfully, the monkeys were rewarded
with a sip of fruit juice. For example, to study the brain's
guidance of hand and arm movements, the monkey might
be trained to move its hand toward the brightest of sev-
eral spots on a computer screen. Pointing to the correct
spot earned it a juice reward. After training, the animals
were anesthetized. In a simple surgica procedure, each
monkey was fitted with a small headpiece so that a micro-
electrode could be introduced into the brain through a
small opening in the skull. When the animals recovered
from surgery. they showed no signs of discomfort from
either the headpiece or the insertion of a microelectrode
into the brain (recall from Chapter 12 that there are no
nociceptors in the brain). Evarts and his colleagues then
recorded the discharges of individual cells in the motor
cortex as the animals made voluntary movements. In the
examp!e above, one could then see how the neuron's re-
sponse changes when the animal points to different spots
on the screen.
This is an example of what is now called behavioral
neurophysiology, the recording of cellular activity in the
brain of awake, behaving animals. By altering the task that
the animal performs, the same method can be applied to
the investigation of a wide range of neuroscientific topics,
including attention, perception, learning, and movement.
Some types of human neurosurgery are also done with
the patient awake, at least during part of the procedure.
By applying the techniques of behavioral neurophysiol-
ogy to informed, consenting adults, we have also learned
some fascinating information about uniquely human
skills.
In recent years, technical developments have made it
possible to insert large numbers of microelectrodes into
the same or different parts of an animal's brain, and to
record from dozens or even hundreds of neurons simul-
taneously. This approach yields a massive amount of infor-
mation about brain activity and its relationship to behav-
ior. Understanding this relationship is one of the greatest
challenges in neuroscience.
... THE PLANNING OF MOVEMENT BYTHE CEREBRAL CORTEX 463
Action potential activity
of PMA neuron
-
++-H-
(a)
Instruction
stimulus
1.
o
t
Instruction
stimulus
on
(b)
Trigger
stimulus
>111}
/"...
t
Trigger
stimulus
on
(c)
hands, such as buttoning a shirt. In humans, a selective inabiJity to perform
complex (but not simple) motor acts is called apraxia.
You've heard the expression "Ready, set, go." The preceding discussion
suggests that readiness ("Ready") depends on activity in the parietal and
frontal lobes, along with important contributions from the brain centers
that control levels of attention and alertness. "Set" may reside in the sup-
plementary and premotor areas, where movement strategies are devised
and held until they are executed. A good ex;ample is shown in Figure 14.9,
based on the work of Michael Weinrich and Steven Wise at the National
Institutes of Health. They monitored the discharge of a neuron in the PMA
as a monkey performed a task requiring a specific arm movement to a
target. The monkey was first given an instruction stimulus informing him
what the target would be ("Get set, monkey!"), followed after a variable
delay by a trigger stimulus informing the monkey that it was OK to move
("Go, monkey!"). Successful performance of the task (i.e., waiting for the
"Go" signal and then making the movement to the appropriate target) was
FIGURE 14.9
The discharge of a cell in the premotor
area before a movement. (a) Ready: A
monkey sits before a panel of lights. The task
is to wait for an instruction stimulus that will
inform him of the movement required to
receive a juice reward, then perform the
movement when a trigger stimulus goes on.
The activity of a neuron in PMA is recorded
during the task. (b) Set: The instruction
stimulus occurs at the time indicated by the
upward arrow, resulting in the discharge of
the neuron in PMA. (c) Go: Shortly after the
movement IS initiated, the PMA cell ceases
firing. (Source: Adapted from Weinrich and
Wise, 1982.)
464 C HAP T E R I 4 . BRAIN CONTROL OF MOVEMENT
rewarded with a sip of juice. The neuron in the PMA began firing if the
instruction was to move the arm to the left, and it continued to discharge
until the trigger stimulus came on and the movement was initiated. If the
instruction was to move to the right, this neuron did not fire (presumably
another population of PMA cells became active under this condition). Thus,
the activity of this PMA neuron reponed the direction of the upcoming
movement and continued to do so until the movement was made. Although
we do not yet understand the details of the coding taking place in the SMA
and PMA the fact that neurons in these areas are selectively active well
before movements are initiated is consistent with a role in planning the
movement.
Now, let's consider our baseball pitcher standing on the mound. He has
made the decision to throw a curve ball, but the batter walks away from
the plate to clean his cleats. The pitcher stands motionless on the mound,
muscles tensed, waiting for the batter to return. The pitcher is "set"; a
select population of neurons in the premotor and supplementary motor
cortex (the cells that are planning the curve ball movement sequence) are
firing away in anticipation of the throw. Then the batter steps up to the
plate, and an internally generated "Go" command is given. This command
appears to be implemented with the participation of a major subcortical
input to area 6, which is the subject of the next section. After that, we ex-
amine the origin of the "Go" command, the primary motor cortex.
THE BASAL GANGLIA
The major subcortical input to area 6 arises in a nucleus of the dorsal thala-
mus, called the ventral lateral (VL) nucleus. The input to this part of VL,
called VLo, arises from the basal ganglia buried deep within the telen-
cephalon. The basal ganglia, in turn, are targets of the cerebral cortex, par-
ticularly the frontal. prefrontal, and parietal cortex. Thus, we have a loop
where information cycles from the cortex through the basal ganglia and
thalamus and then back to the cortex, particularly the supplementary
motor area (Figure 14.10). One of the functions of this loop appears to be
the selection and initiation of willed movements.
Anatomy of the Basal Ganglia
The basal ganglia consist of the caudate nucleus, the putamen, the
globus pallidus, and the subthalamic nucleus. In addition, we can add
the substantia nigra, a midbrain structure that is reciprocally connected
with the basal ganglia of the forebrain (Figure 14.11). The caudate and
putamen together are called the striatum, which is the target of the cor-
tical input to the basal ganglia. The globus pallidus is the source of the out-
put to the thalamus. The other structures participate in various side loops
that modulate the direct path:
Cortex ---;0 Striatum ---;0 Globus pallidus ---;0 VLo ---;0 Cortex (SMA).
Through the microscope, the neurons of the striatum appear randomly
scattered, with no apparent order such as that seen in the layers of the cor-
tex. But this bland appearance hides a degree of complexity in the organi-
zation of the basal ganglia that we are only now beginning to appreciate.
It appears that the basal ganglia participate in a large num'>er of parallel
circuits, only a few of which are strictly motor. Other circuits are involved
in certain aspects of memory and cognitive function. In the following text,
we try to give a concise account of the motor function of the basal ganglia,
simplifying what is a very complex and poorly understood pan of the brain.
'" THE BASAL GANGLIA 465
Prefrontal
cortex
A
Motor
cortex
, ,-_J.- v
Area Area
6 4
Sensory
cortex
A
FIGURE 14.10
A summary of the motor loop from the
cortex to the basal ganglia to the thalamus
and back to area 6.
..
»
.
: ..
.--:----
... :
Cortex
. '
. . ,
,
Sasal
ganglia
VLo
.
/ -
fJ
Cortico-
spina! -
tract
\
) ,\
\ 7
\ \
Red
nucleus
Reticular
nuclei
Superior coJliculus
and vestibular nuclei
r-
lateral
pathways
Jlt,
\,
V
I
Ventromedial
pathways
v
v
Spinal cord
VL nucleus of
thalamus
("
- ( k.
.' ,E'
- .-=-
\ '--
'\
Sasalganglia
and associated
structures:
)
"'-f
Caudate \
nucleus
/ Striatum
Putamen
------
. I
f
7
Globus
palfidus
.
FIGURE 14 II
The basal ganglia and associated structures.
Substantia
nigra
""'-
Subthalamic
nucleus
465
466 C HAP T E R I 4 . BRAIN CONTROL OF MOVEMENT
'"
(
\
"
The Motor Loop
The most direct path in the motor loop through the basal ganglia originates
with an excitatory connection from the cortex to cells in the putamen. The
putamen cells make inhibitory synapses on neurons in the globus pallidus,
which in turn make inhibitory connections with the cells in VLo. The thal-
amocortical connection (from VLo to SMA) is excitatory and facilitates the
discharge of movement-related cells in the SMA. This direct motor loop is
summarized in Figure 14.12.
The functional consequence of cortical activation of the putamen is ex-
citation of the SMA by VL. Let's work out how this happens. At rest, neu-
rons in the globus pallidus are spontaneously active and therefore inhibit
VL. Cortical activation (l) excites putamen neurons, which (2) inhibit
globus pallidus neurons, which (3) release the cells in VLo from inhibition,
allowing them to become active. The activity in VLo boosts the activity of
the SMA. Thus, this part of the circuit acts as a positive-feedback loop that
may serve to focus, or funnel. the activation of widespread cortical areas
onto the supplementary motor area of cortex. We can speculate that the
"Go" signal for an internally generated movement occurs when activation
of the SMA is boosted beyond some threshold amount by the activity
reaching it through this basal ganglia "funnel."
Basal Ganglia Disorders. Studies of several human diseases have supported
the view that the direct motor loop through the basal ganglia functions
to facilitate the initiation of willed movements. According to one model,
increased inhibition of the thalamus by the basal ganglia underlies hypoki-
nesia, a paucity of movement, whereas decreased basal ganglia output leads
to hyperkinesia, an excess of movement.
Parkinson's disease exemplifies the first condition. This disorder, which
affects about 1 % of all people over age SO, is characterized by hypokinesia.
Its symptoms include slowness of movement (bradykinesia), difficulty in
initiating willed movements (akinesia), increased muscle tone (rigidity), and
SMA
)
"
.
Substantia Subthalamus
nigra
FIGURE 14.12
A wiring diagram of the basal ganglia motor loop. Synapses marked with a plus
( +) are excitatory: those with a minus (-) are inhibitory.
.. THE BASAL GANGLIA 467
tremors of the hands and jaw, which are most prominent at rest. Many
patients also suffer deficits of cognition as the disease progresses. The organic
basis of Parkinson's disease is a degeneration of substantia nigra inputs to
the striatum (Box 14.3). These inputs use the neurotransmitter dopamine
(DA), which normally facilitates the direct motor loop by activating cells in
the putamen (which releases VLo from globus pallid us-induced inhibition).
In essence, the depletion of dopamine in Parkinson's disease closes the fun-
nel that feeds activity to SMA via the basal ganglia and VLo.
A central goal of most therapies for Parkinson's disease is to enhance the
levels of dopamine delivered to the caudate nucleus and putamen. This is
most easily done by administering the compound dopa (L-dihydrox-
yphenylalanine, introduced in Chapter 6), which is a precursor to dopamine.
Dopa crosses the blood-brain barrier and boosts DA synthesis in the cells
that remain alive in the substantia nigra, thus alleviating some of the symp-
toms. However, dopa treatment does not alter the progressive course of the
disease, nor does it alter the rate at which substantia nigra neurons degen-
erate. (We will return to the topic of dopamine neurons in Chapter 15.)
One of the treatment strategies still in the experimental stage is an attempt
to graft non-neural cells that have been genetically manipulated to produce
DA into the basal ganglia. Similarly, grafts of human stem cells that have
been induced to release dopamine may one day provide an effective treat-
ment for Parkinson's disease.
If Parkinson's disease lies at one end of the spectrum of basal ganglia dis-
orders, Huntington's disease lies at the other. Huntington's disease is a
hereditary, progressive, inevitably fatal syndrome characterized by hyper-
kinesia and dyskinesias, abnormal movements; dementia, impaired cognitive
abilities; and a disorder of personality. The disease is particularly insidious
because its symptoms usually do not appear until well into adulthood. In
the recent past, patients often unwittingly passed the gene on to their chil-
dren before they knew they had the disease. It is now possible to perform
a genetic test that reveals whether a person carries the Huntington's gene.
People with Huntington's disease exhibit changes in mood, personality, and
memory. The most characteristic sign of the disease is chorea, spontaneous,
uncontrollable and purposeless movements with rapid, irregular flow and
flicking motions of various parts of the body. The most obvious pathology
of their brains is a profound loss of neurons in the caudate nucleus, puta-
men, and globus pallid us, with additional cell loss in the cerebral cortex and
elsewhere (see Box 14.3). The damage to structures in the basal ganglia, and
consequent loss of its inhibitory output to the thalamus, seem to account
for the disorders of movement in Huntington's patients. Cortical degenera-
tion is primarily responsible for their dementia and personality changes.
Hyperkinesia can also result from other types of lesions that affect the
basal ganglia. One example is ballism, which is characterized by violent,
flinging movements of the extremities (somewhat like our baseball pitcher
unintentionally throwing the ball while sitting in the dugout). The symp-
toms usually occur on just one side of the body, and the condition is then
called hemiballismus. As with Parkinson's disease, the cellular mechanisms
associated with ballism are known; it is caused by damage to the subthal-
amic nucleus (usually resulting from an interruption of its blood supply
caused by a stroke). The subthalamic nucleus, part of another side loop
within the basal ganglia, excites neurons in the globus pallidus that project
to VLo. Remember that excitation of the globus pallidus inhibits VLo (see
Figure 14.12). Thus, a loss of excitatory drive to the globus pallidus facili-
tates VLo, in effect opening the funnel of activity to the SMA.
In summary, the basal ganglia may facilitate movement by focusing activ-
ity from widespread regions of cortex onto the SMA. Importantly, however,
468 C HAP T E R I 4 . BRAIN CONTROL OF MOVEMENT
Box 14.3
... , .
OF SPECIAL INTEREST
... ...
lEi
Do Neurons in Diseased Basal Ganglia
Commit Suicide?
Several devastating neurological diseases involve the slow,
progressive death of neurons. Patients with Parkinson's
disease have usually lost more than 80% of the dopamine-
utilizing neurons in their substanti.a nigra (Figure A). Neurons
of the striatum and other regions slowly degenerate in
sufferers of Huntington's disease (Figure B). Why do these
neurons die? Ironically, it may be that natural forms of cell
death are involved. A process called programmed cell death is
essential for normal brain development; certain neurons
commit suicide as part of the "program" by which the
nervous system forms (see Chapter 23). All cells have sev-
eral "death genes" that trigger a set of enzymes that destroy
cellular proteins and DNA. Some forms of cancer occur
when normal programmed cell death is prevented, and cells
proliferate wildly. Some neurological diseases may result
when programmed cell death is unnaturally activated.
Huntington's disease is caused by a dominant gene that
codes for a large brain protein called huntingtin. The normal
molecule has a chain of 10-34 glutamines at one end, but
people with a repeat of more than 40 glutamines develop
Huntington's disease. The abnormally long huntingtins ag-
gregate; globs of them accumulate and trigger neuronal de-
generation. The function of normal huntingtin is unknown,
but it may counterbalance the triggers for programmed cell
death. Thus. Huntington's disease may arise from normal
processes of neuronal degeneration gone awry.
Parkinson's disease is primarily a disease of aging, and
the vast majority of cases occur after age 60. However, in
1976. and again in '982, several relatively young drug abusers
in Maryland and California developed severe Parkinsonian
symptoms within a few days. This was extraordinary, be-
cause usually symptoms accumulate over many years.
Medical detective work unraveled the cause of the addicts'
affliction. Each had taken street versions of a synthetic nar-
cotic that contained the chemical MPTP. The incompetent
basement chemists who had synthesized the illegal drug
tried to shortcut the procedure, thereby creating a chemi-
cal by-product that kills dopaminergic neurons. MPTP has
since helped us understand Parkinson's disease better. We
now know that MPTP is converted in the brain to MPP+;
dopaminergic cells are selectively vulnerable to it because
their membrane dopamine transporters mistake MPP+ for
dopamine, and they selectively accumulate this chemical
Trojan horse. Once inside the cell, MPP+ disrupts energy
production in mitochondria, and the neurons apparently die
because their ATP is depleted.
The effect of MPTP supports the idea that common
forms of Parkinson's disease might be caused by chronic
exposure to a slowly acting toxic chemical in the environ-
ment. Unfortunately, no one has identified such a toxin.
they also serve as a filter that keeps inappropriate movements from being
expressed. We saw in Roland's PET studies that activity in the SMA does
not automatically trigger movement. The initiation of voluntary movement
also requires activation of area 4, the subject of the next section.
... THE INITIATION OF MOVEMENT
BY PRIMARY MOTOR CORTEX
SMA is heavily interconnected with MI, cortical area 4 on the precentral
gyrus. The designation of area 4 as primary motor cortex is somewhat ar-
bitrary because this is not the only cortical area that contributes to the cor-
ticospinal tract or to movement. Nonetheless, since the time of Sherring-
ton, neuroscientists have recognized that this area has the lowest threshold
for the elicitation of movement by electrical stimulation. In other words,
stimulation intensities that are unable to evoke movement in other cortical
areas are still effective in evoking movement when applied to area 4,
meaning that area 4 has dense, strong synaptic connections with the motor
neurons and the spinal interneurons that drive them. Focal electrical stim-
ulation of area 4 evokes the contraction of small groups of muscles, and, as
... THE INITIATION OF MOVEMENT BY PRIMARY MOTOR CORTEX 469
Research has shown that MPTP can induce a form of pro-
grammed neuronal death in the substantia nigra. Dopamin-
ergic neurons of Parkinson's patients may degenerate for a
similar reason. About 5% of Parkinson's cases are inherited,
and mutations in several different genes are now known to
cause these rarer types of the syndrome. One hypothesis is
that Parkinsonian genes encode mutant proteins that are
misfolded, aggregate, accumulate in neurons, and trigger or
facilitate the death of dopaminergic neurons.
By understanding how and why neurons self-destruct,
we may eventually be able to devise strategies of cellular
suicide prevention that halt or avert a variety of terrible
neurological diseases.
S.ubstantia
/ mgra
'
""I
Caudate
nucleus
Putamen
,
4)
'.
.......
FIGURE A
Normal (top); Parkinson's disease (bottom).
(Source: Strange, 1992, Fig. 10.3.)
FIGURE B
Normal (left); Huntington's disease (right). (Source: Strange, 1992,
Fig. 11.2.)
we discussed above, the somatic musculature is mapped systematically in
this area. This ribbon of cortex that stretches the full length of the precen-
tral gyrus is sometimes also called the motor strip.
The Input-Output Organization of M I
The pathway by which motor cortex activates lower motor neurons originates
in cortical layer V. Layer V has a population of pyramidal neurons, some of
which can be quite large (soma diameters approaching 0.1 mm). The largest
cells were first described as a separate class by Russian anatomist Vladimir
Betz in l874 and are therefore called Belz cells. The layer V pyramidal cells
in Ml receive their inputs primarily from two sources: other cortical areas
and the thalamus. The major cortical inputs originate in the areas adjacent
to area 4: area 6 immediately anterior, and areas 3, Land 2 immediately
posterior (see Figure 14.7). The thalamic input to Ml arises mainly from
another part of the ventral lateral nucleus, called VLc, which relays infor-
mation from the cerebellum. Besides projecting directly to the spinal cord,
layer V pyramidal cells also send axon collaterals to many subcortical sites
involved in sensorimotor processing, especially the brain stem.
470 C HAP T E R I 4 . BRAIN CONTROL OF MOVEMENT
The Coding of Movement in M I
Researchers previously thought the motor cortex consisted of a detailed
mapping of the individual muscles, such that the activity of a single pyram-
idal cell would lead to activity in a single motor neuron pooL However, the
view that has emerged from more recent work is that individual pyramidal
cells can drive numerous motor neuron pools from a group of different
muscles involved in moving a limb toward a desired goal. Recordings from
Ml neurons in behaving animals have revealed that a burst of activity occurs
immediately before and during a voluntary movement and that this activity
appears to encode two aspects of the movement: force and direction.
Considering that cortical microstimulation studies had suggested the
existence of a fine-grained movement map in Ml, the discovery that the
movement direction tuning of individual M 1 neurons is rather broad came
as a surprise. This breadth of tuning is shown clearly in a type of experi-
ment devised by Apostolos Georgopoulos and his colleagues, then working
at Johns Hopkins University. Monkeys were trained to move a joystick to-
ward a small light whose position varied randomly around a circle. The Ml
cells fired most vigorously during movement in one direction (180 0 in the
example in Figure 14.13a), but also discharged during movements that
varied :t45° from the preferred direction. The coarseness in the directional
tuning of the corticospinal neurons was certainly at odds with the high
accuracy of the monkey's movements, suggesting that the direction of
movement could not be encoded by the activity of individual cells that
command movement in a single direction. Georgopoulos hypothesized that
movement direction was encoded instead by the collective activity of a
population of neurons.
To test the feasibility of this idea of population coding for movement di-
rection, Georgopoulos and his colleagues recorded from more than 200 dif-
ferem neurons in Ml; for each cell, they constructed a directional tuning
curve such as that shown in Figure 14.13b. From these data, the researchers
--
90° 90°
0 0 c
0 0 0 0 :::J
40
CIJ
180 0 0° 180° 0 0 zu;
...\J/.. Q)
0 0 .;. 0 O!!!
... Q) :::J
""II' '@ 20
0)=
0 0 0 0 -2
u::
270 00 270 0 L 0
0°
-+ 7-
(a) (b)
FIGURE 14.13
Responses of an M I neuron during arm movements in different
directions. (a) As the monkey moves a handle toward a small light. the
responses of an M I neuron are monitored. When the monkey moves in
directions around the clock. the relationship between the cell's discharge
rate and movement direction can be determined. (b) A tuning curve for an
M I neuron. This cell fires most during movements to the left. (c) Because
the cell In part b responds best to leftward movement, It is represented
by a direction vector pointing in that direction. The length of the vector is
proportional to the firing rate of the cell. Notice that as the movement
direction changes. the length of the direction vector changes. (Source:
Adapted from Georgopoulos et al.. 1982.)
90° 180 0 270 0 0 0
T -+
Direction of movement
180° ..
c
Q)
E 135 0
Q)
:>
0
E
15 90 0
c
0
13 45°
2:!
is
0°
60
(c)
Direction vector of cell
/
...
..
..
40 20
Firing rate of M1 neuron
(impulses/see)
o
.. THE INITIATION OF MOVEMENT BY PRIMARY MOTOR CORTEX 471
Movement Direction Direction Population
direction vector vector vector for
for cell 1 for cell 2 cells 1 and 2
g I
UJ
(jj t
OJ Right + =
-'<:
'6.
.
OJ
UJ ! J
c:
0
a.
UJ
OJ
a: Up + =
Left Up Right Down -
180 0 90 0 0" 270 0
(a) Direction of movement (b)
knew how vigorously each of the cells in the population responded during
movement in each direction. The activity of each cell was represented as a
direction vector pointing in the direction that was best for that cell; the length
of the vector represented how active that cell had been during a particular
movement (Figure 14.14). The vectors representing each cell's activity could
be plotted together for each direction of movement then averaged to yield
what the researchers called a population vector. They found a strong correla-
tion between this average vector, representing the activity of the entire pop-
ulation of M I cells, and the actual direction of movement (Figure 14.15).
90°
J.
: :f
". . "
......h----- :V::------.»- 0°
J; '""
.
FIGURE 14.15
Predicting the direction of movement by population vectors. Each cluster of lines
reflects the direction vectors of many cells in MI. Line length reflects the discharge rate of
each cell during a movement in one of eight different directions. Arrows represent the
average population vectors, which predict the movement direction of the monkey's arm.
(Source: Georgopoulos et aI., 1983.)
FIGURE 14.14
Direction vectors and population
vectors. (a) The tuning curves for two
cells in the motor cortex (see Figure 14.13).
Both cells fire during movement in a range
of directions, but cell I fires best when move-
ment is upward, while cell 2 responds best
when movement is from left to right. (b) The
response of each cell is represented as a direc-
tion vector. which points in the preferred di-
rection for the neuron, but its length depends
on the number of action potentials the cell
fires during movement over a range of direc-
tions. For any direction. the direction vectors
of individual cells are averaged to Yield a pop-
ulation vector. reflecting the strength of the
response of both cells during this movement.
472 C HAP T E R I 4 . BRAIN CONTROL OF MOVEMENT
E
.s
(I) 4.5
lii
c
'6
o 3.5
o
u
lii
<;; 2.5
lii
...J
Region of rat M1 mapped
" \ ,
/0,
"
"
View of dorsal
surface of rat brain
1.5
r
lii
'6 o. 1.5 _ 0.5 0.5 1.5 2.5 3.5 4.5
(I)
Posterior --- Anterior coordinate (mm)
(a)
E
.s
(I) 4.5
ro
c
'6 3.5
0
0
u
lii 2.5
Q;
ro
...J
_ Forelimb
_ Vibrissae
o Periocular
1.5
lii
'6 O. 1.5 _ 0.5 0.5 1.5 2.5 3.5 4.5
(I)
Posterior --- Anterior coordinate (mm)
(b)
FIGURE 14.16
Malleable motor maps. (a) This map
represents motor cortex from a normal rat.
(b) This map represents a rat that had the
motor nerve cut that supplies the vibrissae
(whiskers). Notice that the cortical regions
that previously evoked movement of the
vibrissae now cause muscle movement In
the forelimb or around the eyes (periocular).
(Source: Adapted from Sanes and
Donoghue. 1997.)
These studies suggest three important conclusions about how Ml com-
mands voluntary movement: (1) that much of the motor cortex is active
for every movement, (2) that the activity of each cell represents a single
"vore" for a particular direction of movement, and (3) that the direction of
movement is determined by a tally (and averaging) of the votes registered
by each cell in the population. Although this population-coding scheme
remains hypothetical in Ml, experiments on the superior coIliculus have
shown conclusively that a population code is used by this structure to com-
mand precisely directed eye movements.
The Malleable Motor Map. An interesting prediction that derives from
this scheme for motor control is that the larger the population of neurons
representing a type of movement, the finer the possible control. From the
motor map shown in Figure 14.8, we would predict that finer control
should be possible for the hands and the muscles of facial expression, and
indeed this is normally the case. Of course, fine movements of other mus-
cles can be learned with experience; consider the finger, wrist, elbow, and
shoulder movements of an accomplished cellist. Does this mean that cortical
cells in Ml can switch allegiance from participation in one type of move-
ment to another as skills are learned? The answer appears to be yes. John
Donoghue, Jerome Sanes, and their students at Brown University collected
evidence indicating that such plasticity of the adult motor cortex is possi-
ble. For example, in one series of experiments using cortical microstimula-
tion in rats, they found that the region of Ml that normally elicits whisker
movements would evoke forelimb movements instead when the motor
nerve that supplies the muscles of the snout was cut (Figure 14.16). These
neuroscientists speculate that similar types of cortical reorganization might
provide a basis for learning fine motor skills.
From the preceding discussion, we can imagine that when the time has
come for our baseball pitcher to wind up, his moror cortex generates a tor-
rent of activity in the pyramidal tract. What could appear to be a discor-
dant voice to the neurophysiologist recording from a single Ml neuron is
part of a clear chorus of activity to the spinal motor neurons that generate
the movement. By learning to decode this chorus of Ml activity, neurosci-
entists are beginning to help patients with severe damage to their motor
pathways to control their world without the use of muscles (Box 14.4).
.. THE CEREBELLUM
It is not enough to simply command the muscles to contract. Throwing a
curve ball requires a detailed sequence of muscle contractions, each one
timed with great precision. This critical motor control function belongs to
the cerebellum (introduced in Chapter 7). Involvement of the cerebellum
in this aspect of motor control is plainly revealed by cerebellar lesions;
movements become uncoordinated and inaccurate, a condition known as
ataxia.
Take this simple test. Lay your arms in your lap for a moment, then
touch your nose with one finger. Try it again with your eyes closed. No
problem, right? Patients with cerebellar damage are often incapable of
performing this simple task. Instead of smoothly and simultaneously
moving the shoulder, elbow, and wrist to bring the finger to rest on the
nose, they will move each joint sequentially-first the shoulder, then the
elbow, and finally the wrist. This is called dysynergia, decomposition of
synergistic multijoint movement. Another characteristic deficit shown by
these patients is that their finger movement will be dysmetric; they will either
come up short of the nose or shoot past it, poking themselves in the face.
... THE CEREBELLUM 473
Box 14.4
PATH OF DISCOVERY
lit
e;
Neurotechnology: Merging
Mind and Machines
We are entering an era of novel neurotechnologies when
our knowledge of neuroscience, engineering, mathematics.
and computer science will allow us to repair a damaged
nervous system. In the mid-I 990s, we set out to create a
neurotechnology to restore movement for people with
paralysis. Three key advances made this seem possible. First,
we found a way to record arm movement signals from the
brain.A method to sense the activity of many neurons for
long periods was not then available. Luckily, I met bio-
medical engineer Dick Normann, who had invented an array
of 100 microelectrodes that is about the width of a baby
aspirin (Figure A). With graduate student Ed Maynard, we
developed the array into a useful long-term sensor. The
second major advance was that my colleagues Liam Panin-
ski. Matt Fellows. and Nicho Hatsopoulos were able to
record a mass of spike information from primary motor
cortex (M I) and decode it into simple signals that speci-
fied the motion of the hand in space.Third, improvements
in computing and electronics made it feasible to perform
the decoding in real time--about as fast as it takes for your
hand to move after your cortex generates a command.
This set the stage for Misha Serruya, a student in my
lab, to perform a landmark experiment in 2002. Misha
showed that a monkey could playa video game using only
neural signals from its M I, bypassing the usual pathway
through the spinal cord, nerves, and muscles of the arm.
We dubbed this result "turning thought into action." As
the monkey played a computer game called pinball, we
recorded from his M I, analyzed the spiking patterns, and
determined how to decode them so they would predict
the monkey's intended hand motions. We then used only
the decoded activity from the monkey's brain to move the
cursor on the screen, and it worked!
The monkey experiment convinced us that we could
use the same approach to restore a movement signal to
people who were paralyzed. Translating laboratory find-
ings in animals to human clinical trials and finally useful
medical devices is a daunting task. To ensure that a human
trial is warranted, extensive testing and regulatory matters
must first be addressed. In 2002, I helped form a company,
Cyberkinetics, to translate laboratory work into a device
that could restore the ability of paralyzed individuals to
interact with the world.
During the next year. Cyberkinetics developed Brain-
Gate, an initial human version of the recording and de-
coding system developed in my research laboratory. After
- \
by John P Donoghue
,\
review by groups that monitor and oversee human re-
search trials, we were approved to implant the device in
individuals with tetraplegia, a condition in which neither
hand movements nor leg movements are possible. The
first participant was a man who became tetrapl,egic when
a knife wound to his neck severed his spinal cord. Brain-
Gate sensor implantation was performed at Brown Uni-
versity's Rhode Island Hospital by neurosurgeon Gerhard
Friehs in June 2004. After waiting a month for healing, we
processed signals from the subject's implant. We immedi-
ately observed neural activity. and cortical neurons
changed their firing when he thought about moving his
hand left and right.These were important milestones:Three
years after his injury had eliminated all sensation and
movement control of his limbs and body, merely thinking
about movement still engaged his neurons.
We studied the properties of the subject's neurons for
a year so we could learn how to harness their activity and
turn them into reliable control signals. He was able to
control a computer cursor and operate simple e-mail and
paint programs. He could play Pong, one of the original
computer video games, and operate a Tv. He was also
able to open and close a prosthetic hand and operate a
simple robotic limb to grasp and maneuver objects. These
are simple but exhilarating demonstrations.
Many technical developments will be necessary before
neuromotor interfaces become everyday devices for par-
alyzed individuals. Another long-term goal is to restore
the connection between the brain and the muscles di-
rectly. using an electrical stimulation system to allow
thoughts to move the limbs. We hope that someday these
physical repairs will work so well you won't be able to
distinguish someone who has had a spinal cord injury
from any other able-bodied person.
,\) \
( r
FIGURE A
The relative size of a
microelectrode array.
474 C H A PT E R 14 . BRAIN CONTROL OF MOVEMENT
You may recognize these symptoms as similar to those that accompany
ethanol intoxication. Indeed, the clumsiness that accompanies alcohol abuse
is a direct consequence of the depression of cerebellar circuits (Box 14.5).
Anatomy of the Cerebellum
Cerebellar anatomy is shown in Figure 14.17. The cerebellum sits on stout
stalks called peduncles that rise from the pons; the whole structure resem-
bles a piece of cauliflower. The visible part of the cerebellum is actually a
thin sheet of cortex, which is repeatedly folded. The dorsal surface is char-
acterized by a series of shallow ridges called folia (singular: folium), which
run transversely (from side ro side). In addition, there are deeper transverse
fissures, revealed by making a sagittal slice through the cerebellum; these
divide the cerebellum into lO lobules. Together, folia and lobules serve to
greatly increase the surface area of the cerebellar cortex, as the gyri of the
cerebrum do for the cerebral cortex. Because of the high density of neurons
in its cortex, the cerebellum, which constitutes only about 10% of the total
volume of the brain, contains more than 50% of the total number of
neurons in the CNS. Neurons are also embedded deep in the white matter
of the cerebellum, forming the deep cerebellar nuclei, which relay most of the
cerebellar cortical output to various brain stem structures.
Unlike the cerebrum, the cerebellum is not obviously split down the
middle. At the midline, the folia appear to run uninterrupted from one side
to the other. The only distinguishing feature of the midline is a bump that
runs like a backbone down the length of the cerebellum. This midline region
is called the vermis (from the Latin for "worm"), and it separates the two
lateral cerebellar hemispheres from each other. The vermis and the
hemispheres represent important functional divisions. The vermis sends
output to the brain stem structures that contribute to the ventromedial
descending spinal pathways, which, as already discussed, control the axial
\..
\
...... 1
'\
,
\
-------
...
,
(b)
Hemisphere
A
Vermis
,
'-
'- \ Lobules
;"/"'- «. '" \
;' . 0' _
I ,-;r J \\\ \-,j' '\
-* I . . to'"" \\ J}. (),
Cerebellar- r //. \' . \J)
cortex l ./ / \ 1 r
/
Deep cerebellar
nuclei
(c)
/
Pontine
nuclei
Fourth
ventricle
Folia
-
--
\,
\ -
,
(a)
.
Medulla
Spinal cord
FIGURE 14.17
The cerebellum. (a) A dorsal view of the human cerebellum, showing the vermis and
hemispheres. (b) A midsagittal view of the brain, showing the lobules of the cerebellum.
(c) A cross section of the cerebellum, showing the cortex and deep nuclei.
Box 14.5
... , ..
THE CEREBELLUM 475
..
OF SPECIAL INTEREST
....
# '"
10
Involuntary Movements,
Normal and Abnormal
Raise your hand in front of your face. and try to hold it
as still as possible. You will see a very slight trembling of
your fingers. This is caned physiological tremor, a small,
rhythmic oscillation of about 8- J 2 Hz (Figure A). It is per-
fectly normal, and there is nothing you can do to stop it,
short of resting your hand on the table. A variety of
everyday circumstances-stress, anxiety, hunger, fatigue,
fever, too much caffeine--can enhance the tremor.
As we have discussed in this chapter, some neurologi-
cal diseases lead to more dramatic involuntary move-
ments, with distinctive characteristics. Parkinson's disease
is often associated with a large resting tremor of about 3-5
Hz. Movement is at its worst when the patient is not at-
tempting to move. Strangely enough, the tremor immedi-
ately disappears during a voluntary movement. On the
other hand, people with cerebellar damage have no ab-
normal tremor at rest but often show dramatic intention
Flexion
Physiologiealtremor
Extension
1 see
Resting tremor
1 see
Intention tremor
1 see
Chorea
10 see
Athetosis
10min
FIGURE A
tremor when they try to move. Cerebellar tremor is an
expression of ataxia, the uncoordinated contractions of
the muscles used in the movement. For example, as the
patient tries to move her finger from one point in space
to another (Figure B), or track a pathway with her finger
(Figure C), she makes large errors; in trying to correct an
error, she makes more errors, and so on, as the finger
wobbles toward its destination.
Huntington's disease causes chorea (from the Greek for
"dance")-quick, irregular, involuntary, but relatively coor-
dinated movements of the limbs, trunk, head, and face.
Other types of basal ganglia disease can lead to othetosis,
much slower, almost writhing movements of the neck and
trunk The unique properties of each abnormal movement
can help in the diagnosis of neurological diseases, and they
have taught us volumes about the normal functions of the
damaged parts of the brain.
.
..
: '
:... Norma!
\(
\h
."---dP r
'. : ,.----, ,i)
.,.. - .
I
Abnormal
\.!
i'
vr
,;
----J
r
I
"'" \
. \ 1.
Start
Finish
FIGURE B
Normal
I
FIGURE C
476 C HAP T E R I 4 . BRAIN CONTROL OF MOVEMENT
FIGURE 14.18
A summary of the motor loop through
the cerebellum.
musculature. The hemispheres are related to other brain structures that
contribute to the lateral pathways, particularly the cerebral cortex. For the
purpose of illustration, we focus on the lateral cerebellum, which is partic-
ularly important for limb movements.
The Motor loop Through the lateral Cerebellum
The simplest circuit involving the lateral cerebellum constitutes yet another
loop, shown schematically in Figure 14.18. Axons arising from layer V
pyramidal cells in the sensorimotor cortex-frontal areas 4 and 6, somatosen-
sory areas on the postcentral gyrus. and the posterior parietal areas-form
a massive projection to clusters of cells in the pons. the pontine nuclei,
which in turn feed the cerebellum. To appreciate the size of this pathway.
consider that the corticopontocerebellar projection contains about 20 mil-
lion axons; that's 20 times more than in the pyramidal tract! The lateral
cerebellum then projects back to the motor cortex via a relay in the ven-
trallateral nucleus of the thalamus (VLc).
From the effects of lesions in this pathway, we can deduce that it is crit-
ical for the proper execution of planned. voluntary, multijoint movements.
Indeed, once the signal for movement intent has been received by the cere-
bellum. the activity of this structure appears to instruct the primary motor
cortex with respect to movement direction. timing. and force. For ballistic
Prefrontal
cortex
A
Motor
cortex
, ,-------A----., r
Area Area
6 4
Sensory
cortex
A
0(
..
.0:
.
: 0(
...
.
.
Cortex
I Bas l p
1._ ga:g LJ
VLc
Pons,
cerebellum
Red
nucleus
, \
---
) J
\j
Reticular Superior colliculus
nuciei and vestibular nuclei
./
.--/
J I: ' C rtico-
spinal
\ tract
\'jl
'. \
(
Lateral
pathways
o
I
__i
Ventromedial
pathways
\ V
Spinal cord
.. CONCLUDING REMARKS 477
movements, these instructions are based entirely on predictions about their
outcome (because such movements are too fast for feedback to be of much
immediate use). Such predictions are based on past experience; that is, they
are learned. Therefore, the cerebellum is another important site for motor
learning-it is a place where what is intended is compared with what has
happened. When this comparison fails to meet expectations, compensatory
modifications are made in certain cerebel1ar circuits.
Programming the Cerebellum. We will return to the details of cerebellar
circuitry and how it is modified by experience in Chapter 25. But for now,
think about the process of learning a new skill (e.g., downhill skiing, tennis,
juggling, throwing a curve ball). Early on, you must concentrate on new
movements, which you will perform in a disjointed and uncoordinated
fashion. Practice makes perfect, however. As you master the skill, the
movements will become smooth. and eventually you will be able to per-
form them almost unconsciously. This process represents the creation of a
new motor program that generates the appropriate movement sequences
on demand without the need for conscious control.
We are reminded of a certain computer microchip manufacturer that ad-
vertises its product as the "computer inside." The cerebeUum acts as the
"brain inside" that unconsciously sees to it that the programs for skilled
movement are executed properly and are adjusted whenever their execu-
tion fails to meet expectations.
... CONCLUDING REMARKS
Let's return to the example of the baseball pitcher one last time. to put the
different pieces of the motor control puzzle together. Imagine the pitcher
walking to the mound. The spinal circuits of the crossed extensor reflex
are engaged and coordinated by descending commands on the ventrome-
dial pathways. Extensors contract, flexors relax; flexors contract, extensors
relax.
Once on the mound, the pitcher is joined by the umpire. Into his out-
stretched hand the umpire drops a new baseball. The added weight stretches
the flexors of the arm. Group La axons become more active and cause
monosynaptic excitation of the motor neurons innervating the flexors. The
muscles contract to hold the ball up against gravity.
He is now ready to pitch. His neocortex is fully engaged and active as he
looks at the catcher for the hand signal that instructs the type of pitch to
be thrown. At the same time. the ventromedial pathways are working to
maintain his stancling posture. Although his body is still, the neurons of the
ventral horns of the spinal cord are firing madly under the influence of the
ventromedial pathways, keeping the extensors of the lower leg activated.
The catcher flashes the sign for the curve ball. The sensory information
is communicated to the parietal and prefrontal cortex. These regions of cor-
tex. and area 6, begin planning the movement strategy.
The batter steps up to the plate and is ready. Activity cycling through the
basal ganglia increases, triggering the initiation of the pitch. In response to
this input, SMA activity increases. followed immediately by the activation
of Ml. Now instructions are sweeping down the axons of the lateral path-
ways. The cerebellum, activated by the corticopontocerebellar inputs, uses
these instructions to coordinate the timing of the descending activity so the
proper sequence of muscle contractions can occur. Cortical input to the
reticular formation leads to the release of the antigravity muscles from re-
flex control. Finally, lateral pathway signals engage the motor neurons and
interneurons of the spinal cord. which cause the muscles to contract.
478 C HAP T E R I 4 . BRAIN CONTROL OF MOVEMENT
'
>-V)
wI:
w
.....
The pitcher winds up and throws. The batter swings. The ball sails over the
left-field fence. The crowd jeers; the manager curses; the team owner
frowns. Even as the cerebellum goes to work making adjustments for the
next pitch, the player's body reacts. His face flushes; he sweats; he's angry
and anxious. But these latter reactions are not the stuff of the somatic
motor system. These are topics of Part III, The Brain and Behavior.
Descending Spinal Tracts
lateral pathway (p.453)
ventromedial pathway (p.453)
corticospinal tract (p. 454)
motor cortex (p. 454)
pyramidal tract (p. 454)
rubrospinal tract (p. 454)
red nucleus (p.454)
vestibulospinal tract (p.456)
tectospinal tract (p.457)
reticular formation (p.457)
pontine reticulospinal tract
(p. 458)
medullary reticulospinal tract
(p. 458)
The Planning of Movement
by the Cerebral Cortex
primary motor cortex (M I)
(p. 460)
premotor area (PMA) (p. 461)
supplementary motor area (SMA)
(p. 46 I )
The Basal Ganglia
ventral lateral (YL) nucleus (p.464)
basal ganglia (p. 464)
caudate nucleus (p. 464)
putamen (p.464)
globus pallid us (p. 464)
subthalamic nucleus (p.464)
rlf!,
,I.!!J
V)
w Z
o
>
w.....
V)
w
::J
a
substantia nigra (p. 464)
striatum (p. 464)
Parkinson's disease (p.466)
Huntington's disease (p.467)
ballism (p. 467)
The Initiation of Movement
by the Primary Motor Cortex
motor strip (p. 469)
The Cerebellum
cerebellum (p. 472)
ataxia (p. 472)
vermis (p. 474)
cerebellar hemispheres (p.474)
pontine nuclei (p.476)
!. List the components of the lateral and ventromedial descending spinal pathways. Which type of movement
does each path control?
2. You are a neurologist presented with a patient who has the following symptom: an inability to independently
wiggle the toes on the left foot, but with all other movements (walking, independent finger movement) ap-
parently intact. You suspect a lesion in the spinal cord. Where?
3. PET scans can be used to measure blood flow in the cerebral cortex. What parts of the cortex show in-
creased blood flow when a subject is asked to think about moving her right finger?
4. Why is dopa used to treat Parkinson's disease? How does it act to alleviate the symptoms?
5. Individual Betz cells fire during a fairly broad range of movement directions. How might they work together
to command a precise movement?
6. Sketch the motor loop through the cerebellum. What movement disorders result from damage to the
cerebellum?
60,
t9
Wz
I-
.....0
a:.«
::Jw
u...a:.
Andersen RA, Musallam S, Pesaran B. 2004. Selecting
the signals for a brain-machine interface. Current
Opinion in Neurobiology 14:720-726.
Blumenfeld H. 2002. Neuroanatomy Through Clinical
Cases. Sunderland, MA: Sinauer.
The cerebellum: development, physiology. and plastic-
ity. 1998. Trends in Neurosdences 21 :367-419 (spe-
cial issue).
Dauer W. przedborski S. 2003. Parkinson's disease:
mechanisms and models. Neuron 39:889-909.
Donoghue J, Sanes J. 1994. Motor areas of the cere-
bral cortex. Journal of Clinical Neurophysiology II:
382-396.
Porter R. Lemon R. 1993. Corticospinal Function and
Voluntary Movement. Oxford. England: Clarendon
Press.
THE BRAIN
AND BEHAVIOR
PART III
Chemical Control of
the Brain and Behavior
INTRODUCTION
THE SECRETORY HYPOTHALAMUS
AN OVERVIEW OF THE HYPOTHALAMUS
Homeostasis
Structure and Connections of the Hypothalamus
PATHWAYS TO THE PITUITARY
Hypothalamic Control of the Posterior Pituitary
Hypothalamic Control of the Anterior Pituitary
. Box 15.1 Of Special Interest: Stress and the Brain
THE AUTONOMIC NERVOUS SYSTEM
ANS CIRCUITS
Sympathetic and Parasympathetic Divisions
The Enteric Division
Central Control of the ANS
NEUROTRANSMITTERS AND THE PHARMACOLOGY OF AUTONOMIC FUNCTION
Preganglionic Neurotransmitters
Postganglionic Neurotransmitters
THE DIFFUSE MODULATORY SYSTEMS OF THE BRAIN
ANATOMY AND FUNCTIONS OF THE DIFFUSE MODULATORY SYSTEMS
. Box 15.2 Of Special Interest: You Eat What You Are
The Noradrenergic Locus Coeruleus
The Serotonergic Raphe Nuclei
The Dopaminergic Substantia Nigra and Ventral Tegmental Area
. Box 15.3 Path of Discovery: Awakening to Dopamine, by Arvid Carlsson
The Cholinergic Basal Forebrain and Brain Stem ComPlexes
DRUGS AND THE DIFFUSE MODULATORY SYSTEMS
Hallucinogens
Stimulants
CONCLUDING REMARKS
CHAPTER
482 C HAp T E R I 5 . CHEMICAL CONTROL OF THE BRAIN AND BEHAVIOR
. INTRODUCTION
It should be obvious by now that knowing the organization of synaptic
connections is essential to understanding how the brain works. It's not
from a love of Greek and Latin that we belabor the neuroanatomy! Most
of the connections we have described are precise and specific. For exam-
ple. in order for you to read these words, there must be a very fine-grained
neural mapping of the light falling on your retina-how else could you see
the dot on this question mark? The information must be carried centrally
and precisely dispersed to many parts of the brain for processing, coordi-
nated with control of the motor neurons that closely regulate the six mus-
cles of each eye as it scans the page.
In addition to anatomical precision, point-to-point communication in
the sensory and motor systems requires mechanisms that restrict synaptic
communication to the cleft between the axon terminal and its target. It just
wouldn't do for glutamate released in somatosensory cOrtex to activate
neurons in motor cortex! Furthermore, transmission must be brief enough
to allow rapid responses to new sensory inputs. Thus, at these synapses,
only minute quantities of neurotransmitter are released with each impulse,
and these molecules are then quickly destroyed enzymatically or taken up
by neighboring cells. The postsynaptic actions at transmitter-gated ion
channels last only as long as the transmitter is in the cleft, a few milliseconds
at most. Many axon terminals also possess presynaptic "autoreceptors" that
detect the transmitter concentrations in the cleft and inhibit release if they
get too high. These mechanisms ensure that this type of synaptic transmis-
sion is tightly constrained, in both space and time.
The elaborate mechanisms that constrain point-to-point synaptic trans-
mission bring to mind a telecommunications analogy. Telephone systems
make possible very specific connections between one place and another;
your mother in Tacoma can talk just to you in Providence, reminding you
that her birthday was last week. The telephone lines can act like precise
synaptic connections. The influence of one neuron (your mother) is targeted
to a small number of other neurons (in this case, only you). The embar-
rassing message is limited to your ears only. For a real neuron in one of the
sensory or motor systems discussed so far, its influence usually extends to
the few dozen or few hundred cells it synapses on-a conference call, to be
sure, but still relatively specific.
Now imagine your mother being interviewed on a television talk show,
which is broadcast via a cable network. In this case, the widespread cable
connections may allow her to tell millions of people that you forgot her
birthday, and the loudspeaker in each television set will announce the
message to anyone within earshot. Likewise, certain neurons communi-
cate with hundreds of thousands of other cells. These widespread systems
also tend to act relatively slowly, over seconds to minutes. Because of
their broad, protracted actions, such systems in the brain can orchestrate
entire behaviors, ranging from falling asleep to falling in love. Indeed,
many of the behavioral dysfunctions collectively known as mental disor-
ders are believed to result specifically from imbalances of certain of these
chemicals.
In this chapter, we take a look at three components of the nervous system
that operate in expanded space and time (Figure 15.1). One component is
the secretory hypothalamus. By secreting chemicals directly into the blood-
stream, the secretory hypothalamus can influence functions throughout
both the brain and the body. A second component, controlled neurally by
the hypothalamus, is the autonomic nervous system (ANS). introduced in
Chapter 7. Through extensive interconnections within the body, the ANS
., INTRODUCTION 483
o
(a)
C)
r:O
0Q
a
aa
.
:'0.: 0 ::
. .
".';;
(b)
:';..
....:O .... '.
."
'9.P
'. '0'.
.b. .
:.0 'L
:9': X
.
- ..
L 0
0 0
(c) 0
0
0
0
0
(d)
0
FIGURE 15.1
Patterns of communication in the nervous system. (a) Most of the systems we
have discussed in this book may be described as point-to-point. The proper functioning of
these systems requires restricted synaptic activation of target cells and signals of brief dura-
tion. In contrast. three other components of the nervous system act over great distances
and for long periods of time. (b) Neurons of the secretory hypothalamus affect their
many targets by releasing hormones directly into the bloodstream. (c) Networks of inter-
connected neurons of the ANS can work together to activate tissues all over the body.
(d) Diffuse modulatory systems extend their reach with widely divergent axonal
projections.
simultaneously controls the responses of many internal organs, blood ves-
sels, and glands. The third component exists entirely within the central
nervous system (CNS) and consists of several related cell groups that differ
with respect to the neurotransmitter they use. All of these cell groups ex-
tend their spatial reach with highly divergent axonal projections and pro-
long their actions by using metabotropic postsynaptic receptors. Members
of this component of the nervous system are called the diffuse modulatory
systems of the brain. The diffuse systems are believed to regulate, among
other things, the level of arousal and mood.
This chapter serves as a general introduction to these systems. In later
chapters, we will see how they contribute to specific behaviors and brain
states: motivation (Chapter 16), sexual behavior (Chapter 17), emotion
(Chapter 18), sleep (Chapter 19), and psychiatric disorders (Chapter 22).
484 C HAP T E R I 5 . CHEMICAL CONTROL OF THE BRAIN AND BEHAVIOR
\- \ \);
r\/ ),
s, 1\ z-..
Dorsal thalamus
(cut edge)
\ /
/
j
/ \
I \
Optic chiasm
Pituitary
Third
ventricle
/
\
\
\
\
Hypothalamus
FIGURE I S.l
Locations of the hypothalamus and
pituitary. This is a midsaginal section. Notice
that the hypothalamus. whose borders are
Indicated with a dashed line. forms the wall
of the third ventricle and sits below the oorsal
thalamus.
? THE SECRETORY HYPOTHALAMUS
Recall from Chapter 7 that the hypothalamus sits below the thalamus, along
the walls of the third ventricle. It is connected by a stalk to the pituitary
gland, which dangles below the base of the brain, just above the roof of
your mouth (Figure 15.2). Although this tiny cluster of nuclei makes up
less than I % of the brain's mass, the influence of the hypothalamus on body
physiology is enormous. Let's take a brief tour of the hypothalamus and
then focus On some of the ways in which it exerts its powerful influence.
An Overview of the Hypothalamus
The hypothalamus and dorsal thalamus are adjacent to one another, but
their functions are very different. As we saw in the previous seven chap-
ters, the dorsal thalamus lies in the path of all the point-to-point pathways
whose destination is the neocortex. Accordingly, the destruction of a small
part of the dorsal thalamus can produce a discrete sensory or motor deficit:
a little blind spot or a lack of feeling on a portion of skin. In contrast the
hypothalamus integrates somatic and visceral responses in accordance with the needs
of the brain. A tiny lesion in the hypothalamus can produce dramatic and
often fatal disruptions of widely dispersed bodily functions.
Homeostasis. In mammals, the requirements for life include a narrow
range of body temperatures and blood compositions. The hypothalamus
regulates these levels in response to a changing external environment. This
regulatory process is called homeostasis, the maintenance of the body's
internal environment within a narrow physiological range.
Consider temperature regulation. Biochemical reactions in many cells of
the body are fine-tuned to occur at about 37°C. A variation of more than
a few degrees in either direction can be catastrophic. Temperature-sensitive
cells in the hypothalamus detect variations in brain temperature and or-
chestrate the appropriate responses. For example, when you stroll naked
through the snow, the hypothalamus issues commands that cause you to
shiver (generating heat in the muscles), develop goosebumps (a futile at-
tempt to fluff up your nonexistent fur-a reflexive remnant from our
hairier ancestors), and turn blue (shunting blood away from the cold surface
tissues to keep the sensitive core of the body warmer). In contrast when
you go for a jog in the tropics, the hypothalamus activates heat-loss mech-
anisms that make you turn red (shunting blood to the surface tissues where
heat can be radiated away) and sweat (cooling the skin by evaporation).
Other examples of homeostasis are the tight regulation of blood volume,
pressure, salinity, acidity, and blood oxygen and glucose concentrations.
The means by which the hypothalamus achieves these different types of
regulation are remarkably diverse.
Structure and Connections of the Hypothalamus. Each side of the
hypothalamus has three functional zones: lateral. medial. and periventric-
ular (Figure 15.3). The lateral and medial zones have extensive connections
with the brain stem and the telencephalon and regulate certain types of
behavior, as we will see in Chapter 16. Here we are concerned only with
the third zone, which actually receives much of its input from the other two.
The periventricular zone is so named because, with the exception of
a thin finger of neurons that are displaced laterally by the optic tract
(called the supraoptic nucleus), the cells of this region lie right next to the
wall of the third ventricle. Within this zone exists a complex mix of neurons
with different functions. One group of cells constitutes the suprachiasmatic
nucleus (SCN), which lies just above the optic chiasm. These cells receive
... THE SECRETORY HYPOTHALAMUS 485
.....
"-
"-
r y
il:\1 - .\.( {
, I' 'r
J}
-
\ \
FIGURE 15.3
Zones of the hypothalamus. The hypothalamus has three functional zones: lateral.
medial, and periventricular. The periventricular zone receives inputs from the other zones, the
brain stem, and the telencephalon. Neurosecretory cells in the periventricular zone secrete
hormones into the bloodstream. Other periventricular cells comrol the autonomic nervous
system.
direct retinal innervation and function to synchronize circadian rhythms
with the daily light-dark cycle (see Chapter 19). Other cells in the periven-
tricular zone control the ANS, and regulate the outflow of the sympathetic
and parasympathetic innervation of the visceral organs. The cells in a third
group, called neurosecretory neurons, extend axons down toward the stalk of
the pituitary gland. These are the ceJ]s that now command our attention.
Pathways to the Pituitary
We have said that the pituitary dangles down below the base oJ the brain.
which is true if the brain is lifted our of the head. In a living brain, the
pituitary is gently held in a cradle of bone at the base of the skull. It re-
quires this special protection because it is the "mouthpiece" from which
much of the hypothalamus "speaks" to the body. The pituitary has two
lobes, posterior and anterior. The hypothalamus controls the two lobes in
clifferent ways.
Hypothalamic Control of the Posterior Pituitary. The largest of the
hypothalamic neurosecretory cells, magnocellular neurosecretory cells,
extend axons around the optic chiasm, down the stalk of the pituitary, and
into the posterior lobe (Figure 15.4). In the late 1930s, Ernst and Bert<:
Scharrer, working at the University of Frankfurt in Germany, proposed that
these neurons release chemical substances directly into the capillaries of the
posterior lobe. At the time, this was quite a radical idea. It was well estab-
lished that chemical messengers called hormones were released by glands
into the bloodstream, but no one anticipated that a neuron could act like
a gland or that a neurotransmitter could act like a hormone. The Scharrers
were correct, however. The substances released into the blood by neurons
are now called neurohormones.
The magnocellular neurosecretory cells release two neurohormones into
the bloodstream, oxytocin and vasopressin. Both of these chemicals are pep-
tides, each consisting of a chain of nine amino acids. Oxytocin, released dur-
ing the final stages of childbirth, causes the uterus to contract and facilitates
Lateral
Medial
_ _ 1_ Periven-
tricular
Third
ventricle
Hypo-
thalamus
486 C HAP T E R I 5 . CHEMICAL CONTROL OF THE BRAIN AND BEHAVIOR
\.
,
!
I
.....
-
k
.(.
'.
I
II
Hypothalamus I
Optic chiasm
\
\.
Anterior lobe
of pituitary
\
, \ 'I
cells
I(
I
Posterior
/ lobe of
"---Jf.;;. pituitary
\> '-' \
\ 'f'
t;.( "'
. . "
---
II
Capillary bed
FIGURE 15.4
Magnocellular neurosecretory cells of the hypothalamus. This is a midsagittal view
of the hypothalamus and pituitary. Magnocellular neurosecretory cells secrete oxytocin and
vasopressin directly Into capillaries In the posterior lobe of the pituitary.
the deJivery of the newborn. It also stimulates the ejection of milk from the
mammary glands. All lactating mothers know about the complex "let-
down" reflex that involves the oxytocin neurons of the hypothalamus.
Oxytocin release may be stimulated by the somatic sensations generated by
a suckling baby. But the sight or cry of a baby (even someone else's) can
also trigger the release of milk beyond the mother's conscious controL In
each case, information about a sensory stimulus-somatic, visual, or audi-
tory-reaches the cerebral cortex via the usual route, the thalamus, and the
cortex ultimately stimulates the hypothalamus to trigger oxytocin release.
The cortex can also suppress hypothalamic functions, as when anxiety in-
hibits the letdown of milk.
Vasopressin, also called antidiuretic hormone (ADH), regulates
blood volume and salt concentration. When the body is deprived of water,
the blood volume decreases and blood salt concentration increases. These
changes are detected by pressure receptors in the cardiovascular system
and salt concentration-sensitive cells in the hypothalamus, respectively.
Vasopressin-containing neurons receive information about these changes
and respond by releasing vasopressin, which acts directly on the kidneys
and leads to water retention and reduced urine production.
Under conditions of lowered blood volume and pressure, communication
between the brain and the kidneys actually occurs in both directions (Fig-
ure 15.5). The kidneys secrete an enzyme into the blood called renin. Elevated
renin sets off a sequence of biochemical reactions in the blood. Angiotensino-
gen, a large protein released from the liver, is converted by renin to angiotensin
Subfornical
organ ________
--......
Hypothalamus
,)
\
-J
p;ru;7
I ADH I
Angiotensin II
Blood vessels,
kidney
(
Renin
Angiotensinogen
/
Kidney
Lowered blood
pressure
\
Liver
FIGURE ! 5.5
Communication between the kidneys and the brain. Under conditions of lowered
blood volume or pressure, the kidney secretes renin into the bloodstream. Renin in the
blood promotes the synthesis of the peptide angiotensin II, which eXCites the neurons In
the subfornical organ. The subfornical neurons stimulate the hypothalamus, causing an
increase in vasopressin (ADH) production and a feeling of thirst.
1, which breaks down further to form another small peptide hormone,
angiotensin II. Angiotensin II has direct effects on the kidney and blood ves-
sels, which help increase blood pressure. But angiotensin II in the blood is
also detected by the subfornical organ, a part of the telencephalon that lacks
a blood-brain barrier. Cells in the subfornical organ project axons into the
hypothalamus where they activate, among other things, the vasopressin-
containing neurosecretory cells. In addition, however, the subfornical organ
activates cells in the lateral area of the hypothalamus, somehow producing
an overwhelming thirst that motivates drinking behavioL It may be diffi-
cult to accept, but it's true: To a limited extent, our brain is controlled by
our kidneys! This example also illustrates that the means by which the
hypothalamus maintains homeostasis go beyond control of the visceral
organs and can include the activation of entire behaviors. In Chapter 16,
we will explore in more detail how the hypothalamus incites behavior.
Hypothalamic Control of the Anterior Pituitary. Unlike the posterior
lobe, which really is a part of the brain, the anterior lobe of the pituitary is
... THE SECRETORY HYPOTHALAMUS 487
488 C HAP T E R I 5 . CHEMICAL CONTROL OF THE BRAIN AND BEHAVIOR
Table 15.1 Hormones of the Anterior' Pituitary
HORMONE
TARGET
ACTION
Follicle-stimulating
hormone (FSH)
Luteinizing hormone (LH)
Thyroid-stimulating hormone
(TSH); also called
thyrotropin
Adrenocorticotropic
hormone (ACTH);
also called corticotropin
Gonads
Ovulation. spermatogenesis
Gonads
Thyroid
Ovarian, sperm maturation
Thyroxin secretion (increases
metabolic rate)
Adrenal cortex
Prolactin
Mammary
glands
Cortisol secretion (mobilizes
energy stores; inhibits
immune system; other
actions)
Stimulation of protein
synthesis
Growth and milk secretion
Growth hormone (GH)
All cells
an actual gland. The cells of the anterior lobe synthesize and secrete a wide
range of hormones that regulate secretions from other glands throughout
the body (together constituting the endocrine system). The pituitary hor-
mones act on the gonads, the thyroid glands, the adrenal glands, and the
mammary glands (Table i5.1). For this reason, the anterior pituitary was
traditionally described as the body's "master gland." But what controls the
master gland? The secretory hypothalamus does. The hypothalamus itself is
the true master gland of the endocrine system.
The anterior lobe is under the control of neurons in the periventricular
area called parvocellular neurosecretory cells. These hypothalamic
neurons do not extend axons all the way into the anterior lobe; instead,
they communicate with their targets via the bloodstream (Figure 15.6).
These neurons secrete what are called hypophysiotropic hormones into
a uniquely specialized capillary bed at the floor of the third ventricle. These
tiny blood vessels run down the stalk of the pituitary and branch in the
anterior lobe. This network of blood vessels is called the hypothalamo-
pituitary portal circulation. Hypophysiotropic hormones secreted by
hypothalamic neurons into the portal circulation travel downstream until
they bind to specific receprors on the surface of pituitary cells. Activation
of these receptors causes the pituitary cells to either secrete or stop seCret-
ing hormones into the general circulation.
Regulation of the adrenal glands illustrates how this system works. Located
just above the kidneys, the adrenal glands consist of two parts. a shell called
the adrenal cortex and a center called the adrenal medulla. The adrenal
cortex produces the steroid hormone cortisol; when it is released into the
bloodstream, cortisol acts throughout the body to mobilize energy reserves
and suppress the immune system, preparing us to carryon in the face of
life's various stresses. In fact, a good stimulus for cortisol release is stress,
ranging from physiological stress, such as a loss of blood; to positive emo-
tional stimulation, such as falling in love; to psychological stress, such as
anxiety over an upcoming exam.
Parvocellular neurosecretory cells that control the adrenal cortex determine
whether a stimulus is stressful or not (as defined by the release of cortisol).
These neurons lie in the periventricular hypothalamus and release a peptide
)
\
\
/
Hypothalamus
'\
Parvocel'u'ar
(-=-
fi !
{ /? ( Hypophysiotropic
J hormones
released
Hormone transport
in axons
Capillary beds
Anterior lobe
of pituitary
1
Hormone transport
in blood
(. ,\
Stimulation
J or inhibition
__________ ot anterior
___ ---------- pituitary
hormone
release
Hormone transport
in blood
\.
j)'
Hormone-
secreting cells
'r
Action on
organs of
the body
FIGURE 15.6
Parvocellular neurosecretory cells of the hypothalamus. Parvocellular neurosecre-
tory cells secrete hypophysiotropic hormones into specialized capillary beds of the hypothal-
amo-pituitary portal circulation. These hormones travel to the anterior lobe of the pituitary.
where they trigger or inhibit the release of pituitary hormones from secretory cells.
called corticotropin-releasing hormone (CRR) into the blood of the portal cir-
culation. CRR travels the short distance to the anterior pituitary, where,
within about 15 seconds, it stimulates the release of corticotropin, or adreno-
corticotropic hormone (ACTH). ACTH enters the general circulation and travels
to the adrenal cortex where, within a few minutes, it stimulates cortisol
release (Figure 15.7).
Blood levels of cortisol are, to some extent, self-regulated. Cortisol is a
steroid, which is a class of biochemicals related to cholesterol. Thus, cortisol
is a lipophilic ("fat-loving") molecule, which will dissolve easily in lipid
membranes and readily cross the blood-brain barrier. In the brain, cortisol
interacts with specific receptors that lead to the inhibition of CRR release,
thus ensuring that circulating cortisol levels do not get too high. Surpris-
ingly, however, neurons with cortisol receptors are found widely distributed
in the brain, not just in the hypothalamus. In these other CNS locations, cor-
tisol has been shown to have significant effects on neuronal activity. Thus,
we see that the release of hypophysiotropic hormones by cells in the secre-
tory hypothalamus can produce widespread alterations in the physiology of
both the body and the brain (Box 15.1).
... THE SECRETORY HYPOTHALAMUS 489
490 C HAP T E R I 5 . CHEMICAL CONTROL OF THE BRAIN AND BEHAVIOR
Hypothalamus ""
"-
Other brain
regions
7
t\
\
\
\-
Pituitary
I ACTH I
'-
....
Adrenal
/ cortex
Adrenal
medulla
---
Kidney/
FIGURE 15.7
The stress response. Under conditions of physiological. emotional, or psychological stimu-
lation or stress, the penventncular hypothalamus secretes corticotropin-releasing hormone
(CRH) into the hypothalamo-pltuitary portal circulation. This triggers the release of adreno-
corticotropic hormone (ACTH) into the general circulation. ACTH stimulates the release of
cortisol from the adrenal cortex. Cortisol can act directly on hypothalamic neurons, as well
as on other neurons elsewhere In the brain.
THE AUTONOMIC NERVOUS SYSTEM
Besides controlling the ingredients of the hormonal soup that flows in
our veins, the periventricular zone of the hypothalamus also controls the
autonomic nervous system (ANS). The ANS is an extensive network of
interconnected neurons that are widely distributed inside the body cavity.
From the Greek autonomia, autonomic roughly means "independence"; au-
tonomic functions are usually carried out automatically, without conscious,
voluntary control. They are also highly coordinated functions. Imagine a
sudden crisis. In a morning class, as you are engrossed in a crossword
puzzle, the instructor unexpectedly calls you to the blackboard to solve an
impossible-looking equation. You are faced with a classic fight-or-flight sit-
uation, and your body reacts accordingly, even as your conscious mind
frantically considers whether to blunder through it or beg off in humiliation.
Your ANS triggers a host of physiological responses, including increased
heart rate and blood pressure, depressed digestive functions, and mobilized
glucose reserves. These responses are all produced by the sympathetic
division of the ANS. Now imagine your relief as the class-ending bell
suddenly rings, saving you from acute embarrassment and the instructor's
anger. You settle back into your chair, breath deeply, and read the due for
24 DOWN. Within a few minutes, your sympathetic responses decrease to
low levels. and the functions of your parasympathetic division crank up
Box 15.1
... , ...
OF SPECIAL INTEREST
." THE AUTONOMIC NERVOUS SYSTEM 491
#
· Stress and the Brain
Biological stress is created by the brain, in response to
real or imagined stimuli. The many physiological responses
associated with stress help protect the body, and the
brain, from the dangers that triggered the stress in the
first place. But stress in chronic doses can have insidious
harmful effects as well. Neuroscientists have only begun
to understand the relationship between stress, the brain,
and brain damage.
Stress leads to the release of the steroid hormone cor-
tisol from the adrenal cortex. Cortisol travels to the brain
through the bloodstream and binds to receptors in the
cytoplasm of many neurons. The activated receptors travel
to the cell nucleus, where they stimulate gene transcrip-
tion and ultimately protein synthesis. One consequence of
cortisol's action is that neurons admit more Ca H through
voltage-gated ion channels. This may be due to a direct
change in the channels, or it may be indirectly caused by
changes in the cell's energy metabolism. Whatever the
mechanism, presumably in the short term, cortisol makes
the brain better able to cope with the stress-perhaps by
helping it figure out a way to avoid it!
But what about the effects of chronic, unavoidable
stress? In Chapter 6, we learned that too much calcium
can be a bad thing. If neurons become overloaded with
calcium, they die (excitotoxicity). The question naturally
arises: Can cortisol kill? Bruce McEwen and his colleagues
at Rockefeller University, and Robert Sapolsky and his
colleagues at Stanford University, have studied this ques-
tion in the rat brain. They found that daily injections of
corticosterone (rat cortisol) for several weeks caused
dendrites to wither on many neurons with corticosterone
receptors. A few weeks later, these cells started to die. A
similar result was found when, instead of daily hormone
injections, the rats were stressed every day.
Sapolsky's studies of baboons in Kenya further reveal
the scourges of chronic stress. Baboons in the wild main-
tain a complex social heirarchy, and subordinate males
steer clear of dominant males when they can. During one
year when the baboon population boomed, local villagers
caged many of the animals to prevent them from de-
stroying their crops. Unable to escape the "top baboons"
in the cages, many of the subordinate males subsequently
died-not from wounds or malnutrition, but apparently
from severe and sustained stress-induced effects. They
had gastric ulcers, colitis, enlarged adrenal glands, and
extensive degeneration of neurons in their hippocampus.
Subsequent studies suggest that it is the direct effect of
cortisol that damages the hippocampus. These effects of
cortisol and stress resemble the effects of aging on the
brain. Indeed, research has clearly shown that chronic
stress causes premature aging of the brain.
In humans, exposure to the horrors of combat, sexual
abuse, and other types of extreme violence can lead to
posttraumatic stress disorder, with symptoms of heightened
anxiety, memory disturbances, and intrusive thoughts.
Imaging studies have consistently found degenerative
changes in the brains of victims, particularly in the hip-
pocampus. In Chapter 22, we will see that stress, and the
brain's response to it, plays a central role in several psy-
chiatric disorders.
again: Your heart rate slows and blood pressure drops, digestive functions
work harder on breakfast, and you stop sweating.
Notice that you may not have moved out of your chair throughout this
unpleasant event. Maybe you didn't even move your pencil. But your
body's internal workings reacted dramatically. Unlike the somatic motor system,
whose alpha motor neurons can rapidly excite skeletal muscles with pin-
point accuracy, the actions of the ANS are typically multiple. widespread,
and relatively slow. Therefore, the ANS operates in expanded space and
time. In addition, unlike the somatic motor system, which can only excite
its peripheral targets, the ANS balances synaptic excitation and inhibition
to achieve widely coordinated and graded COntrol.
ANS Circuits
Together, the somatic motor system and the ANS constitute the total neu-
ral output of the CNS. The somatic motor system has a single function: It
innervates and commands skeletal muscle fibers. The ANS has the complex
492 C HAP T E R I 5 . CHEMICAL CONTROL OF THE BRAIN AND BEHAVIOR
FIGURE 15.8
The organization of the three neural
outputs of the CNS. The sole output of
the somatic motor system is the lower motor
neurons in the ventral horn of the spinal cord
and the brain stem, which Sherrington called
the final common pathway for the generation
of behavior. But some behaviors, such as sali-
vating, sweating, and genital stimulation, de-
pend instead on the ANS. These visceral mo-
tor responses depend on the sympathetic and
parasympathetic divIsions of the ANS, whose
lower motor neurons (i.e.. postganglionic
neurons) lie outside the CNS in autonomic
ganglia.
ANS
A
Somatic motor Sympathetic
Parasympathetic
r - Q ----
CNS
, ________ Preganglionic
fibers
Autonomic
(sympathetic)
ganglion
PNS
- Somatic
motor
fiber
- Autonomic
(parasympathetic)
ganglion
Skeletal I
muscle L
task of commanding every other tissue and organ in the body that is inner-
vated. Both systems have upper motor neurons in the brain that send com-
mands to lower motor neurons, which actually innervate the peripheral
target structures. However, they have some interesting differences (Figure
15.8). The cell bodies of all somatic lower motor neurons lie within the
CNS, in either the ventral horn of the spinal cord or the brain stem. The
cell bodies of all autonomic lower motor neurons lie outside the CNS,
within cell clusters called autonomic ganglia. The neurons in these ganglia
are called postganglionic neurons. Postganglionic neurons are driven by
preganglionic neurons, whose cell bodies are in the spinal cord and brain
stem. Thus, the somatic motor system controls its peripheral targets via a
monosynaptic pathway, while the ANS uses a disynaptic pathway.
Sympathetic and Parasympathetic Divisions. The sympathetic and
parasympathetic divisions operate in parallel, but they use pathways that
are quite distinct in structure and in their neurotransmitter systems. Pre-
ganglionic axons of the sympathetic division emerge only from the middle
third of the spinal cord (thoracic and lumbar segments). In contrast, pre-
ganglionic axons of the parasympathetic division emerge only from the
brain stem and the lowest (sacral) segments of the spinal cord, so the two
systems complement each other anatomically (Figure 15.9).
FIGURE 15.9 ...
The chemical and anatomical organization of the sympathetic and parasym-
pathetic divisions of the ANS. Notice that the preganglionic inputs of both divisions
use ACh as a neurotransmitter. The postganglionic parasympathetic innervation of the visceral
organs also uses ACh, but the postganglionic sympathetic innervation uses norepinephrine
(with the exception of innervation of the sweat glands and vascular smooth muscle within
skeletal muscle, which use ACh). The adrenal medulla receives preganglionic sympathetic in-
nervation and secretes epinephrine into the bloodstream when activated. Note the pattern
of innervation by the sympathetic division: Target organs in the chest cavity are contacted by
postganglionic neurons originating in the sympathetic chain, and target organs in the abdomi-
nal cavity are contacted by postganglionic neurons originating in the collateral ganglia.
... THE AUTONOMIC NERVOUS SYSTEM 493
Sympathetic division
Parasympathetic division
,
Cranial
Dilates Constricts .J..
pupil pupil Oculomotor (
II) ./--.-
. Sti ul tes ( ')1
Inhibits E y e salivatIon F . I
aCla ==
salivation and tears nerve (V J -£
and tearing d [
,/ -,y"'
>-----> -
Lacrimal and Glossopharyngeal nerve (IX) --........:::::
salivary glands Lungs
Cervical
Slows
heartbeat
.
Thoracic
u
Stimulates glucose
production and
release
Sacral
Dilates blood
vessels in gut
.
Stimulates
digestion
.
Lumbar
Stimulates
secretion of
epinephrine and
norepinephrine
from adrenal
medu
Stimulates pancreas
to release insulin
and digestive
enzymes
9 pancreas
--
Q -r'.r-
Sympathetic
chain
Stimulates orgasm
)---4!
Stimulates sexual
arousal
NE neurons
ACh neurons
'------------y-
Preganglionic
neurons
-----l ,
------y- ____J '--------y
Postganglionic Preganglionic
neurons neurons
Cranial
Cervical
Thoracic
Lumbar
Sacral
494 C HAP T E R I 5 . CHEMICAL CONTROL OF THE BRAIN AND BEHAVIOR
The preganglionic neurons of the sympathetic division lie within the in-
termediolateral gray matter of the spinal cord. They send their axons through
the ventral roots to synapse on Fleurons in the ganglia of the Sflllpathetic
chain, which lies next to the spinal column, or within collateral ganglia
found within the abdominal cavity. The preganglionic parasympathetic
neurons, on the other hand, sit within a variety of brain stem nuclei and
the lower (sacral) spinal cord, and their axons travel within several cranial
nerves as well as the nerves of the sacral spinal cord. The parasympathetic
preganglionic axons travel much farther than the sympathetic axons, be-
cause the parasympathetic ganglia are typically located next to, on, or in
their target organs (see Figures 15.8 and 15.9).
The ANS innervates three types of tissue: glands, smooth muscle, and
cardiac muscle. Thus, almost every part of the body is a target of the ANS,
as shown in Figure 15.9. The ANS:
. Innervates the secretory glands (salivary, sweat, tear, and various mucus-
producing glands).
. Innervates the heart and blood vessels to control blood pressure and
flow.
. Innervates the bronchi of the lungs to meet the oxygen demands of the
body.
. Regulates the digestive and metabolic functions of the liver, gastroin-
testinal tract, and pancreas.
. Regulates the functions of the kidney, urinary bladder, large intestine,
and rectum.
. Is essential to the sexual responses of the genitals and reproductive organs.
. Interacts with the body's immune system.
The physiological influences of the sympathetic and parasympathetic
divisions generally oppose each other. The sympathetic division tends to be
most active during a crisis, real or perceived. The behaviors related to it are
summarized in the puerile (but effective) mnemonic used by medical stu-
dents, called the four Fs: fight, flight, fright, and sex. The parasympathetic
division facilitates various non-four-F processes, such as digestion, growth,
immune responses, and energy storage. In most cases, the activity levels of
the two ANS divisions are reciprocal; when one is high, the other tends to
be low, and vice versa. The sympathetic division frenetically mobilizes the
body for a short-term emergency at the expense of processes that keep it
healthy over the long term. The parasympathetic division works calmly for
the long-term good. Both cannot be stimulated strongly at the same time;
their general goals are incompatible. Fortunately, neural circuits in the CNS
inhibit activity in one division when the other is active.
Some examples will help illustrate how the balance of activity in the
sympathetic and parasympathetic divisions controls organ functions. The
pacemaker region of the heart triggers each heartbeat without the help of
neurons, but both divisions of the ANS innervate ir and modulate it; sym-
pathetic activity results in an increase in the rate of beating, while parasym-
pathetic activity slows it down. The smooth muscles of the gastrointestinal
tract are also dually innervated, but the effect of each division is the oppo-
site of its effect on the heart. Intestinal motility, and thus digestion, is stim-
ulated by parasympathetic axons and inhibited by sympathetic axons. Not
all tissues receive innervation from both divisions of the ANS. For exam-
ple. blood vessels of the skin, and the sweat glands, are innervated only by
excitatory sympathetic axons. Lacrimal (tear-producing) glands are excited
only by parasympathetic input.
Another example of the balance of parasympathetic-sympathetic activity
is the curious neural control of the male sexual response. Erection of the
human penis is a hydraulic process. It occurs when the penis becomes
engorged with blood, which is triggered and sustained by parasympathetic
activity. The curious part is that orgasm and ejaculation are triggered by
sympathetic activity. You can imagine how complicated it must be for the
nervous system to orchestrate the entire sexual act; parasympathetic activ-
ity gets it going (and keeps it going), but a shift to sympathetic activity is
necessary to terminate it. Anxiety and worry, and their attendant sympa-
thetic activity, tend to inhibit erection and promote ejaculation. Not sur-
prisingly, impotence and premature ejaculation are common complaints
of the overstressed male. (We will discuss sexual behavior further in
Chapter 17.)
The Enteric Division. The "little brain," as the enteric division of the
ANS is sometimes called, is a unique neural system embedded in an un-
likely place: the lining of the esophagus, stomach, intestines, pancreas, and
gallbladder. It consists of two complicated networks, each with sensory
nerves, intemeurons, and autonomic motor neurons, called the myenteric
(Auerbach's) plexus and submucous (Meissner's) plexus (Figure 15.10). These
networks control many of the physiological processes involved in the trans-
port and digestion of food, from oral to anal openings. The enteric system
is nor small; it contains about the same number of neurons as the entire
spinal cord!
Blood
Small
intestine
Axon
\ vessel.
Submucous
(Meissner's)
plexus
V
"---
p
.'
"'-
'It)
I
!r----- Myenteric
(Auerbach's)
plexus
FIGURE 15. 10
The enteric division of the ANS. This cross-sectional view of the small intestine shows
the two networks of the enteric division: the myenteric plexus and the submucous plexus.
They both contain visceral sensory and motor neurons that control the functions of the
digestive organs.
'Y THE AUTONOMIC NERVOUS SYSTEM 495
496 C HAP T E R I 5 . CHEMICAL CONTROL OF THE BRAIN AND BEHAVIOR
If the enteric division of the AJ'IS qualifies as "brain" (which may be over-
stating the case), it is because it can operate with a great deal of inde-
pendence. Enteric sensory neurons monitor tension and stretch of the gas-
trointestinal walls, the chemical status of stomach and intestinal contents,
and hormone levels in the blood. This information is used by the enteric
interneuronal circuits to control the activity levels of enteric output motor
neurons, which govern smooth muscle motility, the production of mucous
and digestive secretions, and the diameter of the local blood vessels. For
example, consider a partially digested pizza making its way through the
small intestine. The myenteric plexus ensures that lubricating mucus and
digestive enzymes are delivered, that rhythmic (peristaltic) muscle action
works to mix the pizza and enzymes thoroughly, and that intestinal blood
flow increases to provide a sufficient fluid source and transport newly ac-
quired nutrients to the rest of the body.
The enteric division is not entirely autonomous. It receives input indi-
rectly from the "real" brain via axons of the sympathetic and parasympa-
thetic divisions. These provide supplementary control and can supersede
the functions of the enteric division in some circumstances. For example,
the enteric nervous system and digestive functions are inhibited by the
strong activation of the sympathetic nervous system that occurs during
acute stress.
Central Control of the ANS. As we have said, the hypothalamus is the
main regulator of the autonomic preganglionic neurons. Somehow this
diminutive structure integrates the diverse information it receives about the
body's status, anticipates some of its needs, and provides a coordinated set
of both neural and hormonal outputs. Essential to autonomic control are
the connections of the periventricular zone to the brain stem and spinal
cord nuclei that contain the preganglionic neurons of the sympathetic and
parasympathetic divisions. The nucleus of the solitary tract, located in
the medulla and connected with the hypothalamus, is another important
center for autonomic control. In fact, some autonomic functions operate
well even when the brain stem is disconnected from all structures above it,
including the hypothalamus. The solitary nucleus integrates sensory infor-
mation from the internal organs and coordinates output to the autonomic
brain stem nuclei.
Neurotransmitters and the
Pharmacology of Autonomic Function
Even people who have never heard the word neurotransmitter know what
it means to "get your adrenaline flowing." (In the United Kingdom the
compound is called adrenaline, while in the United States we call it epi-
nephrine.) Historically, the ANS has probably taught us more than any
other part of the body about how neurotransmitters work. Because the
ANS is relatively simple compared to the CNS, we understand the ANS
much better. In addition, neurons of the peripheral parts of the ANS are
outside the blood-brain barrier, so all drugs that enter the bloodstream have
direct access to them. The relative simplicity and accessibility of the ANS
have led to a deeper understanding of the mechanisms of drugs that influ-
ence synaptic transmission.
Preganglionic Neurotransmitters. The primary transmitter of the pe-
ripheral autonomic neurons is acetyLchoLine (ACh), the same transmitter used
at skeletal neuromuscular junctions. The preganglionic neurons of both sympa-
thetic and parasympathetic divisions release ACh. The immediate effect is that the
ACh binds to nicotinic ACh receptors (nAChR), which are ACh-gated chan-
nels, and evokes a fast excitatory postsynaptic potential (EPSP) that usually
triggers an action potential in the postganglionic cell. This is very similar to
the mechanisms of the skeletal neuromuscular junction, and drugs that
block nAChRs in muscle, such as curare, also block autonomic output.
Ganglionic ACh does more than neuromuscular ACh, however. It also
activates muscarinic ACh receptors (mAChR), which are metabotropic
(G-protein-coupled) receptors that can cause both the opening and the
closing of ion channels that lead to very slow EPSPs and inhibitory postsy-
naptic potentials (IPSPs). These slow mAChR events are usually not evi-
dent unless the preganglionic nerve is activated repetitively. In addition to
ACh, some preganglionic terminals release a variety of small, neuroactive
peptides such as NPY (neuropeptide Y) and VIP (vasoactive intestinal polypep-
tide). These also interact with G-protein-coupled receptors and can trigger
small EPSPs that last for several minutes. The effects of peptides are mod-
ulatory; they do not usually bring the postsynaptic neurons to firing thresh-
old, but they make them more responsive to the fast nicotinic effects when
they do come along. Because more than one action potential is required to
stimulate the release of these modulatory neurotransmitters, the pattern of
firing in preganglionic neurons is an important variable in determining the
type of postganglionic activity that is evoked.
Postganglionic Neurotransmitters. Postganglionic cells-the autonomic
motor neurons that actually trigger glands to secrete, sphincters to contract
or relax, and so on-use different neurotransmitters in the sympathetic
and parasympathetic divisions of the ANS. Postganglionic parasympathetic
neurons release ACh, but those of most parts of the sympathetic division
use norepinephrine (NE). Parasympathetic ACh has a very local effect on its
targets and acts entirely through mAChRs. In contrast, sympathetic NE
often spreads far, even into the blood where it can circulate widely.
The autonomic effects of a variety of drugs that interact with cholinergic
and noradrenergic systems can be confidently predicted, if you under-
stand some of the autonomic circuitry and chemistry (see Figure 15.9). In
general. drugs that promote the actions of norepinephrine or inhibit the
muscarinic actions of acetylcholine are sympathomimetic; they cause effects
that mimic activation of the sympathetic division of the ANS. For example,
atropine, an antagonist of mAChRs, produces signs of sympathetic activa-
tion, such as dilation of the pupils. This response occurs because the bal-
ance of ANS activity is shifted toward the sympathetic division when
parasympathetic actions are blocked. On the other hand, drugs that pro-
mote the muscarinic actions of ACh or inhibit the actions of NE are parasym-
pathomimetic; they cause effects that mimic activation of the parasympa-
thetic division of the ANS. For example, propranolol, an antagonist of the
13 receptor (or NE, slows the heart rate and lowers blood pressure. For this
reason, propranolol is sometimes used to prevent the physiological conse-
quences of stage fright.
But what about the familiar flow of adrenaline? Adrenaline (epinephrine)
is the compound released into the blood from the adrenal medulla when ac-
tivated by preganglionic sympathetic innervation. Epinephrine is actuaIly
made from norepinephrine (noradrenaline in the United Kingdom), and it
has effects on target tissues almost identical to those caused by sympathetic
activation. Thus, the adrenal medulla is really nothing more than a modi-
fied sympathetic ganglion. You can imagine that as the epinephrine (adren-
aline) flows, a coordinated, bodywide set of sympathetic effects kicks in.
... THE AUTONOMIC NERVOUS SYSTEM 497
498 C HAP T E R I 5 . CHEMICAL CONTROL OF THE BRAIN AND BEHAVIOR
'Y THE DIFFUSE MODULATORY SYSTEMS
OF THE BRAIN
Consider what happens when you fall asleep. The internal commands "You
are becoming drowsy" and "You are falling asleep" are messages that must
be received by broad regions of the brain. Dispensing this information re-
quires neurons with a particularJy widespread pattern ofaxons. The brain
has several such collections of neurons, each using a particular neuro-
transmitter and making widely dispersed, diffuse, almost meandering con-
nections. Rather than carrying detailed sensory information, these cells of-
ten perform regulatOry functions, modulating vast assemblies of postsynaptic
neurons (such as the cerebral cortex, the thalamus, and the spinal cord) so
that they become more or less excitable, more or less synchronously active,
and so on. CoJlectively, they are a bit like the volume, treble, and bass con-
trols on a radio, which do not change the lyrics or melody of a song but
dramatically regulate the impact of both. In addition, different systems ap-
pear to be essential for aspects of motOr control. memory, mood, motiva-
tion, and metabolic state. Many psychoactive drugs affect these modulatory
systems, and the systems figure prominently in current theories about the
biological basis of certain psychiatric disorders.
Anatomy and Functions of the Diffuse Modulatory Systems
The diffuse modulatory systems differ in structure and function, yet
they have certain principles i.n common:
. TypicaJly, the core of each system has a small set of neurons (several
thousand).
. Neurons of the diffuse systems arise from the central core of the brain,
most of them from the brain stem.
. Each neuron can influence many others, because each one has an axon
that may contact more than lOO,OOO postsynaptic neurons spread widely
across the brain.
. The synapses made by many of these systems release transmitter mole-
cules into the extracellular fluid, so they can diffuse to many neurons
rather than be confined to the vicinity of the synaptic cleft.
We focus on the modulatory systems of the brain that use either NE,
serotonin (5-HT), dopamine (DA), or ACh as a neurotransmitter. Recall
from Chapter 6 that all of these transmitters activate specific metabotropic
(G-protein-coupled) receptors and that these receptors mediate most of
their effects; for example, the brain has 10-100 times more metabotropic
ACh receptors than ionotropic nicotinic ACh receptors.
Because neuroscientists are still working hard to determine the exact func-
tions of these systems in behavior. our explanations here will necessarily
be vague. It is clear, however, that the functions of the diffuse modulatory
systems depend on how electrically active they are, individually and in
combination, and on how much neurotransmitter is available for release
(Box 15.2).
The Noradrenergic Locus Coeruleus. Besides being a neurotransmitter
in the peripheral ANS, NE is also used by neurons of the tiny locus
coeruleus in the pons (from the Latin for "blue spot" because of the pig-
ment in its cells). Each human locus coeruleus has about 12,000 neurons.
We have two of them, one on each side.
A major breakthrough occurred in the mid-1960s, when Kjell Fuxe and
his colleagues at the Karolinska Institute in Sweden developed a technique
Box 15.2
.... , .
OF SPECIAL INTEREST
...
"'" ..
'Y THE DIFFUSE MODULATORY SYSTEMS OFTHE BRAIN 499
You Eat What You Are
Americans, it seems, are always trying to lose weight. The
low-fat, high-carbohydrate diets (think bagels) that were
all the rage in the 1990s have now been replaced by the
"Iow-carb" craze (think omelets). Changing your diet can
alter caloric intake and the body's metabolism; it can also
alter how your brain functions.
The influence of diet on the brain is most clear in the
case of the diffuse modulatory systems. Consider serotonin.
Serotonin is synthesized in two steps from the dietary
amino acid tryptophan (see Figure 6.14). The first step is
catalyzed by the enzyme tryptophan hydroxylase. The low
affinity of the enzyme for tryptophan makes this step rote-
limiting for serotonin synthesis-that is, serotonin can be
produced only as fast as this enzyme can hydroxylate
tryptophan. And a lot of tryptophan is required to push
the synthetic reaction as fast as it can go. However. brain
tryptophan levels are well below the level required to sat-
urate the enzyme. Thus, the rate of serotonin synthesis is
determined, in part, by the availability of tryptophan in the
brain-more tryptophan, more serotonin; less trypto-
phan, less serotonin.
Brain tryptophan levels are controlled by how much
tryptophan there is in the blood, and by how efficiently it
is transported across the blood-brain barrier. Tryptophan
in the blood is derived from the proteins we digest in our
diet, so a high-protein diet will lead to sharply increased
blood levels of tryptophan. Surprisingly, however. there is
a decline in brain tryptophan (and serotonin) for several
hours after a hearty, high-protein meal. The paradox was
resolved by Richard Wurtman and his colleagues at MIT
who observed that several other amino acids (tyrosine,
phenylalanine, leucine, isoleucine, and valine) compete with
tryptophan for transport across the blood-brain barrier.
These other amino acids are rich in a high-protein diet,
and they suppress the entry of the tryptophan into the
brain. The situation is reversed with a high-carbohydrate
meal (that also contains some protein). Insulin. released by
the pancreas in response to carbohydrates, decreases the
blood levels of the competing amino acids relative to
tryptophan. So the tryptophan in the blood is efficiently
transported into the brain, and serotonin levels rise.
Increased brain tryptophan correlates with elevated
mood, decreased anxiety, and increased sleepiness, likely
due to changes in serotonin levels. Inadequate tryptophan
may explain the phenomenon of carbohydrate craving
that has been reported in humans with seasonal affective
disorder-the depression of mood brought on by reduced
daylight during winter. It may also explain why clinical trials
for treating obesity with extreme carbohydrate depriva-
tion had to be stopped because of complaints of mood
disturbances (depression, irritability) and insomnia.
Based on these and other observations, Wurtman and
his wife Judith made the intriguing suggestion that our
dietary choices may reflect our brain's need for serotonin.
Consistent with this notion, drugs that elevate extracel-
lular serotonin can be effective for weight loss (as well as
depression), possibly by reducing the body's demand for
carbohydrates. We will discuss the involvement of sero-
tonin in appetite regulation further in Chapter 16 and in
the regulation of mood in Chapter 22.
that enabled the catecholaminergic (noradrenergic and dopaminergic)
neurons to be visualized selectively in histological sections prepared from
the brain (Figure 15.11). This analysis revealed that axons leave the locus
coeruleus in several tracts, but then fan out to innervate just about every
part of the brain: all of the cerebral cortex, the thalamus and the hypo-
thalamus, the olfactory bulb, the cerebellum, the midbrain, and the spinal
cord (Figure 15.12). The locus coeruleus must make some of the most dif-
fuse connections in the brain, considering that just one of its neurons can
make more than 250,000 synapses, and it can have one axon branch in the
cerebral cortex and another in the cerebellar cortex!
Locus coeruleus cells seem to be involved in the regulation of attention,
arousal, and sleep-wake cycles, as well as learning and memory, anxiety
and pain, mood, and brain metabolism. This makes it sound as if the locus
coeruleus may run the whole show. But the key word is "involved," which
can mean almost anything. For example, our heart, liver, lungs, and kidneys
are also involved in every brain function, for without them, all behavior
would fail utterly. Because of its widespread connections, the locus coeruleus
500 C HAP T E R I 5 . CHEMICAL CONTROL OF THE BRAIN AND BEHAVIOR
.
FIGURE 15.11
Norepinephrine-containing neurons of the locus coeruleus. The reaction of
noradrenergic neurons with formaldehyde gas causes them to fluoresce green. enabling
anatomical investigation of their widespread proJections. (Source: Courtesy of Dr. Kjell Fuxe.)
can influence virtually all parts of the brain. But to understand its actual
functions, we start by determining what activates its neurons. Recordings
from awake, behaving rats and monkeys show that locus coeruleus neurons
are best activated by new, unexpected, nonpainful sensory stimuli in the
animal's environment. They are least active when the animals are not vig-
ilant, just sitting around quietly, digesting a meal. The locus coeruleus may
participate in a general arousal of the brain during interesting events in the
outside world. Because NE can make neurons of the cerebral cortex more
responsive to salient sensory stimuli, the locus coeruleus may function
generally to increase brain responsiveness, speeding information processing
by the point-to-point sensory and motor systems and making them more
efficient.
Norepinephrine system
Neocortex
\\.-
"<
-J \, ( /
--.:;;: /
I, /
"'y\. .
" / '\
/ Thalamus
}",
. . * '. \
I \\\t.
" J'
Hypothalamus/ I , '
T'mpo,,"ob'/ / .
Locus coeruleus/ , \
, Cerebellum
To spinal cord
FIGURE 15.12
The noradrenergic diffuse modulatory system arising from the locus
coeruleus. The small cluster of locus coeruleus neurons project axons that innervate vast
areas of the CNS. including the spinal cord. cerebellum, thalamus. and cerebral cortex.
..... THE DIFFUSE MODULATORY SYSTEMS OF THE BRAIN 50 I
The Serotonergic Raphe Nuclei. Serotonin-containing neurons are
mostly clustered within the nine raphe nuclei. Raphe means "ridge" or
"seam" in Greek, and indeed the raphe nuclei lie to either side of the mid-
line of the brain stem. Each nucleus projects to different regions of the
brain (Figure 15.13). Those more caudal, in the medulla, innervate the
spinal cord, where they modulate pain-related sensory signals (see Chapter
12). Those more rostral, in the pons and midbrain, innervate most of the
brain in much the same diffuse way as do the locus coeruleus neurons.
Similar to neurons of the locus coeruleus, raphe nuclei cells fire most
rapidly during wakefulness, when an animal is aroused and active. Raphe
neurons are the most quiet during sleep. The locus coeruleus and the raphe
nuclei are part of a venerable concept called the ascending reticular activating
system, which implicates the reticular "core" of the brain stem in processes
that arouse and awaken the forebrain. This simple idea has been refined
and redefined in countless ways since it was introduced in the 1950s, but
its basic sense remains. Raphe neurons seem to be intimately involved in
the control of sleep-wake cycles, as well as the different stages of sleep. It
is important to note that several other transmitter systems are involved in
a coordinated way as well. We will discuss the involvement of the diffuse
modulatory systems in sleep and wakefulness in Chapter 19.
Serotonergic raphe neurons have also been implicated in the control of
mood and certain types of emotional behavior. We will return to serotonin
and mood when we discuss clinical depression in Chapter 22.
The Dopaminergic Substantia Nigra and Ventral Tegmental Area.
For many years, neuroscientists thought that dopamine existed in the brain
only as a metabolic precursor for norepinephrine. However, research con-
ducted in the 1960s by Arvid Carlsson of the University of Gothenburg in
Sweden proved that dopamine was indeed a crucial CNS neurotransmitter
(Box 15.3). This discovery was honored with the 2000 Nobel Prize in
Medicine.
Serotonin system
Thalamus
/
\
Cerebellum
To spinal cord
FIGURE i 5.13
The serotonergic diffuse modulatory systems arising from the raphe nuclei.
The raphe nuclei are clustered along the midline of the brain stem and project extensively
to all levels of the CNS.
502 C HAP T E R I 5 . CHEMICAL CONTROL OFTHE BRAIN AND BEHAVIOR
Box 15.3
PATH OF D SCOVERY
it
-
.
Awakening
to Dopamine
Our discovery of dopamine in the brain emerged from a
"Eureka!" kind of experiment. We had treated rabbits and
mice with reserpine, a drug commonly used in the 1950s
as an antipsychotic agent. These animals had obvious signs
of sedation and a characteristic type of immobility known
as catalepsy (Figure A, top). We then treated them with
l-dopa, a precursor to norepinephrine and epinephrine.
We were amazed to see that within 15 minutes of an in-
travenous injection of l-dopa, there was a dramatic re-
versal of the whole syndrome induced by reserpine. The
animals were up and running, fully awake, and mobile (Fig-
ure A. bottom).
We had previously found that following reserpine
treatment, NE disappears almost entirely from brain and
other tissues. If the behavioral action of reserpine was due
to depletion of NE, we reasoned it should be possible to
restore the behavior by replenishing the NE stores. This
could not be done by injecting NE itself because the cat-
echolamine cannot cross the blood-brain barrier. l-dopa,
however, like many other amino acids, might be able to
penetrate into the brain and then be converted to NE by
the appropriate enzymes. Indeed, our experiments seemed
to confirm our hypothesis. However, when we analyzed
the brains of the animals showing this dramatic awaken-
ing response, the NE level remained at about zero, and
our hypothesis was obviously false.
We then turned our attention to dopamine, which in
those days was supposed to be only a precursor to NE.We
developed a specific and sensitive chemical method for as-
saying dopamine and found that dopamine occurs normally
in the brain in levels comparable to NE. Dopamine stores,
like those of NE and serotonin, were depleted by reser-
pine. Unlike NE, however, the DA levels were restored af-
ter l-dopa treatment with a time course closely related to
the awakening response. Moreover, most of the dopamine
in the brain was found in the basal ganglia-structures sup-
posed to be involved in the control of movements. In the
meantime, we had learned that a common side effect of re-
serpine in humans was a movement disorder faithfully mim-
icking the syndrome of Parkinson's disease.
At an international catecholamine symposium in
Bethesda, Maryland, in October 1958, we could, on the
basis of these observations, propose that dopamine is in-
volved in the control of movements, that a lack of DA can
by Arvid Carlsson
lead to the development of the syndrome of Parkinson's
disease, and that the replenishment of DA stores by l-
dopa could alleviate Parkinson's symptoms. Thus, for the
first time, a putative neurotransmitter in the CNS had
been shown to exert a profound effect on brain function
and on an important pathophysiological mechanism.
Imagine our surprise to learn that these findings were
met with an almost unanimous disbelief by the most
prominent researchers in this field! Among the objections
were that dopamine had not shown any physiological ac-
tivity before and that this type of amine had not been
demonstrated in neurons. In addition, the prevailing view
in those days was that communication between nerve
cells in the CNS occurred via electrical rather than
chemical signals. Fortunately, thanks to a histochemical
method developed in our lab by Nils-Ake Hillarp and his
colleagues, we were able to demonstrate that DA. NE, and
serotonin are indeed located to nerve cell bodies and
axons in the CNS in a fashion very similar to the distri-
bution of NE in the peripheral nervous system. Moreover,
we presented additional pharmacological and biochemical
evidence for chemical transmission in the CNS. Thus,
within a few years, our views on chemical transmission in
the CNS were generally accepted, thereby heralding a
paradigm shift in brain research.
FIGURE A
Rabbits immobilized by reserpine (top) and reawakened by dopa
(bottom). (Courtesy of Arvid Carlsson.)
... THE DIFFUSE MODULATO Y SYSTEMS OF THE BRAIN 503
Dopamine system
Striatum
\\ 1//
/
/
/
'- "1- ///
, /
/
'T ,\ \
// ...
/'
Ventral tegmental area
Substantia
'nigra
/
/
l,
IJ
"
'Ii
" \
-'
,,-
FIGURE 15.14
The dopaminergic diffuse modulatory systems arising from the substantia
nigra and the ventral tegmental area. The substantia nigra and ventral tegmental area
lie close together in the midbrain, They project to the striatum (caudate nucleus and
putamen) and limbic and frontal cortical regions, respectively,
Although there are dopamine-comaining neurons scattered throughout
the CNS, including some in the retina, the olfactory bulb, and the periven-
tricular hypothalamus, two closely related groups of dopaminergic cells
have the characteristics of the diffuse modulatory systems (Figure 15.14).
One of these arises in the substantia nigra in the midbrain. Recall from
Chapter 14 that these cells project axons to the striatum (the caudate nu-
cleus and the putamen), where they somehow facilitate the initiation of
voluntary movements. Degeneration of the dopamine-comaining cells in
the substantia nigra is all that is necessary to produce the progressive,
dreadful motor disorders of Parkinson's disease. Although we do not en-
tirely understand the function of DA in motor control, in general it facili-
tates the initiation of motor responses by environmental stimuli.
The midbrain is also the origin of the other dopaminergic modulatory
system, a group of cells that lie very dose to the substantia nigra, in the
ventral tegmental area. Axons from these neurons innervate a circumscribed
region of the telencephalon that includes the frontal cortex and parts of the
limbic system. (The limbic system will be discussed in Chapter 18.) This
dopaminergic projection from the midbrain is sometimes called the mesO-
corticolimbic dopamine system, A number of different functions have been as-
cribed to this complicated projection. For example, evidence indicates that
it is involved in a "reward" system that somehow assigns value to, or rein-
forces, certain behaviors that are adaptive (see Chapter 16). We will see in
Chapter 18 that if rats (or humans) are given a chance to do so, they will
work to electrically stimulate this pathway. In addition, this projection has
been implicated in psychiatric disorders, as we will discuss in Chapter 22.
The Cholinergic Basal Forebrain and Brain Stem Complexes. Acetyl-
choline is the familiar transmitter at the neuromuscular junction, at synapses
in autonomic ganglia, and at postganglionic parasympathetic synapses.
Cholinergic interneurons also exist within the brain-in the striatum and
the cortex, for example. In addition, there are two major diffuse modulatory
cholinergic systems in the brain, one of which is called the basal forebrain
504 C HAP T E R I 5 . CHEMICAL CONTROL OF THE BRAIN AND BEHAVIOR
Acetylcholine system
.
........... // /
Medial/"./
septal nuclei / / ,-.y J J
Basal nucleus / . I
of Meynert / /"
Hippocampus / ""'-
Pontomesencephalo-
tegmental complex
Thalamus
\\ . !
" I
I "- "
I
)
\.
FIGURE 15.15
The cholinergic diffuse modulatory systems arising from the basal forebrain
and brain stem. The medial septal nuclei and basal nucleus of Meynert project widely
upon the cerebral cortex, including the hippocampus. The pontomesencephalotegmental
complex projects to the thalamus and parts of the forebrain.
complex. It is a "complex" because the cholinergic neurons lie scattered
among several related nuclei at the core of the telencephalon, medial and
ventral to the basal ganglia. The best known of these are the medial septal
nuclei, which provide the cholinergic innervation of the hippocampus, and
the basal nucleus of Meynert, which provides most of the cholinergic inner-
vation of the neocortex.
The function of the cells in the basal forebrain complex remains mostly
unknown. But interest in this region has been fueled by the discovery that
these are among the first cells to die during the course of Alzheimer's dis-
ease, which is characterized by a progressive and profound loss of cognitive
functions. (However, there is widespread neuronal death in Alzheimer's
disease, and no specific link between the disease and cholinergic neurons
has been established.) Like the noradrenergic and serotonergic systems, the
cholinergic system has been implicated in regulating general brain ex-
citability during arousal and sleep-wake cyeJes. The basal forebrain complex
may also playa special role in learning and memory formation.
The second diffuse cholinergic system is called the pontomesencephalotegmen-
tal complex. These are ACh-utilizing cells in the pons and midbrain tegmen-
tum. This system acts mainly on the dorsal thalamus, where, together with
the noradrenergic and serotonergic systems, it regulates the excitability of
the sensory relay nuclei. These cells also project up to the telencephalon,
providing a cholinergic link between the brain stem and basal forebrain
complexes. Figure 15.15 shows the cholinergic systems.
Drugs and the Diffuse Modulatory Systems
Psychoactive drugs, compounds with "mind-altering" effects, an act on the
CNS, and most do so by interfering with chemical synaptic transmission.
Many abused drugs act directly on the modulatory systems, particularly the
noradrenergic, dopaminergic, and serotonergic systems.
.. THE DIFFUSE MODULATORY SYSTEMS OFTHE BRAIN 50S
Hallucinogens. The use of hallucinogens, drugs that produce hallucinations,
goes back thousands of years. Hallucinogenic compounds are contained in
a number of plants consumed as part of religious ritual, for example, the
Psilocybe mushroom by the Maya and the peyote cactus by the Aztec. The
modern era of hallucinogenic drug use was unwittingly ushered in at the
laboratory of Swiss chemist Albert Hofmann. In 1938, Hofmann chemicaJly
synthesized a new compound, lysergic acid diethylamide (LSD). For 5 years,
the LSD sat on the shelf. Then one day in 1943, Hofmann accidentaJly
ingested some of the powder. His report on the effects attracted the imme-
diate interest of the medical community. Psychiatrists began to use LSD in
attempts to unlock the subconscious of mentally disturbed patients. Later,
the drug was discovered by intellectuals, artists, students, and the U.S. De-
fense Department, which investigated its "mind-expanding" effects. (A
chief advocate of LSD use was former Harvard psychologist Timothy Leary.)
In the 1960s, LSD made its way to the street and was widely abused. To-
day, the possession of LSD is illegal.
LSD is extremely potent. A dose sufficient to produce a full-blown hal-
lucinogenic effect is only 25 micrograms (compared to a normal dose of as-
pirin at 650 milligrams, which is 25,000 times larger). Among the reported
behavioral effects of LSD is a dreamlike state with heightened awareness of
sensory stimuli, often with a mixing of perceptions such that sounds can
evoke images, images can evoke smells, and so on.
The chemical structure of LSD (and the active ingredients of Psilocybe
mushrooms and peyote) is very close to that of serotonin, suggesting that
it acts on the serotonergic system. Indeed, LSD is a potent agonist at the
serotonin receptors on the presynaptic terminals of neurons in the raphe
nuclei. Activation of these receptors markedly inhibits the firing of raphe
neurons. Thus, one known CNS effect of LSD is a reduction in the outflow
of the brain's serotonergic diffuse modulatory system. It is interesting to
note in this regard that decreased activity of the raphe nuclei is also char-
acteri:;tic of dream-sleep (see Chapter 19).
Can we conclude that LSD produces hallucinations by silencing the brain's
serotonin systems? If only drug effects on the brain were that simple. Un-
fortunately, there are problems with this hypothesis. For one, silencing
neurons in the raphe nuclei by other means-by destroying them, for ex-
ample-does not mimic the effects of LSD in experimental animals. Fur-
thermore, animals still respond as expected to LSD after their raphe nuclei
have been destroyed.
In recent years, researchers have focused on direct LSD actions at serotonin
receptors in the cerebral cortex. Current research suggests that LSD causes
hallucinations by superseding the naturally modulated release of serotonin
in cortical areas where perceptions normally are formed and interpreted.
Stimulants. In contrast to the uncertainties about hallucinogens and
serotonin, it is clear that the powerful CNS stimulants cocaine and amphet-
amine both exert their effects at synapses made by dopaminergic and nora-
drenergic systems. Both drugs give users a feeling of increased alertness
and self-confidence, a sense of exhilaration and euphoria, and a decreased
appetite. Both are also sympathomimetic-they cause peripheral effects
that mimic activation of the sympathetic division of the ANS: increased
heart rate and blood pressure, dilation of the pupils, and so on.
Cocaine is extracted from the leaves of the coca plant and has been used
by Andean Indians for hundreds of years. In the mid-nineteenth century,
cocaine turned up in Europe and North America as the magic ingredient
in a wide range of conc,?ctions touted by their salesmen as having medici-
nal value. (An example is Coca-Cola, originally marketed in 1886 as a
506 C HAP T E R I 5 . CHEMICAL CONTROL OFTHE BRAIN AND BEHAVIOR
therapeutic agent, which contained both cocaine and caffeine.) Cocaine use
feJl out of favor early in the twentieth century, only to reemerge with a
vengeance in the late 1960s as a recreational drug. Ironically, one of the
main reasons for the rise in cocaine use during this period was the tight-
ening of regulations against amphetamines. First chemically synthesized in
1887, amphetamines did not come into wide use until World War Il, when
they were taken by soldiers of both sides (particularly aviators) to sustain
them in combat. Following the war, amphetamines became available as
nonprescription diet aids, as nasal decongestants, and as "pep-pills." Regu-
lations were finally tightened after recognition that amphetamines are, like
cocaine, highly addictive and dangerous in large doses.
The neurotransmitters dopamine and norepinephrine are catecholamines,
named for their chemical structure (see Chapter 6). The actions of cate-
cholamines released into the synaptic cleft are normally terminated by
specific uptake mechanisms. Cocaine and amphetamine both block this cat-
echolamine uptake (Figure 15.16). However, recent work suggests that
cocaine targets DA reuptake more selectively; amphetamine blocks NE and
DA reuptake and stimulates the release of DA. Thus, these drugs can pro-
long and intensify the effects of released DA or NE. Is this the means by
which cocaine and amphetamine cause their stimulant effects? There is
good reason for thinking so. For example. experimental depletion of brain
catecholamines by using synthesis inhibitors (such as a-methyltyrosine)
will abolish the stimulant effects of both cocaine and amphetamine.
Besides having a similar stimulant effect, cocaine and amphetamine share
another, more insidious behavioral action: psychological dependence, or
addiction. Users will develop powerful cravings for prolonging and contin-
uing drug-induced pleasurable feelings. These effects are believed to result
a-Methyltyrosine
)Tyrosine
-
Dopa
!
Activates postsynaptic and
presynaptic receptors
/.. : .
(. -.. .:
. ..
. .
. DA -.
DAJ:...
amphetamine
Activates postsynaptic and
presynaptic receptors
FIGURE 15.16
Stimulant drug action on the catecholamine axon terminal. On the left is a
noradrenergic terminal and on the nght IS a dopaminergic terminal. Both neurotransmitters
are catecholamines synthesized from the dietary amino acid tyrosine. Dopa (3,4-dihydrox-
ypheynylalamne) is an intermediate In the synthesis of both. The actions of I\1E and DA are
usually terminated by uptake back into the axon terminal. Amphetamine and cocaine block
this uptake, thereby allowing I\1E and DA to remain in the synaptic cleft longer.
specifically from the enhanced transmlSSlOn in the mesocorticolimbic
dopamine system during drug use. Remember, this system may normally
function to reinforce adaptive behaviors. By short-circuiting the system,
these drugs instead reinforce drug-seeking behavior. Indeed, just as rats will
work to electrically stimulate the mesocorticoIimbic projection, they will
also work to receive an injection of cocaine. We'll discuss the involvement
of dopamine pathways in motivation and addiction further in Chapter 16.
.. CONCLUDING REMARKS
In this chapter, we have examined three components of the nervous sys-
tem that are characterized by the great reach of their influences. The se-
cretory hypothalamus and autonomic nervous system communicate with
cells all over the body, and the diffuse modulatory systems communicate
with neurons in many different parts of the brain. They are also character-
ized by the duration of their direct effects, which can range from minutes
to hours. Finally, they are characterized by their chemical neurotransmit-
ters. In many instances, the transmitter defines the system. For example, in
the periphery, we can use the words "noradrenergic" and "sympathetic" in-
terchangeably. The same thing goes for "raphe" and "serotonin" in the fore-
brain, and "substantia nigra" and "dopamine" in the basal ganglia. These
chemical idiosyncrasies have allowed interpretations of drug effects on be-
havior that are not possible with most other neural systems. Thus, we have
a good idea where in the brain amphetamine and cocaine exert their stim-
ulant effects, and where in the periphery they act to raise blood pressure
and heart rate.
At a detailed level, each of the systems discussed in this chapter performs
different functions. But at a general level, they all maintain brain homeosta-
sis: They regulate different processes within a certain physiological range.
For example, the ANS regulates blood pressure within a range that is ap-
propriate. Blood pressure variations optimize an animal's performance un-
der different conditions. In a similar way, the noradrenergic locus coeruleus
and serotonergic raphe nuclei regulate levels of consciousness and mood.
These levels also vary within a range that is adaptive to the organism. In
the next several chapters, we will encounter these systems again in the
context of specific functions.
A
--
The Secretory Hypothalamus
homeostasis (p. 484)
periventricular zone (p. 484)
magnocellular neurosecretory cell
(p.485)
neurohormone (p. 485)
oxytocin (p. 485)
vasopressin (p.486)
antidiuretic hormone (ADH)
(p. 486)
parvocellular neurosecretory cell
(p. 488)
hypophysiotropic hormone
(p. 488)
The Autonomic Nervous
System
autonomic nervous system (ANS)
(p. 490)
sympathetic division (p. 490)
parasympathetic division (p. 490)
autonomic ganglia (p. 492)
postganglionic neuron (p. 492)
hypothalamo-pituitary portal
circulation (p. 488)
adrenal cortex (p. 488)
adrenal medulla (p. 488)
cortisol (p. 488)
\-
>-V>
wI:
a::
w
I-
I
.. CONCLUDING REMARKS 507
preganglionic neuron (p. 492)
sympathetic chain (p. 494)
enteric division (p. 495)
nucleus of the solitary tract
(p. 496)
The Diffuse Modulatory
Systems of the Brain
diffuse modulatory system
(p. 498)
locus coeruleus (p. 498)
raphe nuclei (p. 50 I )
basal forebrain complex (p. 503)
508 C HAP T E R I 5 . CHEMICAL CONTROL OF THE BRAIN AND BEHAVIOR
ltJ
., ""
(/)
z
w
0
>
w I-
a:. (/)
w
:J
a
I. Battlefield trauma victims who have lost large volumes of blood often express a craving to drink water. Why?
2. You've stayed up all night trying to meet a term paper deadline. You now are typing frantically. keeping one
eye on the paper and the other on the clock. How has the peri ventricular zone of the hypothalamus or-
chestrated your body's physiological response to this stressful situation? Describe in detail.
3. Why is the adrenal medulla often referred to as a modified sympathetic ganglion? Why isn't the adrenal
cortex included in this description?
4. A number of famous athletes and entertainers have accidentally killed themselves by taking large quantities
of cocaine. Usually, the cause of death is heart failure. How would you explain the peripheral actions of
cocaine?
5. How do the diffuse modulatory and point-to-point synaptic communication systems in the brain differ? List
four ways.
6. Under what behavioral conditions are the noradrenergic neurons of the locus coeruleus active? The nora-
drenergic neurons of the ANS?
6d
a:.
Wz
I-
1-0
a:. <
:Jw
LL.a:.
Carlsson A. 200 I. A paradigm shift in brain research.
Sdence 294:1021-1024.
Cooper JR, Bloom FE. Roth RH. 2002. The Biochemi-
cal Basis of NeuroPharmacology. New York: Oxford
University Press.
McEwen BS. 2002. Sex. stress and the hippocampus:
allostasis. allostatic load and the aging process.
Neurobiological Aging 23(5):921-939.
Meyer JS. Quenzer LF. 2004. Psychopharmacology:
Drugs, the Brain, and Behavior. Sunderland, MA:
Sinauer.
Wurtman RJ, Wurtman JJ. 1989. Carbohydrates and
depression. Scientipc American 260( I ):68-75.
Motivation
INTRODUCTION
THE HYPOTHALAMUS, HOMEOSTASIS, AND
MOTIVATED BEHAVIOR
THE LONG-TERM REGULATION OF FEEDING BEHAVIOR
ENERGY BALANCE
HORMONAL AND HYPOTHALAMIC REGULATION OF BODY FAT AND FEEDING
Body Fat and Food Consumption
. Box 16.1 Of Special Interest: The Starving Brains of the Obese
The Hypothalamus and Feeding
The Effects of Elevated Leptin Levels on the Hypothalamus
The Effects of Decreased Leptin Levels on the Hypothalamus
The Control of Feeding by Lateral Hypothalamic Peptides
THE SHOR"T-TERM REGULATION OF FEEDING BEHAVIOR
APPETITE, EATING, DIGESTION, AND SATIETY
Gastric Distension
Cholecystokinin
Insulin
. Box 16.2 Of Special Interest: Diabetes Mellitus and Insulin Shock
WHY DO WE EAT?
REINFORCEMENT AND REWARD
. Box 16.3 Of Special Interest: Self-Stimulation of the Human Brain
THE ROLE OF DOPAMINE IN MOTIVATION
. Box 16.4 Path of Discovery: Just Rewards, by Kent C. Berridge
. Box 16.5 Of Special Interest: Dopamine and Addiction
SEROTONIN, FOOD, AND MOOD
OTHER MOTIVATED BEHAVIORS
DRINKING
TEMPERATURE REGULATION
CONCLUDING REMARKS
CHAPTER
'"
5 I 0 C HAP T E R I 6 . MOTIVATION
T INTRODUCTION
Behavior happens. But why? In Parr U of this book, we discussed various
types of motor responses. At the lowest level are unconscious reflexes ini-
tiated by sensory stimulation-dilation of the pupils when the lights go out,
sudden removal of the foot from a thumbtack. and so on. At the highest
level are conscious movements initiated by the neurons of the frontal
lobe-for example, the finger movements that tap this text into the com-
puter. Voluntary movements are incited to occur-or motivated-in order to
satisfy a need. The motivation can be very abstract (the "need" to go sailing
on a warm and breezy summer afternoon), but it can also be quite concrete
(the need to go to the bathroom when your bladder is full).
Motivation can be thought of as a driving force on behavior. By analogy,
consider the driving force on sodium ions to cross the neuronal membrane
(an odd analogy, perhaps, but not for a neuroscience text). As we learned
back in Chapters 3 and 4, ionic driving force depends on a number of factors,
including the concentration of the ion on either side of the membrane and
the electrical membrane potential. Variations in driving force make trans-
membrane ionic current in a particular direction more or less likely. But
the driving force alone does not determine whether the current flows; the
transmembrane movement of ions also requires the appropriate gated ion
channels to be opened and capable of conducting the current.
Of course, human behavior will never be described by anything as simple
as Ohm's law. Still, it is useful to consider that the probability and direction
of a behavior will vary with the level of driving force to perform that behav-
ior. And while motivation may be required for a certain behavior, it does
not guarantee that behavior. The membrane analogy also allows us to high-
light the fact that a crucial part of the control of behavior is to appropri-
ately gate the expression of different motivated actions that have conflict-
ing goals-tapping on the computer keyboard versus spending the afternoon
sailing, for example.
Neuroscience cannot yet provide a concrete explanation for why the sail-
ing expedition was abandoned in favor of writing this chapter. However,
considerable progress has been made in understanding the motivation of
behaviors that are more basic to survival.
T THE HYPOTHALAMUS, HOMEOSTASIS,
AND MOTIVATED BEHAVIOR
The hypothalamus and homeostasis were introduced in Chapter 15. Recall
that homeostasis refers to the processes that maintain the internal environ-
ment of the body within a narrow physiological range. Although homeo-
static reflexes occur at many levels of the nervous system, the hypothalamus
plays a key role in the regulation of body temperature, fluid balance, and
energy balance.
The hypothalamic regulation of homeostasis starts with sensory trans-
duction. A regulated parameter (e.g., temperature) is measured by special-
ized sensory neurons, and deviations from the optimal range are detected
by neurons concentrated in the periventricular zone of the hypothala-
mus. These neurons then orchestrate an integrated response to bring the
parameter back to its optimal value. The response generally has three com-
ponents:
1. Humoral response: Hypothalamic neurons respond to sensory signals by
stimulating or inhibiting the release of pituitary hormones into the
bloodstream.
.. THE LONG-TERM REGULATION OF FEEDING BEHAVIOR 511
2. Visceromotor response: Neurons in the hypothalamus respond to sensory
signals by adjusting the balance of sympathetic and parasympathetic out-
puts of the autonomic nervous system (ANS).
3. Somatic motor response: Hypothalamic neurons (particularly within the
lateral hypothalamus) respond to sensory signals by inciting an appro-
priate somatic motor behavioral response.
You are cold, dehydrated, and depleted of energy. The appropriate humoral
and visceromotor responses kick in automatically. You shiver, blood is
shunted away from the body surface. urine production is inhibited, body
fat reserves are mobilized, and so on. But the fastest and most effective way
to correct these disturbances of brain homeostasis is to actively seek or gen-
erate warmth by moving, to drink water, and to eat. These are examples of
motivated behaviors generated by the somatic motor system, and they
are incited to occur by the activity of the lateral hypothalamus. Our goal in
this chapter is to explore the neural basis for this type of motivation. To
illustrate, we concentrate on a subject dear to our hearts: eating.
... THE LONG-TERM REGULATION
OF FEEDING BEHAVIOR
As you know, even a brief interruption in a person's oxygen supply can
lead to serious brain damage and death. You may be surprised to learn that
the brain's requirement for food, in the form of glucose, is no less urgent.
Only a few minutes of glucose deprivation will lead to a loss of conscious-
ness, eventually followed by death if glucose is not restored. While the
external environment normally provides a constant source of oxygen, the
availability of food is less assured. Thus, complex internal regulatory mech-
anisms have evolved to store energy in the body so that it is available
when needed. One primary reason we are motivated to eat is to keep these
reserves at a level sufficient to ensure that there will not be an energy
shortfall.
Energy Balance
The body's energy stores are replenished during and immediately after con-
suming a meal. This condition, in which the blood is filled with nutrients,
is called the prandial state (from the Latin word for "breakfast"). During this
time, energy is stored in two forms: glycogen and triglycerides (Figure
16.1). Glycogen reserves have a finite capacity, and they are found mainly
in the liver and skeletal muscle. Triglyceride reserves are found in adipose
(fat) tissue, and they have a virtually unlimited capacity. The assembly of
macromolecules such as glycogen and triglycerides from simple precursors
is called anabolism, or anabolic metabolism.
During the fasting condition between meals, called the postabsorptive
state, the stored glycogen and triglycerides are broken down to provide the
body with a continuous supply of the molecules used as fuel for cellular
metabolism (glucose for all cells; fatty acids and ketones for all cells other
than neurons). The process of breaking down complex macromolecules
is called catabolism, or catabolic metabolism; it is the opposite of an-
abo1ism. The system is in proper balance when energy reserves are re-
plenished at the same average rate that they are expended. If the intake
and storage of energy consistently exceed the usage, the amount of body
fat, or adiposity, increases, eventually resulting in obesity. (The word obese
is derived from the Latin word for "fat.") If the intake of energy consistently
/ /
:-
- \
\t Skeletal
I muscle
Liver Glycogen
512 C H APT E R 16 . MOTIVATION
y
Liver
I
Glycogen
Neurons
""" Glucose - , }
f :" Fattyaci ds : All cells
: Ketones
,
Neurons
, estines (full) I
, Absorbed
. t.. \ -nutrients
I Blood
, :J- ..:-J
I
Triglycerides
--'" y.....
/"
Adipose (fat) tissue
(a) Anabolism during the prandial state
Energy balance
Body fat
(a)
Intake", expenditure
Normal
(b)
Intake> expenditure
Obesity
(c) Imake < expenditure
Starvation
FIGURE ! 6.2
Energy balance and body fat. (a) Normal
energy balance leads to normal adiposity
(b) Prolonged positive energy balance leads
to obesity (c) Prolonged negative energy
balance leads to starvation.
Intestines (empty)
E
\
\\
Blood
j-
Triglycerides
Adipose (fat) tissue
(b) Catabolism during the postabsorptive state
FIGURE 16.1
Loading and emptying the body's energy reserves. (a) After a meal. when we are
in the prandial state, excess energy is stored as glycogen or triglycerides. (b) During the
time between meals, when we are in the postabsorptive state, the glycogen and triglycendes
are broken down (catabolized) into smaller molecules that can be used as fuel by the cells
of the body
fails to meet the body's demands, loss of fat tissue occurs, eventually result-
ing in starvation. Figure 16.2 summarizes the concept of energy balance
and body fat.
For the system to stay in balance, there must be some means of regulat-
ing feeding behavior, based on the size of the energy reserves and their rate
of replenishment. During recent decades, research has made substantial
progress in explaining the various means by which this regulation occurs-
and none too soon, because eating disorders and obesity are widespread
health problems. It is now apparent that there are multiple regulatory
mechanisms, some acting over a long period of time to maintain the body's
fat reserves, and others acting over a shorter time period to regulate meal
size and frequency. We begin our investigation by looking at long-term
regulation.
Hormonal and Hypothalamic Regulation
of Body Fat and Feeding
The study of the homeostatic regulation of feeding behavior has a long
history, but the pieces of the puzzle are only now falling into place. As we
will see, feeding is stimulated when neurons in the hypothalamus detect a
drop in the level of a hormone released by fat cells. These hypothalamic
cells are concentrated in the periventricular zone; those neurons that incite
feeding behavior are in the lateral hypothalamus.
Body Fat and Food Consumption. If you've ever dieted, you don't need
to be told that the body works hard to frustrate any efforts to alter adiposity.
.. THE LONG-TERM REGULATION OF FEEDING BEHAVIOR 513
You are not alone. As illustrated in Figure 16.3, a rat can be induced to lose
body fat by severely restricting its caloric intake. However, once free access
to food is restored, the animal will overeat until the original level of body
fat has fully returned. (Perhaps this sounds familiar.) But it also works the
other way around. Animals force-fed in order to gain fat mass, once given
the chance to regulate their own diet, will eat less until their fat levels return
to normal. The rat's behavioral response obviously is not a reflection of
vanity; it is a mechanism for maintaining energy homeostasis. The idea that
the brain monitors the amount of body fat and acts to "defend" this energy
store against perturbations, first proposed in 1953 by British scientist
Gordon Kennedy, is called the lipostatic hypothesis.
The connection between body fat and feeding behavior suggests that
there must be communication from adipose tissue to the brain. Immedi-
ately, a bloodborne hormonal signal was suspected, and this suspicion was
confirmed in the 1960s by Douglas Coleman and his colleagues at the
Jackson Laboratories in Bar Harbor, Maine, working with genetically obese
mice. The DNA of one strain of obese mouse lacks both copies of a gene
called ob (these mice are therefore called ob/ob mice). Coleman hypothe-
sized that the protein encoded by the ob gene is the hormone telling the
brain that fat reserves are normal. Thus, in the ob/ob mice that lack this
hormone, the brain is fooled into thinking that the fat reserves are low, and
the animals are abnormally motivated to eat. To test this idea, a parabiosis
experiment was performed. Parabiosis is the long-term anatomical and
physiological union of two animals, as in Siamese twins. Fusion can also be
achieved surgically, thereby resulting in parabiosed animals sharing a
common blood supply. Coleman and his colleagues found that when ob/ob
animals were parabiosed with normal mice, their feeding behavior and
obesity were greatly reduced, as if the missing hormone had been replaced
(Figure 16.4).
Then the search was on for the protein encoded by the ob gene. In
1994, a group of scientists led by Jeffrey Friedman at Rockefeller Univer-
sity finally isolated the protein, which they called leptin (from the
Greek for "slender"). Treating ob/ob mice with leptin completely reverses
the obesity and the eating disorder (Figure 16.5). The hormone leptin, re-
leased by adipocytes (fat cells), regulates body mass by acting directly on
neurons of the hypothalamus that decrease appetite and increase energy
expenditure.
Normal mouse
ob/ob mouse
Parabiosis
FIGURE 16.4
The regulation of body fat by a circulating hormone. If a genetically obese ob/ob
mouse is surgically fused with a normal mouse so that bloodborne signals are shared
between the animals, the obesity of the ob/ob mouse is greatly moderated.
Period of
starvation
r--"---,
Period of
forced feeding
9 500
:EO
.Q> 400
OJ
;:
>.
"V 300
o
ro
200
30 60 90 120 150 180
Time (days)
FIGURE 16.3
The maintenance of body weight
around a set value. Body weight is nor-
mally very stable. If an animal is force-fed, It
will gain weight However. the weight is lost as
soon as the animal can regulate its own food
intake. Similarly. weight lost during a period of
starvation is rapidly gained when food is freely
available.
514 CHAPTER 16 . MOTIVATION
<
Well-fed humans tend to focus on how increased leptin can fight obesity
(Box 16.1). However, more significant for survival is how leptin depletion
fights starvation. Leptin deficiency stimulates hunger and feeding, suppresses
energy expenditure, and inhibits reproductive competence-adaptive re-
sponses when food is scarce and energy reserves are low.
The Hypothalamus and Feeding. A. W. Hetherington and S. W. Ranson
of Northwestern University made the seminal discovery, published in
1940, that small lesions made on both sides of a rat's hypothalamus can
have large effects on subsequent feeding behavior and adiposity. Bilateral
lesions of the lateral hypothalamus caused anorexia, a severely diminished
appetite for food. In contrast, bilateral lesions of the ventromedial hypothal-
amus caused the animals to overeat and become obese (Figure 16.6). This
basic scenario applies to humans as well. Anorexia caused by damage to the
lateral hypothalamus is commonly referred to as the lateral hypothalamic
syndrome; overeating and obesity caused by lesions to the ventromedial
hypothalamus is called the ventromedial hypothalamic syndrome.
FIGURE 16.5
The reversal of obesity in ob/ob mice
by leptin. Both of these mice have a defect
in the ab gene that encodes the fat hormone
leptin. The animal on the right received daily
hormone replacement treatment, which
prevented the obesity that is apparent in the
animal on the left. (Source: Courtesy of John
SholtiS, Rockefeller University.)
Box 16.1
.... , .
..
..
OF SPECIAL INTEREST
The Starving Brains of the Obese
Like the ob/ob mouse, humans lacking leptin crave food.
have slowed metabolism. and are morbidly obese. For
these individuals. leptin replacement therapy can be a
"miracle cure" (Figure A). While mutations affecting the
leptin gene are rare. there is overwhelming evidence for
a genetic basis for most forms of human obesity. The
hereditability of obesity is equivalent to that of height. and
greater than that of many other conditions, including heart
disease and breast cancer. Many genes are involved, and
the search is on to discover them.
Obesity is a major human health problem. In the United
States. more than 60% of the population is overweight.
and millions are morbidly obese. The discovery of leptin
has reduced the stigma of obesity-it is a disease. not a
character flaw. Obese people are compelled to eat. They
experience intense cravings for food and at the same time
have slowed metabolism. In the case of leptin deficiency,
the brain and body respond as if the person is starving,
despite massive obesity.
Leptin also offered tremendous promise as a treatment
for obesity. By supplementing leptin, the logic went, the
brain could be fooled into decreasing appetite and in-
creasing metabolism. Unfortunately, other than the rare
individuals that congenitally lack the hormone, most obese
patients have failed to respond to leptin therapy. Indeed,
many have been found to have abnormally elevated blood
levels of leptin. It appears that the problem for these pa-
tients stems from decreased sensitivity of brain neurons
to the leptin circulating in the blood. The problem can
arise from decreased penetration of the leptin through
the blood-brain barrier, reduced expression of the leptin
10.
f
.
\
..
FIGURE A
The effect of hormone replacement in a leptin-deficient human.
Daily leptin treatment begun at age 5 (left) brought this girl's
weight down to a normal level. shown here at age 9 (right).
(Source: Gibson et 0.1.. 2004. p. 4823.)
receptor in the neurons of the periventricular hypothal-
amus, or altered CNS responses to changes in hypothala-
mic activity. Intensive efforts are now underway to identify
drug targets in the feeding circuits of the brain that are
downstream of leptin.
-
.. THE LONG-TERM REGULATION OF FEEDING BEHAVIOR 515
"
It
.,.
*"
..
"q. a""IIII',
'Or
-t..........."........fif
(a) Lateral hypothalamic
syndrome
It
"""111,
----
<'"
......u...."..
Normal
Lesions
of lateral
hypothalamus
It
...."11I1/.
\
......".........
,
(b) Ventromedial hypothalamic
syndrome
For a time, the idea that the lateral hypothalamus was a "hunger center"
acting in opposition to the ventromedial hypothalamus "satiety center" was
popular. Thus, lesions of the medial or lateral hypothalamus bring the
system out of balance. Destruction of the lateral hypothalamus leaves the
animals inappropriately satiated, so they do not eat; destruction of the
ventromedial hypothalamus leaves the animals insatiable, so they overeat.
However, this "dual center" model has proven to be overly simplistic. We
now have a better idea why hypothalamic lesions affect body fat and feed-
ing behavior-it has much to do with leptin signaling.
The Effects of Elevated Leptin Levels on the Hypothalamus. Although
stilI sketchy in places, a picture is beginning to emerge of how the hypo-
thalamus participates in body fat homeostasis. First let's consider the re-
sponse when leptin levels are high, as they are right after several days of
"forced" holiday feasting.
Circulating leptin molecules, released into the bloodstream by adipocytes,
activate leptin receptors on neurons of the arcuate nucleus of the hypo-
thalamus, which lies near the base of the third ventricle (Figure 16.7). The
arcuate neurons that are activated by a rise in blood leptin levels are char-
acterized by a distinctive mix of peptide neurotransmitter molecules. Most
appear to possess both aMSH and CART, and the levels of these pep tides in
the brain vary in proportion to the level of leptin in the blood. (To explain
the alphabet soup: Peptides are otten named by their first discovered func-
tion, and these names can lead to confusion when other roles are recog-
nized. Therefore, neuropeptides are usually referred to simply by their ab-
breviations. For the record, aMSH stands for alpha-melanocyte-stimulating
hormone, and CART stands for cocaine- and amphetamine-regulated transcript.
Like other neurotransmitters, the functional role of these molecules depends
on the circuits in which they participate.)
Now let's take a moment to consider the body's integrated response to
excessive adiposity (and high leptin levels). The humoral response consists of
increased secretion of thyroid-stimulating hormone (TSH) and adreno-
corticotropic hormone (ACTH) (see Table 15.1). These pituitary hormones
act on the thyroid and adrenal glands and have the effect of raising the
metabolic rate of cells throughout the body. The visceromotor response increases
FIGURE 16.6
Altered feeding behavior and body
weight resulting from bilateral lesions
of the rat hypothalamus. (a) The lateral
hypothalamic syndrome. characterIZed by
anorexia, is caused by lesions of the lateral
hypothalamus. (b) The ventromedial hypothal-
amic syndrome. characterized by obesity. is
caused by lesions of the ventromedial hypo-
thalamus.
516 C HAP T E R I 6 . MOTIVATION
I
(a)
T'
.-.
r- \
Third ventricle _ I
"\ -------+--- Paravenlricular 1
. . I nucleus
/ -' ........ - Hypothalamus
i ,- \ Lateral hypothalamic ---- I ,
- area '.
------ --
'f A eale "edee, ----r I
(b)
FIGURE 16.7
Hypothalamic nuclei important for the control of feeding. (a) A midsagittal view
of the human brain, showing the location of the hypothalamus. (b) A coronal section, taken
in the plane Indicated in part a, showing three important nuclei for the control of feeding:
the arcuate nucleus. the paraventncular nucleus, and the lateral hypothalamic area.
the tone of the sympathetic division of the ANS, which also raises meta-
bolic rate, in part by raising body temperature. The somatic motor response
decreases feeding behavior. The aMSH and CART neurons of the arcuate
nucleus project their axons directly to the regions of the nervous system
that orchestrate this coordinated response (Figure 16.8).
The humoral response is triggered by the activation of neurons in the
para ventricular nucleus of the hypothalamus, which in turn causes the
release of the hypophysiotropic hormones that regulate the secretion of TSH
and ACTH from the anterior pituitary (see Chapter L5). The paraventricu-
lar nucleus also controls the activity of the sympathetic division of the ANS
with direct axonal projections to neurons in the lower brain stem and to
preganglionic neurons in the spinal cord. However, there is also a direct
path for arcuate control of the sympathetic response: The aMSH and CART
neurons themselves project axons directly down to the intermediolateral
gray matter of the spinal cord. Finally, feeding behavior is inhibited via con-
nections of the arcuate nucleus neurons with cells in the lateral hypothal-
amus. We will take a closer look at the lateral hypothalamus in a moment.
The injection of aMSH or CART into the brain mimics the response to
elevated leptin levels. Thus, these are said to be anorectic peptides-they
diminish appetite. The injection of drugs that block the actions of these
peptides increases feeding behavior. These findings suggest that aMSH and
CART normally participate in the regulation of energy balance, in part by
acting as the brain's own appetite suppressants.
The Effects of Decreased Leptin Levels on the Hypothalamus. In ad-
dition to turning off the responses mediated by aMSH and CART neurons,
a fall in leptin levels actually stimulates another type of arcuate nucleus
neuron. These neurons contain their own mix of peptides: NPY (neuropep-
tide Y) and AgRP (agouti-related peptide). The NPY and AgRP neurons of the
arcuate nucleus also have connections with the paraventricular nucleus
and the lateral hypothalamus (Figure 16.9). But the effects of these neu-
ropeptides on energy balance are the opposite of the effects of aMSH and
CART. NPY and AgRP inhibit the secretion of TSH and ACTH, they activate
-
Third
ventricle
Paraventricular nucleus
I
...
....... '\
.... \
... .
...
. . . "'\:
.
. .
Inhibit
feeding
behavior
aMSH/CART neurons
of arcuate nucleus
Stimulate release
of ACTH and
thyrotropin from
anterior pituitary
Activate brain stem neurons
and preganglionic neurons
of sympathetic ANS
Third
ventricle
I- Paraventricular nucleus
...
.......
....
... .
...
..
.
Inhibit secretion of
hypophysiotropic hormones
controlling ACTH and TSH
.
. .
.
. . .
0 . . .
.
o
Stimulate
/ ,; feeding
/j be""""
... . NPY/AgRP neurons
. .. . of arcuate nucleus
... ..
... .
.
.
Lateral
hypothalamic
/area
.
.
.
/
Lateral
hypothalamic
area
/
.... THE LONG-TERM REGULATION OF FEEDING BEHAVIOR 517
FIGURE 16.8
The response to elevated leptin levels. A rise in leptin
levels In the blood is detected by neurons in the arcuate
nucleus that contain the pep tides o.MSH and CART. These
neurons project axons to the lower brain stem and spinal
cord. the paraventricular nuclei of the hypothalamus, and
the lateral hypothalamic area. Each of these connections
contributes to the coordinated humoral, visceromotor, and
somatic motor responses to increased leptin levels.
(Source: Adapted from Sawchenko. 1998. p. 437.)
FIGURE 16.9
The response to decreased leptin levels. A reduction
in blood levels of leptin is detected by neurons in the arcuate
nucleus that contain the peptides NPY and AgRP. These arcu-
ate nucleus neurons inhibit the neurons in the paraventricular
nuclei that control the release ofTSH and ACTH from the
pituitary. In addition, they activate the neurons in the lateral
hypothalamus that stimulate feeding behavior. Some of the
activated lateral hypothalamic neurons contain the peptide
MCH (melanin-concentrating hormone).
5 , 8 C HAP T E R I 6 . MOTIVATION
+ Leptin
0/
\! aMSH
AgRP T
MC4 receptor
on neuron in lateral
hypothalamic area
Inhibit feeding
behavior
FIGURE 16.10
Competition for activation of the MC4
receptor. One way that aMSH, an anorectic
peptide, and AgRP. an orexigenic peptide,
exert opposite effects on metabolism and
feeding behavior IS via an interaction with
the MC4 receptor on some hypothalamic
neurons. While aMSH stimulates the MC4
receptor. AgRP blocks the action of aMSH
at the receptor.
the parasympathetic division of the ANS, and stimulate feeding behavior. They
are therefore referred to as orexigenic pep tides (from the Greek for" ap-
petite") .
AgRP and aMSH literaJly are antagonistic. Both pePtides bind to the same
receptor, called the MC4 receptor. Whereas aMSH is the receptor's agonist,
AgRP is a natural antagonist that blocks the stimulation of aMSH. Activa-
tion of MC4 receptors on lateral hypothalamic neurons inhibits feeding;
blocking the receptors stimulates feeding (Figure 16.10).
The Control of Feeding by Lateral Hypothalamic Pep tides. We now
come to the mysterious lateral hypothalamus, which appears to have a
special role in motivating us to eat. Because this region of the brain is not
organized into weH-defined nuclei, it has the undistinctive name lateral
hypothalamic area (see Figure 16.7). As mentioned earlier, the first in-
dication that the lateral hypothalamus is involved in motivating feeding
behavior was that a lesion here causes animals to stop eating. Moreover,
electrical stimulation of this area triggers feeding behavior, even in sati-
ated animals. These basic findings apply to all mammals that have been ex-
amined (including humans). Unfortunately, interpreting these findings
has proven to be difficult. One problem is that lesions and electrical stim-
ulation not only affect the neurons with cell bodies in this region, they
also affect many different axonal pathways passing"through the lateral
hypothalamus. It is now apparent that both neurons intrinsic to the lat-
eral hypothalamus and axons passing through the lateral hypothalamus
contribute to the motivation of feeding behavior. However, for now, we
concentrate on the role of the neurons within the lateral hypothalamic
area.
One group of neurons in the lateral hypothalamus that receives direct
input from the leptin-sensitive cells of the arcuate nucleus has yet another
peptide neurotransmitter called MCR (melanin-concentrating hormone). These
cells have extremely widespread connections in the brain, including direct
monosynaptic innervation of most of the cerebral cortex. The cortex is in-
volved in organizing and initiating goal-directed behaviors, such as raiding
the refrigerator. The MCH system is in a strategic position to inform the cor-
tex of leptin levels in the blood and therefore could contribute significantly
to motivating the search for food. Supporting this idea, the injection of
MCH into the brain stimulates feeding behavior. Moreover, mutant mice
that lack this peptide exhibit reduced feeding behavior, have an elevated
metabolic rate, and are lean.
Recently, a second population of lateral hypothalamic neurons with
widespread cortical connections has been identified, containing another
peptide caHed orexin. These cells also receive direct inputs from the arcuate
nucleus. As is the case for MCR, and as the name suggests, orexin is an
orexigenic peptide (i.e., it stimulates feeding behavior). The levels of both
MCH and orexin rise in the brain when leptin levels in the blood {all.
To conclude this section, let's briefly summarize hypothalamic responses
to blood leptin levels (Table 16.1). Remember, leptin levels rise when body
fat is increased, and they fall when body fat is decreased:
. A rise in leptin levels increases aMSH and CART in arcuate nucleus neu-
rons. These anorectic pep tides act on the brain to inhibit feeding behav-
ior and increase metabolism.
. A fall in leptin levels increases NPY and AgRP in the arcuate nucleus and
MCH in the lateral hypothalamic area. These orexigenic peptides act on
the brain to stimulate feeding behavior and decrease metabolism.
'Y THE SHORT-TERM REGULATION OF FEEDING BEHAVIOR 519
Table 16.1 Anorectic and Orexigenic Peptides of the Hypothalamus
ANORECTIC PEPTIDES:
INHIBIT FEEDING BEHAVIOR
ABBREVIATION FULL NAME
OREXIGENIC PEPTIDES:
STIMULATE FEEDING BEHAVIOR
ABBREVIATION FULL NAME
LOCATION
aMSH
Arcuate nucleus NPY
Alpha-melanocyte-
stimulating hormone
Cocaine- and
amphetamine-regulated
transcript
Arcuate nucleus AgRP
peptide
CART
MCH
... THE SHOR"T-TERM REGULATION
OF FEEDING BEHAVIOR
Regulation of the tendency to seek and consume food by the body's levels
of leptin is very important, but it is not the whole story. Even setting aside
social and cultural factors (such as a mother's command: "Eat!"), we all
know that the motivation to eat depends on how long it has been since the
last meal and how much we ate at that time. Moreover, the motivation to
continue eating once a meal starts depends on how much food (and what
type) has already been eaten. These are examples of what we are calling
the short-term regulation of feeding behavior.
A useful way to think about this regulatory process is if we imagine that
the drive to eat, which may vary rather slowly with the rise and fall of
leptin, is increased by orexigenic signals generated in response to a period
of fasting and is inhibited by satiety signals that occur when we eat and
begin the process of digestion (i.e., the prandial period). These satiety sig-
nals both terminate the meal and inhibit feeding for some time afterward.
During this postabsorptive (fasting) period, the satiety signals slowly dissi-
pate, and the orexigenic signals build, until the drive to eat again takes
over (Figure 16.11). Let's use this model to explore the biological basis for
the short-term regulation of feeding behavior.
Appetite, Eating, Digestion, and Satiety
You have awakened in the morning after a long night's slumber. You come
to the kitchen to find pancakes cooking on the stove; when they are ready,
you enthusiastically eat them until you're satiated. Your body's reactions
during this process can be divided into three phases: cephalic, gastric, and
substrate (also called the intestinal phase):
1. Cephalic phase: The sight and smell of the pancakes trigger a number of
physiological processes that anticipate the arrival of breakfast. The
parasympathetic and enteric divisions of the ANS are activated, causing
the secretion of saliva into your mouth and digestive juices into your
stomach.
Neuropeptide Y
Agouti-related
Melanin-concentrating
hormone
Orexin
LOCATION
Arcuate nucleus
Arcuate nucleus
lateral
hypothalamic
area
Lateral
hypothalamic
area
520 C H A PT E R 16 . MOTIVATION
-
IF
\ A)
Orexigenic
and satiety
signals
Food consumption
Satiety signals
.-. /
'.
, '.
, .
. .........
Orexigenic signals
o
.;;;
ro
J::
OJ
.0
OJ
c
'6
OJ
OJ
LL
............
.
'.
I-- Meal -..j
Time
FIGURE 16.11
A hypothetical model for the short-term regulation of feeding behavior.
This graph shows a possible means of regulating food consumption by satiety signals. Satiety
signals rise in response to feeding. When satiety signals are high, food consumption is inhib-
ited. When the satiety signals fall to zero, the inhibition is eliminated. and food consumption
ensues.
2. Gastric phase: These responses grow much more intense when you start
chewing, swallowing, and filling your stomach with food.
3. Substrate phase: As your stomach fills and the partially digested pancakes
move into your intestines, nutrients begin to be absorbed into your
bloodstream.
You don't need to be told that the meal begins because you are hungry.
Until recently, scientists believed that hunger was merely the absence of
satiety. This view changed in 1999 with the discovery of a peptide called
ghrelin. Ghrelin was isolated originally as a factor that stimulates growth
hormone release. However, researchers quickly found that the peptide is
highly concentrated in the stomach and is released into the bloodstream
when the stomach is empty. Intravenous administration of ghrelin strongly
stimulates appetite and food consumption by activating the NPY- and
AgRP-comaining neurons of the arcuate nucleus. Removal of the ghrelin-
secreting cells of the stomach is thought to cause the loss of appetite expe-
rienced by patients who have undergone gastric surgery for the treatment
of obesity.
The meal ends by the concerted actions of several satiety signals, three
of which we consider below: gastric distension, the release of the gastroin-
testinal peptide cholecystokinin, and the release of the pancreatic hormone
insulin.
Gastric Distension. We all know what it is like to feel "full" after a big
meal; as you might expect, the stretching of the stomach wall is a power-
ful satiety signal. The stomach wall is richly innervated by mechanosensory
axons, and most of these ascend to the brain via the vagus nerve. Recall
from the appendix to Chapter 7 that the vagus nerve (cranial nerve X) con-
tains a mixture of sensory and motor axons, originates in the medulla, and
meanders through much of the body cavity (vagus is from the Latin for
"wandering"). The vagal sensory axons activate neurons in the nucleus of the
solitary tract in the medulla. These signals inhibit feeding behavior.
You may have noticed that the nucleus of the solitary tract bas been
mentioned several times in different contexts. The gustatory nucleus, which
.. THE SHORT-TERM REGULATION OF FEEDING BEHAVIOR 521
receives direct sensory input from the taste buds (Chapler 8), is actually a
subdivision of the nucleus of the solitary tract. The nucleus of the solitary
tract is also an important center in the control of the ANS (Chapter 15).
Now we find that the same nucleus receives visceral sensory input from the
vagus nerve. It is easy to see how a nucleus with such widespread con-
nections could serve as an important integration center in the control of
feeding and metabolism. As you know, satiety induced by a full stomach
can be delayed Quite a while if what you are eating is tasty enough.
Cholecystokinin. In the 1970s, researchers discovered that the adminis-
tration of the peptide cholecystokinin (CCK) inhibits meal frequency
and size (without causing the experimental animals to get sick). CCK is
present in some of the cells that line the intestines and in some of the
neurons of the enteric nervous system. It is released in response to stimu-
lation of the intestines by certain types of food, especially fatty ones. The
major action of CCK as a satiety peptide is exerted on the vagal sensory
axons. CCK acts synergistically with gastric distension to inhibit feeding
behavior (Figure 16.12). Curiously, CCK like many other gastrointestinal
pep tides, is also contained within selected populations of neurons within
the CNS.
) c ,
A)
Insulin. Released into the bloodstream by the 13 cells of the pancreas, insulin
is a vitally important hormone (Box 16.2). Although glucose is always
readily transported into neurons, glucose transport into the other cells of the
body requires insulin. This means that insulin is important for anabolic metab-
olism, when glucose is transported into liver, skeletal muscle, and adipose
cells for storage, as well as for catabolic metabolism. when the glucose lib-
erated from storage sites is taken up as fuel by the other cells of the body.
Thus, the level of glucose in the blood is tightly regulated by the level of
insuli : Blood glucose levels are elevated when insulin levels are reduced;
blood glucose levels fall when insulin levels rise.
Box 16.2
.... 1 ..
FIGURE 16.12
The synergistic action of gastric dis-
tension and CCK on feeding behavior.
Both signals converge on axons in the vagus
nerve that trigger satiety.
..
OF SPECIAL INTEREST
...
.. Diabetes Mellitus and Insulin Shoel"
Insulin, released by the 13 cells of the pancreas, plays a
pivotal role in maintaining energy balance. After a meal,
glucose levels in the blood rise. To be used by the cells of
the body, glucose must be shuttled across the plasma
membrane by specialized proteins called glucose trans-
porters. In all cells other than neurons, the insertion of
glucose transporters into the membrane occurs when
insulin binds to cell surface insulin receptors. Thus, for the
glucose to be utilized or stored by these cells, a rise in
blood insulin levels must accompany the rise in blood
glucose leve!s. In the clinical condition known as diabetes
mellitus. defects in insulin production and release, or in the
cellular response to insulin, prevent the normal reaction
to elevated glucose. The consequence is elevated blood
sugar levels (hyperglycemia), because the glucose absorbed
from the intestines cannot be taken up by the cells of the
body (other than neurons). The excess glucose passes to
the urine, making it sweet. Indeed, the disorder's name is
from the Latin for "siphoning honey."
An effective treatment for many types of diabetes me!-
litus is hypodermic injections of insulin. However, this
treatment is not without risks. An overdose of insulin
causes blood glucose levels to plummet (hypoglycemia),
starving the neurons of the brain. The resulting condition
is called insulin shock, characterized by sweating, tremor,
anxiety, dizziness, and double vision. If it is not corrected
promptly, these early signs are followed by delirium, con-
vulsions, and loss of consciousness. The sudden neurolog-
ical response to hypoglycemia iUustrates how vital energy
balance is for the normal functioning of the brain.
522 C H A PT E R 16 . MOTIVATION
Cephalic phase
j Gastric phase
! r Substrate phase
1
(j)
>
C
::J
UJ
C
"D
o
o
as
Food Food
presented eaten
Time -----.
FIGURE 16.13
Changes in blood insulin levels
before, during, and after a meal.
(Source: Adapted from Woods and Stricker.
1999, p. 1094.)
/'
f
o \0-0-
o
,.
\
FIGURE 16.14.
Electrical self-stimulation by a rat.
When the rat presses on the lever. it receives
a bnef electrical current to an electrode In
its brain.
Insulin release by the pancreas is conrrolIed in a number of ways (Fig-
ure 16.13). Let's consider the example of your pancake breakfast. During
the cephalic phase, when you are anricipating food, the parasympathetic
innervation of the pancreas (delivered by the vagus nerve) stimulates the
13 cells to release insulin. In response, blood glucose levels fall slightly, and
this change, detected by the neurons of the brain, increases your drive to
eat (in part, by activation of the NPY neurons of the arcuate nucleus). Dur-
ing the gastric phase, when food enters your stomach, insulin secretion is
stimulated further by gastrointestinal hormones, such as CCK. Insulin re-
lease is maximal when the food is finally absorbed in the intestines. and
blood glucose levels rise, during the substrate phase. Indeed, the primary
stimulus for insulin release is increased blood glucose levels. This rise in
insulin, coupled with the elevated blood glucose levels, is a satiety signal
and causes you to stop eating.
In contrast to the other satiety signals we've discussed, which communi-
cate with the brain mainly via the vagus nerve, bloodborne insulin acts to
inhibit feeding behavior by acting directly on the arcuate and ventromedial
nuclei of the hypothalamus. It appears that insulin acts in much the same
way as leptin to regulate feeding behavior.
... WHY DO WE EAT?
We have talked about the signals that motivate feeding behavior, but we
still have not discussed what that really means in psychological terms. Ob-
viously, we eat because we like food. This aspect of motivation is hedonic: It
feels good, so we do it. We derive pleasure from the taste, smell, sight, and
feel of the food, and from the act of eating. However, we also eat because
we are hungry and we want food. This aspect of motivation can be consid-
ered as a drive reduction: satisfying a craving. A reasonable assumption is
that "liking" and "wanting" are two aspects of a unified process; after alI,
we typically crave food that we like. However, research on humans and an-
imals suggests that liking and wanting are mediated by separate circuits in
the brain.
Reinforcement and Reward
In the early 1950s, James aIds and Peter Milner at the California Institute
of Technology conducted an experiment in which a rat had an electrode
implanted in its brain, so the brain could be locally stimulated at any time.
The rat freely roamed about in a box about 3 ft2. Each time the rat went
to a certain corner of the box, the brain was stimulated. After the first stim-
ulation, the rat walked away but quickly returned and was again stimu-
lated. Soon the rat was spending all of its time in the corner, apparently
seeking the electrical stimulation. In a brilliant twist on this experiment,
aids and Milner set up a new box for the rat containing a lever that would
deliver a brief stimulus to the brain when stepped on (Figure 16.14). At
first the rat wandered about the box and stepped on the lever by accident,
but before long it was pressing the lever repeatedly. This behavior is called
electrical self-stimulation. Sometimes the rats would become so in-
volved in pressing the lever that they would shun food and water, stopping
only after collapsing from exhaustion (Box 16.3).
Electrical self-stimulation apparently provided a reward that reinforced the
habit to press the lever. By systematicalIy moving the stimulating electrode
to different regions of the brain, researchers were able to identify specific
sites that were reinforcing. It became apparent that the most effective sites
for self-stimulation felI along the trajectory of dopaminergic axons arising
WHY DO WE EAT! 523
i \- '-
Basal forebrain
area
\1 \ J
/
/\
Ventral tegmental area
'-
),-
,
i)
"' '\
I'
,
/
-,
"
. \
/
"
FIGURE 16.15
The mesocorticolimbic dopamine system. Animals are motivated to behave in ways
that stimulate the release of dopamine in the basal forebrain area.
in the ventral tegmental area and projecting to the forebrain (Figure 16.15).
Drugs that block dopamine receptors also reduced self-stimulation, sug-
gesting that the animals were working to stimulate the release of dopamine
in the brain. Moreover, researchers discovered that animals will lever-press
to receive an injection of amphetamine, a drug that releases dopamine in
the brain. Although there is more to electrical self-stimulation than
dopamine, there is little question that dopamine release in the brain will
reinforce the behavior that causes it.
These experiments suggested a mechanism by which natural rewards
(food, water, sex) reinforce particular behaviors. Indeed, a hungry rat will
press a lever to receive a morsel of food, and this response is also greatly
reduced by dopamine receptor blockers. Microelectrode recordings have
been made from dopaminergic neurons in the ventral tegmental area as
animals learn the association between a sensory stimulus (such as a light)
and food. Initially, the neurons are strongly activated when the food arrives.
However, with some experience, the neurons are excited instead when the
light goes on. It's as if the cells are saying "Yes!" at the sight of the stimulus
that predicts reward.
The Role of Dopamine in Motivation
For many years, this dopamine projection, from the ventral tegmental area
to the basal forebrain area, was believed to serve hedonic reward-in other
words, pleasure. In the case of feeding, it was believed that dopamine was
released in response to palatable foods, making the sensation pleasurable.
Animals were motivated to seek palatable food for the hedonic reward: a
squirt of dopamine in the forebrain.
However, this simple idea has been challenged in the last several years.
Kent Berridge at the University of Michigan discovered that destruction of
the dopamine axons passing through the lateral hypothalamus fails to
reduce the hedonic responses to food, even though animals stop eating
(Box 16.4). If a tasty morsel is placed on the tongue of a rat that has sus-
tained such a lesion, the animal will stilI behave as if the food evokes a
524 . C HAP T E R I 6 . MOTIVATION
Box 16.3
.... , ....
,.
OF SPECIAL INTEREST
I Self-Stimulation of the Human Brain
To determine the sensations evoked by brain stimulation,
it would be desirable to stimulate a person's brain and ask
how it feels. Obviously, this is not normally feasible or
ethical. However. as treatments of last resort for debili-
tating medical conditions, humans have occasionally been
fitted with intracranial electrodes they can self-stimulate.
Let's consider two patients studied by Robert Heath at
the Tulane University School of Medicine in the I 960s.
The first patient had severe narcolepsy; he would
abruptly go from being awake into a deep sleep. (Nar-
colepsy and sleep will be discussed in Chapter '9.) The
condition significantly interfered with his life and obvi-
ously made it difficult to hold a job. He was fitted with '4
electrodes in different areas of the brain in the hope of
finding a self-stimulation site that might keep him alert.
When he stimulated his hippocampus. he reported feeling
mild pleasure. Stimulation of his midbrain tegmentum
made him feel alert but unpleasant. The site he chose to
frequently self-stimulate was the septal area of the fore-
brain (Figure A). Stimulating this area made him more
alert and gave him a good feeling, which he described as
building up to orgasm. He reported that he would some-
times push the button over and over, trying unsuccessfully
to achieve orgasm, ultimately ending in frustration.
The second patient's case is a bit more complex. This
person had electrodes implanted at 17 brain sites in the
hope of learning something about the location of his severe
epilepsy. He reported pleasurable feelings with stimulation
of the septal area and the midbrain tegmentum. Consis-
tent with the first case above, septal stimulation was as-
sociated with sexual feelings. The midbrain stimulation
gave him a "happy drunk" feeling. Other mildly positive
feelings were produced by stimulation of the amygdala
and caudate nucleus. Interestingly, the site that was most
frequently stimulated was in the medial thalamus, even
though stimulation here induced an irritable feeling, one that
was less pleasurable than stimulation at other locations.
The patient stated that the reason he stimulated this area
the most was that it gave him the feeling he was about to
recall a memory. He repeated the stimulation in a futile
attempt to fully bring the memory into his mind, even
though, in the end, this process proved to be frustrating.
These two specific cases and many others suggest that
self-stimulation is not always synonymous with pleasure.
There is often some reward or anticipated reward asso-
ciated with the stimulation. but the experience is not
always pleasant.
Lateral ventricle
'--
-.
\t;/"
/
Septal area
i:
FIGURE A
The septal area, a site of electrical self-stimulation in humans, is
In the rostral forebrain below the lateral ventricie.
pleasurable sensation (the rat equivalent of lip smacking), and the morsel
will be consumed. The dopamine-depleted animal behaves as though it likes
food but does not want food. The animal apparently lacks the motivation
to seek food, even though it seems to enjoy food when it is available. Con-
versely, stimulation pf the dopamine axons in the lateral hypothalamus of
normal rats appears to produce a craving for food without increasing the
food's hedonic impact. Not surprisingly, recent research on the cravings as-
sociated with addiction (to drugs and alcohol, as well as to clwcolate) has
focused on the role of this dopaminergic pathway (Box 16.5).
Serotonin, Food, and Mood
Mood and food are connected. Consider how grouchy you are when you're
on a restricted diet, or your sense of well-being that accompanies a whiff
-
Box 16.4
PATH OF DISCOVERY
Ii"
' n .
-i
.
Just Rewards
The idea that there are separate brain systems for "liking"
and "wanting" the same pleasant reward came from a set
of failed experiments. Sometimes when an experiment
fails to give you an expected answer, it can mean you
were asking the wrong question. In my case with Terry
Robinson and other colleagues at the University of Michi-
gan, we were asking whether reward was mediated by the
neurotransmitter dopamine. That turned out to be too
simple a question, as it can be answered either yes or no
depending on what reward means.
Pleasure or hedonic impact is what most people mean
by reward, and for many neuroscientists who had asked
the dopamine reward question before us, the answer gen-
erally seemed to be yes. But most previous behavioral
neuroscience studies had inferred that DA manipulations
changed how much a reward was "liked" (hedonic impact)
by changes in how much the reward was "wanted" (pre-
ferred, pursued, worked for, or consumed). Our approach
was a bit different in that we tried to assess dopamine-
caused changes in hedonic impact more specifically by
measuring facial "liking" reactions to sweet taste reward.
This ethological window into taste pleasure can detect
"liking" shifts in rats produced by hunger/satiety, learned
preference/aversion, and many brain manipulations. Using
our "liking" reaction technique, we were surprised to find
in our first experiments that blocking DA systems caused no
change in the hedonic impact of a tasty reward (Figure A).
At first, we thought we had done something wrong,
as most neuroscientists, after all, were pretty sure that
mesolimbic dopamine was the brain's chief pleasure neu-
rotransmitter. So we followed up with stronger manipula-
tions-dopamine brain lesions, electrical stimulation, direct
brain microinjections, and others. But always we found
that "liking" for sweetness remained unchanged. Because
we could successfully change "liking" by manipulating other
brain limbic systems, the failure of DA to alter hedonic
impact of sensory pleasure stood in stark contrast.
Our surprising "failure" meant one of two things. Either
the universe was cruelly telling us we didn't have a clue,
or it might be telling us something important-that is, if
we could solve the paradox of why the DA reward ques-
tion had both yes and no answers. We came up with the
incentive salience hypothesis for dopamine's role in "wanting"
reward as a way to reconcile why brain DA sometimes
appears to mediate sensory pleasure when it actually
does not. Incentive salience "wanting" is purely the incen-
tive motivational value of a stimulus, not its hedonic im-
pact or actual sensory pleasure.
-
by Kent C. Berridge
In human life beyond the lab, Terry Robinson and I think
the dissociation between "wanting" and "liking" brain sys-
tems may help explain what happens in some drug addicts
to make their addiction compulsive. Fortunately for most
people, both "liking" and "wanting" usually happen together
for rewards in life. But some addicts may have sensitized
brains, which involves persistent neural changes caused by
addictive drugs in dopamine-related mesocorticolimbic
systems. Brain sensitization is nearly the opposite of brain
tolerance to drugs-both can happen simultaneously in
the same brain, but sensitization lasts longer. The result
of sensitization may be a bit like too much dopamine:
excessive "wanting:' even if the drug isn't particularly
"liked," and even if withdrawal symptoms are long gone.
Looking back to my own neuroscience beginnings as an
undergraduate student, I was fascinated by the idea that
mind and behavior could be emergent products of a brain.
Links between mind and brain are intricate, subtle, and
often surprising. For many people who do neuroscience
research, the excitement stays even over decades. If you
have a taste for scientific research in neuroscience and
psychology, being a part of it can be deeply fun and satis-
fying. And for everyone else, too, neuroscience can offer
a few fascinating insights into the machinery of mind and
brain that may help us understand ourselves and others a
bit better.
Positive reactions to sweet
. .,
" .
,
Negative reactions to bitter
-
-, 0
.. 0
......
:::----
FIGURE A
Reactions to taste "liking." (Courtesy of Kent C. Berridge.)
526 CHAPTER 16 . MOTIVATION
Box 16.5
.... t ...
OF SPECIAL INTEREST
# ..",
:ii"
,
Dopamine and Addiction
What do the drugs heroin, nicotine, and cocaine have in
common? They act on different neurotransmitter systems
in the brain-heroin on the opiate system, nicotine On
the cholinergic system, and cocaine on the dopaminergic
and noradrenergic systems-and they produce different
psychoactive effects. However, all three drugs are highly
addictive. This common quality is explained by the fact
that they all act on the brain circuitry that motivates be-
havior-in this case, drugcseeking behavior. We can learn
much about the brain mechanisms of motivation by study-
ing drug addiction, and vice versa.
Rats, like humans, will self-administer drugs and will
develop clear signs of drug dependence. Studies using
microinfusions of drugs directly into the brain have mapped
out the sites where the drugs cause addiction. In the case
of heroin and nicotine, the key site of actIon is the ven-
tral tegmental area, home of the dopamine neurons that
project axons through the lateral hypothalamus to the
forebrain. These dopaminergic neurons have both opiate
and nicotinic acetylcholine receptors. In the case of cocaine,
a key site of action is the nucleus accumbens, one of the
major targets of the ascending dopaminergic axons in the
forebrain (Figure A). Recall from Chapter 15 that cocaine
prolongs the actions of dopamine at its receptors. Thus,
these three drugs either stimulate dopamine release
(heroin. nicotine) or enhance dopamine actions (cocaine)
in the nucleus accumbens.
The exact role of dopamine in motivating behavior
continues to be debated. However, much evidence sug-
gests that animals are motivated to perform behaviors
Parasagiltal section of rat brain
Nicotine
FIGURE A
Addictive drugs act on the dopaminergic pathway f om the
ventral tegmental area to the nucleus accumbens.
(Source: Adapted from Wise. 1996. p. 248. Fig. I.)
that stimulate dopamine release in the nucleus accumbens
and related structures. Behaviors associated with the de-
livery of drugs that act to stimulate dopamine release are
therefore strongly reinforced. However, chronic overstim-
ulation of this pathway causes a homeostatic response:
The dopamine "reward" system is down-regulated. This
adaptation leads to the phenomenon of drug tolerance-it
takes more and more of the drug to get the desired (or
required) effect. Indeed, drug discontinuation in addicted
animals is accompanied by a marked decrease in dopamine
release and function in the nucleus accumbens. And, of
course, one withdrawal symptom is the powerful craving
for the discontinued drug.
and a bite of a freshly baked chocolate chip cookie. As mentioned in
Chapter 15, one system in the brain involved in the control of mood uses
serotonin as a neurotransmitter. Serotonin provides one of the links between
food and mood.
Measurements of serotonin in the hypothalamus reveal that levels are
low during the postabsorptive period, they rise in anticipation of food, and
they spike during a meal, especially in response to carbohydrates (Figure
16.16). Serotonin is derived from the dietary amino acid tryptophan, and
tryptophan levels in the blood vary with the amount of carbohydrate in the
diet (see Box 15.2). The rise in blood tryptophan, and brain serotonin, is
one likely explanation for the mood-elevating effects of a chocolate chip
cookie. This effect of "carbs" on mood is particularly evident during periods
of stress-possibly explaining the food-seeking behavior, and weight gain.
of the typical first-year college student.
It is interesting to note that drugs that elevate serotonin levels in the
brain are powerful appetite suppressants. One of these drugs is dexfenflu-
ramine (trade name Redux), which was used successfully as a treatment
for human obesity. Unfortunately, the drug had toxic side effects, leading
to its withdrawal from the market in 1997.
Abnormalities in brain serotonin regulation are believed to be one factor
that contributes to eating disorders. The defining characteristic of anorexia
nervosa is the voluntary maintenance of body weight at an abnormally
low level, while bulimia nervosa is characterized by frequent eating
binges, often compensated for by forced vomiting. These disorders are also
commonly accompanied by depression. a severe disturbance of mood that
has been linked to lowered brain serotonin levels (we will discuss mood
disorders in Chapter 22). The serotonin connection is clearest in the case
of bulimia. In addition to depressing mood, lowered serotonin levels reduce
satiety. Indeed, antidepressant drugs that act to elevate brain serotonin
levels (e.g., fluoxetine, or Prozac) are also an effective treatment for the
majority of bulimia nervosa patients.
'Y OTHER MOTIVATED BEHAVIORS
We have used eating and the regulation of energy balance to give you a
fairly detailed picture of the brain mechanisms that incite behavior. The
systems involved in motivating several other behaviors that are basic for
survival have also been intensively studied. Although we will not cover
these other systems in depth, a quick overview will show that the basic
principles are the same as those for eating. We will see that the transduc-
tion of physiological stimuli in the blood occurs in specialized regions of the
hypothalamus, that humoral and visceromotor responses are initiated by
activation of the periventricular and medial hypothalamus, and that be-
havioral action depends on the lateral hypothalamus.
Drinking
Two different physiological signals stimulate drinking behavior. As mentioned
in Chapter 15, one of these is a decrease in blood volume, or hypovolemia.
The other is an increase in the concentration of dissolved substances
(solutes) in the blood, or hypertonicity. These two stimuli trigger thirst by
different mechanisms.
Thirst triggered by hypovolemia is called volumetric thirst. In Chapter
15, we used the example of decreased blood volume to illustrate when and
how vasopressin is released in the posterior pituitary by the magnocellular
neurosecretory cells. Vasopressin (also called antidiuretic hormone, or ADH)
acts directly on the kidneys to increase water retention and inhibit urine
production. The release of vasopressin associated with volumetric thirst is
triggered by two types of stimuli (Figure 16.17). First, a rise in blood lev-
els of angiotensin II occurs in response to reduced blood flow to the kid-
neys (see Figure 15.5). The circulating angiotensin II acts on the neurons
of the subfornical organ in the telencephalon, which in turn directly stim-
ulate the magnocellular neurosecretory cells of the hypothalamus to release
vasopressin. Second, mechanoreceptors in the walls of the major blood ves-
sels and heart signal the loss of blood pressure that accompanies a loss of
blood volume. These signals make their way to the hypothalamus via the
vagus nerve and the nucleus of the solitary tract.
In addition to this humoral response, reduced blood volume (1) stimu-
lates the sympathetic division of the ANS, which helps correct the drop
in blood pressure by constricting arterioles, and (2) powerfully motivates
animals to seek and consume water. Not surprisingly, the lateral hypothal-
amus has been implicated in inciting the behavioral response, although the
details of this process are still poorly understood.
... OTHER MOTIVATED BEHAVIORS 527
w-
e
e=
.- GJ
-0 (/) 200
GJro
(/).c
m
;;
e:J
-- E
ern
0_
oro
Qj -5 100
(/)8-
>-
.c
o
1
t
See,
smell
food
2 3 4
'-------y-----' Ti me (h)...
Eat food
FIGURE 16.16
Changes in hypothalamic serotonin
levels before and during a meal. The
mood-elevating effects of eating are believed
to be related to the release of serotonin in
the brain (Source: Adapted from Schwartz
et aI., 1990.)
528 CHAPTER 16 . MOTIVATION
f
\
"
, ':'I
Nucleus of the
solitary tract
Bloodborne
angiotensin II
signals reduced
blood flow to
kidneys
Vagus nerve
/" Mechanoreceptors in walls
of major blood vessels
and heart detect drop in
blood pressure
\
Heart
Kidne
FIGURE 16.17
Pathways triggering volumetric thirst. Hypovolemia is detected in tvvo ways. First,
angiotensin II, released into the bloodstream In response to decreased blood flow to the
kidneys. activates neurons in the subfornical organ. Second. mechanosensory axons in the
vagus nerve, detecting a drop In blood pressure, activate neurons In the nucleus of the soli-
tary tract. The subfomcal organ and nucleus of the solitary tract relay this information to the
hypothalamus, which orchestrates the coordinated response to reduced blood volume.
The other stimulus for thirst, hypertonicity of the blood, is sensed by
neurons in yet anOther specialized region of the telencephalon lacking a
blood-brain barrier, the vascular organ of the lamina terminalis
(OVLT). When the blood becomes hypertonic, water leaves cells by the
process of osmosis. This loss of water is transduced by the OVLT neurons
into a change in action potential firing frequency. The OVLT neurons (I)
directly excite the magnocellular neurosecretory cells that secrete vaso-
pressin, and (2) stimulate osmometric thirst, the motivation to drink
water when dehydrated (Figure 16.18). Lesions of the OVLT completely
prevent the behavioral and humoral responses to dehydration (but not the
responses to loss of blood volume).
The motivation to drink and the secretion of vasopressin from the hypo-
thalamus (and the retention of water by the kidneys) normally go hand-
in-hand. However, selective loss of the vasopressin-secreting neurons of the
hypothalamus produces a curious condition called diabetes insipidus, in
which the body works against the brain. As a consequence of the loss of
vasopressin, the kidneys pass too much water from the blood to the urine.
The resulting dehydration stimulates the strong motivation to drink water;
however, the water absorbed from the intestines passes quickly through the
kidneys into the urine. Thus, diabetes insipidus is characterized by extreme
, ,
Lateral
hypothalamic area
J
OVL T )
I . j
,
Vasopressin-secreting
magnocellular
1 ., / neurosecretory cells
,
, \
Blood in
f
/'
\
'- fl.... \ Posterior lobe
\ 1 ----- of pituitary
.f l
"
Blood out
.----.
FIGURE 16.18
Osmometric thirst: the hypothalamic response to dehydration. Blood becomes
hypertonic when it loses water. Blood hypertonicity is sensed by neurons of the vascular
organ of the lamina terminalis (OVLT). The OVLT activates magnocellular neurosecretory
cells and cells in the lateral hypothalamus. The neurosecretory cells secrete vasopressin into
the blood. and the neurons of the lateral hypothalamus trigger osmometric thirst.
thirst coupled with frequent excretion of a large amount of pale, watery
urine. This condition can be treated by replacing the missing vasopressin.
Temperature Regulation
You are hot; you seek a cool place. You are cold; you seek warmth. We are
all motivated to interact with our environment to keep our bodies within
a narrow range of temperatures. The need for such regulation is clear: The
cells in the body are fine-tuned for a constant temperature, 37°C (98.6°F),
and deviations from this temperature interfere with cellular functions.
Neurons that change their firing rate in response to small changes in
temperature are found throughout the brain and spinal cord. However, the
most important neurons for temperature homeostasis are found clustered
in the anterior hypothalamus. These cells transduce small changes in blood
temperature into changes in their firing rate. Humoral and visceromotor re-
sponses are subsequently initiated by neurons in the medial preoptic area of
the hypothalamus; somatic motor (behavioral) responses are initiated by the
neurons of the lateral hypothalamic area. Lesions in these different regions
can selectively abolish different components of the integrated response.
A fall in temperature is detected by cold-sensitive neurons of the anterior
hypothalamus. In response, TSH is released by the anterior pituitary. TSH
stimulates the release of the hormone thyroxin from the thyroid gland,
which causes a widespread increase in cellular metabolism. The viscero-
motor response is constricted blood vessels in the skin and piloerection
.. OTHER MOTIVATED BEHAVIORS 529
530 C H A PT E R 16 . MOTIVATION
Table 16.2 Hypothalamic Responses to Stimuli That Motivate Behavior
BLOODBORNE SITE OF HUMORAL VISCEROMOTOR SOMATIC MOTOR
STIMULUS TRANSDUCTION RESPONSE RESPONSE RESPONSE
Eating signals
! Leptin Arcuate nucleus ! ACTH 1 Parasympathetic activity Feeding
! TSH
! Insulin Arcuate nucleus ! ACTH 1 Parasympathetic activity Feeding
! TSH
Drinking signals
1 Angiotensin II Subfornical organ 1 Vasopressin 1 Sympathetic activity Drinking
1 Blood tonicity OVLT 1 Vasopressin Drinking
Thermal signals
1 Temperature Medial preoptic area ! TSH 1 Parasympathetic activity Panting; seeking cold
! Temperature Medial preoptic area 1 TSH 1 Sympathetic activity Shivering; seeking warmth
--
(goosebumps). An involuntary somatic motor response is shivering, and, of
course, the other somatic response is to seek warmth.
A rise in temperature is detected by warm-sensitive neurons of the an-
terior hypothalamus. In response, metabolism is slowed by reducing TSH
release, blood is shunted toward the body periphery to dissipate heat, and
behavior is initiated to seek shade. In some mammals, an involuntary motor
response is panting; in humans, it is sweating.
The strong parallels between the hypothalamic control of energy bal-
ance, water balance, and temperature should now be dear. In each case,
specialized neurons detect variations in the regulated parameter. The hypo-
thalamus orchestrates responses to these challenges, which always include
adjustments in physiology and the stimulation of different types of behav-
ior. Table 16.2 summarizes some of the hypothalamic responses we have
discussed in this chapter.
CONCLUDING REMARKS
In the motor system chapters of Part II, we addressed the "how" questions
of behavior. How do muscles contract? How is movement initiated? How
are the actions of our different muscles coordinated? The discussion of
motivation, however, asks a different question: Why? Why do we eat when
our energy reserves become depleted? Why do we drink when we are de-
hydrated? Why do we seek warmth when our blood temperature falls?
Neuroscientists have found concrete answers to both the "how" and the
"why" of behavior in the body's periphery. We move because of the release
of ACh at the neuromuscular junction. We drink because we are thirsty,
and we are thirsty when angiotensin II levels rise in response to decreased
blood flow to the kidneys. However, we remain largely ignorant about the
convergence of "how" and "why" in the brain. In this chapter, we chose to
focus on feeding behavior, in part because the trail1eads farthest into the
brain. The discovery of orexigenic peptide neurons in the lateral hypothal-
amus that respond to changes in leptin levels was a major breakthrough.
We can at least begin to frame the question of how these neurons might
act elsewhere in the brain to initiate feeding behavior. The next few years
should be an exciting time of discovery. Advances in research will have a
significant impact on how we interpret our own behavior, and the behav-
ior of those around us.
After reading about the bloodborne signals that motivate eating and
drinking, you might begin to feel that. indeed, we are ruled by our hor-
mones. However, while bloodborne signals do have a strong effect on the
probability of specific types of behavior, we are not their slaves. Clearly, one
of the great triumphs of human evolution is the ability to exert cognitive,
cortical control over our more primitive instincts.
..
>-V)
wI:
o:::
w
The Hypothalamus,
Homeostasis, and
Motivated Behavior
motivated behavior (p. 511)
lateral hypothalamic syndrome
(p.514)
ventromedial hypothalamic
syndrome (p.514)
arcuate nucleus (p. 515)
paraventricular nucleus (p. 5 I 6)
anorectic peptide (p.516)
orexigenic peptide (p. 518)
lateral hypothalamic area (p. 518)
The long-Term Regulation
of Feeding Behavior
anabolism (p. 51 I)
catabolism (p. 51 I)
obesity (p. 51 I)
starvation (p. 512)
lipostatic hypothesis (p. 513)
leptin (p. 513)
anorexia (p. 514)
The Short-Term Regulation
of Feeding Behavior
satiety signal (p. 5 I 9)
ghrelin (p. 520)
rlPr
,I.!!J
V)
w Z
o
>
w
0::: V)
w
::>
o
... CONCLUDING REMARKS 53 I
vagus nerve (p. 520)
cholecystokinin (CCK) (p. 521)
insulin (p.521)
Why Do We Eat?
electrical self-stimulation (p. 522)
anorexia nervosa (p. 527)
bulimia nervosa (p. 527)
Other Motivated Behaviors
volumetric thirst (p. 527)
vascular organ of the lamina
terminalis (OYLT) (p.528)
osmometric thirst (p. 528)
I. A surgical approach to reducing excessive body fat is liposuction: the removal of adipose tissue. Over time,
however, body adiposity usually returns to precisely the same value as before surgery. Why does liposuction
not work? Contrast this with the effect of gastric surgery to treat obesity.
2. Bilateral lesions of the lateral hypothalamus lead to reduced feeding behavior. Name three types of neuron,
distinguished by their neurotransmitter molecules, that contribute to this syndrome.
3. What neurotransmitter agonists and antagonists would you design to treat obesity? Consider drugs that
could act on the neurons of the brain, as well as drugs that could act on the PNS.
4. Name one way the axons of the vagus nerve might stimulate feeding behavior and one way they inhibit it.
5. What does it mean, in neural terms, to be addicted to chocolate? How could chocolate elevate mood?
6. Compare and contrast the functions of these three regions of the hypothalamus: the arcuate nucleus, the
subfornical organ, and the vascular organ of the lamina terminalis.
60.
o:::
Wz
I-
O
0:::«
::>w
u..o:::
Berridge KC. 2004. Motivation concepts in behavioral
neuroscience. Physiology and Behavior 8 I: I 79-209.
Flier JS. 2004. Obesity wars: molecular progress con-
fronts an expanding epidemic. Cell 116:337-350.
Friedman JM. 2004. Modern science versus the
stigma of obesity. Nature Medidne 10:563-569.
Saper CB, Chou TC, Elmquist JK. 2002. The need to
feed: homeostatic and hedonic control of eating.
Neuron 36: 199-21 I.
Schultz W. 2002. Getting formal with dopamine and
reward. Neuron 36:241-263.
Wise RA. 2004. Dopamine, learning, and motivation.
Nature Reviews Neuroscience 5:483-494.
CHAPTER
Sex and the Brain
INTRODUCTION
SEX AND GENDER
THE GENETICS OF SEX
SEXUAL DEVELOPMENT AND DIFFERENTIATION
THE HORMONAL CONTROL OF SEX
THE PRINCIPAL MALE AND FEMALE HORMONES
THE CONTROL OF SEX HORMONES BY THE PITUITARY AND HYPOTHALAMUS
THE NEURAL BASIS OF SEXUAL BEHAVIORS
REPRODUCTIVE ORGANS AND THEIR CONTROL
MAMMALIAN MATING STRATEGIES
THE NEUROCHEMISTRY OF REPRODUCTIVE BEHAVIOR
WHY AND HOW MALE AND FEMALE BRAINS DIFFER
SEXUAL DIMORPHISMS OF THE CENTRAL NERVOUS SYSTEM
SEXUAL DIMORPHISMS OF COGNITION
SEX HORMONES. THE BRAIN. AND BEHAVIOR
. Box 17.1 Of Specia/lnterest: Bird Songs and Bird Brains
Mismotches Between Genetic Sex ond Hormone Action
. Box 17.2 OfSpecia/lnterest: John/Joan and the Basis of Gender Identity
Direct Genetic Effects on Sexuol Differentiotion of the Brain
THE ACTIVATIONAL EFFECTS OF SEX HORMONES
Brain Plostidty ond Moternol Behovior
Estrogens, Neurite Growth, ond Diseose
. Box 17.3 Path of Discovery: Estrogen and Synapses in the Hippocampus, by Catherine S. Woolley
SEXUAL ORIENTATION
CONCLUDING REMARKS
534 C HAP T E R I 7 . SEX AND THE BRAIN
T INTRODUCTION
Without sex, there is no human reproduction. And without offspring, no
species can survive. Those are the simple facts of life, and over millions of
years, the human nervous system evolved for the survival of the species.
The drive to reproduce can be compared to the powerful motivation to eat
or drink, which we discussed in Chapter 16. For the sake of survival, life-
maintaining functions, such as reproduction and eating, are not left entirely
to the whims of conscious thought. They are regulated by subcortical struc-
tures, and thoughtful conscious control is provided by the cerebral cortex.
In this chapter. we wi]] explore what is known about sex and the brain.
Our goal is not a discussion of the birds and the bees-we will assume you
have picked up the basics about human sexual behavior from your parents,
teachers, friends, videos, or cable TV. Instead, we will look at the neural
machinery that makes reproduction possible. For the most part, the neural
control of sexual organs uses the same somatosensory and motor pathways
we have examined in earlier chapters. Sexual and reprodvctive behaviors
are clearly different in men and women, but just how dIfferent are the
brains of the two genders? We will explore this question and see whether
brain differences pertain to only reproductive behaviors or more generally
to behavior and cognition.
Ultimately, the origin of most distinctions between males and females is
the chromosomes of the parents. Under the guidance of certain genes, the
human body produces a small number of sex hormones that have power-
ful effects on both the sexual differentiation of the body and adult sexual
physiology and behavior. The reproductive organs (the ovaries and testes),
which secrete sex hormones, are outside the nervous system, but they are
activated by the brain. Recall from Chapter 15 that the hypothalamus con-
trols the release of diverse hormones from the anterior pituitary. In the case
of reproductive function, the hormones released by the anterior pituitary
regulate secretions from the ovaries and testes. Sex hormones have obvious
effects on the human body, but they also influence the brain. There appear
to be effects of hormones on gross brain structure and also at the level of
neurites on individual neurons. Sex hormones may even influence resist-
ance to certain neurological diseases.
Another point to consider is what it means to be male or female. Is
gender determined by genetics, anatomy, or behavior? The answer is not
simple; there are cases of gender identities that do not correlate with bio-
logical and behavioral factors. And what about sexual orientation? Is an
attraction to members of the opposite or same sex determined by experi-
ences in childhood or the structure of the brain? These are challenging
questions that address how we perceive ourselves and others. We will ex-
amine the extent to which we can answer such questions by looking at the
anatomy and physiology of the nervous system.
T SEX AND GENDER
The words sex and gender both refer to the state of being male or female
and are often used synonymously. Gender is medically defined by the many
biological characteristics and qualities that distinguish between male and
female, including the nature of the sex chromosomes, and the anatomy of
the gonads and other genital organs. There are also behavioral and cultural
implications of gender, and these start at birth. When a child is born, we
ask the parents, "Is the baby a boy or a girl?" Regardless of one's ideas
about equality of the sexes, the answer to this question leads to innumer-
able assumptions about the life experiences the child will have. In the case
of adults, we don't inquire about someone's gender, because it's usually
obvious from appearance. However, identifying someone as Eemale or male
still involves many assumptions, as our ideas about gender involve a pack-
age of biological and behavioral traits. Gender-specific behaviors result from
complex interactions among self-assessment, societal expectations, genetics,
and hormones. These behaviors are related to gender identity--our per-
ception of our own gender. In this section, we will discuss some of the
genetic and developmental origins of gender.
The Genetics of Sex
Within the nucleus of every human cell, DNA provides a person's genetic
blueprint-all the information needed to build an individual. The DNA is
organized into 46 chromosomes: 23 from the father and 23 from the mother.
Each of us has two versions of chromosome 1, 2, 3, and so on, conven-
tionally numbered in order of decreasing size (Figure 17.1). The only ex-
ception to this pair system is the sex chromosomes, X and Y. Thus, it is usu-
ally stated that there are 44 autosomes (22 pairs of matching chromosomes)
and two sex chromosomes. Females have two X chromosomes, one from
each parent. Males have an X chromosome from the mother and a Y chro-
mosome from the father. Therefore, the female genotype is denoted XX and
the male genotype XY. These genotypes specify a person's genetic sex. Because
the mother contributes an X chromosome to a child of either sex, gender is
determined by the X or Y contribution from the father. In some nonhuman
animals, such as birds, the mother's contribution determines the gender of
the offspring.
The DNA molecules that make up chromosomes are some of the largest
molecules known, and they contain genes, the basic units of hereditary
information. The piece of DNA comprising a gene provides the unique in-
formation needed to construct a particular protein. Current estimates are
that humans have roughly 25,000 genes.
As you can see in Figure 17.1, the X chromosome is significantly larger
than the Y chromosome. Corresponding to this size difference, scientists
estimate that the X chromosome contains about 1500 genes, whereas the
Y chromosome probably contains less than 50. You might joke that men
appear to get genetically shortchanged, and in a sense, that's right: The XY
genotype has serious medical consequences. If a female has a defective X
gene, there may be no negative consequence if her other X gene is normal.
However, any defect in the single X chromosome of a male can lead to a
developmental defect. Such a defect is called an X-linked disease, and there are
many. One example is red-green color blindness, which is relatively com-
mon in males (see Box 9.4). Other X-linked diseases that occur more often
in men than women are hemophilia and Duchenne muscular dystrophy.
Compared to the X chromosome, the smaller Y chromosome has few
genes and less diverse functions. Most importantly for sex determination,
it contains a gene called the sex-determining region of the Y chromo-
some (SRY), which codes for a protein caned testis-detennining factor (TDF).
A human with a Y chromosome and the SRY gene develops as a male, and
without it, the individual develops as a female. In rare cases, there are too
few or too many sex chromosomes, but gender is always determined by the
presence or absence of the Y chromosome. Thus, an X or XXX individual is
female and an XXY or XXYY individual is male.
The SRY gene was found to be located on the short arm of the Y chro-
mosome in 1990 by Peter Goodfenow, Robin Loven-Badge, and their col-
leagues at the Medical Research Council in London (Figure 17.2). If this bit
of the Y chromosome is artificially incorporated into the DNA of an XX
.... SEX AND GENDER 535
)\ (,
i( »)
6 7
H
13
...
19
2
i
\ (-.
J ,
3
. , I'
}) ,!
4 5
10
, f !I
!I P
11 12
II Ii 1\
8
9
.
U'
16
I .
: .
)t
18
H
14
H
17
. .
L
15
r t
J r..
20
21
Xy
22
FIGURE 17.1
Human chromosomes. These 23 pairs
of chromosomes are from a man. Notice
how much smaller the Y chromosome is
than the X chromosome. (Source: Yunis and
Chandler. 1977.)
536 C H A PT E R 17 . SEX AND THE BRAIN
Y chromosome
SR't'
Yp
Yq
.
.
.
1959
1966
1986
1990
FIGURE 17.2
The location of the SRY gene on the Y chromosome. In 1959. researchers found
that TDF depended on the Y chromosome, and in 1966. the important location was further
restricted to the short (p) arm. Research In the 1980s established that TDF is coded by
the SRY gene. a small segment near the tip of the short arm of the Y chromosome.
(Source: Adapted from McLaren, 1990, p. 21 6.)
mouse, the mouse will develop as a male instead of a female. However, this
doesn't mean that SRY is the only gene involved in sex determination, as
SRY is known to regulate genes on other chromosomes. Also, male-specific
physiology, such as sperm production, relies on other genes on the Y chro-
mosome. Nonetheless, we will see shortly that expression of the SRY gene
causes the development of the testes, and the hormones from the testes are
largely responsible for making the male fetus develop differently from the
female fetus.
Sexual Development and Differentiation
Differences between males and females are numerous, from body size and
muscle development to endocrine function. We know it is ultimately the
genetic sex of the child that determines its anatomical sex, or gender. But
during development, when and how does the fetus differentiate into one
sex or the other? How does the genotype of the child lead to the male or
female development of the gonads?
The answer involves the unique situation of the gonads during develop-
ment. Unlike organs such as the lung and liver, the rudimentary cells that
develop into the gonads are not committed to a single developmental path-
way. During the first 6 weeks of pregnancy, the gonads are in an indiffer-
ent stage that can develop into either ovaries or testes. The uncommitted
gonads possess two key structures, the Mullerian duct and the Wolffian duct
(Figure 17.3). If the fetus has a Y chromosome and an SRY gene, testos-
terone is produced, and the Wolffian duct develops into the male internal
reproductive system. At the same time, the Mullerian duct is prevented
from developing by a hormone called Mullerian-inhibiting factor. Con-
versely, if there is no Y chromosome and no upsurge of testosterone, the
(a) Sexually undifferentiated
M
d Y
Ureter-
MUllerian duct
/
(b) Male
(c) Female
Miillerian duct develops into the female internal reproductive system, and
the Wolffian duct degenerates.
The external genitals of both males and females develop from the same
undifferentiated urogenital structures. This is why it is possible for a per-
son to be born with genitals intermediate in form between those of typical
males and females, a condition known as hermaphroditism.
.. THE HORMONAL CONTROL OF SEX
Hormones are chemicals, released into the bloodstream, that regulate
physiological processes. The endocrine glands we are primarily interested
in are the ovaries and testes, because they release sex hormones, and the
pituitary because it regulates this release. The sex hormones are crucial
to the development and function of the reproductive system and sexual
behavior. The sex hormones are steroids (mentioned in Chapter 15), and
some of them are familiar, such as testosterone and estrogen. Steroids are
molecules, synthesized from cholesterol, that have four carbon rings. Despite
the warnings of the American Heart Association, cholesterol is good for
something! Small alterations to the basic cholesterol structure have profound
consequences for the effects of hormones. For example, testosterone is the
T THE HORMONAL CONTROL OF SEX 537
FIGURE 17.3
Development of the reproductive
organs. (a) The undifferentiated urogenital
system has both Mullerian and WoIffian ducts.
(b) If there is an SRY gene. the WoIffian duct
develops into the male reproductive organs.
(c) If there ;s no SRY gene, the Mullerian duct
develops into the female reproductive organs.
(Source: Adapted from Gilbert, 1994, p. 759.)
538 CHAPTER 17. SEXANDTHEBRAIN
HO#
Cholesterol
L
r ?H3
C=O
o.H
Progesterone
L
r OH
O
Testosterone
OH
HO ""
Estradiol
FIGURE 17.4
Cholesterol and the synthesis of the
principal steroid sex hormones. Broken
arrows Indicate where one or more Interme-
diate reactions occur. The enzyme aromatase
directly converts testosterone into estradiol.
most crucial hormone lor male development. but it differs from the impor-
tant female steroid estradiol in only a few places on the molecule.
The Principal Male and Female Hormones
Steroid sex hormones are often referred to as "male" or "female," but men
also have "female" hormones and women also have "male" hormones. The
designation reflects the fact that men have higher concentrations of an-
drogens, or male hormones, and women have more estrogens, or female
hormones. For example, testosterone is an androgen and estradiol is an es-
trogen. In the series of chemical reactions that lead from cholesterol to sex
hormones, one of the principal female hormones, estradiol. is actually syn-
thesized from the male hormone testosterone (Figure 17.4). This reaction
takes place with the aid of an enzyme called aromatase.
Steroids act differently from other hormones because of their structure.
Some hormones, such as vasopressin and oxytocin, are proteins; as such,
they cannot cross the lipid bilayer of a cell membrane. Hence, these hor-
mones act at receptors with extracellular binding sites. In contrast, steroids
are fatty and can easily pass through cell membranes and bind to receptors
within the cytoplasm, giving them direct access to the nucleus and gene ex-
pression. Differences in the concentration of various receptors result in
steroid effects localized to different areas of the brain (Figure 17.5).
The testes are primarily responsible for the release of androgens, though
small amounts are secreted in the adrenal glands and elsewhere. Testos-
terone is by far the most abundant androgen, and it is responsible for most
masculinizing hormonal effects. Prenatally, elevated testosterone levels are
essential for the development of the male reproductive system. Increases in
testosterone much later. at puberty, regulate the development of secondary
sex characteristics, ranging from increased muscular development and facial
hair in human males to the lion's mane. Oddly, for those with a genetic
predisposition, testosterone also causes baldness in men. Female concen-
trations of testosterone are roughly 10% of those found in males. Male
testosterone levels vary during the course of the day from numerous fac-
tors, including stress, exertion, and aggression. It is not clear whether an
increase in testosterone is a cause or an effect. but it is correlated with
social challenges, anger, and conflict.
o .
o
00
Olfactory bulb
Preoptic area
Hypothalamus
FIGURE 17.5
The distribution of estradiol receptors in a saggital section of the rat brain.
High concentrations of these receptors are found in the pituitary and hypothalamus, includ-
Ing the preoptic area of the anterior hypothalamus. These brain areas are all involved in sex-
ual and reproductive behaviors.
,
The principal female hormones are estradiol and progesterone. and they
are secreted by the ovaries. As already mentioned, estradiol is an estrogen;
progesterone is a member of another class of female steroid hormones
called proges/ins. Quite Jow during childhood, estrogen levels increase dra-
matically at puberty and control the maturation of the female reproductive
system and the development of breasts. As in the male, blood concentra-
tions of sex hormones are quite variable in the female. However, whereas
in men, fluctuations occur rapidly each day, in women, hormonal levels
follow a regular 28-day cycle.
The Control of Sex Hormones
by the Pituitary and Hypothalamus
The anterior pituitary gland secretes twO hormones that are particularly
important for normal sexual development and function in both women and
men: luteinizing hormone (LH) and follicle-stimulating hormone
(FSH). These hormones are also called gonadotropins. LH and FSH are
secreted by specialized cells scattered throughout the anterior pituitary that
represent about 10% of the total cell population. Recall from Chapter 15 that
the secretion of hormones from the anterior pituitary is under the control
of hypophysiotropic hormones released by the hypothalamus. Gonadotropin-
releasing hormone (GnRH) from the hypothalamus does what the name
suggests, causing the release of LH and FSH from the pituitary. GnRH is also
referred to as LHRH. for luteinizing hormone-releasing hormone, because
it causes a much greater increase in LH than FSH. Neuronal activity in the
hypothalamus is influenced by numerous psychological and environ-
mental factors that indirectly affect the secretion of gonadotropins from the
anterior pituitary.
The chain of events from hypothalamic input to the secretion of gonadal
honnones is illustrated in Figure 17.6. Neural input from the retina to the
hypothalamus causes changes in the release of GnRH based on daily vari-
ations in light level. In some nonhuman species, strong seasonal variations
in reproductive behavior and gonadotropin secretion occur. Light inhibits
the production of the hormone melatonin in the pineal gland, increasing
gonadotropin secretion because of the inhibitory effect of melatonin on
gonadotropin release. By means of this circuit, reproductive activity can be
influenced by the length of daylight during the course of the year, and off-
spring are born seasonally when they have the best chance of survival. In
humans, there is also an inverse relationship between gonadotropin release
and melatonin levels, but whether melatonin actually modulates repro-
ductive behavior is not known.
In males, LH stimulates the testes to produce testosterone. FSH is involved
in the maturation of sperm cells within the testes. Sperm maturation also
requires testosterone, meaning that both LH and FSH play key roles in male
fertility. Because there is cortical input to the hypothalamus, it is possible
for psychological factors to decrease male fertility by inhibiting gonadotropin
secretion and sperm production.
In females, LH and FSH cause the secretion of estrogens from the ovaries.
In the absence of gonadotropins. the ovaries are inactive, which is the
case throughout childhood. Cyclic variations in LH and FSH levels in adult
females cause periodic changes in the ovaries, and the timing and dura-
tion of LH and FSH secretion determine the nature of the reproductive
cycle, or menstrual cycle. In the follicular phase of the cycle, these hor-
mones (particularly FSH) have the effect of increasing the growth of a small
number of follicles, the cavities in the ovaries that enclose and maintain the
ova (egg cells). In the luteal phase after egg expulsion, the small cells that
T THE HORMONAL CONTROL OF SEX 539
540 C H A PT E R 17 . SEX AND THE BRAIN
\\
(
Psychological and
sensory influences r
\
\
\\
\
"
t
Ovaries
(or testes)
Cellular targets
throughout body
) ,
" 1
J ""i'
/
1))
FIGURE 17.6
Bidirectional interactions between the brain and the gonads. The hypothalamus
is intluenced by both psychological factors and sensory information. such as light hitting the
retina. GnRH from the hypothalamus regulates gonadotropin (LH and FSH) release from
the anterior pituitary. The testes secrete testosterone and the ovaries secrete estradiol, as
directed by the gonadotropins. The sex hormones have diverse effects on the body and also
send feedback to the pituitary and hypothalamus.
surround the egg undergo chemical changes in a process called luteiniza-
tion, which depends on LH release from the pituitary. The duration of the
follicular and luteal phases of the reproductive cycle vary significantly for
different mammals. The phases are roughly equal in length in the primate
menstrual cycle.
In the estrous cycle of nonprimate mammals, such as rats and mice, the
luteal phase is much shorter. In other estrous animals, such as dogs, cats,
and farm animals, the phases are more equal in duration. Many estrous
animals have only one cycle per year, usually in the spring. Presumably,
this timing is for the production of offspring when the weather and food
supply are optimal. At the other extreme are animals such as rats, which
are said to be polyestrous because they have short periods of estrus, or
"hea!," throughout the year.
T THE NEURAL BASIS OF SEXUAL BEHAVIORS 541
.. THE NEURAL BASIS OF SEXUAL BEHAVIORS
Sexual behavior is a vast, complex, and provocative topic, ranging from the
most mechanical and biological facts of copulation to the myriad cultural
practices of human societies. Here we will touch on only fragments of the
subject. We begin with the autonomic and spinal neurons that control the
genitals, then discuss various strategies of mating, and conclude with some
research about brain mechanisms that are important for monogamy and
parenting.
Reproductive Organs and Their Control
Despite the obvious structural differences between female and male repro-
ductive organs, their neural regulation (to the extent it is understood) is
surprisingly similar. Sexual arousal of adult men and women can result
from both erotic psychological and sensory stimuli (including visual. olfac-
tory, somatosensory), and from tactile stimulation of the external sex organs.
A fu1l sexual response cycle consists of arousal followed by plateau, orgasm,
and resolution phases. Although the duration of each phase can vary widely,
the physiological changes associated with each one are relatively consis-
tent. Neural control of the sexual response comes in parr from the cerebral
cortex-this is, after alL where erotic thoughts occur-but the spinal cord
coordinates this brain activity with sensory information from the genitals
and generates the critical outputs that mediate the sexual responses of the
genital structures.
The major external and internal sex organs are shown in Figure 17.7.
Research on the physiology of the human sexual response has tended to
focus unduly on men, but we will try to summarize some of what is known
about both sexes. Sexual arousal causes certain parts of the external geni-
tals of both women and men to become engorged with bJood, and thus to
swe1l. In women, these structures include the labia and the clitoris: in men,
it is primarily the penis. The external genitals are densely innervated by
mechanoreceptors, particularly within the clitoris and the glans of the pe-
nis. Adequate stimulation of these sensory endings can, by itself, be enough
to cause engorgement and erection. The best evidence that engorgement
can be generated by a simple spinal reflex is that most men who have suf-
fered a complete transection of the spinal cord at the thoracic or lumbar
level can nevertheless generate an erection when their penis is mechani-
ca1ly stimulated. The mechanosensory pathways from the genitals are com-
ponents of the somatosensory system (see Chapter 12), and their anatomy
f01lows the usual pattern: Axons from mechanoreceptors in the penis and
clitoris collect in the dorsal roots of the sacral spinal cord. They then send
branches into the dorsal horns of the cord, and into the dorsal columns,
through which they project toward the brain.
Engorgement and erection are contro1led primarily by axons of the parasym-
pathetic division of the autonomic nervous system (ANS) (see Figure 15.9).
Within the sacral spinal cord, the parasympathetic neurons can be excited by
either mechanosensory activity from the genitals (which can directly trigger
reflexive erection) or by axons descending from the brain (which account for
responses mediated by more cerebral stimuli) (see Figure 17.7). Engorge-
ment of the clitoris and penis depend on dramatic changes in blood flow.
Parasympathetic nerve endings are thought to release a potent combination
of acetylcholine (ACh), vasoactive intestinal polypeptide (VIP), and nitric ox-
ide (NO) directly into the erectile tissues. These neurotransmitters cause the
relaxation of smooth muscle cells in the arteries and the spongy substance of
the ditoris and penis. The usua1ly flaccid arteries then become filled with
blood, thereby distending the organs. (Sildenafil, better known by its trade
542 C H A PT E R 17 . SEX AND THE BRAIN
Brain centers
Lumbar
Urinary
bladder
Urinary
bladder
Parasympathetic pathways
Sympathetic pathways
Sensory pathways
G ./
lans penis
"-
Testis
FIGURE 17.7
The neural control of human sex organs. Sensory
information from the sex organs follows the dorsaJ column---
medial lemnlscal pathway to the brain.
name Viagra, is a treatment for erectile dysfunction that works by enhanc-
ing the effects of NO.) As the penis becomes longer and thicker, the spongy
internal tissues swell against two thick elastic outer coverings of connective
tissue that give the erect penis its stiffness. In order to keep the organs slid-
ing easily during copulation throughout the plateau phase, parasympathetic
activity also stimulates the secretion of lubricating fluids from the woman's
vaginal wall and from the man's bulbourethral gland.
Completing the sexual response cyde requires activity from the sympa-
thetic division of the ANS. As sensory axons, particularly from the penis or
.. THE NEURAL BASIS OF SEXUAL BEHAVIORS 543
clitoris, become highly active, they, together with activity descending from
the brain, excite sympathetic neurons in the thoracic and lumbar seg-
ments of the spinal cord (see Figure 17.7). In men, the sympathetic effer-
ent axons then trigger the process of emission: Muscular contractions move
sperm from storage sites near the testes through two tubes called the vas
deferens, combine the sperm with fluids produced by various glands, and
propel the resulting mixture (called semen) into the urethra. During ejacula-
tion, a series of coordinated muscular contractions expel the semen from
the urethra, usually accompanied by the intense sensations of orgasm. In
women, stimulation adequate to trigger orgasm probably also activates the
sympathetic system. Sympathetic outflow causes the outer vaginal wall to
thicken and, during orgasm itself, triggers a series of strong muscular
contractions.
Following an orgasm, some time must pass before another orgasm can
be triggered in men. The orgasmic experience of women tends to be con-
siderably more variable in frequency and intensity. The neural mechanisms
underlying the sensations of sexual climax are entirely mysterious in both
sexes. The resolution phase, which ends the sexual response cycle, includes
a draining of blood from the external genitals through veins, and a loss of
erection and other signs and sensations of sexual excitement.
Mammalian Mating Strategies
Mammals practice a dazzling range of mating behaviors. Each one is a
strategy that ultimately meets a single evolutionary objective: to maximize
the survival of offspring and parental genes. Species variations in preferred
mating systems seem to depend on the investment that males and fe-
males make in raising their offspring, although there are exceptions. Very
common among mammals is polygyny (from the Greek for "many
women"), in which the male mates with many females but the female usu-
ally mates with only one male. Polygynous mating (practiced by giraffes,
orangutans, and most other mammals) has a "one-night stand" quality to
it, and the male never looks back to check on the outcome of his many
liaisons. Sometimes polygyny takes the form of a harem-one male forms
a lasting and exclusive assodation with a group of females-as practiced
by gorillas, elephant seals, and a very small number of traditional human
cultures.
Polyandry ("many men"), in which one female mates with many males
but the males mate with only that female, is rare among mammals and ver-
tebrates in general. One exception is the phalarope, a shorebird that breeds
in the cold tundra. Polygyny and polyandry are both examples of polygamy,
having more than one spouse.
In monogamy ("one spouse"), a male and a female form a tightly bound
relationship that includes exclusive (or nearly exclusive) mating with each
other. Only about 3% of mammalian species are monogamous, although
monogamy is practiced by roughly 12% of primate species (and 90% of
bird species!).
In a survey of various cultures and eras, there are examples of nearly
every type of mating strategy among humans. On balance, humans have a
strong tendency toward (at least temporary) monogamy, although some
cultures condone polygyny. Interestingly, even where polygyny is socially
acceptable, most marriages are monogamous. Polyandry for reproductive
purposes is rare, and most cultures have penalized women accused of it.
Although there has been much speculation about evolutionary explana-
tions for human mating patterns, determining the precise influences of
genetics and culture on mating behaviors is virtually impossible.
544 C HAP T E R I 7 . SEX AND THE BRAIN
"
'\" '
,
'1
). "
FIGURE 17.8
Studying reproductive behavior. The
praine vole IS a valuable experimental model,
representing monogamy and the care of off-
spring by both parents. (Source: Natural His-
tory. August 1995. Photo courtesy of Wendy
Shattil and Bob Rozlnski.)
The Neurochemistry of Reproductive Behavior
Regardless of an animal's choice of reproductive strategy-staying faithful
ro a mate and devoted to one's children, or wandering promiscuously
and abandoning offspring-complex social behaviors are required. It would
be remarkable if the tendency to be monogamous or polygamous were
controlled by a few simple brain chemicals. Yet recent work on mouselike
rodents called voles suggests that certain well-known piruitary hormones
do precisely that (at least in voles).
Perhaps you are wondering why neuroscienrists study the sex lives of
voles in the first place. The answer should be familiar by now: When you
have a research problem in biology, choosing just the right species to
study can provide a shortcut to the solution. Voles are a wonderful natural
experimental model, because closely related species of voles use very dif-
ferent reproductive behaviors. The prairie vole (Microtus ochrogaster) Jives in
the American grasslands, practicing solid "family values" (Figure 17.8). It is
highly social and as reliably monogamous as any mammal known. After an
intense period of initial matings, the male and female form a tight pair-
bond and live together in one nest. The male will fiercely defend his mate,
and both parents cooperate in the long-term care of their young. By con-
trast, the meadow vole (Microtus montanus) is asocial and promiscuous. Each
one lives in an isolated nest, the males take no part in parenting, and the
females care for their offspring only briefly before letting them fend for
themselves in the world.
Because these two vole species are physically and genetically quite similar,
relatively few biological factors might account for their disparate reproduc-
tive behaviors. Based on clues from previous studies of maternal and terri-
torial behavior, research has focused on the roles of oxytocin and vasopressin
in voles. Recall that these peptide hormones are synthesized in the hypo-
thalamus and can be released into the bloodstream by neurosecrerory
terminals in the posterior pituitary gland (see Figure 15.4). Circulating
vasopressin (also known as AD H) helps regulate water and salt levels in the
body, mainly by affecting the kidneys: oxytocin stimulates smooth muscle,
causing uterine contractions during childbirth and milk letdown during
lactation. However, oxytocin and vasopressin are also released onto CNS
neurons, and, like most signaling molecules, they bind to specific receptors
scattered about the brain.
As shown in Figure 17.9, maps of these receptors are strikingly different
in the brains of prairie voles and meadow voles, whereas maps of other
types of neurotransmitter and hormone receptors are very similar in the
two species. The receptor differences correlate well with reproductive be-
havior even in other species of voles. Furthermore, the maps are plastic.
When the female meadow vole gives birth and assumes a maternal role
(however briefly), her receptor maps temporarily change to resemble those
of the prairie vole.
The distinctive maps of oxytocin and vasopressin receptors tell us that
each hormone activates a different network of neurons in the polygynous
and monogamous vole brains. This alone does not prove that the hormones
have anything to do with sex-related behaviors. But together with the
effects of the hormones and drugs that antagonize them, this evidence
makes a strong case for cause and effect. When a pair of prairie voles cop-
ulates, levels of vasopressin (in males) and oxytOcin (in females) rise sharply.
Vasopressin antagonists given to a male prairie vole before mating prevent
him from forming a pair-bond relationship. This disruption of pair-bonding
can be produced with the antagonist selectively infused into the ventral
pallidum (the anterior portion of the globus pallidus). Oxytocin antagonists
... THE NEURAL BASIS OF SEXUAL BEHAVIORS 545
Meadow vole
Prairie vole
Oxytocin
receptors
...
Vasopressin
receptors
I
I I
2.5mm
FIGURE 17.9
The role of oxytocin and vasopressin receptors in reproductive behavior.
The3e coronal brain sections show the distribution of oxytocin and vasopressin in the brains
of meadow voles and prairie voles. The darkest regions have the highest receptor densities.
(Source: Young et al.. 1998.)
have no such effect. When a male is given vasopressin while he is exposed
to a new female, he quickly forms a strong preference for her even with-
out the intense mating that usually precedes pair-bonding. Oxytocin seems
to be necessary for the female to establish a preference for her mate, while
vasopressin has little effect.
One recent study by Lim et aJ. provides more direct evidence thar vole
pair-bonding can be significantly altered by a small change in vasopressin
receptors. A virus was used to deliver genes to the ventral pallid urn of male
meadow voles, causing an overexpression of vasopressin receptors. Conse-
quently, the male meadow voles had numbers of vasopressin receptors in
the ventral palIidum comparable to prairie voles. The manipulated meadow
voles also pair-bonded like prairie voles. If this cause-and-effect link is
supported by further studies, it dramatically shows that a complex social
behavior can be altered by the overexpression of a single protein at one
location in the brain.
Oxytocin and vasopressin are also involved in parenting habits. Vaso-
pressin increases the male prairie vole's paternal proclivities, causing him
to spend more time wHh his pups, whereas oxytocin stimulates maternal
behaviors in the female. The research on voles suggests a very interesting
hypothesis about the evolution of complex social behaviors. If genetic
mutations cause a change in the anatomical distribution of a particular
hormone's receptors, then that hormone may evoke an entirely new reper-
toire of behaviors. Consistent with this idea, administering vasopressin or
oxytocin to the naturally promiscuous meadow voles does not evoke the
effeds on pair-bonding and parenting seen in prairie voles, perhaps because
they don't have receptors in the necessary places.
The vole story is a fascinating example of how brain chemicals can reg-
ulate critical behaviors. However, by now you are undoubtedly wondering:
Does this have anything to do with human relationships, faithfulness, and
love? We have only incomplete facts. There is some evidence from primates
that vasopressin and oxytocin levels vary with sexual arousal, and that
oxytocin facilitates nurturing behavior in females and sexual assertiveness
in some males. It has also been found in human fMRI experiments that
546 C H APT E R 17 . SEXANDTHE BRAIN
regions of the brain dense with oxytocin and vasopressin receptors are
activated when mothers look at photographs of their own children but not
when they look at photographs of the children of their friends.
Are oxytocin and vasopressin important for romantic and parental love
in people? Maybe. It's too soon to telL
WHY AND HOW MALE AND FEMALE BRAINS DIFFER
Sexual reproduction depends on a variety of individual and social behav-
iors-finding, attracting, and keeping a mate; copulating; giving birth; and
nursing and nurturing the offspring-and in each case, the behavior of
males and females is usually quite different. Because behavior depends on
the structure and function of the nervous system, we can make the strong
prediction that male and female brains are also somehow different-that is,
they have sexual dimorphisms (from the Greek dimorphos, "having two
forms"). Another good reason to expect that male and female brains differ
is simply that male and female bodies differ. The body parts that are unique
to each sex require neural systems that have evolved specifically to control
them. For example, male rats have a particular muscle at the base of the
penis, and their spinal cord has a small cluster of motor neurons that
control that muscle; females lack both the muscle and the related motor
neurons. Body size and general shape also vary with gender, and thus
somatosensory and motor maps must adjust to fit them.
Sexual dimorphisms vary widely across species. Finding them in the
brain is not always easy. In human brains, dimorphisms have so far proven
to be small, subtle, few, and of unknown function. Differences between hu-
man male and female brains tend to vary along a continuum, with lots of
overlap. A particular hypothalamic nucleus might be larger in women than
men on average, but size variations of the nucleus may be so great that
many men have a larger nucleus than many women. By contrast, some
nonhuman species have much more dramatic and explicable dimorphisms.
In rodents, the trained eye can tell male from female brains with no ambi-
guity because of differences in their hypothalamus. The diversity of brain
dimorphisms across species can sometimes be attributed to the remarkable
variations in sexual behaviors. For example, in some songbird species, only
males sing, and, not surprisingly, only males have large singing-related
brain nuclei.
In the rest of this section, we describe sexual dimorphisms in the nervous
systems of humans and other species, focusing on examples that illuminate
the relationship between the brain and behavior. We also discuss some of the
neurobiological mechanisms that generate these dimorphisms.
Sexual Dimorphisms of the Central Nervous System
Few dimorphic neural structures are related to their sexual functions in an
obvious way. One structure that is related is the collection of spinal motor
neurons that innervates the bulbocavernosus (BC) muscles surrounding
the base of the penis. These muscles have a role in penile erection and help
to eject urine. Both women and men have a BC muscle. In women, it
surrounds the opening of the vagina and serves to constrict it slightly. The
motor neuron pool controlling the BC muscles in humans is called Onu['s
nucleus, and it is located in the sacral spinal cord. OnuI's nucleus is moder-
ately dimorphic (there are more motor neurons in men than women)
because the male BC muscles are larger than those of females.
The most distinct sexual dimorphisms in the mammalian brain are
clustered around the third ventricle, within the preoptic area of the anterior
.
'" WHY AND HOW MALE AND FEMALE BRAINS DIFFER 547
__ _ - Corpus callosum
W \------ Anterior commisure
1--- Third ventricle
./
,,'1 ? _
Ji¥::;; - >., .' - ':. -'-:
c: .--...t... . . .tt>- h'
_' r 1 j.: Y;': :::i3
____---- )!i,,, .. "" . ' _.. "-. - ....11' -' '-. -
------ ' "'.1 < -- '?:'" ,-
Third -- 1!- _ .... -;. !l '.1 --. .{ .J ;'. .
ventricle .;;:> r .;.. k.H':t::;'
______ I. ... .:'j'" ..;: it.__ .. ....:
----- [J ' .\ j :.t\ : -:'.;, ;.:"
SON - i.-'..!..{..t,
. ; ... _ . !r .\ :t._ =._t
o. r--->';c , '/, ;J "" -. - ,.
O . h - ....,:_ ;."'.- "..,1-,. '.... .- -. '. - -
ptlC c lasm- _.."'-.....v"-,,.61';1,-I"V-.':'-{<-.:-... " :-
:;:J. . '". ... : > ;l .
:$ -:'f l : . ; : {
. l<.'...;_ _,.. . \ °i. , ."t
Jt;;!.t' ; ) i -. :; ;;( ::
;:& '.\\.'i:,'';i:!\f,- " "A0t.- .; ?-.
/!-,: ; 1- f , f\ f . SON
t--."r ,-,,"-h. . ."- ,-<;ri' !b;.S;"':-'-i. :'
I - : :'--fC!- '{ i£ ! t: fJ ) .! -t \7-
. '-";: \ ...:r:-.if"'1 .,.,)'t.1S<- ", ,r'--
: .; :-;.- _w. :--t).:. :" -. :. .. I.:;
. A . ,,---. 'r..,"." .'
) -'- ...... ':-
hypothalamus. This region seems to have a role in reproductive behaviors.
In rats, lesions of the preoptic area disrupt the estrous cycle in females and
reduce the frequency of copulation in males. Histological sections of male
and female preoptic areas from rats show an obvious difference: The aptly
named sexually dimorphic nucleus (SDN) is five to eight times larger
in males than in females (Figure 17.10).
The preoptic area of humans may also have dimorphisms, but seeing
them is more challenging and more controversial. There are four clusters
of neurons called the interstitial nuclei of the anterior hypothalamus
(INAH). In different studies, lNAH-l, INAH-2, and lNAH-3 have all been
reponed to be larger in men than women. INAH-l may be the human
analogue of the rat SDN, but researchers disagree about whether lNAH-l
is dimorphic. The clearest dimorphism appears to be in INAH-3, which was
first reported to be twice as large in men as women by Laura Allen. Roger
Gorski, and their colleagues at V.C.LA. Evidence of the involvement of the
INAH in sexual behavior is thus far inconclusive. Various neurons of the
medial preoptic area in male rhesus monkeys fire vigorously during specific
phases of sexual behavior, including arousal and copulation. In addition,
there may be subtle differences in the size of certain hypothalamic nuclei
that correlate with sexual orientation in people.
Human brain dimorphisms outside the hypothalamus have been difficult
to prove conclusively, although many have been reported. For example.
some studies have found that the corpus callosum is larger in men, but this
may be a consequence of men having slightly larger brains (and bodies). In
other reports, the posterior end of the corpus callosum, called the splenium,
is selectively larger in women than in men. But even if there is a dimor-
phism in the size or shape of the corpus callosum, what could it mean? We
can only guess. The callosum has no obvious role in mediating specifically
sex-related behaviors, but it is important for a variety of cognitive functions
that involve coordinated activity between hemispheres. Observations of
stroke patients in whom only one hemisphere has been damaged suggest
FIGURE 17,10
Sexual dimorphism in rats. The sexually
dimorphic nucleus (SDN) In the hypothalamus
of male rats (ieft) is much larger than the
SDN In female rats (nght). (Source: Adapted
from Hosenzvveig et ai.. 2005. Fig 12.21.
Photos courtesy of Roger' Gorski.)
-
548 C HAP T E R I 7 . SEX AND THE BRAIN
(a) List words beginning with
the letter B.
big, bag, bug, boy,
banana, bugle, bunny......
(b) Are these two shapes the same?
FIGURE 17.11
Cognitive tasks that may favor women
or men. (a) Women may outperform men
in listing words beginning with the same letter:
(b) Men appear to be somewhat better at
spatial rotation tasks, such as deciding whether
two three-dimensional objects are the same.
(Source: Adapted from Kimura. 1992, p. I 20.)
that the functions of female brains may be less lateralized, that is, dependent
on one cerebral hemisphere more than the other. But this conclusion, too,
has been challenged. As a rule, sexual dimorphisms of the brain are diffi-
cult to prove because male and female brains are very similar, and because
within populations of male and female brains, there is individual variation.
Perhaps the most reliable conclusion we can draw about sexual dimor-
phisms in human brain structure is that there are so few of them. This
probably should not corne as a surprise, because the vast majority of
women's and men's behaviors are very similar, if not indistinguishable. The
gross anatomy of the brain provides only a crude view of the organiza-
tion of the nervous system. To determine the reasons for sexually dimor-
phic behavior, we need to look deeper into the patterns of neural connec-
tions, the neurochemistry of the brain, and the influence of sex-related
hormones on neural development and function.
Sexual Dimorphisms of Cognition
Even if there are no major differences in the brain structures of men and
women, there may still be differences in cognitive abilities. Reports of cog-
nitive dimorphisms sometimes are accompanied by an evolutionary expla-
nation: Men evolved as hunters and relied more on their abilities to navi-
gate their environment. Women evolved the behavior of staying closer to
home to care for children, so they were more soda] and verbal.
Numerous studies have reported that women are better at verbal tasks
than men. Starting at around age 11. girls perform slightly better on tests
of comprehension and writing, and this effect is sometimes said to extend
through high school and beyond. Perhaps it reflects a difference in the rates
of brain development in the two genders. Specific tasks at which women
excel include naming objects of the same color, listing words beginning
with the same letter, and verbal memory (Figure 17.11a).
In other sorts of tasks, men are said to outperform women. Tasks that
reportedly favor men include map reading, maze learning, and mathemat-
ical reasoning. Researchers speculate that these male advantages evolved
from the days when men roamed large areas to hunt wild animals. One of
the largest reported differences between the sexes is mental rotation of
objects, a task that appears to favor men (Figure 17.11 b).
While thinking about dimorphisms of cognition, we need to consider a
few things. First, not all studies yield the same results. In some cases one
gender performs better, and in others there is no difference. Second, across
large groups of people of both genders, there are huge differences in per-
formance. But most of the variation is the result of differences among indi-
viduals, rather than being gender specific. Third, are performance differ-
ences (or brain dimorphisms) innate or the result of differences in
experiences? Typical males and females experience different things and
they may, on average, develop slightly different skills. This may in turn
influence neural circuitry.
A common interpretation of gender-based differences in performance is
that the distinctive hormonal environments of male and female brains
make them work somewhat differently. Perhaps there is a benefit or penalty
associated with estrogens or androgens for each task. Consistent with this
conjecture are reports that spatial reasoning in women correlates with the
menstrual cycle, better performance being observed when estrogen levels are
lowest. Evidence also indicates that administering testosterone enhances
spatial performance in older men with low testosterone levels. However,
cognition cannot be so simply related to hormones, as there is no reliable
correlation between performance on verbal or spatial tasks and hormone
'" WHY AND HOW MALE AND FEMALE BRAINS DIFFER 549
levels. This doesn't mean that hormones do not Jffect cognitive function,
but we must be cautious about overgeneralizing.
Sex Hormones, the Brain, and Behavior
Even if there are no gross anatomical dimorphisms, male and female brain
circuitry must be somewhat different to account for gender-specific behav-
iors, whether singing by male birds or human sexual behavior. Recall that
the kinds of sex hormones circulating in the blood are determined by the
gonads, and the dimorphism of the gonads is ordinarily specified by our
genes. As described earlier, people with a Y chromosome express a factor
(testis-determining factor) that causes rhe undifferenriared gonads to be-
come resres; people lacking a Y chromosome do nor produce TDF, and their
gonads differentiare inro ovaries. The differentiarion of restes or ovaries sets
off a cascade of developmental events in rhe body. Mosr importantly for the
sexual differentiarion of the brain, the testes produce androgens, which
rrigger rhe masculinization of the nervous system by regularing rhe expres-
sion of a variety of sex-related genes. In the absence of androgens, there is
a feminization of the brain through a different pattern of gene expression.
There is nothing fundamentally unique abour the brain's sensitivity to
hormones. It is just one more body tissue waiting for a hormonal signal to
decide its specific pauern of growth and development. Androgens provide
a unitary signal for masculinization in the brain, just as in the various other
tissues of the body that are sexually dimorphic. Steroids can influence
neurons in two general ways (Figure 17.12). First, rhey can acr quickly
(within seconds or less) to alter membrane excitability, sensitivity to neu-
rotransmitters, or neurotransmitter release. Steroids do this, in general. by
directly binding to, and modulating the functions of. various enzymes,
channels. and transmitter receptors. For example, certain metabolites
(breakdown products) of progesterone bind to the inhibitory GABA A re-
ceptor and potentiate the amount of chloride current activated by GABA.
The effecrs of these progesterone metabolites are quite similar to the seda-
tive and anticonvulsant effects of the benzodiazepine class of drugs (see
Figure 6.22). Second, steroids can diffuse across the outer membrane and
bind to specific types of steroid receptors in the cytoplasm and nucleus. Re-
ceptors with bound steroid can either promote or inhibit the transcription
of specific genes in the nucleus, a process that can take minutes to hours.
Specific receptors exist for each type of sex hormone, and the distributions
of each receptor type vary widely throughout the brain (see Figure 17.5).
Ironically, testosterone does not cause the changes in gene expression
that cause masculinization of the male brain. Remember that testosterone
is convened within neuronal cytoplasm into estradiol in a single chemical
step, catalyzed by the enzyme aromatase (see Figure 17.4). It is actually the
estrogen, binding to estradiol receptors, that triggers masculinization of the
developing nervous system. Because female gonads do not produce an es-
trogen surge in early srages of development, female brains normally escape
this steroid-triggered transformation. [f newborn female rats are treated
with estrogen, they will have a large SDN and develop masculine behav-
iors as adults. What is not clear is which genes are regulated in various
pans of the brain by sex hormones to account for masculinization.
A recent study by Amateau ami McCarthy shows that one factor in brain
masculinization "downstream" from testosterone and estradiol is the pro-
duction of prostaglandins. Prostaglandins are compounds derived from
arachidonic acid, a fatty acid present in the brain and other organs. One of
the enzymes involved in the synthesis of prostaglandins is cyclooxygenase
(COX). Prostaglandins have numerous roles; most notably, they are produced
550 CHAPTER 17. SEXANDTHEBRAIN
FIGURE 17.12
The direct and indirect effects of
steroids on neurons. Steroids can directly
affect transmitter synthesis. transfllltter reiease.
or postsynaptic transmitter receptors. They
can indirectly infiuence gene transcnptlon.
Presynaptic
terminal
k
...
i P Jf'! ,
(f Postsynaptic Dendnte
c,' .
,!-.0 spine
Q"
\\ Nuclear
) = \l",eIOP
"''b, --J I / / V/'
&%0,& \7 ---- DNA
'- / ., \
ES
receptor! /
transcription
factor
#,';
/ .)
,/
/
Y--
Estrogen bound
to receptor.
bound to DNA
',,-
( cell
of neuron
after tissue damage and involved in inducing pain and fever. Amateau and
McCarthy found that fetal and neonatal male rats exposed to COX inhibitors
showed reduced copulatory behavior as adults. Conversely, female rats
treated with COX inhibitors exhibited male-like copulatory behaviors. Note
that the fema1e rat behavior, and brain, were partially masculinized despite
the lack of the usual sex hormones playing this role, thus moving us one
step downstream from estradiol in the chain reaction that causes masculin-
ization. A lascinating side note 10 this study is that human pain is frequently
treated with COX inhibitors sLlch as aspirin. Only time will tell whether a
human mother's use of analgesics during pregnancy affects the future
sexual behavior of her children.
Steroid hormones can exert effects on the brain and body throughout
life, but their in[]uence early in development is often fundamentally dif-
ferent from their eHect after an animal is mature. For example, the ability
of testosterone to alter very young genita1s and brain circuitry, leading to
distinctly male genitals and masculine behaviors later in life, can be thought
of as the organizational effects of the hormone. The hormone organizes
the perinatal tissues in irreversible ways that allow it to generate male func-
tions after sexual maturity has been reached. In order for a mature animal
to express sexual behaviors fully. however, it is often necessary for steroid
WHY AND HOW MALE AND FEMALE BRAINS DIFFER 551
hormones to circulate again during periods of sexual .IC(IVIty, providing
activational effects on the nervous system. Thus, for example, testosterone
levels might surge in the body of a male songbird in the spring, activating
changes in certain parts of his brain that are essential for normal repro-
ductive behavior (Box 17.1). Activational effects are usually temporary.
Mismatches Between Genetic Sex and Hormone Action. Because
hormones, not chromosomes, largely determine the sexual characteristics
of the nervous system, it is possible to have genetic males with female
brains and genetic females with male brains. In all mammalian species
studied, treatment with testosterone early in development leads to de-
creases in at least some features of adult female sexual behavior. Activating
fully masculine behavior usually requires extended testOsterone treatment
before and after birth. If genetically female (XX) rats are exposed to testos-
terone during the few days around birth, they will fail to elicit the typical
female mating posture. called lordosis, when they reach maturity. Female
guinea pigs treated in utero with enough testOsterone to masculinize their
external genitals will. as adults, energetically mount and auempt to mate
with females in estrus. In a more natural experiment, when a cow carries
twin calves that include both a male and a female, the female calf is ex-
posed in utero to some testOsterone produced by her male twin. As an adult
the female. known as a freemartin, will invariably be intertile and behave
more like a bull than a cow.
Some humans also experience mismatches between their chromosomes
and sex hormones. For example, genetic males (XY) who carry a defective
androgen receptor gene may have profound androgen insensitivity. The an-
drogen receptor gene is on the X chromosome; males thus have only one
copy of it and males with the defective gene cannot produce functioning
androgen receptors. These individuals develop normal testes and produce
ample testosterone, but they appear outwardly quite female because their
tissues cannot respond to androgen; they have a vagina, a clitoris, and
labia, and at puberty they develop breasts and a female body shape. They
do not menstruate, however, and remain infertile. Androgen-insensitive
genetic males not only look like normal genetic females; they also behave
like them. Even when they understand the circumstances of their biology,
they prefer to call themselves women; they dress like women. and they
choose men as their sex partners.
Occasionally, genetic females have a condition called congenital adrenal hy-
perplasia (CAH), which literally means overgrown adrenal glands present at
birth. Although they are genetically female, because their adrenal glands
secrete unusually large amounts of androgens, CAH females are exposed to
abnormally high levels of circulating androgens early in their development.
At birth, they have normal ovaries and no testes. but their external genitals
are intermediate in size between a normal clitoris and a penis. Surgery and
medications are the usual treatments after birth. Nevertheless, CAH girls (and
their parents) are more likely to describe their behavior as aggressive and
tomboyish. As adults, most CAH women are heterosexual, but compared to
other women, a higher percentage of CAR women are homosexual. Presum-
ably, by analogy to the animal studies, prenatal exposure to high levels of
androgens causes a somewhat male-like organization 01 certain brain circuits
in CAR women. We have to be particularly cautious about drawing conclu-
sions about the causes of human behavior, however (Box l7.2). It is very hard
to determine whether masculine behavior of a CAH female is due entirely to
early androgen exposure aod male-like brain dimorphisms, whether her be-
havior is the product of subtle differences in the way she is treated by others
(particularly parents faced with a child who has ambiguous genitals), or both.
552 CHAPTER 17. SEXANDTHEBRAIN
Box 17.1
... , .
OF SPECIAL INTEREST
I ..
# ...
Bird Songs and Bird Brains
To our ears, the singing of birds may be simply a pleasant
harbinger of spring. but for birds, it is part of the serious
business of sex and reproduction. Singing is strictly a male
function for many species, performed for the purpose of
attracting and keeping a mate and for warning off poten-
tial rivals. Studies of two bird species with different habits
of reproduction and singing have revealed some fascinating
clues about the control and diversity of sexual dimor-
phisms in the brain.
Zebra finches are popular pets, but their wild habitat is
the harsh Australian desert. To breed successfully. birds
require dependable sources of food, but in the desert,
food comes only with sporadic and unpredictable rains.
Zebra finches must therefore be ready and willing to
breed whenever food and a mate are available. in any sea-
son. Wild canaries. on the other hand, live in the more
predictable environment of the Azores and (where else?)
the Canary Isl.ands. They breed seasonally during spring
and summer and do not reproduce during fall and winter.
The males of both species are passionate singers, but they
differ greatly in the size of their repertoires. Zebra finches
belt out one simple ditty all their lives and cannot learn
new ones. Canaries learn many elaborate songs, and they
add new ones each spring. The different behaviors of zebra
finches and canaries require different mechanisms of neural
control.
The birds' sexually dimorphic behavior-singing-is
generated by dramatically dimorphic neural structures.
Birds sing by forcing air past a special muscularized organ
called the syrinx, which encircles the air passage. The
muscles of the syrinx are activated by motor neurons of
the nucleus of cranial nerve XII, which are in turn con-
trolled by a set of higher nuclei collectively called the vocal
Syrinx
control regions, or VCRs (Figure A). In zebra finches and
canaries, VCR size is five or more times larger in males
than in females.
The development of VCRs and singing behavior is under
the control of steroid hormones. However, the very differ-
ent seasonal requirements of zebra finches and canaries
are paralleled by distinctly different modes of steroidal
control. Zebra finches apparently require early doses of
steroids to organize their VCRs and later androgens to
activate them. If a hatchling female zebra finch is exposed
to testosterone or estradiol, its VCRs will be larger than
those of normal females when it reaches adulthood. If the
masculinized female is given more testosterone as an
adult, its VCRs will grow larger still, and she will then sing
like a male. Females that are not exposed to steroids
when young are unresponsive to testosterone as adults.
By contrast, the song system in canaries seems to be
independent of early steroid exposure, yet it bursts into
full service each spring. If female canaries are given an-
drogens for the first time as adults, they will begin
singing within a few weeks. The androgens of males surge
naturally each spring; their VCRs double in size as neurons
grow larger dendrites and more synapses, and singing
commences. Remarkably, neurogenesis. the birth of neu-
rons, continues throughout adulthood in songbird
brains, further contributing to the VCR circuitry during
the mating season. By fall, male androgen levels drop. and
the canary song system shrinks in size as his singing abates.
In a sense, the male canary rebuilds much of his song
control system anew each year as courtship begins. This
may enable him to learn new songs more easily and, with
his enlarged repertoire, gain some advantage in attracting
a mate.
Syrinx
FIGURE A
Blue Circles represent the vocal control regions In male and female zebra finches.
. WHY AND HOW MALE AND FEMALE BRAINS DIFFER 553
Direct Genetic Effects on Sexual Differentiation of the Brain. The
classic view of sexual differentiation, and the one discussed in this chap-
ter, gives genetics only an indirect role in determining the gender of an
individual: Genes direct the development of the gonads and the hormonal
secretions of the gonads control sexual differentiation. While there is no
question that hormones are extremely important in sexual development,
recent research suggests that genes may sometimes be more directly in-
volved in sexual differentiation, at least in some species. The most com-
pelling evidence comes from studies of birds. In one particularly dramatic
study, Agate et a1. examined the body and brain of a rare, naturally occur-
ring zebra finch. This bird, technically a gynandromorph (meaning that it has
both male and female tissues). was genetically female on the left side of its
body and brain and genetically male on the right side (Figure 17.13). As
both sides of the brain were exposed to the same circulating hormones,
they should be equally masculine or feminine if hormones are entirely re-
sponsible for sexual differentiation. However, the brain areas associated
with singing (see Box 17.1) were masculine on the right side and feminine
Right
Left
.
,
- -- .
'.:
'...........
to
.
(a)
R .;S L
t
.- ,,- .....
- . ..
-
(c)
(b)
R
L
-.....--
L
.. "
--
. . .
..- "
./- -.
. ..
. 1.
(d)
FIGURE 17./3
Brain analysis of a gynandromorphic zebra finch. (a) This bird had female
plumage on its left side and male plumage on its right. (b) The HVC nucleus (hyperstriatum
ventrale. pars caudalis) controls singing. It is larger on the genetically male right side (dark
patch of labeled neurons). (c) An autoradiogram showing the expression of a gene normally
expressed only in females labels only the left side of the brain. (d) An autoradiogram
showing the expression of a gene normally more highly expressed in males labels the right
side of the brain more than the left (Source: Arnold, 2004. Fig. 4.)
554 CHAPTER 17 . SEXANDTHEBRAIN
Box 17.2
... ,
".
.
...
...
OF SPECIAL INTEREST
John/Joan and the
Basis of Gender Identity
John was a normal healthy baby boy when he was born
in 1965. But during a routine circumcision. an accident
with an electrocautery device burned John's entire penis.
John's parents were referred to Johns Hopkins Univer-
sity. where they met Dr. John Money. Dr. Money recom-
mended a sex-change operation, and his hypothesis was
that, at birth, babies are essentially gender-neutral; their
identity as male or female is determined by their subse-
quent life experiences and identification with their
anatomy. Because it was not possible to give john normal-
appearing male genitals, it was recommended that the
boy be castrated and undergo cosmetic surgery, followed
by estrogen treatment at puberty, to turn him into a
girl, joan. Faced with a terrible decision, john's parents
were eventually convinced that surgery combined with a
female upbringing gave their child the best chance at a
normal life.
In Dr. Money's accounts of john's life after his trans-
formation into joan, it sounds as if the child adapted well
and became a happy normal girl. The case even made it
into the popular press, as evidenced by a 1973 article in
Time magazine: "This dramatic case . . . provides strong
support . . . that conventional patterns of masculine and
feminine behavior can be altered. It also casts doubt on
the theory that major sex differences, psychological as
well as anatomical, are immutably set by the genes at
conception." I At that time, dramatic societal changes
were taking place in the roles of men and women, and the
success of john as a female appeared to confirm that
society created gender identity as much as, or more than,
biology.
Unfortunately, a follow-up report revealed that John's
gender transformation was a disaster from the outset.
I Time. Jan. 8, 1973, p. 34.
According to john and his twin brother, john's behavior
was always much more like other boys than girls. john
rebelled at wearing girls' clothing and playing with tra-
ditional girls' toys. Despite cosmetic surgery and female
indoctrination, as an adult, john said that he had sus-
pected he was a boy as early as the second grade and
imagined growing up to be a muscular man. As a child,
john was incessantly teased and ostracized. He knew
nothing about the failed circumcision and subsequent
surgery, nor the fact that he was genetically a male. How-
ever, as he got older, he was more attracted to girls than
boys, and he expressed the opinion that he felt like a boy
trapped in a girl's body. By the age of 14, after being on
estrogen for 2 years, he looked increasingly like a girl,
but he stopped living as one. John's father finally told him
what had happened when he was young. john immediately
requested sex-change hormonal therapy and surgery.
For years, john dealt with the overwhelming emotional
problems resulting from his past. He married, adopted his
wife's children, and happily worked a physically demanding
job as a janitor in a slaughter house. In the I 990s, john
revealed his identity and real name, David Reimer, and
collaborated on a book about his life. 2 After numerous
traumatic events in his life, including the death of his
twin brother, David committed suicide in 2004 at the age
of 38.
David Reimer's experiences demonstrate that, rather
than being gender neutral, he had a "male brain" from the
outset. Evidently his genetically determined gender could
not be suppressed even with sex-change surgery, hor-
monal therapy, and a female upbringing. Clearly, gender
identity involves a complex interplay of genetics, hor-
mones, and life experiences.
2Colapinto, 200 I.
on the left side, suggesting that different gene expression and not sex hor-
mones in the two brain halves led to the brain dimorphisms.
Attempts to find direct genetic effects on sexual differentiation in
mammals have only recently begun. However, Eric Vilain and his col-
leagues at U.C.LA. have found that of the 12,000 genes active in the
mouse brain. 5-1 are expressed at different levels in male and female brains
before the formation of the gonads. The function of these genes is not yet
known.
. WHY AND HOW MALE AND FEMALE BRAINS DIFFER 555
The Activational Effects of Sex Hormones
Long after sex hormones have determined the structure of the reproduc-
tive organs, they can have activational effects on the brain. These effects
range in scale from temporary modifications in brain organization to changes
in the structure of neurites. In men, testosterone has a two-way interaction
with sex. On the one hand, testosterone levels rise in anticipation of sex or
even while fantasizing about it. Conversely, reduced testosterone levels are
associated with decreased sexual interest. It has been reported that women
are more likely to initiate sex when estradiolleveIs are highest during their
menstrual cycle. Through unknown mechanisms, hormone levels in both
sexes influence the brain and an individual's interest in sexual behavior.
Brain Plasticity and Maternal Behavior. Patterns of sexual behavior
vary over time. In some species, reproduction occurs only during a partic-
ular season, and mating may occur only during a specific phase of that
season. Obviously, females of all species nurse their offspring only after
birth and only temporarily. In most animals, but not in humans, sexual at-
tractiveness and copulation occur only during certain phases of the estrous
cycle. Sexually dimorphic changes in the brain are sometimes transient or
cyclical, coinciding with the sexual behavior to which they are related. For
example, in female rats the somatosensory cortex contains a sensory rep-
resentation of the ventral skin surrounding the nipples; this representation
expands dramatically but temporarily across the cortex during the time the
mother rat nurses her young (Figure 17.14). It is an interesting example of
somatosensory map plasticity (see Chapter 12).
/l
)
"-
Primary
somatosensory
cortex
H
Hindlimb /
(HL) Dorsal surface
Ventral
SUrfac: C
FL Neck
,\Tail
> \
Hindlimb Q )
(HL) 0 Dorsal (
FL
surface
Hl\
F Ventral
surface
Ventral
surface,
Forelimb (FL
FL "- Neck
FL Forelimb
(FL)
(b)
Lactating
NonJactating
FIGURE 17.14
The effect of lactation on a sensory
representation in the cortex. (a) The
ventral skin of a nursing rat mother; showing
the location of the nipples along one side.
(b) The rat's brain (top) and primary
somatosensory cortex. The boxed area,
expanded below, illustrates how the cortical
region that responds to the ventral skin
around the nipples is enlarged in a postpar-
tum lactating mother (left) compared to a
postpartum nonlactating mother (nght). Re-
gions of somatosensory cortex subserving
other regions of the body were not affected
by the lactating state. (Source: Adapted from
Xerri et a!.. 1994.)
556 C HA PT E R 17 . SEXANDTHE BRAIN
,
'.:
, t&
\ '
.'
'..
(a)
t ..
. 11\'"
'II . .,
- : \..
(b)
FIGURE 17-' 5
The effect of estrogen on neurite
growth in the hypothalamus. Toward
the bottom of each photograph is a piece of
hypothalamic tissue from a newbom mouse.
(a) Without the addition of estrogen. a rela-
tively small number of neuntes grow from the
tissue. (b) With the additior of estrogen.
there is an exuberant growth of neurites.
(Source: Toran-Allerand. 1980.)
Estrogens, Neurite Growth, and Disease. Estrogens have dramatic effects
on the growth of neurites and. more specifically, dendritic spines. Figure 17.15
shows results from the work of Dominique Toran-Allerand at Columbia
University. She [ound that estradiol treatment of tissue taken from the
hypothalamus of newborn mice causes a great degree of neurite outgrowth.
Other studies have shown that estradiol increases cell viability and spine
density. Taken together these findings suggest that estrogens play an impor-
tant role in forming neuronal circuitry during brain development.
[n 1990. Elizabeth Gould, Catherine Woolley, Bruce McEwen, and their
colleagues, working at Rockefeller University, reported a fascinating exam-
ple of estradiol's activational effects (Box 17.3). They counted dendritic
spines on neurons in the hippocampus of female rats and found that the
number of spines fluctuated dramatically during the 5-day estrous cycle.
Spine density and estradiol levels peaked together, and treatment with
injected estradiol also increased the numbers of spines in animals whose
natural estradiol levels were kept low (Figure 17.16). Since spines are the
major site of excitatory synapses on dendrites (see Chapter 2), this provides
a possible explanation for the fact that hippocampal excitability also seems
to track the estrous cycle. The hippocampus of experimental animals more
easily generates seizures, for example, when estrogen levels increase (Fig-
ure 17.17). Woolley and McEwen showed that it is indeed estradiol itself
that triggers the increase in spine numbers. and that as hippocampal neurons
grow more spines, they also grow more excitatory synapses. Furthermore,
the new spines seem to have more of the NMDA type of glutamate receptor.
Estradiol-treated
{
.
..
..
I 10 <m
I 50 lm
FIGURE 17.16
An activational effect of steroid hormones. Estradiol treatment causes an increase
in the number of dendritic spines on hippocampal neurons. (Source: Adapted from Woolley
et al.. 1997.)
... WHY AND HOW MALE AND FEMALE BRAINS DIFFER 557
50
:::J
-€ 40
01
N
b 30
a 20
'6
(jj 10
w
0
(a)
:::J
E
en
'"
b
Q)
c
0
(jj
(jj
Q)
01
e
a. E D 0 P E
(b)
250
<-
2= 200
-0
a
-c 150
(/)
Q)
-E 100
Q)
::; Midnight
N
'a; 50 Noon
CfJ
0 ,
(c) 0 0 P E 0 0 P E
FIGURE /7.17
Fluctuations of hormone levels during the estrous cycle and hippocampal
seizure threshold. The circulating levels of (a) estradiol and (b) progesterone. (c) The
threshold (in terms of stimulating current) for triggenng a seizure in the hippocampus of a
female rat during the estrous cycle The phases of the estrous cycle are 0, disestrous;
P. proestrous; E. estrous. (Sources; a and b, Smith e1 al.. 1995; c. Terasawa and Timiras, 1968.)
This could explain why estradiol also enhances long-term synaptic plastic-
ity in the hippocampus (see Chapter 25).
How does estradiol increase the numbers of hippocampal spines and
excitarory synapses? Experiments by Diane Murphy, Menachem Segal, and
their colleagues at the National Institutes of Health and the Weizmann
lnstitute in Israel, suggest that the direC1 effect of estradiol in the hippocam-
pus is to depress synaptic inhibition. Estradiol receprors in the hippocampus
are primarily within inhibitory interneurons, which paradoxically are not
the cells that grow more spines. However, estradiol causes the inhibitory
cells to produce less GABA, their neurotransmitter, and therefore synaptic
inhibition becomes less effective. Less inhibition, in turn, leads ro an increase
in general neural activity, which somehow triggers an increase in spines
and excitarory synapses on the pyramidal cells. Putting the pieces together,
it seems that estradiol produces a hippocampus with less-effective inhibitory
synapses and additional excitarory circuitry.
We can only speculate about the behavioral significance of these results.
In rats, the hippocampus is particularly important for spatial memory and
navigationaJ skills. Woolley notes that the peak in hippocampal spine
558 C HAP T E R I 7 . SEX AND THE BRAIN
Box 17.3
PATH OF DISCOVERY
..
,
J:..
Estrogen and Synapses
in the Hippocampus
My interest in the plasticity of brain circuitry began simply
by looking at neurons through a microscope. From 1987 to
1993, I was a graduate student at Rockefeller University
working on my Ph.D. with Bruce McEwen. Mirroring Bruce's
energy and enthusiasm. the McEwen lab was a bustling place,
full of people and ideas and many different projects all re-
lated to understanding how steroid hormones affect the
brain. I had the good luck to meet Elizabeth Gould, who
joined the lab as a postdoctoral researcher in 1989. Liz
suggested that I needed to improve my knowledge of brain
circuitry, and she gave me a set of Golgi-stained brain sec-
tions to work from. In Golgi-stained tissue, a small propor-
tion of neurons and glia are filled with a dark precipitate
that allows one to visualize the structure of individual cells
in fine detail. Using this stain, the great Spanish neurohistol-
ogist Cajal described much of brain development and, even
more amazingly, correctly inferred important principles of
brain function--all by observing the shapes and arrange-
ments of neurons! I was fascinated by this history and by
the beauty of Golgi-stained neurons and glia.
The brain sections that Liz gave me to look at had been
prepared from female rats treated with estrogen for a study
of estrogen's effects in the hypothalamus. These sections
.
by Catherine S. Woolley
also happened to contain the hippocampus because it is at
the same level in the rat's brain. I became particularly in-
terested in the dendritic spines on hippocampal neurons;
spines are tiny protrusions that stud dendrites and are the
sites of excitatory synaptic connections (Figure A). I spent
many joyful hours at the microscope studying the patterns
of dendritic spines in the hippocampus and thinking about
the infrastructure of information processing in the brain. I
began to wonder how plastic that infrastructure might be.
I got a surprising answer to that question when Liz and I
compared the density of dendritic spines on hippocampal
neurons from rats with high estrogen levels to those with
low estrogen levels. We found that estrogen increased the
density of spines. both with hormone treatment and with
natural hormone fluctuations during the estrous cycle. Next,
I used electron microscopy to show that the density and
number of excitatory synapses is increased by estrogen, in
parallel with dendritic spine density. These findings, which
were published in the early I 990s. were surprising because,
at the time. few neuroscientists believed that the formation
and elimination of synapses could be a part of normal brain
function in adulthood; adult brain circuitry was widely
viewed as "hard wired." In addition, the hippocampus was
number coincides with the rat's peak in fenility. During that period, the
female actively seeks out mates, which may require the heightened spatial
ability that might come with a more excitable, NMDA-receptor-filled hip-
pocampus. Thus, the female rat's brain may fine-tune itself on a 5-day cycle
in order to meet changing reproductive needs.
Estradiol has also been shown to have a protective effect on neurons. In
neuronal cultures, cells are more likely to survive hypoxia, oxidative stress,
and exposure to various neurotoxic agents if they are exposed to estradiol.
Clinically, estrogen replacement therapy may aid in the treatment of cer-
tain neurological disorders. Researchers have observed that increased
levels of sex hormones during pregnancy are associated with a reduced
severity of multiple sclerosis, and there is some evidence that estrogen
may benefit women with multiple sclerosis. Evidence also suggests that es-
trogen replacement therapy might delay the onset of Alzheimer's disease
and decrease tremors in Parkinson's disease. The benefit of estrogens in
these diseases probably involves multiple cellular mechanisms. and the
neuroprotective role of c'>trogens and their possible use in treatment are
somewhat controversial.
not thought to contain many estrogen receptors; it was not
expected that reproductive hormones like estrogen play a
significant role in the hippocampus. which is important in
learning and memory and in epilepsy. One exception to that
view was the classic work ofTerasawa and Timiras, who had
shown in the 1960s that the threshold for epilepsy-like
seizure activity in the hippocampus also depended on estro-
gen and fluctuated across the estrous cycle. Remarkably, the
timing of estrogen-induced seizure susceptibility was pre-
.
Axon
J
Dendrite
FIGURE A
Confocal microscopic image of a fluorescently labeled dendrite and
axon from the human hippocampus. One swollen region along the
axon contacts a dendritic spine on the dendnte where they likely
form a synapse. (Courtesy of Catherine S. Woolley.)
Sexual Orientation
.. WHY AND HOW MALE AND FEMALE BRAINS DIFFER 559
cisely related to the increase in excitatory synapse numbers
we observed.
The next step was to explore the functional consequences
of structural plasticity induced by estrogen and to find out
whether there was a connection to epilepsy. I moved to the
University of Washington for postdoctoral training with
Philip Schwartzkroin. whose lab had a strong commitment
to combining anatomical and electrophysiological approaches
in epilepsy research. Working with Phil, I was able to con-
firm that increased numbers of dendritic spines and
synapses in rats with high estrogen levels do indeed corre-
late with increased sensitivity to excitatory synaptic input.
specifically input mediated by the NMDA subtype of gluta-
mate receptor. I also honed my skills in serial-section
electron microscopy. Using this technique. I found that es-
trogen-induced dendritic spines change the pattern of synap-
tic connectivity in the hippocampus in a way that could fa-
cilitate synchronous neuronal firing. a key factor in seizure
activity.
Now that I have my own lab at Northwestern University.
my students and I continue to study how hormones influ-
ence synaptic connections in the brain-from molecular
mechanisms to functional consequences. It has turned out
that estrogen has much broader and more varied effects on
hippocampal neurons and synapses than was evident from
those early studies in the 1 990s. As we move forward in
our research, we continue to be amazed at the power of
hormones to drive plasticity of brain circuitry to alter brain
function and guide behavior.
Although estimates vary widely, about 3% of the American population is
homosexual. In light of the behavioral differences between, for example,
male homosexuals and male heterosexuals, are the brains different? Is
there a biological basis for sexual orientation? In some sense, this must be
true if we believe that all behavior is based on brain activity. But are the
biological differences macroscopic, or are they embedded in the scattered
thousands of unobservable synaptic connections that store a lifetime of
experiences? We saw earlier that there may be gender differences in the
INAH. Relevant here is the observation that INAH-3 is about twice as large
in men as in women, a difference that may be related to sexually dimor-
phic behavior.
Some studies of the INAH suggest that there are differences between
homosexual and heterosexual brains that might be related to sexual orien-
tation. Simon LeVay, then working at the Salk Institute found that INAH-3
in gay men is only half the size of the nucleus in straight men (Figure
17.18). In other words, INAH-3 in homosexual men is similar in size to
560 C HAP T E R I 7 . SEX AND THE BRAIN
t\.
....\
"
\
1 J r 4:-
2
..
....
..J.........
" - ,
,
'.
Optic chiasm
\ .
(a)
.:.:f-:
...::
'.'-A
..... ,',.' .:..
.... 10.. I!. .
r.' .
-
r"
..
. t.
r
.. ..ell
r" .-
.
....t
.
,",
j'
..-,
.w ...,.
....
.' '!
...
,
; .
I .
(b)
(c)
FIGURE 17.18
The location and size of INAH-3. (a) The location of the four INAH nuclei in the
hypothalamus. In the micrographs, arrows indicate INAH-3 in (b) a heterosexual man and
(c) a homosexual man. In the homosexual. the nucleus is smaller and the cells more scat-
tered. (Source: Micrographs from LeVay, 1991, p. 1035.)
that of women. While this finding may indicate a biological basis for homo-
sexuality, it is difficult to interpret in terms of complex human behavior.
Moreover. subsequent studies have not always confirmed a correlation
between INAH-3 size and sexual orientation.
Other research has found the anterior commissure and suprachiasmatic
nucleus to be larger in male homosexuals than male heterosexuals. One
study reported that the bed nucleus of the stria terminalis is larger in men
than in women and that male-to-female transsexuals have a nucleus com-
parable in size to females. Collectively. these studies offer the intriguing
prospect that complex aspects of human sexual behavior may ultimately be
linked to distinct brain organization. However. the difficulties involved in
comparing brains. as weB as the history of brain dimorphisms. suggest that
caution is advised until a research consensus is reached.
.. CONCLUDING REMARKS
The subject of sex and the brain is complicated by the subtleties of the
biological and cultural mechanisms that determine sexual behavior. Partic-
ularly in humans. the anatomical differences between the female and male
nervous systems are not readily apparent. and indeed. most human be-
havior is not distinctly masculine or feminine. Where small brain differ-
ences between the sexes occur. any adaptive purpose they may serve is not
clear. And in no case is the neurobiological basis for sex differences in cog-
nition known.
Nevertheless, the essential biological imperative-reproduction-demands
sex-specific behaviors. at least for mating and giving birth. For the most
'f' CONCLUDING REMARKS 561
concretely sexual structures (such as the muscles and motor neurons con-
trolling the penis or the sensory afferents innervating the clitoris), identi-
fying some of the peripheral and spinal neural systems involved is fairly
easy. The powerful role of sex hormones in sexual development and be-
havior is also clear. But the more complex aspects of sexual behavior and
the brain systems that generate them are still quite mysterious.
We have touched on only a few of the issues that define the study of sex
and the brain, and most of the basic questions remain unanswered. Scien-
tific research about sex was long hampered by society's reluctance to talk
openly about the subject, and sexual politics still tends to muddy the sci-
entific waters today. But sexual behavior is a defining feature of being hu-
man, and understanding its neural basis is a worthy challenge.
...
\
>-V)
w1:
c:::
w
.....
Sex and Gender
gender identity (p. 535)
sex-determining region of the Y
chromosome (SRY) (p.535)
Why and How Male and
Female Brains Differ
sexual dimorphism (p.546)
sexually dimorphic nucleus (SON)
(p.547)
interstitial nuclei of the anterior
hypothalamus (INAH) (p. 547)
organizational effect (p. 550)
activational effect (p. 551)
gonadotropins (p. 539)
gonadotropin-releasing hormone
(GnRH) (p. 539)
menstrual cycle (p. 539)
estrous cycle (p. 540)
The Hormonal Control of Sex
androgen (p. 538)
estrogen (p. 538)
luteinizing hormone (LH) (p. 539)
follicle-stimulating hormone (FSH)
(p. 539)
The Neural Basis of Sexual
Behaviors
polygyny (p. 543)
polyandry (p. 543)
monogamy (p. 543)
,£1]
V)
Z
w
0
>
W .....
c::: V)
w
:J
a
I. Suppose you have just been captured by aliens who have landed on Earth to learn about humans. The aliens
are all one gender, and they are curious about the two human genders. To earn your freedom, all you must
do is tell them how to re iably distinguish males from females. What biological and/or behavioral tests do you
tell them to conduct? Be sure to describe any exceptions that might violate your gender tests-you don't
want the aliens to get angry!
2. Trace the chain of events that might link psychological stress and reduced male sperm production and
potency.
3. Figure 17.14 shows an interesting but unexplained observation: In the brain of a mother rat during periods
of lactation, the size of the somatosensory cortex representing the skin around the nipples expands. Spec-
ulate about a likely mechanism for this phenomenon. Suggest a reason why such brain plasticity might be
advantageous.
4. Estradiol is usually described as a female sex hormone, but it also plays a critical role in the early develop-
ment of the male brain. Explain how this happens. and why the female brain is not similarly affected by estra-
diol at the same stage of development.
5. Where and how can steroid hormones influence neurons in the brain. at the cellular level?
6. Suppose a research team has just claimed that a small and obscure nucleus in the brain stem. nucleus X, is
sexually dimorphic and essential for certain "uniquely male" sexual behaviors. Discuss the kinds of evidence
you would need to accept these daims about (a) the existence of a dimorphism. (b) the definitions of uniquely
male behaviors. and (c) the involvement of nucleus X in these sexual behaviors.
562 C HAP T E R I 7 . SEX AND THE BRAIN
DO
O:::l?
Wz
I-
1-0
0:::«
:JW
u..o:::
Amateau SK, McCarthy MM. 2004. Induction of
PGE2 by estradiol mediates developmental mas-
culinization of sex behavior. Nature Neuroscience
7:643-650.
Arnold AP. 2004. Sex chromosomes and brain gen-
der. Noture Reviews Neurosdence 5:701-708.
Colapinto J. 200 I. As Noture Made Him: The Boy Who
Was Raised as a Girl. New York: HarperCollins.
Fausto-Sterling A. 2000. Sexing the Body. New York:
Basic Books.
Maggi A, Ciana P, Belcredito S,Vegeto E. 2004. Estro-
gens in the nervous system: mechanisms and non-
reproductive functions. Annual Review of Physiology
66:291-313.
Morris JA, Jordan CL, Breedlove SM. 2004. Sexual
differentiation of the vertebrate nervous system.
Nature Neurosdence 7: I 034-1039.
Pfaus JG. 1999. Neurobiology of sexual behavior.
Current Opinion in Neurobiology 9:751-758.
Valente SM, LeVay S. 2003. Humon Sexuality. Sunder-
land, MA: Sinauer.
Brain Mechanisms
of Emotion
INTRODUCTION
WHAT IS EMOTION?
THEORIES OF EMOTION
The james-Lange Theory
The Cannon-&rd Theory
Unconscious Emotions
THE LIMBIC SYSTEM CONCEPT
BROCA'S LIMBIC LOBE
THE PAPEZ CIRCUIT
. Box 18.1 Of Spcciallntcrest: Phineas Gage
DIFFICULTIES WITH THE SINGLE EMOTION SYSTEM CONCEPT
THE KLUVER-BUCY SYNDROME
THE AMYGDALA AND ASSOCIATED BRAIN CIRCUITS
ANATOMY OF THE AMYGDALA
THE AMYGDALA AND FEAR
A Neural Circuit for Learned Fear
. Box 18.2 Path of Discovery: Brains Through the Back Door, by Joseph LeDoux
THE AMYGDALA AND AGGRESSION
Surgery to Reduce Human Aggression
. Box 18.3 Of Speciallnteresl: The Frontal Lobotomy
NEURAL COMPONENTS OF AGGRESSION BEYOND THE AMYGDALA
The Hypothalamus and Aggression
The Midbrain and Aggression
SEROTONIN AND AGGRESSION
Serotonin Receptor Knockout Mice
CONCLUDING REMARKS
CHAPTER
564 C HAP T E R I 8 . BRAIN MECHANISMS OF EMOTION
.... ..
,!(..... t'
,:'.:..........._.
-- 1- --
-t-"
I
'" - "r '..
., .!.
" - - . ..
. -';k:- . to
. ;-''-' , .., :.
;'1:"
:l _ " >'
.
' l ,
It, :
.
.......
V I
f'
.
.'
.:: -:- - I ___'_..; _
w.,-L <::--'>-:2=:' ,- .>"-- - -- '"
( - -- -= :"' ,
-, ) .- :? -, )
FIGURE 18.1
The emotional expression of a cat
terrified by a dog. This drawing is from
Darwin's book. The Expression of the EmotIons
in Man and Animals. Darwin conducted one
of the first extensive studies of emotional
expression. (Source: Darwin, 1872/1955,
p. 125.)
... INTRODUCTION
To appreciate the significance of emotions, just imagine life without them.
Instead of the daily highs and lows we all experience, life would be a great
empty plain of existence with no significance. Without question, the expres-
sion of emotion is a large part of being human. Aliens in science fiction
movies often look just like Earthlings, but they appear inhuman simply be-
cause they exhibit no emotions.
In this chapter, we explore the neural basis of emotion. But how can
we study something as ephemeral as one's feelings? If you are studying a
sensory system, you can present a stimulus and seek neurons that respond
to it. You can manipulate the stimulus to determine the stimulus attributes
(e.g., light intensity, sound frequency) that are best for evoking a response.
It is not as straightforward to study emotions in animals that cannot tell us
their subjective feelings. What we observe are the behavioral manifestations
of the internal emotions. Therefore, we must carefully distinguish between
emotional experience and emotional expression. What we know about the
brain mechanisms of emotion has been derived from a synthesis of animal
and human studies. In animals, the effects of brain lesions on emotional
expression have been noted, and in specific cases, the activity of individual
neurons has been recorded in emotional situations. Studies in humans
have examined brain activity associated with emotional experience and the
recognition of emotion in others.
The rapid development of human brain imaging techniques in the past
decade has given rise to a renaissance in the study of emotion. Affective
neuroscience is a relatively new term applied to the investigation of the
neural basis of emotion and mood. We will not cover mood in this chapter
(mood disorders are discussed in Chapter 22), but some scientists consider
mood to be an emotion extended in time.
We are not yet at a stage where we can map out an emotion system the
same way that the visual system has been outlined. Indeed, there probably
is not a single system of emotion. Nonetheless, we will see that a group of
interconnected structures, including the hypothalamus, the amygdala, and
parts of the cerebral cortex, appear to be intimately involved in the pro-
cessing of emotions.
... WHAT IS EMOTION?
Emotions-love, hate, happiness, sadness, fear, anxiety, and so on-are
[eelings we all experience at one time or another. But what precisely defines
those feelings? Are they sensory signals from our body, diffuse patterns of
activity in our cortex, or something else?
Theories of Emotion
In the nineteenth century, several highly regarded scientists, including
Darwin and Freud, considered the role of the brain in the expression of
emotion (Figure 18.1). Careful observations of emotional expression in
animals and humans, and emotional experience in humans, led to the
development of theories relating emotional expression and experience.
The James-Lange Theory. One of the first well-articulated theories of
emotion was proposed in 1884 by the renowned American psychologist
and philosopher William James. Related ideas were proposed by Danish
psychologist Carl Lange. This theory, commonly known as the James-
Lange theory of emotion, proposed that we experience emotion in response
T WHAT IS EMOTION! 565
to physiological changes in our body. For example, we feel sad because we
cry rather than cry because we are sad. Our sensory systems send infor-
mation to our brain about our current situation, and as a result, our brain
sends signals out to the body, changing muscle tone, heart rate, and so on.
The sensory systems then react to the changes evoked by the brain, and it
is this sensation that constitutes the emotion. According to James and
Lange, the physiological changes are the emotion, and if they are removed,
the emotion will go with them. This seems like a backward idea to many
people today, as it did to many contemporaries of James and Lange. Until
this theory was proposed, the commonly held conception was that an
emotion is evoked by a situation and the body changes in response to the
emotion. The James-Lange theory is the exact opposite.
Consider one of the thought experiments suggested by James. Suppose
you are boiling with anger about something that has just happened. Try to
strip away all the physiological changes associated with the emotion. Your
pounding heart is calmed, your tensed muscles are relaxed, and your
flushed face is cooled. It's hard to imagine maintaining rage in the absence
of any physiological signs. In fact, this little experiment isn't all that differ-
ent from the technique used in meditation classes to relieve stress.
Here's another example. You're on a first date with someone you are
really attracted to, and you're swimming in a steaming soup of emotions
that include happiness, love, lust, and anxiety. Then, pooH All at once, the
physiological signs of your infatuation are removed (like taking an imaginary
cold shower). Are you still feeling the same emotional state? Probably not.
Even if it is true that emotion is intimately tied to physiological state, this
doesn't mean that emotion cannot be felt in the absence of obvious phys-
iological signs (a point even James and Lange would concede). But for
strong emotions that are typically associated with physical change, there is
a close relationship between emotion and its physiological manifestation,
and it is not obvious which causes which.
The Cannon-Bard Theory. Although the James-Lange theory became
popular in the early twentieth century. it soon came under attack. In 1927,
American physiologist Walter Cannon published a paper containing several
compelling criticisms of the James-Lange theory and went on to propose a
new theory. Cannon's theory was modified by Philip Bard, and the Cannon-
Bard theory of emotion, as it came to be known, proposed that emotional
experience can occur independently of emotional expression.
One of Cannon's arguments against the James-Lange theory was that
emotions can be experienced even if physiological changes cannot be sensed.
To support this claim. he offered the cases of animals he and others studied
after transection of the spinal cord. Such surgery eliminated body sensa-
tions below the level of the cut, but it did not appear to abolish emotion.
To the extent possible with muscular control of just the upper body Or
head, the animals still exhibited signs of experiencing emotions. Similarly,
Cannon noted human cases in which a transected spinal cord did not
diminish emotion. If emotional experience occurs when the brain senses
physiological changes in the body, as the James-Lange theory proposed.
then eliminating sensation should also eliminate emotions, and this did not
appear to be the case.
A second observation of Cannon's that seems inconsistent with the
James-Lange theory is the lack of a reliable correlation between the expe-
rience of emotion and the physiological state of the body. For example, fear
is accompanied by increased heart rate, inhibited digestion, and increased
sweating. However, these same physiological changes accompany other
emotions. such as anger. and even nonemotional conditions of illness, such
566 C HAP T E R I 8 . BRAIN MECHANISMS OF EMOTION
FIGURE 18.2
A comparison of the James-Lange
and Cannon-Bard theories of emotion.
In the James-Lange theory (red arrows). the
man perceives the threatening animal and
reacts. As a consequence of his bOdy's re-
sponse to the situation. he becomes afraid.
In the Cannon-Bard theory (blue arrows). the
threatening stimulus first causes the feeling of
fear. and the man's reaction follows.
Emotional
experience (fear)
",\\1///
"'- J /'
---- :';j.,}:; --
-\- -
__ r:::r.. __
/' ........
/// I \\"
..
\l
,
.>...
,"
Sensory
stimulus
Jq/J}
S''-ctn
II} ge
e0l)l
\
Stimulus
perceived
Emotional expression
(somatic. visceral response)
as fever. How can fear be a consequence of the physiological changes, when
these same changes are associated with states other than fear?
Cannon's new theory focused on the idea that the thalamus plays a
special role in emotional sensations. The theory proposes that sensory input
is received by the cerebral cortex, which in turn activates certain changes
in the body. But according to Cannon, this stimulus-response neural loop
is devoid of emotion. Emotions are produced when signals reach the thal-
amus either directly from the sensory receptors or by descending cortical
input. In other words, the character of the emotion is determined by the
pattern of activation of the thalamus. An example may clarify the differ-
ence between this and the James-Lange theory. According to James and
Lange, you feel sad because you cry; if you could prevent the crying, the
sadness should go, too. In Cannon's theory. you don't have to cry to feel
sad; there simply has to be the appropriate activation of your thalamus in
response to the situation. The James-Lange and Cannon-Bard theories of
emotion are compared in Figure 18.2.
Many theories of emotion have been proposed since the days of the
James-Lange and Cannon-Bard theories. Subsequent work has demon-
strated that each theory has merits as weJl as flaws. For instance, contrary
to Cannon's statements, fear and rage have been shown to be associated
with distinguishable physiological responses, even though they both acti-
vate the sympathetic division of the automatic nervous system (ANS). Al-
though this does not prove that these emotions result from distinct physi-
ological responses, the responses are at least different. Research has also
shown that, to some extent, we can be aware of our body's autonomic
function (called interoceptive awareness), a key component of the James-
Lange theory. For example, people have been shown to be capable of judg-
ing the timing of their heartbeat, and increased activity is found in certain
brain areas when this task is performed.
Another interesting chaUenge to the Cannon-Bard theory, demonstrated by
later studies, is that emotion is sometimes affected by damage to the spinal
cord. In one study of adult men with spinal injuries, there was a correlation
between the extent of sensory loss and reported decreases in emotional expe-
riences, though other studies of people with spinal injuries have not always
found a similar correlation. Some evidence indicates that forcing oneself to
express an emotion-such as smiling in order to feel happy-sometimes works.
... WHAT IS EMOTION? S67
Unconscious Emotions. Although these findings may be counterintuitive,
recent studies suggest that sensory input can have emotional effects on the
brain without our being aware of the stimuli. Several related experiments
were conducted by Arne Ohman, Ray Dolan, and their colleagues in Sweden
and England. They first showed that if an angry face is briefly flashed and
quickly followed by a photo of an expressionless face, subjects report see-
ing only the expressionless face. The angry face is said to be perceptually
"masked," and the expressionless face is the masking stimulus.
In one experiment, subjects were shown a variety of faces without a
masking stimulus, and each time an angry face was shown, the subject's
finger got a mild electrical shock. After aversive conditioning like this, sub-
jects exhibited altered autonomic activity. such as increased skin conductance
(sweaty palms), when the angry faces were shown again. The researchers
were interested in what happens when the angry faces are occasionally
shown after conditioning but the masking stimulus is reintroduced. Sur-
prisingly, when angry faces were shown the subjects had an autonomic re-
sponse (increased skin conductance), even though they were unaware of
the angry faces. Furthermore, the autonomic response could not be condi-
tioned using happy faces. These findings indicate that the subjects responded
to the angry expressions on the aversive face stimu1i, even though they
were not perceptually aware of seeing the faces at all. The concept of an
unconscious emotion is based on this observation.
In a second experiment, subjects were shown angry faces with or without
a loud unpleasant sound (Figure 18.3). As before, the subjects did not per-
ceive the angry faces when a subsequent masking stimulus was presented.
Nonetheless, skin conductance showed that the subjects responded to the
angry faces that were paired with the sound. In addition, positron emission
Perception: Expressionless face
ANS: No effect
Perception: Expressionless face
ANS: Increased skin conductance
(b) Testing
\
"-
+ -
-
'\
Unpleasant
sound
Perception: Angry face
ANS: Increased skin conductance
I
(a) Conditioning
(c) Brain activity
FIGURE 18.3
Unconscious emotional brain activity. (a) Human subjects were conditioned on
photos of expressionless and angry faces. Subjects responded to the angry face, paired with
a loud unpleasant sound, with increased ANS activity (skin conductance). (b) In the testing
phase, an angry face was shown briefly. followed immediately by an expressionless face.
Subjects reported seeing only the expressionless face, but Increased skin conductance still
occurred. (c) Despite the fact that the angry face was not perceived in the testing phase,
amygdala activation (red and yellow) occurred only when an angry face preceded the
masking stimulus. (Source: c, Morris, Ohman, and Dolan, 1998.)
568 C HAP T E R I 8 . BRAIN MECHANISMS OF EMOTION
tomography (PET) imaging was used to record brain activity while the pho-
tos were presented. The brain images revealed that the angry faces condi-
tioned to be unpleasant evoked greater activity in the brain in a particular
location, the amygdala. We have more to say about the amygdala later in
the chapter. For now, the important point to remember is that measures of
both autonomic response and amygdala activity correlate with the presen-
tation of angry faces that are conditioned to be unpleasant, despite the fact
that the faces are not perceived.
If sensory signals can have emotional impact on the brain without our
being aware of it, this seems to rule out theories of emotion in which
emotional experience is a prerequisite for emotional expression. But even
with this conclusion, there are many possible ways for the brain to process
emotional information. We now turn to the pathways in the brain that
link sensations (inputs) to the behavioral responses (outputs) that charac-
terize emotional experience. In the remainder of this chapter, we will see
that different emotions may depend on different neural circuits, but par-
ticular parts of the brain appear to be especially important for multiple
emotions.
... THE LIMBIC SYSTEM CONCEPT
In previous chapters, we discussed how sensory information from peripher-
al receptors is processed along clearly defined, anatomically distinct path-
ways, to the neocortex. The components of a pathway collectively consti-
tute a system. For example, neurons located in the retina, lateral geniculate
nucleus (LGN). and striate cortex work together to serve vision, so we say
they are part of the visual system. Is there a system, in this sense, that
processes the experiencing of emotions? Beginning around 1930, some sci-
entists argued that there is, and it came to be known as the limbic system.
Shortly, we will discuss the difficulties of trying to define a single system for
emotion. But first, let's examine the origin of the limbic system concept.
Broca's Limbic Lobe
In a paper published in 1878, French neurologist Paul Broca noted that, on
the medial surface of the cerebrum, alJ mammals possess a group of corti-
cal areas that are distinctly different from the surrounding cortex. Using the
Latin word for "border" (limbus), Broca named this collection of cortical ar-
eas the limbic lobe because they form a ring or border around the brain
stem (Figure 18.4). According to this definition, the limbic lobe consists of
the cortex around the corpus calJosum, mainly in the cingulate gyrus, and
the cortex on the medial surface of the temporal lobe, including the hip-
pocampus. Broca did not write about the importance of these structures for
emotion, and for some time, they were thought to be primarily involved in
olfaction. However, the word limbic. and the structures in Broca's limbic
lobe, were subsequently closely associated with emotion.
The Papez Circuit
By the 1930s, evidence suggested that a number of limbic structures are
involved in emotion. Reflecting on the earlier work of Cannon, Bard, and
others, American neurologist James Papez proposed that there is an "emo-
tion system," lying on the medial wall of the brain, that links the cortex
with the hypothalamus. Figure 18.5 shows the group of structures that
have come to be called the Papez circuit. Each is connected to another by
a major fiber tract.
T THE LIMBIC SYSTEM CONCEPT 569
Cingulate gyrus
\ / Cut edge
(I of corpus
}.... \ callosum
'\ /
"-
/" ,
/
"- ,
"""----
..
""-
Cut edge of
brain stem
Temporal lobe /
(medial surface)
Hippocampus
FIGURE J 8.4
The limbic lobe. Broca defined the limbic lobe as the structures that form a ring around
the brain stem and corpus callosum on the medial walls of the brain. The brain stem has
been removed in the illustration to make the medial surface of the temporal lobe visible.
Papez believed, as do many scientists today, that the cortex is critically
involved in the experience of emotion. FoUowing damage to certain cortical
areas, there are sometimes profound changes in emotional expression with
little change in perception or intelligence (Box 18.1). Also, tumors located
near the cingulate cortex are associated with certain emotional distur-
bances, including fear, irritability, and depression. Papez proposed that ac-
tivity evoked in other neocortical areas by projections from the cingulate
cortex adds "emotional colorin.g."
Cingulate
cortex
Neocortex
/2'\
-"(
\
/ Fornix
"
,\
'\.. ! .
., ),
,'-
"
---'-- '
- Emotional experience
Anterior .
nuclei of
thalamus
/
Hypothalamus
\
Hippocampus
FIGURE 18.5
The Papez circuit. Papez believed that the experience of emotion was determined by
activity in the cingulate cortex and, less directly. other cortical areas. Emotional expression
was thought to be governed by the hypothalamus. The cingulate cortex projects to the
hippocampus, and the hippocampus projects to the hypothalamus by way of the bundle of
axons called the fornix. Hypothalamic effects reach the cortex via a relay in the anterior
thalamic nuclei.
570 C HAP T E R I 8 . BRAIN MECHANISMS OF EMOTION
Box 18.1
,,'.
OF SPECIAL INTEREST
...
...
IIIRI Phineas Gage
Brain damage can sometimes have a profound influence
on a person's emotional expression with little or no other
effects. One of the most famous examples is the case of
Phineas Gage. On September 13, 1848, while tamping
explosive powder into a hole to prepare for blasting at a
railroad construction site in Vermont, he made the mis-
take of looking away from what he was doing. His tamp-
ing iron hit a rock, and the powder exploded. The conse-
quences of this act are described by Dr. John Harlow in
an 1848 article entitled "Passage of an Iron Rod Through
the Head." When the charge went off, it sent the meter-
long, 6 kg iron rod into Gage's head just below his left
eye. After passing through his left frontal lobe, the rod
exited the top of Gage's head.
Incredibly. after being carried to an ox cart, Gage sat
upright on the ride to a nearby hotel and walked up a
long flight of stairs to go inside. When Harlow first saw
Gage at the hotel, he commented that "the picture pre-
sented was, to one unaccustomed to military surgery,
truly terrific" (p. 390). As you might imagine, the projec-
tile destroyed a considerable portion of the skull and left
frontal lobe, and Gage lost a great deal of blood. The hole
through his head was more than 9 cm in diameter. Har-
low was able to stick the full length of his index finger
into the hole from the top of Gage's head, and also up-
ward from the hole in his cheek. Harlow dressed the
wound as best he could. Over the following weeks, con-
siderable infection developed. No one would have been
surprised if the man died. But just about a month after
the accident, he was out of bed and walking around town.
Harlow corresponded with Gage's family for many years
and, in 1868, published a second article, "Recovery from
the Passage of an Iron Bar Through the Head:' describing
Gage's life after the accident. After Gage recovered from
his wounds, he was apparently normal except for one
thing: His personality was drastically and permanently
changed. When he tried to return to his old job as con-
struction foreman, the company found he had changed
so much for the worse that they wouldn't rehire him.
According to Harlow, before the accident Gage was con-
sidered "the most efficient and capable foreman. . . . He
possessed a well-balanced mind, and was looked upon by
those who knew him as a shrewd, smart business man,
very persistent in executing all his plans of operation"
(pp. 339-340). After the accident, Harlow described him
as follows:
He is fitful, irreverent, indulging at times in the gross-
est profanity (which was not previously his custom),
manifesting but little deference for his fellows, impa-
tient of restraint or advice when it conflicts with his
desires, at times pertinaciously obstinate, yet capri-
cious and vacillating, devising many plans of future op-
eration, which are no sooner arranged than they are
abandoned in turn for others appearing more feasible.
. . . His mind was radically changed, so decidedly that
his friends and acquaintances said he was "no longer
Gage." (pp. 339-340)
Phineas lived for another 12 years, but when he died,
no autopsy was performed. However, Gage's skull and
the tamping iron have been preserved in a museum at
Harvard Medical School. In 1994, Hanna and Antonio
Damasio and their colleagues at the University of Iowa
made new measurements of the skull and used modern
imaging techniques to assess the damage to Gage's brain.
Their reconstruction of the tamping iron's path is shown
in Figure A. The iron rod severely damaged the cerebral
cortex in both hemispheres, particularly the frontal lobes.
It was presumably this damage that led to Gage's emotional
outbursts and the drastic changes in his personality.
\
\
. "
.\ ...... \..-
\.. r ..
FIGURE A
The path of the iron rod
through Gage's skull.
(Source: Damasio et a/.,
1994, p. I 104.)
I.. .f
We saw in Chapter 15 that the hypothalamus integrates the actions of
the ANS. In the Papez circuit, the hypothalamus governs the behavioral
expression of emotion. The hypothalamus and neocortex are arranged so
that each can influence the other. thus linking the expression and experience
of emotion. In the circuit, the cingulate cortex affects the hypothalamus via
the hippocampus and fornix (the large bundle ofaxons leaving the hip-
pocampus), whereas the hypothalamus affects the cingulate cortex via the
anterior thalamus. The fact that communication between the cortex and
hypothalamus is bidirectional means that the Papez circuit is compatible
with both the James-Lange and the Cannon-Bard theories of emotion.
While anatomical studies demonstrated that the components of the Papez
circuit were interconnected as Papez had indicated, there was only sugges-
tive evidence that each was involved in emotion. One reason Papez thought
the hippocampus is involved in emotion is that it is affected by the virus
responsible for rabies. An indication of rabies infection, and an aid in its
diagnosis, is the presence of abnormal cytoplasmic bodies in neurons, espe-
cially in the hippocampus. Because rabies is characterized by hyperemotional
responses such as exaggerated fear and aggressiveness, Papez reasoned
that the hippocampus must be involved in normal emotional experience.
Although little evidence related to the role of the anterior thalamus, clinical
reports stated that lesions in this area led to apparent emotional distur-
bances, such as spontaneous laughing and crying.
You may have noticed the correlation between the elements composing
both the Papez circuit and Broca's limbic lobe. Because of their similarity,
the group of structures that hypothetically govern the sensation and ex-
pression of emotion are often referred to as the limbic system, even
though Broca's anatomical notion of the limbic lobe originally had nothing
to do with emotion. The term limbic system was popularized in 1952 by
American physiologist Paul MacLean. According to MacLean, the evolution
of a limbic system enabled animals to experience and express emotions and
freed them from the stereotypical behavior dictated by their brain stem.
Difficulties with the Single Emotion System Concept
We have defined a group of interconnected anatomical structures roughly
encircling the brain stem as a limbic system. Experimental work supports
the hypothesis that some of the structures in Broca's limbic lobe and the
Papez circuit playa role in emotion. On the other hand, some of the com-
ponents of the Papez circuit are no longer thought to be important for the
expression of emotion, such as the hippocampus.
The critical point seems to be conceptual, concerning the definition of an
emotion system. Given the diversity of emotions we experience, there is no
compelling reason to think that only one system-rather than several-is
involved. Conversely, solid evidence indicates that some structures involved
in emotion are also involved in other functions; there is not a one-to-one
relationship between structure and [unction. Although the term limbic system
is still commonly used, some question the utility of trying to define a single,
discrete emotion system.
The KlUver-Bucy Syndrome
Shortly after Papez's proposal of an emotion circuit in the brain, neurosci-
entists Heinrich Kluver and Paul Bucy, at the University of Chicago, found
that bilateral removal of the temporal lobes, or temporal lobectomy, in
rhesus monkeys has a dramatic effect on the animals' aggressive tendencies
and responses to fearful situations. The surgery produces numerous bizarre
T THE UMBIC SYSTEM CONCEPT 571
572 C HAP T E R I 8 . BRAIN MECHANISMS OF EMOTION
behavioral abnormalities collectively referred to as the Kliiver-Bucy
syndrome.
After temporal lobectomy, the monkeys appeared to have good visual
perception but poor visual recognition. Placed in a new environment, the
monkeys moved about exploring objects they saw. However, unlike normal
animals, they appeared to rely on placing objects into their mouth to iden-
tify them. If a hungry monkey was shown a group of objects it had seen
before, intermixed with food, the monkey would still go through the process
of picking up each object for study before consuming the food bits. A nor-
mal hungry monkey in the same situation would make a beeline for the
food. The monkeys also showed a markedly increased interest in sex.
The emotional changes in monkeys with Kluver-Bucy syndrome were
most dramatically represented by decreases in fear and aggression. For ex-
ample, a normal wild monkey will avoid humans and other animals. In the
presence of an experimenter, it will usually crouch in a corner and remain
still; if approached, it will dash off to a safer corner or make an aggressive
stand. These behaviors were not exhibited by the monkeys with bilateral
temporal lobectomies. Otherwise wild monkeys would not only approach
and touch the human, they would even let the human stroke them and
pick them up. They had the same placid demeanor in the presence of other
animals that monkeys normally fear. Even after approaching and being
attacked by a natural enemy such as a snake, the monkey would go back
and try to examine it again. There was also a corresponding decrease in the
vocalizations and facial expressions usually associated with fear. It appeared
that both the normal experience and the normal expression of fear and
aggression were severely decreased by the temporallobecromy.
Virtually all the symptoms of the KlUver-Bucy syndrome reported in
monkeys have also been seen in humans with temporal lobe lesions. In
addition to visual recognition problems, oral tendencies, and hypersexuality,
such people appear to have "flattened" emotions.
T THE AMYGDALA AND
ASSOCIATED BRAIN CIRCUITS
As we have already discussed, the question of whether the brain has one
emotion system, or more than one, is a matter of debate. The current con-
sensus is that certain brain structures are particularly important for the
experience and expression of emotion. The structure that has received the
greatest attention recently is the amygdala. In our exploration of neural
mechanisms underlying emotion, we will concentrate on fear and aggres-
sion because they have been the focus of the most research. The amygdala
appears to be a critical element in the brain circuitry that processes fear and
aggression. For example, the emotional flattening observed in the KlUver-
Bucy syndrome probably results from destruction of the amygdala.
Anatomy of the Amygdala
The amygdala is situated in the pole of the temporal lobe, just below
the cortex on the medial side. Its name is derived from the Greek word for
"almond," because of its shape.
The amygdala is a complex of nuclei that are commonly divided into
three groups: the basolateral nuclei, the corticomedial nuclei, and the central
nucleus (Figure 18.6). Afferents to the amygdala come from a large variety
of sources, including neocortex in all lobes of the brain, as well as the
hippocampal and cingulate gyri. Of particular interest here is the fact that
information from all the sensory systems feeds into the amygdala, particu-
larly the basolateral nuclei. Each sensory system has a different projection
... THE AMYGDALA AND ASSOCIATED BRAIN CIRCUITS 573
Lateral view
/{J
/ \
\
Medial view
\..
J
Amygdala /
(a)
\
/'
Amygdala /
Hippocampus
Lateral
ventricle
Thalamus
. l /
} ./
Neocortex/ {:J
/ \
\
Third Amygdala
(b) ventricle Hypothalamus
pattern to the amygdala nuclei, and interconnections within the amygdala
allow the integration of information from different sensory modalities. Two
major pathways connect the amygdala with the hypothalamus: the ventral
amygdalofugal pathway and the stria terminalis.
The Amygdala and Fear
Researchers have demonstrated in several species that lesions of the
amygdala have the effect of flattening emotion in a manner similar to the
Kluver-Bucy syndrome. Bilateral amygdalectomy in animals can profoundly
reduce fear and aggression. Reports indicate that rats so treated will approach
a sedated cat and nibble its ear and that a wild lynx wiH become as docile
as a house cat.
Numerous studies on humans have examined the effect of lesions that
include the amygdala on the ability to recognize emotional facial expressions.
While there is a consensus that the lesions usually impair the recognition
of emotional expression, researchers disagree about which emotions are
affected. In different studies, deficits associated with fear, anger, sadness, and
disgust have been reported. The variety of deficits probably reflects, in part
differences in the damage; two lesions are rardy alike, and they typical1y
\
\
'-
\,
\
Hippocampus
Corticomedial nuclei
A
........
Central
nucleus
/
..
Basolateral
nuclei
FIGURE 18.6
A cross section of the amygdala.
(a) Lateral and medial views of the temporal
lobe, showing the location of the amygdala in
relation to the hippocampus. (b) The brain is
sectioned coronally to show the amygdala. The
basolateral nuclei (surrounded by red) receive
visual, auditory, gustatory, and tactile afferents.
The corticomedial nuclei (surrounded by
purple) receive olfactory afferents.
574 C HAP T E RIB . BRAIN MECHANISMS OF EMOTION
..
..
,
(a)
.
(b)
(c)
FIGURE 18.7
Human brain activity in response to
emotional stimuli. (a) Neutral and fearful
races were used as visual stimuli. (b) Fearful
faces produced greater activity In the amygdala
(red and yellow areas within white squares)
than neutral faces. (c) No difference In amyg-
dala activity occurred in response to happy
and neutral faces. (Source: Breiter et al.. 1996.)
include damage to other brain structures in addition to the amygdala.
Nonetheless, the most commonly reported symptom of lesions including
the amygdala is an inability to recognize fear in facial expressions.
Very few cases of humans with damage isolated to the amygdala have been
documented. However, Ralph Adolphs and his colleagues at the University
of Iowa studied a 30-year-old woman, known as S. M., who had bilateral
destruction of the amygdala resulting from Urbach- Wiethe disease, a rare
disorder characterized by thickening of the skin, mucous membranes, and
certain internal organs. S. M. had normal intelligence and was perfectly able
to identify people from photographs. However. she had difficulty recognizing
certain emotions expressed by people in the photographs. When asked to
categorize the emotion expressed in a person's face, she normally described
happiness, sadness, and disgust. She was somewhat less 1ikely to describe an
angry expression as angry, and the most abnormal response was that she
was much less likely to describe a fearful expression as afraid. It appears that
the amygdala lesion selectively decreased her ability to recognize fear.
If removing the amygdala reduces the expression and recognition of fear,
what happens if the intact amygdala is electrically stimulated? Depending
on the site, amygdala stimulation can lead to a state of increased vigilance
or attention. Stimulation of the lateral portion of the amygdala in cats can
elicit a combination of fear and violent aggression. Electrical stimulation of
the amygdala in humans has been reported to lead to anxiety and fear. Not
surprisingly, the amygdala figures prominently in current theories about
anxiety disorders, as we will see in Chapter 22.
Functional brain imaging demonstrates that neural activity in the amyg-
dala is consistent with a role in processing emotions, especially fear. In an
experiment performed by Breiter et ai.. subjects were positioned in an fMRI
mac:hine and brain activity was monitored as they viewed pictures of
neutral, happy, and fearful faces (Figure [8.7a). Brain activity in response
to fearful faces showed more amygdala activity than that in response to faces
with neutral expressions (Figure I8.7b). The amygdala activation was spe-
cific to fear. as no difference in activity occurred in response to happy and
neutral facial expressions (Figure I8.7c).
A Neural Circuit for Learned Fear. Experiments in animals and humans.
as well as introspection, indicate that memories for emotional events are
particularly vivid and long-lasting. This is undoubtedly true for learned fear.
Through socialization or painful experience, we all learn to avoid certain
behaviors for fear of being hurt. If you ever received a painful shock as a
child by pushing a paper clip into an electrical outlet, you probably never
did it again. Memories associated with fear can be quickly formed and long-
lasting. Although the amygdala is not thought to be a primary location for
memory storage, it does seem to be involved in forming memories for
emotional events.
A number of different experiments suggest that neurons in the amygdala
can "learn" to respond to stimuli associated with pain, and after such learn-
ing, these stimuli evoke a fearful response. In an experiment performed by
Bruce Kapp and his colleagues at the University of Vermont, rabbits were
conditioned to associate the sound of a tone with mild pain. The researchers
made use of the fact that a normal sign of fear in rabbits is a change in
heart rate. An animal was placed in a cage, and at various times, it would
hear one of two tones. One tone was followed by a mild electrical shock to
the feet through the metal floor of the cage; the other tone was benign.
After conditioning, Kapp's group found that the rabbit's heart rate developed
a fearful response to the tone associated with pain, but not to the benign
tone. Before conditioning, neurons in the central nucleus of the amygdala
failed to respond to the tones used in the experiment. But after conditioning,
'Y THE AMYGDALA AND ASSOCIATED BRAIN CIRCUITS 575
neurons in the central nucleus of the amygdala responded to the shock-
related tone (but not the benign one). Joseph LeDoux of New York Univer-
sity has shown that after this type of fear conditioning, amygdala lesions
eliminate the learned visceral responses, such as the changes in heart rate and
blood pressure (Box 18.2). It appears that the conditioned response in the
amygdala arises from synaptic changes in the basolateral nuclei. We will ex-
plore the neural mechanisms underlying memory formation in Chapter 25.
Recent research suggests that the role of the amygdala in learned fear,
first studied in rabbits and rats, extends to humans. In one study, subjects
were shown a number of visual stimuli and conditioned to expect a mild
electrical shock when a particular visual stimulus was presented. An fMRI
machine monitored brain activity. The fMRI images show that the "feared"
visual stimulus activated the amygdala significantly more than visual
stimuli not associated with a shock.
In another study using PET imaging of brain activity conducted by
Hamann et al., subjects first viewed a series of pictures. Some of the pic-
tures were pleasant (appealing animals, sexually arousing scenes, appetiz-
ing food); some were frightening or aversive (threatening animals, muti-
lated bodies, violence); and some were neutral (household scenes, plants).
The emotional stimuli affected physiological measures such as heart rate and
skin conductance, and they evoked greater activity in the amygdala. These
measurements confirm the role of the amygdala in emotional processing
that we have already discussed. In the second phase of the experiment,
subjects were put back in the PET imaging machine and shown a variety
of pictures. They were asked to use their memory and identify which pic-
tures they had seen in the initial conditioning session. As expected, subjects
recalled the emotional pictures better than the neutral ones. The enhanced
memories for emotional pictures correlated with recorded amygdala activity
(Figure 18.8). There was no such correlation for the neutral pictures.
Figure 18.9 shows a proposed circuit to account for learned fear. AuditOry
information is sent to the basolateral region of the amygdala, where cens in
Tone
Central
nucleus
V I
1L»
.,
'-----»
,..
Amygdala
FIGURE 18.9
A neural circuit for learned fear. Through training. a sound tone becomes associated
with pain. The presumed fear response is mediated by the amygdala. The emotional stimulus
reaches the basolateral nuclei of the amygdala by way of the auditory cortex, and the signal
is relayed to the central nucleus. Efferents from the amygdala project to the brain stem peri-
aqueductal gray matter: causing the behavioral reaction 10 the stimulus. and to the hypothala-
mus, resulting in the autonomiC response. The expenence of emotion presumably involves
projections to the cerebral cortex.
FIGURE 18.8
Amygdala activity associated with
enhanced emotional memory. Subjects
first viewed pictures of emotional and neutral
stimuli. and PET imaging recorded brain
activity. Later: the original and new pictures
were viewed. The recall of emotional stimuli
was assoCiated with an enhanced response
in the amygdala. shown in yellow. (Sounce:
Hamann et aI., 1999.)
Hypothalamus I
.. Autonomic
response
Periaqueductal
gray matter
in brain stem
Behavioral
reaction
Emotional
experience
516 C HAP T E R I 8 . BRAIN MECHANISMS OF EMOTION
Box 18.2
PATH OF DISCOVERY
Brains
Through the Back Door
A
I came to brain research through the back door, or maybe
even a crack in the door. I was studying business, but taking
psych courses. One course that really caught my atten-
tion was on memory and motivation. and I started work-
ing in the professor's lab. I learned to test the effects of
brain lesions in rats on learning and memory, and got
hooked. The next year, I was in graduate school studying
brain and behavior. Although I did my Ph.D. work study-
ing neurological patients, I eventually returned to animal
research because I felt it was the only way to get at the
detailed mechanisms underlying complex processes. The
process I was particularly interested in was emotion.
There was very little work being done on emotion in
neuroscience, so I thought I'd jump right in. I did a few
pilot studies and wrote a grant proposal called "Neural
Pathways Underlying Emotion." The review came back
with the word "reject." Why? Because you can't study
emotion in neuroscience. And besides. according to the
review, the grant was based on Pavolvian conditioning and
was thus about learning and memory rather than emo-
tion. I said, fair enough. I fixed it up a bit and gave it a new
title, "Neural Pathways Underlying Emotional Condition-
ing." Not only was it funded, but it was selected to be a
MERIT Award, a special designation for particularly prom-
ising grants. Although I think the comment by the re-
viewer was inappropriate, it led me to begin thinking
about emotion as memory. Today, in fact, my work is as
much about memory and plasticity as emotion.
In studying emotional memory, I spend a lot of time
working on the amygdala, and I'm often labeled as an
amygdala researcher. But I don't really think of myself that
way. My goal is to understand how emotional memories
are acquired and stored, rather than how the amygdala
-
'-'
.
by Joseph LeDoux
works. I only work on one small part of the amygdala, the
lateral nucleus, which is the part that seems especially
involved in emotional memory.
One of the most interesting things I've discovered is that
emotional learning can take place by way of subcortical
sensory inputs to the lateral amygdala. Most researchers
think cortical sensory processing is necessary for conscious
awareness of the stimulus. The finding that subcortical
sensory inputs are sufficient means that the amygdala can
respond to emotional stimuli without the organism being
aware of the stimulus. Imagine jumping back as a car goes
flying by. Your brain knows more about the world than
you do!
Although I study emotions in rats, I don't have any illu-
sion that I'm studying feelings. I think feelings are what
happen when we become consciously aware that our
brain is reacting to some significant stimulus. I don't know
whether rats are capable of this kind of awareness. If they
are, their capacity is surely different from ours, given that
our cerebral cortex is so different from theirs. So I prefer
to study fear responses in rats. If I were to study feelings,
I would do that in people.
Focusing on emotional responses rather than feelings
places some limits on what we can learn through rats.
Nevertheless, the rat work can go pretty far because the
emotional response system is essentially the same in all
mammals. Humans have additional layers of complexity,
but the basic systems and their ability to learn and store
information and respond to threats are essentially the
same.As a result, we can use the rat work not only to fig-
ure out how emotion systems normally work, but also
how they break down in emotional disorders, and how
we might better treat them.
turn send axons to the central nucleus. Efferents [rom the central nucleus
project to the hypothalamus. which can alter the state of the ANS, and to the
periaqueductal gray matter in the brain stem, which can evoke behavioral
reactions via the somatic motor system. The emotional experience is thought
to be based on activity in the cerebral cortex.
The Amygdala and Aggression
We can distinguish different forms of aggression in humans, ranging from
self-defense to murder. Likewise, there are different types in animals. One
-
." THE AMYGDALA AND ASSOCIATED BRAIN CIRCUITS 5 77
animal may act aggressively toward another for many reasons: to kill for
food, to defend offspring, to win a mate, to scare off a potential adversary.
Although it has not been proven, some evidence indicates that difIerent
types of aggression are regulated differently by the nervous system.
Aggression is a multifaceted behavior that is not a product of a single
isolated system in the brain. One factor that has an influence on aggression
is the level of male sex hormones, or androgens (see Chapter 17). [n ani-
mals, there is a correlation between seasonal androgen levels and aggres-
sive behavior. Consistent with one of the roles of androgens, injections of
testosterone can make an immature animal more aggressive, and castration
can reduce aggressiveness. In humans, the relationship is less clear, although
some have claimed that there is a connection between testosterone levels
and aggressive behavior in violent criminals. In any case, there is strong
evidence for a neurobiological component to aggression, which is our focus
here.
A useful distinction can be made between predatory aggression and af-
fective aggression. Predatory aggression involves attacks made against a
member of a different species for the purpose of obtaining food, such as a
lion hunting a zebra. Attacks of this type are typically accompanied by rel-
atively few vocalizations, and they are aimed at the head and neck of the
prey. Predatory aggression is not associated with high levels of activity in
the sympathetic division of the ANS. Affective aggression is for show
rather than to kill for food, and it involves high levels of sympathetic ac-
tivity. An animal exhibiting affective aggression will typically make vocal-
izations while adopting a threatening or defensive posture. A cat hissing
and arching its back at the approach of a dog is a good example (see Fig-
ure 18.1). The behavioral and physiological manifestations of both types of
aggression must be mediated by the somatic motor system and the ANS,
but the pathways must diverge at some point to account for the dramatic
differences in the behavioral responses.
Several lines of evidence indicate that the amygdala is involved in ag-
gressive behavior. In an experiment performed by American scientist Karl
Pribram and his colleagues in 1954, amygdala lesions were shown to have
a major effect on social interactions in a colony of eight male rhesus
monkeys. Having lived together for some time, the animals had established
a social hierarchy. The first intervention made by the investigators was to
make bilateral amygdala lesions in the brain of the most dominant monkey.
After this animal returned to the colony, it fell to the bottom of the hier-
archy, and the previously next subordinate monkey became dominant.
Presumably, the second monkey in the hierarchy discovered that the "top
banana" had become more placid and less difficult to challenge. After an
amygdalectomy was performed on the new dominant monkey, it likewise
fell to the bottom of the hierarchy. This pattern suggested that the amygdala
is important for the aggression normally involved in maintaining a position
in the social hierarchy. Electrical stimulation of the amygdala can produce
a state of agitation or affective aggression.
Surgery to Reduce Human Aggression. Recognizing that aggression is
reduced by amygdalectomy in animals, some neurosurgeons thought it
might be possible to similarly modify aggressive behavior in violent humans.
It was thought by some that violent behavior frequently resulted from
seizures in the temporal lobe. In a human amygdalectomy, electrodes are
passed through the brain and down into the temporal lobe. By making
neural recordings along the way and imaging the electrodes using X-rays,
it is possible to get the tip of the electrode into the amygdala. Electrical cur-
rent is passed through the electrode, or a solution is injected, to destroy all
578 C H A PT E R 18 . BRAIN MECHANISMS OF EMOTION
or part of the amygdala. Clinical reports claim considerable success in re-
ducing aggressive asocial behavior. increasing the ability to concentrate, de-
creasing hyperactivity, and reducing seizures. This type of brain surgery, a
method of treating behavioral disorders, is called psychosurgery. Early
in the twentieth century, treating severe disorders involving anxiety, ag-
gression, or neuroses with psychosurgical techniques, including the frontal
lobotomy. was a common practice (Box 18.3). By today's standards, psy-
chosurgery is a drastic procedure to be considered only as a treatment of
last resort.
Box 18.3
.... , .
OF SPECIAL INTEREST
"'"
I _ ...
.
.
" .
The Frontal Lobotomy
Ever since the discoveries by Kluver, Bucy, and others that
brain lesions can alter emotional behavior. clinicians have
attempted surgery as a means of treating severe behav-
ioral disorders in humans. Today, it is difficult for many
people to imagine that destroying a large portion of the
brain was once thought to be therapeutic. Indeed, in 1949,
the Nobel Prize in Medicine was awarded to Dr. Egas
Moniz for his development of the frontal lobotomy tech-
nique. Even stranger is the fact that Moniz was shot in the
spine and partially paralyzed by a lobotomized patient.
Although lobotomies are no longer being performed, tens
of thousands were performed after World War II.
Little theory supported the development of the lobot-
omy. In the 1930s, John Fulton and Carlyle Jacobsen of
Yale University reported that frontal lobe lesions had a
calming effect in chimpanzees. It has been suggested that
frontal lesions have this effect because of the destruction
of limbic structures and, in particular, connections with
frontal and cingulate cortex. The guiding principle behind
the surgery was something like this: The limbic system
controls emotion; therefore, people with emotional
problems might be helped by altering the system. In other
words, a little emotion is a good thing but too much is
debilitating, and this problem might be surgically corrected.
A frightening variety of techniques were used to pro-
duce lesions in the frontal lobes. In the technique known
as transorbital lobotomy, shown in Figure A, a knife was
inserted through the thin bone at the top of the eye's
orbit. The handle was then swung medially and laterally to
destroy cells and interconnecting pathways. Thousands of
people were lobotomized with this technique, sometimes
called "ice pick psychosurgery," because it was so simple
it could be performed in the physician's office. Note that,
although it left no outward scars, the physician could not
see what was being destroyed.
Frontal lobotomy reportedly had beneficial effects on
people with a number of disorders, including psychosis,
depression, and various neuroses. The effect of the surgery
W
\l \
"
G
-
, -
1
FIGURE A
was described as a relief from anxiety and escape from
thoughts that were unendurable. Only later did a pattern
of less pleasant side effects emerge. While frontal lobot-
omy can be performed with little decrease in IQ or loss
of memory, it does have other profound effects. The
changes that appear to be related to the limbic system
are a blunting of emotional responses and a loss of the
emotional component of thoughts. In addition, loboto-
mized patients often developed "inappropriate behavior"
or an apparent lowering of moral standards. Like Phineas
Gage, patients had considerable difficulty planning and
working toward goals. Lobotomized patients also had
trouble concentrating and were easily distracted.
Perhaps more to the point. with our modest under-
standing of the neural circuitry underlying emotion and
other brain functions, it is hard to justify destroying a
large portion of the brain. Fortunately, treatment with
lobotomy decreased fairly rapidly, and today, drug therapy
is primarily used instead for serious emotional disorders.
.... THE AMYGDALA AND ASSOCIATED BRAIN CIRCUITS 519
Neural Components of Aggression Beyond the Amygdala
During the twentieth century, several brain structures besides the amygdala
were shown to have effects on aggression. These structures, including the
hypothalamus and midbrain periaqueductal gray matter, appear to influ-
ence behavior partially based on input from the amygdala.
The Hypothalamus and Aggression. One of the earliest structures linked
to aggressive behavior is the hypothalamus. Experiments performed in the
1920s showed that a remarkable behavioral transformation took place in
cats or dogs whose cerebral hemispheres have been removed. Animals that
were not easy to provoke before the surgery would go into a state of vi-
olent rage with the least provocation after the surgery. For instance, a vi-
olent response might be produced by an act as mild as scratching a dog's
back. This state was called sham rage because the animal demonstrated all
the behavioral manifestations of rage but in a situation that normally would
not cause anger. It was also a sham in the sense that the animals would not
actually attack as they normally might.
While this extreme behavioral condition resulted from removing all of both
cerebral hemispheres (telencephalon), the behavioral effect can be reversed
by making the lesion just a little bit larger to include portions of the dien-
cephalon, particularly the hypothalamus. Sham rage is observed if the ante-
rior hypothalamus is destroyed along with the cortex, but it is not seen if
the lesion is extended to include the posterior half of the hypothalamus
(Figure 18.10). The impJication is that the posterior hypothalamus may be
particularly important for the expression of anger and aggression and that
normally it is inhibited by the telencephalon. But we must bear in mind
that the lesions were large, and something other than the posterior hypo-
thalamus may have been destroyed with the larger lesion.
Cerebral
cortex \
\ "
'\
..
CD
@
\' '\
Posterior
hypothalamus
Anterior
hypothalamus
FIGURE 18.10
Brain transections and sham rage. <D If the cerebral hemispheres are removed and
the hypothalamus IS left intact, sham rage results. <D and <2:> A similar result is obtained if the
anterior hypothalamus is removed in addition to the cerebral cortex. <D, <2:>, and Q) If the
posterior hypothalamus is removed in addition to the anterior hypothalamus. sham rage
does not result.
580 C HAP T E R I 8 . BRAIN MECHANISMS OF EMOTION
-l J ,
6 '\Y'"
I
l ' '
..' ,
I , '" ..<:-"-.
.". - - . -
/' .:i:: .$ - --.' .-;- ': A
"I'- ""5'- "'4.-.. - - ....
. ...I # ...:.:..._ -:::-.--- ...
(a)
/ r
/ - ... ., I
t
-- -1
r
(b)
FIGURE 18.11
Rage reactions in cats with hypothala-
mic stimulation. (a) Stimulation of the
medial hypothalamus produces affective ag-
gression (threat attack). (b) Stimulation of
the lateral hypothalamus evokes predatory
aggression (silent-biting attack). (Source: Flynn.
1967, p. 45.)
In a series of pioneering studies begun in the 1920s, W. R. Hess at the
University of Zurich investigated the behavioral effects of electrically stimu-
lating the diencephalon. Hess made small holes in the skulls of anesthetized
cats and implanted electrodes into the brain. After the animal awoke, a
small electrical current was passed through the electrodes, and behavioral
effects were noted. Various structures were stimulated, but here we focus
on the effects of stimulating different regions of the hypothalamus.
The variety of complex responses from stimulating slightly different
portions of the hypothalamus is amazing, considering that it is such a small
part of the brain. Depending on where the electrode is placed, stimulation
may cause the animal to sniff, pant, eat, or express behaviors characteristic
of fear or anger. These reactions illustrate the two primary functions of the
hypothalamus discussed in Chapters 15 and 16: homeostasis and the organ-
ization of coordinated visceral and somatic motor responses. Responses
related to emotional expression can include changes in heart rate, pupillary
dilation, and gastrointestinal motility, to name a few. Because stimulation
of some parts of the hypothalamus also elicits behavior characteristic of
fear and rage, we hypothesize that the hypothalamus is an important com-
ponent of the system normally involved in expressing these emotions.
The expression of rage Hess evoked by hypothalamic stimulation was
similar to the sham rage seen in animals whose cerebral hemispheres had
been removed. With a small application of electrical current, a cat will spit,
growl, and fold its ears back, and its hair will stand on end. This complex
and highly coordinated set of behaviors would normally occur when the
cat feels threatened by an enemy. Sometimes the cat would suddenly run
as if fleeing an imaginary attacker. If the intensity of the stimulation was
increased, the animal might make an actual attack, swatting with a paw or
leaping onto an imaginary adversary. When the stimulation was stopped,
the rage disappeared as quickly as it started, and the cat might even curl
up and go to sleep.
In experiments conducted at the Yale University Medical School in the
1960s, John Flynn found that affective aggression and predatory aggression
could be elicited by stimulating different areas of a cat's hypothalamus (fig-
ure 18.11). Affective aggression, also known as a threat attack, was observed
by stimulating specific sites in the medial hypothalamus. Similar to the rage
response reported by Hess, the cat would arch its back, hiss, and spit but
would usually not actually attack a victim, such as a nearby rat. Predatory
aggression, which Flynn called a silent-biting attack, was evoked by stimu-
lating parts of the lateral hypothalamus. While the back might be some-
what arched and the hair slightly on end, predatory aggression was not ac-
companied by the dramatic threatening gestures of affective aggression.
Nonetheless, in this "quiet attack," the cat would move swiftly toward a rat
and viciously bite its neck.
The Midbrain and Aggression. There are two major pathways by which
the hypothalamus sends signals involving autonomic function to the
brain stem: the medial forebrain bundle and the dorsal longitudinal
fasciculus. Axons from the lateral hypothalamus make up part of the
medial forebrain bundle, and these project to the ventral cegmental area in
the midbrain. Stimulation of sites within the ventral tegmental area can
elicit behaviors characteristic of predatory aggression, just as stimulation of
the lateral hypothalamus does. Conversely, lesions in the ventral tegmental
area can disrupt offensive aggressive behaviors. One finding suggesting that
the hypothalamus influences aggressive behavior via its effect on the ven-
tral tegmental area is that hypothalamic stimulation will not evoke aggres-
sion if the medial forebrain bundle is cut. Interestingly, aggressive behavior
.... THE AMYGDALA AND ASSOCIATED BRAIN CIRCUITS 581
is not entirely eliminated by this surgery, suggesting that this route is im-
portant when the hypothalamus is involved, but that the hypothalamus
need not always be involved.
The medial hypothalamus sends axons to the periaqueductal gray
matter (PAG) of the midbrain by way of the dorsal longitudinal fasiculus.
Electrical stimulation of the PAG can produce affective aggression, and
lesions located there can disrupt this behavior. Figure 18.12 shows a sim-
plified circuit for aggression involving the structures we have discussed.
Serotonin and Aggression
Studies indicate that the neurotransmitter serotonin may be involved in
regulating aggression. Serotonin-containing neurons are located in the raphe
nuclei of the brain stem, and they ascend in the medial forebrain bundle
and project to the hypothalamus and various limbic structures involved in
emotion (see Figure 15.l3).
One link between serotonin and aggression comes from studies of induced
aggression in rodents. Mice that are isolated in a smaJl cage for 4 weeks will
frequently become hyperactive and extremely aggressive toward other
mice. Although the isolation has no effect on the level of serotonin in the
brain, there is a decrease in the turnover rate (the rate of synthesis, release,
and resynthesis) of this neurotransmitter. Moreover, this decrease is found
only in the mice that later become unusually aggressive, not in those rela-
tively unaffected by the isolation. Also, female mice typically do not become
aggressive following isolation, and they show no decrease in serotonin
turnover. Evidence indicates that drugs that block the synthesis or release
of serotonin increase aggressive behavior. In one study, the drug PCPA
(parachlorophenylalanine), which blocks serotonin synthesis, was adminis-
tered and the injected animals increased their attacks on others in their cage.
The relationship between serotonin and aggression is similar in primates
that have been studied. For example, researchers found that the dominance
hierarchy in a colony of vervet monkeys could be manipulated by injecting
animals with drugs that either increased or decreased serotonergic activity.
The behavior of these animals was consistent: More aggression was associ-
ated with less serotonergic activity. However, there was one interesting
sociological twist-aggression did not correlate with dominance in the
group. If the dominant male was removed, the top position was taken by
an animal with artificially enhanced serotonergic activity (i.e., one injected
with a serotonin precursor or reuptake inhibitor who was less aggressive).
Conversely, the injection of drugs that reduced serotonin function (serotonin
antagonists) was correlated with animals becoming subordinate. The sub-
ordinate animals were actually significantly more likely to initiate aggres-
sion. However, it appeared that the less aggressive dominant male garnered
his status by his skiHs in recruiting females to support his position.
Serotonin Receptor Knockout Mice. There are many serotonin recep-
tor subtypes, and recombinant DNA techniques have been used to produce
mice lacking certain types. They are called "knockout mice" because a
normal gene-one that codes for a receptor, in this case-has been removed
or mutated in a procedure called the gene knockout technique. Researchers
have been particularly interested in the receptors known as 5- HT lA and 5-
HTIB' which are found in high concentrations in the raphe nudei. Many of
the 5-HT 1A and 5-HT 1B receptors are autoreceptors (see Chapter 5). Some
autoreceptors are presynaptic on the raphe neurons that send serotonin
widely to the brain. Activation of them globally inhibits serotonin release.
In other words, this is a system with negative feedback; serotonin release
Cerebral cortex
Amygdala
/\
I Hypothalamus I
PAG, ventral
tegmental area
Aggressive
behavior
FIGURE 18.12
A neural circuit for aggression. In this
simplified scheme, aggression is controlled by
a neural pathway from the amygdala through
the hypothalamus. PAG and ventral tegmental
area.
582 C HAP T E R I 8 . BRAIN MECHANISMS OF EMOTION
affects the raphe neurons in such a way as to decrease further release. This
powerful and global regulatory role of 5-HT 1A and 5-HT lB receptors ex-
plains why research has focused on them. Note that if the receptors were
missing, there would be no negative feedback, meaning more serotonin
would be released than if feedback were present.
We already men60ned that serotonin antagonists increase aggressive-
ness. Conversely, agonists of the 5-HT 1A and 5-HT 1B receptors are known
to decrease anxiety and aggressiveness in mice. Based on these pharmaco-
logical results, one would predict that mice lacking the 5-HT 1A or 5-HT lB
receptor would be more anxious and aggressive than normal animals. This
prediction has largely been found to be true. In one study, mice lacking the
5-HT lA receptor showed less exploratory behavior. They would avoid open
spaces, instead staying in covered protected areas. The researchers inter-
preted these results to mean that the mice lacking 5-HT IA receptors were
unusually anxious. In a second study, mice lacking the 5-HT 1B receptor
were produced. They behaved normally and were not unusually aggressive
living together as a group. But when put in a stressful situation, such as
having a new mouse placed in their house, the mutants were far more
aggressive.
The anatomical location of the 5-HT 1B receptors is telling. In addition to
the raphe nuclei, they are found in the amygdala, PAG, and basal ganglia.
The localization of the receptors in structures thought to be involved in
aggressive behavior offers the potential of linking pharmacological studies
of serotonin with the behavioral research we've examined.
CONCLUDING REMARKS
Several neural pathways appear to be involved in the experience and ex-
pression of emotion. We have taken a somewhat opposite approach to that
of Papez in the I930s. With good insight, Papez proposed a large emotion
system comprised of numerous structures along the midline of the brain.
Although the role of each structure was far from clear, he knew that they
were anatomically connected. Our discussion of the brain mechanisms of
emotion has focused on a smaller number of structures. Some of them,
such as the amygdala and hypothalamus, appear to be important for sev-
eral different emotions.
The experience and expression of emotions involve widespread activity
in the nervous system, from the cerebral cortex to the ANS. Emotional re-
actions are the result of a complex interaction between sensory stimuli,
brain circuitry, past experiences, and the activity of neurotransmitter sys-
tems. In light of this complexity, we probably should not be surprised that
humans exhibit a broad spectrum of emotional and mood disorders, as we
will see in Chapter 22.
Keep in mind for later chapters that the structures apparently involved
in emotion also have other functions. For a considerable time after the
limbic lobe was defined by Broca, it was thought to be primarily an olfac-
tory system. And even though our perspective has changed a lot since
Broca's time, parts of the brain involved in olfaction have been included in
the definition of the limbic system. We will see in Chapter 24 that some of
the limbic structures are also important for learning and memory. How is
it that these structures evolved to perform so many functions? We don't
really know. Emotion, memory, and olfaction have a fascinating interrela-
tionship. Emotional events usually result in particularly enduring memo-
ries, and most people also feel that olfaction-a whiff of a certain perfume,
for example-can evoke memories quite dramatically.
>-(/')
w:E
a:::
w
.....
... CONCLUDING REMARKS 583
Introducton
affective neuroscience (p. 564)
Papez circuit (p.568)
limbic system (p.571)
Kluver-Bucy syndrome (p. 572)
affective aggression (p. 577)
psychosurgery (p. 578)
sham rage (p. 579)
medial forebrain bundle (p. 580)
dorsal longitudinal fasciculus
(p. 580)
periaqueductal gray matter (PAG)
(p.581)
What Is Emotion?
james-Lange theory (p. 564)
Cannon-Bard theory (p. 565)
unconscious emotion (p. 567)
The Amygdala and
Associated Brain Circuits
amygdala (p. 572)
predatory aggression (p.577)
The. Limbic System Concept
limbic lobe (p. 568)
riA
,
(/')
w Z
o
>
w.....
a:::(/')
W
::>
a
I. According to the james-Lange and Cannon-Bard theories of emotion, what is the relationship between the
anxiety you would feel after oversleeping for an exam and your physical responses to the situation?
2. How have the definition of the limbic system and thoughts about its function changed since the time of
Broca?
3. What procedures will produce an abnormal rage reaction in an experimental animal? How do we know that
the animals feel angry?
4. What changes in emotion were observed following temporal lobectomy by Kluver and Bucy? Of the numer-
ous anatomical structures they removed. which is thought to be closely related to changes in temperament?
5. Why might performing bilateral amygdalectomy on a dominant monkey in a colony result in that monkey's
becoming a subordinate?
6. What assumptions about limbic structures underlie the surgical treatment of emotional disorders?
7. The drug known as Prozac is a serotonin-selective reuptake inhibitor. How might this drug affect a person's
level of anxiety and aggression?
Cd
a::: (.,9
Wz
I-
.....0
a:::«
::>w
u...a:::
Adolphs R. 2002. Neural systems for recognizing
emotion. Current Opinion in Neurobiology 12:
169-177.
Dagleish T. 2004. The emotional brain. Nature Reviews
5:582-589.
Dolan Rj. 2002. Emotion, cognition. and behavior.
Science 298:1191-1194.
McGaugh jl. 2004. The amygdala modulates the con-
solidation of memories of emotionally arousing
experiences. Annual Review of Neuroscience 27:
1-28.
Pare D, Quirk Gj, LeDoux jE. 2004. New vistas on
amygdala networks in conditioned fear. Journal of
Neurophysiology 92: 1-9.
Pessoa L, Ungerleider LG. 2005. Neuroimaging
studies of attention and the processing of
emotion-laden stimuli. Progress in Brain Research
144:171-182.
Brain Rhythms
and Sleep
INTRODUCTION
THE ELECTROENCEPHALOGRAM
RECORDING BRAIN WAVES
EEG RHYTHMS
MECHANI.5MS AND MEANINGS OF BRAIN RHYTHMS
The Generation of Synchronous Rhythms
Functions of Brain Rhythms
THE SEIZURES OF EPILEPSY
SLEEP
THE FUNCTIONAL STATES OF THE BRAIN
THE SLEEP CYCLE
. Box 19.1 Of Special Interest: Walking, Talking, and Screaming in Your Sleep
WHY DO WE SLEEP?
. Box 19.2 Of Special Interest: The Longest All-Nighter
FUNCTIONS OF DREAMING AND REM SLEEP
NEURAL MECHANISMS OF SLEEP
Wakefulness and the Ascending Reticular Activating System
Falling Asleep and the Non-REM State
Mechanisms of REM Sleep
. Box 19.3 Of Special Interest: Narcolepsy
Sleep-Promoting Factors
Gene Expression During Sleeping and Waking
CIRCADIAN RHYTHMS
BIOLOGICAL CLOCKS
THE SUPRACHIASMATIC NUCLEUS: A BRAIN CLOCK
. Box 19.4 Of Special Interest: Mutant Hamster Clocks
. Box 19.5 Path of Discovery: Strange Vision, by David M. Berson
SCN MECHANISMS
CONCLUDING REMARKS
CHAPTER
586 C HAP T E R I 9 . BRAIN RHYTHMS AND SLEEP
....1
... .""
" .,"
......-
,\
;,,. .-
1
FIGURE 19.1
A subject in a sleep research study.
The subject shown here IS American sleep
researcher Nathaniel Kleitman, codiscoverer
of REM sleep. The white patches on his head
are pieces of tape holding EEG electrodes,
and those next to his eyes hold electrodes
that monitor his eye movements.
(Source: Carskadon, 1993.)
INTRODUCTION
The Earth is a rhythmic environment. Temperature, precipitation, and day-
light vary with the seasons; light and dark trade places each day; tides ebb
and flow. To compete effectively and therefore survive, an animal's behavior
must oscillate with the cadences of its environment. Brains have evolved a
variety of systems for rhythmic control. Sleeping and waking are the most
striking periodic behavior. But some rhythms controlled by the brain have
much longer periods, as in hibernating animals, and many have shoner
periods, such as the cycles of breathing, the steps of walking, the repetitive
stages of one night's sleep, and the electrical rhythms of the cerebral cor-
tex. The functions of some rhythms are obvious, while others are obscure.
and some rhythms indicate pathology.
In this chapter, we explore selected brain rhythms, beginning with the
fast and proceeding to the slow. The forebrain, especially the cerebral cor-
tex, produces a range of rapid electrical rhythms that are easily measured
and that closely correlate with interesting behaviors, including sleep. We
discuss the electroencephalogram, or EEG, because it is the classical method
of recording brain rhythms and is essential for studying sleep. Sleep is
treated in detail because it is complex, ubiquitous, and so dear to our
hearts. Finally, we summarize what is known about the timers that regu-
late the ups and downs of our hormones, body temperature, alertness, and
metabolism. Almost all physiological functions change according to daily
cycles known as circadian rhythms. The clocks that time circadian rhythms
are in the brain, calibrated by the sun via the visual system. and they pro-
foundly influence our health and well-being.
THE ELECTROENCEPHALOGRAM
Sometimes the forest is more interesting than the trees. Similarly, we are
often less concerned with the activities of single neurons than with under-
standing the activity of a large population of neurons. The electroen-
cephalogram (EEG) is a measurement that enables us to glimpse the gen-
eralized activity of the cerebral cortex. The roots of the EEG lie in work
done by English physiologist Richard Caton in 1875. Caton made electrical
recordings from the surface of dog and rabbit brains using a primitive de-
vice sensitive to voltage. The human EEG was first described by Austrian
psychiatrist Hans Berger in 1929. Berger observed that waking and sleep-
ing EEGs are distinctly different. Today, the EEG is primarily used to help
diagnose certain neurological conditions, especially the seizures of epilepsy,
and for research purposes, notably to study sleep.
Recording Brain Waves
Recording an EEG is relatively simple. The method is usually noninvasive,
and it is painless. Countless people have slept through entire nights wear-
ing EEG electrodes in the comfort of sleep research laboratories (Figure
19.1). The electrodes are wires taped to the scalp, along with conductive
paste to ensure a low-resistance connection. As shown in Figure 19.2, some
two dozen electrodes are fixed to standard positions on the head and con-
nected to banks of amplifiers and recording devices. Small voltage fluctua-
tions. usually a few tens of microvolts (pV) in amplitude, are measured be-
tween selected pairs of electrodes. Different regions of the brain-anterior
and posterior, left and right-can be examined by selecting the appropriate
electrode pairs. The typical EEG record is a set of many simultaneous squig-
gles, indicating voltage changes between pairs of electrodes.
C z
F3 P
3
FpI T3
T'
Pen recorder
... THE ELECTROENCEPHALOGRAM 587
A 1
Left
What part of the nervous system generates the fluctuations and oscilla-
tions of an EEG? For the most part, an EEG measures voltages generated
by the currents that now during synaptic excitation of the dendrites of
many pyramidal neurons in the cerebral cortex, which lies right under the
skull and makes up 80% of the brain's mass. But the electrical contribution
of any single cortical neuron is exceedingly small, and the signal must
penetrate several layers of non-neural tissue, induding the meninges, fluid,
bones of the skull, and skin, to reach the electrodes (Figure 19.3). There-
fore, it takes many thousands of underlying neurons, activated together, to
generate an EEG signal big enough to see at all.
EEG electrode
----------
lJj D D
p «:>:.t,.. ;o.«:> 0 Scalp
dtf Q..=. '."f . Q._- _ 1'P .......
Oj>, .. . . "'- Skull
--=--
-
J ll A \ A ; "Oid
" 1\) Piamater
yr t>----f- I
o V
001
C Afferent axon
O
150 !LV
1 sec
FIGURE 19.2
Standard positions for the placement
of EEG electrodes. A, auricle (or ear); C.
central; Cz, vertex; F, frontal; Fp, frontal pole;
0. occipital; P. parietal; T. temporal. Wires from
pairs of electrodes are fed to amplifiers, and
each recording measures voltage differences
between two pOints on the scalp. The output
of each amplifier drives a pen recorder or is
stored in computer memory.
FIGURE 19.3
The generation of very small electrical
fields by synaptic currents in pyramidal
cells. In this case, the synapse is on the upper
part of the dendrite. When the afferent axon
fires, the presynaptic terminal releases gluta-
mate, which opens cation channels. Positive
current fiows into the dendrite, leaving a slight
negativity in the extracellular fiuid. Current
spreads down the dendrite and escapes
from Its deeper parts, leaving the fiuid slightly
positive at those sites. The EEG electrode
(referred to a second electrode some dis-
tance away) measures this pattern through
thick tissue layers. Only if thousands of cells
contribute their small voltage is the signal
large enough to see the scalp surface. (Notice
the EEG convention of plotting the signals
with negativity upward.)
588 CHAPTER 19 . BRAIN RHYTHMS AND SLEEP
,-L EEG .'oclmde Irregular
CD
@
@
@
@
@
Sum == EEG
(b)
Synchronized
CD
@
@
@
@
@
Sum == EEG
(a) (c)
FIGURE 19.4
The generation of large EEG signals by synchronous activity. (a) In a population
of pyramidal cells located under an EEG electrode, each neuron receives many synaptic
inputs. (b) If the inputs fire at irregular intervals. the pyramidal cell responses are not
synchronized. and the summed activity detected by the electrode has a small amplitude.
(c) If the same number of inputs fire within a narrow time window so the pyramidal cell
responses are synchronized. the resulting EEG is much larger.
This has an interesting consequence: The amplitude of the EEG signa]
strongly depends, in part, on how synchronous the activity of the underly-
ing neurons is. When a group of cells is excited simultaneously, the tiny
signals sum to generate one large surface signal. However, when each cell
receives the same amount of excitation, but spread out in time, the summed
signals are meager and irregular (Figure 19.4). Notice that in this case. the
number of activated cells and the total amount of excitation may not have
changed, only the timing <;>f activity. If synchronous excitation of this group
of cells is repeated again and again, the resulting EEG will consist of large.
rhythmic waves. We often describe rhythmic EEG signals in terms of their
relative amplitude, suggesting how synchronous the underlying activity is
(although olher factors, especially the number of active neurons, contribute
to amplitude as well).
An alternative way to record the rhythms of the cerebral cortex is with
magnetoencephalography (MEG). Recall from physics that whenever electrical
current flows, a magnetic field is generated according to the "right hand rule"
(hold up your right hand loosely; if your thumb points in the direction of
current flow, the rest of your curling fingers indicate the direction of the
magnetic field). It stands to reason that when neurons generate currents,
as in Figure 19.3, they should also produce a magnetic field. But the mag-
netic field they generate is minuscule. Even the strongest brain activity,
.
.
.
') .
-
1: -1'
(a)
(b)
FIGURE 19.5
Magnetoencephalography (MEG). (a) The tiny magnetic signals generated by neurons
on the brain are detected by an array of I 50 sensitive magnetic detectors. (b) Researchers
use the signals to calculate the locations of sources of neural activity (color-coded. in this
image). (Source: Los Alamos National Laboratory, www.lanl.govfpfp2Ifmirview.)
with many synchronously active neurons contributing, produces a field
strength just one billionth that of the magnetic field generated by the Earth,
nearby power lines, and the movement of distant metal objects such as
elevators and cars. Detecting the brain's infinitesimal magnetic signals in
the midst of those relatively immense sources of environmental magnetic
"noise" is analogous to. listening for the footsteps of an ant in the middle of
a rock concert! It requires a specially screened room to shield out the mag-
netic noise and an expensive instrument with highly sensitive magnetic de-
tectors that are cooled with liquid helium to -269°C (Figure 19.5).
The capabilities of MEG complement those of other methods that meas-
ure brain function. MEG is much better than EEG at localizing the sources
of neural activity in the brain, particularly when they are deep below the
surface. Like EEG, MEG can record rapid fluctuations of neural activity that
are much too fast to be detected by fMRI or PET (see Box 7.3). MEG cannot
provide the spatially detailed images of fMRI, however. Another important
distinction is that EEG and MEG directly measure the activity of neurons,
whereas fMRI and PET detect changes in blood flow or metabolism, which
are controlled in part by neuronal activity, but may also be influenced by
other physiological factors. MEG is currently being used in experimental
studies of the human brain and its cognitive functions and as an aid in the
diagnosis of epilepsy and language disorders.
EEG Rhythms
EEG rhythms vary dramatically and often correlate with particular states of
behavior (such as level of attentiveness, sleeping, or waking) and pathol-
ogy (seizures or coma). Figure 19.6 shows part of a normal EEG. The
rhythms are categorized by their frequency range, and each range is named
after a Greek letter. Beta rhythms are fastest, anything greater than about 14
Hz, and signal an activated cortex. ALpha rhythms are about 8-13 Hz and are
associated with quiet, waking states. Theta rhythms are 4-7 Hz and occur
during some sleep states. Delta rhythms are quite slow, less than 4 Hz, often
large in amplitude, and are a hallmark of deep sleep.
While analysis of an EEG will never teU us what a person is thinking,
if can help us know if a person is thinking. In general. high-frequency,
low-amplitude rhythms are associated with alertness and waking, or the
Y THE ELECTROENCEPHALOGRAM 589
590 C HAP T E R I 9 . BRAIN RHYTHMS AND SLEEP
FiGURE 19.6
A normal EEG. The subject is awake and
quiet. and electrode recording positions are
Indicated at the left. The first few seconds
show normal alpha activity. which has frequen-
cies of 8-1 3 Hz and is largest in the occipital
regions. About halfYvay through the recording.
the subject opened his eyes, signaled by
the large blink artifacts on the top traces
(arrows). and alpha rhythms were suppressed.
/
/ ..
(a)
. .
Jb
(b)
FIGURE 19.7
Two mechanisms of synchronous
rhythms. Synchronous rhythms can
(a) be led by a pacemaker or (b) arise from
the collective behavior of all participants.
Time (see)
1 2
I I
Blink artifacts
II ?
9
i
3
,
4
I
7
I
I
- -......-...._- """'.(",..
I v
8
I
.
,....."....v.-..- ..r ......,..,....
.
1.r""-'l"""'V-IM. ...'''_ t-'Hv
.
'lV1t-NVlJ' .; ,;Yi.{,:."' '''':.-" ..",.- II50 !J.V
i
'-------,.-'
Alpha rhythms
.
Beta rhythms
Electrode
positions
dreaming stages of sleep. Low-frequency, high-amplitude rhythms are asso-
ciated with nand reaming sleep states, or the pathological state of coma.
This is logical because when the cortex is most actively engaged in pro-
cessing information, whether generated by sensory input or by internal
processes, the activity level of cortical neurons is relatively high but also
relatively unsynchronized. In other words, each neuron, or very sma))
group of neurons, is vigorously involved in a slightly different aspect of a
complex cognitive task; it fires rapidly, but not quite simultaneously with
most of its neighbors. This leads to low synchrony, so EEG amplitude is low,
and beta rhythms dominate. By contrast, during deep sleep, cortical neurons
are not engaged in information processing, and large numbers of them are
phasically excited by a common, slow, rhythmic input. In this case syn-
chrony is high, so EEG amplitude is high.
Mechanisms and Meanings of Brain Rhythms
Electrical rhythms abound in the cerebral cortex. But how are they gener-
ated, and what functions do they perform? Let's take a look at each of these
questions.
The Generation of Synchronous Rhythms. The activity of a large set of
neurons will produce synchronized oscillations in one of two fundamental
ways: (1) They may all take their cues from a central clock, or pacemaker; or
(2) they may share or distribute the timing function among themselves by
mutually exciting or inhibiting one another. The first mechanism is analogous
to a leader and a band, with each musician playing in strict time to the
baton's changing beat (Figure 19.7a). The second mechanism is more sub-
tle, because rhe timing arises from the collective behavior of the cortical
neurons themselves. Musically, it is more like a jam session (Figure 19.7b).
The concept can be easily demonstrated by a group of friends, even non-
musical ones. Simply tell them to clap together, but give them no instruc-
tions about how fast to clap or whose beat to follow. Within one or two
claps, they will all be clapping in synchrony! How? By listening and watch-
ing each other, they will adjust their clapping rates to match. A key factor
is person-to-person interaction; in a network of neurons, these interactions
occur via synaptic connections. People rend to clap within a narrow range
of frequencies, so they don't have to adjust their timing very far in order
to clap in synchrony. Likewise, some neurons may fire at certain frequen-
cies much more than others. This kind of collective, organized behavior can
generate rhythms of impressive dimensions, which can move in space and
time. Have you ever been part of a human wave in the stands of a sold-
out football stadium?
Many different circuits of neurons can generate rhythmic activity. A very
simple oscillator, consisting of just one excitatory and one inhibitory neu-
ron, is shown in Figure] 9.8.
Within the mammalian brain, rhythmic, synchronous activity is usually
. coordinated by a combination of the pacemaker and the collective methods.
The thalamus, with its massive input to all of the cortex, can act as a power-
ful pacemaker. Under certain conditions, thalamic neurons can generate
very rhythmic action potential discharges. But how do thalamic neurons
oscillate? Thalamic cells have a particular set of voltage-gated ion channels
that allow each cell to generate very rhythmic, self-sustaining discharge
patterns even when there is no external input to the cell (Figure 19.9). The
rhythmic activity of each thalamic pacemaker neuron then becomes syn-
chronized with many other thalamic cells via a hand-clapping kind of col-
lective interaction. Synaptic connections between excitatory and inhibitory
thalamic neurons force each individual neuron to conform to the rhythm
of the group. These coordinated rhythms are then passed to the cortex by
the thalamocortical axons, which excite cortical neurons. In this way, a rel-
atively small group of centralized thalamic cells (acting as the band leader)
can compel a much larger group of cortical cells (acting as the band) to
march to the thalamic beat (Figure 19.10).
Some rhythms of the cerebral cortex do not depend on the thalamic
pacemaker but rely instead on the collective, cooperative interactions of
cortical neurons themselves. In this case, the excitatory and inhibitory
:> +30
E-
rn 0
-E -30
D-
g -60
.0
E
Q)
::2:
(a)
:>
.s +30
C 0
Q)
<5
-30
c
co
-60
Q)
::2:
(b)
Stimulus
cu rrent
W
600 1000 1800
Time (m,ec)
FIGURE 19.9
A one-neuron oscillator. At times during sleep states, thalamic neurons fire In rhythmic
patterns that do not reflect their input. Shown here are intracellular recordings of membrane
voltage in such a case. (a) A short pulse (less than 0.1 sec) of stimulus current was applied,
and the cell responded with almost 1 sec of rhythmic firing, first with bursts at about 5 Hz,
and then with single spikes. (b) Two of the bursts expanded in time: each burst is a cluster
of five or six action potentials. (Source: Adapted from Bal and McCormick, 1993. Fig. 2.)
... THE ELECTROENCEPHALOGRAM 591
Constantly
active E cell ( I cell
excitatory o
Input 0
CY
t
Orf.°
O
t
AJ
Excitatory axon
firing pattern
Ecell
firing pattern
One
cyde
I cell
firing pattern
FIGURE 19.8
A two-neuron oscillator. One excitatory
cell (E cell) and one inhibitory cell (I cell)
synapse upon each another. As long as there
is a constant excitatory drive (which does not
have to be rhythmic) onto the E cell. activity
will tend to trade back and forth between the
two neurons. One activity cycle through the
network will generate the pattern of firing
shown in the dashed box.
592 C HAP T E R I 9 . BRAIN RHYTHMS AND SLEEP
Cortex
"'-
Thalamus
Afferent
pathways
FIGURE 19.10
Rhythms in the thalamus driving
rhythms in the cerebral cortex.
The thalamus can generate rhythmic activity
because of the Intrinsic properties of Its
neurons and Qecause of its synaptic intercon-
nections. In the thalamus, green represents a
population of excitatory neurons, and black
represents a population of inhibitory neurons.
imerconnections of the neurons result in a coordinated, synchronous pattern
of activity that may remain localized or spread to encompass larger regions
of cortex.
Functions of Brain Rhythms. Cortical rhythms are fascinating to watch
in an EEG, and they parallel so many interesting human behaviors that we
are compelled to ask: Why so many rhythms? More importantly, do they
serve a purpose? There are no satisfactory answers yet. Ideas abound, but
relevant data are scarce. One hypothesis for sleep-related rhythms is that
they are the brain's way of disconnecting the cortex from sensory input.
When you are awake, the thalamus allows sensory information to pass
through it and be relayed up to the cortex. When you are asleep, thalamic
neurons enter a self-generated rhythmic state that prevents organized
sensory information from being relayed to the cortex. While this idea has
intuitive appeal (most people do prefer to sleep in a dark, quiet environ-
ment), it does not explain why rhythms are necessary. Why not just steadily
inhibit the thalamus and allow the cortex to rest quietly?
A function for fast rhythms in the awake cortex has also been proposed.
Recall from Chapter 10 that one scheme for understanding visual percep-
tion takes advantage of the fact that cortical objects responding to the same
object are synchronously active. Walter Freeman, a neurobiologist at the
University of California, Berkeley, pioneered the idea that neural rhythms
are used to coordinate activity between regions of the nervous system. Both
sensory and motor systems of the awake brain often generate bursts of syn-
chronous neural activity that give rise to EEG oscillations in the 30-80 Hz
range (sometimes called gamma rhythms).
By momentarily synchronizing the fast oscillations generated by differ-
ent regions of cortex, perhaps the brain binds together various neural com-
ponents into a single perceptual construction. For example, when you are
trying to catch a basketball, different groups of neurons that simultane-
ously respond to the specific shape, color. movement, distance, and even
the significance of the basketball will tend to oscillate synchronously. The
fact that the oscillations of these scattered groups of cells (those that to-
gether encode "basketballness") are highly synchronous would somehow
tag them as a meaningful group, distinct from other nearby neurons,
thereby unifying the disjointed neural pieces of the "basketball puzzle." The
evidence for this idea is indirect, far from proven, and understandably
con troversial.
For now, the functions of rhythms in the cerebral cortex are largely a
mystery. One plausible hypothesis is that most rhythms have no direct
function. Instead, they may be intriguing but unimportant by-products of
the tendency for brain circuits to be strongly interconnected, with various
forms of excitatory feedback. When something excites itself, whether it is
an audio amplifier or the human stadium wave, it often leads to instability
or oscillation. Feedback circuits are essential for the cortex to do all the
marvelous things it does for us. Oscillations may be the unfortunate but
unavoidable consequence of so much feedback circuitry, unwanted but
tolerated by necessity. Even without a function, EEG rhythms provide us
with a convenient window on the functional states of the brain.
The Seizures of Epilepsy
Seizures, the most extreme form of synchronous brain activity, are always
a sign of pathology. A generalized seizure involves the entire cerebral
cortex of both hemispheres. A partial seizure involves only a circum-
scribed area of the cortex. In both cases, the neurons within the affected
areas fire with a synchrony that never occurs during normal behavior. As
a consequence, seizures are usually accompanied by very large EEG patterns.
The cerebral cortex, probably because of its extensive feedback circuitry, is
never far from the runaway excitation we know as a seizure. Isolated
seizures are not uncommon during a lifetime, and 7-10% of the general
population have at least on . When a person experiences repeated seizures,
the condition is known as epilepsy. About 1 % of the U.S. population
(almost 3 million people) has epilepsy.
Epilepsy is more a symptom of disease than a disease itself. Its causes can
sometimes be identified, and they include tumors, trauma, metabolic dys-
function, infection, and vascular disease, but in many cases the cause of
epilepsy is not known. Different types of seizures have different underly-
ing mechanisms. Some forms of epilepsy show a genetic predisposition, and
the genes responsible for a few forms have been identified. These genes
code for a diverse array of proteins, including ion channels, transporters,
and receptors. Several mutations of genes that encode for sodium channel
proteins, for example, have been linked to rare familial forms of epilepsy.
These mutated sodium channels tend to stay open a bit longer than normal,
allow more sodium current to enter the neurons, and thus make neurons
hyperexcitable. Another group of mutations that leads to epilepsy impairs
synaptic inhibition mediated by GAB A.
Research suggests that some seizures reflect an upset of the delicate bal-
ance of synaptic excitation and inhibition in the brain. Other seizures may
be due to excessively strong or dense excitatory interconnections. Drugs
that block GABA receptors are very potent convulsants (seizure-promoting
agents). The withdrawal of chronic depressant drugs, such as alcohol or
barbiturates, may also trigger seizures. A variety of drugs are useful in the
suppression of seizures, and these anticonvulsants tend to counter excitabil-
ity in various ways. For example, some act by prolonging the inhibitory ac-
tions of GABA (e.g., barbiturates, benzodiazepines), while others decrease the
tendency for certain neurons to fire high-frequency action potentials (e.g.,
phenytoin, carbamazepine).
The behavioral features of a seizure depend on the neurons involved and
the patterns of their activity. During most forms of generalized seizures,
virtually all cortical neurons participate, so behavior is completely disrupted
for many minutes. Consciousness is lost, while all muscle groups may be
driven by tonic (ongoing) activity or by clonic (rhythmic) patterns, or by
both in sequence, the so-called tonic-clonic seizure. Absence seizures occur
during childhood and consist of less than 30 sec of generalized, 3 Hz EEG
waves accompanied by loss of consciousness. An EEG recorded during an
absence seizure illustrates several very striking abnormalities (Figure 19. I 1).
The voltage patterns are extraordinarily large, regular, and rhythmic and
they are generated synchronously across the entire brain. Despite this
dramatic pattern of activity, the motor signs of an absence seizure are
strangely subtle-fluttering eyelids or a twitching mouth.
Partial seizures can be instructive. If they begin in a small area of motor
cortex, they can cause clonic movement of part of a limb. In the late 1800s,
Bristish neurologist John Hughlings Jackson observed the progression of
seizure-related movements across the body, looked at his patients' brains
after they died, and correctly inferred the basic somatotopic map of the
motor cortex (see Chapter 14). If seizures begin in a sensory area. they can
trigger an abnormal sensation, or aura, such as an odd smell or sparkling
lights. Most bizarre are the partial seizures that elicit more well-formed
auras such as deja vu (the feeling that something has happened before) or
hallucinations. Sometimes involving the cortex of the temporal lobes, includ-
ing the hippocampus and amygdala, they can impair memory, thought, and
..,. THE ELECTROENCEPHALOGRAM 593
594 C HAP T E R I 9 . BRAIN RHYTHMS AND SLEEP
FIGURE 19.11
An EEG of generalized epilepic seizure.
(a) EEG electrodes are placed at various positions
on the scalp. (b) They detect a brief absence
seizure that begins abruptly. is synchronized across
the entire head. generates strong neural activity
with rhythms of about 3 Hz. and ends after
about I 2 see. (Source: Adapted from
www.biopae.com/bslprolessons/h 10/
EEGabnormality.gif; J F. Lambert and N. Chantrier.)
(a)
2
3
4
5
6
7
8
9
I--
(b) 5 see
consciousness. In some cases, partial seizures may spread uncontrollably
and become generalized seizures.
"f' SLEEP
Sleep and dreams-they are mysterious, even mystical to some people, and
a favorite subject of art and literature, philosophy and science. Sleep is a
powerful master. Each night, we abandon our companions, our work, and
our play and enter the cloister of sleep. We have only limited control over
the decision; we can postpone sleep for a while, but eventually it over-
whelms us. We spend about one-third of our lives sleeping and one-quarter
of that time in a state of active dreaming.
Sleep is universal among higher vertebrates, perhaps among all animals.
Recent research suggests that even the fruit fly, Drosophila. sleeps. Prolonged
sleep deprivation is devastating to proper functioning, at least temporarily,
and in some animals (though not humans), it may even cause death. Sleep
is essential to our Jives-almost as important as eating and breathing. But
why do we sleep? What purpose does it serve? Despite many years of re-
search, the joke remains that the only thing we are sure of is that sleep
overcomes sleepiness. But one of the wonderful things about science is that
the lack of consensus inspires a flourishing of theories, and sleep research
is no exception.
We can still describe what we cannot explain, and sleep has been richly
studied. Let's begin wi th a definition: Sleep is a readily reversible state of reduced
responsiveness to, and interaction with, the environment. (Coma and genera]
anesthesia are not readily reversible and do not quaJify as sleep.) In the sec-
tions that follow, we discuss the phenomenology and neural mechanisms
of sleep and dreaming.
The Functional States of the Brain
During a normal day, you experience two very different and noticeable
types of behavior: waking and sleeping. It is much less obvious that your
... SLEEP 595
BEHAVIOR
NON-REM SLEEP
Table 19.1 Characteristics of the Three Functional States of the Br"ain
REM SLEEP
AWAKE
EEG
Sensation
Thought
Movement
Low voltage, fast
Vivid, externally generated
Logical, progressive
Continuous, voluntary
High voltage, slow
Dull or absent
Logical, repetitive
Occasional, involuntary
Rapid eye movement
Often
Rare
sleep also has very distinct phases, or states. Several times during a night,
you enter a state called rapid eye movement sleep, or REM sleep,
when your EEG looks more awake than asleep, your body (except for your
eye and respiratory muscles) is immobilized, and you conjure up the vivid,
detailed illusions we call dreams. The rest of the time you spend in a state
called non-REM sleep, in which the brain does not usually generate
complex dreams. (Non-REM sleep is also sometimes called slow-wave sleep
because of its domination by large, slow EEG rhythms.) These fundamental
behavioral states-awake, non-REM sleep, and REM sleep-are produced
by three distinct states of brain function (Table L 9.1). Each behavioral state
is also accompanied by large shifts in body function.
Non-REM sleep seems to be a period for rest. Muscle tension throughout
the body is reduced, and movement is minimal. It is important to realize
that the body is capable of movement during non-REM sleep, but only
rarely does the brain command it to move, usually to briefly adjust the
body's position. The temperature and energy consumption of the body are
lowered. Because of an increase in activity of the parasympathetic division
of the autonomic nervous system (ANS), heart rate, respiration, and kid-
ney function all slow down, and digestive processes speed up.
During non-REM sleep, the brain also seems to rest. Its rate of energy
use and the general [iring rates of its neurons are at their lowest point of
the day. The slow, large-amplitude EEG rhythms indicate that the neurons
of the cortex are oscillating in relatively high synchrony, and experiments
suggest that most sensory input cannot even reach the cortex. While there
is no way to know for certain what people are thinking when they are
asleep, studies indicate that mental processes also hit their daily low during
the non-REM state. When awakened, people usually recall nothing, or
only very vague thoughts. Detailed, entertaining types of dreams are rare,
although not absent, during non-REM sleep. William Dement, a prominent
sleep researcher at Stanford University, characterizes non-REM sleep as an
idling brain in a movable body.
In contrast, Dement calls REM sleep an active, hallucinating brain in a
paralyzed body. REM sleep is dreaming sleep. Although the REM period ac-
counts for only a small part of our sleep time, it is the part most researchers
get excited about (and this is the state that most excites the brain), probably
because dreams are so intriguing and enigmatic. If you awaken someone
during REM sleep, as Dement, Eugene Aserinsky, and Nathaniel Kleitman
first did in the mid-1950s, she will likely report visually detailed, lifelike
episodes, often with bizarre story lines-the kinds of dreams we love to talk
about and try to interpret.
The physiology of REM sleep is also bizarre. The EEG looks almost indis-
tinguishable from that of an active, waking brain, with fast, low-voltage
fluctuations. This is why REM sleep is sometimes referred to as paradoxical
Low voltage, fast
Vivid, internally generated
Vivid, illogical, bizarre
Muscle paralysis; movement commanded
by the brain but not carried out
Often
596 C HAP T E R I 9 . BRAIN RHYTHMS AND SLEEP
sleep. In fact, the oxygen consumption of the brain (a measure of its energy
use) is higher in REM sleep than when the brain is awake and concentrat-
ing on difficult mathematical problems. The paralysis that occurs during
REM sleep is almost a total loss of skeletal muscle tone, or atonia. Most of
the body is actually incapable of moving! Respiratory muscles do continue
to function, but just barely. The muscles controlling eye movement and the
tiny muscles of the inner ear are the exceptions; these are strikingly active.
With lids closed, the eyes occasionally dart rapidly back and forth. These
bursts of rapid eye movement are the best predictors of vivid dreaming, and
90-95% of people awakened during or after them report dreams.
Physiological control systems are dominated by sympathetic activity dur-
ing REM sleep. Inexplicably, the body's temperature control system simply
quits, and core temperarure begins to drift downward. Heart and respira-
tion rates increase but become irregular. In healthy people, the clitoris and
penis become engorged with blood and erect, although this usually has
nothing to do with the sexual content of dreams. Overall, during REM
sleep, the brain seems to be doing everything except resting.
The Sleep Cycle
Even a good night's sleep is not a steady, unbroken journey. Figure 19.12
shows the cycling of eye movements, physiological functions, and penile
erections through non-REM and REM periods during one full night of
sleep. It is obvious that sleep takes the brain through a repetitive roller-
coaster ride of activity. Roughly 75% of total sleep time is spent in non-
REM and 25% in REM, with periodic cycles between these states through-
out the night. Non-REM sleep is generally divided into four distinct stages.
During a normal night, we slide through the stages of non-REM, then into
REM, then back through the non-REM stages again, repeating the cycle
about every 90 minutes. These cycles are examples of ultradian rhythms,
which have faster periods than circadian rhythms.
EEG rhythms during the stages of sleep are shown in Figure 19.13. As
an average, healthy adult becomes drowsy and begins to sleep, she first
enters stage] non-REM sleep. Stage I is transitional sleep, when the EEG
alpha rhythms of relaxed waking become less regular and wane, and the
eyes make slow, rolling movements. Stage] is fleeting, usually lasting only
a few minutes. It is also the lightest stage of sleep, meaning that we are
most easily awakened. Stage 2 is slightly deeper and may last 5-]5 min-
utes. Its characteristics include the occasional 8-14 Hz oscillation of the
EEG called the sleep spindle, which is known to be generated by a thalamic
pacemaker. In addition, a high-amplitude sharp wave called the [( complex
is observed. Eye movements almost cease. Next follows stage 3, and the
EEG begins large-amplitude, slow delta rhythms. Eye and body movements
are usually absent, although there are exceptions (Box 19.1). Stage 4 is the
deepest stage of sleep, with large EEG rhythms of 2 Hz or less. During the
first cycle of sleep, stage 4 may persist for 20-40 minutes. Then sleep begins
to lighten again, ascends to stage 2 for 10-15 minutes, and suddenly enters
a brief period of REM sleep, with its fast EEG beta rhythms and sharp, fre-
quent eye movements.
As the night progresses, there is a general reduction in the duration of
non-REM sleep, particularly in stages 3 and 4, and an increase in the REM
periods. Half of the night's REM sleep occurs during its last third, and the
longest REM cycles may last 30-50 minutes. Still, there seems to be an
obligatory refractory period of about 30 minutes between periods of REM;
in other words, each REM cycle is followed by at least 30 minutes of non-
REM sleep before the next REM period can begin.
Non- Non- Non- Non- Non-
REM REM REM REM REM REM REM REM REM REM
Awake
(f) Stage 1 I I I I I I I I
ID
0)
co Stage 2
(j) I I II I I I I I I I
CD Stage 3
W I I
W
Stage 4 I
.
(a)
(f) f ilii
c
E . . .. II. I..
WID
>
0
E
75
ID
65
t
co
ID
I
55
26 .
ID
22
c
.Q
"6. 18
(f)
ID
II:
14
c i - - - A
.Q
t5 h
20 tM r\
ID
M
"c 10
ID
a..
0 I I I J I I
0 2 3 4 5 6 7 8
(b) Time of day (h)
What is a normal night's sleep? Your mother may have insisted that you
need a "good 8 hours" of sleep each night. Research suggests that normal
requirements vary widely among adults, from about 5-10 hours per night.
The average length is about 7.5 hours, and the sleep duration of about 68%
of young adults is between 6.5 and 8.5 hours. Teenagers may rind it especially
challenging to get enough sleep. Research by Mary Carskadon at Brown
University suggests that sleep requirements do not decrease between
preadolescence and early teen years, but changes in circadian timing mech-
anisms make it progressively harder for teenagers to fall asleep early in the
evening. This process often coincides with the move to high school, and an
earlier start of the school day. As a result, many students are chronically
sleep-deprived, which is an unhealthy condition.
'Y SLEEP 597
FIGURE 19.12
Physiological changes during non-REM
and REM sleep. (a) This graph represents
one night of sleep, starting with a transition
from awake to stage I non-REM sleep" The
sleep cycle progresses through the deeper
stages of non-REM sleep, then into REM sleep.
It is repeated several times. but each cycle has
shorter and shallower non-REM periods and
longer REM periods. (b) These graphs show
regular increases in heart rate, respiration
rate, and penile erection during the REM
periods of one night of sleep. (Source:
Adapted from Purves et aI., 2004. Fig. 27.7.)
598 C HAP T E R I 9 . BRAIN RHYTHMS AND SLEEP
R
L JI
(a)
R
L 1f'fv V ,.
(b)
R Jr H
l
(c)
FIGURE 19.14
Sleep in the bottlenose dolphin. These
EEG patterns were recorded from the right
(R) and left (L) hemispheres. (a) High-
frequency activity on both sides during alert
wakefulness. (b) Large delta rhythms of deep
sleep only on the right side, with fast activa-
tion on the left. (c) The patterns shift to op-
posite hemispheres some time later: (Source:
Mukhametov, 1984, Fig. I.)
Awake
REM
sleep
Stage 1
non-REM
sleep
Stage 2
non-REM
sleep
Stage 3
non-REM
sleep
Stage 4
non-REM
sleep
rvI J,,v. !II!i w. ',," 'Ht...>i'
Alpha rhythms
Beta rhythms
,"1'''''',, f {1(.4w.
Beta rhythms
¥.,),'vjf . i. '/r\/'''',
Theta rhythms
J\A'1"WtioI""A "", i, AM.f'1 "IJtW"""'ty.fr'yV"".
Spindle . V : Plex
N
Delta rhythms '
o
Delta rhythms
10
Time (see)
20
5
15
FIGURE 19.13
EEG rhythms during sleep. The recordings illustrate EEG rhythms that characterize each
sleep stage. (Source: Adapted from Horne, 1988, Fig. 1.1)
What is the proper length of sleep time for you? The best measure of suc-
cessful sleep is the quality of your time awake. You need a certain amount
of sleep to maintain a reasonable level of alertness. Too much daytime
sleepiness can be more than annoying; it can be dangerous if it interferes
with driving, for example. Because of the wide variations among individu-
als, you must decide for yourself how much sleep you need.
Why Do We Sleep?
All mammals, birds, and reptiles appear to sleep, although only mammals
and some birds have a REM phase. Sleep time varies widely, from about
18 hours a day in bats and opossums to about 3 hours a day in horses and
giraffes. Some people argue that a behavior as pervasive as sleep must have
a critical function; otherwise, some species would have lost the need to
sleep through evolution. Whatever the function, there is good reason to
believe sleep is solely for the brain. A restful 8 hours in bed without sleep
might allow your body to recover from physical exertion, but you would
probably not be at your best mentally the next day.
Some animals apparently have more reason not to sleep than others.
Imagine living your entire life in deep or turbulent water, yet needing to
breathe air every minute or so. Even a quick nap would be awkward, at
best. This is precisely the situation with dolphins, yet they sleep about as
much as humans do. Remarkably, bottlenose dolphins sleep with only one
cerebral hemisphere at a time: about 2 hours asleep on one side, then 1
hour awake on both sides, 2 hours asleep on the other side, and so on, for
a total of 12 hours per night (Figure 19.14). (This gives new meaning to
the phrase, "being half asleep.") Bottlenose dolphins seem to have no REM
sleep. The blind Indus River dolphin of Pakistan uses sonar to navigate
Box 19.1
.... , ,,
"t' SLEEP 599
....
OF SPECIAL INTEREST
#
Walking, Talking, and
Screaming in Your Sleep
Sleep is not always serene and stationary. Walking, talking,
and screaming are common, and they usually occur during
non-REM sleep. If this seems surprising, remember that
REM sleep is accompanied by almost total body paralysis.
You would therefore be incapable of walking or talking
during REM sleep, even if your dream "urged" you to do it.
Sleepwalking, or somnambulism, peaks at about age II.
Although 40% of us were sleepwalkers as children, few of
us sleepwalk as adults. Sleepwalking usually occurs during
the first stage 4 non-REM period of the night. A full-
blown sleepwalking incident involves open eyes and move-
ment around the room, the house, or even outside, with
enough awareness to avoid objects and climb stairs. Cog-
nitive functioning and judgment are severely impaired. It is
often difficult to awaken sleepwalkers because they are in
deep, slow-wave sleep. The best treatment is a guiding
hand back to bed. Sleepwalkers usually have no memory
of the incident the next morning.
Almost everyone practices sleep talking, somniloquy,
now and then. Unfortunately, sleeping speech is usually so
garbled or nonsensical that a curious listener is disap-
pointed by its emptiness.
M,ore dramatic are sleep terrors, which are most com-
mon in children 5-7 years old. A girl screams in the
middle of the night. Her parents rush to her bedside,
frantic to know what has terrified her. The girl cries in-
consolably, unable to explain her horrifying experience.
After 10 agonizing minutes of shrieking and flailing, she
finally sleeps quietly, leaving the parents shaken and baf-
fled. The next morning she is bright and cheerful, with
no recollection of the night's misadventure. Sleep terrors
are distinctly different from nightmares, which are vivid,
complex dreams, outwardly quiet, that occur during
REM sleep. By contrast, sleep terrors begin in stage 3 or
4 of non-REM sleep, and the experience is not dreamlike
but a feeling of uncontrollable panic, accompanied by
greatly increased heart rate and blood pressure. They
usually pass with age and are not a symptom of a psychi-
atric disorder.
through muddy, turbid, sweeping currents, and during monsoon season, it
must never stop swimming or it will come to grief on the rocks and debris
of the flooded estuary it calls home. Still, the Indus River doJphin manages
to sleep, snatching "microsleeps" 4-6 seconds long while continuing to swim
slowly. Its many microsleeps add up to about 7 hours in a 24-hour day.
Dolphins have evolved extraordinary sleep mechanisms that adapt them
to a demanding environment. But the fact that dolphins are not sleepless
reinforces our question: What is so important about sleeping?
No single theory of the function of sleep is widely accepted, but the most
reasonable ideas fall into two categories: theories of restoration and theories
of adaptation. The first category is a commonsense explanation: We sleep to
rest and recover and to prepare to be awake again. The second category is
less obvious: We sleep to keep us out of trouble, to hide from predators
when we are most vulnerable or from other harmful features of the envi-
ronment, or to conserve energy.
If sleep is restorative, what is it restoring? Quiet rest is certainly not a
substitute for sleep. Sleeping does something more than simple resting.
Prolonged sleep deprivation can lead to serious physical and behavioral
problems (Box] 9.2). Unfortunately, no one has yet identified a particular
physiological process that is clearly restored by sleep, or an essential sub-
stance that "is made or a toxin that is destroyed while sleeping. Sleep does
prepare us to be effectively awake again. But does sleep renew us in the
same way that eating and drinking do, by replacing essential substances, or
the way the healing of a wound repairs damaged tissues? For the most part
evidence indicates that sleep is not a time of increased tissue repair for the
600 C HAP T E R I 9 . BRAIN RHYTHMS AND SLEEP
Box 19.2
.... , ...
OF SPECIAL INTEREST
'9' ...
.a The Longest AII-Nighter
In 1963, Randy Gardner was a 17 -year-old high school
student with an ambitious idea for a San Diego Science
Fair project. On December 28 he awoke at 6 a.m. to begin.
When he finished II days (264 hours) later, he had bro-
ken the world's record for nonstop wakefulness, under
the continuous scrutiny of two friends and, during the last
5 days, fascinated sleep researchers. He had used no drugs,
not even caffeine.
The experience was not pleasant. After 2 days with-
out sleep, Randy became irritable, nauseated, had trouble
remembering, and could not even watch te evision. By
the fourth day he had mild delusions and overwhelming
fatigue, and by the seventh day he had tremors, his
speech was slurred, and his EEG no longer showed al-
pha rhythms. Fortunately, he did not become psychotic,
despite the predictions of some "experts." On the con-
trary, on his last awake night, he beat one of his better-
rested observers at an arcade baseball game, and he
gave a coherent account of himself at a national press
conference.
When he finally went to bed, he slept for almost 15
hours straight, then stayed awake 23 hours to wait for
nightfall, and slept for another 10.5 hours. After the first
sleep, his symptoms had mostly disappeared, and within a
week, he was sleeping and behaving normally.
One of the most interesting things about Randy's ordeal
is that there were no lasting harmful effects. The same is
not true for some animals deprived of sleep. If rats are
kept awake for long periods, they progressively lose weight
while consuming much more food, they become weak,
accumulate stomach ulcers and internal hemorrhages, and
even die. They seem to suffer from an impairment of their
ability to regulate body temperature and metabolic needs.
Total sleep deprivation is not necessary. Prolonged REM
sleep Joss alone is detrimental. These results may imply that
sleep does provide something physiologically essential.
body. However, it is possible that brain regions such as the cerebral cortex
can achieve some form of essential "rest" only during non-REM sleep.
Adaptation theories of sleep take many forms. Some large animals eat
small animals; a stroll in the moonlight is far too risky for a squirrel living
in owl and fox territory. The squirrel's best strategy may be to stay safely
tucked away in an underground burrow during the night, and sleep is a
good way to enforce such isolation. At the same time, sleep may be an
adaptation for conserving energy. While sleeping, the body does only just
enough work to stay alive, core temperature drops, temperature regulation
is depressed, and the rate of calories burned is kept low.
Functions of Dreaming and REM Sleep
In many ancient cultures, people believed that dreams were a window on
some higher world and a source of information, guidance, power, or en-
1ightenment. Perhaps they were right but the collective wisdom of the past
does not agree on exactly how to interpret the meaning of dreams. Today
we must take a step backward and first ask whether dreams even have
meaning. Dreams are difficult to study. Obviously, we can't directly observe
the dreams of someone else, and even the dreamer has access to them only
after he or she has awakened, and perhaps forgotten or distorted the ex-
perience. Modern explanations of dreaming lean heavily on studies of
REM sleep rather than dreaming because the phenomena of REM can be
objectively measured. But it is important to remember that the two are not
synonymous. Some dreams can occur outside of REM sleep, and REM sleep
has many peculiar features that have nothing to do with dreaming.
Do we need to dream? No one knows, but the body does seem to crave
REM sleep. It is possible to deprive sleepers of REM sleep specifically, by
... SLEEP 60 I
waking them every time they enter the REM state; when they fall asleep a
minute or two later. it is inevitably into a non-REM state, and they can
accumulate an entire night of relatively pure non-REM sleep. As Dement
first observed, after several days of this annoying treatment. sleepers attempt
to enter the REM state much more frequently than normal. When they are
finally allowed to sleep undisturbed, they experience REM rebound and
spend more time in REM proportional to the duration of their deprivation.
Most studies have not found that REM deprivation causes any psychologi-
cal harm during the daytime. Again, it is important not to interpret REM
deprivation as dream deprivation, since during REM deprivation, dreams
may continue to occur during sleep onset and during non-REM periods.
Sigmund Freud suggested many functions for dreams. For Freud, dreams
were disguised wish-fulfillment. an unconscious way for us to express our
sexual and aggressive fantasies, which are forbidden while we are awake.
Bad dreams might help us conquer the anxiety-provoking events of life.
Recent theories of dreaming are more biologically based. Allan Hobson and
Robert McCarley of Harvard University propose an "activation-synthesis
hypothesis:' which explicitly rejects the Freudian, psychological interpreta-
tions. Instead, dreams, or at least some of their bizarre features, are seen as
the associations and memories of the cerebral cortex that are elicited by
the random discharges of the pons during REM sleep. Thus, the pontine
neurons, via the thalamus, activate various areas of the cerebral cortex, elicit
well-known images or emotions, and the cortex then tries to synthesize the
disparate images into a sensible whole. Not surprisingly, the "synthesized"
dream product may be quite bizarre and even nonsensical because it is trig-
gered by the semi-random activity of the pons. Evidence for the activation-
synthesis hypothesis is mixed. It does predict the weirdness of dreams and
their correlation with REM sleep. But it does not explain how random ac-
tivity can trigger the complex and fluid stories that many dreams contain,
nor how they can evoke dreams that recur night after night.
Many researchers have suggested that REM sleep, and perhaps dreams
themselves, have an important role in memory. None of the evidence is
definitive, but intriguing hints indicate that REM sleep somehow aids the
integration or consolidation of memories. Depriving humans or rats of REM
sleep can impair their ability to learn a variety of tasks. Some studies show
an increase in the duration of REM sleep after an intense learning experi-
ence. In one study, Israeli neuroscientist Avi Karni and his colleagues
trained people to identify the orientation of a small line in their peripheral
visual field. The task was made difficult by presenting the visual stimulus
for a very short period of time. With repeated practice over days, people
got much better at this task; surprisingly, their performance also improved
between evening and morning, after a night's sleep. Karni found that if
people were deprived of REM sleep, their learning of the task did not improve
overnight. Depriving them of non-REM sleep, on the other hand, actually
enhanced their performance. Karni hypothesizes that this kind of memory
requires a period of time to strengthen, and that REM sleep is particularly
effective for this purpose.
You may have heard about sleep-learning, the notion that you can study
for an exam by simply listening to a tape of the material while you bliss-
fully snooze away. Sounds like a student's fantasy, right? Unfortunately, it is
exactly that, and no more. There is no scientific evidence for sleep-learning,
and careful studies have shown that the very few things recalled the next
morning were heard when the subjects briefly woke up. In fact. sleep is a
profoundly amnesic state. Most of our dreams, for example, seem to be lost
forever. Although we dream profusely during each of the four or five
REM periods every night we usually remember only the last dream before
602 C HAP T E R I 9 . BRAIN RHYTHMS AND SLEEP
waking. Also, when we wake up to do something in the middle of the
night, we have often forgotten the incident by morning.
At this point, you are probably confused about the functions of dream-
ing and REM sleep. So are we. Unfortunately, there is not enough evidence
to suPPOrt or dismiss any of the theories we have discussed. There are also
many other creative and plausible ideas that we do not have the space to
present here.
Neural Mechanisms of Sleep
Until the 1940s. it was generally believed that sleep was a passive process:
Deprive the brain of sensory input, and it will fall asleep. However, when
the sensory afferents to an animal's brain are blocked, the animal contin-
ues to have cycles of waking and sleeping. We now know that sleep is an
active process that requires the participation of a variety of brain regions.
As we saw in Chapter 15, wide expanses of the cortex are actually controlled
by very small collections of neurons much deeper in the brain. These cells
act like the switches or tuners of the forebrain, altering cortical excitability
and gating the flow of sensory information into it. The full details of these
control systems are complex and not fully understood. But we can sum-
marize a few basic principles:
1. The neurons most critical to the control of sleeping and waking are part
of the diffuse modulatory neurotransmitter systems (see Chapter 15).
2. The brain stem modulatory neurons using norepinephrine (NE) and
serotonin (5-HT) fire during waking and enhance the awake state; some
neurons using acetylcholine (ACh) enhance critical REM events, and
other cholinergic neurons are active during waking.
3. The diffuse modulatory systems control the rhythmic behaviors of the
thalamus, which in turn controls many EEG rhythms of the cerebral
cortex; slow, sleep-related rhythms of the thalamus apparently block the
flow of sensory information up into the cortex.
4. Sleep also involves activity in descending branches of the diffuse modu-
latory systems, such as the inhibition of motor neurons during dreaming.
There are three basic kinds of evidence for the localization of sleep mech-
anisms in the brain. Lesion data reveal changes in function after a part of
the brain is removed, results of stimulation experiments identify changes
following the activation of a brain region, and recordings of neural activity
determine the relationship between that activity and different brain states.
Wakefulness and the Ascending Reticular Activating System.. Lesions
in the brain stem of humans can cause sleep and coma, suggesting that the
brain stem has neurons whose activity is essential to keeping us awake.
Italian neurophysiologist Giuseppe Moruzzi and his colleagues, working in
the 1940s and 1950s, began to sort out the neurobiology of the brain stem's
control of waking and arousal. They found that lesions in the midline struc-
tures of the brain stem caused a state similar to non-REM sleep, but lesions
in the lateral tegmentum, which interrupted ascending sensory inputs, did
not. Conversely, electrical stimulation of the midline tegmentum of the
midbrain, within the reticular formation, transformed the cortex from the
slow, rhythmic EEGs of non-REM sleep to a more alert and aroused state
with an EEG similar to that of waking. Moruzzi called this ill-defined region
of stimulation the ascending reticular activating system (mentioned in Chapter
15). This area is now much better defined, anatomically and physiologically,
and it is clear that Moruzzi's stimulation was affecting many different sets
of ascending modulatory systems.
Several sets of neurons increase their firing rates in anticipation of
awakening and during various forms of arousal. They include cells of the
locus coeruleus, which contain NE, serotonin-containing cells of the raphe
nuclei, ACh-containing cells of the brain stem and basal forebrain, and
neurons of the midbrain that use histamine as a neurotransmitter. Col-
lectively, these neurons synapse directly on the entire thalamus, cerebral
cortex, and other brain regions. The general effects of their transmitters are
a depolarization of neurons, an increase in their excitability, and a sup-
pression of rhythmic forms of firing. These effects are most clearly seen in
the relay neurons of the thalamus (Figure 19.15).
Falling Asleep and the Non-REM State. Falling asleep involves a pro-
gression of changes over several minutes, culminating in the non-REM
state. It is not clear what initiates non-REM sleep, but there is a general
decrease in the firing rates of most brain stem modulatory neurons (those
using NE, 5-HT, and ACh). Although most regions of the basal forebrain
seem to promote alertness and arousal. a subset 01 its cholinergic neurons
increases their firing rate with the onset of non-REM sleep and are sHent
during wakefulness.
Early stages of non-REM sleep include the EEG sleep spindles, described
earlier, which are generated by the inherent rhythmicity of thalamic neu-
rons (see Figure 19.13). As non-REM sleep progresses, spindles disappear
and are replaced by slow delta rhythms (less than 4 Hz). Delta rhythms also
seem to be a product of thalamic cells. occurring when their membrane
potentials become even more negative than during spindle rhythms (and
much more negative than they are during waking). Synchronization of
activity during spindle or delta rhythms is due to neural interconnections
within the thalamus, and possibly between the thalamus and cortex. Because
of the strong, two-way excitatory connections between the thalamus and
cortex, rhythmic activity in one is often strongly and widely projected onto
the other.
Mechanisms of REM Sleep. REM is such a different state from non-REM
that we would expect some clear neural distinctions. Many cortical areas are
at least as active during REM sleep as they are during waking. For example,
neurons of the motor cortex fire rapidly and generate organized motor
patterns that attempt to command the entire body but succeed only with a
few muscles of the eye, the inner ear, and those essential for respiration.
The elaborate dreams of REM sleep certainly require the cerebral cortex.
However, the cortex is not necessary for the production of REM sleep.
The use of PET imaging in the waking and sleeping human brain has
provided fascinating glimpses of the activity patterns that distinguish
waking from REM and non-REM sleep. Figure 19.16a shows the difference
in brain activity between REM sleep and waking. Some areas, including
primary visual cortex, were equally active in the two states. However, ex-
trastriate cortical areas and portions of the limbic system were significantly
more active during REM sleep. Conversely, regions of the frontal lobes
were noticeably less active during REM. Figure 19.16b contrasts the brain
activity in REM and non-REM sleep. The primary visual cortex and a
number of other areas are significantly less active during REM sleep, but
extrastriate cortex is more active. These results paint an intriguing picture
of what happens when we sleep. During REM, there is an explosion of
extrastriate activity, presumably during the times when we dream. How-
ever, there is no corresponding activity increase in primary visual cortex,
" SLEEP 603
(a)
j ACh or NE
(b)
f- ----J
0.5 see
FIGURE 19.15
Modulating thalamic and cortical
rhythmicity. In this case. either ACh or NE
shifts cells from (a) an intrinsic burst-firing
mode to (b) a single-spiking mode. This may
be what happens during transitions from
non-REM sleep to the waking state.
(Source: Steriade et al.. 1993. Fig. 50.)
604 C HAP T E R I 9 . BRAIN RHYTHMS AND SLEEP
"
REM - Wake
(a)
FIGURE 19.16
PET images of the waking and sleeping
human brain. (a) These images show brain
activIty in three hOrizontal sections. Color
represents changes in activIty between REM
sleep and waking Note the dark notch at
the bottom (posterior) edge of the sections.
indicating that striate cortex is equally active
in the two states. (b) REM sleep compared
with non-REM sleep (SWS). In REM, striate
cortex is less active. (Source: Adapted from
Braun et aI., 1998. Fig. I.)
FIGURE 19.17
Control of the onset and offset of REM
periods by brain stem neurons. This
graph shows the relative firing rates of REM
associated neurons during a single night.
Periods of REM sleep are green. REM-on cells
are cholinergic neurons of the pons. and they
increase their firing rates just before the onset
of REM sleep (red line). REM-off cells are
noradrenergic and serotonergic neurons of
the locus coeruleus and raphe nuclei, respec-
tively. and their firing rates increase just before
the end of REM sleep (blue line). (Source:
McCarley and Massaquol, 1986, Fig. 4B.)
"-.
"
REM - SWS
(b)
suggesting that the extrastriate excitation is internally generated. The emo-
tional component to dreams might derive from the heightened limbic ac-
tivation. The low activity in the frontal lobe suggests that high-level inte-
gration or interpretation of the extrastriate visual information might not
take place, leaving us with a buzz of uninterpreted visual imagery.
The control of REM sleep, as with the other functional brain states, derives
from diffuse modulatory systems in the core of the brain stem, particularly
the pons. The firing rates of the two major systems of the upper brain stem,
the locus coeruleus and the raphe nuclei, decrease to almost nothing with
the onset of REM (Figure 19.17). However. there is a concurrent sharp
increase in the firing rates of ACh-containing neurons in the pons, and
some evidence suggests that cholinergic neurons induce REM sleep. It is
probably the action of ACh during REM sleep that causes the thalamus and
cortex to behave so much like they do in the waking state.
Why don't we act out our dreams? The same core brain stem systems that
control the sleep processes of the forebrain also actively inhibit our spinal
motor neurons, preventing the descending motor activity from expressing
itself as actual movement. This is clearly an adaptive mechanism, protect-
ing uS from ourselves. In rare cases, usually elderly men, dreamers seem to
act out their dreams; they have a hazardous condition known as REM sleep
behavior disorder. These people often sustain repeated injuries, and even their
spouses have fallen victim to their nocturnal flailings. One man dreamed
he was in a football game and tackled his bedroom bureau. Another imag-
ined he was defending his wife from attack, when in fact he was beating
her in her bed. The basis for this REM disorder seems to be disruption of
the brain stem systems that normally mediate REM atonia. Experimental
lesions in certain parts of the pons can cause a similar condition in cats.
During REM periods, they may seem to chase imaginary mice or investi-
gate invisible intruders. Disorders of REM control mechanisms may also
underlie the problems of people with narcolepsy (Box 19.3).
Non-REM REM
- REM-on cells
- REM-off cells
4
(1)3
co
2
c
.;::
u:
o 2
8
3 4 5 6
Hours since sleep onset
7
Box 19.3
.... , .
OF SPECIAL INTEREST
T ...
... Naxcolepsy
Narcolepsy is a bizarre and disabling disturbance of sleeping
and waking. Despite the sound of the name. it is not a form
of epilepsy. It can include some or all of the following
manifestations.
Excessive daytime sleepiness can be severe and often
leads to unwanted "sleep attacks." Cataplexy is a sudden
muscular paralysis while consciousness is maintained. In the
middle of a normal day, sufferers suddenly collapse into a
state similar to REM sleep. Cataplexy is often brought on
by strong emotional expression, such as laughter or tears,
or by surprise or sexual arousal, and it usually lasts less
than a minute. Sleep paralysis, a similar loss of muscle con-
trol, occurs during the transition between sleeping and
waking; even though conscious, a person may be unable to
move or speak for several minutes. Hypnagogic hallucinations
are graphic dreams, often frightening, that can accompany
sleep onset and may occur following sleep paralysis.
EEG monitoring reveals that a narcoleptic person often
goes directly from waking into a REM phase, whereas nor-
mal adult sleepers always enter a long period of non-REM
sleep first. Most narcolepsy symptoms could be inter-
preted as an abnormal intrusion of the characteristics of
REM sleep into waking.
The prevalence of narcolepsy varies greatly. The dis-
order has a modest genetic component. In the United
States, first-degree relatives of people with narcolepsy
have roughly a I % chance of developing it themselves,
compared to the 0.1 % chance in people without an affected
first-degree relative. Environmental factors presumably
also play an important role.
Narcolepsy occurs in goats, donkeys, ponies, and more
than a dozen breeds of dogs. In 1999, Emmanuel Mignot,
Seiji Nishino, and their research team at Stanford Univer-
sity found that canine narcolepsy is caused by a mutation
of the gene for a hypocretin receptor. Hypocretin (also
known as orexin) is a peptide mainly expressed by neurons
whose cell bodies are in the hypothalamus. Also in 1999,
Masashi Yanagisawa and his group at the University of
Texas Southwestern Medical Center deleted the gene
responsible for hypocretin in mice and found that the
animals were narcoleptic. Hypocretin-containing neurons
project widely in the normal brain, and they strongly excite
neurons of the cholinergic, noradrenergic, serotonergic,
SLEEP 605
FIGURE A
Positions of hypocretin-containing neurons in the hypothalamus
of a normal brain (left) and a narcoleptic brain (right).
(Source: Adapted from Thannickal et aI., 2000, Fig. I.)
dopaminergic, and histaminergic modulatory systems.
When the peptide was first discovered, researchers
thought hypocretin was involved specifically in feeding
behavior (see Chapter 16), but now its role appears to be
more general. It facilitates neurons that enhance certain
kinds of motor behavior, promotes wakefulness, and in-
hibits REM sleep. Basic animal research of this sort quickly
inspired important studies of human narcolepsy.
In 2000, two research teams discovered that the brains
of human narcoleptics have about 10% or less of the
normal complement of hypocretin-containing neurons
(Figure A). Their cerebrospinal fluid has immeasurably low
levels of hypocretin. Human narcolepsy almost certainly
results from the selective death of hypocretin-containing
neurons, in most cases. Unlike in some animal versions of
the disease, hypocretin deficiency is not primarily due to
genetic defects. The reason hypocretin neurons die in nar-
coleptic patients is unknown, although some kind of au-
toimmune process seems to be involved.
There is no cure for narcolepsy yet, and current treat-
ments consist of trying to relieve the symptoms. Frequent
naps, amphetamines, and a drug called modafinil may help
daytime sleepiness, while tricyclic antidepressant drugs
(which have REM-suppressant effects) may reduce cata-
plexy and sleep paralysis. The discovery that hypocretin
deficiency underlies narcolepsy suggests an obvious po-
tential treatment-administer hypocretin, or its agonists.
This possibility is currently being tested.
606 C HAP T E R I 9 . BRAIN RHYTHMS AND SLEEP
Sleep-Promoting Factors. Sleepiness is one of the most familiar conse-
quences of infectious diseases, such as the common cold and the flu. There
may be direct links between the immune response to infection and the
regulation of sleep. Sleep researchers have searched intensIvely for a chem-
ical in the blood or cerebrospinal fluid (CSF) that promotes or even causes
sleep. Many sleep-promoting substances have been identified in sleep-de-
prived animals, and most of them interact with the body's immune system.
In the 1970s, physiologist John Pappenheimer of Harvard University iden-
tified a muramyl dipeptide in the spinal fluid of sleep-deprived goats that
facilitated non-REM sleep. Mummyl pep tides are usuaJly produced only by
the cell waJls of bacteria, not brain cells, and they also cause fever and stim-
ulate immune cells of the blood. It is nOI clear how they appear in CSF, but
they may be synthesized by bacteria in the intestines. Another sleep-pro-
moting factor. interleukin-l, is synthesized by the brain, in glia, and in
macrophages, cells throughout the body that scavenge foreign material. In-
terleukin-l is also a peptide that stimulates the immune system.
Adenosine, a more recent candidate as a sleep-promoting factor, might
appeal to the millions who drink coffee, tea, and cola. Adenosine is used by
all cells to build some of the most basic molecules of life, including DNA,
RNA, and ATP Adenosine is also released by some neurons and acts as a
neuromodulator at synapses throughout the brain. From ancient times,
antagonists of adenosine receptors, such as caffeine and theophylline. have
been used to keep people awake. Conversely, the administration of adeno-
sine or its agonists increases sleep. In a number of brain areas that have
been examined, extracellular adenosine levels are higher during waking
than while sleeping, and the levels progressively increase during prolonged
waking periods. Adenosine levels gradually decrease during sleep.
How might adenosine promote sleep? Adenosine has an inhibitory effect
on the diffuse modulatory systems for ACh, NE, and 5-HT thai tend to pro-
mote wakefulness. This suggests that sleep may be the result of a molecu-
lar chain reaction. Neural activity in the awake brain increases adenosine
levels, thereby increasing the inhibition of neurons in the modulatory sys-
tems associated with wakefulness. Enhanced suppression of the "wakeful"
modulatory systems makes it more likely that the brain will fall into the
slow-wave synchronous activity characteristic of sleep. After sleep begins,
adenosine levels slowly fall, and activity in the modulatory systems gradu-
ally increases until we wake up to start the cycle anew.
Anolher endogenous sleep-promoting substance is melatonin, a hormone
secreted by the pea-sized pineal body, which is located just above the tec-
tum (see the appendix to Chapter 7). Melatonin is a derivative of the amino
acid tryptophan. It has been called the "Dracula of hormones" because it is
released only when the environment darkens-normally at night-and its
release is inhibited by light. In humans, melatonin levels tend to rise around
the time we become sleepy in the evening, peak in the early morning
hours, and then fall to baseline levels by the time we awaken. Evidence
suggests that melatonin helps initiate and maintain sleep, but its precise
role in natural sleep-wake cycles is not clear. In recent years, melatonin has
become popular as an over-the-counter sleep-promoting drug. Although
it has shown some promise in treating the symptoms of jet lag and the
insomnia that affects some older adults, the general effect of melatonin on
improving sleep remains debatable.
Gene Expression During Sleeping and Waking. Research into the
neural lunction of sleep has benefited from studies at various levels of
analysis, including sleep behavior, brain physiology, and the action of diffuse
modulatory systems. The use of techniques from molecular neurobiology is
Y CIRCADIAN RHYTHMS 601
relatively new. While the pieces do not all fit together quite yet, it is clear
that the behavioral states of sleeping and waking are different even at the
molecular level. For example, in the macaque monkey, most areas of cere-
bral cortex show higher rates of protein synthesis in deep sleep than in light
sleep. In rats, levels of cAMP in several brain areas haw been found to be
lower during sleeping than waking.
Research has demonstrated that sleeping and waking are associated with
differences in the expression of certain genes. Chiara Cirelli and Giulio
Tononi, working at the Neurosciences Institute in San Diego and at the
University of Wisconsin, have studied the expression of thousands of genes
in rats that were awake or asleep. The vast majority of genes were expressed
at the same level in the two states. However, the 0.5% of genes that showed
different levels of expression may provide insight into what happens in the
brain during sleep. Most of the genes that were more highly expressed in
the awake brain could be placed into one of two groups. One group includes
what are called immediate early Henes, genes that code for transcription factors
that anect the expression of other genes. Some of these genes appear to be
related to changes in synaptic strength. The low expression of these genes
during sleep may be associated with the fact that learning and memory
formation are largely absent in this state. The second group of genes comes
from mitochondria. Increased expression of these genes may playa role in
satisfying the higher metabolic demands of the awake brain.
A different group of genes was most highly expressed during sleep, and
some of them might contribute to increased protein synthesis and synaptic
plasticity mechanisms that complement those most prevalent during waking.
An important point is that the sleep-related changes in gene expression
were specific to the brain, and they did not change in other tissues, such
as the liver and skeletal muscle. This is consistent with the widely held
hypothesis that sleep is a process generated by the brain, for the benefit of
the brain.
CIRCADIAN RHYTHMS
Almost all land animals coordinate their behavior according to circadian
rhythms, the daily cycles of daylight and darkness that result from the spin
of the Earth. (The term is from the Latin circa, "approximately," and dies,
"day.") The precise schedules of circadian rhythms vary among species.
Some animals are active during daylight hours, others only at night, and
others mainly at the transitional periods of dawn and dusk. Most physio-
logical and biochemical processes in the body also rise and fall with daily
rhythms; body temperature, blood flow, urine production, hormone levels,
hair growth, and metabolic rate al1 fluctuate (Figure 19.18). In humans,
there is an approximately inverse relationship between the propensity to
sleep and body temperature.
When the cycles of daylight and darkness are removed from an animal's
environment, circadian rhythms continue on more or less the same schedule
because the primary docks for circadian rhythms are not astronomical (the
sun and Earth) but biological, in the brain. Brain docks, like all clocks, are
imperfect and require occasional resetting. Now and then you readjust your
watch to keep it in sync with the rest of the world (or at least the time
given on the radio). Similarly, external stimuli, such as light and dark, or
daily temperature changes, help adjust the brain's clocks to keep them
synchronized with the coming and going of the sunlight. Circadian rhythms
have been well studied at behavioral, cellular, and molecular levels. Brain
docks are an interesting example of the link between the activity of specific
neurons and behavior.
608 C HAP T E R I 9 . BRAIN RHYTHMS AND SLEEP
80
({J
({J
OJ
-E 40
OJ
<x:
0
38
E
OJ
rn 37
Qj
Cl.
E
OJ
I-
36
:J 15
E
a,
.r: c
10
o OJ
C
(9 0
E 5
0
.r:
0
:J 15
oE
. 0 10
to
o
00,
2- 5
0
E- 3
. £
({J U
({Jill 2
1E E
o
n..
(lJQ.
",(lJ
o
'lf
'lf
(lJQ.
",(lJ
o
(lJQ.
q.(lJ
\ \\ 4
,
6
18
24
12
18
24 6 12
Time of day (h)
FIGURE 19.1 B
Circadian rhythms of physiological functions. Fluctuations over two consecutive days
are shown here. Alertness and core body temperature vary similarly, but growth hormone
and cortisol levels In the blood are highest during sleep, although at different times. The
bottom graph shows the excretion of potassium by the kidneys, which is highest during the
day (Source: Adapted from Coleman, 1986, Fig. 2.1.)
Biological Clocks
The first evidence for a biological clock came from a brainless organism, the
mimosa plant. The mimosa raises its leaves during the day and lowers them
at night. It seemed obvious to many people that the plant simply reacts to
sunlight, in some kind of reflex movement. In 1729, French physicist Jean
Jacques d'Ortous de Mairan tested the obvious; he put some mimosa plants
in a dark closet and found that they continued to raise and lower their
. CIRCADIAN RHYTHMS 609
leaves. But a surprising new observation can still lead to a wrong conclusion.
It was de Mairan's opinion that the plant was still somehow sensing the
sun's movements, even in the darkness. More than a century later, Swiss
botanist Augustin de Candolle showed that a similar plant in the dark
moved its leaves up and down every 22 hours, rather than every 24 hours,
according to the sun's movement. This implied that the plant was not re-
sponding to the sun and very likely had an internal biological clock.
Environmental time cues (light/dark, temperature and humidity varia-
tions) are collectively termed zeitgebers (German for "time givers"). In the
presence of zeitgebers, animals become entrained to the day-night rhythm
and maintain an activity cycle of exactly 24 hours. Obviously, even small,
consistent errors of timing could not be tolerated for long. A 24.5-hour
cycle would, within 3 weeks, completely shift an animal from daytime to
nighttime activity. When mammals are completely deprived of zeitgebers,
they settle into a rhythm of activity and rest that often has a period
more or less than 24 hours, in which case their rhythms are said to free-
run. In mice, the natural free-running period is about 23 hours; in ham-
sters, it is close to 24 hours; and in humans, it tends to be 24.5-25.5 hours
(Figure 19.19).
o
----A.-_______________
----- ------_.--------
----A-----------------
----A------.---------.
-----A---------------.
----A----------.._____
----A-----------------
----------------_.
-----A-------.---------
--_.-----------_.
___A___________________
___A____________________
--A____________________
--A--------------------
-A--------------------..
-A-------"'" ---- --- --
-A--- ____ ___ _.__ _n_
--------------.-------
A--- -.-----.-- ------
A-----------------------
.A---------.--------..--.
.-------------------.---
.------------.-------.--
.---------------------_.
A------.--------.------.
------------------
.A-----------.-----------
.-- __eo. __ ______e.
5
10
15
20
II)
>.
co
o 25
30
-:Ar.--- ----..,------ --.....
35
--------------_..----_.
A------------------
------_..-------------
A----------------------
.A----------..-------.-
A________________
A_____________.______
...--------------------
A--------.-----------.
A--------------------.
-A-------------------
--A-------------------
---A-------------.----
---A-----------------.
----A---------------.-.
---.-----------------
40
45
Midnight
Noon
Midnight
Time of day
Noon
Natural
situations
Free-
running
in an
isolated
situation
Entrained
to a
24-hour
day
Midnight
FIGURE 19.19
Circadian rhythms of sleep and wakefulness_ This is a daily plot of one person's
sleep-wake cycles. Each horizontal line is a day; solid lines indicate sleep, and dashed lines
indicate waking. A triangle indicates the point of the day's lowest body temperature. The
subject was first exposed to 9 days of natural 24-hour cycles of light and dark. noise and
quiet. and air temperature. During the middle 25 days, all time cues were removed, but the
subject was free to set his own schedule. Notice that the sleep-wake cycles remained stable,
but each lengthened to about 25 hours. The subject was now free-running. Notice also that
the low point of body temperature shifts from the end of the sleep period to the beginning.
During the last II days, a 24-hour cycle of light and meals was reintroduced, the subject
again entrained to a day-long rhythm. and body temperature gradually shifted back to its
normal point in the sleep cycle. (Source: Adapted from Dement, 1976, Fig. 2.)
I
610
C HAP T E R I 9 . BRAIN RHYTHMS AND SLEEP
It is quite difficult to separate a human from all possible zeitgebers. Even
inside a laboratory, society provides many subtle time cues, such as the
sounds of machinery, the comings and goings of people, and the on-off
cycling of heating and air conditioning. Some of the most secluded envi-
ronments are deep caves, which have been the sites for several isolation
studies. When people in caves are allowed to set their own schedules of ac-
tivity for months on end-waking and sleeping, turning lights on and off,
and eating when they choose-they initially settle into roughly a 25-hour
rhythm. But after days to weeks. their activity may begin to free-run with
a surprisingly long period of 30-36 hours. They stay awake for about 20
hours straight, then sleep for about 12 hours, and this pattern seems per-
fectly normal to them at the time.
In isolation experiments, behavior and physiology do not always con-
tinue to cycle together. Recent studies have found that body temperature
and other physiological measures change quite reliably over a 24-hour
cycle, even if people are entrained on a 20-hour or 28-hour "day" with
a nificia I lighting. This means that the rhythms of temperature and sleep-
ing-waking, which are normally synchronized to a 24-hour period, become
desynchronized. In the cave experiments described above, there can be
even larger differences in the periods of behavioral and physiological cycles,
when people are allowed to set their own schedules. Normally, our lowest
body temperature occurs shortly before we awaken in the morning, but
when desynchronized, this temperature nadir can drift, first moving earlier
into the sleep period, and then into waking time. Sleep quality and waking
comfort are impaired when cycles are desynchronized. One implication of
this desynchronization is that the body has more than one biological clock,
because sleeping-waking and temperature can cycle at their own pace,
uncoupled from one another.
Desynchronization may occur temporarily when we travel and force our
bodies suddenly into a new sleep-wake cycle. This is the familiar experience
known as jet lag, and the best cure is bright light. which helps resynchronize
our biological clock.
The primary zeitgeber for mammals is the light-dark cycle. The mother's
hormone levels may be the first zeitgeber for some mammals, however,
already entraining their activity levels in the womb. In studies of various
adult animals, effective zeitgebers have also included the periodic avail-
ability of food or water, social contact, environmental temperature cycles,
and noise-quiet cycles. Although many of these are much less effective
than light-dark cycles, they may be important for particular species, in cer-
tain circumstances.
The Suprachiasmatic Nucleus: A Brain Clock
A biological clock that produces circadian rhythms consists of several com-
ponents:
Light-sensitive input pathway Clock Output pathway
One or more input pathways are sensitive to light and dark, and entrain
the clock and keep its rhythm coordinated with the circadian rhythms of
the environment. The clock itself continues to run and keep its basic rhythm
even when the input pathway is removed. Output pathways from the clock
allow it to control certain brain and body functions according to the timing
of the clock.
Mammals have a tiny pair of neuron clusters in the hypothalamus that
serves as a biological clock: the suprachiasmatic nuclei (SCN), intro-
duced in Chapter 15. Each SCN has a volume of less than 0.3 mm 3 , and its
neurons are among the smallest in the brain. They are located on either
side of the midline, bordering the third ventricle (Figure 19.20). When the
SCN is stimulated electrically, circadian rhythms can be shifted in a pre-
dictable way. Removal of both nuclei abolishes the circadian rhythmicity of
physical activity, sleeping and waking, and feeding and drinking (Figure
19.21). In hamsters, the transplantation of a new SCN can restore rhythms
within 2-4 weeks (Box 19.4). The brain's internal rhythms never return
without an SCN. Lesions in the SCN do not abolish sleeping, however, and
animals will continue to coordinate their sleeping and waking with light-
dark cycles if they are present. Sleep appears to be regulated by a mechanism
other than the circadian clock, which depends primarily on the amount
and timing of prior sleep.
Because behavior is normally synchronized with light-dark cycles, there
must also be a photosensitive mechanism for resetting the brain clock. The
SCN accomplishes this via the retinohypothalamic tract: Axons from gan-
glion cells in the retina synapse directly on the dendrites of SCN neurons.
This input from the retina is necessary and sufficient to entrain sleeping
and waking cycles to night and day. When recordings are made from
neurons of the SCN, many are indeed sensitive to light. Unlike the more
familiar neurons of the visual pathways (see Chapter 10), SCN neurons
have very large, nonselective receptive fields and respond to the luminance
of light stimuli rather than their orientation or motion.
Recent research suggests, surprisingly, that the retinal cells synchronizing
the SCN are neither rods nor cones. Eyeless mice cannot use light to reset
their clocks, but mutant mice with intact retinas that lack rods and cones
can! Since rods and cones were the only known photoreceptors in mam-
mals, it remained a mystery how light could affect the circadian clock
without them.
This mystery was solved recently by David Berson of Brown University
and his colleagues (Box 19.5). They discovered a new photoreceptor in the
retina that was not at all like rods and cones but was, remarkably, a very
specialized type of ganglion cell. Recall from Chapter 9 that ganglion cells
are retinal neurons whose axons send visual information to the rest of the
brain; ganglion cells, like nearly all other neurons in the brain, were not
supposed to be directly sensitive to light. The light-sensitive ganglion cells,
however, express a newly recognized type of photopigment called
melanopsin, which is not present in rods and cones. These neurons are very
slowly excited by light, and their axons send a signal directly to the SCN
that can reset the circadian clock that resides there.
Output axons of the SCN mainly innervate nearby parts of the hypothal-
amus, but some also go to the midbrain and other parts of the diencephalon.
Because almost all SCN neurons use GABA as their primary neurotrans-
mitter, presumably they inhibit the neurons they innervate. It is not yet clear
how the SCN sets the timing of so many important behaviors. Extensive
lesions in the efferent SCN pathways disrupt circadian rhythms. [n addition
to the axonal output pathways, SCN neurons may rhythmically secrete the
peptide neuromodulator vasopressin (see Chapter 15).
SCN Mechanisms
How do neurons of the SCN keep time? We don't have a complete answer
at the molecular level, but it's clear that each SCN cell is a minuscule clock.
The ultimate isolation experiment has been simply to remove neurons
from the SCN of an animal and grow them alone in a tissue culture dish,
segregating them from the rest of the brain and from each other. Never-
theless, their rates of action potential firing, glucose utilization, vasopressin
... CIRCADIAN RHYTHMS 61 1
\
)-
f
'i\.... '--'
--
.....
)
t....'
Hypothalamus
SCN l
---
Optic --
chiasm
Third
ventricle
SCN
Optic chiasm -
FIGURE 19.20
The human SCN. Two suprachiasmatic
nuclei reside within the hypothalamus, just
above the optic chiasm and next to the third
ventncle. The sagittal view is followed by a
frontal view, sectioned at the dashed line.
r
612 C HAP T E R 19 . BRAIN RHYTHMS AND SLEEP
Awake
SWS1
Q) SWS2
rn
U5
REM
40.0
E
!:!
:::J 38.0
Q)
a.
E
Q)
I-
36.0
8 20 8 20
(a)
I
Ir
J/
8
20
8
8 20 8
Time of day (h)
20
8
20
20
8
Awake
SWS1
Q) SWS2
rn
U5
REM
40.0
E
!:!
:::J 38.0
rn
Qj
a.
E
Q)
I-
36.0
8
(b)
,I,..:IIIIIII'II!",
I
2"
u; 3000
C
6 2000
.s
. 1000
>
<t
/ ,..\
."p;,.-
1'-> \. , _ .. "
- ---. ""..... =-
o
o
12 24 36 48
Time (h)
FIGURE 19.22
Circadian rhythms of the SCN isolated
from the rest of the brain. The activrty of
a clock gene was monitored in 100 individual
SCN neurons maintained in tissue culture.
Each neuron generates a strong circadian
rhythm that is well coordinated with the
neurons. (Source: Adapted from Yamaguchi
et al.. 2003. Fig. I.)
20
20
8
8
8 20 8
Time of day (h)
20
20
8
FIGURE 19.21
The SCN and circadian rhythms. (a) Normal squirrel monkeys kept in a constantly
lit environment display circadian rhythms of about 25.5 hours. The graph shows the stages
of waking-sleeping and concurrent vanations in body temperature. The animals' activity states
were defined as awake, two levels of non-REM sleep (SWS I or SWS2) , or REM sleep.
(b) Circadian rhythms are abolished in monkeys with lesions In both SCN. kept In the
same constant-light environment. Notice that persistent high-frequency rhythms of both
activity and temperature result from SCN lesions. (Source: Adapted from Edgar et aI., 1993.
Figs. I, 3.)
production, and protein synthesis continue to vary with rhythms of about
24 hours, just as they do in the intact brain (Figure 19.22). SCN cells in
culture can no longer be entrained to light-dark cycles (input from the
eyes is necessary for this), but their basic rhythmicity remains intact and
expresses itself just as it does when an animal is deprived of zeitgebers.
SCN cells communicate their rhythmic message to the rest of the brain
through efferent axons, using action potentials in the usual way, and rates
of SCN cell firing vary with a circadian rhythm. However, action potentials
are not necessary for SCN neurons to maintain their rhythm. When
tetrodotoxin (TIX) , a blocker of sodium channels, is applied to SCN cells,
it blocks their action potentials but has no effect on the rhythmicity of their
Box 19.4
.... ,
OF SPECIAL INTEREST
..
...
"
l(
... CIRCADIAN RHYTHMS 613
Mutant Hamster Clocks
Golden hamsters are perfectionists of circadian timing.
When placed in constant darkness, they continue sleep-
ing and waking, running on their wheels. and eating and
drinking over an average period of 24.1 hours, for weeks
on end.
It was this dependability that made neuroscientists
Martin Ralph and Michael Menaker, then working at the
University of Oregon. notice when one of the hamsters
in their aboratory began punching in with 22.0-hour cycles
during a period of 3 weeks in the dark.This maverick male
was bred with three females of unimpeachable circadian
character (their free-running periods were 24.0 I, 24.03,
and 24.04 hours-quite normal). When 20 pups from the
three resulting litters were tested in the dark, their free-
running periods were evenly split into two narrow groups.
Half had periods of 24.0 hours, and half had periods of
22.3 hours. further cross-breeding showed that the ham-
sters with the shorter circadian periods had one mutant
copy of a gene (tau) that was dominant over their normal
gene. After further breeding, Ralph and Menaker also
found that animals with two copies of the mutant tau
gene had free-running periods of only 20 hours!
Hamsters with mutant circadian rhythms provided a
convincing way to answer a fundamental question: Is the
SCN the brain's circadian clock? Ralph. Menaker, and their
colleagues found that when both SCNs of a hamster were
ablated, rhythms were entirely lost. But rhythms could be
restored to these ablated animals by simply transplanting a
new SCN into their hypothalamus and waiting about a week.
The key finding was that hamsters receiving transplants
adopted the circadian rhythm of the transplanted SCN,
not the rhythm they were born with. In other words, if a
genetically normal hamster with SCN lesions received an
SCN from a donor with one copy of the mutant tau gene,
it subsequently cycled at about 22 hours. If its trans-
planted SCN came from an animal with two mutant taus,
it cycled at 20 hours. This is very compelling evidence that
the SCN is the master circadian clock in the hamster
brain, and probably in our own brain as well.
Short circadian periods were often devastating to a
mutant hamster's lifestyle when it was placed into normal,
24-hour light and dark cycles. A hamster's normal prefer-
ence is to be active at night. but most tau animals could
not completely entrain to the 24-hour rhythm. Instead,
they found their activity periods continually shifting
through various parts of the light-dark cycle.
A similar problem sometimes occurs in people, most
often in the elderly. Due to an age-dependent shortening
of the circadian rhythm, overwhelming sleepiness begins
in early evening, and awakening comes at 3:00 or 4:00 in
the morning. Some people are unable to entrain their
sleep-wake cycles to a daily rhythm and, like the mutant
hamsters, find their activity cycles constantly shifting with
respect to daylight.
metabolism and biochemical functions. When the TIX is removed, action
potentials resume firing with the same phase and frequency they had orig-
inally, before the TIX, implying that the SCN clock keeps running even
without action potentials. SCN action potentials are like the hands of a
clock; removing the clock's hands does not stop the clock from working,
but it does make it very difficult to read the time.
What is the nature of this clock that functions without action potentials?
Research in a wide range of species indicates that it is a molecular cycle
based on gene expression. The molecular clock used in humans is very sim-
ilar to those found in mice, fruit flies (Drosophila), and bread mold. In
Drosophila and mice, the system involves clock genes known as period
(per), timeless (tim), and clock. Although the details vary across species, the
basic scheme is a negative feedback loop. Many of the details were first
worked out in experiments performed by Joseph Takahashi and his col-
leagues at Northwestern University, who named the clock gene (an acronym
for circadian locomotor output cycles kaput). A clock gene is transcribed to pro-
duce mRNA that is then translated into proteins. After a delay, the newly
manufactured proteins send feedback and somehow interact with the
transcription mechanism, causing a decrease in gene expression. As a
614 C HAP T E R I 9 . BRAIN RHYTHMS AND SLEEP
Box 19.5
PATH OF DISCOVERY
..
,
.
Strange Vision
I
I was first smitten with a passion for retinal ganglion cells
(the output cells of the retina) as a graduate student in
the /970s. It was a period of great excitement about
these neurons, triggered by a profusion of new findings
and some lively debate from the labs of Bill Levick and
Jonathan Stone, among many others. I was impressed by
the evidence that ganglion cells were divisible into a large
number of types and was hooked by the emerging idea that
each type offered the brain a unique view of the world
matching the requirements of specific visual functions.
It took me almost 20 years before I screwed up the
courage to conduct research in this area myself. It was an
auspicious time to get into the game. New in vitro methods
were just emerging that enabled us to record light re-
sponses from ganglion cells that had been labeled by ret-
rograde transport from specific brain targets, and to stain
them completely by dye filling. These innovations allowed
us to correlate the structure, function, and connections of
ganglion cells to a degree that could only have been
dreamed about in the I 970s.
After exploring a variety of ganglion cell types, my lab
turned its attention in the late I 990s to the small subset of
ganglion cells that innervate the SCN, the pacemaker for
circadian rhythms, including those of sleep and wakeful-
ness. We were dumbfounded by behavioral evidence from
the labs of Shizufumi Ebihara and Russell Foster that this
pathway continues to function in "blind" mice lacking
nearly all rods and cones, synchronizing the clock to the
day-night cycle just as it does normal mice. According to
dogma, ganglion cells depend entirely on rods and cones
for their visual responsiveness.The circadian findings, how-
ever, implied that a previously unrecognized photorecep-
tor lurked somewhere in the eye and somehow influenced
the ganglion cells that innervated the biological clock. As
by David M. Berson
the new millennium dawned,lggy Provencio and colleagues
discovered melanopsin, a new opsin and possible pho-
topigment, and found it to be expressed by a small num-
ber of ganglion cells. This suggested the intriguing notion
("heresy" might be a better word) that the "missing" pho-
toreceptors were ganglion cells, and perhaps the very
ganglion cells that sent axons to the circadian pacemaker.
The hypothesis was irresistible, and we were lucky
enough to have in hand just the mix of techniques needed
to do the key experiment. A superb undergraduate stu-
dent, Felice Dunn, learned to make the tricky injections
of retrograde tracer in the SCN. One unforgettable day,
Felice watched over my shoulder as I established a record-
ing from one of the labeled ganglion cells for the first
time. Because we had silenced the rods and cones, we
knew that seeing a light response under these conditions
would fly in the face of more than a century of dogma
about retinal organization. Though we knew it was a long
shot at best, I have to admit we were harboring that
fantasy. Imagine our disappointment, then, when we
flooded the retina with light and the cell's voltage dis-
played on the oscilloscope failed to budge even a bit. But
wait! Over the next few seconds, the trace began to inch
ever so slightly upward. and then . . . bingo! . . . there it
was, as plain as day, a full-blown light response! I knew
instantly that I'd been blessed with something every sci-
entist dreams of-a moment when the expected and the
unexpected, reason and intuition, coalesce in an instant of
pure, ecstatic discovery. We now know that the delayed
response was typical of these extraordinarily sluggish
photo receptors, but at the time. it certainly seemed a
great practical joke, designed by some higher power for
maximal dramatic effect!
consequence of decreased transcription, less protein is produced, and gene
expression again increases to start the cycle anew. This entire cycle takes
about 24 hours, and thus it is a circadian rhythm (Figure 19.23).
If each SCN neuron is a clock, there must be a mechanism to coordinate
the thousands at cellular docks so that the SCN as a whole transmits a
single, dear message about time to the rest of the brain. Light information
trom the retina serves to reset the docks in the SCN neurons each day, but
the SCN neurons also communicate directly with each other. Surprisingly,
-----
SCN
III
Retinal input
even the coordination of rhythms between SCN cells seems to be independ-
ent of action potentials and normal synaptic transmission because TTX does
no1 block them. Also, the SCN of the very young rat brain coordinates cir-
cadian rhythms perfectly we]], even before it has developed any chemical
synapses. The nature of neuron-to-neuron communication within [he SCN
is not understood, but in addition to classical chemical synapses, it may
include other chemical signals, electrical synapses (gap junctions), or the
participation of glia.
CONCLUDING REMARKS
Rhythms are ubiquitous in the mammalian central nervous system. They
also span a broad range of frequencies. from more than 100 Hz in the cor-
tical EEG to once per year (0.00000003 Hz) for many seasonal behaviors,
such as the autumn mating of deer, the winter hibernation of chipmunks,
and the instinct that drives migrating swallows to return to Capistrano,
California, every March 19. According to local legend, in 200 years they
have only missed the date twice. In some cases, these rhythms are based
on intrinsic brain mechanisms; in some, they result from environmental fac-
tors; and in others, such as the SCN clock, they represent an interaction of
a neural process and zeitgebers.
While the purpose of some rhythms is obvious, the functions of many
neural rhythms are unknown. Indeed. some rhythms may have no func-
tion at all but arise as a secondary consequence of neural interconnections
that are essential for other, nonrhythmic, purposes.
Among the most conspicuous yet inexplicable of brain rhythms is sleep.
Sleep provides a fascinating set of problems for neuroscience. Unlike most
studies of single ion channels, single neurons, or the systems mediating
perception and movement, sleep research begins with profound ignorance
about a most basic question: Why? We still don't know why we spend
.,. CONCLUDING REMARKS 61 5
FIGURE 19.23
Clock genes. In the SCN. clock genes pro-
duce proteins that inhibit further transcription.
Gene transcription and the firing rate of indi-
vidual SCN neurons cycle up and down over
24 hours The cycles of many celis are syn-
chronized by light exposure (Input from the
retina) and by interactions of the SCN neurons.
616 C HAP T E R I 9 . BRAIN RHYTHMS AND SLEEP
'
>-V>
wI:
el:
w
I-
one-third of our lives sleeping, most of that time languid and vegetative
and the rest of it paralyzed and hallucinating. Sleep and dreams may have no
vital function, but they can be studied and enjoyed nevertheless. Ignoring
the functional question will not be a satisfying approach for long, however.
For most neuroscientists, asking "Why?" remains the deepest and most
challenging problem of all.
The Electroencephalogram
electroencephalogram (EEG)
(p. 586)
generalized seizure (p. 592)
partial' seizure (p. 592)
epilepsy (p. 593)
Sleep
rapid eye movement sleep (REM
sleep) (p. 595)
non-REM sleep (p. 595)
atonia (p. 596)
ultradian rhythm (p. 596)
Circadian Rhythms
circadian rhythm (p. 607)
zeitgeber (p. 609)
suprachiasmatic nucleus (SCN)
(p.610)
clock gene (p. 613)
,/11
V>
Z
w
0
>
w I-
el: V>
w
:J
a
I. Why do EEGs with relatively fast frequencies tend to have smaller amplitudes than EEGs with slower fre-
quencies?
2. The human cerebral cortex is very large and must be folded extensively to fit within the skull. What do the
foldings of the cortical surface do to the brain signals that are recorded by an EEG electrode at the scalp?
3. Sleep seems to be a behavior of every species of mammal, bird, and reptile. Does this mean that sleep per-
forms a function essential for the life of these higher vertebrates? If you do not think so, what might be an
explanation for the abundance of sleep?
4. An EEG during REM sleep is very similar to an EEG when awake. How do the brain and body in REM sleep
differ from the brain and body when awake?
5. What is a likely explanation for the brain's relative insensitivity to sensory input during REM sleep, compared
to the waking state?
6. The SCN receives direct input from the retina, via the retinohypothalamic tract, and this is how light-dark
cycles can entrain circadian rhythms. If the retinal axons were somehow disrupted, what would be the likely
effect on a person's circadian rhythms of sleeping and waking?
7. What differences would there be in the behavioral consequences of a free-running circadian clock versus no
clock at all?
60,
el:C}
wz
I-
1-0
el:«
:Jw
LL.el:
Berson OM. 2003. Strange vision: ganglion cells as
circadian photoreceptors. Trends in Neurosciences
26:314-320.
Carskadon MA, ed. 1993. Encyclopedia of Sleep and
Dreaming. New York: Macmillan.
Dement We. 1976. Some Must Watch While Some
Must Sleep. San Francisco: San Francisco Book
Company.
Greene R, Siegel J. 2004. Sleep: a functional enigma.
NeuroMo/ecular Medicine 5:59-68.
Lowrey PL, Takahashi JS. 2004. Mammalian circadian
biology: elucidating genome-wide levels of tempo-
ral organization. Annual Review of Genomics and
Human Genetics 5:407-441.
McCormick DA, Contreras D. 200 I. On the cellular
and network bases of epileptic seizures. Annual
Review of Physiology 63:815-846.
Siegel JM. 2004. Hypocretin (orexin): role in normal
behavior and neuropathology. Annual Review of Psy-
chology 55:125-148.
CHAPTER
Language
INTRODUCTION
. Box 20.1 Of Special Interest: Is Language Unique to Humans?
THE DISCOVERY OF SPECIALIZED LANGUAGE AREAS
IN THE BRAIN
BROCA'S AREA AND WERNICKE'S AREA
. Box 20.2 Of Special Interest: The Wada Procedure
"
TYPES OF APHASIA
BROCA'S APHASIA
WERNICKE'S APHASIA
APHASIA AND THE WERNICKE GESCHWIND MODEL
CONDUCTION APHASIA
APHASIA IN BILINGUALS AND THE DEAF
ASYMMETRICAL LANGUAGE PROCESSING IN THE CEREBRAL HEMISPHERES
LANGUAGE PROCESSING IN SPLIT-BRAIN HUMANS
Left Hemisphere Language Dominance
Language Functions of the Right Hemisphere
ANATOMICAL ASYMMETRY AND LANGUAGE
LANGUAGE STUDIES USING BRAIN STIMULATION AND BRAIN IMAGING
THE EFFECTS OF BRAIN STIMULATION ON LANGUAGE
IMAGING OF LANGUAGE PROCESSING IN THE HUMAN BRAIN
. Box 20.3 Of Special Interest: Hearing Sight and Seeing Touch
LANGUAGE ACQUISITION
. Box 20.4 Path of Discovery: The Origins of Language: A Tale of 1\vo Species, by Patricia Kuhl
. Box 20.5 Of Spedalinterest: The Search for Language Genes
CONCLUDING REMARKS
618 C HAP T E R 20 . LANGUAGE
'Y INTRODUCTION
Language is a remarkable system for communication that obviously has an
enormous impact on our lives. You can walk into a cafe and order a tan
skinny mocha frappucino with a dash of vanilla and be reasonably certain
you will not be handed a bucket of mud. You can speak on the telephone
with a friend thousands of miles away and explain both the complexities
of quantum physics and the emotional toll the physics course is having on
your social life. There are endless debates about whether animals also have
language (Box 20.1). However, there is no question that the complex and
flexible system we use is unique to humans.
More than just sounds, language is a system by which sounds, symbols, and
gestures are used [or communication. Language comes into our brain through
the visual and auditory systems, and the motor system produces speech and
writing. The brain processing between the sensory and motor systems is the
essence of language. Because animals are of limited use in studying human
language, tor many years language was studied primarily by linguists and psy-
chologists rather than neuroscientists. Much of what we know about the
brain mechanisms for language is derived from studies of language deficits re-
sulting from brain damage. Numerous different aspects of language can be se-
lectively disrupted, including speech, comprehension, and naming, suggesting
that language is processed in multiple, anatomically distinct, stages. More re-
cently, the imaging of activity in the human brain with functional magnetic
resonance imaging (fMRI) and positron emission tomography (PET) has given
us intriguing insights into the complex circuits underlying language.
Language is universal in human society, perhaps because of specialized
brain organization. It is estimated that there are about 10.000 languages
and dialects throughout the world. Languages differ in many ways, such as
the order in which nouns and verbs are arranged. But despite differences
in syntax, from Patagonia to Katmandu, all languages convey the subtleties
of human experience and emotion. Consider the fact that no mute tribe of
people has ever been found, not even in the remotest corner of the world.
Also, with no formal training, children raised in a normal language envi-
ronment will invariably learn to understand language and speak. Many sci-
entists believe the universality of language is a consequence of the fact that
the human brain has evolved special language-processing systems.
'Y THE DISCOVERY OF SPECIALIZED
LANGUAGE AREAS IN THE BRAIN
As in many other areas of neuroscience, only in the last century has our
understanding of a clear relationship between language and the brain
emerged. Much of what we know about the importance of certain brain
areas is derived from studies of aphasia. Aphasia is the partial or complete
loss of language abilities following brain damage, often without the loss of
cognitive faculties or the ability to move the muscles used in speech.
During the time of the Greek and Roman Empires, it was commonly
thought that the tongue controls speech and that speech disorders origi-
nate in the mouth rather than the brain. If a head injury resulted in a loss
of speech, the treatment involved special gargles or tongue massage. By the
sixteenth century, it had been noted that a person could suffer speech
impairment without paralysis of the tongue. However, in spite of this step
forward, treatment still included such procedures as cutting the tongue,
drawing blood, and applying leeches.
Around 1770, Johann Gesner published a relatively modern theory of
aphasia, describing it as the inability to associate images or abstract ideas
'"' THE DISCOVERY OF SPECIALIZED LANGUAGE AREAS IN THE BRAIN 619
Box 20.1
.... , .
OF SPECIAL INTEREST
..
.
· Is Language Unique to Humans?
Animals communicate in a variety of ways-from the
dance of a honeybee to the watery bellow of a whale. But
do they use language as we humans do? Human language
is a remarkably complex. flexible, and powerful system for
communication that involves the creative use of words
according to the rules of a systematic grammar. Do other
animals have anything similar? Actually, there are two ques-
tions: Do animals naturally use language? Can animals be
taught human language?
Chimpanzees and monkeys use a variety of sounds,
gestures. and facial expressions to communicate alarm,
warn adversaries, claim territory, and so on. But com-
pared to humans, nonhuman primates have a very limited
system used in stereotypical situations. Human language is
a much more creative system. Limited only by the rules of
grammar, it is effectively infinite. New word combinations
and sentences are constantly being made, and the combi-
nations have clear meaning according to the meaning of
the individual words plus the rules for arranging them.
Further observations of nonhuman primates or dolphins
might reveal that they combine their vocalizations in end-
lessly creative ways, but at present this does not seem to
be the case.
Can animals be taught human language? In the I 940s,
several psychologists tried raising baby chimpanzees just like
human children, including teaching them to speak. Despite
extensive training, the chimps never learned to say more
than a few words. One main reason is that the position
of the animal's larynx prevents a chimp from making the
sounds of human speech. In more recent studies. animals
have been trained to use either American Sign language
gestures or objects, such as plastic pieces in various shapes,
to indicate words. Well-known examples are the chimp
named Washoe, trained by Allen and Beatrice Gardner.
and the gorilla named Koko, trained by Francine Patter-
son. While the animals clearly learned the meanings of
gestures, it only proves that they have good memories.
The big question is whether nonhuman primates com-
bine visual symbols in original ways according to some
grammatical system to express new things. The answer is
mired in controversy. Proponents of animal language report
instances in which animals use combinations of symbols
to "describe" a novel situation. For instance, after learning
the sign for water and the sign for bird, one chimp put the
signs together as "water bird" when it was near a swimming
swan. Opponents of animal language argue that animals
never really learn sign language. The chimp may simply have
made separate gestures for water and bird. Part of the
problem is that the animals frequently combine symbols
in illogical or unintelligible ways and only occasionally
come up with something like "water bird." Do the seem-
ingly logical combinations of symbols reflect moments of
language lucidity, or are they just coincidences that the
researchers choose to emphasize? It is not easy to know,
and more controlled experiments are ongoing.
Whether language is unique to humans appears to be a
matter of definition. Animals certainly communicate, and to
some scientists. the systems of communication are so-
phisticated enough to be considered rudimentary lan-
guage. To others, the distance between human and animal
language is too great to conclude that animals use lan-
guage. Whichever conclusion you reach. it is important to
distinguish between language and intelligence. language is
not necessary for thought. Monkeys, as well as humans
raised without any language. can do many things requiring
abstract reasoning. Many creative people say they do some
of their best thinking without words. Albert Einstein
claimed that many of his ideas about relativity came from
visually thinking of himself riding on a beam of light look-
ing around at clocks and other objects. In any event, Fido
does think, but he may not need language (Figure A).
'IHE fAR SIDE By GARY lARSON
What We Say to dogs
() h y (7inqer! I've hCki ill
f'U- I f f -Me rbcloe I
y SV-'j ()U. 0 . C;:sti t
?/nde rs1a n:!, &,f'l/er - /. ,9' ...nl
of-tfJe qarbatJe,ore.s e . I
FIGURE A
620 CHAPTER 20 . LANGUAGE
Motor cortex
Motor control of j
mouth and li P \ Angular
gyrus
: ';;" ' ,) {
- j61,
f"
Auditory
cortex
Wernicke's
area
FIGURE 20.1
Key components of the language
system in the left hemisphere. In the
frontal lobe. Broca's area lies next to the area
that controls the mouth and lips in motor
cortex. Wernicke's area. on the supenor
surface of the temporal lobe, lies between
auditory cortex and the angular gyrus.
with their expressive verbal symbols. He attributed this loss to brain damage
resulting from disease. Gesner's definition makes the important observation
that in aphasia, cognitive ability may remain intact, but some function
specific to verbal expression is lost. Despite the incorrect association Franz
Joseph Gall and later phrenologists made between skull shape and brain
function (see Chapter 1>- they, too, made an important observation about
aphasia. They reasoned that cases of brain lesions, in which speech is lost but
other mental faculties are retained, suggest that there is a specific region of
the brain used for speech.
In 1825, based on many case studies, French physician Jean-Baptiste
Bouillaud proposed that speech is specifically controlled by the frontal lobes.
But it took another 4 decades before this idea was generally accepted. In
1861, Simon Alexandre Ernest Aubertin, Bouillaud's son-in-law, described
the case of a man who had shot away his frontal skull bone in a failed
suicide attempt. In treating this man, Aubertin discovered that if a spatula
was pressed against the exposed frontal lobe while the man was speaking,
his speech was immediately halted and did not resume until the pressure
was released. He inferred that the pressure on the brain interfered with the
normal function of a cortical area in the frontal lobe.
Broca's Area and Wernicke's Area
Also in 1861, French neurologist Paul Broca had a patient who was almost
entirely unable to speak. Broca invited Aubertin to examine the brain, and
they concluded that this man had a lesion in the frontal lobes. Perhaps be-
cause of a change in the scientific climate, Broca's case study appears to have
swung popular opinion around to the idea that there is a language center in
the brain. In 1863, Broca published a paper describing eight cases in which
language was disturbed by damage to the frontal lobe in the left hemisphere.
Additional similar cases, along with reports that speech is not disturbed by
right hemispheric lesions, led Broca, in 1864, to propose that language ex-
pression is controlled by only one hemisphere, almost always the left. This
view is supported by the results of a more modern procedure for assessing
the role of the two hemispheres in language, called the Wada procedure, in
which a single hemisphere of the brain is anesthetized (Box 20.2). In most
cases, anesthesia of the left hemisphere, but not the right disrupts speech.
If one hemisphere is thought to be more heavily involved in a particular
task, it is said to be dominant. The region of the dominant left frontal lobe
that Broca identified as being critical for articulate speech has corne to be
called Broca's area (Figure 20.1). Broca's work is of considerable signifi-
cance because it was the first clear demonstration that brain functions can
be anatomically localized.
In 1874, German neurologist Karl Wernicke reported that lesions in
the left hemisphere, in a region distinct from Broca's area, also disrupt nor-
mal speech. Located on the superior surface of the temporal lobe between
auditory cortex and the angular gyrus, this region is now commonly called
Wernicke's area (see Figure 20.1). The nature of the aphasia Wernicke
observed is different from that associated with damage to Broca's area.
Having established that there are two language areas in the left hemi-
sphere, Wernicke and others proceeded to construct maps of language pro-
cessing in the brain. Interconnections between auditory cortex, Wernicke's
area, Broca's area, and the muscles required for speech were hypothesized,
and different types of language disabilities were attributed to damage in
different parts of this system.
Although the tenns Broca's area and Wernicke's area are still commonly used,
the boundaries of these areas are not clearly defined, and they appear to
Box 20.2
,,'.
OF SPECIAL INTEREST
.. TYPES OF APHASIA 621
...
lEi The Wada Procedure
Developed by Juhn Wada at the Montreal Neurological
Institute, the Wada procedure, also known as the Wada
test, is a simple technique for studying the function of a
single cerebral hemisphere. A fast-acting barbiturate, such
as sodium amy tal, is injected into the carotid artery on
one side of the neck (Figure A). The drug is preferentially
carried in the bloodstream to the hemisphere ipsilateral
to the injection, where it acts as an anesthetic for about
10 minutes. The effects are sudden and dramatic. Within
a matter of seconds, the limbs on the side of the body
contralateral to the injection become paralyzed, and so-
matic sensation is lost.
By asking the patient to answer questions, one can
assess his or her ability to speak. If the injected hemi-
sphere is dominant for speech, the patient will be com-
pletely unable to talk until the anesthesia wears off. If the
injected hemisphere is not dominant, the person will con-
tinue to speak throughout the procedure.
In 96% of right-handed people and 70% of left-handed
people, the left hemisphere is dominant for speech. Be-
cause 90% of all people are right-handed, this means
that the left hemisphere is dominant for language in
roughly 93% of people. While small but significant num-
bers of people with either handedness have a dominant
right hemisphere. only in left-handers are bilateral rep-
resentations of speech seen. In the Wada procedure.
this is indicated when an injection into either hemi-
sphere has some disruptive effect on speech, although
specifics of the disruption may be different for the two
hemispheres.
Frontal lobe
Middle cerebral
artery
Left internal
carotid artery
\S
\
Sodium
amy tal
FIGURE A
be quite variable from one person to the next. We will also see that each
area may be involved in more than one language function. However, this
recent finding will only make sense after we look at the aphasias produced
by damage to Broca's and Wernicke's areas.
.. TYPES OF APHASIA
As in the studies of Broca and Wernicke, the oldest technique for studying
the relationship between language and the brain involves correlating func-
tional deficits with lesions in particular brain areas. The occurrence of distinct
types of aphasia, as shown in Table 20.1, suggests that language is processed
in several stages, at different locations in the brain.
Broca's Aphasia
The syndrome called Broca's aphasia is also known as motor or nonflu-
ent aphasia, because the person has difficulty speaking even though he or
she can understand language heard or read. The case of David Ford is typ-
ical. Ford was a radio operator in the Coast Guard when, at age 39, he suf-
fered a stroke. He remained an intelligent man, but he had little control
over his right arm and leg (demonstrating that his lesion was in the left
622 CHAPTER 20 . LANGUAGE
Table 20.1 Characteristics of Types of Aphasia
TYPE OF COMPRE- IMPAIRED PARAPHASIC
APHASIA SITE OF BRAIN DAMAGE HENSION SPEECH REPETITION ERRORS
Broca's Motor association cortex of Good Nonfluent, Yes Yes
frontal lobe agrammatical
Wernicke's Posterior temporal lobe Poor Fluent, grammatical, Yes Yes
meaningless
Conduction Arcuate fasciculus Good Fluent, grammatical Yes Yes
Global Portions of temporal and Poor Very little Yes
frontal lobes
Transcortical Frontal lobe anterior to Good Nonfluent, No Yes
motor area Broca's agrammatical
Transcortical Cortex near junction of temporal, Poor Fluent, grammatical, No Yes
sensory parietal, and occipital lobes meaningless
Anomic Inferior temporal lobe Good Fluent. grammatical No
hemisphere). His speech was also abnormal, as the following discussion
with psychologist Howard Gardner illustrates:
"I asked Mr. Ford about his work before he entered the hospital.
I'm a sig... no... man... uh, welL... again." These words were emitted slowly,
and with great effort. The sounds were not clearly articulated; each syllable
was uttered harshly, explosively, in a throaty voice. With practice, it was
possible to understand him, but at first 1 encountered considerable difficulty
in this.
"Let me help you," 1 interjected. "You were a signaL."
"A signal man... right," Ford completed my phrase triumphantly.
"Were you in the Coast Guard?"
"No, er, yes, yes... ship... Massachu... chusetts... Coastguard... years." He
raised his hands twice, indicating the number "nineteen."
"Could you tel] me Mr. Ford, what you've been doing in the hospital?"
"Yes, sure. Me go, er, uh, P.T. nine o'cot speech... two times... read... wr ..,
ripe, er, rike, er, write... practice... get-ting better."
"And have you been going home on weekends?"
"Why, yes... Thursday, er, er, er, no, er, Friday... Bar-ba-ra... wife... and, oh,
car... drive... purnpike... you know... rest and... tee-vee."
"Are you able to understand everything on television?"
"Oh, yes, yes... well... almost." Ford grinned a bit. (Gardner, 1974, pp.
60-61. )
People with Broca's aphasia have difficulty saying anything, often pausing
to search for the right word. The inability to hnd words is called anomia
(meaning "no name"). Interestingly, there are certain "overlearned" things
Broca aphasics can say without much hesitation, such as the days of the
week and the Pledge of Allegiance. The hallmark of Broca's aphasia is a
telegraphic style of speech, in which mainly content words (nouns, verbs, and
adjectives carrying content specific to the sentence) are used. For instance,
when Mr. Ford was asked about being in the Coast Guard, his answer con-
tained the words ship, Massachusetts, Coast Guard, and years, but little
else. Many function words (articles, pronouns, and conjunctions connecting
the parts of the sentence grammatically) are left out (there are no ifs, ands,
or buts). Also, verbs are frequently not conjugated. In the jargon of apha-
sia deficits, the inability to construct grammatically correct sentences is
. TYPES OF APHASIA 623
called agrammatism. There are some peculiar nuances to the agrammatical
tendencies in Broca's aphasia. In the case of Ford, he could read and use
the words "bee" and "oar" but had difficulty with the more common words
"be" and "or." The problem isn't related to the sound but to whether or
not the word is a noun. In a similar vein, Broca aphasics have difficulty
repeating things spoken to them, though they tend to be better at familiar
nouns such as "book" and "nose." Sometimes they substitute incorrect
sounds or words. Ford said "purnpike" for "turnpike." These are called
paraphasic errors.
In contrast to the speech difficulties in Broca's aphasia, comprehension is
generally quite good. In the dialogue above, Ford seems to understand the
questions asked of him, and, for the most part, he says he understands
what he sees on television. In Gardner's study, Ford was able to answer
simple Questions, such as "Does a stone float on water?" However, more
difficult questions demonstrated that he did not have completely normal
comprehension abilities. If he was told "The lion was killed by the tiger;
which animal is dead?" or "Put the cup on top of the fork and place the
knife inside the cup," he had difficulty understanding. This is probably
related to the fact that he generally had trouble with the function words
"by" in the first example and "on top of" in the second example.
Because the most obvious difficulty is in producing speech, Broca's
aphasia is thought of as a language disturbance toward the motor end of
the language system. Language is understood but not easily produced.
While it is true that Broca aphasics are worse at speech than other types of
aphasics, several things suggest that there is more to the syndrome. As
pointed out above, comprehension is generally good, but comprehension
deficits can be demonstrated by tricky Questions. Also, patients sometimes
have considerable anomia, suggesting that they have problems "finding"
words as well as making the appropriate sounds.
Wernicke suggested that the area damaged in Broca's aphasia contains
memories for the fine series of motor commands required for articulating
word sounds. Because Broca's area is near the part of motor cortex that con-
trols the mouth and lips, there is an appealing logic to this idea. Wernicke's
theory is still held by some, but there are other ways of looking at the prob-
lem. For instance, the difference in the aphasic's ability to use content
words and function words suggests that Broca's area and nearby cortex may
be specifically involved in making grammatical sentences out of words. This
might explain why Gardner's Mr. Ford could produce sounds such as "bee"
and "oar" when they represent content words, but not when the sounds
represent the function words "be" and "or."
Wernicke's Aphasia
When Wernicke noted that superior temporal lesions could lead to apha-
sia, the syndrome he observed was Quite distinct from Broca's aphasia.
Indeed, Wernicke suggested that aphasia is of two general types. In Broca's
aphasia, speech is disturbed but comprehension is relatively intact. In
Wernicke's aphasia, speech is fluent but comprehension is poor. (Although
these descriptions are oversimplified, they are useful for remembering the
syndromes.)
Let's consider the case of Philip Gorgan, another patient studied by
Gardner.
"What brings you to the hospital?" I asked the 72-year-old retired butcher four
weeks after his admission to the hospital.
"Boy, I'm sweating, I'm awful nervous, you know, once in a while I get
caught up, I can't mention the rarripoi, a month ago, quite a little, I've done
624 CHAPTER 20 . LANGUAGE
a lot welL] impose a lot, while, on the other hand, you know whar ] mean, I
have to run around, look it over, trebbin and all that sort of stuff."
I attempted several times to break in, but was unable to do so against this
relentlessly steady and rapid outflow. Finally, J put up my hand, rested it on
Gorgan's shoulder, and was able to gain a moment's reprieve.
"Thank you, Mr. Gorgan. ] want to ask you a few "
"Oh sure, go ahead, any old think you want. If I could I would. Oh, I'm
raking the word the wrong way to say, all of the barbers here whenever they
stop you it's going around and around, if you know what I mean, that is tying
and tying for repucer, repuceration, well, we were trying the best that we
could while another time it was with the beds over there the same thing...."
(Gardner, 1974, pp. 67-68.)
Clearly, Mr. Gorgan's speech is altogether different from that of Mr. Ford.
Gorgan's speech was fluent, and he had no trouble using function words as
well as content words. If you didn't understand English, the speech would
probably sound normal because of its fluency. However, the content does
not make much sense. It is a strange mixture of darity and gibberish. Along
with their far greater output of speech compared with Broca aphasics, Wer-
nicke aphasics also make far more paraphasic errors. Gargan sometimes
used the correct sounds but in an incorrect sequence, such as "plick" in-
stead of "clip." Occasionally, he stumbled around the correct sound or
word, as when, in another conversation, he called a piece of paper "piece
of handkerchief, pauper, hand pepper, piece of hand paper." Interestingly,
he sometimes used an incorrect word bur one categorically similar to the
correct word, such as "knee" instead of "elbow."
Because of the stream of unintelligible speech, it is difficult to assess with
speech alone whether the Wernicke aphasic comprehends what he hears
or reads. Indeed, one of the intriguing things about Wernicke aphasics is
that they frequently appear undisturbed by the sound of their own speech
and the speech of others, even though they probably don't understand either.
Comprehension is usually assessed by asking the patient to respond in a
nonverbal manner. For instance, the patient could be asked to put object A
on top of object B. Questions and commands of this sort quickly lead to the
condusion that Wernicke aphasics do not understand most instructions.
They are completely unable to comprehend questions of the sort under-
stood by Broca aphasics. When Gorgan was presented with commands
written on cards ("Wave goodbye," "Pretend to brush your teeth"), he was
often able to read the words but never acted as if he understood what the
words meant.
Gorgan's strange speech was mirrored in his writing and his ability to
play music. When Gardner offered him a penciL he spontaneously took it
and wrote "Philip Gorgan. This is a very good beautifyl day is a good day,
when the wether has been for a very long time in this part of the cam-
paning. Then we want on a ride and over to for it culd be first time. . . ."
(p. 71). Likewise, when he sang or played the piano, pieces of the appro-
priate song were intermixed with musical gibberish, and he had a difficult
time ending, just as in his speech.
Insight about the possible function of Wernicke's area is provided by its
location on the superior temporal gyrus near primary auditory cortex.
Wernicke's area may playa critical role in relating incoming sounds to their
meaning. In other words, it is an area specialized for storing memories of
the sounds that make up words. It has been suggested that Wernicke's area
is a high-order area for sound recognition in the same sense that inferior
temporal cortex is thought to be a high-order area for visual recognition.
A sound recognition deIicit would explain why Wernicke aphasics don't
comprehend speech well. However, there must be mOre to Wernicke's area
to account for the odd speech patterns. Speech in Wernicke's aphasia sug-
gests that Broca's area and the system that governs speech production are
running without control over content. The speech zooms along, swerving
in every direction like a car with a sleepy driver at the wheel.
Aphasia and the Wernicke-Geschwind Model
Shortly after making his observations on what came to be called Wernicke's
aphasia, Wernicke proposed a model for language processing in the brain.
Later extended by Norman Geschwind at Boston University, this model is
known as the Wernicke-Geschwind model. The key elements in the
system are Broca's area, Wernicke's area, the arcuate fasciculus, a bundle of
axons connecting the two cortical areas, and the angular gyrus. The model
also includes sensory and motor areas involved in receiving and producing
language. To understand what the model entails, we'll consider the per-
formance of two tasks.
The first task is the repetition of spoken words (Figure 20.2). When sounds
of incoming speech reach the ear, the auditory system processes the sounds,
and neural signals eventually reach auditory cortex. According to the model,
the sounds are not understood as meaningful words until they are processed
in Wernicke's area. In order to repeat the words, word-based signals are
passed to Broca's area from Wernicke's area via the arcuate fasciculus. In
Broca's area, the words are converted to a code for the muscular move-
ments required for speech. Output from Broca's area is sent to the nearby
motor cortical areas that control moving the lips, tongue, larynx, and so on.
The second task we'll consider is reading written text aloud (Figure 20.3).
In this case, the incoming information is processed by the visual system
through striate cortex and higher-order visual cortical areas. The visual
signals are then passed to the angular gyrus at the junction of the occipital,
parietal, and temporal lobes. In the cortex of the angular gyrus, it is assumed
that a transformation occurs so that the output evokes the same pattern of
activity in Wernicke's area as if the words were spoken rather than written.
From this point, the processing follows the same progression as in the first
example: Wernicke's area to Broca's area to motor cortex.
This model offers simple explanations for key elements of Broca's and
Wernicke's aphasia. A lesion in Broca's area seriously interferes with speech
production because the proper signals can no longer be sent to motor
cortex. On the other band, comprehension is relatively intact because
Wernicke's area is undisturbed. A lesion in Wernicke's area produces seri-
ous comprehension problems because this is the site of the transformation
of sounds into words. The ability to speak is unaffected because Broca's area
is still able to drive the muscles required for speech.
The Wernicke-Geschwind model has several errors and oversimplifica-
tions. For example, words read do not have to be transformed into a
pseudo-auditory response, as suggested in the reading task described above.
In fact, visual information can reach Broca's area from visual cortex with-
out making a stop at the angular gyrus. One of the dangers inherent in any
model is overstating the significance of a given cortical area for a particular
function. Researchers have recently found that the severity of Broca's and
Wernicke's aphasias depends on how much cortex is damaged beyond the
limits of Broca's and Wernicke's areas. Also, aphasia is influenced by damage
to subcortical structures such as the thalamus and caudate nucleus, which
are not in the model. In surgical cases where parts of cortex are removed,
the resulting language deficits are usually milder than the deficits resulting
from stroke, which affects both cortical and subcortical structures.
T TYPES OF APHASIA 625
Motor cortex
1_ Arcuate
Broca's / fasciculus
area ) ,,) / N
/ )
j; t '
Auditory
cortex Wernicke's
area
FIGURE 20.2
Repeating a spoken word, according to
the Wernicke-Geschwind model.
Motor cortex
Broca's
area
c: \. #....) .. '.
\ " ........ "\ / L-- Primary
.r- p , :
Auditory t - \
cortex Angular
Wernicke's gyrus
area
FIGURE 20.3
Repeating a written word, according to
the Wernicke-Geschwind model.
626 CHAPTER 20 . LANGUAGE
Written word
Spoken word
Early visual processing:
Striate cortex
Early auditory processing:
Primary auditory cortex
tisual wo rd recognition
Ex trastriate corte
-
,
t ,- -
Auditory word recognition:
Temporoparietal cortex (angular gyrus)
Anterior superior temporal cortex
-/
I
...
--
Premotor coding:
Supplementary motor area
Other areas near Sylvian fissure
Motor control of speech:
Primary motor cortex
Speech
FIGURE 20.4
A model of language processing. Stages in the processes of repeating a written or
spoken word are indicated. Below each stage is the cortical location where task-specific
activity was observed with PET imaging. (Source: Adapted from Petersen et a\., 1988, Fig, 3.)
Another important factor is that there is often significant recovery of
language function after a stroke, and it appears that other cortical areas can
sometimes compensate for what is lost. As in many neurological syn-
dromes, young children recover extremely well. but even adults, especially
left-handers, can show good recovery of function.
A final problem with the Wernicke-Geschwind model is that most
aphasias involve both comprehension and speech deficits. Mr. Ford, with
Broca's aphasia, had good comprehension but was confused by complex
questions. Conversely, Mr. Gorgan, with Wernicke's aphasia, had several
speech abnormalities in addition to a severe lack of comprehension.
Therefore, in cortical processing, the sharp functional distinctions between
regions implied by the model do not exist. In response to these shortcom-
ings, more complex models have been proposed, but they retain some of
the features of the Wernicke-Geschwind model (Figure 20.4). Despite the
problems with the Wernicke-Geschwind model, it continues to be of clini-
cal use because of its simplicity and approximate validity.
Conduction Aphasia
The value of a model is not only its ability to account for previous obser-
vations but also its ability to predict. Wernicke showed that his language-
processing model could predict that a form of aphasia would result from a
lesion that disconnects Wernicke's area from Broca's area but leaves both
areas themselves intact. In the Wernicke-Geschwind model. a lesion in the
fibers composing the arcuate fasciculus could accomplish this. In reality,
such disconnection lesions usually involve damage to parietal cortex in
addition to the arcuate fasciculus, but Broca's and Wernicke's areas are
spared.
Sure enough, aphasia from such lesions was demonstrated and is now
known as conduction aphasia. As the model predicts, based on the preser-
vation of Broca's and Wernicke's areas, comprehension is good and speech
is fluent. The patient is typically able to express himself through speech
without difficulty. The deficit that chieny characterizes conduction aphasia
is difficulty in repeating words. In response to hearing a few words, the
patient may attempt to repeat what was said, but the repetition will sub-
stitute words, omit w,ords, and include paraphasic errors. Repetition is usu-
ally best with nouns and shon common expressions, but it may fail entirely
if the spoken words are function words, polysyllabic words, or nonsense
sounds. Interestingly, a person with conduction aphasia will comprehend
sentences he reads aloud, even though what is said aloud contains many
paraphasic errors. This is consistent with the idea that comprehension is
good and the deficit occurs between regions involved in comprehension
and speech.
One of the sad yet fascinating things about aphasia is the diversity of syn-
dromes that occurs following strokes. While the syndromes challenge any
language model, each one offers a clue to our understanding of language
processing. Characteristics of a few other aphasias are listed in Table 20.1.
Aphasia in Bilinguals and the Deaf
Cases of aphasia in bilingual people and deaf people provide fascinating
insight about language processing in the brain. Suppose a person knows
two languages before she has a stroke. Does the stroke produce aphasia in
one language and not the other, or do both languages suffer equally? The
answer depends on several factors, including the order in which the lan-
guages were learned, the f1uency achieved in each language, and how re-
cently the language was used. The consequences of a stroke are not always
predictable, but language tends to be relatively more preserved in the
language learned more fluently and earlier in life. If the person learned two
languages at the same time to equivalent levels of fluency, a lesion will
probably produce similar deficits in both languages. If the languages were
learned at different times in life, it is likely that one language will be affected
more than the other. The implication is that the second language may make
use of different, though overlapping, populations of neurons.
The study of language deficits in those who are deaf and/or know sign
language suggests that there is some universality to language processing in
the brain. American Sign Language uses hand gestures to express the ideas
and emotions most of us convey with spoken language (Figure 20.5). Left
hemispheric lesions in people who use sign language appear to cause lan-
guage deficits similar to those seen in verbal aphasics. In some cases anal-
ogous to Broca's aphasia, comprehension is good but the ability to "speak"
through sign language is severely impaired. Importantly, the ability to move
the hands is not impaired (i.e., the problem is not with motor control).
Rather, the deficit is specific to the use of hand movements for the expres-
sion of language.
There are also sign language versions of Wernicke's aphasia in which the
patient signs fluently but with many mistakes, while having difficulty com-
prehending the signing of others. [n one unusual case, a hearing man who
was the child of deaf parents learned both sign language and verbal lan-
guage. A left hemispheric stroke initially gave him global aphasia. but his
condition significantly improved with time. The important observation is
that his verbal and sign languages recovered together, as if overlapping
Me
Index finger
points to and
touches chest.
Cat
Draw out two
whiskers with
thumb and
index finger.
'If TYPES OF APHASIA 627
.....
.
.....
"
,'4l::_
, ,,}
I . I
"
v-
\.
FIGURE 20.5
"Speaking" in American Sign Language.
628 C HAP T E R 20 . LANGUAGE
brain areas were used. While there do appear to be aphasias in those using
sign language analogous to speech aphasias. evidence also indicates that
signing aphasia and speaking aphasia can be produced by left hemispheric
lesions in somewhat different locations.
T ASYMMETRICAL LANGUAGE PROCESSING
IN THE CEREBRAL HEMISPHERES
We have seen that damage to certain parts of the brain leads to a variety
of aphasias. As the early work of Broca indicated, language is usually not
processed equally by the two cerebral hemispheres. Some of the most valu-
able and fascinating findings on the language differences of the two hemi-
spheres come from split-brain studies, in which the hemispheres are sur-
gically disconnected. Communication between the cerebral hemispheres is
served by several bundles ofaxons known as commissures. Recall from
Chapter 7 that the largest of these is the great cerebral commissure, also
called the corpus callosum (Figure 20.6). The corpus callosum consists of
about 200 million axons crossing between the hemispheres. Surely such a
huge bundle of fibers must be of great importance. Surprisingly, until about
1950, researchers had been unable to demonstrate any important role of
the corpus callosum.
In split-brain procedures, the skull is opened and the axons making up
the corpus callosum are severed (Figure 20.7). The hemispheres may retain
some communication via the brain stem or smaller commissures (if they
aren't also severed), but most of the intercerebral communication is lost. In
the 1950s, Roger Sperry and his colleagues at the University of Chicago,
and later at the California Institute of Technology, performed a series of
experiments using split-brain animals, to explore the function of the corpus
callosum and the separated cerebral hemispheres. Sperry's group confirmed
earlier reports that cutting the corpus callosum in a cat or monkey has no
noticeable effect on the animal's behavior. Temperament is unchanged, and
the animal appears to be normal in coordination, reaction to stimuli, and
Corpus callosum
Left
..... hemisphere
s
---
\
Cerebellum
FIGURE 20.6
The corpus callosum. The corpus callosum is the largest bundle ofaxons providing
communication between the cerebral hemispheres.
... ASYMMETRICAL LANGUAGE PROCESSING IN THE CEREBRAL HEMISPHERES 629
ability to learn. However, in cleverly devised experiments, Sperry's group
showed that the animals sometimes acted as if they had two separate
brains.
Language Processing in Split-Brain Humans
Because split-brain monkeys did not appear to have any major deficits, sur-
geons felt they were justified in cutting the corpus callosum as a last resort
in treating certain types of severe epilepsy in humans. They hoped to pre-
vent the spread of epileptic activity from one hemisphere to the other. It
may seem questionable to cut 200 million axons on the assumption that
they are not very important, but the surgery is often beneficial in restoring
a seizure-free life. Michael Gazzaniga, then at New York University, studied
a number of these people. Gazzaniga had initially worked with Sperry, and
his techniques were modifications of those used with experimental animals.
In some of the human split-brain studies, the two hemispheres initiated
conflicting behaviors, apparently because they were thinking differently. In
one task, a patient was asked to arrange a group of blocks to match a pattern
on a small card. He was told to use only his right hand (left hemisphere),
which is not generally good at this type of task. As the right hand strug-
gled to arrange the blocks, the left hand (right hemisphere), which knew
how to do it, reached in to take over. Only the restraint of the experimenter
kept the left hand from pushing the right one out of the way to solve the
puzzle. Another patient studied by Gazzaniga would sometimes find him-
self pulling his pants down with one hand and pulling them up with the
other. These bizarre behaviors make a strong case that there are two inde-
pendent brains controlling the two sides of the body.
One key methodological feature of studying split-brain humans is care-
fully controlling the presentation of visual stimuli to only one cerebral
hemisphere. Gazzaniga did this by taking advantage of the fact that only
the right hemisphere sees objects to the left of the point of fixation, and
only the left hemisphere sees objects to the right, as long as the eyes can't
move to bring the image onto the fovea (Figure 20.8). Pictures or words
Projectors
/
D L
Sh""",
-
"
V " /
lewlng screen
FIGURE 20.8
Visual stimulation of one hemisphere.
A visual stImulus is briefly flashed to the left
or right visual field by means of a shutter. The
display time is shorter than the time needed
to generate a saccadic eye movement thus
assunng that only one hemisphere sees the
stimulus.
Corpus
callosum
\
I
/
I
\
"II
l1.
jJ
Removed bone
Skull
I
"-
Cerebral
vasculature
'\. Scalpel
FIGURE 20.7
Split-brain surgery. To reach the corpus
callosum. a portion of the skull is removed
and the cerebral hemispheres are retracted.
630 C HAP T E R 20 . LANGUAGE
were flashed on for a fraction of a second using a device with a camera like
shutter. Because the images were presented for a shorter time than that
required ro move the eyes, the images were seen by only one hemisphere.
Left Hemisphere Language Dominance. Although split-brain humans
are normal in most every way, there is a striking asymmetry in their abiJity
to verbalize answers to questions posed separately to the two hemispheres.
For instance, numbers, words, and pictures visually presented only in the
right visual field are repeated or described with no difficulty because the
left hemisphere is usually dominant for language. Likewise, objects that can
be manipulated only by the right hand (out of view of both eyes) can be
described. These findings would be entirely unremarkable except for the
fact that such simple verbal descriptions of sensory input are impossible for
the right hemisphere.
If an image is shown only m the left visual field or an object is felt only
by the left hand, the person will be unable to describe it and will usually
say that nothing is there (Figure 20.9). An object could be covertly placed
in a patient's left hand. and there would be no verbal indication of even
noticing. This absence of response is a consequence (and demonstration) of
the fact that the left hemisphere controls speech in most people. If you think
about the impJications for spJit-brain people, you'll realize that they have
an unusual existence. Following their surgery, they are unable to describe
anything to the left of their visual fixation point: the left side of a person's
face, the left side of the room, and so on. What is startling is that this
doesn't seem to disturb them.
Language Functions of the Right Hemisphere. While there is a dramatic
inability of the right hemisphere to speak, this does not mean it knows
nothing of language. Researchers have demonstrated that the right hemi-
sphere can read and understand numbers, letters, and short words as long
as the required response is nonverbal. In one experiment, the right hemi-
sphere is shown a word that is a noun. As already mentioned, the person
B a"
-
""
--
......
Q>"
\\<ti
/
. Control of
left hand
"I don't see
anything"
FIGURE 20.9
Demonstrating language comprehension in the right hemisphere. If a split-brain
person sees a word in the left visual field. he will say he sees nothing. This is because the left
hemisphere, which usually controls speech, did not see the word. and the right hemisphere,
which saw the word, cannot speak. However. the left hand. which is controlled by the right
hemisphere, can pick out the object corresponding to the word by touch alone.
... ASYMMETRICAL LANGUAGE PROCESSING IN THE CEREBRAL HEMISPHERES 63 I
will say he sees nothing. Of course, that's the talkative left hemisphere
speaking, and it didn't see anything. But if he is urged to use his left hand
to select a card containing a picture corresponding to the word he saw,
or pick out an object by touch, he can do it (see Figure 20.9). The right
hemisphere isn't able to do this with more complex words or sentences, but
the results clearly imply that the right hemisphere does have language
comprehension.
A study conducted by Kathleen Baynes, Michael Gazzaniga, and their
colleagues at the University of California, Davis, suggests that the right
hemisphere may sometimes also be able to write even if it can't speak. In
most people, reading, speaking, and writing are all controlled by the left
hemisphere. However, in a split-brain woman known as V. J., this was
found not to be true. Words were flashed to either her left or her right
hemisphere. Words seen by her left hemisphere could be spoken but not
written. Conversely, she could write but not speak words shown to her
right hemisphere. While this separation of function may be an abnormal
situation, the case of V. J. is particularly interesting because it indicates that
there isn't necessarily a single brain system for all aspects of language located
in one hemisphere.
Evidence also suggests that the right hemisphere understands complex
pictures despite its inability to say so. In one experiment, a subject was
shown a series of pictures in her left visual field, and at one point a nude
photo appeared in the series. When the researcher asked what she saw, she
said nothing, but then she began to laugh. She told the researcher that she
didn't know what was funny, but that perhaps it was the machine used in
the experiment.
The right hemisphere appears to be better than the left hemisphere at
certain things. For instance, even though the split-brain patients were
right-handed and thus their left hemispheres were much more practiced at
drawing, the left hand controlled by the right hemisphere was better at
drawing or copying figures containing three-dimensional perspective. The
patients were also better at solving complex puzzles with their left hand. It
has also been reported that the right hemisphere is somewhat bener at
perceiving nuances in sound.
The results of these split-brain studies demonstrate that the two hemi-
spheres can function as independent brains and that they have different
language abilities. Although the left hemisphere is usually dominant for
language, the right hemisphere has significant skills in comprehending
language. It is important to keep in mind that the split-brain studies test
the ability of each hemisphere to perform on its own. Presumably in the
intact brain, the corpus callosum allows for synergistic interactions between
the hemispheres for language and other functions.
Anatomical Asymmetry and Language
In the nineteenth century, there were reports of anatomical differences
between the two hemispheres. For example, scientists noted that the left
lateral (Sylvian) fissure is longer and less steep than the right (Figure 20.10).
However, as recently as the 1960s, the existence of significant cortical
asymmetries was in considerable doubt. Because of the strikingly asym-
metrical control of speech demonstrated by the Wada procedure, it would
be interesting to know if the twO cerebral hemispheres are anatomically dif-
ferent. Some of the first good quantitative data demonstrating hemispheric
differences came from the work of Geschwind and his colleague Walter
Levitsky. Initial observations were made on postmortem brains, but more
recently, the results were confirmed by MRI (see Box 7.2).
Sylvian fissure
Left hemisphere
RighI hemisphere
FIGURE 20.\ 0
Asymmetry of the Sylvian fissure.
In most right-handed people. the Sylvlan fis-
sure in the left hemisphere is longer and runs
at a shallower angle than the fissure in the
right hemisphere. (Source: Adapted from
Geschwind. 1979. p. 192.)
632 CHAPTER 20 . LANGUAGE
, :
k,
( ght : m
temporale
I
\.
...
'> Occipital
lobes
-
\
Left planum
temporale
FIGURE 20.11
Asymmetry of the planum temporale.
This region on the superior temporal lobe
is usually significantly larger in the left hemi-
sphere. (Source: Adapted from Geschwind
and Levitsky. 1968. Fig. I.)
Vocalization or Central
speech arrest sulcus
-/
, / l
/(h-
V . r(f(
. \
AphasIc arrest '- ...
FIGURE 20.12
Sites where electrical brain stimulation
affects language. Stimulation of motor
cortex causes vocalizations or speech arrest
by activating faCial muscles. At other sites.
stimulation causes an aphasic arrest in which
language is agrammatical or anomia is ob-
served. (Source: Adapted from Penfield and
Rasmussen. 1950. Fig. 56.)
The most significant difference seen was in a region called the planum
temp orale on the superior surface of the temporal lobe (Figure 20.11).
Based on measurements of 100 brains, Geschwind and Levitsky found that
in about 65% of the brains, the left planum temporale was larger than the
right, whereas in only about 10%, the right was larger. In some instances,
the left area was more than five times larger than the right. Researchers
have suggested that the left planum temporale is larger because this hemi-
sphere is dominant for speech. However, this hypothesis has not been
proven. Interestingly, the asymmetry in this area is seen even in the human
fetus, suggesting that it is not a developmental consequence of the use of
the left hemisphere for speech. Indeed, apes also tend to have a larger left
planum temporale. This suggests the possibility that, if the planum tempo-
rale is related to language, speech became dominant in the left hemisphere
because of a preexisting size difference.
It may have occurred to you that a functional human asymmetry more
obvious than language is handedness. More than 90% of humans are right-
handed and usually relatively uncoordinated with their left hand, implying
that in some way the left hemisphere is specialized for fine motor control.
Is this related to the left hemispheric dominance for language? The answer
is not known, but it is interesting that humans are different from non-
human primates in regard to handedness as well as language. While ani-
mals of many species show a consistent preference for using one hand
over the other, there are typically equal numbers of left-handers and
right - handers.
T LANGUAGE STUDIES USING BRAIN STIMULATION
AND BRAIN IMAGING
Until recently, the main way language processing in the brain could be
examined was by correlating language deficits with postmortem analysis of
brain damage. However, other techniques enable researchers to study lan-
guage [unction in the brains of living humans. Electrical brain stimulation
and PET imaging are two of these techniques.
The Effects of Brain Stimulation on Language
At several points in this book, we have discussed the electrical brain
stimulation studies of Wilder Penfield. Without general anesthesia, pa-
tients were able to report the effects of stimulation at different cortical
sites. In the course of these experiments, Penfield noted that stimulation
at certain locations affected speech. These effects fell into three main cat-
egories: vocalizations, speech arrest, and speech difficulties similar to
aphasia.
Electrical stimulation of motor cortex in the area that controls the mouth
and lips caused immediate speech arrest (Figure 20.12). Such a response is
logical because the activated muscles sometimes pulled the mouth to one
side or clenched the jaw shut. Motor cortex stimulation occasionally evoked
cries or rhythmic vocalizations. It is important to note that these effects
occurred by stimulating the motor cortex on either side of the brain. Pen-
field found three other areas where electrical stimulation interfered with
speech, but these were only in the dominant left hemisphere. One of these
areas appeared to correspond to Broca's area. If this area was stimulated
while a person was speaking, speech was either stopped entirely (strong
stimulation) or speech hesitation resulted (weaker stimulation). Some
patients were unable to name objects they could name before and after the
brain stimulation. Occasionally, they would substitute an incorrect word.
'Y LANGUAGE STUDIES USING BRAIN STIMULATION AND BRAIN IMAGING 633
They apparently experienced a mild transient form of anomia. In some
subjects, word confusion and speech arrest also resulted from stimulation
at two other sites, one in the posterior parietal lobe near the Sylvian fis-
sure and the other in the temporal lobe. These latter two areas were in the
vicinity of the arcuate fasciculus and Wernicke's area, although they did not
align perfectly with estimated locations of those areas.
It is somewhat reassuring to see that electrical stimulation selectively
affects speech in the brain areas roughly corresponding to those responsi-
ble for aphasia. However, the consequences of stimulation are surprisingly
variable among nearby cortical sites and across subjects. In studies similar
to those of Penfield, neurosurgeon George Ojemann, at the University of
Washington, has found that the effects of stimulation can sometimes be
quite specific. For example, stimulating small parts of cortex at different
locations can interfere with naming, reading, or repeating facial move-
ments (Figure 20.13). What makes these findings all the more intriguing is
that different results are sometimes obtained at nearby stimulation sites,
and similar results can be obtained at distant sites. These results may indi-
cate that the language areas in the brain are much more complex than the
Wernicke-Geschwind model implies. Brain regions involved in language
are also more extensive than Broca's and Wernicke's areas; they include
other cortical areas, as well as parts of the thalamus and striatum. Specialized
regions might exist within Broca's area and Wernicke's area, possibly on the
scale of functional columns in somatosensory cortex or ocular dominance
columns in visual cortex. It appears that the large language areas identified
on the basis of aphasic syndromes may well encompass a good deal of finer
structure.
Imaging of language Processing in the Human Brain
With the advent of modem imaging techniques, it has become possible to
observe language processing in the human brain. With PET and fMRI, the
level of neural activity in different parts of the brain is inferred from re-
gional blood flow (see Box 7.3). In many ways, brain imaging confirms
what was already known about language areas in the brain. For example,
various language tasks make different portions of cerebral cortex active,
and the activated areas are generally consistent with areas implicated from
studies of aphasia.
However, brain imaging sometimes suggests that language processing is
more complex. In an experiment conducted by Lehericy et aL brain activ-
ity was recorded while subjects performed three different language tasks
(Figure 20.14). In the first task, subjects were instructed to generate as
many words as possible in a particular category, such as fruits or animals.
In the second task, subjects silently repeated to themselves a sentence they
previously heard read aloud. The third task required that they simply lis-
ten to a story being read aloud. Notice in Figure 20.14 that the locations of
activated brain areas are roughly consistent with temporal and parietal lan-
guage areas that were discovered by examining aphasia resulting from
brain lesions. Somewhat more surprising is the extent to which the brain
activation is bilateral. Based on a Wada test of language lateralization, the
subject of Figure 20.14 had a strongly dominant left hemisphere. The fMRI
results suggest that there is more going on in the nondominant hemisphere
than the Wada procedure suggests. Significant bilateral activation is a
common observation in fMRI studies, and there is ongoing debate about its
significance. Recent PET and fMRI studies also suggest fascinating simi-
larities and differences in language processing of spoken language, sign
language, and Braille (Box 20.3).
R
()
FIGURE 20.13
The effects of brain stimulation in three
patients being treated for epilepsy.
Patients were awake, and difficulties in speak-
ing or reading were noted. N, naming difficulty
with intact speech (anomia); A. arrested
speech; G. grammatical errors; j, jargon (fiuent
speech with frequent errors); R, failure to
read; M, facial movement errors. (Source:
Adapted from Ojemann and Mateer. 1979,
Fig. I.)
634 C HAP T E R 20 . LANGUAGE
-.....,.
"
'.
. -lo.'"
p
... \
'" - .
, ..
...
'\
(a)
.-,-'"'
r
,
... 1 f
\ .
...
\
\ -
"
'- --
(b)
"I.
.-
\'
'\
..
...
..
r
- 0,...
.'" \.
I..
, I
, ,
...
...
\\
,
(c)
FIGURE 20.14
Bilateral brain activation from fMRI. Based on a Wada procedure, this subject had a
strongly dominant left hemisphere for language. Images from fMRI show significant bilateral
activation of language areas on (a) a word generation task (b) silent sentence repetition,
and (c) passive listening. (Source: Adapted from Lehericy et aI., 2000, Fig. I.)
In another study, researchers used PET imaging to observe the differences
in brain activity between the sensory responses to words and the produc-
tion of speech. They began by measuring cerebral blood flow with the sub-
ject at rest. They then had the person either listen to words being read or
look at words presented on a computer display. By subtracting the levels of
blood flow at rest from the levels during listening or seeing, blood flow
levels were obtained specifically corresponding to the activity evoked by
the sensory input. The results are shown in the top half of Figure 20. I 5.
Not surprisingly, the visual stimuli evoked increased brain activity in stri-
ate cortex and extra striate cortex, and the auditory stimuli elicited activity
in primary and secondary auditory cortex. However, the areas activated in
extra striate cortex and secondary auditory cortex did not respond to visual
and auditory stimuli that were not words. These areas may be specialized
for the coding of words either seen or heard. The visual stimuli did not
evoke noticeably increased activity in the area of the angular gyrus and
... LANGUAGE STUDIES USING BRAIN STIMULATION AND BRAIN IMAGING 635
.
Passively viewing words
Listening to words
.
)
,
..
Speaking words
Generating verbs
Wernicke's area, as one would expect based on the Wernicke-Geschwind
model.
Another task studied with PET imaging was repeating words. In order to
know what words to repeat, subjects must perceive and process the words
by either the visual or auditory system. Thus, the brain activity seen in the
repetition task should include a component associated with the basic per-
ceptual process as well as a component associated with speech. To isolate
the speech component, the response pattern previously obtained in the sim-
ple sensory task was subtracted out. In other words, the image for "speak-
ing words" equals an image corresponding to "repeating spoken words"
minus an image corresponding to "listening to words." After the subtraction,
the blood flow pattern indicated high levels of activity in primary motor
cortex and the supplementary motor area (Figure 20.15, bottom left). There
was also increased blood flow around the Sylvian fissure near Broca's area.
However, the PET images showed such activity bilaterally, and it was even
observed when the subjects were instructed to move their mouth and
tongue without speaking. Because there is good evidence that Broca's area is
unilateral, it may not be showing up in these images, for reasons unknown.
The final task required the subjects to think a little. For each word pre-
sented, the subject had to state a use for the word (e.g., if "cake" was pre-
sented, the subject said "eat"). To isolate activity specific to this verb-noun
association task, the blood flow pattern obtained previously for speaking
words was subtracted. Areas that were activated in the association task are
located in the left inferior frontal area, the anterior cingulate gyrus, and the
posterior temporal lobe (Figure 20.15, bottom right). The activity in frontal
and temporal cortex is believed to be related to the performance of the
word-association task, whereas the activity in cingulate cortex may be re-
lated to attention (see Chapter 21).
Language Acquisition
Language processing in the adult human brain relies on carefully orchestrated
interactions between a number of cortical areas and subcortical structures.
FIGURE 20.15
PET imaging of sensation and speech.
Relative levels of cerebral blood flow are
color-coded. Red indicates the highest levels,
and progressively lower levels are represented
by orange. yellow. green, and blue. (Source:
Posner and Raichle. 1994, p. II 5.)
636 C HAP T E R 20 . LANGUAGE
Box 20.3
.... ' .;
OF SPECIAL INTEREST
...
4 ..
';..o!:
.. Hearing Sight and Seeing Touch
The human brain is a remarkably adaptable organ, and some
of the most dramatic examples of brain reorganization come
from studies of human language processing. The top panel
of Figure A is an fMRI image showing brain areas activated
when normally hearing English speakers read sentences in
English. Red areas are most highly activated by language, and
yellow areas are somewhat less activated. (Visual activity
not associated with language has been subtracted.) There is
'"
...
"1:\,-
../"""""\\1
... J "} \..
'")
, -'-.
-r;- \
....,.....,
I
-::--
::'- --....-
, .....
..
,.
"
,
\
'...
-.,/"--. """-,
..i ---
..-" ')).
' ... --
-.
.....'-
...
--.......
)(
"\
"
=-
-
"\ '-
, I I --..... '" '
.J \-.
I .......
\ ....
-
(-
"
- ..
I
--
..--
-:
....
But how does the brain learn to use language? Learning a language, language
acquisition, is a remarkable and fascinating process that proceeds in a
similar manner in all cultures. The gurgles of newborns turn into babbling
around 6 months of age. By 18 months, children understand about ISO words
and can speak about 50. A 3-year-old can produce full sentences. Patricia
Kuhl at the University of Washington has studied this mysterious process
and begun to reveal the brain processes involved in language acquisition
(Box 20.4).
The speed at which infants learn language belies the challenges involved.
When we hear a foreign language, it sounds rapidly spoken, and it is difficult
to determine where one word stops and the next begins. This is one of the
problems faced by infants learning their native tongue. Spoken language
.... LANGUAGE STUDIES USING BRAIN STIMULATION AND BRAIN IMAGING 637
significant activity in the standard language areas of the left
hemisphere, including Broca's and Wernicke's areas, but lit-
tle activity in the right hemisphere.
The center panel of Figure A shows brain activity when
hearing English speakers saw sentences in American Sign
Language (ASL). Not understanding ASL, they showed no
specific brain activity after their response to meaningless
hand signs was subtracted. On the other hand, the bottom
panel of Figure A shows the response to ASL in deaf sub-
jects who were raised with ASL as their sole language. The
activation includes Broca's and Wernicke's areas in the left
hemisphere, indicating that ASL uses the same language ar-
eas as for spoken English in hearing subjects. Even more sur-
prising is the great deal of activity in the right hemisphere.
Remarkably, the superior temporal gyrus is active in re-
sponse to ASL in deaf subjects, an area that would normally
respond to spoken language in hearing subjects. As these
areas are also active in hearing subjects who are bilingual in
... FIGURE A
Top: Wrrtten English. read by hearing subjects. Center:
ASL. seen by English-speaking hearing subjects. Bottom:
ASL. seen by deaf subjects. (Source: Neville et al.. 1998.
p. 925.)
ASL, it appears that something about ASL recruits right
hemisphere auditory areas in addition to the usual left hemi-
sphere language areas.
A different form of brain reorganization is seen in blind
subjects who read Braille. A system of writing that uses
patterns of small bumps on paper to represent letters,
Braille is read by scanning the fingertips across the bumps.
As you would expect, Braille reading activates somatosensory
cortex. but other brain areas activated are a real surprise.
Figure B shows a PET image obtained from a person reading
Braille. There is significant activity at the occipital pole of the
brain (yellow)-unmistakably portions of visual cortex.
Through a process of brain reorganization. these blind
subjects have a brain that uses traditional visual areas to
process Braille, similar to the auditory areas used for ASL
in deaf subjects. (The chapters in Part IV explore the mech-
anisms by which sensory experience can affect brain organ-
ization and lead to learning and memory.)
.'
...
FIGURE B
Reading Braille. (Source: Sadato
et al.. 1996. p. 527.)
does not reliably indicate the divisions between words, rather like reading
tex1 without the spaces (Figure 20.16). Yet infants must learn to under-
stand thousands of words that are all constructed from the same small pool
of language-specific sounds. Jenny Saffran and her colleagues at the Uni-
versity of Wisconsin have found that words are distinguished by statistical
learning in the infant. In other words, the child learns that some combi-
nations of sounds are far more likely than others. When a low-probability
combination occurs, it suggests the possible location of a word boundary.
For example, in the phrase "pretty baby," the probability that "ty" follows
"pre" in a single word is higher than "bay" following "ty" in a single word.
Another cue infants learn to use is the syllable emphasis most common
in the language. In English, for example, the stress is usually on the first
638 C HAP T E R 20 . LANGUAGE
FIGURE 20.17
Brain activity evoked by speech in
3-month-old infants. On the top. the red
arrows on the lateral views of the brain pOint
to three temporal lobe areas significantly acti-
vated while the infants are listening to speech.
These areas. the planum temporale. superior
temporal gyrus, ..md the pole of the temporal
lobe, are shown in horizontal sections below
In the fMRI images. red, orange. and yellow
indicate increasingly greater brain activity.
(Source: Dehaene-Lambertz et al.. 2002.
p.2014.)
(a) Spoken
"There are no silences between words"
h; I' 1. _ !. n_ __'d A _ _
I
I ThereAre
I Bet
NoS
ilen
weenWord
ces
s
(b) Printed text
THEREDONA TEAKETTLEOFTENCHIPS
THE RED ON A TEA KETTLE OFTEN CHIPS or THERE, DON ATE A KETTLE OF TEN CHIPS
FIGURE 20.16
Word boundaries in spoken and written English. (a) Acoustic anaiysis of a spoken
sentence demonstrates that word boundaries cannot be determined simply from sounds.
(b) \n analogous situation mrght be reading text without spaces between words. Indeed.
some patterns of letters could form more than one sentence. (Source: Kuhi, 2004. p. 836.)
syllable, and this pattern helps determine where words start and stop.
When adults of both genders ta11< to infants, they often use "motherese,"
in which the speech is slower oud exaggerated and vowel sounds are more
clearly articulated. Motherese may help the child in learning speech sounds.
We do not yet know the brain mechanisms by which infants learn to dis-
tinguish and speak w(Fds. However, Ghislaine Dehaene-Lambertz et aL
have found using lMRI that even at the age 01 3 months, the brain response
to spoken words is distributed in a manner similar to that in adults (Figure
20.17). Listening to speech activates extensive areas in the temporal lobe,
and the activation is strongly biased toward the left hemisphere. These find-
ings do not show that the infant brain processes language the same as the
adult brain, bur they indicate a similar early organization or auditory areas
and Jateralization for language. It is a commonly held belief that the human
brain's language abiJities are innate, and recent research explores the genetic
has is for this predisposition (Box 20.5).
-'t l
t
1 --j ---:--i
.-,. --
.. ". .. t J.
Planum templorale
Superior temporal gyrus
Temporal pole
{
I
'\
f I
I
I
R I L
-,
...
L
R I L
R
"If LANGUAGE STUDIES USING BRAIN STIMULATION AND BRAIN IMAGING 639
Box 20.4
PATH OF DISCOVERY
..
..
n A
-
The Origins of Language:
A Tale of Two Species
Why don't nonhuman primates learn language? When I
was a graduate student at the University of Minnesota in
the I 960s, this question occupied the minds of psycholo-
gists and linguists all over the country. Several psychologists
had devoted their careers to trying to teach chimpanzees
to produce and respond to spoken language, but chimps
did not learn language. Noam Chomsky, the world's fore-
most linguist, introduced an exciting and revolutionary
theory about the origins of language, and it ignited a de-
bate that pitted his nativist position against classical
learning theory.
My acceptance of a post-doctoral position at Central
Institute for the Deaf (CID) in St. Louis in 1973 allowed me
to get into the fray and pursue the species-specificity of
language in a new way-by studying language at the pho-
netic level, rather than at the semantic or syntactic level.
At the time, speech perception was just being recognized
as a good puzzle. AI Liberman at Haskins laboratories had
discovered "categorical perception" (CP) for speech, the
ability of adults to hear speech stimuli in terms of absolute
categories. In adults, CP occurred only for the speech
sounds contained in one's native language, indicating that
learning played a role, and infant studies showed that they
demonstrated CP for the sounds of all languages.
As a post-doc, my goal was to study the origins of CP.
I examined whether animals would exhibit Cp, and set up
an infant laboratory so that direct comparisons could be
made. At ClD, my infant lab was located in space occupied
by Hallowell Davis, the first person to record electrical
potentials in humans in response to auditory stimuli, and
he suggested that I use evoked potentials to study speech
perception, a technique I now use. Next door to the baby
lab, Jim Miller and I worked to establish a technique that
tested CP in animals. We traveled to Haskins Laborato-
ries to record the exact same stimuli that had been used
in previous CP experiments. In 1975, our results showing
categorical perception in the chinchilla were published.
We argued that the animal results suggested a new view-
that general auditory perceptual mechanisms had influ-
enced the evolution of language. Both the findings and the
by Patricia Kuhf
theory have gained support. I moved to the University of
Washington in Seattle and replicated these effects in
monkeys. Other labs also showed that animals reproduce
speech perception effects using phonemes, statistical pat-
terns in speech that allow the detection of words, and
prosodic patterns. These findings changed our thinking.
Theorists (including Chomsky) now agree that certain
key aspects of language are demonstrable in nonhuman
animals and that this raises the possibility that at least
some aspects of human language exploit previously exist-
ing properties of sensory and cognitive systems. Impor-
tantly, additional research in my lab, as well as in others.
has shown dissociation between infants and animals on
language tasks. Our "perceptual magnet effect;' which
focuses on speech categorization rather than discrimina-
tion, is shown in infants by 6 months of age, but not in
animals, suggesting that infants learn from exposure to
speech in a way that animals do not.
In collaboration with cognitive psychologist Andy
Meltzoff, I extended infant speech studies to examine
imitation and auditory-visual (cross-modal) perception.
We discovered that by 20 weeks of age, infants imitate
speech and show a primitive form of lip-reading, effects we
believe are species specific. In collaboration with col-
leagues in Japan, Russia, Sweden, Finland, Spain, Mexico,
Taiwan, and China, my current studies examine speech
perception in bilingual infants and adults, on the universal
phenomenon of "motherese," and on the impact of social
interaction in language learning.
My students and I now use the tools of modern neuro-
science-event-related potentials (ERPs) and magneto-
encephalography (MEG)-to test language processing in
infants during the first year of life. A great deal of progress
has been made. Human language still provides an intrigu-
ing scientific puzzle. Neuroscience methods are paving the
way for the next round of significant discoveries, and
things have come full circle. I now direct an interdiscipli-
nary center, the Institute for Learning and Brain Sciences
at the University of Washington, that links brain and be-
havior in the study of complex human abilities.
640 C HAP T E R 2 0 . LANGUAGE
Box 20.5
... 1
OF SPECIAL INTEREST
I....
_ .I The Search for Language Genes
Human babies and puppies enter the world knowing
equally little about the language that wil'l surround them
after birth. Why is it that the human child rapidly learns
the words and grammar of language, while Fido barks his
way through life To many scienti,sts, the answer is that the
human brain has evolved an organization that facilitates
language acquisition and use. Speech and language disorders
sometimes run in families, suggesting a role for genetics
in the neural basis of language. But the complex patterns
of inheritance usually observed do not clearly implicate
any particular gene(s).
The view of genetics and language changed dramatically
in 1990 when the first publkations appeared describing a
British family known only as KE. In three generations,
about half of the KE family members have verbal dys-
praxia, an inability to produce the coordinated muscular
movements needed for speech (Figure A). Their speech is
I'argely unintelligible to both the general public and other
members of the family. In fact, they developed signs to
supplement spoken language. In addition to dyspraxia, the
affected KE family members have broader difficulties in-
volving grammar and language, and a lower IQ than the
unaffected members. The deficit is thought to be language
specific rather than a more general cognitive impairment,
because the language problems are observed even in af-
fected family members with a normal IQ. Brain scans re-
veal that affected members have significantly smaller cau-
date nuclei and somewhat smaller Broca's areas than
unaffected members.
What is the genetic explanation for this striking familial
language disorder? Unlike previously observed inherited
language disorders that appeared to involve multiple genes,
the hereditary pattern of the KE family was consistent
with the mutation of a single gene. This gene appeared to
affect the structure of the brain and the muscular control
of the lower face. The hunt for the culprit gene was aided
by the discovery of an unrelated boy known as C. 5., who
had a similar language disorder. Combining what was
known about C. S. and the KE family, the mutated gene
was eventually identified as FOXP2, which codes for a
transcription factor that turns other genes on and off.
Although it would be incorrect to call FOXP2 the lan-
guage gene, it does appear to be a critical factor. From
our two parents, each of us has two copies of the FOXP2
gene, but a mutation in either one is sufficient to produce
severe language deficits. The fact that a change in a single
gene can affect a complex behavior such as speech is
striking. However, through its action as a transcription fac-
tor, FOXP2 is capable of influencing numerous other genes
that might be involved in language.
FOXP2 is found in mice and chimpanzees, so is there
something special about the human form that conceivably
underlies our extensive language abilities Only two amino
acids distinguish the human form of the FOXP2 protein
from the chimpanzee, gorilla, and rhesus monkey form.
The evolutionary paths leading to human and chimpanzee
diverged about 6 million years ago, but it has been esti-
mated that the FOXP2 mutations occurred in the past
100.000 years. An intriguing speculation is that a small and
relatively recent mutation in the FOXP2 gene set humans
on a path toward developing language that was needed for
higher cognitive function and the development of culture.
Unaffected family
members:
III Male
. Female
/ Deceased
Affected family
members:
III Male
. Female
-:;7 Twins
FIGURE A
The inheritance of language defiCits in the KE family.
(Source: Adapted from Watkins et al.. 2002. p. 466.)
... CONCLUDING REMARKS 641
... CONCLUDING REMARKS
To a limited extent, language processing by the brain can be understood
based on what we previously learned about sensory and motor systems. If
a person repeats a word he reads, initial activity in visual cortex will even-
tually be followed by activity in motor cortex corresponding to the muscles
that move the vocal apparatus. Studies of brain damage associated with
aphasia, speech disturbances produced by brain stimulation, and human
brain imaging have identified multiple brain areas between the sensory and
motor systems that appear to be critical for language. The brain imaging
and stimulation results are generally consistent with the placement of
language areas inferred from studies of aphasia.
It appears, however, that language processing involves more than a sim-
ple interaction between two major language areas (Broca's and Wernicke's).
Perhaps this is not surprising, because language involves many different
skills, such as naming, articulation, grammar usage, and comprehension.
Striking differences in language processing also exist in the two cerebral
hemispheres. An important question is whether separate systems are in-
volved in different language skills. We still have much to learn. Further
brain imaging studies will continue to clarify the organization of language
systems in the brain at a finer scale than was possible by studying the con-
sequences of brain lesions.
..
>-V>
wI:
w
.....
The Discovery of
Specialized Language
Areas in the Brain
aphasia (po 618)
Wada procedure (po 620)
Broca's area (p. 620)
Wernicke's area (po 620)
anomia (po 622)
Wernicke's aphasia (p. 623)
Wernicke-Geschwind model
(p. 625)
conduction aphasia (po 627)
corpus callosum (po 628)
planum temporale (po 632)
Language Studies Using
Brain Stimulation and
Brain Imaging
language acquisition (po 636)
Asymmetrical Language
Processing in the Cerebral
Hemispheres
split-brain study (po 628)
Types of Aphasia
Broca's aphasia (po 621)
ctJ
., ...,
V>
Z
w
0
>
w .....
V>
w
::>
a
I. How is it possible for a split-brain person to speak intelligibly if the left hemisphere controls speech? Isn't
this inconsistent with the fact that the left hemisphere must direct motor cortex in both hemispheres to
coordinate movements of the mouth?
2. What can you conclude about the normal function of Broca's area from the observation that there are usually
some comprehension deficits in Broca's aphasia? Must Broca's area itself be directly involved in comprehension?
3. Pigeons can be trained to press one button when they want food and other buttons when they see particular
visual stimuli. This means the bird can "name" things it seeso How would you determine whether or not the
pigeon is using a new language--"button-ese"?
40 What does the Wernicke-Geschwind language-processing model explain? What data are inconsistent with
this model?
50 In what ways is the left hemisphere usually language dominant? What does the right hemisphere contribute?
6. What evidence is there that Broca's area is not simply a premotor area for speech?
642 C H A PH R 20 . LANGUAGE
6d
C>
Wz
I-
.....0
«
W
LL.
Bookeheimer S. 2002. Functional MRI of language:
new approaches to understanding the cortical
organization of semantic processing. Annuol Review
of Neuroscience 25:51-188.
Kuhl PK. 2004. Early language acquisition: cracking
the speech code. Nature Reviews Neuroscience
5:831--843.
Saffran EM. 2000. Aphasia and the relationship of
language and brain. Seminars in Neurology 20:
409-418.
Scott SK. Johnsrude IS. 2002. The neuroanatomical
and functional organization of speech perception.
Trends in Neurosciences 26: I 00-1 07.
Vargha-Khadem F. Gadian DG. Copp A, Mishkin M.
2005. FOXP2 and the neuroanatomy of speech and
language. Nature Reviews Neuroscience 6: 131-138.
CHAPTER
Attention
INTRODUCTION
. Box 21.1 OfSpedallnterest: Attention-Deficit Hyperactivity Disorder
BEHAVIORAL CONSEQUENCES OF ATTENTION
ENHANCED DETECTION
FASTER REACTION TIMES
NEGLECT SYNDROME AS AN ATTENTIONAL DISORDER
"
PHYSIOLOGICAL EFFECTS OF ATTENTION
FUNCTIONAL MRI IMAGING OF ATTENTION TO LOCATION
PET IMAGING OF ATTENTION TO FEATURES
ENHANCED NEURONAL RESPONSES IN PARIETAL CORTEX
. Box 21.2 Path of Discovery: Finding Neuronal Correlates of Attention, by Robert Wurtz
RECEPTIVE FIELD CHANGES IN AREA V4
HOW IS ATTENTION DIRECTED?
THE PULVINAR NUCLEUS
ATTENTION AND EYE MOVEMENTS
CONCLUDING REMARKS
644 C HAP T E R 2 I . ATTENTION
INTRODUCTION
Picture yourself at a crowded party surrounded by loud music and the chat-
ter of hundreds of people. Even though you are bombarded by sound from
all directions, you are somehow able to concentrate on the conversation
you're having and ignore most of the other noise and talking. You are
paying attention to the one conversation. Behind you, you hear someone
mention your name, and you decide to eavesdrop. Without turning around,
you stan focusing your attention on this other conversation to find out
what's being said about you.
The state of selectively processing simultaneous sources of information is
known as attention. In the visual system, attention enables us to concentrate
on one object over many others in our visual Held. Interactions between
modalities also occur. For example, if you are performing an attention-
demanding visual task, such as reading, you will be less sensitive to incom-
ing sounds. Clearly, attention has to do with preferential processing of sen-
sory information. Amidst all the sights, sounds, and tastes coming into our
brain, we are able to selectively attend to some information and ignore the rest.
The extra mental energy required for paying attention has significant
beneficial effects on our pertormance of various behavioral tasks. Although
not simply a problem of attention, a condition known as attention-deficit
hyperactivity disorder demonstrates how critical attentional mechanisms
are (Box 21.1). What is happening in the brain when attention is devoted
Box 21.1
... , .
.
....
...
OF SPECIAL INTEREST
Attention-Deficit Hyperactivity Disorder
It is the last lecture of the school year. You are failing mis-
erably at focusing on the instructor, as you stare longingly
at the green grass and trees outside the window. At times,
we all have difficulty concentrating on our work, sitting still,
and resisting the urge to play. But for millions of people,
the syndrome that has come to be called attention-defrcit
hyperactivity disorder (ADHD) routinely and seriously inter-
feres with their ability to get things done.
The three behavioral characteristics commonly associ-
ated with ADHD are inattention, hyperactivity, and impul-
siveness. Children normally exhibit these behaviors more
than adults, but if they are significantly pronounced, ADHD
might be diagnosed. By some estimates, 5-1 0% of all school-
age children worldwide have ADHD, and the disorder
interferes with schoolwork and interactions with class-
mates. Follow-up studies show that many people diagnosed
with ADHD continue to exhibit some symptoms as adults.
Although the cause of ADHD is not known, there are
several clues. For example, researchers have reported that
in magnetic resonance imaging scans, several brain struc-
tures, including prefrontal cortex and the basal ganglia, are
smaller in children with ADHD. Whether these differences
are behaviorally significant is unclear, and they are not re-
liable enough to diagnose the disorder. However, the pos-
sible involvement of these structures is intriguing because
they have long been implicated in the regulation and plan-
ning of behavior. Recall Phineas Gage, who experienced
great difficulty making and carrying out plans after a severe
lesion to his prefrontal cortex (see Box 18.1).
Several pieces of evidence suggest that heredity plays a
significant role in ADHD. Children of parents with ADHD
are more likely to develop it, and a child is much more
likely to have it if an identical twin does. Nongenetic fac-
tors, such as brain injury and premature birth, may also
be involved. Several genes related to the function of
dopaminergic neurons have been reported to be abnor-
mal in people withADHD. These include the D4 dopamine
receptor gene, the D2 dopamine receptor gene, and the
dopamine transporter gene. We have seen in several pre-
vious chapters how important dopaminergic transmission
is for a variety of behaviors, so it will be a challenge to
clarify dopamine's involvement in ADHD.
At present, the most common treatment for ADHD,
aside from behavioral therapy, is drugs such as Ritalin
(methylphenidate). Ritalin is a mild central nervous system
stimulant similar to amphetamines. It also inhibits the
dopamine transporter, increasing the postsynaptic effect
of dopamine. In many children, Ritalin successfully de-
creases impulsiveness and inattention, although questions
about long-term use remain.
'f' BEHAVIORAL CONSEQUENCES OF ATTENTION 645
to something? Human brain imaging studies and recordings from individual
neurons show that cortical activity is significantly altered by the attention
we exert. But before looking at the neural reflections of attention, let's
examine a few key findings concerning the behavioral manifestations of
attention. We focus on visual attention, for which behavioral studies are
most closely correlated with physiological research.
T BEHAVIORAL CONSEQUENCES OF ATTENTION
Under most conditions, if we want to visually scrutinize something, we
move our eyes so that the object of interest is imaged on the fovea in each
eye. Implicit in this behavior is the fact that most of the time, we are pay-
ing attention to something imaged on our fovea. However, it is possible to
shift attention to objects imaged on parts of the retina outside the fovea.
Shifting attention to some location on the retina enhances visual process-
ing in several ways. Two ways that we'll look at are enhanced detection
and faster reaction times.
Enhanced Detection
Figure 21.1 shows an experiment for studying the effects of directing visual
attention to different locations. The observer fixated on a central point, and
her task was to say whether a target stimulus was flashed on at a location
to the left of the fixation point, to the right. or not at all. The task was dif-
ficult because the target was small and flashed on very briefly. The exper-
iment had several special procedures for identifying the effects of attention.
Each trial began with the presentation of a cue stimulus at the fixation
point. The cue was either a plus sign, an arrow pointing left, or an arrow
pointing right. After the cue was extinguished, a variable delay period fol-
lowed, during which the fixation point was seen. In half the trials there
was no further stimulus, and in the other half, a small target circle was
flashed on for 15 msec at either the left or right position.
A key element of the experiment is that the cue was used to direct at-
tention. If the central cue was a plus sign, it was equally likely that a little
circle would appear at either the left or right. The plus sign was thus a
"neutral cue." If the cue was a left arrow, it was four times more likely that
a target would appear on the left than on the right. If the cue was a right
arrow, it was four times more likely that a target would appear on the right
than on the left. If the target appeared to the cued side, the cue was "valid";
the cue was "invalid" if it pointed away from where the target would ap-
pear. The observer had to keep her eyes pointing straight ahead, but to
make the most correct responses on the difficult task of detecting the
flashed circles, it would be advantageous to make use of the cue. For in-
stance, if the cue was a left arrow, it would be beneficial to pay attention
to the left target location more than the right.
For each of the subjects used in this experiment, the data collected con-
sisted of the percentage of the time a circle was correctly detected. Because
there was no target circle on half the trials, the observers could not get a
high percentage correct by "cheating" (i.e., by saying there was always a
target at the side where the arrow pointed). In trials in which the central cue
was a plus sign, the observers detected a target stimulus on about 60% of
the trials in which one was presented. When the cue was a right arrow, the
observers detected a target stimulus at the right on about 80% of the trials
in which one was presented there. However, when the cue pointed right,
the observers detected a target stimulus at the left on only about 50% of
the trials in which one was presented there. With the appropriate left-right
646 C HAP T E R 2 I . ATTENTION
100
;g
c
0
Q) 50
ID
1:>
ID
OJ
ro
I-
a
Neutral
Valid
J
Invalid
y
Cue
FIGURE 21.2
The effect of cueing on target detection.
Subjects reported whether a small circle was
detected to the left or right of the fixation
point. On some trials. the cue was neutral,
giving no indication to which side the circle
would appear. Subjects detected the circle
on a higher percentage of trials when a small
arrow at the fixation point conrectly indicated
the side to which the target would appear
(i.e., a valid cue). If the cue was invalid. point-
ing away from the side with the circle, the
circle was less likely to be detected.
Fixation point
Attended \ Cue
location \/Y
IL=J
t
-----/;
(( n(
Target appears at
cued location
'---
I
Target appears at
uncued location
' ,#,
/
.,../
1
'1(
o(
"-p
FIGURE 21.1
Measuring the effect of attention on visual detection. While an observer maintains
steady fixation, a cue directs her to shift her attention to one side of the computer screen.
In each trial. the observer indicates whether a circular target is seen on either side of the
sCl-een.
reversal. the results were about the same with left arrows. The results are
summarized in Figure 21.2.
What do these data mean? To answer, we must imagine what one of the
observers was doing. Evidently, the expectation of the observer based on
the cues influenced her ability to detect the subsequent targets. It appears
that the arrow cues caused the observer to shift her attention to the side
where the arrow pointed, even though her eyes didn't move. Presumably,
this covert shift of attention made it easier to detect the flashed targets com-
pared to the trials when the central cue was a plus sign. Conversely, the
observer was less sensitive to the targets on the side of fixation opposite to
where the arrow cue pointed. Based on these results and those from many
other similar experiments, our first conclusion about the behavioral effects
of attention is that it makes things easier to detect. This is probably one of
the reasons we can listen in on one conversation among many when we
give it our attention.
'Y BEHAVIORAL CONSEQUENCES OF ATTENTION 647
Faster Reaction Times
Using an experimental technique similar to the one above, researchers
have demonstrated that attention increases the speed of reactions in per-
ceptual studies. In a typical experiment, an observer fixated on a central
point on a computer screen, and target stimuli were presented to either the
left or the right of the fixation point. However, in this experiment the
observer was told to wait until he perceived a stimulus at either location
and to press a button when he did. A measurement was made of how long
it took the observer to react w the presentation of a stimulus and press a
button. Preceding the target was a cue stimulus, either a plus sign or an
arrow pointing left or right. The arrows indicated the side to which a stim-
ulus was more likely to appear, whereas the plus sign meant that either
side was equally likely.
Results Irom this experiment demonstrated that an observer's reaction
times were influenced by where the central cue told him to direct his at-
tention. When the central cue was a plus sign, it took about 250-300 msec
to press the button. When an arrow cue correctly indicated where a target
would appear (e.g., right arrow and right target), reaction times were 20-30
msec faster. Conversely, when the arrow pointed in one direction and the
target appeared at the opposite location, it took 20-30 msec longer to re-
act w the target and press the button. The reaction time included time for
transduction in the visual system, time for visual processing, time to make
a decision, time to code for the finger movement, and time to press the
button. Nonetheless, there was a small but reliable effect based on which
direction the arrows directed the observer's attention (Figure 21.3). If we
assume that attention to visual objects does not have a direct effect on
visual transduction or motor coding, we are left with the hypothesis that
attention can alter the speed of visual processing or the time it takes to
make a decision about pressing the button.
Neglect Syndrome as an Attentional Disorder
In Chapter 12, we briefly discussed the neglect syndrome, in which a
person appears to ignore objects, people, and sometimes his own body to
one side of the center of gaze. Some have argued that this syndrome is a
unilateral deficit in attention. The manifestations of a neglect syndrome can
be so bizarre that they're hard to believe if not directly observed. In mild
cases, the behavior may not be apparent from casual observation. But in
severe cases, the patient acts as if half the universe no longer exists. He may
shave only one side of his face, brush the teeth on only one side of his
mouth, dress only one side of his body, and eat food from only one side of
his plate.
Because neglect syndrome is less common following left hemispheric
damage, it has primarily been studied in regard to neglect of the left half of
space as a result of damage to right cerebral cortex. In addition to neglect-
ing objects to the left side, some patients exhibit denial. For instance,
they may say that their left hand isn't really paralyzed, or in extreme cases,
refuse to believe that a limb on their left side is part of their body. Refer to
Figure 12.23 as a typical example of the distorted sense of space these
patients have. If asked to make a drawing, they may crowd all the features
into the right hall, leaving the left half blank. A particularly dramatic ex-
ample is the paintings shown in Figure 21.4, which were made by an artist
as he recovered from a stroke.
If a person with neglect syndrome is asked to close her eyes and point
toward the midline of her body, she typically will point too far to the right,
300
rJJ
E
Q)
250
c
.Q
t>
co
ti. 200
Invalid Neutral Valid
J
y
Cue
FIGURE 21.3
The effect of cueing on reaction time.
In neutral cue trials, the cue was a plus sign,
which gave no indication of the likely location
of the following target. In valid cue trials. the
arrow-shaped cue pointed to the location
where the target appeared, speeding reactions
to the targets. When the cue was invalid,
pointing in a direction opposite to where the
target later appeared, reaction times were
slower. (Source: Adapted from Posner. Snyder.
and Davidson, 1980, Fig. I.)
648 CHAPTER 21 . ATTENTION
11"
.or' '11
.....".. .
( ,\)
(b,r \
.... ..
I
e-..; J
" "1
,
......
...... \
..
.
, "
..
. '\
t:.' - .
,
, f
" (' 01
"
,t
Ja
FIGURE 21 A
Neglect syndrome. Two months after suffenng a stroke affecting parietal cortex on the
right side, the artist made the upper-left self-portrait. There is virtually no left side to the
face in the painting. About 3.5 months after the stroke. the left side has some detail but
not nearly as much as the right side (upper right). At 6 months (lower left) and 9 months
(lower right) after the stroke, the left side of the painting has increasingly more detail.
(Source: Posner and Raichle. 1994. p. 152.)
as if there has been a shrinkage of the left half. If blindfolded and asked to
explore objects placed on a table before them, patients behave normally in
exploring objects to the right but are haphazard about probing to the left.
All of these examples point toward a problem in relating to the space
around them.
Neglect syndrome is most commonly associated with lesions in posterior
parietal cortex in the right hemisphere. Reports have shown that it also
occurs following damage to the right hemisphere prefrontal cortex, cingu-
late cortex, and other areas. Researchers have proposed that the posterior
parietal cortex is involved in attending to objects at different positions in
extrapersonal space. If this is true, then neglect syndrome might be a dis-
ruption of the ability to shift attention. One piece of evidence supporting
this hypothesis is that objects in the right visual field of patients with neg-
lect syndrome are sometimes abnormally effective in capturing attention,
and patients may experience difficulty disengaging their attention from an
object on this side.
The reason that neglect syndrome more often accompanies right hemi-
spheric damage than left hemispheric damage is unclear. The right hemi-
sphere appears to be dominant for understanding spatial relationships, and
in split-brain studies, it has been shown to be superior at solving complex
puzzles. This finding seems consistent with the greater loss of spatial sense
... PHYSIOLOGICAL EFFECTS OF ATTENTION 649
after right hemispheric lesions. One hypothesis is that the left hemisphere
is involved in attending to objects in the right visual field, whereas the right
hemisphere is involved in attending to objects in the left and right visual
fields. While this would account for the asymmetrical effects of left and
right hemispheric lesions, at present there is only suggestive evidence in
support of such a hypothesis.
PHYSIOLOGICAL EFFECTS OF ATTENTION
What is happening in the brain when we shift our attention to something?
For example, in the behavioral studies we have discussed, is a subject's
performance enhanced because neural activity in a particular brain area is
somehow "better"? While it's conceivable that attention is strictly a high-
level cognitive process, experiments demonstrate that the effects of atten-
tion can be observed in numerous sensory areas stretching from area VI to
visual cortical areas in the parietal and temporal lobes. We first look at
human brain imaging studies that show activity changes associated with
the allocation of attention and then turn to animal studies that reveal the
effects of attention on individual neurons. These experiments show the
consequences of giving attention to a location or feature. Only a few recent
experiments have explored brain areas that might be involved in guiding
attention.
Functional MRI Imaging of Attention to Location
A key observation made in behavioral studies of attention is that enhance-
ments in detection and reaction time are selective for spatial location.
When we know where an important stimulus is more likely to appear. we
move our attention to it and process the sensory information with greater
sensitivity and speed. A common analogy is that attention works like a
spotlight, moving to illuminate objects of particular interest or significance.
Recent experiments using functional magnetic resonance imaging (fMRI)
imaging of the human brain suggest that there may be selective changes in
brain activity associated with spatial shifts in attention.
In one experiment, subjects in the fMRI machine viewed a stimulus
consisting of colored line segments arranged in circular sectors at several
distances from the central fixation point (Figure -21.5a). The subject was
instructed which sector to pay attention to, and this location changed every
10 seconds. During the 10-second period, the color and orientation of the
line segments changed every 2 seconds. Each time the line segments
changed, the subject's task was to press one button if the lines were blue
and horizontal or orange and vertical. and a second button if the lines were
blue and vertical or orange and horizontal. The reason for having the sub-
jects perform this task was to force them to attend to a particular sector of
the stimulus. Remember that subjects always kept their gaze fixed at the
center of the bull's-eye stimulus.
The fascinating aspect of this experiment is what happens when the lo-
cation of the sector being attended to changes. Figure 21.5b shows brain
activity recorded with the attended sector at four locations at increasing
distance from the fixation point. Notice how the areas of highest brain ac-
tivity move away from the occipital pole as the attended sector moves out
from the fovea. The pattern of brain activity shifts retinotopically, even
though the visual stimuli are the same regardless of which sector is at-
tended. The hypothesis is that these images show the neural effect of the
spotlight of attention moving to different locations.
650 C HAP T E R 2 I . ATTENTION
.
" (\
C
" "
C
," (\
C
" "
C
(b)
(a)
FIGURE 21.5
The spotlight of attention. (a) The visual stimulus.The stimulus (bottom frame) con-
sisted of blue and orange line segments arranged Into sectors radiating out from the central
fixation pOint. The orientation and color of each sector changed every 2 seconds. The four
bull's-eye patterns indicate in red the sector that a subject was instructed to attend to.
(b) Enhanced activity in visual cortex. The visual stimuli elicited activity in multiple visual
cortical areas, but patches of enhanced activity were associated with the attended sector.
In these images. enhanced activity is indicated by yellow and red. (Source: Courtesy of J. A.
Brefczynski and E. A. DeYoe.)
PET Imaging of Attention to Features
The fMRI results above appear consistent with the behavioral observation
that visual attention can be moved independently of eye position. But at-
tention involves more than just location. Imagine walking down a crowded
city sidewalk in the winter looking for someone. Everyone is bundled in
heavy coats, but you know your friend will be wearing a red hat. By
mentally "focusing" on red, it will be much easier to pick out your friend.
Evidently, we are able to pay particular attention to visual features such as
color to enhance our performance. Is there any reflection of this attention
to features in brain activity? The answer has come from studies using
positron emission tomography (PET) imaging in humans.
Steven Petersen and his colleagues at Washington University used PET
imaging while humans performed a same-different discrimination task
(Figure 21.6). An image was flashed on a computer screen for about half
a second; after a delay period, another image was flashed. Each image
was composed of small elements that could vary in shape, color, and
speed of motion. The task of the observer was to indicate whether the two
successive images were the same or different. While the speed, shape, and
color of the elements could all change between the two images, the ob-
server was instructed to base his same-different judgments on anyone or
all of the attributes. Accordingly, brain activity in response to identical
stimuli could be measured when the person was attending to different fea-
tures. Of course, the brain activity would simply indicate where neurons
were activated by the visual patterns, unless something were added to the
experiment.
To isolate the effect of attention, two different versions of the experiment
were conducted. In selective-attention experiments, subjects viewed the stim-
uli and performed the same-different task after being told to pay attention
to just one of the features (shape, color, or speed). In divided-attention exper-
iments, subjects simultaneously monitored all features and based their
same-different judgments on changes in any feature. The researchers
then subtracted the divided-attention responses from the selective-atten-
tion responses to obtain an image of changes in brain activity associated
with attention to one feature.
Figure 21.7 illustrates the results. Different areas of cortex had higher
activity when different attributes of the stimuli were being discriminated.
For instance, whereas ventromedial occipital cortex was affected by atten-
tion in color and shape discrimination tasks, it was not affected in the speed
discrimination task. Conversely, areas in parietal cortex were influenced by
attention to the motion task but not the other tasks. While it is not possi-
ble to know with certainty which cortical areas were highlighted in these
experiments, areas of heightened activity in the color and shape tasks may
have corresponded to areas V4 and IT and other visual cortical areas in the
temporal lobe. The area most affected by performing the motion task was
near area MT. These effects of attention to different features are roughly
consistent with the tuning properties of neurons in extrastriate visual areas
discussed in Chapter 10.
The important point to learn from these and other PET studies is that
numerous cortical areas appear to be affected by attention and that the
greatest attentional effects are seen in "late" rather than "early" areas in the
visual system. Attention selectively increases brain activity, but the partic-
ular areas atfected depend on the nature of the behavioral task performed.
We now examine two of these areas in detail and see how studies in be-
having monkeys have clarified the neural effects of attention.
... PHYSIOLOGICAL EFFECTS OF ATTENTION 65 I
Frame 1
--- ---
---.---
-----
--- ---
---
Frame 2
..-
..-...-
FIGURE 21.6
Stimuli used to measure attention to
features. The observer sees two frames,
each containing moving elements that can
change in shape. color. and speed of motion.
The observer responds by indicating whether
the stimuli are the same or different. (Source:
Adapted from Corbelia et al.. 1990, Fig. I.)
652 CHAPTER 21 . ATTENTION
FIGURE 21.7
Feature-specific effects of visual atten-
tion. Symbols Indicate where brain activity
in PET images was higher in selective-attention
experiments relative to divided-attention ex-
periments. In selective-attention experiments,
the same-different judgments were based on
speed (green), color (blue), or shape (orange).
(Source: Adapted from Corbetta et aI., 1990,
Fig. 2.)
Fixation point
/
// } Screen
\jJ -1
J ------- Target
Shift of gaze
due to saccadic
eye movement
FIGURE 21.8
A behavioral task for directing a
monkey's attention. While recordings are
made from the posterror parietal cortex, the
monkey fixates on a point on a computer
screen. When a perrpheral target appears
(usually In a neuron's receptive field), the
animal makes a saccade to the target.
(Source: Adapted from Wurtz, Goldberg,
and Robinson, 1982, p. /28.)
Corpus callosum
:!-J
" (/ superior
temporal
left medial
left lateral
sulcus
\
Right medial
Right lateral
Enhanced Neuronal Responses in Parietal Cortex
The perceptual studies discussed earlier show that in carefully constructed
experiments, attention can be moved independently of eye position. But
what happens normally when you move your eyes? Let's assume that
when you are scrutinizing an object focused on your fovea, your attention
is also directed to the fovea. If a bright flash of light appeared in the periph-
ery of your visual field, a saccadic movement toward the sudden flash
would happen automatically so you could see it with your fovea. But what
happened to your attention? Did it move before. during, or after the eye
movement? Behavioral studies have shown that shifts in attention can occur
in about 50 msec, whereas saccades take about 200 msec. Therefore, it is
quite likely that attention is drawn to the flash before your eyes move.
The assumption that attention changes location before an eye movement
underlies an experiment performed by neurophysiologists Robert Wurtz,
Michael Goldberg, and David Robinson of the National Institutes of Health
(Box 21.2). They recorded neural activity at several locations in the brains
of monkeys to determine whether there was increased activity that might
be related to attention, before eye movements. Assuming there is a rela-
tionship between attentional shifts and eye movements, the researchers
logically examined parts of the brain involved in generating sacca des.
They recorded from neurons in the posterior parietal cortex of monkeys
while the animals performed a simple behavioral task (Figure 21.8). This
cortical area is thought to be involved in directing eye movements, in part
because electrical stimulation here will evoke saccades. Parietal neurons
have rather large visual receptive fields, encompassing about 25% of the
entire visual field. In the task, a monkey fixated on a spot on a computer
screen; when a target appeared at a different location, it made a saccade
to that location. In each triaL the receptive field of a cortical neuron was
located, and the target used in the behavioral task was positioned so that
.... PHYSIOLOGICAL EFFECTS OF ATTENTION 653
"
Box 21.2
PATH OF DISCOVERY
,I
.
Finding Neuronal
Correlates of Attention
it....
"
· A !&..
As a psychology graduate student with Jim Olds at the
University of Michigan, I recognized that determining the
neuronal activity underlying higher-order cognitive func-
tions such as attention requires both recording activity in
the right place in the brain and having the experimental
animal perform the right behavioral task. After hearing a
talk by David Hubel in 1961, I thought the visual system
would be the right place to study. The beautiful order and
specificity of the processing in primary visual cortex
seemed like an ideal place to look for modulations re-
sulting from factors such as attention. But behavior was a
problem because Hubel and Wiesel's elegant studies of
the receptive fields of neurons were done on anesthetized
paralyzed cats, and if these animals were awake, they
would move their eyes as they liked and make it impos-
sible to study the very visual processing that made the
system attractive. If, however, I could study the visual re-
sponse of neurons during the normal periods of fixation
when the animal was not moving its eyes, I could study
the processing in conjunction with behavior.
I had the opportunity to try this after I joined the
laboratory of Ichiji Tasaki at the National Institutes of
Health (NIH) in July 1966. I began by rewarding a monkey
with fruit juice when it detected a change in a spot of light
on a screen in front of it, a change so small that I hoped
it would have to look right at it to see it. The monkey
learned the task easily, and when I had gathered equip-
ment for recording, I was ready to test my hunch. I had
been lucky enough to watch a recording session of
Hubel and Wiesel at Harvard a few years earlier. and Ed
Evarts at the NIH helped me adapt the neuron recording
system he had perfected for monkeys. For recording eye
movements, I had to devise my own technique of pasting
electrodes on the skin near the eyes. The technique
worked, but the electrodes repeatedly fell off and I could
not detect small movements. Nonetheless, the results
were good enough to show that the monkey was indeed
fixating, and I did my first recording from visual cortex on
the day before Thanksgiving 1966. It was one of the most
thrilling days of my life. I was able to map out a receptive
field of a V I neuron that responded best to an oriented
by Robert Wurtz
slit of light, tilted slightly off the vertical. I knew my tech-
nique worked, and I had a very happy Thanksgiving.
I spent much of the next 2 years developing my meth-
ods. which were largely dependent on digital logic cards (di-
gibits), as this was the pre-computer era. I built an un-
gainly setup, but it worked well enough to determine the
answers to such questions as whether visual cortex neu-
rons behaved substantially differently in the awake than in
the anesthetized animal and whether they were actively
turned off during eye movements. The answers were no.
My euphoria after that first Thanksgiving was premature;
I was in the wrong place for the questions I was asking.
I then decided to look at the other branch of the visual
system, the superior colliculus on the roof of the mid-
brain, and I was joined by Mickey Goldberg. In the initial
experiments, we did not know quite where we were in
the colliculus and brain stem, and after a particularly ex-
asperating day, Mickey opined that the colliculus must
have been put in the brain as a practice area for physiol-
ogists because it apparently contained one of each type of
neuron in the brain. But it was an incidental observation
that is relevant here: We noticed that when the monkey
made a rapid or saccadic eye movement to a spot of light
falling in the receptive field of a colliculus neuron, the
visual response seemed to be enhanced. We then devised
a task to test our hunch: We always kept the spot of light
the same, but varied whether the monkey made a saccade
to it or to somewhere else in the field. The enhanced
response occurred only with saccades to the spot, and we
inferred that the enhancement was a correlate of the
monkey's attention to the spot. Subsequent experiments
explored the relationship between the enhancement and
the generation of the movement and whether the effect
was present in cerebral cortex.
M,any laboratories now use far more elegant attention
paradigms and have found such enhanced responses in
multiple cortical areas. While my lab and many others
have developed the techniques that make the visual sys-
tem of the behaving monkey a cornerstone of cognitive
neuroscience, everything still comes down to the right
place in the brain and the right behavioral question.
654 C HAP T E R 2 I . ATTENTION
it appeared within the receptive field. As expected, the neuron was excited
when the target flashed in its receptive field (Figure 21. 9a). However, the
key observation Wurtz and his colleagues made was that the response of
many parietal cortex neurons was significantly enhanced (a rapid burst of
action potentials) when a saccade to the target subsequently occurred
(Figure 21.9b). This effect was spatially selective because the enhancement
was not seen if a saccade was made to a location outside the receptive field
(Figure 21.9c). The point is important because it indicates that the brain
was not simply generally more excitable.
The enhancement that occurred before the saccades is curious if the
parietal neurons were simply responding to the visual stimuli. Why should
the response to a target stimulus depend on an eye movement that hap-
pens long after the target is turned on? One explanation is that the in-
creased activity before the saccades was a consequence of attention shift-
ing to the location inside the receptive field of the neuron. Another
possibility is that the enhanced response was a premotor signal related to
coding for the subsequent eye movement, just as neurons in motor cortex
fire before hand movements. To address this possibility, the researchers per-
formed a variation on the experiment in which the behavioral response
was changed from a saccade to a hand movement (Figure 21.9d). Again,
there was an enhanced response to the target in the receptive field. This
shows that the response enhancement was not a premotor signal for a sac-
cade, but rather was related to attention.
It isn't difficult to see how response enhancement of the kind observed
in posterior parietal cortex could be involved in the behavioral effects of
attention discussed earlier. If attention drawn to one location in the visual
field by a cueing stimulus increases the response to other stimuli near that
location, this could account for the spatially selective enhancement in the
ability to detect a target. Likewise, it is conceivable that an increased response
could lead to more rapid visual processing and ultimately faster reaction
times, as seen in the perceptual experiments.
Receptive Field Changes in Area V4
In a fascinating series of experiments, Robert Desimone and his colleagues
at the National Institute of Mental Health have revealed surprisingly specific
effects of attention on the response properties of neurons in visual cortical
area V4. In one experiment, monkeys performed a same-different task with
pairs of stimuli within the receptive fields of V4 neurons. As an example,
suppose that a particular V4 cell responded strongly to vertical and hori-
zontal red bars of light in its receptive field but did not respond to vertical
or horizontal green bars. The red bars were "effective" stimuli and the
green bars were "ineffective" stimuli. While the monkey fixated, two stim-
uli (each either effective or ineffective) were briefly presented at different
locations in the receptive field, and after a delay period, two more stimuli
were presented at the same locations.
In an experimental session, the animal was instructed to base its same-
different judgments on the successive stimuli at one of the two locations
within the receptive field. In other words, the animal had to pay attention
to one location in the receptive field, but not the other, in order to perform
the task. The animal pushed a Jever one way with its hand if the succes-
sive stimuli at the attended location were the same, and the opposite way
if the stimuli were different.
Consider what happened in a trial when effective stimuli appeared at the
attended location and ineffective stimuli appeared at the other location
(Figure 21.lOa). Not surprisingly, the V4 neuron responded strongly in this
M
.., PHYSIOLOGICAL EFFECTS OF ATTENTION 655
\/
/'
Fixation /'
point
/ .
RecePtlve
.--.--J field
Target stimulus
Target
ON I
OFF
1 - __ __ -_______ ----- -- -- - - -- ----
L
Cell
activity
Eye
position
(a)
Sa,,",. 10
right
Target
ON I
OFF
I, _ _ _ _ _ _ _ _ _ _ _ _ _ _ _ _ _ _ _ _ _ _ _ _ _ _ _ _ _ _
!
Cell
activity
Eye
position
(b)
Target
ON I
OFF
L _______ _____________ ___ ______
g
Cell
activity
Eye
position
(c)
g
Target
BRIGHT I
DIM -- -- - - -- - I
lever
released
Cell
activity
Eye
position
(d)
FIGURE 21.9
The effect of attention on the response of a neuron in posterior parietal cortex.
(a) A neuron in posterior parietal cortex responds to a target stimulus ill its receptive field.
(b) The response is enhanced if the target presentation is followed by a saccade to the target.
(c) The enhancement effect is spatially selective, because it is not seen If a saccade occurs in
response to a stimulus not in the receptive field. (d) Enhancement is also seen when the task
requires the animal to release a hand lever when the peripheral spot dims, (Source: Adapted
from Wurtz. Goldberg. and Robinson, 1982, p. 128.)
656 C HAP T E R 2 I . ATTENTION
Frame 1
Fixation
point a II ·
Receptive - -- -
field II I - I
Attended -
location
(a) Attention to effective stimuli
Frame 1
r;;=
.
- I
Attended
location ----...-J_
(b) Attention to ineffective stimuli
Frame 2
.
ON I
Stimuli
OFF
Response of I
V4 neuron when
effective stimuli
are at attended _
location in
receptive field
I - I
.,
Frame 2
Stimuli
ON I
OFF
.
I -
R po"" of I
V4 neuron when
ineffective stimuli
are at attended
location in
receptive field
Hitl
FIGURE 21.1 0
The effect of attention on neurons in visual cortical area V4. The yellow Circle
indicates whether the monkey is attending to (a) the left or (b) the right location in the
receptive field. For this neuron. red bars of light are effective In producing a response and
green bars are ineffective. (Source: Adapted from Moran and Desimone. 1985. p_ 782.)
situation because there were perfectly good "effective" stimuli in the recep-
tive field. Suppose the monkey was then instructed to base its same-different
judgments on the stimuli at the other location in the receptive field (Fig-
ure 21.1Gb). At this location, only green ineffective stimuli were presented.
The response of the neuron should have been the same as before because
exactly the same stimuli were in the receptive field, right? Wrong! Even
though the stimuli were identical, on average the responses of V4 neurons
were less than haU as great when the animal attended to the area in the
neuron's receptive field containing the ineffective stimuli. It's as if the re-
ceptive field contracted around the attended area, decreasing the response
to the effective stimuli at the unattended location.
The location specificity of attention observed in this experiment may be
directly related to that discussed earlier in the human perceptual experiments.
Perceptually, detection is enhanced at attended locations compared to unat-
tended locations. It's not too great a conceptual leap to imagine that the dif-
ference in ease of detection at the attended and unattended locations is based
on the higher activity evoked by effective stimuli at the attended location.
HOW IS ATTENTION DIRECTED?
We have discussed the modulation of neuronal activity in several cortical
areas by attention, and similar effects have been reported in other areas.
But what is directing attention? Are there inputs from "higher structures"
that enhance the responses in parietal cortex, area V4, and other areas
when attention is allocated? At present, there are no clear answers to these
questions. However, evidence suggests that both cortical and subcortical
structures may be involved in modulating the activity of neurons in areas
of sensory cortex. We now look at a couple of the candidate structures that
have been examined.
The Pulvinar Nucleus
One structure that has been studied for its possible role in guiding attention
is the pulvinar nucleus of the thalamus. Several properties make it an
interesting structure. For example, it has reciprocal connections with most
visual cortical areas of the occipital, parietal, and temporal lobes, giving it
the potential to modulate widespread cortical activity (Figure 21.11). Also,
humans with pulvinar lesions respond abnormally slowly to stimuli on the
contralateral side, particularly when there are competing stimuli on the
ipsilateral side. Such a deficit might reflect a reduced ability to focus atten-
tion on objects in the contralateral visual field.
A similar phenomenon has been observed in monkeys. When muscimot
an agonist of the inhibitory neurotransmitter GABA is unilaterally injected
into the pulvinar, the activity of the neurons is suppressed. Behaviorally,
the injection produces difficulty in shifting attention to contralateral stimuli,
which seems similar to the effect of pulvinar lesions in humans. Interest-
ingly, injection of the GABA antagonist bicuculline appears to facilitate
shifting attention to the contralateral side.
There are several problems with the hypothesis that the pulvinar plays a
special role in directing attention. Researchers have found that unilateral
deactivation of the superior colliculus or posterior parietal cortex has be-
havioral effects similar to deactivation of the pulvinar. Also, bilateral pulvinar
lesion9 do not have a large effect on attention, as would be expected if it
were a critical part of an attention system.
Attention and Eye Movements
When something captures our attention, we reflexively move our eyes to the
interesting object. We have seen that a stimulus evokes a greater response
in parietal cortex and other cortical areas if a saccadic eye movement occurs.
Thus, a close association appears to exist between eye movements and at-
tention. Recent experiments suggest that the brain circuitry responsible for
directing the eyes to objects of interest might also playa critical role in
guiding attention.
TIrin Moore and his colleagues, then at Princeton University, examined
a cortical area known as the frontal eye fields (FEF) (Figure 21.12).
There are direct connections between the FEF and numerous areas known
to be influenced by attention, including areas V2, V3, V4, MT, and parietal
cortex. Neurons in the FEF have motor fields. small areas in the visual field.
If a sufficient electrical current is passed into the FEF, the eyes rapidly make
a saccade to the motor field of the stimulated neurons.
In one experiment, Moore et a1. trained monkeys to look at a computer
display that contained numerous small spots of light (Figure 21.13a). They
placed an electrode into the FEF and determined the motor field of the
neurons at the electrode's tip. The animal's task was to fixate on the center
of the visual display but pay attention to one of the spots, the "target" spot,
specified by the experimenter. On each trial. if the target spot dimmed, the
monkey moved a lever with its hand. If the spot did not dim, the monkey
did not move the lever. By varying the light level. the experimenters meas-
ured the minimum light difference or threshold the monkey needed to de-
tect the dimming. The task was made difficult for the monkey by "dis-
tracter" spots that blinked on and off at random times.
. HOW IS ATTENTION DIRECTED! 657
" /
k< I
Thalamus
/ Pulvinar
nucleus
/
J \
.{
( I __
-'::::-".
"
FIGURE 21.11
Pulvinar projections to the cortex.
The pulvinar nucleus is in the posterior thala-
mus. It sends widespread efferents to areas of
cerebral cortex. including areas V I. V2, MT.
parietal cortex. and inferior temporal cortex.
FEF
\
\
FIGURE 21.12
The location of the frontal eye fields
in the macaque brain. FEF are involved
In the production of saccadic eye movements
and may play a role in the guidance of
attention.
658 C HAP T E R 2 I . ATTENTION
Fixation point
\
\
\ \
,
Distracter ,
Motor
field
Target
Lever
(a)
20
:e
1 0
Q) C
(J) .Q
lliJjj
E
"D +:: 0
"D (J)
ora
.c .
gs -5 -10
..c
f-Q)
-20
(b)
Target inside Target outside
motor field motor field
FIGURE 21.13
The effect of FEF stimulation on
perceptual thresholds. (a) A monkey
views spots on a visual display: all spots blink
on and off except for the target spot. The
monkey releases a lever if the target spot
dims. (b) If the target spot is in the motor
field of neurons under study. electrical stimula-
tion In the FEF reduces the threshold light
difference needed to detect that the target
spot dimmed. If the target is outside the
motor field, electrical stimulation slightly in-
creases the threshold. (Source: Adapted from
Moore and Fallah, 200 I, Fig. I.)
FIGURE 21.14
The effect of FEF stimulation on
neuron activity in area V4. (a) A small
electrical current is passed into the FEF while
the activity of a neuron in V4 is recorded. A
stimulus is presented in the V4 receptive field
at time zero. and FEF stimulation occurs after
a delay (b) The V4 response was greater on
trials with FEF stimulation (red) than on trials
without (black). (Source: Adapted from Moore
and Armstrong, 2003, p. 371.)
Unbeknownst to the monkey, on some trials a very small amount of elec-
trical current was passed into the FEF electrode. Importantly, the current
was insufficient to drive the eyes to the motor field, and the animal con-
tinued to look at the centra] fixation point. The aim of the experiment was
to determine whether the small electrical stimulation could enhance the
animal's ability to detect the dimming of the target spot-sort of an artifi-
cial attentional "boost." The results are summarized in Figure 21.13b,
The histogram shows that when the target stimulus was located inside
the motor field, the threshold Ught difference needed to detect dimming of
the target was about 10% less with electrical stimulation than without. The
right side of the histogram in Figure 21.13b shows that performance was
not enhanced, and may actually have been impaired, by electrical stimula-
tion if the target was outside the motor field. As predicted, electrical stim-
ulation in the FEF improved performance in a manner similar to added at-
tention. Moreover, the effect of electrical stimulation was location-specific
just as attentional modulation normally is.
H these results mean that the FEF is part of a system for directing atten-
tion and enhancing visual performance in a location-specific manner, how
might this work? One possibility is that FEF activity indicating the location
of a potential future saccadic eye movement feeds back to the cortical ar-
eas it is connected to, enhancing activity there. Moore's research team
tested this hypothesis by recording in area V4 during electrical stimulation
of the FEE They located electrodes in the two areas so that the motor field
of the neurons in the FEF overlapped the visual receptive fields of the V 4
neurons. Figure 21.14 shows that when the FEF was stimulated (with a
current insufficient to evoke a saccade), the activity in V4 was increased.
Taken together, Moore's experiments suggest that FEF stimulation mimics
both the physiological and behavioral effects of attention. Other scientists
have found similar results with electrical stimulation of the superior col-
ticulus, another structure involved in generating saccadic eye movements.
These findings make a compelling case that the guidance of attention is
integrated with a system used to move the eyes.
CONCLUDING REMARKS
Studies of attention provide a powerful reminder of the flexibility of the
human brain. By allocating more mental energy to one location or feature,
we can enhance our sensitivity or reaction time. At the same time, we ignore
competing stimuli that are of less interest. Reflections of our atttentional
bias can be clearly seen in brain imaging studies. Perhaps most surprising
is the finding that changes in attention are reflected in the receptive field
properties of individual neurons spread across the brain.
FEF stimulation
r
-\
\
V4 recording
r
FEF stimulation
t
I, '. 1..1.. ,j
I
:
u
OJ
'tV 80
<.)
v
>
o
750
(a)
(b)
Time (msec)
... CONCLUDING REMARKS 659
Perhaps you have wondered why we even need attention. After all, if
sensory information successfully makes its way into the brain, why not
process all of it? One possibility is that the brain simply cannot handle all
the incoming sensory information simultaneously. For example, striate
cortex in a macaque monkey occupies about 10% of all cerebral cortex. By
current estimates, there are more than twenty other visual areas, but many
are much smaller than striate cortex. It is likely that these other areas
cannot process all of the detailed information represented in area VI. If this
is true, attention plays a key role in selecting what information should
receive the limited processing resources of the brain. For this reason, some
scientists believe there may a close relationship between attention and the
brain mechanisms of conscious awareness.
'
>-V>
wI:
c::::
w
I-
Introduction
attention (p. 644)
BehavioraJ Consequences
of Attention
neglect syndrome (p.647)
How Is Attention Directed?
pulvinar nucleus (p.657)
frontal eye field (FEF) (p.657)
r:f!!,
V>
w Z
o
>
wI-
c::::v>
w
::>
a
I. What differences are there between the conscious states of a person with negiect syndrome and a split-
brain individual who can only describe things in the right visual field?
2. In what ways is unilateral spatial negiect different from blindness in half of the visual field?
3. How would you use fMRI or PET imaging to look for brain areas involved in directing selective attention in
humans?
4. What neural mechanism(s) could be responsible for the receptive field changes observed in area V4 in re-
sponse to shifts in attention?
5. How are shifts in attention and eye movements related?
6. How might feedback from the frontal eye fields modulate the responses of neurons in visual cortex?
7. How would a system for guiding attention to features differ from a system directing attention to different
locations?
Cd
C::::<..:J
Wz
I-
1-0
c::::<
::>w
u-c::::
Behrmann M, Geng JJ, Shomstein S. 2004. Parietal
cortex and attention. Current Opinion in Neurobiol-
ogy 14:212-217.
Mesulam MM. 1999. Spatial attention and neglect:
parietal, frontal and cingulate contributions to the
mental representation and attentional targeting of
salient extrapersonal events. PhilosoPhical Transac-
tions of the Royal Society of London. Series B: Biologi-
cal Sciences (London) 1387: 1325-1346.
Olfson M. 2004. New options in the pharmacological
management of attention-deficit/hyperactivity
disorder. American journal of Managed Care 10(4
Suppl):S 117-S 124.
Pessoa l, Ungerleider lG. 2004. Neuroimaging studies
of attention and the processing of emotion-laden
stimuli. Progress in Brain Research 144:171-182.
Shipp S. 2004. The brain circuitry of attention. Trends
in Cognitive Science 8:223-230.
Treue S. 2003. Visual attention: the where, what, how
and why of saliency. Current Opinion in Neurobiology
13:428--432.
Mental Illness
INTRODUCTION
MENTAL ILLNESS AND THE BRAIN
PSYCHOSOCIAL APPROACHES TO MENTAL ILLNESS
BIOLOGICAL APPROACHES TO MENTAL ILLNESS
. Box 22.1 Path of Discovery: Neuroscience, Genes, and Mental Illness.
by Steven E. Hyman
ANXIETY DISORDERS
A DESCRIPTION OF ANXIETY DISORDERS
Panic Disorder
Agoraphobia
. Box 22.2 Of Special Interest: Agoraphobia with Panic Attacks
Obsessive-Compulsive Disorder
BIOLOGICAL BASES OF ANXIETY DISORDERS
The Stress Response
Regulation of the HPA Axis by the Amygdala and Hippocampus
TREATMENTS FOR ANXIETY DISORDERS
Psychotherapy
Anxio/ytic Medications
AFFECTIVE DISORDERS
A DESCRIPTION OF AFFECTIVE DISORDERS
Major Depression
Bipolar Disorder
. Box 22.3 Of Special Interest: A Magical Orange Grove in a Nightmare
BIOLOGICAL BASES OF AFFECTIVE DISORDERS
The Monoamine Hypothesis
The Diathesis-Stress Hypothesis
TREATMENTS FOR AFFECTIVE DISORDERS
Electroconvulsive Therapy
Psychotherapy
Antidepressants
Lithium
SCHIZOPHRENIA
A DESCRIPTION OF SCHIZOPHRENIA
BIOLOGICAL BASES OF SCHIZOPHRENIA
Genes and the Environment
The Dopamine Hypothesis
The Glutamate Hypothesis
TREATMENTS FOR SCHIZOPHRENIA
CONCLUDING REMARKS
CHAPTER
662 C HAP T E R 22 . MENTAL ILLNESS
INTRODUCTION
Neurology is a branch of medicine concerned with the diagnosis and treat-
ment of nervous system disorders. We have discussed many neurological
disorders in this book, ranging from multiple sclerosis to aphasia. In addi-
tion to the fact that they are significant and fascinating in their own right,
neurological disorders help iJlustrate the role of physiological processes in
normal brain function-the importance of myelin for action potential con-
duction and the role of the frontal lobe in language, for example.
Psychiatry, on the other hand, has a different focus. This branch of med-
icine is concerned with the diagnosis and treatment of disorders that affect
the mind, or psyche. (In Greek mythology, the beautiful young woman Psy-
che was the personification of the human soul.) Aspects of brain function
that are disturbed by mental illness-our fears, moods, and thoughts-were
once considered to be beyond the reach of neuroscience. But, as we saw in
the earlier chapters of Part III, many higher brain functions have begun to
yield their secrets. Today, there is hope that neuroscience will also solve the
riddle of mental illness.
In this chapter, we discuss some of the most severe and prevalent psy-
chiatric disorders: anxiety disorders, affective disorders, and schizophrenia.
Once again, we will see that a great deal can be learned about the nervous
system by studying what happens when things go wrong.
MENTAL ILLNESS AND THE BRAIN
Human behavior is the product of brain activity, and the brain is the product
of two mutually interacting factors: heredity and environment. Obviously,
one important determinant of your individualism is your complement of
DNA which, unless you have an identical twin, is unique. This means that
physically your brain, like your fingerprint, is different from all others. A
second factor that makes your brain unique is your history of personal ex-
perience. Experiences can include trauma and disease, bur, as we saw in
the case of somatosensory map plasticity (Chapter 12), the sensory environ-
ment itself can leave a permanent mark on the brain. (We'll return to this
theme in Part IV when we discuss development, learning, and memory.)
Thus, despite the gross physical similarities you might share with a genetic
twin, at a fine scale neither your brains nor your behaviors are identical.
To complicate matters further, variations in genetic makeup and past expe-
rience make the brain differentially susceptible to modification by subse-
quent experiences. These genetic and experiential variations, all ultimately
expressed as physical changes in the brain, give rise to the full range of
behaviors exhibited by the human population.
Health and illness are two points along a continuum of bodily function,
and the same can be said for mental health and mental illness. While we
aU have our odd characteristics, the point at which an individual is said to
be "mentally ill" is when the person has a diagnosable disorder of thought,
mood, or behavior that causes distress or impaired functioning. An unfor-
tunate legacy of our past ignorance about brain function is the common
distinction drawn between "physical" and "mental" health. The philosoph-
ical roots of this distinction can be traced to Descartes' proposed separation
of body and mind (see Chapter 1). Disorders of the body (which for Descartes
included the brain) had an organic basis and were the concern of physicians
and medicine. Disorders of the mind, on the other hand, were spiritual or
moral and were the concern of clergymen and religion. The fact that most
disorders of mood, thought. and behavior have. until very recently, re-
mained resistant to biological explanations Or treatments has reinforced this
dichotomy.
Psychosocial Approaches to Mental Illness
An important advance in the secularization of mental illness was the emer-
gence of the medical discipline of psychiatr}', devoted to treating disorders
of human behavior. The Austrian neurologist and ps}'chiatrist Sigmund
Freud (1856-1939) had an enormous impact on the new field, especially
in the United States (Figure 22.l). Freud's theory of psychoanalysis is based
on two major assumptions: (1) that much of mental life is unconscious
(be}'ond awareness), and (2) that past experiences, particularly in childhood,
shape how a person feels and responds throughout life. According to Freud,
mental illness results when the unconscious and conscious elements of the
psyche come into conflict. The way to resolve the conflict, and to treat the
illness, is to help the patient unearth the hidden secrets of the uncon-
scious. Often, these dark secrets are related to incidents (e.g., physical,
mental, or sexual abuse) that occurred during childhood and were sup-
pressed from consciousness.
A different theory of personality, championed by Harvard University
psychologist B. F. Skinner (1904--1990), is based on the assumption that
many behaviors are learned responses to the environment. Behaviorism re-
jects the notions of underlying conflicts and the unconscious and focuses
instead on observable behaviors and their control by the environment. In
Chapter 16, we learned about some of the forces that motivate behavior.
The probability of a type of behavior increases when it satisfies a craving or
produces a pleasurable sensation (positive reinforcement), and it decreases
when the consequences are deemed unpleasant or unsatisfactory (negative
reinforcement). According to this theory, mental disorders ma}' represent
maladaptive behaviors that are learned. Treatment consists of active attempts
to "unlearn" through behavior modification, either b}' introducing new t}'pes
of behavioral reinforcement or by providing an opportunity to observe and
recognize behavioral responses that are appropriate.
Such "psychosocial" approaches to treating mental illness have a sound
neurobiological basis. The brain is structurally modified through learning and
early experience, and these modifications will alter behavioral responses.
Treatment relies on psychotherapy, the use of verbal communication to help
[he patient. Of course, "talk therapy" is not appropriate for all mental dis-
orders, any more than a particular type of antibiotic is appropriate [or all
infections. However, until the recent revolution in biological psychiatry,
variations in ps}'chotherapy were the only tools available to psychiatrists.
Moreover, despite the shift in "blame" away from one's moral character and
toward early childhood experience, psychotherapy contributed to the stigma
that mental illness (in contrast to physical iIIness) could be overcome by
willpower alone. Freud himself recognized the shortcomings of psychother-
apy, stating that the "deficiencies in our [the psychoanal}'tic] description
would probably vanish if we were already in a position to replace the psy-
chological terms by physiological or chemical ones" (1920, p. 54). Now, nearl}'
a century later, neuroscience has advanced to a point where this goal seems
attainable.
Biological Approaches to Mental Illness
A spectacular success in the earl}' biological diagnosis and treatment of
mental illness actually occurred during Freud's time. A major psychiatric
disorder at the turn of the twentieth century was called general paresis of
the insane. and it afflicted 10-15% of all institutionalized psychiatric pa-
tiems. The disorder had a progressive course, starting with symptoms of
mania-excitement, euphoria, and grandiose delusions-and evolved to
cognitive deterioration and, ultimately, paralysis and death. Initially blamed
.... MENTAL ILLNESS AND THE BRAIN 663
.
....
,.
,
'-;
/"
FIGURE 22.1
Sigmund Freud. Freud proposed psycho-
analytical theories of mental illness.
664 C HAP T E R 2 2 . MENTAL ILLNESS
Box 22.1
PATH OF DISCOVERY
..
.. 2 .
Neuroscience, Gel1es,
and Mental Illness
In 1996, I became director of the National Institute of
Mental Health (NIMH), whose mission is performing and
supporting research to eliminate the suffering and disabil-
ity caused by mental illness. Although the term "mental
illness" is an anachronism dating from the era before neu-
roscience, the impact of these disorders is current and
very reat. Depression alone is the leading cause of dis-
ability, and also the leading contributor to suicide world-
wide. These conditions, which include schizophrenia, bipo-
lar disorder, autism, and obsessive-compulsive disorder,
typically begin early in life and take a chronic or relapsing
course. Because menta] illnesses disrupt aspects of cogni-
tion, emotion, and behavior, they impair a person's ability
to learn or to work. Despite their profoundly negative
effects, mental disorders have been misunderstood and
stigmatized, thus exacerbating the suffering of patients
and families and interfering with access to care.
My goal as NIMH director, building on the work of
many, was to bring the investigation of mental illness into
the mainstream of biology and medicine and to help
change the public perception to disorders of the brain
instead of failures of will. The main avenues toward this
goal were neuroscience and genetics. Genetics was par-
ticularly important to the NIMH for two reasons. First,
many mental disorders are strongly influenced by genet-
ics. Second, given the brain's staggering complexity, risk
genes promised a shortcut to discovering underlying dis-
ease mechanisms. But even as the Human Genome Pro-
ject was moving toward a successful conclusion near the
turn of the twenty-first century, significant hurdles ex-
isted. Several linkages of genetic markers to mental dis-
orders were widely reported, rapidly followed by failure
to replicate the findings. Some researchers were ques-
tioning whether the genetic dissection of mental illness
was scientifically feasible.
Compounding these scientific challenges, during the
mid-I 990s, the NIMH became embroiled in controversies
about the application of genetics outside the study of ill-
ness, specifically in research about aggression and criminal
behavior. While students of modern neuroscience may
see human genetics as a critical tool to understanding
brain function and disease, the application of genetics to
human behavior has a very dark past. Between I 907 and
1944, eugenics programs in the United States led to
--'
by Steven E. Hyman
more than 40,000 sterilizations in 30 states of people
who were retarded, mentally ill, or who had exhibited other
behaviors deemed undesirable. Enthusiasm for eugenics
ended only with the recognition of its role in justifying
mass murder in Nazi Germany. Opposition to research on
the genetics of behavior reemerged in the second half of
the twentieth century. Opponents believed that genetic
views of intelligence and of problem behaviors would en-
courage fatalistic determinism in social policy and rein-
force negative stereotypes of some minority groups.
Paradoxically, the same fundamental observation that
could have comforted those who feared a deterministic
genetics of behavior would also frustrate those who hoped
that genetics would speed cures for terrible illnesses.
While genes playa significant role in common behavioral
phenotypes, including mental disorders, these traits ap-
pear to be "genetically complex"; that is, they result from
the interaction of a large number of genes and nongenetic
factors. Single-gene disorders, including disorders of be-
havior, tend to result in severe phenotypes that decrease
reproductive fitness and are thus rare. Simple determinis-
tic models-for example. that "there is an intelligence
gene or a depression gene"-do not seem relevant to
common behavioral phenotypes.
These difficulties reinforce the need for neuroscience
to refine phenotypes and thus to minimize heterogeneity
in genetic studies. Given the relatively small effect of any
particular genes, large numbers of subjects will be required
to achieve the "statistical power" to detect risk alleles. I
thus set a controversial policy that required the investi-
gators we supported (with taxpayer funds) to store DNA
samples (at NIMH expense) along with extensive pheno-
type data and make them available to other investigators
building large data sets or exploiting new technologies. In
addition, the NIMH began to contribute to the develop-
ment of new methodologies for use in the genetic analy-
sis not only of mental disorders but of all genetically
complex diseases.
Whether we succeed in obtaining useful genetic or neu-
robiological information that will inform new understand-
ings and treatments for mental illnesses remains unclear. A
very large number of people are depending on our suc-
cess. Perhaps one of the users of this textbook will join in
this challenging and critically important endeavor.
" ANXIETY DISORDERS 665
on psychological factors, the cause eventually was traced to infection of the
brain with Treponema pallidum, the microorganism that causes syphilis.
Once the cause was established, increasingly effective treatments quickly
followed. By 1910, German microbiologist Paul Ehrlich had established that
the drug arsphenamine could act as a "magic bullet," killing the T. pallidum
in the blood without damaging its human host. Eventually, the antibiotic
penicillin (discovered in 1928 by British microbiologist Alexander Fleming)
was found to be so effective in killing the microorganism that established
brain infections could be completely eradicated. Thus, when penicillin became
widely available, by the end of World War II, a major psychiatric disorder
was virtually eliminated.
A number of other mental illnesses can be traced directly to biological
causes. For example, a dietary deficiency in niacin (a B vitamin) can cause
agitation, impaired reasoning, and depression. The penetration of HIV (the
AIDS virus) into the brain causes progressive cognitive and behavioral
impairments. Recently, a form of obsessive-compulsive disorder (discussed
below) has been linked to an autoimmune response triggered by strepto-
coccal pharyngitis (strep throat) in children. Understanding the causes of
these diseases will lead to treatments and, ultimately, to cures of the asso-
ciated mental disorders (Box 22.1).
Of course, serious mental disorders also occur in wel1-nourished and
infection-free individuals. Although the causes remain to be determined, it
is safe to say that the roots of these disorders lie in altered brain anatomy,
chemistry, and function. Next, we explore the major psychiatric disorders
and see how neuroscience has provided insight about their possible causes
and contributed to their treatment.
... ANXIETY DISORDERS
Fear is an adaptive response to threatening situations. As we learned in
Chapter 18. fear is expressed by the autonomic fight-or-flight response, medi-
ated by the sympathetic division of the autonomic nervous system (ANS) (see
Chapter 15). Many fears are innate and species specific. A mouse does not
need to be taught to fear a cat. But fear is also learned. One touch is usually
all it takes to cause a horse to fear an electric fence. The adaptive value of fear
is obvious. As the old aviation saying goes, "There are old pilots, and there are
bold pilots, but there are no old bold pilots." But fear is not an appropriate or
adaptive response in all circumstances. The inappropriate expression of fear
characterizes anxiety disorders, the most common of psychiatric disorders.
A Description of Anxiety Disorders
It has been estimated that in any given year, more than 15% of Americans
will suffer from one of the recognized anxiety disorders listed in Table
22.1. Although they differ in terms of the real or imagined stimuli that
evoke the anxiety, and the behavioral responses the individual uses to at-
tempt 10 reduce it, these disorders have in common the pathological ex-
pression of fear.
Panic Disorder. Panic attacks are sudden feelings of intense terror that
occur without warning. The symptoms include palpitations, sweating, trem-
bling, shortness of breath, chest pain, nausea, dizziness, tingling sensations,
and chills or blushing. Most people report an overwhelming fear that they
are dying or "going crazy" and flee from the place where the attack begins,
often seeking emergency medical assistance. The attacks are short-lived,
however, usually lasting less than 30 minutes. Panic attacks can occur in
666 C HAP T E R 2 2 . MENTAL ILLNESS
NAME
Table 22.1 Anxiety Disorders
DESCRIPTION
Panic disorder
Agoraphobia
Obsessive-compulsive disorder
Generalized anxiety disorder
Specific phobias
Social phobia
Post-traumatic stress disorder
Frequent panic attacks consisting of discrete periods with the sudden onset of intense
apprehension, fearlulness, or terror, often associated with feelings of impending doom
Anxiety about, or the avoidance of, places or situations from which escape might be
difficult or embarrassing, or in which help may not be available in the event of a panic
attack
Obsessions, which cause marked anxiety or distress, and/or compulsions, which serve
to neutralize anxiety
At least 6 months of persistent and excessive anxiety and worry
Clinically significant anxiety provoked by exposure to a specific feared object or
situation, often leading to avoidance behavior
Clinically significant anxiety provoked by exposure to certain types of social or
perlormance situations, often leading to avoidance behavior
The reexperiencing of an extremely traumatic event, accompanied by symptoms of
increased arousal and the avoidance of stimuli associated with the trauma
Source: Adapted from American Psychiatric Association. 2000.
response to specific stimuli. They may be a feature of a number of anxiety
disorders, bur they can also occur spontaneously.
The condition that psychiatrists call panic disorder is characterized by
recurring, seemingly unprovoked panic attacks, and a persistent worry
about having further attacks. About 2% of the population suffers from
panic disorder, and it is twice as common in women as in men. The onset
of the disorder is most common after adolescence but before the age of 50.
Half of the individuals who have panic disorder will also suffer from major
depression (see below), and 25% of them will become alcoholic or develop
substance-abuse problems.
Agoraphobia. Severe anxiety about being in situations where escape
might be difficult or embarrassing is characteristic of agoraphobia (from
the Greek for "fear of an open marketplace"). The anxiety leads to avoid-
ance of situations irrationally perceived as threatening, such as being alone
outside the home, in a crowd of people, in a car or airplane, or on a bridge
or elevator. Agoraphobia is often one adverse outcome of panic disorder, as
the situation in Box 22.2 describes. About 5% of the population is agora-
phobic, with the incidence among women being twice that of men.
Obsessive-Compulsive Disorder. People with obsessive-compulsive
disorder (OCD) have obsessions, which are recurrent, intrusive thoughts,
images, ideas, or impulses that are perceived as being inappropriate,
grotesque, or forbidden. Common themes are thoughts of contamination
with germs or body fluids, thoughts that the sufferer has unknowingly
caused harm to someone, and violent or sexual impulses. These thoughts
are recognized as being foreign. and they evoke considerable anxiety. People
with OCD also have compulsions, repetitive behaviors or mental acts that are
performed to reduce the anxiety associated with obsessions. Examples are
repeated hand-washing, counting, and checking to make sure that something
is nor our of place.
OCD affects more than 2 % of the population, with an equal incidence
among men and women. The disorder usually appears in young adult life,
and the symptoms fluctuate in response to stress levels.
Box 22.2
... , .
T ANXIETY DISORDERS 667
...,
OF SPECIAL INTEREST
Agoraphobia with Panic Attacks
To appreciate the distress and disruption caused by anxiety
disorders, consider the following case history from Nancy
C. Andreasen's book, The Broken Brain:
Greg Miller is a 27-year-old unmarried computer
programmer. When asked about his main problem,
he replied, "I am afraid to leave my house or drive
my car."
The patient's problems began approximately one
year ago.At that time he was driving across the bridge
that he must traverse every day in order to go to
work. While driving in the midst of the whizzing six-
lane traffic, he began to think (as he often did) about
how awful it would be to have an accident on that
bridge. His small, vulnerable VW convertible could be
crumpled like an aluminum beer can, and he could die
a bloody, painful death or be crippled for life. His car
cou d even hurde over the side of the bridge and
plunge into the river.
As he thought about these possibilities, he began to
feel increasingly tense and anxious. He glanced back
and forth at the cars on either side of him and became
frightened that he might run into one of them. Then he
experienced an overwhelming rush of fear and panic.
His heart started pounding and he felt as if he were
going to suffocate. He began to take deeper and deeper
breaths, but this only increased his sense of suffoca-
tion. His chest felt tight and he wondered if he might
be about to die of a heart attack. He certainly felt that
something dreadful was going to happen to him quite
soon. He stopped his car in the far right lane in order
to try to regain control of his body and his feelings.
Traffic piled up behind with many honking horns, and
drivers pulled around him yelling obscenities. On top
of his terror, he experienced mortification. After about
three minutes, the feeling of panic slowly subsided, and
he was able to proceed across the bridge and go to
work. During the remainder of the day, however, he
worried constantly about whether or not he would be
able to make the return trip home across the bridge
without a recurrence of the same crippling fear.
He managed to do so that day, but during the next
several weeks he would begin to experience anxiety as
he approached the bridge, and on three or four occa-
sions he had a recurrence of the crippling attack of
panic. The panic attacks began to occur more fre-
quently so that he had them daily. By this time he was
overwhelmed with fear and began to stay home from
work, calling in sick each day. He knew that his main
symptom was an irrational fear of driving across the
bridge. but he suspected that he might also have some
type of heart problem. He saw his family doctor, who
found no evidence of any serious medical illness. and
who told him that his main problem was excessive
anxiety. The physician prescribed a tranquilizer for him
and told him to try to return to work.
For the next six months, Greg struggled with his
fear of driving across the bridge. He was usually un-
successful and continued to miss a great deal of work.
Finally, he was put on disability for a few months and
told by the company doctor to seek psychiatric treat-
ment. Greg was reluctant and embarrassed to do this,
and instead he stayed home most of the time, reading
books. listening to records, playing chess on his Apple
computer, and doing various "handy-man" chores
around the house. As long as he stayed home, he had
few problems with anxiety or the dreadful attacks of
panic. But when he tried to drive his car, even to the
nearby shopping center, he would sometimes have
panic attacks. Consequently, he found himself staying
home nearly all the time and soon became essentially
housebound. (Andreasen, 1984, pp. 65-66.)
Biological Bases of Anxiety Disorders
A genetic predisposition has been established for many anxiety disorders,
although the specific genes have not been identified. Other anxiety disorders
appear to be rooted more in the occurrence of stressful life events.
Fear is normally evoked by a threatening stimulus, called a stressor, and
it is manifest by a response known as the stress response. As mentioned
previously, the stimulus-response relationship can be strengthened by expe-
rience (recall the horse and the electric [ence), but it can also be weakened.
Consider, for example, the expert skier who no longer views a precipitous
drop as fearful. A healthy person regulates the stress response through
668 C HAP T E R 22 . MENTAL ILLNESS
learning. The hallmark of anxiety disorders is the occurrence of an inap-
propriate stress response either when a stressor is not present or when it is
nol immediately threatening. Thus, a key to understanding anxiety is to
understand how the stress response is regulated by the brain.
The Stress Response. The stress response is the coordinated reaction to
threatening stimuli. It is characterized by the following:
. Avoidance behavior
. Increased vigilance and arousal
. Activation of the sympathetic division of the ANS
. Release of cortisol from the adrenal glands
It should come as no surprise that the hypothalamus is centrally involved
in orchestrating the appropriate humoral. visceromotor. and somatic motor
responses (see Chapter 16). To get an idea of how this response is regu-
Jated, Jet's focus our attention on the humoral response, which is mediated
by the hypothalamic-pituitary-adrenal (HPA) axis (Figure 22.2).
} \\
(r
I Stress I .
J
\.
(
I
)---'
''''
\ \ \ / ,-
"
\ ,
- ,'\
"'\..
./" ) CAH
" //
Hypothalamus'---/
Anterior /
pituitary ACTH
gland
Adrenal-
gland
\
-- , \
\ \
Physiological
changes
supporting
fight-or-flight
responses
Kidney /./
\
FIGURE 22.2
The hypothalamic-pituitary-adrenal axis. The HPA axis regulates the secretion of
cortisol from the adrenal gland in response to stress. CRH is the chemical messenger
between the paraventricular nucleus of the hypothalamus and the anterior pituitary gland.
ACTH released by the pituitary gland travels in the bloodstream to the adrenal gland lying
atop the kidney. where it stimulates cortisol release. Cortisol contributes to the body's
physiological response to stress.
... ANXIETY DISORDERS 669
As we learned in Chapter 15, the hormone cortisol (a glucocorticoid) is
released from the adrenal cortex in response to an elevation in [he blood
level of adrenocorticotropic hormone (ACTH). ACTH is released by the
anterior pituitary gland in response ro corticotropin-releasing hormone
(CRH). CRH is released into the blood of the portal circulation by parvo-
cellular neurosecretory neurons in the paraventricular nucleus of the hy-
pothalamus. Thus, [his arm of the stress response can be traced back to ac-
tivation of [he CRH-con[aining neurons of the hypo[halamus. Much can be
learned about anxiety disorders by understanding how the activity of these
neurons is regulated. For example, when CRH is overexpressed in geneti-
cally engineered mice, [he animals display increased anxiety-like behaviors.
When [he receptors for CRH are genetically eliminated from mice, they
have less anxiety-like behavior [han normal mice.
Regulation of the HPA Axis by the Amygdala and Hippocampus.
The CRH neurons of the hypothalamus are regula[ed by two S[TUctures
that were introduced in earlier chapters: the amygdala and [he hippocampus
(Figure 22.3). As we learned in Chapter 18, the amygdala is critical to fear
responses. Sensory information enters the basolateral amygdala, where it is
processed and relayed to neurons in the central nucleus. When the central
nucleus of the amygdala becomes active, the stress response ensues (Figure
22.4). Inappropriate activation of [he amygdala, as measured using fMRI
(see Box 7.3), has been associated with some anxiety disorders. Down-
stream from the amygdala is a collection of neurons called the bed nucleus
of the stria terminalis. The bed nucleus neurons activate the HPA axis and the
stress response.
The HPA axis is also regulated by the hippocampus. However, hippocam-
pal activation suppresses, rather than stimulates, CRH release. The hip-
pocampus contains numerous glucocorticoid receptors that respond to
the cortisol released from the adrenal gland in response ro HPA system ac-
tivation. Thus, the hippocampus normally participates in the feedback reg-
ulation of the HPA axis, by inhibiting CRH release (and [he subsequent re-
lease of ACTH and cortisol) when circulating cortisol levels get too high.
Continuous exposure to cortisol, such as during periods of chronic stress,
can cause hippocampal neurons to whither and die in experimental animals
(see Box 15.1). This degeneration of [he hippocampus may set off a vicious
\.. \ \
,-:.
"'- "
',- "'
/
Amygdala
(beneath overlying cortex)
Hippocampus
(beneath overlying cortex)
FIGURE 22.3
The location of the amygdala and hippocampus.
, -Ir;r--.
I [J Sensory
information
1
670 C HAP T E R 2 2 . MENTAL ILLNESS
\
"
Amygdala
Amygdala I
L
Cortisol
FIGURE 22.5
Push-pull regulation of the HPA axis
by the amygdala and hippocampus.
Amygdala activation stimulates the HPA
system and the stress response (green lines).
Hippocampal activation, on the other hand.
suppresses the HPA system (red line). Because
the hippocampus has glucocorticoid receptors
that are sensitive to circuiailng cortisol, It IS
important in the feedback regulation of the
HPA axis in preventing excessive cortisol
release.
Amygdala
"
Stress
response
)r
HPA activation
Hypothalamus --...
Activation of
sympathetic
nervous system
Periaqueductal Avoidance
---..
gray matter behavior
Diffuse
modulatory
systems
---..
Increased
vigilance
L-
/
Basolateral
nuclei
Central
nucleus
FIGURE 22.4
Control of the stress response by the amygdala. The amygdala receives ascending
sensory Information from the thalamus, as well as descending inputs from the neocortex.
This information is integrated by the basolateral nuclei and is relayed to the central nucleus.
Act.ivation of the central nucleus leads to the stress response.
cycle, in which the stress response becomes more pronounced, leading to
even greater cortisol release and more hippocampal damage. Human brain
imaging studies have shown a decrease in the volume of the hippocampus
in some people suffering from post-traumatic stress disorder, an anxiety dis-
order that is triggered by exposure to inescapable stress (see Table 22.1).
To summarize, the amygdala and the hippocampus regulate the HPA axis
and the stress response in a push-pull fashion (Figure 22.5). Anxiety disorders
have been related to both hyperactivity of the amygdala and diminished ac-
tivity of the hippocampus. It is important to keep in mind, however, that
the amygdala and hippocampus both receive highly processed information
£rom the neocortex. Indeed, another consistent finding in humans with
anxiety disorders has been elevated activity of the prefrontal cortex.
to
Treatments for Anxiety Disorders
Several treatments are available for anxiety disorders. In many cases, patients
respond well to psychotherapy and counseling; in other cases, specific med-
ications are preferred.
Psychotherapy. We have seen that there is a strong learning component
to fear, so it should not be surprising that psychotherapy can be an effec-
tive treatment for many of the anxiety disorders. The therapist gradually
increases the exposure of the patient to the stimuli that produce anxiety,
reinforcing the notion that the stimuli are not dangerous. At the neuro-
biological level, the aim of the psychotherapy is to alter connections in
the brain such that the real or imagined stimuli no longer evoke the stress
response.
Anxiolytic Medications. Medications that reduce anxiety are described
as anxiolytic drugs, and they act by altering chemical synaptic transmis-
sion in the brain. The major classes of drugs currently used in the treatment
of anxiety disorders are benzodiazepines and serotonin-selective reuptake
inhibitors.
Recall that GABA is an important inhibitory neurotransmitter in the
brain. GABA A receptors are GAB A-gated chloride channels that mediate
fast IPSPs (see Chapter 6). The proper action of GABA is critical to the
proper functioning of the brain: Too much inhibition results in coma, and
too little results in seizures. In addition to its GABA binding site, the GABA A
receptor contains sites where chemicals can act to powerfully modulate
channel function. Benzodiazepines bind to one of these sites and act to
make GABA much more effective in opening the channel and producing
inhibition (Figure 22.6). The site on the receptor that binds benzodiazepines
is believed to be used normally by a naturally occurring brain chemicaL al-
though the identity of the endogenous molecule has not been established.
Benzodiazepines, of which Valium (diazepam) is perhaps the most well
known, are highly effective treatments for acute anxiety. Indeed, virtually
all drugs that stimulate GABA actions are anxiolytic including the popular
type of alcohot ethanol. A reduction in anxiety is likely to explain, at least
in part the widespread social use of alcohol. The anxiolytic effects of alcohol
are also an obvious reason that anxiety disorders and alcohol abuse often
go hand-in-hand.
We may infer that the calming actions of benzodiazepines are due to
the suppression of activity in the brain circuits used in the stress response.
Benzodiazepine treatment might be required [0 restore normal function to
these circuits. Indeed, a study of patients with panic disorder using positron
emission tomography (PET) imaging (see Box 7.3) demonstrated that the
number of benzodiazepine binding sites was reduced in regions of frontal
cortex that show hyperactive responsiveness during anxiety (Figure 22.7).
These results are promising, not only because they might reveal the sites of
benzodiazepine action in the brain, but also because they suggest that an al-
teration in the endogenous regulation of GABA receptors is a cause of the
anxiety disorder.
Serotonin-selective reuptake inhibitors (SSRIs), of which Prozac
(f1uoxetine) is the best known, are widely used in the treatment of mood
disorders, as we discuss in a moment. However. SSRIs are also highly ef-
fective for treating anxiety disorders, notably including OCD. Recall that
J,j
.
.n
.
..
.. 'hi.
If
,.
.
"
t.
FIGURE 22.7
Diminished binding of radioactive benzodiazepine in a patient with panic
disorder. PET scans in the horizontal plane of the brain of a healthy person (left) and the
brain of a person suffenng from panic disorder (nght). The color-coding indicates the number
of benzodiazepine binding sites in the brain (hot colors indicate more; cool colors indicate
fewer). The frontal cortex, at the top of the scan, shows far fewer binding sites in the
,ndividual with panic disorder. (Source: Malizia et aI., 1998, Fig. I.)
... ANXIETY DISORDERS 671
GABA
BMZOd;azepiOO.., 1
Ethanol
........... .....
nfii'1'n'n'rrn'n'n'n'n'n-n n'
II U.U.II,U,U,u velltv v.u V U U
t i... ..,
. . . , . , . . . . . . ...
nnnnnnr n
,\JaI!i. Ue.V.U Uti! VI
..-.. ...
/
GABA-gated CI- channel
(GABA A receptor)
FIGURE 22.6
The action of benzodiazepine. Benzodi-
azepines bind to a site on the GABA A recep-
tor that makes it much more responsive to
GAB A. the major inhibitory neurotransmitter
in the forebrain. A different site can bind
ethanol and also make the receptor more
responsive to GABA.
672 C HAP T E R 22 . MENTAL ILLNESS
Serotonin system
Norepinephrine system
Neocortex
\ ,\..--
"\--
Thalamus
Neocortex
\
.........
/ Thalamus
(
/'
/
Hypothalamus/ /
Temporallobe /
Locus coeruleus
Cerebellum
To spinal cord
To spinal cord
FIGURE 22.8
The diffuse modulatory systems implicated in affective disorders.
serotonin is released throughout the brain by a diffuse modulatory system
originating in the raphe nuclei of the brain stem (Figure 22.8). The actions
of serotonin are mediated primarily by G-protein-coupled receptors and are
terminated by reuptake. via serotonin transporter proteins, into the axon
terminal. Thus, as the name implies, SSRIs act to prolong the actions of
released serotonin at their receptors by inhibiting reuptake. In a recent
study, the presence in some families of a rare mutation in the serotonin
transporter gene was associated with a high incidence of OCD, further
implicating serotonin in the origins of this disease.
Unlike the benzodiazepines, however, the anxiolytic actions of the SSRIs
are not immediate. Therapeutic effects develop slowly, over a period of
weeks, in response to regular daily dosing. This finding means that the
immediate rise in extracellular serotonin caused by the SSRI is not respon-
sible for the anxiolytic effect. Rather, the effect appears to be due to an
adaptation of the nervous system to chronically elevated brain serotonin,
via some structural or functional change that is not understood. We return
to a discussion of the actions of SSRIs when we discuss depression later in
this chapter. However, it is very interesting in the context of anxiety dis-
orders that one adaptive response to SSRIs is an increase in the glucocor-
ticoid receptors in the hippocampus. SSRIs might act to dampen anxiety by
enhancing the feedback regulation of the CRR neurons in the hypothal-
amus (see Figure 22.5).
Although benzodiazepines and SSRIs have proven to be effective in
treating a wide variety of anxiety disorders, novel drugs are now being de-
veloped based on our new understanding of the stress response. One very
promising drug target is the receptors for CRH. Not only is CRH used by
hypothalamic neurons to control ACTH release [rom the pituitary, it is also
used as a neurotransmitter in some of the central circuits involved in the
stress response. For example. some neurons of the central nucleus of the
amygdala contain CRR and injections of CRH into the brain can produce
the full-blown stress response and signs of anxiety. Thus, there is hope that
antagonists of CRH receptors will be useful for the treatment of anxiety
disorders.
'Y AFFECTIVE DISORDERS 673
T AFFECTIVE DISORDERS
Affect is the medical term for emotional state or mood. Affective disor-
ders, also known as mood disorders, are characterized by disordered emo-
tions. In a given year, more than 7% of the population will suffer from one
of the mood disorders.
A Description of Affective Disorders
An occasional, brief feeling of depression-getting "the blues" -is a common
response to life's events, such as suffering a loss or disappointment, and we
can hardly call this a disorder. However, the affective disorder that psychia-
trists and psychologists call depression is something more prolonged and
much more severe, characterized by a feeling that one's emotional state is
no longer under one's control. It can occur suddenly, often without obvi-
ous external cause, and if left untreated, it usually lasts 4-12 months.
Depression is a serious disease. It is a main precipitating cause of suicide,
which claims more than 30,000 lives each year in the United States. De-
pression is also widespread. Perhaps as many as 20% of the population will
suffer a major, incapacitating episode of depression during their lifetime. In
a subset of patients with bipolar disorder, bouts of depression are punctu-
ated with emotional highs that can also be highly disruptive.
Major Depression. The mental illness known as major depression is the
most common mood disorder, affecting 5 % of the population every year.
The cardinal symptoms are lowered mood and decreased interest or pleas-
ure in all activities. For a diagnosis of major depression, these symptoms
must be present every day for a period of at least 2 weeks and not be ob-
viously related to bereavement. Other symptoms also occur, including:
. Loss of appetite (or increased appetite)
. Insomnia (or hypersomnia)
. Fatigue
. Feelings of worthlessness and guilt
. A diminished ability to concentrate
. Recurrent thoughts of death
Episodes of major depression usually don't last longer than 2 years, al-
though the disease has a chronic, unremitting course in about 17% of pa-
tients. Without treatment, however, depressions will recur in 50% of cases,
and after three or more episodes, the odds of recurrence increase to more
than 70%. Another expression of depression, afflicting 2% of the adult
population, is called dysthymia. Although milder than major depression,
dysthymia has a chronic, "smoldering" course, and it seldom disappears
spontaneously. Major depression and dysthymia are twice as common in
women as men.
Bipolar Disorder. Like major depression, bipolar di,sorder is a recurrent
mood disorder. It consists of repeated episodes of mania, or mixed episodes
of mania and depression, and therefore is also called manic-depressive disor-
der. Mania (derived from a French word meaning "crazed" or "frenzied")
is a distinct period of abnormally and persistently elevated, expansive, or
irritable mood. During the manic phase, other common symptoms include:
. Inflated self-esteem or grandiosity
. A decreased need for sleep
. Increased talkativeness or feelings of pressure to keep talking
674 CHAPTER 22 . MENTAL ILLNESS
. Flight of ideas, or a subjective experience that thoughts are racing
. Distractibility
. Increased goal-directed activity
Another symptom is impaired judgment. Spending sprees, offensive or dis-
inhibited behavior. promiscuity, or other reckless behaviors are common.
According to current diagnostic criteria, there are two types of bipolar
disorder. Type I bipolar disorder is characterized by the manic episodes just
described (with or without incidents of major depression) and occurs in
about 1 % of the population, equally among men and women. Type II
bipolar disorder, affecting about 0.6% of the population, is characterized by
hypomania, a milder form of mania that is not associated with marked im-
pairments in judgment or performance. Indeed, hypomania in some may
take the form of a marked increase in efficiency, accomplishment, or cre-
ativity (Box 22.3). However, type II bipolar disorder is also always associ-
ated with episodes of major depression. When hypomania alternates with
periods of depression that are not severe enough to warrant the description
"major" (i.e., fewer symptoms and shorter duration). the disorder is called
cyclothymia.
Biological Bases of Affective Disorders
Like most other mental illnesses, affective disorders reflect the altered func-
tioning of many parts of the brain at the same time. How else can we explain
the coexistence of symptoms ranging from eating and sleeping disorders to
a loss of the ability to concentrate? For this reason, research has focused on
the role of the diffuse modulatory systems, with their wide reach and diverse
effects. However. in the last few years, disruption of the HPA system has
also been implicated as playing an important role in depression. Let's take
a closer look at the neurobiology of mood disorders.
The Monoamine Hypothesis. The first real indication that depression
might result from a problem with the central diffuse modulatory systems
came in the 1960s. A drug called reserpine, introduced to control high
blood pressure, caused psychotic depression in about 20% of cases. Reser-
pine depletes central catecholamines and serotonin by interfering with
their loading into synaptic vesicles. Another class of drugs introduced to
treat tuberculosis caused a marked elevation in mood. These drugs inhibit
monoamine oxidase (MAD), the enzyme that destroys catecholamines and
serotonin. Another piece of the puzzle fell into place when neuroscientists
recognized that the drug imipramine, introduced some years earlier as an
antidepressant, inhibits the reuptake of released serotonin and norepi-
nephrine, thus promoting their action in the synaptic cleft. As a result of
these observations, researchers developed the hypothesis that mood is
closely tied to the levels of released "monoamine" neurotransmitters-nor-
epinephrine (NE) and/or serotonin (5-HT)-in the brain. According to this
idea, called the monoamine hypothesis of mood disorders, depression
is a consequence of a deficit in one of these diffuse modulatory systems (see
Figure 22.8). Indeed, as we will see in a moment, many of the modem drug
treatments for depression have in common enhanced neurotransmission
at central serotonergic and/or noradrenergic synapses.
A direct correlation between mood and modulator, however, is too
simplistic. Perhaps the most striking problem is the clinical finding that the
antidepressant action of all of these drugs takes several weeks to develop.
even though they have almost immediate effects on transmission at the
Box 22.3
.... , .
OF SPECIAL INTEREST
I ...
...
-
'Y AFFECTIVE DISORDERS 675
A Magical Orange Grove in a Nightmare
Winston Churchill called it his "black dog.'" The writer
F. Scott Fitzgerald often found himself"... hating the night
when I couldn't sleep and hating the day because it went
toward night."2 It was the most "terrible of all the evils of
existence" for (he composer Hector Berlioz. 3 They were
speaking of their lifelong bouts with depression. From the
Scottish poet Robert Burns to the American grunge
rocker Kurt Cobain, extraordinarily creative people have
suffered inordinately from affective disorders. Biographical
studies of accomplished artists have been consistent and
alarming; their estimated rates of major depression are
about 10 times higher than in the general population, and
rates of bipolar disorder may be up to 30 times higher.
Many artists have eloquently described their misfortunes.
But can mood disorders actually reinforce great talent
and creative productivity? Certainly most people with
mood disorders are not artistic or unusually imaginative,
and most artists are not manic-depressive. However, artists
with bipolar disorders can sometimes draw vigor and in-
spiration from their condition. Edgar Allan Poe wrote of
his cycles of depression and mania, "I am excessively sloth-
ful, and wonderfully industrious-by fits."4 The poet
Michael Drayton mused about "that fine madness . . .
which rightly should possess a poet's brain."5 Studies have
suggested that hypomania can heighten certain cognitive
processes, increase original and idiosyncratic thought, and
even enhance linguistic skills. Manic states can also reduce
the need for sleep, foster intense and obsessive concen-
tration, create unmitigated self-confidence, and eliminate
concern for social norms-just what you need, perhaps.
to push the envelope of artistic creativity.
The poet's madness is much more often a scourge than
an inspiration. For Robert Lowell, manic experiences were
"a magical orange grove in a nightmare."6 Virginia Woolf's
I Quoted in Ludwig AM. 1995. The Price of Greatness: Resolving
the Creativity and Madness Controversy. New York: Guilford Press,
p.174.
2 F. Scott Fitzgerald. 1956. The Crack-Up. In The Crack-Up and
Other Stories. New York: New Directions, pp. 69-75.
J Hector Berlioz. f 970. The Memoirs of Hector Berlioz, trans.
David Cairns. St.Albans, England: Granada, p. 142.
4 Edgar Allan Poe. 1948. Letter to James Russell Lowell, June 2,
1844. In The Letters of Edgar Allan Poe, Vol. I, ed. John Wand Os-
trom. Cambridge, MA: Harvard University Press, p. 256.
5 Michael Drayton. 1753. "To my dearly beloved Friend. Henry
Reynolds, Esq.; of Poets and Poesy," lines 109-110, The Works of
Michael Drayton, Esq., vol,. 4, London: W Reeve.
6 Ian Hamilton. 1982. Robert Lowell: A Biography. New York: Ran-
dom House, p. 228.
UJ
C
0,
:;::;
'iij
o
a.
E
o
()
'0
27 compositions_
9 comps.
f
t
rt;.0",
n . <J-
0
0":J
l"
t t t t t
. .o '"v
t;;'f>.t;) f<> t;;' if!:I
f' ....qj 0....qj ....qj $-0,p o
X' o 00 o O . 0° b 'lj
?$ 1,.0?$ ?$ ...0'.0
o N. 0 o ,:> 0 <:;)"
,;f 00 o \!;?0
FIGURE A
Schumann's output of musical composition. (Source: Adapted
from Slater and Meyer. 1959.)
husband described how "she talked almost without stop-
ping for two or three days, paying no attention to anyone
in the room or anything said to her.'>7 It is hard to over-
state the depths of melancholy that can accompany major
depression. The suicide rate among accomplished poets is
said to be 5 to 18 times higher than in the general pop-
ulation. Poet John Keats once wrote desperately, "I am in
that temper that if I were under water I would scarcely
kick to come to the top."a But when Keats' mood pitched
the other way, he wrote most of his best poetry during a
9-month period in 1.819, before dying of tuberculosis at
age 25. Figure A shows how Robert Schumann's wildly
fluctuating output of musical compositions coincided with
the oscillations of his manic-depressive episodes.
The psychiatrist Kay Redfield Jamison has suggested
that "depression is a view of the world through a dark
glass, and mania is that seen through a kaleidoscope-
often brilliant but fractured." 9 Today, we are lucky to have
effective treatments for both conditions, for the dark glass
and the kaleidoscope carry a heavy price.
7 Leonard Woolf. 1964. Beginning Again.'An Autobiography of the Years
1911 to 1918. New York: HarcolJrt Brace, pp. 172-/73.
B Quoted by Kay Jamison in a presentation at the Depression
and Related Affective Disorders AssociationlJohns Hopkins
Symposium, Baltimore, Maryland, April 1997.
9 Jamison KR. Manic-depressive illness and creativity. Scientifrc
American 272:62-67.
676 CHAPTER 22 . MENTAL ILLNESS
modulatory synapses. Another concern is that other drugs that raise NE
levels in the synaptic cleft, like cocaine, are not effective as antidepressants.
A new hypothesis is that the effective drugs promote long-term adaptive
changes in the brain, involving alterations in gene expression, that alleviate
the depression. One adaptation occurs in the HPA axis, which, as we dis-
cuss next, has also been implicated in mood disorders.
The Diathesis-Stress Hypothesis. Evidence clearly indicates that mood
disorders run in families and that our genes predispose us to this type of
mental illness. The medical term for a predisposition for a certain disease is
diathesis. However, researchers have also established that early childhood
abuse or neglect, and other stresses of life, are important risk factors in the
development of mood disorders in adults. In an attempt to synthesize these
findings, Charles Nemeroff and his coBeagues at Emory University pro-
posed the diathesis-stress hypothesis of mood disorders. According to
this idea, the HPA axis is the main site where genetic and environmental
influences converge to cause mood disorders.
As we have seen, exaggerated activity of the HPA system is associated
with anxiety disorders. However, anxiety and depression often coexist (in
fact, this "comorbidity" is the rule rather than the exception). Indeed, one
of the most robust findings in all of biological psychiatry is hyperactivity of
the HPA axis in severely depressed patients: Blood cortisol levels are ele-
vated, as is the concentration of CRH in the cerebrospinal fluid. Could this
hyperactive HPA system, and the resulting deleterious effects on brain
function, be the cause of depression? Animal studies are highly suggestive.
Injected CRH into the brains of animals produces behavioral effects that
are similar to those of major depression: insomnia, decreased appetite, de-
creased interest in sex, and, of course, an increased behavioral expression
of anxiety.
Recall that the activation of the hippocampal glucocorticoid receptors by
cortisol normally leads to feedback inhibition of the HPA axis (see Figure
22.5). In depressed patients, this feedback is disrupted, explaining why HPA
function is hyperactive. A molecular basis for the diminished hippocampal
response to cortisol is a decreased number of glucocorticoid receptors. What
regulates glucocorticoid receptor number? In a fascinating parallel with the
factors implicated in mood disorders, the answer is genes, monoamines,
and early childhood experience.
Glucocorticoid receptors, like all proteins, are the product of gene expres-
sion. In rats, it has been shown that the amount of glucocorticoid receptor
gene expression is regulated by early sensory experience. Rats that received
a lot of maternal care as pups express more glucocorticoid receptors in their
hippocampus, less CRH in their hypothalamus, and reduced anxiety as
adults. The maternal influence can be replaced by increasing the tactile
stimulation of the pups. Tactile stimulation activates the ascending sero-
tonergic inputs to the hippocampus, and the serotonin triggers a long-
lasting increase in the expression of the glucocorticoid receptor gene. More
glucocorticoid receptors equip the animal to respond to stressors as adults.
However, the beneficial effect of experience is restricted to a critical period
of early postnatal life; stimulation of the rats as adults does not have the
same effect.
Childhood abuse and neglect. in addition to genetic factors, are known
to put people at risk for developing mood and anxiety disorders, and these
animal findings suggest one cause. Elevations in brain CRR. and decreased
feedback inhibition of the HPA system, may make the brain especially vul-
nerable to depression.
... AFFECTIVE DISORDERS 677
Treatments for Affective Disorders
Mood disorders are very common, and the burden they impose on human
health, happiness. and productivity is enormous. Fortunately, a number of
helpful treatments are available.
Electroconvulsive Therapy. It might surprise you to learn that one of the
most effective treatments for depression and mania involves inducing
seizure activity in the temporal lobes. In electroconvulsive therapy
(ECT), electrical currents are passed between two electrodes placed on the
scalp. Localized electrical stimulation triggers seizure discharges in the
brain, but the patient is given anesthesia and muscle relaxants to prevent
violent movements during treatment. An advantage of ECT is that relief
can occur quickly, sometimes after the first treatment session. This attrib-
ute of ECT is especially important in cases where suicide risk is high. An
adverse effect of ECT, however, is memory loss. As we will see in Chapter
24, temporal lobe structures (including the hippocampus) playa vital role
in memory. ECT usually disrupts memories for events that occurred before
treatment, extending back 6 months, on average. In addition, ECT can tem-
porarily impair the storage of new information.
The mechanism by which ECT relieves depression is unknown. However.
as mentioned above, one temporal lobe structure affected by ECT is the
hippocampus, which we have seen is involved in regulating CRH and the
HPA axis.
Psychotherapy. Psychotherapy can be effective in treating mild to moder-
ate cases of depression. The main goal of psychotherapy is to help depressed
patients overcome negative views of themselves and their furure. The
neurobiological basis of the treatment has not been established, although
we can infer that it relates to establishing cognitive, neocortical control over
the activity patterns in disturbed circuits.
Antidepressants. A number of highly effective pharmacological treat-
ments are available for mood disorders. The most popular antidepressant
drugs are (1) tricyclic compounds (named for their chemical structure),
such as imipramine, which block the reuptake of both NE and 5-HT by
transporters; (2) SSRIs, such as fJuoxetine, which act only on 5-HT termi-
nals; (3) NE-selective reuptake inhibitors, such as reboxetine; and (4) MAG
inhibitors, such as phenelzine, which reduce the enzymatic degradation of
5-HT and NE (Figure 22.9). All of these drugs elevate the levels of
monoamine neurotransmitters in the brain; however, as mentioned, their
therapeutic actions take weeks to develop.
The adaptive response in the brain for the clinical effectiveness of these
drugs has not been established with certainty. Nonetheless, an intriguing
finding is that clinically effective treatment with antidepressants dampens
the hyperactivity of the HPA system in humans. Animal studies suggest that
this effect may be due, in part, to increased glucocorticoid receptor expression
in the hippocampus, which occurs in response to a long-term elevation in
serotonin. Recall that CRH plays a crucial role in the stress response of the
HPA axis. New dmgs that act as CRH receptor antagonists are currently under
development and testing, and some have shown promise as antidepressants
in clinical trials. Recent research has also shown that prolonged treatment
with SSRIs increases neurogenesis, the proliferation of new neurons, in the
hippocampus. Remarkably, this proliferation may be important for the
beneficial behavioral effects of SSRIs, although the reason is unknown.
678 C HAP T E R 22 . MENTAL ILLNESS
/
/
(
I
;(
Tricyclics I /
i/
.
. . : ..
:o o::
00 0
00 0
o 00
NE
/
Transporter _______ \
/
_.[ r
)
/
Fluoxetine
Activates presynaptic
and postsynaptic receptors
Activates presynaptic
and postsynaptic receptors
Breakdown
products
FIGURE 22.9
Antidepressant drugs and the biochemical life cycles of norepinephrine and
serotonin. MAG inhibitors. tricyclics. and SSRls are used as antidepressants. MAG inhibitors
enhance the actions of NE and 5-I-H by preventing their enzymatic destruction. T ricyclics
enhance NE and 5-I-H action by blocking uptake. SSRls act the same way but are selective
for serotonin.
Lithium. By now, you probably have formed the (correct) impression that,
until recently, most treatments for psychiatric disorders were discovered
virtually by chance. For example, ECT was introduced initiaHy in the 1930s
as a treatment of last resort for psychotic behavior. based on the mistaken
belief that epilepsy and schizophrenia could not coexist in the same person.
Only later was it shown to be an effective treatment for major depression,
for reasons that still remain unknown.
"Enlightened serendipity" was again at work in the discovery of a highly
effective treatment for bipolar disorder. Working in the 1940s, Australian
psychiatrist John Cade was searching for psychoactive substances in the
urine of manic patients. He injected guinea pigs with urine or urinary
constituents and observed their behavioral effects. Cade wanted to test
the effect of uric acid, but he had difficulty getting it into solution. In-
stead, he used lithium urate because it dissolved easily and was readily
available in the pharmacy. He observed, quite unexpectedly, that this
treatment calmed the guinea pigs (he predicted the opposite effect). Because
other lithium salts also produced the behavioral effect, he concluded that
it was the lithium, not a constituent of urine, that was responsible. He
went on to test lithium treatment on patients with mania-and, amaz-
ingly, it worked. Subsequent studies showed that lithium is highly effec-
tive in stabilizing the mood of patients with bipolar disorder, by prevent-
ing not only the recurrence of mania but also the episodes of depression
(Figure 22.10).
'" SCHIZOPHRENIA 6 79
1962
1963
1964
1965
. . .
. ... .- . . .
.. .. - .
. - - .
Mania
Depression
Lithium administration
FIGURE 22.10
The mood-stabilizing effect of lithium therapy in five patients. By 1965, after
5 years of treatment. lithium effectively stopped manic-depressive episodes in all five cases.
(Source: Adapted from Barondes. 1993. p. 139.)
Lithium affects neurons in many ways. In solution, it is a monovalent
cation that passes freely through neuronal sodium channels. Inside the
neuron, lithium prevents the normal turnover of phosphatidyl inositol
(PIP 2 ), a precursor for important second messenger molecules that are
generated in response to activation of some G-protein-coupled neurotrans-
mitter receptors (see Chapter 6). Lithium also interferes with the actions of
adenylyl cyclase, essential for the generation of the second messenger
cAMp, and glycogen synthase kinase, a critical enzyme in cellular energy
metabolism. Why lithium is such an effective treatment for bipolar disor-
der. however, remains completely unknown. Like other antidepressants, the
therapeutic effects of lithium require long-term use. The answer, again, ap-
pears to lie in an adaptive change in the CNS, but the nature of this change
remains to be determined.
"Y SCHIZOPHRENIA
Although their severity might be hard to fully comprehend, we all have
some idea of what mood and anxiety disorders are like, because they are
extremes in the spectrum of brain states that are part of normal experience.
The same cannot be said for schizophrenia. This severe mental disorder dis-
tnrts thoughts and perceptions in ways that healthy people find difficult to
understand. Schizophrenia is a major public health problem, affecting 1%
of the population. More than 2 million people suffer from the disorder in
the United States alone.
A Description of Schizophrenia
Schizophrenia is characterized by a loss of contact with reality, and a
disruption of thought. perception, mood, and movement. The disorder
typically becomes apparent during adolescence or early adulthood, and
usually persists for life. The name, introduced in 1911 by Swiss psychia-
trist Eugen Bleuler. roughly means "divided mind:' because of his obser-
vation that many patients seemed to oscillate between normal and abnor-
mal states. However, there are many variations in the manifestations of
schizophrenia, including those that show a steadily deteriorating course.
Indeed, it is still not clear whether what is called schizophrenia is a single
disease or several.
680 C HAP T E R 2 2 . MENTAL ILLNESS
The symptoms of schizophrenia fall into two categories: positive and
negative. Positive symptoms reflect the presence of abnormal thoughts and
behaviors, such as:
. Delusions
. Hallucinations
. Disorganized speech
. Grossly disorganized or catatonic behavior
Negative symptoms reflect the absence of responses that are normally present.
These symptoms include:
. Reduced expression of emotion
. Poverty of speech
. Difficulty in initiating goal-directed behavior
. Memory impairment
According to current diagnostic criteria, schi ophrenia is classified into a
number of types, based on the constellation of prominent symptoms that
are present. Paranoid schizophrenia is characterized by a preoccupation with
delusions organized around a theme; for example, patients beJieve that
powerful adversaries are out to get them. These are often accompanied by
auditory hallucinations (such as hearing imaginary voices) related to the
same delusional theme. Of aU patients with schizophrenia, those with the
paranoid type have the best chance of rehabilitation.
The outlook is less optimistic in cases of disorganized schizophrenia. The
characteristics include a lack of emotional expression (caned a "flat affect"),
coupled with disorganized behavior and incoherent speech. The speech may
be accompanied by silliness and laughter that appear to have no relation to
what is being said. This form of schizophrenia has a steadily worsening
course, without significanL remissions. A third common type is called cata-
tonic schizophrenia, characterized by peculiarities of voluntary movement,
such as immobility and stupor (catatonia), bizarre posturing and grimacing,
and senseless, parrot-like repetition of words or phrases.
Biological Bases of Schizophrenia
Understanding the neurobiological basis for schizophrenia represents one
of the greatest challenges of neuroscience, because the disorder affects
many of the characteristics that make us human: thought, perception, self-
awareness. Although considerable progress has been made, we stiJI have
much more to learn.
Genes and the Environment. Schizophrenia runs in families. As shown
in Figure 22.11, the likelihood of having the disorder varies in relation to
the number of genes that are shared with an affected family member. If
your identical twin has schizophrenia, the probability is about 50% that
you will also have it. The chances you will have the disease decline as the
number of genes you share with an affected family member decreases.
These findings argue that schizophrenia is primarily a genetic disorder.
Recently, researchers have identified several specific genes that seem to
increase susceptibility to schizophrenia. Nearly an of these genes have impor-
tant roles in synaptic transmission, its plasticity, or the growth of synapses.
Remember, however, that identical twins have exactly the same genes.
So why, in 50% of cases, is one sibling spared when the other has schizo-
phrenia? The answer must lie in the environment. In other words, faulty
Genes shared
General population
17.5% First cousins
(third-degree
relatives) Uncles, aunts
2%
2%
25% Nephews, nieces
(second-degree
relatives) Grandchildren
50%
(first-degree
relatives)
100%
4%
5%
Half-siblings 6%
Parents 6%
Siblings l
Children l
Fraternal twins
9%
13%
17%
Identical twins
48%
o 10 20 30 40 50
Lifetime risk of developing schizophrenia (%)
FIGURE 22.11
The familial nature of schizophrenia. The risk of developing schizophrenia increases
with the number of shared genes. suggesting a genetic basis for the disease. (Source:
Adapted from Gottesman, 1991, p. 96.)
genes seem to make some people vulnerable to environmental {actors that
cause schizophrenia. Although the symptoms may not appear until a person
reaches his twenties, considerable evidence indicates that the biological
changes causing the condition begin early in development perhaps prenatally.
Viral infections during {etal and infant development have been implicated
as possible causes, as has poor maternal nutrition. In addition, environ-
mental stresses throughout life are known to exacerbate the course of the
disorder. At present, however, neither the identity of the genes nor the ex-
act environmental factors important for schizophrenia have been identified.
Schizophrenia is associated with physical changes in the brain. An inter-
esting example appears in Figure 22.12. The figure shows brain scans of
identical twins, one with schizophrenia and one without. Normally the
structures of the brains of identical twins are nearly identical. However, in
this case, the brain of the schizophrenic sibling shows enlarged lateral
ventricles, which reflects the shrinkage of brain tissue around them. This
difference is consistent when large numbers of people are sampled; the
brains o{ schizophrenics have, on average, a significantly larger ventricle-
to-brain-size ratio than people who do not have the disorder.
Such pronounced structural changes are not always apparent in the
brains of schizophrenics. Important physical changes in their brains also
occur in the microscropic structure and function of cortical connections.
For example, schizophrenics often have defects in the myelin sheaths sur-
rounding axons in their cerebral cortex, although it is not clear whether
this is a cause or consequence of the disease. Another common finding in
the cortex of schizophrenics is abnormal clusters of neurons. Changes in
synapses and several neurotransmitter systems have also been implicated
in schizophrenia. As we'll see next, particular attention has focused on
alterations in chemical synaptic transmission mediated by dopamine and
glutamate.
... SCHIZOPHRENIA 681
...
.
r;" I
A ..
.
.... -
. 1
.
1
) ...... ... (I
. .
\ . 1
1
1
""' .
"
\
I
.
,
. .. & ..
.
"
,
..
..
FIGURE 22.12
Enlarged lateral ventricles in schizo-
phrenia. These MRI scans are from the
brains of identical twins. The sibling on the
left was normal; the one on the right was
diagnosed with schizophrenia. Notice the
enlarged lateral ventricles in the schizophrenic
sibling. indicating a loss of brain tissue. (Source:
Barondes, 1993, p. 153.)
682 C HAP T E R 22 . MENTAL ILLNESS
Striatum
\ /
/1
\
Substantia
nigra
,
/
"i.-.
/
/
),
,
,
\\'J
--r/ J' "
"
/
/\
Ventral tegmental area
FIGURE 22.13
The dopaminergic diffuse modulatory systems of the brain. The mesocorLlcolimbic
dopamine system arises in the ventral tegmental area and has been implicated in the C<luse
of schizophrenia. A second dopaminergic system arises from the substantia nigra and IS In-
volved in the control of voluntary movement by the stnatum.
The Dopamine Hypothesis. Recall that dopamine is the neurotransmit-
ter used by another of the diffme modulatory systems (Figure 22.13). A
link between the mesocorticolimbic dopamine system and schizophrenia has been
made on the basis of two main observations. The first relates to the effects of
amphetamine in otherwise healthy people. Remember (rom our disCllssion
in Chapter 15 that amphetamine enhances neurotransmission at cate-
cholamine-utilizing synapses and causes the release of dopamine. Amphet-
amine's normal stimulant action bears little resemblance to schizophrenia.
However, because of its addictive properties, users of amphetamines often
risk taking more and more to satisfy their cravings. The reslliting overdose
can lead to a psychotic episode with positive symptoms that are virtualJy
indistingllishable (rom those of schizophrenia. This suggests that psychosis
is somehow related to too much catecholamine in the brain.
A second reason to associate dopamine with schizophrenia relates to the
CNS effects of drugs that are effective in reducing the positive symptoms of
the disorder. In the 1950s. researchers discovered that the drug chlorpro-
mazine, initially developed as an antihistamine, could prevent the positive
symptoms in schizophrenia. Chlorpromazine and other related antipsy-
chotic medications, collectively called neuroleptic drugs, were later found
to be potent blockers of dopamine receptors. specifically the D 2 receptor.
When a large number of neuroleptics are examined, the correlation be-
tween the dosage effective for controlling schizophrenia, and their ability
to bind to D 2 receptors, is impressive (Figme 22.14). Indeed, these same
drugs are eHective in the treatment of amphetamine and cocaine psychoses.
According to the dopamine hypothesis of schizophrenia, psychotic
episodes in schizophrenia are triggered specifically by the activation of
dopamine receptors.
Despite the tantalizing link between the positive symptoms of schizophre-
nia and dopamine, there seems to be more to the disorder than an overactive
dopamine system. One indication is that newly developed antipsychotic
drugs, like clozapine, have little effect on D 2 receptors. These dmgs are called
atypical neuroleptics, indicating that they act in a novel way. The mechanism
>. 10 -7
E
....J:t:
m
Perazine
Clomacran
T razodone
.£ 10-8
<::
:E
m
0>
<::
'6
<::
:.0
o
0.
10-9
'"
o
Chlorpromazine
Clozapine
. Thioridazine
· Prochlorperazine
.r::. .£ 10- 10
0><::
I:E
m
0.1
1000
1.0
10
100
Average clinical dose (mg/day)
by which these compounds exert their neuroleptic effect has not been es-
tablished with certainty, but an interaction with serotonin receptors is
suspected.
The Glutamate Hypothesis. Another indication that there is more to
schizophrenia than dopamine comes from the behavioral effects of phency-
clidine (PCP). The drug was introduced in the 1950s as an anesthetic. Trials
in humans were a failure, however, because many patients experienced
adverse postoperative side effects, sometimes lasting for days, that included
hallucinations and paranoia. Tragically, PCP is now a common illegal drug
that is abused; it is known on the street as "angel dust" or "hog." PCP
intoxication is accompanied by many of the symptoms of schizophrenia,
both positive and negative. However, PCP has no effect on dopaminergic
transmission; it affects synapses that use glutamate as a neurotransmitter.
Recall from Chapter 6 that glutamate is the main tast excitatory neuro-
transmitter in the brain and that NMDA receptors are one subtype ot glu-
tamate receptor. PCP acts by inhibiting NMDA receptors (Figure 22.15).
Thus, according to the glutamate hypothesis of schizophrenia, the dis-
order reflects diminished activation of NMDA receptors in the brain.
To study the neurobiology of schizophrenia, neuroscientists have at-
tempted to establish animal models of the disorder. Low doses of PCP ad-
ministered chronically to rats produce changes in brain biochemistry and
behavior that resemble those in schizophrenic patients. Mice that have
been genetically engineered to express fewer NMDA receptors also display
some schizophrenia-like behaviors, including repetitive movements, agita-
tion, and altered social interactions with other mice (Figure 22.16). ot
course, we don't know whether the mutant mice feel paranoid or hear
imaginary voices. But it is significant that the observable behavioral abnor-
malities can be lessened by treating the mice with either conventional or
atypical neuroleptic drugs.
'Y SCHIZOPHRENIA 683
FIGURE 22.14
Neuroleptics and D 2 receptors. The
neuroleptic dosages effective in controlling
schizophrenia correlate well with the binding
affinities of the drugs for O 2 receptors.
(Source: Adapted from Seeman. 1980.)
684 C HAP T E R 2 2 . MENTAL ILLNESS
Glutamate
binding
sites
._
, j 1 t J"n,_'
I U U "I I 'I' I 'I , U
..1).. ...
Glutamate
PCP binding l
sites
+;' I
dj"l . -i t I 'I""
t'll l l 'V J II J..
t
j '""
i."
PCP
- .
I l
I r
Na+
Ca 2 +
(a)
(b)
(c)
FIGURE 22.15
Blocking of the NMDA receptor by PCP. NMDA receptors are glutamate-gated Ion
channels. (a) In the absence of glutamate. the channel is closed. (b) In the presence of
glutamate. the channel is open. exposing PCP binding sites. (c) The channel is blocked when
PCP enters and binds. The blockade of brain NMDA receptors by PCP produces effects on
behavior that resemble the symptoms of schizophrenia.
Treatments for Schizophrenia
The treatment of schizophrenia consists of drug therapy combined with
psychosocial support. As we mentioned, the conventional neuroleptics,
such as chlorpromazine and haloperidol. act at O 2 receptors. These drugs
reduce the positive symptoms of schizophrenia in the majority of patients.
Unfortunately, the drugs also have numerous side effects, relating to their
actions on the dopaminergic input to the striatum that arises from the sub-
stantia nigra (see Chapter 14). Not surprisingly, the effects of blocking
dopamine receptors in the striatum resemble Parkinson's disease and in-
clude rigidity, tremor. and difficulty initiating movements. Chronic treat-
ment with conventional neuroleptics also can result in the emergence of
tardive dyskinesia, which is characterized by involuntary movements of the
lips and jaw. Many of these side effects are avoided by using atypical
neuroleptics, such as clozapine and risperidone. because they do not act
directly on the dopamine receptors in the striatum. These medications are
also more effective against the negative symptoms of schizophrenia.
The newest focus of drug research is the NMDA receptor. Investigators
hope that increasing NMDA receptor responsiveness in the brain, perhaps
in combination with decreasing D 2 receptor activation, will further allevi-
ate the symptoms 0[ schizophrenia.
'Y CONCLUDING REMARKS
Neuroscience has had a huge impact on psychiatry. Mental illness is now
recognized to be the consequence of pathological modifications of the brain.
and psychiatric treatments today are focused on correcting these changes.
Just as importantly, neuroscience has changed the way people who suffer
from mental illness are viewed by society. Suspicion about mentally ill
people is slowly giving way to compassion. Mental illnesses today are rec-
ognized as diseases of the body. just like cancer or diabetes.
Despite remarkable progress in treating psychiatric disorders, we have a
very incomplete understanding of how current treatments work their magic
... CONCLUDING REMARKS 685
FIGURE 22.16
Social withdrawal in mutant mice with reduced numbers of NMDA receptors.
The mice on the left have the normal number of NMDA receptors. Each photograph was
taken 30 minutes apart for 2 hours to monitor social behavior. These mice tend to nest
together. The mice on the right have been genetically altered to express fewer NMDA
receptors. Notice that these mice tend to avoid social contact with one another.
(Source: Mohn et al.. 1999, p. 432.)
on the brain. In the case of drug therapy, we know with great precision
about how chemical synaptic transmission is affected. But we do not know
why, in many cases, the therapeutic effect of a drug takes weeks to emerge.
Even less is known about how psychosocial treatments act on the brain. In
general, the answer seems to lie in adaptive changes that occur in the brain
in response to treatment.
We also do not know the causes of most mental disorders. It is clear that
Our genes either put us at risk or protect us. However, the environment
also plays an important role. Environmental stresses before birth may con-
tribute to schizophrenia, and those after birth may precipitate depression.
Not all environmental effects are bad, however. Appropriate sensory stim-
ulation, especially in early childhood, apparently can produce adaptive
changes that help protect us from developing mental illnesses later in life.
Psychiatric disorders and their treatment illustrate that our brains and
behaviors are influenced by past experience, whether it is exposure to in-
escapable stress or to pharmacologically elevated levels of serotonin. Of
course, much more subtle sensory experiences also leave their mark on the
brain. In Part IV, we will explore how sensory experiences modify the brain
during development, and during learning.
686 C HAP T E R 2 2 . MENTAL ILLNESS
7"
-
>-V')
wI:
cx::
w
J-
Anxiety Disorders
anxiety disorder (p. 665)
panic disorder (p.666)
agoraphobia (p.666)
obsessive-compulsive disorder
(OCD) (p. 666)
hypothalamic -pituitary-ad renal
(HPA) axis (p. 668)
adrenocorticotropic hormone
(ACT H) (p. 669)
corticotropin-releasing hormone
(CRH) (p. 669)
glucocorticoid receptor
(p.669)
,ftJ
V')
Z
w
0
>
w J-
c:: V')
w
:J
a
anxiolytic drug (p. 670)
benzodiazepine (p. 671)
serotonin-selective reuptake
inhibitor (SSRI) (p. 671)
electroconvulsive therapy (ECT)
(p. 677)
antidepressant drug (p. 677)
lithium (p. 679)
Affective Disorders
affective disorder (p. 673)
major depression (p. 673)
bipolar disorder (p. 673)
mania (p. 673)
monoamine hypothesis of mood
disorders (p. 674)
diathesis-stress hypothesis of
mood disorders (p. 676)
Schizophrenia
schizophrenia (p. 679)
neuroleptic drug (p. 682)
dopamine hypothesis of
schizophrenia (p. 682)
glutamate hypothesis of
schizophrenia (p. 683)
I. Why and where do benzodiazepines reduce anxiety?
2. Depression is often accompanied by bulimia nervosa, which is characterized by frequent eating binges fol-
lowed by purging. Where does the regulation of mood and appetite converge in the brain?
3. Snuggling with your mom as a baby might help you cope with stress better as an adult. Why?
4. What three types of drugs are used to treat depression? What do they have in common?
5. Psychiatrists often refer to the dopamine theory of schizophrenia. Why do they believe dopamine is linked
to schizophrenia? Why must we be cautious in accepting a simple correlation between schizophrenia and too
much dopamine?
co
C::l:)
wz
I-
J-O
c::«
:Jw
u..cx::
Moghaddam B, Wolf ME, eds. 2003. Glutamate and
disorders of cognition and motivation. Annals of
the New York Academy of Sdences 1003: 1-484
(whole volume).
Wong ML. Licinio J. 200 I. Research and treatment
approaches to depression. Nature Reviews Neuro-
sdence 2:343-351.
Andreasen NC. 2004. Brave New Brain: Conquering
Mental Illness in the Era of the Genome. New York:
Oxford University Press.
Fogel BS, Schiffer RB, Rao SM, Anderson Sc. 2000.
Neuropsychiatry: A Comprehensive Textbook.
Baltimore: Lippincott Williams & Wilkins.
Harrison PJ, Weinberger DR. 2005. Schizophrenia
genes, gene expression, and neuropathology: on the
matter of their convergence. Molecular Psychiatry
10:40-68.
THE
CHANGING
BRAIN
PART IV
\
Wiring the Brain
INTRODUCTION
THE GENESIS OF NEURONS
CELL PROLIFERATION
. Box 23.1 Of Special Interest: Neurogenesis in the Adult Neocortex
CELL MIGRATION
CELL DIFFERENTIATION
DIFFERENTIATION OF CORTICAL AREAS
THE GENESIS OF CONNECTIONS
THE GROWING AXON
AXON GUIDANCE
Guidance Cues
. Box 23.2 Path of Discoven J : All Roads Lead to Netrin, by Marc Tessier-Lavigne
Establishing Topographic Maps
. Box 23.3 Of Special Interest: Why Our CNS Axons Don't Regenerate
Synapse Formation
THE ELIMINATION OF CELLS AND SYNAPSES
. Box 23.4 Of Specialll1tereSl: The Mystery of Autism
CELL DEATH
CHANGES IN SYNAPTIC CAPACITY
ACTIVITY-DEPENDENT SYNAPTIC REARRANGEMENT
SYNAPTIC SEGREGATION
Segregation of Retinal Inputs to the LGN
Segregation of LGN Inputs in the Striate Cortex
. Box 23.5 Braill Food: Ocular Dominance Columns and Other Oddities
. Box 23.6 Brain Food: The Critical Period Concept
SYNAPTIC CONVERGENCE
SYNAPTIC COMPETITION
MODULATORY INFLUENCES
ELEMENTARY MECHANISMS OF CORTICAL SYNAPTIC PLASTICITY
EXCITATORY SYNAPTIC TRANSMISSION IN THE IMMATURE VISUAL SYSTEM
LONG-TERM SYNAPTIC POTENTIATION
LONG-TERM SYNAPTIC DEPRESSION
WHY CRITICAL PERIODS END
CONCLUDING REMARKS
CHAPTER
690 C H A PT E R 23 . WIRING THE BRAIN
Area 17
-
\
Anterior 01(
(a)
INTRODUCTION
We have seen that most of the operations of the brain depend on remarkably
precise interconnections among its 100 billion neurons. As an example,
consider the precision in the wiring of the visual system, from retina to
lateral geniculate nucleus (LGN), to cortex, shown in Figure 23.1. AI} reti-
nal ganglion cells extend axons into the optic nerve, bur only ganglion cell
axons from the nasal retinas cross at the optic chiasm. Axons from the two
eyes are mixed in the optic tract, but in the LGN, they are sorted out again
(1) by ganglion cell type, (2) by eye of origin (ipsilateral or contralateral),
and (3) by retinotopic position. LGN neurons project axons into the optic
radiations that travel via the internal capsule to the primary visual (striate)
cortex. Here, they terminate (1) only in cortical area 17, (2) only in spe-
cific cortical layers (mainly layer IV), and (3) again according to cell type
and retinotopic position. Finally, the neurons in layer IV make very specific
connections with cells in other cortical layers that are appropriate for binoc-
ular vision and are specialized to enable the detection of contrast borders.
How did such precise wiring arise?
Back in Chapter 7, we looked at the embryological and fetal development
of the nervous system to understand how it changed from a simple tube in
the early embryo into the structures we recognize in the adult as the brain
Striate
cortex
/1
Layer IV III, II
-
.......
r.
Optic radiation
, l\
I
.
Optic tract
Posterior
(b)
Optic
disks
FIGURE 23.1
Components of the mature mammalian retinogeniculocortical pathway.
(a) A midsagittal view of a cat brain. showing the location of pnmary visual cortex (striate
cortex. area 17). (b) Components of the ascending visual pathway. Notice that the left eye's
temporal retina and the nght eye's nasal retina project axons via the OptIC nerve and optic
tract to the LGN of the left dorsal thalamus. Inputs from both of the eyes remain segre-
gated in separate layers at the level of this synaptic relay. LGN neurons project to striate
cortex via the OptiC radiations. These axons terminate mainly in layer IV, where inputs serving
both the eyes continue to be segregated. (c) The first site of major convergence of inputs
from both eyes IS In the projection of layer IV cells onto cells in layer III.
and spinal cord. Here we take another look at brain development, this time
to see how connections are formed and modified as the brain matures. We
will discover that most of the wiring in the brain is specified by genetic pro-
grams that al10w axons to detect the correct pathways and the correct tar-
gets. However, a small but important component of the final wiring de-
pends on sensory information about the world around us during early
childhood. In this way, nurture and nature both contribute to the final
structure and function of the nervous system. We will be using the central
visual system as an example whenever possible, so you may want to quickly
review Chapter 10 before continuing.
... THE GENESIS OF NEURONS
The first step in wiring the nervous system together is the generation of
neurons. Consider as an example the striate cortex. In the adult, there are
six cortical layers, and the neurons in each of these layers have character-
istic appearances and connections that distinguish striate cortex from other
areas. Neuronal structure develops in three major stages: cell proliferation.
cell migration, and cell differentiation.
Cell Proliferation
Recall [rom Chapter 7 that the brain develops from the walls of the five
fluid-filled vesicles. These fluid-filled spaces remain in the adult and consti-
tute the ventricular system. Very early in development, the walls of the vesi-
cles consist of only two layers: the ventricular zone and the marginal zone.
The ventricular zone lines the inside of each vesicle, and the marginal zone
faces the overlying pia. Within these layers of the telencephalic vesicle, a
ceJlular bal1et is performed that gives rise to all the neurons and glia of the
visual cortex. The choreography of cell proliferation is described below, and
the five "positions" correspond to the circled numbers in Figure 23.2a:
1. First position: A cell in the ventricular zone extends a process that reaches
upward toward the pia.
2. Second position: The nucleus of the cell migrates upward [rom the ven-
tricular surface toward the pial surface; the cell's DNA is copied.
3. Third position: The nucleus, containing twO complete copies of the genetic
instructions, settles back to the ventricular surface.
4. Fourth position: The cell retracts its arm from the pial surface.
5. Fifth position: The cell divides in two.
The fate of the newly formed daughter cells depends on a number of factors.
Curiously, a ventricular zone precursor cell that is cleaved vertically during
division has a different fate than one that is cleaved horizontal1y. After ver-
tical cleavage, both daughter cel1s remain in the ventricular zone to divide
again and again (Figure 23.2b). This mode of cell division predominates
early in development to expand the population of neuronal precursors.
Later in development, horizontal cleavage is the rule. In this case, the
daughter cell lying farthest away from the ventricular surface migrates
away to take up its position in the cortex, where it will never divide again.
The other daughter remains in the ventricular zone to undergo more divi-
sions (Figure 23.2c). Ventricular zone precursor cells repeat this pattern
until al1 the neurons and glia of the cortex have been generated.
In humans, the vast majority of neocortical neurons are born between
the fifth week and the fifth month of gestation (pregnancy), peaking at the
T THE GENESIS OF NEURONS 691
692 C H A PT E R 23 . WIRING THE BRAIN
FIGURE 23.2
The choreography of cell proliferation.
(a) The wall of the brain vesicles Initially
consists of only two layers, the marginal zone
and the ventricular zone. Each cell performs
a characteristic "dance" as it divides, shown
here from left to right. The circled numbers
correspond to the five "positions" described
in the text. The fate of the daughter cells
depends On the plane of cleavage during
division. (b) After cleavage in the vertical
plane. both daughters remain in the ventricu-
lar zone to divide again. (c) After cleavage in
the horizontal plane, the daughter farthest
away from the ventricle ceases further division
and migrates away
Notch-1
I .,/
I
Numb
-
-'-
FIGURE 23.3
The distribution of cell constituents
in precursor cells. The proteins notch-I
and numb are differentially distributed in the
precursor cells of the developing neocortex.
Vertical cleavage partitions these proteins
equally in the daughters, but horizontal cleav-
age does not. Differences in the distribution of
proteins in the daughters causes them to have
different fates.
Pial surface
Marginal { ,
zone @ '\..
CDI 2 ,@
Ventricular 1 ! /
zone ,
(a)
Vertical cleavage
\\r
/
,/
Horizontal cleavage
astonishing rate of 250,000 new neurons per minute. Recent findings sug-
gest that although most of the action is over well before birth, the adult
ventricular zone retains some capacity to generate new neurons (Box 23.1).
However, it is important to realize that once a daughter cell commits to a
neuronal fate, it will never divide again.
How does the cleavage plane during cell division determine the cell's
fate? Remember that all of our cells contain the same complement of DNA
we inherited from our parents, so every daughter cell has the same genes.
The factor that makes one cell different from another is the specific genes
that generate mRNA and, ultimately, protein. Thus, cell fate is regulated by
differences in gene expression during development. Gene expression is regu-
lated by cellular proteins called transcription factors. If transcription factors.
or the "upstream" molecules that regulate them, are unevenly distributed
within a cell, then the cleavage plane can determine which factors are
passed on to the daughter cells. For example, proteins called notch-1 and
numb migrate to different poles of ventricular zone precursor cells (Figure
23.3). When the neuron divides vertically, the notch-1 and numb proteins
are partitioned symmetrically. However, when the cell divides horizontally,
notch-l goes with the daughter that will migrate away, while numb re-
mains with the cell that will divide again. Research suggests that notch-I,
"unopposed" by numb, activates the gene expression that causes the cell to
cease dividing and migrate away from the ventricular zone.
Mature cortical cells can be classified as glia or neurons, and the neurons
can be further classified according to the layer in which they reside, their
dendritic morphology, and the neurotransmitter they use. Conceivably, this
diversity could arise from different types of precursor cell in the ventricu-
lar zone. In other words, there could be one class of precursor cell that gives
rise only to layer VI pyramidal cells, another that gives rise to layer V cells,
and so on. However, this is not the case. Multiple cell types, including
neurons and glia, can arise from the same precursor cell. Because of this
potential to give rise to many different types of tissue, these precursor cells
are also called neural stem cells.
Box 23.1
.... , .
"If THE GENESIS OF NEURONS 693
...
OF SPECIAL INTEREST
" Neurogenesis in the Adult Neocortex
For many years, neuroscientists believed that neurogene-
sis-the generation of new neurons from precursor
cells-was restricted to early brain development. But new
findings have challenged this view. It now appears that
new neurons are continuously generated by neural pre-
cursor cells lining the ventricles in the adult brain.
Cell division requires the synthesis of DNA. which can
be detected by feeding the cells chemically labeled DNA
precursor molecules. Cells undergoing division at the time
the precursor is available incorporate the chemical label
into their DNA In the mid-I 980s, Fernando Nottebohm
of Rockefeller University used this approach to prove that
new neurons are generated in the brains of adult canaries,
particularly in regions associated with song learning. This
finding resurrected interest in adult neurogenesis in mam-
mals, which had actually first been described in 1965 by
John Altman and Gopal Das of the Massachusetts Institute
of Technology. Research in the past few years by Fred
Gage at the Salk Institute has established definitively that
new neurons are generated in the adult rat hippocampus,
a structure that is important for learning and memory
(as we will see in Chapter 24). Interestingly, the number
of new neurons goes up in this region if the animal is
exposed to an enriched environment, filled with toys and
playmates. In addition, rats given the chance to have a daily
run on an exercise wheel show enhanced neurogenesis.
In both cases. the increased number of neurons correlates
with enhanced performance on memory tasks that re-
quire the hippocampus. Hippocampal neurogenesis is not
restricted to rats; Gage has found evidence that the same
holds true for humans.
Can newly generated neurons be incorporated into the
elaborate circuits of the primate neocortex? This ques-
tion was addressed in 1999 by Elizabeth Gould and her
colleagues at Princeton University. They found that in
adult macaque monkeys. cells are born in the ventricular
zone. migrate through the white matter to the neocortex,
and differentiate into neurons (Figure A). The new neurons
appear to be added selectively to the association cortex
of the temporal and frontal lobes. Primary sensory areas,
such as striate cortex, had no new neurons.
Neurogenesis in the adult brain. unfortunately, is far
too limited to repair CNS damage. However, under-
standing how adult neurogenesis is regulated-for exam-
ple. by the quality of the environment-might suggest
ways it can be harnessed to promote regeneration after
brain injury.
..
....
'- "
Migrating
neuroblasts
Newly
generated
neurons
FIGURE A
The ultimate fate of the migrating daughter cell is determined by a com-
bination of factors, including the age of the precursor cell, its position
within the ventricular zone, and its environment at the time of divisjon.
Cortical pyramidal neurons and astrocytes derive from the dorsal ventricu-
lar zone, whereas inhibitory interneurons and oligodendroglia derive from
the vemal telencephalon (Figure 23.4). The first cells to migrate away from
the dorsal ventricular zone are destined to reside in a layer called the sub-
plate, which eventually disappears as development proceeds. The next
cells to divide become layer VI neurons, followed by the neurons of layers
V, IV, III, and II.
694 C H A PT E R 23 . WIRING THE BRAIN
FIGURE 23.5
The migration of neuroblasts to the
cortical plate. This IS a schematic section
through the dorsal telencephalon early in
development. The expanded view shows a
neuroblast crawling along the thin processes
of the radial glia en route to the cortical
plate, which forms just under the marginal
zone.
Dorsal
Future
neocortex
" Proliferative
zone
/
Future
basal ganglia
Origin of
oligodendrocytes
Ventral
FIGURE 23.4
The sources of cortical cells. Proliferation of cortical pyramidal neurons and astrocytes
occurs in the ventricular zone of the dorsal telencephalon. However; inhibitory interneurons
and oligodendroglia are generated in the ventricular zone of the ventral telencephalon;
consequently. these cells must migrate laterally over some distance to arrive at their final
destination in the cortex. (Source: Adapted from Ross et al.. 2003.)
Cell Migration
Many daughter cells migrate by slithering along thin fibers that radiate
from the ventricular zone toward the pia. These fibers are derived [rom
specialized radial glial cells, providing the scaffold on which the cortex is
buUt. The immature neurons, called neuroblasts, follow this radial path
from the ventricular zone toward the surface of the brain (Figure 23.5).
Recent studies indicate that some neurons actually derive from radial glia.
In this case, migration occurs by the radial movement of the soma within
Intermediate
zone
Trailing process
of neuron
Process of radial
glial cell
Marginal zone {
Cortical plate {
Leading process
of neuron
Migrating neuron
Subventricular {
zone
Ventricular {
zone
Radial
glial cell
t
Intermediate
zone
f
f
i
Intermediate
zone
1
1
Intermediate
zone
,1
} Ventricular
zone
} Ventricular
zone
} Ventricular
zone
Development
the fiber that connects the venricular zone and pia. When cortical assembly
is complete, the radial glia withdraw their radial processes. Not all migrating
cells follow the path provided by the radial glial cells, however. About one-
third of the neuroblasts wander horizontally on their way to the cortex.
The neuroblasts destined to become subplate cells are among the first to
migrate away from the ventricular zone. Neuroblasts destined to become
the adult cortex migrate next. They cross the subplate and form another
cell layer called the cortical plate. The first cells to arrive in the cortical
plate are those that will become layer V1 neurons. Next come the layer V
cells, followed by layer IV cells, and so on. Notice that each new wave of
neuroblasts migrates right past those in the existing cortical plate. In this
way, the cortex is said to be assembled inside-out (Figure 23.6). This orderly
process can be diswpted by a number of gene mutations. For example, in
a mutant mouse called reeler (describing the mouse's wobbly appearance).
the neurons of the cortical plate are unable to pass through the subplate
and pile up below it. Subsequent discovery of the affected gene revealed
one of the [actors-a protein called reelin-that regulates the assembly of
the cortex.
Cell Differentiation
The process in which a cell takes on the appearance and characteristics of a
neuron is called cell differentiation. Differentiation is the consequence o[ a spe-
cific spatiotemporal pattern of gene expression. As we have seen, neuroblast
differentiation begins as soon as the precursor cells divide with the uneven
distribution of cell constituents. Further neuronal differentiation occurs when
'f' THE GENESIS OF NEURONS 695
White matter
--
FIGURE 23.6
Inside-out development of the cortex.
The first cells to migrate to the cortical plate
are those that form the subplate. As these
differentiate into neurons. the neuroblasts
destined to become layer VI cells migrate past
and collect in the cortical plate. This process
repeats again and again until all layers of the
cortex have differentiated. The subplate
neurons then disappear.
696 C H A PT E R 23 . WIRING THE BRAIN
Attraction by semaphorin 3A
of apical dendrite t
Neuroblast , Differenti 1 r-
neuron \
Repulsion by semaphorin 3A
of efferent axon
FIGURE 23.7
The differentiation of a neuroblast into
a pyramidal neuron. Semaphorin 3A, a
protein secreted by cells In the marginal zone,
repels the growing axon and attracts the
growing apical dendrite, giving the pyramidal
neuron its characteristic polarity
the neuroblast arrives in the cortical plate. Thus, layer V and VI neurons
have differentiated into recognizable pyramidal cells even before layer II
cells have migrated into the cortical plate. Neuronal differentiation occurs
first, followed by astrocyte differentiation that peaks at about the time of
birth. OJigodendrocytes are the lasl celJs to differentiate.
Differentiation of the neuroblasT into a neuron begins with the appearance
of neurites sprouting off the cell body. At first, these neurites alJ appear
about the same, but soon, one becomes recognizable as the axon and the
others as dendrites. Differentia tion will occur even if the neuroblast is re-
moved from the brain and placed in tissue culture. For example, cells des-
tined to become neoconical pyramidal cens will often assume the same
characteristic dendritic architecture in tissue culture. This means that dif-
ferentiation is programmed well before the neuroblast arrives at its final
resting place. However, the stereotypical architecture of cortical dendrites and
axons also depends on intercellular signals. As we have learned, pyramidal
neurons are characterized by a large apical dendrite that extends radially,
toward the pia, and an axon that projects in the opposite direction. Research
has shown that a protein called semaphorin 3A is secreted by cells in the
marginal zone. The protein acts first to repel growing pyramidal cell axons,
causing them to stream away from the pial surface, and second to attract
the growing apical dendrites, causing them to stream toward the brain
surface (Figure 23.7). We will see that the oriented growth of neurites in
response to diffusible molecules is a recurring theme in neural development.
Differentiation of Cortical Areas
The neocortex is often described as a sheet of tissue. In reality, however,
cortex is much more Jike a patchwork quilt, with many structurally distinct
areas stitched together. One of the consequences of human evolution was
the creation of new neocortical areas that are specialized for increasingly
sophisticated analysis. It is natural to wonder exactly how all these areas
arise during development.
As we have seen, most cortical neurons are born in the ventricular zone
and then migrate along radial glia to take up their final position in one of
the cortical layers. Thus, it seems reasonable to conclude that cortical areas
in the adult brain simply reflect an organization that is already present in
the ventricular zone of the fetal telencephalon. According to this idea, the
ventricular zone contains something like a microfilm record of the future
cortex, which is projected onto the wall of the telencephalon as develop-
ment proceeds.
The idea of such a cortical "protomap" was originally based on the as-
sumption that migrating neuroblasts are precisely guided to the cortical
plate by the network of radial glial fibers. If migration is strictly radial, we
might expect that an the offspring of a precursor cell would migrate to ex-
actly the same neighborhood of the cortex. However, as mentioned above,
one-third of all neuroblasts stray considerable distances as they migrate
toward the cortical plate. This finding initially seemed to be at odds with
the protomap hypothesis.
Recall that cortical areas differ not only in terms of cytoarchitecture, but
also in terms of connections, particularly with the dorsal thalamus. Area
] 7 receives input from the LGN, area 3 receives input from the ventral
posterior (VP) nucleus. and so on. What is the contribution of the thalamic
input to the differentiation of cortical areas? Researchers Brad Schlaggar
and Dennis O'Leary of the Salk Institute addressed this question in a novel
way. In rats, the thalamic fibers wait in the cortical white matter and do
not enter the cortex until a few days after birth. Schlaggar and O'Leary
peeled off the parietal cortex in newborn rats and replaced it with a piece
of occipital cortex. This created a situation in which the thalamic fibers
from the VP nucleus were waiting under what would have been visual cor-
tex. Remarkably, the fibers invaded the new piece of cortex, and it assumed
the cytoarchitecture that is characteristic of the rodent somatosensory
cortex (the "barrels"; see Figure 12.20). These results suggest the thalamus
is important for specifying the pattern of cortical areas.
But how did the appropriate thalamic axons come to lie in wait under
the parietal cortex in the first place? This is beginning to sound like the
chicken-and-egg problem! The answer, apparently, lies in the subplate.
Subplate neurons, which have a more strictly radial migration pattern, at-
tracr the appropriate thalamic axons to different parts of the developing
cortex: LGN axons to occipital cortex, VP nucleus axons to parietal cortex,
and so on. The area-specific thalamic axons initially innervate distinct pop-
ulations of subplate cells. When the overlying cortical plate grows to a suf-
ficient size, the axons invade the cortex. The arrival of the thalamic axons
causes the cytoarchitectural differentiation we recognize in the adult brain.
Thus, the subplate layer of earliest-born neurons seems to contain the in-
structions for the assembly of the cortical quilt.
'Y THE GENESIS OF CONNECTIONS
As neurons differentiate, they extend axons that must find their appropriate
targets. Think of this development of long-range connections, or pathway
formation, in the CNS as occurring in three phases: pathway selection, target
selection, and address selection. Let's understand the meaning of these
terms in the context of the development of the visual pathway from the
retina to the LGN, as shown in Figure 23.8.
Imagine for a moment that you must lead a growing retinal ganglion cell
axon to the correct location in the LGN. First, you travel down the optic
LGN
- ""
-1 OPI"mct
Optic chiasm
LGN layers
Lateral I .
geniculate ------+--- [ "'" \t
nucleus & .
/ t
Medial / @
geniculate / /'
nucleus ?'
Contralateral I
optic tract
--.--
.J --r Ipsilateral
] ti"mct
t
/
Contralateral
optic nerve
Trajectory of
growing axon
THE GENESIS OF CONNECTIONS 697
FIGURE 23.8
The three phases of pathway formation.
The growing retinal axon must make several
"decisions" to find its correa target in the
LGN. ill During pathway selection, the axon
must choose the correct path. (lJ During tar-
get selection. the axon must choose the cor-
rect structure to innervate. Q) During address
selection, the axon must choose the correct
cells to synapse with in the target structure.
698 C HAP T E R 2 3 . WIRING THE BRAIN
Transmitter
storage
A vesicles
, Microtubules
\. Actin filaments
",,' "" j.
Mitochondrion
./
Neunte
....
\.
" \
. ---jLamelliPodia
'" / ,I
Filopodia
FIGURE 23.9
The growth cone. The filopodia probe the
environment and direct the growth of the
axon toward attractive cues.
stalk toward the brain. But soon you reach the optic chiasm at the base of
the brain and must decide which fork in the road to take. You have three
choices: You can enter the optic tract on the same side, you can enter the
optic tract on the opposite side, or you can dive into the other optic nerve.
The correct path depends on the location in the retina of your gangHon celt
and on the cell type. If you came from the nasal retina, you would cross
over at the chiasm into the contralateral optic tract; but if you came from
the temporal retina, you would stay in the tract on the same side. And
in no case would you enter the other optic nerve. These are examples of
the "decisions" that must be made by the growing axon during pathway
selection.
Having forged your way into the dorsal thalamus, you are now confronted
with the choice of which thalamic nucleus to innervate. The correct choice,
of course, is the lateral geniculate nucleus. This decision is called target
selection.
But finding the correct target still isn't enough. You must now find the
correct layer of the LGN. You also must make sure that you sort yourself
out with respect to other invading retinal axons so that retinotopy in the
LGN is established. These are examples of the decisions that must be made
by the growing axon during address selection.
We will see that each of the three phases of pathway formation depends
critically on communication between cells. This communication occurs in
several ways: direct cell-cell contact, contact between cells and the extra-
cellular secretions of other cells, and communication between cells over a
distance via diffusible chemicals. As the pathways develop, the neurons also
begin to communicate via action potentials and synaptic transmission.
The Growing Axon
Once the neuroblast has migrated to take up its appropriate position in the
nervous system, the neuron differentiates and extends the processes that
will ultimately become the axon and dendrites. At this early stage, how-
ever, the axonal and dendritic processes appear quite similar and collec-
tively are still called neurites. The growing tip of a neurite is called a
growth cone (Figure 23.9).
The growth cone is specialized to identify an appropriate path for neurite
elongation. The leading edge of the growth cone consists of flat sheets of
membrane called lamellipodia that undulate in rhythmic waves like the
wings of a stingray swimming along the ocean bottom. Extending from
the lamellipodia are thin spikes called filopodia, which constantly probe the
environment. moving in and out of the lamellipodia. Growth of the neurite
occurs when a filopodium, instead of retracting, takes hold of the substrate
(the surface on which it is growing) and pulls the advancing growth cone
forward.
Obviously, axonal growth cannot occur unless the growth cone is able to
advance along the substrate. An important substrate consists of fibrous
proteins that are deposited in the spaces between cells, the extracellular
matrix. Growth occurs only if the extracellular matrix contains appropri-
ate proteins. An example of a permissive substrate is the glycoprotein
laminin. The growing axons express special surface molecules called inte-
grins that bind laminin, and this interaction promotes axonal elongation.
Permissive substrates, bordered by repulsive ones, can provide corridors
that channel axon growth along specific pathways.
Travel down such molecular highways is also aided by fasciculation, a
mechanism that causes axons growing together to stick together (Figure
23.10). Fasciculation is due to the expression of specific surface molecules
.-
called cell-adhesion molecules (CAMs). The CAMs in the membrane of
neighboring axons bind tightly to one another, causing the axons to grow
in unison.
Axon Guidance
Wiring the brain is a formidable challenge. when you consider the distances
that many axons traverse in the mature nervous system. Remember, though,
that distances are not nearly as great early in development, when the en-
tire nervous system is no more than a few centimeters long. A common
mode of pathway formation is the initial establishment of connections by
pioneer axons. These axons "stretch" as the nervous system expands, and
they are used to guide their later-developing neighbor axons to the same
targets. Still, the question remains of how the pioneer axons grow in the
correct direction, along the correct paths, to the correct targets. The answer
appears to be that the trajectory of the axons is broken into short segments
that may only be a few hundred microns long. Axons conclude a segment
when they arrive at an intermediate target. The interaction of the axon and
the intermediate target throws a molecular switch that sends the axons on-
ward to another intermediate target. Thus, by "connecting the dots," the
axons find their way to their final destination.
Guidance Cues. Growth cones differ in terms of the molecules they ex-
press on their membranes. Interactions of these cell surface molecules with
guidance cues in the environment determine the direction and amount of
growth. Guidance cues can be attractive or repulsive. depending on the
receptors expressed by the axons.
A chemoattractant is a diffusible molecule that acts over a distance to
attract growing axons toward their targets, Jike the aroma of freshly brewed
java might attract a coffee lover. Although the existence of such chemoat-
tractants was proposed more than a century ago by Cajal and was inferred
by many experimental studies since then, only very recently have attrac-
tant molecules been identified in mammals. The first to be discovered, by
Marc Tessier-Lavigne at the University of California, San Francisco, is a pro-
tein called netrin (Box 23.2). Netrin is secreted by neurons in the ven-
tral midline of the spinal cord (Figure 23.11). The gradient of netrin attracts
the axons of dorsal horn neurons that will cross the midline to form the
spinothalamic tract. These axons possess netrin receptors. and the binding
of netrin to the receptor spurs growth toward the source of netrin.
But that's only half the story. Once the decussating axons cross the mid-
line, they need to escape the powerful siren song of netrin. This escape is
enabled by the action of slit, another protein secreted by midline cells. Slit
is an example of a chemorepellent, a diffusible molecule that chases
axons away. For slit to exert this action, however, the axon must express
on its surface the slit receptor, a protein called robo. The growth cones that
are attracted to the midline by netrin express little robo and are therefore
insensitive to repulsion by slit. However, once they cross the midline, they
encounter a signal that causes robo to be up-regulated. Now slit repels the
axons so they grow away from the midline.
This example shows how axons can be "pulled" and "pushed" by the co-
ordinated actions of chemoattractants and chemorepellents. The trajectory of
the axons to and from the midline is also constrained by the permissive
substrates that are available for growth. In this example, the cells of the mid-
line are an intermediate target-one of the "dots"-along the molecular high-
way that spans the midline. These cells serve to alternately attract and then
repel the growing axon as it crosses from one side of the CNS to the other.
.. THE GENESIS OF CONNECTIONS 699
CAMs Integrin
xon . molecu les
Laminin
molecules _
n n .. Yo.
Extracellular matrix
FIGURE 23.10
Fasciculation. The bottom axon grows
along the molecular "highway" of the extra-
cellular matrix The other axons ride piggy-
back, sticking to one another by the inter-
'action of cell-adhesion molecules (CAMs)
on their surfaces.
700 C H A PT E R 23 . WIRING THE BRAIN
Midline
Netrin
receptors:
,
:.: Netrin
:.: Slit
(a)
Ventral surface
of spinal cord
Midline
(b)
Ventral surface
of spinal cord
FIGURE 23.11
Chemoattraction and chemorepulsion. (a) The protein netrin is secreted by cells
in the ventral midline of the spinal cord. Axons with the appropriate netrin receptors are
attracted to the region of highest netrin concentration. (b) The protein slit is also secreted
by midline cells. Axons that express the protein robo, the slit receptor. grow away from the
region of highest slit concentration. Up-regulation of robo by axons that cross the midline
ensures that they keep growing away from the midline.
Establishing Topographic Maps. Let's return to the example of the grow-
ing retinogeniculate axon (see Figure 23.8). These axons grow along the
substrate provided by the extracellular matrix of the ventral wall of the
optic stalk. An important "choice point" occurs at the optic chiasm. Axons
from the nasal retina cross and ascend in the contralateral optic tract, while
axons from the temporal retina remain in the ipsilateral optic tract. From
our discussion so far, we can infer that nasal and temporal retinal axons
must express different receptors to cues secreted at the midline.
Once the axons from the retinas are sorted out at the midline, they con-
tinue on to innervate targets such as the LGN and the superior colliculus.
Sorting of the axons occurs again, this time to establish a retinotopic map
in the target structure. If we accept the notion that axons differ depending
on their position in the retina (as they must, to account for the partial
decussation at the optic chiasm), then we have a potential molecular basis
for the establishment of retinotopy. This idea, that chemical markers on
... THE GENESIS OF CONNECTIONS 70 I
Box 23.2
PATH OF DISCOVERY
lit
A'
. J&
........
All Roads
Lead to N etrin
I hadn't planned on studying brain development. With a
background in mathematics and physics, I was initially
drawn to the brain as the ultimate computer, choosing for
my graduate studies the investigation of information pro-
cessing by retinal circuits. But in the course of recording
from neurons in retinal slices, my interest in brain func-
tion was gradually displaced by a deeper fascination with
the question of how such intricate connections can form
so reproducibly during development.
The problem of brain wiring has, of course, a distin-
guished history. It was posed forcefully at the end of the
nineteenth century by Cajal, who provided an answer at
the cellular level that was largely correct. Growth cones
at the tips of developing axons, Cajal postulated, are led to
their targets by specific guidance cues in the embryonic
environment, including chemoattractant factors made by
target cells. Despite its appeal, this simple theory did not
gain immediate acceptance. Not until the late 1980s did
conclusive evidence reveal accurate guidance of develop-
ing axons and the existence of chemoattractive activities
in the embryo. By then, I had joined Tom Jessell as a post-
doctoral fellow, and my colleagues and I contributed to
this view by providing evidence for a chemoattractant fac-
tor in the central nervous system, made by cells in the
ventral spinal cord.
Now the challenge was to identify the guidance cues
themselves. Or so I thought. At the time, the prevalent
view was that we already knew the solution: Guidance
cues were simply different combinations of recently iden-
tified factors, including cell-adhesion and extracellular matrix
molecules. The fact that few or no axon guidance defects
were seen in mutant mice or flies lacking such molecules
was interpreted as evidence of massive redundancy of
guidance mechanisms, rather than an indication that we
hadn't yet isolated the key guidance factors.
Isolating the ventral spinal cord chemoattractant was
therefore not considered a good project for a starting as-
sistant professor, as I now was. In addition to the inherent
risks of attempting a biochemical purification from a small
source of tissue, there was a belief that the solution would
not be that interesting if the factor was just a combination
of known molecules. But I wasn't deterred. The effect of the
chemoattractant on responsive axons in vitro is dramatic-
with it, axons burst at the seams to grow out; without it,
they don't grow out at all. And it is highly specific: No
known factors at the time could mimic its effect. This po-
by Marc Tessier-Lavigne
tency and specificity convinced me that identifying the fac-
tor would be worth the effort. The finding of a similar ac-
tivity in embryonic brain extracts provided a more abun-
dant source for purification than spinal cord. Making
reasonable assumptions about the factor's specific activ-
ity, I estimated that it should be possible to purify it from
about 5000 chick brains-a manageable number. In the
end, however, what convinced me to bet all on isolating
the factor was the belief that nothing else I could do
would advance our knowledge anywhere near to the same
extent.
I was fortunate that my passion for tackling this chal-
lenge was shared by the young people who joined my
laboratory. Mass dissections of chick brains, a thousand at
a sitting, turned into lab parties, dubbed "Bastille days" by
a student, which involved up to 20 post-docs, students,
and friends motivated by a desire to contribute to sci-
ence--and the reward of gourmet pizza probably didn't
hurt either. We ultimately needed 25,000 embryonic
brains to isolate the active factor (I was off by a factor of
five). and we ended up purifying not one but two related
factors, which we called netrin-I and netrin-2, from the
Sanskrit word netr, meaning "one who guides." We were
gratified to find that netrin-I itself accounts for all the
outgrowth activity of the ventral spinal cord cells and is
essential for the guidance of responsive axons.
Since then, through the work of many labs including
ours, the field has exploded, with the finding of several
major families of guidance factors-the netrins, sema-
phorins, slits, and ephrins-which, when mutated, cause
major defects in guidance in vivo. And we are only at the
beginning of our understanding, as we determine how these
cues collaborate to guide axons and as evidence mounts
that they also regulate a variety of other processes, in-
cluding axonal regeneration, the plasticity of neuronal
connections, and processes outside the nervous system
like blood vessel and lung morphogenesis.
My experience with the netrins has also convinced me
of the importance of focusing on strong biological effects,
of taking calculated risks to go after key regulatory mech-
anisms, and of being suspicious of claims that processes are
regulated by large numbers of factors, each of which con-
tributes only a little--a claim made. for example, in the field
of axonal regeneration today. So my advice to students is
the same 1 give myself every day: Follow big effects; they will
provide the keys to unlock the mysteries you are probing.
702 C H A PT E R 23 . WIRING THE BRAIN
growing axons are matched with complementary chemical markers on
their targets to establish precise connections, is called the chemoaffinity
hypothesis.
This hypothesis was first tested in the 1940s by Roger Sperry, at the
California Institute of Technology, in an important series of experiments
using the retinotectal projection in frogs. The tectum is the amphibian
homologue of the mammalian superior colliculus. The tectum receives
retinotopically ordered input from the contralateral eye and uses this in-
formation to organize movements in response to visual stimulation, such
as lunging after a fly passing overhead. Thus, this system can be used to in-
vestigate the mechanisms that generate orderly maps in the CNS.
Another advantage of amphibians is that their CNS axons will regener-
ate after being cut, which is not true Eor mammals (Box 23.3). Sperry
took advantage of this property to investigate how the retinotopic map
was established in the tectum. In one experiment, Sperry cut the optic
nerve, rotated the eye 180 0 in the orbit, and then allowed the upside-
down nerve to regenerate. Despite the fact that the axons in the optic
nerve were now scrambled from where they would occur naturaJJy, the
axons grew into the tectum to exactly the same sites that they occupied
originally. Now, when a fly passed overhead, these frogs lunged down in-
stead of up because their eyes were providing the brain a mirror image of
the world.
What factors control the guidance of retinal axons to the correct part
of the tectum? When the axons arrive at the tectum, they must grow
along the membranes of tectal cells. The axons from the nasal retina cross
the anterior part of the tectum and innervate the neurons in the poste-
rior part. The axons of the temporal retina, in contrast, grow into the an-
terior tectum and stop there (Figure 23.12a). Why? Experiments have
shown that the cell membranes of anterior and posterior tectal neurons
differentially express factors that allow the growth of nasal and temporal
retinal axons. Nasal axons grow well on the substrate provided by both
anterior and posterior tectal membranes. However, temporal axons grow
only on anterior tecta I membranes; the posterior membranes are repul-
sive (Figure 23.12b). Recent research has led to the discovery that pro-
teins called ephrins are one repulsive signal for temporal retinal axons.
Specific ephrin molecules are secreted in a gradient across the surface of
the tectum, with the highest levels found on posterior tectal cells. An
ephrin interacts with a receptor. caJled eph, on the growing axon. The in-
teraction of ephrin with its receptor inhibits further axonal growth, sim-
ilar to the slit-robo interaction discussed earlier.
Such gradients in the expression of guidance cues and their axonal recep-
tors can impose considerable topographic order on the wiring of the retina
to its targets in the brain. However, as we will see in a moment, final refine-
ment of connections often requires neural activity.
Synapse Formation. When the growth cone comes in contact with its tar-
get, a synapse is formed. Most of what is known about this process comes
from studies of the neuromuscular junction. The first step appears to be the
induction of a cluster of postsynaptic receptors under the site of nerve-mus-
cle contact. This clustering is triggered by an interaction between proteins
secreted by the growth cone and the target membrane. At the neuromus-
cular junction, one or these proteins, called a9rin, is deposited in the ex-
tracellular space at the site of contact (Figure 23.13). The layer of proteins
in this space is called the basal lamina. Agrin in the basal lamina binds to a
receptor in the muscle cell membrane, called muscle-specific kinase, or MuSK.
MuSK communicates with another molecule, called rapsyn, which appears
-
" t." .
. .. ,\.
- '
Nasal
f
Posterior
/
Aotericr L
(a)
Retina
Tectum
Neurons from nasal retina
!
)
Membranes from
anterior retina
) Membranes from
posterior retina
/1= I ,
0--
o _
o _
o _
o
°1__
01-
,0 ,_ I
o _ I
o
(b)
-
--
Neurons from temporal retina
I
:- 1Io - \ M bffiOO' 1m
--.J'"--r- '" ) anterior retina
Membranes from
wv Ierioc'etioo
--!
(c)
FIGURE 23.12
Establishing retinotopy in the frog retinotectal projection. (a) Retinotopy is
established when the nasal retina projects to the posterior tectum and the temporal retina
projects to the anterior tectum. (b) To reveal how this retinotopy is established, membranes
of cells from anterior and posterior tectum are removed from the frog and deposited In a
striped pattenn at the bottom of a Petri dish. Experiments show that nasal retinal axons in
vitro grow equally well on anterior and posterior membranes. (c) Temporal axons, in con-
trast, are repelled by membranes from posterior tectum and grow only on anterior tectal
membranes.
to act like a shepherd to gather the postsynaptic acetylcholine receptors
(AChRs) at the synapse. The size of the "flock" of receptors is regulated by
another molecule released by the axon, called neuregulin, which stimulates
the receptor gene expression in the muscle cell.
The interaction between axon and target occurs in both directions, and
the induction of a presynaptic terminal also appears to involve proteins in
'f' THE GENESIS OF CONNECTIONS 703
704 C HAP T E R 2 3 . WIRING THE BRAIN
Growing axon
j
CD lj- FilOPodium
( 1
I \Ji)
Dendrite
S,""tic ""
@ ==4 Pm"",,,;, ,,",, , '00'
l Jl
---v-v
M\ ! Postsynaptic receptor
o l cluster
Jl
FIGURE 23.14
Steps in the formation of a CNS
synapse. J.., A dendritic filopodium contacts
an axon. (2) Contact leads to the recruitment
of synaptic vesicles and active zone proteins
to the presynaptic membrane. Q) I\Jeurotrans-
mitter receptors accumulate postsynaptically.
,..,.
( Motor neuron growth conel
S '"'00 '"",;nal
Bas.al ""- "c1
lamina '------,
Agrin
molecules
-+....-..r 1 J",
- oJ" f'-i
'" s
T
@
(
Muscle cell
membrane
I
3
Agrin
receptor
(MuSK)
ACh
receptor
FIGURE 23.13
Steps in the formation of a neuromuscular synapse. CD The growing motor neuron
secretes the protein agrin into the basal lamina. (2) Agrin interacts wrth MuSK in the muscle
cell membrane. This Interaction leads to (3) the clustering of ACh receptors in the postsynap-
tic membrane via the actions of rapsyn.
tbe basal lamina. Basal lamina factors provided by the target cell evidently
can stimulate Ca H entry into the growth cone, which triggers neurotrans-
mitter release. Thus, although the final maturation of synaptic structure
may take a matter of weeks, rudimentary synaptic transmission appears
very rapidly after contact is made. Besides mobilizing transmitter. Ca H entry
into the axon also tr1ggers changes in the cytoskeleton that cause it to assume
the appearance of a presynaptic terminal and to adhere tightly to its post-
synaptic pa rtner.
Similar steps are involved in synapse formation in the CNS, but these
may occur in a different order, and they definitely use distinct molecules
(Figure 23.14). Microscopic imaging of neurons in tissue culture reveals
that filopodia are continually being formed and retracted from neuronal
dendrites seeking innervation. Synapse formation begins when such a
dendritic protrusion reaches out and touches an axon that might be pass-
ing by. This interaction appears to cause a preassembled presynaptic active
zone to be deposited at the site of contan followed by the recruitment of
neurotransmitter receptors to the postsynaptic membrane. In addition,
specific adhesion molecules are expressed by both presynaptic and post-
synaptic membranes that serve to glue the partners together.
. THE ELIMINATION OF CELLS AND SYNAPSES
The mechanisms of pathway formation we've dis<.:ussed are sufficient to
establish considerable order in the connections of the fetal brain. For exam-
ple, in the visual system, these mechanisms ensure that (1) retinal axons
reach the LGN, (2) geniculate axons reach layer IV of striate cortex, and (3)
both ot these sets ofaxons form synapses in their target structures in proper
retinotopic order. But the job of wiring together the nervous system isn't
finished yet. A prolonged period of development follows, from before birth
Box 23.3
.... , .
OF SPECIAL INTEREST
.. THE ELIMINATION OF CELLS AND SYNAPSES 70S
....
..
iii Why Our CNS Axons Don't Regenerate
Compared with other vertebrates, mammals are fortunate
in many ways. We have computing power and behavioral
flexibility that our distant aquatic cousins, the fish and
amphibians, utterly lack. However, in one interesting re-
spect. fish and frogs have a distinct advantage-the growth
ofaxons in the adult CNS after injury. Cut the optic
nerve in a frog, and it grows back. Do the same thing in
a human, and she is blind forever. Of course, our CNS
axons do grow over long distances early in development.
But something happens shortly after birth that makes the
CNS, especially the white matter, a hostile environment
for axon growth.
When an axon is cut, the distal segment degenerates
because it is isolated from the soma. But the severed tip
of the proximal segment initially responds by emitting
growth cones. In the adult mammalian CNS, sadly, this
growth is aborted. Not in the mammalian PNS, though; if
you've ever had a deep cut that severed a peripheral
nerve, you know that eventually sensations can come
back in the denervated skin. This happens because PNS
axons are capable of regeneration over long distances.
Surprisingly, the critical difference between the mam-
malian PNS and the CNS is not the neurons. A PNS dorsal
root ganglion cell axon regenerates in the peripheral
nerve, but when it hits the environment of the CNS, in the
dorsal horn, growth ceases. Conversely. if a CNS alpha
motor neuron axon is cut in the periphery. it grows back
to its target. If it is cut in the CNS, no regeneration occurs.
Thus. the critical difference seems to be the different
environments of the CNS and PNS. This idea was tested
in a very important series of experiments, beginning in
the early I 980s, performed by Albert Aguayo and his col-
leagues at Montreal General Hospital. They showed that
crushed optic nerve axons can grow long distances if they
are given a peripheral nerve graft to grow along (Figure A).
What is different about peripheral nerves? The type of
myelinating glial cell varies: oligodendroglia in the CNS
and Schwann cells in the PNS (see Chapter 2). Experi-
ments performed by Martin Schwab of the University of
Zurich showed that CNS neurons grown in tissue cul,ture
will extend axons along substrates prepared from Schwann
cells. but not along CNS oligodendroglia and myelin. This
finding led to the search for glial factors that inhibit axon
growth, and a molecule called nogo was finally identified,
early in 2000. Nogo apparently is released when oligo-
dendroglia are damaged.
Antibodies raised against nogo neutralize the molecule's
growth-suppressing activity. Schwab and his colleagues
/Righteye
.
OptiC nerve 'J:
crush I
Optic chiasm
OptiC tract-----
Growing tip of
L- retinal ganglion
cell
Superior
colliculus
Oligodendroglia
containing nogo
. Schwann cells
lacking nogo
FIGURE A
have injected the anti-nogo antibody (called IN-I) into
adult rats after spinal cord injury. This treatment enabled
about 5% of the severed axons to regenerate-a modest
effect, perhaps, but sufficient for the animals to show a
remarkable functional recovery. The same antibodies
have also been used to localize nogo in the nervous sys-
tem. The protein is made by oligodendroglia in mammals,
but not in fish, and it is not found in Schwann cells.
One of the last steps in wiring the mammalian brain
is wrapping the young axons in myelin. This has the ben-
eficial effect of speeding action potential conduction. but
it comes with a heavy cost-the inhibition of axon
growth after injury. The lack of axon regeneration in the
adult CNS was accepted by neurologists in the last cen-
tury as a dismal fact of I,ife. However, our recent under-
standing of molecules with the power to stimulate or
inhibit CNS axon growth offers hope for the twenty-
first century that treatments can be devised to promote
axon regeneration in the damaged human brain and spinal
cord.
706 C H A PT E R 23 . WIRING THE BRAIN
Box 23.4
..... , .
OF SPECIAL INTEREST
"__ The Mystery of Autism
Autism is a developmental disorder in humans character-
ized by repetitive or stereotyped patterns of behavior and
impairments in communication and social interactions.
Although affected children appear to be normal at birth,
symptoms gradually appear over the course of the first 3
years. Among the signs first noticed by the parents of
autistic children are a failure to speak by 16 months of
age, poor eye contact. an inability to play with toys, the
obsessive attachment to a toy or object, and a failure to
smile. The gradual emergence of autism suggests an al-
tered trajectory of brain development, and current re-
search supports this conclusion. Imaging studies show
that autistic children tend to have accelerated growth of
the brain-both gray and white matter-during early
postnatal development. This finding suggests the brains of
autistic infants have too many neurons and too many
axons, although changes in glia are also possible.
Although the causes of autism are unknown, evidence
clearly indicates that certain genes put children at risk.
Input
neurons
Initial state
() () Target
neurons
Selective
cell death
Input
neurons
Following
competition
for trophic
factors
0 Q 0 Target
neurons
FIGURE 23.1 S
Matching inputs with targets by selec-
tive cell death. The input neurons are
believed to compete with one another for
limited quantities of trophic factors produced
by the target neurons.
One genetic risk factor is a mutation in the gene that
encodes a protein called FMRP. The lack of FMRP causes
fragile X syndrome, a form of mental retardation (see Box
2.5), but it also greatly increases the odds of developing
autism, from I in 500 for the general population to I in
5 for children with fragile X. FMRP normally functions to
put a brake on protein synthesis in neurons. In the ab-
sence of this protein, too many proteins are produced.
Brain growth is controlled by balancing the genesis and
destruction of cells, axons, and synapses and the proteins
that comprise them. Mutations that bring this process out
of balance, by excessive genesis or reduced destruction,
could lead to the abnormal brain growth that is ultimately
expressed as the impairments in behavior, communica-
tion, and social interactions that characterize autism. Neu-
roscientists hope that understanding how the brain nor-
mally becomes wired together will suggest therapies to
correct the altered trajectory of brain growth in children
at risk for autism.
all the way through adolescence, in which these connections are refined. It
may come as a surprise that one of the most significant refinements is a
large-scale reduction in the numbers of all those newly formed neurons and
synapses. The development of proper brain function requires a careful bal-
ance between the genesis and elimination of cells and synapses (Box 23.4).
Cell Death
Entire populations of neurons are eliminated during pathway formation, a
process known as programmed cell death. After axons have reached their
targets and synapse formation has begun, there is a progressive decline in
the number of presynaptic axons and neurons. Cell death reflects compe-
tition for trophic factors. life-sustaining substances that are provided in
limited quantities by the target cells. This process is beJieved to produce
the proper match in the number of presynaptic and postsynaptic neurons
(Figure 23.15).
A peptide called nerve growth factor (NGF) was the first trophic fac-
tor to be identified in the 1940s by Italian biologist Rita Levi-Montalcini.
NGF is produced by the targets ofaxons in the sympathetic division of the
ANS. Levi-Montalcini and Stanley Cohen found that the injection of anti-
bodies to NGF into newborn mice resulted in total degeneration of the sym-
pathetic ganglia. NGF, produced and released by the target tissue, is taken
up by the sympathetic axons and transported retrogradely, where it acts to
promote neuronal survival. Indeed, ifaxoplasmic transport is disrupted, the
neurons will die despite the release of NGF by the target tissue. Their pio-
neering work earned Levi-Montalcini and Cohen the 1986 Nobel Prize.
NGF is one of a family of related trophic proteins collectively called the
neurotTophins. Family members include the proteins NT-3, NT-4, and
'" THE ELIMINATION OF CEllS AND SYNAPSES 707
brain-derived neurotrophic factor (BDNF), which is important for the survival
of visual cortical neurons. Neurotrophins act at specific cell surface recep-
tors. Most of the receptors are neurotrophin-activated protein kinases,
called trk receptors, that phosphorylate tyrosine residues on their substrate
proteins (recall phosphorylation from Chapter 6). This phosphorylation re-
action stimulates a second messenger cascade that ultimately alters gene
expression in the cell's nucleus.
The description of cell death during development as "programmed" reflects
the fact that it is actually a consequence of genetic instructions to seIf-
destruct. The important discovery of cell death genes by Robert Horvitz at
the Massachusett; Institute of Technology was recognized with the 2004
Nobel Prize. It is now understood that neurotrophins save neurons by
switching off this genetic program. The expression of cell death genes
causes neurons to die by a process called apoptosis, the systematic disas-
sembly of the neuron. Apoptosis differs from necrosis, which is the accidental
cell death resulting from injury to cells. Research on neuronal cell death is
proceeding at a rapid pace, fueled by the promise of rescuing dying neurons
in neurodegenerative disorders, such as Alzheimer's disease (see Box 2.3)
and amyotrophic lateral sclerosis (see Box l3.I).
Changes in Synaptic Capacity
Each neuron can receive on its dendrites and soma a finite number of
synapses. This number is the synaptic capacity of the neuron. Throughout the
nervous system, synaptic capacity peaks early in development and then de-
clines as the neurons mature. For example, in the striate cortex of all
species examined so far, the synaptic capacity of immature neurons exceeds
that of adult cells by about 50%. In other words, visual cortical neurons in
the infant brain receive one-and-a-half times as many synapses as do the
neurons in adults.
When do cortical neurons lose all those synapses? Yale University scien-
tists Jean-Pierre Bourgeois and Pasko Rakic conducted a detailed study to
address this question in the striate cortex of the macaque monkey. They
discovered that synaptic capacity was remarkably constant in the striate
cortex from infancy until the time of puberty. However, during the subse-
quent adolescent period, synaptic capacity declined sharply-by almost
50% in just over 2 years. A quick calculation revealed the following star-
tling fact: The loss of synapses in the primary visual cortex during adoles-
cence occurs at an average rate of 5000 per second. (No wonder adolescence
is such a trying time!)
Once again, the neuromuscular junction has been a useful model for
studying synaptic elimination. Initially, a muscle fiber may receive input
from several different motor neurons. Eventually, however, this polyneu-
ronal innervation is lost, and each muscle fiber receives synaptic input from
a single alpha motor neuron (Figure 23.16a). This process is regulated by
electrical activity in the muscle. Silencing the activity of the muscle fiber
leads to a retention of polyneuronal innervation, while stimulation of the
muscle accelerates the elimination of all but one input.
Careful observations have revealed that the first change during synapse
elimination is the loss of postsynaptic AChRs, followed by the disassembly
of the presynaptic terminal and retraction of the axon branch. What causes
the receptors to disappear? The answer appears to be insufficient receptor
activation in an otherwise active muscle. If receptors are partially blocked
with a-bungarotoxin (see Box 5.5), they are internalized and the overlying
axon terminal withdraws (Figure 23.16b). However, if all the AChRs are
blocked, the synapses remain, because the muscle is also silent. As we will
708 C HAP T E R 2 3 . WIRING THE BRAIN
FIGURE 23.16
Synapse elimination. (a) Initially. each muscle
fiber receives inputs from several alpha motor
neurons. Over the course of development, all in-
puts but one are lost (b) Normally. postsynaptic
AChR loss precedes the withdrawal of the axon
branch. Simply blocking a subset of receptors
with a-bungarotoxin can also stimulate synapse
elimination.
Alpha motor neuron
/
- - \ Polyneuronal
innervation of
, immature muscle
1
.
AChR blockade
in small area of
neuromuscular
junction
y
, ..
..-..-..
--- ---- -
.. -.
:n, .........
Postsynaptic AChRs
! Loss of AChRs
at site of
AChR blockade
f
--
.
Maturation
, t
\ - - - \ . One alpha motor
axon innervates
one muscle fiber
.
! Withdrawal of axon
branch at site of
AChR blockade
( II
-
. I '
(a)
(b)
see in a moment a similar process appears to occur during the refinement
of connections in the CNS.
ACTIVITY-DEPENDENT
SYNAPTIC REARRANGEMENT
Imagine a neuron that has a synaptic capacity of six synapses and receives
inputs from two presynaptic neurons, A and B (Figure 23.17). One arrange-
ment would be that each of the presynaptic neurons provides three
synapses. Another arrangement is that neuron A provides one synapse and
neuron B provides five. A change from one such pattern of synapses to
another is called synaptic rearrangement. There is abundant evidence for
widespread synaptic rearrangement in the immature brain.
Synaptic rearrangement is the final step in the process of address selection.
Unlike most of the earlier steps of pathway formation, synaptic rearrange-
ment occurs as a consequence of neural activity and synaptic transmission. In the
visual system, some of this activity-dependent shaping of connections occurs
before birth in response to spontaneous neuronal discharges. However, sig-
nificant activity-dependent development occurs after birth and is influ-
enced profoundly by sensory experience during childhood. Thus, we will
find that the ultimate performance of the adult visual system is determined
[0 a significant extent by the quality of the visual environment during the
early postnatal period. In a very real sense, we learn to see during a critical
period of postnatal development.
.. ACTIVITY-DEPENDENT SYNAPTIC REARRANGEMENT 709
A
Presynaptic {
neurons
G
G
...
Synaptic
rearrangement
FIGURE 23.17
Synaptic rearrangement. The target cell receives the same number of synapses in both
cases, but the innervation pattern has changed.
The neuroscientists who pioneered this field were none other than David
Rubel and Torsten Wiesel who, you'll recall from Chapter 10, also laid the
foundation for our current understanding of the central visual system in
the adult brain. In 1981. they shared the Nobel Prize with Roger Sperry.
Macaque monkeys and cats were used by Hubel and Wiesel as models for
studies of activity-dependent visual system development because, like
humans, both of these species have good binocular vision. Recent studies
have used rodents because they are better suited for investigation of the
underlying molecular mechanisms.
Synaptic Segregation
The precision of wiring achieved by chemical attractants and repellents can
be impressive. In some circuits, however, the final refin.ement of synaptic
con.nections appears to require neural activity. A classic example is the seg-
regation of eye-specific inputs in the cat LGN.
Segregation of Retinal Inputs to the LGN. The first axons to reach the
LGN are usually those from the contralateral retina, and they spread out to
occupy the entire nucleus. Somewhat later, the ipsilateral projection arrives
and intermingles with the axons of the contralateral eye. Then the axons
from the two eyes segregate into the eye-specific domains that are charac-
teristic of the adult nucleus. Silencing retinal activity with TTX (tetrodotoxin)
prevents this process of segregation (recall that TTX blocks action potentials).
What is the source of the activity, and how does it orchestrate segregation?
Because segregation occurs in the womb, before the development of
photoreceptors, the activity cannot be driven by light stimulation. Rather,
it appears that ganglion cells are spontaneously active during this period of
fetal development. This activity is not random, however. Studies by Carla
Shatz and her colleagues at Stanford University indicate that ganglion cells
fire in quasisynchronous "waves" that spread across the retina. The origin
of the wave and its direction of propagation may be random, but during
each wave, the activity in a ganglion cell is highly correlated with the
activity of its nearest neighbors. And because these waves are generated
independently in the two retinas, the activity patterns arising in the two
eyes are not correlated with respect to each other.
Segregation is thought to depend on a process of synaptic stabilization
whereby only retinal terminals that are active at the same time as their
postsynaptic LGN target neuron are retained. This hypothetical mechanism
of synaptic plasticity was first articulated by Canadian psychologist Donald
710 C HAP T E R 2 3 . WIRING THE BRAIN
FIGURE 23.18
Plasticity at Hebb synapses. Two target
neurons in the LGN have inputs from differ-
ent eyes. Inputs from the two eyes initially
overlap and then segregate under the infiu-
ence of activity. (a) The two input neurons In
one eye (top) fire at the same time. This is
sufficient to cause the top LGN target neuron
to fire. but not the bottom one. The active In-
puts onto the active target undergo Hebblan
modification and become more effective.
(b) This is the same situation as In part a,
except that now the two input neurons in the
other eye (bottom) are active simultaneously.
causing the bottom target neuron to fire.
(c) Over time, neurons that fire together wire
together. Notice also that input cells that fire
out of sync with the target lose their link.
Synapses undergoing
Hebbian modification
--
/ ;"( .,
/ .
(a)
(c)
(b)
Bebb in the 1940s. Consequently, synapses that can be modified in this way
are called Hebb synapses, and synaptic rearrangements of this sort are
called Hebbian modifications. According to this hypothesis, whenever a
wave of retinal activity drives a postsynaptic LGN neuron to fire action
potentials, the synapses between them are stabilized (Figure 23.18). Be-
cause the activity from the two eyes does not occur at the same time, the
inputs wiJI compete on a "winner-takes-al\" basis until one input is retained
and the other is eliminated. Stray retinal inputs in the inappropriate LGN
layer are the losers because their activity does not consistently correlate
with the strongest postsynaptic response (which is evoked by the activity
of the other eye). In a moment, we explore some potential mechanisms for
such correlation-based synaptic modification.
Segregation of LGN Inputs in the Striate Cortex. In visual cortex of
monkeys and cats (but not in most other species), the inputs from LGN
neurons serving the two eyes are segregated into ocular dominance
columns. This segregation occurs before birth and appears to be due to a
combination of molecular guidance cues and retinal activity differences
(Box 23.5).
Regardless of how ocular dominance columns form, however, the appear-
ance of segregation does not mean that the axons lose their ability to
grow and retract. "Plasticity" of ocular dominance columns after birth can
be dramatically demonstrated by an experimental manipulation used by
Wiesel and Rubel, called monocular deprivation, in which one eyelid is
sealed closed. If monocular deprivation is begun shortly after birth, the
Box 23.5
" ,\
'- -II"
', ..
BRAIN FOOD
'Y ACTIVITY-DEPENDENT SYNAPTIC REARRANGEMENT 711
Ocular Dominance Columns
and Other Oddities
Ocular dominance columns (stripes, or bands, depending
on how they are viewed) are a peculiar feature of some
primates, most notably humans and macaque monkeys,
and some carnivores, notably cats and ferrets. For many
years, researchers believed that inputs from the two eyes
are initially overlapping in layer IV of visual cortex of
these species and that segregation into alternating columns
was based on the comparison of activity generated in the
retinas. Very recently, however, this notion has been chal-
lenged by the observation that eye-specific inputs to the
visual cortex of ferrets can be detected even when de-
velopment proceeds without any retinal activity at all. This
finding suggests that molecular guidance mechanisms,
rather than activity patterns, cause segregation into ocular
dominance stripes.
It is important to recognize, however, that some prob-
lems in development can have more than one solution.
The branches of the mammalian family tree leading to
modern carnivores and primates diverged very early in
evolutionary history, about 95 million years ago. Because,
most other mammals lack ocular dominance columns,
evolutionary biologists believe that the columns in carni-
"
(a)
vores and primates evolved independently, so we must be
cautious when generalizing about the mechanisms of
ocular dominance formation.
This point is nicely illustrated by studies of three-eyed
frogs, conducted in the 1980s by Martha Constantine-
Paton and her students, then at Princeton University.
Frogs don't have three eyes, of course. Normally, they
have two eyes, and each retina projects axons exclusively
to the contralateral optic tectum. However, by trans-
planting the eye bud from one embryo into the forebrain
area of another, the researchers were able to create a sit-
uation where two retinal projections were forced to
grow into the same tectum (Figure A, part a). Amazingly,
the input segregated into stripes that look very much like
the ocular dominance patterns in monkey striate cortex
(Figure A, part b). If retinal activity was blocked, however,
the axons from the two eyes rapidly became intermingled.
This experiment proves that differences in activity can
indeed be used to segregate inputs, as suggested by
Hebbian models of development.
- .
r
. ...
t
. .
\. l'
,
".
.
.
-. ....
." 1
.
.;, .,
. -.
I
_ f,.
· r
.
'.'
. .
I
. '.
.. f .:.1
'" {
," J
'. . '\.
.
. .-
\
.
,
... ..
.
..
(b)
FIGURE A
(a) This frog's third eye formed from a transplanted embryonic eyebud. (b) Tangential sections through the
tectum of a three-eyed frog, illuminated to show the distribution of radioactive axon terminals serving one
eye. (Source: Courtesy of Dr. Martha Constantine-Paton.)
712 C HAP T E R 2 3 . WIRING THE BRAIN
I '"
- '1"
'1
(a)
,"
...
, .
..
............ '.-;"6 t
'....... '-"1.. I .', ....t...
..."" . I' . I
'....., }. "".:-. .,,; . < t ' \
'\. ;\ \ . J". "J, \ t
, '. ''''''
-" \ \. \. "', "'\' \.).
. ..;\', (, .1' .,.\ .
,. :\..,- '# J.' c,' .
tt." r ,- .
; '""L-'(' ..
y ". --=\, "C: '0, ,
. ..."\ ............ -
.....".."\ "'-. .
. \. .. "
.. ' ,
.J.am
'r- . "
(b)
F!GURE 23.19
Modification of ocular dominance
stripes after monocular deprivation.
Tangential sections through layer IV of
macaque monkey striate cortex. illuminated
to show the distribution of radioactive LGN
terminals serving one eye. (a) A normal
monkey. (b) A monkey that had been monoc-
ularly deprived for 22 months, starting at 2
weeks of age. The nondeprived eye had been
injected. revealing expanded ocular dominance
columns In layer IV. (Source: Wiesel, 1982,
p. 585.)
striking result is that the "open-eye" columns expand in width while the
"closed-eye" columns shrink (Figure 23.19). Moreover, these effects of
monocular deprivation can be reversed simply by closing the previously open
eye and opening the previously closed eye. The result of this "reversed-
occlusion" manipulation is that the shrunken ocular dominance columns
of the formerly closed eye expand, and the expanded columns of the formerly
open eye shrink. Thus, LGN axons and their synapses in layer IV are highly
dynamic. even aher birth. Notice that this type of synaptic rearrangement
is not just activity dependent. it is experience dependent, because it relies on
the quality of the sensory environment.
The plasticity of ocular dominance columns does not occur throughout
life, however. Hubel and Wiesel found that if the deprivation is begun later
in life, these anatomical effects are not observed in layer IV. Thus. a criti-
cal period exists for this type of structural modification. In the macaque
monkey. the critical period for anatomical plasticity in layer IV lasts until
about 6 weeks of age. At the end of the critical period, the LGN afferents
apparently lose their capacity for growth and retraction and, in a sense, are
cemented in place.
It is important to appreciate that there are many "critical periods" during
development-specific times when developmental fate is inUuenced by the
environment (Box 23.6). In the visual cortex, the end of the critical period
for anatomical plasticity in layer IV does not spell the end of the influence
of visual experience on cortical development. As we will now see, the
synapses in striate cortex remain modifiable by experience until adoles-
cence and beyond.
Synaptic Convergence
Although the streams of information from the two eyes are initially segre-
gated, eventually they must be combined to make binocular vision possible.
The anatomical basis for binocular vision in species with ocular dominance
columns is the convergence of inputs from layer IV cells serving the right
and left eyes onto cells in layer III. These are among the last connections
to be specified during the development of the retinogeniculocortical path-
way, Again, experience-dependent synaptic rearrangement plays a major
role in this process.
Binocular connections are formed and modified under the influence of the
visual environment during infancy and early childhood. Unlike segregation
of eye-specific domains, which evidently depends on asynchronous patterns
of activity spontaneously generated in the two eyes, the establishment of
binocular receptive fields depends on correlated patterns of activity that arise from
the two eyes as a consequence of vision. This has been demonstrated clearly by
experiments that bring the patterns of activity from the two eyes out of
register. For example, monocular deprivation, which replaces patterned
activity in one eye with random activity, profoundly disrupts the binocular
connections in striate cortex. Neurons that normally have binocular recep-
tive fields instead respond only to stimulation of the nondeprived eye. This
change in the binocular organization of the cortex is called an ocular
dominance shift (Figure 23.20).
These effects of monocular deprivation are not merely a passive renec-
tion of the anatomical changes in layer IV discussed earlier. First ocular
dominance shifts can occur very rapidly, within hours of monocular depri-
vation, before any gross changes in axonal arbors can be detected (Figure
23.21). Such rapid changes reflect changes in the structure and molecular
composition of synapses without a substantial remodeling ofaxons. Second,
ocular dominance shihs can occur at ages well beyond the critical period
... ACTIVITY-DEPENDENT SYNAPTIC REARRANGEMENT 713
= 40
= 80
Q)
>-
E!
.!:: 30
UJ
c
e
::J
20
Q)
>-
E!
.!:: 60
"'40
Monocular
deprivation
o
"0
Q)
0)
10
Q)
!::?
Q)
D...
"0
Q)
0)
20
Q)
!::?
Q)
D...
o
1 2 3 4 5
(a) t Ocular dominance group t
Contralateral Ipsilateral
eye eye
2 3 4 5
t Ocular dominance group t
Closed Open
eye eye
(b)
FIGURE 23.20
The ocular dominance shift. These ocular dominance histograms were constructed
after electrophysiological recording from neurons In the striate cortex of (a) normal cats
and (b) cats after a period of monocular deprivation early in life. The bars show the per-
centage of neurons in each of five ocular dominance categories. Cells in groups I and 5 are
activated by stimulation of either the contralateral or the ipsilateral eye, respectively, but not
both. Cells in group 3 are activated equally well by either eye. Cells in groups 2 and 4 are
binocularly activated but show a preference for either the contralateral or the ipsilateral eye,
respectively. The histogram in part a reveals that the majority of neurons in the visual cortex
of a normal animal are driven binocularly. The histogram in part b shows that a period of
monocular deprivation leaves few neurons responsive to the deprived eye.
I
J
for changes in LGN axonal arbors. Finally, ocular dominance shifts occur
in all mammals that have binocular vision, not just those few species with
ocular dominance columns. However, such ocular dominance plasticity also
diminishes with age, disappearing in many species by the onset of adoles-
cence (Figure 23.22).
The critical period of maximal ocular dominance plasticity coincides with
the time of greatest growth of the head and eyes. Thus, it is believed that
the plasticity of binocular connections is normally required for maintaining
good binocular vision throughom this period of rapid growth. The hazard
associated with such activity-dependent fine-tuning is that these connec-
tions are also highly susceptible to deprivation.
Synaptic Competition
As you well know, a muscle that is not used regularly will atrophy and
lose strength; hence the saying, "Use it or lose it." Is the disconnection of
activity-deprived synapses simply a consequence of disuse? This does not
appear to be the case in striate cortex, because the disconnection of a deprived
eye input requires that the open-eye inputs be active. Rather, a process of
binocular competition evidently occurs, whereby the inputs from the
two eyes actively compete for synaptic control of the postsynaptic neuron.
If the activity of the two eyes is correlated and equal in strength, the two
inputs will be retained on the same cortical cell. However, if this balance is
disrupted by depriving one eye, the more active input will somehow displace
the deprived synapses or cause them to be less effective.
Competition in visual cortex is demonstrated by the effects of strabismus,
a condition in which the eyes are not perfectly aligned (i.e., they are "cross-
eyed" or "wall-eyed"). This common visual disorder in humans can result
in the permanent loss of stereoscopic vision. Experimental strabismus is
UJ
c
Q)
o
a.
c
.Q
t5
ro
"0
Q;
.D
E
::J
Z
Left-eye
response
Right-eye
response
Right-eye
response
101lrJ.
(b) After 17-hour right-eye deprivation
Time_____
(a) Initial state
UJ
c
Q)
o
a.
c
.Q
t5
ro
"0
Q;
.D
E
::J
Z
Left-eye
response
FIGURE 23.2/
Rapid shifts in ocular dominance. These
histograms show the number of action poten-
tials generated by a single neuron in the visual
cortex of a young kitten. A visual stimulus was
presented at the times indicated by the yellow
bars. (a) Initial responses, before a period of
monocular deprivation. Notice that although
there is a slight ocular dominance favoring the
right eye, each eye evokes a strong response.
(b) -me same neuron, recorded after I 7
hours of monocular deprivation of the right
eye. The eye that had been deprived is no
longer able to evoke a response (Source:
Adapted from Mioche and Singer. 1989.)
Time-----
L..t
1 2 3 4 5
Ocular
dominance
group
714 C HAP T E R 2 3 . WIRING THE BRAIN
Q) 70 U
g>.!Q
em
Q)U
u_
ID o
Q.. 0
1 234 5
"0
Q)
ro
c
100
Q) 80
"0>'
UJQ)
=(ij
E 60
CO
Q)c
g> E 40
C
Q)
Q)
Q..
20
o
(a)
8
Age (weeks)
= 40
(JJ
>.
c 30
UJ
C
:J
20
15
Q)
OJ
19
I]l
I
2 3 4
(a) Ocular dominance group
5
15 20
Q)
OJ
cu
10
U
CD
Q..
o
2 3 4
(b) Ocular dominance group
5
FIGURE 23.23
The effects of strabismus on cortical
binocularity. (a) An ocular dOminance
histogram from a normal animal like that in
Figure 23.20a. (b) In this case, the eyes have
been brought out of alignment by cutting one
of the eye muscles. After a brief period of
strabismus, binocular cells are almost com-
pletely absent. The cells in visual cortex are
driven by either the right or the left eye, but
not by both.
12
c
cu
Ec
:J.Q
.r -
cu
-> 100
o'i::
>. 0-
:;;0)
:.c;"O
E. 80
Q):J
uu
UJO
:Jc
UJO 60
cuE
.8
Xc
CUo 40
E--
UJ
0">
Q)n;
OJ-
cu:J 20
_U
cO Birth 3 6 9
(JJC
U'-
.o Age (years)
(JJ (b)
Q..
16
FIGURE 23.22
The critical period for plasticity of binocular connection. These graphs shOw
the sensitivity of binocular connections to monocular deprivation (of the contralateral eye)
Initiated at different postnatal ages In a kitten. (a) The ocular dominance shifts recorded In
kittens in response to 2 days of monocular deprivation. The line graph plots the decline in
plasticity as a function of age, and the histograms show the corresponding ocular dominance
shifts. (b) An estimate of the developmental decline of plasticity of binocular connections in
humans. (Source: Adapted from Mower. 1991.)
produced by surgically or optically misaligning the two eyes, thereby
causing visually evoked patterns of activity from the two eyes to arrive out
of sync in the cortex. If you press gently with a finger alongside one eye,
you can see the consequences of misalignment of the two eyes. A total loss
of binocular receptive fields occurs following a period of strabismus, even
though the twO eyes retain equal representation in the cortex (Figure
23.23). This is a clear demonstration that the disconnection of inputs from
one eye results from competition rather than disuse (the two eyes are
equally active, but for each ceIL a "winner takes all"). If produced early
enough, strabismus can also sharpen the segregation of ocular dominance
columns in layer IV.
The changes in ocular dominance and binocularity after deprivation have
clear behavioral consequences. An ocular dominance shift after monocular
deprivation leaves the animal visually impaired in the deprived eye, and
the loss of binocularity associated with strabismus completely eliminates
stereoscopic depth perception. However, neither of these effects is irre-
versible if corrected early enough in the critical period. The clinical lesson
is clear: Congenital cataracts or ocular misalignment must be corrected in
early childhood, as soon as surgically feasible, to avoid permanent visual
disability.
\
Modulatory Influences
With increasing age, there appear to be additional constraints on the forms
of activity that will cause modifications of cortical circuits. Before birth,
spontaneously occllrring bursts of retinal activity are sufficient to orches-
trate aspects of address selection in the LGN and cortex. After birth, an in-
teraction with the visual environment is of critical importance. However,
even visually driven retinal activity may be insufficient for modifications of
binocularity during this critical period. Increasing experimental evidence
Box 23.6
t ;, ) .. i,
. -
. ..
BRAIN FOOD
.., ACTIVITY-DEPENDENT SYNAPTIC REARRANGEMENT 715
The Critical Period Concept
)
A critical period of development may be defined as a
period of time in which intercellular communication alters
a cell's fate. The concept is usually credited to the exper-
imental embryologist Hans Spemann. Working around the
turn of the twentieth century, Spemann showed that trans-
plantation of a piece of early embryo from one location
to another often caused the "donor" tissue to take on the
characteristics of the "host," but only if transplantation
had taken place during a well-defined time period. Once
the transplanted tissue had been induced to change its
developmental fate, the outcome could not be reversed.
The intercellular communication that altered the physical
characteristics (the phenotype) of the transplanted cells
was shown to be mediated by both contact and chemical
signals.
The term took on new signifr,cance with respect to
brain development as a result of the work of Konrad
Lorenz in the mid-1930s. Lorenz was interested in the
process by which young graylag geese become socially at-
tached to their mother. He discovered that in the absence
of the mother, the young geese formed social attachments
to a wide variety of moving objects, including Lorenz him-
self (Figure A). Once imprinted on an object, the goslings
would follow it and behave toward it as if it were their
mother. Lorenz used the word "imprinting" to suggest
that this first visual image was somehow permanently
etched in the young bird's nervous system. Imprinting was
also found to be limited to a finite window of time (the
first 2 days after hatching), which Lorenz called the "criti-
cal period" for social attachment. Lorenz himself drew the
analogy between this process of imprinting the external
environment on the nervous system and the induction of
tissue to change its developmental fate during critical
periods of embryonic development.
This work had a tremendous impact in the field of
developmental psychology. The very terms imprinting and
critical period suggested that changes in the behavioral
phenotype caused by early sensory experience were per-
manent and irreversible later in life, much like the deter-
mination of tissue phenotype during embryonic develop-
ment. Numerous studies extended the critical period con-
cept to aspects of mammalian psychosocial development.
The fascinating implication was that the fate of neurons
and neural circuits in the brain depended on the experi-
ence of the animal during early postnatal life. It is not dif-
ficult to appreciate why research in this area took on
social as well as scientific significance.
By necessity, the effects of experience on neuronal fate
must be exercised by neural activity generated at the sen-
sory epithelia and communicated by chemical synaptic
transmission. The idea that synaptic activity can alter the
fate of neuronal connectivity during CNS development
first received solid neurobiological support from the study
of mammalian visual system development, beginning with
the experiments of Hubel and Wiesel. Using anatomical
and neurophysiological methods, they found that visual
experience (or lack thereof) was an important determi-
nant of the state of connectivity in the central visual path-
ways and that this environmental influence was restricted
to a finite period of early postnatal life. A great deal of
work has been devoted to the analysis of experience-
dependent plasticity of connections in the visual system.
Thus, it is an excellent model for illustrating the principles
of critical periods in nervous system development.
\,
--
...,
.=- ,
-
-==
-
"'
-
---- - -
:t .
FIGURE A
Konrad Lorenz with graylag geese.
(Source: Nina Leenffime Pix.)
indicates that such modifications also require the animals to pay attention
to visual stimuli and use vision to guide behavior. For example, modifications
of binocularity following monocular stimulation do not occur when animals
are kept anesthetized, even though it is known that cortical neurons respond
briskly to visual stimulation under this condition. These and related ob-
servations have led to the proposal that synaptic plasticity in the cortex
requires the release of extraretinal "enabling factors" that are linked to
behavioral state (level of alertness, for example).
716 C HAP T E R 2 3 . WIRING THE BRAIN
FIGURE 23.24
The dependence of plasticity of binocu-
lar connections on modulatory inputs.
(a) A midsagittal view of a cat brain. showing
the trajectory of two modulatory inputs to
striate cortex. One arises in the locus
coeruleus and uses NE as a transmitter, and
the other arises in the basal forebrain com-
plex and uses ACh as a transmitter. The activ-
ity of both of these inputs IS related to levels
of attention and alertness. If these systems are
Intact, monocular deprivation will produce the
expected ocular dominance shift, shown in
the histogram at the right. (b) The result of
depleting the cortex of these modulatory
Inputs. Monocular deprivation has little effect
on the binocular connections in striate cortex.
(Source: Adapted from Bear and Singer, 1986.)
Striate cortex
(area 17)
-
{
'\.
t-
Basal forebrain
complex
Locus
coeruleus
(a)
Stnate cortex
(area 17)
/
Knife cut
)-. \ -
(
"-.
'\.
t- "
Locus
coeruleus
--J
Basal forebrain
complex
(b)
60
50
e
:J
40
'0
30
(\\
C
20
Qj
0...
10
o
2 3 4
Ocular dominance group
5
40
U)
c
30
(!)
c
'0
20
(\\
C
(!)
()
Q5 10
0...
o I I
2 3 4 5
t Ocular dominance group t
Closed Open
eye eye
Some progress has been made in identifying the physical basis of these
enabling factors. Recall that a number of diffuse modulatory systems inner-
vate the cortex (see Chapter 15). These include the noradrenergic inputs
from the locus coeruleus and the cholinergic inputs from the basal fore-
brain. The effects of monocular deprivation have been studied in animals
in which these modulatory inputs to striate cortex were eliminated. This
was found to cause a substanrial impairment of ocular dominance plastic-
ity, even though transmission in the retinogeniculocortical pathway was
apparently normal (Figure 23.24).
.. ELEMENTARY MECHANISMS
OF CORTICAL SYNAPTIC PLASTICITY
Synapses form in the absence of any electrical activity, However, as we
have seen, the awakening of synaptic transmission during development
plays a vital role in the final refinement of connections. Based on the analy-
sis of experience-dependent plasticity in the visual cortex and elsewhere,
we can formulate two simple "rules" for synaptic modification:
1. When the presynaptic axon is active and, at the same time, the postsy-
naptic neuron is strongly activated under the influence of other inputs,
then the synapse formed by the presynaptic axon is strengthened. This
is another way of stating Hebb's hypothesis, mentioned previously. In
other words, neurons that fire together wire togerher.
. ELEMENTARY MECHANISMS OF CORTICAL SYNAPTIC PLASTICITY 717
2. When the presynaptic axon is active and, at the same time, the postsy-
naptic neuron is weakly activated by other inputs, then the synapse formed
by the presynaptic axon is weakened. In other words, neurons that fire out
of sync lose their link.
The key appears to be correlation. Remember that in most locations in the
CNS, including the visual cortex, a single synapse has little influence on the
firing rate of the postsynaptic neuron. To be "heard," the activity of the
synapse must be correlated with the activity of many other inputs con-
verging on the same postsynaptic neuron. When the activity of the synapse
consistently correlates with a strong postsynaptic response (and, therefore,
the activity of many other inputs), the synapse is retained and strength-
ened. When synaptic activity consistently fails to correlate with a strong
postsynaptic response, the synapse is weakened and eliminated. In this
way, synapses are "validated" based on their ability to participate in the
firing of their postsynaptic partner.
What mechanisms underlie such correlation-based synaptic modifica-
tions? The answer requires knowledge of the mechanisms of excitatory
synaptic transmission in the brain.
Excitatory Synaptic Transmission
in the Immature Visual System
Glutamate is the transmitter at all of the modifiable synapses we have
discussed (retinogeniculate, geniculocortical. and corticocortical). and it
activates several subtypes of postsynaptic receptors. Recall from Chapter 6
that neurotransmitter receptors may be classified into two broad categories:
G-protein-coupled, or metabotropic, receptors; and transmitter-gated ion
channels (Figure 23.25). Postsynaptic glutamate-gated ion channels allow
the passage of positively charged ions into the postsynaptic cell and may be
further classified as either AMPA receptors or NMDA receptors. AMPA and
NMDA receptors are colocalized at many synapses.
An NMDA receptor has two unusual features that distinguish it from
an AMPA receptor (Figure 23.26). First, NMDA receptor conductance is
voltage gated, owing to the action of Mg H at the channel. At the resting
.4
.
. .
.
.
.
..
- -
. -/
.
Glutamate
AMPA receptor
/'
NMDA receptor
Metabotropic
glutamate recePt /
'\
Postsynaptic
dendritic spine
FIGURE 23.25
Glutamate receptors at excitatory synapses.
718 C HAP T E R 23 . WIRING THE BRAIN
(( ..
' ... .
. ..
. .
Presynaptic .. \
glutamate / . Glutamate
release
Mg 2 +
.--/.
-1
i AMPA
receptor
Na+
NMDA
receptor
(a) Postsynaptic membrane at
resting potential
(
'-
presynaptic / .
glutamate ·
release
b..
\
AMPA
receptor
Na+
- NMDA
Ca 2 + receptor
Na+
(b) Postsynaptic membrane at
depolarized potential
FIGURE 23.26
NMDA receptors activated by simul-
taneous presynaptic and postsynaptic
activity. (a) Presynaptic activation causes the
release of glutamate. which acts on postsynap-
tic AMPA receptors and NMDA receptors.
At the negative resting membrane potential.
the NMDA receptors pass little ionic current
because they are blocked with Mgl+ Ions.
(b) If glutamate release coincides with depo-
larization sufficient to displace the Mg2+ ions,
then Ca2+ will enter the postsynaptic neuron
via the NMDA receptor. Hebbian modification
could be explained If the Ca2+ admitted by
the NMDA receDtor were to trigger en-
hanced synaptic effectiveness.
membrane potential. the inward current through the NMDA receptor is
interrupted by the movement of Mg H ions into the channeL where they
become lodged. As the membrane is depolarized. however. the Mg H block
is displaced from the channel. and current is free to pass into the cell. Thus.
substantial current through the NMDA receptor channel requires the con-
current release of glutamate by the presynaptic terminal and depolarization
of the postsynaptic membrane. The other distinguishing feature of an
NMDA receptor is that its channel conducts Ca H ions. Therefore. the
magnitude of the Cau flux passing through the NMDA receptor channel specifically
signals the level of pre- and postsynaptic coactivation.
Curiously. when a glutamatergic synapse first forms. only NMDA recep-
tors appear in the postsynaptic membrane. As a consequence. released glu-
tamate at a single synapse evokes little response when the postsynaptic
membrane is at the resting potential. Such "silent" synapses announce their
presence only when enough of them are active at the same time to cause
sufficient depolarization to relieve the Mg H block of the NMDA receptor
channels. In other words. "silent" synapses "speak" only when there is
highly correlated activity-the necessary condition for synaptic enhance-
ment during development.
Long-Term Synaptic Potentiation
Perhaps NMDA receptors serve as Hebbian detectors of simultaneous
presynaptic and postsynaptic activity. and Ca H entry through the NMDA
receptor channel triggers the biochemical mechanisms that modify synaptic
effectiveness. Tests of this hypothesis have been performed by electri-
cally stimulating axons to monitor the strength of synaptic transmission
before and after an episode of strong NMDA receptor activation (Figure
23.27a. b). Results consistently indicate that a consequence of strong NMDA
receptor activation is a strengthening of synaptic transmission. called long-
term potentiation (LTP).
What accounts for LTP of the synapse? One consequence of the strong
NMDA receptor activation. and the resulting flood of Ca H ions into the
postsynaptic dendrite. is the insertion of new AMPA receptors into the
synaptic membrane (Figure n.27c). Such" AMPAfication" of the synapse
makes transmission stronger. In addition to this change in the complement of
glutamate receptors. recent evidence suggests that the synapses can actually
split in half following LTP induction. forming distinct sites of synaptic contact.
Cortical neurons grown in tissue culture form synapses with one another
and become electrically active. The immature synapses contain clusters of
NMDA receptors but few AMPA receptors. Consistent with the idea that
LTP is a mechanism for synaptic maturation, electrically active synapses
gain AMP A receptors over the course of development in cell culture. This
change fails to occur. however. if NMDA receptors are blocked with an an-
tagonist. Thus. the strong activation of NMDA receptors that occurs when
pre- and postsynaptic neurons fire together appears to account, at least in
part, for why they wire together during visual system development. (We
will discuss LTP and its molecular basis further in Chapter 25.)
Long-Term Synaptic Depression
Neurons that fire out of sync lose their link. In the case of strabismus, for
example, synapses whose activity fails to correlate with that of the postsy-
naptic cell are weakened and then eliminated. Similarly, during monocular
deprivation. the residual activity in the deprived retina fails to correlate
with the responses evoked in conical neurons by the seeing eye, and the
Presynaptic
shock
(a)
Axon
NMDA receptor
AMPA receptor
Postsynaptic
EPSP
G
[<lc
(c)
CD Before L TP induction
.. ELEMENTARY MECHANISMS OF CORTICAL SYNAPTIC PLASTICITY 719
200
ID
.
.Q]j
OJ <0
UJ.D
5 '0 150
5f#
OJ -
-'"
u u
+=0
D- .<::
<0 UJ
5., g 100
1!2"D-
UJ <0
o c
Il..
D-
Postconditioning
measurements
................. t ........
... LTP
..... .................10'" - -. - - -. - - - - -- - -- --.- n - n - __ - __ - n_ - n -.
Baseline measurements
CD
@
@
50
-15
15
30
o
(b)
t
Time (min)
Apply conditioning stimulation
to produce strong activation
of NMDA receptors
Axon
Axon
Dendrite
Dendrite
f Ca ' r.-
.,.-
o
'-'--
Ca 2 + I S
- . --
@ During L TP induction
@ After L TP induction
FiGURE 23.27
The lasting synaptic effects of strong NMDA receptor activation. (a) An experi-
ment in which presynaptic axons are stimulated electrically to evoke an action potential and
microelectrode recordings of the resulting EPSPs are made from the postsynaptic neuron.
(b) This graph shows how the strength of synaptic transmission IS changed by strong
NMDA receptor activation. The conditioning stimulation consists of depolarizing the post-
synaptic neuron via current injection through the microelectrode, at the same time that the
synapses are repeatedly stimulated. LTP is the resulting enhancement of synaptic transmis-
sion. (c) LTP at many synapses IS associated With the insertion of AMPA receptors Into
synapses that previously had none. The circled numbers correspond to the times before
and after LTP in part b.
720 C HAP T E R 2 3 . WIRING THE BRAIN
deprived-eye synapses are weakened. What mechanism accounts for this
form of synaptic plasticity?
In principle, weak coincidences could be signaled by lower levels of
NMDA receptor activation and less Ca2+ influx. Indeed, experiments sug-
gest that the lower level of Ca2+ admitted under these conditions triggers
an opposite form of synaptic plasticity, long-term depression (LTD),
whereby the active synapses are decreased in effectiveness. One conse-
quence of LTD induction is a loss of AMPA receptors from the synapse, the
exact opposite of LTP. We do not yet know whether the long-term conse-
quence of LTD is synapse elimination, but it is an appealing hypothesis. Re-
caB that at the neuromuscular junction, the loss of postsynaptic receptors
stimulates the physical retraction of the presynaptic axon.
Recent studies in the visual cortex of rats and mice have confirmed that
one consequence of monocular deprivation is the loss of AMPA receptors
from the surface of visual cortical neurons. This change, like the loss of
visual responsiveness, requires residual activity in the deprived retina and
activation of cortical NMDA receptors. Thus, it is now possible to reconstruct,
at least in rough outline, what happens when an animal is monocularly de-
prived by closing one eyelid (Figure 23.28). Eyelid closure prevents proper
image formation on the retina; therefore, it replaces weJl-correlated retinal
ganglion ceJl activity with less-correlated activity that can be considered as
static or noise. This activity, presynaptic to neurons in visual cortex, rarely
correlates with a strong postsynaptic response and therefore only weakly
activates NMDA receptors. The modest entry of Ca 2 -'- through the NMDA
receptors initiates a cascade of molecular events that results in the removal
of AMPA receptors from the visuaJly deprived synapse. With fewer AMPA
receptors, these synapses lose influence over responses of cortical neurons.
* * *
How are presynaptic and postsynaptic correlations used to refine synap-
tic connections in the visual system? The data accumulated thus far suggest
that the maintenance of some connections formed during development
depends on their success in evoking an NMDA receptor-mediated response
beyond some threshold level. Failure to achieve this threshold leads to dis-
connection. Both processes depend on activity originating in the retina,
NMDA receptor activation, and postsynaptic Ca2+ entry.
... WHY CRITICAL PERIODS END
Although plasticity of visual connections persists in the adult brain, the
range over which this plasticity occurs constricts with increasing age. Early
in development, gross rearrangements of axonal arbors are possible, while
in the adult, plasticity appears to be restricted to local changes in synaptic
efficacy. In addition, the adequate stimulus for evoking a change also appears
to be increasingly constrained as the brain matures. An obvious example is
the fact that simply patching one eye will cause a profound alteration in
the binocular connections of the superficial layers during infancy, but by
adolescence, this type of experience typically fails to cause a lasting alter-
ation in cortical circuitry.
Why do critical periods end? Here are three current hypotheses:
1. Plasticity diminishes when axon growth ceases. We've seen that there is a
period of several weeks when the geniculate arbors can contract and ex-
pand within layer IV under the influence of visual experience. Thus, a
factor that limits the critical period in layer IV could be a lo s of the
capability for changes in axon length, which in turn may be due to
Cortical
neuron
Axons carrying
activity from
closed eye
Axon from !
LGN
"Noise" Correlated
patterns
)
Dendrite
... WHY CRITICAL PERIODS END 721
Axons carrying
activity from
open eye
CD Weak NMDA receptor activation
by poorly correlated activity
triggers loss of AMPA receptors
changes in the extracellular matrix or the myelination of the axons by
oligodendroglia.
2. Plasticity diminishes when synaptic transmission matures. The end of a critical
period may reflect changes in the elementary mechanisms of synaptic
plasticity. Evidence indicates that glutamate receptors change during
postnatal development. For example, it has been shown that the activa-
tion of metabotropic glutamate receptors stimulates very different post-
synaptic responses in striate cortex during the critical period when binoc-
ular connections are most susceptible to monocular deprivation. In
addition, the molecular composition and properties of NMDA receptors
change during the course of the critical period. Accordingly, the proper-
ties of LTP and LID vary with age and, at some synapses, they seem to
disappear altogether.
3. Plasticity diminishes when cortical activation is constrained. As development
proceeds, certain types of activity may be filtered by successive synaptic
relays to the point where they no longer activate NMDA receptors, or
other elementary mechanisms, sufficiently to trigger plasticity. As
mentioned previously, ACh and NE facilitate synaptic plasticity in the
superficial cortical layers, perhaps simply by enhancing polysynaptic
intracortical transmission. A decline in the effectiveness of these neuro-
transmitters, or a change in the conditions under which they are released,
may contribute to the decline in plasticity. Indeed, evidence suggests that
supplementing the adult cortex with NE can restore some degree of
modifiability.
60
00
00
@ Strong NMDA receptor activation
by well-correlated activity
maintains AMPA receptors
FIGURE 23.28
How brief monocular deprivation leads
to reduced visual responsiveness.
Closing one eye replaces well-correlated
presynaptic action potentials (denoted as
yellow dots) with less correlated "noise."The
noise weakly activates NMDA receptors, and
the resulting modest increases in Ca H cause
internalization of AMPA receptors. On the
other hand. the well-correlated activity
strongly depolarizes the postsynaptic neurons
and stimulates large increases in Ca 2 +, which
stimulate AMPA receptor delivery to the
synapse.
722 CHAPTER 23 . WIRING THE BRAIN
>-V>
wL:
a:::
w
J-
The Genesis of Neurons
subplate (p. 693)
radial glial cell (p.694)
neuroblast (p. 694)
cortical plate (p. 695)
The Genesis of Connections
growth cone (p. 698)
extracellular matrix (p. 698)
fasciculation (p. 698)
cell-adhesion molecule (CAM)
(p. 699)
chemoattractant (p.699)
netrin (p.699)
Evidence also indicates that intrinsic inhibitory circuitry is late to mature
in the striate cortex. Consequently, patterns of activity that may have
gained access to modifiable synapses in superficial layers early in postnatal
development might be tempered by inhibition in the adult. Consistent with
the idea that inhibition regulates the duration of the critical period, recent
research in mice has shown that genetic manipulations that accelerate
the maturation of GABAergic inhibition in visual cortex also shorten the
duration of the critical period for ocular dominance plasticity. Conversely,
manipulations that slow the development of inhibition can prolong the
critical period.
The question of why critical periods end is important. Synaptic modifi-
cation and rewiring of circuitry provide the capacity for some recovery of
function after CNS damage. However, such recovery is disappointingly
limited in the adult brain. On the other hand, the recovery of function af-
ter brain injury can be nearly 100% in the immature nervous system when
synaptic rearrangements are widespread. Thus, an understanding of how
plasticity is regulated during normal development may suggest ways to
promote recovery from damage later in life.
CONCLUDING REMARKS
We have seen that the generation of circuitry during brain development
occurs mostly before birth and is guided by cell-to-cell communication
through physical contact and by diffusible chemical signals. Nonetheless,
while most of the "wires" find their proper place before birth, the final re-
finement of synaptic connections, particularly in the cortex, occurs during
infancy and is influenced by the sensory environment. Although we have
focused on the visual system, other sensory and motor systems are also
readily modified by the environment during critical periods of early child-
hood. In this way, our brain is a product not only of our genes, but also of
the world in which we grow up.
The end of developmental critical periods does not signify an end to
experience-dependent synaptic plasticity in the brain. Indeed, the environ-
ment must modify the brain throughout life, or there would be no basis for
memory formation. In the next two chapters, we'll explore the neurobiol-
ogy of learning and memory. We will see that the mechanisms of synaptic
plasticity proposed to account for learning bear a close resemblance to those
believed to playa role in synaptic rearrangement during development.
chemorepellem (p. 699)
chemoaffinity hypothesis (p. 702)
ephrin (p. 702)
Hebbian modification (p. 710)
monocular deprivation (p. 710)
critical period (p. 712)
ocular dominance shift (p. 712)
binocular competition (p. 713)
strabismus (p. 713)
The Elimination of Cells
and Synapses
trophic factor (p.706)
nerve growth factor (NGF) (p. 706)
neurotrophin (p. 706)
apoptosis (p. 707)
Elementary Mechanisms of
Cortical Synaptic Plasticity
long-term potentiation (LTP)
(p.718)
long-term depression (LTD)
(p. 720)
Activity-Dependent Synaptic
Rearrangement
Hebb synapse (p. 710)
rlf!r
,LLJ
l/)
w Z
o
>
wI-
a:::l/)
w
:J
a
'f' CONCLUDING REMARKS 723
I. What do we mean by saying that the cortex develops "inside-out"?
2. Describe the three phases of pathway formation. In which phase (or phases) does neural activity playa role?
3. What are three ways that Ca H is thought to contribute to the processes of synapse formation and re-
arrangement?
4. How are the elimination of polyneuronal innervation of a muscle fiber and the segregation of retinal termi-
nals in the LGN similar? How do these processes differ?
5. Not long ago, when a child was born with strabismus, the defect usually was not corrected until after ado-
lescence. Today, surgical correction is always attempted during early childhood. Why? How does strabismus
affect the connections in the brain, and how does it affect vision?
6. Children are often able to learn several languages apparently without effort, while most adults must strug-
gle to master a second language. From what you know about brain development, why would this be true?
7. Neurons that fire out of sync lose their link. Why?
60.
a:::CJ
Wz
I-
1-0
a:::«
:Jw
LL.a:::
Bear ME 2003. Bidirectional synaptic plasticity: from
theory to reality. Philosophical Transactions of the
Royal Society of London. Series B: Biological
Sciences (London) 358:649-655.
Goda Y, Davis GW 2003. Mechanisms of synapse
assembly and disassembly. Neuron 40:243-264.
Katz LC, Crowley Jc. 2002. Development of cortical
circuits: lessons from ocular dominance columns.
Nature Reviews Neuroscience 3( I ):34--42.
Mclaughlin T, O'Leary DDM. 2005. Molecular gradi-
ents and development of retinotopic maps. Annual
Review of Neuroscience 28:327-355.
Whitford KL, Pijkhuizen P, Polleux F, Ghosh A. 2002.
Molecular control of cortical dendrite develop-
ment. Annual Review of Neuroscience 25: 127-149.
Wiesel T. 1982. Postnatal development of the visual
cortex and the influence of the environment.
Nature 299:583-592.
CHAPTER
Memory Systems
(
INTRODUCTION
TYPES OF MEMORY AND AMNESIA
DECLARATIVE AND NON DECLARATIVE MEMORY
. Box 24.1 Of Special Interest: An Extraordinary Memory
LONG-TERM, SHORT-TERM,AND WORKING MEMORY
AMNESIA
. Box 24.2 Of Special Interest: A Fish Tale of Memory Loss
THE SEARCH FOR THE ENGRAM
LASHLEY'S STUDIES OF MAZE LEARNING IN RATS
HEBB AND THE CELL ASSEMBLY
. Box 24.3 Brain Food: A Model of a Distributed Memory
LOCALIZATION OF DECLARATIVE MEMORIES IN THE NEOCORTEX
Studies in Monkeys
Studies in Humans
ELECTRICAL STIMULATION OF THE HUMAN TEMPORAL LOBES
THE TEMPORAL LOBES AND DECLARATIVE MEMORY
THE EFFECTS OF TEMPORAL LOBECTOMY
A Human Case Study: H.M.
THE MEDIAL TEMPORAL LOBES AND MEMORY PROCESSING
An Animal Model of Human Amnesia
THE DIENCEPHALON AND MEMORY PROCESSING
A Human Case Study: N.A.
Korsakoff's Syndrome
MEMORY FUNCTIONS OF THE HIPPOCAMPUS
The Effects of HiPpocampal Lesions in Rots
Spatial Memory and Place Cells
. Box 24.4 Path of Discovery: A Brief History of the Water Maze, by Richard Morris
Spatial Memory, Working Memory, and Relational Memory
THE STRIATUM AND PROCEDURAL MEMORY
RODENT RECORDINGS AND LESIONS IN THE STRIATUM
HABIT LEARNING IN HUMANS AND NONHUMAN PRIMATES
THE NEOCORTEX AND WORKING MEMORY
THE PREFRONTAL CORTEX AND WORKING MEMORY
Imaging Working Memory in the Human Brain
AREA LIP AND WORKING MEMORY
CONCLUDING REMARKS
726 C HAP T E R 24 . MEMORY SYSTEMS
. INTRODUCTION
The brain has numerous systems for performing functions related to sen-
sation, action, and emotion, and each system contains billions of neurons
with enormous numbers of interconnections. In Chapter 23, we explored
the mechanisms that guide the construction of these systems during brain
development. But as impressive and orderly as prenatal development is, no
one would confuse a newborn baby and a Nobel Prize winner. Much of
the difference between the two comes down to what has been learned and
remembered. From the moment we take our first breath, and possibly be-
fore, the sensory stimuli we experience modify our brain and influence our
behavior. We learn an enormous number of things-some straightforward
(snow is cold), and others more abstract (an isosceles triangle has two sides
of equal length). Some of the things we learn are easily stated facts, while
others, such as driving or playing soccer, are ingrained motor patterns. We
will see that brain lesions differentially affect different types of remembered
information, suggesting that there is more than one memory system.
There is a close relationship between what we called experience-dependent
brain development in Chapter 23 and what we call learning in this chapter.
Visual experience during infancy is essential for the normal development
of the visual cortex, but it also aJlows us to recognize an image of our
mother's face. Visual development and learning probably use similar mech-
anisms, but at different times and in different cortical areas. Viewed in this
way, learning and memory are the lifelong adaptations of brain circuitry to
the environment. They enable us to respond appropriately to situations we
have experienced before.
In this chapter, we discuss the anatomy of memory-the different parts
of the brain involved in storing particular types of information. In Chapter
25, we wiJl focus on the elementary synaptic mechanisms that can store
information in the brain.
. TYPES OF MEMORY AND AMNESIA
Learning is the acquisition of new information or knowledge. Memory is
the retention of learned information. We learn and remember lots of dif-
ferent things, and it is important to appreciate that these various things
might not be processed and stored by the same neural hardware. No single
brain structure or cellular mechanism accounts for all learning. Moreover,
the way in which information of a particular type is stored may change
over time.
Declarative and Nondeclarative Memory
Psychologists have studied learning and memory extensively, and they
have distinguished what appear to be different types. A useful distinction for
our purposes is between declarative memory and nondeclarative memory.
During the course of our lives, we learn many facts-the capital of
Thailand is Bangkok; the coyote will never catch the roadrunner. We also
store memories of life's events-"I had Cheerios for breakfast"; "1 heard a
boring chemistry lecture yesterday." Memory for facts and events is called
declarative memory (Figure 24.1). Declarative memory is what we
usually mean by the word "memory:' in everyday usage, but we actually
remember many other things. These non declarative memories fall
into several categories. The type we are most concerned with here is pro-
cedural memory, or memory for skills, habits, and behaviors. We learn
to play the piano, throw a Frisbee, or tie our shoes, and somewhere that
Declarative memory
(Medial temporal lobe; diencephalon)
... TYPES OF MEMORY AND AMNESIA 727
Nondeclarative memory
/'
Procedural memory:
skills and habits
(Striatum)
Skeletal musculature
(Cerebellum)
Emotional responses
(Amygdala)
Facts
Events
{
,r'
{I'
"
"'-
i
.-. .
".,
+ .: :
(1\ .. .
'.
\
L-
,
I
r
information is stored in our brain. In Chapter 18, we discussed learned fear,
another type of nondeclarative memory that involves the amygdala. We'll
explore other forms of nondeclarative memory in Chapter 25.
Generally, declarative memories can be accessed for conscious recollec-
tion, and nondeclarative memories cannot. However, the tasks we learn, as
well as the reflexes and emotional associations we have formed, operate
smoothly without conscious recollection. As the old saying goes, you never
forget how to ride a bicycle. You may not explicitly remember the day you
first rode a two-wheeler on your own (the declarative part of the memory),
but your brain remembers what to do when you're on one (the procedural
part of the memory). Nondec1arative memory is also frequently called implicit
memory, because it results from direct experience, and declarative memory
is often called explicit memory, because it results from more conscious effort.
Another distinction is that declarative memories are often easy to form
and are easily forgotten. By contrast, forming nondeclarative memories tends
to require repetition and practice over a longer period of time, but these
memories are less likely to be forgotten. Think of the difference between
memorizing the capitals of foreign countries and learning to ski. While
there is no clear limit to the number of declarative memories the brain can
store, there can be great diversity in the ease and speed with which new
information is acquired. Studies of humans with abnormally good memories
suggest that the limit on the storage of declarative information is remark-
ably high (Box 24.1).
Long-Term, Short-Term, and Working Memory
From daily experience, we know that some memories last longer than
others. Long-term memories are those that you can recall days, months,
or years after they were originally stored. For example, you can probably
recall a birthday or holiday you had as a young child. But not all memories
make it into long-term storage. What did you have for dinner last night?
You probably have no problem remembering. But how about dinner a
week ago? Chances are that this memory has faded completely. Thus, it is
useful to distinguish long-term memory from shorter-term forms of storage.
FIGURE 24.1
Types of declarative and nondeclarative
memory. Brain structures thought to be in-
volved in each type of memory are indicated.
(Note that this is not a complete representa-
tion of all types of memory.)
728 C HAP T E R 24 . MEMORY SYSTEMS
Box 24.1
,,'.
OF SPECIAL INTEREST
...
I ...
I...
An Extraordinary Memory
In the 1 920s, a man named Sherashevsky came to see the
Russian psychologist Aleksandr Luria. Thus began a 30-
year study of the uncommon memory of this man Luria
referred to simply as S. Luria published his fascinating de-
scription of this study in his book, The Mind of a Mnemonist.
Luria initially studied S. by giving him conventional tests,
such as memorizing lists of words, numbers, or nonsense
syllables. He'd read the list once and then ask S. to repeat
it. Much to Luria's surprise, he couldn't come up with a
test S. could not pass. Even when 70 words were read in
a row. S. could repeat them forward, backward. and in any
other order. During the many years they worked together,
Luria never found a limit to S.'s memory. In tests of his
retention, S. demonstrated that he remembered lists he
had previously seen even 15 years earlier!
How did he do it? S. described several factors that may
have contributed to his great memory. One was his un-
usual sensory response to stimuli--he retained vivid images
of things he saw. When shown a table of 50 numbers, he
claimed it was easy to later read off numbers in one row
or along the diagonal because he simply had to call up a
visual image of the entire table. Interestingly, when he
occasionally made errors in recalling tables of numbers
written on a chalkboard, they appeared to be "reading"
errors rather than memory errors. For instance, if the
handwriting was sloppy, he would mistake a 3 for an 8
or a 4 for a 9. It was as if he were seeing the chalkboard
and numbers all over again when he was recalling the in-
formation.
Another interesting aspect of S.'s sensory response to
stimuli was a powerful form of synesthesia. Synesthesia is
a phenomenon in which sensory stimuli evoke sensations
usually associated with different stimuli. For example,
when S. heard a sound, in addition to hearing, he would
see splashes of colored light and perhaps have a certain
taste in his mouth. The multimodal response to sensory
input may have established particularly strong memory
traces.
After learning that his memory was unusual, S. left his
job as a reporter and became a professional stage per-
former-a mnemonist. To remember huge lists of num-
bers or tables of words given by members of the audi-
ence trying to stump him, he complemented his lasting
sensory responses to stimuli and his synesthesia with
memory "tricks." To remember a long list of iltems, he
made use of the fact that each item evoked some sort of
visual image. As the list was read or written, S. imagined
himself walking through his home town; as each item was
given, he placed its evoked image along his walk-the
image evoked by item I by the mailbox, the image for
item 2 by a bush, and so on. To later recall the items, he
walked the same route and picked up the items he had
put down. Although we may not have the complex synes-
thetic sensations of S., this ancient technique of making
associations with familiar objects is one we all can use.
But not everything about S.'s memory was to his ad-
vantage. While the complex sensations evoked by stimuli
helped him remember lists of numbers and words, they
interfered with his ability to integrate and remember
more complex things. He had trouble recognizing faces
because each time a person's expression changed, he
would also "see" changing patterns of light and shade,
which would confuse him. He also wasn't very good at
following a story read to him. Rather than ignoring the
exact words and focusing on the important ideas, S. was
overwhelmed by an explosion of sensory responses.
Imagine how bewildering it would be to be bombarded by
constant visual images evoked by each word. plus sounds
and images evoked by the tone of voice of the person
reading the story.
S. also experienced the inability to forget. This became
a particular problem when he was performing as a pro-
fessional mnemonist and was asked to remember things
written on a chalkboard. He would see things that had
been written there on many different occasions. Although
he tried various tricks to try and forget old information,
such as mentally erasing the board, nothing worked. Only
by the strength of his attention, and by actively telling
himself to let information slip away, was he able to forget.
It was as if the effort most of us use for remembering and
the ease with which we forget were reversed for S.
We don't know the neural basis for S.'s remarkable
memory. Perhaps he lacked the segregation most of us
have between sensations in different sensory systems.
This may have contributed to an uncommonly strong
multimodal coding of memories. Maybe his synapses
were more malleable than normal. Unfortunately, we'll
never know.
Sensory
information
Consolidation
.
Sensory
information
..
(a)
Time
(b)
..
Note, however, that the terminology for describing memory has changed
over the years, and the same term may have different meanings to differ-
ent scientists.
In the 1940s, memories that are readily lost were called short-term
memories-memories that last on the order of seconds to hours and are
vulnerable to disruption. An example is your recollection of last night's
dinner, which fades after a week. Short-term memory can be erased by
head trauma or electroconvulsive shock. But the same treatments do not
affect long-term memories, which were stored long ago (e.g., childhood
memories). These observations have led to the idea that memories are
stored in short-term memory and are selectively converted into a permanent
form via a process called memory consolidation. Note, however, that
memory consolidation does not necessarily require short-term memory as an
intermediary; the two types of memory might exist in parallel (Figure 24.2).
By the 1960s, researchers recognized that there are multiple types of
memories held for shorter periods of time. Worldng memory is a tempo-
rary form of information storage that is limited in capacity and requires re-
hearsal. It is often said that working memory is information held "in mind."
When someone tells you his or her phone number, you can retain it for a
limited period of time by repeating the number to yourself. Keeping a
memory alive through repetition is a hallmark of working memory. If the
number is too long (e.g., a phone number with extra numbers for a foreign
country), you may have trouble remembering the number at all. Eventu-
ally, the number may be consolidated into a long-term memory. Working
memory is commonly studied by measuring a person's digit span, the max-
imum number of randomly chosen numbers a person can repeat back after
hearing a list read. The normal digit span is 7. plus or minus two numbers.
Interestingly, there are reports of humans with cortical lesions who have
normal memory for information coming from one sensory system (e.g.,
they can remember the same number of visually seen numbers as other
people) but a profound deficit when information comes from another sen-
sory system (e.g., they cannot remember more than one number spoken to
them). These different digit spans in different modalities are consistent with
the notion of multiple temporary storage areas in the brain.
Amnesia
As we all know, in daily life, forgetting is nearly as common an occurrence
as learning. However, certain diseases and injuries to the brain cause a seri-
ous loss of memory and/or the ability to learn called amnesia. Concussion,
chronic alcoholism, encephalitis, brain tumor, and stroke can all disrupt
memory. You've probably seen a movie or television show in which a per-
son experiences a great trauma and wakes up the next day not knowing
who he or she is and not remembering the past. That kind of absolute am-
nesia for past events and information is actually quite rare. It is more com-
mon for trauma to cause limited amnesia along with other nonmemory
deficits. If amnesia is not accompanied by any other cognitive deficit, it is
.... TYPES OF MEMORY AND AMNESIA 729
Consolidation
..
Time
.
FIGURE 24.2
Short-term and long-term memory.
Sensory information can be temporarily
held in short-term memory. but permanent
storage Into long-term memory requires
consolidation. (a) Information may be consoli-
dated from short-term memory. (b) Alterna-
tively. information processing necessary for
consolidation may occur separately from
short-term memory.
730 C HAP T E R 24 . MEMORY SYSTEMS
100
0
E
Q) 50
E
ro
E
0
z 0
Birth Time_ Time of
(a) trauma
FIGURE 24.3
Amnesia produced by trauma to
the brain. (a) In retrograde amnesia, events
for a period of time before the trauma
are forgotten. but memones from the distant
past and the period following the trauma
are intact. (b) In anterograde amnesia. events
before the trauma can be remembered. but
there are no memories for the penod follow-
ing the trauma.
100
0
E
Q) 50
E
ro
E
0
z 0
Today Birth Time_ Time of Today
(b) trauma
known as dissociated amnesia (i.e., the memory problems are dissociated
from any other problems). We wiU focus on cases of dissociated amnesia
because a clear relationship can be drawn between memory deficits and
brain injury.
Following trauma to the brain, memory loss can manifest itself in two
different ways: retrograde amnesia and anterograde amnesia (Figure 24.3).
Retrograde amnesia is characterized by memory loss for events before
the trauma; you forget things you already knew. In severe cases, there
might be complete amnesia for all declarative information learned before
the trauma. More often, retrograde amnesia follows a pattern in which
events of the months or years preceding the trauma are forgotten, but
memory is increasingly strong for older memories. The graded loss of old
memories across time apparently reflects the changing nature of memory
storage. Anterograde amnesia is an inability to form new memories
following brain trauma. If the anterograde amnesia is severe, a person
might be completely incapable of learning anything new. In milder cases,
learning may be slower and require more repetition than normal. In clini-
cal cases, there is often a mixture of retrograde and anterograde amnesias
of different degrees of severity.
An example will help clarify. Consider the case of a 45-year-old man who
experienced some brain trauma at the age of 40. If he has severe retrograde
amnesia, he will be unable to remember many things that occurred before
age 40. If he has severe anterograde amnesia. he wiU remember nothing
from age 40 until the present time.
A form of amnesia that involves a much shorter period of time is called
transient global amnesia. A sudden onset of anterograde amnesia lasts only
for a period of minutes to days, often accompanied by retrograde amnesia
for recent events preceding the attack. During the spell, the person may
appear disoriented and ask the same questions repeatedly, but he is con-
scious, and measures of working memory, such as digit span, are normal.
In a matter of hours, the attack usually subsides, and the person is left with
a permanent memory gap.
Transient global amnesia can be frightening to both the person experi-
encing it and those around him. Although the cause has not been clearly
established, brief cerebral ischemia, in which the blood supply to the brain
is temporarily reduced, or concussion to the head from trauma, such as a
car accident or a hard blow while playing football, might be implicated.
There have been reports of transient global amnesia brought on by seizures,
physical stress, drugs, cold showers, and even sex, presumably because all
of these affect cerebral blood flow. Many cases have been linked to use of
the antidiarrheal drug clioquinol (which has been taken off the market).
While we don't know exactly what causes transient global amnesia, it may
be a consequence of temporary blood deprivation to structures essential for
learning and memory. Other forms of temporary amnesia can be caused by
disease, brain trauma, and environmental toxins (Box 24.2).
Box 24.2
... , ...
OF SPECIAL INTEREST
.
THE SEARCH FOR THE ENGRAM 731
A Fish Tale of Memory Loss
Along the mid-Atlantic coast of the United States lurks a
mysterious killer that has left millions of dead fush waslhed
up on the shore. Even more distressing are the fisherman
in the area who have shown up in doctors' offices with
sometimes severe memory loss. The source of the trouble
to both fish and humans appears to be a unicellular micro-
organism called Pfiesterio piscicido and a number of its algal
cousins. Pfiesterio is a dinoflagellate; at certain stages in
its life cycle, it swims by means of a whiplike flagellum.
Pfiesterio releases a neurotoxin that stuns the fish, making
them unable to escape. The dinoflagellates then swim to
the fish and consume them.
Other dinoflagellates produce neurotoxins, but Pfiesterio
is unusual in several ways. For example, the dinoflagellate
GombierdisQJs toxicus, more commonly known as ciguatera,
also produces a neurotoxin, ciguatoxin, that accumulates
in fish that feed on coral reefs. However, unlike Pfiesterio,
ciguatera does not kill the fish, and the fish continue to
grow and are caught by fishermen. When people consume
the fish, the ciguatoxin binds to Na + channels, increasing
membrane excitability. Aside from nausea and diarrhea, the
toxin produces a broad array of neurological symptoms,
including numbness and tingling around the mouth, intense
itching, and a reversal of the sensation of hot and cold.
THE SEARCH FOR THE ENGRAM
Pfiesterio's modus operandi is different, and people do not
become sick from ingesting the neurotoxin. Illness results
from the seemingly innocuous activities of touching water
containing the neurotoxin or inhaling it in the air. The
fishermen, scientists, and others exposed to Pfiesterio
experience a frightening array of neurological symptoms,
including memory loss, difficulty concentrating, disorien-
tation, and confusion. On visiting the doctor, patients tell
of driving in the car and being unable to remember where
they were going and what they were going to do. Some
were even unable to remember their name or do simple
arithmetic. Tlhe memory loss was sometimes so severe
that it was confused with Alzheimer's disease. Fortunately,
the symptoms generally subsided over the course of
weeks or months after exposure to the toxin was stopped.
Potentia toxins Ihave been isolated from Pfiesterio, but
at present no neurotoxin has been definitively shown to be
the cause of the amnesia and other symptoms. Aside
from identifying the toxin and the manner in which it at-
tacks neurons is the question of why the sudden Pfieste-
rio outbreaks occur. The leading hypothesis os that water
pollution from human sewage and fertilizers provided a
rich source of food for the microbes, leading to tremen-
dous growth in the Pfiesterio population.
Now that we've discussed several types of memory and amnesia, let's
turn our attention to the parts of the brain that are involved in memory
storage. The physical representation or location of a memory is called an
engram, also known as a memory trace. When you learn the meaning of a
word in French, where is this information stored-where is the engram?
The technique most often used to answer this type of question is the time-
honored experimental ablation method of Marie-lean-Pierre Flourens (see
Chapter 1).
Lashley's Studies of Maze Learning in Rats
In the 1920s. American psychologist Karl Lashley conducted experiments
to study the effects of brain lesions on learning in rats. Well aware of the
cytoarchitecture of the neocortex, Lashley set out to determine whether the
engram resided in particular association areas of cortex (see Chapter 7), as
was widely believed at the time.
In a typical experiment, he trained a rat to run through a maze to get a
food reward (Figure 24.4a). On the first trial, the rat was slow getting to
the food because it would enter blind alleys and have to turn around. Af-
ter running through the same maze repeatedly, the rat learned to avoid
blind alleys and go straight to the food. Lashley was investigating how per-
732 C HAP T E R 24 . MEMORY SYSTEMS
=J Finish IL
I
L
SS1
II Start II
(a)
90
80 .
70 .
>f!. .
-0 60
Q) .
>-
e . .
(j) 50
Q)
-0 . .
x 40 . .
Q)
t .
0
u 30 . .
. .
. . . .
.
20 . . . .
. ..
10 .
'r.
.
0
"
\
I
Lateral view of
left hemisphere
Dorsal view
Lateral view of
right hemisphere
(b)
.
500
1000 1500
Number of errors
2000
FIGURE 24.4
The effects of cortical lesions on maze performance.
(a) The rat is trained to run through a maze from start to finish
without entering blind alleys. (b) Three different cortical lesions are
shown in blue, yellow, and orange. (c) The greater the percentage
of cortex destroyed, the more errors made while the rats learn
to run the maze. The number of errors shown is cumulative across
trials, suggesting that rats with larger lesions had difficulty remem-
bering which arms of the maze were blind alleys. (Source: Adapted
from Lashley, 1929, Figs. 2, 16, and 23.)
(c)
formance on this task was affected by lesions in the rat's cortex (Figure
24.4b). He found that rats given brain lesions before learning needed more
trials to run the maze without going down blind alleys. The lesions seemed
to interfere with their ability to learn.
In another group, a lesion was made after a rat had learned to run the
maze without making mistakes. With the lesion, the rat made mistakes and
went down blind alleys it had previously learned to avoid. It appeared that
the lesion damaged or destroyed the memory for how to reach the food.
What was the effect of the size and location of the lesion? Interestingly,
Lashley found that the severity of the deficits caused by the lesions (both
learning and remembering) correlated with the size of the lesions (Figure
24.4c) but was apparently unrelated to the location of the lesion within the
cortex. Based on these findings, he speculated that all cortical areas con-
tribute equally to learning and memory; it is simply a matter of getting
poorer performance on the maze task as the lesion gets bigger and the abil-
ity to remember the maze worsens. If true, this would be a very important
finding because it implies that engrams are based on neural changes spread
throughout the cortex rather than being localized to one area. The main
problem with this interpretation is that it goes beyond what can safely be
concluded from the data.
Notice how large the lesions are in Figure 24.4b. Perhaps one of the
reasons Lashley did not find a difference in the effects of lesions at various
locations is that his lesions were so large that they each damaged several
cortical areas involved in learning the maze task. Another problem was that
the rats might solve the maze in several different ways-by sight, feel, and
smell-and the loss of one memory might be compensated for by another.
Subsequent research has proven Lashley's conclusions to be incorrect.
All cortical areas do not contribute equally to memory. Nonetheless, he
was correct that memories are distributed. Lashley had an important and
lasting impact on the study of learning and memory because he led other
scientists to consider ways in which memories might be distributed among
the vast number of neurons of the cerebral cortex.
Hebb and the Cell Assembly
Lashley's most famous student was Donald Bebb, introduced in Chapter 23.
Bebb reasoned that it was crucial to understand how external events are
represented in the activity of the brain before one can hope to understand
how and where these representations are stored. In a remarkable book
published in 1949 entitled The Organization of Behavior, Bebb proposed that
the internal representation of an object consists of all the cortical cells that
are activated by the external stimulus. Bebb called this group of simulta-
neously active neurons a cell assembly (Figure 24.5a). Bebb imagined
that all these cells were reciprocally interconnected. The internal repre-
sentation of the object was held in short-term memory as long as activity
reverberated through the connections of the cell assembly. Bebb further
hypothesized that if activation of the cell assembly persisted long enough,
consolidation would occur by a "growth process" that made these recip-
rocal connections more effective; neurons that fired together would wire
together (Figure 24.5b). Subsequently, if only a fraction of the cells of the
assembly were activated by a later stimulus, the now-powerful reciprocal
connections would cause the whole assembly to become active again, thus
recalling the entire internal representation of the external stimulus-in this
case, a circle (Figure 24.5c).
Bebb's important message about the engram was twofold: (1) It could
be widely distributed among the connections that link the cells of the as-
sembly, and (2) it could involve the same neurons that are involved in
sensation and perception. Destruction of only a fraction of the cells of the
assembly would not be expected to eliminate the memory, possibly ex-
plaining Lashley's results. Bebb's ideas stimulated the development of
neural network computer models. Although his original assumptions had
to be modified slightly, these models have successfully reproduced many
features of human memory (Box 24.3).
Localization of Declarative Memories in the Neocortex
According to Bebb, if an engram is based on information from only one
sensory modality, it should be possible to localize it within the regions of
cortex that serve this modality. For example, if the engram relies only on
visual information, then we would expect it to reside within the visual
cortex. Studies of visual discrimination in monkeys are consistent with this
proposal.
Studies in Monkeys. Macaque monkeys can be trained to perform visual
discriminations (e.g., they can differentiate pairs of objects based on their
shapes and learn to associate one with a food reward). After being trained on
this task and becoming proficient at it, a lesion is made in inferotemporal
... THE SEARCH FOR THE ENGRAM 733
734 C HAP T E R 2 4 . MEMORY SYSTEMS
Reciprocal connections O
between neurons _______ \
r) 0
Neuronsq 0
o
o
. . .
.. . Activation of the cell
assembly by a stimulus.
.
f
. . Reverberating activity
continues activation after
the stimulus is removed.
. . .
f
. Hebbian modification
strengthens the reciprocal
connections between
neurons that are active
at the same time.
. The strengthened
connections of the cell
assembly contain the
engram for the stimulus.
. After learning, partial
activation of the assembly
.. leads to activation of the
entire representation of
the stimulus.
f
. = "Circle."
(a) The cell assembly
External
stimulus
(b)
, ,
FIGURE 24.5
Hebb's cell assembly
and memory storage.
(c)
cortex (area IT), a high-order visual area in the inferior temporal lobe
(Figure 24.6a). With this brain lesion, the animal can no longer perform
the discrimination task, even though its basic visual capacities remain intact.
It appears as if the animal no longer remembers the stimulus shape associ-
ated with the reward. As in Lashley's experiments, the implication is that
the memory for the task is stored in the cortex. However, in this case of a
task specific to vision, the memory appears to be stored in a high-order
visual area. Stated another way, inferotemporal cortex is both a visual area
and an area involved in memory storage.
Further evidence that inferotemporal cortex is involved in certain types
of memory storage comes [rom physiological experiments in which the
response properties ot" individual neurons are examined. For example,
recordings made from IT neurons suggest that they may encode memo-
ries of faces (Figure 24.6b). In a typical experiment, the monkey is alert.
and an electrode is used to record from an IT neuron. Initially, the response
of the neuron to multiple presentations of familiar faces (other monkeys
the subject frequently sees) is recorded. The face cell responds more to
"IJ III I. I .J1
/
I nferotemporal
(a) cortex (area IT) (b)
'OJ
50 Face 1
40
u
OJ
(/)
30 Face 2
-'"
'6.
Cf)
20
10
0
2 3 4 5
(c) Presentation number
'Y THE SEARCH FOR THE ENGRAM 735
J1lU.illlIw
-
..
FIGURE 24.6
Responses to faces in inferotemporal cortex. (a) The location of area IT
in the Inferior temporal lobe of a macaque monkey. (b) Responses of a face cell.
The histograms show the response of a neuron in area IT to different views of a
monkey's head. The horizontal bar under each hIstogram Indicates when the stim-
ulus was presented. (c) Changing responses of a cell to unfamiliar faces. When
the four faces are presented for the first time, there is a moderate response to
each. With subsequent presentations, the cell becomes more responsive to faces
I and 2 and less responsive to faces 3 and 4. (Sources: Part b, Desimone et aI.,
1984, Fig. 6; part c, adapted from Rolls et aI., 1989, Fig. I.)
some faces than to others. When new faces unfamiliar to the monkey are
introduced, interesting neuronal responses result (Figure 24.6c). The first
time new faces are seen, the cell responds at about the same moderate
level to all of them. However, with a couple of additional exposures, the
response changes, such that some faces evoke a significantly greater re-
sponse than others. The cell is becoming selective in its response to these
new stimuli as the researcher watches it. With continued presentation of
the same group of faces, the response of the neuron to each pattern be-
comes more stable. We can speculate that the response selectivity of this
neuron and others is part of a distributed code for the representation-the
memory-of many different faces. This dynamic aspect of responses in area
IT supports Hebb's view that the brain can use cortical areas for both the
processing of sensory information and the storage of memories.
Studies in Humans. When we discussed visual processing beyond striate
cortex in Chapter 10, we saw results from fMRI studies in humans indi-
cating that a small portion of the brain is particularly activated by faces.
Other fMRI experiments have shown responses specific to a range of dif-
ferent types of objects. For example, in one study, subjects were presented
with various pictures of birds and cars. Everyone can recognize a few bird
species or car models, but birdwatchers and car buffs are experts at dis-
criminating the subtleties. When bird experts and car experts view pictures
of both birds and cars, the brain responses are different. The bird experts
have areas of extra striate visual cortex that are significantly more activated
by images of birds than by other objects, such as cars. Conversely, car ex-
perts show an especially strong response to pictures of cars (Figure 24.7).
Birds
Cars
-
Qj
Q.
x
OJ
"E
iD
-
-
,.
(a)
..
ID
Q.
X
OJ
rn
()
(b)
FIGURE 24.7
Functional MRI recordings of brain
activity in bird and car experts. (a) Bird
experts showed greater activity (orange) in
extrastriate visual areas in response to birds
than other objects. (b) Extrastriate cortex in
car experts was more activated by images of
cars. (Source: Gauthier et aI., 2000, Fig. 3.)
I'
-.
Box 24.3
c)
BRAIN FOOD
A Model of a Distributed Memory
Historically, most of the progress in neuroscience research
has come from experimental studies. But today, theoretical
neuroscience is playing an increasing role, and the use of
computational models of neural systems is widespread. In
some cases, a model can provide insights about the work-
ings of a system that are otherwise hard to gain. One area
is the study of systems for learning and memory.
We'll examine a simplified nervous system consisting of
three sensory neurons (the inputs) and three postsynap-
tic neurons (the outputs). The inputs represent patterns
of activity in visual afferents in response to the faces of
three different people-Eric, Kyle, and Kenny. Ignoring the
complexities of visual processing, let's assume each input
excites all three output neurons-A, B, and C (Figure A,
part a). Before the system learns who Eric, Kyle, and
Kenny are, each of the three output cells responds at
roughly the same level to each of the inputs (part b).
There is no way to tell, from the outputs of cells A, B, and
C, which face was the stimulus at a given time.
Imagine that after being exposed to the three inputs
repeatedly, the synaptic effectiveness or "strength" changes.
One possibility is that after learning, Eric's face activates
only cell A, Kyle's face activates only cell B, and Kenny's
face activates only cell C (Figure A, part c). We can tell
which face is present at any time by looking to see which
output neuron is active. All the relevant information that
allows the system to recognize the face---the memory-is
stored in the synaptic weights. Part c represents a nondis-
tributed memory because all the information about Eric,
for example, is stored in the single synapse with output cell
A The system can recognize that Eric is present without
Stimulus
Before learning
Eric Kyle Kenny
"0
«
c-
8- ID
(/) u
OJ
a::
A
--"B
"0
(Q
c-
OID
o..u
(/)
OJ
a::
c
"0
o
c_
8- ID
(/) u
OJ
a::
L
Eric Kyle Kenny
Stimulus
(a)
FIGURE A
(b)
even bothering to look at the outputs of cells Band C.
In an alternative system, learning the three faces would
again alter the synaptic weights, but none of them would
be zero (Figure A, part d). The synaptic changes that store
the memories can make the inputs more or less effective;
memory formation does not involve only increases in
synaptic strength. This is a distributed memory system be-
cause the memory of each face is stored in three synapses.
In a real nervous system, many thousands of synapses
might be involved. Note that recognition of one of the in-
put faces requires comparing the strength of activity
across all the output neurons-the memory is "distrib
uted." One reason the distributed system seems more
realistic is that recordings from cortical neurons do not
suggest individual neurons are specifically responsive to
every image we recognize. Presumably, human recognition
is based on the relative activation of many neurons.
An attractive feature of the distributed memory system
is its relative immunity to catastrophic memory loss if out-
put neurons die. In the nondistributed scheme, recognition
of Kenny totally depends on the response of cell C. If this
cell dies, say goodbye to Kenny. Contrast this with the dis-
tributed system. If cell B is lost, we can still recognize Kyle
by comparing the responses of cells A and C. The more
neurons and synapses that are involved in the distributed
memory, the lower the consequence of losing any single
cell. This relative immunity to the effects of cell loss is a
great advantage. Neurons in the brain die every day. and it
is probably because of the distributed nature of memory
that we don't suddenly lose memories for people and events.
After leaming
Nondistributed
memory
Distributed
memory
L
L
ldu
LJ
I
I
Eric Kyle Kenny
(c) Stimulus
(d)
Eric Kyle Kenny
Stimulus
The meaning of these activity patterns is hotly debated. One possibility is
that the different activity patterns in the two types of experts reflect highly
developed specialized processing of visual features needed to classify par-
ticular examples. Obviously, birds and cars differ in many ways-the pres-
ence of feathers, sheet metal, and so on. Another interpretation is that
extrastriate visual areas encode memories for birds or cars (or even faces,
as we saw in Chapter 10). Rather than focusing on the uncertainty about
whether the responses in this type of experiment are sensory or memory,
we note that the results are in line with Hebb's idea that the same area of
cortex can subserve both functions.
Electrical Stimulation of the Human Temporal Lobes
One of the most intriguing and controversial studies implicating the neo-
cortex of the temporal lobe in the storage of declarative memory traces
involved electrical stimulation of the human brain. In Chapters 12 and 14,
before we discussed the work of Wilder Penfield, in which patients, as part
of surgical treatment for severe epilepsy, had their brain electrically stimu-
lated at numerous locations before ablation of the seizure-prone region.
Stimulation of somatic sensory cortex caused the patient to experience tin-
gling sensations in regions of skin, whereas stimulation of motor cortex
caused a certain muscle to twitch.
Electrical stimulation of the temporal lobe occasionally produced more
complex sensations than those obtained with stimulation in other brain
areas. In a number of cases, Penfield's patients described sensations that
sounded like hallucinations or recollections of past experiences. This is con-
sistent with reports that epileptic seizures of the temporal lobes can evoke
complex sensations, behaviors, and memories. Here is part of Penfield's
account of one operation:
At the time of operation, stimulation of a point on the anterior part of the first
temporal convolution on the right caused him [the patient] to say, "I feel as
though I were in the bathroom at school." Five minutes later, after negative
stimulations elsewhere, the electrode was reapplied near the same point. The
patient then said something about "street corneL" The surgeon asked him,
"where" and he replied, "South Bend, Indiana, corner of Jacob and Washington."
When asked to explain, he said he seemed to be looking at himself-at a
younger age. (Penfield, 1958, p. 25)
Another patient reported a similar sense of experiencing flashbacks.
When her temporal cortex was stimulated, she said, "I think I heard a
mother calling her little boy somewhere. It seemed to be something that
happened years ago." With stimulation at another location, she said, "Yes,
I hear voices. It is late at night around the carnival somewhere-some sort
of traveling circus. . . . I just saw lots of big wagons that they use to haul
animals in."
Are these people reexperiencing events from earlier in their life because
memories are evoked by the electrical stimulation? Does this mean that
memories are stored in the neocortex of the temporal lobe? Those are
tough questions! One interpretation is that the sensations are recollections
of past experiences. The fact that such elaborate sensations were obtained
only when the temporal lobe was stimulated suggests that the temporal
lobe may playa special role in memory storage. However, other aspects of
the findings do not clearly support the hypothesis that engrams are being
electrically activated. For instance, in some of the cases in which the
stimulated part of the temporal lobe was removed, the memories that had
been evoked by stimulation in that area could be evoked by stimulation
... THE SEARCH FOR THE ENGRAM 737
738 C HAP T E R 24 . MEMORY SYSTEMS
somewhere else. In other words, the memory had not been "cut out." Also,
it is important to appreciate that complex sensations were reported only by
a minority of the patients, and all of these patients had abnormal cortex
associated with their epilepsy.
There is no way to prove whether the complex sensations evoked by
temporal lobe stimulation are recalled memories. However, it is clear that
the consequences of temporal lobe stimulation and temporal lobe seizures
can be qualitatively different from stimulation of other areas of the neo-
cortex. Now we'll take a closer look at the structure of the temporal lobes
and the elements within them that are strongly implicated in learning and
memory.
... THE TEMPORAL LOBES
AND DECLARATIVE MEMORY
The temporal lobe is located under the temporal bone, so named because
the hair of the temples is often the first to go gray with the passage of time
(tempus is Latin for "time"). The association of the temporal lobe with time
was fortuitous because considerable evidence points to this region of the
brain as being particularly important for the recording of past events. The
temporal lobes contain the temporal neocortex, which may be a site of long-
term memory storage. Also within the temporal lobe are the hippocampus
and other structures, which, as we will see, are critical for the formation of
declarative memories.
The Effects of Temporal Lobectomy
If the temporal lobe is particularly important for learning and memory, one
would expect that removing both temporal lobes would have a profound
effect on these functions. Recall from the discussion of the KlUver-Eucy
syndrome in Chapter 18 that bilateral temporal lobectomy does seem to
have some effect on memory. The monkeys studied by KlUver and Eucy
following temporal lobectomy had a peculiar way of interacting with their
environment, in addition to a host of other abnormalities. The monkeys
explored their room by placing objects in their mouth. If an object was
edible, they would eat it; if it wasn't, they would drop it. However, their
behavior suggested that they did not have basic perceptual deficits. In the
words of Kluver and E ucy, they exhibited "psychic blindness" -even though
they could see things, they did not appear to understand with their eyes
what the objects were. They would repeatedly go back to the same inedi-
ble objects, put them in their mouth, then toss them aside. This problem
with object recognition is probably related to memory function in the
temporal lobe.
A Human Case Study: H.M. A renowned case of amnesia resulting from
temporal lobe damage provides further evidence for the importance of this
region in memory. A man known by his initials, H.M., has been extensively
studied. H.M. experienced minor epileptic seizures beginning around age
10, and as he aged, they became more serious generalized seizures involv-
ing convulsions, tongue biting, and loss of consciousness. Although the
cause of the seizures is not known, they may have resulted from damage
sustained in an accident in which he was knocked off his bicycle at the age
of 9 and left unconscious for 5 minutes. After graduating from high school
he got a job, but despite heavy medication with anticonvulsants, his seizures
increased in frequency and severity to the point that he was unable to
work. In 1953, at the age of 27, H.M. had an operation in which an 8 cm
... THE TEMPORAL LOBES AND DECLARATIVE MEMORY 739
\.
r
r
- - m mt
'_T (
\.
Cerebellum
.-'
\
)
" o 1fT
- ,\ I
-
..
..:---":-
-,
"- Temporal
lobe
I
\
-Y
......
.tA
r
A"
,
,(A
A)r
'-
"
-. \
'\. \
/
Hippocampus
(a) H.M.'s brain
(b) Normal brain
length of medial temporal lobe was bilaterally excised, including cortex, the
underlying amygdala, and the anterior two-thirds of the hippocampus, in
a last-ditch attempt to assuage the seizures (Figure 24.8). The surgery was
successful in alleviating the seizures.
The removal of much of the temporal lobes had little effect on H.M:s
perception, intelligence, or personality. H.M. is still alive, and in most every
way, he appears to be normal. However, this normal appearance belies the
reality that the surgery left him with an amnesia so profound that he is
incapable of performing basic human activities. H.M. has partial retrograde
amnesia for the years preceding the operation. However, much more seri-
ous is his extreme anterograde amnesia. While he can remember a great
deal about his childhood, he is unable to remember someone he met just
a few minutes earlier. Dr. Brenda Milner of the Montreal Neurological
Institute has worked with H.M. for nearly 50 years, but, incredibly, she has
to introduce herself to him every time they meet. M.ilner has said it appears
that H.M. forgets events as quickly as they occur. If he is told to remember
a number and is then distracted, he will not only forget the number, he will
also forget that he had even been asked to remember one.
To be clear about the nature of H.M:s amnesia, we must contrast what
was lost with what is retained. He remembers his childhood, so long-term
memories formed before the surgery and his ability to recollect past events
were not destroyed. His working memory is also normal. For instance, with
constant rehearsal he can remember a list of six numbers, although any
interruption will cause him to forget. He simply has an extreme inability to
form new declarative memories. He has learned a very small number of
declarative facts since his surgery. For example, he can recognize and name
a few people who became famous after his surgery, such as President John
Kennedy. He also learned the floor plan of a home he moved to after the
surgery. These rare remembered facts probably result from extensive daily
FIGURE 24.8
The brain lesion in patient HoMo that
produced severe anterograde amnesia.
(a) The medial temporal lobe was removed
from both hemispheres in H.M:s brain to alle-
viate severe epileptic seizures. (b) A normal
brain, showing the location of the hippocampus
and cortex that were removed from H.M:s
brain. (Source: Adapted from Scoville and
Milner, 1957, Fig. 2.)
740 C HAP T E R 24 . MEMORY SYSTEMS
repetitIOn. H.M. is also able to learn new tasks (i.e., form new procedural
memories). For example, he was taught to draw by looking at his hand in
a mirror, a task that takes a good deal of practice for anyone. The odd thing
is that he has learned to perform new tasks, despite the fact that he has no
recollection of the specific experiences in which he was taught to do them
(the declarative component of the learning).
The characteristics of H.M.'s amnesia reinforce the idea that the neuro-
anatomy and neural mechanisms underlying procedural and declarative
memory, as well as short-term and long-term memory, are not identical. In
our search to understand the role of the medial temporal lobe in learning
and memory, we are led to focus on the processing and consolidation of
new declarative memories.
The Medial Temporal Lobes and Memory Processing
In the medial temporal lobe, a group of interconnected structures appears
to be of great importance for declarative memory consolidation. The key
structures are the hippocampus, the nearby cortical areas, and the pathways
that connect these structures with other parts of the brain (Figure 24.9). As we
saw in Chapter 7, the hippocampus is a folded structure situated in the
temporal lobe. Ventral to the hippocampus are three important cortical re-
Lateral view
Medial view
-
\
\
,
r
r/
-
.
"'-
"-
...
Hippocampul
ff
H . /'
Ippocampus
(a)
Lateral ventricle
/
/Thill:/
Hippocampus
/
C "
"
/
I
Entorhinal '>.
cortex <:
\
..........
...
1 "
L/
H;_a",,", '
Rhinal
sulcus
Rhinal
sulcus
\
Perirhinal
cortex
\
Parahippocampal
cortex
(b)
FIGURE 24.9
Structures in the medial temporal lobe involved in declarative memory
formation. (a) Lateral and medial views show the location of the hippocampus in the
temporal lobe. (b) The brain is sectioned coronally to show the hippocampus and cortex
of the medial temporal lobe.
... THE TEMPORAL LOBES AND DECLARATIVE MEMORY 74 I
Cortical
association --..
areas
Parahippocampal
and rhinal Hippocampus
cortical areas
ForniX.. Thalamus,
hypothalamus
t
gions that surround the rhinal sulcus: the entorhinal cortex, which occu-
pies the medial bank of the rhinal sulcus; the perirhinal cortex, which
occupies the lateral bank; and the parahippocampal cortex, which lies
lateral to the rhinal sulcus. (We'll refer to entorhinal cortex and perirhinal
cortex collectively as rhinal cortex.)
Inputs to the medial temporal lobe come from the association areas of
the cerebral cortex, containing highly processed information from all sen-
sory modalities (Figure 24.10). For instance, inferotemporal visual cortex
(area IT) projects to the medial temporal lobe, but low-order visual areas
such as striate cortex do not. This means that the input contains complex
representations, perhaps of behaviorally important sensory information,
rather than responses to simple features such as light-dark borders. Input
first reaches the rhinal and parahippocampal cortex before being passed to
the hippocampus. A major output pathway from the hippocampus is the
fornix, which loops around the thalamus before terminating in the hypo-
thalamus.
An Animal Model of Human Amnesia. The effects of temporal lobec-
tomy, and particularly the amnesia of H.M., make a strong case that one or
more structures in the medial temporal lobe are essential for the formation
of declarative memories. If these structures are damaged, severe anterograde
amnesia results. There has been intensive investigation into the specific
structures in the medial temporal lobe that are essential for memory for-
mation. For the most part, these studies use the experimental ablation tech-
nique to assess whether the removal of some part of the temporal lobe
affects memory.
Because the macaque monkey brain is similar in many ways to the human
brain, macaques are frequently studied to further our understanding of
human amnesia. The monkeys are most often trained to perform a task
called delayed non-match to sample (DNMS) (Figure 24.11). In this
type of experiment, a monkey faces a table that has several small wells in
its surface. It first sees the table with one object on it covering a well. The
object might be a wooden block or a chalkboard eraser (the sample stimu-
lus). The monkey is trained to displace the object so that it can grab a food
"-
"-
' , I
, il [ I
:IJ I
I
I
I
Delay
d I t.
.,
\
,.
\1
.......
\j01
\1
FIGURE 24.10
Information flow through the medial
temporal lobe".
FIGURE 24.11
The delayed non-match to sample
task. A monkey first displaces a sample
object to obtain a food reward. After a delay,
two objects are shown, and recognition
memory is tested by having the animal
choose the object that does not match the
sample. (Source: Adapted from Mishkin and
Appenzeller, 1987, p. 6.)
742 C HAP T E R 24 . MEMORY SYSTEMS
100
Normal
.
-----.
U 90
o
u
80
ro
C
Q)
u
Qj 70
C>-
c
ro
Q)
:2: 60
50
8-10
see
15-30 60-70
see see
Length of delay
2-10
min
FIGURE 24.12
The effect of medial temporal lesions
on DNMS performance. The Y aXIs shows
the percentage of correct choices made by
monkeys as a function of the length of the
delay interval. The performance of normal
monkeys is compared to that of monkeys
with large bilateral medial temporal lesions.
(Source: Adapted from Squire, 1987, Fig. 49.)
reward in the well under the object. After the monkey gets the food. a
screen prevents it from seeing the table for some period of time (the delay
interval). Finally, the monkey gets to see the table again, but now there are
two objects on it: One is the same as before, and another is new. The
monkey's task is to displace the new object (the non-matching object) in
order to get another food reward in a well below it. Normal monkeys are
relatively easy to train on the non-matching task and get very good at it
probably because it exploits their natural curiosity for novel objects. With
delays between the two stimulus presentations of anywhere from a few
seconds to 10 minutes, the monkey correctly displaces the non-matching
stimulus on about 90% of the trials. Memory required in the DNMS task
has been called recognition memory because it involves the ability to
judge whether a stimulus has been seen before.
In the early 1980s, experiments performed by Mortimer Mishkin and his
colleagues at the National Institute of Mental Health, and Larry Squire and
his coworkers at the University ot California, San Diego, demonstrated that
severe deficits on the DNMS task result from bilateral medial temporal lesions
in macaque monkeys. Performance was close to normal if the delay between
the sample stimulus and the two test stimuli was short (a few seconds). This
is very important because it indicates that the monkey's perception was still
intact after the ablation and it remembered the DNMS procedure. But when
the delay was increased from a few seconds to a few minutes, the monkey
made increasingly more errors choosing the non-matching stimulus (Fig-
ure 24.12). With the lesion, the animal was no longer as good at remem-
bering what the sample stimulus was in order to choose the other object.
This behavior suggests that it forgot the sample stimulus if the delay was
too long. The deficit in recognition memory produced by the lesion was not
modality specific since this deficit was also observed if the monkey was
allowed to touch but not see the objects.
The monkeys with medial temporal lesions appeared to provide a good
model of human amnesia. As with H.M., the amnesia was anterograde, it
involved declarative rather than procedural memory, working memory was
intact, and consolidation was severely impaired. Note that the lesions that
were originally found to produce recognition memory deIicits in monkeys
were quite large. They included the hippocampus, amygdala, and rhinal
cortex. At one time, it was thought that the key structures damaged in the
lesions were the hippocampus and amygdala. Recall from Chapter 18 that
the amygdala plays a special role in memory for emotional experiences.
However, research has now shown that selective amygdala lesions have no
effect on recognition memory, and lesions of the hippocampus alone pro-
duce only relatively mild amnesia. For example, Squire studied a man
known by the initials R.Bo who had bilateral hippocampal damage as a
result of oxygen deprivation during surgery. Although R.B. clearly had dif-
ficulty forming new memories, this anterograde amnesia was not nearly as
severe as that seen in H.M. The most severe memory deficits result from
damage to the perirhinal cortex. The anterograde amnesia resulting from
perirhinal lesions is not specific to information from a particular sensory
modality, reflecting the convergence of input from association cortex of
multiple sensory systems.
Together with the hippocampus, the cortex in and around the rhinal
sulcus evidently performs a critical transformation on the information com-
ing from association cortex. Scientists have hypothesized distinct roles for
the hippocampus and rhinal cortex, but at present, there is no consensus
about the nature ot the distinction. Nonetheless, it appears that collectively
medial temporal structures are critical for the consolidation of memory. It
is also possible that they serve as an essential intermediate processing stage
.... THE TEMPORAL LOBES AND DECLARATIVE MEMORY 743
that involves something other than consolidation. In H.M. and possibly in
R.B., there was some retrograde amnesia. Perhaps in addition to consolida-
tion, the cortex of the medial temporal lobes stores memories temporarily
before they are ultimately transferred to the neocortex elsewhere for more
permanent storage.
The Diencephal.on and Memory Processing
Lesions in the medial temporal lobe can produce profound amnesia, but other
lesions can also disrupt memory. Outside the temporal lobe, one of the brain
regions most associated with memory and amnesia is the diencephalon.
The three regions of the diencephalon implicated in the processing of
recognition memory are the anterior and dorsomedial nuclei in the thala-
mus and the mammillary bodies in the hypothalamus. Recall that a major
output of the hippocampal formation is a bundle ofaxons making up the
fornix. Most of these axons project to the mammillary bodies (Figure
24.13). Neurons in the mammillary bodies then project to the anterior
nucleus of the thalamus. This circuit from hippocampus to hypothalamus
to anterior nucleus and then to cingulate cortex should sound familiar; it
is half of the Papez circuit (see Chapter 18). The dorsomedial nucleus of the
thalamus also receives input from temporal lobe structures, including the
amygdala and inferotemporal neocortex, and it projects to virtually aU of
frontal cortex.
Large midline thalamic lesions in monkeys produce relatively severe
deficits on the DNMS task. These lesions damage the anterior and dorso-
medial nuclei of the thalamus, producing retrograde degeneration in the
mammillary bodies. Bilateral lesions limited to either the dorsomedial
nuclei or the anterior nuclei produce significant but milder deficits. The
limited data available suggest that rather mild deficits are seen after lesions
in only the mammillary bodies.
A Human Case Study: N.A. Reports for many years have suggested a
relationship between human amnesia and damage to the diencephalon. A
Fornix
) 'I \ / Thalamus
\
I l
/
'-
)
Amygdala
I
Mammillary
body
'"
Hippocampus
FIGURE 24.13
Components of the diencephalon involved in memory. The thalamus and mammil-
lary bodies receive afferents from structures in the medial temporal lobe.
744 CHAPTER 24 . MEMORY SYSTEMS
particularly dramatic example is the case of a man known as N.A. In 1959
at the age of 21, N.A. was a radar technician in the u.s. Air Force. One day
he was siuing down assembling a model in his barracks, while behind him
a roommate played with a miniature fencing foil. N.A. turned at the wrong
momenr and was stabbed. The foil wenr through his right nostril, taking a
lefrward course into his brain. Many years later when a CT scan was per-
formed, the only obvious damage was a lesion in his lefr dorsomedial thal-
amus, though there may have been orher damage.
Afrer his recovery, N.A.'s cognitive ability was normal but his memory
was impaired. He had relatively severe anrerograde amnesia and retrograde
amnesia for a period of about 2 years preceding the accidenr. While he could
remember some faces and events from the years following his accidenr,
even these memories were sketchy. He had difficulty watching television
because during commercials, he'd forget what was previously happening.
In a sense, he lived in the past by preferring to wear old familiar clorhes
and keeping his hair in a crewcut.
Although N.A.'s amnesia was less severe than H.M.'s, the quality was
strikingly similar. There was preservation of short-term memory, recollection
of old memories, and general intelligence. Along with difficulty forming
new declarative memories, he had retrograde amnesia for a period of years
preceding the accident that produced the amnesia. The similarities in the
effects of medial temporal and diencephalic lesions suggests that these
interconnected areas are part of a system serving the common function of
memory consolidation.
Korsakoff's Syndrome. Further support {or a role of the diencephalon in
memory comes from Korsakoff's syndrome. Usually resulting from chronic
alcoholism, Korsakoff's syndrome is characterized by confusion, confab-
ulations, severe memory impairment, and apathy. As a resulr of poor nu-
trition, alcoholics may develop a thiamin deficiency, which can lead to such
symptoms as abnormal eye movements, loss of coordination, and tremors.
This condition can be treated with supplemental thiamin. If left untreated,
thiamin deficiency can lead to structural brain damage, which does not
respond to thiamin therapy. The structural damage produces Korsakoff's
syndrome. Although all cases of Korsakoff's syndrome are nor associated
with damage to the same parts of the brain, there are usually lesions in the
dorsomedial thalamus and the mammillary bodies.
In addition to anterograde amnesia, Korsakoff's syndrome can involve
more severe retrograde amnesia than observed in N.A. and H.M. No strong
correlation exists between the severity of anterograde amnesia and retro-
grade amnesia in Korsakoff's syndrome. This is consistent with the orher
studies of amnesia we've discussed, suggesting that the mechanisms involved
in consolidation (disrupted in anrerograde amnesia) are largely distinct
from processes used to recall memories (disrupted in retrograde amnesia).
Based on a small number of cases such as that of N.A., researchers suspect
that anterograde amnesia associated with diencephalic lesions results from
damage to the thalamus and mammillary bodies. Although it is nor clear
which damage causes the retrograde amnesia, in addition to diencephalic
lesions, Korsakoff's patienrs sometimes have damage to the cerebellum,
brain stem, and neocortex.
Memory Functions of the Hippocampus
One important role of the medial temporal lobes is in declarative memory
processing or consolidation. The best evidence is the severe anterograde
amnesia produced by medial temporal lesions. Physiological recordings in
... THETEMPORAL LOBES AND DECLARATIVE MEMORY 745
the hippocampus are also consistent with this structure being involved in
memory. Researchers have observed in both animals and humans that the
same stimulus elicits a different response when it is familiar than when it
is unfamiliar. In some neurons the stimulus gives rise to a larger response
when it is familiar, and in other cells the response is less when the stimulus
is familiar. Fried et a1. had the rare opportunity to record from individual
neurons in human hippocampus as part of surgery to relieve epilepsy. They
showed pictures of household objects to patients and recorded hippocam-
pal activity. Figure 24.14 shows a hippocampal response that was greater
for objects that had been shown 10 hours earlier than for objects that were
seen for the first time. Whether the response to familiar objects is greater
or less than to unfamiliar objects, the fact that there is a difference suggests
that the hippocampal activity may reflect recognition.
Much of what we know about memory and the hippocampus comes
from studies conducted in rats. The research suggests that the hippocam-
pus is involved in diverse memory functions in addition to declarative
memory formation.
The Effects of Hippocampal Lesions in Rats. A role for the hippocam-
pus in memory has been demonstrated by experiments in which rats are
trained to get food in a radial arm maze, devised by David 01 ton and his
colleagues at Johns Hopkins University. This apparatus consists of arms, or
passageways. radiating from a central platform (Figure 24.15a). If a normal
rat is put in such a maze, it will explore until it finds the food at the end
of each arm. With practice, the rat becomes efficient at finding all the food,
going down each arm of the maze just once (Figure 24.15b). To run through
the maze without going twice into one of the arms, the rat uses visual or
other cues around the maze to remember where it has already been. Work-
ing memory is presumably used to retain information about which arms
have been visited.
If the hippocampus is destroyed before the rat is put in the maze, per-
formance will differ from normal in an interesting way. In one sense, rats
with lesions seem normal; they learn to go down the arms of the maze and
eat the food placed at the end of each arm. But unlike normal rats, they
never learn to do this efficiently. Rats with hippocampal lesions go down
the same arms more than once, only to find no food after the first trip, and
they leave other arms containing food unexplored for an abnormally long
time. It appears that the rats can learn the task in the sense that they go
Q
o
o 0
o
(b)
(a)
FIGURE 24.15
Following a rat through a radial arm maze. (a) An eight-arm radial maZe. (b) The
path of a rat through a maze in which all the arms contain food. (c) If a rat learns that four
of the eight arms never contain food. It will ignore these and follow a path to only the
baited arms. (Source: Parts band c, adapted from Cohen and Eichenbaum, 1993, Fig. 7.4.)
':;
:g
ro
ro
0.
E
ro
u
o
0.
0.
:.c
OJ
>
.'@
ID
a: No stimulus New Old
FIGURE 24.14
Hippocampal responses to old and
new stimuli. The left bar shows hippocam-
pal activity in the absence of stimulation. The
middle bar shows that when a new (unfamiliar)
stimulus was presented, the response was not
significantly different from the no-stimulus ac-
tivity The right bar shows that the response to
old stimuli was significantly elevated, perhaps
indicating recognition of the familiar objects.
The "new" stimuli were pictures of household
objects, and "old" stimuli were ones that had
been presented in a previous session I 0
hours earlier. (Source: Adapted from Fried
et aI., 1997, Fig. 5.)
a
746 CHAPTER 24 . MEMORY SYSTEMS
down the arms in search of food. But they cannot seem to remember which
arms they've already been down.
A variation on the radial arm experiment illustrates an important sub-
tlety in the deficit produced by destroying the hippocampus. Instead of
placing food at the end of all the arms of the maze, food is placed only at
the ends of certain arms and never in the other ones. After a bit of prac-
tice, a normal rat learns to avoid going down the arms that never contain
food (Figure 24.15c). At the same time, the rat learns to efficiently get the
food in the other arms, entering each arm just once. How do rats with
hippocampal lesions perform on this task? Interestingly, just like normal
rats, they are able to learn to avoid the arms that never contain food. But
they still are not able to get the food from the other arms without wasting
time going down the same arms more than once. Isn't this a little odd? How
can we argue that the lesion disrupts the ability to learn the locations of
arms that have already been entered, even though the rat can learn to
avoid arms that never contain food? Evidently, the key to making sense of
these findings is that the information about the no-food arms is always the
same each time the rat goes in the maze, whereas the information about
which arms the rat has already entered requires working memory and
varies from one trial to the next.
Spatial Memory and Place Cells. Several lines of evidence suggest that,
at least in rats, the hippocampus is particularly important for spatial mem-
ory. The Morris water maze, a commonly used test of spatial memory in
rats, was devised by Richard Morris of the University of Edinburgh (Box
24.4). 'In this test, a rat is placed in a pool filled with milky water (Figure
24.16). Submerged just below the surface in one location is a small plat-
form that allows the rat to escape. A naive rat placed in the water will swim
around until it bumps into the hidden platform, and then it will climb onto
it. Normal rats quickly learn the spatial location of the platform and on sub-
sequent trials waste no time swimming straight to it. Moreover, once they
have figured out what to search for, rats put in a new maze learn the task
much faster. But rats with bilateral hippocampal damage never seem to fig-
ure out the game or remember the location of the platform.
In a fascinating series of experiments begun in the early I970s, John
O'Keefe and his colleagues at University College London showed that
many neurons in the hippocampus selectively respond when a rat is in a
Hidden platform
---;
Wading pool
------
/
/
--
.;,
I
(
l
\.
"
l
(a) Before learning
(b) After learning
FIGURE 24.16
The Morris water maze. (a) The trajectory a rat might take to find a hidden platform
the first time the rat is placed In the pool. (b) After repeated tnals. the rat knows where
the platform is and swims straight to it. Learning this task requires the activation of NMDA
receptors in the hippocampus.
.. THETEMPORAL LOBES AND DECLARATIVE MEMORY 747
Box 24.4
PATH OF D SCOVERY
jit",
.
..JJIP'&. !&..
I
t
A Brief History
of the Water Maze
My parents were both mathematicians. One day, a friend
at school asked if I would like to help him build a "com-
puter:' I didn't know what that was, but was soon wiring
up switches, transistors, and resistors on circuit boards-
which is how it was in the I 960s. We got it to add two
binary numbers, but couldn't do subtraction. One day, I
worked out that if you changed all the Os and I s of the
larger binary number into I s and Os respectively, added
the two numbers, and then reversed things again, you had
effectively subtracted. So I wired up an inverter circuit,
and our computer subtracted by adding. I still remember
running across the school grounds to tell my friend.
After earning my Ph.D. in 1973, I met John O'Keefe and
Lynn Nadel in London. They introduced me to "place
cells" in the rat hippocampus, and pressed me to think of
new ways to study spatial learning. They weren't sure that
reading the literature was the right thing to do. The key
observation was that place cells fired where they did ir-
respective of local cues. I resolved to get rid of local cues
in a true learning task.
Upon joining the University of St. Andrews in Scotland,
I was assigned a laboratory in the somewhat antiquated
Gatty Marine Laboratory down by the beach. It was a
slightly strange place to work, getting to my lab past
tanks of sea creatures of various shapes. One day, it oc-
curred to me that rats might be able to learn while
swimming and that this might help solve the local cue
problem. Could they escape from water onto a platform
that was hidden beneath the water surface--a platform
that the rats couldn't see, hear, smell, or feel until they got
to it!
The first "water maze" was built from hardboard and
yacht resin with the help of an animal technician over a
by Richard Morris
weekend, these being the halcyon days when staff still had
access to workshops and Health and Safety Officers were
unheard of. To our delight, the rats learned the task very
quickly, but couldn't do it if we moved the platform from
trial to trial. A year later, we observed that learning was
impaired by hippocampal lesions unless the platform was
visible. We tracked the animals by tracing the swim path
with a felt-tip pen onto clear film that we had taped over
a video monitor. A year later, the British Broadcasting
Corporation (BBC) introduced a BBC Computer with
128 K of memory. So we wrote a little program and were
soon able to track paths of swimming rats directly. This
was a revelation because, to my knowledge, studies of
spatial learning had hitherto relied on observer reports.
It was a small step toward better objectivity.
Soon after, I had the privilege of going to work with Gary
Lynch at UC Irvine. I discussed my water maze experi-
ments with Eric Harris, then a post-doc with Carl Cot-
man. He drew my attention to a recently published paper
by Graham Collingridge on the role of the NMDA re-
ceptor in LTP and a drug called APS (APV) that blocked
it. Sadly, it was time to go home, but upon returning to
Scotland, Jeff Watkins at Bristol University kindly gave me
a small supply of this magic drug, and I began work. Using
mini pumps, I did some acute in vivo experiments on den-
tate LTP. APS's blockade of LTP in vivo was complete. I was
amazed and excited. The obvious next step was to try
this in swimming rats, and to my astonishment, I found
that rats treated with the drug were poor at learning the
water maze. The experiments were run "blind;' and I had
something of the same excitement when we broke the
animal code as I'd had as a boy working out that you can
subtract by addition. Discovering things is great fun.
particular location in its environment. Suppose we have a microelectrode
implanted in the hippocampus of a rat while it scurries about inside a large
box. At first the cell is quiet. but when the rat moves into the northwest
corner of the box, the cell starts firing. When it moves out of the corner,
the firing stops; when it returns, the cell starts firing again. The cell only
responds when the rat is in that one portion of the box (Figure 24.17a).
This location, which evokes the greatest response, is called the neuron's
place field. We try recording from another hippocampal cell, and it too has
a place field, but this one fires only when the rat goes to the center of the
box. For obvious reasons, these neurons are called place cells.
748 CHAPTER 24 . MEMORY SYSTEMS
FIGURE 24.17
Place cells in the hippocampus. A rat
explores a small box for 10 minutes (left
panels). Then a partition is removed so the rat
can explore a larger area (center and
right panels). (a) Color coding indicates the
area in the box where one place cell in the
hippocampus responds: red, large response;
yellow, moderate response; blue, no response.
This cell has a place field in the smaller upper
box: when the partition is removed, it stays in
the same location. (b) In this case, an elec-
trode is next to a cell in the hippocampus
that does not respond when the rat IS In the
smaller upper box (left). In the first 10 min-
utes after the partition is removed. the cell
also does not respond (center). But after an
another 10 minutes, a place field develops in
the new larger box (right). (Source: Adapted
from Wilson and McNaughton, 1993, Fig. 2.).
Cell 1 Cell 2
. .
Partition Partition
(a) (b)
.
.
In some ways, place fields are similar to the receptive fields of neurons
in the sensory systems. For instance, the location of the place field is related
to sensory input such as visual stimuli in the enyjronment. In our experiment
with the rat in the box, we could paint images above the four corners, such
as a star above the northwest corner, a happy face above the southeast cor-
ner, and so on. Consider a cell that responds only when the rat is in the
northwest corner of the box, near the painted star. Suppose we take the rat
out of the box and blindfold it. We then secretly go back and rotate the
box 180 0 so that now the northwest comer has the happy face and the
southeast corner has the star. Will the ceJl we were previously studying re-
spond when the animal is in the northwest corner, or will it respond in the
corner where the star is now located (the southeast corner)? We put the
rat back in the box and take off the blindfold. It starts exploring, and the
neuron becomes active when the rat goes to the corner near the star. This
demonstrates that, at least under some conditions, the response is based on
visual stimuli.
While place cells are similar to receptive fields in some ways, there are also
major differences. For instance, once the animal has become familiar with
the box with the images painted in each corner, a neuron will continue to
fire when the rat goes into the northwest corner, even if we turn off the
lights so it cannot see the location markers. Evidently, the responses of
place cells are related to where the animal thinks it is. If there are obvious
visual cues (such as the star and happy face), the place fields will be based
on these cues. But if there are no cues (e.g., because the lights are out), the
place cells will still be location specific as long as the animal has had enough
time to explore the environment and develop a sense of where it is.
Performance in the radial arm maze, discussed above. may utilize these
place cells, which code for location. Of particular importance in this regard
is the finding that the place fields are dynamic. For instance, let's say we
first let a rat explore a small box, and we determine the place fields of
several cells. Then we cut a hole in a side of the box so the animal can
explore a larger area. Initially, there will not be any place fields outside the
smaller box. But after the rat has explored its new expanded environment,
some cells will develop place fields outside the smaller box (Figure 24.1 7b).
These cells seem to learn in the sense that they alter their receptive fields
to suit the current environment. It's easy to imagine how these sorts of cells
could be involved in remembering arms already visited in the radial arm
maze. And, if they are involved in running the maze, it certainly makes
sense that performance is degraded by destroying the hippocampus.
Whether or not there are place cells in the human brain is not known.
However, PET imaging studies show that the human hippocampus is acti-
vated in situations involving virtual or imagined navigation through the
environment. In one experiment. subjects were positioned in a PET machine
to view a video game on a computer monitor. They could navigate a virtual
town in the game by using buttons for I"orward movement, backward move-
ment, and turning (Figure 24.I8a). After learning their way around the
virtual town, brain activity was recorded while they navigated their way
.. THE TEMPORAL LOBES AND DECLARATIVE MEMORY 749
from an arbitrary starting point to a chosen destination. In a control con-
dition, the person moved through the virtual environment from the same
start to finish locations, but arrows in the town always pointed them in the
correct direction. In this condition, they did not have to think about how
to navigate.
Figure 24.18b shows the difference in brain activity between the naviga-
tion condition and the control condition with directional arrows. When the
person had to navigate the environment, there was increased activation of
the right hippocampus and the left tail of the caudate. The asymmetry in the
activation of the left and right hemispheres is an interesting observation that
has been repeatedly made, but our primary point is that the hippocampus
is particularly active in this spatial navigation task with humans, just as it
is in rats. The caudate activation is thought to reflect movement planning.
Similar hippocampal activation was observed in an interesting study in
which the brains of experienced taxi drivers were imaged as they imagined
themselves driving to a destination through the complex streets of London.
Spatial Memory, Working Memory, and Relational Memory. From
our discussion of the hippocampus to this point, it may seem that its role
is easily defined. First, we saw that performance in a radial arm maze,
which requires memory for the locations of arms already explored, is dis-
rupted by hippocampal lesions. Second, the responses of neurons in the
hippocampus, the place cells, suggests that these neurons are specialized for
location memory. This is consistent with a hypothesis originally proposed
by O'Keefe, stating that the hippocampus is spedalized for creating a spatial
map of the environment. In one sense, it is undeniable that the hippocam-
pus, at least in rats, plays an important role in spatial memory.
Others argue, however, that this is not the best description of what the
hippocampus does. In Olton's original studies using the radial arm maze, he
described the result of hippocampal lesions as a deficit in working memory.
The rats were not able to retain recently acquired information concerning
arms already explored. Thus, working memory might be one aspect of
hippocampal function. This would explain why the rats with lesions could
avoid going down arms that never contained food but still not remember
which arms they had recently visited. Presumably after training, the infor-
mation about no-food arms was saved in long-term memory, but working
memory was still required to avoid the arms where food had already been
retrieved.
A hypothesis attempting to integrate a range of experimental findings
was proposed by behavioral neuroscientists Neal Cohen at the University
of Illinois, Howard Eichenbaum at the State University of New York, Stony
Brook, and their colleagues. Cohen and Eichenbaum describe the function
of the hippocampus, in conjunction with other structures of the medial
temporal lobe, as involving relational memory. The basic idea of relational
memory is that highly processed sensory information comes into the hip-
pocampus and nearby cortex, and memories are formed in a manner that
links all the things happening at the time. For example, as you read this
book, you may form memories relating multiple things: specific facts, illus-
trations that catch your eye, interesting passages, the arrangement of ma-
terial on the page, and information about the sounds or events going on
around you. Maybe you've tried finding a particular passage in a book by
searching for a page that looks the way you remember. Another common
example is how remembering one thing, such as the theme song to an old
television show, can bring back a flood of related associations-the characters
in the show, your living room at home, the friends you watched with, and
so on. Interconnectedness is a key feature of declarative memory storage.
......
.
. I
I
----
..
(a)
.
.
(b)
FIGURE 24.18
Activity in the human brain related
to spatial navigation. (a) A virtual town
was shown on a computer monitor, and
subjects in a PET imaging machine used
buttons to navigate the virtual environment.
(b) Increased brain activity associated with
spatial navigation was observed in the right
hippocampus and left tail of the caudate
(yellow). (Source: Maguire et aI., 1998, Fig. I.)
750 CHAPTER 24 . MEMORY SYSTEMS
----
(a)
II
\ Port A
'" ( '\
d - Odor 1
,
Odor 2
Port B
FIGURE 24.20
An odor discrimination experiment
used to study relational memory.
For various combinations of odors. rats were
trained to move toward a port emitting one
odor and avoid the other port. (Source:
Adapted from Eichenbaum et al.. 1988. Fig. I.)
FIGURE 24.19
Spatial navigation. In this experiment. a rat navigates its environment based on (a) a spa-
tial map or (b) a senes of relational memories. (Source: Adapted from Eichenbaum et al..
1999, Figs. 2 and 6.)
To navigate its environment, a rat could use either a mental map of space
or relational memories associated with environmental cues. The distinction
between the spatial map and relational memory hypotheses is illustrated in
Figure 24.19. 11' there is a spatial map, one would expect place fields to be
ordered in the hippocampus as the locations are in space, much like the
retinotopic receptive fields in visual cortex. Experts disagree about the ex-
tent to which hippocampal place cells provide such an organized map of
the entire area around the animal. In a relational memory scheme, neu-
rons encode information about place as a series of simple associations be-
tween nearby objects and concurrent sounds and smells. For example, in
Figure 24.19b, "ball A is below cone B" would be one memory and "cone
B is to the left of cylinder C" would be another. Strung together. such re-
lational memories could provide an understanding of the layout of the
environment without having a complete organized map in the hip-
pocampus.
Whether or not relational memory is the principal function of the hip-
pocampus has not been settled, but it is a useful concept. In the maze ex-
periments, a case can be made that the rat performs the task by storing
memories of the arms it has been down in terms of the sensory cues in the
room and the time it entered a given arm. Evidence also suggests that place
cells may encode relational information of types other than spatial location.
A simple example is that the responses of neurons with place fields are
sometimes also affected by other factors, such as the speed or direction the
rat is moving.
The responses of hippocampal neurons are also sometimes determined by
nonspatial factors. This was demonstrated in an experiment in which Eichen-
baum, Cohen, and their colleagues trained rats to discriminate between
odors. At one end of the rat's cage were two ports putting out two different
odors for the animal to sniff (Figure 24.20). For each pair of odors, the ani-
mal was trained to go toward the port releasing one odor and to avoid the
other port. The researchers found that some neurons in the hippocampus be-
came selectively responsive for certain pairs of odors. Moreover, the neurons
were particular about which odor was at which port-they would respond
strongly with odor 1 at port A and odor 2 at port B, but not with the odors
switched to the opposite ports. This indicates that the response of the hip-
pocampal neurons relates the specific odors, their spatial locations, and the
fact that they are presented separately or together. It was also shown that
hippocampal lesions produce deficits on this discrimination task.
.. THE STRIATUM AND PROCEDURAL MEMORY 751
... THE STRIATUM AND PROCEDURAL MEMORY
Thus far, we have focused on the brain systems involved in the formation
and retention of declarative memories, partly because declarative informa-
tion is what we usually mean when we say we remember something. In
addition, however, the neural basis of nondeclarative memory is complex
because different types seem to involve different brain structures. As indi-
cated in Figure 24.1, various kinds of nondeclarative memory are thought
to involve different parts of the brain. As an example of nondeclarative
memory, we will take a look at evidence supporting the involvement of the
striatum in habit learning and procedural memory.
Recall from Chapter 14 that the basal ganglia are important for the control
of voluntary movements. Two elements of the basal ganglia are the caudate
nucleus and the putamen, and together they are called the striatum. The
striatum sits at a key location in the motor loop, receiving input from
frontal and parietal cortex and sending output to thalamic nuclei and
cortical areas involved in movement. Several lines of evidence in studies of
rodents and humans suggest that the striatum is critical for the procedural
memory involved in forming behavioral habits.
Rodent Recordings and lesions in the Striatum
The amnesia experienced by H.M. is surprising, in part, because he is able
to learn new habits despite his complete inability to form new declarative
memories. Indeed, this is one of the most compelling reasons for hypothe-
sizing that procedural memory uses distinct circuitry. In the monkey model
of amnesia, we saw that the formation of new declarative memories could
be disrupted by making small lesions in the rhinal cortex of the medial tem-
poral lobe. Such a lesion has relatively little effect on procedural memory,
which raises an obvious question: Are there comparable lesions that disrupt
procedural memory without affecting declarative memory? In rodents, le-
sions to the striatum have this effect.
In one study, rats had to learn two versions of the radial arm maze task.
The first was the standard version discussed above, in which the rat must
move as efficiently as possible retrieving the food from each of the baited
arms of the maze. In the second version, small lights were illuminated
above one or more arms containing food, and the unlit arms had no food.
The lights could be turned on or off at any time. In this case, optimal per-
formance meant that the animal kept returning to retrieve food from lit
arms as long as they were lit and avoided arms that were never lit. The
standard maze task was designed to require the use of declarative memory.
The "light" version of the task was intended to draw on procedural mem-
ory because of the consistent association between the presence of food and
illuminated lights. The rat does not have to remember which arms it already
explored; it must simply form a habit based on the association that light
correlates with food. The rat's performance on the light task is analogous
to the habits H.M. was able to form, such as mirror drawing.
Performance on the two versions of the radial arm maze task were af-
fected in markedly different ways by two types of brain lesions. If the hip-
pocampal system was damaged (in this case, by lesioning the fornix that
sends hippocampal output), performance was degraded on the standard
maze task but was relatively unaffected on the light version. Conversely, a
lesion in the striatum impaired performance of the light task but had little
effect on the standard task. This "double dissociation" of the lesion site
and the behavioral deficit suggests that the striatum is part of a proce-
dural memory system but is not crucial for the formation of declarative
memories.
752 C H A PT E R 24 . MEMORY SYSTEMS
FIGURE 24.21
Changing responses in rat striatum
during the learning of a habit. (a) The
rat began at the end of the long arm of a
T-maze and turned left or right depending on
the pitch of a tone. (b) The percentage of
neurons that responded at several stages of
the task: start position. tone sounding, turning
into reward arm, and reaching the reward
(goal). Over the stages of learning. more cells
responded to the start and the goal and
fewer to the tone. (Source: Adapted from
Jog et aI., 1999, Figs. I and 2.)
-----------------------------...-------------------..
.
.
.
.
.
.
.
.
.
Start
Tone
Turn
(a) Goal
Start Tone Turn Goal
100 100 100 100
80 80 80
!!2
(j)
() 60 60 .
OJ
c
'6 40
c
0
a.
(f) 20 20
Q)
a:
0 0
1 3 5 7 9 3 5 7 9 3 5 7 9 1 3 5 7 9
(b) Stage Stage Stage Stage
Recordings made from the rat striatum in other experiments show that
neural responses change as the animals learn a procedure associated with
a food reward. In a simple T-maze task, rats were placed at the end of one
arm of the T and, as they moved away from the arm's end, a tone sounded
(Figure 24.21a). A low tone instructed the animal to turn left into the next
arm of the T to get a chocolate snack, and a high tone instructed the ani-
mal to turn right for the reward. Figure 24.21b shows the percentage of
neurons that responded when the animal was in several stages of the task:
start position, tone sounding, turning into reward arm, and reaching the
reward.
When the rats first performed the task, the highest percentage of neurons
responded when the animals turned into the reward arm. However, as
training progressed, this percentage decreased significantly. As the rats
mastered the procedure, increasingly more neurons became responsive at
the start and completion of the task. Also, increasing numbers of neurons
responded during more than one stage of the task. One possible interpreta-
tion of these changes in response patterns is that they reflect the formation
of a habit for which the striatum codes a sequence of behaviors initiated in
the T-maze situation. At present, this is only a hypothesis, but it is intrigu-
ing because of the connectivity of the striatum-taking in highly processed
sensory information and sending out signals involved in motor responses.
Habit Learning in Humans and Nonhuman Primates
Studies with monkeys indicate that the effects of selective brain lesions are
comparable in rodents and primates. In primates, there is a similar dissoci-
ation between the effects of lesions to the hippocampal system and the
striatum. As we have already seen, lesions to the medial temporal lobe sig-
nificantly impair performance on the DNMS task that uses declarative
memory. However, consider another task in which the animal repeatedly
sees two visual stimuli, such as a square and a cross, and it must learn to
... THE STRIATUM AND PROCEDURAL MEMORY 753
associate a food reward with only the cross. This kind of habit learning is
relatively unaffected by medial temporal lesions. Such preservation of habit
learning in monkeys is analogous to the rat's ability to retrieve food con-
sistently associated with light above an arm of a maze, even after a fornix
lesion.
In monkeys, lesions that involve the striatum or connections to it have
quite different effects from medial temporal lesions. When the striatum is
damaged, there is no effect on the performance of the DNMS task, demon-
strating both that declarative memory formation is still possible and that the
animal can discriminate visual stimuli. But when the striatum is damaged,
the animal is unable to form the habit of always rerrieving food associated
with one visual stimulus over another. Repeated exposure to this fixed
stimulus-reward situation just doesn't seem to sink in. Thus, there appear to
be somewhat distinct anatomical systems for declarative memory and pro-
cedural memory, and behaviors such as learned habits utilize the striatum.
Several diseases in humans attack the basal ganglia, and certain effects
on memory appear consistent with the striatum's role in procedural mem-
ory. For example, Huntington's disease kills neurons throughout the brain,
but the striatum is a focus of the attack. Huntington's patients have been
shown to have difficulty learning tasks in which a motor response is asso-
ciated with a stimulus. Although these people generally have motor dys-
function, difficulty in learning the stimulus-response habit does not corre-
late with the severity of the motor deficits, suggesting that it is an
independent consequence of the disease.
Further evidence for the involvement of the striatum in habit learning
comes from comparisons of patients with Parkinson's disease with amnesic
patients. As we saw in Chapter 14, Parkinson's disease is characterized by
degeneration of the substantia nigra inputs to the striatum. In one study,
people were tested on two tasks. In the first task, patients saw one, two, or
three out of four possible cues in one of ] 4 possible combinations. They
then had to guess whether this combination was arbitrarily associated with
a prediction of sunny or rainy weather (Figure 24.22a). For each patient,
'" thl, 'earn'". ga , yo" .,e the ,,;..
forecaster. You will learn how to predict rain
or shine using a deck of four cards:
... ...... .. .....
...... ...
... .....
...... . .
. ......... .. ...
75 90
70 80 T T
UJ UJ
OJ 65 OJ 70
UJ UJ
c: c:
0 0
a. 60 a. 60
UJ UJ
(3 55 (3 50
a 50 a 40
0 0
45 10 20 30 40 50 30
(b) Trials (c)
. Control . . . Parkinson's
1 Amnesia disease
(a)
FIGURE 24.22
The performance of patients with amnesia and Parkinson's disease on two
memory tasks. (a) Four cue cards were presented in various combinations associated
with the icons indicating sun or rain. Based on repeated exposure to the combinations,
patients had to learn to predict sun or rain by inferring the associations. (b) With successive
trials, control subjects and amnesic patients improved on the association task Parkinson's
patients showed little improvement. (c) On a test of declarative memory formation (a ques-
tionnaire), Parkinson's patients performed similar to control subjects, and amnesia patients
were greatly impaired. (Source: Adapted from Knowlton et al., 1996, Figs. I and 2.)
754 C HAP T E R 24 . MEMORY SYSTEMS
Central sulcus
I
,
\
(
1.......
Prefrontal
cortex
(, .:;;;-
f" ---
'-
,'\,
FIGURE 24.23
Prefrontal cortex. The prefrontal cortex
at the rostral end of the frontal lobe receives
afferents from the medial dorsal nucleus of
the thalamus.
the experimenter assigned different probabilities that various cues were
associated with sun or rain. By being told when they guessed correctly or
incorrectly about the predicted weather, the patients slowly built up an
association between the cues and the weather. The idea Jehind this task
was that it draws on the formation of a stimulus-response habit. In the
second task, declarative memory was tested by having patients answer
multiple-choice questions about the appearance of the cues and the com-
puter screen.
The Parkinson's patients had great difficulty learning the weather fore-
casting task (Figure 24.22b) but performed at normal levels on the declar-
ative memory questionnaire (Figure 24.22c). Conversely, amnesic patients
had no trouble learning the weather classification, but they performed sig-
nificantly worse than either Parkinson's patients or normal controls on the
questionnaire. These results suggest that the striatum in humans may play
a role in procedural memory as pan of a system distinct from the medial
temporal system used for declarative memory.
... THE NEOCORTEX AND WORKING MEMORY
Declarative and procedural memory are systems for storing memories for
long periods of time. After months or years of disuse, we can summon
these memories to answer a question in a crossword puzzle or participate
in a sport. Working memory is fundamentally different. Working memory
is information held in mind for some immediate need, be it a person re-
membering a phone number or a rat remembering the arms in a maze from
which it has already removed cheese. We have seen that working memory
may be one of several memory functions of the hippocampus, but there
appear to be many structures in the brain that temporarily store informa-
tion for working memory.
The Prefrontal Cortex and Working Memory
One of the most obvious anatomical differences between primates (espe-
cially humans) and other mammals is that primates have a large frontal
lobe. The rostral end of the frontal lobe, the prefrontal cortex, is partic-
ularly highly developed (Figure 24.23). Compared to the sensory and
motor cortical areas, the function of prefrontal cortex is relatively poorly
understood. But because it is so weD developed in humans, prefrontal cor-
tex is often assumed to be involved in those characteristics that distinguish
us from other animals, such as self-awareness and the capacity for complex
planning and problem solving. One reason for thinking that prefrontal cor-
tex may be involved in learning and memory is that it is interconnected
with the medial temporal lobe and diencephalic structures previously dis-
cussed (Figure 24.24).
Some of the first evidence suggesting that the frontal lobe is important
for learning and memory came from experiments performed in the 1930s
using a delayed-response task. A monkey first sees food being placed in a well
below one of two identical covers in a table. A delay period follows, dur-
ing which the animal cannot see the table. Finally, the animal is allowed
to see the table again and receives the food as a reward if it chooses the
correct welL Large prefrontal lesions seriously degrade performance on this
delayed-response task and on other tasks including a delay period. More-
over, the monkeys perform increasingly poorly as the delay period is length-
ened. These results imply that prefrontal cortex plays some important role
in memory.
... THE NEOCORTEX AND WORKING MEMORY 755
Medial temporal
lobe structures
Anterior nucleus
Hypothalamus --.. of the thalamus
----.. Cingulate
cortex
...
Dorsomedial nucleus
of the thalamus
... Frontal
cortex
FIGURE 24.24
Connections between cortical associa-
tion areas and the medial temporal
lobe. Prefrontal cortex, as well as cingulate
cortex, receive afferents from structures of
the medial temporal lobe.
Experiments conducted more recently suggest that prefrontal cortex is
involved with working memory for problem solving and the planning of
behavior. One piece of evidence comes from the behavior of humans with
lesions in prefrontal cortex. These people usually perform better than those
with medial temporal lesions on simple memory tasks, such as recalling
information after a delay period. However, in other more complex tasks,
humans with prefrontal damage show marked deficits. Recall the case of
Phineas Gage, discussed in Chapter 18. Having sustained severe frontal lobe
damage (an iron bar passing through the head), Gage had a difficult time
maintaining a course of behavior after his injury. Although he could carry
out behaviors appropriate for different situations, he had difficulty planning
and organizing these behaviors, perhaps because of the damage to his
frontal lobe.
A task that brings out the problems associated with prefrontal cortical
damage is the Wisconsin card-sorting test. A person is asked to sort a deck
of cards having a variable number of colored geometric shapes on them
(Figure 24.25). The cards can be sorted by color, shape, or number of
symbols, but at the beginning of the test, the subject isn't told which cat-
egory to use. However, by putting cards into stacks and being informed
when errors occur, the subject learns what the current sorting category
is. After 10 correct card placements are made, the sorting category is
changed, and the routine starts over again. To perform well on this test,
the person must use memory for previous cards and errors made, in or-
der to plan the next card placement. People with prefrontal lesions have
great difficulty on this task when the sorting category is changed; they
continue to sort according to a rule that no longer applies. It appears that
First sort by color
Then sort by shape
FIGURE 24.25
The Wisconsin card-sorting test. Cards containing various numbers of colored symbols
must first be sorted by color. After a string of correct responses is made, the sorting cate-
gory IS changed to shape.
756 C HAP T E R 24 . MEMORY SYSTEMS
FIGURE 24.26
Working memory activity in monkey
prefrontal cortex. The two histograms
show the activity of cells in prefrontal cortex
recorded while the animal performed a de-
layed-response task During a cue period of
7 seconds, food IS placed into ol'1e of two
wells within the monkey's view. During the
delay period, the animal cannot see the food
wells; after the delay, it is allowed to choose
a well to receive a food reward (the choice
period). (a) This cell responds when the well
is first baited with food and again when the
animal exposes the well to get the food.
(b) This cell responds strongest during the
delay period. when there is 1'10 visual stimulus.
(Source: Adapted from Fuster; 1973. Fig. 2.)
20
15
u
OJ
10
-'"
'6.
CfJ
5
o
(8)
o
20
10
20 l
15
.1
U
<lJ
10
-'"
'6.
CfJ
5
o
(b)
o
'--v----' \
Cue
period
y
Delay (see)
10
20
) '--y---J
Choice
period
they have difficulty using recent information (Le., data in working mem-
ory) to change their behavior.
The same kind of deficit is seen in other tasks. For example, a person
with a prefrontal lesion might be asked to trace a path through a maze
drawn on a piece of paper. Although the patient will understand the task
he will repeatedly make the same mistakes, returning to blind alleys. In
other words, patients do not learn from their recent experience in the same
way that a normal person does. And when they make mistakes, they may
have difficulty returning to an earlier point in the maze and instead start
over from the beginning.
The neurons in prefrontal cortex have a variety of response types, some
of which may reflect a role in working memory. Figure 24.26 shows two
response patterns obtained while a monkey performed a delayed-response
task. The neuron in the top trace responded while the animal saw the loca-
tion of the food, was unresponsive during the delay interval, and responded
again when the animal made a choice (Figure 24.26a). The response of the
neuron simply correlates with the presentation of the stimuli. Perhaps
more interesting is the response pattern of the other neuron, which fired
only during the delay interval (Figure 24.26b). This cell was not directly
activated by the stimuli in the first or second interval in which it saw the
food wells. The increased activjty during the delay period may be related
to the retention of information needed to make the correct choice after the
delay (i.e., working memory).
Imaging Working Memory in the Human Brain. Human brain imaging
experiments suggest that numerous areas in the prefrontal cortex are involved
in working memory. In one study by Courtney et al., brain activity was
recorded by fMRI while subjects viewed a succession of face pictures. The
first sample face was presented for 3 seconds. After an 8-second delay, the
subject saw a test face for 3 seconds. The subject's task was to remember
.. THE NEOCORTEX AND WORKING MEMORY 757
,)
\J
(" '- '-- k
, ,
'"
\ \ 1 J
.... "\
, \.
"\
-
'f((lf ___ .
"I:;:....,
"
the sample face and press buttons to indicate whether the test face was the
same or different. In a second experiment, a similar paradigm was used, but
the subject's task was to remember the location of three faces presented
before the delay but not the facial identity. Both experiments looked for brain
activity during the delay interval while the subject had to hold information
in mind. In the first experiment, this was information about faces; in the
second experiment, it was information about spatial location.
Brain areas showing significant working memory activity are summarized
in Figure 24.27. Six areas in the frontal lobe showed significant sustained
activity during the delay period, suggesting a role in working memory.
Three areas exhibited stronger sustained activity for facial identity than
spatial location, one area was more responsive to spatial memory, and two
areas were active equally in facial and spatial memory tasks. An interest-
ing unanswered question is whether working memory for other types of
information is held in the same Or different brain areas.
Area LIP and Working Memory
Conical areas outside the frontal lobe have also been found to contain
neurons that appear to retain working memory information. In Chapter 14,
we saw an example in area 6 (see Figure 14.9). Another example is pro-
vided by lateral intraparietal cortex (area LIP), buried in the intrapari-
etal sulcus (Figure 24.28). Area LIP is thought to be involved in guiding eye
movements because electrical stimulation here elicits sacca des. The re-
sponses of many neurons suggest that they are involved in a type of work-
ing memory. This pattern is evident in a delayed-saccade task, in which the
animal fixates On a point on a computer screen and a target is briefly
flashed at a peripheral location (Figure 24.29a). After the target goes off,
there is a variable-length delay. At the end of the delay period, the fixation
point disappears, and the animal's eyes make a saccadic movement to the
remembered location of the target. The response of an LIP neuron while a
monkey performs this task is shown in Figure 24.29b. The neuron begins
firing shonly after the peripheral target is presented; this seems like a
normal stimulus-evoked response. But the cell keeps firing throughout the
delay period in which there is no stimulus, until saccadic movements finally
occur. Further experiments using this delayed-saccade task suggest that the
response of the LIP neuron is temporarily holding information that will be
used to produce the saccades.
Other areas in parietal and temporal cortex have been shown to have
analogous working memory responses. These areas seem to be modality
specific, just as the responses in area LIP are vision specific. This is con-
sistent with the clinical observation that there are distinct auditory and vi-
sual working memory deficits in humans produced by conical lesions.
FIGURE 24.27
Human brain areas and working
memory. In these lateral and medial views,
SIX areas in the frontal lobe show sustained
activity correlated with working memory. Sub-
jects had to retain information about either
facial Identity or spatial location. The three
blue areas showed greater sustained activity
in the facial identity task. the two green areas
were equally active in facial identity and spatial
memory tasks. and the red area was more
active in the spatial memory task. (Source:
Adapted from Haxby et al.. 2000, Fig. 5.)
Central sulcus
/ ./'Intraparietal
/ ./' sulcus
FIGURE 24.28
Area LIP, buried in the intraparietal
sulcus. Working memory responses are
observed in some LIP neurons, which are
involved in guiding eye movements.
758 C HAP T E R 24 . MEMORY SYSTEMS
FIGURE 24.29
The delayed-saccade task. (a) The monkey
fixates on a central pOint while a penpheral
target flashes on and off. During a delay period
after the target goes off. the monkey must
continue to fixate on the central point At the
end of the delay. the fixation pOint disappears,
and the animal knows to move its eyes to the
remembered location of the target. (b) The his-
togram shows the response of an LIP neuron.
The neuron begins firing when the target is
presented and continues firing until after the
fixation point IS gone and tI'le sacc.adic eye
movement begins. (Source: Adapted from
Goldman-Raklc. 1992, Fig. p I I], and Gnadt
and Andersen, 1988, Fig. 2.)
-L---
/
I
"'
Time 1 '.
,
"'"
Time 2 '.
-
Time 3
.
\
\
\
-'"\
Target
I
I
, ,
X
, I
X
x
'-
\
\
Fixation
point
(a)
(/)
120
'0..
(/)
'0
ID
.Q
E
::J 0
Z
(b)
.. CONCLUDING REMARKS
Learning and memory occur throughout the brain. It is not a matter of a
small number of specialized "memory cells" storing our life experiences and
learned behaviors independent from the rest of brain function. This is log-
icat considering that behavioral adaptability is critical for survival and that
the required brain adaptations involve sensory systems (you recognize
what you see over there as an angry dog that might bite you), motor control
systems (the combination of muscle contractions required to keep you atop
a unicycle). and systems more specialized for storing facts.
We have seen that memories can be categorized based on duration, the
kind of information stored, and the brain structures involved. The distinct
types of memory, and the fact that one type can be disrupted without af-
fecting others in amnesia, suggest that multiple brain systems are used for
memory storage. What remains unclear is how memory types defined by
psychological testing are correlated with anatomical structures. Declarative
memory depends on the hippocampus and related structures, procedural
memory involves the striatum, and working memory traces are found in
many brain locations.
But how do different parts of the brain interact to enable us to learn?
We've said that engrams may exist in temporal lobe neocortex, among
other places. But what is the physiological basis for the memory storage?
When we try to remember a phone number, an interruption can make us
forget, suggesting that memories are initially held in a particularly fragile
form. However, long-term memory is much more robust; it can survive
interruption, anesthesia, and the normal bumps and traumas that life
involves. Partly because of this robustness, it is thought that memories are
ultimately stored in structural changes in neocortex. Our brain is constantly
undergoing rewiring, to a certain degree, to adapt to life's experiences. The
nature of these structural changes in the brain, which underlie learning and
memory, is the subject of Chapter 25.
..
>-V)
wI:
a::
w
I--
... CONCLUDING REMARKS 759
Types of Memory
and Amnesia
learning (p. 726)
memory (p. 726)
declarative memory (p.726)
nondeclarative memory (p. 726)
procedural memory (p. 726)
long-term memory (p. 727)
short-term memory (p. 729)
memory consolidation (p. 729)
working memory (p. 729)
amnesia (p. 729)
retrograde amnesia (p. 730)
anterograde amnesia (p. 730)
The Search for the Engram
engram (p. 73 I )
cell assembly (p. 733)
Korsakoff's syndrome (p. 744)
Morris water maze (p.746)
place cell (p.747)
relational memory (p.749)
The Temporal Lobes and
Declarative Memory
hippocampus (p. 740)
entorhinal cortex (p.741)
perirhinal cortex (p.741)
parahippocampal cortex (p. 741)
fornix (p. 741)
delayed non-match to sample
(DNMS) (p. 741)
recognition memory (p. 742)
The Striatum and
Procedural Memory
striatum (p. 751)
The Neocortex and
Working Memory
prefrontal cortex (p. 754)
lateral intraparietal cortex (area
LIP) (p. 757)
riA
,LZJ
sV>
w Z
o
>
wI--
a:: V>
w
::>
a
I. If you try to recall how many windows there are in your house by mentally walking from room to room,
are you using declarative memory, procedural memory, or both
2. What evidence is there that declarative and nondeclarative memory use distinct circuits
3. What abilities and disabitities do you think a person completely lacking working memory would have
4. Why did Lashley conclude that all cortical areas contribute equally to learning and memory Why was this
conclusion later called into question
5. What evidence indicates that long-term memories are stored in neocortex
6. If you were using a microelectrode to record from the brain and you suspected that a neuron you en-
countered was involved in storing long-term memories, how would you test that hypothesis
7. If a neuron in visual cortex responds to faces, how could you determine whether it is involved in percep-
tion or storing memories for faces
8. What are place cells, and where are they found In what ways are the response characteristics of place cells
different from the receptive fields of sensory neurons
9. What role does the hippocampus play in spatial memory, working memory, and relational memory
10. What is working memory, and in what brain areas have neural correlates of working memory been
observed
6d
a::l:)
Wz
I-
1--0
a::«
::>w
u.a::
Baddeley A. 2003. Working memory: looking back
and looking forward. Nature Reviews Neuroscience
4:829-839.
Corkin S. 2002. What's new with the amnesic
patient H.M. Nature Reviews Neuroscience
3:153-160.
Eichenbaum H. 2000. A cortical-hippocampal system
for declarative memory. Nature Reviews Neuro-
science 1:41-50.
Haxby JV, Petit L, Ungerleider LG, Courtney SM.
2000. Distinguishing the functional roles of multi-
ple regions in distributed neural systems for visual
working memory. Neuroimage II :380-391.
Passingham D, Sakai K. 2004. The prefrontal cortex
and working memory: physiology and brain
imaging. Current Opinion in Neurobiology 14:
163-168.
Squire LR, Stark CEL, Clark RE. 2004. The medial
temporal lobe. Annual Review of Neuroscience
27:279-306.
CHAPTER
Molecular Mechanisms
of Learning and Memory
INTRODUCTION
PROCEDURAL LEARNING
NONASSOCIATIVE LEARNING
Habituation
Sensitization
ASSOCIATIVE LEARNING
Classical Conditioning
Instrumental Conditioning
SIMPLE SYSTEMS: INVERTEBRATE MODELS OF LEARNING
NONASSOCIATIVE LEARNING IN APLYSIA
Habituation of the Gill-Withdrawal Reflex
Sensitization of the Gill-Withdrawal Reflex
ASSOCIATIVE LEARNING IN APLYSIA
VERTEBRATE MODELS OF LEARNING
SYNAPTIC PLASTICITY IN THE CEREBELLAR CORTEX
Anatomy of the Cerebellar Cortex
Long-Term Depression in the Cerebellar Cortex
Mechanisms of Cerebellar LTD
SYNAPTIC PLASTICITY IN THE HIPPOCAMPUS
Anatomy of the Hippocampus
Properties of LTP in CA I
Mechanisms of LTP in CA I
. Box 25.1 Brain Food: Synaptic Plasticity: Timing Is Everything
Long-Term Depression in CA I
LTp, LTD, and Glutamate Receptor Trafficking
LTp, LTD, and Memory
. Box 25.2 Of Special Interest: Memory Mutants
THE MOLECULAR BASIS OF LONG-TERM MEMORY
PERSISTENTLY ACTIVE PROTEIN KINASES
CaMKII and LTP
. Box 25.3 Path of Discovery: A Memorable Walk on the Beach, by John E. Lisman
PROTEIN SYNTHESIS
Protein Synthesis and Memory Consolidation
CREB and Memory
Structural Plasticity and Memory
CONCLUDING REMARKS
,
762 C HAP T E R 25 . MOLECULAR MECHANISMS OF LEARNING AND MEMORY
... INTRODUCTION
An important first step in understanding the neurobiology of memory is
identifying where different types of information are stored. As we saw in
Chapter 24, answers to this question are beginning to yield to basic neuro-
scientific research. However, an equally important question concerns how
information is stored. As Hebb pointed out (and as research using computer
models has amply confirmed), memories can result from subtle alterations
in synapses, and these alterations can be widely distributed in the brain.
This helps narrow the search for a physical basis of memory-synaptic
modifications-but it also raises a dilemma. The synaptic modifications that
underlie memory may be too small and too widely distributed to be observed
and studied experimentally.
These considerations inspired some researchers to study the nervous
systems of simple invertebrate animals for insights about the molecular
mechanisms of memory. Although such animals obviously aren't going to
remember the definition of an isosceles triangle, they do display certain
types of simple procedural memory. Invertebrate research has clearly shown
that Hebb was right: Memories can reside in synaptic alterations. Moreover,
it has been possible to identify some of the molecular mechanisms that lead
to this synaptic plasticity. Although nonsynaptic changes have also been
found that may account for some types of memory, invertebrate research
leaves little doubt that the synapse is an important site of information
storage.
It would be disappointing if the best we could do was understand how a
sea slug learns. We really want to know how our own brain forms memories.
Hope for this understanding now comes from the study of synaptic plastic-
ity in regions of the mammalian brain associated with different types of
memory. Theoretical work and invertebrate studies point to lasting alter-
ations in the effectiveness of synapses in the brain as a basis for memory.
Therefore, researchers have used electrical stimulation of the brain to pro-
duce measurable synaptic alterations whose mechanisms can be studied.
One of the interesting conclusions of this research is that the mechanisms
of activity-dependent synaptic plasticity in the adult brain have much in
common with those operating during development for wiring the brain.
Another conclusion is that the basic molecular mechanisms in the mam-
malian brain that alter synaptic effectiveness are quite similar to memory
formation mechanisms in invertebrates.
There is a growing sense of optimism among neuroscientists that we may
soon know the physical basis of memory. This investigation has benefited
from the combined approaches of researchers in disciplines ranging from
psychology to molecular biology. In this chapter, we take a look at some of
their discoveries.
... PROCEDURAL LEARNING
Recall that declarative memories have a certain ethereal quality. They are
easily formed and easily forgotten, and they may result from small modifi-
cations of synapses that are widely distributed in the brain. These charac-
teristics make this type of memory particularly challenging to study at the
synaptic level. However, procedural memories have characteristics that make
them more amenable to investigation. Besides the fact that these memo-
ries are particularly robust, they can be formed along simple reflex path-
ways that link sensations to movements. Procedural learning involves
learning a motor response (procedure) in reaction to a sensory input and
it is typically broken down into two categories: nonassociative learning and
associative learning.
Nonassociative Learning
Nonassociative learning describes the change in the behavioral response
that occurs over time in response to a single type of stimulus. There are
two types: habituation and sensitization.
Habituation. Suppose you live in a house with a single telephone. When
the phone rings, you run to answer it. But every time you do, the call is
for someone else. Over time, you stop reacting to the ringing of the phone
and eventually no longer even hear it. This type of learning, habituation,
is learning to ignore a stimulus that lacks meaning (Figure 25.1a). You are
habituated to a lot of stimuli. Perhaps as you read this sentence, cars and
trucks are passing by outside, a dog is barking, your roommate is playing U2
for the hundredth time-and all this goes on without your really noticing.
You have habituated to these stimuli.
Sensitization. Suppose you're walking down the sidewalk on a well-lit
city street at night, and suddenly there is a blackout. You hear footsteps
behind you, and though normally this wouldn't disturb you, now you
nearly jump out of your skin. Car headlights appear, and you react by side-
stepping away from the street. The strong sensory stimulus (the blackout)
caused sensitization, learning to intensify your response to all stimuli,
even ones that previously evoked little or no reaction (Figure 25.1b).
Associative Learning
During associative learning, we form associations between events. Two
types are usually distinguished: classical conditioning and instrumental
conditioning.
Classical Conditioning. This type of learning was discovered and charac-
terized in dogs by the famous Russian physiologist Ivan Pavlov around the
turn of the nineteenth century. Classical conditioning involves associat-
ing a stimulus that evokes a measurable response with a second stimulus
that nonnally does not evoke this response. The first type of stimulus, the
one that nonnally evokes the response, is called the unconditional stimulus
(US) because no training (conditioning) is required for it to yield a response.
In Pavlov's experiments, the US was the sight of a piece of meat, and the
response was salivation by the dog. The second type of stimulus, the one
that normally does not evoke this same response, is called the conditional
stimulus (CS) because this one requires training (conditioning) before it will
yield this response. In Pavlov's experiments, the CS was an auditory stimu-
lus, such as the sound of a bell. Training consisted of repeatedly pairing the
sound with the presentation of the meat (Figure 25.2a). After many of
these pairings, the meat was withheld, and the animal salivated to the
sound alone. The dog had learned an association between the sound (CS)
and the presentation of meat (US); the dog learned that the sound predicted
the meat (Figure 25.2b). The learned response to the conditioned stimulus
is called the conditioned response (CR).
It is important to understand that there are certain timing requirements
in successful classical conditioning. Conditioning will occur if the US and
CS are presented simultaneously, or if the CS precedes the US by a short
... PROCEDURAL LEARNING 763
OJ
(/)
c:
o
Q.
(/)
OJ
a:
(a)
5 10
Stimulus number
15
OJ
(/)
c:
o
Q.
(/)
OJ
a:
t
(b)
5 10
Stimulus number
15
FIGURE 25.1
Types of nonassociative learning.
(a) In habituation, repeated presentation of
the same stimulus produces a progressively
smaller response. (b) In sensitization, a strong
stimulus (arrow) results in an exaggerated
response to all subsequent stimuli.
764 C HAP T E R 25 - MOLECULAR MECHANISMS OF LEARNING AND MEMORY
Stimulus Response
Before conditioning
Stimulus
Response
LQ]
\
\
.,
. .
.
. .
(a)
Conditioning
,
+
Dr
.-
., . .
. .
.
After conditioning
,
CR
[Q]
I.'
., -
.
.
.
.
(b)
FIGURE 25.2
Classical conditioning. (a) Before conditioning, the sound of a bell (the conditional stim-
ulus, CS) elicits no response, in sharp contrast to the response elicited by the sight of a
piece of meat (the unconditioned stimulus, US). (b) Conditioning entails pairing the sound
of the bell with the sight of the meat. The dog learns that the bell predicts the meat.
interval. However, if the CS precedes the US by too much, the conditioning
will be much weaker or absent. Conditioning typically does not occur if the
CS follows the US. The synaptic mechanism of classical conditioning wiH
have to account for these stringent timing requirements.
Instrumental Conditioning. This type of associative learning was dis-
covered and studied by Columbia University psychologist Edward Thorndike
early in the last century. In instrumental conditioning, an individual
learns to associate a response, a motor act, with a meaningful stimulus,
typically a reward such as food. As an example, consider what happens
when a hungry rat is placed in a box with a lever that dispenses food. In
the course of exploring the box, the rat bumps the lever, and out pops a
piece of food. After this happy accident occurs a few more times, the rat
learns that pressing the lever leads to a food reward. The rat wiH then work
the lever (and eat the food) until it is no longer hungry. This should sound
familiar. Recall from previous chapters experiments in which monkeys
were trained to make responses as subtle as saccadic eye movements in
order to receive a juice reward. Behavioral neurophysiology makes use of
instrumental learning. The reward need not be food or drink, either. Re-
member that rats will lever-press for a cocaine reward or for electrical stim-
ulation of the medial forebrain bundle. Instrumental conditioning will also
occur if a response, instead of evoking a rewarding stimulus, prevents the
occurrence of an aversive stimulus, such as a foot shock.
As in classical conditioning, a predictive relationship is learned during
instrumental conditioning. In classical conditioning, the subject learns that
one stimulus (CS) predicts another stimulus (US). In instrumental condi-
tioning, the subject learns that a particular behavior is associated with a
particular consequence. Also like classical conditioning, timing is important.
'Y SIMPLE SYSTEMS: INVERTEBRATE MODELS OF LEARNING 765
Successful instrumental conditioning requires the stimulus to occur shortly
after the response.
Because motivation plays such a large part in instrumental conditioning
(after aU, only a hungry rat will lever-press for a food reward), the under-
lying neural circuits are considerably more complex than those involved in
simple classical conditioning. Therefore, we'll leave instrumental condi-
tioning to focus on the simpler forms of learning and memory whose
mechanisms have been identified in the nervous system of an invertebrate
animal.
.... SIMPLE SYSTEMS:
INVERTEBRATE MODELS OF LEARNING
Over the course of neuroscience history, a large menagerie of invertebrate
creatures has been used for experimentation. You are already Familiar with
the squid and the contribution of its giant axon and giant synapse to our
understanding of cellular neurophysiology (see Chapters 4 and 5). Other
invertebrate species that have been used include cockroaches, £lies, bees,
leeches, and nematode worms. The reason is that invertebrate nervous
systems offer some important experimental advantages:
. Small nervous systems. Neurons in invertebrate nervous systems number
as few as a thousand, roughly 10 million times less than in the human
brain.
. Large neurons. Many invertebrate neurons are very large, making them
easy to study electrophysiologically.
. Identifiable neurons. Neurons in invertebrates can be classified according
to size, location, and electrophysiological properties and can therefore be
identified from individual to individual.
. Identifiable circuits. Identifiable neurons make the same connections with
one another from individual to individual.
. Simple genetics. The small genomes and rapid life cycles of some inverte-
brates (such as flies and nematodes) make them ideal for studies of the
genetic and molecular biological basis of learning.
Invertebrates can be particularly useful for analyzing the neural basis of
behavior. Granted, the behavioral repertoire of the average invertebrate is
rather limited. Nonetheless, many invertebrate species exhibit the simple
forms of learning we discussed above: habituation, sensitization, and classical
conditioning. One species in particular has been used to study the neuro-
biology of learning, the sea slug Aplysia californica (Figure 25.3).
Nonassociative Learning in Aplysio
If someone blows gently at your eye, you blink. Eventually, however, you
will habituate (assuming that the air puff is not painful). Similarly, if a jet
of water is squirted onto a fleshy region of Aplysia called the siphon, the
gill will retract (Figure 25.4). This is called the gill-withdrawal reflex. Like the
eye blink, the gill-withdrawal reflex displays habituation after repeated
presentation of the water jet. In a pioneering series of experiments begin-
ning in the 1960s, Eric Kandel and his colleagues at Columbia University
set out to determine where this procedural memory resides and how it is
formed. Kandel's accomplishments were recently recognized with the 2004
Nobel Prize in Medicine.
FIGURE 25.3
Aplys;a cal;forn;ca. One cool sea slug. used
for neurobiologICal studies of learning and
memory.
\
/
Siphon
Gill
(a)
#'
.--
,
Water jet
(b)
FIGURE 25.4
The gill-withdrawal reflex in Aplys;a.
(a) The mantle is held aside to show the gill
in its normal position. (b) The gill retracts
when water is sprayed on the siphon. This
reflex is an example of habituation.
766 C HAP T E R 25 . MOLECULAR MECHANISMS OF LEARNING AND MEMORY
5;pOOo'k;0
Gill muscle
FIGURE 25.6
A simple wiring diagram for the
gill-withdrawal reflex. The sensory neuron
that detects stimuli applied to the skin of the
siphon synapses directly on the motor neuron
that causes the gill to withdraw.
Head
gangli
Electrodes
-..I
/ /
/ tL/
"
l
Stimulate
r
Record
L7-
Siphon
nerve
FIGURE 25.5
The abdominal ganglion of Aplysio. The gill-withdrawal reflex involves neurons within
the abdominal ganglion that can be dissected and studied electrophyslologically.
Habituation of the Gill-Withdrawal Reflex. Sensory information from
the siphon travels along a nerve until it enters a region of the Aplysia
nervous system called the abdominal ganglion (Figure 25.5). Here the infor-
mation is distributed to motor neurons and to interneurons. One of the
motor neurons that receives direct monosynaptic sensory input from the
siphon is identified as L7. and this cell innervates the muscles that produce
gill withdrawal. Therefore, research has focused on understanding how this
simple monosynaptic reflex arc changes during habituation.
The first important question concerns where the habituation occurs.
Figure 25.6 shows a simplified wiring diagram of the gill-withdrawal reflex.
Repeated stimulation of the siphon skin leads to progressively less contrac-
tion of the gill-withdrawal muscles. The change underlying this habituation
could occur (I) at the sensory nerve endings in the skin. making them less
sensitive to the squirt of water; (2) at the muscle, making it less responsive
to synaptic stimulation by the motor neuron; or (3) at the synapse between
the sensory neuron and the motor neuron.
The first possibility was ruled out by making microelectrode recordings
from the sensory neuron as habituation occurred. The sensory neuron
continued to fire action potentials in response to skin stimulation, even as
the motor response decreased. Similarly. the third possibility was ruled out
by electrically stimulating the motor neuron (L7) and showing that it always
evoked the same amount of muscle contraction. This left the second possi-
bility: that habituation occurs at the synapse joining the sensory input to
the motor neuron. Indeed, simply giving repetitive electrical stimulation to
the sensory neuron was sufficient to cause a progressive decrease in the size
of the postsynaptic EPSP (Figure 25.7).
Identifying a synaptic modification as a possible basis for habituation
still leaves unanswered the question of where the synapse is modified.
Let's consider the possibilities. After habituation, there could be (I) less
neurotransmitter release by the presynaptic axon or (2) decreased post-
synaptic responsiveness to the transmitter (perhaps caused by fewer recep-
tors). Recall from Chapter 5 that transmitter molecules are released in dis-
crete packets called quanta, believed to correspond to the contents of
individual synaptic vesicles. Further analysis revealed that after habitua-
tion. there are fewer quanta released per action potential. The sensitivity of the
... SIMPLE SYSTEMS: INVERTEBRATE MODELS OF LEARNING 767
Record from presynaptic neuron
V m
11111
Stimulate
Record from postsynaptic neuron
10 15
Stimulus number
5
20
FIGURE 25.7
Habituation at the cellular level. Repeated electrical stimulation of a sensory neuron
leads to a progressively smaller EPSP in the postsynaptic motor neuron.
postsynaptic cell to neurotransmitter did not change. In other words, ha-
bituation of the gill-withdrawal reflex is associated with a presynaptic
modification.
Why is neurotransmitter release reduced after repeated stimulation of
the sensory nerve terminal? Recall the sequence of events that couples the
arrival of the action potential in the terminal with the release of neuro-
transmitter. A critical step is the entry of Ca2+ into the terminal, which is
mediated by voltage-gated calcium channels. In the nerve terminal of the
sensory neuron, it appears that these channels become progressively and
persistently less effective following habituation. However, despite the
apparent simplicity of this type of learning, how this change occurs is still
unknown.
Sensitization of the Gill-Withdrawal Reflex. To cause sensitization of
the gill-withdrawal reflex, Kandel and his colleagues applied a brief elec-
trical shock to the head of Aplysia. This resulted in exaggerated gill with-
drawal in response to stimulation of the siphon. Using the strategy outlined
above, they identified a site of plasticity showing changes that correlate
with the behavior. Once again, it turned out to be a modification of trans-
mitter release in the sensory nerve terminal.
How might stimulation of the head lead to sensitization of the gill-
withdrawal reflex? Understanding the answer to this question requires
adding a third neuron to the wiring diagram (Figure 25.8). This third cell,
L29, is activated by the head shock and makes a synapse on the axon ter-
minal of the sensory neuron. The neurotransmitter released by L29 is sero-
tonin (5-HT), which sets in motion a molecular cascade that sensitizes
the sensory axon terminal so that it lets in more Ca2+ per action potential.
The serotonin receptor on the sensory axon terminal is a G-protein-coupled
metabotropic receptor. Stimulation of this receptor leads to the production
of intracellular second messengers. In the case of the Aplysia sensory nerve
terminal, this second messenger is cyclic AMP (cAMP) produced from ATP
by the enzyme adenylyl cyclase (Figure 25.9). Recall from Chapters 5 and 6
that cAMP activates protein kinase A, and this enzyme phosphorylates (at-
taches phosphate groups to) various proteins. In the sensory nerve termi-
nal, one of these proteins is a potassium channel, and phosphorylation of
4
Sensitizing
stimulu d
r Head
Y Gili muscle
FIGURE 25.8
A wiring diagram for sensitization of
the gill-withdrawal reflex. A sensitizing
stimulus to the head of Aplysla indirectly
activates an interneuron, L29, which makes
an axoaxonic synapse on the terminal of the
sensory neuron.
768 C HAP T E R 25 . MOLECULAR MECHANISMS OF LEARNING AND MEMORY
L29 .
L29 axon
terminal
5-HT
receptor
/
'-
-
)
Adenylyl ),
cyclase "'>'
¥
f\
I .
G-proteln
Protein I
kinase A
(active)
Protein I
kinase A
. . I
(inactive) I
Sensory
neuron
axon terminal
I
FIGURE 25.9
A mechanism for sensitization of the gill-withdrawal reflex. Serotonin (S-HT)
released by L29 in response to the head shock leads to G-protein-coupled activation of
adenylyl cyclase in the sensory axon terminal. Activation of this enzyme leads to the produc-
tion of cyclic AMP. which in turn activates protein kinase A. Protein kinase A attaches phos-
phate groups to a potassium channel. causing it to close.
this channel causes it to close. The closure of potassium channels in the
axon terminal leads to a prolongation of the presynaptic action potential.
This results in more Ca H entry through voltage-gated calcium channels
during the action potentiaL and therefore more quanta of neurotransmit-
ter are released (Figure 25.10).
Recent research suggests that this "simple" story is incomplete, however.
In addition to presynaptic modifications, persistent sensitization is associ-
ated with increased postsynaptic responses to the neurotransmitter released
by the sensory nerve. This neurotransmitter is glutamate, and sensitization
is partly explained by the delivery of new glutamate receptors to the
synapse. We will return to glutamate receptor delivery and removal as a
substrate for memory when we discuss vertebrate models of learning
shortly.
Associative Learning in Aplys;o
In the 1980s, researchers discovered that Aplysia also could be classically
conditioned. Again, the response measured was the withdrawal of the gill.
The US was a strong shock to the taiL The CS was stimulation of the
siphon that was so gentle that it did not cause much of a response. If stim-
.... ..$-.1s.,
"I It." '" 1ft ntl
, I
K'" K'"
(a) (b)
V m -\' -.... ,
---Lr
Ca 2 +
.
.
.
.
.
Na+ .
'"i.It. -rr" ' .
.:-
. .... .
+ I r' u:r Protein . -;:;.-.
K+ '- kinase A .. :
(c) (d)
V m
T SIMPLE SYSTEMS: INVERTEBRATE MODELS OF LEARNING 769
FIGURE 25.10
The effect of decreased potassium conductance in the sensory axon terminal.
(a) The trace shows membrane voltage changes during an action potential. The rising
phase is caused by the opening of voltage-gated sodium channels, and the falling phase is
caused by the closing of the sodium channels and the opening of potassium channels. In the
axon terminal. voltage-gated calcium channels stay open as long as the membrane voltage
exceeds a threshold value. indicated by the red line. (b) The resulting entry of Ca2+ stimu-
lates the release of neurotransmitter. (c) A decrease in K+ conductance after sensitization
prolongs the action potential. (d) The voltage-gated calcium channels stay open longer.
thereby admitting more Ca2+ into the terminal. This causes more transmitter to be
released per action potential.
ulation of the tail (US) was paired with stimulation of the siphon (CS),
the subsequent response to siphon stimulation alone (CR) was much
greater than what could be accounted for by sensitization (Figure 25.11).
As in Pavlov's experiments, timing was critical. Conditioning occurred
only if the CS (siphon stimulus) preceded the US (tail stimulus) by sO.5
second.
Once again, a critical modification occurs at the synapse between the
sensory and motor neuron. To understand how this comes about, we need
to focus on what is happening at that synapse during the CS-US pairing.
At the cellular level, the CS is represented by the arrival of an action poten-
tial in the sensory axon terminal, and the US is represented by the release
of serotonin by L29 (activated by the tail shock). At the molecular level,
the CS is represented by the influx of Ca2+, and the US is represented by
770 C HAP T E R 25 . MOLECULAR MECHANISMS OF LEARNING AND MEMORY
FIGURE 25.11
Classical conditioning in Aplysio.
(a) A gentle water jet to the siphon is the CS.
A shock to the tail is the US. The response
measured is the withdrawal of the gill.
(b) The wiring diagram for classical condition-
ing. The US activates the same serotonergic
cell (L29) that is activated during sensitization.
(c) Timing of the CS and US during three
different types of training. (d) Plotted here IS
the magnitude of the gill withdrawal in re-
sponse to the CS. After pairing (classical con-
ditioning), the animal withdraws the gill in re-
sponse to the CS. which before training was
ineffective In eliCiting a response.
,
"
CS US
\ +
s,"'" J L29
neuro7!' \ Motor
euron
)
./
\
Shock US
(b)
Tactile CS
(a)
----1-- CS (siphon stimulation: 0.5 see)
---IL-_ US (tail shock: 1.5 see)
I Paired 3 1
US alone
(sensitization)
u
60.
50
:5 40
. 30
c
o
-5. 20-
'w
@ 10
OJ
I
5
.--... Paired
......... US alone
......... Unpaired
I Unpaired
2 3 4
Days after training
/1
Training
(c)
(d)
the G-protein-coupled activation of the enzyme adenylyl cyclase in the
terminal (Table 25.1).
Recall that adenylyl cyclase generates cAMP. In the early 1990s, researchers
discovered that in the presence of elevated [Ca 2 "], adenylyl cyclase churns out more
cAMP (Figure 25.12). More cAMP means more activation of protein kinase
A, more phosphorylation of potassium channels, and therefore the release
of more transmitter molecules. Thus, in the case of classical conditioning
of the gill-withdrawal reflex, adenylyl cyclase may serve as a detector of
cs-us coincidence. According to this hypothesis, learning occurs when a
presynaptic Ca2+ pulse coincides with (or just precedes) the G-protein-
coupled activation of adenylyl cyclase, which stimulates the production of
a lot of cAMP. Memory occurs when potassium channels are phosphorylated
and neurotransmitter release is enhanced.
Table 25.1 Cellular and Molecular Correlates
of Classical Conditioning in Aplysio
LEVEL OF ANALYSIS
STIMULUS BEHAVIORAL
CELLULAR
MOLECULAR
CS
Touch to siphon
Presynaptic influx
of Ca2+
G-protein activation of
adenylyl cyclase in
presynaptic terminal
Presynaptic action
potential
Release of serotonin
US
Shock to tail
US !Ione
L29
Sensory /'
neuron Motor
neuron
[jJ
It-
---
Adenylyl {
cyclase m
I .
G-proteln
(a)
.". SIMPLE SYSTEMS: INVERTEBRATE MODELS OF LEARNING 771
CS + US
! !
ft\29 r;
Sensory /
neuron "61 Motor
___ n euron
L29 axon
terminal
'\
°0
o 0
o
°0
o
o () 5-HT
5-HT G " ePtor I
l
Ca 2 +
/
G-protein
Sensory
neuron
axon terminal
(b)
FIGURE 25.12
The molecular basis for classical conditioning in Aplysio. (a) The US alone leads to
activation of the motor neuron (via an interneuron, not shown) and to sensitization of the
sensory input by the same mechanism illustrated in Figures 24.9 and 24.10. (b) Pairing the
CS and the US causes greater activation of adenylyl cyclase than either stimulus does by
itself because the CS admits Ca2+ into the presynaptic terminal The Ca L ' (by interacting
with a protein called calmodulin, not shown) increases the response of adenylyl cyclase to
G-proteins
Pavlov would have been surprised by these results. He had assumed that
this type of associative memory required the sophisticated neural hardware
of the cerebral cortex. Now we see that even a sea slug can be classically
conditioned and that many of the defining characteristics of the condition-
ing can be accounted for by the properties of a single type of enzyme.
We've seen that a great deal can be learned about the neurobiology of
behavior in invertebrates. It is important to realize, however, that none of
the Aplysia studies have uncovered the cellular basis of learning, only some
cellular correlates of learning. Although the studied synaptic changes can ac-
company behavioral learning, they may not be essential for learning to occur.
In other words, there may be (and, in some instances, definitely are) addi-
tional mechanisms that contribute to habituation, sensitization, and classical
conditioning. Thousands of neurons in the Aplysia nervous system are active
during even the simplest reflexes, and synaptic changes related to learning
are likely to be widely distributed among them. Nonetheless, the invertebrate -
studies have been invaluable for identifying candidate molecular mecha-
nisms for learning and memory. We will return to invertebrate studies
again when we discuss the molecular basis of memory consolidation.
772 C HAP T E R 2 5 . MOLECULAR MECHANISMS OF LEARNING AND MEMORY
... VERTEBRATE MODELS OF LEARNING
Let's summarize what we've learned from the invertebrate studies about
the possible neural basis of memory:
. Learning and memory can result from modifications of synaptic trans-
mission.
. Synaptic modifications can be triggered by the conversion of neural ac-
tivity into intracellular second messengers.
. Memories can result from alterations in existing synaptic proteins.
Keep these points in mind as we explore different types of activity-
dependent synaptic plasticity in the mammalian brain. To illustrate, we fo-
cus mainly on synapses in the cerebellum and hippocampus, where current
understanding is most complete. Keep in mind, however, that plasticity of
synaptic transmission is widespread in the central nervous system (CNS),
and relies on slightly different mechanisms at different types of synapse.
Synaptic Plasticity in the Cerebellar Cortex
In Chapter 14, we discussed the cerebellum in the context of motor con-
trol. We concluded that the cerebellum was an important site for motor
learning, a place where corrections are made when the outcome of move-
ments fails to meet expectations. Because these corrections are believed to
be made by modifications of synaptic connections, the cerebellum has
become a model system for the study of the synaptic basis of learning in
the mammalian brain.
Anatomy of the Cerebellar Cortex. Of particular interest is the cere-
bellar cortex, the sheet of tissue that lies just under the surface of the
cerebellum (Figure 25.13a). The cortex consists of two layers of neuronal
cell bodies, the Purkinje cell layer and the granule cell layer, and these are
separated from the pial surface by a molecular layer that is largely devoid of
somata. purkinje cells, named for the Czech neuroanatomist who first
described them in 1837, have a number of interesting features. First, their
dendrites extend only into the molecular layer, where they branch like a
fan, flattened in one plane. Second, Purkinje cell axons synapse on neurons
in the deep cerebellar nuclei, which are the major output cells of the cere-
bellum. Thus, Purkinje cells are in a powerful position to modify the output
of the cerebellum. Third, Purkinje cells use GABA as a neurotransmitter, so
their influence on cerebellar output is inhibitory.
Purkinje cell dendrites are directly contacted by one of the two major
inputs to the cerebellum. This input arises in a nucleus of the medulla
called the inferior olive, which integrates information from muscle pro-
prioceptors. Axons from the inferior olive are called climbing fibers be-
cause they twist around the purkinje cell dendrites like a vine on the
branches of a tree. Each Purkinje cell receives input from only one inferior
olive cell, but this input is very powerful. A single climbing fiber axon
makes hundreds of excitatory synapses on the dendritic tree of its target
Purkinje neuron. An action potential in a climbing fiber generates an ex-
ceptionally large EPSP that is always sufficient to strongly activate the post-
synaptic Purkinje cell.
The second major input to the cerebellum arises from a variety of brain
stem cell groups, notably the pontine nuclei that relay information from
the cerebral neocortex. These inputs, called mossy fibers, synapse on
cerebellar granule cells, which form a layer just below the Purkinje cells
(Figure 25.13b). Granule cells are very smaiL very tightly packed, and very
... VERTEBRATE MODELS OF LEARNING 773
Cerebrum
\
) -, ,
} Molecular layer
} Purkinje cell
layer
----- I
parallel
"., fibers
I .
I -'--A
"', z ..,
' 1 cell
1 ' 'H Cerebellar
(J granule
'f \ cell
Climbing
fiber
c..-- Mossy
fiber
'-
'I' " --- Cerebellum
/
Granule cell
layer
} White matter
I
I
-
(a)
FIGURE 25.13
The structure of the cerebellar cortex. (a) A view of the cortex showing the
organization of the granule cell. Purkinje cell, and molecular layers. (b) The major inputs to
the Purkinje cells are parallel fibers arising from cerebellar granule cells and climbing fibers
arising from the inferior olive. The major input to the granule cells is the mossy fibers, arising
from neurons In the pontine nuclei.
(b)
numerous. (Estimates are that granule cells may make up half the total
number of neurons in the brain!) Cerebellar granule cells give rise to axons
that ascend into the molecular layer, where they branch like a T. Each
branch, called a parallel fiber, runs straight for several millimeters in a
direction that intersects the plane of the Purkinje cell dendrites at a right
angle, like wires passing a telephone pole. Therefore, a single parallel fiber
has only a brief encounter with anyone purkinje cell, but along its length,
it encounters many. However, although a Purkinje cell receives only one
synapse from each passing parallel fiber, it does so from as many as 100,000
different fibers.
This unusual convergence of parallel and climbing fiber inputs onto
Purkinje cell dendrites has fascinated neuroscientists ever since it was de-
scribed originally by Cajal. In the early 1970s, James Albus at the Goddard
Space Flight Center in Greenbelt, Maryland, suggested a way that this
arrangement could serve motor learning. He proposed that (I) the climbing
fiber input carries error signals indicating a movement has failed to meet
expectations, and (2) corrections are made by adjusting the effectiveness of
774 C HAP T E R 25 . MOLECULAR MECHANISMS OF LEARNING AND MEMORY
FIGURE 25.14
Cerebellar long-term depression.
(a) The experimental arrangement for
demonstrating LTD. The magnitude of the
Purkinje cell response to stimulation of a
"beam" of parallel fibers is monitored.
Conditioning involves pairing parallel fiber
stimulation with climbing fiber stimulation.
(b) A graph of an experiment performed
in this way. After the pairing, LTD of the
response to parallel fiber stimulation results.
the paraJlel fiber inputs to the Purkinje cell. The idea that motor learning
is served by plasticity of the parallel fiber-Purkinje cell synapse actually was
proposed a few years earlier by David Man, then at Cambridge University
in England. What is now called the Marr-Albus theory of motor learning
specifically predicts plasticity of the parallel fiber synapse if it is active at the
same time as the climbing fiber input to the postsynaptic Purkinje cell.
Long-Term Depression in the Cerebellar Cortex:. Masao Ito and his
colleagues at the University of Tokyo tested the prediction of the Marr-
Albus theory directly. To monitor the effectiveness of parallel fiber synapses
on Purkinje cells, they applied brief electrical stimulation to the parallel
fibers and measured the size of the EPSP in the Purkinje cell. Then, to in-
duce synaptic plasticity, they paired stimulation of the climbing fibers with
stimulation of the parallel fibers. Remarkably, they found that after this
pairing procedure, activation of the parallel fibers alone resulted in a smaller
postsynaptic response in the Purkinje ceJl. This type of modification could
last at least an hour and therefore was termed long-term depression, or
LTD (Figure 25.14). (LTD was first introduced in Chapter 23.)
An important property of LTD is that it occurs only in parallel fiber
synapses that are active at the same time as the climbing fibers. Other par-
allel fiber synapses that were not stimulated in conjunction with the climb-
ing fibers did not exhibit the plasticity. This property, that only the active
inputs show the synaptic plasticity, is called input specificity.
Immediately, we can see similarities between cerebellar LTD and classical
conditioning in Aplysia. In Aplysia, there is an input-specific synaptic mod-
ification when presynaptic activity in the sensory axon (event 1) occurs at
the same time as stimulation of the sensory axon terminal with serotonin
(event 2). In the cerebeJiar cortex, there is an input-specific modification
when activation of the parallel fiber-Purkinje cell synapse (event 1) occurs
at the same time as depolarization of the postsynaptic purkinje cell by the
climbing fiber (event 2). However. note that the site of convergence of
events 1 and 2 is different in the two systems. In Aplysia, convergence occurs
in the presynaptic axon terminal, while in the cerebellar cortex, conver-
gence apparently occurs in the Purkinje cell dendrite. Another difference,
obviously, is the nature of the synaptic change. After classical conditioning,
the sensory-motor synapse becomes more effective, while after pairing
parallel and climbing fiber activity, the parallel fiber-Purkinje synapse
becomes less effective.
As with Aplysia, now we must ask what side of the parallelliber-Purkinje
synapse is modified. Recall that in Aplysia. the modifications included
Stimulate
parallel fibers
Record Purkinje cell
response to parallel
fiber stimulation
.(:? . .
.-??y.::.....
........:..
'. .:
:'..-:-
.":"
.....
...';".
-,":.'-:.
CD
(/)
c
o
Q.
(/)
0>
C
. .. . . . -g
0:::
'5
c
o
0................
a;
o
CD
.C'
:::J
CL
-15 -10 -5 0 5 10 15
Time from pairing of climbing fiber and
(b) parallel fiber stimulation (min)
(a)
Stimulate
climbing fiber
presynaptic alterations in transmitter release. But in the cerebellum, the
synaptic modification was discovered to be postsynaptic. Specifically, LTD
was found to result from a decrease in the postsynaptic response to gluta-
mate released by the parallel fibers. The glutamate receptor that mediates
excitatory transmission at this synapse is called the AMPA receptor. Recent
research suggests that AMPA receptors are internalized by the postsynaptic
cell following LTD induction, thus making the synapse less sensitive to
glutamate.
Mechanisms of Cerebellar LTD. To understand how paired stimulation
of the climbing and parallel fibers leads to LTD, we need to focus on the
Purkinje cell dendrite where these signals converge. First, we can ask what
is so important about activating the climbing fiber synapses on the Purkinje
cell. Recall that this is a very powerful input, causing a large postsynaptic
EPSP that always stimulates the Purkinje cell to fire an action potential.
However, in addition to activating voltage-gated sodium channels (causing
the action potential), this depolarization is powerful enough to activate
voltage-gated calcium channels that exist in the membrane of the Purkinje
cell dendrites. Thus, climbing fiber activation is associated with a surge of
Ca H into the Purkinje cell dendrite. To assess the importance of this Ca2+
signal in the induction of LTD, a substance that binds Ca H and prevents
rises in [Ca2+], called a Ca 2 + chelator, was injected into the Purkinje cell.
This treatment blocked LTD. This and related experiments have led to the
conclusion that the critical signal provided by climbing fiber activation is a
surge in [Ca 2 +] in the Purkinje cell dendrite.
What is special about activation of the parallel fibers? The transmitter
released after parallel fiber activation is glutamate, and, as we said above,
one of the postsynaptic receptors is the AMPA receptor. The AMPA receptor
is the channel that mediates the EPSP by allowing Na+ into the Purkinje
cell dendrite. However, there is a second type of glutamate receptor post-
synaptic to the parallel fibers. This is a metabotropic glutamate receptor that is
coupled via a G-protein to the enzyme phospholipase C. Activation of this
enzyme leads to the production of a second messenger (diacylglycerol),
which then activates protein kinase C (Figure 25.15).
1 Ca2+
Depolarization
-- Na+
Climbing
fiber
... VERTEBRATE MODELS OF LEARNING 775
FIGURE 25.15
A mechanism of LTD induction in the
cerebellum. CD Climbing fiber activation
strongly depolarizes the Purkinje cell dendrite,
which leads to the activation of voltage-gated
calcium channels. @ Parallel fiber activation
leads to Na+ entry through AMPA receptors
and @ the generation of diacylglycerol (DAG)
via stimulation of the metabotropic receptor.
DAG activates protein kinase C (PKC).
Na+
Parallel fiber
..
PKC
G-protein
Metabotropic
glutamate receptor
776 C HAP T E R 2 5 . MOLECULAR MECHANISMS OF LEARNING AND MEMORY
Classical conditioning in Aplysia
l TD in the cerebellum
Event 1 Event 2
Presynaptic Serotonin
action activation of
potential presynaptic
! receptors
t
Increase Activation
internal Ca 2 + of G-proteins
concentration I
\
Event 1
Glutamate
activation of
postsynaptic
glutamate
receptors
f
Increase internal
Na T concentration
and activation of
protein kinase C
\
Increase adenylyl
cyclase activity
+
Event 2
Strong
depolarization
of Purkinje
cell dendrite
+
Increase
internal Ca 2 +
concentration
/
Internalization of
AMPA receptors
+
Decrease openings of
presynaptic potassium
channels
Decrease openings of
postsynaptic AMPA
receptor channels
F!GURE 25.16
A comparison of the events leading to classical conditioning in Aplysia and to
LTD in the cerebellum.
The evidence to date indicates that LTD is caused when three intracellular
signals occur at the same time: a rise in [Ca2+Ji due to climbing fiber acti-
vation, a rise in [Na+Ji due to AMP A receptor activation, and activation of
protein kinase C due to metabotropic receptor activation. Precisely what
happens next is still under investigation, but it certainly involves the phos-
phorylation of proteins, including an AMP A receptor subunit called GluR2,
by protein kinase C. The end result is a decrease in the number of AMPA
receptor channels in the postsynaptic membrane. In this model, learning
occurs when rises in [Ca2+Ji and [Na+Ji coincide with the activation of
protein kinase C. Memory occurs when AMP A channels are internalized and
excitatory postsynaptic currents are depressed.
If we make a leap of faith and assume that LTD plays a role in motor
learning (not yet proven), then we see the following:
1. Learning and memory can result from modifications of synaptic trans-
mission.
2. Synaptic modifications can be triggered by the conversion of neural
activity into intracellular second messengers.
3. Memories can result from alterations in existing synaptic proteins.
Does this sound familiar? Figure 25.16 compares the mechanisms of classi-
cal conditioning in Aplysia and LTD in the cerebellum.
Synaptic Plasticity in the Hippocampus
Recall from Chapter 24 that declarative memory, the type of memory you'll
rely on to pass your next exam, involves the neocortex and structures in
the medial temporal lobe, including the hippocampus. In 1973, an impor-
tant discovery was made in the hippocampus by Timothy Bliss and Terje
L0mo, working together in Norway. They found that brief, high-frequency
electrical stimulation of an excitatory pathway to the hippocampus produced
a long-lasting enhancement in the strength of the stimulated synapses. This
effect is now known as long-term potentiation, or LTP (see Chapter 23).
More recently, a form of LTD has also been described in the hippocampus.
LTP and LTD are considered by many to be the key to how declarative
memories are formed in the brain. Let's explore LTP and LTD where they
are normally studied, in the hippocampus.
Anatomy of the Hippocampus. The hippocampus consists of two thin
sheets of neurons folded onto each other. One sheet is called the dentate
gyrus, and the other sheet is called Ammon's horn. Of the four divisions
of Ammon's. horn, we will focus on two: CA3 and CAI (CA stands for
cornu Ammonis, Latin for "Ammon's horn").
Recall from Chapter 24 that a major input to the hippocampus is the
entorhinal cortex. Entorhinal cortex sends information to the hippocampus
by way of a bundle ofaxons called the perforant path. Perforant path
axons synapse on neurons of the dentate gyrus. Dentate gyrus neurons give
rise to axons (called mossy fibers) that synapse on cells in CA3. The CA3
cells give rise to axons that branch. One branch leaves the hippocampus via
the fornix. The other branch, called the Schaffer collateral, forms synapses
on the neurons of CAI. These connections are summarized in Figure 25.17.
Because of its very simple architecture and organization, the hippocam-
pus is an ideal place to study synaptic transmission in the mammalian
brain. In the late 1960s, researchers discovered that the hippocampus ac-
tually could be removed [rom the brain (usually in experimental animals)
and cut up like a loaf of bread, and that the resulting slices could be kept
alive in vitro for many hours. In such a brain slice preparation, fiber tracts
Fornix
A
Dentate
gyrus
Entorhinal
cortex
CA1
Rhinal fissure
FIGURE 25.17
Some microcircuits of the hippocampus. <D Information flows from the entominal
cortex via the perforant path to the dentate gyrus. @The dentate gyrus granule cells emit
axons called mossy fibers that synapse on pyramidal neurons in area CA3. @ Axons from
the CA3 neurons, called Schaffer collaterals, synapse on pyramidal neurons in area CA I.
... VERTEBRATE MODELS OF LEARNING 777
778 C HAP T E R 25 . MOLECULAR MECHANISMS OF LEARNING AND MEMORY
can be stimulated electrically and synaptic responses recorded. Because
cells in the slice can be observed, stimulating and recording electrodes
can be positioned with the precision previously reserved for invertebrate
preparations. This preparation has greatly facilitated the study of LTP
and LTD.
Properties of LTP in CAI. Although LTP was first demonstrated at the
perIorant path synapses on the neurons of the dentate gyrus, today most
oE the experiments on the mechanism oE LTP are performed on the
Schaffer collateral synapses on the CAI pyramidal neurons in brain slice
preparations.
In a typical experiment, the effectiveness of the Schaner collateral synapse
is monitored by giving a bundle oE presynaptic axons a brief electrical stim-
ulus and then measuring the size oE the resulting EPSP in a postsynaptic
CA 1 neuron (Figure 25.18). This method is similar to the way parallel fiber
responses are monitored in the cerebellar cortex. Usually, such a test stim-
ulation is given every minute or so for 15-30 minutes to ensure that the
baseline response is stable. Then, to induce LTp, the same axons are given
a tetanus, a brief burst of high-frequency stimulation (typically 50-100
stimuli at a rate of 100/sec). Usually, this tetanus induces LTP, and subse-
quent test stimulation evokes an EPSP that is much greater than it was
during the initial baseline period. In other words, the tetanus has caused a
modification of the stimulated synapses so they are more effective. Other
synaptic inputs onto the same neuron that did not receive tetanic stimu-
lation do not show LTP. Therefore, like cerebellar LTD, hippocampal LTP is
input specific.
e--..
e-.-e-e
EPSP
magnitude in
response to
test stimulation
of input 1
.-e-_e-e
,
Baseline responses
Input 1 Input 2
'/ I \
I". \
-I- )';
J .. \
/ I"
I ...
I
o 5
(b)
I I I I
10 15 20 t 25
Time (min)
30
I
35
I I
40 45
EPSP
magnitude in
response to
test stimulation
of input 2
-_e__ .
Baseline responses
e
e
e-e
(a)
o 5
(c)
10 15 20 25 30 35 40 45
Time (min)
FIGURE 25.18
Long-term potentiation in CA I. (a) The response of a CA I neuron is monitored as
two Inputs are alter'lately stimulated. LTP IS induced in input I by giving this input a tetanus.
(b) The graph shows a record of the experiment. The tetanus to input I (arrow) yields a
potentiated response to stimulation of this input. (c) LTP is input specific, so there is no
change in the response to input 2 after a tetanus to Input I.
One remarkable feature of this plasticity is that it can be induced by a
brief tetanus, lasting less than a second, consisting of stimulation at fre-
quencies well within the range of normal axon firing. A second remarkable
feature of LTP is its longevity. LTP induced in CAI of awake animals can
last many weeks, possibly even a lifetime. No wonder this form of synap-
tic plasticity has attracted interest as a candidate mechanism for declarative
memory.
Subsequent research has shown that high-frequency stimulation is not
an absolute requirement for LTP. Rather, what is required is that synapses be
active at the same time that the postsynaptic CAi neuron is strongly depolarized. To
achieve the necessary depolarization with a tetanus, (1) synapses must be
stimulated at frequencies high enough to cause temporal summation of the
EPSPs, and (2) enough synapses must be active simultaneously to cause sig-
nificant spatial summation of EPSPs. This second requirement is called co-
operativity, because coactive synapses must cooperate to produce
enough depolarization to cause LTP. Thus, like cerebellar LTD, LTP results
when synaptic stimulation (event l) coincides with strong postsynaptic de-
polarization (event 2). However, unlike the cerebellum, where a single
powerful synapse can provide the critical depolarization, in the hippocam-
pus, adequate depolarization requires that many excitatory synapses be ac-
tive at the same time.
Consider for a moment how the cooperativity property of hippocampal
LTP could be used to form associations. Imagine a hippocampal neuron
receiving synaptic inputs from three sources: A, B, and C. Initially, no sin-
gle input is strong enough to evoke an action potential in the postsynaptic
neuron. Now imagine that inputs A and B repeatedly fire at the same time.
Because of spatial summation, inputs A and B are now capable of firing the
postsynaptic neuron and of causing LTP. Only the active synapses will be
potentiated, and these, of course, are those belonging to inputs A and B.
Now, because of potentiation of their synapses, either input A or input B
(but not input C) can fire the postsynaptic neuron. Thus, LTP has caused
an association of inputs A and B. In this way, the sight of a rose could be
associated with the smell of a rose (they often occur at the same time) but
never with the smell of an onion (Figure 25.19).
Speaking of associations, remember the idea of a Hebb synapse intro-
duced in Chapter 23 to account for aspects of visual development? LTP in
CAI is Hebbian: Inputs that fire together wire together.
Mechanisms of LTP in CAl. Excitatory synaptic transmission in the
hippocampus is mediated by glutamate receptors. As with the parallel
fiber-Purkinje cell synapse in the cerebellum, Na+ ions passing through
the AMPA subclass of glutamate receptor cause the EPSP at the Schaffer
collateral-CAI pyramidal cell synapse. However, unlike the cerebellum,
CAI neurons also have postsynaptic NMDA receptors. Recall that these
glutamate receptors have the unusual property that they conduct Ca2+
ions, but only when glutamate binds and the postsynaptic membrane is
depolarized enough to displace Mg2+ ions that clog the channel (see Fig-
ure 23.26). Thus, Ca2+ entry through the NMDA receptor specifically sig-
nals when presynaptic and postsynaptic elements are active at the same
time (Box 25.1).
Considerable evidence now links this rise in postsynaptic [Ca2+]; to the
induction of LTP. For example, LTP induction is prevented if NMDA recep-
tors are pharmacologically inhibited or if rises in postsynaptic [Ca2+]; are
prevented by the injection of a Ca 2 -1 chelator into the postsynaptic neuron.
The rise in [Ca2+]; activates two protein kinases: protein kinase C and calcium-
calmodulin-dependent protein kinase II, also known as CaMKII (pronounced
'Y VERTEBRATE MODELS OF LEARNING 779
780 C HAP T E R 2 5 . MOLECULAR MECHANISMS OF LEARNING AND MEMORY
<j' A"" "
& <, a
c
e
:::J
OJ
C
Response to A
(sight of rose)
e-e-e-e-e
'"
'0
OJ
(J)
c
f
+
Repeated pairing
ofAandB
Time
B
Sight or smell
= "Rose"
c
e
:::J
OJ
C
Response to B
(smell of rose)
e-e-e-e-e
'0
OJ
(J)
c
8., -_e-e_
(J)
£ 1
+
Repeated pairing
of A and B
Time
Response to C
(smell of onion)
FIGURE 25.19
A rose is a rose, but it is not an onion.
Because the sight and smell of the rose occur
at the same time. the inputs carrying this
information to a neuron may undergo L TP.
thus forming an association between the two
stimuli.
c
e
:::J
OJ
c
'0
OJ
(J)
:5 -e-e-e-e
Q
(J)
OJ
a:
e-_e-e-e
Time
Repeated pairing
of A and B
"cam-K-two"). Pharmacological inhibition of either kinase blocks the induc-
tion of UP.
Following the rise in postsynaptic (Ca 2 +]; and the activation of the kinases,
however, the molecular trail that leads to a potentiated synapse gets harder
to follow. Current research suggests that this trail may actually branch
(Figure 25.20). One path appears to lead toward an increased effectiveness
of existing postsynaptic AMPA receptors by way of phosphorylation. phos-
phorylation of the AMP A receptor, by either protein kinase C or CaMKII,
leads to a change in the protein that increases the ionic conductance of
the channel. The other path leads to the insertion of entirely new AMP A
receptors into the postsynaptic membrane. According to a current model,
vesicular organelles studded with AMPA receptors lie in wait near the
postsynaptic membrane. In response to CaMKII activation, the vesicle
membrane fuses with the postsynaptic membrane, and the new AMP A
receptors are thereby delivered to the synapse.
Evidence also indicates that synaptic structure changes following LTP.
In particular. postsynaptic dendritic spines appear to bud and form new
synaptic contacts with axons. Thus, following LTp, a single axon can make
multiple synapses on the same postsynaptic neuron, which is not the normal
pattern in CAl. This sprouting of synapses not only increases the respon-
sive postsynaptic surface but also increases the probability that an action
potential in the axon will trigger presynaptic glutamate release.
EPSP
magnitude in
response to __e-e-e e-e-e_-e
test stimulation Baseline responses
of input 2
Long-Term Depression in CAl. We have seen that information can be
stored either as a decrease in synaptic effectiveness (cerebellar LTD) or as
an increase in synaptic effectiveness (hippocampal LTP). However, there is
no reason both types of synaptic plasticity cannot reside in one location and
contribute to information storage. In fact, we have already learned that
hippocampal responses can be modified in both directions. Remember the
place cells in Chapter 24? When the spatial environment changed, two
changes occurred in the place cells: They became more responsive to a new
location and less responsive to an old location. Similar changes in response
selectivity are observed in many regions of the cerebral cortex when infor-
mation is learned (see, for example, Figure 24.6). Neural network models
suggest that the experience-dependent changes in selectivity of individual
neurons reflect synaptic modifications that, distributed over many neurons,
store information (see Box 24.3). From this perspective, memories are
encoded as specific patterns of synaptic change, with some synapses grow-
ing srronger and others growing weaker.
Recall Hebb's theory that a synapse grows stronger, or potentiates, when
the activity of that synapse correlates with the strong activation of the
postsynaptic neuron by other converging inputs. An extension of Hebb's
theory, designed to account for bidirectional (up and down) regulation of
synaptic strength, is called the BCM theory, named for its authors, Elie
Bienenstock, Leon Cooper, and Paul Munro, working at Brown University.
According to the BCM rheory, synapses that are active when the post-
synaptic cell is only weakly depolarized by other inputs will undergo LTD
instead of LTP. This idea inspired a search for LTD in CAl, using stimuli that
were designed to evoke a modest postsynaptic response. Soon researchers
discovered that prolonged tetanic stimulation of the Schaffer collaterals at
low frequencies (1-5 Hz) produces input-specific LTD (Figure 25.21).
EPSP
magnitude in
response to
test stimulation
of input 1
-e_-e-e
Baseline responses
o
(b)
10
Input 1
,___ J
(a)
... VERTEBRATE MODELS OF LEARNING 781
/ Presynaptic
(( _c.:
Glutamate/}
.
..
AMPA . ........ NMDA
'oc- L · =4ifreoro,
( t Ca'> ' \I ,
\ CD \ ! (0'\)\) )
B f
FIGURE 25.20
Routes for the expression of LTP in
CAI. Ca H entering through the NMDA re-
ceptor activates protein kinases. This can cause
LTP by (j) changing the effectiveness of exist-
ing postsynaptic AMPA receptors or CV stimu-
lating the insertion of new AMPA receptors.
- - - - - - - - - - - - - - f - - - --
___e-e-e
/e
I
+20
Time (min)
I
40
30
o
(c)
10
40
FIGURE 25.21
Hippocampal long-term depression. (a) The response of a CAI neuron is monitored
as two inputs are alternately stimulated. LTD is induced in Input I by giving this input a
I Hz tetanus. (b) The graph shows a record of the experiment. The low-frequency tetanus
to Input I (arrow) yields a depressed response to stimulation of this input. (c) LTD is input
specific, so there is no change in the response to input 2 after a tetanus to input I
20
Time (mln)
30
782 C HAP T E R 2 S . MOLECULAR MECHANISMS OF LEARNING AND MEMORY
Box 25.1
t iP ., I)
, .
'--
BRAIN FOOD
Synaptic Plasticity: Timing Is Everything
When enough synapses are active at the same time, the
postsynaptic neuron will be depolarized sufficiently to fire
an action potential. Donald Hebb proposed that each in-
dividual synapse grows a litt e stronger when it success-
fully participates in the firing of the postsynaptic neuron.
The phenomenon of LTP comes close to satisfying Hebb's
ideal. The synapse gets stronger when the glutamate re-
leased by the presynaptic terminal binds to postsynaptic
NMDA receptors and the postsynaptic membrane is de-
polarized strongly enough to displace Mg2+ from the
NMDA receptor channel.
Is there a role for postsynaptic action potentials in
this "strong" depolarization? The first evidence that ap-
propriate timing of a postsynaptic action potential might
be important for LTP was obtained in the early I 980s by
William Levy and Oswald Steward at the University of
Virginia. They found that LTP occurred if a postsynaptic
action potential occurred simultaneously with, or slightly
after, presynaptic release of glutamate. However, action
potentials are generated in the soma in response to
depolarization of the membrane beyond threshold. Be-
cause this happens far away from the synapses located out
on the dendritic tree, it was assumed for a time that
the actual occurrence of the spike was not important for
the mechanism of synaptic potentiation. The important
thing was the strong depolarization in the dendrite, due
to summed synaptic currents, which, coincidentally, was
also usually sufficient to evoke a postsynaptic action
potential.
+
Long-term
change in 0
synaptic
strength
Amount of NMDA
receptor activation
during tetanic stimulation
FIGURE 25.22
NMDA receptor activation and bidirec-
tional synaptic plasticity. The long-term
change in synaptic transmission is graphed as
a fUllction of the level of NMDA receptor
activation during conditioning stimulation.
While it remains true that the key is strong postsynap-
tic depolarization, researchers have recently taken another
look at the role of the postsynaptic spike in LTP. This new
attention resulted from the discovery that action poten-
tials generated in the soma can actually "back-propagate"
into the dendrites of some ceHs. Thus, Henry Markram.
Bert Sakmann. and their colleagues at the Max Planck Insti-
tute investigated what happens when a postsynaptic spike
is generated (via a microelectrode) at various time inter-
vals before or after an EPSP. Remarkably, they found that
if an EPSP is followed. within about 50 msec, by a post-
synaptic action potential, the synapse potentiates. Noth-
ing happens in response to the spike or the EPSP atone--
LTP results specificaUy from the precise timing of EPSP
and spike. just as Hebb suggested! In addition, the timing
requirements for LTP in these studies agreed very well
with those originally reported by Levy and Steward.
What accounts for the LTP-promoting effect of a back-
propagating action potential? The answer. of course, is
strong depolarization. NMDA receptors have a very high
affinity for glutamate. so the transmitter remains bound
to the receptor for many tens of milliseconds. However.
this bound glutamate does nothing if the postsynaptic
membrane is not depolarized strongly, because the chan-
nel is clogged with Mg2+. The timely occurrence of the
action potential is sufficient to awaken these dormant
channels by ejecting the Mg 2 +. Then. as long as glutamate
is still bound to the receptor, Ca2+ will enter the cell and
trigger the mechanism of LTP.
Surprisingly, LTD, like LTp, is triggered by postsynaptic Ca2+ entry through
the NMDA receptor. But how can the same signal, Ca2+ entry through the
NMDA receptor, trigger both LTP and LTD? The key difference lies in the
level of NMDA receptor activation (Figure 25.22). When the postsynaptic
neuron is only weakly depolarized, the partial blocking of the NMDA re-
ceptor channels by Mg2+ prevents all but a trickle of Ca2+ into the postsy-
naptic neuron. On the other hand, when the postsynaptic neuron is strongly
depolarized, the Mg2+ block is displaced entirely, and Ca 2 + floods into
the postsynaptic neuron. These different types of Ca2+ response selectively
activate different types of enzymes. Instead of the kinases that are activated
by high [Ca2+]j, modest and prolonged elevations in [Ca 2 +]i activate pro-
tein phosphatases, enzymes that pluck phosphate groups off proteins. There-
fore, if LTP is putting phosphate groups on, LTD apparently is taking them
off. lndeed, biochemical evidence now indicates that AMPA receptors are
dephosphorylated in response to stimulation that induces LTD (Figure
25.23). Moreover, the induction of hippocampal LTD can also be associated
with the internalization of AMPA receptors at the synapse (similar to
'Y VERTEBRATE MODELS OF LEARNING 783
Presynaptic
Postsynaptic
Ca'>'n.;;'" )
via NMDA J
receptors (
\ -c '?J.
..,- -.. Ca2
'NMDA (/:'O'
receptor
Unphosphorylated
synaptic protein
yields L TD
[Ca 2 +] > 5 lM
-.
I Calcium
flux
200 msec
.:. ..
... ."-r
.
[Ca 2 +] " 1 lM
FIGURE 25.23
A model for how Ca2+ can trigger both LTP and LTD in the hippocampus.
High-frequency stimulation (HFS) yields LTP by causing a large elevation of [Ca H ].
Low-frequency stimulation (LFS) yields LTD by causing a smaller elevation of [Ca2+].
(Source: Adapted from Bear and Malenka. 1994. Fig. I.)
cerebellar LTD). Thus, LTP and LTD appear to reflect the bidirectional reg-
ulation of both the phosphorylation and the number of postsynaptic
AMPA receptors.
LTP, LTD, and Glutamate Receptor Trafficking. Besides revealing
much about the likely synaptic basis for learning and memory, studies of
LTP and LTD have led to a much deeper understanding of how synaptic
transmission is maintained in the brain. Current research suggests that
AMPA receptors in the postsynaptic membrane are continually being added
and removed even in the absence of synaptic activity. Researchers estimate
that half the synaptic AMP A receptors are replaced every 15 minutes! How-
ever, despite this remarkable turnover, synaptic transmission will remain
stable as long as one receptor is added whenever one receptor is removed.
LTP and LTD disrupt this equilibrium, leading to a net increase or decrease
in the capacity of the synaptic membrane for AMPA receptors.
The capacity of the postsynaptic membrane is determined by the size of
a scaffold of what has been termed slot proteins. Imagine that the scaffold is
like an egg carton and that the slot proteins form each of the egg cups.
AMPA receptors are the eggs that fill the carton. As long as the size of the
carton doesn't change, synaptic transmission is stable even if we continu-
ally replace the individual eggs (Figure 25.24).
Stable LTP requires that we increase the size of the carton and provide
new eggs. Research by Roger Nicoll and David Bredt at the University of
California, San Francisco, and others, suggests that a protein called PSD-95
(a postsynaptic density protein with a molecular weight of 95 kilodaltons)
may comprise the egg carton. Increasing the expression of PSD-95 in
neurons increases .the synaptic capacity for AMPA receptors. Research by
Roberto Malinow at Cold Spring Harbor Laboratory has identified the new
eggs-AMPA receptors that contain a distinctive subunit called GluRl. LTP
appears to cause a selective increase in the number of GluRI -containing
AMPA receptors in the membrane. Over time, these receptors are replaced
by those that lack GluRI. By analogy, imagine that the neuron has inside
it a stash of blue Easter eggs that can be delivered to the carton in response
to LTP-inducing stimulation. Over time, the blue eggs are replaced by un-
colored eggs. But because the size of the carton is increased, there contin-
ues to be a net increase in the number of eggs.
.. Protein kinase
.
.f
.. Protein
phosphatase
Phosphorylated
synaptic protein
yields L TP
784 C HAP T E R 25 . MOLECULAR MECHANISMS OF LEARNING AND MEMORY
= AMPA receptor
"-f-..-- '..../' - lacking GluRl
, = AMPA receptor
containing GluRl
(a) Initial steady state = PSD-95
, (' '\
h
,-
--...
t t
\ <
./' \ ,
(b) L TP (d) L TO
.
.
" ;L./' \. ./"
(c) New steady state
(e) New steady state
F!GURE 25.24
An egg carton model of AMPA receptor trafficking at the synapse. Each egg
represents an AMPA receptor, and the carton is PSD-95, which determines the capacity of
the synapse for receptors. (a) The initial steady state. Each AMPA receptor that is removed
is replaced with a new receptor. (b) LTP More PSD-95 is added. increasing the synaptic
capacity for AMPA receptors. The new receptors (blue) contain the GluRI subunit. (c) The
new steady state_ Over time, ongoing turnover of receptors replaces those with GluR I
(d) LTD Some PSD-95 is destroyed, decreasing the synaptic capacity for AMPA receptors.
(e) The new steady state following LTD
Conversely, stable LTD requires that we reduce the size of the egg carton,
which reduces the capacity for eggs. Indeed, recent research has shown that
LTD-inducing stimulation leads to both the destruction of PSD-95 and a net
loss of AMPA receptors from the postsynaptic membrane.
LTP, LTD, and Memory. LTP and LTD have attracted a lot of interest
because theoretical work shows that these mechanisms of synaptic plas-
ticity can contribute to the formation of declarative memories. Recent
research indicates that the types of NMDA-receptor-dependent synaptic
plasticity that have been characterized in the hippocampus also occur in the
neocortex (Figure 25.25). It appears that plasticity at many synapses in the
cerebral cortex may be governed by the same "rules" and might use the
same mechanisms. (But remember, there are many exceptions to these
"rules," and they do not apply to all synapses, even within a single structure.)
LTP and LTD are clearly appealing models, but what evidence links them
to memory? So far, all we've described is a possible neural basis for a
memory of having one's brain electrically stimulated! A useful approach
has been to see whether the molecules involved in LTP and LTD are also
involved in learning and memory. For example, both forms of synaptic
plasticity require the activation of NMDA receptors. To assess the possible
role of hippocampal NMDA receptors in learning, researchers injected an
NMDA-receptor blocker into the hippocampus of rats that were being
- Record
, ",,,,
/
.---- -====-4
..
Stimulate
L ) layer IV
25
)
15 ").
Inferotemporal
(I)
!: cortex (area IT)
ID 5
(/)
ro
.c 0
E
g -5
(I)
0)
!:
ro
s::
0
-15
-25
Frequency of conditioning stimulation
FIGURE 25.25
Bidirectional synaptic modifications in human area IT. Slices of human temporal
cortex, removed during surgery to gain access to deeper structures, were maintained In vitro.
Synaptic responses were monitored following various types of tetanic stimulation. As In rat
CA I, stimulation of I Hz produced LTD, while 100 Hz stimulation
produced LTP. (Source: Adapted from Chen et aI., 1996.)
trained in a water maze (see Figure 24.16). Unlike nonnal animals, these rats
failed to learn the rules of the game or the location of the escape platform.
This finding provided the first evidence that NMDA receptor dependent
processes play a role in memory.
A revolutionary new approach to the molecular basis of learning and
memory was introduced by Susumu Tonegawa at the Massachusetts Insti-
tute of Technology. Tonegawa, who switched to neuroscience after winning
the 1987 Nobel Prize for his research in immunology, recognized that
molecules and behavior could be connected by manipulating the genes of
experimental animals. This approach had already been tried, with success,
in simple organisms like fruit flies (Box 25.2) but not in mammals. In their
first experiment, Tonegawa, Alcino Silva, and their colleagues "knocked
out" (deleted) the gene for one subunit ((I') of CaMKII and found parallel
deficits in hippocampal LTP and memory. Since then, many genes have
been manipulated in mice with the aim of assessing the role of LTP and LTD
mechanisms in learning. Although the jury is still out, it does appear that
LTP, LTD, and learning have many common requirements.
Despite the power of the genetic approach, it has some serious limita-
tions. Loss of a function, like LTP or learning, might be a secondary conse-
quence of developmental abnormalities caused by growing up without a
particular protein. Moreover, because the protein is missing in all cells that
T VERTEBRATE MODELS OF LEARNING 785
786 C HAP T E R 25 . MOLECULAR MECHANISMS OF LEARNING AND MEMORY
Box 25.2
...f.#-
OF SPECIAL INTEREST
....
...
Memory Mutants
Of the several hundred thousand proteins manufactured
by a neuron, some may be more important than others
when it comes to learning. It is even possible that some
proteins are uniquely involved in learning and memory.
Needless to say, we could gain considerable insight into
the molecular basis of learning and learning disorders if
such hypothetical "memory molecules" could be identified.
Recall that each protein molecule is the readout of a
segment of DNA called a gene. One way to identify a
"memory protein" is to delete genes one at a time and
see if specific learning deficits result. This is precisely the
strategy that Seymour Benzer, Yadin Dudai, and their
colleagues at the California Institute of Technology tried
using the fruit fly Drosophila melanogaster. Drosophila has
long been a favorite species of geneticists, but one might
reasonably question to what extent a fruit fly learns.
Fortunately, Drosophila can perform the same tricks that
Aplysia has mastered: habituation, sensitization, and classi-
cal conditioning. For example, fruit flies can learn that a
particular odor predicts a shock. They demonstrate this
memory after training by flying away when the odor is
presented. The strategy is to produce mutant flies by
exposing them to chemicals or X-rays. They are then bred
and screened for behavioral deficits. The first mutant dis-
playing a fairly specific learning deficit was described in
1976 and called Dunce. Other memory-deficient mutants
were later described and given vegetable names such as
Rutabaga and Cabbage. The next challenge was to identify
exactly which proteins had been deleted. It turned out
that all three of these memory mutants lacked particular
enzymes in cAMP-associated signaling pathways. Perhaps
this isn't too surprising, considering the key role this sec-
ond messenger system plays in procedural memory in
Aplysia.
In these early Drosophila studies, the mutations were
made at random, followed by extensive screening, first to
find a learning deficit and then to determine exactly which
gene was missing. More recently, however, genetic engi-
neering techniques have made it possible to make very
specific deletions of known genes, not only in Drosophila,
but also in mammals. Thus, for example, in 1992, Susumu
Tonegawa, Alcino Silva and their colleagues at MIT were
able to isolate and delete one subunit (0:) of the calcium-
calmodulin-dependent protein kinase II in mice. Experi-
ments had already suggested that this enzyme is critical
for the induction of long-term potentiation. Sure enough,
these mice have a clear deficit in LTP in the hippocampus
and the neocortex. And, when tested in the Morris wa-
ter maze, they were found to have a severe memory
deficit. Thus, these mice are memory mutants, just like
their distant cousins Dunce, Rutabaga, and Cabbage.
Are we to conclude that the missing proteins in these
mutants are the elusive "memory molecules"? No. All of
these mutants show other behavioral deficits besides
memory. We can only conclude at present that animals
growing up without these proteins are unusually poor
learners. However, these studies do underscore the
critical importance of specific second messenger path-
ways in translating a fleeting experience into a lasting
memory.
normally express it, pinpointing where and how a molecule contributes to
learning can be difficult. For these reasons, researchers have attempted to
devise ways to restrict their genetic manipulations to specific times and
specific locations. In one interesting example of this approach, Tonegawa,
Joe Tsien, and their colleagues found a way to restrict the genetic deletion
of NMDA receptors to the CAI region, starting at about 3 weeks of age.
These animals show a striking deficit in LTP, LTD, and water maze per-
formance, thus revealing an essential role [or CAI NMDA receptors in this
type of learning.
If too little hippocampal NMDA receptor activation is bad for learning
and memory, what would happen if we boosted the number of NMDA
receptors? Amazingly, animals engineered to produce too many NMDA re-
ceptors show enhanced learning ability in some tasks. Taken together, the
pharmacological and genetic studies show that hippocampal NMDA recep-
tors playa key role, not only in synaptic modification, such as LTP and LTD,
but also in learning and memory.
... THE MOLECULAR BASIS OF LONG-TERM MEMORY 787
... THE MOLECULAR BASIS OF LONG-TERM MEMORY
We have now seen in several different model systems that memory can
result from experience-dependent alterations in synaptic transmission. In
almost every case, synaptic transmission is modified as a result of changing
the number of phosphate groups that are attached to proteins in the
synaptic membrane. In the case of sensitization and classical conditioning
in Aplysia, this occurs at certain potassium channels in the presynaptic
membrane. In the case of LTD and LTP in the mammalian CNS, this occurs
at the postsynaptic AMPA receptor and at proteins regulating AMPA re-
ceptor number at the synapse.
Adding phosphate groups to a protein can change synaptic effectiveness
and form a memory, but only as long as the phosphate groups remain
attached to that protein. Phosphorylation as a long-term memory mecha-
nism is problematic for two reasons:
1. Phosphorylation of a protein is not permanent. Over time. the phosphate
groups are removed, thereby erasing the memory.
2. Protein molecules themselves are not permanent. Most proteins in the
brain have a lifespan of less than 2 weeks and are undergoing a contin-
ual process of replacement. Memories tied to changes in individual pro-
tein molecules would not be expected to survive this rate of molecular
turnover.
Thus. we need to conside"r the mechanisms that might convert what ini-
tially is a change in synaptic protein phosphorylation to a form that can last
a lifetime.
Persistently Active Protein Kinases
Phosphorylation of synaptic proteins, and memory, could be maintained if
the kinases-the enzymes that attach phosphate groups to proteins-were
made to stay "on" all the time. Normally, the kinases are tightly regulated
and are "on" only in the presence of a second messenger. But what if
learning changed these kinases so they no longer required the second mes-
senger? The relevant synaptic proteins would remain phosphorylated all
the time.
Recent evidence suggests that some kinases can become independent of
their second messengers. Let's consider as an example the changes that
occur in one protein kinase during LTP in the hippocampus.
CaMKII and LTP. Recall that Ca2+ entry into the postsynaptic cell and
activation of CaMKII are required for the induction of LTP in CAI. Research
has shown that CaMKII stays "on" long after [Ca2+]; has fallen back to a
low level.
CaMKII consists of 10 subunits arranged in a rosette pattern. Each sub-
unit catalyzes the phosphorylation of substrate proteins in response to a rise
in Ca2+ -calmodulin. How might CaMKII be switched permanently on? The
answer requires some knowledge of how this enzyme is normally regulated
(Figure 25.26). Each subunit is built like a pocket knife, with two parts con-
nected by a hinge. One pan, the catalytic region, performs the phosphory-
lation reaction. The other part is called the regulatory region. Normally, in
the absence of the appropriate second messenger, the knife is closed and
the catalytic region is covered by the regulatory region. This keeps the en-
zyme "off." The normal action of the second messenger (Ca2+ -calmod-
ulin) is to pry the knife open, but only as long as the messenger is present.
When the messenger is removed, the molecule usually snaps shut, and the
Regulatory "")
Catalytic
(a)
Second
messenger
(Ca 2 +- calmodulin)
Phosphorylation
of proteins
(b)
Phosphorylation
of proteins
(c)
FIGURE 25.26
The regulation of CaMKIl. (a) The hinge-
like subunit of CaMKIl is normally "off" when
the catalytic region is covered by the regula-
tory region. (b) The hinge opens on
activation of the molecule by Ca H -bound
calmodulin, freeing the catalytic region to
add phosphate groups (P) to other proteins.
(c) A large elevation of Ca 2 + can cause
phosphorylation of one subunit by another
(autophosphorylation). which enables the
catalytic region to stay "on" permanently.
788 C HAP T E R 2 5 . MOLECULAR MECHANISMS OF LEARNING AND MEMORY
kinase turns "off" again. After LTP, however, it appears that the knife fails
to close completely in the? subunits of CaMKII. The exposed catalytic re-
gion continues to phosphorylate CaMKII substrates.
How is the hinge of the protein kinase molecule kept open? The an-
swer lies in the fact that CaMKII is an autophosphorylating protein kinase-
each subunit within the CaMKII molecule can be phosphorylated by a
neighboring subunit. The consequence of subunit phosphorylation is that
the hinge stays open. If the initial activation of CaMKII by Ca2+ -calmod-
ulin is sufficiently strong, autophosphorylation will occur at a faster rate
than dephosphorylation, and the molecule will be switched "on." Persis-
tent activity of CaMKII could contribute to the maintenance of synaptic
potentiation, for example, by keeping the postsynaptic AMPA receptors
phosphorylated. The general idea that an autophosphorylating kinase
could store information at the synapse, initially proposed by John Lisman
at Brandies University, is called the molecular switch hypothesis
(Box 25.3).
Protein Synthesis
Persistent kinases are likely to contribute to the maintenance of a synaptic
modification, but apparently only for a limited time (minutes to hours).
After that, a requirement for long-term memory is the synthesis of new
protein. This protein is used to assemble new synapses.
Protein Synthesis and Memory Consolidation. The possible role of
new protein synthesis in memory has been investigated extensively since
the introduction of drugs in the 1960s that selectively inhibit the assem-
bly of protein from messenger RNA. Protein synthesis inhibitors can be
injected into the brains of experimental animals as they are trained to
perform a task, and deficits in learning and memory can be assessed.
These studies reveal that if brain protein synthesis is inhibited at the time
of training, the animals learn normally but fail to remember when tested
days later. A deficit in long-term memory is also often observed if the in-
hibitors are injected shortly after training. However, the memories become
increasingly resistant to the inhibition of protein synthesis as the interval
between the training and the injection of inhibitor is increased. These
findings indicate a requirement [or new protein synthesis during the period
of memory consolidation, when short-term memories are converted into long-
term ones.
Very similar effects of protein synthesis inhibitors have been observed
in the model systems we've been discussing. In Aplysia, the repeated appli-
cation of sensitizing stimuli causes a form of long-term memory that can
last many days. The application of protein synthesis inhibitors at the
time of training has no effect on sensitization measured hours later, bur it
completely blocks the development of the long-term memory. Likewise,
inhibiting protein synthesis at the time of a tetanus has no effect on the
induction of LTP in the hippocampus. However, instead of lasting days to
weeks, the synaptic potentiation gradually disappears over a few hours.
How are we to interpret these results? From what we have learned so
far, memory formation appears initially to involve the rapid modification of
existing synaptic proteins. These modifications, perhaps with the help of
persistently active kinases, work against the factors that would erase our
memory (such as molecular turnover). It's a losing battle, unless a new pro-
tein arrives at the modified synapse and converts the temporary change in
the synapse to a more permanent one.
.. THE MOLECULAR BASIS OF LONG-TERM MEMORY 789
,
...
Box 25.3
PATH OF DISCOVERY
it
. A
. I J
A Memorable Walk
on the Beach
My graduate work was in photoreceptor physiology with
Joel Brown at MIT. I then did a postdoctoral fellowship
with George Wald. who had recently won the Nobel Prize
for the biochemical characterization of rhodopsin. I was
fascinated with the problem of visual transduction and
fully expected that I would spend my career on this topic.
But about 10 years into my faculty position at Brandeis
University. a series of events led me to become involved
in what was for me the altogether new field of memory
research.
My ongoing work on rhodopsin had led me to become
interested in protein kinases. Rhodopsin is a molecular
switch that is turned on by light. It had just been discov-
ered that light also causes rhodopsin to become phos-
phorylated and that this contributes to turning rhodopsin
back off. In the course of reading about kinases, I came
across a curious fact: Some kinases phosphorylate them-
selves, a process called autophosphorylation.
That year, I was teaching the introductory course in
neuroscience. which included a substantial section about
memory. For years. I had peripherally followed the mem-
ory field. Indeed. if one went to the meeting of the Society
for Neuroscience. the most exciting sessions were those
dealing with memory. particularly the work on Aplysio by
Eric Kandel. But I also took note of the "new kid on the
block" in memory research: the field of long-term poten-
tiation in the vertebrate hippocampus. At the time, only
a few labs were working on L Tp, but they were making
interesting discoveries. In particular. it was clear that
hippocampal neurons contained thousands of dendritic
spines, which were the sites of individual synapses. Re-
markably. it appeared that each of these synapses could
independently undergo LTP.
In the spring of 1984, just before teaching the memory
component of my course, I attended the meeting of the
Association for Research in Vision and Ophthalmology, at
a wonderful beach resort in Sarasota, Florida. Between
sessions, one could walk on the beach. Although there
were ample visual distractions, my mind occasionally
turned to science. Knowing that I would have to teach
about memory when I returned to Brandeis. I contem-
plated my lecture. I was impressed Kandel's work. but the
It..
..
by John E. Lisman
ideas he had developed for Aplysio just didn't seem appli-
cable to LTP. He argued that learning was a form of dif-
ferentiation; the secret to memory thus lay in gene
control. What I couldn't understand is how gene control
from the nucleus could apply differentially to each of the
thousands of hippocampal synapses distributed over the
dendritic tree. It would seem much more sensible for
memory storage devices to be localized to each synapse.
But this thought was heretical: If a storage device was in
each spine. it couldn't be made of DNA and would prob-
ably be made of protein. But covalent modifications of
proteins are unstable, and even if one could think of a
stable modification. the protein itself would eventually dis-
appear in the course of protein turnover. Everything would
thus be forgotten. How could unstable molecular changes
underlie stable memory
My eureka moment occurred on this stroll along the
beach. The core idea was that a group of autophosphory-
lating kinase molecules localized at a synapse could make
a stable switch. During LTP induction, these molecules
would become phosphorylated. and this would make
them active. If a kinase molecule was dephosphorylated
or replaced in the course of protein turnover, it could be
phosphorylated by other members of the group. The
switch could stay on, perhaps indefinitely, and this showed
how unstable molecules could produce stable information
storage.
At the time my first article was published. it was
known that CaMKIl was highly enriched at synapses. On
exciting visits to two labs working on this enzyme, those
of Jimmy Schwartz and Mary Kennedy. I learned of the
newly discovered auto phosphorylation properties of
CaMKIl. This suggested that CaMKIl might operate as a
switch along the lines suggested by my model. Now 20
years later, the central role of CaMKIl in LTP is well es-
tablished, and there is compelling support from mutant
mice for the idea that autophosphorylation of the enzyme
is also crucial for learning. The key question now is
whether CaMKIl is important in only the first phases of
memory or whether it is required throughout the mem-
ory process. It will be exciting to see the answer to this
question unfold.
790 C HAP T E R 2 5 . MOLECULAR MECHANISMS OF LEARNING AND MEMORY
CREB and Memory. What regulates the protein synthesis tha[ is required
for memory consolidation? Recall that the very first step in protein syn-
thesis is the generation of an mRNA transcript of a gene (see Figure 2.8).
This process of gene expression is regulated by transcription factors in the
nucleus. One transcription factor is called the cyclic AMP response ele-
ment binding protein (CREB). CREB is a protein that binds to specific
segments of DNA called cyclic AMP response elements (CREs), and functions
to regulate the expression of neighboring genes (Figure 25.27). There are
two forms of CREB: CREB-2 represses gene expression when it binds to the
CRE; CREB-l activates transcription, but only when it is phosphorylated by
protein kinase A. In a seminal study published in 1994, Tim Tully and Jerry
Yin at Cold Spring Harbor Laboratory showed that CREB regulates the gene
expression required for memory consolidation in the fruit fly Drosophila
melanogaster (see Box 25.2).
In their first series of experiments, Tully and Yin bred Drosophila that
would make extra copies of the fly's version of CREB-2 (called dCREBb)
when the animal was warmed up (a miracle of fly genetic engineering that
is not possible in mammals). This manipulation repressed all gene expres-
sion that is regulated by the CREs and also blocked memory consolidation
in a simple associative memory task. Thus, CREB-regulated gene expres-
sion is critical for memory consolidation in flies. More interesting, however,
is what they found when they generated flies that could make extra copies
of fly CREB-l (called dCREBa). Now, tasks that would take normal flies
many trials to learn could be remembered after a single training trial. These
mutant flies had a "photographic" memory! And these results are not
peculiar to flies; CREB has been implicated in regulating the consolidation
CREB-2
GENE
DNA
r--l-
I
\C RE l
No transcription
(a)
CREB-1 /
CREB-2
\CR E l
GENE
(b)
Phosphorylated
CREB-1
) PI
Transcription
CRE
GENE
(c)
FIGURE 25.27
The regulation of gene expression by CREB. Shown here is a piece of DNA contain-
ing a gene whose expression is regulated by the interaction of a CREB protein with aCRE
on the DNA. (a) CREB-l functions as a repressor of gene expression. (b) CREB-I, an
activator of gene expression, can displace CREB-l. (c) When CREB-I is phosphorylated by
protein kinase A (and other kinases). transcription can ensue.
... THE MOLECULAR BASIS OF LONG-TERM MEMORY 791
of sensitization in Aplysia, as well as long-term potentiation and spatial
memory in mice.
As you know, not all experiences are remembered equally. Some, partic-
ularly those with strong emotional content, are seared permanently into
our memories. (Think of your first romance.) Others remain with us only
briefly and then fade away. The modulation of gene expression by CREB
offers a molecular mechanism that can control the strength of a memory.
A failure of memories to consolidate is a feature of numerous brain
disorders and the aging process. The recent understanding of how consol-
idation is regulated has spawned a new industry focused on developing
memory-enhancing drugs. Such drugs could greatly improve the quality of
life for individuals with neurological diseases, such as Alzheimer's. How-
ever, there is also the allure of performance enhancement in otherwise
healthy people. By analogy, consider the widespread use of such drugs as
Viagra for erectile dysfunction in normal men. "Viagra for the brain," as
such memory enhancers have been whimsically called, will likely be avail-
able in the next few years. As was the case for drugs that enhance athletic
performance, the ethics of using memory boosters in the absence of a clear
medical justification are certain to be hotly debated.
Structural Plasticity and Memory. How does the synapse make use of
the timely occurrence of gene expression and the arrival of a new protein?
In the case of synapses that are strengthened after learning, it appears that
this protein is used to construct brand new synapses. This has been best
demonstrated in Aplysia, where it is possible to examine identified synapses
made by the sensory neuron in the gill-withdrawal reflex. Long-term
(but not short-term) sensitization causes a doubling of the number of
synapses made by this neuron! Furthermore, this increase in synapse
number slowly decays at the same rate as the long-term memory. Thus, in
this simple invertebrate system, long-term memory is associated with the
formation of new synapses, and forgetting is associated with a loss of these
synapses.
Do similar structural changes occur in the mammalian nervous system
after learning? This is a difficult problem to solve experimentally because
of the complexity of the mammalian brain and the distributed nature of
memory. One approach has been to compare brain structure in animals
that have had ample opportunity to learn with that of animals that have
had little chance to learn. Thus, putting a laboratory rat in a "complex"
environment filled with toys and playmates (other rats) has been shown
to increase the number of synapses per neuron in the occipital cortex by
about 25%.
Structural changes after learning need not be confined to increases in
synapse number, however. For example, long-term habituation of the gill-
withdrawal reflex in Aplysia is associated with a decrease (by one-third) in
the number of synapses made by the sensory neuron. And recent research
suggests that the conditioning stimulation that yields long-term depression
in the cerebellar cortex also decreases the number of parallel fiber-Purkinje
cell synapses.
It is important to recognize that there are limits to structural plasticity in
the adult brain. As we discussed in Chapter 23, large changes in brain cir-
cuitry are generally confined to critical periods of early life. The growth and
retraction of most axons in the adult CNS are restricted to no more than a
few tens of micrometers. But it is now very clear that the end of a critical
period does not necessarily signify an end to changes in the structure of
axon terminals or the effectiveness of their synapses.
792 C HAP T E R 2 S . MOLECULAR MECHANISMS OF LEARNING AND MEMORY
...
>-V)
WI:
a::
W
r-
CONCLUDING REMARKS
Learning and memory can occur at synapses. Regardless of the species,
brain location, and memory type, many of the underlying mechanisms
appear to be universal. Events are represented first as changes in the elec-
trical activity of the brain, then as second messenger molecules, and next
as modifications of existing synaptic proteins. These temporary changes are
converted to permanent ones-and long-term memory-by altering the
structure of the synapse. In many forms of memory, this involves new
protein synthesis and the assembly of new microcircuits. In other forms of
memory, existing circuits may be disassembled. In either case, learning
requires many of the same mechanisms that were used to refine brain cir-
cuitry during development.
One universal feature is the involvement of Ca 2 +. Clearly, calcium does far
more than build strong bones and teeth. Not only is it critical for neuro-
transmitter secretion and muscle contraction, it is involved in nearly every
form of synaptic plasticity. Because it is a charge-carrying ion on the one
hand and a potent second messenger substance on the other, Ca2+ has a
unique ability to directly couple electrical activity with long-term changes
in the brain.
Can basic neuroscience research take us from ions to intelligence? From
calcium to cognition? If your performance on the next exam is a fair
measure of intelligence and cognition, and if synaptic plasticity truly is the
basis of declarative memory, it would appear that the answer is yes.
mossy fiber (p. 772)
cerebellar granule cell (p. 772)
parallel fiber (p. 773)
Marr-Albus theory of motor
learning (po 774)
long-term depression (LTD)
(p.774)
input specificity (p. 774)
long-term potentiation (LTP)
(p. 777)
dentate gyrus (po 777)
Ammon's horn (p. 777)
CA3 (po 777)
CA I (po 777)
perforant path (po 777)
Schaffer collateral (p. 777)
tetanus (po 778)
cooperativity (p. 779)
BCM theory (po 781)
Procedural Learning
nonassociative learning (po 763)
habituation (p.763)
sensitization (p. 763)
associative learning (po 763)
classical conditioning (po 763)
instrumental conditioning (po 764)
Vertebrate Models of
Learning
cerebellar cortex (p. 772)
Purkinje cell (p. 772)
inferior olive (p. 772)
climbing fiber (po 772)
The Molecular Basis of
Long-Term Memory
molecular switch hypothesis
(p. 788)
cyclic AMP response element
binding protein (CREB) (p. 790)
,ftj
V)
z
W
0
>
W f-
a:: V)
W
::>
a
T CONCLUDING REMARKS 793
I. Outline the steps involved in the presynaptic release of neurotransmitter. Why would the closure of a potas-
sium channel in the presynaptic axon terminal change the amount of Ca 2 + entering and change the amount
of neurotransmitter released?
2. Rabbits can be classically conditioned to blink in response to a tone. This is accomplished by repeatedly
pairing the tone with an air puff to the eye. Richard Thompson and his colleagues at Stanford University have
made the following observations: Learning fails to occur, and the memory is wiped out, if the cerebellum is
surgically removed; the air puff activates cells in the inferior olive; the tone activates cerebellar mossy fibers.
Using your knowledge of synaptic plasticity in the cerebellum, propose a mechanism for classical conditioning
in the rabbit.
3. In Figure 25.16. the mechanisms of classical conditioning in Aplysia and LTO in the cerebellar cortex are
compared. Expand this comparison to include LTP in the hippocampus. What would events I and 2 be? How
do these signals converge to affect a common intracellular process? How is the synaptic change expressed?
4. What property of the NMOA receptor makes it well suited to detect coincident presynaptic and post-
synaptic activity? How could Ca2+ entering through the NMOA receptor possibly trigger both LTP and LTO
in CA I and neocortex?
5. In H.M and R.B. (see Chapter 24), destruction of the hippocampus appears to have impaired the mechanism
that "fixes" new memories in the neocortex. Propose a mechanism involving CREB explaining why this might
be true.
00.
a::l.?
Wz
I-
f-O
a::«
::>w
u...a::
Bredt OS, Nicoll RA. 2003. AMPA receptor traffick-
ing at excitatory synapses. Neuron 40:361-379.
Lisman J, Schulman H, Cline H. 2002. The molecular
basis of CaMKIl function in synaptic and behav-
ioural memory. Nature Reviews in Neuroscience
3: 175-190.
Malenka RC, Bear ME 2004. LTP and LTO: an embar-
rassment of riches. Neuron 44:5-21.
Malinow R. 2003. AMPA receptor trafficking and
long-term potentiation. Philosophical Transactions
of the Royal Society of London Series B: Biological Sci-
ences 358:707-714.
Roberts AC, Glanzman OL. 2003. Learning in Aplysia:
looking at synaptic plasticity from both sides.
Trends in Neuroscience 26:662-670.
Al See primary auditory cortex.
absolute refractory period The period of time, meas-
ured from the onset of an action potentiaL during
which another action potential cannot be triggered.
accommodation The focusing of light by changing
the shape of the eye's lens.
acetylcholine (ACh) An amine that serves as a
neurotransmitter at many synapses in the peripheral
and central nervous systems, including the neuro-
muscular junction.
ACh See acetylcholine.
ACTH See adrenocorticotropic hormone.
actin A cytoskeletal protein in all cells and the major
thin filament protein in a skeletal muscle fiber;
causes muscle contraction by specific chemical inter-
actions with myosin.
action potential A brief fluctuation in membrane
potential caused by the rapid opening and closing of
voltage-gated ion channels; also known as spike,
nerve impulse, or discharge. Action potentials sweep
like a wave along axons to transfer information from
one place to another in the nervous system.
activational effect The ability of a hormone to
activate reproductive processes or behaviors in the
mature organism.
active zone A presynaptic membrane differentiation
that is the site of neurotransmitter release.
adenosine triphosphate (ATP) The molecule that
is the cell's energy source. The hydrolysis of ATP
to produce adenosine diphosphate (ADP) releases
energy that fuels most of the biochemical reactions
of the neuron. ADP is convened back to ATP in the
mitochondria.
adenylyl cyclase An enzyme that catalyzes the
conversion of adenosine triphosphate (ATP) to
cyclic adenosine monophosphate (cAMP), a second
messenger.
adrenal cortex The outer segment of the adrenal
gland; releases cortisol when stimulated by the
pituitary adrenocorticotropic hormone.
adrenal medulla The inner segment of the adrenal
gland, innervated by preganglionic sympathetic
fibers; releases epinephrine.
adrenaline A catecholamine neurotransmitter synthe-
sized from norepinephrine; also called epinephrine.
adrenocorticotropic hormone (ACTH) A hormone
released by the anterior pituitary in response to cor-
ticotropin-releasing hormone; stimulates the release
of cortisol from the adrenal gland.
affective aggression A threatening or defensive form
of aggression accompanied by vocalizations and a
high level of ANS activity.
affective disorder A psychiatric condition character-
ized by disordered emotions; also called mood
GLOSSARY
disorder. Examples are major depression and bipolar
disorder.
affective neuroscience The study of the neural basis
of mood and emotion.
afferent An axon coursing toward and innervating a
given structure. See also efferent.
after-hyperpolarization The hyperpolarization that
follows strong depolarization of the membrane;
the last part of an action potentiaL also called
undershoot.
agnosia The inability to recognize objects, even
though simple sensory skills appear to be normal;
most commonly caused by damage to posterior
parietal areas of the brain.
agoraphobia A mental disorder characterized by
severe anxiety about being in situations in which
escape might be difficult or embarrassing.
alpha motor neuron A neuron that innervates the
extrafusal fibers of skeletal muscle.
amacrine cell A neuron in the retina of the eye that
projects neurites laterally in the inner plexiform
layer.
amino acid A chemical building block of protein
molecules, containing a central carbon atom, an
amino group, a carboxyl group. and a variable R
group.
Ammon's horn A layer of neurons in the hippo-
campus that sends axons into the fornix.
amnesia A severe loss of memory or the ability to
learn. See also anterograde amnesia, retrograde
amnesia.
AMPA receptor A subtype of glutamate receptor; a
glutamate-gated ion channel that is permeable to
Na+ and K+.
ampulla The bulge along a semicircular canaL which
contains the hair cells that transduce rotation.
amygdala An almond-shaped nucleus in the anterior
temporal lobe thought to be involved in emotion
and certain types of learning and memory.
anabolism The biosynthesis of organic molecules from
nutritive precursors; also called anabolic metabolism.
See also catabolism.
analgesia The absence of normal sensations of pain.
androgens Male sex steroidal hormones, the most
important of which is testosterone.
anion A negatively charged ion. See also cation.
anomia The inability to find words.
anorectic peptide A neuroactive peptide that acts
to inhibit feeding behavior; examples are cholecys-
tokinin (CCK), alpha-melanocyte-stimulating
hormone (aMSH), and cocaine- and amphetamine-
regulated transcript peptide (CART).
anorexia A state of negative energy balance in which
energy expenditure exceeds energy intake.
796 G LOS SA R Y
anorexia nervosa A psychiatric disorder characterized
by an obsession with food, an intense fear of gaining
weight, and voluntary maintenance of weight at
below normal levels.
ANS See autonomic nervous system.
antagonist muscle A muscle that acts against another
at the same joint.
anterior An anatomical reference meaning toward the
nose, or rostral.
anterograde amnesia The inability to form new
memories.
anterograde transport Axoplasmic transport from a
neuron's soma to the axon terminal.
antidepressant drug A drug that treats the symptoms
of depression by elevating brain levels of monoamine
neurotransmitters; examples are tricyclics, mono-
amine oxidase (MAO) inhibitors, and SSRIs.
antidiuretic hormone (ADH) See vasopressin.
anxiety disorder One of a group of mental disorders
characterized by irrational or inappropriate expres-
sions of fear, including panic disorder, agoraphobia,
and OCD.
anxiolytic drug A medication that reduces anxiety;
examples are benzodiazepines and SSRIs.
aphasia A partial or complete loss of language abilities
following brain damage. See also Broca's aphasia, con-
duction aphasia, Wernicke's aphasia.
apoptosis A mechanism of orderly, genetically pro-
grammed cell death.
aqueous humor The fluid between the cornea and
the lens of the eye.
arachnoid membrane The middle of the three
meninges, the three membranes that cover the
surface of the central nervous system.
arcuate nucleus A nucleus in the periventricular
area of the hypothalamus containing a large number
of neurons sensitive to changes in leptin levels,
contributing to the regulation of energy balance.
area 17 Primary visual cortex.
area IT An area of neocortex, on the inferior surface
of the temporal lobe, that is part of the ventral
visual processing stream; contains neurons with
responses to complex objects, including faces, and
appears to be involved in visual memory.
area LIP See lateral intraparietal cortex.
area MT An area of neocortex, at the junction of the
parietal and temporal lobes, that receives input from
primary visual cortex and appears to be specialized
for the processing of object motion; also called V5.
area V4 An area of neocortex, anterior to striate
cortex, that is in the ventral visual processing stream
and appears to be important for both shape percep-
tion and color perception.
aspinous neuron A neuron lacking dendritic spines.
associative learning The learning of associations
between events; two types are usually distinguished:
classical conditioning and instrumental conditioning.
astrocyte A glial cell in the brain that supports
neurons and regulates the extracellular ionic and
chemical environment.
ataxia Abnormally uncoordinated and inaccurate move-
ments, often associated with cerebellar dysfunction.
atonia The absence of muscle tone.
ATP See adenosine triphosphate.
attention The state of selectively allocating mental
energy to a ensory stimulus.
attenuation reflex The contraction of muscles in
the middle ear, re ulting in a reduction in auditory
sensitivity.
audition The sense of hearing.
auditory canal A channel leading from the pinna
to the tympanic membrane; the entrance to the
internal ear.
auditory-vestibular nerve Cranial nerve VIII, con-
sisting ofaxons projecting from the spiral ganglion
to the cochlear nuclei.
autonomic ganglia Peripheral ganglia of the sympa-
thetic and parasympathetic divisions of the auto-
nomic nervous system.
autonomic nervous system (ANS) A system of
central and peripheral nerves that innervates the
internal organs, cardiovascular system, and glands;
also called visceral PNS. The ANS consists of sympa-
thetic, parasympathetic, and enteric divisions.
autoradiography A method lor visualizing sites of
radioactive emissions in tissue sections.
autoreceptor A receptor in the membrane of a pre-
synaptic axon terminal that is sensitive to the neuro-
transmitter released by that terminal.
axial muscle A muscle that controls movements of
the trunk of the body.
axon A neurite specialized to conduct nerve impulses,
or action potentials, normally away from the soma.
axon collateral A branch of an axon.
axon hillock A swelling of the axon where it joins
the soma.
axon terminal The end region of an axon, usually a
site of synaptic contact with another cell; also called
terminal bouton or presynaptic terminal.
axoplasmic transport The process 01 transporting
materials down an axon.
ballism A movement disorder caused by damage to
the subthalamus, characterized by violent, flinging
movements of the extremities.
barbiturate A class of drugs with sedative, general
anesthetic, and anticonvulsant effects; barbituates act
in part by binding to GABA A receptors and prolong-
ing their inhibitory actions.
basal forebrain complex Several cholinergic nuclei
of the telencephalon, including the medial septal
nuclei and basal nucleus of Meynerl.
basal ganglia A collection of associated cell groups in
the basal forebrain, including the caudate nucleus,
putamen, globus pallid us, and subthalamus.
basal telencephalon The region of the telencephalon
lying deep in the cerebral hemispheres.
basilar membrane A membrane separating the scala
tympani and scala media in the cochlea in the
inner ear.
BCM theory A theory proposing that synapses are
bidirectionally modifiable. Synaptic potentiation
results when presynaptic activity correlates with a
strong postsynaptic response, and synaptic depression
results when presynaptic activity correlates with a
weak postsynaptic response. An extension of the
Hebb synapse concept, proposed by Bienenstock,
Cooper, and Munro at Brown University. See also
Hebb synapse, Hebbian modification.
benzodiazepine A class of drugs with antianxiety,
sedative, muscle-relaxing, and anticonvulsant effects;
acts by binding to GABA A receptors and prolonging
their inhibitory actions.
binocular competition A process believed to occur
during the development of the visual system
whereby the inputs from the two eyes actively
compete to innervate the same cells.
binocular receptive field The receptive field of a
neuron that responds to stimulation of either eye.
binocular visual field The portion of the visual field
viewed by both eyes.
bipolar cell In the retina, a cell that connects photo-
receptors to ganglion cells.
bipolar disorder A psychiatric affective disorder
characterized by episodes of mania, sometimes inter-
spersed with episodes of depression; also called
manic-depressive disorder.
bipolar neuron A neuron with two neurites.
blob A collection of cells, mainly in primary visual
cortical layers II and III, characterized by a high level
of the enzyme cytochrome oxidase.
blob pathway A visual information-processing path-
way that passes through the parvocdlular and
koniocellular layers of the LGN and converges on
the blobs of striate cortical layer III; believed to
process information about object color.
blood-brain barrier A specialization of the walls of
brain capillaries that limits the movement of blood-
borne substances into the extracellular fluid of the
brain.
brain The part of the central nervous system contained
in the skull, consisting of the cerebrum, cerebellum,
brain stem, and retinas.
brain stem The diencephalon, midbrain, pons, and
medulla. (Some anatomists exclude the diencephalon.)
Broca's aphasia A language disturbance in which a
person has difficulty speaking or repeating words but
can understand language; also known as motor or
nonfluent aphasia.
Broca's area A region of the frontal lobe associated
with Broca's (motor) aphasia when damaged.
bulimia nervosa A psychiatric disorder characterized
G LOS S A R Y 797
by large, uncontrolled eating binges followed by
compensatory behavior, such as forced vomiting.
bundle A collection ofaxons that run together but do
not necessarily have the same origin and destination.
CAl A region of Ammon's horn in the hippocampus
that receives input from the neurons of CA3.
CA3 A region of Ammon's horn in the hippocampus
that receives input from the neurons of the dentate
gyrus.
calcium-calmodulin-dependent protein kinase
(CaMI<) A protein kinase activated by elevations of
internal Ca 2 + concentration.
calcium pump An ion pump that removes cytosolic
Ca 2 +.
CAM See cell-adhesion molecule.
cAMP See cyclic adenosine monophosphate.
Cannon-Bard theory A theory of emotion proposing
that emotional experience is independent of emo-
tional expression and is determined by the pattern
of thalamic activation.
capsule A collection ofaxons that connect the cere-
brum with the brain stem.
cardiac muscle A type of striated msucle found only
in the heart; it contracts rhythmically even in the
absence of innervation.
catabolism The breaking down of complex nutrient
molecules into simpler molecules; also called cata-
bolic metabolism. See also anabolism.
catecholamines The neurotransmitters dopamine,
norepinephrine, and epinephrine.
cation A positively charged ion. See also anion.
caudal An anatomical reference meaning toward the
rail, or posterior.
caudate nucleus A part of the basal ganglia in the
basal forebrain, involved in motor control.
CCI< See cholecystokinin.
cell-adhesion molecule (CAM) A molecule on
the cell surface that causes cells to adhere to one
another.
cell assembly A group of simultaneously active
neurons that represents an object held in memory.
cell body The central region of the neuron containing
the nucleus; also called soma or perikaryon.
center-surround receptive field A visual receptive
field with a circular center region and a surround
region forming a ring around the center; stimulation
of the center produces a response opposite that
generated by stimulation of the surround.
central nervous system (CNS) The brain (including
the retinas) and spinal cord. See also peripheral
nervous system.
central pattern generator A neural circuit that gives
rise to rhythmic motor activity.
central sulcus The sulcus in the cerebrum that divides
the frontal lobe from the parietal lobe.
cerebellar cortex A sheet of gray matter lying just
under the pial surface of the cerebellum.
798 GLOSSARY
cerebellar granule cell A neuron in the cerebellar
cortex that receives input from mossy fibers and
gives rise to parallel fibers that innervate Purkinje
cells. Plasticity of the synapses between granule cells
and Purkinje cells is believed to be imponant for
motor learning.
cerebellar hemispheres The lateral regions of the
cerebellum.
cerebellum A structure derived from the rhomben-
cephalon, attached to the brain stem at the pons;
an important movement control center.
cerebral aqueduct A canal filled with cerebrospinal
fluid within the midbrain.
cerebral cortex The layer of gray matter that lies just
under the surface of the cerebrum.
cerebral hemispheres The two sides of the cerebrum,
derived from the paired telencephalic vesicles.
cerebrospinal fluid (CSF) In the central nervous
system, the fluid produced by the choroid plexus
that flows through the ventricular system to the
subarachnoid space.
cerebrum The largest part of the forebrain; also called
telencephalon.
cGMP See cyclic guanosine monophosphate.
channelopathy A human genetic disease caused
by alterations in the structure and function of ion
channels.
characteristic frequency The sound frequency to
which a neuron in the auditory system gives its
greatest response.
chemical synapse A synapse in which presynaptic
activity stimulates the release of neurotransmitter,
which activates receptors in the postsynaptic
membrane.
chemoaffinity hypothesis The hypothesis that
chemical markers on growing axons are matched
with complementary chemical markers on their
targets.
chemoattractant A diffusible molecule that acts over
a distance to attract growing axons.
chemoreceptor Any sensory receptor selective for
chemicals.
chemorepellent A diffusible molecule that acts over a
distance to repel growing axons.
cholecystokinin (CCK) A peptide found within
some neurons of the central and peripheral nervous
systems and in some endothelial cells lining the
upper gastrointestinal tract; a satiety signal that
inhibits feeding behavior, in part, by acting on axons
of the vagus nerve that respond to gastric distension.
cholinergic Describing neurons or synapses that pro-
duce and release acetylcholine.
chromosome A structure in the cell nucleus contain-
ing a single linear thread of DNA.
ciliary muscle A muscle that controls the shape of the
eye's lens.
circadian rhythm Any rhythm with a period of about
1 day.
classical conditioning A learning procedure in
which a stimulus that evokes a measurable response
is associated with another stimulus that normally
does not evoke this response.
climbing fiber An axon of an inferior olive neuron
that innervates a Purkinje cell of the cerebellum.
Climbing fiber activity is an important trigger for
LTD, a form of synaptic plasticity believed to be
important for motor learning.
clock gene A gene that is critically involved in the
molecular mechanism of the circadian rhythm; clock
genes are translated into proteins that regulate their
own transcription, and their expression rises and
falls over a cycle of about 24 hours.
CNS See central nervous system.
cochlea A spiral bony structure in the inner ear that
contains the hair cells that transduce sound.
cochlear amplifier Outer hair cells, including the
motor proteins in the outer hair cell membrane, that
amplify displacements of the basilar membrane in
the cochlea.
cochlear nucleus See dorsal cochlear nucleus, ventral
cochlear nucleus.
color-opponent cell A cell in the visual system with
an excitatory response to wavelengths of light of one
color and an inhibitory response to wavelengths of
another color; the color pairs that cancel each other
are red-green and blue-yellow.
commissure Any collection ofaxons that connect one
side of the brain with the other side.
complex cell A type of visual cortical neuron that
has an orientation-selective receptive field without
distinct ON and OFF subregions.
concentration gradient A difference in concentration
from one region to another. Ionic concentration
gradients across the neuronal membrane help deter-
mine the membrane potential.
conductance See electrical conductance.
conduction aphasia A type of aphasia associated
with damage 10 the arcuate fasciculus, characterized
by good comprehension and speech but difficulty
repeating words.
cone photoreceptor A photoreceptor in the retina
containing one of three photopigments that are
maximally sensitive to different wavelengths of light.
Cones are concentrated in the fovea, specialized for
daytime vision, and responsible for all color vision.
See also rod photoreceptor.
conjunctiva The membrane that folds back from the
eyelids and attaches to the sclera of the eye.
contralateral An anatomical reference meaning on
the opposite side of the midline.
cooperativity The property of long-term potentiation,
reflecting the requirement that many inputs be
active at the same time during a tetanus to induce
LTP. See also long-term potentiation.
cornea The transparent external surface of the eye.
coronal plane An anatomical plane of section that
divides the nervous system into anterior and poste-
rior parts.
corpus callosum The great cerebral commissure,
consisting ofaxons connecting the cortex of the two
cerebral hemispheres.
cortex Any collection of neurons that forms a thin
sheet, usually at the brain's surface.
cortical module The unit of cerebral cortex that is
necessary and sufficient to analyze one discrete point
in a sensory surface.
cortical plate A cell layer of the immature cerebral
cortex containing undifferentiated neurons.
cortical white matter A collection ofaxons lying just
below the cerebral cortex.
corticospinal tract The tract that originates in
the neocortex and terminates in the spinal cord;
involved in the control of voluntary movement.
corticotropin-releasing hormone (CRH) A hormone
released by neurons in the para ventricular nucleus
of the hypothalamus; stimulates the release of ACTH
I'rom the anterior pituitary.
cortisol A steroid hormone released by the adrenal cor-
tex; mobilizes energy reserves, suppresses the immune
system, and has direct actions on some CNS neurons.
co-transmitter One of two or more different neuro-
transmitters that are released from a single presynap-
tic nerve terminal.
cranial nerves Twelve pairs of nerves that arise from
each side of the brain stem, numbered from anterior
to posterior. Cranial nerve I is actually the olfactory
tract, and cranial nerve II is the optic nerve; both
are parts of the central nervous system. Cranial
nerves III-XII, which are in the peripheral nervous
system, perform many diverse functions.
CRH See corticotropin-releasing hormone.
critical period A limited period of time when a par-
ticular aspect of brain development is sensitive to a
change in the external environment.
CSF See cerebrospinal fluid.
cyclic adenosine monophosphate (cAMP) A sec-
ond messenger formed from adenosine triphosphate
by the action of the enzyme adenylyl cyclase.
cyclic AMP response element binding protein
(CREB) A protein that binds to specific regions of
DNA (cyclic AMP response elements) and functions
to regulate gene transcription; a key regulator of
protein synthesis-dependent memory consolidation.
cyclic guanosine monophosphate (cGMP) A second
messenger formed from guanosine triphosphate by
the action or the enzyme guanylyl cyclase.
cytoarchitectural map A map, usually of the cerebral
cortex, based on cytoarchitectural diHerences.
G LOS S A R Y 799
cytoarchitecture The arrangement of neuronal cell
bodies in various parts of the brain.
cytochrome oxidase A mitochondrial enzyme
concentrated in cells that I'orm the blobs in primary
visual cortex.
cytoplasm Cellular material contained by the cell
membrane, including the organelles but excluding
the nucleus.
cytoskeleton The internal scaffolding that gives a cell
its characteristic shape; consists of microtubules,
neurofilaments, and microfilaments.
cytosol The watery fluid inside a cell.
DA See dopamine.
OAG See diacylglycerol.
Dale's principle The idea that a neuron has a unique
identity with respect to neurotransmitter.
dark adaptation The process by which the retina
becomes more sensitive to light in dim light.
dark current The inward sodium current that occurs
in photoreceptors in the dark.
declarative memory Memory for facts and events.
delayed non-match to sample (DNMS) A behav-
ioral task in which animals are trained to displace
one of two alternative objects that does not match
a previously seen sample object.
dendrite A neurite specialized to receive synaptic
inputs from other neurons.
dendritic spine A small sac of membrane that pro-
trudes from the dendrites of some cells and receives
synaptic input.
dendritic tree All the dendrites of a single neuron.
dense-core vesicle See secretory granule.
dentate gyrus A layer of neurons in the hippo-
campus that receives input from the entorhinal
cortex.
deoxyribonucleic acid See DNA.
depolarization A change in membrane potentia!,
taking it from the value at rest (e.g., -65 mY) to
a less negative value (e.g., 0 mY).
dermatome A region of skin innervated by the pair of
dorsal roots from one spinal segment.
diacylglycerol (DAG) A second messenger molecule
formed by the action of phospholipase C on the
membrane phospholipid phosphatidylinositol-4,5-
bisphosphate. DAG activates the enzyme protein
kinase C.
diathesis-stress hypothesis of mood disorders
A hypothesis suggesting that depression is caused
by a combination of genetic predisposition and envi-
ronmental stress.
diencephalon A region of the brain stem derived
from the prosencephalon (forebrain). Diencephalic
structures include the thalamus and hypothalamus.
differentiation During embryonic development, the
process by which structures become more complex
and functionally specialized.
800 G LOS S A R Y
diffuse modulatory system One of several systems
of CNS neurons that project widely and diffusely
onto large areas of the brain and use modulatory
neurotransmillers, including dopamine, norepineph-
rine, serotonin, and acetylcholine.
diffusion The temperature-dependent movement
of molecules from regions of high concentration to
regions of low concentration, resulting in a more
even distribution.
diopter A unit of measurement for the refractive
power of the eye; the reciprocal of the focal distance.
direction selectivity The properly of cells in the
visual system that respond only when stimuli move
within a limited range of directions.
distal muscle A muscle that controls the hands. feel.
or digits.
DNA (deoxyribonucleic acid) A double-stranded
molecule constructed from four nucleic acids that
contains the genetic instruction<; for a cell.
DNMS See delayed non-match to sample.
dopa A chemical precursor of dopamine and the other
catecholamines.
dopamine (DA) A catecholamine neurotrammitter
synthesized from dopa.
dopamine hypothesis of schizophrenia A hypothe-
sis suggesting that schizophrenia is caused by exces-
sive activation of Dl receptors in the mesocorticolim-
bic dopamine system in the brain.
dorsal An anatomical reference meaning toward the
back.
dorsal cochlear nucleus A nucleus in the medulla
that receives alferents from the spiral ganglion in the
cochlea of the inner ear.
dorsal column A white matter tract on the dorsal side
of the spinal cord, carrying touch and proprioceptive
axons to the brain stem.
dorsal column-mediallemniscal pathway An
ascending somatic sensory pathway that mediates
inlormation about touch, pressure, vibration, and
limb proprioception.
dorsal column nucleus One 01 a pair of nuclei located
in the posterior medulla; target 01 dorsal column
axons, mediating touch and proprioceptive input
from the limbs and trunk.
dorsal horn The dorsal region of the spinal cord
cOIl\aining neuronal cell bodies.
dorsal longitudinal fasciculus A bundle ofaxons
reciprocally connecting the hypothalamus and mid-
brain periaqueductal gray mailer.
dorsal root A bundle of sensory neuron axons that
emerges from a spinal nerve and attaches to the dor-
sal sick of the spinal cord. Dorsal root axons bring
information into the spinal cord. See also ventral
roo\.
dorsal root ganglion A collection of cell bodies of
the sensory neurons that are part of the somatic
PNS. There i one dorsal root ganglion lor each
spinal nerve.
duplex theory of sound localization The principle
that two schemes function in sound localization:
interaural time delay at low frequencies and inter-
aural intensity difference at high frequencies.
dura mater The outermost of the three meninges,
the membranes that cover the surface of the central
nervous system.
EEG See electroencephalogram.
efferent An axon originating in and coursing away
from a given structure. See also a[[erent.
electrical conductance The relative ability of an elec-
trical charge to migrate lrom one point to another.
represented by the symbol g and measured in
siemens (S). Conductance is the inverse of resistance
and is related La electrical current and voltage by
Ohm's law.
electrical current The rate of movement of electrical
charge, represented by the symbol I and measured in
amperes (amp).
electrical potential The force exerted on an electri-
cally charged particle, represented by the symbol V
and measured in volts; also called voltage or poten-
tial difference.
electrical resistance The relative inability of an elec-
trical charge to migrate from one point to another,
represented by the symbol R and measured in ohms
(W). Resistance is the inverse of conductance and is
related to electrical current and voltage by Ohm's
law.
electrical self-stimulation Electrical stimulation that
an animal can voluntarily deliver to a portion of its
brain.
electrical synapse A synapse in which electrical cur-
rent flows directly from one cell to another via a gap
junction.
electroconvulsive therapy (ECT) A treatment for
major depres ion that involves eliciting electrical
seizure activity in the brain.
electroencephalogram (EEG) A measurement of
electrical activity generated by the brain and
recorded from the scalp.
endocannabinoid A natural (endogenous) chemical
that binds to, and activates, cannabinoid (CB)
receptors.
endocytosis The process by which a bit of the cell
membrane is pinched oIl internalized, and con-
verted to an intracellular vesicle. See also exocytosis.
endolymph The fluid that fills the scala media in the
cochlea of the inner ear. containing high K+ and low
Na ' concentrations.
endorphin One of many endogenous opioid peptides
with actions similar to those of morphine; present in
many brain struct ures, particularly those related to
pain.
engram The physical representation or location uf a
memory; also called memory trace.
enteric division A division of the autonomic nervous
system that innervates the digestive organs; consists
of the myenteric and submucous plexuses.
entorhinal cortex A cortical region in the medial
temporal lobe that occupies the medial bank of the
rhinal sulcus; provides input to the hippocampus.
ependymal cell A type of glial cell that provides the
lining of the brain's ventricular system.
ephrin A protein secreted by neurons in many parts
of the developing nervous system that helps establish
topographic axonal connections.
epilepsy A chronic brain disorder characterized by
recurrent seizures.
epinephrine A catecholamine neurotransmitter syn-
thesized from norepinephrine; also called adrenaline.
EPSP See excitatory postsynaptic potentiaL
EPSP summation A simple form of synaptic integra-
tion whereby excitatory postsynaptic potentials com-
bine to produce a larger postsynaptic depolarization.
equilibrium potential See ionic equilibrium potentiaL
estrogens Female steroidal hormones, the most
important of which are estradiol and progesterone.
estrous cycle The female reproductive cycle in most
nonprimate mammals in which there are periodic
episodes of estrus, or "heat."
Eustachian tube An air-filled tube connecting the
middle ear to the nasal cavities.
excitable membrane Any membrane capable of
generating action potentials. The membrane ofaxons
and muscle cells is excitable.
excitation-contraction coupling The physiological
process by which the excitation of a muscle cell
leads to its contraction.
excitatory postsynaptic potential (EPSP) Depolar-
ization of the postsynaptic membrane potential by
the action of a synaptically released neurotransmitter.
exocytosis The process whereby material is released
from an intracellular vesicle into the extracellular
space by fusion of the vesicle membrane with the
cell membrane. See a/so endocytosis.
extension The direction of movement that opens a
joint.
extensor A muscle that causes extension when it
contracts.
extracellular matrix The network of Iibrous proteins
deposited in the space between cells.
extrafusal fiber A muscle fiber in skeletal muscle that
lies outside muscle spindles and receives innervation
from alpha motor neurons.
extraocular muscle A muscle that moves the eye in
the orbit.
falling phase The part of an action potential charac-
terized by a rapid fall of membrane potential [rom
positive to negative.
G LOS S A R Y 80 I
fasciculation A process in which axons growing
together stick to one another.
fast motor unit A motor unit with a large alpha
motor neuron innervating rapidly contracting and
rapidly fatiguing white muscle fibers.
flexion The direction of movement that closes a
joint.
flexor A muscle that causes flexion when it contracts.
follicle-stimulating hormone (FSH) A hormone
secreted by the anterior pituitary; its diverse roles
include the growth of follicles in the ovaries and the
maturation of sperm in the testes.
forebrain The region of the brain derived from the
rostral primary embryonic brain vesicle; also called
prosencephalon. Forebrain structures include the
telencephalon and the diencephalon.
fornix A bundle ofaxons that originates in the hippo-
campal formation, loops around the thalamus, and
terminates in the diencephalon.
fourth ventricle The CSF-filled space within the
hindbrain.
fovea The pit or depression in the retina at the center
of the macula; in humans, the fovea contains only
cone photoreceptors and is specialized for high-
acuity vision.
frequency The number of sound waves or other dis-
crete events per second, expressed in hertz (Hz).
frontal eye field (FE F) A cortical area in the frontal
lobe involved in the generation of saccadic eye
movements.
frontal lobe The region of the cerebrum lying anterior
to the central sulcus under the frontal bone.
FSH See follicle-stimulating hormone.
GABA See gamma-aminobutyric acid.
GABAergic Describing neurons or synapses that pro-
duce and release gamma-aminobutyric acid.
gamma-aminobutyric acid (GABA) An amino acid
synthesized from glutamate; the major inhibitory
neurotransmitter in the central nervous system.
gamma motor neuron A motor neuron that inner-
vates intrafusal muscle fibers.
ganglion A collection of neurons in the peripheral
nervous system. Plural: ganglia.
ganglion cell A cell in the retina that receives input
from bipolar cells and sends an axon into the optic
nerve.
ganglion cell layer A layer of the retina closest to the
center of the eye, containing ganglion cells.
gap junction A specialized junction where a narrow
gap between two cells is spanned by protein chan-
nels (connexons) that allow ions to pass directly
from one cell to another.
gating A property of many ion channels, making
them open or closed in response to specific signals,
such as membrane voltage or the presence of neuro-
transmitters.
802 G LOS S A R Y
gender identity A person's perception of his or her
maleness or femaleness.
gene A unit of heredity; a sequence of DNA that
encodes a single polypeptide or protein.
gene expression The process of transcribing the infor-
mation from a gene into messenger RNA; a gene is a
segment of DNA carrying the instructions for a single
protein.
generalized seizure Pathologically large and synchro-
nous neural activity that spreads to encompass the
entire cerebral hemispheres. See also partial seizure.
ghrelin A peptide secreted by cells in the stomach that
stimulates appetite by activating orexigenic neurons
in the hypothalamus.
glial cell A support cell in the nervous system. Glia
are classified into four categories: astrocytes, oligo-
dendroglia, Schwann cells, and microglia. Astrocytes
regulate the extracellular environment of the brain,
oligodendroglia and Schwann cells provide myelin,
and microglia scavenge debris.
globus pallid us A pan of the basal ganglia in the
basal forebrain; involved in motor control.
glomerulus A cluster of neurons in the olfactory bulb
that receives input from olfactory receptor neurons.
glucocorticoid receptor A receptor activated by cor-
tisol released from the adrenal gland.
glutamate (Glu) An amino acid; the major excitatory
neurotransmitter in the central nervous system.
glutamate hypothesis of schizophrenia A hypothe-
sis suggesting that schizophrenia is caused by the re-
duced activation of NMDA receptors in the brain.
glutamatergic Describing neurons or synapses that
produce and release glutamate.
glycine (Gly) An amino acid; an inhibitory neuro-
transmitter at some locations in the central nervous
system.
GnRH See gonadotropin-releasing hormone.
Goldman equation A mathematical relationship used
to predict membrane potential from the concentra-
tions and membrane permeabilities of ions.
Golgi apparatus An organelle that sorts and chemi-
cally modifies proteins that are destined for delivery
to different parts of the cell.
Golgi stain A method of staining brain tissue that
shows neurons and aU of their neurites; named for
its discoverer, Italian histologist Camillo Golgi
(1843-1926).
Golgi tendon organ A specialized structure within
the tendons of skeletal muscle that senses muscle
tension.
gonadotropin-releasing hormone (GnRH) A hypo-
physiotropic hormone secreted by the hypothalamus;
regulates the release of luteinizing hormone and
follicle-stimulating hormone from the anterior
pituitary.
gonadotropins Hormones secreted by the anterior
pituitary that regulate the release of androgens and
estrogens from the testes and ovaries.
G-protein A membrane-enclosed protein that binds
guanosine triphosphate (GTP) when activated by a
membrane receptor. Active G-proteins can stimulate
or inhibit other membrane-enclosed proteins.
G-protein-coupled receptor A membrane protein
that activates G-proteins when it binds neurotrans-
mitter.
gray matter A generic term for a collection of neu-
ronal cell bodies in the central nervous system.
When a freshly dissected brain is cut open, neurons
appear gray. See also white matter.
growth cone The specialized tip of a growing neurite.
gustation The sense of taste.
gustatory nucleus A nucleus in the brain stem that
receives primary taste input.
gyrus A bump or bulge lying between the sulci of the
cerebrum. Plural: gyri.
habituation A type of nonassociative learning leading
to decreased behavioral responses to repeated stimu-
lation.
hair cell An auditory cell that transduces sound into
a change in membrane potential, or a vestibular cell
that transduces head movements into a change in
membrane potential.
Hebb synapse A synapse that exhibits Hebbian modi-
fications.
Hebbian modification An increase in the effective-
ness of a synapse caused by the simultaneous activa-
tion of presynaptic and postsynaptic neurons.
helicotrema A hole at the apex of the cochlea in the
inner ear that connects the scala tympani to the
scala vestibuli.
hertz (Hz) The unit of sound frequency equivalent to
cycles per second.
hindbrain The region of the brain derived from the
caudal primary embryonic brain vesicle; also called
rhombencephalon. Hindbrain structures include the
cerebellum, pons, and medulla.
hippocampus A region of the cerebral cortex lying
adjacent and medial to the olfactory cortex. In
humans, the hippocampus is in the temporal lobe
and may playa role in learning and memory.
histology The microscopic study of the structure of
tissues.
homeostasis The balanced functioning of physiological
processes and maintenance of an organism's internal
environment within a narrow range.
horizontal cell A cell in the retina of the eye that
projects neurites laterally in the outer plexiform
layer.
horizontal plane An anatomical plane of section that
divides the nervous system into dorsal and ventral
parts.
HPA axis See hypothalamic-pituitary-adrenal axis.
5-HT See serotonin.
Huntington's disease A hereditary, progressive, in-
evitably fatal condition characterized by dyskinesias,
dementia, and personality disorders; associated with
profound degeneration of neurons in the basal gan-
glia and cerebral cortex.
hyperalgesia A reduced threshold for pain, an in-
creased response to painful stimuli, or a spontaneous
pain that follows localized injury.
hypophysiotropic hormone A peptide hormone, such
as corticotropin-releasing hormone or gonadotropin-
releasing hormone, released into the blood by the
parvocellular neurosecretory cells of the hypothala-
mus; stimulates or inhibits the secretion of hormones
from the anterior pituitary.
hypothalamic-pituitary-adrenal (HPA) axis A sys-
tem of CNS neurons and endocrine cells that regu-
lates the release of cortisol from the adrenal gland.
Dysfunction of the HPA system has been implicated
in anxiety disorders and affective disorders.
hypothalamo-pituitary portal circulation A system
of blood vessels that carries hypophysiotropic hor-
mones from the hypothalamus to the anterior
pituitary.
hypothalamus The ventral part of the diencephalon,
involved in the control of the autonomic nervous
system and the pituitary gland.
immunocytochemistry An anatomical method that
uses antibodies to study the location of molecules
within cells.
incus An ossicle in the middle ear whose shape some-
what resembles an anvil.
inferior colliculus A nucleus in the midbrain from
which all ascending auditory signals project to the
medial geniculate nucleus.
inferior olive A nucleus of the medulla that gives rise
to climbing fiber input to the cerebellar cortex.
Climbing fiber activity is an important trigger for
LTD, a form of synaptic plasticity believed to be
important for motor learning.
inhibitor A drug or toxin that blocks the normal
action of a protein or a biochemical process.
inhibitory postsynaptic potential (IPSP) A change
in the postsynaptic membrane potential by the
action of a synaptically released neurotransmitter,
making the postsynaptic neuron less likely to fire
action potentials.
inner ear The cochlea, which is part of the auditory
system, plus the labyrinth, which is part of the
vestibular system.
inner hair cell An auditory cell located between the
modiolus and the rods of Corti; the primary trans-
ducer of sound into an electrochemical signal.
inner nuclear layer A layer of the retina of the eye
containing the cell bodies of bipolar, horizontal, and
amacrine cells.
G LOS S A R Y 803
inner plexiform layer A layer of the retina of the
eye, located between the ganglion cell layer and the
inner nuclear layer; contains the neurites and
synapses between bipolar cells, amacrine cells, and
ganglion cells.
innervation The provision of synaptic input to a cell
or collection of cells.
inositol-I,4,5-triphosphate (IP]) A second messenger
molecule formed by the action of phospholipase C
on the membrane phospholipid phosphatidylinositol-
4,5-bisphosphate. IP 3 causes the release of Ca H from
intracellular stores.
input specificity A property of some forms of synaptic
plasticity such that only the active synapses onto a
neuron are modified.
in situ hybridization A method for localizing strands
of messenger RNA within cells.
instrumental conditioning A learning procedure in
which a response, such as a motor act, is associated
with a stimulus reward, such as food.
insulin A hormone released by the f3 cells of the pan-
creas; regulates blood glucose levels by controlling
the expression of glucose transporters in the plasma
membrane of non-neuronal cells.
intensity The amplitude of a sound wave. Sound
intensity is the amplitude of the pressure differences
in a sound wave that perceptually determines
loudness.
internal capsule A large collection ofaxons that
connects the telencephalon with the diencephalon.
internal resistance The resistance to electrical current
flows longitudinally down a cable or neurite, repre-
sented by the symbol rj.
interneuron Any neuron that is not a sensory or
motor neuron; also describes a CNS neuron whose
axon does not leave the structure in which it resides.
interstitial nuclei of the anterior hypothalamus
(INAH) Four neuron clusters in the preoptic area of
the anterior hypothalmus in humans, some of which
may be sexually dimorphic.
intrafusal fiber A specialized muscle fiber within a
muscle spindle that receives motor innervation from
gamma motor neurons.
ion An atom or molecule that has a net electrical
charge because of a difference in the number of
electrons and protons.
ion channel A membrane-spanning protein that forms
a pore that allows the passage of ions from one side
of the membrane to the other.
ion pump A protein that transports ions across a
membrane at the expense of metabolic energy.
ion selectivity A property of ion channels that are
selectively permeable to some ions and not to others.
ionic driving force The difference between the real
membrane potential, V rn , and the ionic equilibrium
potential, E ion .
804 G LOS SA R Y
ionic equilibrium potential The electrical potential
difference that exactly balances an ionic concentra-
tion gradient, represented by the symbol E ion ; also
known as equilibrium potential.
IP 3 See inositol-I,4, 5-triphosphate.
ipsilateral An anatomical reference meaning on the
same side of the midline.
IPSP See inhibitory postsynaptic potential.
iris The circulal pigmented muscle that controls the
size of the pupil in the eye.
James-Lange theory A theory proposing that the
subjective experience of emotion is a consequence of
physiological changes in the body.
kainate receptor A subtype of glutamate receptor; a
glutamate-gated ion channel that is permeable to
Na+ and K+.
Kliiver-Bucy syndrome A constellation of symptoms
resulting from bilateral temporal lobectomy in
humans and monkeys that includes decreased fear
and aggression (flattened emotions), the tendency
to identify objects by oral examination rather than
visual inspection, and altered sexual behavior.
koniocellular LGN layer A layer of the lateral
geniculate nucleus containing very small cells, lying
just ventral to each magnocellular and parvocellular
layer.
Korsakoff's syndrome A neurological syndrome
resulting from chronic alcoholism, characterized by
confusion, confabulations, apathy, and amnesia.
language acquisition The process of learning a
language.
lateral An anatomical reference meaning away from
the midline.
lateral geniculate nucleus (LGN) A thalamic
nucleus that relays information from the retina to
the primary visual cortex.
lateral hypothalamic area A poorly defined region
of the hypothalamus that has been implicated in the
motivation of behavior.
lateral hypothalamic syndrome Anorexia associated
with lesions of the lateral hypothalamic area that
might be involved in guiding eye movements and
that playa role in working memory.
lateral intraparietal cortex (area LIP) A cortical
area buried in the intraparietal sulcus that is involved
in guiding eye movements; the responses of LIP
neurons suggest that they are involved in working
memory.
lateral pathway Axons in the lateral column of the
spinal cord that are involved in the control of volun-
tary movements of the distal musculature and are
under direct cortical control.
lateral ventricle The CSF-filled space within each
cerebral hemisphere.
layer of photoreceptor outer segments A layer
of the retina farthest from the center of the eye con-
taining the light -sensitive elements of the
phowreceptors.
learning The acquisition of new information or
knowledge.
lemniscus A tract that meanders through the brain
like a ribbon.
length constant A parameter used to describe how
far changes in membrane potential can passively
spread down a cable such as an axon or a dendrite,
represented by the symbol A. The length constant A
is the distance at which the depolarization falls to
37% of its original value; it depends on the ratio of
membrane resistance (rill) to internal resistance (rj).
lens The transparent structure lying between the
aqueous humor and the vitreous humor that enables
the eye to adjust its focus to different viewing
distances.
leptin A protein hormone released by adipocytes (fat
cells) that communicates with neurons of the arcu-
ate nucleus of the hypothalamus.
LGN See lateral geniculate nucleus.
ligand-binding method A method that uses radio-
active receptor ligands (agonists or antagonists) to
locate neurotransmitter receptors.
light adaptation The process by which the retina
becomes less sensitive to light in bright light
conditions.
limbic lobe The hippocampus and cortical areas
bordering the brain stem in mammals, which Broca
proposed as a distinct lobe of the brain.
limbic system A group of structures, including those
in the limbic lobe and Papez circuit, that are
anatomically interconnected and are probably
involved in emotion, learning, and memory.
lipostatic hypothesis A hypothesis proposing that
body fat is maintained homeostatically at a specific
level.
lithium An element, existing in solution as a monova-
lent cation, that is effective in the treatment of bipo-
lar disorder.
locus A small, well-defined group of cells. Plural: loci.
locus coeruleus A small nucleus located bilaterally in
the pons; using NE as their neurotransmitter, its
neurons project widely on all levels of the CNS.
long-term depression (LTD) A long-lasting decrease
in the effectiveness of synaptic transmission that
follows certain types of conditioning stimulation.
long-term memory Information storage that is rela-
tively permanent and does not require continual
rehearsal.
long-term potentiation (LTP) A long-lasting
enhancement of the effectiveness of synaptic trans-
mission that follows certain types of conditioning
stimulation.
LTD See long-term depression.
LTP See long-term potentiation.
luteinizing hormone (LH) A hormone secreted by
the anterior pituitary; its diverse roles include the
stimulation of testosterone production in males and
the facilitation of follicle development and ovulation
in females.
Ml Primary motor cortex, area 4.
macula (I) In the eye, a yellowish spot in the middle
of the retina with relatively few large blood vessels;
contains the fovea. (2) In the ear, a sensory epithe-
lium in the otolith organs whose hair cells transduce
head tilt and acceleration.
magnocellular LGN layer A layer of the lateral
geniculate nucleus receiving synaptic input from
M-type retinal ganglion cells.
magnocellular neurosecretory cell A large neuron
of the perivemricular and supraoptic nuclei of the
hypothalamus that projects to the posterior pituitary
and secretes oxytocin or vasopressin into the
blood.
magnocellular pathway A visual information-
processing pathway that begins with M-type retinal
ganglion cells and leads to layer IVB of striate cortex;
believed to process information about object motion
and motor actions.
major depression An affective disorder characterized
by prolonged, severe impairment of mood; may
include anxiety, sleep disturbances, and other
physiological disturbances.
malleus An ossicle in the middle ear attached to the
tympanic membrane; shaped somewhat like a
hammer.
mania An elevated, expansive, or irritable mood that
is characteristic of bipolar disorder.
Marr-Albus theory of motor learning The theory
that parallel fiber synapses on Purkinje cells are
modified when their activity coincides with climbing
fiber activity.
mechanoreceptor Any sensory receptor selective for
mechanical stimuli, such as hair cells of the inner
ear, various receptors of the skin, and stretch recep-
tors of skeletal muscle.
medial An anatomical reference meaning toward the
midline.
medial forebrain bundle A large bundle ofaxons
coursing through the hypothalamus carrying effer-
ents from the dopaminergic, noradrenergic, and
serotonergic neurons in the brain stem and fibers
interconnecting the hypothalamus, limbic structures,
and midbrain tegmental area.
medial geniculate nucleus (MGN) A relay nucleus
in the thalamus through which all auditory informa-
tion passes on its way from the inferior colliculus to
the auditory cortex.
medial lemniscus A white matter tract of the somatic
sensory system carrying axons from dorsal column
nuclei to the thalamus.
G LOS S A R Y 805
medulla oblongata The part of the hindbrain caudal
to the pons and cerebellum; also called medulla.
medullary reticulospinal tract A tract originating in
the medullary reticular formation and terminating in
the spinal cord; involved in the control of movement.
membrane differentiation A dense accumulation
of protein adjacent to and within the membrane on
either side of a synaptic cleft.
membrane potential The voltage across a cell
membrane; represented by the symbol V m.
membrane resistance The resistance to electrical
current flow across a membrane; represented by the
symbol r m .
memory The retention of learned information.
memory consolidation The process of storing new
information into long-term memory.
meninges Three membranes that cover the surface of
the central nervous system: the dura mater, arach-
noid membrane, and pia mater. Singular: meninx.
menstrual cycle The female reproductive cycle in
primates.
messenger RNA (mRNA) A molecule constructed
from four nucleic acids that carries the genetic
instructions for the assembly of a protein from the
nucleus to the cytoplasm.
metabotropic receptor A G-protein-coupled receptor
whose primary action is to stimulate an intracellular
biochemical response.
MGN See medial geniculate nucleus.
microelectrode A probe used to measure the electrical
activity of cells. Microelectrodes have a very fine tip
and can be fashioned from etched metal or glass
pipettes filled with electrically conductive solutions.
microfilament A polymer of the protein actin, forming
a braided strand 5 nm in diameter; a component of
the cytoskeleton.
microglial cell A type of cell that functions as a
phagocyte in the nervous system to remove debris
left by dead or dying neurons and glia.
microionophoresis A method of applying drugs and
neurotransmitters in very smaIl quantities to cells.
microtubule A polymer of the protein tubulin,
forming a straight, hollow tube 20 nm in diameter.
Microtubules, a component of the cytoskeleton, play
an important role in axoplasmic transport.
midbrain The region of the brain derived from the
middle primary embryonic brain vesicle; also called
mesencephalon. Midbrain structures include the
tectum and the tegmentum.
middle ear The tympanic membrane plus the ossicles.
midline An invisible line that bisects the nervous
system into right and left halves.
midsagittal plane An anatomical plane of section
through the midline that is perpendicular to the
ground. A section in the midsagittal plane divides
the nervous system into right and left halves.
806 G LOS S A R Y
miniature postsynaptic potential A change in post-
synaptic membrane potential caused by the action of
neurotransmitter released from a single synaptic
vesicle.
mitochondrion An organelle responsible for cellular
respiration. Mitochondria generate adenosine
triphosphate using the energy produced by the
oxidation of food.
modulation A term used to describe the actions of
neurotransmitters that do not directly evoke post-
synaptic potentials but modify the cellular response
to excitatory postsynaptic potentials and inhibitory
postsynaptic potentials generated by other synapses.
molecular switch hypothesis The idea that protein
kinases can be switched "on" by autophosphoryla-
tion to a state in which they no longer require the
presence of a specific second messenger to be active.
Such persistently active kinases may hold the memory
of an episode of strong synaptic activation. Initially
proposed by John Lisman at Brandeis University.
monoamine hypothesis of mood disorders A hy-
pothesis suggesting that depression is a consequence
of a reduction in the levels of monoamine neuro-
transmitters, particularly serotonin and norepineph-
rine, in the brain.
monocular deprivation An experimental manipula-
tion that deprives one eye of normal vision.
monogamy Mating behavior in which two individuals
form a tightly bound relationship that includes ex-
clusive or nearly exclusive mating with each other.
Morris water maze A task used to assess spatial
memory in which a rodent must swim to a hidden
platform below the surface of a pool of water.
mossy fiber An axon of a pontine neuron that inner-
vates cerebellar granule cells. This term is also used
to describe the axons from dentate gyrus granule
cells that innervate area CA3 of the hippocampus.
motivated behavior Behavior that is incited to
achieve a goal.
motor cortex Cortical areas 4 and 6, which are directly
involved in the control of voluntary movement.
motor end-plate The postsynaptic membrane at the
neuromuscular junction.
motor neuron A neuron that synapses on a muscle
cell and causes muscle contraction.
motor neuron pool All the alpha motor neurons
innervating the fibers of a single skeleta muscle.
motor strip A name for area 4 on the precentral
gyrus; also called primary motor cortex.
motor unit One alpha motor neuron and all the
skeletal muscle fibers it innervates.
mRNA See messenger RNA.
M-type ganglion ceU A type of ganglion cell in the
retina characterized by a large cell body and dendritic
arbor, a transient response to light. and no sensitivity
to different wavelengths of light; also called M cell.
multipolar neuron A neuron with three or more
neurites.
muscarinic ACh receptor A subtype of acetylcholine
receptor that is G-protein-coupled.
muscle fiber A multinucleated skeletal muscle cell.
muscle spindle A specialized structure within skeletal
muscles that senses muscle length; provides sensory
information to neurons in the spinal cord via group
Ia axons; also called stretch receptor.
myelin A membranous wrapping, or sheath, around
axons provided by oligodendroglia in the central
nervous system and Schwann cells in the peripheral
nervous system.
myofibril A cylindrical structure within a skeletal
muscle fiber that contracts in response to an action
potential.
myosin A cytoskeletal protein in all cells and the
major thick filament protein in a skeletal muscle
fiber; causes muscle contraction by chemical inter-
action with actin.
myotatic reflex A reflex that leads to muscle contrac-
tion in response to muscle stretch, mediated by the
monosynaptic connection between group la axons
from a muscle spindle and an alpha motor neuron
innervating the same muscle; also called stretch
reflex.
NE See norepinephrine.
neglect syndrome A neurological disorder in which
a part of the body or a part of the visual field is
ignored or suppressed; most commonly associated
with damage to posterior parietal areas of the brain.
neocortex The cerebral cortex, with six or more layers
of neurons, found only in mammals.
Nernst equation A mathematical relationship used to
calculate an ionic equilibrium potential.
nerve A bundle ofaxons in the peripheral nervous
system.
nerve growth factor (NGF) A neurotrophin required
for survival of the cells of the sympathetic division
of the ANS; also important for aspects of CNS
development.
netrin An axonal guidance module; a protein secreted
by cells in specific locations in the developing CNS
that can act as either an axonal attractant or a repel-
lent, depending on the type of netrin receptor ex-
pressed on the growing axon.
neural crest The primitive embryonic peripheral
nervous system, consisting of neural ectoderm that
pinches off laterally as the neural tube forms.
neural tube The primitive embryonic central nervous
system, consisting of a tube of neural ectoderm.
neurite A thin tube extending from a neuronal cell
body; the two types are axons and dendrites.
neuroblast An immature neuron before cell differenti-
ation.
neurofilament A type of intermediate filament found
in neurons, 10 nm in diameter; an important com-
ponent of the neuronal cytoskeleton.
neurohormone A hormone released by neurons into
the bloodstream.
neuroleptic drug An antipsychotic drug used to
treat schizophrenia by blocking dopamine receptors;
examples are chlorpromazine and clozapine.
neuromuscular junction A chemical synapse
between a spinal motor neuron axon and a skeletal
muscle nber.
neuron The information-processing cell of the nervous
system; also called nerve cell. Most neurons use
action potentials to send signals over a distance, and
all neurons communicate with one another using
synaptic transmission.
neuron doctrine The concept that the neuron is the
elementary functional unit of the brain and that
neurons communicate with each other by contact
not continuity.
neuronal membrane The barrier, about 5 nm thick,
that separates the inside of a nerve cell from the
outside; consists of a phospholipid bilayer with
proteins embedded in it; encloses the intracellular
organelles and vesicles.
neuropharmacology The study of the effects of drugs
on nervous system tissue.
neurotransmitter A chemical released by a presynap-
tic element upon stimulation that activates postsy-
naptic receptors.
neurotrophin A member of a family of related neu-
ronal trophic factors, including nerve growth factor
and brain-derived neurotrophic factor.
neurulation The formation of the neural tube from
the neural ectoderm during embryonic development.
NGF See nerve growth factor.
nicotinic ACh receptor A class of acetylcholine-gated
ion channel found in various locations, notably at
the neuromuscular junction.
Nissl stain A class of basic dyes that stain the somata
of neurons; named for its discoverer, German histol-
ogist Franz Nissl (1860-1919).
nitric oxide (NO) A gas produced from the amino
acid arginine that serves as an intercellular messenger.
NMDA receptor A subtype of glutamate receptor; a
glutamate-gated ion channel that is permeable to Na+,
K+, and Ca2+. Inward ionic current through the
N-methyl-o-aspartate receptor is voltage dependent
because of a magnesium block at negative mem-
brane potentials.
nociceptor Any receptor selective for potentially
harmful stimuli; may induce sensations of pain.
node of Ranvier A space between two consecutive
myelin sheaths where an axon comes in contact
with the extracellular fluid.
nonassociative learning A change in the behavioral
response that occurs over time in response to a
G LOS S A R Y 807
single type of stimulus; the two types are habituation
and sensitization.
nondeclarative memory Memory for skills, habits,
emotiona[ responses, and some reflexes.
nonM-nonP ganglion cell A ganglion cell in the
retina that is not of the M type or P type, based
on cell morphology and response properties. Of
the variety of cell types in this category, some are
known to be sensitive to the wavelength of light.
non-REM sleep A stage of sleep characterized by
large, slow EEG waves, a paucity of dreams, and
some muscle tone. See also rapid eye movement
sleep.
noradrenergic Describing neurons or synapses that
produce and release norepinephrine.
norepinephrine (NE) A catecholamine neurotrans-
mitter synthesized from dopamine; also called nora-
drenaline.
nucleus (1) The roughly spherical organelle in a cell
body containing the chromosomes. (2) A clearly
distinguishable mass of neurons, usually deep in
the brain.
nucleus of the solitary tract A brain stem nucleus
that receives sensory input and uses it to coordinate
autonomic function via its outputs to other brain
stem and forebrain nuclei and to the hypothalamus.
obesity A state of positive energy balance in which
energy intake and storage exceed energy expendi-
ture, resulting in an increase in body fat. See also
starvation.
obsessive-compulsive disorder (OCD) A mental
disorder that includes obsessions (recurrent intrusive
thoughts, images, ideas, or impulses that are perceived
as being inappropriate, grotesque, or forbidden) and
compulsions (repetitive behaviors or mental acts that
are performed to reduce the anxiety associated with
obsessions) .
occipital lobe The region of the cerebrum lying under
the occipital bone.
OCD See obsessive-compulsive disorder.
ocular dominance column A region of striate cortex
receiving information predominantly from one eye.
ocular dominance shift A change in visual cortex
interconnections that makes more neurons respon-
sive to one eye or the other.
OFF bipolar cell A bipolar cell of the retina that
depolarizes in response to dark (light OFF) in the
center of its receptive field.
Ohm's law The relationship between electrical current
(I), voltage (V), and conductance (g): I = gV. Because
electrical conductance is the inverse of resistance
(R). Ohm's law may also be written: V = IR.
olfaction The sense of smell.
olfactory bulb A bulb-shaped brain structure derived
from the telencephalon that receives input from
olfactory receptor neurons.
808 G LOS S A R Y
olfactory cortex The region of the cerebral cortex
connected 10 the olfactory bulb and separated from
the neocortex by the rhinal fissure.
olfactory epithelium A sheet of cells lining part of
the nasal passages that contains olfactory receptor
neurons.
oligodendroglial cell A glial cell that provides myelin
in the central nervous system.
ON bipolar cell A bipolar cell of the retina that depo-
larizes in response to light (light ON) in the center of
its receptive field.
opioid receptor A membrane protein that selectively
binds natural (e.g., endorphin) and synthetic (e.g.,
morphine) opioid substances.
optic chiasm The structure in which the right and left
optic nerves converge and partially decussate (cross)
to form the optic tracts.
optic disk The location on the retina where optic
nerve axons leave the eye.
optic nerve The bundle of ganglion cell axons that
passes from the eye to the optic chiasm.
optic radiation A collection ofaxons coursing ['rom
the lateral geniculate nucleus to the visual cortex.
optic tectum A term used to describe the superior
colliculus, particularly in non mammalian vertebrates.
optic tract A collection of retinal ganglion cell axons
stretching from the optic chiasm to the brain stem.
Important targets of the optic tract are the lateral
geniculate nucleus and superior colliculus.
orexigenic peptide A neuroactive peptide that stimu-
lates feeding behavior; examples are neuropeptide Y
(NPY), agouti-related peptide (AgRP), melanin-
concentrating hormone (MCR), and orexin.
organ of Corti An auditory receptor organ that con-
tains hair cells, rods of Corti, and supporting cells.
organelle A membrane-enclosed structure inside a
cell; examples are the nucleus, milochondrion, endo-
plasmic reticulum, and Golgi apparatus.
organizational effect The ability of a hormone to
influence the prenatal development of sex organs
and the brain.
orientation column A column of visual cortical
neurons stretching from layer II to layer VI that
responds best to the same stimulus orientation.
orientation selectivity The propen y of a cdl in the
visual system that responds lO a limited range of
stimulus orientations.
osmometric thirst The motivation to drink water as
a result of an increase in blood tonicity.
ossicle One of three small bones in the middle ear.
otolith organ The utricle or the saccule, organs of the
vestibular labyrinth in the inner ear that transduce
head tilt and acceleration.
outer ear The pinna plus the auditory canal.
outer hair cell An auditory receptor cell located far-
ther from the modiolus than the rods of Corti in the
inner ear.
outer nuclear layer A layer of the retina of the eye
containing the cell bodies of photoreceptors.
outer plexiform layer A layer of the retina of the
eye between the inner nuclear layer and the outer
nuclear layer; contains the neurites and synapses
between photoreceptors, horizontal cells, and bipolar
cells.
oval window A hole in the bony cochlea of the inner
ear, where movement of the ossieles is transferred to
movement of the fluids in the cochlea.
overshoot The part of an action potential when the
membrane potential is more positive than 0 mV.
oxytocin A small peptide hormone released from the
posk'fior pituitary by magnocellular neurosecretory
cells; stimulates uterine contractions and milk let-
down from the mammary glands.
Pacinian corpuscle A mechanoreceptor of the deep
skin, selective lor high-frequency vibrations.
PAG See periaqueductal gray matter.
panic disorder A mental disorder characterized by
recurring, seemingly unprovoked panic attacks and a
persistent worry about having further attacks.
Papez circuit A circuit of structures interconnecting
the hypothalamus and cortex, proposed by Papa to
be an emotion system.
papilla A small protuberance on the surface of the
tongue that contains taste buds.
parahippocampal cortex A cortical region in the
medial temporal lobe that lies lateral to the rhinal
sulcus.
parallel fiber An axon of a cerebellar granule cell
that innervates Purkinje cells. Plasticity of the
synapse between a parallel fiber and a Purkinje cell
is believed to be important for motor learning.
parallel processing The idea that different stimulus
attributes are processed by the brain in paralleL
using distinct pathways.
parasympathetic division A division of the auto-
nomic nervous system that maintains heart rate and
respiratory, metabolic, and digestive functions under
normal conditions; its peripheral axons emerge from
the brain stem and sacral spinal cord. See a/so sympa-
thetic division.
paraventricular nucleus A region of the hypothala-
mus involved in the regulation of the autonomic
nervous system and in controlling the secretion of
thyroid-stimulating hormone and adrenocorticotropic
hormone from the anterior pituitary.
parietal lobe The region 01' the cerebrum lying under
the parietal bone.
Parkinson's disease A movement disorder caused by
damage to the sub tantia nigra, characterized by
paucity of movement, difficulty in initiating willed
movement, and resting tremor.
partial seizure Pathologically large and synchronous
neural activity that remains localized to a relatively
small region of the brain. See a/so generalized seizure.
parvocellular LGN layer A layer of the lateral genic-
ulate nucleus receiving synaptic input from P-type
retinal ganglion cells.
parvocellular neurosecretory cell A small neuron
of the medial and periventricular hypothalamus that
secretes hypophysiotropic peptide hormones into the
hypothalamo-pituitary portal circulation to stimulate
or inhibit the release of hormones from the anterior
pituitary.
parvo-interblob pathway A visual information-
processing pathway that begins with P-type retinal
ganglion cells and leads to the interblob regions of
striate cortical layer III; believed to process informa-
tion about fine object shape.
patch clamp A method that enables an investigator to
hold constant the membrane potential of a patch of
membrane while current through a small number of
membrane channels is measured.
PDE See phosphodiesterase.
peptide bond The covalent bond between the amino
group of one amino acid and the carboxyl group of
another.
peptidergic Describing neurons or synapses that pro-
duce and release peptide neurotransmitters.
perforant path The axonal pathway from the en-
torhinal cortex to the dentate gyrus of the hip-
pocampus. Perforant path synapses exhibit LTP and
LTD, forms of synaptic plasticity believed to be im-
portant for memory formation.
periaqueductal gray matter (PAG) A region sur-
rounding the cerebral aqueduct in the core of the
midbrain, with descending pathways that can inhibit
the transmission of pain-causing signals.
perikaryon The central region of the neuron contain-
ing the nucleus; also called soma or cell body.
perilymph The fluid that fills the scala vestibuli and
scala tympani in the cochlea in the inner ear, con-
taining low K+ and high Na+ concentrations.
peripheral nervous system (PNS) The parts of the
nervous system other than the brain and spinal cord.
The PNS includes all the spinal ganglia and nerves,
cranial nerves III-XII, and the autonomic nervous
system. See a/so central nervous system.
perirhinal cortex A cortical region in the medial
temporal lobe that occupies the lateral bank of the
rhinal sulcus. Lesions to this area in humans pro-
duce profound anterograde amnesia.
periventricular zone A hypothalamic region that lies
most medially. bordering the third ventricle.
phase locking The consistent firing of an auditory
neuron at the same phase of a sound wave.
pheromone An olfactory stimulus used for chemical
communication between individuals.
phosphodiesterase (PDE) An enzyme that breaks
down the cyclic nucleotide second messengers cyclic
adenosine monophosphate (cAMP) and cyclic guano-
sine monophosphate (cGMP).
G lO S SA R Y 809
phospholipase C (PLC) An enzyme that cleaves the
membrane phospholipid phosphatidylinositol-4,5-
bisphosphate to form the second messengers diacyl-
glycerol (DAG) and inositol triphosphate (IP,).
phospholipid bilayer The arrangement of phospho-
lipid molecules that forms the basic structure of the
cell membrane. The core of the bilayer is lipid, creat-
ing a barrier to water and to water-soluble ions and
molecules.
phosphorylation A biochemical reaction in which a
phosphate group (P0 4 2 -) is transferred from adeno-
sine triphosphate (ATP) to another molecule. Phos-
phorylation of proteins by protein kinases changes
their biological activity.
photoreceptor A specialized cell in the retina that
transduces light energy into changes in membrane
potential.
pia mater The innermost of the three meninges, the
membranes that cover the surface of the central
nervous system.
pinna The funnel-shaped outer ear, consisting of carti-
lage covered by skin.
place cell A neuron in the rat hippocampus that re-
sponds only when the animal is in a certain region
of space.
planum temporale An area on the superior surface
of the temporal lobe that is frequently larger in the
left than in the right hemisphere.
PKA See protein kinase A.
PKC See protein kinase C.
PLC See phospholipase C.
PNS See peripheral nervous system.
polyandry Mating behavior in which one female
mates with more than one male.
polygyny Mating behavior in which one male mates
with more than one female.
polypeptide A string of amino acids held rogether by
peptide bonds.
polyribosome A collection of several ribosomes float-
ing freely in the cytoplasm.
pons The part of the rostral hindbrain that lies ventral
to the cerebellum and the fourth ventricle.
pontine nuclei The clusters of neurons that relay in-
formation from the cerebral cortex to the cerebellar
cortex.
pontine reticulospinal tract A tract originating in
the pontine reticular formation and terminating in
the spinal cord, involved in the control of movement.
population coding The representation of sensory,
motor, or cognitive information by activity distributed
over a large number of neurons. An example is
color, which is encoded by the relative activity of
the types of retinal cones.
posterior An anatomical reference meaning toward
the tail. or caudal.
posterior parietal cortex The posterior region of
the parietal lobe, mainly Brodmann's areas 5 and 7,
810 GLOSSARY
involved in visual and somatosensory integration
and attention.
postganglionic neuron A peripheral neuron of the
sympathetic and parasympathetic divisions of the
autonomic nervous system; its cell body lies in auto-
nomic ganglia, and its axons terminate on peripheral
organs and tissues.
postsynaptic density A postsynaptic membrane
differentiation that is the site of neurotransmitter
receptors.
postsynaptic potential (PSP) A change in the post-
synaptic membrane potential by the presynaptic
action of an electrical synapse, or a synaptically
released neurotransmitter.
predatory aggression Attack behavior, often with the
goal of obtaining food, accompanied by few vocaliza-
tions and low ANS activity.
prefrontal cortex A cortical area at the rostral end of
the frontal lobe that receives input from the dorso-
media] nucleus of the thalamus.
preganglionic neuron A neuron of the sympathetic
and parasympathetic divisions of the autonomic
nervous system; its cell body lies in the CNS (spina]
cord or brain stem), and its axons extend peripher-
ally to synapse on postganglionic neurons in the
autonomic ganglia.
premotor area (PMA) The latera] part of cortical area
6, involved in the control of voluntary movement.
primary auditory cortex Brodmann's area 4 I. on the
superior surface of the temporal lobe; also called AI.
primary gustatory cortex The area of neocortex that
receives taste information from the ventroposterior
medial nucleus.
primary motor cortex Brodmann's area 4, located on
the precentral gyrus; the region of cortex that, when
weakly stimulated, elicits localized musde contrac-
tions; also called MI.
primary sensory neuron A neuron specialized to
detect environmental signals at the body's sensory
surfaces.
primary somatosensory cortex Brodmann's area 3b
located in the postcentral gyrus; also called S 1.
primary visual cortex Brodmann's area 17, located
at the pole of the occipital lobe; also called striate
cortex and V I.
procedural memory Memory for skills and behaviors.
promoter A region of DNA that binds RNA poly-
merase to initiate gene transcription.
proprioception The sensation of body position and
movement using sensory signals from muscles,
joints, and skin.
proprioceptor A sensory receptor from the muscles,
joints, and skin that contributes to proprioception.
protein A polymer of amino acids strung together by
peptide bonds.
protein kinase A class of enzyme that phosphorylates
proteins, a reaction that changes the conformation of
the protein and its biological activity.
protein kinase A (PKA) A protein kinase activated
by the second messenger cAMP.
protein kinase C (PKC) A protein kinase activated
by the second messenger DAG.
protein phosphatase An enzyme that removes phos-
phate groups trom proteins.
protein synthesis The assembly of protein molecules
in the cell's cytoplasm according to genetic instruc-
tions.
proximal (girdle) muscle A muscle that controls the
shoulder or pelvis.
psychosurgery Brain surgery used to treat mental or
behavioral disorders.
P-type ganglion cell A type of ganglion cell in the
retina characterized by a small cell body and dendritic
arbor. a sustained response to light, and sensitivity to
different wavelengths of light; also called P cell.
pulvinar nucleus A mass of neurons in the posterior
thalamus that have widespread reciprocal connec-
tions with areas across the cerebral cortex.
pupil The opening that allows light to enter the eye
and strike the retina.
pupillary light reflex An adjustment by the pupil to
different levels of ambient light; the pupil's diameter
becomes larger in dim light and smaller in bright
light, in response to retinal inputs to brain stem
neurons that control the iris.
Purkinje cell A cell in the cerebellar cortex that
projects an axon to the deep cerebellar nuclei.
putamen A part ot the basal ganglia in the basal
forebrain; involved in motor control.
pyramidal cell A neuron characterized by a pyramid-
shaped cell body and elongated dendritic tree; found
in the cerebral cortex.
pyramidal tract A tract running along the ventral
medulla that carries corticospinal axons.
quanta I analysis A method of determining how many
vesicles release neurotransmitter during normal
synaptic transmission.
radial glial cell A glial cell in the embryonic brain
extending a process from the ventricular zone to
the surface of the brain; immature neurons and glia
migrate along this process.
raphe nuclei Clusters of serotonergic neurons that lie
along the midline of the brain stem from the mid-
brain to the medulla and project diffusely upon all
levels of the CNS.
rapid eye movement sleep (REM sleep) A stage
of sleep characterized by low-amplitude, high-
frequency EEG waves, vivid dreams, rapid eye
movements, and atonia. See also non-REM sleep.
rate-limiting step In the series of biochemical reac-
tions that leads to the production of a chemical, the
one step that limits the rate of synthesis.
receptive field The region of a sensory surface
(retina, skin) that, when stimulated, changes the
membrane potential of a neuron.
receptor (I) A specialized protein that detects chemi-
cal signals, such as neurotransmitters, and initiates a
cellular response. (2) A specialized cell that detects
environmental stimuli and generates neural responses.
receptor agonist A drug that binds to a receptor and
activates it.
receptor antagonist A drug that binds to a receptor
and inhibits its function.
receptor potential A stimulus-induced change in the
membrane potential of a sensory receptor.
receptor subtype One of several receptors to which a
neurotransmitter binds.
reciprocal inhibition The process whereby the con-
traction of one set of muscles is accompanied by the
relaxation of antagonist muscles.
recognition memory Memory required to perform a
delayed non-match to sample task.
red nucleus A cell group in the midbrain involved in
the control of movement.
referred pain Pain that is perceived as coming from a
site other than its true origin. Nociceptor activation
within visceral organs is typically perceived as pain
originating in skin or skeletal muscle.
refraction The bending of light rays that can occur
when they travel from one transparent medium to
another.
Reissner's membrane The cochlear membrane in the
inner ear that separates the scala vestibuli from the
scala media.
relational memory A type of memory in which all of
the events occurring at a given time are stored in a
manner linking them.
relative refractory period The period of time
following an action potential during which more
depolarizing current than usual is required to
achieve threshold.
REM sleep See rapid eye movement sleep.
resistance See electrical resistance.
resting membrane potential The membrane poten-
tiaL or membrane voltage, maintained by a cell
when it is not generating action potentials; also
called resting potential. Neurons have a resting
membrane potential of about -65 mY.
reticular formation A region of the brain stem
ventral to the cerebral aqueduct and fourth ventricle;
involved in many functions, induding the control of
posture and locomotion.
reticular lamina A thin sheet of tissue in the inner ear
that holds the tops of hair cells in the organ of Corti.
retina A thin [ayer of cells at the back of the eye that
transduces light energy into neural activity.
retinofugal projection A neural pathway that carries
information away from the eye.
GLOSSARY 811
retinotectal projection A neural pathway that carries
information from the retina to the superior colliculus.
retinotopy The topographic organization of visual
pathways in which neighboring cells on the retina
send information to neighboring cells in a target
structure.
retrograde amnesia Memory loss for events before
an illness or brain trauma.
retrograde messenger Any chemical messenger that
communicates information from the postsynaptic
side of a synapse to the presynaptic side.
retrograde transport Axoplasmic transport from an
axon terminal to the soma.
rhodopsin The photopigment in rod photoreceptors.
ribosome A cellular organelle that assembles new
proteins from amino acids according to the instruc-
tions carried by messenger RNA.
rising phase The first part of an action potential. char.
acterized by a rapid depolarization of the membrane.
RNA splicing The process by which introns, the
regions of a primary RNA transcript that are not
used to code protein, are removed.
rod photoreceptor A photoreceptor in the retina
containing rhodopsin and specialized for low light
levels. See also cone photoreceptor.
rostral An anatomical reference meaning toward the
nose, or anterior.
rough endoplasmic reticulum (rough ER) A
membrane-enclosed cellular organelle with ribo-
somes attached to its outer surface; a site of synthe-
sis for proteins destined to be inserted into mem-
brane or to be enclosed by membrane.
round window A membrane-covered hole in the
bony cochlea of the inner ear that is continuous
with the scala tympani in the cochlea.
rubrospinal tract A tract originating in the red
nucleus and terminating in the spinal cord; involved
in the control of movement.
Sl See primary somatosensory cortex.
sagittal plane An anatomical plane of section that is
parallel to the midsagittal plane.
saltatory conduction The propagation of an action
potential down a myelinated axon.
sarcolemma The outer cell membrane of a skeletal
muscle fiber.
sarcomere The contractile element between Z lines in
a myofibril; contains the thick and thin filaments
that slide along one another to cause muscle con-
traction.
sarcoplasmic reticulum (SR) An organelle within a
skeletal muscle fiber that stores Ca H and releases it
when stimulated by an action potential in T tubules.
satiety signal A factor that reduces the drive to eat
without causing sickness; examples are gastric dis-
tension and cholecystokinin released by the intes-
tinal cells in response to food.
812 GLOSSARY
scala media A chamber in the cochlea that lies
between the scala vestibuli and the scala tympani.
scala tympani A chamber in the cochlea that runs
from the helicotrema to the round window.
scala vestibuli A chamber in the cochlea that runs
from the oval window to the helicotrema.
Schaffer collateral An axon of a CA3 neuron that
innervates neurons in CA I of the hippocampus.
Schaffer collateral synapses exhibit LTP and LTD,
forms of synaptic plasticity believed LO be important
for memory formation.
schizophrenia A mental disorder characterized by a
loss of contact with reality; fragmentation and disrup-
tion of thought, perception, mood, and movement;
delusions; hallucinations; and disordered memory.
Schwann cell A glial cell that provides myelin in the
peripheral nervous system.
sclera The tough outer wall of the eyeball; the white
of the eye.
SCN See suprachiasmatic nucleus.
second messenger A short-lived chemical signal in
the cytosol that can trigger a biochemical response.
Second messenger formation is usually stimulated by
a first messenger (a neurotransmitter or hormone)
acting at a G-protein-coupled cell surface receptor.
Examples of second messengers are cyclic adenosine
monophosphate (cAMP), cyclic guanosine mono-
phosphate (cGMP), and inositol-I,4,S-triphosphate
(IP 3 ).
second messenger cascade A multistep process that
couples activation of a neurotransmitter receptor to
activation of intracellular enzymes.
secretory granule A spherical membrane-enclosed
vesicle about 100 nm in diameter containing pep-
tides intended for secretion by exocytosis; also called
dense-core vesicle.
semicircular canal A component of the vestibular
labyrinth in the inner ear that transduces head
rotation.
sensitization A type of nonassociative learning lead-
ing to an intensified response to all stimuli.
sensory map A representation of sensory iniormation
within a neural structure that preserves the spatial
organization of Lhat information established on the
sensory organ. Examples are retinotopic maps in
the superior colliculus, lateral geniculate nucleus,
and visual cortex, where neurons in specific places
respond selectively to stimulation of specific parts of
the retina.
serotonergic Describing neurons or synapses that
produce and release serotonin.
serotonin (5-HT) An amine neurotransmitter,
S-hydroxytryptamine.
serotonin-selective reuptake inhibitor (SSRI) A
drug, such as fluoxetine (Prozac), that prolongs the
actions of synaptically released serotonin by prevent-
ing reuptake; used to treat depression and obsessive-
compulsive disorder.
sex-determining region of the Y chromosome
(SRY) A gene on the Y chromosome that codes for
testis-determining factor; essential for normal male
development.
sexual dimorphism A sex-related difference in struc-
ture or behavior.
sexually dimorphic nucleus (SON) A neuron
cluster in the preoptic area of the anterior hypothal-
amus that in rats is significantly larger in males than
in females.
sham rage A display of great anger in a situation that
would not normally cause anger; behavior produced
by brain lesions.
short-term memory Retention of information about
recent events or facts that is not yet consolidated
into long-term memory.
shunting inhibition A form of synaptic inhibition in
which the main effect is to reduce membrane resist-
ance, thereby shunting depolarizing current generated
at excitatory synapses.
simple cell A neuron found in primary visual cortex
that has an elongated orientation-selective receptive
field with distinct ON and OFF subregions.
skeletal muscle A typt' of striated muscle that is under
voluntary control and that functions to move bones
around joints; derived from mesodermal somites.
slow motor unit A motor unit with a small alpha
motor neuron innervating slowly contracting and
slowly latiguing red muscle Hbers.
SMA See supplementary motor area.
smooth endoplasmic reticulum (smooth ER) A
membrane-enclosed cellular organelle that is hetero-
geneous and performs different functions in different
locations.
smooth muscle A type of muscle in the digestive
tract, arteries, and related structures; innervated
by the autonomic nervous system and not under
voluntary control.
sodium-potassium pump An ion pump that
removes intracellular Na+ and concentrates intra-
cellular K+, using adenosine triphosphate as its
energy source.
soma The central region of the neuron containing
the nucleus; also called cell body or perikaryon.
somatic motor system The skeletal muscles and the
parts of the nervous system that control them; the
system that generates behavior.
somatic PNS The part of the peripheral nervous
system that innervates the skin, joints, and skeletal
muscles.
somatic sensation The senses of touch, temperature,
body position, and pain.
somatotopy The topographic organization of somatic
sensory pathways in which neighboring receptors in
the skin feed information to neighboring cells in a
target structure.
spatial summation The combining of excitatory
postsynaptic potentials generated at more than
one synapse on the same cell. See also temporal
summation.
spike-initiation zone A region of the neuronal mem-
brane where action potentials are normally initiated,
characterized by a high density of voltage-gated
sodium channels.
spinal canal The CSF-filled space within the spinal
cord.
spinal cord The part of the central nervous system in
the vertebral column.
spinal nerve A nerve attached to the spinal cord that
mnervates the body.
spinal segment One set of dorsal and ventral roots
plus the portion of spinal cord related to them.
spinothalamic pathway An ascending somatic sen-
sory pathway traveling from the spinal cord to the
thalamus via the lateral spinothalamic columns;
mediates information about pain, temperature, and
some forms of touch.
spiny neuron A neuron with dendritic spines.
spiral ganglion A collection of neurons in the modio-
lus of the cochlea that receives input from hair cells
and sends output to the cochlear nuclei in the
medulla via the auditory nerve.
split-brain study An examination of behavior in
animals or humans whose cerebral hemispheres
have been disconnected by cutting the corpus
callosum.
SRY See sex-determining region of the Y chromosome.
SSRI See serotonin-selective reuptake inhibitor.
stapes An ossicle in the middle ear attached to the
oval window that somewhat resembles a stirrup.
starvation A state of negative energy balance in which
energy intake fails to meet the body's demands,
resulting in a loss of fat tissue. See also obesity.
stellate cell A neuron characterized by a radial. star-
like distribution of dendrites.
stereocilium A hairlike cilium attached to the top of a
hair cell in the inner ear.
strabismus A condition in which the eyes are not
perfectly aligned.
striate cortex Primary visual cortex, Brodmann's area
] 7; also called VI.
striated muscle A type of muscle with a striated, or
striped, appearance; the two types are skeletal and
cardiac.
striatum A collective term for the caudate nucleus and
putamen; involved in the initiation of willed move-
ments of the body; plays a role in procedural memory.
GLOSSARY 813
subplate A layer of cortical neurons lying below the
cortical plate early in development; when the cortical
plate has differentiated into the six layers of the
neocortex, the subplate disappears.
substantia A group of related neurons deep within
the brain, usually with less distinct borders than
those of nuclei.
substantia gelatinosa A thin dorsal part of the dorsal
horn of the spinal cord that receives input from
unmyelinated C fibers; important in the transmission
of nociceptive signals.
substantia nigra A cell group in the midbrain that
uses dopamine as a neurotransmitter and innervates
the striatum.
subthalamic nucleus A part of the basal ganglia in
the basal forebrain; involved in motor control.
sulcus A groove in the surface of the cerebrum
running between neighboring gyri. Plural: sulci.
superior colliculus A structure in the tectum of the
midbrain that receives direct retinal input and con-
trols saccadic eye movements.
superior olive A nucleus in the caudate pons that
receives afferents from the cochlear nuclei and sends
efferents to the inferior colliculus; also called supe-
rior olivary nucleus.
supplementary motor area (SMA) The medial part
of cortical area 6; involved in the control of volun-
tary movement.
supra chiasmatic nucleus (SCN) A small nucleus of
the hypothalamus just above the optic chiasm that
receives retinal innervation and synchronizes circa-
dian rhythms with the daily light-dark cycle.
sympathetic chain A series of interconnected sympa-
thetic ganglia of the autonomic nervous system,
adjacent to the vertebral column, that receive input
from preganglionic sympathetic fibers and project
postganglionic fibers to target organs and tissues.
sympathetic division A division of the autonomic
nervous system that in fight-or-flight situations acti-
vates physiological responses, including increased
heart rate, respiration, blood pressure, and energy
mobilization and decreased digestive and reproduc-
tive functions; its peripheral axons emerge from the
thoracic and lumbar spinal cord. See also parasympa-
thetic division.
synapse The region of contact where a neuron trans-
fers information to another cell.
synaptic cleft The region separating the presynaptic
and postsynaptic membranes of neurons.
synaptic integration The process by which multiple
EPSPs and/or IPSPs combine within one postsynaptic
neuron, in some cases triggering one or more action
potentials.
synaptic transmission The process of transferring
information from one cell to another at a synapse.
814 GLOSSARY
synaptic vesicle A membrane-enclosed structure,
about 50 nm in diameter, containing neurotransmit-
ter and found at a site of synaptic contact.
synergist muscle A muscle that contracts with other
muscles to produce movement in one direction.
T tubule A membrane-enclosed tunnel running
within a skeletal muscle fiber that links excitation
of the sarcolemma with the release of Ca H from the
sarcoplasmic reticulum.
taste bud A cluster of cells, including taste receptor
cells, in papillae of the tongue.
taste receptor cell A modified epithelial cell that
transduces taste stimuli.
tectorial membrane A sheet of tissue that hangs over
the organ of Corti in the cochlea in the inner ear.
tectospinal tract A tract originating in the superior
colliculus and tenninating in the spinal cord; involved
in the control of head and neck movement.
tectum The part of the midbrain lying dorsal to the
cerebral aqueduct.
tegmentum The part of the midbrain lying ventral to
the cerebral aqueduct.
telencephalon A region of the brain derived from the
prosencephalon (forebrain). Telencephalic structures
include the paired cerebral hemispheres that contain
cerebral cortex and the basal telencephalon.
temporal coding The representation of information
by the timing of action potentials rather than by
their average rate.
temporal lobe The region of the cerebrum lying under
the temporal bone.
temporal summation The combining of excitatory
postsynaptic potentials generated in rapid succession
at the same synapse. See also spatial summation.
terminal arbor Branches at the end of an axon
terminating in the same region of the nervous
system.
terminal bouton The end region of an axon, usually
a site of synaptic contact with another cell; also
called axon terminal.
tetanus A type of repetitive stimulation.
tetrodotoxin (TTX) A toxin that blocks Na+ perme-
ation through voltage-gated sodium channels,
thereby blocking action potentials.
thalamus The dorsal part of the diencephalon, highly
interconnected with the cerebral neocortex.
thermoreceptor A sensory receptor selective for
temperature changes.
thick filament A part of the cytoskeleton of a muscle
cell containing myosin, lying between and among
thin filaments and sliding along them to cause
muscle contraction.
thin filament A part of the cytoskeleton of a muscle
cell containing actin, anchored to Z lines and sliding
along thick filaments to cause muscle contraction.
third ventricle The CSF-filled space within the dien-
cephalon.
threshold A level of depolari7ation sufficient to trigger
an action potential.
tonotopy The systematic organization within an
auditory structure on the basis of characteristic
frequency.
tract A collection of central nervous system axons
with a common site of origin and a common
destination.
transcription The process of synthesizing a messenger
RNA molecule according to genetic instruction<;
encoded in DNA.
transcription factor A protein that regulates the
binding of RNA polymerase to a gene promoter.
transducin The G-protein that couples rhodopsin to
the enzyme phosphodiesterase in rod photoreceptors.
transduction The transformation of sensory stimulus
energy into a cellular signal. such as a receptor
potential.
translation The process of synthesizing a protein
molecule according to genetic instructions carried
by a messenger RNA molecule.
transmitter-gated ion channel A membrane protein
forming a pore that is permeable to ions and gated
by neurotransmitter.
transporter A membrane protein that transports neu-
rotransmitters, or their precursors, across membranes
to concentrate them in either presynaptic cytosol or
synaptic vesicles.
trigeminal nerve Cranial nerve V; attaches to the
pons and carries primarily sensory axons from the
head, mouth, and dura mater and motor axons of
mastication.
trophic factor Any molecule that promotes cell
survival.
troponin A protein that binds Ca H in a skeletal
muscle cell. thereby regulating the interaction of
myosin and actin.
TTX See tetrodotoxin.
tympanic membrane A membrane at the internal
end of the auditory canal that moves in response to
variations in air pressure; also called eardrum.
ultradian rhythm Any rhythm with a period signifi-
cantly less than I day. See also circadian rhythm.
unconscious emotion The experience or expression
of emotion in the absence of conscious awareness of
the stimulus that evoked the emotion.
undershoot The part of an action potential when the
membrane potential is more negative than at rest;
also called after-hyperpolarization.
unipolar neuron A neuron with a single neurite.
VI Primary visual cortex, or striate cortex.
vagus nerve Cranial nerve X, arising from the
medulla and innervating the viscera of the thoracic
and abdominal cavities; a major source of pregan-
glionic parasympathetic visceromotor axons.
vascular organ of the lamina terminalis (OVLT)
A specialized region of the hypothalamus containing
neurons that are sensitive to blood tonicity; they
activate magnocellular neurosecretory cells to release
vasopressin into the blood, triggering osmometric
thirst.
vasopressin A small peptide hormone released from
the posterior pituitary by magnocellular neurosecre-
tory cells; promotes water retention and decreased
urine production by the kidney; also called antidi-
uretic hormone (ADH).
ventral An anatomical reference meaning toward the
belly.
ventral cochlear nucleus A nucleus in the medulla
that receives afferents from the spiral ganglion in the
cochlea of the inner ear.
ventral horn The ventral region of the spinal cord
containing neuronal cell bodies.
ventral lateral (VL) nucleus A nucleus of the thala-
mus that relays information from the basal ganglia
and cerebellum to the motor cortex.
ventral posterior (VP) nucleus The main thalamic
relay nucleus of the somatic sensory system.
ventral posterior medial (VPM) nucleus The part
of the ventral posterior nucleus of the thalamus that
receives somatosensory input from the face, including
afferents from the tongue.
ventral root A bundle of motor neuron axons that
emerges from the ventral spinal cord and joins sen-
sory fibers to form a spinal nerve. Ventral root axons
carry information away from the spinal cord. See also
dorsal root.
ventricular system The cerebrospinal fluid-filled
spaces inside the brain, consisting of the lateral ven-
tricles, third ventricle, cerebral aqueduct and fourth
ventricle.
ventromedial hypothalamic syndrome Obesity
associated with lesions of the lateral hypothalamic
area.
ventromedial pathway Axons in the ventromedial
column of the spinal cord that are involved in the
control of posture and locomotion and are under
brain stem control.
vermis The midline region of the cerebellum.
vestibular labyrinth A part of the inner ear special-
ized for the detection of head motion; consists of the
otolith organs and semicircular canals.
vestibular nucleus A nucleus in the medulla that
receives input from the vestibular labyrinth of the
inner ear.
vestibular system The neural system that monitors
and regulates the sense of balance and equilibrium.
vestibulo-ocular reflex (VOR) A reflexive movement
GLOSSARY 815
of the eyes stimulated by rotational movements of
the head; stabilizes the visual image on the retinas.
vestibulospinal tract A tract originating in the
vestibular nuclei of the medulla and terminating in
the spinal cord; involved in the control of movement
and posture.
visceral PNS The part of the peripheral nelVOUS system
that innervates the internal organs, blood vessels,
and glands; also called autonomic nervous system.
vision The sense of sight.
visual acuity The ability of the visual system to distin-
guish between two nearby points.
visual angle A way to describe distance across the
retina; an object that sub tends an angle of 3.5 0 will
form an image on the retina that is 1 mm across.
visual field The total region of space viewed by both
eyes when the eyes are fixated on a point.
visual hemifield The half of the visual field to one
side of the fixation point.
vitreous humor The jellylike substance filling the eye
between the lens and the retina.
VL nucleus See ventral lateral nucleus.
volley principle The idea that high sound frequencies
are represented in the pooled activity of a number
of neurons, each of which fires in a phase-locked
manner.
voltage The force exerted on an electrically charged
particle, represented by the symbol V and measured
in volts; also called electrical potential or potential
difference.
voltage clamp A device that enables an investigator
to hold the membrane potential constant while
transmembrane currents are measured.
voltage-gated calcium channel A membrane protein
forming a pore that is permeable to Ca 2 + ions and
gated by depolarization of the membrane.
voltage-gated potassium channel A membrane
protein forming a pore that is permeable to K+ ions
and gated by depolarization of the membrane.
voltage-gated sodium channel A membrane protein
forming a pore that is permeable to Na+ ions and
gated by depolarization of the membrane.
volumetric thirst The motivation to drink water as a
result of a decrease in blood volume.
VOR See vestibulo-ocular reflex.
VP nucleus See ventral posterior nucleus.
VPM nucleus See ventral posterior medial nucleus.
Wada procedure A procedure in which one cerebral
hemisphere is anesthetized to enable testing of the
function of the other hemisphere.
Wernicke-Geschwind model A model for language
processing involving interactions of Broca's area and
Wernicke's area with sensory and motor areas.
Wernicke's aphasia A language disturbance in which
speech is fluent but comprehension is poor.
816 GLOSSARY
Wernicke's area An area on the superior surface of
the temporal lobe between auditory cortex and the
angular gyrus; associated with Wernicke's aphasia
when damaged.
white matter A generic term for a collection of central
nervous system axons. When a freshly dissected brain
is cut open, axons appear white. See also gray matter.
worl<ing memory Information storage that is tempo-
rary, limited in capacity, and requires continual
rehearsal.
Young-Helmholtz trichromacy theory The theory
that the brain assigns colors based on a comparison
of the readout of the three types of cone photore-
ceptors.
Z line A band delineating sarcomeres in a myofibril of
a muscle fiber.
zeitgeber Any environmental cue, such as the light-
dark cycle, that signals the passage of time.
Chapter I
Allman JM. 1999. Evolving Brains.
New York: Scientific American
Library.
Alt KW, et al. 1997. Evidence for
stone age cranial surgery. Nature
387:360.
Alzheimer's Association, 2004.
American Stroke Association,
2004.
Centers for Disease Control and
Prevention, National Center for
Injury Prevention and Control,
2004.
Centers for Disease Control and
Prevention, National Center for
Injury Prevention and Control,
Leading Causes of Death, 2004.
Centers for Disease Control and
Prevention, National Center for
Injury Prevention and Control,
Stroke Fact Sheet, 2004.
Clarke E, O'Malley C. 1968. The
Human Brain and Spinal Cord,
2nd ed. Los Angeles: University
of California Press.
Corsi P, ed. 1991. The Enchanted
Loom. New York: Oxford Univer-
sity Press.
Crick F. 1994. The Astonishing Hy-
pothesis: The Scientific Search for the
Soul. New York: Macmillan.
Finger S. 1994. Origins of Neuro-
science. New York: Oxford Uni-
versity Press.
Hall MJ, et a\. 2001. National Hos-
pital Discharge Survey. Advance
data from vital and health statis-
tics, no. 332. Hyattsville, MD:
National Center for Health Sta-
tistics.
Kessler RC, et a\. 2003. The epi-
demiology of major depressive
disorder: results from the Na-
tiemal Comorbidity Survey Repli-
cation (NCS-R). Journal of the
American Medical Association
289(23 ):3095-3105.
Moscicki EK, et a\. 1992. Identifi-
cation of suicide risk factors us-
ing epidemiologic studies. Psychi-
atric Clinics of North America
20(3):499-517.
REFERENCES AND RESOURCES
National Academy of Sciences In-
stitute of Medicine. 1991. Sci-
ence, medicine, and animals.
Washington, DC: National Acad-
emy Press.
National Institute of Mental Health
Fact Sheet, Schizophrenia, 2004.
National Institute on Drug Abuse
InfoFacts, 2004.
National Parkinson Foundation,
2004.
National Stroke Association, 2004.
Shepherd GM, Erulkar SD. 1997.
Centenary of the synapse: from
Sherrington to the molecular bi-
ology of the synapse and be-
yond. Trends in Neurosciences
20:385-392.
U.S. Department of Health and
Human Services. Mental Health: A
Report of the Surgeon General.
Rockville, MD: U.S. Department
of Health and Human Services,
Substance Abuse and Mental
Health Services Administration,
Center for Mental Health Ser-
vices, National Institutes of
Health, National Institute of
Mental Health, 2004.
U.S. Office of Science and Technol-
ogy Policy, Subcommittee on
Brain and Behavioral Sciences.
1991. Report to Congress: Maxi-
mizing human potentia\.
Chapter 2
Alberts B, Johnson A, Lewis J,
Ran M, Roberts K Walter P.
2002. Molecular Biology of the Cell,
4th ed. New York: Garland.
Bick K Amaducci L, Pepeu G.
1987. The Early Story of
Alzheimer's Disease. New York:
Raven Press.
DeFclipe J, Jones EG. 1998. Cajal
on the Cerebral Cortex. New York:
Oxford University Press.
Finger S. 1994. Origins of Neuro-
science. New York: Oxford Uni-
versity Press. .
Goedert. 1996. Molecular dissec-
tion of the neurofibrillary lesions
of Alzheimer's disease. Cold
Spring Harbor Symposia on Quanti-
tative Biology, Vo\. LXI. Cold
Spring Harbor, NY: Cold Spring
Harbor Laboratory Press.
Grafstein B, Forman DS. 1980. In-
tracellular transport in neurons.
Physiological Reviews 60: 1167-
1283.
Hammersen F. 1980. Histology. Bal-
timore: Urban & Schwarzenberg.
Harris KM, Stevens JK. 1989. Den-
dritic spines of CA 1 pyramidal
cells in the rat hippocampus: se-
rial electron microscopy with
reference to their biophysical
characteristics. Journal of Neuro-
science 9:2982-2997.
HubeJ DH. 1988. Eye, Brain and Vi-
sion. New York: Scientific Ameri-
can Library.
Jones EG. 1999. Golgi, Cajal and
the neuron doctrine. Journal of
the History of Neuroscience 8:
170-178.
Levitan I, Kaczmarek L. 1997. The
Neuron: Cell and Molecular Biology,
2nd ed. New York: Oxford Uni-
versity Press.
Peters A, Palay SL, Webster H deF.
1991. The Fine Structure of the
Nervous System, 3rd ed. New
York: Oxford University Press.
Purpura D. 1974. Dendritic spine
"dysgenesis" and mental retarda-
tion. Science 20: 1126-1128.
Sadava D, Purves WK, Heller HC,
Orians GH. 2003. Life: The Science
of Biology, 7th ed. Sunderland,
MA: Sinauer.
Steward 0, Schuman EM. 2001.
Protein synthesis at synaptic
sites on dendrites. Annual Review
of Neuroscience 24:299-325.
Vickers JC, Riederer BM, Marugg
RA, Buee-Scherrer V, Buee L,
Delacourte A, Morrison JH.
1994. Alterations in neurofila-
ment protein immunoreactivity
in human hippocampal neurons
related to normal aging and
Alzheimer's disease. Neuroscience
62(1):1-13.
818 REFERENCES AND RESOURCES
Chapter 3
Doyle DA, Cabral JM, Pfuetzner
RA, Kuo A, Gulbis JM, Cohen
SL, Chait BT, MacKinnon R.
1998. The structure of the potas-
sium channel: molecular basis of
K+ conduction and selectivity. Sci-
ence 280:69-77.
Hille B. 2001. Ionic Channels of Ex-
citable Membranes, 3rd ed. Sunder-
land, MA: Sinauer.
Jan L, Jan YN. 1997. Cloned potas-
sium channels from eukaryotes
and prokaryotes. Annllal Review of
Neuroscience 20:91-123.
Levitan I, Kaczmarek 1. 2002. The
Neuron: Cell and Moleatlar Biology,
3rd ed. New York: Oxford Uni-
versity Press.
Li M, Unwin N, Staufer KA, Jan
YN, Jan 1. 1994. Images of puri-
fied Shaker potassium channels.
Current Biology 4:110-115.
MacKinnon R. 1995. Pore loops: an
emerging theme in ion channel
structure. Neuron 14:889-892.
MacKinnon R. 2003. Potassium
channels. Federation of European
Biochemical Societies Letters 555:
62-65.
Miller C. 1988. Shaker shakes out
potassium channels. Trends in
Neurosciences 11:185-186.
Nicholls J, Wallace B, Fuchs P, Mar-
tin A. 2001. From Neuron to Brain,
4th ed. Sunderland, MA: Sinauer.
Ransom SR, Goldring S. 1973.
Slow depolarization in cells pre-
sumed to be glia in cerebral cor-
tex of cat. Journal of Neurophysiol-
ogy 36:869-878.
Sanguinetti MC, Spector PS. 1997.
Potassium channelopathies. Neu-
ropharmacology 36:755-762.
Shepherd G. 1994. Neurobiology, 3rd
ed. New York: Oxford University
Press.
Somjen GG. 2004. Ions in the Brain:
Normal Function, Seizures, and
Stroke. Oxford University Press.
Stoffel M, Jan LY. 1998. Epilepsy
genes: excitement traced to
potassium channels. Nature Genet-
ics 18:6-8.
Chapter 4
Agmon A, Connors BW. 1992. Cor-
relation between intrinsic firing
patterns and thalamocortical
synaptic responses of neurons in
mouse barrel cortex. Journal of
Neuroscience 12:319-329.
Armstrong CM, Hille B. 1998. Volt-
age-gated ion channels and elec-
trical excitability. Neuron 20:
371-380.
Cole KS. 1949. Dynamic electrical
characteristics of the squid axon
membrane. Archives of Scientific
Physiology 3:253-258.
Connors B, Gutnick M. 1990. In-
trinsic firing patterns of diverse
neocortical neurons. Trends in
Neurosciences 13:99-104.
Hardman JG, Goodman Gilman A,
Limbird LE, eds. 1996. Goodman
and Gilman's The Pharmacological
Basis of Therapeutics, 9th ed. New
York: McGraw-Hill.
Hille B. 1992. Ionic Channels of Ex-
citable Membranes, 2nd ed. Sun-
derland, MA: Sinauer.
Hodgkin A. 1976. Chance and de-
sign in electrophysiology: an in-
formal account of certain experi-
ments on nerves carried out
between 1942 and 1952. Journal
of Physiology (London) 263: 1-21.
Hodgkin AL, Huxley AF, Katz B.
1952. Measurement of current-
voltage relations in the mem-
brane of the giant axon of Loligo.
Journal of Physiology (London)
116:424-448.
Huguenard J, McCormick D. 1994.
Electrophysiology of the Neuron.
New York: Oxford University
Press.
Kullmann D. 2002. The neuronal
channelopathies. Brain 125:
1177-1195.
Levitan I, Kaczmarek 1. 2002. The
Neuron: Cell and Molecular Biology,
3rd ed. New York: Oxford Uni-
versity Press.
Llinas R. 1988. The intrinsic elec-
trophysiological properties of
mammalian neurons: insights
into central nervous system func-
tion. Science 242: 1654-1664.
Narahashi T. 1974. Chemicals as
tools in the study of excitable
membranes. Physiology Reviews
54:813-889.
Narahashi T, Deguchi T, Urakawa
N, Ohkubo Y. 1960. Stabilization
and rectification of muscle fiber
membrane by tetrodotoxin.
American Journal of Physiology
198:934-938.
Narahashi T, Moore JW, Scott WR.
1964. Tetrodotoxin blockage of
sodium conductance increase in
lobster giant axons. Journal of
General Physiology 47:965-974.
Neher E. 1992. Nobel lecture: ion
channels or communication be-
tween and within cells. Neuron
8:605-612.
Neher E, Sakmann B. 1992. The
patch clamp technique. Scientific
American 266:28-35.
Nicholls J, Wallace B, Fuchs P, Mar-
tin A. 2001. From Neuron to Brain,
4th ed. Sunderland, MA: Sinauer.
Noda M, Ikeda T, Suzuki H, et al.
1994. Primary structure of Elec-
trophorus electriclls sodium channel
deduced from cDNA sequence.
Nature 312:121-127.
Shepherd G. 1994. Neurobiology, 3rd
ed. New York: Oxford University
Press.
Sigworth FJ, Neher E. 1980. Single
Na+ channel currents observed in
cultured rat muscle cells. Nature
287:447-449.
Unwin N. 1989. The structure of
ion channels in membranes of
excitable cells. Neuron 3:665-676.
Chapter 5
Bloedel JR, Gage PW, Uinas R,
Quastel DM. 1966. Transmitter
release at the squid giant synapse
in the presence of tetrodotoxin.
Nature 212:49-50.
Capogna M, Gahwiler SH, Thomp-
son SM. 1996. Calcium-inde-
pendent actions of alpha-latro-
toxin on spontaneous and
evoked synaptic transmission in
the hippocampus. Journal of
Neurophysiology 76:3149-3158.
Colquhoun D, Sakmann B. 1998.
From muscle end plate to brain
synapses: a short history of
synapses and agonist-activated
ion channels. Neuron 20:381-387.
Connors BW, Long MA. 2004. Elec-
trical synapses in the mammalian
brain. Annual Review of Neuro-
science 27:393-418.
Cooper JR, Bloom FE, Roth RH.
2002. The Biochemical Basis of Neu-
ropharmacology, 8th ed. New York:
Oxford University Press.
Cowan WM, Siidhof TC, Stevens
CF. 200 I. Synapses. Baltimore:
Johns Hopkins University Press.
Fatt P, Katz B. 1951. An analysis of
the end-plate potential recorded
with an intracellular electrode.
Journal of Physiology (London)
115:320-370.
Furshpan E, Potter D. 1959. Trans-
mission at the giant motor
synapses of the crayfish. Journal
of Physiology (London) 145:
289-325.
Heuser J, Reese T. 1973. Evidence
for recycling of synaptic vesicle
membrane during transmitter re-
lease at the frog neuromuscular
junction. Journal of Cell Biology
57:315-344.
Heuser J, Reese T. 1977. Structure
of the synapse. In Handbook of
Physiology-Section 1. The Nervous
System, Vol. I. Cellular Biology of
Neurons, eds. Brookhart JM,
Mountcastle VB. Bethesda, MD:
American Physiological Society,
pp. 261-294.
Johnston D, Wu SM-S. 1994. Foun-
dations of Cellular Neurophysiology.
Cambridge, MA: MIT Press.
Levitan I, Kaczmarek L. 200 I. The
Neuron: Cell and Molecular Biology,
3rd ed. New York: Oxford Uni-
versity Press.
L1imls R, Sugimori M, Silver RB.
1992. Microdomains of high cal-
cium concentration in a presy-
naptic terminal. Science 256:
677-679.
Loewi O. 1953. From the Workshop
of Discoveries. Lawrence: Univer-
sity of Kansas Press.
Matthews G. 1996. Neurotransmit-
ter release. Annual Review of Neu-
roscience 19:219-233.
Matthews R. 1995. Nightmares of
Nature. London: HarperCollins.
Neher E. 1998. Vesicle pools and
Ca 2 + microdomains: new tools
for understanding their roles in
neurotransmitter release. Neuron
20:389-399.
Neher E, Sakmann B. 1992. The
patch clamp technique. Scientific
American 266:44-51.
Rajendra S, Schofield PRo 1995.
Molecular mechanisms of inher-
ited startle syndromes. Trends in
Neurosciences 18:80-82.
Rothman JE. 2002. Lasker Basic
Medical Research Award. The
machinery and principles of vesi-
cle transport in the cell. Nature
Medicine 8: 1059-1062.
Sherrington C. 1906. Integrative Ac-
tion of the Nervous System. New
Haven: Yale University Press.
Sloper JJ, Powell TP. 1978. Gap
junctions between dendrites and
somata of neurons in the primate
sensori-motor cortex. Proceedings
of the Royal Society, Series B 203:
39-47.
Stevens CF. 2004. Presynaptic func-
tion. Current Opinion in Neurobiol-
ogy 14:341-345.
Stuart G, Spruston N, Hausser M.
1999. Dendrites. New York: Ox-
ford University Press.
Siidhof TC. 2004. The synaptic
vesicle cycle. Annual Review of
Neuroscience 27:509-547.
Unwin N. 1993. Neurotransmitter
action: opening of ligand-gated
ion channels. Cell 72:31-41.
Chapter 6
Amara SG, Arriza JL. 1993. Neuro-
transmitter transporters: three
distinct gene families. Current
Opinion in Neurobiology 3:
337-344.
Attwell D, Mobbs P. 1994. Neuro-
transmitter transporters. Current
Opinion in Neurobiology 4:
353-359.
Boehning D, Snyder SH. 2003.
Novel neural modulators. Annual
Review of Neuroscience 26: I 05-131.
REFERENCES AND RESOURCES 819
Brezina V, Weiss KR. 1997. Analyz-
ing the functional consequences
of transmitter complexity. Trends
in Neurosciences 20:538-543.
Changeux J-P. 1993. Chemical sig-
naling in the brain. Scientific
American 269:58-62.
Colquhoun D, Sakmann B. 1998.
From muscle endplate to brain
synapses: a short history of
synapse and agonist-activated ion
channels. Neuron 20:381-387.
Cooper JR, Bloom FE, Roth RH.
2002. The Biochemical Basis of Neu-
ropharmacology, 8th ed. New
York: Oxford University Press.
Cowan WM, Siidhof TC, Stevens
CF. 2001. Synapses. Baltimore:
Johns Hopkins University Press.
Feldman RS, Meyer JS, Quenzer
LF. 1997. Principles of Neuropsy-
chopharmacology, Sunderland,
MA: Sinauer.
Gilman AG. 1995. Nobel lecture: G
proteins and regulation of adeny-
Iyl cyclase. Bioscience Report 15:
65-97.
Gudermann T, Schoneberg T,
Sch ultz G. 1997. Functional and
structural complexity of signal
transduction via G-protein-couple
receptors. Annual Review of Neuro-
science 20:399-427.
Hille B. 200 I. Ionic Channels of Ex-
citable Membranes, 3rd ed. Sun-
derland, MA: Sinauer.
Matsuda LA. 1997. Molecular as-
pects of cannabinoid receptors.
Critical Reviews in Neurobiology
11:143-166.
Mayer ML, Armstrong N. 2004.
Structure and function of gluta-
mate receptor ion channels. An-
nual Review of Physiology 66:
161-181.
Meyer JS, Quenzer LF. 2004. Psy-
chopharmacology: Drugs, the Brain.
and Behavior. Sunderland, MA:
Sinauer.
Nicholls J, Martin A, Wallace B,
Fuchs P. 2001. From Neuron to
Brain, 4th ed. Sunderland, MA:
Sinauer.
Nicoll R, Malenka R, Kauer J.
1990. Functional comparison of
820 REFERENCES AND RESOURCES
neurotransmitter receptor sub-
types in the mammalian nervous
system. Physiological Reviews 70:
5] 3-565.
Nonh RA, Barnard EA. ] 997. Nu-
cleotide receptors. Current Opinion
in Neurobiology 7:346-357.
Pierce KL, Premont RT, Lefkowitz
RJ. 2002. Seven-transmembrane
receptors. Nature Reviews Molecu-
lar and Cell Biology 3:639-650.
Piomelli D. 2003. The molecular
logic of endocannabinoid sig-
nalling. Nature Reviews Neuro-
science 4:873-884.
Rabow LE, Russek SJ, Farb DH.
1995. From ion channels to ge-
nomic analysis: recent advances
in GABA A receptor research.
Synapse 21:189-274.
Rosenmund C, Stern-Bach Y,
Stevens CF. ] 998. The tetrameric
structure of a glutamate receptor
channel. Science 280:1596-1599.
Siegel GJ, Agranoff BW, Albers RW,
Fisher S1<, Uhler MD, eds. 1998.
Basic Neurochemistry: Molecular, Cel-
lular and Medical Aspects, 6th ed.
Baltimore: Lippincott Williams &
Wilkins.
Snyder S. 1986. Drugs and the Brain.
New York: W. H. Freeman.
Squire LR, Bloom FE, McConnell S,
Roberts JL, Spitzere N, Zigmond
MJ, eds. 2002. Fundamental Neu-
roscience, 2nd ed. San Diego: Aca-
demic Press.
Walker JM, Huang SM, Strangman
NM, Tsou 1<, Sanudo-Pena Me.
1999. Pain modulation by release
of the endogenous cannabinoid
anandamide. Proceedings of the Na-
tional Academy of Sciences USA 96:
12198-12203.
Wilson Rl, Nicoll RA. 2002. Endo-
cannabinoid signaling in the
brain. Science 296:678-682.
Wollmuth LP. Sobolevsky AI. 2004.
Structure and gating of the gllJta-
mate receptor ion channel. Trends
in Neurosciences 27:321-328.
Chapter 7
Butterworth CE, Bendich A. 1996.
Folic acid and the prevention of
birth defects. Annual Review of
Nutrition 16:73-97.
Creslin E. 1974. Development of
the nervous system: a logical ap-
proach to neuroanatomy. CIBA
Clinical Symposium 26: 1- 32.
Frackowick RSJ. 1998. The func-
tional architecture of the brain.
Daedalus 127: 105-130.
Gilbert SF. 2003. Developl11CJ1tal Biol-
ogy, 7th ed. Sunderland, MA:
Sinauer.
Gluhbegoric N, Williams TH. 1980.
The Human Brain: A Photographic
Guide. Philadelphia: Lippincott.
Johnson KA, Becker JA. The whole
brain atlas. http://www.med.
harvard.edu/ AANLlB/home/html
Kaas JH. 1995. The evolution of
neocortex. Brain, Behavior and
Evolution 46:187-196.
Krubitzer 1.. 1995. The organization
of neocortex in mammals: are
species really so different? Trends
in Neurosciences 18:408-418.
Nauta W, Feirtag M. 1986. Funda-
mental Neuroanatomy. New York:
W. H. Freeman.
Northcutt RG, Kaas JH. 1995. The
emergence and evolution of
mammalian neocortex. Trends in
Neurosciences 18:373-375.
Posner MI, Raichle M. 1994. Images
of Mind. New York: Scientific
American Library.
Povinelli DJ, Preuss TM. 1995. The-
ory of mind: evolutionary history
of a cognitive specialization.
Trends in Neurosciences 18:
414-424.
Smith JL, SchoenwoIf Ge. 1997.
Neurulation: coming to closure.
Trends in Neurosciences 20:
510-517.
Watson e. 1995. Basic Human Neu-
roanatomy: An Introductory Atlas,
5th ed. Baltimore: Lippincott
Williams & Wilkins.
Chapter 8
Belluscio L, Gold GH, Nemes A,
Axel R. 1998. Mice deficient in
G(oIf) are anosmic. Neuron 20:
69-81.
Brennan PA, Keverne EB. 2004.
Something in the air? New
insights into mammalian
pheromones. Current Biology 14:
R8]-R89.
Buck LB. 1996. Information coding
in the vertebrate olfactory sys-
tem. Annual Review of Neuro-
sciences ]9:517-554.
Buck LB, Axel R. 1991. A novel
muhigene family may encode
odorant receptors: a molecular
basis for odor recognition. Cell
65:175-187.
Dorries KM. 1998. Olfactory cod-
ing: time in a model. Neuron
20:7-10.
Engen T. 1991. Odor Sensation and
Memory. New York: Praeger.
Fain GL. 2003. Sensory Transduction.
Sunderland, MA: Sinauer.
Garcia J, Ervin FR, Koelling RA.
1966. Learning with prolonged
delay of reinforcement. psycho-
nomic Science 5: 121-122.
Getchell TV, Doty RL Bartoshuk
LM, Snow JB. 1991. Smell and
Taste in Health and Disease. New
York: Raven Press.
Kauer JS. 199 I. Contributions of
topography and parallel process-
ing to odor coding in the verte-
brate olfactory pathway. Trends in
Neurosciences 14:79-85.
Laurent G. 1997. Olfactory process-
ing: maps, time and codes. Cur-
rent Opinion in Neurobiology 7:
547-553.
Laurent G. 2002. Olfactory network
dynamics and the coding of mul-
tidimensional signals. Nature Re-
views Neuroscience 3:884-895.
Laurent G, Wehr M, Davidowitz H.
] 996. Temporal representations
of odors in an olfactory network.
Journal of Neuroscience ]6:3837-
3847.
Luo M, Katz Le. 2004. Encoding
pheromonal signals in the mam-
malian vomeronasal system. Cur-
rent Opinion in Neurobiology 14:
429-434.
Meredith M. 2001. Human
vomeronasal organ function: a
critical review of best and worst
cases. Chemical Senses. 26:
433-445.
Mombaerts P. 2004. Genes and lig-
ands for odorant, vomeronasal
and taste receptors. Nature Re-
views Neuroscience 5:263-278.
Mombaerts P. 2004. Odorant recep-
tor gene choice in olfactory sen-
sory neurons: the one receptor-
one neuron hypothesis revisited.
Current Opinion in Neurobiology
14:31-36.
Mombaerts P. Wang F, Dulac C,
Chao SK, Nemes A, Mendelsohn
M, Edmondson J, Axel R. 1996.
Visualizing an olfactory sensory
map. Cell 87:675-686.
Nakamura T, Gold GH. 1987. A
cyclic nucleotide-gated conduc-
tance in olfactory receptor cilia.
Nature 325:442-444.
Nelson G, Hoon MA, Chan-
drashekar J, Zhang Y, Ryba NJ,
Zuker CS. 200 I. Mammalian
sweet taste receptors. Cell 106:
381-390.
Ressler J, Sullivan SL, Buck LB.
1993. A zonal organization of
odorant receptor gene expression
in the olfactory epithelium. Cell
73:597-609.
Sato T. 1980. Recent advances in
the physiology of taste cells.
Progress in Neurobiology 14:25-67.
Scott K. 2004. The sweet and the
bitter of mammalian taste. Cur-
rent Opinion in Neurobiology 14:
423-427.
Stern K McClintock MK. 1998.
Regulation of ovulation by hu-
man pheromones. Nature 392:
177-179.
Stewart RE, DeSimone JA, Hill DL.
1997. New perspectives in gusta-
tory physiology: transduction, de-
velopment, and plasticity. Ameri-
can Journal of Physiology 272:
CI-C26.
Stopfer M, Bhagavan S, Smith BH,
Laurent G. 1997. Impaired odour
discrimination on desynchroniza-
tion of odour-encoding neural as-
semblies. Nature 390:70-74.
Strausfeld NJ, Hildebrand JG. 1999.
Olfactory systems: common de-
sign, uncommon origins? Current
Opinion in Neurobiology 9:
634-639.
Wysocki CJ, Preti G. 2004. Facts,
fallacies, fears, and frustrations
with human pheromones.
Anatomical Record 28IA:1201-
1211.
Zhang Y. Hoon MA, Chandrashekar
J, Mueller KL, Cook B, Wu 0,
Zuker CS, Ryba NJ. 2003. Coding
of sweet, bitter. and umami
tastes: different receptor cells
sharing similar signaling path-
ways. Cell 112:293-301.
Zhao GQ, Zhang Y, Hoon MA,
Chandrashekar J, Erlenbach t
Ryba NJ, Zuker CS. 2003. The
receptors for mammalian sweet
and umami taste. Cell 115:
255-266.
Chapter 9
Arshavsky VY, Lamb TO, Pugh EN.
2002. G proteins and phototrans-
duction. Annual Review of Physiol-
ogy 64:153-187.
Barlow H. 1953. Summation and
inhibition in the frog's retina.
Journal of Physiology (London)
119:69-78.
Baylor DA. 1987. Photoreceptor
signals and vision. Investigative
Ophthalmology and Visual Science
28:34-49.
Burns ME, Baylor DA. 2001. Acti-
vation, deactivation, and adapta-
tion in vertebrate photoreceptor
cells. Annual Review of Neuroscience
24:779-805.
Curcio CA, Sloan KR, Kalina RE,
Hendrickson AE. 1990. Human
photoreceptor topography. Jour-
nal of Comparative Neurology
292:497-523.
Dacey OM, Packer OS. 2003.
Colour coding in the primate
retina: diverse cell types and
cone-specific circuitry. Current
Opinion in Neurobiology 13:
421-427.
Dowling JE. 1987. The Retina: An
Approachable Part of the Brain.
Cambridge, MA: Harvard Univer-
sity Press.
Dowling JE, Werblin FS. 1971.
Synaptic organization of the ver-
REFERENCES AND RESOURCES 821
tebrate retina. Vision Research
SuppI3:1-15.
Fesenko EE, Kolesnikov SS,
Lyubarsky AL. 1985. Induction
by cyclic GMP of cationic con-
ductance in plasma membrane of
retinal rod outer segment. Nature
313:310-313.
Kutner S. 1953. Discharge patterns
and functional organization of
the mammalian retina. Journal of
Neurophysiology 16:37-68.
Masland RH. 2001. The fundamen-
tal plan of the retina. Nature Neu-
roscience 4:877-886.
McIlwain JT. 1996. All Introduction
to the Biology of Vision. Cambridge,
England: Cambridge University
Press.
Nathans J. 1999. The evolution and
physiology of human color vi-
sion: insights from molecular ge-
netic studies of visual pigments.
Neuron 24:299-312.
Neitz J, Jacobs GH. 1986. Polymor-
phism of the long-wavelength
cone in normal human colour vi-
sion. Nature 323:623-625.
Newell FW. 1965. Ophthalmology.
St. Louis: Mosby.
Rodieck RW. 1998. The First Steps in
Seeing. Sunderland, MA: Sinauer.
Schnapf JL, Baylor DA. 1987. How
photoreceptor cells respond to
light. Scientific American 256:
40-47.
Schwab L. 1987. Primary Eye Care in
Developing Nations. New York: Ox-
ford University Press.
Wiissle H. Boycott B. 1991. Func-
tional architecture of the mam-
malian retina. Physiological Reviews
71:447-480.
Watanabe M, Rodieck RW. 1989.
Parasol and midget ganglion cells
of the primate retina. Journal of
Comparative Neurology 289:
434-454.
Chapter 10
Alonso JM. 2002. Neural connec-
tions and receptive field proper-
ties in the primary visual cortex.
Neuroscientist 8:443-456.
Barlow H. 1972. Single units and
sensation: a neuron doctrine for
822 REFERENCES AND RESOURCES
perceptual psychology? Perception
1:371-394.
Callaway EM. 1998. Local circuits
in primary visual cortex of the
macaque monkey. Annual Review
of Neuroscience 21:47-74.
Courtney SM, Ungerleider LG.
1997. What fMRI has taught us
about human vision. Current
Opinion in Neurobiology 7:
554-561.
Gauthier I, Tarr MJ, Anderson AW,
Skudlarski P, Gore Jc. 1999. Ac-
tivation of the middle fusiform
"face area" increases with expert-
ise in recognizing novel objects.
Nature Neuroscience 2:568-573.
Gegenfurtner KR. 2003. Cortical
mechanisms of colour vision. Na-
ture Reviews Neuroscience 4:
563-572.
Goodale MA, Westwood DA. 2004.
An evolving view of duplex vi-
sion: separate but interacting cor-
tical pathways for perception and
action. Current Opinion in Neurobi-
ology 14:203-211.
Hendry S, Yoshioka T. 1994. A
neurochemically distinct third
channel in the macaque dorsal
lateral geniculate nucleus. Science
264:575-577.
Hendry SHC, Reid RC. 2000. The
koniocellular pathway in primate
vision. Annual Review of Neuro-
science 23:127-153.
Horibuchi S, ed. 1994. Stereogram.
Tokyo: Shogakukan.
Hubel D. 1982. Explorations of rhe
primary visual cortex, 1955-78
(Nobel lecture). Nature 299:
515-524.
Hubel D. 1988. Eye, Brain. and Vi-
sion. New York: W. H. Freeman.
Hubel 0, Wiesel T. 1962. Receptive
fields, binocular interaction and
functional architecture in the
cat's visual cortex. Journal of
Physiology (London) 160: 1 06-154.
Hubel 0, Wiesel T. 1968. Receprive
fields and [unctional architecture
of monkey striate cortex. Journal
of Physiology (London) 195:
215-243.
Hubel 0, Wiesel T. 1977. Func-
tional architecture of the
macaque monkey visual cortex
(Ferrier lecture). Proceedings of the
Royal Society of London Series B
198:1-59.
Julesz B. 1971. Foundations of Cyclo-
pean Perception. Chicago: Univer-
sity of Chicago Press.
LeVay S, Wiesel TN, Hubel DH.
1980. The development of ocular
dominance columns in normal
and visually deprived monkeys.
Journal of Comparative Neurology
191:1-51.
Livingstone M, Hubel D. 1984.
Anatomy and physiology of a
color system in the primate vi-
sual cortex. Journal of Neuroscience
4:309-356.
Martin K. 1994. A brief history of
the "feature detector." Cerebral
Cortex 4:1-7.
Palmer SE. 1999. Vision Science: Pho-
tons to Phenomenology. Cambridge,
MA: MIT Press.
Paradiso MA. 2002. Perceptual and
neuronal correspondence in pri-
mary visual cortex. Current Opin-
ion in Neurobiology 12:155-161.
Salzman C, Britten K, Newsome W.
1990. Cortical microstimulation
influences perceptual judgments
of morion derection. Nature
346:174-177.
Sereno Ml, Dale AM, Reppas JB,
Kwong KK, Belliveau JW, Brady
TJ, Rosen BR, Tootell RBH. 1995.
Borders of multiple visual areas
in humans revealed by functional
magnetic resonance imaging. Sci-
ence 268:889-893.
Sherman SM, Guillery RW. 2002.
The role of the thalamus in the
flow of information to the cortex.
Philosophical Transactions of the
Royal Society of London B 357:
1695-1708.
Singer W, Gray CM. 1995. Visual
feature integration and the tem-
poral correlation hypothesis. An-
nual Review of Neuroscience 18:
555-586.
Ts'o DY, Frostig RD, Lieke EE,
Grinivald A. 1990. Functional or-
ganization of primate visual cor-
tex revealed by high resolution
optical imaging. Science 249:
417-420.
Tyler C, Clarke MB. 1990. The au-
tostereogram. Proceedings of the In-
ternational Society for Optical Engi-
neering 1256:182-197.
Zeki S. 1993. A Vision of the Brain.
London: Blackwell Scientific.
Zihl J, von Cramon 0, Mai N.
1983. Selective disturbance of
movement vision after bilateral
brain damage. Brain 106:
313-340.
Chapter II
Ashmore JF, Kolston PJ. 1994. Hair
cell based amplification in the
cochlea. Current Opinion in Neuro-
biology 4:503-508.
Baloh RW, Honrubia V. 2001. Clini-
cal Neurophysiology of the Vestibular
System, 3rd ed. New York: Oxford
University Press.
Brandt T. 1991. Man in motion:
historical and clinical aspects of
vestibular function. A review.
Brain 114:2159-2174.
Copeland BJ, Pillsbury HC 3rd.
2004. Cochlear implantation for
the treatment of deafness. Annual
Review Medicine 55:157-167.
Corey DP, Garcia-Anoveros J, Holt
JR, Kwan KY, Un SY, Vollrath
MA, Amalfitano A, Cheung EL-
M, Derfler BH, Duggan A, Geleoc
GSG, Gray PA, Hoffman Mp,
Rehm HL, Tamasauskas 0, Zhang
DS. 2004. TRPAI is a candidate
for the mechanosensitive trans-
duction channel of vertebrate
hair cells. Nature 432:723-730.
Eggermont JJ, Roberts LE. 2004.
The neuroscience of tinnitus.
Trends in Neurosciences 27:676-682.
Frolenkov GL Atzori M, Kalinec E
Mammano F, Kachar B. 1998.
The membrane-based mechanism
of cell motility in cochlear ourer
hair cells. Molecular Biology of the
Cell 9: 1961-1968.
Goldberg JM. 1991. The vestibular
end organs: morphological and
physiological diversity of affer-
ents. Current Opinion in Neurobiol-
ogy 1:229-235.
Hudspeth AJ. 1983. The hair cells
of the inner ear. Scientific Ameri-
can 248: 54-64.
Hudspeth AJ. 1997. How hearing
happens. Neuron 19:947-950.
Joris PX, Schreiner CE, Rees A.
2004. Neural processing of ampli-
tude-modulated sounds. Physio-
logical Reviews 84:541-577.
Joris PX, Smith PH, Yin TCT. 1998.
Coincidence detection in the au-
ditory system: 50 years after Jef-
fress. Neuron 21:1235-1238.
Kemp DT. 2002. Otoacoustic emis-
sions, their origin in cochlear
function, and use. British Medical
Bulletin 63:223-241.
Konishi M. 2003. Coding of audi-
tory space. Annual Review of Nell-
roscience 26:31-55.
Koppl C. 1995. Otoacoustic emis-
sions as an indicator for active
cochlear mechanics: a primitive
property of vertebrate auditory
organs. In Advances in Hearing Re-
search, eds. Manley GA, Klump
GM, Koppl C, Fastl H. Oecking-
haus H. Singapore: World Scien-
tific, pp. 207-216.
Liberman MC, Gao J, He DZ, Wu
X, Jia S, Zuo J. 2002. Prestin is
required for electro motility of the
outer hair cell and for the
cochlear amplifier. Nature 419:
300-304.
Lin SY, Corey DP. 2005. TRP chan-
nels in mechanosensation. CUr-
rent Opinion in Neurobiology 15:
350-357.
McAlpine D. Grothe B. 2003.
Sound localization and delay
lines-do mammals fit the
model? Trends in Neurosciences
26:347-350.
Middlebrooks JC, Green DM. 1991.
Sound localization by human lis-
teners. Annual Review of Psychology
42:135-159.
Nobili R, Mammano F, Ashmore J.
1998. How well do we under-
stand the cochlea? Trends in Neu-
rosciences 21: 159-167.
Oertel D. 1997. Encoding of timing
in the brain stem auditory nuclei
of vertebrates. Neuron 19:
959-962.
Palmer AR. 2004. Reassessing
mechanisms of low-frequency
sound localisation. Current Opin-
ion in Neurobiology 14:457-460.
Rose JE, Hind JE, Anderson OJ,
Brugge JE 1971. Some effects of
stimulus intensity on response of
auditory nerve fibers in the
squirrel monkey. Journal of Neuro-
physiology 24:685-699.
Ruggero MA, Rich NC. 1996.
Furosemide alters organ of Corti
mechanics: evidence for feedback
of outer hair cells upon the basi-
lar membrane. Journal of Neuro-
science 11:1057-1067.
Santos-Sacchi J. 2003. New tunes
from Corti's organ: the outer hair
cell boogie rules. Current Opinion
in Neurobiology 13:459-468.
Sento S, Ryugo OK. 1989. End-
bulbs of Held and spherical
bushy cells in cats: morphological
correlates with physiological
properties. Journal of Comparative
Neurology 280:553-562.
Simmons JA. 1989. A view of the
world through the bat's ear: the
formation of acoustic images in
echolocation. Cognition 33:
155-199.
Suga N. 1995. Processing of audi-
tory information carried by
species-specific complex sounds.
In The Cognitive Neurosciences, ed.
Gazzaniga MS. Cambridge, MA:
MIT Press, pp. 295-314.
Trussell LO. 1997. Cellular mecha-
nisms for preservation of timing
in central auditory pathways.
Current Opinion in Neurobiology
7:487-492.
Volta A. 1800. On the electricity
excited by mere contact of con-
ducting substances of dillerent
kinds. Philosophical Transactions of
the Royal Society of London 90:
403-431.
von Bekesy G. 1960. Experiments in
Hearing, ed. and trans. Wever EG.
New York: McGraw-Hill.
Zeng F-G. 2004. Trends in cochlear
implants. Trends in Amplification
8:1-34.
Zenner H-P, Gummer AW. 1996.
The vestibular system. In Compre-
REFERENCES AND RESOURCES 823
hensive Mammalian Physiology.
From Cellular Mechanisms to Inte-
gration, Vol. 1, eds. Greger R,
Windhorst U. Berlin: Springer-
Verlag, pp. 697-710.
Chapter 12
Cao Y, Mantyh P, Carlson E, Gille-
spie A, Epstein C. 1998. Primary
afferent tachykinins are required
to experience moderate to in-
tense pain. Nature 392:390-394.
Cesare P, McNaughton P. 1997. Pe-
ripheral pain mechanisms. Cur-
rent Opinion in Neurobiology 7:
493-499.
Chen R, Corwell B, Yaseen Z, Hal-
lett M, Cohen L. 1998. Mecha-
nisms of cortical reorganization
in lower-limb amputees. Journal
of Neuroscience 18(9):3443-3450.
DeFelipe C, Huerrero J, O'Brien J,
Palmer J, Doyle C. 1998. Altered
nociception, analgesia and ag-
gression in mice lacking the re-
ceptor for substance P. Nature
392:394-397.
Elbert T, Pantev C, Wienbruch C,
Rockstroh B, Taub E. 1995. In-
creased cortical representation of
the fingers of the left hand in
string players. Science 270:
305-306.
Fields H. 2004. State-dependent
opioid control of pain. Nature Re-
views Neuroscience 5(7):565-575.
Fields H, Basbaum A. 1994. Central
nervous system mechanisms of
pain modulation. In Textbook of
Pain, eds. Wall P, Melzack R. Ed-
inburgh: Churchill Livingstone,
pp. 243-257.
Garcia-Anoveros J, Corey DP. 1997.
The molecules of mechanosensa-
tion. Annual Review of Neuroscience
20:567-594.
Jenkins WM, Merzenich MM, Ochs
MT, Allard T, Guic-Robles E.
1990. Functional reorganization
of primary somatosensory cortex
in adult owl monkeys after be-
haviorally controlled tactile stim-
ulation. Journal of Neurophysiology
63:82-104.
Johnson KO. 2001. The roles and
functions of cutaneous
824 REFERENCES AND RESOURCES
mechanoreceptors. Currmt Opin-
ion in Neurobiology 11(4):455-461.
Johnson KO, Hsiao SS. 1992.
Neural mechanisms of tactile
form and texture perception. An-
nual Review of Neuroscimce 15:
227-250.
Julius D, Basbaum AL. 2001. Mole-
cular mechanisms of nociception.
Nature 413:203-210.
Kaas SH, Nelson RH, Sur M,
Merzenich MM. 1981. Organi7a-
tion of somatosensory cortex in
primates. In The Organization of
the cerebral Cortex, eds. Schmitt
FO, Worden FG, Adelman G,
Dennis SG. Cambridge, MA: MIT
Press, pp. 237-262.
Kass J. 1998. Phantoms of the
brain. Nature 391:331-333.
Loewenstein WR, Mendelson M.
1965. Components of receptor
adaptation in a Pacinian cor-
pusule. Joumal ( r Physiology
177:377-397.
Mantyh PW, Rogers SD, Honore P,
Allen BJ, Ghilardi JR. Li J.
Daughters RS, Lappi DA, Wiley
RG, Simone D. 1997. Inhibition
of hyperalgesia by ablation of
lamina I spinal neurons express-
ing the substance Preceptor. Sci-
mce 278:275-279.
Melzack R, Wall P. 1983. The Chal-
lmge of Pain. New York: Basic
Books.
Merzenich MM, Nelson RJ, Stryker
MP, Cynader MS, Schoppman A.
1984. Somatosensory cortical
map changes following digit am-
putation in adult monkeys. Jour-
nal of Comparative Neurology
224:591-605.
Meyer R, Campbell J, Raja S. 1994.
Peripheral neural mechanisms of
nociception. In Textbook (if Pain,
eds. Wall P, Melzack R. Edin-
burgh: Churchill Livingstone, pp.
13-44.
Mountcastle VB. 1997. The colum-
nar organization of the neocor-
tex. Brain 120:701-722.
Patapoutian A, Peier AM, Story
GM, Viswanath V. 2003. Ther-
moTrp channels and beyond:
mechanisms of temperature sen-
sation. Nature Reviews Neuroscimce
4:529-539.
Penfield W, Rasmussen T. 1952. The
Cerebral Cortex of Man. New York:
MacmiJIan.
Ramachandran VS. 1998. Con-
sciousness and body image:
lessons from phantom limbs,
Capgras syndrome and pain
asymbolia. Philosophical Transac-
tions ( r Royal Society London B: Bio-
logical Scimces 353( 1377):
1851-1859.
Sacks O. 1985. The Man Who Mis-
took His Wlfe for a Hat and Other
Clinical Tales. New York: Summit.
Sadato N, Pascual-Leone A, Gral-
man J, Ibanez V, Delber M-P.
1996. Activation of the primary
visual cortex by Braille reading in
blind subjects. Nature 380:
526-527.
Schmelz M, Schmidt R, Bickel A,
Hardwerker H, Torebjork H.
1997. Specific C-receptors for itch
in human skin. Joumal ( r Neuro-
scimce 17(20):8003-8008.
Schmidt RF. 1978. Fundamentals ( r
Smsory Physiology. New York:
Springer-Verlag.
Springer Sp, Deutsch G. 1989. Left
Brain, Right Brain. New York:
W. H. Freeman.
Taddese A, Nah SoY, MCCleskey E.
1995. Selective opioid inhibition
of small nociceptive neurons. Sci-
ence 270:1366-1369.
Vallbo A. 1995. Single-afferent
neurons and somatic sensation in
humans. In The Cognitive Neuro-
sciences, ed. Gazzaniga M. Cam-
bridge, MA: MIT Press, pp.
237-251.
Vallbo A, Johansson R. 1984. Prop-
erties of cutaneous mechanore-
ceptors in the human hand rc-
lated to touch sensation. Human
Neurobiology 3:3-14.
Wall P. 1994. The placebo and the
placebo response. In Textbook of
Pain, cds. Wall p, Melzack R. Ed-
inburgh: Churchill Livingstone,
pp. 1297-1308.
Woolsey TA, Van Der Loos H. ] 970.
The structural organization of
layer IV in the somatosensory re-
gion (S I) of mouse cerebral cor-
tex: the description of a cortical
field composed of discrete cytoar-
chitectonic units. Brain Research
17:205-242.
Chapter 13
Brown RH. 1995. Amyotrophic lat-
eral sclerosis: recent insights from
genetics and transgenic mice. Cell
80:687-692.
Brown T. 1911. The intrinsic factors
in the act of progression in the
mammal. Proceedings ( r the Royal
Society of London Series B
84:308-319.
Bruijn LI, Miller TM, Cleveland
DW. 2004. Unraveling the mech-
anisms involved in motor neuron
degeneration in ALS. Annual Re-
view of Neuroscience 27:723-749.
Buller A, Eccles J, Eccles R. 1960.
Interactions between motoneu-
rons and muscles in respect to
the characteristic speeds of their
responses. Journal (if Physiology
(London) 150:417-439.
Dalkilic 1, Kunkel LM. 2003. Mus-
cular dystrophies: genes to
pathogenesis. Current Opinion in
Genetics and Development 13:
231-238.
Grillner S, Ekeberg 0, El Manira A,
Lansner A, Parker D, et al. 1998.
Intrinsic lunction of a neuronal
network: a vertebrate central pat-
tern generator. Brain Research Re-
views 26: 184-197.
Henneman E, Somjen G, Carpemer
D. 1965. Functional significance
of cell size in spinal motoneu-
rons. Journal of Neurophysiology
28:560-580.
Huxley A, Niedergerke R. 1954.
Structural changes in muscle
during contraction. Interference
microscopy of living muscle fi-
bres. Nature 173:971-973.
Huxley H, Hanson J. 1954.
Changes in cross-striations of
muscle during contraction and
stretch and their structural inter-
pretation. Nature 173:973-976.
Lindstrom JM. 2000. Acetylcholine
receptors and myasthenia. lvIuscle
Nerve 23:453-477.
Loeb GE, Ghez e. 2000. The motor
unit and muscle action. In Princi-
ples of Neural Science, 4th ed, eds.
Kandel ER, Schwartz JH, Jessel
TM. New York: McGraw-Hili.
L0mo T, Westgaard R, Dahl H.
1974. Contractile properties of
muscle: control by pattern of
muscle activity in the rat. Proceed-
ings of the Royal Society of London
Series B 187:99-103.
Mendell L, Henneman E. 1968.
Terminals of single Ia fibers: dis-
tribution within a pool of 300
homonymous motor neurons.
Science 160:96-98.
Nicolle MW. 2002. Myasthenia
gravis. The Neurologist 8:2-21.
Patrick J, Lindstrom J. 1973. Au-
toimmune response to acetyl-
choline receptor. Science 180:
871-872.
Pette D. 2001. Historical perspec-
tives: plasticity of mammalian
skeletal muscle. Journal of Applied
Physiology 90: 1119-1124.
Poppe Ie R, Bosco G. 2003. Sophisti-
cated spinal contributions to mo-
tor control. Trends in Neurosciences
26:269-276.
Rowland L. 1988. Clinical concepts
of Duchenne muscular dystro-
phy: the impact of molecular ge-
netics. Brain 111:479-495.
Schouenborg J, Kiehn 0, eds.
2001. The Segerfalk symposium
on principles of spinal cord func-
tion, plasticity and repair. Brain
Research Reviews 40:1-329.
Sherrington e. 1947. The Inteqrative
Action of the Nervous System, .2nd
ed. New Haven: Yale University
Press.
Sherrington e. 1979. 1924 Linacre
lecture. In Sherrington: His Life
and Thought, eds. Eccles JC, "Gib-
son we. New York: Springer-
Verlag.
Stein PSG, Grillner S, Selverston
AI. Stuart DG, eds. 1999. Neu-
rons, Networks, and Motor Behavior.
Cambridge, MA: MIT Press.
Wallen P, Grillner S. 1994. N-
Methyl-D-aspartate receptor-
i uc d, inherent oscillatory ac-
nVlty In neurons active during
fictive locomotion in the lam-
prey. Journal of Neuroscience 7:
2745-2755.
Chapter 14
Andersen RA, Musallam S, Pesaran
B. 2004. Selecting the signals for
a brain-machine interface. Cur-
rent Opinion in Neurobiology 14:
720-726.
Blumenfeld H. 2002. Neuroanatomy
Through Clinical Cases. Sunder-
land, MA: Sinauer.
Campbell A. 1905. Histoloqical Stud-
ies on the Localization of Cerebral
Function. Cambridge, England:
Cambridge University Press.
The Cerebellum: Development,
Physiology, and Plasticity. 1998.
Trends in Neurosciences 21:367-419
(special issue).
Dauer W, Przedborski S. 2003.
Parkinson's disease: mechanisms
and models. Neuron 39:889-909.
Donoghue J, Sanes J. 1994. Motor
areas of the cerebral cortex. Jour-
nal of Clinical Neurophysiology I I:
382-396.
Donoghue JP. 2002. Connecting
cortex to machines: recent ad-
vances in brain interfaces. Nature
Neuroscience 5 (Suppl):1085-1088.
Ev.arts EV. 1973. Brain mechanisms
In movement. Scientific American
229:96-103.
Feigin A. 1998. Advances in Hunt-
ington's disease: implications for
experimental therapeutics. CUr-
rent Opinion in Neurology 11:
357-362.
Feldman RS, Meyer JS, Quenzer
LF. 1997. Parkinson's disease. In
Principles of Neuropharmacology.
Sunderland, MA: Sinauer, pp.
861-887.
Ferrier D. 1890. The Croonian lec-
tures on cerebral localisation. De-
livered before the Royal College
of Physicians, June 1890. Lon-
don: Smith Elder, 61: 1 52.
Fritsch G, Hitzig E. 1870/1960. On
the electrical excitability of the
cerebrum, trans. von Bonin G. In
Some Papers on the Cerebral Cortex
Springfield: Thomas, 1960, ,
REFERENCES AND RESOURCES 825
pp. 73-96. Originally published
in 1870.
Georgopoulos A, Caminiti R,
Kalaska J, Massey J. 1983. Spa-
tial coding of movement: a hy-
pothesis concerning the coding of
movement direction by motor
control populations. Experimental
Brain Research SuppI7:327-336.
Georgopoulos A, Kalaska J,
Caminiti R, Massey J. 1982. On
the relations between the direc-
tion of two-dimensional arm
movements and cell discharge in
primate motor cortex. JOl/rnalof
Neuroscience 2: 1527-1537.
Langston JW. 2002. Parkinson's dis-
ease: current and future chal-
lenges. Neurotoxicology 23:
443-450.
Langston JW, Palfreman J. 1995.
The Case of the Frozen Addicts. New
York: Pantheon.
Lawrence D, Kuypers H. 1968. The
functional organization of the
motor system in the monkey: I.
The effects of bilateral pyramidal
lesions. Brain 91: 1- 1 4.
Lawrence D, Kuypers H. 1968. The
functional organization of the
motor system in the monkey: II.
The effects of lesions of the de-
scending brain-stem pathways.
Brain 91:15-36.
Porter R, Lemon R. 1993. Corti-
cospinal Function and Voluntary
Movement. Oxford, England:
Clarendon Press.
Roland P, Larsen B, Lassen N, Skin-
h0f E. 1980. Supplementary mo-
tor area and other cortical areas
in organization of voluntary
movements in man. Journal of
Neurophysiology 43: 118-1 36.
Roland PE, Zilles K. 1996. Func-
tions and structures of the motor
ort ces in humans. Current Opin-
IOn 111 Neurobiology 6:773-781.
Sanes IN, Donoghue JP. 2000. Plas-
ticity and primary motor cortex.
Annual Review of Neuroscience
23:393-415.
Strange PG. 1992. Brain Biochemistry
and Brain Disorders. New York:
Oxford University Press.
826 REFERENCES AND RESOURCES
Weinrich M, Wise S. 1982. The
premotor cortex of the monkey.
Joumal of Neuroscience 2: 1329-
1345.
Wichmann T, DeLong MR. 2003.
Functional neuroanatomy of the
basal ganglia in Parkinson's dis-
ease. Advances in Neurology 91:
9-18.
Chapter 15
Aghananian GK, Marek GJ. 1999.
Serotonin and hallucinogens.
Neuropsychopharmacology 2
(Suppl): 16S-23S.
Appenzeller O. 1990. The Autonomic
Nervous System: An Introduction to
Basic and Clinical Concepts, 4th ed.
New York: Elsevier.
Carlsson A. 200 I. A paradigm shift
in brain research. Science 294:
1021-1024.
Cooper JR, Bloom FE, Roth RH.
1991. The Biochemical Basis of Neu-
ropharmacology, 6th ed. New
York: Oxford University Press.
Dahlstroem A, Fuxe K. 1964. A
method for the demonstration of
monoamine-containing nerve
fibers in the central nervous sys-
tem. Acta Physiologica Scandinavica
60:293-294.
Hofmann A. 1979. How LSD origi-
nated. Journal of Psychedelic Drugs
11:1-2.
Janig W, McLachlan EM. 1992.
Characteristics of function -spe-
cific pathways in the sympathetic
nervous system. Trends in Neuro-
sciences 15:475-481.
Kerr DS, Campbell LW, Applegate
MD, Brodish A, Landsfield PW.
1991. Chronic stress-induced ac-
celeration of electrophysiologic
and morphometric biomarkers of
hippocampal aging. Joumal of
Neuroscience 11: 1316-1324.
Kerr DS, Campbell LW, Hao S- Y,
Landsfield PW. 1989. Cortico-
steroid modulation of hippocam-
pal potentials: increased effect
with aging. Science 245: 1505-
1509.
Koob GF. 1992. Drugs of abuse:
anatomy, pharmacology and
function of reward pathways.
Trends in Pharmacological Sciences
13:177-184.
McEwen BS. 2002. Sex, stress and
the hippocampus: allostasis, allo-
static load and the aging process.
Neurobiological Aging 23(5):
921-939.
McEwen BS, Schmeck HM. 1994.
The Hostage Brain. New York:
Rockefeller University Press.
Meyer JS, Quenzer LF. 2004. psy-
chophamlacology: Drugs, the Brain,
and Behavior. Sunderland, MA:
Sinauer.
Sapolsky RM. 1994. Why Zebras
Don't Get Ulcers: A Guide to Stress,
Stress-Related Diseases, and Coping.
New York: W. H. Freeman.
Sapolsky RM, Krey LC, McEwen
BS. 1986. The neuroendocrinol-
ogy of stress and aging: the glu-
cocorticoid cascade hypothesis.
Endocrine Reviews 7:284-301.
Scharrer E, Scharrer B. 1939. Se-
cretory cells within the hypothal-
amus. Research Publications-Asso-
ciation for Research in Nen/ous and
Mental Disease 20: 179-197.
Snyder SH. 1986. Drugs and the
Brain. New York: Scientific Amer-
ican Books.
Watanabe Y, Gould E, McEwen BS.
1992. Stress induces atrophy of
apical dendrites of hippocampal
CA3 pyramidal neurons. Brain
Research 588:341-345.
Wurtman RJ, Wunman JJ. 1989.
Carbohydrates and depression.
Scientific American 260( 1 ):68-75.
Chapter 16
Berridge KC. 1996. Food reward:
brain substrates of wanting and
liking. Neuroscience and Biobehav-
ioral Reviews 20:1-25.
Berridge KC. 2004. Motivation con-
cepts in behavioral neuroscience.
Physiology & Behavior 81: 179-209.
Berridge KC Robinson TE. 1998.
What is the role of dopamine in
reward: hedonic impact, reward
learning, or incentive salience?
Brain Research Review 28:308-367.
Flier JS. 2004. Obesity wars: molec-
ular progress confronts an ex-
panding epidemic. Cell 116:
337-350.
Flier JS, Maratos-Flier E. 1998.
Obesity and the hypothalamus:
novel peptides for new pathways.
Cell 92:437-440.
Friedman JM. 1997. The alphabet
of weight control. Nature 385:
119-120.
Friedman JM. 2004. Modern sci-
ence versus the stigma of obesity.
Nature Medicine 10:563-569.
Gibson WT, Farooqui IS, Moreau
M, DePaoli AM, Lawrence E,
O'Rahilly S, Trussell RA. 2004.
Congenital leptin deficiency due
to homozygosity for the delta
133 mutation: repon of another
case and evaluation response to
four years of leptin therapy. Jour-
nal of Clinical Endocrinology and
Metabolism 89(10):4821-4826.
Heath RG. 1963. Electrical seIf-
stimulation of the brain in man.
American Joumal of Psychiatry
120:571-577.
Hoebel BG. 1997. Neuroscience and
appetitive behavior research: 25
years. Appetite 29:119-133.
Koob GF, Sanna PP, Bloom FE.
1998. Neuroscience of addiction.
Neuron 21:467-476.
Olds J, Milner P. 1954. Positive re-
inforcement produced by electri-
cal stimulation of the septal area
and other regions of the rat
brain. Journal of Comparative Phys-
iological Psychology 47:419-427.
Saper CB, Chou TC, Elmquist JK.
2002. The need to feed: homeo-
static and hedonic control of eat-
ing. Neuron 36: 199-211.
Sawchenko PE. 1998. Toward a
new neurobiology of energy bal-
ance, appetite, and obesity: the
anatomists weigh in. Joumalof
Comparative Neurology 402:
435-441.
Schultz W. 2002. Getting formal
with dopamine and reward. Neu-
ron 36:241-263.
Schwartz DH, Hernandez L, Hoebel
BG. 1990. Serotonin release in
lateral and medial hypothalamus
during feeding and its anticipa-
tion. Brain Research Bulletin 25:
797-802.
Stricker EM, Verbalis JG. 1999. Wa-
ter intake and body fluids. In
Fundamental Neuroscience, eds. Zig-
mond MJ, et ai. New York: Aca-
demic Press, pp. 1111-1125.
Wise RA. 1996. Neurobiology of
addiction. Current Opinion in Neu-
robiology 6:243-251.
Wise RA. 2004. Dopamine, learn-
ing, and motivation. Nature Re-
views Neuroscience 5:483-494.
Woods SC, Seeley RJ, Porte D,
Schwartz MW. 1998. Signals that
regulate food intake and energy
homeostasis. Science 280:1378-
1382.
Woods SC, Stricker EM. 1999. Food
intake and metabolism. In Funda-
mental Neuroscience, eds. Zigmond
MJ, et ai. New York: Academic
Press, pp. 1091-1109.
Chapter 17
Agate RJ, Grisham W, Wade J,
Mann S, Wingfield J, Schanen C,
Palotie A, Arnold AP. 2003.
Neural. not gonadal. origin of
brain sex differences in a gynan-
dromorphic finch. Proceedings of
the National Academy of Sciences
USA 100:4873-4878.
Allen LS, Richey MF, Chai YM,
Gorski RA. 1991. Sex differences
in the corpus callosum of the liv-
ing human being. Journal of Neu-
roscience II :933-942.
Alvarez-Buylla A Kirn JR. 1997.
Birth, migration, incorporation,
and death of vocal control neu-
rons in adult songbirds. Journal of
Neurobiology 33:585-601.
Amateau SK, McCarthy MM. 2004.
Induction of PGE2 by estradiol
mediates developmental mas-
culinization of sex behavior. Na-
ture Neuroscience 7:643-650.
Arnold AP. 2004. Sex chromosomes
and brain gender. Nature Reviews
Neuroscience 5:701-708.
Berne RM, Levy MN. 1998. Physiol-
ogy. St. Louis: Mosby.
Blum D. 1997. Sex on the Brain: The
Biological Differences Between Men
and Women. New York: Viking.
Breedlove SM. 1994. Sexual differ-
entiation in the human nervous
system. Annual Review of Psychol-
ogy 45:389-418.
Cola pinto J. 2001. As Nature Made
Him: The Boy Who Was Raised as a
Girl. New York: HarperColiins.
Dewing P, Shi T, Horvath S, Vilain
E. 2003. Sexually dimorphic gene
expression in mouse brain pre-
cedes gonadal differentiation.
Molecular Brain Research 118:
82-90.
Diamond J. 1997. Why Is Sex Fun?
The Evolution of Human Sexuality.
New York: Basic Books.
Fausto-Sterling A. 1992. Myths of
Gender: Biological Theories About
Women and Men. New York: Basic
Books.
Fausto-Sterling A. 2000. Sexing the
Body. New York: Basic Books.
Gilbert SF. 1994. Developmental Biol-
ogy. 4th ed. Sunderland, MA:
Sinauer.
Gould E, Woolley CS, Frankfurt M,
McEwen BS. 1990. Gonadal
steroids regulate spine density on
hippocampal pyramidal cells in
adulthood. Journal of Neuroscience
10: 1286-1291.
Hamer DH, Hu S, Magnuson VL,
Hu N, Pattatucci AM. 1993. A
linkage between DNA markers
on the X chromosome and male
sexual orientation. Science 261:
321-327.
Kimura D. 1992. Sex differences in
the brain. Scientific American 267:
119-125.
Kimura D. 1996. Sex, sexual orien-
tation and sex hormones influ-
ence human cognitive function.
Current Opinion in Neurobiology
6:259-263.
Koopman P, Gubbay J, Vivian N,
Goodfellow P, Lovell-Badge R.
1991. Male development of chro-
mosomally female mice trans-
genic for Sry. Nature 351:
117-121.
LeVay S. 1991. A difference in hy-
pothalamic structure bctween
heterosexual and homosexual
men. Science 253:1034-1037.
.
REFERENCES AND RESOURCES 827
LeVay S. 1993. The Sexual Brain.
Cambridge, MA: MIT Press.
Lim MM, Wang Z, Olazabal DE.
Ren X, Terwilliger EF, Young LJ.
2004. Enhanced partner prefer-
ence in a promiscuous species by
manipulating the expression of a
single gene. Nature 429:754-757.
Maggi A, Ciana P, Belcredito S,
Vegeto E. 2004. Estrogens in the
nervous system: mechanisms and
nonreproductive functions. An-
nual Review of Physiology 66:
291-313.
McEwen BS. 1976. Interactions be-
tween hormones and nerve tis-
sue. Scientific American 235:48-58.
McEwen BS. 1999. Permanence of
brain sex differences and struc-
tural plasticity of the adult brain.
Proceedings of the National Academy
of Sciences USA 96:7128-7130.
McEwen BS, Davis PG, Parsons BS,
Pfaff DW. 1979. The brain as a
target for steroid honnone ac-
tion. Annual Review of Neuroscience
2:65-112.
McLaren A. 1990. What makes a
man a man? Nature 346:216-217.
Morris JA, Jordan CL, Breedlove
SM. 2004. Sexual differentiation
of the vertebrate nervous system.
Nature Neuroscience 7:1034-1039.
Murphy DD, Cole NB, Greenberger
V, Segal M. 1998. Estradiol in-
creases dendritic spine density by
reducing GABA neurotransmis-
sion in hippocampal neurons.
Journal of Neuroscience 18:
2550-2559.
Nottebohm F, Arnold AP. 1976.
Sexual dimorphism in vocal con-
trol areas of the songbird brain.
Science 194:2] 1-213_
Pia us JG. 1999. Neurobiology of
sexual behavior. Current Opinion
in Neurobiology 9:751-758.
Rosenzweig MR, Breedlove SM,
Watson NY. 2005. Biological Psy-
chology, 4th ed. Sunderland, MA:
Sinauer.
Sinclair AH, Berta P, Palmer MS.
Hawkins JR, Griffiths BL, Smith
MJ. Foster JW, Frischauf AM,
Lovell-Badge R, Goodfellow PN.
1990. A gene from the human
828 REFERENCES AND RESOURCES
sex -determining region encodes a
protein with homology to a con-
served DNA-binding motif. Na-
ture 346:240-242.
Smith MS, Freeman ME, Neill JD.
1975. The control of proges-
terone secretion during the es-
trous cycle and early pseudopreg-
nancy in the rat: prolactin,
gonadotropin and steroid levels
associated with rescue of the cor-
pus luteum of pseudopregnancy.
Endocrinology 96:219-226.
Terasawa E, Timiras PS. 1968. Elec-
trical activity during the estrous
cycle of the rat: cyclical changes
in limbic structures. Endocrinology
83:207-216.
Toran-Allerand CD. 1980. Sex
steroids and the development of
the newborn mouse hypothala-
mus and preoptic area in vitro.
II. Morphological correlates and
hormonal specificity. Brain Re-
search 189:413-427.
Valente SM, LeVay S. 2003. Human
Sexuality. Sunderland, MA: Sin-
auer.
Woolley CS. 1999. Effects of estro-
gen in the CNS. Current Opinion
in Neurobiology 9:349-354.
Woolley CS, Schwartzkroin PA.
1998. Hormonal effects on the
brain. Epilepsia 39 (Suppl):S2-S8.
Woolley CS, Weiland N, McEwen
BS, Schwartzkroin PA. 1997.
Estradiol increases the sensitivity
of hippocampal CAI pyramidal
cells to NMDA receptor-mediated
synaptic input: correlation with
dendritic spine density. Journal of
Neuroscience 17:1848-1859.
Xerri C, Stern JM, Merzenich MM.
1994. Alterations of the cortical
representation of the rat ventrum
induced by nursing behavior.
Journal of Neuroscience 14: 1710-
1721.
Young LJ, Wang Z, Insel TR. 1998.
Neuroendocrine bases of
monogamy. Trends in Neurosciences
21:71-75.
Yunis lJ, Chandler ME. 1977. The
chromosomes of man-clinical
and biologic significance: a re-
view. American Journal of PatllOl-
ogy 88:466-495.
Chapter 18
Adolphs R. 2002. Neural systems
for recognizing emotion. Current
Opinion in Neurobiology 12:
169-177.
Adolphs R, Tranel D, Damasio H,
Damasio A. 1994. Impaired
recognition of emotion in facial
expressions following bilateral
damage to the human amygdala.
Nature 372:669-672.
Aggleton Jp. 1993. The contribution
of the amygdala to normal and
abnormal emotional states. Trends
in Neurosciences 16:328-33 3.
Bard P. 1934. On emotional expres-
sion after decortication with
some remarks on certain theoret-
ical views. Psychological Reviews
41:309-329.
Breiter HC, Etcoff NL, Whalen Pl,
Kennedy WA, Rauch SL, Buck-
ner RL, Strauss MM, Hyman SE,
Rosen BR. 1996. Response and
habituation of the human amyg-
dala during visual processing of
facial expression. Neuron 17:
875-887.
Broca P. 1878. Anatomie compare
de circonvolutions cerebrales. Le
grand lobe limbique et la scissure
limbique dans la serie des mam-
miferes. Revue d'Anthropologie
1:385-498.
Biichel C, Morris l, Dolan RJ, Fris-
ton KJ. 1998. Brain systems me-
diating aversive conditioning: an
event-related (MRI study. Neuron
20:947-957.
Cannon WB. 1927. The lames-
Lange theory of emotion. Ameri-
can Journal of Psychology 39:
106-124.
Dagleish T. 2004. The emotional
brain. Nature Reviews 5:582-589.
Damasio H, Grabowski T, Frank R,
Galaburda AM, Damasio AR.
1994. The return of phineas
Gage: clues about the brain fron:
the skull of a famous patient. SCI-
ence 264: l102-11 05.
Darwin C. 1872/1955. The Expres-
sion of the Emotions in Man and An-
imals. New York: The Philosophi-
cal Library, 1955. Originally pub-
lished in 1872.
Davis M. 1992. The role of the
amygdala in fear and anxiety.
Annual Review of Neuroscience
15:353-375. .
Dolan RJ. 2002. Emotion, cogm-
tion, and behavior. Science 298:
1191-1194.
Edwards DH. Kravitz EA. 1997.
Serotonin, social status and ag-
gression. Current Opinion in Neuro-
biology 7:812-819.
Flynn JP. 1967. The neural basis f
aggression in cats. In NeurophysI-
ology and Emotion. ed. Glas.s DC:
New York: Rockefeller UmversIty
Press.
Fulton lE 1951. Frontal Lobotomy
and Affective Behavior. A Neurophys-
iological Analysis. New York:
Norton.
Gallagher M, Chiba AA. 1996. The
amygdala and emotion. Current
Opinion in Neurobiology 6:
221-227.
Hamann SB, Ely TD, Grafton ST,
Kilts CD. 1999. Amygdala activity
related to enhanced memory for
pleasant and aversive stimuli. Na-
ture Neuroscience 2:289-293.
Harlow JM. 1848. Passage of an
iron rod through the head. Boston
Medical and Surgical Journal 39:
389-393.
Harlow JM. 1868. Recovery from
the passage of an iron bar
through the head. Publication of
the Massachusetts Medical Society
2:329-347.
Heisler LK, Chu HM, Brennan TJ,
Danao JA, Bajwa P, Parsons LH,
Tecott LH. 1998. Elevated anxiety
and antidepressant-like responses
in serotonin 5 - HT 1 A receptor
mutant mice. Proceedings of the
National Academy of Sciences USA
95: 15049-15054.
Hess WR. 1954. Diencephalon:
Autonomic and Extrapyramidal
Functions. New York: Grune &
Stratton.
Jacobsen CF, Wolf JB. Jackson TA.
1935. An experimental analysis
of the functions of the frontal as-
sociation areas in primates. Jour-
nal of Nervous and Mental Disease
82:1-14.
James W. 1884. What is an emo-
tion? Mind 9:188-205.
Julius D. 1998. Serotonin receptor
knockouts: a moody subject. Pro-
ceedings of the National Academy of
Sciences USA 95:15153-15154.
Kalin NH. 1993. The neurobiology
of fear. Scientific American 268:
94-101.
Kapp BS, Pascoe JP, Bixler MA.
1984. The amygdala: a neu-
roanatomical systems approach to
its contributions to aversive con-
ditioning. In Neuropsychology of
Memory, eds. Butler N, Squire LR.
New York: Guilford.
Klliver H, Bucy pe. 1939. Prelimi-
nary analysis of functions of the
temporal lobes in monkeys.
Archives of Neurology and Psychiatry
42:979-1000.
LaBar KS, Gatenby JC, Gore JC,
LeDoux JE, Phelps EA. 1998. Hu-
man amygdala activation during
conditioned fear acquisition and
extinction: a mixed-trial fMRI
study. Neuron 20:937-945.
Lange CG. 1887. Uber Gemuthsbewe-
gungen. Liepzig: T. Thomas.
LeDoux JE. 1994. Emotion, mem-
ory and the brain. Scientific Ameri-
can 270:50-57.
MacLean PD. 1955. The limbic sys-
tem ("visceral brain") and emo-
tional behavior. Archives of Neurol-
ogy and Psychiatry 73:130-134.
McGaugh JL. 2004. The amygdala
modulates the consolidation of
memories of emotionally arous-
ing experiences. Annual Review of
Neuroscience 27: 1-28.
Morris JS, Ohman A, Dolan RJ.
1998. Conscious and unconscious
emotional learning in the human
amygdala. Nature 393:467-470.
Papez JW. 1937. A proposed mech-
anism of emotion. Archives of
Neurology and Psychiatry 38:
725-743.
Pare D, Quirk GJ, LeDoux JE.
2004. New vistas on amygdala
networks in conditioned fear.
Journal of Neurophysiology 92:1-9.
Pessoa L, Ungerleider LG. 2005.
Neuroimaging studies of atten-
tion and the processing of emo-
tion-laden stimuli. Progress in
Brain Research 144: 171-182.
Pribram KH. 1954. Towards a
science of neuropsychology
(method and data). In Current
Trends in Psychology and the Behav-
ioral Sciences, ed. Patton RA. Pitts-
burgh: University of Pittsburgh
Press.
Raleigh MJ, McGuire MT, Brammer
GL, Pollack DB, Yuwiler A. 1991.
Serotonergic mechanisms pro-
mote dominance acquisition in
adult vervet monkeys. Brain Re-
search 559:181-190.
Saudou F, Amara DA, Dierich A,
LeMeur M, Ramboz S, Segu L,
Buhot M, Hen R. 1994. En-
hanced aggressive behavior in
mice lacking 5-HT 1B receptor. Sci-
ence 265:1875-1878.
Chapter 19
Bal T, McCormick DA. 1993. Mech-
anisms of oscillatory activity in
guinea-pig nucleus reticularis
thalami in vitro: a mammalian
pacemaker. Journal of Physiology
(London) 468:669-691.
Basheer R, Strecker RE, Thakkar
MM, McCarley RW. 2004.
Adenosine and sleep-wake regu-
lation. Progress in Neurobiology
73:379-396.
Berger H. 1929. Ober das elek-
troenkephalogramm des men-
schen. Archiv fUr Psychiatrie und
Nervenkrankheiten 87:527-570.
Berson DM. 2003. Strange vision:
ganglion cells as circadian pho-
toreceptors. Trends in Neurosciences
26:314-320.
Braun AR, Balkin TJ, Wesensten
NJ, Gwadry F, Carson RE, Varga
M, Baldwin P, Belenky G, Her-
scovitch P. 1998. Dissociated pat-
tern of activity in visual cortices
and their projections during hu-
man rapid eye movement sleep.
Science 279:91-95.
Brzezinski A, Vangel MG, Wurtman
RJ, Norrie G, Zhdanova I, Ben-
Shushan A, Ford L 2005. Effects
REFERENCES AND RESOURCES 829
of exogenous melatonin on sleep:
a meta-analysis. Sleep Medicine Re-
views 9:41-50.
Carskadon MA, ed. 1993. Encyclope-
dia of Sleep and Dreaming. New
York: Macmillan.
Carskadon MA, Acebo C, Jenni
OG. 2004. Regulation of adoles-
cent sleep: implications for be-
havior. Annals of the New York
Academy of Sciences 1021:276-291.
Caton R. 1875. The electric cur-
rents of the brain. British Medical
Journal 2:278.
Chemelli RM, Willie IT, Sinton CM,
Elmquist JI<, Scammell T, Lee C,
Richardson JA, Williams SC,
Xiong y, Kisanuki Y, Fitch TE,
Nakazato M, Hammer RE, Sa per
CB, Yanagisawa M. 1999. Nar-
colepsy in orexin knockout mice:
molecular genetics of sleep regu-
lation. Cell 98:437-451.
Cirelli C, Gutierrez CM, Tononi G.
2004. Extensive and divergent ef-
fects of sleep and wakefulness on
brain gene expression. Neuron
41:35-43.
Coleman RM. 1986. Wide Awake at
3:00 A.M. by Choice or by Chance?
New York: W. H. Freeman.
Czeisler CA, Duffy JF, Shanahan
TL, Brown EN, Mitchell JF,
Rimmer DW, Ronda JM, Silva EJ,
Allan JS, Emens JS, Dijk D,
Kronauer RE. 1999. Stability,
precision, and near-24-hour
period of the human circadian
pacemaker. Science 284:2177-
2181.
Dement We. 1976. Some Must Watch
While Some Must Sleep. San Fran-
cisco: San Francisco Book Com-
pany.
Edgar DM, Dement WC, Fuller CA.
1993. Effect of SCN lesions on
sleep in squirrel monkeys: evi-
dence for opponent processes in
sleep-wake regulation. Journal of
Neuroscience 13:1065-1079.
Engel AI<, Fries P, Singer W. 2001.
Dynamic predictions: oscillations
and synchrony in top-down pro-
cessing. Nature Reviews Neuro-
science 2:704-716.
830 REFERENCES AND RESOURCES
Freeman W. 1991. The physiology
of perception. Scientific American
264:78-85.
Gekakis N, Staknis D, Nguyen HB,
Davis FC, Wilsbacher LD, King
DP, Takahashi JS, Weitz CJ. 1998.
Role of the CLOCK protein in
the mammalian circadian mecha-
nism. Science 280: 1564-1568.
Greene R, Siegel J. 2004. Sleep: a
functional enigma. NeuroMolecular
Medicine 5:59-68.
Hobson JA. 1993. Sleep and
dreaming. Current Opinion in Neu-
robiology 10:371-382.
Horne JA. 1988. Why We Sleep: The
Functions of Sleep in Humans and
Other Mammals. New York: Ox-
ford University Press.
Jackson JH. 1932. Selected Writings
of John Hughlings Jackson, ed. Tay-
lor J. London: Hodder and
Stoughton.
Karni A, Tanne D, Rubenstein BS,
Akenasy JJM, Sagi D. 1994. De-
pendence on REM sleep of
overnight performance of a per-
ceptual skill. Science 265:679-682.
King Dp, Takahashi JS. 2000. Mole-
cular genetics of circadian
rhythms in mammals. Annual Re-
view of Neuroscience 23:713-742.
Lamberg L. 1994. Bodyrhythms:
Chronobiology and Peak
perfonnance. New York: Morrow.
Lin L, Faraco J, Li R, Kadotani H,
Rogers W, Lin X, Qiu X, de Jong
PJ, Nishino S, Mignot E. 1999.
The sleep disorder canine nar-
colepsy is caused by a mutation
in the hypocretin (orexin) recep-
tor 2 gene. Cell 98:365-376.
Lowrey PL, Takahashi JS. 2004.
Mammalian circadian biology:
elucidating genome-wide levels
of temporal organization. Annual
Review of Genomics and Human Ge-
netics 5:407--441.
McCarley RW, Massaquoi SG. 1986.
A limit cycle reciprocal interac-
tion model of the REM sleep os-
cillator system. American Journal
of Physiology 251:R 10 II.
McCormick DA, Bal T. 1997. Sleep
and arousal: thalamocortical
mechanisms. Annual Review of
Neuroscience 20:185-216.
McCormick DA, Contreras D. 2001.
On the cellular and network
bases of epileptic seizures. Annual
Review of Physiology 63:815-846.
Moruzzi G. 1964. Reticular influ-
ences on the EEG. Electroen-
cephalography and Clillical Nellro-
physiology 16:2-17.
Mukhametov LM. 1984. Sleep in
marine mammals. In Sleep Meclw-
11 isms, eds. Borbely AA, Valatx JL.
Munich: Springer-Verlag, pp.
227-238.
Noebels JL. 2003. The biology of
epilepsy genes. Annual Review of
Neuroscience 26:599-625.
Obal F Jr, Krueger JM. 2003. Bio-
chemical regulation of non-rapid-
eye-movement sleep. Frontiers in
Bioscience 8:520-550.
Pappenheimer JR, Koski G, Fencl V,
Karnovsky ML, Krueger J. 1975.
Extraction of sleep-promoting
factor S from cerebrospinal fluid
and from brains of sleep-deprived
animals. Journal of Neurophysiology
38:1299-1311.
Porkka-Heiskanen T, Strecker RE,
Thakkar M, Bjorkum AA, Greene
RW, McCarley RW. 1997. Adeno-
sine: a mediator of the sleep-
inducing effects of prolonged
wakefulness. Science 276: 1265-
1268.
Purves D, Augustine GJ, Fitzpatrick
D, Hall WC, LaMantia AS, Mc-
Namara JO, Williams SM. 2004.
Neuroscience, 3rd ed. Sunderland
MA: Sinauer.
Ralph MR, Foster RG, Davis FC,
Menaker M. 1990. Transplanted
suprachiasmatic nucleus deter-
mines circadian period. Science
247:975-978.
Ralph MR, Menaker M. 1988. A
mutation of the circadian system
in golden hamsters. Science 241:
1225-1227.
Scammell TE. 2003. The neurobiol-
ogy, diagnosis, and treatment of
narcolepsy. Annals of Neurology
53:154-166.
Scheffer IE, Berkovic SF. 2003. The
genetics of human epilepsy.
Trends in Pharmacological Sciences
24:428--433.
Shaw PJ, Cirelli C, Greenspan RJ,
Tononi G. 2000. Correlates of
sleep and waking in Drosophila
melanogaster. Science 287: 1834-
1837.
Siegel JM. 2004. Hypocretin
(orcxin): role in normal behavior
and neuropathology. Annual Re-
view of Psychology 55: 125-148.
Steriade M, McCormick DA,
Sejnowski TJ. 1993. Thalamocor-
tical oscillations in the sleeping
and aroused brain. Science 262:
679-685.
Thannickal TC, Moore RY, Nienhuis
R, Ramanathan L, Gulyani S,
Aldrich M, Cornford M, Siegel
JM. 2000. Reduced number of
hypocretin neurons in human
narcolepsy. Neuron 27:469--474.
Wheless JW, Castillo E, Maggio V,
Kim HL. Breier JI, Simos PG, Pa-
panicolaou AC. 2004. Magne-
toencephalography (MEG) and
magnetic source imaging (MSI).
The Neurologist 10: 138-153.
Winson J. 1993. The biology and
function of rapid eye movement
sleep. Current Opinion il1 Neurobi-
ology 3:243-248.
Yamaguchi S, Isejima H, Matsuo T,
Okura R, Yagita K, Kobayashi M,
Okamura H. 2003. Synchroniza-
tion of cellular clocks in the
suprachiasmatic nucleus. Science
302:1408-1412.
Chapter 20
Baynes K, Eliassen JC, Lutsep HL,
Gazzaniga MS. 1988. Modular
organization of cognitive systems
masked by interhemispheric inte-
gration. Science 280:902-905.
Binder JR, Frost JA, Hammeke TA,
Cox RW, Rao SM, Prieto T. 1997.
Human brain language areas
identified by functional magnetic
resonance imaging. Journal of
Neuroscience 17:353-362.
Bookeheimer S. 2002. Functional
MRI of language: new ap-
proaches to understanding the
cortical organization of semantic
processing. Annual Review of Neu-
roscience 25:51-188.
Broca P. 1861. Perte de la parole,
ramollissement chronique et de-
stmction particlle du lobe an-
terieur gauche du cerveau. Bul-
letins de la Societe d'Anthropologie
2:235-238.
Damasio AR, Damasio H. 1992.
Brain and language. Scientific
American 267:88-95.
Dehaene-Lambertz G, Dehaene S,
Hertz- Pannier L. 2002. Func-
tional neuroimaging of speech
perception in infants. Science
298:2013-2015.
Fromkin V, Rodman R. 1992. An
Introduction to Language. New
York: Harcourt Brace Jovanovich
Gardner H. 1974. The Shattered
Mind. New York: Vintage Books.
Gardner RA, Gardner B. 1969.
Teaching sign language to a
chimpanzee. Science 165:
664-672.
Gazzaniga MS. 1970. The Bisected
Brain. New York: Appleton-
Century-Crofts.
Geschwind N. 1979. Specializations
of the human brain. Scientific
American 241: 180-1 99.
Geschwind N, Levitsky W. 1968.
Human-brain: left-right asymme-
tries in temporal speech region.
Science 161:186-187.
Kuhl PK. 2004. Early language ac-
quisition: cracking the speech
code. Nature Reviews Neuroscience
5:831-843.
Lehericy S, Cohen L, Bazin B,
Samson S, Giacomini E, Rougetet
R, Hertz-Pannier L, Le Bihan D,
Marsault C, Baulac M. 2000.
Functional MR evaluation of
temporal and frontal language
dominance compared with the
Wada test. Neurology 54:
1625-1633.
Neville HJ, Bavelier D, Corina D,
Rauschecker J, Karni A, Lalwani
A, Braun A, Clark V, Jezzard P,
Turner R. 1998. Cerebral organi-
zation for language in deaf and
hearing subjects: biological con-
straints and effects of experience.
Proceedings of the National Academy
of Sciences USA 95:922-929.
Ojemann G, Mateer C. ] 979. Hu-
man language cortex: localization
of memory, syntax, and sequen-
tial motor-phoneme identification
systems. Science 205:140]-1403.
Patterson FG. ] 978. The gestures of
a gorilla: language acquisition in
another pongid. Brain and Lan-
guage 5:56-71.
Penfield W, Rasmussen T. 1950. The
Cerebral Cortex of Man. New York:
Macmillan.
Petersen SE, Fox PT, Posner MI,
Minturn M, Raichle ME. 1988.
Positron emission tomographic
studies of the cortical anatomy of
single-word processing. Nature
331 :585-589.
Pinker S. 1994. The Language
Instinct. New York: Morrow.
Posner MI, Raichle M. 1994. Images
of Mind. New York: Scientific
American Library.
Rasmussen T, Milner B. 1977. The
role of early left-brain injury in
determining lateralization of
cerebral speech functions. Annals
of New York Academy of Sciences
299:355-369.
Sadato N, Pascual-Leone A, Graf-
man J, Ibanez V, Deiber M, Dold
G, Hallett M. 1996. Activation of
the primary visual cortex by
Braille reading in blind subjects.
Nature 380:526-528.
Saffran EM. 2000. Aphasia and the
relationship of language and
brain. Seminars in Neurology
20:409-418.
Saffran JR, Aslin RN, Newport EL.
1996. Statistical learning by 8-
month-old infants. Science 274:
1926-1928.
Scott SK, Johnsrude IS. 2002. The
neuroanatomical and functional
organization of speech percep-
tion. Trends in Neurosciences
26: 100-107.
Sperry RW. 1964. The great cere-
bral commissure. Scientific Ameri-
can 210:42-52.
Vargha-Khadem F, Gadian DG,
Copp A, Mishkin M. 2005.
FOXP2 and the neuroanatomy of
REFERENCES AND RESOURCES 831
speech and language. Nature Re-
views Neuroscience 6: 131-138.
Wada JA, Clarke R, Hamm A.
1975. Cerebral hemispheric
asymmetry in humans. Cortical
speech zones in 100 adults and
100 infant brains. Archaeological
Neurology 32:239-246.
Watkins KE, Dronkers NF, Vargha-
Khadem F. 2002. Behavioural
analysis of an inherited speech
and language disorder: compari-
son with acquired aphasia. Brain
125:452-464.
Wernicke C. 1874/1977. Der apha-
sische symptomenkomplex: eine
psychologische studie auf
anatomischer basis, trans. Eggert
GH. In Wernicke's Works on Apha-
sia: A Sourcebook and Review. The
Hague: Mouton, 1977. Originally
published in 1874.
Chapter 21
Behrmann M, Geng JJ, Shomstein
S. 2004. Parietal cortex and at-
tention. Current Opinion in Neuro-
biology 14:212-217.
Brefczynski JA, DeYoe EA. 1999. A
physiological correlate of the
"spotlight" of visual attention.
Nature Neuroscience 2:370-374.
Corbetta M, Miezin FM, Dobmeyer
S, Shulman GL, Petersen SE.
1990. Attentional modulation of
neural processing of shape, color,
and velocity in humans. Science
248: 1556-1559.
Courtney SM, Ungerleider LG, Kell
K, Haxby JY. 1997. Transient and
sustained activity in a distributed
neural system for human work-
ing memory. Nature 386:
608-611.
Crick R. 1994. The Astonishing Hy-
pothesis: The Scientific Search for the
Soul. New York: Scribner's.
Fried F, MacDonald KA, Wilson CL.
1997. Single neuron activity in
human hippocampus and amyg-
dala during recognition of faces
and objects. Neuron 18:753-765.
Mesulam MM. 1999. Spatial atten-
tion and neglect: parietal. frontal
and cingulate contributions to
the mental representation and at-
832 REFERENCES AND RESOURCES
I
tentional targeting of salient ex-
trapersonal events. Philosophical
Transactions of the Royal Society of
London. Series B: Biological Sciences
1387:1325-1346.
Moore T, Armstrong KM. 2003. Se-
lective gating of visual signals by
microstimulation of frontal cor-
tex. Nature 421:370-373.
Moore T, Fallah M. 2001. Control
of eye movements and spatial at-
tention. Proceedings of the National
Academy of Sciences USA 98: 1273-
1276.
Moran J, Desimone R. 1985. Selec-
tive attention gates visual pro-
cessing in the extrastriate cortex.
Science 229:782-784.
Olfson M. 2004. New options in
the pharmacological management
of attention-deficit/hyperactivity
disorder. American Journal of Man-
aged Care 10(4 Suppl):SI17-S124.
Pessoa L, UngerJeider LG. 2004.
Neuroimaging studies of atten-
tion and the processing of emo-
tion-laden stimuli. Progress in
Brain Research 144: 171-182.
Petersen SE, Fox PT, Posner Ml,
Minturn M, Raichle ME. 1988.
Positron emission tomographic
studies of the cortical anatomy of
single-word processing. Nature
331:585-589.
Posner Ml, Petersen SE. 1990. The
attention system of the human
brain. Annual Review of Neuro-
science 13:25-42.
Posner Ml, Raichle M. 1994. Images
of Mind. New York: Scientific
American Library.
Posner Ml, Snyder CRR, Davidson
BJ. 1980. Attention and the de-
tection of signals. Journal of Ex-
perimental Psychology General
109: 160-174.
Shipp S. 2004. The brain circ l.itry
of attention. Trends in Cogmtlve
Science 8:223-230.
Treue S. 2003. Visual attention: the
where, what, how and why of
saliency. Current Opinion in Neuro-
biology 13:428-432.
Wurtz RH. Goldberg ME, Robinson
DL. 1982. Brain mechanisms of
visual attention. Scientific Ameri-
can 246:124-135.
Chapter 22
American Psychiatric Association.
2000. Diagnostic and Statistical
Manual of Mental Disorders: DSM-
lV-TR, 4th ed. Washington, DC:
American Psychiatric Association.
Andreasen NC. 1984. The Broken
Brain. New York: Harper Collins.
Andreasen NC. 2004. Brave New
Brain: Conquering Mental Illness in
the Era of the Genome. New York:
Oxford University Press.
Barondes SH. 1993. Molecules and
Mental Illness. New York: W. H.
Freeman.
Cade JFJ. 1949. Lithium salts in
the treatment of psychotic excite-
ment. Medical Journal of Australia
36:349-352.
Callicott JH. 2003. An expanded
role for functional neuroimaging
in schizophrenia. Current Opinion
in Neurobiology 13:256-260.
Codas G, Roy K, Buxbaum JD.
2004. Neuregulin l-erbB signal-
ing and the molecular/cellular
basis of schizophrenia. Nature
Neuroscience 7:575-580.
Davidson RJ, Abercrombie H.
Nitschke JB, Putnam K. 1999.
Regional brain function, emotion
and disorders of emotion. Current
Opinion in Neurobiology 9:
228-234.
Fogel BS, Schiffer RB, Rao SM: An-
derson Sc. 2000. Neuropsychiatry:
A Comprehensive Textbook. Balti-
more: Lippincott Williams &
Wilkins.
Freud S. 1920/1990. Beyond the
Pleasure Principle. New York: Nor-
[on, 1990. Originally published in
1920.
Gordon JA, Hen R. 2004. Genetic
approaches to the study of a xi-
ety. Annual Review of NeurosCience
27: 193-222.
Gottesman II. 1991. Schizophrenia
Genesis. New York: W. H. Free-
man.
Harrison PJ, Weinberger DR. 2005.
Schizophrenia genes, gene ex-
pression, and neuropathology: on
the matter of their convergence.
Molecular PsychiaTry 10:40-68.
Heuser I. 1998. The hypothalamic-
pituitary-adrenal system in de-
pression. Anna-Monika-Prize pa-
per. Pharmacopsychiatry 31:10--:13.
LeDoux DA, Levitt P. 2002. Schizo-
phrenia as a disorder of develop-
ment. Annual Review of Neuro-
science 25:409.
Lewis DA, Levitt P. 2002. Schizo-
phrenia as a disorder of neurode-
velopment. Annual Review of Neu-
roscience 25:409-432.
Liu D, Diorio J, Tannenbaum B,
Caldji C, Francis D, et al. 1997.
Maternal care, hippocampal glu-
cocorticoid receptors, and hypo-
thalamic-pituitary-adrenal re-
sponses to stress. Science 277:
1659-1662.
Malberg JE, Eisch AJ, Nestler EJ,
Duman RS. 2000. Chronic anti-
depressant treatment increases
neurogenesis in adult rat hip-
pocampus. Journal of Neuroscience
20:9104-9110.
Malizia AL, Cunningham VJ, Bell
CJ, Liddle PF, Jones T, et al.
1998. Decreased brain GABA(A)-
benzodiazepine receptor binding
in panic disorder: preliminary re-
sults from a Quantitative PET
study. Archives General Psychiatry
55:715-720.
Moghaddam B, Wolf ME, eds.
2003. Glutamate and disorders of
cognition and motivation. Annals
of the New York Academy of Sciences
1003: 1-484.
Mohn AR, Gainetdinov RR, Caron
MG, Koller BH. 1999. Mice with
reduced NMDA receptor expres-
sion display behaviors related to
schizophrenia. Cell 98:427-436.
Morris BJ, Cochran SM, Pratt JA,
2005. PCP: from pharmacology to
modelling schizophrenia. Current
Opinion in Pharmacology 5:
101-106.
Nemeroff CB. 1998. The neurobiol-
ogy of depression. Scientific Ameri-
can 278(6):42-49.
Santarelli L, Saxe M, Gross C, Sur-
get A, Battaglia F, Dulawa S,
WeIsstaub N, Lee J, Duman R,
Arancio 0, Belzung C, Hen R.
2003. Requirement of hippocam-
pal neurogenesis for the behav-
ioral effects of antidepressants.
Science 301:805-809.
Satcher D. 1999. Mental Health: A
Report of the Surgeon General.
Washington, DC: US Government
Printing Office.
Seeman P. 1980. Brain dopamine
receptors. Pharmacological Reviews
32:229-313.
Slater E, Meyer A. 1959. Contribu-
tions to a pathology of the musi-
cians. Confinia Psychiatrica 2:
65-94.
Winterer G, Weinberger DR. 2004.
Genes, dopamine and cortical sig-
nal-to-noise ratio in schizophre-
nia. Trends in Neurosciences 27:
683-690.
Wong ML, Licinio J. 2001. Re-
search and treatment approaches
to depression. Nature Reviews Neu-
roscience 2:343-351.
Zhang X, Gainetdinov RR, Beaulieu
JM, Sotnikova TD, Burch LH, et
al. 2005. Loss-of-function muta-
tion in tryptophan hydroxylase-2
identified in unipolar major de-
pression. Neuron 45:11-16.
Chapter 23
Altman J, Das GD. 1965. Autoradi-
ographic and histological evi-
dence of postnatal hippocampal
neurogenesis in rats. Journal of
Comparative Neurology 124:
319-335.
Balice-Gordon RJ, Lichtman JW.
1994. Long-term synapse loss in-
duced by focal blockade of post-
synaptic receptors. Nature 372:
519-524.
Bear ME 2003. Bidirectional
synaptic plasticity: from theory
to reality. Philosophical Transac-
tions of the Royal Society of London
Series B: Biological Sciences 358:
649-655.
Bear MF, Huber KM, Warren ST.
2004. The mGluR theory of frag-
ile X mental retardation. Trends in
Neurosciences 27:370-377.
Bear ME Kleinschmidt A Gu Q,
Singer W. 1990. Disruption of ex-
perience-dependent synaptic
modifications in striate cortex by
infusion of an NMDA receptor
antagonist. Journal of Neuroscience
10:909-925.
Bear MF, Rittenhouse CD. 1999.
Molecular basis for ocular domi-
nance plasticity. Journal of Neuro-
biology 41 :83-91.
Bear ME Singer W. 1986. Modula-
tion of visual cortical plasticity by
acetylcholine and noradrenaline.
Nature 320:] 72-176.
Bourgeois J, Rakic P. 1993.
Changes of synaptic density in
the primary visual cortex of the
macaque monkey from fetal to
adult stage. Journal of Neuroscience
13:2801-2820.
Dudek SM, Bear ME 1989. A bio-
chemical correlate of the critical
period for synaptic modification
in the visual cortex. Science
246:673-675.
Fixsen W, Sternberg P. Ellis H,
Horvitz R. 1985. Genes that af-
fect cell fates during the develop-
ment of Caenorhabditis elegans.
Cold Spring Harbor Symposium on
Quantitative Biology 50:99-104.
Ghosh A Carnahan J. Greenberg
M. 1994. Requirement for BDNF
in activity-dependent survival of
cortical neurons. Science 263:
1618-1623.
Goda y, Davis GW. 2003. Mecha-
nisms of synapse assembly and
disassembly. Neuron 40:243-264.
Goldberg JL, Barres BA. 2000.
Nogo in nerve regeneration. Na-
ture 403:369-370.
Goodman CS, Shatz CJ. 1993.
Developmental mechanisms that
generate precise patterns of
neuronal connectivity. Cell 72
(Suppl):77-98.
Gould E, Reeves AJ, Graziano
MSA Gross CG. 1999. Neurogen-
esis in the neocortex of adult pri-
mates. Science 286:548-552.
Harris WC, Holt CEo 1999. Slit, the
midline repellent. Nature 398:
462-463.
Hebb DO. 1949. Organization of Be-
havior. New York: Wiley.
REFERENCES AND RESOURCES 833
Herbert MR, Ziegler DA Deutsch,
CK, O'Brien LM, Lange N,
Bakardjiev A Hodgson J, Adrien
KT, Steele S, Makris N, Kennedy
D. Harris GJ, Caviness VS Jr.
2003. Dissociations of cerebral
cortex, subcortical and cerebral
white matter volumes in autistic
boys. Brain 126: II82-1192.
Heynen AJ, Yoon BJ, Liu CH,
Chung HJ, Huganir RL, Bear ME
2003. Molecular mechanism for
loss of visual responsiveness fol-
lowing brief monocular depriva-
tion. Nature Neuroscience 6:
854-862.
Honda T, Tabata H, Nakajima K.
2003. Cellular and molecular
mechanisms of neuronal migra-
tion in neocortical development.
Seminars in Cellular and Develop-
mental Biology 14:169-174.
Huang ZJ, Kirkwood A Pizzorusso
T, Porciatti V, Morales B, Bear
ME Maffei L, Tonegawa S. 1999.
BDNF regulates the maturation
of inhibition and the critical pe-
riod of plasticity in mouse visual
cortex. Cell 98:39-55.
Katz LC, Crowley Jc. 2002. Devel-
opment of cortical circuits: les-
sons from ocular dominance
columns. Nature Reviews Neuro-
science 3 ( 1): 34-42.
Katz LC, Shatz CJ. 1996. Synaptic
activity and the construction of
cortical circuits. Science 274:
1133-1138.
Kempermann G, Gage FH. 1999.
New nerve cells for the adult
brain. Scientific American 280:
48-53.
Kempermann G, Wiskott L, Gage
FH. 2004. Functional significance
of adult neurogenesis. Current
Opinion in Neurobiology 14:
186-191.
Kennedy T, Serafini T, Torre JDL,
Tessier-Lavigne M. 1994. Netrins
are diffusible chemotropic factors
for commissural axons in the
embryonic spinal cord. Cell 78:
425-435.
Law Ml, Constantine-Paton M.
1981. Anatomy and physiology
of experimentally produced
834 REFERENCES AND RESOURCES
striped tecta. Journal of Neuro-
science 1(7):741-759.
LeVay S, Stryker Mp, Shatz CJ.
1978. Ocular dominance columns
and their development in layer
IV of the cat's visual cortex: a
Quantitative study. Journal of
Comparative Neurology 179:
223 244.
Levi-Montalcini R, Cohen S. 1960.
Effects of the extract of the
mouse submaxillary salivary
glands on the sympathetic system
of mammals. Annals of the New
York Academy of Sciences 85:
324-341.
Liao D, Zhang X, O'Brien R, Ehlers
MD, Huganir RL. 1999. Regula-
tion of morphological postsynap-
tic silent synapses in developing
hippocampal neurons. Nature
Neuroscience 2:37-43.
McConnel SK. 1995. Constructing
the cerebral cortex: neurogenesis
and fate determination. Neuron
15:761-768.
McLaughlin T, O'Leary DDM. 2005.
Molecular gradients and develop-
ment of retinotopic maps. Annual
Review of Neuroscience 28:
327-355.
Meister M, Wong R, Baylor D,
Shatz C. 1991. Synchronous
bursts of action potentials in gan-
glion cells of the developing
mammalian retina. Science 252:
939-943.
Mioche L, Singer W. 1989. Chronic
recordings from single sites of
kitten striate cortex during expe-
rience-dependent modifications
of receptive-field properties. Jour-
nal of Neurophysiology 62: 185-197.
Mower GD. 1991. The effect of
dark rearing on the time course
of the critical period in cat visual
cortex. Developmental Brain Re-
search 58: 151-158.
National Institute of Mental Health.
http://www.nimh.nih.gov.
publicattautism.cfm.
Paton JA, Nottebohm FN. 1984.
Neurons generated in the adult
brain are recruited into func-
tional circuits. Science 225:
1046-1048.
Richardson PM, McGuinness UM,
Aguayo AJ. 1980. Axons from
CNS neurons regenerate into
PNS grafts. Nature 284:264-265.
Ross SE, Greenberg ME, Stiles CD.
2003. Basic helix-loop-helix fac-
tors in cortical development. Neu-
ron 39:13-25.
Schlagger BL, O'Leary DD. 1991.
Potential of visual cortex to de-
velop an array of functional units
unique to somatosensory cortex.
Science 252: 1556-1560.
Sperry R. 1963. Chemoaffinity in
the orderly growth of nerve fiber
patterns and connections. Proceed-
ings of the National Academy of Sci-
ences USA 4:703-710.
Tessier-Lavigne M, Goodman CS.
1996. The molecular biology of
axon guidance. Science 274:
1123-1133.
Walsh C, Cepko C. 1992. Wide-
spread dispersion of neuronal
clones across functional regions
of the cerebral cortex. Science
255:434.
Whitford KL, Pijkhuizen P, Polleux
F, Ghosh A. 2002. Molecular
control of cortical dendrite devel-
opment. Annual Review of Neuro-
science 25:127-149.
Wiesel T. 1982. Postnatal develop-
ment of the visual cortex and the
influence of the environment.
Nature 299:583-592.
Wiesel TN, Hubel DH. 1963. Single-
cell responses in striate cortex of
kittens deprived of vision in one
eye. Journal of Neurophysiology
26:1003-1017.
Chapter 24
Baddeley A. 2003. Working mem-
ory: looking back and looking
forward. Nature Revielvs Neuro-
science 4:829-839.
Burkholder JM. 1999. The lurking
perils of pfiesteria. Sdentific Ameri-
can 281:42-49.
Cohen NJ, Eichenbaum H. 1993.
Memory, Amnesia, and the Hip-
pocampal System. Cambridge, MA:
MIT Press.
Corkin S. 2002. What's new with
the amnesic patient H.M.? Na-
ture Reviews Neuroscience 3:
153-160.
Courtney SM, Ungerleider LG, Kell
K. Haxby JV. 1997. Transient and
sustained activity in a distributed
neural system for human work-
ing memory. Nature 386:608-
611.
Desimone R. Albright TD, Gross
CG, Bruce C. 1984. Stimulus-
selective properties of inferior
temporal neurons in the
macaque. Journal of Neuroscience 4:
2051-2062.
Eichenbaum H. 2000. A cortical-
hippocampal system for declara-
tive memory. Nature Reviews Neu-
roscience 1:41-50.
Eichenbaum H, Dudchenko P,
Wood E, Shapiro M, Tanila H.
1999. The hippocampus, mem-
ory, and place cells: is it spatial
memory or a memory space?
Neuron 23:209-226.
Eichenbaum H, Fagan H. Mathews
p, Cohen NJ. 1988. Hippocampal
system dysfunction and odor dis-
crimination learning in rats: im-
pairment or facilitation depend-
ing on representational demands.
Behavioral Neuroscience 102:
331-339.
Fried F, MacDonald KA, Wilson
CL. 1997. Single neuron activity
in human hippocampus and
amygdala during recognition of
faces and objects. Neuron 18:
753-765.
Fuster JM. 1973. Unit activity in
prefrontal cortex during delayed-
response performance: neuronal
correlates of transient memory.
Journal of Neurophysiology 36:
61-78.
Fuster JM. 1995. Memory in the
Cerebral Cortex. Cambridge, MA:
MIT Press.
Gauthier I. Skularski P, Gore JC,
Anderson AW. 2000. Expertise
for cars and birds recruits brain
areas involved in face recogni-
tion. Nature Neuroscience 3:
191-197.
Gnadt JW, Andersen RA. 1988.
Memory related motor planning
activity in posterior parietal cor-
tex of macaque. Experimental
Brain Research 70:216-220.
Goldman-Rakic P. 1992. Working
memory and the mind. Scientific
American 267: 111-11 7.
Grattan LM, Oldach D, Perl TM,
Lowitt MH, Matuszak DL, Dick-
son C, Parrott C, Shoemaker RC,
Kauffman CL, Wasserman Mp,
Hebel JR, Charache p, Morris JG.
1998. Learning and memory dif-
ficulties after environmental ex-
posure to waterways containing
toxin-producing Pfiesteria or Pfies-
teria-like dinoflagellates. Lancet
352:532-539.
Haxby JV, Petit L, Ungerleider LG,
Courtney SM. 2000. Distinguish-
ing the functional roles of multi-
ple regions in distributed neural
systems for visual working mem-
ory. Neuroimage 11:380-391.
Hebb DO. 1949. The Organization of
Behavior: A Neuropsychological The-
ory. New York: Wiley.
Jog MS, Kubota y, Connolly CI,
HiIlegaart, Graybiel AM. 1999.
Building neural representations
of habits. Science 286:1745-1749.
Kauffman CL, Wasserman MP,
Hebel JR, Charache P, Morris JG.
1998. Learning and memory dif-
ficulties after environmental ex-
posure to waterways containing
toxin-producing ffiesteria or Pfies-
teria-like dinoflagellates. Lancet
352:532-539.
Knowlton BJ, Mangels JA, Squire
LR. 1996. A neostriatal habit
learning system in humans. Sci-
ence 273:1399-1402.
Lashley KS. 1929. Brain Mechanisms
and Intelligence. Chicago: Univer-
sity of Chicago Press.
Luria A. 1968. The Mind of a
Mnemonist. Cambridge, MA: Har-
vard University Press.
Maguire EA, Burgess N, Donnett
JG, Frackowiak RS, Frith CD,
O'Keefe J. 1998. Knowing where
and getting there: a human navi-
gation network. Science 280:
921-924.
Mishkin M, Appenzeller T. 1987.
The Anatomy of Memory.
Scientific American 256:80-89.
Morris RGM. 1984. Developments
of a water-maze procedure for
studying spatial learning in the
rat. Journal of Neuroscience
Methods 11:47-60.
O'Keefe JA. 1979. Place units in
the hippocampus of the freely
moving rat. Experimental Neurol-
ogy 51:78-109.
O'Keefe JA, Nadel L. 1978. The Hip-
pocampus as a Cognitive Map. Lon-
don: Oxford University Press.
Olton DS, Samuelson RJ. 1976. Re-
membrance of places passed: spa-
tial memory in rats. Journal of Ex-
perimental Psychology 2:97-116.
Passingham D, Sakai K. 2004. The
prefrontal cortex and working
memory: physiology and brain
imaging. Current Opinion in Neuro-
biology 14:163-168.
Penfield W. 1958. The Excitable Cor-
tex in Conscious Man. Liverpool:
Liverpool University Press.
Rolls ET, Baylis GC, Hasselmo ME,
Nalwa V. 1989. The effect of
learning on the face selective re-
sponses of neurons in the cortex
in the superior temporal sulcus
of the monkey. Experimental Brain
Research 76: 153-164.
Scoville WB, Milner B. 1957. Loss
of recent memory after bilateral
hippocampal lesions. Journal of
Neurology, Neurosurgery, and P ychi-
atry 20: 11-21.
Squire LR. 1987. Memory and Brain.
New York: Oxford University
Press.
Squire LR, Stark CEL, Clark RE.
2004. The medial temporal lobe.
Annual Review of Neuroscience
27:279-306.
Wilson MA, McNaughton BL. 1993.
Dynamics of the hippocampal en-
semble code for space. Science
261:1055-1058.
Zola-Morgan S, Squire LR, Amaral
DG, Suzuki WA. 1989. Lesions of
perirhinal and para hippocampal
cortex that spare the amygdala
and hippocampal formation pro-
duce severe memory impairment.
Journal of Neuroscience 9:4355-
4370.
REFERENCES AND RESOURCES 835
Chapter 25
Bailey CH, Kandel ER. 1993. Struc-
tural changes accompanying
memory storage. Annual Review of
Neuroscience 55:397-426.
Bear ME 1996. A synaptic basis for
memory storage in the cerebral
cortex. Proceedings of the National
Academy of Sciences USA 93:
13453-13459.
Bear MF, Malenka RC. 1994.
Synaptic plasticity: LTP and LTD.
Current Opinion in Neurobiology
4:389-399.
Bienenstock EL, Cooper LN, Munro
PW. 1982. Theory for the devel-
opment of neuron selectivity: ori-
entation specificity and binocular
interaction in visual cortex. Jour-
nal of Neuroscience 2:32-48.
Bliss TVp, Collingridge GL. 1993. A
synaptic model of memory: long-
term potentiation in the hip-
pocampus. Nature 361:31-39.
Bredt DS, Nicoll RA. 2003. AMPA
receptor trafficking at excitatory
synapses. Neuron 40:361-379.
Carew TJ, Sahley CL. 1986. Inver-
tebrate learning and memory:
from behavior to molecules. An-
nual Review of Neuroscience 9:
435-487.
Castellucci VF, Kandel ER. 1974. A
quantal analysis of the synaptic
depression underlying habitua-
tion of the gill-withdrawal reflex
in Aplysia. Proceedings of the Na-
tional Academy of Sciences USA
77:7492-7496.
Chen, WR, Lee S, Kato K, Spencer
DD, Shepherd GM, Williamson
A. 1996. Long-term modifications
of synaptic efficacy in the human
inferior and middle temporal cor-
tex. Proceedings of the National
Academy of Sciences USA 93:
8011-8015.
Colledge M, Snyder EM, Crozier
RA, Soderling JA, Jin Y, Lange-
berg LK, Lu H, Bear ME Scott
JD. 2003. Ubiquitination regu-
lates PSD-95 degradation and
AMPA receptor surface expres-
sion. Neuron 40:595-607.
Davis HP, Squire LR. Protein syn-
thesis and memory. 1984. Psycho-
logical Bulletin 96:518-559.
836 REFERENCES AND RESOURCES
Dudai Y, Jan YN, Byers D, Quinn,
WG, Benzer S. 1976. Dunce, a
mutant of Drosophila deficient in
learning. Proceedings of the Na-
tional Academy of Sciences USA
73:1684-1688.
Ezzeddine Y, Glanzman DL. 2003.
Prolonged habituation of the gill-
withdrawal reflex in Aplysia de-
pends on protein synthesis, pro-
tein phosphatase activity, and
postsynaptic glutamate receptors.
Joumal of Neuroscience 23:9585-
9589.
Grant SGN, Silva AJ. 1994. Target-
ing learning. Trends in Neuro-
sciences 17:7]-75.
Greenough WT, Bailey CH. 1988.
The anatomy of memory: con-
vergence of results across a diver-
sity of tests. Trends in Neurosciences
11:142-147.
Ito M. 1982. Experimental verifica-
tion of Marr-Albus' plasticity as-
sumption for the cerebellum. Acta
Biology 33:189-199.
Kandel ER. 1970. Nerve cells and
behavior. Scientific American
223:57-67.
Kandel ER. 200 I. The molecular
biology of memory storage: a dia-
logue between genes and
synapses. Science 294: I 030-1 038.
Levy WB, Steward O. ] 983. Tem-
poral contiguity requirements for
long-term associative potentia-
tion/depression in the hippocam-
pus. Neuroscience 8:791-797.
Linden DJ, Connor JA. 1993. Cel-
lular mechanisms of long-term
depression in the cerebellum.
Current Opinion in Neurobiology
3:401-406.
Lisman J, Schulman H, Cline H.
2002. The molecular basis of
CaMKII function in synaptic and
behavioural memory. Nature Re-
views Neuroscience 3: 175-190.
Lisman JE, Fallon JR. 1999. What
maintains memories? Science
283:339-340.
Lynch G, Baudry M. 1984. The bio-
chemistry of memory: a new and
specific hypothesis.
Malenka RC, Bear ME 2004. LTP
and LTD: an embarrassment of
riches. Neuron 44:5-21.
Malinow R. 2003. AMPA receptor
trafficking and long-term potenti-
ation. Philosophical Transactions
of the Royal Society of London
Series B: Biological Sciences 358:
707-714.
Markram H, Lubke J, Frotscher M,
Sakmann B. 1997. Regulation of
synaptic efficacy by coincidence
of postsynaptic APs and EPSPs.
Science 275:213-215.
Marr D. 1969. A theory of cerebel-
lar cortex. Joumal of Physiology
202:437-470.
Morris RGM, Anderson E, Lynch
GS, Baudry M. 1986. Selective
impairment of learning and
blockade of long-term potentia-
tion by an N-methyl-o-aspartate
receptor antagonist, AP5. Nature
319:774-776.
Pavlov IP. 1927. Conditioned Reflexes:
An Investigation of The Physiological
Activity of the Cerebral Cortex. Lon-
don: Oxford University Press.
Roberts AC, Glanzman DL. 2003.
Learning in Aplysia: looking at
synaptic plasticity from both
sides. Trends in Neurosciences
26:662-670.
Schwartz JH. 1993. Cognitive ki-
nases. Proceedings of the National
Academy of Sciences USA 90:
8310-8313.
Silva AJ, Paylor R, Wehner JM,
Tonegawa S. 1992. Impaired spa-
tiallearning in alpha-calcium-
calmodulin kinase II mutant
mice. Science 257:206-211.
Silva AJ, Stevens CF, Tonegawa S,
Wang y. 1992. Deficient hip-
pocampal long-term potentiation
in alpha-calcium-calmodulin ki-
nase II mutant mice. Science
257:201-206.
Tang Yp, Shimizu E, Dube GR,
Rampon C, Kerchner GA, Zhuo
M, Liu G, Tsien JZ. 1999. Genetic
enhancement of learning and
memory in mice. Nature 401:
63-69.
Thompson RF, Krupa DJ. 1994. Or-
ganization of memory traces in
the mammalian brain. Annual Re-
view of Neuroscience 17:519-549.
Thorndike EL. 1911. Animal Intelli-
gence: Experimental Studies. New
York: Macmillan.
Tsien JZ, Huerta PT, Tonegawa S.
1996. The essential role of hip-
pocampal CAI NMDA receptor-
dependent synaptic plasticity in
spatial memory. Cell 87: 1327-
1338.
Yin JC, Tully T. 1996. CREB and
the formation of long-term mem-
ory. Current Opinion in Neurobiol-
ogy 6:264-268.
Note: Page numbers in italics refer to figures;
those followed by band t refer to boxes and
tables. respectively.
A
Al (primary auditory cortex). 348,348, 372,
373
Aa fibers. 393
Abducens nerve, 232. 233
AI3 fibers, 393. 393-394, 397
Absence seizure, 593. 594
Absolute refractory period, 80. 91
Absorption, light, 280, 280
Abuse, child, affective disorders and, 676
Accessory olfactory system. 264b
Accommodation, 284, 284. 286
Acetylcholine (ACh). 103b. lI2. 112. See also
Cholinergic entries
in autonomic function, 496-497
chemistry, 142. 142-143. 143
in muscle contraction, 428
AcetylchoJine-gated ion channel, 117, 120b,
122
Acetylcholine receptors
muscarinic. 139. 497
in myasthenia gravis, 442b
nicotinic, L22, 139. 152. /53.497
Acetylcholinesterase, 119-120, 143, 143
Achromatopsia.. 336
Acoustic radiation, 372
ACTH (adrenocorticotropic hormone),
488-489, 488t, 490, 668. 669
Actin, 35. 38. 434-435. 436
Action potential. 52-53, 76-98
conduction, 93. 93-97
firing frequency, 79, 79
generation, 76-77
ins and outs, 82, 83
membrane currents and conductances,
80-82,81
multiple, 77-80. 79
properties, 76-80
recording methods, 76, 77
spike-initiation zone, 97, 98
summary of key properties, 91-93, 92
theory, 80-82
ups and downs, 76. 77
voltage-gated potassium channel, 91
voltage-gated sodium channel. 84-89.
85--f57
Activation-synthesis hypothesis of sleep,
601
Activational effect, sex hormone, 551, 552b,
553-558, 555-557, 558b-559b
Active zone, 106. 106
Activity-dependent brain development,
708-716. 709
Adaptation
dark. 296. 298
light, 298
neuronal. 99b
olfactory, 267
Pacinian corpuscle, J91, 391-392
thermoreceptors, 420. 420
Addiction, 506-507, 526b
Ao fibers, 393.412,412.421
Adenosine, sleep promotion and, 606
Adenosine triphosphate (ATP)
neurotransmitter properties, 140t.
147-148
in pain transduction. 408. 411
production. 35
Adenosine triphosphate (ATP) receptors,
148. 154
Adenylyl cyclase. 129, 129. 161. 161-162
in classical conditioning in Aplysia, 770,
770t, 771
in sensitization of gill-withdrawal reflex
in Aplysia. 767, 768
Adiposity. See Body fat
Adolphs. Ralph. 574
Adrenal cortex, 488
Adrenal hyperplasia, congenitaL, 551
Adrenal medulla. 488
Adrenaline. See Epinephrine
Adrenocorticotropic hormone (ACTH),
488-489, 488t. 490. 668. 669
Affective aggression, 564. 577, 580
Affective disorders, 673-679
in artists, 675b
biological bases, 674, 676
description, 673-674
diathesis-stress hypothesis, 676
monoamine hypothesis, 674, 676
treatment, 677-679. 678. 679
Affective neuroscience, 564
Afferent axons. 173
from muscle. 393, 438-439, 443
from skin. 392-394,393
Afferent pain regulation, 416, 417
Al"ter-hyperpolarization, 76, 77
Ageusia. 262
Aggression
affective. 564. 577, 580
amygdala and, 576-578, 578b
hypothalamus and. 579. 579-580. 580
midbrain and, 580-581. 581
predatory, 577, 580
seroronin and. 581-582
surgery to reduce, 577-578. 578b
Agnosia. 407
Agoraphobia. 666. 666t
with panic disorder. 666, 667b
Agrammatism, 622
Agrin, 702, 704
AgRP (agouti-related peptide), 516, 517.
518. 519t
Albus. James, 773-774
AlcohoL anxiolytic effects. 671
Alertness, circadian rhythm and, 608
"All-or-none" action potentials. 77
Allen. Laura. 547
Alpha-melanocyte-stimulating hormone.
515. 516,517. 519t
INDEX
Alpha motor neurons, 428-430, 429. 430,
441
Alpha rhythms, 589. 590
Alzheimer's disease, 19, 19t, 36b-37b, 156b
Amacrine cell. 288-289, 289. 300
Amblyopia.. 285b
American Sign Language, 627, 627.
636b--637b
Amiloride-sensitive sodium channel. 256.
257, 257
Amine neurotransmitters, 111. III t, 112
release, 113-114, II4
synthesis and storage, 112-113, II3
Amino acid neurotransmitters, Ill, III t.
Il2
release. 113-114. 114
synthesis and storage, 112-113, 113
Amino acid (umani) taste, 253, 259,259
Amino acidergic neurons, 146-147, 147
Amino acids, 31, 56. 56-57
Ammon's horn, 777, 777
Amnesia, 729-730, 730
after diencephalon lesions, 743-744
after temporal lobectomy, 738-740, 739
animal model, 741,741-743,742
in Korsakoff's syndrome. 744
from neurotoxins, 731b
procedural memory and. 753. 753-754
from trauma, 730, 730
types, 729-730
AMPA-gated channels. 154
AMPA receptors. 139.140. 154. 155. 717.
718, 719,720, 721
in cerebellar long-term depression, 775,
775
in hippocampal long-term depression,
782. 782-783
in hippocampal long-term potentiation,
780, 781
trafficking, egg carton model. 783-784.
784
Amphetamine, 505-507, 506
Amplification. signal, in phototransduction,
295
Amplifier. cochlear, 361, 361-363, 362b
Amplitude, electromagnetic radiation, 279,
279
Ampulla, 380. 381
Amputee, phantom limb sensations,
405-406,406b
Amygdala, 212, 221
aggression and, 576-578, 578b
anatomy, 572-573, 573
emotion and, 572-578
fear and, 573-576,574. 575. 576b
food palatability and, 262
regulation of HPA axis by. 669. 669-670,
670
Amygdalecromy, 577-578
Amyloid, 37b
Amyotrophic lateral sclerosis. 156b, 432b
Anabolism, 511, 512
Analgesia, capsaicin for, 410b
838 INDEX
Anandamide, 149b
Anatonllcal planes, 170, /70
Androgen, 538, 538
in aggression, 577
in brain masculinization, 549
Androgen insensitivity, 551
Anencephaly, 182b, 183b
Anesthesia, local, 95b
Angiotensin I. 486--487, 487
Angiotensin II, 487, 487
Angiotensinogen, 486, 487
Angular acceleration, 380
Angular gyrus, 625, 625
Animal language, 619b
Animal models, 11-12, /2
Animal research, 16-] 9, 18
Animal rights, 17-19, /8
Animal welfare, 17, 18
Anion, 54
Anion mhibition, in taste transduction, 256
Anode, 60, 60
Anomalous trichromatic vision, 297b
Anomia, 622
Anomic aphasia, 622t
Anorectic peptides, 515, 516, 5/7, 519t
Anorexia nervosa, 514, 5/5, 527
Anosmia, 266
ANS. See AutonomIC nervous system (ANS)
Antagonist muscle, 426
Anterior, 168, 170
Anterior cerebral artery, 234, 235
Anterior communicating artery, 234
Anterior pituitary, 487--489, 488t, 489, 490
Anterograde amnesia, 730, 730
Anterograde transport, 41, 4/
Antibiotics, deafness from, 363
Antibodies, 135-136. 136
Anticonvulsants, 593
Antidepressants, 677-679, 678. 679
Antidiuretic hormone (ADH). See Vasopressin
Antidromic conduction, 93-94
Antipsychotic drugs, 682-683, 683. 684
Anxiety disorders, 665-672
biological bases, 667-670, 668-670
description, 665-666, 666t
treatment, 670-672, 67/. 672
Anxiolytic drugs, 670-672, 671, 672
Aphasia, 618. 620
in bilinguals and the deaf. 627. 627-628
types, 621-628, 622t
and Wernicke-Geschwind model. 625.
625-626
Apical dendrites, 195
Apical end, taste cell, 254. 255
Ap/ysia gill-withdrawal reflex, 765. 765
classical conditioning, 768-771, 770.770t,
77/
habituation, 766. 766-767, 767
sensitization. 767-768, 767-769
Apoptosis, 707
Appetite
feeding behavior and, 519-522, 520-522
regulation, seroronin in, 499b
Apraxia, 463
Aqueous humor, 282, 283
Arachnoid membrane, 173, 174
Arcuate fasciculus, 625, 625
Arcuate nucleus, 515. 516.5/7
Area I, 401.40/
Area 2, 401. 40/
Arca 3b, 40 I. 40/
Area 4. See Primary motor cortex
Area 5,461
Area 6, 460. 461. 462--464, 463
Area 7. 461
Area 17. See Striate cortex
Area IT, 333. 334.336-137, 337
Area LIP. 757, 757, 758
Area MST. 333, 334. 335
Area MT, 333. 334. 334-335
Area V I. See Striate cortex
Area V4, 333, 334. 336, 655, 656, 656
Areflexia, 456b
Aristotle, 5
Aromatase, 538, 538
An, vision and. 331 b
Artists, affective disorders in, 675b
Ascending pain pathways. 413--415. 414-4/6
Ascending reticular activating system. 50 I.
602-603, 603
Ascending sensory pathways, 229
Ascending somatic sensory pathways, 414,
4/5
Aserinsky, Eugene, 595
Aspinous neuron, 46
Association areas of cortex. 199. 210
Associative learning, 763-765, 764
in Aplysia, 768-77 1, 770. 770t, 77/
Astereognosia, 407
Astigmatism, 286b
Astrocyte. 46--47, 47
diflerentiation, 696
potassium spatial buflering, 71. 7/
sources, 693, 694
Asymmetrical synapse, /09, 109
Ataxia, 472
Athetosis. 475b
Atonia, 596
ATP. See Adenosine triphosphate (ATP)
Atrophy, muscle, 431, 456b
Atropine, 139, 497
AItemion, 643-659
area V4 and. 655, 656, 656
behavIOral consequences. 645-649,
646-648
cortical and subcortical modulation,
656-658, 657. 658
effect on detection, 645-646. 646
effect on reaction time, 647, 647
eye movements and. 657. 657-658. 658
to features, 651,65/.652
to location. 649. 650
in neglect syndrome, 647-649, 648
neuronal correlates, 648, 652. 652-656,
653b, 655. 656
physiological eflects, 649-656
posterior parietal cortex and, 648, 652,
652-654, 653b, 655
pulvinar nucleus and, 657, 657
Attention-deficit/hyperactivity disorder. 644b
Attenuation reflex, auditory, 350, 350
Aubertin, Simon Alexandre Ernest, 620
Audition, 344
Auditory canal. 347, 347
Auditory cortex, 210, 372-375
lesion and ablation efleers, 374-375. 376b
neuronal response properties. 373.
373-374, 374b-375b
primary, 348. 348. 372. 373
Auditory nerve, 354, 355. 356, 359, 359
phase locking. 367, 367-368
response properties, 365, 365
Auditory pathways, 363- 365. 364. 365
Auditory receptor cells. See Hair cells
Auditory system. See also Ear
attenuation reflex, 350, 350
central pathways. 363-365. 364. 365
cochlear anatomy and physiology,
351-363. See also Cochlea
disorders, 376b
and nature of sound, 344-346, 345, 346b
sound localization mechanisms, 368-372
horizontal plane, 368-371,368-37/
vertical plane. 371-372, 372
stimulus frequency encoding, 366,
366-368,367
stimulus intensity encoding, 365, 365-366
structure, 347, 347-348, 348
tonotopic maps, 366. 366-367, 373, 373
Auditory-vestibular nerve, 232, 233, 354
Auerbach's plexus, 495, 495
Aura, in partial seizure. 593
Autism. 706b
Autoimmune disease, 438b, 442b
Autonomic ganglia. 492
Autonomic nervous system (ANS), 173,
230 231,490--497
central control. 496
circuits, 491--496, 492. 493, 495
divisions, 230, 490--491, 492-496. 493,
495
postganglionic neurotransmitters, 492. 492.
493. 497
preganglionic neurotransmitters. 492, 492.
493,494,496-497
AUlOphosphorylating protein kinase. 788,
789b
Autoradiography, 137. /37,322, 322
Auwreceptor, 119
Autosomes. 535
Autostereograms, 339b
Aversions, food. 262b
Axel, Richard, 268
Axial muscles, 426
Axoaxonic synapse, 106, /07
Axodendritic synapse, 106, /07
Axon coJiaterals, 38, 38
Axon hillock, 29, 38, 38. 97, 98
Axon terminal. 39, 39
Axonal diameter, conduction velocity and,
94
Axonal length. neuronal classification based
on,46
Axons, 26, 26. 38. 38--41
a fferent, 173
collections of. 180t
efferent. 173
growth, 698, 698-699, 699
gUIdance. 699-702. 700. 701b. 703
pioneer, 699
regeneration, 705b
Axop]asmic transport, 40-41, 4/. 42b
Axosomatic synapse, 106, 107
B
Babinski sign, 456b
Balance. See Vestibular system
Ballism, 467
Ballistic movement 452-453
Barbiturates, 156-157, /57
Bard, Philip, 565
Barlow, Horace, 298
Basal. 186
Basal cells. olfactory, 265, 265
Basal forebrain, 218, 220
Basal forebrain complex, cholinergic diffuse
modulatory system arising [rom,
503-504, 504
Basal ganglia, 186,219
anatomy, 464, 465
disorders, 466-468, 468b-469b, 475b
motor loop, 465, 466, 466-468
Basal lamina, 702, 704
Basal nucleus of Meynert, 504, 504
Basal telencephalon, 184, /85
Basilar artery. 234
Basilar membrane, 351-352,352
response to sound, 353, 353-354, 354
tonotopic maps on, 366, 366
Basolateral nuclei, 572, 573
Batrachotoxin, 89
Baynes, Kathleen, 631
BCM theory of synaptic plasticity, 781
Becker muscular dystrophy, 437b
Bed nucleus of the stria terminalis, 669
Behavior. See Chemical control of brain and
behavior; Motivation
Behavioral neurophysiology, 462b
Behaviora] neuroscience, 13-14
Behaviorism, 663
Bell, Charles, 9-10
Bennett, Michael V L, 108b
Benzodiazepines, 156-157, /57,671. 671
Berridge, Kem, 523, 525b
Berson, David, 611, 614b
Beta rhythms, 589. 590
Betz cells, 469
Bienenstock, E]ie, 781
Bi]ateral symmetry, 170
Bilinguals, aphasia in, 627, 627-628
Binaural neurons, 369-371, 370, 371
Binocular competition, 713-714,7/4
Binocular receptive field, 324-325
Binocular vision
modulatory influences, 714-716, 7/6
plasticity, 710,7/2,712-714,713,7/4
Binocular visual field, 312
Biological clock
examples, 608-610, 609
suprachiasmatic nucleus as, 610-615, 61/,
6/2, 613b, 614b, 615
Biological psychologist, 15t
Bipolar cell, 288, 289
Bipolar cell receptive fields, 299-300, 300
Bipo]ar disorder, 673-674, 678-679, 679
Bipolar neuron, 45, 45
Bird song, 552b, 553. 553-554
Bitemporal hemianopia, 315b
Bitterness, 253, 258, 258, 259
Black widow spider venom, 121 b
Blind regions of eye, 282b
Blindness
brain reorganization, 636b-637b
color, 297b
Bliss, Timothy, 776-777
Blob pathway, 332
Blob receptive field, 329
Blood-brain barrier. 71
Blood hypertonicity, thirst triggered by, 528,
529
Blood supply to brain, 234-235
Blood volume, reduced, thirst triggered by,
527, 528
Blue-yellow color opponency, 305 306
Body lat
energy balance and, 511-512,512
food consumption and, 512-514,513,
5/4
hypothalamic regulation, 515-518,
5/6-5/8
leptin and, 515-518, 516-5/8
Body temperature
circadian rhythm, 608, 610
regulation, 484, 529-530, 530t
Body weight
hypothalamus and, 514-515, 5/5
maintenance, 513, 513
Botulinum, 121b
Bouillaud, Jean-Baptiste, 620
Bourgeois, Jean-Pierre. 707
Boutons en passam, 39
Bradykinin, 408, 411. 411
Braille reading, neuroimaging studies,
636b-637b
Brain
anatomical subdivisions, 8
blood supply, 234-235
chemical control. 481-507
control 01 movement. See Central motor
system
cross-sectional anatomy, 217-226
caudal midbrain, 224
forebrain al mid-thalamus. 220-221
forebrain at thalamus-midbrain junction,
222-223
forebrain al thalamus-telencephalon
junction, 218-219
medulla-spinal cord junction, 226
mid-medulla, 226
pons and cerebellum, 225
rostral medulla. 225
rostral midbrain, 224
development, 690-722
activity-dependent synaptic rearrange-
ment 708-716, 709
critical period. 715b. 720-722
differentiation, 182-190,184-190,696,
696-697
elimination of cells and synapses, 704,
706-708
genesis of connections, 697-704
genesis of neurons, 691-697. See also
Neurogenesis
INDEX 839
mechanisms of synaptic plasticity,
716-720,7/7-7/9
neural tube formation, 180-182,181
primary vesicle development, 182-183,
184
diet and, 499b
diffuse modulatory systems. 498-507. See
also Diffuse modulatory systems of
brain
electrical stimulation
effects on language, 632, 632-633, 633
memory storage and, 737-738
self-administered, 522, 522-523, 523.
524b
functional states, 594-596, 595t
historical beliefs about, 5-13
human, special features, 192-195, 193-195
imaging, 174-176, 177b 179b
kidney and, communication between,
486-487, 487
language specialization, 618, 620, 620-621.
621b
localization of function. historical research,
10, IO-ll, 11
mammalian
common fealures, 168, 169
organizational plan, 191-192, 192
masculinization, 549- 550
mental illness and, 661-665
sex and, 533-561
specializations, animal models, 11-12,
12
stress and, 491b
structure, 171, 17/
surface anatomy, 206-216
dorsal. 215-216
lateral. 208-210
medial. 211-213
ventral. 214
water on, 175b
Brain-derived neurotrophic factor (BDNF),
706-707
Brain-Gate, 473b
Brain rhythms, 586-616
circadian, 607-615. See also Circadian
rhythms
electroencephalography, 586-594. See also
Electroencephalography (EEG)
during epileptic seizures, 592-594, 594
functions, 592
during sleep, 594-607, 595t, 597, 598. See
also Sleep entries
synchronous, generation, 588, 590-592,
590-592
types, 589-590. 590
Brain sJice preparation, 777-778
Brain stem, 8,171,171,208
cholinergic diffuse modulatory system aris-
ing from, 504, 504
structu res, 211
Brain surgery
prehistoric, 4. 4-5
to reduce aggression, 577-578, 578b
Brain vesicles
primary, 182-183, /84
secondary, 184, /84
Brede David, 783
840 INDEX
Broad tuning
olfactory receptor cells, 268
taste receptor cells, 263
Broca, Paul. 10, 10
Broca's aphasia, 621-623, 622t
Broca's area, 10,11,620,620-621, 621b
Broca's limbic lobe, 568, 569
Brodmann, Korbinian, 197, 198
Brown-Sequard syndrome, 414
Buck, Linda. 268
Bucy, Paul. 571-572, 738
Bulimia nervosa, 527
Bundle, 180t
c
C fibers, 393, 39]. 412, 4/2. 421
CAI, 777, 777
long-term depression, 781,781-783. 782
long-term pOlentiation, 778-780, 778-781
CA3, 777, 777
Cade, John, 678
Cajal. Santiago Ramon y, 27, 27
Calcium, 54
binding to troponin. 435, 4]6
concentration on either side of membrane,
66
flux, at NMDA receptors, 717,718
influx
in cerebellar long-term depression, 775.
775
in classical conditioning in Aplysia, 770,
7701, 771
in hippocampal long-term depression,
782, 782
in hippocampal long-term potentiation.
779-780, 78/
intracellular, importance, 155, 156b
in light adaptation, 298
Nernst equation, 65b
release, in muscle contraction, 433, 4]4
Calcium-activated potassium channel, 447,
448
Calcium-calmodulin-dependent protein
kinase, 162
Calcium-calmodulin-dependent protein
kinase II (CaMKll)
autophosphorylation, in long-term memo-
ry, 788, 789b
in hippocampal long-term potentiation,
779-780, 78/,787
regulation, 787, 787-788
Calcium pump, 67
Calcium release channel, sarcoplasmic reticu-
lum, 433, 4]4
cAMP. See Cyclic adenosine monophosphate
(cAMP)
Campbell, Alfred Walter, 461
Cannabinoid receptor, 150
Cannabinoid therapy, 149b
Cannabinoids, endogenous, /48, 148-151,
149b, 150b-I51b
Cannabis, 149b
Cannon-Bard theory of emotion, 565-566,
566
Capacitance, 63, 63
Capsaicin,410b
Capsule, 180t
Cardiac muscle, 424
Carlsson, Arvid. 501. 502b
Carotid arteries, 234
Carskadon, Mary, 597
CART (cocaine- and amphetamine-regulated
transcript), 515, 516, 5/7, 519t
Catabolism, 511, 512
Cataplexy, 605b
Cataract, 285b
Catatonic schizophrenia, 680
Catechol group, 143, 14]
Catecholaminergic neurons
chemistry, [43, 14], /45. 145-146
stimulant drug action on, 506, 506
Categorical speech perception, 639b
Cathode, 60. 60
Cation, 54
Cauda equina, 396
Caudal. 168, 170
Caudal hindbrain, 188-189, 189
Caudal midbrain, 224
Caudate nucleus, 219, 221, 464, 465
Cell-adhesion molecules (CAMs), 699, 699
Cell assembly. memory storage studies, 733.
734
Cell body, 26, 26. 28-35, 29
Cell death
apoptosis, 707
programmed, 468b, 706, 706--707
Cell differentiation, 695-696, 696
Cell migration, 694, 694-695, 695
Cel! proliferation, 691-693, 692. 693b, 694
Cell theory, 12
Cellular neuroscience, 13
Cellular respiration, ]4. 34-35
Center-surround receptive field
bipolar cell, 300
color-opponent, 305, ]05
ganglion cell, 302, 302
striatal cel!, 324
Central motor system, 452-478
basal ganglia, 464-468, 465 466
cerebellum. 472, 474. 474-477. 475b. 476
descending spinal tracts, 453-458
corticospinal (pyramidal) tract, 189-190,
454, 455
lateral pathways, 453, 45]. 454-455,
455, 459
medullary reticulospinal tract, 457-458,
458
pontine reticulospinal tract, 457-458,
458
rubrospinal tract, 454, 455
tectospinal tract, 457, 457
ventromedial pathways, 453, 45],
455-458,457,458,459
vestibulospinal tract, 456-457, 457
hierarchical levels, 452, 452, 452t
motor initiation by primary motor cortex,
468-472, 470--472
motor planning by cerebral cortex.
459-464
motor cortex, 459-461,460
neuronal correlates, 462-464, 462b, 46]
posterior parietal cortex, 461
prefrontal cortex, 461-462
Central nervous system (CNS). See also Brain;
Spinal cord
axon regeneration, 705b
development, understanding structure
through,178-195
historical views, 7, 8
human, special features, 192-195, 19]-/95
mammalian, organizational plan, ]9]-192,
/92
sexual dimorphisms, 546-548, 547
structure, /7l, 171-172, /72
synapse formation, 704, 704
Central nucleus, 572, 573
Central pathways
auditory, 363-365, 364, ]65
gustatory, 259, 260, 260
olfactory, 269-272, 270-272
vestibular, 381-384, 382, ]8]
Central sulcus, 8, 194, /94, 209
Central visual system, 310-340
dorsal stream, 333, ]]3, ]]4, 334-336, 3]5
extrastriate areas, ]]]-336. 333-337, ]]7
lateral geniculate nucleus, 315-318,
]/6-]/8
perception and, 337-340. 338b-339b
retinofugal projection, 310-315, ]11-]14
retinotopy, 319-320, ]20, 325
striate cortex, 318-333, 3/9-]32
ventral stream, 333, ]]], ]]4, ]]5,
336-337, ]]7
Cephalic phase of feeding behavior, 519
Cerebellar cortex, 225
anatomy, 772-774, 77]
synaptic plasticity, 772-776, 77]-776
Cerebellar hemispheres, 216, 474, 474
Cerebellar peduncle, 216
Cerebellar tremor, 475b
Cerebellum, 8, 171, /7l, 188, /88,216,225
anatomy, 474, 474. 476
functions, 11, 189
lateral. motor loop, 476, 476-477
motor control function, 472, 474, 474-477,
475b, 476
programming, 477
Cerebral aqueduct, 187, /87, /92, 192t, 213,
222, 224
Cerebral arteries, 234, 235
Cerebral cortex, 184, /85, 219. 221
areas, 197-199, /98, 199, 200b-20lb
cytoarchitectural map, 197, 198
evolution, 198-199,199
guide to, 195-199
motor planning by, 459-464. See also
Motor planning
structure-function relationships, 185-187,
186, 198-199, 199
types, 195-197, /97
vertebrate, general features, 195, /96
Cerebral hemispheres, 215
Cerebral lobes, 7, 8, 194, 194, 209
Cerebral localization, historical research, 10,
10-11,1/
Cerebral palsy, 19t
Cerebral peduncle, 454, 455
Cerebrospinal fluid (CSF), 174
Cerebrum. 8. 171. 171,208,215
functions, II
historical views, 5, 5-6
Cervical spinal corel 394, 395
Cervical vertebrae, 226, 227
Characteristic frequency, 365, 365
Chemical control of brain and behavior.
481-507
autonomic nervous system, 490--497
dif[use modulatory systems, 498-507
patterns of communication, 482--483, 483
secretory hypothalamus, 484--489
Chemical nociceptors, 409
Chemical senses. See Smell; Taste
Chemical synapse, 102, 103b, 105-107,
109-111
central nervous system, 106, 107, 109, 109
characteristics, 105-106, 106, 107
neuromuscular junction, 109-111, 110
Chemical synaptic transmission, 111-122
neurotransmitter receptors and effectors,
115,117-119, 117-119
neurotransmitter recovery and degrada-
tion, 119-121
neurotransmitter release, 113-115, 114,
116b
neurotransmitter synthesis and storage,
112-113, 113
neurotransmitters, 111-112, Illt, 112
Chemoattractant 699, 700,701b
Chemoreceptor, 252
Chemorepellant, 699, 700
Child abuse and neglect, af[ective disorders
and, 676
Chloride, 54, 65b, 66
Chloride channel, 126-127, 128
Chlorpromazine, 682
Cholecystokinin, 521, 521
Cholesterol. and synthesis of steroid sex hor-
mones, 538, 538
Choline, 142, 142, 143
Choline acetyltransferase, 142, 142, 143
Cholinergic diffuse modulatory system,
503-504, 504, 716, 716
Cholinergic neurons, 46, 134, /42, 142-143,
143
Cholinergic system, 134, 138-139, 139, 140t
Chorea, 467, 475b
Choroid plexus, 174, 174
Chromosomes, 30
human, 535, 535
mismatches between sex hormones and,
551. 553b
Ciguatoxin, 731b
Ciliary muscles, 282, 283
Cingulate cortex, 569,569, 571
Circadian rhythms, 607-615
biological clocks, 608-610, 609
physiological examples, 608
suprachiasmatic nucleus and, 610-615,
6/1. 6/2, 613b, 614b, 615
Circle of Willis, 234
Cirelli, Chiara, 607
Classical conditioning, 763-764, 764
of gill-withdrawal reflex in Aplysia,
768-771. 770, 770t, 771
Climbing fibers, cerebellar, 772, 773
Clinical research, 14, 14t
Clitoris, 541. 542
Clock, biological
examples, 608-610, 609
suprachiasmatic nucleus as, 610-615. 611,
61L 613b, 614b, 615
Clock genes, 613-614, 615
Clonus, 456b
C1ozapine, 682
CNS, See Central nervous system (CNS)
Co-transmitters, 142
Cobra toxin, 121b
Cocaine, 95b, 505-507, 506, 526b
Cocaine- and amphetamine-regulated tran-
script 515, 516,517, 519t
Cochlea, 347, 347, 351-363
anatomy, 35/, 351-352, 352
basilar membrane response to sound, 353,
353-354, 354
hair cell innervation, 359, 359, 361
hair cell transduction, 356, 357,358,
358-359, 360b
implants, 356b-357b
organ of Corti and associated structures,
354--356, 355
outer hair cell amplification, 36/, 361-363,
362b
physiology, 352-363
Cochlear amplifier, 36/, 361-363, 362b
Cochlear nuclei, 363, 364, 365, 366
Cognition, sexual dimorphisms of, 548,
548-549
Cognitive neuroscience, 14
Cohen, Neal, 749-750
Cohen, Stanley, 706
Coleman, Douglas, 513
Color blindness, 297b
Color detection, 296, 296, 297b
Color-opponent ganglion cell, 304--306, 305
Color vision, genetics, 297b
Commissure, 180t
Complex cell, striate cortex, 327, 329, 329
Compulsions, 666, 666t
Computational neuroscientist, 15t
Computed tomography (CT), 175-176
Concentration gradient, 59
Conditional stimulus (CS), 763, 764
Conditioned response (CR), 763, 764
Conditioning
classical, 763-764, 764
of gill-withdrawal reflex in Aplysia,
768-771, 770, 770t, 771
instrumental, 764--765
Conduction aphasia, 6221, 626-627
Conduction deafness, 376b
Conduction velocity, 94--97, 97
Cone photo receptors
regional differences, 290-292, 291, 292
structure, 290, 290
transduction, 296, 296, 297b
Congenital adrenal hyperplasia, 551
Conjunctiva, 280, 280
Connexins, 103, 104
Connexon, 103, 104
Consensual pupillary light reflex, 287-288
Contralateral, 170, 170
Contrast enhancement, somatic sensory sys-
tem, 399b
INDEX 841
Convergence, in neurotransmiuer systems,
164, 165
Convulsants, 593
Cooper, Leon, 781
Cooperativity property, of hippocampal long-
term potentiation, 778
Corey, David, 360b
Cormack, AJlan, 175-176
Cornea, 280, 280, 283-284, 284
Coronal plane, 170, 170
Corpus callosum, 184, 185,212,215,219,
628, 628
sexual dimorphisms, 547
split-brain studies of language, 628-630,
628-631
Cortex, 180t, 695, 695. See also Cerebral cor-
tex
Cortical areas, differentiation, 696--697
Cortical cells, sources, 693, 694
Cortical modules, striate correx, 332,
332-333
Cortical plate, 695, 695
Cortical rhythms. See Brain rhythms
Cortical somatotopy, 402--404, 402--405
plasticity, 404--407, 405, 406b
Cortical synaptic plasticity. See Synaptic plas-
ticity
Corticomedial nuclei, 572, 573
Corticospinal tract, 189-190,454,455
Corticotropin, See Adrenocorticotropic hor-
mone (ACTH)
Corticotropin-releasing hormone (CRH),
488--489,49Q 668, 669
Corticotropin-releasing hormone (CRH)
receptor antagonists, 677
Cortisol, 488--489, 490, 491 b, 608
Cotransport, 144b
Counter-transport, 144b
Cranial nerves, 173, 214, 232-233
CREB (cyclic AMP response element binding
protein), 786b, 790, 790-791
Cribriform plate, 265, 266
Cristae, mitochondrial, 34, 34
Critica I period
brain development, 715b, 720-722
ocular dominance plasticity, 710, 712, 712,
713,7/4
Cross-sectional anatomy
bram, 217-226
spinal cord, 229
Crossed-extensor reflex, 446, 446--447
Crossed-innervation experiment, 431
Cupula, 380, 381
Curare, 122, 139
Cyclic adenosine monophosphate (cAMP),
129,129-130, /6/, 161-162
in classical conditioning in Aplysia, 770,
770t. 771
in olfactory transduction, 266, 267, 269
in sensitization o[ gill-withdrawal reflex in
Aplysia, 767, 768
Cyclic AMP response element binding pro-
tein (CREB), 786b, 790, 790-791
Cyclic guanosine monophosphate (cGMP),
293, 294, 294--295, 295
Cyclooxygenase (COX), in brain masculiniza-
tion, 549-550
842 INDEX
CyclOThymia, 674
Cytoarchitectural map of neocortex, 197, 198
Cytoarchitecture of neurons, 25
Cytochrome oxidase blobs, 324, 324. 329
Cytoplasm, 30
axon, 38
axon terminal, 39
dendrite, 45
CylOskelelOn, 35, 35-38, 55
Cytosol. 28, 53-54, 54
D
Dale's principle, 142
Dark adaptation, 296, 298
Dark current, 293, 294
Darwin, Charles, II, 11
Daughter cells, 691, 692
de Candolle, Augustin. 609
de Mairan, Jean Jacques d'Onous, 608-609
Deafness
from antibiOTics, 363
aphasia and, 627, 627-628
brain reorganization, 636b-637b
types, 376b
Declarative memory, 726-727, 727
limits,728b
localization in neocortex, 733-737, 735
temporal lobe and, 738-750, 739-743, 745,
746, 748-750
Decussation, 190, 312
Deep cerebellar nuclei, 225, 474, 474
Dehydration, thirst triggered by, 528, 529
Deja vu, in partial seizure, 593
Delay Jines, and neuronal sensitivity to
sound location cues, 370, 371
Delayed non-match to sample task, 741.
741-742
Delayed-response task, 754
Delayed-saccade task, 757, 758
Delta rhythms, 589
Dement. William, 595
Dementia, 19, 19t, 467
Demyelinating disease, 96b
Dendrites, 26, 26-27, 41, 41 45,42
cable properties, 124-126, 125
excitable, 126
neuronal classification based on, 45-46,
46
Dendritic spines, 42, 42, 43b, 44b
Dendritic tree, 41
Dendrodendritic synapse, 106, 109, 109
Dense-core vesicles, 106, 107
Dentate gyrus, 777, 777
Deoxyribonucleic acid (DNA). 30, 535, 535
Dephosphorylation, 163, 163
Depolarization
causes, 77
hair cell, 358, 358
level, firing frequency and, 79, 79
photoreceptor, 293, 294
potassium concentration and, 71
Depolarizauon-induced suppression of inhi-
bition, 15 I b
Depression, 19t. 20, 673
diathesis-stress hypothesis, 676
erOTonin and, 527
treatment, 677-679, 678, 679
Dermatomes, shingles and, 396, 396b
Dermis, 388, 389
Descartes, Rene. 7, 7, 662
Descending motor pathways, 229
Descending pain regulation, 4] 6, 417
Descending spinal tracts, 453 458
Desensiuzation, 120-121
Desimone, Robert, 654
Detection, visual attention effects on,
645-646, 646
Developmental neurobiologist, 15t
Diabetes insipidus, 528-529
Diabetes mellitus, 521 b
Diacylglycerol, 162, 162
Diathesis-stress hypothesis, 676
Diazepam, 671
Dichromatic vision, 297b
Diencephalon. 211
differentiation, 184, 185
in memory storage, 743, 743-744
Diet, and brain, 499b
Differemiation
brain, 182-190, 184-190
cell, 695-696, 696
cortical areas, 696-697
sexual. 536-537, 537, 553, 553-554
spinal cord, ]90-191. 191
Dif[use modulatory systems of brain,
498-507
anatomy and functions, 498-504
cholinergic, 503-504, 504, 716, 716
dopaminergic, 501-503, 502b, 503, 682
drugs and, 504-507, 506
noradrenergic, 498-500, 500, 716, 716
serotonergic, 501. 501, 672
sleep and, 602, 604, 604
Diffusion, 59. 59
Digestion, feeding behavior and, 519-522,
520-522
Diopter, 283, 284
Direction selectivity, visual, 326, 327
Direction vector, 471, 471
Disorganized schizophrenia, 680
Dissociated amnesia, 730
Distal muscles, 426
Distributed memory, 736b
Divalent ion, 54
Divergence, in neurotransmitter systems,
164,165
DNA microarrays, 32b
Docking, 114, 116b
Dolan, Ray, 567
Donoghue, John, 472, 473b
Dopa, 143, 145, 145
Dopa decarboxylase, 145, 145
Dopa therapy, 467
Dopamine
addiction and, 526b
in attention-deficit/hyperactivity disorder,
644b
chemistry, 143, 143, 145, 145-146
in mOTivation, 523, 523-524, 525b
in Parkinson's disease, 467
in schizophrenia, 682, 682-683, 683
Dopamine l3-hydroxylase, 146
Dopaminergic diffuse modulatory system,
501-503, 502b, 503, 682
Dorsal, 168, 170
Dorsal cochlear nucleus. 225, 363. 364.
365
Dorsal column, 190, 191,191. 228, 229, 397,
397
Dorsal column-mediallemniscal pathway,
397-399, 398
Dorsal column nuclei, 226, 397, 398
Dorsal horn, 190, 191, 228, 396, 397
Dorsal longitudinal fasciculus, 580
Dorsal root. 9, 9, 172, /72, 228
Dorsal root ganglia, 172, 172-173, 392, 393
Dorsal stream, central visual system, 333,
333, 334, 334-336,335
Dorsal surface
brain, 215-216
spinal cord, 226-227
Dowling, John, 299, 30lb
Down syndrome, 43b
Dreaming, 600-602
Drinking, physiological signals, 527-529, 528.
529
Drug(s)
addiction, 506-507, 526b
diffuse modulatory systems of brain and,
504-507, 506
tolerance, 526b
Duchenne muscular dystrophy, 437b
Duck-billed platypus, 20lb
Duplex theory of sound localization, 369
Dura mater. 173, /74
Dynein, 41
Dyskinesia, 467
Dyslexia, artistic talent and, 331 b
Dysmetria, 472
Dyspraxia, verbal. 640b
Dyssynergia, 472
Dysthymia, 673
Dystrophm, 437b
E
Ear
inner. 347. 348,350,351-363. See a/so
Cochlea; Vestibular labyrinth
middle, 347, 348-350, 349, 350
outer, 347, 348
Eardrum, 347, 347, 348, 349, 349
Eating behavior See Feeding behavior
Eating disorders, 514, 515,527
Eccles, John, 102
Echolocation, 374b-375b
Ectoderm, 180, 181
EEG. See Electroencephalography (EEG)
Efferent axons. 173
Egg carton model of AMPA receptor traffick-
ing, 783-784, 784
Ehrlich, Paul. 665
Eichenbaum, Howard. 749-750
Ejaculation, 543
Elbow joint muscles, 425, 425-426
Electrical brain stimulation
effects on language, 632, 632-633, 633
memory storage and, 737-738
self-administered. 522. 522-523. 523. 524b
Electrical charge
distribution, 63. 63
of water. 53. 54
Electrical conductance, 60
Electrical current, 60. 60. 6/
Electrical potential, 60
Electrical resistance. 60
Electrical synapse. 102. 103-105, /04. 105.
108b
Electrically coupled cells, 104
Electricity. 59-61. 60. 61
Electroconvulsive therapy. 677
Electroencephalography (EEG). 586-594
electrode placement. 587
dunng epileptic seizures. 592-594, 594
magnetoencephalographyand. 588-589.
589
mechanisms and meanings of brain
rhythms. 590-592, 590-592
recording brain waves. 586-589. 586-589
types of rhythms. 589-590. 590
Electromagnetic radiation. 279. 279
Electromagnetic spectrum, 279. 279
Electron microscopy. 27. 28b
Electron transport chain. 35
Emmetropia. 286b, 287b
Emotion. 564-582
amygdala in. 572-578. 573-575. 576b,
578b
Broca's limbic lobe. 568. 569
in Kluver-Bucy syndrome. 571-572
limbic system concept. 568-572. 569
Papez circuit. 568-569, 569. 571
theories. 564-568. 566
unconscious. 566-568. 567
End-product inhibition. 145
Endocannabinoids, 148.148-151. 149b.
150b-151b
Endocochlear potential. 352
Endocytosis. 114
Endoderm. 180. /8/
Endolymph
cochlear. 352
vestibular, 380. 38/
Endorphin. 140.418
Endplate potential. 428
Energy balance. feeding behavior and.
51 ]-512.512
Engram. search for. 731-738
Enkephalin. ] 40
Enteric division of autonomic nervous sys-
tem. 495. 495--496
Entorhinal conex. 740. 741
Enzyme. 55
Ependymal cell. 48
Ephrins, 702
Epidermis. 388, 389
Epiglottis. 253.253.260
Epilepsy. 19t
Epileptic seizures, 592-594. 594
Epinephrine
in autonomic function. 497
chemistry. 143. 143. /45. 145-146
EPSPs. See Excitatory postsynaptic potentials
(EPSPs)
Equilibrium. 62, 62
Equilibrium potential, 62. 62-64. 63. 64.
65b
Esotropia, 285b
Estradiol receptors. 538. 538
Estrogen. 538. 538
activational effects. 553, 556. 556-558, 557.
558b-559b
in brain masculinization. 549
eHects on neurite growth. 556. 556
neuroprotective role. 558
Estrous cycle. 540
Ethanol. 157. 157
Ethical code. animal welfare. 17
Eugenetics. 664b
Eustachian tube. 348. 349
Evarts. Edward. 462
Evolution
cerebral cortex, 198-199. 199
nervous system. //. 11-12. /2
Excitable dendrites. 126
Excitable membrane. 53
Excitation-contraction coupling. 432--437.
433-436
Excitatory neurotransmitter, 120b
Excitatory postsynaptic potentials (EPSPs).
117. II7
quantal analysis. 122-123, /23
summation. 123-124. /24
Excitatory spinal imerneurons. 445--447,
446
Excitatory synaptic transmission. in imma-
ture visual system. 7/7.7]7-718.
7/8
Excitotoxicity. 156b. 432b
Exocytosis. I 14. //4. I 15
Exon. 30. 3/
Exotropia. 285b
Experience-dependent brain development.
708-716. 709
Experimental ablation method. 10-1 I
Experimental neuroscientists. 14-15. 15t
Explicit memory. 727
Extension. 425. 425
Extensors. 426
External genitalia. 541. 542
Extracellular fluid. 53-54. 54
Extracellular matrix. in neurite growth. 698,
699
Extracellular recording. 78b
Extracellular space. 47
Extrafusal fiber. 440. 44/
Extraocular muscles, 280. 280
Extrastriatal cortex. 333-336. 333-337.
337
Eye, 278-306. See also Central visual system;
Retina
blind regions. 282b
cross-sectional anatomy. 282-283. 283
disorders. 285b
early developmem. 184. /84
gross anatomy. 280. 280
image formation. 283-284. 284-288.
286-288
ophthalmoscopic appearance. 28 I. 28/
segregation of LGN input by. 316-317.3/7.
318
structure. 280-283
INDEX 843
Eye movements
attention and. 657. 657-658, 658
in vestibulo-ocular reflex. 382-384.383
F
Face recognition. 336-337. 337
Facial nerve. 232. 233. 259. 260
facial vibrissae. somatotopic map. 403. 403
Falling phase of action potential. 76. 77.91
Fasciculation. 698-699. 699
Fast axoplasmic transport. 40
Fast motor units. 430
Fat. body. See Body fat
Fear
adaptive value. 665
amygdala and. 573-576. 574. 575. 576b
learned. neural circuit for. 574-576. 575.
576b
pathological. See Anxiety disorders
Feeding behavior
anorectic peptides. 515. 516, 5/7. 519t
appetite. eating. digestion. and satiety
cues, 5 19-522. 520-522
body fat and. 512-514.5/3.5/4
cholecysrokinin and. 52/. 521
energy balance and. 511-512.512
gastric distension and, 520-521. 521
homeostatic regulation. 512-518
hypothalamus in. 514-515.515. 519t. 530t
control by lateral hypothalamic peptides.
518
leptin and. 515-518.516-5/8
seroronin and. 526. 527
insulin and. 522. 521-522
long-term regulation. 5 11-518
orexigenic peptides. 516.517. 518. 519t
psychological motivation. 522-527
seroronin and, 524. 526-527. 527
short-term regulation. 519-522.520-522
Female genotype, 535
Ferrier. David. I 1,460-461
Fetal alcohol syndrome. 43b
Filopodia. 698. 698
Fingertip. two-point discrimination. 392. 392
First pain. 412. 412
Fissures. 7. 8. 209
Flavor aversion learning. 262b
Fleming. Alexander. 665
Flexion, 425. 425
Flexor reflex. 445--446. 446
Flexors. 426
Flourens. Marie-Jean-Pierre. 10
Fluid-mechanical theory of brain function. 7.
7
Fluoxetine.671
Flynn. John, 580
Focal distance. 283, 284
Folate (folic acid) deficiency. 182b
Folia. cerebellar. 474. 474
Foliate papillae. 253. 254
Follicle stimulating hormone (FSH). 488t.
539. 540
Food. See Feeding behavior
Footplate. 348.349
Ford. David. 621-623
844 INDEX
Forebrain
differentiation, /84-/86, 184-187
at mid-thalamus, 220-221
prosencephalon of. 183, /84
structure-function relationships, 185-187,
/86
structures, 212
at thalamus-midbrain junction, 222-223
at thalamus-telencephalon junction,
218-219
Fornix, 212, 219, 221
Fourth ventricle, 188, 189. 192, 192!. 213,
216, 225
Fovea, 281, 28/, 292,292
FOXP2 gene, 640b
Fragile X mental rerardation protem (FMRP),
44b
Free ribosomes, 33, 33
Free-run rhythm, 609
Freeman, Walter, 592
Frequency
electromagnetic radiation, 279,279
sound, encoding, 36 366-368, 367
sound waves, 344-345, 345
Freud, Sigmund, 601, 663, 663
Friedman, Jeffrey, 513
Fritsch, Gustav, 460
Frontal eye field (FEF). 657, 657-658, 658
Frontal lobe, 8, 194, 194. 209, 218
Frontal lobotomy, 578b
Functional brain imaging, 176, 178b-179b
Functional magnetic resonance imaging
(fMRl), 176, [78b
attention to location, 649, 650
language processing, 633, 634
memory storage, 735, 737, 737
working memory, 756-757, 757
Fungiform papillae, 253, 254
Furshpan, Edwin, 102
G
G-protein-coupled effector systems, 160-164
phosphorylation and dephosphorylation,
162-163, /63
in phototransduction, 292, 293
second messenger cascades, 161, 161-162,
/62
shortcut pathway, 160, 160-161
signal amplification by, 163. 163-164
G-protein-coupled ion channels, 160,
160-161
G-protein-coupled receptors, 118-1 19. 119.
141
in cerebellar long-term depression, 775,
775
examples, 158t
gusratory, 258, 259, 261b
olfactory, 269
structure, 157-158,158
G-proteins, 118,1/9, 158-160,159
GABA (gamma aminobutyric acid). 112, 1/2.
146-147, /47
GABA-gated ion channel. 117, 156-157, /57
GABA transaminase, 147, /47
GABA A ceceplOt; 14I, 671. 671
GABAergic synapses, 134
Gage, Phineas, 570b, 755
Galen, 5. 5-6, 6
Gall, Franz Joseph, 10, 10
Gamma loop, 443
Gamma motor neurons, 440--441, 441, 443
Gamma rhythms, 592
Ganglion, 180t
Ganglion cell. 288, 289
color-opponent, 304-306, J05
M-type, 303-304, 304, 316, JI8
nonM-non?, 304, 317,3/8
P-type, 303-304,304,316,3/8
retinal. 61 I, 614b
types, 303-306,304,305
segregation of LGN input by, 316-317,
3/7,3/8
Ganglion cell layer, 289, 290
Ganglion cell receptive fields, 302, 302-303,
303
Gap junction, 103, 104
Gap junction channel. 103, 104
Gastric distension, feeding behavior and,
520-521. 521
Gastric phase of feeding behavior. 520
Gate theory of pain, 416
Gating, ion channel. 58
Gazzaniga, Michael, 629, 631
Gender, sex and, 533-537
Gender identity, 537, 55 I, 553b
Gene expression, 30
during development, 692, 692
profiling differences, 32b
regulation by CREB, 786b, 790, 790-791
during sleep and wakefulness, 606-607
Gene knockout technique, 581-582
Gene transcription, 30,3/
Generalized seizure, 592, 594
Genes, 30, 535
Genetic sex, 535
Genetics
color vision, 297b
language, 640b
mental illness, 664b
schizophrenia, 680-681, 68/
of sex, 535,535-536,536
Genitalia, external, 541. 542
Genome Project, 32b
Genmype, 535
Georgopoulos, Apostolos, 470,470--47 I
Geschwind, Norman, 625-626, 631-632
Gesner, Johann, 618, 620
Ghrelin, 520
Gill-withdrawal reflex, 765, 765
classical conditioning, 768-771, 770, 770t,
771
habituation, 766, 766-767, 767
sensitization, 767-768, 767-769
Girdle muscles, 426
Glabrous skin, 388, 389
Glaucoma, 285b
Glia
astrocytes, 46--47, 47
functions, 24
myelinating, 47, 47--48
potassium spatial buffering. 7 I, 71
Globus pallid us, 2 I 9, 221, 464, 465, 466, 466
Glomerulus, olfactory, 269-27 I, 270, 271
Glossary, 795-816
Glossopharyngeal nerve, 232. 233, 259, 260
Glucocorticoid receptors
in affective disorders, 676
hippocampal. 669-670
Glucose, 521
Glutamate, 112, 112
chemistry, 146-147, 147
excitotoxicity, 156b
in phototransduction, 299
Glutamate-gated channels, 154-156, 155,
156b
Glutamate hyporhesis of schizophrenia, 683,
684, 685
Glutamate receptors, 154, 717.717-718
in cerebellar long-term depression. 775,
775
in hippocampal long-term depression, 782,
782-783
in hippocampal long-term potentiation,
779-780, 781
in learning and memory, 784-786, 785
in sensitization of gill-withdrawal reflex in
Aplysia. 768
trafficking, egg carton modeL 783-784,
784
GJutamatergic synapses, 134
GJutamatergic system, 139, 140. 140t
Glutamic acid decarboxylase, 147, 147
Glycine, 112, 112, 146-147, /47
Glycine-gated ion channel. 117, 156-157,
157
Glycine receptor defects, 127b
Glycogen, 51 I. 512
Gold, Geoffrey, 269
Goldberg, Michael. 652, 653b
GoJdman equation, 67, 68b
GoJgi, Camillo, 26, 26
Golgi apparatus, 29, 34, 34
Golgi stain, 26, 26-27
Golgi tendon organs, 443, 443--444, 444
Golgi type I neurons, 46
Golgi type II neurons, 46
Gonadotropin. 539, 540
Gonadotropin-releasing hormone (GnRH),
539, 540
Gonads
bidireCiional interactions between brain
and, 540
development, 536-537, 537
neural control. 541-546, 542, 544, 545
Goodfellow, Peter, 535
Gorgan, Philip, 623-624
Gorski, Roger, 547
Gould, Elizabeth, 556
Grafstein, Bernice, 40
"Grandmother cells:' 338-339
Granule cells, cerebellar, 772-773, 773
Gray matter, 180t
historical views, 7, 7
spinal cord, 190, 19/, 228
Gray's type I synapse, 109, 109, 128
Gray's type II synapse, 109, 109, 128-129
Greece. Ancient, beliefs about brain, 5
Greenough, William, 42, 44b
Grillner. Sten. 447
Growth cone. 698, 698
Growth hormone (GH), 488t. 608
Guidance cues. axon. 699. 700. 70lb
Guillain-Barre syndrome. 96b
Gustation. 252. See also Taste
Gustatory axons, 255, 256
Gustatory cortex. 210, 259,260
Gustatory nucleus. 226, 259, 260
Gynandromorph, 553. 553-554
Gyri. 7, 8. 194. 209
H
Habit learning, striatum in. 751-754. 752,
753
Habituation. 763. 763
of gill-withdrawal reflex in Aplysia. 766.
766-767. 767
Hair, functions. 390
Hair cells. 354. 355
innervation. 359.359.361
receptor potentials. 358. 358
semicircular canal. 380, 381
transduction, 356,357.358. 358-359, 360b
vestibular macula, 378-379,379.380
Hair follicles. 389. 391
Hairy skin, 388. 389
Hallucination. hypnagogic. 605b
Hallucinogens, 505
Handedness, 632
Hartline, Keffer, 298
Hearing. See Auditory system
Hearing loss. 376b. See also Deafness
Hebb. Donald, 733. 734
Hebb synapse. 710. 7/0.778
Hebbian modification, 710. 7/0
Helicotrema. 351.352
Hemianopia, bitemporal, 315b
Hemiballismus, 467
Hemiplegia, 456b
Hemisphere(s)
cerebellar, 216, 474. 474
cerebral, 215
left, language dominance, 630. 630
right
attention and, 648-649
language functions. 630. 630-631
Hermaphroditism, 535
Heroin, 526b
Herpes zoster virus, 396b
Hertz (Hz). 345
Hess, W. R., 580
Hetherington, A. w.. 514
Hindbrain
differentiation, 188-189, 188-/89
rhombencephalon of. 183. 184
structure-function relationships, 189-190,
190
Hippocampus, 196, 197, 212. 223. 740. 740
anatomy, 777.777-778
in emotion, 571
estradiol activational effect on, 556.
556-558, 557. 558b-559b
memory functions. 744-750. 745, 746.
748-750
neurogenesis. 693b
place cells. 747. 748
positron emission tomography of, 748.
748-749
radial arm maze studies, 745.745-746
regulation of HPA axis by. 669. 669-670.
670
in relational memory. 749-750, 750
responses to old and new stimuli, 745, 745
in spatial memory. 746-749. 748-750
synaptic plasticity, 776-786. 777-785
Hippocrates, 5
Histamine, 409
Hitzig, Eduard. 460
Hobson, Allan. 60 I
Hodgkin, Alan. 84
Hofmann. Albert. 505
Homeostasis
feeding behavior. 512-518
hypothalamus in, 484, 510-511
Homosexuality. 559-560, 560
Homunculus, 402. 402. 403
Horizontal cell. 288. 289
Horizontal eye movements, 383. 383-384
Horizontal intracortical connections, 323,
323
Horizontal plane. 170, 170
Horizontal sound localization. 368-371.
368-371
Hormones
pituitary, 488. 488t
sex. See Sex hormones
Horseradish peroxidase. 42b
Horvitz, Robert. 707
Hounsfields, Godfrey, 175-176
Hubel, David, 322. 324. 325. 326, 327, 329,
332.709.712
Hudspeth, A. J.. 358
Human Genome Project, 32b
Humoral response
to excessive adiposity. 515
in hypothalamic homeostatic regulation,
510
Hunger, 520
Huntingtin. 468b
Huntington's disease, 467, 468b-469b. 475b,
753
Huxley, Andrew. 84
Hydrocephalus. 175b
Hydrophilic substance, 54
Hydrophobic substance, 54-55
Hyman, Steven E., 664b
Hyperalgesia. 410-412. 411
Hyperekplexia. 127b
Hyperkinesia. 466, 467
Hyperopia. 286b. 287b
Hyperpolarization
hair cells. 358. 358
photoreceptor, 293. 294
Hyperreflexia, 456b
Hypertonicity, blood, thirst triggered by. 528.
529
Hypertrophy, muscle, 431
Hypnagogic hallucination. 605b
Hypocretin. in narcolepsy. 605b
Hypoglossal nerve. 232, 233
Hypokinesia, 466
Hypomania, 674
INDEX 845
Hypophysiotropic hormones. 488. 489
Hypothalamic-pituitary-adrenal (HPA) axis
in affective disorders. 676
regulation by amygdala and hippocampus.
669. 669-670. 670
in stress response. 668. 668-669
Hypothalamopituitary portal circulation, 488
Hypothalamus, 184. 185.211,218,220,
484-489
aggression and. 579, 579-580. 580
circadian rhythms and, 610-615. 611. 612.
613b, 614b. 615
control of anterior pituitary, 487-489, 489.
490
control of autonomic nervous system, 490.
496
control of posterior pituitary. 485-487.
486, 487
control of sex hormones, 539-540. 540
drinking behavior and, 527-529, 528. 529.
530t
emotion and, 571
feeding behavior and, 514-515, 515. 519t.
5301
control by lateral hypothalamic peptides.
518
leptin and, 515-518,516-518
serotonin and. 526. 527
food palatability and. 262
functions, 186-187, 484
homeostasis and. 484, 510-511
location. 484, 484
periventricular zone, 484-485. 485
sexual dimorphisms. 546-547. 547
sexual orientation and, 559-560. 560
structure and connections. 484-485, 485
temperature regulation and. 484. 529-530.
530t
Hypotonia, 456b
Hypovolemia. thirst triggered by. 527. 528
I-V plot. 120b
Ia axons. 393. 438-439
Ib axons, 443. 443
Illustrated Guide to Neuroanatomy, 205-235
Image formation, 283-284, 284-288. 286-288
Immediate early genes, 607
Immunocytochemistry, 135-137. IJ6
Implants. cochlear. 356b-357b
Implicit memory. 727
In situ hybridization. 137, 137
Incus. 348. 349
Inferior colliculus, 188, 2J 6.224.363-364,
364
Inferior olive, 225. 772. 773
Inferotemporal cortex. 210, 733-735, 735
Infiltration anesthesia, 95b
Infrasound, 346b
Inhibition
depolarization-induced suppression of,
151b
end-product. 145
lateral, somatic sensory system. 399b
reciprocal, 445, 445
846 INDEX
Inhibition (continued)
shunting, 127, /28
synaptic 126-129, /28,722
Inhibitors, 122
Inhibitory neurons
sources, 693, 694
in striate cortex, 321
Inhibitory neurotransminer, 120b
Inhibitory postsynaptic potentials (IPSPs),
117, /18, 126-127, 128
Inhibitory spinal interneurons, 445, 445
Inner ear, 347, 348,350,351-363. See also
Cochlea; Vestibular labyrinth
Inner hair cells, 354, 355, 359, 359, 361
Inner nuclear layer, 289, 290
Inner plexiform layer. 289, 290
Innervation, 39
Inositol- 1,4,5-triphosphate, 162, /62, 258,
258
Input specificity, 774
Institutional Animal Care and Use
Comminee, 17
In.strumental conditioning, 764-765
Insula, 209, 218, 220
Insulin, 522, 52\-522
Imulin shock, 521 b
Intensity, sound, 345, 346. 365. 365-366
Intention tremor, 475b
Interaural intensity difference, 369, 369
Interaural time delay, 368, 368-369, 370,
370-371,371
Interleukin -I. 606
Intermediate filaments, 38
Intermediate zone, 190, 19/,396,397
Internal capsule, 184, /85. 2\ 9. 22\
Internal carotid arteries, 234
Internal resistance, /25, 125-126
Interneurons, 46
spinal, 444-447
excitatory, 445--447, 446
inhibitory, 445, 445
rhythmic activity, 447--449, 448
Interpretation. in scientific process. 15-16
Interstitial nuclei of the anterior hypothala-
mus, 547, 559-560, 560
Intracellular fluid (cytosol). 28, 53-54, 54
Intracellular recording, 78b
Intrafusa[ fiber, 440, 441
Intralaminar nuclei, 415, 4/6
Intron, 30, 3/
Invertebrate models of learning, 765-771
advantages, 765, 765
associative learning in Aplysia, 768-771.
770, 770t, 77/
nonassociative learning in Aplysia,
765-768. 765-769
Involuntary movement, 475b
Ion channel. 58, 58-59
Ion pump, 59, 65-67, 66, 144b
Ion selectivity, 58, 117
Ionic bond, 54
Ionic concentration, 63
Ionic current, 120b
Ionic driving force, 63
Ionic equilibrium porential. 62, 62-64, 63, 64,
65b
Ions, 54, 54
distribution across membrane, 65-67, 66
movement, 59, 59-6 L 60, 6/
Ipsilateral. 170, 170
IPSPs (inhibitory postsynaptic potentials),
117,1/8
Isofrequency bands, auditory cortex, 373
Jackson, John Hughlings, 593
James-Lange theory of emotion, 564-565,
566
Jet lag, 610
Joints, proprioception from, 444
K
K complex, 596, 598
Kaas, Jon, 199
Kainate receptors, 139, 140, 154
Kandel, Eric, 765
Kapp, Bruce, 574-575
KarnL Avi, 601
Katz, Bernard, 102
Keratotomileusis, laser in-situ. 286b
Keratotomy, 286b
Kidney, brain and, communication between,
486--487, 487
Kinesis, 41, 41
Kinocilium, 378
Kleitman, Nathaniel. 595
Kliiver-Bucy syndrome, 571-572, 738
Knee-jerk reflex, 439--440. 441
Knockout mice, serotonin receptor, 581-582
KonwceJlular lateral genICulate nucleus,
316-317,3/8,322
KorsakolT's syndrome, 744
Krause end bulbs, 389
Krebs cycle, 34, 34-35
Krubitzer, leah, 198, 200b-20 I b
Ku[[[er, Stephen, 298. 324
Kuhl. Patricia, 636, 639b
Kuypers, Hans, 454
L
Labeled line hypothesis or taste perception,
263
Labia, 541, 542
Labyrinth, vesribuliJr. 376-378,377, 384,
456,457
Lamc acid, 409
Lamellipodia, 698, 698
Lange, Carl. 564-565
Language. 617-641
acquisition, 635-638, 638, 639b
animal,619b
aphasia and, 621-628. 6221. See also
Aphasia
brain area specialization, 618, 620,
620-621,621b
brain stimulation studies, 632. 632-633, 633
genetics. MOb
left hemisphere dominance, 630, 630
origins, 639b
processmg
anatomical asymmetry, 631, 631-632,
632
models, 625, 625-626, 626
neuroimaging studies, 633-635, 634,
635, 636b-637b
split-brain studies, 628-630, 628-63 I
right hemisphere functions, 630, 630-631
Laser in-situ keratotomileusis, 286b
Laser microscopy. 28b
Lashley, Karl. 731-733, 732
Lateral. 170, /70
lateral columns, 190, 191, /91. 228
Lateral fissure, 8, 209, 2 I 8, 220, 63 I, 631
Lateral geniculate nucleus, 223, 278, 313,
315-318
cortical projection, 313, 313
koniocellular layer. 316-317, 318,322
layers, 315, 316
magnocellular layer. 316, 3/8, 322
non retinal inputs, 318
output to striate cortex, 321-323,322
parvocellular layer, 316, 318, 322
receptive fields, 317
retmal rnputs, 316-317,317,318
segregation of retinal inputs to, 709-712.
710
Lateral horn, 228
Lateral hypothalamic peptides, 5 I 8
Lateral hypothalamic syndrome, 514, 515
Lateral inhibition, somatic sensory system,
399b
Lateral intraparietal cortex, 757, 757, 758
Lateral Jenmiscus, 363. 364
Lateral Jine organs, 377
Lateral pathways, 229, 453, 453, 454-455,
455, 459
corticospinal (pyramidal) tract, 189-190,
454, 455
lesions, 454--455
rubrospinal tract, 454, 455
Lateral surface of brain., 208-210
Lateral ventricle, 184, 185, 192, 192t, 2\ 3,
2 I 8, 220, 222
Lateral vestibular nucleus, 382, 382
LaureQl, Gilles, 274
Lawrence, Donald, 454
Learned fear, 574-576, 575, 576b
Learning. See also Memory
associative, 763-765, 764
in Aplysia, 768-77 L 770, 770t, 771
glutamate receprors in, 784-786, 785
habit, striatum in, 751-754, 752, 753
invertebrate models, 765-771
motor, Man-Albus theory of, 774
nonassociative, 763, 763
in Aplysia, 765-768, 765-769
procedural. 762-765, 763, 764
sleep, 601-602
and synaptic plasticity in cerebellar cortex,
772-776, 773-776
and synaptic plasticity in hippocampus,
776-786, 777-785
taste aversion, 262b
vertebrate models. 772-786
leary, Timothy, 505
LeDoux, Joseph, 575, 576b
Left hemisphere. language dominance, 630.
630
Left visual hemifield, 3/2,312-313
Lemniscus, 180t
Length constant. 125, /25
Lens, 282, 283, 284, 284, 286
Leptin, 515-516,5/6,517,518
deficiency, 514
replacement 513, 514, 514b
Lethal injection. 72b
LeVay, Simon, 559
Levels of analysis. in neuroscience. 13-14
Levi-Montalcini, Rita, 706
Levitsky. Walter, 631-632
LGN. See Lateral geniculate nucleus
Lidocaine, 95b
Ligand-binding studies, 139-141, /40
Light, 279, 279-280, 280
Light adaptation, 298
Light-dark cycle. 610
Light microscopy, 28b
Limbic lobe, Broca's, 568, 569
Limbic system, 571
Limbic system concept of emotion, 568-572,
569
Lindstrom, Jon M., 442b
Linear acceleration, 378
Lipid. 54--55
Lipostatic hypothesis, 5 13
Lisman, John, 788, 789b
Lithium, 678-679, 679
Livingstone, Margaret. 330, 331 b
LobectOmy, temporal, 571-572
Lobes, cerebral, 7, 8,194, /94.209
Lobotomy, frontal, 578b
Lobules, cerebellar. 474. 474
Local anesthesia, 95b
Locus, 180t
Locus coeruleus, 498-500, 500
Loewi, Otto, 102, 103b, 134
Lomo, Terje, 776-777
Long-term depression (LTD), 718, 720,72/
in CAI of hippocampus, 78/, 781-783, 782
in cerebellar cortex, 774--776, 774-776
glutamate receptor trafficking and, 784,
784
memory and, 784--786, 785
Long-term memory, 727, 729, 729
molecular basis, 787-791
persistently active protein kinases and, 787,
787-788, 789b
protein synthesis and, 788. 790.790-791
Long-term potentiation (LTP). 718, 719
in CAI of hippocampus, 778-780, 778-78/
glutamate receptor trafficking and, 783,
784
memory and. 784--786. 785
timing and, 782b
Lorenz, Konrad, 715b
Lovell-Badge, Robin, 535
Lower motor neurons, 426-432
alpha. 428-430. 429
autonomic, 492, 492
distribution, 427. 427-428, 428
motor unit types, 430-431, 43/
muscle innervation by, 426, 426
pathology, 456b
segmental organization, 426-428
LSD (lysergic acid diethylamide), 505
Lumbar puncture, 396
Lumbar spinal cord, 394. 395
Lumbar venebrae, 226. 227
Luria, Aleksandr, 728b
Luteinizing hormone (LR). 488t. 539, 540
M
M-type ganglion cell. 303-304. 304. 316.
3/8
MI. See Primary motor cortex
MacKinnon, Roderick, 68, 70b
MacLean, Paul, 571
Macula, 281. 28/
degeneration, 285b
vestibular. 378, 379, 379. 380
Magendie, Fraw;ois. 9-10
Magnetic resonance imaging (MRI). 176,
177b
author's brain, 202
functional, 176, 178b
attention to location, 649, 650
language processing, 633, 634
memory storage, 735, 737, 737
working memory. 756-757, 757
Magnetoencephalography, 588-589, 589
Magnocellular lateral geniculate nucleus,
316,3/8.322
Magnocellular neurosecretory neurons,
485-487, 486
Magnocellular pathway, 330. 330, 332
Major depression, 673, 677-679, 678, 679
Male genotype, 535
Ma!inow, Roberto. 783
Malleus, 348, 349
Mammalian nervous system, gross organiza-
tion, 168-178
Mammillary bodies, 214, 221, 743,743
Mania, 673-674
Manic-depressive disorder, 673-674
Marginal zone, 691. 692
Marin-Padilla, Miguel, 43b
Marr-Albus theory 01 motor learning, 774
Masculinization, brain, 549-550
Maternal behavior. brain plasticity and, 555,
555
Mating strategies, mammalian, 543
Matrix, mitOchondrial, 34, 34
Maze performance
effects of conical lesions, 731-733, 732
effects of hippocampal lesions, 745.
745-746, 746, 747b
MC4 receptor, 518, 5/8
McCarley. Roben. 60 I
McEwen, Bruce, 556
Mechanical nociceptors, 409
Mechanoreceptors, 389-392, 389-392
hair follicles, 389, 391
receptive fields. 389-390, 390
Mechanosensitive ion channels, 389
Medial. 170, /70
Medial dorsal nucleus, 272,272
Medial forebrain bundle, 580
INDEX 847
Medial geniculate nucleus, 223, 348, 348,
364. 364. 365
Medial lemniscus, 226, 397-398,398
Medial longitudinal fasciculus, 382, 382
Medial septal nuclei, 504. 504
Medial surface of brain, 211-213
Medial temporal lobe
cortical association area connections,
755
inputs, 741. 74/
in memory storage, 740-742, 740-743
Medial vestibular nucleus, 382, 382
Medical specialties associated with nervous
system, 14, 14t
Medulla, 188-189, /89.211. 214, 225, 226
Medullary pyramid, 189, /89, 225, 454, 455
Medullary reticulospinal tract, 457-458, 458
Meissner's corpuscle, 389, 389, 390, 390, 391,
391
Meissner's plexus, 495,495
Melanocyte-stimulating hormone, 515, 516,
517,519t
Melatonin, 539. 606
Melzack, Ronald, 416
Membrane currents and conductances,
80-82, 8/
Membrane differentiations, 106. 106, /09.
109
Membrane potential, 6/. 61-62. 120b. See
also Resting membrane potential
Membrane resistance, dendrites, /25.
125-126
Membrane trafficking, 116b
Memory, 725-759. See also Learning
consolidation, protein synthesis and, 788
declarative, 726-727, 727
limits. 728b
localization in neocortex, 733-737, 735
temporal lobe and. 738-750, 739-743,
745, 746. 748-750
distributed, 736b
implicit, 727
long-term. 727, 729, 729
molecular basIs, 787-791
persistently active protein kinases and.
787, 787-788, 789b
protein synthesis and, 788, 790,790-791
long-term depression or potentiation and,
784--786, 785, 786b
loss. See Amnesia
nondeclarative, 726-727, 727
procedural, 726-727, 727
striatum and, 751-754. 752. 753
recognition, 742
relational, hippocampus in, 749-750, 750
role of sleep, 601
short-term, 729, 729
spatial. and place cells. 746-749. 748-750
stOrage
dendritic spines and, 44b
diencephalon in, 743, 743-744
Hebb and the cell assembly, 733, 734
hippocampus in, 744--750, 745, 746.
748-750
inferotemporal cortex In, 733-735, 735
Lashley's studies of maze learning in
rats, 731-733, 732
848 INDEX
Memory (continued)
medial temporal lobe in, 740-742,
740-743
search for the engram, 731-738
structural plasticity and, 79]
temporal lobe in, 738-750, 739-743. 745.
746. 748-750
working, 729, 729
functional magnetic resonance imaging
01. 756-757, 757
hippocampus in, 749-750. 750
lateral imraparietal cortex (area LIP) in,
757. 757, 758
neocortex in, 754-757
prefrontal cortex in, 754-757. 754-757
"Memory" proteios, 44b
Mendell, Lome, 439
Meninges, 173-]74, 174
Menstrual cycle, 539-540
Mental illness. 661-686
affective disorders. 673-679
anxiety disorders, 665-672, 666t
biological approaches. 663-665. 664b
brain and, 661-665
genetics, 664b
psychosocial approaches, 663, 663
schizophrenia, 679-684
Mental retardation, 43b
Merkel's disks. 389, 389. 390, 390
Merzenich, Michael. 404
Mesencephalon. 183. 184. See also Midbrain
Mesocorticolimbic dopamine system, 503,
522-523, 523, 682
Mesoderm, 180, 181
Messenger ribonucleic acid (mRNA). 30
in situ hybridizalion, 137. /37
Metabolism, anabolic versus catabolic, 511,
512
Metabotropic receptors. See G-protein-
coupled receptors
Metric system, 25t
MGN (medial geniculate nucleus), 223, 348,
348, 364, 364, 365
Microelectrode, 61, 61
Microfilaments, 35. 38
Microglia. 48
Microionophoresis, 138. /38
Microscopy, 27, 28b
Microtubule-associated proteins (MAPs). 35,
36b-37b
Microtubules, 29, 35,35,40-41,41
Microvilli, taste cell. 254, 255
Mid-medulla, 226
Midbrain, 211, 214. 216, 222
aggression and, 580-581, 581
caudal. 224
cholinergic diffuse modulatory system aris-
ing from, 504, 504
differemiation, 187, 187-188
mesencephalon of, 183, 184
rostral. 224
structure-function relationships, 187-188
Middle cerebral artery, 234, 235
Middle ear, 347, 348-350, 349,350
attenuation reflex. 350, 350
componems, 348, 349
sound force amplification by, 348-349
Midline, ] 70, 170
Midsagittal plane, 170, 170
Migration, cell. 694, 694-695, 695
Miller, Chris, 68
Milner, Peter, 522
Miniature postsynaptic potential, 123
Mishkin. Mortimer, 742
Mitochondrion, 29. 34, 34-35
Mixed spinal nerves, 427
Mnemonist, 728b
Modiolus, 351
Modulation. 129, 129-130
Molarity, 60
Molecular biology, 31
Molecular layer, cerebellar cortex, 772. 773
Molecular neurobiologist, ] 5t
Molecular neurobiology, 31, 32b
Molecular neuroscience, 13
Molecular switch hypothesis of long-term
memory, 788, 789b
Moles, 60
Monaural neurons, 369
Monoamine hypothesis of affective disorders.
674, 676
Monoamine oxidase. ]46
Monoamine oxidase inhibitors. 677, 678
Monochromatic vision. 297b
Monocular deprivation
AMPA receptor loss after, 720, 721
ocular dominance after, 710, 712, 712-713,
713. 714
Monogamy, 543
Monosynaptic myotatic reflex, 439, 440
Monovalem ion, 54
Mood, serotonin and, 524, 526-527
Mood disorders. See Affective disorders
Moore, Tirin, 657-658
Monis water maze, 746, 746, 747b
Moruzzi, Giuseppe, 602
Mossy fibers, cerebellar, 772-773, 773
Motivalion. 510-531
dopamine in, 523, 523-524, 525b
drinking, 527-529, 528, 529
feeding. See Feeding behavior
hypothalamic responses, 510-511, 530t
reinforcemem and reward, 522. 522-523,
523. 524b
temperature regulation, 529-530
Motor (nonfluent) aphasia, 621-623, 622t
Motor areas, 198, 210
Motor cortex, 454, 455, 459-461. 460
area 6, 460. 461, 462-464. 463
primary, 210
coding of movement, 470. 470-472. 471
initiation of movemem, 468-472,
470-472
input-output organization, 469
planning of movement, 459-460, 460
Motor end-plate. I/O, 110-1] I
Motor leaming, Marr-Albus theory of, 774
Motor loop
basal ganglia, 465. 466. 466-468
lateral cerebellum, 476, 476-477
Motor map, malleable. 472. 472
Motor neuron pool. 428, 429
Motor neurons. 46
alpha, 428-430.429.430,441
distribution in spinal cord. 427. 427-428,
428
gamma. 440-441. 441, 443
lower, 426-432
upper, 456b
Motor planning, 459-464
motor cortex, 459-461. 460
neuronal correlates, 462-464, 462b, 463
posterior parietal cortex, 461
prefrontal cortex. 461-462
Motor programs, 424
Motor proteins. in outer hair cells. 361.
361-362
Motor strIp, 469
Motor system
central. See Central motor system
somatic. See Somatic motor system
Motor units. 428. 429
recruitment, 429-430
spinal control. 437-449, 439-448
types, 430-43], 431
Mouth, 253.253
MPTP. 468b-469b
Mucus, olfactory, 265, 265
Mullerian duct, 536-537, 537
Multinucleated muscle cells, 433
Multiple sclerosis. 19t, 96b
Multipolar neuron, 45. 45
Munk, Hermann. 11
Munro, Paul. 781
Muramyl. 606
Murphy, Diane, 557
Muscarine, 139
Muscarinic ACh receptors. 139, 497
Muscle comraction
calcium release, 433. 434
graded control by alpha motor neurons,
428-430, 429
molecular basis. 434-436. 434-437
sliding filament model. 434, 435
steps, 436
Muscle fibers, 424, 425
effects of activity on, 431
phenotype, 431
structure, 433, 433, 434
Muscle phenotype. 431
Muscle relaxation. 436
Muscle-specific kinase, 702, 704
Muscle spindles, 438-440, 439-441, 443, 443
Muscular dystrophy, 437b
Myasthenia gravis, 438b. 442b
Myelin. 47. 47. 96-97. 97
Myelin sheath. 47, 47, 96, 97
Myelinating glia, 47. 47-48
Myemeric plexus, 495, 495
Myofibril, 433, 433, 434
Myopia. 286b. 287b
Myosin, 434-435, 436
Myotatic reflex, 439-440, 440, 441
reciprocal inhibition in. 445, 445
reverse, 444, 444
N
Nakamura, Tadashi. 269
Naloxone, 418
Narahashi, Toshio, 89, 90b
Narcolepsy, 604, 605b
Nasal cavity, 253, 253
Nasal passages, 253, 253
Natural selection, II
Necrosis, 707
Negative symproms, in schizophrenia, 680
Neglect, child, affective disorders and, 676
Neglect syndrome, 407, 407--408, 647-649,
648
Neher, Erwin, 86, 88b
Nemero[f. Charles, 676
Neocorrex, 196, 197. See also Cerebral conex
areas, 197-199, 198, 199, 200b-20lb
cyroarchitectural map, 197, 198
evolution, structure-function relationships
and, 198-199, 199
working memory and, 754-757
Nernst equation, 64, 65b
Nerve block, 95b
Nerve cell. See Neurons
Nerve deafness, 376b
Nerve gas, 121 b
Nerve growth factor (NGF), 706
Nerve impulse. See Action potential
Nerves, 9-10, 180t
Nervous system
anatomical references, 168, 170, 170
anaromical subdivisions, 8
central. See Central nervous system (CNS)
disorders, 19-20, 19t
evolution, 1 I, 11-12, 12
patterns of communication, 482--483, 483
peripheral. See Peripheral nervous system
(PNS)
structure, 168-248
gross organization, 168-178
illustrated guide, 205-235
self-quiz, 235-248
Netrin, 699, 700,701b
Neural crest, 181. 181
Neural folds, 181, 181
Neural groove, 181, 181
Neural plate, 18'0-181, 181
Neural stem cell, 692, 692
Neural tube
defects, 182b-183b
[ormation, 180-182, 181
nutrition and, 182b-183b
primary vesicles, 182-183, 184
Neuraxis, 217
Neuregulin, 703
Neurites, 26, 26
estradiol effects on, 556, 556
growth, 698. 698-699, 699
neuronal classification based on, 45, 45
Neuroanatomist, 15t
Neuroanatomy, 168-248
cross-sectional
brain, 217-226
spinal cord, 229
illustrated guide, 205-235
auronomic nervous system, 230-231
blood supply of brain, 234-235
brain, 206-226
cranial nerves, 232-233
spinal cord, 226-229
self-quiz, 235-248
surface
brain, 206-2]6
spinal cord, 226-228
Neuroblast
differentiation, 696, 696
migration, 694, 694-695, 695
Neurochemist, ] 5t
Neuroethologist, 15t
Neurofibrillary tangles, 36b. 37b
Neurofilaments, 35, 38
Neurogenesis, 691-697
in adult brain, 693b
cell differentiation, 695-696, 696
cell migration, 694, 694-695, 695
cell proliferation, 69]-693, 692, 693b, 694
differentiation of conical areas, 696-697
Neurohistology, 25-27, 25-27
Neurohormone, 485
Neuroleptics, 682-683, 683, 684
Neurologist, ] 4t
Neurology, 662
Neuromuscular junction, 109-] II, I/O, 428,
438b
synapse formation, 702-704, 704
Neuromuscular matchmaking, 431
Neuron doctrine, 24-27
Neuronal membrane. 29. 35
electrical charge across. See Action poten-
tial; Resting membrane potential
Neuronal membrane transporter, ] 44b
Neurons, 12-13, 13
in Alzheimer's disease, 36b-37b
axons, 26, 26, 38, 38--41
classification, 45, 45--46, 46
collections of. 180t
cyroskeleron, 35. 35-38
dendrites, 26, 26-27, 41. 41--45, 42
electrical properties, 99b
functions, 24
genesis. See Neurogenesis
histology, 25-27, 25-27
prototypicaL 28--45
soma (cell body), 26,26, 28-35,29
Neuropathologist, 14t
Neuropeptide Y (NPY), 497, 5]6,517,518,
519t
Neuropharmacologist. 15t
Neuropharmacology, 121-] 22
receprors, 138-139, /39, 140, 140t
Neurophysiologist. 15t
Neurophysiology, behavioraL 462b
Neuroscience
animal research, 16-19, 18
hisrory, 4-13
levels of analysis, 13-14
overview, 4-21
Neuroscientists, 14-15
clinical, 14, 14t
experimentaL 14-]5, ]5t
Neurosecretory neurons, 485
magnocellular, 485--487,486
parvocellular. 488--489, 489. 490
Neurosteroids, 157, 157
Neurosurgeon, ] 41
Neurotechnology, 473b
Neurotoxins, ]21b, 73]b
INDEX 849
Neurotransmitter systems, 134-]65
chemistry o[ neurotransmitters, 141-152
divergence and convergence, 164, /65
elements, /34, 134-135
G-protein-coupled receptors and effectors,
157-164, 158-163, 158t
steps in studying, 135-141, /36-140
transmitter-gated channels, 152-157, 153,
155, 157
Neurotransmitters, 40, 134
autonomic nervous system, 492, 492, 493,
494, 496--497
chemistry, 14]-152
criteria, 13 5
localization, 135-137, 136, /37
neuronal classification based on, 46
release, 137-138
transporters. 144b
Neurotrophins, 706-707
Neurulation, 180-]82, 181
Newsome, William, 334-335
Nicoll, Roger A., 150b-]51b, 783
Nicotine, 139, 526b
Nicotinic ACh receptors, 122, 139, 152, 153,
497
Nightmare. 599b
Nissl bodies, 25, 25, 33
Nissl stain, 25, 25
Nitric oxide, 151
NMDA-gated channels, 154-155, 155, 156
NMDA receptors, 139, 140. 154, /55
characteristics, 717, 717-718
in hippocampal long-term depression, 782,
782
in hippocampal long-term potentiation,
779-780, 781
in learning and memory. 784-786, 785
in long-term synaptic potentiation, 718,
719
in schizophrenia, 683, 684, 685
in spinal interneurons, 447, 448
Nociception, 408
Nociceptors
convergence of input from viscera and
skin, 412.413
hyperalgesia and, 410--412, 411
spinal connections, 412, 412
and transduction of painful stimuli,
408--412,411
types, 409--410, 410b
Node of Ranvier. 47, 47, 96, 97
Nogo, 705b
Non-neuronal cells, 48
Non-REM sleep, 595, 595t
falling asleep and, 603
physiological changes during, 596, 597, 598
Nonassociative learning, 763, 763
in Aplysia, 765-768, 765-769
Nondeclarative memory, 726-727, 727
NonM-nonP ganglion cell, 304, 317,318
Nonpolar covalent bonds, 54
Noradrenergic diffuse modulatory system,
498-500,500.672,716,716
Noradrenergic neurons, 134
Norepinephrine, 112
in autonomic function, 497
chemistry, 143,143, 145, 145-146
850 INDEX
Norepinephrine receptors
alpha. 140t. /61. 162
beta, /29. 129-130, 1401, /6/, 161-162
Norepinephrine-selective reuptake inhibitors.
677. 678
Notch-I protein, 692, 692
NPY (neuropeptide V). 497,516,5/7,518,
519t
Nuclear envelope, 30
Nucleus. 29. 30-31. 180t
Nucleus of the solitary tract. 226, 496,
520-521,521
Numb protein. 692, 692
Nung Jan, Lily and Yuh, 67
Nutrition, neural tube and, 182b-183b
o
Db gene. 513
Db/ob mouse, 513,5/3.5/4
Obesity
energy balance and, 511,5/2
hypothalamus and, 514,5/5
leptin and, 514
Object color analysis. 329, 332. 336
Object motion analysis, 326, 330, 334. 335.
335-336
Object shape analysis, 326, 332, 336
Observation, in scientific process, 15
Obsessive-compulsive disorder, 666, 666t
Occipital lobe, 8, 194, /94. 209
Ocular dominance columns, 322. 322-323,
325, 328
Ocular dominance plasticity. 710, 712,7/2.
713,714
Ocular dominance shift. 712. 713
Oculomotor nerve, 232, 233
Odor discrimination task, effects of hip-
poca mpa I lesions, 750, 750
Odor identity, 264b
Odorant receptor proteins, 267-268, 268
Odorants, 265
OFF bipolar cell, 299, 300, 300
OFF-center ganglion cell. 302, 302-303.
303
OR-center striatal cell. 327, 327
Ohman, Arne, 567
Ohm's law, 60
Ojemann, George. 633
O'Keefe, John, 746-747
Olds, James, 522
Olfaction. 252. See alm Smell
Olfactory bulb. 184, /85,208, 214,265.266,
269-272. 270-272
accessory, 264b
Olfactory cortex, 196, /97, 271, 272
Olfactory epithelium. 265. 265
Olfactory maps, 272-274,273
Olfactory nerve, 232, 233. 265. 266
Olfactory population coding. 269, 272
Olfactory receptor cells, 265, 265-269.
266-269
Olfactory system. accessory, 264b
Ollactory temporal coding, 274
Olfactory tubercle. 272. 272
Oligodendroglial cell, 47. 47---48
differentiation, 696
sources. 693, 694
Olton, David. 745
ON bipolar cell, 299, 300. 300
ON-center ganglion cell. 302
ON-center striatal cell, 327, 327
Ophthalmoscope, 281, 28/
Opiate receptors, 140, /40. 418
Opiates, endogenous, 417---418
Opsin. 294. 295. 296
Optic chiasm, 214, 3/1. 311-312.3/2,313.
3/4
Optic disk, 281. 28/
Optic nerve, 214. 232, 233, 280, 280. 31/,
311-312
development. 184
lesions, visual field deficit from, 313. 3/4
Optic radiation. 313. 313
Optic tectum, 187-188,216.224,3/4.
314-315,457.457,472
Optic tract. 214, 3/ /. 312
lesions, visual field ddicit from, 313, 314
targets
nomhalamic. 313-315,3/4
thalamic. 313,3/3,315-318,3/6-3/8
Optic vesicles. 184. 184
Optical imaging, 326, 328b
Optics, 279-280, 280
OrbilOfrontal cortex, 272,272
Orexigenic peptides, 516.5/7,518, 519t
Orexin. 518, 519t
Organ of Corti, 351, 35/. 354--356, 355
Organ of tl1e lamina terminalis, 528, 529
Organelles, 28
Organizational effects. sex hormones, 550
Organophosphates, 121 b
Orgasm. 543
Orientation column, 326, 332
Orientation seleCtIvity, visual. 325, 325-326.
326, 328b
Orthodromic conduction, 93-94
Oscillator. in generation of brain rhythms,
591. 591
Oscilloscope, 76. 77. 78b
Osmometric thirst. 528. 529
Ossicles, 347, 347. 348-349, 349
Otoacoustic emissions. 362b
Outer ear, 347, 348
Outer hair cells, 354, 355
amplification by, 36/. 361-363. 362b
innervation, 359, 359, 361
Outer nuclear layer, 289. 290
Outer plexiform layer, 289. 290, 299-300,
300
Outer segment layer of photoreceptors. 289,
290
Oval window, 347, 347. 349, 351,352
Overshoot. 76, 77.91
Oxytocin, 485---486, 544--545, 545
p
P-type ganglion cell, 303-304,304,316.
3/8
Pacemaker, in generation of brain rhythms.
590, 590, 591. 592
Pacemaker activity, in spinal interneurons,
447
Pacinian corpuscle, 389, 389. 390, 390
frequency sensitivity, 391. 391
vibration sensitivity, 391, 391-392
PAG (periaqueductal gray matter), 224, 416,
4/7, 581. 58/
Pa in, 408---418
ascending pathways, 413---415, 414-4/6
congenital absence of. 409b
first and second, 412, 4/2
gate theory, 416
versus nociception. 408
peripheral mediators, 408---412, 41/
primary a[[erents and spinal mechanisms,
412.4/2.413
referred, 412, 4/3
regulation. 415---418, 4/7
spinothalamic pathway, 413---414,414, 4/5
thalamus and cortex, 415, 4/6
transduction, 408 412,4/1
trigeminal pathway, 415
Palatability, 262, 262b
Palate, 253,253
Panic attack, 665-666
Panic disorder, 666. 666t
agoraphobia with, 666, 667b
benzodiazepine binding in, 671, 671
Papez circuit. 568-569, 569. 571
Papilla, 253, 254
Pappenheimer. John, 606
Parabiosis, 513,5/3
Parahippocampal cortex, 740, 741
Parallel fiber, cerebellar cone x, 773, 773, 775,
775
Parallel patl1ways, striate cortex, 330, 330,
332
Parallel processing
in retina, 306
visual perception and, 339-340
Paralysis, 456b
during REM sleep, 596
Paranoid schizophrenia, 680
Paraphasic error, 622
Paraplegia. 456b
Parasympathetic nervous system, 230,
490---491, 492---496,493,495
in sexual response cycle, 541-542, 542
Parasympathomimetic drug, 497
Paraventricular nucleus, 516. 517
Parenting, neurochemistry, 545
Paresis. 456b
Parietal cortex, posterior, See Posterior pari-
eta cortex
Parierallobe, 8, 194, /94. 209. 220, 222
Parkinson's disease, 19, 191, 145-146.
466---467. 468b---469b, 475b
procedural memory in, 753, 753-754
Partial seizure, 592-593, 594
Parvo-interblob pathway, 330,330, 332
Parvocellular lateral geniculate nucleus, 316.
318. 322
Parvocellular neurosecretory neurons,
488---489, 489, 490
Patch-clamp method, 86, 88b
Pavlov, Ivan, 763
Penfield, Wilder. 402, 459, 461, 632, 737
Penis, 541, 542
Peptide bonds, 57, 57
Peptide neurotransmitters, 111-112, lIlt,
112
release, 115
synthesis and storage, 113, 113
Peptidergic synapses, 134
Perforant path, 777
Periaqueductal gray matter, 224, 416, 417,
581,581
Perikaryon, 26
Perilymph, cochlear, 352
Peripheral nerves, 392, 392
Peripheral nervous system (PNS)
axon regeneration, 705b
axons, 173
historical views, 7, 8
somatic, 172-173
structure, 172-173
visceral. See Autonomic nervous system
(ANS)
Perirhinal cortex, 740, 741. 742
Periventricular zone of hypothalamus,
484-485,485
Persistently active protein kinases. 787,
787-788, 789b
Peters, Alan. 47
Peterson, Steven, 651
Peyote, 505
Phantom limb sensations, 405--407, 406b
Pharynx, 253, 253
Phase locking, auditory nerve, 367, 367-368
Phencyclidine (PCP), 683, 684
Phenotype, muscle, 431
Phentolamine N-methyltransferase, 146
Phenylketonuria (PKU), 43b
Pheromone, 264, 264b
Phosphodiesterase, 294-295, 295
phospholipase C, 162, 162
in cerebellar long-term depression, 775,
775
in taste transduction, 258,258
Phospholipid bilayer, 55, 55
Phospholipid membrane, 54-55,55
Phosphorylation, 129, 129, 162-163, 163,787
Photopic retinal conditions, 290
Photopigment, 290
Photoreceptors
adaptation. 296. 298
information processing system, 288-289,
289
light-sensitive ganglion cell, 611, 614b
outer segment layer, 289, 290
pathways to bipolar cells, 298-300,300
regional differences, 290-292,291,292
structure, 290, 290
transduction, 292-298. 293-295
Photorefractive keratotomy, 286b
Phototransduction, 292-298, 293-295
in cones, 296, 296, 297b
dark adaptation, 296, 298
light adaptation, 298
in rods, 292-295, 293-295
signal amplification in, 295
Phrenology, 10, 10
Physiological psychologist, 15t
Physiological tremor, 475b
Pia mater, 174, 174
Pigmented epithelium, 289, 290
Pineal body, 216
Pineal gland, 7, 7
Pinna, 347,347. 371-372,372
Pioneer axon, 699
Pitch, 346
Pituitary. See also Hypothalamic-pituitary-
adrenal (HPA) axis
control of sex hormones, 539-540, 540
hormones, 488, 488t
hypertrophy, visual abnormalities in, 315b
hypothalamic control. 485--489, 486, 487,
489, 490
location, 484, 484
Place cells, spatial memory and. 746-749,
748-750
Place field, 747-748, 748
Planum temporale, hemispheric asymmetry,
632, 632
Plasticity
cortical somatotopic map, 404-407, 405,
406b
synaptic. See Synaptic plasticity
PNS. See Peripheral nervous system (PNS)
Polar covalent bonds, 53
Polar solvent, water as, 53, 54
Polyangry, 543
Polygyny, 543
Polymer, 35
Polymerization, 35
Polymodal nociceptors, 409
Polypeptide, 57,57
Polyribosomes, 29, 33
Polysynaptic muscle actions, 444-445
Pons, 188, 188,211,214,216,225
cholinergic diffuse modulatory system aris-
ing from, 504, 504
[unctions, 189
Pontine nuclei, 225, 476, 476
Pontine reticulospinal tract. 457--458. 458
Pontomesencephalotegmental complex, 504,
504
Population coding
smell, 269, 272
taste, 263
Population vector, 471, 471
Pore loop
potassium channel. 68. 69
sodium channel. 84, 86
Positive symptoms, in schizophrenia, 680
Positron emission tomography (PET), 176,
178b-179b
attention to features, 651, 651, 652
language processing, 634-635, 635
REM sleep, 603-604, 604
spatial navigation, 748, 748-749
Post-genomic era, 32b
Post-traumatic stress disorder, 491b, 670
Postabsorptive state, 511, 512
Postcentral gyrus, 209
Posterior, 168, 170
Posterior cerebral artery, 234, 235
Posterior communicating artery, 234
Posterior parietal cortex, 210, 401, 401,
407--408
area 5, 461
INDEX 851
area 7, 461
attention and, 648, 652, 652-654, 653b,
655
lesions, 407, 407--408
motor planning and, 461
Posterior pituitary, 485--487, 486, 487
Postganglionic neurotransmitters, 492, 492,
493, 497
Postsynaptic density, 106, 106
Postsynaptic neuron, 103
Postsynaptic potential, 104-105, 105
Potassium, 54, 65b, 66, 71, 71. 608
Potassium channel. 67-71
atomic structure, 68. 69, 70b
calcium-activated, in spinal interneurons,
447,448
in hair cell transduction, 358-359,359
pore loop, 68, 69
in sensitization of gill-withdrawal rel1ex in
Aplysia, 767-768, 768
Shaker. 68, 69
in taste transduction, 257, 258
voltage-gated, 91
Potassium chloride, lethal injection, 72b
Potassium current and conductance, 80---82,
81
Potassium ions, in pain transduction, 408,
41l
Potassium spatial buffering, 71, 71
Potter, David, 102
Prandial state, 511, 512
Precentral gyrus, 209, 460
Precursor cell. 692. 692
Predatory aggression, 577, 580
Prefrontal cortex, 210, 754
in motor planning, 461--462
in working memory, 754-757, 754-757
Preganglionic neurotransmitters, 492, 492,
493, 494, 496--497
Premotor area, 210, 460. 461, 463, 463--464
Preoptic area of hypothalamus, sexual
dimorphisms, 546-548, 547
Presbyopia, 286b
Prest in, 361-362, 363
Presynaptic element, 105, 106
Presynaptic neuron, 103
Pribram, Karl. 577
Primary auditory cortex, 348, 348, 372,
373
Primary brain vesicles, 182-183, 184
Primary gustatory cortex, 259,260
Primary motor cortex, 210
coding o[ movement, 470, 470--472, 471
initiation of movement, 468--472, 470-
472
input-output organization, 469
planning of movement, 459--460, 460
Primary protein structure, 57, 57
Primary sensory area, 198
Primary somatosensory cortex, 398,398,401,
401,402
Primary visual cortex, See Striate cortex
Probe, hybridized, 137, 137
Procedural learning, 762-765, 763, 764
Procedural memory, 726-727, 727, 751-754,
752, 753
Progesterone, 538, 539
.
852 INDEX
Programmed cell death, 468b, 706,706-707
Prolactin, 488t
Proliferation, cell, 691-693, 692, 693b, 694
Promoter, 30, 31
Propranolol, 497
Proprioception, 438
from Golgi tendon organs, 443, 443-444,
444
from joints, 444
from muscle spindles, 438-440, 439-441
Proprioceptor, 438
Prosencephalon, 183, 184. See also Forebrain
Prosopagnosia, 337
Prostaglandins
in brain masculinization, 549-550
in pain transduction, 411, 4Il
Protein kinase A, 162, 767, 768
Protein kinase C, 162, 162, 775, 775
Protein kinases, 129, 129, 162-163, 163
autophosphorylating, in long-term memo-
ry, 788, 789b
persistently active, long-term memory and,
787, 787-788, 789b
Protein phosphatase, 163, 163
Proteins, 30
channel, 58, 58-59
membrane potential and, 55-59
"memory," 44b
structure, 56, 56-58, 57
synthesis, 30, 33. 33-34
long-term memory and, 788, 790,
790-791
Protomap hypothesis of cortical differentia-
tion, 696-697
Proximal muscles, 426
Prozac, 671
PSD-95, 783-784, 784
Psilocybe mushroom. 505
Psychiatrist, 14t
Psychiatry, 662
Psychoactive drugs, 504-507, 506
Psychoanalysis, 663
Psychobiologist, 15t
Psychological motivation, feeding behavior,
522-527
Psychophysicist 15t
Psychosurgery, 577-578, 578b
Psychotherapy, 663
for affecrive disorders, 677
for anxiety disorders, 670
Pufferfish, 89, 90b, 108b
Pulvinar nucleus, 657, 657
Pupil, 280, 280
Pupillary light reflex, 287-288
Purinergic (ATP) receptors, 148, 154
purkinje cells, cerebellar, 772, 773
Purpura, Dominick, 43b
Putamen, 219, 221, 464, 465, 466, 466
Pyramidal cell. 45,46, 99b
differentiation of neuroblast into, 696,
696
electrical fields generated by, 587, 587
layer V, primary motor cortex, 469
sources, 693, 694
in striate cortex, 321. 321, 323
Pyramidal decussation, 190, 190
Pyramidal tracr, 189-190,454,455
Q
Quadriplegia, 456b
Quaternary protein structure, 57, 57-58
R
R group, amino acid, 56, 57
Radial arm maze task, 745, 745-746, 751
Radial glial cell, 694, 694
Radial intracortical connections, 323, 323
Radial keratotomy, 286b
Radiation
acoustic, 372
electromagnetic, 279, 279
optic, 313, 313
Rakic, Pasko, 707
Ramachandran, Vilayanur 5., 405-407, 406b
Ranson, S. W., 514
Raphe nucleus, 225, 416, 417,501. 501
Rapid eye movement sleep. See REM sleep
Rapsyn, 702-703, 704
Rate-limiting step, 143, 143
Ray, light, 279-280, 280
Reacrion time, visual attention effects on,
647, 647
Receptive fields, 299
auditory, 373, 373-374
binocular, 324-325
bipolar cell, 299-300, 300
center-surround, 300, 302, 302, 305, 305,
324
ganglion cel!, 302, 302-303, 303
lateral geniculate nucleus, 317
mechanoreceptors, 389-390. 390
posterior parietal cortex, 407
somatosensory cortex, 402-404, 402-405
striate cortex, 324-329, 325, 326, 327, 329
visual pathway organization and, 330-333,
331b
visual perception and, 337-339
Receptor agonists, 122, 139
Receptor antagonists. 122, 139
Receptor potential
hair cell, 358, 358
Pacinian corpuscle, 391, 391-392
taste cell, 255,255
Receptors, 41,55,138-141
ligand-binding studies, 139-141, 140
molecular analysis, 141
neuropharmacology, 138-139, /39. 140,
140t
subtypes, 138, 141
Reciprocal inhibition, 445, 445
Recognition memory, 742
Recurrent collaterals, 38
Red-green color opponency, 305, 305
Red nucleus, 188,224,454,455
Reducrionist approach, 13
Referred pain, 412, 413
Reflection. light 280, 280
Refraction
corneal, 283-284, 284
light, 280, 280
Refractory period, 80, 91
Reinforcement 522, 522-523. 523, 524b
Reissner's membrane, 351. 351
Relational memory, 749-750, 750
Relative refractory period, 80, 92
Relay nuclei. 398
REM rebound, 60 I
REM sleep, 595-596, 595t
[unctions, 600-602
mechanisms, 603-604, 604
physiological changes during, 596, 597,
598
REM sleep behavior disorder, 604
Renaissance, beliefs about brain during, 6-7,
6--8
Renin, 486, 487
Replication, in scientific process, 15
Reproductive behavior, neurochemistry, 544,
544-546, 545
Reproductive organs
bidirecrional interactions between brain
and, 540
development, 536-537, 537
neural control, 541-546, 542. 544,545
Research proposals, animal welfare review,
17
Resting membrane potential, 53-7]
calculation, 67, 68b
cytosol and extracellular fluid, 53-54, 54
equilibrium potentials, 62, 62-64, 63, 64,
65b
ion distribution, 65-67, 66
ion movement. 59. 59-61. 60. 61
ion permeabiJities, 67-71, 68b
ionic basis, 61-71
measurement. 61, 61-62
phospholipid membrane, 54-55,55
protem molecules, 55-59, 56, 57, 58
Resting tremor, 475b
Reticular acrivating system, ascending, 501.
602-603, 603
Reticular formation, 225, 457-458,458
Reticular lamina, 354, 355
Reticular theory of brain, 27
Reticulospinal tracts, 457-458, 458
Retina, 278
basic information processing, 288-289, 289
cell layer nomenclature, 289, 290
detached, 285b
development, 184
duplex nature, 290
laminar organization, 289, 289-290
light-sensitive ganglion cells in, 611, 614b
microscopic anatomy, 288-292, 289-292
ophthalmoscopic appearance, 281,281
output, 300, 302-306, 316-317, 317, 318
parallel processing, 306
photoreceptor strucrure and regional dif-
ferences, 290, 290-292,291,292
phototransduction, 292-298, 293-295
processing, 298-300,300, 30lb
signal amplification, 295
Retinal. 294, 295
Retinitis pigmentosa, 285b
Retinofugal projection, 310-315, 3Il-314
lesions, visual field deficits from. 313,314,
315b
optic chiasm, 311, 311-312
optic nerve, 311, 311-312
optic tract, 311, 312
targets of optic tract 313,313-315,314
visual hemifields, 312,312-313
Retinogeniculocortical pathway, 313, 313,
690, 690
Retinohypothalamic tract, 611
Retinotectal projection, 315
Retinotopy, 319-320, 320, 325, 700, 702, 703
Retrograde amnesia, 730, 730
Retrograde messengers, 148, 148
Retrograde transport, 41, 42b
Reuptake, neurotransminer, 119
Reversal potential, 120b
Reverse myotatic reflex, 444, 444
Reward, 522, 522-523, 523, 524b
Rhinal cortex, 740, 741, 742
Rhinal fissure, 196, 197
Rhodopsin, 294, 295
Rhombencephalon, 183, 184. See also
Hindbrain
Rhythms, brain. See Brain rhythms
Ribosomes, 29, 31, 33, 33-34
Rich, Nola, 362
Right hemisphere
attenlion and, 648-649
Ianguag functions, 630, 630-631
Right visual hemifield, 312, 312-313
Rigor mortis, 436-437
Rising phase of action potential, 76, 77. 91
RNA polymerase, 30
RNA splicing, 30, 31
Robinson, David, 652, 653b
Rod photoreceptors
regional differences, 290-292, 291,292
structure, 290, 290
transduction, 292-295, 293-295
Rods of Corti. 354, 355
Roland, Per, 461
Roman Empire, beliefs about brain, 5-6, 5-6
Rostral. 168, 170
Rostral hindbrain, 188, 188
Rostral medulla, 225
Rostral midbrain, 224
Rough endoplasmic reticulum (rough ER),
29, 31,33,33-34
Round window, 351,352
Rubrospinaltracl. 454, 455
RuHini's endings, 389,389, 390,390. 391,
391
Ruggero, Mario, 362
s
SI (primary somatosensory cortex), 398, 398,
401,401, 402
Saccule, 377, 378-379,379,380
Sacks, Oliver, 407-408
Sacral spinal cord, 394, 395
Sacral spinal nerves, 230, 231
Sacral vertebrae, 226, 227
Sagittal plane, 170, 170
Sakmann, Bert, 88b
Saltatory conduction, 97, 97
Saltiness, 253, 256, 257
Sanes, Jerome, 472
Sarcolemma, 433, 433, 434
Sarcomere, 434, 434
Sarcoplasmic reticulum, 433, 433, 434
Satiety cues, 519-522, 520-522
Saxitoxin, 89
Scala media, 351, 351
Scala tympani, 351,351
Scala vestibuli, 351,351
Schaffer collateral, 777
Schizophrenia, 19t, 20, 679-684
biological bases. 680-683
description, 679-680
dopamine hypothesis, 682, 682-683, 683
genetics, 680-681, 681
glutamate hypothesis, 683, 684, 685
treatment, 684
Schwann, Theodor, 12
Schwann cells, 47, 47-48
Scientific process, I 5-16
Sclera, 280, 280
Scotopic retinal conditions, 290
Second messenger, 118, 119
Second messenger cascades, G-protein-cou-
pled effector systems, 161, 161-162,
162
Second-order sensory neurons, 397
Second pain, 412, 412
Secondary protein structure, 57, 57
Secondary sensory area, 198
Secretory granules, 105-106, 106, 107
Secretory hypothalamus, 484-489. See also
Hypothalamus
Section, anatomical, 170
Segal, Menachem, 557
Seizures, epileptic, 592-594, 594
Selective serotonin reuptake inhibitors,
671-672, 672, 677, 678
Selectivity filter
potassium channel, 68, 69
sodium channel, 84, 86
Self-stimulation of brain, electrical, 522,
522-523, 523, 524b
Semaphorin 3A, 696, 696
Semicircular canals, 377, 378, 379-381, 381
Sensitization, 763, 763
of gill-withdrawal reflex in Aplysia,
767-768, 767-769
Sensorimotor system, 453
Sensory area aphasia, transcortical, 622t
Sensory areas, 198, 210
Sensory map, olfacrory, 272-274, 273
Sensory nerve endings, 97, 98
Sensory neurons, 46
Septal area, 219, 524b
Serotonergic diffuse modulatory system, 50 I,
501, 672
Serotonin
aggression and, 581-582
in appetite regulation, 499b
chemistry, 146, 147
relationship ro food and mood, 524,
526-527, 527
in sensitization of gill-withdrawal reflex in
Aplysia, 767, 768
Serotonin receptor knockout mice, 581-582
Serotonin reuptake inhibitors, 671-672, 672,
677, 678
Sex, 533-561
gender and, 533-537
INDEX 853
genetics, 535, 535-536, 536
Sex chromosomes, 535, 535-536, 536
Sex hormones, 537-540
activationa[ effects, 551, 552b, 553-558,
555-557, 558b-559b
in aggression, 577
brain sensitivity to, 549-554, 550
mismatches between chromosomes and,
551, 553b
organizational effects, 550
pituitary and hypothalamic control.
539-540, 540
principal, 538, 538-539
Sexual arousal, 541
Sexual behavior
mammalian mating strategies, 543
neural basis, 541-546,542,544,545
Sexual differentiation, 536-537, 537, 553,
553-554
Sexual dimorphisms, 546
central nervous system, 546-548, 547
cognition, 548, 548-549
Sexual orientation, 559-560, 560
Sexual response cycle, 541-543, 542
Sexually dimorphic nucleus, 547, 547
Sham rage, 579, 579-580, 580
Shatz, Carla, 709
Sherringron, Charles, 102,460-461
Shingles, 396, 396b
Short-term memory, 729, 729
Shunting inhibition, 127, 128
Signal amplification, 163, 163-164
in phorotransduction, 295
in somatic sensory system, 399b
Silva, Alcino, 785, 786b
Simple cell, striate cortex, 327, 327
Simple reIlex, 52, 52
Size principle of moror unit recruitment, 430
Skeletal muscle
innervation, 426, 426
structure, 424. 425
terminology, 425-426
Skin
convergence of nociceptor input from vis-
cera and, 412, 413
layers, 388, 389
mechanoreceptors, 389-392,389-392
primary afferent axons, 392-394, 393
two-point discrimination, 392, 392
types, 388, 389
Skinner, B. E, 663
Sleep, 594-607
circadian rhythm, 609. 609-610
definition, 594
deprivation, 599-600, 600b
in dolphins. 598, 598-599
dreaming and. 600-602
factors promoting, 606
functions, 598-600
gene expression during, 606-607
initiation, 603
neural mechanisms, 602-607, 603,604
requirements, 597
states, 594-596, 595t
Sleep cycle, 596-598, 597, 598
Sleep-learning, 601-602
Sleep paralysis, 605b
854 INDEX
Sleep spindle, 596, 598
Sleep talking, 599b
Sleep terrors, 599b
Sleepiness, excessive daytime, 605b
Sleepwalking. 599b
Slot proteins. 783
Slow axoplasmic transport. 40
Slow motor units, 430
Slow-wave sleep, 595
Smell. 263-274
central pathways. 269-272, 270-272
organs, 265, 265
spatial and temporal representations,
272-274,273,274
transduction mechanisms. 266-269,
266-269
Smooth endoplasmic reticulum (smooth ER).
29,34
Smooth muscle, 424
Snake venom, 121 b
SNARE peptide, 116b
Snellen eye chart. 288
Snyder, Solomon, 140
Society for Neuroscience. 4
Sodium, 54. 65b. 66
Sodium channel
amiloride-sensitive. in taste transduction,
256, 257, 257
cGMp-gated, in phototransduction. 293,
294
voltage-gated, 84-89, 85, 86. 87, 90b
Sodium current, 82, 83
Sodium-potassium pump, 65-66, 66
Soma, 26, 26, 28-35, 29
Somatic motor nerves. 181
Somatic motor response
to excessive adiposity, 516
in hypothalamic homeostatic regulation,
511
Somatic motor system, 172-173, 424--449
excitation-contraction coupling. 432-437.
433--436
lower motor neurons, 426-432
alpha, 428-430, 429
distribution, 427. 427-428, 428
motor unit types. 430-431,431
muscle innervation by. 426. 426
segmental organization, 426-428
spinal control of motor units, 437-449,
439--448
gamma motor neurons. 440-441, 441.
443
generation of walking programs.
447-449. 448
proprioception from Golgi tendon
organs, 443. 443-444. 444
proprioception from muscle spindles,
438-440, 439--441
spinal imerneurons. 444--447, 445. 446
Somatic sensation, 387
Somatic sensory system, 387-421. See also
specific components. e.g.. Pain
ascending pathways. 414, 415
lateral inhibition, 399b
pain, 408-418
primary afferent axons, 392-394, 393
proprioception. 438-439. 439
temperature, 418-421
touch. 388-408
Somatosensory cortex, 210,40/--407.
401-408
columnar organization, 398, 398, 401.
401-402, 402
plasticity, and matemal behavior, 555. 555
primary (SI). 398, 398.401. 40/. 402
receptive fields. 402-404, 402--405
Somatotopy
cortical. 402-404, 402-405. 404--407. 405.
406b
precentral gyrus, 460
Somites, 181. /8/
Somnambulism, 599b
Somniloquy, 599b
Sound. See also Auditory system
basilar membrane response to, 353.
353-354, 354
frequency encoding. 366, 366-368, 367
intensity encoding, 365, 365-366
localization, 368-372
deficits, 375
in horizontal plane. 368-371.368-371
in vertical plane. 371-372,372
nature of. 344-346, 345, 346b
Sound force amplification, by ossicles,
348--349
Sound waves
frequency, 344-345. 345
intensity, 345. 346
Sourness, 253, 257, 257-258
Spasticity, 456b
Spatial maps, olfactory, 272-274,273
Spatial memory, and place cells, 746-749,
748-750
Spatial summation, 123-124, 124
Speech. See Language
Sperry, Roger, 628-629. 702
Spider venom. 121b
Spike-initiation zone. 97, 98
Spina bifida, 182b, 183b
Spinal accessory nerve. 232. 233
Spinal anesthesia, 95b
Spinal canal. 190, /9/,213,226
Spinal control of motor units. 437-449.
439--448
gamma motor neurons. 440-441, 44/. 443
generation of walking programs. 447-449.
448
proprioception from Golg! tendon organs.
443. 443-444, 444
proprioception from muscle spindles.
438-440, 439--44/
spinal interneurons, 444-447, 445, 446
Spinal cord, 8, 394-397
cross-sectional anatomy, 229
descending tracts. 453-458
differentiation, 190-191, /9/
motor neuron distribution in, 427.
427-428. 428
segmental organization, 394-396.394-396
sensory organization, 396-397, 397
structure. 171-172, /72.393
structure-function relationships, 190-191
surface anatomy, 226-228
Spinal interneurons, 444--447, 445. 446
excitatory, 445-447, 446
inhibitory, 445, 445
rhythmic activity. 447-449. 448
Spinal motor programs for walking,
447-449, 448
Spinal nerves, 9, 9-10, 394, 394
anatomy, 172, 172. 226, 227, 228, 230,
231
mixed, 427
Spinal paralysis, 19t
Spinal roots, 9. 9-10
Spinal segments, 394-396,394-396, 427
Spinal shock, 456b
Spinal tap, 396
Spinal trigeminal nucleus, 415
Spinothalamic pathway. 413-414, 414. 415
Spinothalamic tract, 229
Spiny neuron, 46
Spiny stellate cell. in striate cortex, 321. 32/,
323
Spiral ganglion, 354, 355, 359, 359
Split-brain studies of language processing,
628-630, 628-631
Squire, Larry, 742
SRY gene, 535-536, 536
Stapedius muscle, 350,350
Stapes, 348, 349
Startle disease, 127b
Starvation, energy balance and, 511-512, 5/2
Stellate cell. 45, 46. 99b
in striate cortex, 321, 32/. 323
Stem cell, neural. 692, 692
Stereocilia, 354,355, 356, 357, 358
Stereograms, 338b-339b
Steroids, 489
effects on neurons, 549, 550
neurosteroids, 157, /57
sex hormones as. 537-539, 538. See also
Sex hormones
Steward, Oswald, 45
Stimulants. 505-507, 506
Strabismus, 285b, 713-714,714
Stress, and brain, 491b
Stress disorder, post-traumatic, 491b
Stress response, 488-489, 490
in anxiety disorders, 667-668
regulation, 668-670, 668-670
Stretch receptor. 438-440, 439--44/, 443, 443
Stretch reflex, 439-440, 440. 44/
Stria terminalis, 573
Stria vascularis, 35 I. 351
Striate cortex, 318-333,319-332
anatomy, 318-324, 3/9-324
cell types, 321, 32/
cortical modules, 332, 332-333
cytochrome oxidase blobs, 324, 324, 329
inputs, 321-323,322,323
intracortical connections, 323, 323
lamination, 320-321,321
ocular dominance columns, 322, 322-323,
325. 328
outputs, 323, 323
parallel pathways, 330, 330, 332
physiology, 324-333
receptive fields, 324-329
binocularity, 324-325
blob, 329
complex cell. 327, 329. 329
direction selectivity, 326. 327
orientation selectivity, 325. 325-326.
326. 328b
simple cell, 327.327
retinotopic map. 319-320. 320. 325
segregation of LGN inputs in, 710, 711b,
712. 7/2
Striated muscle, 424
Striatum, 464. 465
in procedural memory. 751-754. 752. 753
Stroke. 19t, 20
Strychnine, 127b
Subarachnoid space. 174. /74
Subdural hemawma, 173
Subdural space, 173-174. 174
Subfornical organ, 487
Submucous plexus, 495, 495
Subplate layer of brain, 693
Substance P. 112. 411. 411. 412. 413
Substantia. 180t
Substantia gelatinosa, 412. 412
Substantia nigra. 188.221.224,464.465.
503. 503
Substrate phase of feeding behavior. 520
Subthalamic nucleus, 464, 465
Subthalamus, 221
Subunit, quaternary protein structure, 58
Suga, Nobuo. 374b-375b
Suicide, 673
Sulci. 7, 8. 194. 209
Superior cerebellar arteries. 234
Superior coIIiculus. 187-188, 216. 224,314.
3]4-315,457,457.472
Superior olive. 225. 363,364. 365.370.
370-371,371
Superior temporal gyrus. 209
Superoxide dismutase. 432b
Supplemental motor area. 210, 460. 461.
462--463
Supporting cells, olfactory. 265, 265
Suprachiasmatic nucleus, 484-485
circadian rhythms and, 610-615. 6//. 612.
613b. 614b, 615
Surface anatomy
brain. 206-216
spinal cord. 226-228
Surgery. brain
prehistoric, 4. 4-5
10 reduce aggression, 577-578, 578b
Sweetness. 253. 258. 258-259, 259
Sylvian fissure, 8.209.218.220.631, 631
Symmetrical synapse, 109. 109
Sympathetic chain. 493. 494
Sympathetic ganglia. 230, 231
Sympathetic nervous system. 230. 490.
492--496. 493. 495
in sexual response cycle. 542. 542-543
Sympathomimetic drug. 497
Synapse, 39,39,40.41. 41
central nervous system, 106. 107. 109, J09
chemical. See Chemical synapse; Chemical
synaptic transmission
electrical. 102, 103-105, /04. 105. 108b
elimination, 707-708. 708
formation, 702-704, 704
Hebb, 710.7/0
inhibitory. 126-129,128.722
types. 103-111
Synaptic cleft, 39.40, 105, /06
Synaptic competition, 713-714,714
Synaptic convergence. 712-713, 713. 714
Synaptic depression. long-term. See Long-
term depression (LTD)
Synaptic integration. 122-130
dendritic contribution. 124-126. 125
EPSPs, 122-124. 123. 124
inhibition, 126-129, 128
modulation. 129. 129-130
Synaptic mimicry. 138, 138
Synaptic plasticity
BCM theory. 781
in cerebellar cortex. 772-776. 773-776
critical period concept, 715b. 720-722
in hippocampus, 776-786. 777-785
input specificity, 774
mechanisms. 716-720.717-719
memory and. 791
in temporal cortex. 784. 785
timing and. 782b
Synaptic potentiation, long-term. See Long-
term potentiation (LTP)
Synaptic rearrangement, 708-716. 709
Synaptic segregation. 709-712, 710
Synaptic transmission. 40, 102-131
Synaptic vesicles, 39. 39. 105. 106. 107
Synaptotagmin. 116b
Synergists. muscle, 426
Synesthesia. 728b
Systems neuroscience. 13
T
T tubules. 433. 433. 434
Tl R taste receptors. 258-259, 259
T2R taste receptors, 258, 259
Takahashi, Joseph, 613
Tardive dyskinesia, 684
Taste, 252-263
basic types, 253
central pathways. 259. 260, 260
neural coding. 262-263
organs, 253-255. 254
transduction mechanisms, 256-259,
257-259. 261 b
Taste aversion learning, 262b
Taste bud, 254. 254
Taste pore. 254, 255
Taste receptor cell (taste cell). 254. 254-256.
255-256
Taste stimuli (tastants). 256
Tau, in Alzheimer's disease. 36b-37b
Tectorial membrane, 351,351
Tectospinal tract. 457,457
Tectum. 187. 187. 211
Tegmentum. 187, 187, 188,211
Telencephalic vesicles, 184, 184
Telencephalon. 184, 185
Temperature, 418--421
body
circadian rhythm, 608. 610
regulation. 484, 529-530, 530t
pathway, 420--421
INDEX 855
spinothalamic pathway, 413--414, 414, 415
thermoreceptors, 418--420, 419. 420
trigeminal pathway, 415
Temporal coding, olfactory, 274
Temporal cortex. synaptic plasticity. 784. 785
Temporal lobe. 8. 194. 194. 209. 220, 222
electrical stimulation, memory and,
737-738
in memory storage, 738-750. 739-743. 745.
746. 748-750
Temporal lobectomy, 571-572. 738-740, 739
Temporal summation, 124. 124
Tensor tympani muscle, 350, 350
Terminal arbor. 39
Terminal bouton. 39. 39
Terminawr, 30, 31
Tertiary protein structure. 57. 57
Tessier-Lavigne. Marc, 699. 70lb
Testis-determining factor (TDF), 535. 536
Testosterone. 538. 538
activational effects, 551. 552b. 553
in aggression, 577
organizational effects, 550
Teranic stimulation, 778
Tetrahydrocannabinol. 149b
Tetrodotoxin. 89. 90b
Thalamic nuclei. 221, 743. 743
Thalamus, 184, 185. 186. 186.211.216,218.
220. 222
in cortical differentiation, 696-697
in emotion, 566
in memory storage. 743, 743
as pacemaker in generation of brain
rhythms, 591, 591.592
somatic sensory nuclei, 415. 416
wakefulness and. 603. 603
Thennal nociteptors. 409, 410b
Thermoreceptors. 418-420. 419. 420
Theta rhythms. 589
Thick filament. 434. 434. 435
Thin filament, 434. 434. 435
Third ventricle, 184. 185, 192. 192t, 213, 218,
220. 222
Thirst, volumetric. 527, 528
Thoracic spinal cord. 394. 395
Thoracic vertebrae. 226. 227
Thorndike. Edward, 764
Threshold. 77, 91
Throat, 253.253
Thyroid-stimulating hormone (TSH), 488t
Tinnitus, 376b
Tip link, 358,359. 360b
Tonegawa. Susumu, 785, 786. 786b
Tongue. 253. 253. 259.260
Tonic-clonic seizure, 593
Tononi, Giulio, 607
Tonotopy, 366. 366-367. 373.373
Topical anesthesia, 95b
Topographic map. 700. 702, 703
Touch, 388--408
dorsal column-medial lemniscal pathway,
397-399. 398
versus pain pathway. 413. 414. 415
primary afferent axons, 392-394. 393
skin mechanoreceptors, 389-392,389-392
somatosensory cortex, 401-407, 40l--408
spinal cord. 394-397.394-397
856 INDEX
Touch (continued)
trigeminal pathway, 400, 400
Tract, 180t
Transcortical motor area aphasia, 622t
Transcortical sensory area aphasia, 622t
Transcript, 30, 3 I
Transcription, 30,31
Transcription factors. 30. 692
Transducin. 294, 295
Traqsduction
light, 292-298, 293-295
motion, 378
pain, 408-412, 41 I
smell, 266-269, 266-269
sound, 356, 357,358, 358-359, 360b
taste. 256-259,257-259. 261b
Transient global amnesia, 730
Translation. 31
Transmitter-gated channels, 1l5, 1l7, 117,
118. 120b, 141. 152-157
amino acid. 155.155-157, 156b, 157
structure. 152-154, 153
subunits, 152. 153, 154
Transmitter-synthesizing enzymes. 13 5-13 7.
136, 137
Transneuronal autoradiography, 322, 322
Transporter protein, 113, 113
Transporters, neurotransmitter, 144b
Trauma, amnesia from, 730, 730
Tremor. 475b
Trepanation, 4. 4-5
Trichromatic vision. 296. 297b
Tricyclic antidepressants, 677, 678
Trigeminal lemniscus, 415
Trigeminal nerve, 232, 233, 400, 400
Trigeminal pathway, 400, 400, 415
Triglycerides, 511. 512
Trk receptors, 706-707
Trochlear nerve, 232, 233
Trophic factors. 706
Troponin, 435,436
Trp channels, thermoreceptors, 4 I 9. 419-420
TRPAI channel, in hair cell transduction,
358,359. 360b
Tryptophan, 146, 147, 499b
Tryptophan hydroxylase, 146, ]47
Tsien, Joe, 785
Tubulin, 35. 35
Tully, Tim, 790
Tunnel vision, 315b
Twitch, muscle, 428, 429
Two-point discrimination, 392, 392
Tympanic membrane. 347, 347. 348. 349, 349
Tyrosine, 143, 145, 145
Tyrosine hydroxylase. 143, 145, 145
U
Ultradian rhythms, 596
Ultrasound. 346b
Umani (amino acid) taste, 253, 259,259
Unconditional stimulus (US), 763. 764
Unconscious emotion. 566-568, 567
Undershoot, 76, 77.91
Unipolar neuron. 45. 45
Upper motor neurons, 456b
Urethra, 542. 543
Utricle, 377, 378-379, 379.380
v
Vagus nerve, 230, 231, 232, 233, 259,260
feeding behavior and. 521, 520
thirst and, 527, 528
Vagusstoff, 103b
Valium, 671
VaJJare papillae, 253, 254
Vallbo, Ake, 389
Vas deferens, 542, 543
Vascular organ of the lamina terminalis, 528,
529
Vasoactive intestinal polypeptide (VIP), 497
Vasopressin. 486
reproductive behavior and, 544-545, 545
thirst and, 527, 528
Ventral, 168, 170
Ventral amygdalofugat pathway, 573
Ventral cochlear nucleus, 225, 363, 364, 365
Ventral columns. 190, 191. 228
Ventral horn. 190,191,228,396,397.428,
428
Ventral lateral nucleus, 221, 464, 465. 466,
466
Ventral-lateral surface of spinal cord, 228
Ventral posterior nucleus, 221, 259,260, 382,
382, 398, 398
Ventral root. 9. 9-10, 172. ]72, 228
Ventral surface of brain, 214
Ventral tegmental area, 503,503. 580-581.
581
Ventricles
historical views, 5, 6, 6
size, in schizophrenia, 681, 681
Ventricular system, 174, 174, 192, 192, 192t,
213
human, 195, 195
Ventricular zone, 691. 692
Ventromedial hypothalamic syndrome, 514.
515
Ventromedial pathways, 229, 453, 453.
455-458, 457, 458, 459
medullary reticulospinal tract, 457-458,
458
pontine reticulospinal tract, 457-458, 458
tectospinal tract, 457, 457
vestibulospinal tract, 382, 382. 456-457,
457
Verification. in scientific process. 16
Vermis, 216, 474, 474
Vertebrae, 226, 227
Vertebral arteries, 234
Vertebral column, 230, 231
Vertebrate models of learning, 772-786
synaptic plasticity in cerebellar cortex,
772-776, 773-776
synaptic plasticity in hippocampus,
776-786, 777-785
Vertical sound localization. 371-372.372
Vesalius, Andreas, 6, 6
Vesicular transporter, 144b
Vestibular labyrinth, 376-378,377. 384, 456,
457
Vestibular nerve, 377, 378
Vestibular nucleus, 226. 381-382,382,456.
457
Vestibular system, 344, 376-384
central pathways, 381-384,382,383
otolith organs, 377,378-379,379.380
pathology, 384
semicircular canals. 377,378. 379-381,381
Vestibulo-ocular reflex (VOR), 382-384, 383
Vestibulospinal tract, 382, 382. 456-457, 457
Vibration, and Pacinian corpuscle, 391,
391-392
Vibrissae. facial, somatotopic map, 403, 403
Vilain, Eric, 554
VIP (vasoactive intestinal polypeptide), 497
Viscera. convergence of nociceptor input
from skin and, 412,413
Visceral PNS. See Autonomic nervous system
(ANS)
Visceromotor response
to excessive adiposity, 515-516
in hypothalamic homeostatic regulation,
51l
Vision. arr and, 331 b
Vision correction, 286b-287b
Visual acuity, 288, 288
Visual angle, 288, 288
Visual cortex, 210
primary. See Striate correx
Visual field, 288, 288, 312
binocular, 312
deficits. 313. 3]4. 315b
Visual hemifield, 312,312-313
Visual perception, 337-340
parallel processing and, 339-340
receptive fields and, 337-339
retinogeniculocorrical pathway mediating,
313,313
stereograms and, 338b-339b
Visual system
central, 310-340. See also Central visual
system
development
activity-dependent synaptic rearrange-
ment, 708-716, 709
critical period, 715b, 720-722
genesis of neurons, 691-697. See also
Neurogenesis
mechanisms of synaptic plasticity,
716-720, 717-719
pathway formation, 697, 697-704
peripheral, 278-306. See also Eye; Retina
retinogeniculocorrical pathway, 313, 3/3,
690, 690
Vitreous humor, 282, 283
Vocal control regions, 552b
Volley pnnciple, 368
Voltage, 60
Voltage clamp, 84
Voltage-,gated calcium channel, 113-114, ] 14
Voltage-gated NMDA channel, 155, 155-156
Voltage-gated potassium channel, 91
Voltage-gated sodium channel, 84-89, 85. 86.
87. 90b
Voltmeter, 61. 6]
Volumetric thirst, 527, 528
Vomeronasal organ, 264b
Vomeronasal receptor proteins, 269
Von Bekesy, Georg, 353
w
Wada procedures, 620, 621b
Wakefulness
ascending reticular activating system and,
602-603, 603
circadian rhythm, 609, 609-610
gene expression during, 606-607
Walking, spinal motor programs for,
447-449, 448
Wall, Patrick, 416
Wallerian degeneration. 40
Wallpaper effect, 339b
Water, as polar solvent, 53, 54
Water-fearing substance, 54--55
Water-loving substance, 54
Water maze, 746, 746, 747b
Wavelength, electromagnetic radiation, 279,
279
Weakness, 456b
Weaver mice, 68, 71
Weinrich, Michael. 463-464
Werblin, Frank, 299, 30 I b
Wernicke-Geschwind model, 625, 625-626
Wernicke's aphasia, 622t. 623-625
Wernicke's area, 374,620,620-621, 621b
Whiskers, somatotopic map, 403, 403
White matter, 180r
conical. 184, 185,219,221
historical views, 7, 7
spinal cord, 190, 191,228
Wiesel. Torsten, 322, 324, 325. 326, 327,
329, 332,709,712
Wisconsin card-sorting test, 755, 755-756
Wise, Steven, 463-464
WolHian duct, 536-537, 537
Woolley, Catherine S., 556, 558b-559b
Working me'mory, 729, 729
functional magnetic resonance imaging of.
756--757, 757
hippocampus in, 749-750, 750
lateral intraparietal cortex (area LIP) and,
757, 757, 758
neocortex and, 754--757
prefrontal cortex and, 754--757, 754-757
Wurtz, Robert, 652, 653b
INDEX 8S 7
x
X chromosome, 535, 535
X-linked disease, 535
y
Y chromosome, 535, 535
sex-determining region of. 535-536, 536
Yeast, 116b
Yin, Jerry, 790
Young. J. Z" 94
Young, Thomas, 296
Young-Helmholtz ttichromacy theory, 296
z
Z line, 434, 434. 435
Zeitgeber, 609-610
Zihl, Josef. 335-336
Zone of Lissauer, 412. 412
Zuker, Charles, 258, 261b
,..
..,.
o
o
(jj
a:
a: