/


Текст
McGRA W-HILL
INTERN A TlON AL
BOOK COMPANY
New York
St loui
San Ffancisco
Auckland
Beirut
Bogota
Diisseldorr
Johannesburg
Lisbon
london
Lucerne
Madnd
Mexico
Montreal
New Delhi
Panama
Paris
San Juan
Sao Paulo
Singapore
Sydney
Tokyo
Toronto
\'ATISH T. SHAH
Department "lChemiL.,,1 alld Petroleum En.q'lIl'e r iny
U nil'ersitJ of Pillsburyll
Pittsburgh
USA
Gas-Liquid-
Solid Reactor Design
1 O.D.--;- :"0
.,. If 1:: 'T 1; 1; oJ 1\ r: \-
..
TP AS:t
S3.
This book was set in Times Roman, Series 327
British Library Cataloging in Publication Data
Shah. Y. T.
Gas-liquid-solid reactor dcsign.
1. ChemIcal reactors Design and
construction
I. Title
660.2'83 TPI57 78-40100
ISBN 0-07-056370-5
TPI5' .UI
1II'n1
c. ..... .... NIdDr ......' Y'"
IIIIIII1I1IIII
It2t'HJIS
To my parents
191079
GAS-LIQUID SOLID REACTOR DESIGN
Copyright @ 1979 by McGraw-Hili Inc. All rights reserved.
Printed in the United States of America. No part or thIs publication may be reproduced,
stored in a retrieval system. or transmitted in any form or by any means,
electronic. mechanical. photocopying. recording or otherwise.
without the prior permission or the publisher.
I 2 3 4 5 MP 8 0 7 9 8
Printed and bound in the United States of America
CONTENTS
Preface
1 Practical Systems and Types of Industrial Reactor
./ I-I Introduction and types of gas-liquid-solid reaction
01 1-2 Important design parameters for a gas-liquid-solid reactor
.... 1-3 Types of industrial gas liquid-solid reactor
References
.J 2 Film and Penetration Theory Analyses of Gas Liquid and Gas-Liquid-
Solid Reactions 22
2-1 Introduction
2-2 Film theory analysis of gas-liquid -solid reactions
2-3 Methods for estimating transport resistances
2-4 Heat effects
2-5 Recommendations for future study
Nomenclature
References
o
".
,j 3 Residence-time Distribution and Models for Macromixing in the
Reactors
3-1 Introduction
3-2 Tracers
3-3 Methods for obtaining residence-time distribution
3-4 Problem areas
3-5 Models for macromixing in the reactor
3-6 TD and scaleup problems
3-7 Recommendations for future study
Nomenclature
References
1,,-
..0
elf
.I
I:"
cr
-.:
tI"'
.....
0t
c
c
"
If:
,j
r
,"
ix
1
1
6
9
18
22
25
47
49
51
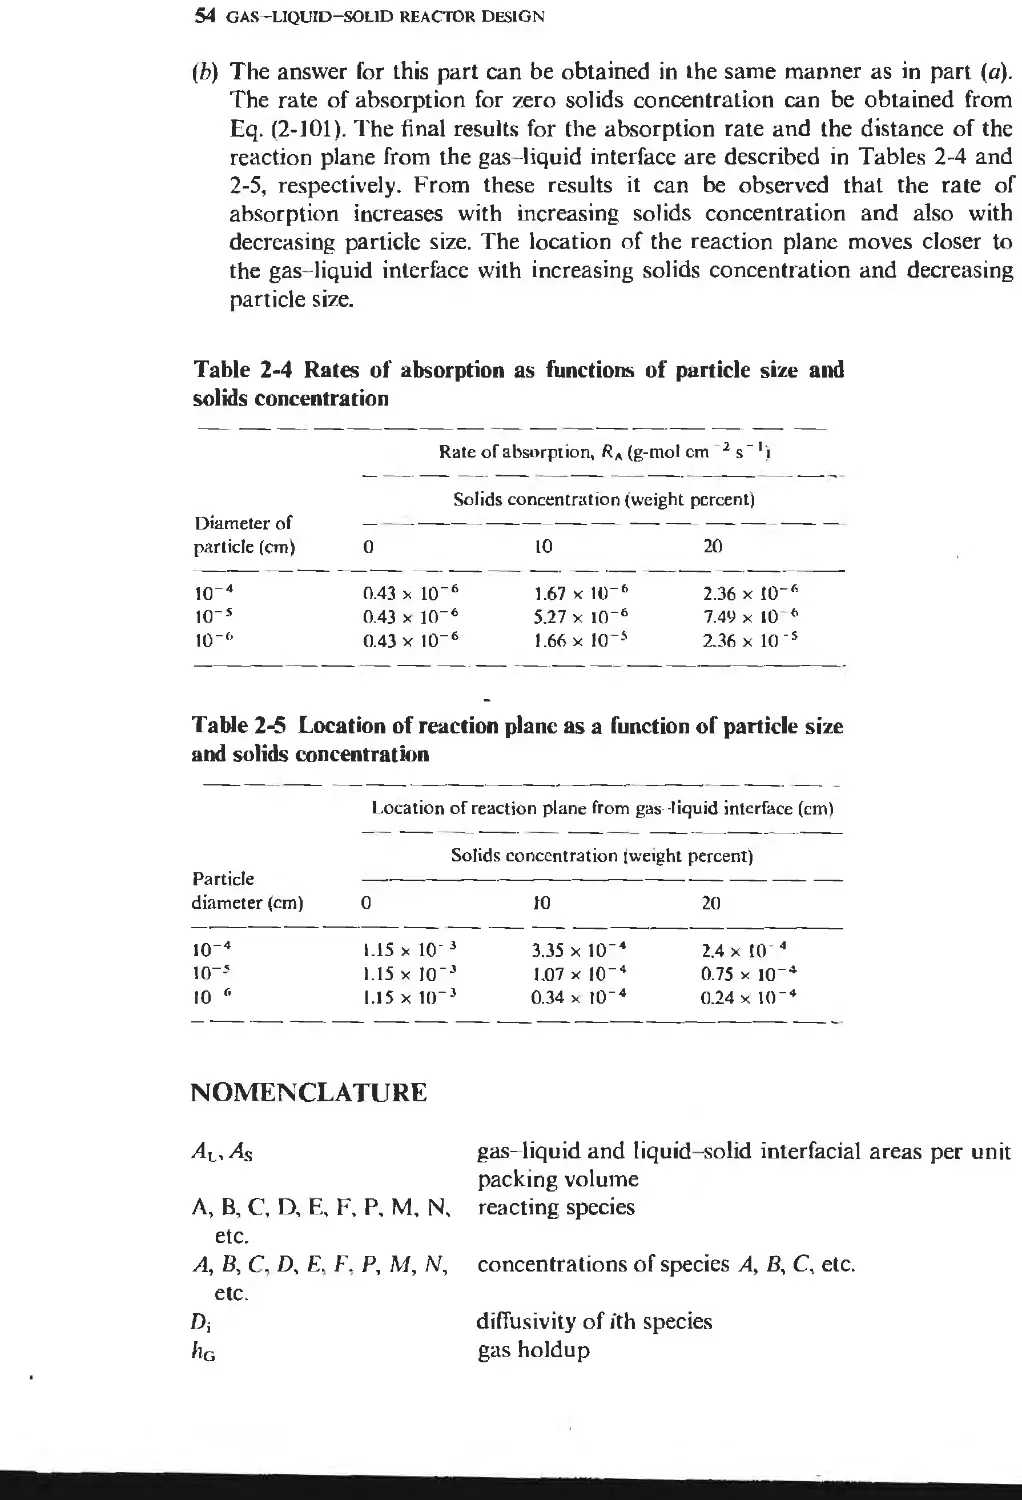
54
55
60
60
61
64
65
69
93
94
100
102
,
vi rO"TENTS
4 Mathematical Models for Gas-Liquid Solid Reactors
105
4-1 Models based on effectiveness of contact. \vith no external mass-
transfer resistances (models for trickle-bed reactors) 105
4-2 Reactor performance based on residence-time distribution 112
4-3 Model when reactant present in both liquid and vapor phases ] 13
4-4 Models for non isothermal trickle-bed reactor 115
4-5 Models which include external mass-transfer effecls 128
4-6 Models for three-phase slurry reactors 133
4-7 Models for the packed-bubble-column gas liquid reactors 135
4-8 General remarks 140
4-9 Recommendations for future study 141
Nomenclature 14J
References 147
5 Laboratory Reactors
149
5-1 Introduction 149
5-2 Laboratory gas-liquid-solid reactors 151
5 3 Reactors used for gas solid reactions that can be adapted to
three-phase systems 160
5-4 Reactors normally used for gas-liquid reactions which can be used
for the measuremenl of absorption rates in dilute gas-liquid-
solid slurries ] 71
References and bibliography 175
6 Dynamics of the Cocurrent-downflo\\. Fixed-hed Column
6-1 Flow regimes
6-2 Pressure drop
6-3 ) Liquid holdup__
6-4 Radial and axial gas and liquid distributions
6-5 Effective catalyst wetting
6-6 Axial dispersion
6-7 Gas -liquid mass transfer
6-8 Solid-liquid mass transfer
6-9 Heat transfer
Nomenclature
References
180
180
184
]90
199
202
206
2]2
216
220
224
227
7 Dynamics of the Cocurrent-upflow Fixed-bed Column
7-1 Flow regimes
7-2 Pressure drop
7-3 'Gas and liquid holdups
7-4 Axial dispersion in Ihe gas and liquid phases
7-5 Gas-liquid interphase mass Iransfer
230
230
232
237
247
251
7-6 Liquid-solid mass transfer
7-7 Heat transfer
omcnclature
References
8 Dynamics of CountucurreRt-now Fixed-bed Column
R-I Flow regimes
8-2 'Pressure drop
8-3 Gas and liquid holdupS!
8-..tGas- and liquid-phase axial dispersion
8-5 Wetted area
8-6 Gas-liquid mass transfer
8-7 Liquid-soJid mass transfer
8-8 Heat transfer
Nomenclature
References
9 Dynamics of the Gas Liquid Suspended-solid Column
9-' Introduction
9-2 Hydrodynamics
9-3 Gas. liquid. and solid holdups
9-4 Axial dispersion in the gas, liquid. and solid phases
9-5 Gas-liquid interface mass transfer
9-6 Liquid-solid mass transfer
1)-7 Wall mass transfer in the slurry column
9-8 Heat transfer
Nomenclature
References
Index
CONTENTS "ii
261
266
271
273
275
275
276
277
281
292
293
297
297
300
302
304
304
305
312
328
334
348
356
356
64
367
371
!/
PREFACE
The analysis and design of multiphase reactors is probably the most widely
researched subject in the area of chemica] reaction engineering at the present time.
While the subject of two-phase reactor design (i.e., gas-solid and gas-liquid) has
been extensively reviewed in numerous texts, no similar treatment of three-phase
(i.e., gas-liquid-solid) reactor design is available.
The only unified review ofthree phase operations was published by Ostergaard
(Adv. in Cl1em. Series, vol. 7, p. 71, 1968). Since then, considerable progress has
been made on this subject. Numerous reviews (Satterfield, eN.. AIChE J., vol.
21, p. 209, 1975; Goto, S., J, Levec and J. M. Smith, Catal. Rev. Sci. Eng., vol.
IS, no. 2, p. 187, 1977; Charpentier, J. C, The Chern. Eng. J., vol. 11, p. 161,
1976; etc.) on various aspects of three-phase reactors have been published. This
monograph attempts to bring about a more complete and timely review of the
entire subject matter.
Three-phase reactors are widely used in hydroproces sin g_opera io s and [o .
oxidation reactions. Trickle bed reactors have been widely used for hydrode-
sulfurization of residue oils, hydrodesulfurization, and hydrocraeking of gas oils
and in numerous oxidation reactions. Three-phase fluidized bed reactors are also
used in coal liquefaction and in Fischer-Tropsch synthesis. It is in these and
similar examples that the review presented in this monograph can most pertinently
be applied.
The monograph is divided into nine chapters. In the first chapter, numerous
practical samples for gas liquid-solid reactions are outlined. Types of industrial
gas- liquid-solid reactors, their advantages and disadvantages are briefty discussed.
ix
x PREFACE
Chapters 2, 3, and 4 review the tools for modeling the performance of three-phase
reactors. Chapter 2 evaluates the use of film and penetration theory for the
calculation of absorption rate in three-phase reactors. Chapter 3 describes various
techniques for characterizing residence time distribution and the models which
take into account the macromixing in a variety of three-phase reactors. The
concepts described in these two chapters are vital to the simulation of an entire
reactor. Chapter 4 illustrates the development of the mathematical models for
some important pilot scale and commercial reactors.. In Chapter 5 some advantages
and disadvantages of three-phase laboratory reactors are outlined.
The modeling and design of a three-phase reactor requires the knowledge of
several hydrodynamic (e.g., flow regime, pressure drop, holdups of various phases,
etc.) and transport (e.g., degree of backmixing in each phase, gas-liquid, liquid-
solid mass transfer, fluid-reactor wa1l heat transfer, etc.) parameters. During the
past decade, extensive research efforts have been made in order to improve our
know-how in these areas. Chaptcrs 6 to 8 present a unified review of the reported
studies on these aspects for a varicty of fixed bed columns (Le., co-current down-
flow, co-current upflow, and counter-current flow). Chapter 9 presents a similar
survey for three-phase fluidizcd columns.
The monograph is primarily designed to be used by industrial researchers
and graduate students in order to bring them up to date on the state-of-the-art
in three-phase reactor design. The book can also be uscd as a reference text for
graduate level courses in reaction engineering.
This kind of an effort could not have been possible without cooperation from
a large number of associates. r would first like to thank Mr. H. Taylor of Gulf
Science and Technology Company for allowing me to present Ihe concepts of
this monograph as a series of seminars to Gulf scientists and engineers. One
cannot find better critics of the book than the students who read it and hopefully
learn somethmg new from it. My special thanks are to Gary Stiegel and
Sowmithri Knshnamurthy for proof-reading and finding numerous errors in the
monograph. Many helpful discussions with John Paraskos, Howard McIlvried
and Norman Carr are gratefully acknowledged.
Acknowledgements are also due to a very efficient group of ladies, Ms.
Dolores Persun. Janet Bradley, Quandra Nickols and Susan Mateya of the Word
Processing Center at Gulf Research and Development, whose persistent efforts
allowed the preparation of the first and most important rough draft of the mono-
graph. Thanks are also due to Mrs. Angela Cheyne for typing the final draft, and
her unending effort is gratefully acknowledged. Finally, needless to say, that this
project would not have been started without the love and understanding of my
wife, Mary, for her patience and sacrifice during the many long hours it took to
put the manuscript in finaJ form.
..
Yatish T. Shah
June 1978
CHAPTER
ONE
PRACTICAL SYSTEMS AND TYPES OF
INDUSTRIAL REACTOR
I-I INTRODUCTION AND TYPES OF GAS-LIQUID-SOLID
REACTION
Reactions involving gas. liquid, and solid are often encountered in the chemical
process industry. The most common occurrence of this type of reaction is in
hydroprocessing operations, in which a variety of reactions between hydrogen,
an oil phase, and a catalyst have been examined. Other common three-phase
catalytic reactions are oxidation and hydration reactions. Some three-phase
reactions, such as coal liquefaction, involve a solid reactant. These and numerous
other similar gas-liquid-solid reactions, as well as a large number of gas-liquid
reactions. are carried out In a vessel or a reactor whIch contains all three phases
simultaneously. The subject of this monograph is the design of such gas liquid
solid reactors.
The correct choice of a gas-liquid .solid reactor depends, to a certain extent,
on the nature of the reaction. There are three types of gas .Iiquid solid reactions.
I. Reactions where gas, liquid, and solid are either reactants or products
II. Gas-liquid solid reaction with the solid acting as a catalyst
III. Two reacting phases with the third phase inert
A. Gas-liquid reaction in packed bed the solid imparts momentum, better
transfer coefficient. and contact
B. Gas-solid reaction with the liquid inert - the liquid acts as a heat-transfer
medium or an agenffur redistributing the concentration of various reacting
species at the catalyst surface
C. Liquid -solid reaction with inert gas - the gas provides mixing.
2 GAS-LlQUID-SOLlD REACTOR DESIGN
Absorption of carbon dioxide in a suspension of lime and thermal coal
liquefaction are examples of Type I reactions. In the first example, calcium
carbonate is produced by carbonation of suspensions of lime, whereas, in the
second example, coal is liquified in the presence of hydrogen and oil to produce
a host of products. These and several other examples of this type of reaction are
summarized in Table I-I.
The second type of gas- liquid-solid reaction is the one most often encountered
in the petroleum industry. Hydroprocessing reactions are characterized by
reactions between hydrogen, one or more components of the oil phase (such as
sulfur, nitrogen, vanadium, nickel, etc.), and a catalyst. A large portion of the
discussion of reactor design given in this monograph is most relevant to these
reactions. The reactions may produce a volatile, a nonvolatile, or a mixture of
volatile and nonvolatile products. Some important examples of this type of
reaction are given in Table 1-2. It should be noted that there could be a reaction
system such as catalytic liquefaction of coal, where the solid phase could be
present simultaneously as a reactant (coal) and as a catalyst.
In the third type of gas-liquid-solid reaction, only two of the three phases
take part into the reaction. the third phase being an inert phase. This type of
reaction can be further subdivided into three catagories. Some reactions are
strictly gas liquid reactions, but they are often carried out in cked-bed react s
operating under countercurrent-flow conditions. Here, the solid imparts momen-
tum transfer and allows better gas- liquid contact and gas- liquid interfacial mass
Table 1-1 Examples of a:as-liquid-solid-reaction systcms where all three phases are
either reactants or products
No. Reaction system
Reference no.
I Thermal coal liquefaction
2 Production of calcium acid sulfite (sulfur dioxIde, water, and hmestone)
reacting to produce calcium bisulfite and used in the manuracture or
sulfite cellulose
3 Flotation and special types of fluidized crystallization processes
4 Production of acetylene by the reaction between water and calcium
carbide - desorption of C 2 H 2
5 Production of gas hydrates in desaturation processes - propane and sea
water produce a solid phase
6 Melting of gas hydrate or ice crystals - reaction between gas and solid
forming a liquid
7 Reaction of phosphid of Ca and AI with water (desorption of phosphine)
8 Manufacture of calcium hypophosphite by the treatment of white phos-
phorus with a boiling slurry of lime (desorption of phosphine, diphos-
phine. and hydrogen!
9 Absorption of CO 2 in a suspension of lime
10 Wet oxidation of active carbon desorption of carbon dIoxide
11 Biological and photo-oxidation of suspended organic solids in water
purification
42, 79, 113
12,31, 123. 124
129
60
83
83
62
62
56
19
4.100
PRACTICAL SYSTEMS AND TYPES OF INDUSTRIAL REACTOR 3
Table 1-2 Examples of gas-liquid-solid-reaction systems where the gas and liquid
are either reactants or products and the solid is a catalyst
Reference no.
No.
Reaction system
2
3
Oxidation or an aqueous solution of sodium sulfite ",ith copper ions
serving as a catalyst
Hydrogenation of sesame seed oil with a nickel-on-silica catalyst
Hydrogenation of cyclohexanc in an aqueous suspension of 30-pm
palladium black particles
Hydrogenation of ot-methyl styrene containing a slurry of palladium
black or alumina-supported palladium catalyst
Hydrogenation of hen.rene tdilule solUlion of cyclohexane 111 benzene)
by 2 percent Pt on alumina
Hydrogenation of ethylene by Raney nickel particles in a paraffin oil
Oxidation of S02 on wetted carbon
Hydrogenation of crotonaldehyde over pelleted palladium-on-alumina
catalyst
Liquid-phase xylene isomerization on
a. H-Mordcnite (zeolite) catalyst
b. Silica-alumina catalyst
c. Dual-funchon catalyst
Oxygen transfer in fermentation
Carbon dioxide absorption by an aqueous huffer in the presence of
an enzyme (carbonic anhydrase)
Absorption of oxygen in immobilized enzyme syslems
Absorption of oxygen in an aqueous medium contaimng activated
carbon
Catalytic coal liquefaction and upgrading of coal liquids
Hydrogenation of acetone by Raney nickel catalysts
Catalytic hydrocracking of petroleum fractions '_
HydrogenatIon of an aqueous solution of glucose to form sorbitol by
solid catalyst consisting of nickel on diatomaceous ear (;arrier. .
Production of 2-butene-I,4-diol and propargyl alcohol by reaction
between acetylene and formaldehyde in aqueous solution over a
copper acctyhide catalyst supported on nickel
Hydrodenitrogenation of a lube oil distillate
Hydrogenation of aromatics in a naphthenic lube oil distillate
Absorption of S02 in a suspension of magnesium oxide
Hydrodesulfunzation of petroleum fractions
4
5
6
7
8
9
10
II
12
\3
14
15
16
11-
IH
19
20
21
22
23
Hydrogenation of I-octyne and phenylacetylene in C 1 to n-C. alcohols
and n-C 6 to n-C 8 alkenes by palladium oxide catalysts
Organofunctional group hydrogenation
Hydrogenation of unsaturated fats using Raney nickel catalysts
Catalytic hydrogenation of carboxylic acid to rorm alcohols
u. Reduction of an aqueous solution of adepic acid to produce
hexane-I,6-diol
h. ReductIon of a reaction mixture resultll1g from cyclohexane
oxidation to produce a mixture of hexane-I,6-diol, pentane-I.5-
diol, and butane-I,4-diol
Conversion of the oxygen-contaming products of propylene oXIdation
on bismuth molybdate catalyst
24
25
26
27
24
23
107
37.88. 96. 107, 110
M.95
70
48.71
59, 103, 104
54
47. 109
22. I:! 6
117,118
116
74
81,87
42, 79, 113
75
20,36,51,53.102,114
8,10
14.52.99
38
51
12.124
13, 35, 50. 55, 57, 82,
92,101,119,120,121
15
5,46,125
6
5
39
"*-53
4 GAS-LIQUID-SOLID REACTOR DESIGN
Table 1-2 Continued
No. Reaction syslem
28
Hydrogenation OrCA hydrocarbons at low temperatures 00-20 "C) in
the presence or a noble metal catalyst - reaction gives high yield
(nearly complete hydrogenation of acetylene) and high selectivity
(only a small loss or butadiene by hydrogenation), also
iI. Selective hydrogenation of butadiene
b. Selective hydrogenation or methyl acetylene and propadiene in
propylene reedstocks
Hydrotreating reactions
Denitrogenation of gas oils
Catalytic hydrogenation or phenylacetylene and styrene
Oxidation or dilute solutions (132 parts per million) or formic acid in
water by a CuO - ZnO catalyst
Catalytic oxidation of phenol in aqueous solution over copper oxide
Hydrodenitrogenation or various compounds and of a catalytically-
cracked light furnace oil
Oxidation of acetic acid by copper chromite catalysts
Catalytic isomerization of cyclopropane
Reaction or phosphides of Ca and AI with water (desorption or
phosphine)
Hydrogenation of nitro compounds in the presence of Pt or Pd
catalysts (desorption or water)
Hydrogenallon of carbonyl compounds in the presence of nickel
catalyst (desorption or water)
Reaction between C 2 H 2 and aqueous formaldehyde in the presence
of copper-bismuth acetylidc catalyst to give butynediol .
Hydrogenation or aqueous butynedlol to butenediol in the presence or
Ni -Cu Mn on silica-based catalyst
Conversion of acrylonitrile to acrylamide using copper chromitc
catalyst
Oxidation or S02 In water containmg MnSOA as a catalyst
Production or acetaldehyde from oxidation of C 2 H 4 in a solution or
CuCh containing PdCI 2 as a catalyst
Liquid-phase esterification orterephthalic acid with methanol
Hydrogenation or methyl linoleate in the presence of a palladium
cataly t
Oxidation of sodium sulfite with cobaltous sulrate calalyst
Hydrogenation of allyl alcohol in the solvents water and ethanol and
in the presence of Raney nickel catalyst
Hydrogenation or fumaric acid in the solvent ethanol and in the
presence or Raney nickel catalyst
Hydrogenation of aniline to cydohexylaniline by nickel catalysts
Hydrode lrurization of narrow-boiling-range rractions of gas oil
Oxidations or sulfide illns (hydrogen sulfide) to Ihiosulrate ions and
methyl mercaptan to dimethyl disulfide in the presence or activated
carbon
Oxidation or aqueous solutions or sodium sulfide in the presence of
activaled carbon
29
30
31
32
... 33
")..34
35
36
37
38
39
40
41
42
43
44
45
46
47
48
49
50
51
52
Refcre nce no.
72. 73
77
77
78
7,40
93
33
76
98
62
30
39
11
II
80
27,43
17,49
2,61
2S
112
1)J
91
41
127
18
1,115, 122
PRACTICAL SYSTEMS A!>iD TYPES OF INDUSTRIAL REACTOR 5
transfer. A number of such reactions are listcd by Danckwerts ;29 they are also
summarized in Table 1-3 and Table 2-4. Some reactions. such as Fischer-Tropsch
reactions. are strictly gas-solid reactions. In these reactions, the liquid does not
take an active part in the reaction but is either used as a heat-transfer medium
or as an agent for redistributing the concentration of the reacting species at the
catalyst surface. Since liquids are better heat-conducting mediums than gases,
excessive heating of the catalyst in some gas-solid reactions (e,g., Fischer- Tropsch
Table 1-3 Examples of gas-liquid-so lid-reaction systems where only two phases
take active parts in the reaction. The third phase is inert.
No.
Reaction systemt
I
2
Polymcrization of ethylene or propylene In cydohexane
Caralytic hydration of c>/ejil1s Hydration of light olefins such as ethylene,
propylene, and butenes (at high pressure and high water-to-olefin ratio)
in thc presence of catalyst
Hydrogenation of ethylene using a large concentration or Raney nickel
catalyst suspended in solution
C z H 4 (g) + H 2 (g) --> C 2 H.(g)
3
4
The Fj,.cher- Tropsch proces.. Reaction or carbon monoxide with hydro-
gen in the presence of a solid catalyst to produce a mixture of
hydrocarbons, alcohols, aldehydes. ketones, and acids depending upon
operating condiuons and the nalure of the c81alyst
C aw/yti,' oxidation of olejins Production or epoxides such as ethylene
oxide and higher olefin oxides by the oxidation or olefins in the
presence of silver oxide on silica-gd carrier process applicable to
other organic oxidation processes
Catalytic hydrogenallon of diolefins to form mono-olefins and saturates
in the presence of a "wash oil"
Diolefins - Mono-olefins - Saturates
1somerization of cyclopropane
Hydrogenation of crotonaldehyde
Cleaning or sand fillers in waler-treating plants - gas is inert and provides
stirring and mixing
Gas-liquid reactions in packed towers - solid is inen, e.g.,
a. Removal or lean HzS rroni a variety or streams
b. Removal of lean SOz from a variety of streams
c. Absorption of Jean SO, in aqueous H 2 S0 4 as well as aromatic
substances for sulrona[ion
d. Absorption of nitrous gases NO x in water and aqueous alkaline
solurions
e. Absorption of lean COCh in aqueous alkaline solution
j. Removal of phosphine from CzHz by absorption in aqueous NaOCI
or H z S0 4
5
6
7
8
9
10
Reference no.
""\"
, .2.1
128
16
9, J 6,28, 32,44.
58.64.65.66.
67, 68. 69, 85,
105
97, 108
111
126
103. 104
45
3,29,90, 106
Many other reactions are listed in Refs 3. 29, 90, and 106 and in Table 2-4.
t In reactions 1-6 the liquid phase acts as a heat-transfer medium.
6 GAS-LiQUID-SOLID REACTOR DESIGN
reactions) is avoided by using an inert, nonvolatile liquid (oil) as a heat-removal
medium. If a reaction is reversible and approacl1es equilibrium, introduction of
an inert liquid phase may markedly increase conversion if the product is relatively
more soluble in the liquid than the rcactant. A good example is the hydration
of olefins to the corresponding alcohols in the presence of tungsten oxide
catalyst. 128 These reactions can be carried out either in single-phase flow or in
mixed flow. A higher conversion at equilibrium of propylene to isopropanol can
be obtained in a two-phase system compared to a. completely vapor-phase
operation. The improved performance can be attributed to the difference between
the solubility of propylene and isopropanol in the excess water present. The
concentration of the product at the catalyst surface is reduced by the presence
of liquid and, thus, alters the reactant-product ratio in a favorable direction. In
some other reactions, the presence of liquid may redistribute the concentrations
of the reacting species at the catalyst surface.126.12R Some oxidation reactions are
also marked by three-phase operations. Conversion of primary alcohols to the
corresponding sodium salt of the acid (e.g., air oxidation of ethanol to acetic acid)
in the presence of palladium- and platinum-based catalysts is one such class of
reactions. These and some other examples of gasliquid-solid catalytic reactions
are summarized in Table 1-3.
1-2 IMPORTANT DESIGN PARAMETERS FOR A
GAS-LIQUID-SOLID REACTOR
An appropriate design and model of a gas-liquid solid reactor rcquires the
estimation of various transport (momentum, mass, and heat), kinetic, and mixing
parameters. Specifically, the following parameters are needed.
1-2-1 Knowledge of Flow Regime and Flow Uniformity
The mixing characteristics and the transport processes within a reactor depend
strongly on the prevailing flow regime. The flow regime largely depends on the
flow rates of gas and liquid phases (and solids in the case of a three-phase
fluidized bed) and their relative orientation (cocurrent upwards, cocurrent down-
wards, or countercurrent), the nature, size, and status of the packing material, the
fluid properties, and the nature of gas and liquid distributors, [n a three-phase
fluidized-bed reactor, the flow regime would also be dependent upon the concen-
tration of the solids and the length and diameter of the reactor.
The flow regime plays a very important role in reactor scaleup. If the data
obtained in the pilot-scale reactor are to be useful for a larger-scale reactor, the
flow regime in these two reactors must be the same. The flow regimes in a variety
of fixed-bed operations are described in Chaps. 6 to 8.
Flow uniformities are important for the proper reproduction of the data. In
large-scale reactors, uniform distribution of gas can be difficult. Nonuniformities
can cause channeling or bypassing, which can be harmful to the reactor per-
PRACTICAL SYSTEMS AND TYPES OF INDUSTRIAL REACTOR 7
formance. Furthermore, the effects of these non uniformities on the transport and
mixing processes would be difficult to estimate. In small-scale reactors, flow
nonuniformities can be encountered at low flow rates. Flow uniformities can be
achieved by adding a calming section before the reactor. The effects of flow
nonuniformities on the residence-time distribution in a reactor and the reactor
performance are discussed in Chaps. 3 and 4.
1-2-2 Pressure Drop
The pressure drop across the reactor constitutes an important parameter because
pumping costs could be a significant portion of the total operating cost. As shown
in Chaps. 6 through 9, various transport variables such as gas-liquid and liquid-
solid mass-transfer coefficients can be correlated to the pressure drop using the
analogy between mass- and momentum-transfer processes. nific@ t_ pJess!!!e
Qrop can also cause large u nd_ sired changes in th _p !i<!!_px s !:!..re o(the__reacting
gas-wil.hiD th !: £for:------ ---- -------- .
1-2-3 Holdups of Various Phases
The holdups can play an important role in the reactor performance. For example,
in a pilot-scale trickle-bed reactor, the liquid holdup can play an important role
in changing the nature of the apparent kinetics of the reaction. When homogeneous
and catalytic reactions occur simultaneously, the liquid holdup plays an important
role in determining the relative rates of homogeneous and catalytic reactions. In
a three-phase fluidized-bed reactor, the holdup of the solid phase plays an im-
portant role in the reaction rate, particularly when the solid phase is a reactant.
The gas holdup, of course, always plays an important role in reactor performance
when a gaseous reactant takes part in the reaction.
The holdup of a phase is usually defined as the volume of the phase per unit
reactor volume. However, for a fixed-bed reactor, the gas and liquid holdups are
often defined on the basis of void volume of the reactor. In a fixed-bed reactor,
the liquid and sometimes gas holdups are divided into two parts: dynamic
holdup. which depends largely on the gas and liquid flow rates and the properties
of the fluids and the packing material, and static holdup. which depends to a
major extent on the nature of the packing (e.g., porosity of the packing) and the
fluids' properties. The relationships between the holdups of various phases and
the system variables for a variety of three-phase reactors are discussed in Chaps.
6 through 9_
1-2-4 Residence-time Distribution and Axial Mixing
When the fluid elements pass through the reactor, the exchange of mass between
the fluid elements occurs both on a microscale as well as on a macroscale. The
mixing process on a macro scale is characterized by the residence-time distribution
of the fluid elements. Usually, only the macromixing is considered to have a
8 GAS LIQUID-SOLID REACTOR DESIGN
significant effect on the reactor performance. In a three-phase reactor, the
residence-time distribution for each Rowing phase is measured separately. The
reactor performance must take into account the role of residence-time distribution,
which is normally measured by tracer techniques. Various macromixing models
used to correlate the residence-time distributions of various phases in a three-phase
reactor afG discussed in Chap. 3.
1-2-5 Gas Liquid Mass and Heat Traffifer
The importance of gas-liquid mass transfer on the reactor performance depends
upon the nature of the reaction system and the Row conditions in the reactor.
Two important parameters characterizing the gas-liquid mass transfcr are the
gas-liquid mass-transfer coefficient and the gas-liquid interfacial area. Both of
these parameters depend on the flow conditions and the. nature and status of the
solid packing. The relationships between gas-liquid mass-transfer coefficients,
gas-liquid interfacial area, and the system conditions for various types of reactors
are described in Chaps. 6 through 9.
Estimation of gas-liquid mass-transfer rates also requires the knowledge of
solubilities of absorbing and/or desorbing species and their variations with
temperature (i.e., knowledge of heats of solution). In some reactions, such as
hydrocracking, significant evaporation of the liquid occurs. The heat balance in
a hydrocracker would thus require an estimation of the heat of vaporization of
the oil as a function of temperature and pressure. The data for the solubility.
heat 01 solution, and heat of vaporization for a given reaction system should be
obtained experimentally if not available in the literature.
1-2-6 Liquid-Solid Mass and Heat Transfer
Just as in the case of gas-liquid mass transfer. two important parameters
characterizing the liquid-solid mass transfer are the liquid-solid mass-transfer
coefficient and the liquid-solid interfacial area. Various correlations for the
estimation of these parameters under a variety of system conditions are discussed
in Chaps. 6 through 9. The importance ofliquid--solid mass transfer on the reactor
performance depends, once again, on the nature of the reaction and the flow
conditions.
Very little work has been done on the liquid -solid heat-transfer coefficient in
a three-phase reactor. L'nder many industrial conditions, the temperatures of
the liquid and tht: adjoining solid particles are assumed to be equal.
1-2-7 Intraparticle Mass and Heat Transfer
The methods outlined by Satterfield 94 for taking into account the effects of intra-
particle mass- and heat-transfer resistances on the effective reaction rate are
applicable to three-phase reactors and, therefort, they will not be repeated here.
The importance of these resistances depends upon the nature of the reaction and
PRACTICAL SYSTEMS AND TYPES OF INDUSTRIAL REACTOR 9
the catalyst properties. It should be noted that, unlike those in gas solid or
liquid-solid reactions, the complications in gas liquid-solid reactors arise when
the pores of the catalyst particles are filled with both the gas and liquid phases
simultaneously. In this situation, a knowledge of the static holdup along with
total available pore volume of the catalyst will allow the estimation of the total
mass- and heat-transfer resistances of the gas and liquid phases within the
catalyst.
1-2-8 Wall Heat Transfcr
Little is known about (he fluid- wall heal (ransfer in the case of gas- liquid flow
in a fixed-bed reactor. Some research on this subject, however, has been carried
out for the specific case of cocurrent down flow over a fixed-bed reactor. This is
summarized in Chap. 6. Some work on the slurry wall heat-transfer rate for a
three-phase fluidized bed has also been reported. The heat-transfer rate is
characterized by the convective heat-transfer coefficient between the slurry and
the reactor waiL Some correlations for the heat-transfer coefficient in a three-phase
slurry reactor are discussed in Chap, 9.
1-2-9 Intrinsic Kinetics
For most reaction systems, the intrinsic kinetic rate can be expressed either by
a power-law expression or by 1he Langmuir-Hinshelwood model. The intrinsic
kinetics should include both the detailed mechanism of the reaction and the kinetic
expression and heat of reaction associated with each step of the mechanism. For
catalytic reactions. a knowledge of catalyst deactivation is essential. Film and
penetration models for describing (he mechanism of gas- liquid and gas-liquid -
solid reactions are discussed in Chap. 2. A few models for catalyst deactivation
during the hydrodesulfurization process are briefly discussed in Chap. 4.
1-3 TYPES OF INDUSTRIAL GAS-LIQUID SOLID REACTOR
The types of industrial gas liquid-solid reactor used in industry can be largely
divided into two categories, i.e., one where the solids are fixed and the other where
solids are in a suspended state (fluidized bed). Although the choice of the status
of the solid depends mainly on the nature of the reaction system, often both
fixed- and fluidized-bed systems are examined for the same reaction system (e.g.,
coal liquefaction).
1-3-] Fixed-bed Gas- Liquid-Solid Reactors
In principle, the gas-liquid- solid reactor with the fixed bed of solids can be
operated in three ways, depending upon the relative orientation of the gas and
liquid flow (see Fig. I-I). The gas and liquid can each flow cocurrently downwards,
10 GAS- LIQUID-SOLID REACTOR DESIGN
Gas Liquid
(0)
Liquid Gas
(b)
Gas
(c)
Figure 1-1 Types of gas liquid-fixed-bed-solid reactor. (a) Fixed-bed cocurTent downflow, (b) fixed-
bed countercurrent flow, (el fixed-bed cocurrenl upflow.
cocurrently upwards, or countercurrently (normally, the flow directions are liquid
downwards and gas upwards). The hydrodynamics and the mass- and heat-transfer
conditions are different in each of these flow conditions. Some practical examples
using these types of reactors are shown in Table 1-4A.
One of the most widely-used three-phase reactors is the trickle-bed reacto r.
This type of reactor is particularly favored by the hydro processing industr y. In a
trickle-bed reactor, the liquid flows down over the packings in the form of a thin
liquid film nd the continuous gas phase flows in between the packing either
cocurrently or countercurrently_ In the normal mode of operation, gas and liquid
flow cocurrently downward. In commercial hydro processing reactors, the liquid
velocity ranges from a minimum of 3 m h - I (corresponding gas velocity ranges
from 542.5 to 2,712.7 mh- I at STP) to a maximum of 91.4mh- t (corresponding
gas velocity ranges from 16,300 to 81,075mh -I at STP):94 These velocities are
about an order of magnitude higher than those used in pilot-scale hydroprocessing
trickle-bed reactors.
PRACTICAL SYSTEMS AND TYPES OF INDUSTRIAL REACTOR 11
Table 1-4 Practical examples
A. Fixed-bed reactor
I. Trickle-bed reactor
c/. Catalytic hydrodesulfurization
b. Catalytic hydrocracking
c. Catalytic hydrotreating
d. Catalytic hydrogcnation such as diolefin hydrogenation, hydrogenation of various petroleum
fractions. hydrogenation of lubricating oils, hydrogenation of nitro-compounds, carbonyl
compounds, carhoxylic acid, benzene, .:x-methyl styrene
e. Production of calcium acid sulfite - Jenssen tower operation
f. Synthesis of butynediol
g. Production of sorbitol
h. Oxidation of formic acid in water
i. urrics of activated carbon
j. Hydrogcnation of anilme to cyclohexylaniline
2. Cocurrent-upflo..... reactor
a. Coal liquefaction (SYNTHOIL r.eactor)
b. The Fischer- Tropsch process
c. Selective hydrogcnation of phenyl acetylene and styrene
d. Catalytic hydrodesulfurization
3. Seqmenled-bed reactors .
a. Coal liquefaction (Gulf process)
b. Fermentation reactions
B. Gas-/iquid-suspended-solid reactors
1. or fluidizeJ-bed reactnrs
u. Production of calcium acid sulfite - fluidized-bed reactor
b. Catalytic hydrogenation of carboxylic acid slurry reactor
c. The Fischer Tropsch process - slurry reactor
d. Catalytic oxidation of ole fins - slurry reactor
e. Catalytic hydration of olefins - sll,!rrY..I.t;Ilc;tor
r Polymerization of ethylene - sl reactor'
(!. . d !:U . .!Iter-tre !i!lB..plants - fluidized-bed reactor
h. Fluidized crystallization process
i. Coal liquefaction (H-COAL process, SRC process) - fluidized-bed reactors
j. Absorption ofS0 2 in a suspension oflimestone parlicles - slurry reactor
k. Manufacture of calcium hydrophosphite by treating white phosphorus with a boiling slurry
of lime
/. liquid-phase xylene isomerizat ion - slurry reactor
tlJ. Catalytic hydrogenation of -methyl styrene
n. Catalytic oxidation of sodium sulfite
2. Agitated-slurry reactor
a. Catalytic hydrogenation of unsaturated fats and fatly oils
b. Reaction between HCI and CH,OH in the presence of ZnCI 2 catalyst
l". Hydrogenation of acetone
Several advantages and disadvantages of a trickle-bed reactor are listed in
Table ] -5. The commercial trickle-bed reactors are operated under plug-flow
conditions. aJ}'£1s are effecti!.'cly_wetted. These factors allow high conversion
to be achieved in a single reactor. The liquid-to-solid ratio (or liquid holdup) in
a trickle-bed reactor is small, thus minimizing the importance of homogeneous
12 GAS UQUID-SOLID REACTOR DESIGN
reactions. This may be important in the J ooesUIfurv.ation reacti011.... he re low
liquid holdup minimizes the importance of thermal or hydrocracking of the. oiL
Normally, in a gas-liquid-solid operation, both the gas liquid and the liquid-solid
interfacial mass- (or heat-) transfer resistances are important and are treated
separately. Because of the thinness of the liquid film in a trickle-bed reactor, these
two resistances can be combined and the overall resistance of the liquid film
would be smaller than those obtained in other types of gas-liquid-solid operation.
The trickle-bed operation is normally carried out under cocurrent-downftow
conditions; hence, flooding is not a problem in such a reactor. The trickle-flow
operation gives a lower pressure drop than bubble-flow (cocurrent-upflow or
countercurrent-flow) operation. The low pressme-drop also .allows for a uniform
partial pressure of the gaseous rcactant (i.e., hydrogen in hydroprocessing
operations) in the reactor. This would be important for ensuring hydrogen-rich
conditions at the catalyst surface along the entire length of the reactor. Hydrogen
starvation at the catalyst surface is known to cause rapid decay of the catalyst.
The trickle-bed reactor can be operated as a partially or completely vapor-
phase reactor. It minimizes the energy costs associated with reactant vaporization.
Mixed flow conditions at the catalyst surface exist in hydrocracking reactions,
hydrogenation of crotonaldehyde and isomerization of cyclopropane. When
the temperature rise in a trickle-bed reactor is significant (e,g.. hydrodesulfurization
and hydrocracking reactions), it can be conveniently controlled by the addition
Table 1-5 Advantages and disadvantages of trickle-bed reactors
..
A.dvunwg"s
I. Flow is close to plug flow, allowing high conversion to bc acbieved in a single reactor.
2. LiqUld-to:solid ratio is small, minimizing the homogeneous side reactions if possible.
1 Liquid flows as a film, thus offering very small resistance to the diffusion of gaseous reactanl to
the catalyst surface.
4. Flooding is not a problem. Pressure drop is lower than in cocurrent-upflow and countercurrent-
flow reactors.
5. Iftemperarure flse Is sIgnificant, it may be com rolled by rccyclmg the liquid producr or oy the
addition or "quenches" from the side of the reactor. The recycling of liquid would cause Ihe
reactor to behave more like a CSTR; hence. recycling will not be possible when high conversions
are desired.
6. Can beoperatcd as a partially or completely vapor-phase reactor. A trickle-bed reactor minimized
r the energy co ts asslleiated with reactant vaporization.
(y Lower pressure drop will allow an essentially uniform partial pressure of rcactant across Ihe
length of the reactor.
8. In the commercial reactor. uniform dislribution of gas and liquid are achieved. The catalyst is
uniformly and efl"eclively welled by the liquid.
DislIdvonrages
I Poor radial mixing of heat.
2. At low liqUId flow rates, flow maldistributions such as channehng, bypassing, and incomplete
1:1 catalyst welling may occur. These adversely affect the reactor performance.
\.:J The catalyst particles cannot be very small. The Intraparucle.diffusion effects can be significant.
. The calalyst pore-mouth plugging can cause rapid deaclivalion.
PRACTICAL SYSTEMS AND TYPES OF INDUSTRIAL REACTOR 13
of one or more streams of "quench fluids" (normally hydrogen) along the length
of the reactor.
A majo di sadv_a!1J.age oLthetrickle-bed..reactor is the poor radial mixing of
heat in large-scale reactors. The poor mixing can cause excessive localized heating
of the catalyst. Thc excessive heating has harmful effects, in that it causes rapid
deactivation of the catalyst and excessive vaporization of the liquid film. In a
trickle-bed reactor, the catalyst particles cannot be very small, because they can
give a large initial pressure drop and a faster increase in pressure drop as the
catalyst ages. The large particles will give pronounced intraparticle diffusion effects
and, in processes such as hydrodesulfurization, the catalyst pore-mouth plugging
would casue rapid deactivation of the catalyst Finally, in trickle-bed reactors
operating at low liquid flow rates, flow maldistributions such as channeling, by-
passing, and incomplete t!atalyst wetting may occur. This can adversely affect
the reactor performance:/./
For some reactions listed in Table 1-4A, the fixed-bed reactor is operated
under cocurrent-upflow conditions. Unlike the trickle-flow condition, this type of
operation is normally characterized by bubble-flow (at low liquid and gas rates)
and pulsating-flow (at high gas flow rates) conditions. Normally, the bubble-flow
conditions are used. In the SYNTHOIL coal-liquefaction process, both pulsating-
and spray-flow conditions are used, so that the solid reactant (coal) does not plug
the reactor. In bubble flow, the gas is the dispersed phase and the liquid is a
continuous phase. In pulsating flow, pulses of gas and liquid pass through the
reactor. In the spray-flow regime, the gas is a continuous phase and the liquid
is a dispersed phase.
A comparison between the cocurrent-upflow and the cocurrent-downftow
reactor is shown in Table 1-6. This comparison shows that the upflow reactor
gives better mixmg (both radial and axial), higher gas-liquid mass-transfer
coefficients, higher liquid holdup, better liquid distribution, better heat transfer
between liquid and solid, lower concentration of solid particles, less solids plugging
(e.g., coal liquefaction), and, sometimes, better aging of the catalyst than the
downflow reactor under equivalent flow conditions. However, it also gives higher
pressure drops (total and partial pressure of the reactant), poorer conversion (due
to axial mixing), more homogeneous reactions, and more intraparticle diffusional
ffects than downf1ow operation. Flooding is not a problem in cocurrent -downflow
operation, but it could, however, be a problem in an upf10w operation.
The countercurrent-flow fixed-bed operation is often used for gas-liquid
reactions rather than gas-liquid-solid reactions. Examples of reactions using this
type of reactor are given by Danckwerts. 29 A comparison between a gas -liquid-
solid (catalytic) fixed-bed reactor and a gas-liquid -solid (inert) fixed-bed reactor
is shown in Table 1-7. The major difference between packed-bed gas-liquid
reactors and gas. liquid-solid catalytic reactors is in the nature and size of the
packing used and the conditions of gas and liquid flow rates. The packed-bed
gas- liquid reactors use nonporous, large-size packing, so that they can be operated
at high gas and liquid flow rates without excessive pressure drop. The shape of
14 GAS-LIQUID-SOLID REACTOR DESIGN
Table 1-6 Upftow versus downflow cocurrent 6xed-bed reactors
t. Larger pressure drop in an upflow reactor.
2. Beller mixing in an upflow reactor. This may give beller heat transfer, but larger axial mixing
would give poorer conversion in an upflow reactor.
J. At low flow rates upflow behaves like a bubble column. i.e.. gas as a dispersed phase, liquid as a
continuous phase. In downflow trickle-bed operation. gas is a continuous phase and liquid flows
as a film.
4. High pressure drop in an upflow reactor would Ciluse significant drop in the partial pressure of
the reactant across the length of the reactor.
5. Under similar flow conditions.. a higher gas-liquid mass-transfer coefficient is obtained in an
upflow operation than in a downflow operation.
6. High liquid holdup and liquid-to-solid ratio in an upflow reactor. High liquid holdup will offer
more liquid-phase resistance to the mass transfer of the gaseous reactant to the calalyst surface.
High liquid-to-solid ratio will give more importance to the role of possible homogeneous
reactions.
7. At low liquId flow rates, upflow will provide better distribution of liquid and, thus. m many cases,
better performance of the rcactor than the downflow reactor under similar operating conditions.
8. If reaction is rapid and highly exothermic, heat transfer between liquid and solid is more effective
in an upflow n:actor.
9. In an upftow reactor, the catalyst must be kept in place by suitable mechanical methpds, otherwise
the bed will be fluidized. In a downflow reactor, the catalyst is held in place tightly by the flow
This may cause undesired ccmentation of the soft catalyst particles.
10. In an upflow reactor, the catalyst pores are more lik.ely to fill completely with liquid tha!l in a
downflow reactor. The catalyst effectivencss factor is lower when the catalyst pores are cOnjpletely
filled with liquid compared to the case when they are only partially filled wilh liquid.
II. Better sweeping of thc catalyst by liquid in an upflow reactor may sometimes give better aging
of the catalyst. If a solid reactant is used (e.g., coal liquefaction) then an upflow would cause
less solids plugging problems than the downflow operation.
12. In an upflow reactor, flooding may be a problem.
Table ] -, Gas-liquid-solid (catalytic) fixed-bed reactor versus gas.liquid-solid
(inert) fixed-bed reactor
,
I. Gas liquid solid catalytic (GlSC) reactors are usually run with cocurrent flow of both gas and
liquid. Gas .Iiquid reaction in an absorption tower (GSLI) is often operated under countercurrent-
flow conditions.
2. The function of solids in a GSLI reactor is to impart momentum transfer and better contact betVieen
gas and liquid.
3. The GSLI are often operated under very high gas and liquid flow rates (near flooding) compared
to the ones used in GSlC (in particular trickle-bed) reactors. An exception is the SYNTHOIL
reactor for coal liquefaction.
4. In order to obtain high flow rates, the pack.ings for GLSI reactors are large compared to the ones
used in GSLC reactors. Catalysts in GSlC reactors are porous and as small as possible to avoid
intraparticle diffusion effects. The packing in GSLJ reactors are nonporous. The liquid holdup in
the catalyst pores (usually called static holdup) may contribute significantly to the overall liquid
holdup in the reactor and it would also affect the liquid-phase residence-time distribution and
backmixing in GSlC reactors.
5. The wetting characteristics of the catalyst particles in a GSLC reactor may be substantially
different from the welling characteristics of packings in a GSLI reactor.
PRACTICAL SYSTEMS AND TYPES OF INDUSTRIAL REACTOR 15
the packing used is also designed to give larger gas-liquid interfacial areas. The
packed-bed gas-liquid reactors are often operated near flooding conditions.
In recent years, segmented fixed-bed reactors have also been used for a
variety of applications. A few specific types of segmented fixed-bed reactor are
shown in Fig. 1-2. Although, in this figure, both gas and liquid are shown to flow
cocurrently upward, they could, in principle, flow cocurrently downward or in a
countercurrent fashion. The segmcnted bed of the type shown in Fig. 1-2(a) would
give a reactor with different mixing zones. It has been examined in connection
with gas-liquid reactions. The segmented-bed reactors shown in Fig. 1-2(b) and
(c) are used for the catalytic hqucfaction of coa1. 21 These configurations permit
t
Gas
Liquid
t
Gas
t
t
Catalyst
Catalyst
t t
Gas Liquid
(a)
Gas Liquid
t t
Liquid
t
t t
Gas Uquid
(b)
Gas Liquid
! t
I
Catalyst- -
Catalyst
t
Gas
t
Liquid
...
t t"
Gas Liquid
(d)
(e)
Figure 1-2 Various types of segmented fixed-bed gas-liquid solid reactor. (a) Horizontal segments
of bed, (h) vertical segments of bed, (c) annular segments of bed, (d) catalyst impregnated at the wall.
16 GAS-LlQUID-SOLlD REACTOR DE.<;IGN
Table 1-8 Advantages and disadvantages of segmented-bed reactors
I. Allows more flexibility or mixing characteristics in the reactor.
2. In a vertically-segmemed bed, the three phases can be transported without plugging the reactor.
3. BeUer flexibilily of liquid-to-solid (catalyst) ratio, thus allowing hctter variation in homogeneous
and heterogencous reaction rates when both are possible.
4. High liquid-to-soJid ratio. thus allowing more homogeneous reactions. This may not be desirable.
High liquid holdup will also ofli::r more resistance to the transfer or gas to the catalyst surface.
5. Poor liquid distribution and mixing in the c1Italyst baskets ir they are large and suspended
vertically.
the three-phase reactors to he operated without plugging of the catalyst bed. The
open section of the reactor behaves like a well-mixed column. In order to use
the catalyst (which is packed in vertically-suspended baskets) effectively. good
radial mixing within the catalyst baskets is desirable. This is achieved by the
intense agitation in the open sections of the column. It is clear that in order to
use the catalyst surface effectively, the size (diameter) of the screen baskets should
not be very large.
The segmented-bed reactor allows better flexibility of liquid-la-solid (catalysf)
ratio, thus allowing better variations in homogeneous and heterogeneous reaction
rates when both are possible. High liquid holdup will, however, offer more
resistance to the transfer of gaseous reactant to the catalyst surface.
The segmented-bed reactor uf the type shown in Fig. I-l(d) is useful when
the reaction requires only a small amount of catalyst activity and a high degree
of mixing. This reactor would have good heat-transfer characteristics, which would
make it useful for highly exothermic reactions_ This Lype of reactor will allow
more homogeneous reactions to occur if they are possible. Some advantages and
disadvantages of the segmented-bed reactors are summ£rized in Table 1-8.
1-3-2 Gas-Liquid Suspended-Solid Reactors
Some practical examples using this type of reactor are illustrated in Table 1-4B.
This second major type of gas -liquid- solid reactor can be further subdivided into
five categories:
,
1. Agitated gas-liquid-suspended-solid reactors
2. Nonagitated three-phase slurry reactors
3. Nonagitated three-phase cocurrent-upflow fluidized-bed reactors
4. Nonagitated three-phase countercurrent-flow reactors (spouted-bed reactors)
5. Pulsating three-phase reactors.
The pulsating three-phase reactor has been examined only at the laboratory
level. The pulsation gives good mixing and l}eat- and mass-transfer characteristics
in the column. The first three types of gas -liquid-suspended-solid reactor are the
most commonly used in practice. Schematic diagrams for these reactors are shown
in Fig. 1-3(a), (b), and (e), respectively. The agitated and nonagitated slurry
PRACTICAL SYSTEMS AND TYPES OF INDUSTRIAL REACTOR 17
Solid
.
.
0 .
(a)
I
Gas
Gas
t
. . .
.
Solid 0
. Q. -
Gas 0
"V
bubble 0 0
. 0
0
(b)
_____Gas
Gas
bubble
Gas liquid
t .+
0 0
0
0 0
0 0
0 Solid
C
. 0 CJ
0 (j 0
0 .
r r
Gas Uquid
(e)
Figure 1-3 Schematic diagrams or some gas-liquid-su pended-solid reactors. (a) Agitated slurry
reactor, (b) nonagitated slurry reactor, (e) f1uidiLed-bcd rcaClOr.
reactors are batch reactors in which the liquid does not flow through the reactor.
These reactors are used when a small quantity of product is required. The con-
tinuous three-phase fluidized-bed reactor is used for Fischer- Tropsch and catalytic
coal-liquefaction (H-COAL) processes. Several advantages and disadvantages of
slurry and fluidized-bed reactors are listed in Table 1-9. The major advantages.
?f the gas-liquid-suspended-solid reactors are tl:!at they give better flexibility of
mixing. heat recovery, and temperature control. h y allow the use of fine.cat t
particles;which minimize the intrapartide d etrects. Such reactors can be
effectively used for a reaction which involves'a r. pidly decaying ca! ly t and
ph.ase..readw .ns..iny__clyjJj gbo.th solid re !ant and solid catalyst (e.g., catalytic
coal liquefaction). These reactors, however, give poor conversion due to axial
mixihg.. The separation of cataly.st frum the product mixture may c,?--use problems.
I
Y
&..
18 GAS-LiQUID-SOLID REACTOR DESIGN
Table 1-9 Advantages and disadvantages of slurry or fluidized-bed reactors
Adl:antages
I. High heat capacity providing good temperature control.
2. POlcntially _Q!g r c. lion.-!:!l unit volu lJ1 . ! rt actor i the catalyst is hig ly activ .
3. Ease of heat recovery.
4. Can be easily used as a batch (slurry) reactor or continuous-flow (fluidized-bed) reactor.
5. The cataly t \Oan be easily remoye!}and replaced if it decays rapidly.- Steady-state operation can
.J:! .?chieved even in a rapidly decaying system.
6.1!_f!.I.lPw _ se..<2. Ime._calJj. .p"ilJ: s. hich ca give an effectiveness fact appro!lc.l.l}!Ig
. unity. This is especially important i[ d.iflj,lsjpn l!!:nitatio"ns cause rapid catalytic deactivation or
"poorer s I !<li...ity.
7:1i.allows three-phase gas---liquid-solid (reactant) reactions to operate in the presence of a solid
catalyst Y<ii.fi put i2! i.'.:l2_ of ! .i-_c:!ic 9ij e.g.. the H-COA I. process for coalliqueraction.
8. II allows more flexibility for mixing, e.g.. agitated slurry reactor.
Disadvamages
I. High degree of axial mixing reduces conversion. High degree of conversion is obtained only by
staging several reactors in series.
2. Ca t _s.ep<;lratlon from the prod!-l . ixture by filtrat !I_I11 _p()5 .pro.9J I1) ...of .l2.\!:'.u\!!&..!..h..
fi!teT.s.:.:r _t.:cosi"of fil a.ti£ :m .l t.!e-'e -
3. 'The high ratio on_quid 10 solid may allow homogeneous side reactions to become important,
if thcy are possible.
4. High liquid holdup may cause the liquid-phase diffusional resistance to the gaseous reactant to
be an importaTlt factor affecting the global rate of reaction.
c,. ....;.'::'}:.. \-
.:.",';..'-L': )rtot-'f C c\...,. re"'l \ CC»-'" ';.. ''r-,"". \.e .C!;;'
High liqUId holdup may also give significant homogeneous reactions and signifi-
cant mass-transfer resistances for the gaseous reactant.
The three-phase continuous countercurrent fluidized-bed reactor and the
spouted.bed reactor have been used on the laboratory scale. Pruden and Weber 88
have shown that the countercurrent mode of operation for hydrogenation of
a-methyl styrene performs better than the cocurrent fixed-bed operation under
similar reaction conditions.
ic...
REFERENCES
I. Alferova, L. A., and G. A. Titova, J. Appl. Chem. (USSR), vol. 42, p. 165. 1969.
2. Anon, Petrol'hemical. Handbook, 1969. vol. 48. p. 172.
3. Astarita, G.. Mass Transfer with Chemical Reaction, Elsevier Publishing Co., 1'\Iew York, 1967.
4. Atkinson, B., and Abdel Rahman Ali, M. E., Trans. Inst Chem. Eng., vol. 54, p.239, 1976.
5. Augustine, R. L.. Cawl. Rev. - Sci. Eng., vol. 13, no. 2, p. 285,1976.
6. Bailey, A. E., in Encyclopedia of Chemical Technology (R. E. Kirk and D. F. Othmer, eds.l, Wiley
Interscience, New York, 195-" vol. 6. p. 140.
\. I ' Baldi, G., S. Go.to, C. K. Chow, and J. M. Smith,I&EC Process Design De ., vol. 13, p. 447, 1974.
I ' 'Benson. F. R., 111 Encyclopedia (!( Chemical Technology, 2nd ed. (R. E. KIrk and D. F. Othmer,
L' cds.), Wiley Interscience. New York, 1963, vol. I, p. 569.
.9. Benson, H. E., J. M. Field, D. Bienstock, and H. H. Storch, Ind. Eng. Cllem vol. 46, p. 2278,
J954. .
, Vf6."Bill, W., Thesis, Technische Hochschule, Darmstadt. 1955.
' .
",.',.)
PRACTICAL SYSTEMS AND rvPES OF INDUSTRIAL REACTOR 19
1 J. BIOS, "Manufacture of 1,4-butynediol atl.G. Ludwigshafen," Final Report No. 367.
12. Bjerle, I., S. Bangtsson, and K. Farnkvist, Chem. Eng. SCi., vol. 27, p. 1853, 1972.
13. Bondi. A. A.. Chem. Tl!Ch., vol. 1. p. 185. March 1971.
14. Brusie, J. P.. and E. V. Hort, in Encyclopedia of Chemical Technology, 2nd ed. (R. E. Kirk and
D. F. Othmcr, eds.), Wiley Interscience, New York, 1963, vol. I, p. 609.
t5. Caga, I, T., E. Shutt, and J. M. Winterbottom, J. Catill., vol. 44, p. 271,1976.
16. Calderbank, P. H., F. Evans, R. Farley, G. Jepson, and A. Poll, Proceedinys of a SymposlI/m on
Catalysis in Practice, Institute of Chemical Engineers, London. 1963. p. 66.
17. Chandalia, S. B., Indian J. Technol., vol. 6. p. 88, 1968.
18. Chandrasckaran. K.. and M M Sharma, Cllern. En!!. SCI., vol. 32, p. 669, 1977.
19. Charest, F., and E. Chornet, Can. J. Chern. Eng., vol. 54, p. 190, 1976.
20. Chervenak, M. C., S. Feigelman, R. Wolk, C. R. Cyrd. L. R. Hellwig, and R. P Van Driesen.
Oil Gas J.. vol. 61. no. 41, p. 227,1963.
21. Chun, S. WoO D. C. Cronauer, and T. W. Leslie, "Process for the Conversion of Carbon<!ccous
Materials:' US Patent No. 3.957.619. May 18, 1976.
22. Ciapctta. F. G.. and J. B. unter, Ind. Eng Chem., vol. 45, p. 147, 1953.
23. Coenan, J. W. E., in The Mechamsm of HeTerogenous Cawlysls (J. H. deBoer, ed.), Elsevier
Publishing Co., New York, 1960, p. 126-
24. Cooper. C. M.. G. A. Fernstrom, and S. A. Miller, Ind. Eng. Chem., vol. 36, p. 504,1944.
. 25. Cordova, W. A.. and P. Harriott, Chern. Eng. Sci.. vol. 30. p. 1201, 1975.
26. Corr, H., E. Haarer, and P. Hornberger, British Patent, vol. 921, p. 447,1963.
27. Coughanowr, D. R., and F. E. Krause, Ind. Eng. Chern. Fund., vo\. 4, p. 61, 1965.
28. Crowell. J. H., H. E. Benson, J. H. Field. and H. II. Storch. Ind. En9. Chern.. vol. 42, p. 2376,
1950.
29. Danckwerts. P. V.. Gas-Liquid Reactions. McGraw-Hili. New York. 1970.
30. Dovcll, F. S., W. E. Ferguson, and H. Greenfield, I&EC Process Design Dev., vol. 9, no. 2, p. 224,
1970.
31. Ericsson. E. 0., J. L McCarthy, and D. A. Pearson, in Pulp and Paper Science aNd Technolo9r
(c. E.libby, ed.), McGraw-Hili, New York, 1962, vol. 1, p. 240.
32. Farley. R.. and D. J. Ray, J. Ins!. Perrol., vol. 50, p. 27, 1964
33. Flinn. R. A., O. A. larson, and H. Reuther, Hydrocarbon Proc. Petro Refiner., vol. 42, no. 9,
p. 129, 1963.
34. Freifelder, M., Practical Catalytic HydrogenatiOtJ - TechtJiques and Applit'ation, Wiley I nterscience,
New York. 1971.
35. Frye, C G.. and J. F Moshy, Chem. En!!. Pro{Jr., vol. 63, no. 9, p. 66,1967.
36. Gerdes. K. F., B. E. Strangeland, G. T. S. Chem, and R. J. Gumerman, ''Simulation of Hydro-
cracking Reactor Systems" (personal communication\.
37. Germain, A. H.. A. G. LeBabvre, and G. A. l'Homme, Chern. React. Eng., I I Adv. Chem. Ser., no.
133, p. 164, 1974.
38. Gilbert, J. B., and R. Kartzmark, Proc. Amer. Inst. Petr., vol. 45, no. 3, 1965.
39. Gorshkov,A. P.,I. K. Kolchin, A. M. Gribov, and L. Ya. Margolis, Kmet. Karal., vol. 9, p. 1086.
1968.
40. Goto, S., and J. M. Smith, AIChE J., vol. 21. no. 4, p. 714. 1975.
41. Govindarao. V. M. H., and K. V'. Ramana Murthy, J. Appl. Chern. BiOTechnol., vol. 25. p. 169,
1975.
42. Guill, J., A. Tarrer, L Taylor, Jr., J. Prather. and S. Green, Jr., I&EC Process Design Dev.. vol. l5,
no. 4, p. 490. 1976.
43. Gunn, D. J., and A. Saleem, Trans. lnst. Chem. Eng., vol. 48, p. 146, 1970.
44. Hall. C. c.. D. Gall, and S. L. Smith. J. Inst. Petrol., vol. 38, p. 845, 1952.
45. Halvorson, H. 0., in Encyclopedia (if Chemical Technology (R. E. Kirk and D. F. Othmer, cds.),
Wiley Interscience, New York, 1955, vol. 14, p. 946.
46. Hanika. J.. K. Sporka, and V. Ruzicka, Col/. Czuh. Chem. Comm., vol. 36, p. 2903, 1971.
47. Hanson, L. L, and A. J. Engel, AIChE J., vol. 13, p. 260, 1967.
48. Hartman. M., and R. W. Coughlin. Chem. Eng. Sci., vol. 27, p. 867, 1972.
20 GAS-LIQUID-SOLID REACTOR DESIGN
49. Hatch. L. F., Hydrocarbalj Proces. ing, vol. 49, no. 3. p. 101, 1970.
SO. Hellwig, L. R., R. P. Van Dricscn, S. C Schuman, and C E. Slyngstad, Oil Gas J., vol. 60, no. 21,
p. 119, 1962.
51. Henry. H. C. and J. B. Gilberl./&EC Process Design Dev.. vol. 12. p. 328, 1973.
52. Hofmann, H., Thesis, Technische Hochschule. Darmstadt, 1954.
53. Hoog, H., in Prnl'eedin!ls O{thl' 3rd Internatinnal Congre-'. on Catalysis, North Holland Publishing
Co., Amsterdam, 1965, p. 7.
:'i4. Hooper, J. R., and D S. Shigemura, AIChE J.. vol. 19. no. 15, p. 1025, 1973
55. Horne, W. A., and J. McAfee. Ad\:. Petrol. Chem. Rt'fimng. vol. 3, p. 193, 1960.
56. Juvekar, V. A., and M. M. Sharma, Chem. Eng. Sci., vol. 28, p. 825,1973.
57. Karolyi, J., A. Zahli. R. Rirlhler, and H. Spitzner, 1m. ChI''''. Eng.. vol. 3. p. 597, 1963.
58. Kastens, M. L., L L. Hirst. and R. G. Dressler, Ind. Eny. Chern., vol. 44, p. 450, 1952.
59. Kenney, eN.. and W. Sedricks, Chern. En.'/. Sd., vol. 27, p. 2029,1972.
60. Kirk, R. E., and D. F. Othmer, Encyclnpedia nf Chemical TechnololiV, 2nd ed., Interscience
Publications, New York, 1963, vol. 1, p. 174.
61. Kirk. R. E., and D. F. Dthmer. Encyclopedia /If ihemical Tedl1lolagy, 2nd ed.. Interscience. New
York, 1968, vol. 15.
62 Kirk, R. E., and D. F. Dlhmer, Encyclopedia of Chemical Technology. 2nd cd., Interscience
Publications, New York, 1968, vol. 15, p.292.
63. Kirk. R. E.. and D. F. Dthmer, Encyclopedia vj Chemical 1"e<'hnolagy, 2nd ed.. Interscience
Publicalions, New York. 196R. vol. 15. p. 472.
64. Kolbel. H., in Chemische Technologie, 2nd ed. (K. Wirmacher and L. Kiiehler, eds.\. Carl Hauser
Verlag, Munich. 1959, vol. 3, p.439.
65. Kolbel, H., and P. Ackermann, Cllem. Engl'.- Tech., vot 28, p. 381, 1956.
66. Kolbel, H., P. Ackermann, and F. Engelhardt, El'dnel KohlI', vol. 153, no. 225, p. 303, 1956.
67. Kolbd. H., and P. Ackermann. in Ullma,ms Encyklopadie del' Technisehen Chemie. 3rd ed. (W.
Foerst, ed.). Ruban and Schwar7cnberg, Munich, 1957, vol. 9, p. 716.
68. Kolbe!. H., and P. Ackermann, Proceeding. uf Ihe 4tll World Congress /If Petroleum EngIneers,
Rome, 1955, Carlo Colombo Editeur, Rome, 1955, Sect IVC, p. 228.
69. Kolbe!, H., H. Hammer, and U. Meisel, Chemical Rt'a<tl"'! Ellgineel'ing: Prnceedings (!f the Fifth
European and St't'and lnternati()nal Svmposium 0/1 Chemical Reaction Engineering, Amsterdam.
May 2-4, 1972, Elsevier, Amsterdam, 1972.
70. Kolbel, H., and H. G Maennig, Elekroehem., vol. 66, p. 744,1962.
71. Komiyama, H., and J. M. Smith, AIChE J., vol. 21, no. 4, p. 664,1975.
72. Kronig, W., Erdoel KohlI', vol 15. p. 176, 1 '.162.
73. Kronig, W., Pro(.eedings of rhe 6th World Congress Q{ Petroleum Enqineer , Druck: Hanseatische
Druckanstalt, Hamburg, 1963, Sect. IV, Paper 7.
74. Lawny. F.. M. C'ordonnier, and W. Thomas. A/C'hE J.. vol. 21. no. 4. p. 822. 1975.
75. LemcoIT, N. D., and G. J. Jameson, AIChE J., vol. 21, no. 4, p. 730, 1975.
76. Levec, J., and J. M. Smith, AIChE J., vol. 22, no. 1,1976.
77. Mears, D. E., Chern. En!!. Sd., vol. 26, p. 1361, 1971.
78. Mochizuki, S., and T. Matsui, AIChE J., vol. 5, no. 5, p.904, 1976.
79. Neavel. R. C. Fuel, vol. 55, p. 237. 1976.
80. "1'\Iew Catalytic Route to Acrylamide," Chem. E"O., vol. 80, no. 27, p. 68-69,1973.
RI. Niiyama, H., and J M. Smith, AlClIE J., vol. 23, no. 4, p. 592,1977.
82. Ohtsuka, T., Y. Hasegawa, and N. Takanari, BII/I. Japan Petrol. In t., vol. 10, p. 14, May, 1968.
83. Dstergaard, K.. Adv. Chern. Eng.. vol. 7, p. 71, 1968.
84. Dzel, F., MS Thesis, MIT, Cambridge, 1973.
,-85. Pichler, H., and A. Hector, in Encyclopedia of Chemical Technology, 2nd ed. (R. E. Kirk and
D. F. Dthmer, eds.), Wiley Imerscience, New York. 1964, vol. 4, p. 446.
86. Pius. P. M., J. E. Conner, and L. N. Leum, Ind. Eng. Chem., vol. 47, p. 770, 1955.
87. Prober, R., J. J. Pyeha, and W. E. Kidon, AIChE J., vol. 21, no. 6, p. 1200, 1975.
88. Pruden, B. B., and M. E. Weber, Cun. J. Cllen!. Eng., vol. 48, p. 162, 1970.
89. Raff, R. A. V., and J. B. Allison, Palyethyle..e, Wiley Interscience, New York, 1956.
PRACTICAL SYSTEMS AND TYPES OF INDUSTRIAL REACTOR 21
90. Ramchandran, P. A., ,md M. M. Sharma. Trum..lltst. Chern. EII.I/., vol. 49, p. 253,1971.
91. Reulher, J. A., and P. S. Puri, Can. J. Chern. Eng., vol. 51, p. 345, 1973.
92. Ross, L. D., Chem. Ellg. Prngr., vol. 61, no. 10, p. 77. 1965.
93. Sadana. A.. and J. R. Katzer. 1& EC F undamental. . vol. 13. p. 127. 1974.
94. Satterfield, C. N., AlChE J., vol. 21, no. 2, p. 212, 1975.
95. Sallerfield, C. N., and F. Ozel, AIChE J., vol. 19, no. 6, p. 1259,1973.
96. Satterfield, C. N., A. A. Pelossor. and T. K. Sherwood, AIChE J., vol. 15. p. 226.1969.
97. Satterfield, C. N., and T. K. Sherwood. The Role £1{ D!ffusiolt in Catalysis. Addison-Wesley,
Reading. Mass., 1963.
98. Satterfield. C. N., and P. F. Way, AIChE J., vol. 18, p. 305, 1972.
99. Schoenemann, K., Dechema Monograph. vol. 21. p. 203,1952.
100. Schorr, V., V. Boval, V. Hancil, and J. M. Smith, I&EC Process Desi!J1t Dev., vol. 10, p. 509,
1971.
101. Schuil, G. C. A.. and B. C. Gates. AIChE J., vol. 19. no. 3. p. 417.1974.
102. ScolI, J. W., and A. G. Bridge, Adv. Chem., no. 103, 1971.
103. Sedricks, W., PhD ThesIs, University of Cambridge, 1969.
104. Sedricks, W., and C. N. Kenney, Chem. Ellg. Sci., vol. 28, p. 559,1973.
105. Shah, Y. T., and A. J. Perrota, I &EC Product Res. D,'v., vol. 15, no. 2, p. 123, June, 1976.
106. Shah, Y. T.. and M. M. Sharma. Trails. lnst. Chem. Eng.. vol. 54, p. I. 1976.
107. Sherwood, T. K., and E. J. Farkas, Chern. Eny. Sci., vol. 21, p. 573, 1966.
108. Shingu. H.. US Patent 2.985.668 (1961).
109. Silvestri, A. J., and C. D. Prater. J. Phys. Chern., vol. 68. p. 3268,1964.
110. Snider, J. W.. and J. J. Perona, AIChE J., vol. 20, no. 6, p. 1172, 1974.
111. Somers, A., Y. T. Shah, and J. Paraskos, ellem. Eng. Sri., vol. 31, p. 759, 1976.
112. Srivastava, R. D., A. F. McMillan, and I. J. Harris, Can. J. C/li'm. Eng.. vol. 46, p. 181. 1968.
113. Stanulonis. J. J.. B. C. Gates. and J. M. Olson, AIChE J.. vol. 22. no. 3. p. 576, 1976.
114. Strangeland, B. E., I &EC Process Design Dev., vol. 13, p. 71. 1974.
115. Titova. G. A.. Chem. Abstr., vol. 70, p. 1314, 60621h, 1968.
'\ 116. Tsao. G. T., Chern. Eng. Sci., vol. 27, p. 1593, 1972.
117. Tsao, G. T., and D. D. Lee, AfChE J.. vol. 21, no. 5, p. 979, 1975.
118. Tsao. G. T.. A. Mukerjee. and Y. Y. Lee, in Proceedings of the 4rh lnrernational Fermenrarion
Sj:mposium, Fermentlltion Tecl!llolog}' Today, Kyora, 1972, American Society for Microbiology,
Washington D.C., 1972, p. 65.
119. Urban, W., Erdoel Kohle, vol. 8. p. 780,1955.
120. Van Deemter, J. J., in Proceedillgs of the 3rd European Symposium on Ch<'mical Rem.tintl
Engineering, Pergamon Press, Oxford. 1965, p. 215.
121. Van Dnesen, R. P., and N. C. Stewart, Oil Gas J.. vol. 62, no. 20, p. 100. 1964.
122. Verno, Y. J., Water Pol. Cont. Fed., vol. 46, no. 12, p.2778, 1974.
123. Volpicelli, G., and L Massimilla, Chem. Eny. Sci., vol. 25, p. 1361, 1970.
124. Volpicelli, G., and L Massimilla, Pulp Paper Mag. Cat!., vol. 66, p. TS12, 1965.
125. Ware, C. H.. Jr., PhD Thesis. University of Pennsylvania. University Park, 1959.
126. Way, P. F., PhD Thesis, MIT, Cambridge, Mass, 1971; also Satterfield, C. N., and P. F. Way,
AIChE J., vol. 18, p. 305. 1972.
127. Yitzhaki, D., and C. Aharoni, AIChE J.. vol. 23, no. 3. p. 342, 1977.
128. Zabor, R. c., R. C. Odiozo, B. K. SchmIdt, and J. R. Kaiser, 111 Acres du Deuxieme Congresse
ImertJGtionale de Catalyse, Paris, 1960, Editions Technip, Paris, 1961, p.2601.
129. Zenz, F. A., and D. F. Othmer, Fluidization and Fluid-Particle Systems, Reinhold, New York,
1960.
CHAPTER
TWO
FILM AND PENETRATION THEORY ANALYSES
OF GAS-LIQUID AND GAS-LIQUID-SOLID
REACTIONS
2-1 INTRODUCTION
The gas-liquid and gas solid reaction processes can be analyzed by several
different physical models, namely film, penetration, surface renewal, Danckwerts,
film-penetration, etc. These models are described by Danckwerts. 39 Although each
ofthese models gives a somewhat different physical picture of the reaction process,
in many instances the final desired answer for the rate of absorption of gas in the
presence of a liquid- or a solid-phase reaction is similar. Since film and penetration
theories are most widely used. we review their applications here.
2-1-1 Film The.,ry
The film theory was originally proposed by Whitman,195 who obtained his idea
from the Nernst l17 concept of the diffusion layer. It was first applied to the
analysis of gas absorption accompanied by a chemical reaction by Hatta. 8S ,86
It is a steady-state theory and assumes that mass-transfer resistances across the
interface are restricted to thin films in each phase near the interface. If more than
one species is involved in a multiphase reaction process, this theory assumes that
the thickness of the film near any interface (gas-liquid or liquid-solid) is the same
for all reactants and products. Although the theory gives a rather simplified
description of the multiphase reaction process, it gives a good answer for the
global reaction rates, in many instances, particularly when the diffusivities of all
reactants and products are identical. It is simple to use, particularly when the
22
FILM AND PFNI.:TRATION THEORY ANALYSES OF REACTIONS 23
reaction process is complex, involving seveJ:al volatile and nonvolatile reactants
<l:ndjor products. The governing equations for this theory can be written in a
general form, as:
d 2 W; * 0
D. - - R . -
· dx 2 · - ,
i = 1, 2, . . . , 11,
(2-1)
where Db W;, and Rt are the diffusivities, concentrations, and rate of generation
(or depletion) of the reacting species i. respectively. The number of equations of
type (2-11 involved is generally equal to the number of reacting species. /1. Not all
the equations may be relevant for the purpose of calculating global reaction rates.
It should be noted that no convective mass transfer, as such, is taken into account
in Eq. (2-1). The relevant boundary conditions for all species, i = 1,2,..., etc.,
are generally written at the interface (gas-liquid or liquid. solid) and at the film
boundary. The absorption rate is obtained as
R- = -D. d 1
· · dx ,, o
(2-2)
If there is no reaction in the film, the theory implies that the mass flux across
the film is given by
R, = KiMtj,
(2-3)
where LlW i is the difference in concentration at the two ends of the film and K i
the phenomenological mass-transfer coefficient for the ith species. K i can be
expressed as equal to D;/l>, where l> is the film thickness. The values of the
phenomenological coefficients K i depend upon the properties of the diffusing
species and the fluid and the prevailing hydrodynamic conditions during the
reaction process.
2-1-2 Penetration Theory
Classical penetration theory, often referred to as Higbie's penetration theory, is
more realistic than film theory and takes into account the transient mass-transfer
conditions. In this theory, no assumption is made regarding the depths of
penetration of the various reacting species. 11 is more complex to use than the
film theory. since it involves partial differential equations for the mass balances
of each reacting species. 11 gives a more accurate answer for the absorption and
desorption rates when the diffusivities of all reacting species are unequal. The
governing equations for this theory can be expressed in a general form:
a 2 w i * _ aW i
-Ri - ,
ux vt
i= 1,2,...,n.
(2-4)
The right-hand side of Eq. (2-4) takes into accoUnt the time variation of the
concentration of the reacting species in the liquid phase. Just as in the case of
film theory, classical penetration theory neglects the convective mass transfer at
24 GAS-LIQUID SOLID REACTOR DESIGN
the gas-liquid interface. The number of equations of type (2-4) generally required
is equal to the number of the reacting species, /1. Equation (2-4) requires initial
conditions along with the boundary conditions. The boundary conditions are
usually written at x = 0 and at x = 00 (ifliquid film is thick and can be considered
to be a semi-infinite medium for mass penetration) or at x = d, where d is the
thickness of the liquid film. Unlike film theory, penetration theory takes into
account the effect of time of contact between gas and liquid during a gas liquid
reaction process. The latter theory is particularly useful when the gas-liquid
reaction is non isothermal, because in this situation an assumption of the same
film thickness for mass and heat penetration is obviously not true and the film
theory is not applicable. When the reaction process is complex, an analytical
evaluation of the absorption and/or desorption rates by the penetration theory
may become too complex for its practical use. Penetration theory has been shown
to be equivalent to the boundary layer theory.2 At any given time, the absorption
rate is given as
awl
R j = - Dr ----.!. ,
ex ,, o
(2-5)
2-1-3 Mechanism of Absorption with Reaction
Gas -liquid reactions may conform to various mechanisms. Under certain con-
ditions, the absorption and reaction may conform to a "slow" reaction mechanism.
By this term, we mean that a gaseous species A is absorbed, diffuses through the
fih.n..andthc;:.!} r:eflfts ill the bulk liquid. Thus. according to film theory, the processes
of chemical reaction and diffusion become two steps in series for a slow reaction.
The absorption rate in this case is almost unaffected by a chemical reaction. In
the limiting case, where the concentration profile of the absorbing species in the
liQuid J)lm is flat, the reaction is often called a "very slow" reaction, and the process
of absorption is said to be in the kinetically-controlled regil11e-
Absorption accompanied by a vhemical reaction is considered to be in a "fast"
reaction regime when the absorption rate is considerably affected by the chemieal
reaction. According to film theory, in a "fast" reaction regime, both r a..0.jQl) and
dirru: on occur in parallel-within the diffusion film. If the conc -";tration of one
or more QQ!}voJatik ...specics taking part in the reaction remains ess ntiaH}:-W1-
ch nged in the vicinity of the gas-liquid interface and if the reaction is mthQrckr
with respect to the other absorbing, or nonvolatile, species taking part in the
reaction, then the "fast" reaction is considered to be pseudo-mth-order with
respect to these species. If, on the other hand, concentrations of all nonvolatile
species taking part in the react:ion change significantly near the interface, the
"fast" reaction is said to occur under "depletion" conditions.
A reaction between an absorbing species and a nonvolatile reactant may, in
an extreme case, be "instantaneous"- The increase in absorption rate due to the
chemical reaction would be maximized under' this situation. If the reaction is
irreversible, the "instantaneous" reaction occurs when the reaction between the
absorbing species and the nonvolatile reactant is so rapid that they cannot coexist
FILM AND PENETRATION THEORY ANALYSES OF REACTIONS 25
in the liquid. A "reaction plane" is formed in the liquid, where the instantaneous
reaction occurs. and both absorbed species and the nonvolatile reactant diffuse
towards this "reaction plane," where they react. T G.tion is, thus, solely
l'fer-controlled . When thc concentration of the no -; I ac ta;t is
much larger than that of the absorbed species, the ,! ctiQD---p-la " is almost next
to the gas-liquid interface, and the rate of reaction is solely governed by the rate
of diffusion of the nonvolatile reactant from the bulk liquid to the interface. It
should be noted, however, that even a reaction which may not be intrinsically
instantaneous can become "instantaneous" under certain conditions. By the term
"instantaneous," _it_ is me 1ttp.a!J:hc:: _ rat. '!!. '!EtLq!Li .f..o !!. led _ y th J.aJe_Qf
diffusion ofth.e.absorbed species apd_ he_ nonvo).?-.til re t<!'!t_to the reactiQn_plane.
If the reaction betwe n_!.h. .1'ill!!or.hed--sp c::ic;;.!L nd the nonvolatile reactant-is
reversible, the term "instantaneous reaction" is .synonymous with "equilibrium
reaction." Both forward and backward reactions in this case are so fast that, at
all times, concentrations of the various reacting species in the liquid are in
equilibrium. The absorption rate in this situation would be independent of the
reaction and solely determined by the diffusion of various reacting species.
The mechanisms described above similarly apply to the case of desorption
with reaction (i.e., where the product of a liquid-phase reaction is volatile and
desorbs in the gas phase). The word "absorption" in the above discussion will be
replaced by the word "desorption" for this case. In most practical situations, more
than one reaction occurs simultaneously. Under these situations, the terms "slow,"
"fast," and "instantaneous" are applied to each reaction individually. Although
the terms "slow," "fast," and "instantaneous" reactions (or diffusion-contmlled
and mass-trans fer-controlled regimes) are discussed with respect to gas-liquid
reactions, they can also be applied to gas liquid- solid reactions, where the solid
is either a catalyst or a reactant.
2-2 FILM THEORY ANALYSIS OF GAS- LIQUID-SOLID
REACTIONS
We consIder three types of gas-liquid-solid reaction.
1. Gas-liquid reactions with solid inert.
2. Gas-liquid -solid reactions with solid as a catalyst.
3. Gas-liquid-solid reactions with solid as a reactant.
Here we briefly review each of these reaction separately.
2-2-1 Gas-Liquid Reactions
The most basic type of gas-liquid reaction is
I!.
A (g) + ZC (I) B (I).
(2-6)
26 GAS-LIQUID-SOLID REACTOR DESIGN
This reaction can occur in slow, fast, or instantaneous reaction regimes. II! e.ach
re lkm .Ie.gim t e gas phas T_esistance can be important, depending --on Ihe
concentration of the reactant in the gas phase and the solubility of the gas in
the liquid phase. The criteria for these reaction regimes are 24 ,39
1. Slow reaction,
-J (KC tDA)/kL « I ;
(2-7)
2. Fast reaction,
,/(i?CL DA) /k L » 1;
(2-8)
3. I nstantaneous reaction,
-J(KCLD A)/k L » I + CL/ZA iL ;
(2-9)
where K = rate constant. C L = bulk concentration of the liquid reactant, AiL =
gas-tiq-tridinterfacc concent ation of the gaseo!.!.s Iea.clant, D" = diffusivity of
gaseous reactant in the liquid phase, and k L =gas::-l quid mass-transfer coefficient
in the absencc of a chemical reaction. --
The concentration distributions for species A, B, and C in these regimes
based on the film theory are described in Figs. 2-1 through 2-3.
If the product B in reaction (2-6) is volatile, it will simultaneously desorb
in the gas phase. The typical concentration distributions of species A, B, and C
Gas film
Liquid film
Bulk liquid
..-- _.--:
AI. K
'-'-'-'-'-'-'-A -t C _ B (Q)
At
A+C B(Il)
o
li G
Gas-liquid
interface
1,1. Gas film.I.esist3l1t important;
- A rPtio -rate, R A = kcudAG - A iG ) =
. .- kLadAiL -A L )
Gas film resistant not-important;
-.- Absorption rate, R A = kLaL.(A-;L - AI.)
Figun 2-1 The concentration distribution for species A, B, and C in the slow reaction regime, based
on the film theory. Reaction occurs mainly in the bulk liquid; mass transfer and reaction are
processes in series.
fiLM AND PENETRATION THEOR\' A AI.YSES OF REACTIONS 27
Gas film
Liquid film
Bulk liquid
.'\;
c
K
A+C- B( )
o
li(;
Gas-liquid
interrace
lit
- Gas film resistant important
-.- Gas film resistant not important
Figure 2-2 The concentration distribution for specIes A. B. and C in the rast reaction regime, based
on the film theory. ReactIOn occurs mainly in the liquid film; mass transrer and reaction are
parallel processes; the a.bsorption rate of the gas is increased due to the ctJemical n:acLwJ\.
Reaction plane
AG
C L
Gas-liquid
interrace
-Gas film resistant important
- . -Gas rilm rcsistant not important
Figure 2-3 The concentration distribution ror specics A. B. and C in._tht; mst n a_ll eous reaction
regime. based on [he film theory. Reaction occurs at a plane m the liquid: the gas and t he .ii"qllia
cannot coexist and the increase in absorption rate due to the chemical reaction is a maximum.
28 GAS-LIQUID-SOLID REM-TOR DESIGN
r
(a)
C L
C L
(b)
x=O li L
:B" C L
L I
I
x=O
li L
l
(c)
C L
Be
fd)
C L
(e)
(I)
x=O
A
lit
6e
x=O
/)L
(g)
lie x = 0 >.. /)L
Figure 2-4 TYPIcal concentration profiles ofmstantaneous reaction between the gas A and the reactant
C. based on film theory. (01 Diffusion controlled slow reaction. (bl kinetically cOlltrolled- slow
reaction. (e) gas film-controlled desorption- fast reactio.n, fj) liquid-tilm-co.ntrolled desorption-fast
reaction. (el liquid-film-controlled absorption -instantaneous reaction between A and C. (j) gas-film-
controlled absorption instantaneous reaction between A and C, (g) concentration profiles for A, B, and
C ror instantaneous reaction between A and C - both gas- and liquid-phase resistances are
compa r able. 162
FILM AND PENETRATION THEORY ANALYSES OF REACTIONS 29
for various cases of slow, fast, and instantaneous reactions bascd on the film
theory are illustrated in Fig. 2-4.
An extensive literature on the film and penetration theory analyses of gas-
liquid reactions has been published. A summary of the types of reaction analyzed
by the film and pcnetration theories is given in Table 2-1 for the case of finite
Table 2-1 Summary of theoretical analysis of gas-liquid reactiom with finite
reaction rate by film and penetration modclst
Type of teaction Model
Zero-order reaction (e.g.. oxidation rcactions of Film and penetration
hydrocarbon)
Zero-order reaction Penetration
A(g) ..... B Penetration
A(g) --> B Film
YAA(g) Product Film and penetration
A(g) + B -+ Product (e.g.. absorption of CO 2 Penetration
into carbonate-bicarbonate solution\
A(g) + B , Product Film
A(gl + B(g) .. Product (e.g., Film
C 2 H. + CI 2 -+ C 2 H.Cl 2 )
A(g\ + B(g) -+ Product (e.g., Penetration
CO 2 NH).. Ammonium carbonate)
Y AA(g) .J.. Y II B -+ Products (e.g., reaction Penetration
between ammonia and ethyl malonate in
alcoholic solution)
YAA(g) + YIIB -+ Products Film
A(g) E Film
A(g);':: E Penetration
A(gl 2B Film
A(g) C + Q... Film
A(g) nB(g) Penetration
A(g) + B --> C. Film and penetration
C+B-+P
YAA(g) I- fllB -+ feC + Y D D (gas or liquid), Film and penetration
YEE(g\ + Yc.C -+ YIlB
(e.g., C 2 H 4 and O 2 in CuCl 2 solution)
YAA(g) + Y..B -+ fcC, Film
YAA(g) + Yc.C -+ Product
YAA(g) + YIIB Product, Film
YAA(g) 1- YeC -+ Product
Reference
186
11,177
7,39,40,41,67,76,
130, 143
39.76
88
18, 76. 89, 189, 198
56,163
148
13
16,63,88, 125, 133
88
23. 47, 94
166,178
184
184
135
17, 115, 144
102.141,161
123
124
30 GAS-LiQUID-SOLlD REACTOR DI::SIGN
Table 2-1 Continued
Type of reaction
1-:"Algl - YoB --> Product.
Yf.E(gl -t 1-;'B --> Product
Y,A(gl + YBB 1-""E.J.. fd'-
Y,A(g} ... Y.B YEE -t YfF
Algl"T YoB:;='" YcC + Product,
YEE(gl... Yr.C . "BR
A(g) 1- R E
A(g) ... B ... C
ACgl -+ B ..... C
A(g) + B-+C,
A(g)+C.....P
A(g) + Y.B..... Product,
A(g) + YcC Product
fAA(g) + Y B B ..... YcC(J) + Y D 0,
Yf.".(gl - YeC..... YuB
Y.A(gl -I- Y u B..... YcC(I) + Y D D.
YF.Elgl + }-(,-C..... tR.B
Alg)'" YRB Ycc,
Alg) -/- Yr.C ... Product
AlgI + YBB . Product.
Alg) + Yee..... Product
AlgI -/- YRB..... Product,
YEE(g) + Y.. B ..... Product
Alg) + YeC..... Product.
B(g) .L YeC..... Product
A, A2
I/'
A..
"-
Ch -+ H20 Hr +CI- -I- HOC!
Rate = KF( [Ch] _ [H _+]( ClK [HOCIJ ).
K* = [H +][ct][HOCl l
[Cl 2 ]
Carbonic oi.u'h)cJr.lSt.:
CO 2 -f H 2 0 , H 2 CO-,
K [EnLyme] [CO 2]
Rale = -..- -. -
Km + [C0 2 ]
K,
C + D Alg)+ B,
I.,
D.. = Dc = Do = 0
Model Reference
--- - -
Film 12..\
Film 122
Penetration 125, 156
Penetration 125
Film 131
Film 23
Penetration 174
Film 187,188
Film 95
Penetration 160
Film 123
Penetration 125
Penelration 125
Penetration 125
Penetration 74
Film 31
Penetration 20,21
Film and penetration
182
Peneuallon
I --t
FILM AND PENETRATION THEORY ANAl VSES OF REACTIONS 31
Table 2-1 Continued
Type of reaction Model Reference
Condensation polymcrization (e.g.. synthesis of
polyamidcs. synthesis of polymers such as
polyethylene terephthalate)
2A(g) A* -/- A, Film 149
A* + B P
Gener:-tl Film 62
A(g) E..... P Film 105
6 n
A(gl + C - Products, Film 1311, 137, I3g
B(g) + C ..... Products
(e.g., CO and C 2 H 4 in ammoniacal CuCb
solution, O 2 and CO in haemoglobin. H 2 S
and CO , 111 amine under caustic conditions)
Alg) + C B(g) + S, Film 141
S
B(g) .. Products (S acts as catalyst)
(e.g., CI , and CO 2 in Na2CO, solution, S02
and CO 2 In Na2C03 solulion)
A(g) I-C ....S. Film 141
B(g) + S .... Product
(e.g., S02 and O 2 in caustic soda)
A(g) + C ---S. Film 141
B(g) + C .... Product,
S
B .... Product
(e.g.. Cl 2 and O 2 in NaOH, S02 and CO 2 in
NaOH)
A(g) I- C - B(g) + E, Film 140
BIg) + c..... Products
(e.g., phosgene and CO 2 in NaOH or Na2CO)
solutions)
t Note that notations A. B. C. D. E, F, etc., in this table refer to either reactant or product
depending upon the particular reaction system under consideration.
reaction rate and in Table 2-2 for the case of instantaneous reaction rates. Some
additional reaction systems involving simultaneous absorption of two gases may
be found in the review by Ramchandran and Sharma. 14t Additional reactions
involving one or more volatile products may also be found in the review by Shah
and Sharma. 162
Experimental systems A large number of gas-liquid reaction systems have been
examined experimentally. Some of these studies are outlined in Table 2-3. This
32 GAS-LlQUID-SOLlD REACTOR DFSJr.N
Table 2-2 A summary of studies on imtantaneous reactiom
Reference
Reaction Model
A E m
A 2E Film
A+B E m
A + B E + F Film
A(g) L Z..C, Penetration
B(g) LZ.,C
(e.g., simultaneous absorption of CO 2 and IhS into
amine solution)
Y"A + f B 8 = YcC + YDD
Alg) + Z I 8 1 + -" YLPI + Y2P2 -/- ...
(e.g., S02 + H20 H + + HSOj.
CO, + 2R2NH R 2 NCOO + R 2 NHn
(S02),oln + SO + H20 2HS03
(H 2 S).n!n + OH- HS + H 2 0,
HS +OH- S2 ..,..H 2 0
(S02),oln + OH - HSO),
HSO] + OH- soi + H 2 0
A + B - Product
A + YBB - Product
(e.g., oxygen into sodium dithionite solution)
A(g) + Y B B .... Product in packed tower
A(g) + Y"B.... PI,
E(g) + Ya.8 .. P 2
(e.g., simultaneous absorption of CO 2 and H 2 S
into alkaline liquid)
A(g) + YBB Product,
Alg) + YcC - Product
" N
Alg) + L Z,B i ..... L E"
1= I i= I
120
120
120
120
136,142
PenetratIon 156
42
Film 126
Film 126
Film 126
Penetration 6, 18, 39, 166
Penetration 39,43.98, 132
Film 155,163 \
Penetrallon 39, 73. 148
Film 95
Peneuallon 3
Film 142
Film 140
where EL' E2,..., E. are n products
A(g) + C _ S + Product (instantaneous),
B(g) ..,.. S C (finite rate)
A(g) ..... B(g) + D,
A(g) + C(g) + B(g) t- D
(e.g., absorption of mixture of CO 2 and phosgene
into water)
A(g) + C..... E (gas or liquid) '(instantaneous reaction), Film 137
YFE t- fcC.... Products (fimte reaction rate)
H 2 S + MOH - MHS -j H 2 0. Penetration 127
H 2 S + 2MOH ..... M 2 S + H 2 0.
H 2 S + CO) - HS + HCOi,
H 2 S + HCOi ..... HS - + H 2 0 + CO"
C0 3 + H 2 0... HCOi + OH-
FILM AND PENETRATION THEORY ANALYSES OF REACTIONS 33
Table 2-2 Continued
Reaction
Model Reference
Film 141
Film 141
A(g) -+ B(g) + E
A(g) -+-- C -+ S.
B(g) + C .. Products,
B(g) Products
A(g) + C .... B(g) -+-- E.
B(g) ..l Products
(S acts as catalyst)
Film
141
table indicates that the absorption of carbon dioxide in a variety of solvents is
the most extensively examined process. Other absorbent gases studied are carbon
monoxide, ammonia, hydrogen chloride, hydrogen cyanide, carbonyl sulfide,
phosphorous trichloride, hydrogen bromide, mercaptans, oxygen, chlorine, sulfur
dioxide, hydrogen sulfide, phosgene, and nitrous gas. Absorption of some hydro-
carbons such as acetylene, benzene, ethylene, propylene, dimethyl ether, vinyl
chloride, heptene, octene, and isobutylene have also been considered. The studies
are made for both single gas absorption as well as simultaneous absorption of
two gases. Reactions producing both nonvolatile and volatile products are
examined. The solvents used are of varied chemical nature.
Several experimental systems, such as absorption of Ch, NH 3 , and phosgene
in water, hydrogen sulfide in aqueous buffer solutions, and oxygen in glucose
solution have been extensively examined with the help of penetration and/or film
models. Others, such as absorption of CO 2 in amine solution and hydro-
chlorination of octyl and dodecyl alcohols have been only either partially examined
or not subjected to a significant theoretical evaluation. The absorptions of Ch
and NH 3 in water are accompanied by large heat effects. These effects are also
examined with the help of penetration theory. Several other practical systems
involving simultaneous absorption of two gases to and/or the one involving one
or more volatile products ll have been described, and reviewed by Ramchandran
and Sharma t4t and Shah and Sharma Hi2.
(' I . (" I I U J )
2-2-2 Gas-Liquid-Solid Catalytic Reaction t), I J
NC? an lysis of this type of the reaction by penetration theory has been reported.
We shali analyze a few examples of this type of reaction by t!le film theory. For
a gaseous reactant, the following process steps are involved in this type of a
reaction. ..,
I. Mass transfer from the bulk concentration in the gas phase to the gas-liquid
interface,
2. Mass transfer from the gas-liquid interface to the bulk-liquid phase.
34 GAS LIQUID SOLID RIiACfOR DESIGN
3. Mixing and diffusion in the bulk liquid.
4. Mass transfer to the external surface of the catalyst particles.
5. Reaction at the catalyst surface, including intraparticle diffusion effects.
System
Table 2-3 A summary of experimental gas -liquid reaction systems
Reference
CO 2 in monoethanolamine solution
CO 2 in aqueous amine-potash solution
CO 2 in aqueous amine
CO 2 in solutions of Na2CO) and triethanolamine
CO 2 in diethanolamine solution
CO, in carbonate-bicarbonate, alkaline solutions
CO 2 in water in presence of carbonic anhydrase
CO 2 in weak ion-base ion-exchange resll1
CO 2 and H 2 S into lOalcium cyanamide solution
CO and CO 2 into ammoniacal cuprous chloride
CO 2 and S02 111 NaOH
CO 2 and carbonyl sulfidc 111 NaOH
CO 2 and NH, in watcr
CO 2 and phosgene in water
H,S and CO, in amll1e solulion
H)S and CO 2 111 aqucous hydroxIde solution
O 2 in sodium sulfite
'I
O 2 in glucose solution
O 2 m cuprous chloridc
O 2 in aqucous alkaline solu tion of sodium dithionite
O 2 in aqueous solutions of phenol, methanol. and formaldehyde
Cl 2 m waler
CI 2 in HCr. NaCl, and NaOH
Chlorination of acetylene
Chlorinization of\:1en7ene with stannic chloride catalyst
Ferric-chloride-catalyzed hydrochlorination of I-hexadecene
Hydrochlorination of octyl and dodecyl alcohols
NH, in H 2 S0 4
NH) in ethyl malonate 111 alcoholic solution
NH, in water
NH., in acetic acid
S02 and NH) in ",ater
S02 from K 2 0-S0 2 -C,H 5 COOH-H 2 0
S02 and CO, into aqueous carbonate solution or aqueous caustic soda
S02 oxidation by V 205 catalyst in K,S,O, melt
S02 in water
SO, in alkaline solution
Oxidation of SO, by aerosols MnS04
H 2 S in alkaline solution
H 2 S in water
rJ '){ ()LJ.- \.. '. ::. JI
'"
/ :.1 .
L' .".
--i.
12,22.32,42,46,61. 181
45,48. 167
191,192
185
118
5,49,80, 129, 146, 147,
164,193,199
182
194
79
190
74
74
84,148
140
10
148
57, 81, t07, t08, t09, 128,
1()7
10(,
96
97
172
20,21
175
55
169
ISI
50
168
b3
29. 77,93
58
153
82
72
91. 92
42,126
126
36,78, 114
70, 126
9
Tablc 2-3 Continued
FILM AND PENETRATJO rIlF.ORY A ALYSES OF REACTIONS 35
Rererence
System
Nitrous gas in water
Carbonyl sulfide in amines and alkalines
I--.thylene in aqueous chlorine solution
I obutylene in aqueous solution or H 2 SO.
C,H4 and 0, into solution of CuCh contall1ing PdCI 2 catalyst
1':0 and H 2 into sulruric acid solutiL'n
C<.'ndensation of polymeri7arilln - synthesis of polyamides and
polyester
Ben:mic acid in water I
o-Silhcyclic acid in water
Bcnmic acid in 22.5 percent aqueous glycerol r
Benzoic acid in 41 percent aqucous glycerol
10dll1e dissolullon in potassIum iodine a rast interracial reacllon
Hydrogen chloride in elhylcnc glycol
Dimethyl sulfide and NO, 11110 dimethyl sulroxlde
C)H" CO, and H, into butanol
Heptane or oclene, CO. ilnd H, into octanols or nonanols
C,H.. HC!. and O 2 into aqueous CuCI 2
C,H. and Ch into water
HCI and O 2 imo water
Ethylene and propylene into non-Newtonian solution or copolymer
S02 and H 2 S into molten sulrur
S02 and CI 2 into sulruryl chloride
S02 and HCI into chlorosulrnnic acid
Dimethyl ether and SO) into dimethyl sulrale
PCI, and O 2 into phosphorous oxychloride
Acetylene and Ch II1to tetrachloroethane
C 2 H. and HCI into elhyl chloride
\lercaptans and CO, into alkalis
1\ H J and CO 2 into aqueous urea nitrate
Vinyl chloride and CI 2 in trichloroethane
C 2 H. and HBr into ethyl bromide
C ,H., CO and H, into butanol
HCI'\ and CO 2 in alkalis
Isobutylene and bUlenes into aqueous H 2 S0 4
CO 2 , H,S and CO 2 , CDS, H 2 S into aqueous potassium carbonate
solution
CO 2 , H 2 S and CO 2 , CDS. H 2 S into aqueous triethanolamine and into
aqueous ammoma
CO 2 . H,S and CO 2 . COSo H,S into aqueous potassium phosphate
solutions
CO 2 , H 2 S and CO 2 , CDS. H2S into aqueous monoethanolamine and
diethanolaminc
CO 2 . H,S and CO 2 , CDS, H 2 S into aqueous diglycolamine
CO 2 and COCI into water. aqueous carhonate solution. or aqueous
ca ust ic soda
Cl 2 and CO 2 into water, aqueous carbonate solution. or aqueous
caustic soda
4.52
165
1,13
66
26.83
87
154
113
8,37
33
170
121
121
64
60. 116
119
100
28,71,196
103
103
103
103
179
180
110
152
75
75
75
176
51
65.68
104
69
44
59
112
112
36 GAS-LIQUID SOLID REACTOR DESIGN
First-order reaction For the first-order catalytic reaction iu vo 1\'ing a gasco.us
, the following steady-state equations are valid under isothermal con-
ditions:
R "- Rate of reaction = kGadAe; - A iG )
-- -- -- ----
= kLad AiL - Ad
= Ksas(AL - As)
= KasAs'1
gas to gas-liquid interface.
gas liqUId mterface to bulk liquid,
bulk liquid to catalyst surface,
reaction rate at the catalyst sur =
(2-10)
Henry's law gives
1
I;':
A iG -= H A jL .
If
.........
o >-'
then
(2-11 )
(2-12)
= as} + as H + H ( I -i ) (2-13)
.Ko aL kG a L k l Ks IV]'
Thus, the overaU (global) reaction rate is dependent upon four mass.transfer
resistances plus a kinetic resistance.
For limiting cases:
1. No gas-phase resistance. kG -+ 00,
1 as J J
-=-+- -
HKo aLk L Ks Kt]
2. No liquid-phase resistance at the gas .Iiquid interface. k L -+ 00,
I as 1 ( ] J )
Ko = aL k + H Ks + K'7 .
3. No bulk-liquid-to-catalyst surface-transfer resistance. Ks -+ 00.
1 as I asH H
-=---+- -+-
Ko aL kG aL k L Ktl
4. No intra particle diffusion effects. '7 -+ 1,
1 as] asH ( 11 )
Ko = aL kG + aL k L + H Ks + K .
(2-14)
(2-15)
(2-16)
(2-17)
AU the nomenclature is described in the list of nomenclature at the end of the
chapter. Figure 2-5 describes the concentration distribution of the gaseous
reactant when all resistances are Important.
FILM AND PENETRATION THEORY ANALYSES OF REACTIONS 37
(I)
(2)
(3)
(4)
(5)
Gas
I
I
I
:A
liquid
Dc
°l
lis
G -liqujd
interface
Uq\.lid olid
interface
Figure 2-5 Concentration distributions of a gasenu reactant.
Two reactants (one gas, one liquid) generating a nonvolatiJe product If the reaction
involves a gaseous and a liquid reactant,
-....__-. ._._-_" .' _ '_ 'A __.._.""-"'__'__"
A(g) + cm -+ Products (2-18)
(e.g., hydrodesulfurization), then at steady state and under isothermal conditions,
the following equations are valid: I..
R A = koarJAo - A iG ) = kLadA iL - Ad = KSAas(A L - As) = Ku s A£CJ1,
......'
Rc = KSCas(CL - C s ) - KasAsCslJ.
--......-..- -
Once again, if A ic = HAil., and ifthe global reaction rate R is expressed as
(2-19)
(2-20)
R _==.. ous AG C L.
(2-21)
then
1 as 1 asH ( I 1 )
K = aL kG + aL k-;' + SA + l5-C s '1 .
T.-Ee concentration of gas at the catalyst surface is given by
K1J K1J
\A j KoA -;:;- - Ksc '
Th e concentration of C at the catalyst surface is.given by
KoAGC L
C s = - -.
K1J A s
ormally, I<;.SA and Ksc are assumed to be equal. Once again, conditions kG -+ 00,
k l -+ 00, and KSA' Ksc -+ cp imply that the gas-film resistance, the liquid-film
resistance for the mass transfer at the gas. liquid interface, and the liquid-film
resistance for the mass transfer at the liquid-solid' interface a'r negligible. When
all the mass-transfer resistances are important, the typical concentration distri-
butions of A and C are as shown in Fig. 2-6.
(2-22)
(2-23)
(2-24)
38 GAS-LIQUID-SOLID REACTOR OESIGN
Liquid
Gas
I
I
I
I
I
I
I
I
I
I
I
t
I
l)G
c
A
SL
Gas-liquid
i nte rf ace
Liquid olid
interrace
Figure 2-6 Concentration distributions or gaseous re:-\ctal\! A and liquid reactant C.
Reactions producing a volatile product We now consider a reaction
\lvHg) + ZICO) tB(g). (2-25)
where the product of the reaction is volatile. The concentration distributions of
species A. B, and C for the general case arc illustrated ill Fig. 2-7. In the limiting
c<\,se, when C is in excess and no gas film resistance is important, one can write
R A = kLAad iL - SId = KSAasGtL - St s ) = KAa/"'As11, (2-26)
c... C c C f.
R o = k Lo adl1 L - Bid = KSBas(Bs - B L ) = K A aS7!-s'lZ2. (2-27)
If the liquid film is very thin. such that two liquid films merge and only one liquid
film exists, then the process can be described as follows.
Slow reaction (kinetically controlled regime) This condition will prevail when
kLAaL » K A a sl1,
R", = KAasAiLt[,
Ru = kLUadBs - Bid.
The mass balance on B will yield
Ru = Z2KAasA1L'l = kLBlldBs - Bid.
(2-28)
(2-29)
(2-30)
(2-31)
If Bs » B iL , the above equation can be used to calculate Bs. The concentration
distributions of A and B for this case are illustrated in Fig. 2-8.
Fast reaction (diffusion-controlled regime) This condition will prevail when
kLAaL «KAast[,
(2-32)
i' ,
FILM AND PEr-:ETRATION THEORY ANALYSES OF REACTIONS 39
Gas
Gas
film
If{v
I
I
I
I
I
I
I
f '
I
I
I
I
I
f",
lie
li l .
lis
Gas-liquid
interface
liquid-solid
interface
Figure 2-7 Concentration distributions of A, B. and C when the product is volatile.
R" = kLAOLAiL'
(2-33)
(2-34)
R B = kLBadBs - Bid = Z2 k LAa L A,L'
If k LB = k LA and Bs »B iL , then
Bs = Z2AjL
(2-35)
Note that the kinetic constant does not appear in the expressions for the rates
Qf absorption or desorption. The concentration distributions for A and B for the
fast reaction are illustrated in Fig. 2-9.
Slow reaction but B under/(oes further reaction
K.
B -I- Z 3C ....... Products.
(2-36)
The concentration profiles for A and B are the same as the ones illu'itrated in
Fig. 2-8. The rate of absorption of A will still be
R A = KA a sAil. 1 J.
(2-37)
----
A;L
/'
/
Gas-liquid
interface
Liquid-solid
interface
Figure 2-8 Concentration dis-
tributions of A and B for a slow
reaction.
40 GAS LIQUID SOLID RFACTOR DESIGN
A;L
.I
t
Gas-liquid
interface
Liquid olid Figure 2-9 COfIccntration dlstribu-
interface lions of A and B for the fast reaction.
A mass balance on B will yield
...
Z2 K A{lsA iL '1 = kLDuL(B s - Bid + klJa Bsl}l.
(2-38)
wherc '1 t is the effectiveness factor for the second reaction. If Bs »B iL , we have
B --' Z2KAasAiL11
s - 1 .
(kLBaL + Koasl} )
(2-39)
The rate of desorption of B is
[ Z2KAasAjLIJ 1
R B = kLDaLB s = - k K . 1 kLDaL.
LOal + H a S'1
(2 -40)
Fast read;on but B undergoe. further reaction
1<..
B + Z 3C -+ Products.
(2-41 )
The concentration profiles for A and B are the same as the ones illustrated In
Fig. 2-9. The rate of absorption of A will be
R A = kLAaLA iL -
(2-42)
A mass balance for B will yield
Z2kLAaLAil = kLBa..{B s - Bid + K o a s B s '1 t .
(2-43)
If Bs » Bit..
Z2 k LAa L A jL
Bs= ---;--
kLDaL + K o as'1
and the rate of desorption of B will be
R - k B _ Z2(kLAad( k lBadAiL
B-IOaL s - t
(kLDaL + K oasIJ )
(2-44)
(2-45)
FILM AND PENETRATION THEORY ANALYSES OF REACTIONS 41
2-2-3 Gas-Liquid-Solid (with Solid as a Reactant) Rcaction
Two examples of this type of reaction are:
1. Absorption of CO 2 in aqueous slurry of lime for the manufacture of precipitated
calcium carbonate (which is reused in large quantities as a rubber filler, a
pigment, etc.). Here lime is sparingly soluble in water and the reaction occurs
between the dissolved carbon dioxide and OH - ions.
2. In thermal coal solvation, a reaction occurs between dissolved hydrogen (or
hydrogenated solvent) and the fragm.ented coal molecules to produce a host of
products.
We idealize these systems as:
A(g) ..... A(aq),
C(s) ..... C(aq).
A(aq) + C(aq) Products.
(2-46)
(2-47)
(2-48)
The analysis of this type of reaction can be broken down into three parts.
depending upon the particle size of the solid and its concentration. No analysis
of this process based on penetration theory has been reported. Here we examine
the process with the use of film theory.
Case A: Small concentration of solids or large particle size compared to the
thickness of liquid film In this case, solid dissolution during diffusion of species
C in the liquid film can be neglected. The solid dissolution and chemical reaction
can be assumed to be processes in series.
Ramachandran and Sharma 13Q showed that this condition is satisfied when
KsasD"i
4k[D----; « 1,
(2-49)
where Ks = mass-transfer coefficient for solid dissolution (in cm s -I), as = surface
area of solid particles (in cm 2 cm - 3 dispersion), k L = true Jiq uid-side mass-transfer
coefficient in the absence of chemical reaction (in cm s [), and D A . Dc = diffusivities
of species A and C, respectively, in the liquid phase (in cm 2 s t). The process
involves:
I. Diffusion of gaseous species A through the gas film:
R A = kcadAc - Aid.
2. Dissolution of the solid species C:
Rc = Ksas(C s - Cd.
(2-50)
(2-51)
3. Diffusion and simultaneous chemical'reaction between A and C in the liquid
film near the gas-liquid interface.
42 GAS-LIQUID-SOLID REACTOR DESIGN
Fast reaction Once AiG and Cr. are known from the above equations. R can be
calculated using standard solutions for a fast second-order gas-liquid reaction.'w
The condition for a fast reaction is
J{D".1<-2 CrJl k L » L
(2-52)
If the concentration C at the gas-liquid interface is nearly the same as that in the
bulk. the conditions for a fast reaction are! 39
J[i5 A K z C d 1 d Jl DAKzC L) C L JG DC\ )
- -» an - - - «t-:- -
k L k L AiL DA,
and the rate of absorption in this case is
(2-53)
r;-;------;- -
R A = [AiL]...;(D A KzCr.),
(2-54)
when
J(D;j( Cd _ C J . ( . ) '
k L Z A;L D A '
then the component C isotiepleted in the film and the rate of absorption of A is
given by the expression
(2-55)
AGcPkL
R",=- -,
. 11 + cPkr./ka
(2-56)
where cP, the enhancement factor in the absorption rate due to the chemical
re ction, is given by
<P = J[DAKzC L ) [ I + (CL/Z A ir.)(De/DA) - cP J t / 2
k L (CL/ZAiLHDc/D A ) .
For greater accuracy, the term DelDA is often replaced by J {Dc/DA)' The concen-
tration distributions of A and C for this case are illustrated in Fig. 2-10.
(2-57)
I
I
A lAc
I
I
I
I
I
I
I
I
I
I
I
I
I
Gas-liquid
interface
Liquid-solid
interface
.
Figure 2-lU Concentrallon distributIons of a gaseous and a solid reactanl ror the case ofa fast reaction.
FILM AND P""IFfRATION THEORY ANALYSES OF REACTIONS 43
In the transition regime between slow and fast reactions the condition
,/[.D...K 2C )/kL - 1
(2-58)
holds. 39 The absorption rate in this regime can be more conveniently obtained
by surface renewal theory. The final result is t4 . 139
AG J(i5";,"K ;C L ..;:: kt)
R A = H + JW A K 2 C L + ki)/k G -
(2-59)
Practical example Carbonation of suspensions of lime for the manufacture of
calcium carbonate which is used in a variety of industries such as rubber,
paints, pigments. and cosmetics. It is also important in the manufacture of
pentaerythritol by the lime process. The overall process involves;
Ca(OHh(s) Ca2+(aq) + 20H-(aq),
C02(g) CO 2 (aq),
CO 2 (aq) + OH (aq) -+ HC03"(aq).
HC03" (aq) + OH-(aq} -+ H 2 0 + CO -(aq),
Ca 2 +(aq) + COj-(aq) -+ CaC0 3 (s).
(2-60)
(2-61 )
(2-62)
(2-63)
(2-64)
Reactions (2-63) and (2-64) are instantaneous, so only the first three reactions
are important. If CO 2 is mixed with an inert gas. the gas-side resistance may
be important. Reactions (2-63) and (2-64) can be combined to give
CO 2 (aq) + 20H (aq) -+ H 2 0 + CO -(aq). (2-65)
The system is further discussed by Juvekar and Sharma. IOI
Instantaneous reaction The conditions for an instantaneous reaction arc given by
Danckwerts. 42 For this case, the absorption rate is given by139
AG Dc
- - + - C s
H D A
R -
A - 1 1 Dc I
-+-+---
HkGA. kLo t D A Ksas
(2-66)
The concentration distributions of A and B for this case are illustrated in Fig. 2-11.
Case B: Absorption in a solution containing small particles When the average
diameter of particles is considerably less than the thickness of the liquid film,
I.e..
d p «-frrt>L'
the solid dissolution in the film becomes important. 139 Here
KsQsD.
-,-»1.
4ki.. D c
(2-67)
(2-68)
44 GAS LIQUID SOLID REACTOR DESIGN
Reaction
pane
c
Gas-liquid
interface
Liquid-,\iolid
interface
Figure 2-11 Concentration distributions of A and B in the case of an instantaneous reaction.
...
The solid dissolution and chemical reaction in the liquid film occur in parallel
steps. The effect of solid dissolution in the film is to increase the local concen-
tration of the reactive species in the film, thereby enhancing the rate of
absorption.
Fast reaction The concentration distributions in this case will be the same as
those described in the earlier case. An approximate expression for the rate of
absorption is derived by Ramchandran and Sharma I 39 as
R A = AiL J(D A K2.Cd,
where CL is obtai ned from the solution of the equation
C il J(D A K 2 C S ) AiL D A ( 1 ) J ( C;L )
C S k l C s Dc 1+KsasDI/4ktD C s
- [I + (l + K s a s D1I4ktDd J = O.
Here, K 2. is the rate constant for the second-order reaction between A and C.
(2-69)
(2-70)
Instantaneous reaction The concentratio distributions for this case will be the
same as those described in the earlier similar case for small concentrations of
solids. This case is also studied by Ramchandran and Sharma. 139 The rate of
absorption is given by the expression
R A = Cs J (DrKsas){coth J (Ksas/DdHl> - J.) + Ks asCsJ.,
(2 - 71 )
where J. is the distance from the gas-liquid interface where the reaction occurs,
(\ is the thickness of liquid film (D L = DA/kd. The value of A decreases as the
particles become finer or their concentration increases.
FILM AND PENHRA nON THEORY ANAL YSfS OF REACTIONS 45
In the analysis of Ramchandran and Sharma, 139 it was assumed that the solid
dissolution process increases the ahsorption rate of the gaseous reactant. If we
consider another case, wherc the rate of dissolution of the solid is also enhanced
by the reaction between the absorbed gas and the dissolved solid species in the
liquid film between x = 0 and x = A. then the material balance for the diffusing
gas for 0 < x < A is given by the following equation:
d 2 A Ks ( ZA DA )
D A - 2 - - 1 +- - asCs=O.
dx Z C s Dc
Due to the presence of the absorbed gas A in this region. the rate of solid
dissolution is enhanced by thc value of I + ZADA/CsDc. Since the reaction is
assumed to bc instantaneous, no B exists between 0 < x < .t. For A < x < D. no
A exists and the material balance on C gives
(2-72)
d 2 C
Dc d i -+- Ksas(C s - C) = O.
x
(2-73)
The boundary condItions to the above equations are
( dA )
-D A _ d ' = RA
X x=O
_D!\ ( dA ) = Dc ( CI .
. dx x=l Z dx/x=J.'
x= 0,
A= A,L.
x=l,
A = C = 0,
x = c5L, C = C s .
(2-74)
A solution to the above set of equations is given by Uchida et at 183 The rate of
absorption of A is given by:
mDcCs _ ( 2DcCs ) ( . 1 )
R A = ----z coth m(lIL - A) -I- m DAA iL + Z - coth mi. - sinh mA '
(2-75)
where A is obtained from the relation
DrCs [ 1 J DAAiL
- - coth m}, + coth m(c5 L - A) - . - - . ------;- = 0
Z smh m}. smh mA.
and m = J(Ksas/Dd.
Figure 2-12 shows the concentration profiles of A and C for this case and
compares it with the previous case and the case of an instantaneous reaction
between A and C, where C is a liquid reactant. As shown in the figure. the
reaction plane moves towards the gas liquid interface as the absorption rate
increases. Equation (2-75) will predict higher absorption rates than Eg. (2-71)
under similar reaction conditions.
(2-76)
Case C: Absorption in a solution containing extremely fine solids When the solids
content is very high and particles are very fine, the dissolution of solids in the
46 GAS LIQUID-SOLID REACTOR DESIGN
lit
Rate of absorption and rate of dissolution both
enhanced in film
Ra of absorption only enchanced
A-C gas-liquid reaction - no solids present,
no gas-phase resIstance
Figure 2-12 Instantaneous reaclions for small solid particles
liquid film may be so fast that the concentration of the dissolved species in the
liquid film may correspond to the saturation concentration. Thus, C iL C s . The
pseudo-first-order conditio n will pr evail if
J(DAKlC S ) « C s ( I + s sD ) . (2-77)
k r . AiL 4ki..D c
From the above inequality, it can be seen that the term KsasDi/4kiDc represents
the extent to which the solid dissolution in the film is capable of increasing the
rate of absorption.
Instantaneous I'eaction This condition will prevail when
J(D.... . 2CS) » C s ( I -I- Ks sD ) . (2-78)
k L AiL 4k r .Dr:
The reaction plane in this case shifts to the gas-liquid interface (A -.0). The rate
of absorption would be
R A = Cs J (DcKsG;j,
(2-79)
provided that
J(Ksas/Dc) (DA/kd > 5 and C s » AiL.
(2-80)
The above equation suggests that the rate of absorption will be proportional to
the square root of the amount of solids for a fixed particle size, since as is directly
proportional to the amount of solids.
FILM AND PENFffiATION THEORY ANALVSI'.S OF REACTIONS 47
2-3 METHODS FOR ESTIMATING TRANSPORT
RESISTANCES
Various methods are proposed to estimate the transport resistances outlined
earlier. Traditionally, a L and as are obtained in terms of bubble diameter and
the solid loading (aL = 6h G Id b and as = 6ml ppd p ; here h G is the gas holdup, db is
the bubble diameter, m is the catalyst loading, Pr is the catalyst density, and d p
is the catalyst particle diameter). For a first-order reaction, from Eq. (2-10), the
global rate per unit volume ofthe slurry can be expressed tSO as
AG ( HPpd p ) ( db ) ( Hd b ) ( HdpPp )
R = 6K11m + 6k G h G + 6k L h G t 6Ksm '
where R is the global reaction rate per unit slurry volume, as defined by Eq. (2-12),
and H is defincd by Eq. (2-1 I).
Satterfield lso considers a special case of the above equation. in which the
gas-phase resistance is neglected (i.e., the second term on the right-hand side of
the above equation is zero) and the catalyst effectiveness factor is assumed to
be unity. In this case, a series of measurements of AGIR for various catalyst
loadings permits a plot of AGIR versus 11m to be established. The intercept yields
the gas-liquid mass-transfer coefficiem and the slope yields a combination of the
intrinsic rate constant and the liquid solid mass-transfer coefficient.
The above method assumes that kLll L is independent of the catalyst particle
loading. Chandrasekaran and Sharma, 2 7 Joosten et al.,99 and SIcsser et al.. t 7 [
among others. have shown kLll L to be a function of solids loading and, hence.
care should be exercised in making the above plots.
Sylvester et al. t73 proposed another method. They defined a series of effective-
ness factors such as
(2-81 )
1}b = l/(] t- Dab)' Dab = kdkG
1}L = 1/(1 ..I- Dad, DaL = mK /ppKsas
I}o = 1/(1 + Dao),
Dao = mKI}1]L/k L ll L Pp'lh
overall effectiveness,
(2-82)
(2-83)
(2-84)
gas liquid effectiveness;
liquid-solid effectiveness;
Here. Dai are the Damkohler numbers defined in several ways. 1]0 can also be
expressed as
'10 = 1 - H RI A G k L ll L 11b'
(2-85)
By measuring H Rand AG and estimatmg k L ll L 1}b' the overaU slurry effectiveness
factor I}o is estimated. I}L can be expressed as
I}l = I - HR!AGtloKslls.
(2-86)
From a single datum point and the knowledge of KSlls. 1}L can be obtained from
the above equation. Knowing L, KI} can be calculated using the equation
ppHRjAGtlom = K11!(l + Km1}IK s a spp).
(2-87)
Finally, can be estimated by the usual methods. I so Thus, given one experimental
48 GAS-LlQUID-SOLlD REACTOR DESIGN
value of global rate R, at a hulk gas composition of Ao and the corresponding
value of H, we can calculate various effectiveness factors. ,
Sylvester et al. 173 also point out that, for a trickle-bed reactor, .aL = as = Gc:
'loDao = RH /kTas A G ,
(2-88)
where Dao = mK'l/ppkTQC and the overall external mass-transfer coefficicnt is
given by
I 1 1 1
- = + + -.
k T kG k L Ks
The determination of o and K is analogous to that given earlier.
The procedure described above will save on experimentation time. The method
is, of course, applied only to thc first-order reaction and its accuracy depends
upon the appropriate estimations of gas-liquid and liquid-solid mass-transfer
coefficients.
In a large number of hydro processing trickle-bed reactors, the gas-side mass-
transfer resistance at the gas-liquid interface is usually negligible. The overall,
liquid-phase mass-transfer coefficient K LS is defined as
(2-89)
I I 1
-=-+-.
K LS k l Ks
(2-90)
Various methods for estimating K LS are described by Satterfield. ISO The most
conservative estimate of K LS is obtained as K LS = D/{)L, where D is the molecular
diffusivity of the reactant in the liquid phase and {)L the average thickness of
liquid film surrounding the particles. This estimation assumes no turbulence in
the liquid film. The average thickness of the liquid film can be obtained from a
knowledge of the dynamic liquid holdup and the outside area of catalyst particles
per unit volume of the reactor, as. For example, if the dynamic liquid holdup
is 50 percent ofthe void volume E, then {)L = E/20s. Various methods for estimating
k L and Ks under trickle-flow conditions are described in Chap. 6.
Sauerfield t50 also pointed out that the mass-transfer resistance of the liquid
film in a trickle-bed reactor would be negligible if
( lOd p )
K LS > 3A iL R ,
(2-91 )
where R is the reaction rate per single catalyst particle volume and AiL is the
solubility of the reacting species in the liquid. In deriving the above inequality,
it was assumed that both diameter and length of the cylindrical catalyst particle
is d p . For a catalyst of diameter d p and length 1, the similar inequality would be
20 [ dpl/4 l *
K LS > AiL d p /2 + 1 J Rp. (2-92)
Reuther and Puri l45 proposed another method for estimating the liquid- solid
mass-transfer coefficient from rate measurements. They considered reactions
FILM AND PENETRATION THEORY ANAI.YSES OF REACTIONS 49
between a gaseous species A (hydrogen) and a liquid substrate C. The reaction
occurred at the catalyst surface, The reaction was tnth order with respect to A
and nth order with respect to C. The reaction rate expression was r = KAmC".
If the mass-transfer resistances for hydrogen are negligible, Kscas for the
substrate C can be obtained using the expression t45
c L I 1
- = -- +
rp Ksctls (VpppS'lcKA'r)'
where C L is the bulk liquid concentration of the substrate, r p is the rate of reaction
per particle, V p is the volume of the particle, PP is the density of particle, S is
the specific surface area per unit mass of catalyst, lJc is the catalyst effectiveness
factor for C, K is the rate constant, and A L is the bulk liquid concentration of
hydrogen. For a given system, a plot of C dr p versus AL"m would give (K sc l1s) - I
as the intercept.
The above equation was developed by considering the flux of the substrate
to a particle-catalyzing reaction at the steady state. An analogous development
considering hydrogen flux leads to the equation
(2-93)
A L 1 I
-= + (2-94)
r p (KsAas) (VpppSI]AKCi)'
provided that C L is constant throughout the particle and the rate is linear in As. A
plot of Adrp versus Ci" would, once again, give (K SA Ds)-l as ordinate. In the
above equation, 17A is the catalyst effectiveness factor for hydrogen and Ksas is
the liquid-solid volumetric mass-transfer coefficient tor hydrogen. Reuther and
Puri t45 applied the above methods to hydrogenation of allyl alcohol in the
solvents water and ethanol and fumaric acid in ethanol. Raney nickel was used
as a catalyst for both systems.
If a transport parameter Te = Cs/C L is defined, where C s is the concentration
of C at the catalyst surface, then Peterson t J4 showed that for gas-solid reactions
17c < 'c, where 'Ie is the catalyst effectiveness factor for C. For three-phase slurry
reactors, Reuther and Puri [4S showed that 'C could be less than '1c if the reaction
order with respect to C is less than unity, the reaction occurs in the liquid phase,
and the catalyst is finely divided. The effective diffusivity in the pores of the
catalyst particle is considerably less if the pores are filled with liquid than if they
are filled with gas. For finely divided catalyst, the Sherwood number for the
liquid-solid mass-transfer coefficient based on catalyst particle diameter is two.
2-4 HEAT EFFECTS
The analysis presented so far has assumed an isothermal operation. In gas-liquid
or gas- liquid-solid reactions, two types of heat can cause nonisothermal
operations. The absorption of gas can generate heat at the gas-liquid interface.
This type of heat is commonly known as heat of solution. The reaction (in the
50 GAS-LiQUID-SOUD REACTOR DESIGN
liquid phase or at the solid catalyst surface) can be accompanied by a significant
amount of heat of reaction.
The problem of heat effects in gas- liquid reactions was first analyzed by
Danckwerts. 3B ,41 He showed that for the absorption of CO 2 in amine solutions,
the heat- effects are negligible. Carberry25 showed that, in many gas liquid
reactions, heat effects are small because of the low activation energy for the
reactions.
In some gas-liquid systems, the heat effccts are, however, found to be large.
A most widely-studied example is the absorption of ammonia in water. 30.29.77
The heat of solution for this system is known to be large. Other systems with
large heat effects are absorption of hydrogen chloride in ethylene glycol 33 and
chlorine in toluene,3 4 carbon tetrachloride,34 or water. 1S A large amount of heat
could also be generated in the case of absorption of sulfur dioxide in water and
sulfur dioxide in dodecylbenzene. t II
Several theoretical attempts have been made to evaluate the above mentioned
systems with large heat effects. Chiang and Toor 30 considered a case of gas
absorption accompanied by an instantaneous reaction (such as ammonia in water)
and took into account volume changes due to reaction. They assumed a lime-
varying gas solubility and diffusion coefficient and obtained a series form of an
analytical solution for the rise in gas-liquid interface temperature. Clegg and
Kilgannon B showed that the model of Chiang and ToOT applied well to the
absorption of hydrogen chloride in ethylene glycol. An interesting result of Chiang
and ToOT's analysis is that, for the type of system they studied, the effects of
volume change and enhanced diffusivity quite often compensate for the decrease
in solubility, such that the absorption rate is essentially unaffected by the
temperature rise of the gas-liquid interface.
Cook and Moore 35 studied gas absorption theoretically using a finite-rate
first-order chemical reaction with a large heat effect. They assumed linear boundary
conditions (i.e., interfacial temperature was assumed to be a linear function of
time and the interfacial concentration was assumed to be a linear function of
interfacial temperature) and a linear relationship between the kinetic constant
and the temperature. They formulated the differential difference equations and
solved them successively. The calculations were used to analyze absorption of
CO 2 in NaOH solutions. They concluded that, for some reaction conditions,
compensating effects of temperature on rate constant and solubility would make
the absorption rate independent of heat effects.
Mann and Moyes 1 t t developed an approximate film theory to describe gas
absorption and interfacial temperature behavior under very exothermic conditions.
They used the theory to analyze their own experimental data for the sulfur
trioxide- dodecylbenzene system. They showed (both experimentally as well as
theoretically) that in a highly exothermic reaction system the chemical absorption
rate could be lower than the physical absorption rate because the depression of
interfacial solubility can greatly reduce the absorption potential under reacting
conditions.
Shah 158 analyzed gas absorptIon with a first-order chemical reaction, assum-
FILM AND PF.NETRATION THEORY ANALYSES OF REACTIONS 51
ing no volume change effect and exponential temperature dependence of
diffusivity, rate constant, and solubility. The reaction rate was assumed to be
finite. Since both diffusivity and rate constant increase with temperature, whereas
solubility decreases with an increase in temperature, one would expect to observe
a reaction condition where a large heat effect should have no effect on the rate
of absorption. Such a condition was obtained by numerical solution of the
coupled mass- and heat-balance equations. Shah ls8 also reported empirical
correlations for calculating the increase in gas-liquid interfacial temperature when
heat effects arc large. In separate studies, Shah lS7 ,I59 evaluated the increase in
gas liquid interfacial temperature for a rapid ahsorption reaction in a thin liquid
film and prcscntt:d an approximate solution for the increase in gas liquid inter-
facial temperature in the case of a generalized second-order irreversible reaction,
Finally, Delancey and Chiang S 3,S4 reported a general mathematical evaluation
of multi component non isothermal mass transfer in the presence as well as absence
of a chemical reaction. These studies followed the matrix approach to the
problem. The chemical reaction considered was a simple first-order irreversible
reaction. The problem was solved assuming time dependence of the rate constant
and an exponcntial relationship between the temperature and the distance.
It is obvious from the reported studies that temperature effects are not very
important in the majority of gas-liquid reaction systems. For a few systems, where
large amounts of heat may be liberated, the compensating effects such as the ones
mentioned above would decrease its effect on the rate of absorption.
The heat effects can also be important in gas-liquid-solid reaction systems.
Some reactions, such as hydrodesulfurization, hydrocracking, and coalliqucfaction
are known to be highly exothermic. No analysis of such reactions in the presence
of a significant temperature gradient in the liquid phase is presently available.
If the heat of solution is negligible. at steady state the heat balance at the catalyst
surface would give
Ks(C s - Cd l:1Hr = h,,(Ts - Td,
(2-95)
where AH. is the heat of reaction and Ks and lis are the liquid- solid mass- and
heat-transfer coefficients. This equation can be used to estimate the temperature
at the catalyst surface and its effect on the effective reaction rate. The use of this
equation in gas-liquid-solid reaction systems has been discussed by Satterfield. 1so
2-5 RECOMMENDATIONS FOR FUTURE STUDY
Several aspects of gas-liquid -solid reactions are, as yet, not evaluated by film
and/or penetration theories. Future study should include the followmg topics.
1. Film theory evaluations of the gas-liquid solid reactions, where the solid is a
reactant and the reaction is a slow reaction. The reaction scheme examined
by Juvekar and Sharma, lOt as well as other practical reactions such as coal
liquefaction, can be examined.
52 GAS-LIQUID-SOLID REACTOR DESIGN
2. Penetration theory evaluation ofthe gas-liquid-solid reactions, where the solid
is either a catalyst or a reactant. All reactions examined in this chapter can
be considered. The practical cases, where the diffusivities of various reacting
species are unequal, should be of most interest.
3. Either film or penetration theory evaluations of gas-liquid-solid reactions,
where the solid phase is present as a catalyst as well as a reactant, e.g., catalytic
coal liquefaction.
ILLUSTRATION 2-1
A three-phase reaction involves a solid, C, which is slurried 'in an inert solvent
in which it is soluble and a gas, A, which is bubbled through the slurry. The
reaction is A + C --jo Products, and is assumed to he instantaneous. There is no
gas-side resistance to mass transfer. The average diameter of the solids can be
considered to be much less than the thickness of the liquid film. The following
data are available for the system under consideration:
D A = 2.54 >< 10 5 cm 2 s "
Dc = 3.1 x 10 5 cm 2 S-I,
Saturation solubility of solids = 4.1 x 10- 5 g-mol cm- 3 ,
Solubility qf gas under experimental conditions = 1.94 x 10- 5 g-mol cm - 3,
k l = 6.3 x 10- 3 cm s 1,
Ks = 4.5 x 10- 3 cm s -I,
pp=O.9gcm -3.
(a) Obtain the concentration profile for the gas-and dISsolving solids in the liquid
film for a particle diameter of I x 10- 4 cm and solids . concentration of 10
percent by weight.
(b) Obtain the rate of mass transfer for particles of diameter 1 x 10- 4 cm,
1 x 10- 5 cm, and 1 x 10- 6 cm. For each particle, consider the solids concen-
tration of 10 and 20 weight percent. Compare the answers with the one for
o percent solids concentration,
SOLUTION The film-theory model described earlier in the chapter can be applied
to the solution of the above problem. The solution for the concentration profiles,
as developed by R. mci!. a. !! _n and _ ha a, 139 is .
A = A;dl - xl).} - KsasCsx()' - x)/2D A , (2-96)
C = C [ I - sinh J(Ksas/Dd(b L - X) ] (2-97)
s sinh J (KsasIDd(b l _)..} ,
where bd = DAlkd is the film thickness, A;G and C s are the solubilities of A and
FILM AND PENETRATION THEORY ANALYSE.'> OF REACTIONS 53
C, respectively, x is the distance from the gas-liquid interface, and A is the distance
of the reaction plane from the gas-liquid interface. The rate of absorption of A
is given as
R A = DAAiG/A t KstlsCsA/2
(2-9R)
or
R A = Cs .J (DcKsas)coth .J (Ksas/Dd(DL - A) + KsasCsA.
(2-99)
For the case of zero solids concentration. i.e., Kstls -+ 0, the above equations
reduce to
R A = DAAiO/A =-- DcCs/(b L - A).
(2-100)
Upon rearrangement, one gets
R A = kLAiG(1 + DcCS/DAAiG)'
(a) The quantity as is obtained as
as = 6W/p"d p = 6 x.0.I/O.9 X 10- 4 = 6.67 X 10 3 cm 2 cm 3
Here W is the fractional solids conc:; utL1li.Q.n and d p the diameter of the solid
parti I-;; '. Th co tra-tion .pr fil can be obtained by selecting a value of
A, obtaining the rates of absorption from Eqs. (2-98) and (2-99), and comparing
them. This procedure is repeated until good agreement is obtained. Once a
correct value of A is obtained, the concentration profiles for A and Care
obtained from Eqs. (2-96) and (2-97), respectively. The concentration profiles
obtained in this manner are shown in Fig. 2-13. The figure also shows the
concentration profiles for the case of zero solids concentration. Note that the
reaction plane moves closer to the gas-liquid interface as the solids concen-
tration increases.
(2-101)
'0 4
)(
,
E 3
u
"0
E
.=5'
<:
.2
-
<::
'"
'-'
<::
0
W
0 4
"
","
,/
","
,'"
,//
"
"
c,,"'/
,,'" - 10 wetght percent solids
"
,,'" --- No solid
, '
',I..."'"
8
12
16
20
24
28
32
36
40
Distance (cm x 10 4 )
Figure 2-13 Typical concentration protiles for A and C in the presence and absence of solids
(instantaneous reaction between A and C).
54 GAS-LIQUID-SOUD REACTOR DESIGN
(b) The answer for this part can be obtained in the same manner as in part (a).
The rate of absorption for zero solids concentration can be obtained from
Eq. (2-101). The final results for the absorption rate and the distance of the
reaction plane from the gas liquid interface are described in Tables 2-4 and
2-5, respectively. From these results it can be observed that the rate of
absorption increases with increasing solids concentration and also with
decreasing particle size. The location of the reaction planc moves closer to
the gas liquid interface with increasing solids concentration and decreasing
particle size.
Table 2-4 Rates of absorption as functions of particle size and
solids concentration
Diameter of
particle (em)
o
10- 4
10- 5
10- 6
0.43 )( 10- 6
0.43 )( 10- 6
0.43 X 10- 6
Rate of absorption, R A (g-mol em 2 s - Ii
Solids concenlratlon (weight percent)
to
20
1.67 x 10- 6
5.27)( 10- 6
1.66 )( 10 5
2.36 x 10-'
7.4!J x 10. 6
2.36)<. 10- 5
Table 2-5 Location of reaction plane as a function of particle size
and solids concentration
Location of reaclion plane from gas .liquid interface (cm)
Pa rlicle
diameter (cm)
o
10- 4
10- 5
10 6
1.15 )( 10- 3
1.15 X 10- 3
1.15)( 10- 3
NOMENCLATURE
AL,As
A, B, C. 0, E, F, P, M, N,
etc.
A, B, C D, E. F. P, M, N,
etc.
D.
I
h G
Solids concentration (weIght percent)
to
20
3.35 )( 10- 4
1.07 X 10- 4
0.34)<. 10- 4
2.4 )( to 4
0.75 X 10- 4
0.24 X 10- 4
gas-liquid and liquid solid interfacial areas per unit
packmg volume
reacting species
concentrations of species A, B, C etc.
diffusivity of ith species
gas holdup
FILM AND PENE"ffiATlON THEORY ANALYSES OF REACTIONS 55
Henry's law constant
kinetic constants
gas-side mass-transfer coefficient
equilibrium constants
liquid-side mass-transfer coefficient
. ____ _______Iiqgif!.. s<?)..i41B , tr,,= f r_ E .!:fi jiPtJ
orders ofthe reaction with respect to various-reacting
species
R . . _ ...__-- . .bal i011-.rat.e..---
. .. ."- .-.--- __ rate of absorption or desorption for ith species
. Rt ---- ..-" -intim E ia ..Q f neratiDli Q[&PI ellon fof.1 t}J 3pec j
axial distance
t time
W; refers to concentration of the ith reacting species
Y A , YB' Y c , Y D , n, ,Y c ',
Yn..
z.. Z 2, Y b Y 2 , Y E , Zj,
Z, VB, Y F etc.
H
K, K], K2' Ko. KA, Ku,etc.
kG
K*, KT, K!,etc.
k L
rKs- ==--___.
m, n. p, q, etc.
I
J
stoichio metric coefficients
Greek letters
rJ>
catalyst bed void fraction
liquid and gas film thicknesses
catalyst effectiveness factors
distance from the gas-liquid interface where an
instantaneous reaction occurs
enhancement factor for the rate of absorption
t;
liL,li G
"P1'
A
Subscripts
I_
I
A, B, c...
solid phase
liquid phase
gas phase
--- gas .liquid interface
refers to reacting species in Eqs. (2-1) to (2-5)
refer to species A, B, C, etc.
S
L
G
REFERENCES
-,
I. Akehata, T., and A. 1 Johnson, Can. J. Chern. ElIg., vol. 43, p. 262, 1965.
2. Akiyama, T., Chen!. En!!. Sci., vol. 27, p. 161, 1972.
3. Alper, E.. "Absorption of a Gas into a Solution Containing More than One Reactant -
Analytical Solutions for Instantaneous Reactions," personal communications with Professor
P. V. Danckwerls. 1972.
4. Andrew, S. P. S., and D. Hanson, Chern. Eny. Sci., vol. 14, p. lOS. 1961.
5. Astarita. G.. l&EC furul., vol. 2. no. 4, p. 294, 1963.
6. Astarita. G., Mass Tran, fi'r .....ith Chernim/ Reaction. Elsevier Publishing Co., Amsterdam, 1967.
7. Astarita, G.. Chern. EIIY. Sci., vol. 17, p. 70R, 1962.
56 GAS .J./QlJID SOI.1D REACTOR DESIGN
8. Astarita, G.. I &EC FUlld.. vol. 5. no. I, p. 147. 1966.
9. Astarita, G.. and F. Gioia, Chern. EIIIl. SCI., vol. 19, p. 963, 1964.
10. Astarila, G., and F. Gioia,l&lOC fund., vol. 4, no. 3, p. 317, 1965.
11. Astarita. G., and G. Marrucci, 1& lOC Fund., vol. 2, no. 1, p. 4, 1963.
12. Astarita. G., G. Marrucci, and F. Gioia, Chern. Eng. Sci., vol. 19, p. 95, 1964.
B. Balsubramanian, S. N.. D. N. Rihani. and L. K. Doraiswamy. l&EC Fund.. vol. 5. no. 2. p. 184.
1966.
14. Bjerle, I., S. Renglsson, and K. Farnkvlsl, Chern. 1OlIg. Sci., vol. 27, p. 1853, 1972.
15. Bourne, J. R., and G. C. Coggan, Chern. lOnq. Sd., vol. 24, p. 669, 1969.
16. Brian, P L. T., AIChI. J., vol. 10, p. 5, 1964.
17. Brian, P. L. T.. and M. C. Beaverstock. Chern. Eng. Sci.. vol. 20, p. 47, 1965.
18. Brian, P. L. T., J F. Hurley, and F. H. Hassehine, A1Ch£ J., vol. 7, no. 2, p. 226. 1961.
19. Brian. P. L. T., R. F. Raddour. and D. C. MatialOs. AIChE J., vol. 10, no 5, p. 727, 1964.
20. Brian, P. L. T., J. E. Vivian, and C. Piazza, Chern. Eng. Sd., vol. 21, p. 551, 1961.
21. Brian, P. L. T.. J. E. Vivian, and A. G. Habib, AIChI. J., vol. 8, no. 2, p. 205,1962.
22. Brian, P. L. T., J. E. Vivian, and D. C. Matiatos, AIChE J., vol. 13, p. 28,1967.
23. Bridgewater, J., Chern. £ng. SCi., vol. 22, p. 185, 1967.
24. Carberry, 1. J., Chemical and Catalytic Reaction Engineering, McGraw-Hili Book Co New
York, 1977.
25. Carberry. J. J., Chern. Enl'. Sci.. vol 21. p. 951, 1966.
26. Chandalia, S. R., Indian J. Technol., vol. 6, p. 88. 1968.
27. Chandrasekaran, K., and M. M. Sharma. Chern. En9. Sci., vol. 32, p. 66\1, 1977.
28. Cllem. EII!/. Ne....s. vol. 48, no. 18.. p. 68.1970.
29. Chiang. S H.. S. J. Green, and A. Gandica, "Measurement or Interracial Temperature
Change Accompanying Mass Transfer:' personal communication, 1977.
30. Chiang. S. H.. and H. L. Toor, AIChE J., vol. 5, p. 165, 1959.
31. Chu. c.. Chern. En9. Sci., vol. 26, p. 305, 1(171.
32. Clarke. J. K. A., I&Ee Fund.. vol. J, no. 3, p. 239, 1964.
33. Clegg. G. T., and R. B. F. Kilgannon. Chern. EIIY. Sl"i., vol. 26, p. 669, 1969.
34. Clegg, G. T.. and R. Mann, Chen!. En9. SCI.. vol. 24. p. 321. 1969.
35. Cook. A. E.. and E. Moore, Che,1I. En!!. Sei.. vol. 27, p. 605, 1972.
36. Coughanowr, D. R., and F. E. Krause,l&EC Fund., vol. 4, no. 1, p. 61,1965.
37. Cowherd, c., and H. E. Hoelscher, I&EC Fund., vol. 2, no. 4, p.273, 1963.
38. Danckwerts, P V., Appl. Sci. Res., vol. 43, p. 385. 1952.
39. Danckwerts. P. V.. Gas-Liquid Reactio1!. . McGraw-Hili Book Co.. New York. 1970.
40. Danckwerts. P. V., Trails. Faraday Soc., vol. 46, p. 300, 1950a.
41. Danckwcrts, P. V., Chern. Ellg. Sci., vol. 22, p. 472, 1967.
42. Danckwerls, P. V., Chem. Ellg. Sd., vol 23, p. 1045, 1968.
43. Danckwerts, P V., Trllm. Faraday Soc., vol. 46, p. 712. 1950b.
44. Danckwerts. P. V.. and M. M. Sharma. Chem. EIII/., vol. 44. CE 244,1966.
45. Danckwerts, P. V., and K. M. McNeil, Chem. Eng. Sd., vol. 22, p. 925, 1967.
46. Danckwerls, P V., and A. Tavares Da Silva, Chem. E119. Sci.. vol. 22, p. 1513,1967.
47. Danckwerts, P. V., and A. M. Kennedy, Trans. Inst. Chem. Eng., vol. 32, p. S49, 1954.
48. Danckwerts, P. V., and K. M. McNeil, Trans. Insl. Che,1I. En /., vol. 45, p. T32, 1967.
49. Danckwerls. P. V.. A M. Kennedy, and D. Roberts, Chem. E'lg. Sd.. vol. 18. p. 63. 1963.
50. Date, R. V., J B. Butl, and H. Bliss, 1&1OC Fund., vol. 8, no. 4, p. 687, 1969.
51. Davies, H. S., and R. Schuler, J. Am. Chem. Soc., vol. 52, p. 721 and 3769, 1930.
52. Dekkar, V. A., E. Snoecle, and H. Kramers, Chern. Eng. Sci., vol. II, p. 61, 1959.
53. Delancey, Q. B., and S. H. Chl3ng,l&EC Fund., vol. 9, no. 1, p. 138. 1970.
54. Delancey, G. B., and S. H. Chiang, I&EC FUlld., vol. 9, no. 3, p. 344,1970.
55. Desai. N. R., and D. S. Viswanath,l&EC Fund.. vol. 11, no. 1, p.26, 1972.
56. DeSantiago, M., and I. H. Farina. Chem. En{]. Sd., vol. 25. p. 744.1970.
57. Dewaal. K. H., and W. J. Beek, ehem. lOllY. Sl'i., vol. 22, p. 51\5. 1%7.
58. DhiJlonn, S.. and R. H. Perry, AIChE J., vol. 8, no. 3, p. 389. 1962.
FILM AND PENETRATION THEORV ANALYSES OF REACTIONS 57
59. Dingham, J. c.. and T. F. Mllore, Hydrocarb()n Pmcess.,s, vol. 47, no. 7, p. 138. 1968.
60. Damask, W. G., and K. 4.. Kobe, ImI. EniJ. Chem., vol. 46. p. 680, 1964.
61. Emmert, R. E., and R. L. Pigford, AIChE J.. vol. 8. no. 2, p. 171, 1962.
62." FraLier, G. c., and R. E. UlanowicL, Chern. Eng. Sci., vol. 25, p. 549, 1970.
63. Friedlander, S. K., and K. H. Keller. Chern. Ellg. Sci., vol. 18. p. 365. 1963.
64. Friend, l., L. Wender, and J. C yarge, Liquid Plwse OxychlorinUlil11l of Erhylene to Villyl
CIJ/oridc. Advances m ChemIstry Series, No. 70, American Chemical Society, Washington, D.C,
1968.
65. Garncll, F. H., R. Long, and A. Pennell, J. Appl. Chem.. vol. 8, p. 325, 195x.
66. Gehlawal, J. K.. and M. M. Sharma. Chern. Eng. Sri.. vol. 23, p. 1173, 19(,8.
67. Gill. W. N., and R. J. Nunge, Chern. Eng. Sci., vol. 17, p. 683, 1963.
68. Gioia. F.. Chimiclllnd. Milano, vol. 49, p. 1287, 1967.
69. Gioia, F., and G Marrucci, Chern. Eng. J.. vol. I, p. 91, 1970.
70. Gioia, F., and G. Astanta, I&EC Fund.. vol. 6. p. 370.1967.
71. Goar, B. G. H}'drocarbon Proccs.,e. . vol. 47, no. 9, p. 248, 1968.
72. Goettler, l. A., and R. L. PIgford, in Proceedings ()f the Symposium on Ma. s Transfer with
Chemical Reaction (J. M. Pirier. ed.), Instilute of Chemical Engineers. London, 1968.
73. Goetder, l. A., and R. l. Pigford, Paper presented at 57th Annual Meeting of AIChE, December,
'1964, Preprinl 25e.
74. Goettler, L. A., and R. L. Pigford. AIC/,E J., vol. 17, no. 4, p. 793,1971.
75. Goldstein, R. F.. and A. L. Waddams, The Perrolellm Chemi..als ImIl/Srry, E. and F. N. Span
ltd.. London. 1967.
76. Gottirredi, J. C, A. A. Yeramian, and J. J. Ronco. Rcv. Lat. Arn. Iny. Quirn. y Quim. Appl., vol. 2,
p. 129, 1971.
77. Green, S. J., and S. H. Chiang. Chern. En!}. Pron. Symp. Ser., vol. 67, no. 113, p. 64, 1971.
78. Gunn, D. J., and A. Saleem. Trans. I11St. Chem. Eng., vol. 48, no. T46, 1970.
79. Hahn. A. V.. The Petrochernicallndustry Market and Ecol1omic... McGraw-Hili Book Co., New
York, 197D
80. Harris, J. J., and G. H. Roper. Can. J. Chern. El1q., vol. 41. p. 158, 1963.
81. Harris, I.J.. and G. H. Roper, Call. J. Chern. Eny., vol. 42. p. 34,1964.
82. Hartman. M., and K. Grigar, Int. Chem. Ell!}.. vol. 10, no. 4, p. 351. 1970.
83. Hatch, L. F.. H.1'd7IJl'lIrhon Processing, vol. 49. no. 3. p. 101. 1970.
84. Hatch, T. F., and R. L. Pigford, I&EC Fund., vol. 1. no. 3, p. 209, August, 1962.
85. Halla. S., J. Soc. Chern. Ind. (J<ipan), vol. 31, p. 869, 1928.
86. Hatta, S., Technol. Rep. Tohuku Imperial Unil'., vol. 10. p. 119,1932.
87. Hermann, M., Chern. Ahstr., vol. 61. p. 12984d; West German patent no. 1, vol. 177, p. 118, lo}64.
88. Hikita, H., and S. Asai, 1m. Chern. Ellq., vol. 4, p. 332, 1964.
89. Hikita, H., and S. Asai, J. Chcm. Eng., Japa.., vol. 2, p. 77,1964.
90. Hikita, H.. and S. Asai. Chern. Eng.. Japan. vol. 28. p. 823,1968.
r 91. Holroyd, F. P. B., and C. N. Kenney, Chern. Eny. Sc ., vol. 26, p. 1963, 1971.
1..92. Holroyd, F. P. 8., and C. N. Kenney, Chern. Eng. Sn., vol. 26, p. 1971, 1971.
93. Hughmark, G. A..I&EC Fund., vol. 4, no. 3, p. 361, 1965.
94. Huang, C. J., and C. H. Kuo. AIChE J., vol. II, no. 5, p. 901, 1'J65.
95. Jhaveri. A. S.. Chem. Eng. Sci., vol. 24. p. 1738, 1969.
96. Jhaveri. A. S., and M. M. Sharma, Chen!. Ellg. Sci., vol. 22, p. 1.1967.
97. Jhaveri, A. S., and M. M. Sharma, Chern. Ellg. Sei., vol. 23, p. I. 1968.
9B. Jhaveri, A. S., and M. M. Sharma. Chern. Eny. Sci., vol. 24, p. 189, 1969.
99. Joosten. G. E. H., J. G. M. Schilder, and J. J. Janssen, Cllem. En9. Sci., vol 32, p. 563, 1977.
100. Jordan, D. G.. Chemical Proce.u Del'el()pment. Interscience Publications, ew York. 196B.
101. Juvekar. V. A., and M. M. Sharma, Chern. Eng. Sci., vol. 28, p. 825, 1973.
102. Kenney. C. N., and Y. T. Shah, Chern. Ellg. Sci., vol. 28, p. 325,1973.
103. Kirk. R. E., and D. F. Othmer, fllcycl()pedi<l ..{ Chernical Tecllnnlogy, 2nd ed., Interscience
Publications, New York, 1968.
104. Kohl, A. L., and F. C Riesenfeld, Ga, Purification, McGraw-Hili Book Co., Ne\N York, 1960.
58 GAS-LiQUID-SOLID REACTOR DESIGN
IOS. Kuo, C. H., and C. J. Huang, AlChE J., vol. 16, no. 3, p.493, 1970.
106. Lee. Y. Y., and G. T. Tsao, Chern. Ellg. Sci., vol. 27, p. 1601, 1972.
107. Linek. V., Chern. Eng. Sci., vol. 26, p. 491. 1971.
108. Linek, V.. and J. Mayrhoferova, Chern. Eng. Sci., vol. 25, p. 787, 1970.
109 Linek, V.. J. Mayrhoferova, and J. Mosnerova. Chern. lOng. Set. vol. 25, p. 1033. 1970.
110 Lites, I. L. V. V. Dil'man and B. G. Tagmtaev, Khirn. Prom., vol. 7, p. 523, 1968.
III. Mann, R., and H. Moyes, AIChE J., vol. 23. no. I, p. 17, 1977.
112. Manogue. W. H.. and R. L. Pigford, AIChE J., vol. 6, p. 494, 1960.
113. Marangozis. J.. and A.1. Johnson, Can. J. Chern. Eny., vol. 39, p. 152, 1961.
114. Matteson, M. J.. W. Stober. and H. Luther.I&EC Fund.. vol. 8. no. 4. p. 677.1969.
115. McNeil, K. 11.1., Chern. £lIg. Sci., vol. 20, p. 787, 1965.
116. Miller. S. A.. Ethylene tlnd Ir.< Illdustrllli Deril1,/ti"l's, Ernest Benn Ltd.. London. 1969
117. Nernst, W., Phys. Chernie, vol. 47, p. 52,1904.
118. Nunge, R. J., and W. N. Gill. AIChE J., vol. 9, p. 469,1963.
119 Oblad, A..G..Ind. Eny. Chern.. vol. 61. no. 7, p. 23. 1969.
120. Olander, D. R., AIChE .1., vol. 6, p. 233, 1960.
121. Oliver. K. L., and F. B. Booth. Hydmcarhml Pmcessmg, vol. 49, no. 4. p. 112. 1970
122. Onda. K., E. Sada, T. Kobayashi, and M. Fujine, Chem. Eny. SCi., vol. 25, p. 753, 197Q.
123. Onda, K., E. Sada. T. Kobayashi, and M. Fujine, Chern. Eng. Sci., vol. 25, p. 761, 1970.
124. Onda. K., E. Sada, T. Kobayashi, and M. Fujine. Chern. Ellg. Sci.. vol. 2\ p. 1023. 1970.
125. Onda, K., E. Sada, T. Kobayashi, and M. Fujine, Chern. EIJg. Sci., vol. 27, p. 247, 1972.
126. Onda, K.. T. Kobayashi. M. Fujine. and M. Takahashi. Chem. Eng. Sci., vol. 26, p. 2009, 1971.
127. Onda, K., T. Kobayashi. M. Fujine, and M. Takahashi, Chem. Eng. Sci., vol. 26, p. 2027, 1971.
128. Onda, K., H. Takeuchi. and Y. Maeda, Chern. Eng. Sci., vol. 27. p. 449,1972.
129. Onda, K., T. Kobayashi, and T. Nigase, 1m. Chern. Eng., vol. 8, p. 520, 1968.
130. Padmanabhan, L., and,B. Gal-Or, Chern. Eng. Sd., vol. 23, p. 631,1968.
131. Peaceman. D. W.. ScD Thesis, MIT. Cambridge, Mass.. 1951.
132. Pearson. J. R. A., Appl. Sci Res.. vol. All, p. 321, 1963.
133. Perry, R. H., and R. L. Pigford, Ind. F.11{J. Chern., vol. 45, p. 1247, 1951
134 Petersen. E. E., Chernical React;()n Analysis, Prenlice-Hall, Englewood Cliffs, NJ, 1965.
13S. Porter, K. E., A. D. C. Cantwell, and C. McDermott, AIChE J., vol. 17. no. 3. p. 536, 1971.
136. Ramachandran, P. A.. Chern. Ellg. Sci., vol. 26. p. 349. 1971.
137. Ramachandran, P. A.. Chern. E'¥J. Sci., vol. 27, no. 10, p. 1807, 1972.
138. Ramchandran, P. A... Chern. Process Eng. (India), vol. 3, no. I, p. 23, 1969.
139. Ramchandran, P. A., and M. M. Sharma, Chern. Eng. Sci.. vol. 24, p. 1681, 1969.
140. Ramchandran, P. A., and M. M. Sharma, Chern. Eng. Sci., vol. 2S, p. 1743, 1970.
141 Ramchandran, P. A.. and M. M. Sharma. TraIlS. Inst. Chern. Engrs., vol. 49. p. 253, 1971.
142. Ramchandran, P. A., and M. M. Sharma, ("hem. Ellg. Sci., vol. 26, p. 1767, 1971.
143. Ratcliff. G. A., and J. G. Holdcrofl, Chern. Eng. Sci., vol. IS, p. 100, 1961.
144. Rehm, T. R., A. J. \11011, and A. l. Babb, AIChE J.. vol. 9, no. 6, p. 760,1963.
145. Reuther, J. A.. and P. S. Puri, Can. J. Chern. EIIg., vol. 51, p. 345, 1973.
146. Richards, G 11.1.. G. A. Ratcliff, and P. V. Danckwerts, Chern. En9. Sci.. vol. 19. p. 325.1964.
147. Roberts, D., and P. V. Danckwerts, Chern. Eny. Sci., 1101. 17, p. 961,1962.
148. Roper, G. H.. T. F. Hatch, and R. L. Pigford. l&EC FUlld.. vol. I, no. 2, p. 144, 1962.
149. Sada, E., and H. Kumazawa. "Gas Absorption Accompanied by a Complex Chemical Reaction-
Variation or the Enhancement Factors wilh the Order of Reaction," personal communication
with Professor P. V. Danckwerts. 1972.
150. Sauerfield, C. N., Mass Tran.ifer in Helerngeneous Catalysis, MIT Press, Cambridge, 1970.
151. Scher, M., W. N. Gill, and R. V. Jelil1t:k. I&E(, Fund.. vol. 2, no. 2. p. 107,1963.
152. Schmidt A., Chemie-Ingr.-Tech., vol. 42. p. 521,1970.
153. Scott. W D., and J. l. McCarthy, I&EC Fund., vol. 6, no. I, p. 41,1967.
154. Secor, R. 11.1.. AIChE .1., vol. IS, p. 861.1969.
155. Secor, R. M., and R. W. Southworth, .4IC hE J., vol. 7, no. 4, p. 705, 1961.
)56. Secor, R. M.. and J. A. Beutler, A1ChE .1., vol. 13, p. 365.1967.
FILM AND PENETRATION TIIEORY ANALYSES OF REACTIONS 59
157. Shah. Y. T.. Chern. Eng. Sci.. vol. 27, no. 10. p. 1893. 1972.
158. Shah, Y. T., Chern. Eny. Sci., vol. 27, p. 1469, 1972.
159. Shah, Y. T., Chem. Et>g. Sci., vol. 27, p. 843. 1972.
160. Shah, Y. T., Chem. Eng. Sci., vol. 27, p. 1171,1972.
161. Shah, Y. T., and C. N. Kenney, Chern. Eng. Sci., vol. 27, p. I, 1972.
162. Shah, Y. T.. and M. M. Sharma, Trans. ItlSt. Chem. Eng., vol. 54. p. 1, 1976.
163. Sharma, M. M., and A. K. Nanda, Trans. ItlSt. Chem. £ng., vol. 46, p. 744. 1968.
164. Sharma. \4. M., and P. V. Danckwerts, Chern. Eng. Sci., vol. 18, p. 729, 1963.
165. Sharma, M. M., and P. V. Danckwcrts, Chern. Eng. Sci.. vol. 19, p. 991, 1964.
166. Sherwood, T. K., and R. L. Pigford, Absorption Qnd Extraction, 2nd ed.. McGraw-Hili Book
Co., New York,1952, p. 329.
167. Shrier, A. L.. and P. V. Danckwerts.I&EC Fund.. vol. 8, no. 3, p. 415,1969.
168. Shulman, H. L., W. G. Mellish. and W. H. Lyman, AIChE J.. vol. 17, no. 3, p. 631. 1971.
169. Silberstein, B., H. Bliss, and J. R. Butt, I &EC Fund., vol. 8, no. 3, p. 366, 1969.
170. Sittig, M., O"ganic Chemical Process Encyclopedia, Noyes Development Corp., USA.
171. Slesser. C. G. M., W. T. Allen, A. R. Cuming, V. Fawlowsky, and J. Shields, Chemical Reaction
Enyineering, Proceedings of the Fourth Europetl/1 Sympo..ium, Brussels 1968, supplement to
Chemical Engineeriny Science. pp. 41---45.
172. Stepanyan, I. S., I. A. Vinokur, and G. M. Padaryan, Int. Chern. Eny.. vol. 12, no. 4, p. 649.
Octoher, 1972.
173. Sylvester, N. D., A. Kulkarni, and J. J. Carberry, Can. J. Chern. Eng., vol. 53, p. 313, 1975.
174. Szekely, J., and J. Bridgewater, Chem. Eng. Sci., vol. 22, p. 711,1967.
175. Takahashi, T., M. Hatanaka, and R. Konaka, Can. J. Chern. Eng.. vol. 45. p. 145, 1967.
176. Taylor, M. D., Paper presented at a symposIUm on "Gas-liquid Reactions organized by the
I nstitution of Chemical Engineers, University of Salford, 21st January, 1969.
177. Tavlarides, L. L., and B. Gal-Or, Israel J. Technol., vol. 7, no. 1-2, p. I. 1969.
178. Tavlarides. L L., and R. Gal-Or, Chern. Eng. Set., vol. 24, p. 553, 1960.
179. Technical Reports on German Induslry, "Chlorinated Hydrocarbons from Acetylene," FIAT
Final Report No. 843.
180. Technical Reports on German Industry. CIOS. XXXII. 31.
181. Thomas, W. J., and E. Nicholls, McK., Tram. Ins/. Olern. Eng., vol. 47, no. T325, 1969.
182. Tsao, G. T., Chem. Eng. Sei., vol. 27. p. 1593, 1972.
183. Uchida, S., K. Koide, and M. Shindo, Chern. Eng. Sci., vol. 30. p. 644,1975.
184. Ulanowicz, R. E., and G. C. Frazier, Chern. En(/. Sci., vol. 23. p. 1335. 1968.
185. Van den Berg, L., Can J. Chern. Eng., vol. 40, p. 250. 1962.
186. Van de Vusse, J. G., Chern. Eng. Sci., vol. 16, p. 21,1961.
187. Van de Vusse, J. G., Chern Eng. Sci., vol. 21, p. 631. 1966.
188. Van de Vusse, J. G., Chem. Eng. Sci.. vol. 21, p. 645, 1966.
189. Van Krevelen, D. W., and P. J. Hoftijzer, Tra'l$. Inst. Chern. Eng., vol. 32, p. S60, 1954.
190. Van Krevelen. D. W.. and C. M. E. Baans. J. Phys. Chern.. vol. 54. p. 370, 1950.
191. Vassilatos, G., O. Trass, and A.1. Johnson, Can. J. Chem. £rlg., vol. 40, p. 210, 1962.
192. Vassilalos. G., O. Trass. and A. J Johnson, Can. J. Chern. £ng., vol 41, p. 7, 1963.
193. Wall, H., PhD Thesis, University of Delaware, Delaware, 1966.
194. Weber, O. W., I. F. Miller, and H. P. Gregor, AIChE J.. vol. 16, no. 4, p. 609, 1970.
195. Whitman. W G.. Chern. Met. £nn.. vol. 29, p. 146, 1923.
196. Wiewiorowski, T. K., US Patent No. 3,447,903.
197. Yagi, S., and H. Inoue, Chern. Eny. Sci.. vol. 17, p. 411, 1962.
198. Yermanian, A. A., J. C. Gotlifredi, and J. J. Ronco, Chern. Eny. Sci.. vol. 25. p. 744,1970.
199. Yoshida, F., and Y. Miura. AIChE J., vol. 9, no. 3, p. 331,1963.
CHAPTER
THREE
RESIDENCE-TIME DISTRIBUTION AND
MODELS FOR MACROMIXING IN THE
REACTORS
3-1 INTRODUCTION
The performance of a chemical reactor depends not only on the relevant intrinsic
kinetics of the reaction processes, but also on the physical processes occurring in
the reactor. The physical processes such as interphase, interparticle, and intra-
particle mass and heat transfer occurring within a multiphase reactor depend very
significantly upon the mixing characteristics of the various phases involved.
The mixing process is conventionally divided into two parts: macromixing
(which gives information about the retention times of the elementary volumes)
and micromixing (which describes the communication between the elementary
volumes). As the names imply, the difference between macro- and micromixing
is in the scale of mixing. Micromixing includes all aspects of mixing not defined
by residence-time distribution (RTD). Each fluid molecule in the reactor has a
certain age and life expectation. During a reaction process, a transition from a
grouping of molecules with identical ages to a grouping of molecules with identical
life expectations occurs. Such a transition of molecular groupings is, essentially,
micromixing. The extent of micromixing depends on the timing of permissible
association of entering molecules with older molecules already within the reactor.
Two extreme conditions of micromixing are commonly characterized as "complete
segregation" and "maximum mixedness." In the first case, mixing occurs as late
as possible; in the second case, the reverse is true.
F of the proper modeling of the performance of a multiphase chemical reactor,
the RTD's of various fluid phases are of vital importance. The RTD curves allow
6U
RESIDENCE-TIME DISTRIRIJTlON AND MODEL" FOR MACROMIXING IN THE REACTORS 61
the quantitative evaluation of the nature and degree of mixing in each fluid
phase, as well as the dynamic holdup of each fluid phase in the reactor. Even
when tJ1ere are no extraneous mass- or heat-transfer effects present in the reactor,
its performance would depend both on the nature of the intrinsic reactIon kinetics
and the nature of the RTD curves.
Two extreme cases of macromixing in a flow reactor are "plug flow" and
"complete mixing." In the first case, there is no logitudinal mixing, complete radial
mixing. and all elements of fluid within the reactor have identical velocities and
residence times. The flow in a packed-bed reactor with very large ratio of reactor
length to tube (and particle) diameter can be approximated by a plug flow. In the
case of a "completely mixed" reactor the RTD is of an exponential form and the
composition of the exit stream is that of the fluid within the reactor. This kind
of macromixing can exist in a very vigorously stirred tank reactor.
The nature of macromixing in the majority of actual reactors deviate from
these two extreme cases. The deviation may be caused by a nonuniform velocity
profile, by velocity Ouctuation due to molecular or turbulent diffusion, by short-
circuiting, bypassing, and channeling of fluid, by the presence of stagnant regions
of fluid caused by the reactor shape and internals, by the back flow of a fluid
within the reactor as a result of relative velocity differences between two mixing
fluid phases, or by the recycling of fluid within the reactor as a result of agitation.
When the macro mixing in both axial and radial directions is incomplete, the
macromixing in the axial direction is characterized by axial mixing. Backmixing
is a case of axial mixing when the transverse mixing (i.e., mixing in the direction
perpendicular to flow) is complete. When there is transverse mixing and only part
of the fluid is held back, as in channeling, axial mixing will resuh but not
backmixing. The cases of channeling with some transverse mixing and recirculation
with some transverse mixing can be characterized by axial mixing but not by
backmixing.
In constructing a flow model for a given reactor, we must know the f! w
pattern through the reactor. This can be conveniently achieved by determining
the age distribution of the elements of the fluid in the exit stream or the RTD
within the reactor,
3-2 TRACERS
The RTD for a flowing fluid is normally obtained by the so-called "stimulus-
response" technique. This technique involves the injection of a tracer at the inlet
stream or at some point within a reactor and the observation of the corresponding
response at the exit stream or at some other downstream point within the reactor.
A suitable flow model can then be selected by matching the experimental RTD
curve with that obtained from the mathematical model. This approach implies
that a transient analysis of reactor and flow model behavior is necessary.
Since the tracer experiments are supposed faithfully to illustrate the RTD
of actual reacting fluids, a proper choice of tracer in a given reacting system is
62 GAS-UQUID-SOLID RFACTOR DESIGN
very important. The basic requirements for a satisfactory tracer experiment can
be outlined as follows.
i. The tracer should be miscible and it should have physical properties closely
resembling the fluid stream under investigation.
2. The tracer should be accurately detectable in small concentrations, so that the
introduction of a tracer does not affect the flow pattern of the main fluid
stream. The small concentration of tracer should also allow approximately
linear response, so that prior calibration of the tracer detection equipment can
be kept to a minimum.
3. Normally, the tracer should be non reacting, so that the analysis of the RTD
curve can be kept simple.
4. During an experiment in a multiphase system, the tracer should not be trans-
ferred from one phase to another phase. For example, a gaseous tracer used
in a gas-liquid reactor should not be absorbed by liquid; and a liquid 'tracer
used to measure the liquid-phase RTD curve should not be volatile. Similarly,
a solid tracer used to measure the RTD curve for the solid phase in a gas
liquid solid slurry reactor should not dissolve in the liquid, etc.
5. The tracer detection device should cause the least amount of disturbance in the
flow pattern. In this respect, a radioactive tracer has a distinct advantage over
other chemical tracers in that the detection device can be placed externally.
6. If heat is used as a tracer, the heal balance on the system should be properly
checked.
7. For measuring the RTD of a very fast-moving phase, the sensitivity- and the
response time of the tracer-concentration recording equipment may be a
problem. A radioactive tracer offers an advantage in that the scintillation
detection counter can be interfaced with very rapid recording systems or
multichannel analyzers.
8. The tracer itself (particularly for large industrial-scale systems) and its detection
device and other auxilliary equipment should be relatively cheap.
The nature of the tracer dictates the detection system. For the liquid phase,
quite often the tracers (e.g., NaC!, H 2 S0 4 . etc.) are such that the detection probe
is directly inserted into the reactor and continuous monitoring of the concentration
at any fixed position is obtained by means of an electrical conductivity cell and
a recorder. In this case, no external sampling of liquid is necessary. If the tracer
concentration measurement requires an analytical procedure such as titration, etc.,
sampling of the liquid is required. For the solid phase, a magnetic tracer is
sometimes used. The concentration of a solid-phase tracer can also be measured
by a capacitance probe if the tracer material has a different dielectric constant
than the solid phase. In general. however. for solid and sometimes gas phases,
some suitable radioactive tracer is convenient to use. The detection systems for
a radioactive tracer (which include scintillation counters, a recorder, etc.) can be
expensive. Some of the tracers for the gas, liquid, and solid phases reported in
the literature are summarized in Table 3-1.
RESIDFNCE-TIME DISTRIBUTION AND MODELS FOR :liIACROMIXING IN THE REACTORS 63
Tablc 3-1 Traccrs commonly employed in gas-liquid-solid columns
System Tracers Detection apparatus Reactor Reference
(A) Liquid-pha e-'.;;;:: s c.\ .; ( c..\;().o'\ . 'h ----:: - .----- -------
A ir-water MgS0 4 , ! Titration Packed bed 54
KCI, HCI(
HCI I Electrical conductivily Packed bed 53
H 2 S0 4 f Electrical conductivily Packed bed and 101, 102
c..",",...t'; :{ £..!+J T'--.c-'-' L/ elec-\-r:f) bl;-coru'func.-\ v. c(:\\,. ,f....,.nl.. .
NH..CI Electrical conductivit Packed bed 45
NaCI J Electrical conductivity Packed bed 18, 19, 35, 67,
. l
FEK-M photoelectric . Packed bed 97
colorirneKr
ectroDho!. Packed bed
r"' o'" .,.Jr. / ,"tDo ."'4 r""
Baird Atomic, Model Packed bed
812B scintillation
detector
Electrical conductivity Packed bed 43
Canalco conductivity Packed bed 24
meter";<I...I;a"" / r...-I"r.. ..J..ve :"J ,; .,.r.
-or'" \oJ -r t:,._J
Electrical conductivity Slurry reactor 49
Infrared analyzer Fluidized bed 44
Air-water
Air-water
Air water
Air-water
Air water
Air water
Air-water
N 2 -methanol
Air-water
Air-water
Air-water-glass
beads
Air water glass
Ballotini be:!ds
Air-water
(B) GlJ -plla. e tracers
Air-water
Air water
N 2 -methanol
Air-water
Air-water glass
beads
Air -water glass
Ballotini beads
Ie) Solid-phase tracers
' Air .water -g l ass
spheres
Glycerine soln
waler
Ait .water <:oal
.3-.:J"...., """
Thermal conductivity
cell
Baird Atomic Model
812B scintillation
detector
GowMac thermal
conductivity detector
Anton Type 108 CG-M Packed bed
counter
CO!, He Infra d analvzer Fluidized bed
- - -. _ 'I {'V '1. ....
2. Na. "-"r'""' "' ' , . 1. I t-'
Argon 41 Scintillation detector Fluidized bed
Methylene)
blue dye \
MethYlen
blue dye
Iodine 131
C.ot.r&'r' . ...
IP......J. A "
=',
KSCN
NaCI
';; ':
KCI
NaCl
3
91
Scintillation detecLOr Fluidized bed
rl,,,,.r.s ;9,..r c-o"".,..tl"I'
Sargent oscillometer Packed bed
69. 79
54
Bromine 82
t...k, l>c. VL'"
Helium
'( {-c. r
Helium
Argon 41
Helium
Krypton
Glass spheres.
aIr, ion-exchange
resin, FeSi0 2
powder, Cu
powder
Lanthanum 138
s...
Packed bed
53 1)04 o.....,-nY._......
Sf>t"c';' .-I /!!' r
91 (3.-.]<:'.,., I. 11",,1;3'"
CYtr 1r:-c -lor
U -..J ob.orf'1;"'"
43 .. dJv '-."
Packed bed
Packed bed
31
94
9, 79
External sampling Slurry reactor 49
External sampling of Slurry reactor 47
solid-liquid soln. at
various points
R nioactiv tr . u ' .e.z; Batch three- Author's
det ector phase flUIdized unpublished
.-or bed work
d:j f't4 .ffarpr r
I
,
64 GAS-LIQUID-SOLID REAClOR DFSIGN
As indicated earlicr, the tracer should normally be nonreacting, so that RTD
data are easily amenable to appropriate modeling. Certain reactant tracer
techniques, however, should be noted. Parimi and Harris 80 developed a tech-
nique for identifying residence-time models from reacting tracer expe.riments.
Domnesteanu 34 suggested a method for evaluating both macro- and micromixing'
in a chemical reactor by means of reactant tracers. Denbigh et al. 33 suggested a
"'time reaction" technique, which produces a dye solution for visualizing the flow
pattern. They used potassium iodate and a solution of sodium sulfite with a
little starch paste to liberate iodine. Later, Danckwerts et al. 26 modified the method
by using sodium persulfate, potassium iodite, sodium thiosulfate. and starch.
Finally, Goldfish et ap9 proposed a flash photolysis method for RTD measure-
ment. This method employs a lightly-colored dilute solution which undergoes a
chemical reaction. In this method, the tracer is inside the reactor, so it avoids
the disturbance of flow pattern normally encountered during an injection of the
tracer.
The technique described above, in general, requires concentration-time
measurements. Baird and co-workers 7 are developing visual techniques. which use
the observation of an indicator color change due to chemical reaction. They
suggest that, in principle, any instantaneous ionic reaction could be used, but
have found that acid base reactions with phenolphthalein as an indicator have
given satisfactory results. Both steady-state as well as unsteady-state pulse-
injection techniques have been examined. The position of the reaction plane
b tween two reacting species will depend upon the extent of backmixing. The
problem with this method is that the location of the reaction plane may not be
sharp because of the effect of turbulent eddies and t 1-11 8, of course, makes the
measurements somewhat inaccurate. The method avoids the need for a concen-
tration measurement device; however. it can only be used in transparent columns.
3-3 METHODS FOR OBTAINING RESIDENCE-TIME
DISTRIBUTION
The tracer technique for measuring RTD normally involves the injection of a
tracer at one or more locations in the system and detecting its concentration as
a function of time at one or more downstream positions. Various types of tracer
inputs such as step, impulse. imperfect pulse, sinusoidal. ramp. parabolic, and a
step decrease in concentration can be examined. The sin Jsoidal. inp.!lJ has been
examined by Kramers and Alberda 52 for a single-phase system. Bennett and
Goodridge Q examined a step decrease in concentration input and outlined a
method for evaluating the backmixing coefficient from the RTD of a packed
column for such an input. Since the majority of literature studies have used
impulse, pulse, or imperfect-pulse inputs, we will restrict our discussion here
mainly to these types of inputs. The st P-!.r:!put are considered by Co and
Bibaud,24 Chen. 20 ,2 I and Babcock et al. 6 The equivalence of the pulse and step
input residence-time measurements in a trickle-bed reactor is shown by Rothfeld
RESIDENCE-TIME DISTRIBUTION AND MODELS FOR MACROMIXING IN THE REACTORS 65
Injection
(liquid or
solid)
Gas
t
0 0 0
0 0 0
D
0 0
0 Detcclion
0 0 (hquid or
0 0 solid)
Gas
Figure 3-1 Slurry reactor.
and Ralph. 87 Normally, in a tracer experiment, the tracer is injected aI the inlet
stream and its concentration at one or more downstream positions is noted. For
a pulse injection in. a flow system, the detections are usually carried out at
two downstream positions, so that the method of moments can be easily applied.
fu a slurry reactor (i.e., no liq'u'id flow), the RTO for liquid and solid phases can be
measured by uniformly spreading a tracer (liquid or solid) at the free surface of
the slurry and detectir)g..its concentration at some downstream position (see Fig.
3-1). For a fixed-bed reactor, injection-detectioll systems used for a variety of flow
configuration are illustrated in rig. 3-2. Similar techniques can be used for
measuring the gas. liquid, and solid phase RTD in three-phase, i.e., gas-liquid.
solid, fluidized beds. The concentration of tracer at the points of injection and
detection should be uniform across the cross-section of the reactor.
MiDoux and Charpentier 70 have proposed an alternate method (see Fig. 3-3)
for the experimental determination of the RTD in the fast-flowing phase. It
consists of making two very ;;imilar injections of tracer at two different cross-
sections of the apparatus where there is two-phase flow and measuring the R TO
in the analyzed phase in a single-phase flow region of the apparatus. The method
thus eliminates the need for two detection devices. The proponents of the method
have shown that the final results obtained are strictly the same as those obtained
by injecting tracer in the entering phase and measuring the transient response at
two different cross-sections of the apparatus (i.e., the apparatus transfer function
between two injection cross-sections is the same as the equivalent apparatus
transfer function between the two detection cross-sections).
3-4 PROBLEM AREAS
Normally, a pulse il1Pu will give an RTO curve of the type. shown in Fig. 3-4 (0)
or (b). The nonuniform velocity and the methods for injection and detection
could, however, have a significant effect on the nature of the RTD curve.
66 GAS-LiQUID-SOUD REACTOR DESIGN
Levenspiel et al.,57 Levenspiel and Turner,59 and Turner lO9 have evaluated this
problem theoretically. Kim and Harris 50 have proposed a "line-sampling" method.
In this method, the dispersive effect of velocity gradients on the concentration
profile has been evaJuated by an electrical conductivity sampling probe. The probe
averages the tracer concentration along a single diameter of the tube.
The effect of velocity distribution on the RTD curve requires careful choice
of tracer detection positions. In a batch system, such as the one shown in Fig-. 3- L
the detection probe should be kept as far from the free surface as possible. If the
detection probe is kept very close to the free surface, an RTD curve similar to
the dotted curve in Fig. 3-4(a) will be obtained. An evaluation of backmixing
liquid
Gas liquid
Detection
(both gas and
liquid)
Injection
(both gas and
liquid)
Detection
(both ga>. and
liquid)
Detection
(both gas
and liquid)
"ctection
(both gas
and liquid)
Injection
(both gas
and liquid)
Gas liquiIJ
Gas Liquid
(a)
(n)
Liquid Gas
Injection
(liquid)
Detection
(gas)
Detection
(liquid)
Detecllon
(liquid)
Detection
(gas)
Injection
(gas)
Liquid Gas
(e)
Figure 3-2 One injection-one, two, Of more detections. (a) Fixed-bed reactor with cocurrent upflow,
(hI fixed-bed reactor with cocurfent down flow. (el fixed-bed reactor with countercurrent flow.
RESIDENCE-TIME DISTRIBLITIOI'- AND MODELS FOR MACROMIXING IN THE REACTORS 67
Liquid
I
Injection
(liquid)
Injection
(liquid)
Dctection
(liquid)
liquid
Gas
q
I ,,----..............
.................
I -____
C E --I-
I I UndesIrable
RTD
V
I
I
I
I
I
I
I
I
I
(0)
c
Detection
(gas)
[njection
(gas )
Injection
(gas)
Figure 3-3 Two injections one
detection.
Time
,
............. "Tailing"
-...- 1
--
------
(bJ
Time
Figure 3--4 RTDcurves for a pulse input. (ul Batch !:ystem (see Fig. 3-1). (hI flow systems (see Fig. 3-21.
'!
68 GAS-I.IQUID-SOLJD REACTOR DESIGN
characteristics from such a curve would be much more difficult. In flow systems.
such as those shown in Fig. 3-2. the first detection probe should be placed at a
distance of about 50 to 100 particle diameters (depending upon the tluid velocity)
from the column inlet so that the entrance effect on the RTD curve is minimized.
The true ideal impulse function is difficu!t to introduce into the system. In
most practical cases. th.c.wc.er -in.p_uts are pulses. Careful precautions should be
taken to ensure good pulse injections. If the pulse is imperfect, the analysis of the
RTD eurve becomes much more difficult. Quit.e often the RTD curve obtained
from an arbitrary input is transported to the one which could correspond to-'1
pulse input. using the c onv \}tion !,I}-Jcgral
E(t) = L C(ic)F(t - }.) ,lA,
where Elt) is the RTD of the system for an arbitrary input, CIA) is the response
of the system to an impulse input, F(t) is an arbitrary input. and A is a dummy
time variable.
." Flow maldistribution can have a significant effect on the RTD. The typical
effects of reactor channeling, dead zones, and bypassing on the RTD for an impulse
input are illustrated in Figs. 3-5 through 3-7. If these types of flow maldistribution
effects are unavoidable in the system, then a micromixing model for the system
must correlate such unusual types of RTD curves. Tn a packed-bed reactor (such
as a trickle-bed reactor), these types of flow anomalies are observed in small-scale
systems. Proper design of'a liquid distributor and addition of a calming section
in the reactor is usually desirable for minimizing these flow anomalies. The
_haQt1elio.g an" ! y£ nK.in a trick Je-b clr actor.1!-re parmflll. beq!lse they prt;Y
!h .e_!f c.!i " _use_QLal1 the cat<ill-'s "su!face for t he rea h flow maldist il?l!tlon
i!i an uptl w fixed-be reactor would occur if the gas is t unifoqnly distri!'.!-,.te.9-
. in the .bed. -
The porosity of the solid particles would also show a significant effect on the
RTD curve. The porous particles trap some liquid (commonly known as part of
(3-1 )
E(t)
Fi ure 3--S RTDcurve for a typical reactor
with considerable channeling
RESIDENCE-TIME DISTRIBUTION AND MODELS FOR MACROMIXING IN THE REACTORS 69
E(t)
Figure3-6 RTDcurvefor a typical reactor
with a large dead space.
o
the static liquid holdup of the system). This trapped liquid can cause significant
"tailing" in the RTD curve, such as that shown by the dotted curve in Fig. 3-4(b).
Schiesscr and Lapidus 92 showed a similar type of tailing for a step response in a
trickle-bed reactor. Their results are shown in Fig. 3-8. It is, therefore, important
that the nature of pac kings used in tracer experiments reflect the nature of pac kings
used in actual reactors. Furthermore, macromixing models used to correlate the
RTD curve for a porous packing must take into account the existence of "tailing
phenomena"
3-5 MODELS FOR MACROMIXING IN THE REACTOR
Once the data for the RTD are obtained, the backmixing characteristics for each
phase of a multi phase reactor can be quantitatively evaluated by fitting appropriate
models to these data. The models for backmixing can be largely divided into two
E(t)
Figurt: 3-7 RTDcurve for a typical reactor
with considerable bypassing.
o
70 GAS-LIQUID-SOLID REACTOR DESIGN
1.0
0.8
d' 0.6
'b"
0.4
0.2
6.
\
'l!.
...6....6.
..l!....A_A..."
"'-A
5
20
25
30
35
40
45
10
15
Time (s)
Figure 3-8 Comparison of the step respon e for porous and nonporous packing (from the data of
Schiesser and Lapidus 92 ). 37.8 g h - I em - 2 water; O. 0.63 cm nonporous alumina spheres; J"...
0.63 cm porous alumina spheres.
categories: (a) differential models and (b) stagewise models. The differential models
result in differential equations, whereas, in the steady-state conditions, stagewise
models result in algebraic equations. The parameters describing the backmixing
in these two types of models are usually interchangeable.
Ea lier st dies on the mixing characteristics of various types of sin .and
multiphase reactors are included in the reviews by Ostergaard,78 Bischoff, t I
Pavlica and Olson,81 and Mashelkar. 61 The most up-to-date review on macro-
mixing models for single-phase and for gas -solid and gas liquid' reactors is given
by Wen and Fan,110 Here. we specifically evaluate the macromixing models for
three-phase fixed-bed reactors and three-phase agitated reactors. The proposed
models vary in their complexities. The simplest models (e.g., the axial dispersion
n1.'3d r.!_ !a!!1s -in:::s ries_model) contain only a single parameter correlating
th -"RTn r.m:ve.. More complex models use two (e.g., the crossflow model, the
time-delay model, the modified mixing---cell model, etc.), three (e.g., the PDE model),
or even four (e.g., the model of Raghuraman and Varma) parameters to correlate
the RTD curves.
3-5-1 Differential Models
Single-parameter axial dispersion model The axial dispersion model characterizes
the backmixing by a simple one-dimensional Fick's-law-type diffusion equation.
Ibe constant of proportionaliLy in this equation is commonly known as the a ial
dise rsion coefficient. The-assumption that all the mixing processes follow a Fick's-
law-type diffusion equation, regardless of the actual mechanism, becomes, of
course, increasingly dubious with large degrees of back mixing. However, since
RESIDENCE-TIME DISTRIBUTION AND MODEL" FOR MACROMIXING IN THE REACTORS 71
the model characterizes the backmixing (or RTD) by only a single 'parameter, its
simplicity has made it the most widely-used model. The dispersion coefficient is
expressed in the dimensionlcss form as the Peclet number (Pe_ = !--clEz). Here
Ez is the axial dispersion coefficient and U is the velocity of the fluid, usually
ofthe phase in which the backmixing is considered. Lc is the characteristic length.
In a slurry column, Lc could be. ei.ther th diameter of the._. !;ol t,lUlIJ.__.QI...tbe
dia met T r: ib :SQlrd .p' r_ ic. F ; flO\v through a fixed b d, Ls:. js usu lly. the
characteristic Eiar l ter of_tb:e I?a _k.! . Under this situation, Pe is often dcnoted
as the Bodenstein number. The value of the Peelet (or Bodenstein) number denotes
the degree ofbackmixing.1fPe - 0, backmixing is complete and for Pe = oo,lili!g
fl .
For a multiphase reactor, the backmixing in each phase is considered
separately. In a gas-liquid reactor, a considerably different degree of backmixing
can exist in each phase. For example, in a three-phase fluidized-bed reactor, the
backmixing in the fast-moving gas phase is considerably smaller than in the
slow-moving liquid phase. Insma!J-scale reactorsLthe ga a e__iD1 lliill-y ass..u.med
t9....!TI...QYS:jlU:11Yg..fiQ . ---.-'--- ..-
In a cocurrent-upflow packed-bubble-column reactor, significant backmixing
in the liquid phase is caused by the gas flow. Furthermore, the backmixing
increases with the diameter of the reactor (Le., usually more backmixing occurs
in commercial reactors than in pilot-scale reactQrst The design of a bubble-column
reactor always requires consideration of backmixing in the liquid phasc. For
gas-liquid flow through a packed column, in general, the degree of backmixing
in the liquid phase depend strongly upon the flow regime, flow rates of various
phases, and the packing characteristics and is usually insensitive to the size of the
column. Backmixing could be particularly important at low liquid flow mtes. In
three-phase fluidized beds, the backmixing in both the solid and liquid phases is
important.
Commercial reactors are non isothermal and often adiabatic. In a noniso-
thermal gas-liquid reactor, along with the mass dispersions in each phase, the
corresponding heat dispersions are also required. Normally, the gas and liquid
at any given axial position are assumed to be at the same temperature. Thus. in
contrast to the'case of mass, only a single heat-balance equation (and corresponding
heat-dispersion coefficient) is needed. Under turbulent flow conditions (such as in
the bubble-column reactor) the Peelet number for the heat dispersion is often
assumed to be approximately equal to the Peclet number for the mass dispersion
in a slow-moving liquid phase.
The standard axial-dispersion model is a one-dimensional model which
neglects the contributions of rad.iaJ dis .r.!ion._a _w 1I Jts..nonuotfo.rm...Y.e.!QQ!y
distri'p ns on th ..Rr.pJ:Ut.v_e. For a single-phase flow t he effects of the para bol ic
-- -.
or nonuniform velocity profiles generated from nonuniform cross-sectional tubes
have been theoretically examined. 4 ,l0 The effect of the velodty profile on the
axial dispersion in packed beds has also been investigated. 25 The model is also
applied by Kostanyan 51 to a tube with several mixing zones. Nishiwaki and
Kato 73 and Nishiwaki et al. 74 have modified the dispersion model to a multistage
72 GAS-LIQ1-'ID-SOUD REACTOR DESIGN
dispersion model, where the backmixing is characterized by two parameters, i.e.,
the Pedet number for each stage and the number of stages. The two parametcrs
allow more flexibility in correlating the experimental data, and is more useful for
a reactor with nonuniform axial mixing characteristics.
Methods for eJ'aluating the axial dispersion coefficient from RTD data As men-
tioned earlier, the one-parameter axial-dispersion model is wide-iyusecfto correlate
RTD data, The nature of the RTD depends upon the nature of the tracer input
.and the natureof the. flow characterist_ics. For the RTO shown in Fig. 3-4{a), the
-'---r,- -- -- .- -- ---- - ---" "
axial dIspersion coefficients for the liquid and solid phases can be obtained by
fitting the equation
£ = I -f 2 f r ( cos " L 7r Lz ) CXP ( _n2 n: Ezt )J (3-2)
C E "=1 I Ii L lj
to the RTD curve. 76 Here. C E is the final equilibrium concentration of tracer,
( is time, LJ! is the bubbling height, Lz is the distance between tracer injection
and detection points, and Ez is the axial dispersion coefficient.
In the vast majority of experimental studies, the backmixing characteristics
of a flowing phase are examined using a\pu! e.Jr EjQPl!!, For the fi xed-b
systems shown in Fig. 3-2, if a perfect pu)se input is used. then, as Shown by
Levenspiel, 5 6 the axial dispersion coefficient or the Pedet number can be obtained
from the variance of the RTD curve. For exam.£le , for a dosed system and lar ge
extent of dispersion, the variance, ib. is related to the Peclet number b--y tbe
eq a ion
2 1 l ac 2 2 2 - p.
ao =- (l-lm) E(l)dl=---(l-e ),
0 p
where lm is the average residence time of the fluid in the reactor, as given by. the
normalized first moment of the RTD curve, and E(t) is the RTD of the tra r i!J
the n:att-Qf.
Although the above method can give a simple evaluation of Pedet number
for the system, the tailing in the RTD curve can cause significant inaccuracy in
the evaluation of the Peclet number. Michell and Furzer 67 suggested that a better
estimation of the axial dispersion coefficient is obtained if the observed RTD is
statistically fitted to the exact solution of the axial dispersion model equation
with appropriate boundary conditions. For example, a time-domain solution to the
partial differential equation describing the dispersion model, Le.,
(3-3)
ac a 2 c ac
at = Ez az I - U az '
(3-4)
subjected to the initial and boundary conditions, i.e.,
C(Z, 0) = 0,
lim C(Z, t) = 0,
r-O .
(3-5)
(3-6)
RESIDENCE-TIME DISTRIBUTiON AND MODELS FOR MACRO nXING IN THE REACTORS 73
f +oo
lim C(Z, t)A dZ = M (i.e., an impulse input)
r-)O -
(3-7)
is
M [ -(Z - Ut)2 ]
C(Z, t) = A J(4nE z t) exp 4Ezt .
Here, A is the cross-sectional area of fluid flow, U is the interstitial velocity of
liquid, and M is the mass of tracer added. Michell and Furzer 67 and Furzer and
Michell 35 claim that an a .c: rate estimation of Ez can be obtained by fitting the
exp rimental RTD with Eq. (3-8) by- nonlinear regression techniques. The first
and second moments are given by the relations
(3-8)
LX) Ci(t)t dt
/li = (U fL) f oo
Ci(t) dt
o
i = 1,2
(3-9)
and
1'""
Jo C(t)r2 dt
a? = (UfL)2 f.1.f.
I \00 C;(t) tIt
.0
Here, Cj(t) is the concentration ofthe tracer at time t on the RTD curve at position
i, U is the real mean axial velocity of the phase being co[),sidered, L is the distance
between two measuring points, f.1.i is the first moment and .9:tis t.he_seco.n. c;L.mo nt
of the RTD curve. Since the first moment of ti1e.-response curve is essentially
the mean of that curve, the average residence time of the tracer can be calculated
by taking the difference of the first moment of the response curves
,,".-- _n .. - i
\t m = (LfU)(f.1.? - g j' .. (3-11)
The second moment of tAe response-curves i dicates the spread of the RTD
curve and the difference of the second moments is a measure of the amount of
backmixing occurring between the two measuring points. For_thf:. open. tem,
the second moment has been derived analytical1y by Levenspiel and Smith 5B as
i = 1. 2.
(3-10)
(J2 _ 2(E z /U L) + 8(E z /U L)2.
(3-12)
Aris 5 has shown that for a one-shot injection of tracer, the above equation can
be simplified (without introducing any significant error) to
/:!(J2 = a - a = 2(E z /U L). (3-13)
Several aspects of the above method of moments are discussed by Butt. 17 In
this method, also. the tailing in the RTD curves can cause significant errors in
the calculation of the Peclet number. An analysis involving the Laplace transform
74 GAS-LIQUID-SOLID REACTaR DESIGN
af the axial dispersian madel and the evaluatian af a linear transfer functian is
described by Ostergaard and Michelsen. 79 These investigatars claim that this
methad produces much mare cansistent results than the meLhaQ af maments,
regardless af the severity af the tailing and the lacatian af the cut-aff paint af
the tail. ording to. this__n:lethod. the transfer-function far__t line ar system fEn
be calculate d fram --the r laJil:.m -
,ox I f 00
C ( ) J C2(t)exp(- .st)dtj C 2 (t)dt
F ( - - I 0
s) - C ( ) - f <L I f 00 '
1 s C 1 (t)exp(-st)dtl Ct(t)dt
o / 0
(3-14)
where F(s) can be defined from the Laplace transform af the axial dispersian
madel as
F(S)=CXp { e [l- JF -4:i )]}.
(3- 15)
U,QQ!' rea .:!ang iI}JI . ne.,g ts
r log ( F;S») r I = tms Ila g ( F;S») T 2
]
Pe'
(3-16)
A plat af [lag (1 I F(s))] I versus s[lag (11 F(sH] - 2 from the abave equation should
yield a straight line, if the axial dispersian madel is applicable, The slape a.!1d
intercept yieht.!p. value5 of the average resi(l I) JilJle t'!1_!'lI1d..PJ c.le .!"lumber P .
- H pkins et a1. 46 showed that the range of s over - which this regressian is
carried aut is very impartant. For small values af s, althaugh the value af the
transfer functian can be accurately determi-ned, it becames insensitive to. variatians
in the parameters and, hence, small errors in the transfer function are magnified
in estimating the parameters. For large values af s, the initial part af the signal
(which, like the tail, has a large relative error) is taa heavily weighted and the
evaluatian af the transfer function hecames inaccurate. They suggested that the
aptimum range of s is that far which st m lies between 2 and 5. Anderssen and
White 2 further cansidered the typ af weighting this regressian technique gives
to errars in the time damain and suggested alternate methads far treating RTD
data. Their methads considered unequal weighting afthe data in the time damain,
thus minimizing the error due to. tailing af the RTD curve.
Michelsen and Ostergaard 68 subsequently propased three additianal methads
far calculating mean residence time and Pedet number, based upan numerical
evaluatian af the transfer functian and its derivative for a number of values of
the Laplace transfarm parameter stm' They defined
ut = In F,
(3- 17)
u _ -t m
1 - (I + 4st m /Pe)1I2'
(3-18)
RfSIDENCF-TIME DISTRIBUTION AND MODELS FOR MACROMIXING IN THE REACTORS 75
2t 2
V = m
2 Pe (I + 4Slm/ Pe )3/2 .
According to the three methods proposed, t m and Pe are related to V 0, V hand
U 2 by the following equations:
(3-19)
Method I,
Pe = (V + 2sV d
V .L sV I '
-V VI
t m = V + 2sV I;
(3-20)
(3-21 )
Method 11,
2V ( SV2 ) t/2
Pe = - 1 - 2-
V 2 VI'
( 2. V 2 ) -t / 2
t = V I 1 - - '
"I VI'
(3-22)
(3-23)
Method III,
-2 -2 4
V t = t", + S - p .
f m e
(3-24)
A plot of VI 2 versus S thus gives a straight line of slope 4f(t m Pe) and intercept
f;;' 2 on the ordmate axis.
The main advantages of the above methods, compared with the normal1y-
used method of central moments, are: (a) the validity of the model may be easily
assessed, and (b) the sensitivity to experimental errors in the determination of
transient response is greatly reduced. provided suitable s-values are used.
Michelsen and Ostergaard 68 showed that the last method can also be applied
to the N-tanks-in-series model. Very recently, Pham and Keey,82 by working with
the general definitions of V , V h and V 2 as
V (s) = In F(s).
V I(S) = - V '(s) = - F'(s)fF(s),
U 2(S) = - V't(s) = F(s)/F(s) - [F'(s)fF(sW,
(3-25)
(3-26)
(3-27)
showed the usefulness of this method for checking the validity of other complex
mixing models. They derived the necessary equations for the mixing parameters
for (a) tanks in series with plug flow, (b) diminishing back flow, (c) backflow cells,
and (d) second-order system models in terms of U , V.. and V 2.
There are other methods available for the evaluation of the axial dispersion
coefficient. Clements 23 suggested a least-squares method for the evaluation of the
axial dispersion coefficient from the RTD obtained with a Dirac b-function input.
76 GAS-UQUID"SOUD REACTOR DESIGl'<
Clements also estimated the frequency response from the pulse response. A
frequency-response method is also suggested by Kramers and Alberda. 52 Schwartz
et al. 95 suggested a new, two-tracer technique for simultaneous determination of
liquid holdup and Peclet number.
Johnson et a1. 48 compared the moments. s-plane, and frequency-response
methods for evaluating the RTD to an arbitrary input. The r-distribution model
with bypassing was titted to the experimental data obtained in a flow channel
agitated by air bubbles. Some conclusions regarding the relative advantages and
disadvantages of the three methods are given. Gunn 40 and Abbi and Gunn I
expanded the square-root term in Eq. (3-15) by the binomial theorem and obtained
[ lUx [ ( 2 U Ez 2 S _ 2E U - 4 S2 + O[S 3 ])J.
In F(s)J = ---=--- I - I --j (3-28)
2Ez
Thus,
1
-In F(s) =
.
x Ez O ( 2 )
U --j U3 + s.
(3-29)
Because of limitations on the accuracy of the three-term binomial approximation
to the square root, the expression on the right-hand side is an accurate
representation of the left, provided 0 < 4E z sjU 1 < (0.2 - 0.4), thus establishing
an upper-bound to the value!> of s that are considered in calculating E7. Given
this provision, Eq. (3-29) is linear with s, with intercept - x/V and gradient
EzjV 3 .
The response of the axially dispersed reactor to an imperfect pulse can also
be obtained, using the convolution integral, as
I ' x exp [Ux/2EzJ l ( V2 L ' ] X2 )J d .
E(t) = co.) - " exp - -- t - A + ---.-. A,
o 2 .J'(EzT[(t - /.)") 4Ez 4Ez(t - A)
where CIA) is the tracer input concentration at time l = ). and E(t) is the response
curve. If CO.) and E(t) are known, Ez can be calculated from the numerical
evaluation ofthe above convolution integral. Although there are difficulties in the
numerical solution that can cause severe inaccuracies in the estimation of Ez,
the process of numerical convolution is highly stable and nonoscillating.
Vergnes to7 has outlined a simple method for the determination of the Peclet
number when the tracer injection is sharp enough to be considered as a true Dirac
i5 impulse and the response equation is described by the solution of the dispersion
model for a system open at both ends. The method does not require knowledge
of the tracer quantity added, the sensitivity of the recorder, or the chart speed.
Sachova and Sterbacek 89 evaluated the axial dispersion coefficient from a
response to a random-pulse input by using a general analytical expression for
the random-pulse input. The random-pulse input was correlated as
(3-30)
fit) = {(I - J ( )] If: (1 - )' GY dt,
O<t<o,
(3-3] )
f(t) = 0 for t > a and t < 0,
(3-32)
RESIDENCE-TIME DISTRIBUTION AND MODELS FOR MACROMIXING IN THE. REACTORS 77
where a is the time width of the input curve, r and Ii are the variable exponents.
They showed 89 that this input is more realistic than a perfect pulse or step input
and gives better results for Ez than the method of moments. It is far simpler
than the frequency-response method at a com para hie accuracy. The method is
most useful for correlating curves having extended tail sections.
As a point of note, the axial dispersion coefficient can also be obtained from
the steady-state concentration-versus-distance profile of the tracer. This method,
among others, has been used by Watson and McNeese,,09 Shestopalov et al.,Q7
Kato et al.,49 Imafuku et al., 4 7 and Deckwer et al.: u The two-dimensional axial
dispersion models for the evaluation of RTD are considered by Schugerl 94 and
Tanoka and Inoue.!03
SingIc-parameter bypass model of Michell and Furzer 66 The axial dispersion
model dcscribed above gives good correlation to the measured RTD data as long
as radial-flow nonuniformities can be minimized by keeping a large bed-diameter-
to-packing-diameter ratio. For example, in trickle flow over a fixed bed, the safe
hed-to-packing-diameter ratio for no significant radial effects is about 25: L 100
The mixing model used to correlate the RTD curve must, however, adequately
describe the physical situation. The RTD for the liquid phase in a trickle-bed
reactor, in which the liquid flows downwards as a film over a fixed bed of catalyst,
shows excessive tailing. Although, as shown earlier, the tailing in RTD curves
1 has bcen treated by a variety of methods, Michell and Furzer 66 claimed that the
axial dispersion model does not describe the nature of trickle flow. They
visualized trickle flow as laminar film flow over a series of packing elements with
imperfect mixing or bypassing at each packing junction. The laminar film regions
are virtually plug-flow regions. The static holdup at junctions is well mixed by
hydrodynamic effects (mainly ripples) and causes axial dispersion in the reactor.
A schematic of their model is shown in Fig. 3-9.
As shown in Fig. 3-9. flow over the packing surface between junctions is
assumed to be laminar. At each junction a fraction, q, of the flow enters the
perfectly mixed regions, corresponding to the static holdup region. while the
remainder of the flow bypasses the mixing. The probability of an element of flUid
being mixed at each junction is taken as q. Michell and Furzer 66 derived the
expression for the mean residence time for the liquid as
t mL = 'ltF + '7qtM,
(3-33)
where tmL is the mean residence time of the liquid, '1 is the number of surfaces
encountered by liquid in the depth of bed, iF is the mean residence time of a
single film, and I'M is the mean residence time in a single mixer; tl, tF, and tM
can be expressed as
'1 = Lp/tl p .
/
iF = dp/iir.
i M = PLh.Ldp/qGI.
(3-34)
[n deriving the above equation, it is assumed the laminar film portions of the flow
were vertical streamline films of length d p . Lp is the total packed-bed height, d p
is the nominal packing size, and PL the liquid density. h. L is the static holdup of
78 GAS-LIQUID SOLID REACTOR DESIGN
Perfectly mIxed
static holdup
region
Laminar film
region
I-q
Instantaneous
bypass
I-q
Figure 3-9 Block diagram of bypass
model....
the liquid and G l is the superfieialliquid loading. The mean now velocity in the
film, Ufo is related to the welted surface area by the relation l7
Uf = (4GL!auJ.td2/3(/lLy/48pdi3.
(3-35)
Here, /ll. is the viscosity of fluid. y the gravitational constant. and a w the wetted
surface area. According to this model. an expression for the RTD for an impulse
input is given by
11 'l! qX(l - q)l1 x ( t ) .x. t ( t )
E{t) = (I - q)I1(j(t) + ( _ )I( _ 1)'{ _ 1)1 -=- exp - -=- .
x- I YJ x. x . x . tM tM
(3- 36)
In general. a w and h SL are known or could be estimated/ 7 . 77 . 98 so this model
is a single-parameter (q) model. Michell and Furzer correlated q with the film
Reynolds number by the relation
q = 0.0187 Re .32.
where
Ref = 4lJ..PLUri/lL'
(3-37)
Here IJ. is the film thickness. By comparing the variance of the response obtained
by this model and the one obtained for an axial dispersion model of the same
system. Michell and Furzer derived the following approximate relationship
between Peclet number and the parameter q:
"Pe = q(tM + td2/ , (3-38)
RESIDENCE-TIME DISTRIBUTION AND MODELS FOR MACROMIXING IN THE REACTORS 79
where tmL = f F + t M . Based on the above relationships, they then derived a
relationship
Pe = 0.039 Re .50. (3-39)
It should be noted that the film Reynolds number can also be defined as
Rer = 3.05(L p jt m d 3 / 2 (48pdlhg)1/2, (3-40)
based on Davidson's27 random angles and random lengths concept of a packed
bed or as 65
Rer = 21f.Gdu w llL> (3-41)
when accurate data on wetted surface area are available 77 ,9R and when the mean
residence time is not representative of the one for laminar films, As shown in
Fig. 3-10, Eq. (3-39) correlates the data of several investigators well.
Several points about this model should be noted. First, it takes into account
both macromixing as well as micromixing (in the rippled films at the junctions)
ii; the trickle-bed reactor to correlate the RTD and, second, it assumes that the
mixing at the static junctions is achieved by hydrodynamic effects, rather than by
diffusion effects, as is often postulated. I 3.29 The model is not tested against the
data from porous packing, where a significant portion of the static liquid holdup
is due to the liquid in the pores of the packings.
....
..
E;
::!
r:::
-
0>
"0
\.0
A
.iitJ,;K +
A:f!;iJ4! 0
': cst"
.
.
0.1
10
10 2
10 3
Film Reynolds number, Re
Figure 3-10 Correlation of the extent of aXIal mixing III trickle flow (atier Michell arid Furzer 66 ).
.. 1.27-cm Raschig rings (Stephens IOO }: 0, 2.54-cm Raschig rings (Srephens'oo); 6,O.635-cm
Raschig rings (Polk and llements 88 ); V, 0.635-cm Berl saddles (Polk and Clemetlls 88 ); A, string of
3.8-cm spheres (Harrison et £11. 42 ); .. 2.54-cm Lessing rings, 122-cm bed; 0, 2.54-cm Lessing rmgs,
244-cm bed; x, O.63-cm Raschig rings; +. 5.1 O-cm Raschig rings.
80 GAS-LIQUID-SOllD REACTOR DESIGN
Two-parameter modified mixing-cel1 model - Deans and Lapidus 29 and Deans 28
This model is an extension of the "perfectly mixed cells in series" model of Deans
and Lapidus. 29 The model assumes that each cell contains stagnant and flowing
regions. Due to backmixing.. mass exchange between the flowing and the stagnant
regime occurs. When the number of cells is very large, the model can be
represented by the partial differential equations 28 . 29
aC d iJC d
(1 - f) . + U L '" - + K (Cd - C.) = 0,
Dt vZ
(3-42)
ac. .
f "' . - K(C d - C.) = O.
d
(3-43)
Here. Cd and C. are the concentrations of tracer in flowing and stagnant liquids,
f is the fraction of liquid which is stagnant, and K is the mass-transfer coefficient
between flowing and stagnant liquid. For an injection of a sharp pulse at x = 0,
Eqs. (3-42) and (3-43) are subjected to the initial and boundary conditions
Cd(O, t) = <'5It),
Cd(Z,O) = C.(Z.O) = 0,
(3-44)
where lilt) is the Dirac iJ function. The solution to the above set of equations at
Z = Lp (i.e., reactor outlet) can be expressed as
E(t) = 0,
t < rj,
(3-45)
E(t)-exp( Ktm)b(t t ;)+( ;t m)expr -Ktm(2 + l tft n1J)J
x [It (2KtmJ(I-+ t fi: m ) ) i Ktm J0 - t 7c: m ) J t ti,
(3-46)
where I t(Z) is the first-order Bessel function of the first kind with imaginary
argument and t; is the time at which the tracer first appears in the reactor
effluent, i.e., the initial breakthrough time for the tracer.
The model requires two arbitrary parameters, f, the fraction of liquid which
is stagnant, and K, the mass-transfer coefficient between Bowing and stagnant
liquid, to describe thl; extent of liquid backmixing. The relationship between f
and K and the characteristics of the experimental RTD curve have been developed
by many workers. 2R ,29 .f may be calculated from the expression
f = 1 - (ti/t m ),
( 3-4 7)
where t m is the average residence time of the liquid in tht: reactor. Furthermore,
the variance of the RTD is given by
a = 2j2/Kt m . (3-48)
Thus, K can be calculated by combining Eqs. (3-47) and (3-48). This model has
been successfully applied to -the liquid-phase dispersion in film reactors (e.g.,
trickle-bed reactors).
RESIDENCE-rIME DISTRIBUTION AND MODEL FOR MACROMIXING IN THE REACTORS 81
Two-parameter crossflow model This model is conceptually very similar to the
"modified mixing-cell model" of Deans. It is, once again, largely applied to Iiquid-
phase backmixing in trickle-bed reactors. 43 . 45 The model is based on the
assumption that the liquid phase is divided into two regimes: stagnant and plug
flow. Possible areas where stagnant liquid might exist in trickle beds are at the
top of packing particles, in the interstices between tightly-packed particles. and
between the packing and the wall of the reactor. The mass can be exchanged
between the stagnant and flowing portions of liquid:
oC d aC d
cf; + U L :i z -t K(C d - Co) = 0,
ct (,
(3-49)
ac o
(1 - cf;):1 - K(C d - Co) = 0,
a
( 3-50)
where 4> is the fraction of liquid which is in the plug flow (i.e., fraction of mobile
phase) and K is the mass-transfer coefficient between stagnant and flowing liquid.
l..'L is the mean interstitial liquid velocity and Cd, C. are concentrations of the
tracer in the mobile and stagnant phases.
There is an obvious similarity between the equations of the crossflow model
and those of the modified mixing-cell model. With suitable redefinition of para-
meters. it can easily be shown that these partial differential equations are
mathematically identical. Thus, the solution for the modified mixing-cell model is
identical to the solution for the cross flow model, for the same set of boundary
conditions.
The parameters of the crossflow model can be obtained in several ways.
Ruszkay'H! estimated them from calculated values of the first three moments.
However, because of the uncertainty in measuring third moments, the technique
used by Hoogendoorn and Li ps 45 is probably more accurate. They showed that
cf; can be obtained from the initial breakthrough of tracer
cf; = t; jt m ,
(3- 51)
where t j is the initial breakthrough time and t m the mean residence time. K can
be calculated from
K = 2(1 - cf;f/()2 tm ,
(3-52)
where a is the standard derivation obtained from the experimental RTD curve.
It has been shown 95 that the parameter ct>, as calculated from the RTD curve.
agrees within experimental error with the ratio of the dynamic to the total external
liquid holdup. This agreement lends physical support to the crossflow model.
Two-parameter time-delay mode] (Buftham,14 Buftham and Gibilaro,15 and
Buftham el a1. 16 ) This model is based on the concept of fluid elements bemg
randomly delayed in time on their passage through the bed. The model has been
mainly applied to the liquid-phase backmixing in a trickle-bed reactor. The model
assumes that the liquid would flow in plug flow except for the fact that molecules
82 GAS-LIQUID-SOLID REACTOR DESIGN
have a chance of being "delayed" at many points along their path. The delayed
molecule eventually rejoins the flowing stream after a period of time has elapsed.
An individual molecule may experience a number of delays in the course of
traversing the bed. The developers contend that such a probabilistic model more
realistically describes the physical basis for the spread of RTD in trickle-bed
reactors than diffusion-based models. The model is, however, in mathematical
terms, equivalent to the modified mixing-cell or crossflow models in that it leads
to the same expression for the RTD, as can be shown by suitable redefinition of
parameters.
If it is assumed that the delay times are distributed exponentially, with a
mean delay time, tD, then the response to a pulse input of tracer may be shown
by a rather detailed stochastic argument to be
E(l) = 0, t < ti,
[ -Urn - ti) ] I [ -tm - t + 2t l J
E(t) --= exp b(t - t i ) + -exp - -
to (t - td tD
X [(t m - lj)(t - tj)/t p -l
L t ti,
1 '1!1J-l!
where '1 is the total number of delays that a tracer molecule experiences in
traversing the bed.
Two parameters, t j and to are required to describe liquid backmixing with
this model. The parameter t; may be estimated as the time taken for initial
breakthrough oftracer, or may be related to the time taken to reach a normalized
concentration of 0.05. The parameter to can be estimated from the pcak height
or the variance of the RTD curve.
(3-53)
(3-54)
Three-parameter PDE model (Van Swaaij et al.l 06) This model is largely used to
correlate the RTD curves from a trickle-bed r actor. The model is based on the
same concept as the crossflow or modified mixing-cell model, except that axial
dispersion in the mobile phase is also considered. The model, therefore, contains
three arbitrary parameters, two of which are the same as those used in the cross-
flow model and the third one is the axial dispersion coefficient (or the Pec1et
number in dimensionless form) in the mobile phase (see Fig. 3-1 I).
The basic equations are derived from a mass balance of a tracer component
as follows:
iPC d aC d Kmas aC d
Ed - - - U d - - - (Cd - C ) = . -
az 2 az f.hLtP · at
(3-55)
for the dynamic region, and
Krnas DC,
_ £IIdl - tjJ) (C. - Cd) = 8l
(3-56)
for the stagnant regIOn, where subscripts d and s refer to the dynamic and the
RESIDENCE-TIME DISTRIBUTION AND MODELS FOR MACROMIXING IN THE REACTORS 83
Axially dispersed
plug flow
Cd C.
Km
Mobile
phase
Figure 3-11 A mixing model for the trickle-
Stagnant hed reactor which comprises an axially
region dispersed plug flow with mass exchange with
tagnanl areas. 106
stagnant regions, respectively. Us is the packing surface area for unit volume, c
denotes the void fraction of the dry bed, h L is the volume fraction of the total
liquid volume per unit void volume, rp is the fraction of the dynamic liquid
volume in the total liquid volume.
The boundary conditions whi ch lead to the solution for the impulse response
are as follows:
Cd = 0, C.= 0 at t = 0; (3-57)
Cd = b(tt C.=O at Z = 0: (3-58)
Cd =0, C.=O atZ=oo. (3-59)
Equations (3-55) to (3-59) were rewritten in dimensionfess form and solved
analytically by the Laplace transformation technique. The final solution, the
theoretical impulse response , can be obtained as follows :69
C d (8) = J: J Co - ; ( 8 - X) ) 11 [2N J C -= ) ]
)( ex [ _ p (x - rp f _ N x - 2rpx + Otb J d
p 4cf>x cf>O _ rp) x
+ J ( Pcf» exp [ _ p (O - -,l - N ]
2 7"[0 3 4tbO rp ,
C.(O) = J: 2(1 rp) J (: ) Jo[2N (;: = ;) ]
[ (x - cf»2 N X - 2cf>x -f erp J d-
x exp - P 4cf>x cf>O _ rp) x,
(3-60)
(3-61)
where
N = (K maJhLcf>c)(Lp/Ud),
P = UdLp/Ed'
(1 = tUdrp/L p ,
x = ZILp,
and where J 0 and 1 [ are the zero- and first-order Bessel functions of the first kind.
When N is zero and cf> is unity, the PDE model coincides with the dispersion
model. When Ed = 0, this model becomes the crosst1ow model The impulse
84 GAS LlQUID-SOUD REACTOR OI:.'iIGN
response, Eq. (3-60), is characterized by three parameters, cJ>. N, and P. Figure 3-12
shows somc of the curves calculated from Eq. (3-60). The impulse response is
characterized by a sharp peak and a tail. For large P. the peak becomes higher
as P increases and for small P, the peak time decreases with a decrease in P.
1.5
'"I
..-.
""
'-'
tJ'"
1.0
2.5
2.0
I p= 40 J
0.7
0 3
2
8[-]
2.0
[!J
N- I
1.5 =0.9
=0.8
=0.7
= 0.6
..!.... = 0.5
1.0
U
0.5
0.5
o
8[-1
2
Figure :.\-12 Impulse response curves
calcul<lted by Eq (3-60\(liftt'r ''\,f''t....llrcl
et al. hl)
3
RE'>IDENCF-TIME DISTRIBUTION AND MODELS FOR MACROMIXING IN THE REACTORS 85
The effect of P is similar to that of Pe in the dispersion model. At moderate values
of Nand tP, i.e.. N = om to I and tP = 0.5 to 1, the tail in the impulse response
becomes long with a decrease in N and the peak appears at carlier time with a
decrease in Nand cPo
The mean residence time can be best evaluated by using the method of
moments. In order to estimate the thrce parameters, cPo N, and P, the experimental
impulse response IICt) is. first, calculated numerically from the input and output
signals on the basis of the following equation:
y'(t) = };.f'(t - A.)II(A.) A.,
(3-62)
where ,no and y'(r) represent the first derivatives of the input and output signals,
respectively. Then. the parameters are estimated so as to minimize the following
least-squares error over a time range from t b to t c :
'.
Error = L [1I(t) - C(t)Y
I.
{3-63)
The time range (rb. te), which is essentially arbitrary. is determined according to
the relations
t b = (l; + t c )/2.
{3-641
(3-65)
to = 4(lc - t j ) + tj,
where r, is the breakthrough time and rc is the peak time.
In practice, it is easy to introduce a pulse input. Under this condition, the
boundary condition at Z = 0 in the dimensionless form would become
I rC d
b(lI) = Cd - P az '
Cs=o.
( 3-66)
The moments of the distribution function for Cd at x = I can be calculated directly
from the Laplace transform of Eqs. (3-55) and (3-56) by
. af;d
/1j=(-I)Jlim . (3-67)
.5---100 (is)
One finds
1
/II = 1 +-,
P
4 4 2(1 - tP)2 ( I )
/12 = - + -- + - + 1 + I
P N P ,
(3-68)
and the variance a = /12 - /1 can be given as
, 2 3 2(1 - cP)2 ( 1 )
() = /12 - /11 = P + p2 + N p T] .
The parameter P can be found from the value of the Peclet number for high
values of l1dL//hL. where h dl . and h sl are the dynamic and static holdups (fractions
of void volume). At other values of h d l./I1'l, P is assumed to remain constant. If
(3-69)
86 GAS-LIQUID -SOLID REACTOR DESIGN
we now define
M j = to tjydt,
where y is the recorder deflection t seconds after injection of the tracer, then we
find 62
(3-70)
1_ M OM 2- )
(j- ---I
Mf .
(3-71)
For the model,
a' = (I//ll)a. (3-72)
From Eqs. (3-71) and (3-72), N can be calculated. It should be noted that the
parameter cP = hdL/(h dL + hsd.
As indicated earlier. the influence of microporosity of porous packing causes
larger static holdup and, thus, a very long tail in the RTD curves. According
to the PDE model, the axial dispersion in the mobile fraction of the liquid phase
and the complex mass excha ge between mobile and stagnant liquid at contact
points and inside the panicles are the causes for the long tails in the RTD curves.
As dead zones are very important for porous catalyst packings, the real RTD
data for trickle-bed reactors cannot be explained by a model which does not take
into account the role of static holdup in the reactor on the RTD curve. The PDE
model shows that the tracer has access to small parts of porous catalyst particles
and that a fraction of the stagnant zones become mobile when there is gas flow
or better axial mixing in the mobile phase. A limiting case of the PDE model.
denoted as the PD model, has been studied by Matsuura et a1. 62 . 63 In this two-
parameter model, N is assumed to be zero (i.e., no mass exchange between
stagnant and mobile fluids). The PDE model has been shown to correlate the data
better than the single-parameter dispersion model (see Fig. 3-13) or the two-
parameter PD or cross flow models. 1S ,62.63
3-5-2 Stagewise Models
Unlike the differential models. the stagewise models basically represent the back-
mixing by a series of tanks with either backflow or interstage circulation between
the consecutive tanks. The complete or imperfect mixing in each stage has been
considered. The number of tanks or stages, along with the amount of backflow
or the interstage circulation, characterizes the degree of backmixing. [n the
limiting case of an infinite number of tanks in series, plug flow prevails.
Series-of-stirred-tanks model The series-of-stirred-tanks model (often referred to
as the cell model) is perhaps the simplest type of stagewise model for the backmix
reactor. In this model. the reactor is represented by a series of perfectly mixed
stages. The degree of backmixing is characterized by the number of stages: the
RESIDENCF.-TIMF. DISTRIBUTION ANn MODELS FOR MACROMlXINCi IN THE Rf'AfTORS 87
0.30
o
Observed
"I
0.20
...
t;
d"
.g
b
c::
'"
'->
<=
o
U
0.10
2
4
6
8 10 12 14 16 18 20 22 24
Time. t (s)
Figurc 3-13 Comparison of the output signals calculated on the basis of the PDE model and the
dispersion model with the measured output signal.<>2
larger the number of stages, the less the overall degree of back mixing. The various
aspects of this model have been discussed, among others, by Deans and Lapidus,29
Nishiwaki and Kato,73 and Ham and Coe. 4t
A modification of the cell model is considered by Rang and Cholette. s They
represented a backmix reactor by imperfectly mixed tanks in series. They also
assumed that a fraction fb of the inlel fluid to each stage bypasses the stage. The
model is, thus, useful for characterizing macTOmixing in a reactor which contains
at least some degree of bypassing (e.g., agitated reactors). Furthermore, only a
fraction tPa ofthe fluid entering a stage is agitated. The fraction 1 - tP. is stagnant.
The overall mixing characteristic of the reactor is, thus. characterized by three
parameters fb' tP., and 11, the number of stages. Bang and Cholette S have shown
that this three-parameter model is more versatile than the regular axial dispersion
model.
Backflow model This generalized stagewise model assumes backflow super-
imposed on the net flow through a column with perfectly mixed stages in cascade.
The model describes the backmixing in two-phase countercurrent operation. In
this model, the dispersed phase may be treated as a second continuous phase. In
the limiting case of no backt10w or the number of stages being mllch larger than
unity, this model reduces to the "stage model" (of perfectly mixed cells in cascade)
or the "diffusion model" (or axial dispersion model for two phasesl. respectively.
The model has been applied successfully to correlate the longitudinal dispersion
coefficient for the continuous phase in pulsed sieveplate columns. Various aspects
ofthis model are discllssed by Miyauchi and Vermeulen. 72 Sherwood and Jenny,96
Latinen and Stockton,55 Sleicher,99 Nishiwaki and Kato,73 Saida,9o and
88 GAS-LIQUID SOUD REACTOR DESIGN
Nishiwaki et.al. 14 Deckwer 30 has applied the back flow cell model to correlate
the temperature profiles in a nonisothermalliquid-phase reactor.
A simple extension of the back flow model is considered by Nishiwaki et al.,74
who assumed each stage to be backmixed but not perfectly mixed. The back-
mixing in each stage was assumed to be expressed hy the dispersion modeL This
model is, thus, named the dispersionjbackflow model. A comparison of this model
to the dispersion model is given hy Nishiwaki and Kato. 73
Interstage recirculation model Conceptually, this model is very similar to the
back flow model. The backmix reactor is represented by a series of perfectly mixed
stages with recirculation between the two stages. The number of stages and the
degree of interstage recirculation characterizes the degree of backmixing of the
entire reactor. This model is discussed by Mecklenburgh. 64
Three-parameter mixing-cell model (Van Swaaij et 31"06) This is a stagewise
model for liquid-phase backmixing in a trickle-bed reactor. According to this
model, an elementary mixing pattern for trickle flow is expressed as I 06
C(l- ])
cm
Q
j
The liquid is mixed stagewise. A small quantity passes through a stagnant
zone V t and the rest through a mobile zone V 2 . Q and C are the total flow rate
and concentrations. For a pulse input, the relevant mass-balance equations and
their solutions are given by Van Swaaij et al. 106 The moments for ex > 0 are given
as l06
/11 = I,
2 1+ex(A 2 -1) j-l
/12 = /[1 + ':l(A - 1)]2 + j"
6 I + ex(;p - 1 ) 6(j - I) {1 + et(4"2 - I)} (j - I)(j - 2)
/13= / [I+ex(A_l)]3+ j [l+CJ.(A-l)]2+ / '
where A = Vt(l - .:x)/V 2 :x. The number of stages, j, can be found from these
experimental conditions, where the stagnant areas can be neglected. For this case.
a 2 = I/I The exchange parameter ex then follows from the standard deviation of
the model distribution function and the experimental standard deviation. Although
the model describes the mixing process in packed columns, it is not certain that
(3-73)
(3-74)
(3- 7 5)
RESIDENCE-TIME DISTRIBUTION AND MODELS FOR MACROMIXING IN THE REACTORS 89
the dynamic and static holdups are completely identical with the mobile phase
and the stagnant regions.
The best values of the ratio of mobile phase to stagnant phase, together with
the exchange parameter, can be found by comparing the experimental RTD
curves with the distributions given by the models. This gives more information
than the first two moments. The final expressions for predicting the RTD distri-
butions are given by Villermaux and Van Swaaij. t08
Four-parameter models (Raghuraman and Varma 84 ) Conceptually, this is an
extension of the tagewise PDE model, in which the reactor is r.epresented by /1
perfectly mixed stages. An instantaneous bypass of a fraction X of the feed to
each stage, which consists of an active backmix region (of fraction Y) and a dead
region (of fraction 1 - Y) with a crossflow ratio P, between the two regions. A
schematic diagram ofthis model is shown in Fig. 3-14. The mass-balance equations
for the ith stage (i of- I) are
QC j = Q(1 - X)C; + QXC i - t.
- - dq
Q(1 - X)C i - 1 + PQ(l - X)q' = Q(1 - X)(1 + P)C; + VYd("'
PQ(1 - X)(C; - C') = V{1 _ Y) d ;' .
(3-76)
(3-77)
(3-78)
Here, C; and Cj' are the concentrations ofthe tracer in the active and dead regions
of stage i. The initial conditions are
t = 0,
Ci'=O,
C;=o
(i -of- I).
(3-79)
For the first stage, the material balance equations are
QC I = Q(1 - X)C'. + Xqb (l = 0),
P"Q(1 - X)(C'{ - C;) = Q(1 - X)Ci + Vy d ; ,
PQ(1 :...- X)(C't - CD = V{1 _ Y) d '{ ,
(3-80)
(3-81 )
(3-82)
q (t=O) QX
Figure 3-14 Schematic diagram of the stagewise model of Raglmraman and Varma."4
90 GAS-LiQUID-SOLlD REACTOR DESIGN
with the initial conditions
t= 0,
C't = (l - X)qjVY,
c,-=o.
(3-83)
The above equations assume a Dirac {) impulse input. From the above equations,
the RTD for an n-stage cascade is derived by Raghuraman and Varma as
E(fJ) =- f ni ( ) (l - x) 2i x(n i) ( ) i t ! O)I : r'i (-It I ·
i=1 I ) t 1 (1- 1). Lr=o
( '>i-I-r-I ) ' I
- . f ( R + B )i reR,no
Xu -r)!(i-l-r)!r!(R t -R 1 )2i t,l I I
+ (-I)t+r(R 2 + Bd- r e R1nO } J + XnlJ(O = 0).
(3-84)
where
RI = -UBI + B 2 - J {(BI + B 2 )2 - 4B 3 }l ,
R 2 = -1[BI + B 2 + Jf(Bl + B 2 f - 4B 3 }],
and where
BI = (I - X)p/(l - Y),
B 2 = (1 + P)(I - X)/Y,
B3 = PO - xf/Y(I - Y),
0= tlt m ;
t m being the mean residence time. The RTD for a step input is, similarly, given
by the expression
F(fJ) = 1 _ f i ( ) (1 _ X)2iX1n-il ( I_ ) i t (nfJ)I-1 Iii (2i 1- r - I)!
i=t I Y t=I(I-I)!L,=o (z-l-r)!
I r .. J {( R +B ) i-jeR,nO
,, ( 1 ) ,-1-)+1 I I
X (R _ R) 2i-I-,.L. - " ( '_' ) 1 R r-j+t
I 2 )=0 ). I }. I
( R + B ) i- j eR2nO } ' ]
+ ( _J ) /+r 2 t. .
R 2 - J+ I
(3-85)
This general model should be useful in modeling macromixing in trickle-bed
reactors when significant bypassing occurs. In limiting cases, when It...... 00 and
X...... O. it is conceptually similar to the crossftow model, the time-delay model.
etc. When X -00, it is similar to the stagewise PDE model described earlier.
Several other limiting cases of this model are given by Raghuraman and Varma. 84
Four-parameter model of Rao and Varma ss This model combines the concepts
of the bypass model of Michell and Furzer 66 and the PDE model of Van Swaaij
et al. I 06 The model is applied to the liquid-phase backmixing in a trickle-bed
RESIDENCE-TIME DISTRIRUTION AND MODEL" FOR MAC'ROMIXING IN THE REACTORS 91
reactor. The model visualizes the liquid flowing as a film over the surface of
a particle, followed by a mixing tank corresponding to a packing junction. The
mixing in the film due to velocity gradients and film rippling is represented by a
diffusion type of mechanism characteristic of dispersed plug flow. The mixing at
the packing junction is assumed to be incomplete, with an ideally mixed zone
that exchanges mass with the stagnant zone. Figure 3-15 gives a schematic of
the basic unit of the model, and the number of such units in series are cquated
to the ratio of bed height to panicle size. The RTD based on this model can be
expressed as BS
E(8) = f: E D ({J')E M (8 - 8') dO',
(3-86)
where
_ 1 _ P . e_ ] lJ2 [ -(X Pe (1 - O/(X)2 J
ED({J) - 4n:1B exp 4 8
(3-87)
and
/1(1 - Pn) r f 8/1 } 2 / J
E",«(J) - [ n ( (l _ m] exp L - l(l=- l-= If) - /1 ! 2/1 "
where
] « n « liP.
(3-88)
In the above expressions, the four unknown parameters are Pe. the Pec1et number,
P. the crossflow ratio defined as the fraction of feed that exchanges betwcen the
active and stagnant regions. and (X and P. as defined in Fig. 3-15. V is the volume
with subscripts p, m, s, and.t denoting the volumes for the dispersed film. mixing
tank, stagnant zone. and the total basic unit, respectively. fi is the dimensionless
time, based on the mean holding time of the total sequence. {J' is the dummy
variable. Rao and Varma as showed that this model correlates various experimental
data well and that the only significant parameters in the model are Ihe Peclet
Mixing tank
Dispersed film km l
Q -1 V p -I
- I ! -
PQ I PQ
lkJ
Figure 3-1S A schematic diagram of the basic unit of the four-parametel model of Rao and Varma. 85
v, = V p + ;., + V" :x = Vp/V" Ji = V./( V m + V.I.
92 GAS-LIQUID-SOLID REACTOR DESIGN
or Bodenstein number of the film and 13, the fractional stagnant volume of the
mixing tank. For most of the data they analyzed, the parameters {X and P
remained constant at the values of 0.5 and 10- 5 , respectively.
3-5-3 Other :\1odels
Besides the differential and stagewise models discussed above, there are several
other models 7t,93,1 II reported in the literature. These are, however, not extensively
examined. The stagewise and differential models can be related 10 each other. For
some problems, differential models are better applicable (e.g., trickle-bed reactor)
than the stagewise models and vice versa. There are, however, cases intermediate
between differential and stagewise backmixing (e.g., tubular reactors compart-
mentalized by coils, segmented bubble-column reactors, bubble-column reactors
with side streams, etc.). These cases are best handled by combining the differential
and stagewise models discussed above.
3-5-4 A Model for an Agitated Stirred Vessel (Recycle-flow odel with
Crossmixing)
The'differential and stagewise macromixing models described so far are largely
applicable to the liquid-phase mixing in trickle-bed or packed and sectionalized
packed-bed bubble-column reactors. Some of the models are also applicable to
the liquid- and solid-phase mixing in a three-phase fluidized-bed reactor. In an
agitated reactor that exhibits departures from the ideal case of "perfect mixing,"
the impeller acts like a submerged pump, circulating the contents of a tank. For
the continuous system, the circulation loop is divided into two parts, by the
inflow and outflow streams, with possible crossmixing in between these two
streams (see Fig. 3-]6). In the most general case, this single circulation loop with
crossmixing in between the two streams of the loop contains five parameters:
number of cells in each leg n, recycle rate r, crossflow coefficient K, and holding
times for the two legs <I and <2, For a closed vessel, <1 and <2 are not independent.
Furthermore, in most practical cases, the design of the impeller and the vessel
are such that the holding times of the two streams are approximately equal and
are related to the recycle rate and mean residence time, Thus, n, r, and K are the
three parameters that describe a recycle-flow model with crossmixing. A detailed
analysis of this model is given by Mah. 6o The limiting case, when both streams
move in plug flow (i.e., n -+ 00), is considered by Hochman and McCord. 43 This
case is relevant for propeller-agitated vessels having a large length/diameter ratio.
Various aspects of the recycle-flow model with no crossmixing (K = 0) are
reviewed and unified by Gibilaro. 36 The recycle flow model can also describe the
phenomena of partial bypass flow and initial delay in response which have been
observed in experiments in stirred vessels. 22 . 37 These effects are largely a result
of the position chosen for the inlet/outlet ports. 37
In practice, multiple circulation is bound to occur. 37 ,38.43 The details of
multiple recirculation models are reviewed by Wen and FanYo
Rr-.'\lDENCE-TIME. DISTRIBUTION AND MODELS FOR MACROMIXING IN THE REACTORS 93
Q,C j
o
k
Al A 2
VI k V 2
C] C 2
VI V 2
R
L
Q. Co
Figure 3-16 Recycle-crossflow modeL 60
k = exchange coefficient. L = length. A = area. U = velocity,
Q = flow rate, R = flow rate, C;, Co' Ct. C 2 = concentrations.
v= volume. We define K = kL/Q and r = R/Q.
3-6 RTD AND SCALEUP PROBLEMS
The RTD and mixing characteristics can be subjected to a host of problems in
the proper scaleup of a gas-liquid-solid reactor. The important problems can
be listed as follows:
1. RTD data from a smaU-scale apparatus cannot be used for larger-scale units,
Ross 86 has shown this for hydrodesulfurization in a trickle-bed reactor wherein
the prevailing flow regimes in small- and large-scale reactors may be different.
2. Flow maldistribution of the phases can render the evaluation of RTD data
very difficult. In some cases, maldlstnbution may exist in small units but it
may not exist in large-scale units (e.g., trickle-bed reactors). While in some
other cases, such as three-phase fluidized-bed reactors, nonuniform gas
distribution in large-scale units may cause undesirable recirculation and dead
zones. Uniform gas distribution can usuaIJy be achieved in the small-scale
fluidized-bed reactor.
3. In small-scale apparatus, no backmixing may be observed, but larger-scale units
might show substantial backmixing. For instance, in small-size packed-bubble-
columns the gas phase moves in plug flow, but for larger-size units there may
be substantial backmixing in the gas phase.
4. In sectionalized bubble-columns, we may optimize the height-to-diameter ratio
of each section to 0.8 through 1.2 and prevent backmixing of liquid between
sections. However, in larger units. this height-to-diameter ratio may be
completely unsatisfactory for preventing mixing between sections.
94 GAS-LIQUID SOLID REACTOR DESIGN
5. In large-size mechanically-agitated multistage contactors, the speed of the
agitator is kept at a relatively low level and horizontal baffles are provided.
Here, RTD in the gas and liquid phases may show different behavior compared
to a small-scale unit.
3-7 RECOMMENDATIONS FOR FL'TURE STUDY
From the reactor design and modeling point of view, the RTD analysis has to
be combined with the intrinsic kinetics and other mass- and heat-transfer effects
prevailing in the reactor. As shown in the next chapter, unless some simplifying
assumptions are made, the mathematical equations describing the performance
of a simple three-phase reactor can be very complex, even when the RTD is
described by the simple axial dispersion model. From this point of view, the
macromixing models which include more than two parameters will find very
limitcd use for reactor design and modeling purposes. Further work on macro-'
mixing models involving a large number of parameters should, therefore, be
avoided.
Several important practical aspects of the RTD are still unavailable from the
reported literature. Future research should include the following studies.
1. Experimental RTD data from real commercial reactors is needed. This type of
data would be very useful in examining the applicability of macromixing models
discussed here to large-scale systems. Furthermore, with the help of such data,
onC could evaluate the usefulness of various models for scaleup purposes, and
their applicability to systems other than air and water.
2. The applicability of the proposed macromixing models have been generally
restricted to the bubble- and trickle-flow conditions. Their usefulness in
correlating RTD in pulsating- and spray-flow regimes needs to be investigated.
3. In most of the macromixing models, radial mixing in the bulk-fluid phases
is assumed to be complete. However, in some flow regimes (e.g., the pulsating-
flow regime), this may not be a good assumption. While the assumption of
complete radial mixing may be reasonable in some small-scale reactors, it may
be questionable in some large-scale ones. Some criteria for the reactor
conditions where one may assume complete radial mixing (both mass and heat)
need to be developed. The criteria, of course, should consider all phases and
all possible flow regimes in the reactor.
4. The axial dispersion of heat in large-scale reactors should be measured. This
information would be useful in modeling large-scale nonisothermal reactors.
5. Since gas causes most of the mixing in three-phase reactors, its distribution
is, of course, very important. For small-diameter columns, the nature of a gas
distributor is known to have a significant effect on RTD. Similar information
on large-diameter columns is presently unavailable. For reactor scaleup
purposes, such informarion is desirable. Studies should consider various reactor
configurations and flow regimes.
RESmENCE-TlME DISTRIBUTION AND MODELS FOR MACROMIXING IN THE REAcrORS 95
6. Maldistribution of liquid may be a problem in large columns and/or under
low liquid-flow conditions. Proper study of liquid distribution (both in small
as well as large columns) and its effect on the RTD is needed. The study
should include wide ranges of gas and liquid flow rates and a variety of reactor
configurations. From this type of study, the design criteria for minimizing the
maldistrihution of liquid should be developed. Studies should include the role
of liquid distributor design.
7. So far. only the axial dispersion model has been used for scaleup purposes.
Very little knowledge on the effects of reactor configuration and flow conditions
on the parameters of more complex macromixing models (e.g., the two-
parameters model, etc.) is available. Since these complex models are more
realistic, more information on the relation between their parameters and the
system conditions, such as packing size, fluid properties, and flow rates, needs
to be obtained. At present, complex models are not very useful for scaleup
purposes.
ILLUSTRATION 3-1
The residence-time distribution in the liquid phase of a cocurrent-upflow fip.ed-bed
I!lt!1tLwas mea ure at t p different flow rates. The column diameter was 5.1 cm
and the packing diameter was 0.38 cm. The bed void fraction was 0.354 and the
mass flow rate was 50.4 g s - t. The RTD data at two axial positio.ns (which were
I}l em apart in Run 1 and 152 cm apart in Run 2) are summarized in Tabl 3-;2.
Using the mcthod of moments, estimate the mean residence time and the Pcelet
number for these two runs. If one assumes that the backmixing characteristies
are independent of the distance between two measuring points, what is the effect
of gas flow rat.e on the mean residence time of liquid and the Peelet number?
Row does the measured and the predicted RTD at the downstream positions
compare in both cases?
SOLUTION For both upstream and downstrean) RTD curves, the moments c.a.lf
be calculated as
(tCjjfji1U)
Jlj = ( C jj L'11) ,
2 (t JifJi.M)
= ( t C ji L'1 )
j = 1,2,
(3-89)
j= 1,2,
(3-90)
where j = 1,2 refer to upstream and dO\",:nstream positions respectively. Sufficiently
96 GAS LIQUID-SOLID REACTOR DESIGN
Table 3-2 RTD for typical rull'O
Upstream
Time( )
Time (sl
Concentration" 10 4
{weight percent)
Downstream
Concentration )( 10 4
(weight percent)
Run I: gas flow rute 342 em) s- ': distunce be/ween upSlr"<lm and down..rream . I L"L
'. 4' / i.
positions. Lp = 91 em \ I :\I _J' .
.......\ : I l \_ ,r'"
0 0 l 6.6 0 .J. rt" {J:: - J .
1 0.13 ( 7.6 0.09
2 0.57 8.6 0.29
3 1.51 \ 9.6 0.75
4 1.59 10.6 1.18
5 1.13 \ 11.6 1.08
6 0.82 \ 12.6 0.8
7 0.59 I I 13.6 0.55
8 0.45 ( \ 14.6 0.44
l) 0.375 " 15.6 0.345
10 0.315 \ 16.6 0.27
[I 0265 17.6 0.225
12 022 \ ' 18.6 0.19
13 021 19.6 0.17
14 0.18 \ 20.6 0.14 (""'
t' t , 17
15 0.15 216 0.12 fJ' L-:;
16 0.13 22.6 0.1
17 0 23.6 0.09 )
18 0 24.6 0
Run number 2: gas flow rate = 460 cm) s - , : distance between upstream and
downstream positions. L. = 152 em
o
I
2
3
4
5
6
7
8
9
10
11
12
13
14
15
16
17
18
o
0.13
0.54
1.54
1.66
113
0.79
0.59
0.44
0.365
0.305
0.265
024
0.22
0.21
0.19
0.[6
0.13
o
9.8
10.8
11.8
[2.B
13.8
14.8
15.8
16.8
17.8
18.8
19.8
20.8
2IJJ
22.B
23.8
24.8
25.8
26.8
27.8
28.8
29.8
o
0.09
0.26
0.73
1.06
1.18
0.83
O.5B
0.44
0.33
0.27
0.23
0.2
0.18
0.17
0.15
0.13
0.11
0.09
0.08
o
RESIDENCE-TIME DISTRIBUTION AND MODELS FOR MACROMIXING IN THE RIJACTORS 97
large values of n (at least 100) should be taken to ensure accuracy in the calcu-
lations. The .!!I 1ill-.re.sidelJ.Q:. tj .!!:1e i th.u given b y
. -,
-;;;. - U (3-91)
and the Peelet number is given by
Pe = 2dp/Lp«(J , - (Jll: (3-92)
---- ----...
Using the above procedure, the following values of t m and Pe for two runs arc
obtained:
--
Run number Gas rate (em] S-I) t rn (s) Pe
.. 1 91 cm 7.2 0.413
2 152 em 10.7 0.281
The differences in trn and Pe are partly caused by the difference in L p . As one
may expect, the increase in gas flow rate increases the backmixing. The RTD at
the downstream positions predicted from the estimated parameters are compared
with the measured ones in Figs. 3-17 and 3-18. As shown, the agreement is fair for
both runs.
ILLUSTRA TION 3-2
The residence-time distributions in the liquid phase at two positions in a packed
column are given by the data sho n in Table 3-3. The data were obtained in a
--
i: 1.2 Observed
Q.)
u Moments
...
Q.)
""
. 0.8 l
0
x
c:
.2 0.4 --1
f I
i:
Q.)
u
c
8
0 8 12 16 20 24
Time (s)
Figure 3-17 Measured versus predicted RTD for Run 1.
98 GAS LIQUID SOUD REACTOR DESIGN
---
....
<=:
1.2
Q)
C>.
0Q
0.8 -
"0
x
<::
.g
b 0.4
<=:
Q)
'-'
c::
8
0.0
6
.- Observed
.....
:\
\
\
\
\
\
,
"-
'.......
.......
.......
-- Momcnt
10
18
22
26
30
14
Figure 3-18 Measured versus predicted RTD For Run 2.
Time (s)
column of diameter 61 cm with a packing diameter of 0.44 em and a bed void
fraction of 0.41. The distance between the upstream and downstream position was
91.5 cm. The gas and liquid flow rates were 222 cm 3 s 1 and 37.8 g s \
respectively. Estimate the mean ence tim and thePeclet num.ber using (a)
the method of moments and (b) the method of Ostergaard and Michelsen. How
do They-co.mpare? Show the downstream RTD predicted by each of these methods
and compare them with the measured RTD.
SOLUTION The calculations for the method of moments can be carried out using
the procedure outlined in the previous illustration. The calculations of mean
residence time and Peclet number by the method of Ostergaard and Michelsen
are carried out as follows.
(a) Estimate mean residence time using Eqs. (3-89) and (3-91).
(b) Choose several values of s such that 1 st m 9.
(c) CaIc -tfa-ns.fgF--fynction1--4.).from
L C 2 (t) exp (-st) I1t!L C 2 (t) /11
F(s) = r if ,
L C 1(1) exp ( -Sl) I1t /L C t(t) I1t
t , t
(3-93)
where the subscripts I and 2 once again refer to upstream and downstream
positions, respectively.
(d) Calculate [log(l,'F(s»] I and s[log(I/F(s))]-2 for each chosen s. Plot
[log (IIF(s»)] - I versus s[log (tIF(s»] 2 and fit the line statistically. The slope
ofthe line = t m and the intercept on the ordinate = -dr./{pe x L p ), where d p
is the packing diameter and Lp is the distance between the upstream and the
downstream positions.
RESIDENCE-TIME DlSTRIRUTlON AND MODEI.S FOR MACROMIX\NG IN THE REACTORS 99
Table 3-3 Typical RTD at two positio _.___
Downstream
Time (s)
o
I
2
3
4
5
(j
7
8
9
10
11
12
13
14
15
16
17
18
19
20
-_.- - - . ..
Upstream
Concentration x 10 4
(weight percent)
Time(s)
o
0.13
0.5
1.22
1.7
1.74
1.5
1.2
0.97
0.75
0.59
0.49
0.4
0.34
0.31
0.26
0.23
0.2
0.16
0.13
o
[I
12
13
14
15
16
17
18
19
20
21
22
23
24
25
26
27
28
29
30
31
32
33
34
Concentration y 10 4
(weight percent)
o
0.09
0.22
0.47
0.73
1.17
1.24
1.17
1.02
0.85
0.66
0.53
0.41
0.36
0.31
0.26
0.22
0.19
0.16
0.14
0.12
0.[
0.09
o
(e) Compare the calculated t m with the assumed (or estimated) t m . If they do not
agree within the specified error (which, in the present case, is taken to be less
than 1 percent) then adjust t m and repeat the procedure from step (b).
The values of t m and Pe obtained by the method of moments and the method
of Ostergaard and Michelsen are as follows.
t m (s!
Pe
Thus, at least for this problem, the agreement in the predictions of lm and Pe by
these two methods was excellent. The predicted RTD by these two methods and
the measured RTD at the downstream position are compared in Fig. 3-19. As
shown, the predictions of the models are fair.
Method of
moments
Method of Ostergaard
and Michelsen
12.3
0.441
12.3
0.451
tOO GAS-LlQUID-SOLlD REACTOR DESIGN
1.6
-
<::
'"
'--'
...
"
Co 1.2
.c
on
'0
"0 0.8
)(
<::
.2
0.4
<::
'"
u
to:
8
0.0
6
- Observed
-- Moments
. 0 and M
18
Time (s)
Figure 3-19 Measured versus predicted RTD.
[0
14
22
26
30
34
NOME CLATURE
a time width of input curve
as specific surface area of packing
a,,, wetted surface area
A column cross-sectional area
A quantity defined by Eq. (3-75)
C concentration
Cd concentration of tracer in flowing phase
C E equilibrium tracer concentration
C s concentration of tracer in stagnant phase
C(s) transformed concentration distribution
C(t) distribution of tracer
C' tracer concentration in the active back mixed region of a stage
C n tracer concentration in the dead region of a stage
d p packing diameter
E(t) residence-time distribution
Ez axial dispersion coefficient
Ed axial dispersion coefficient for the dynamic phase
f fraction of stagnant liquid
I'(t) first derivative of input signal
F(s) Laplace transfer function
F(t) arbitrary input
g gravitational constant
G superficial mass velocity
G(i.)
hi.
h dL
h. l .
K.Km
1.
Lc
Lp
Lz
L p
M
M j
n
N
p
p
Pe
q
Q
r
RC r
S
t b
t c
t.
t;
t m
to
tF
t m
'''n
iir
u(tI
V
V d
V
V t
V 2
V
x
X
y'lt)
y
RESIDENCE-TIMF. DISTRIBUTION AND MODELS FOR MACROMIXING IN THF. REACTORS 101
system response to an impulse
total liquid holdup per unit void volume
dynamic holdup of liquid
static holdup of liquid
mass-transfer coemcients
distance between measuring points
characteristic length
packed hed height
distance between injection and detection points
bubbling height
mass of tracer
defined by Eq. (3-70)
number of stages
quantity defined by Eg. (3-61)
Peclet number for the dynamic liquid phase (V d Lp/E d )
crossflow ratio
Peclet number (V Lc/Ez)
fraction of fluid strcam entering a perfectly mixed region
main flow rate
recycle rate
film Reynolds number
Laplace transform parameter
time
defined hy Eq. (3-641
peak time
defined by Eq. (3-65)
initial break through time of the tracer
mean residence time
mean delay time
residence time of a single film
residence time in a single mixer
mean residence time of liquid
mean fluid film velocity
impulse response
interstitial fluid velocity
velocity of the dynamic liquid phase
defined by Eqs. (3-17) and (3-25)
defined by Eqs. (3-18) and (3-26)
defined by Eqs. (3-19) and (3-27)
volume
axial distance
fraction of feed instantaneously bypassing a stage
first derivative of output signal
fraction of stage actively back mixed
102 GAS LIQUID SOUD RfArTOR DFSIGN
G reek letters
exchange parameter
fi fractional stagnant volume of a mixing tank
b(t) Dirac b function
E void fraction
p dcnsity
(J second moment
(J dimensionless variance of the RTD
l n mber of surfaces encountered by a liquid phase; also total number
of delays experienced by a molecule
0' dummy variable
(J dimensionless time
), dummy variable
Jt viscosity
Jt; first moment
L holding time
<p fraction of Ouid In plug flow
<p fraction of agitated tluid
Subscripts
G gas phase
L liquid phase
position
REFERENCES
I. Abbi. v. P. and D. j Gunn, Truns.lnst. Chern. Eng., vol. 54. p. 225, 1976.
2. Anderssen. A. S.. and E. T. White, Cht'm. Eng. Sci.. vol. 25, p. 1015.1970.
3. Anderson. K. L.. O. M. Stokke, and R. E. Gilbert, l&EC Fund.. vol. 5, no. 3, p. 430. 1966.
4. Aris, R.. Pmc. Rl'Y. Sue. (London). vol. A235. p. 67. 1956.
5. Aris. R.. Chern. Eng. Sci., vol. 4, p. 266. 1959.
6. Babcock, R. En D. W. Green, and R. H Perry, A/ChE J.. vol. 12. no. 5, p. 922, 1966.
7. Baird, M. H.l., personal communication. [977.
8. Bang, V. V., and A. Cholelle, Can J. Chern. Eny., vol. 51, p. 149. 1973.
9. Bennett. A.. and F. Goodridge. Trun . 11l. t. Chen!. Enl/.. vol. 48, p. 232. 1970.
10. Blschotf, K. 8.. AlChE J., vol. 14. no. 5, p. 820. 1968.
II BIschoff. K. B., llld. E'lg. Cltem., vol. 58, no. II, p. 18,1966
12. Bischof1 K. B., and O. levenspiel, Chem. Eng. Sci., vol. 17, p. 245,1962.
13 Briuan. M. I., and E. T. Woodburn. AlChE J., vol. 12, p. 541, 1%6.
14. Butfham, B. A., Chen!. EIIg. J., vol. 2, p. 71, [971.
15. Butfham. B. A., and L. G. Gibilaro, Chem. Eng. J., vol. 1, no. I, p. 31. 1970.
16. Butfham. 8. A.. L. G. Gibilaro, and M. N Rathor, AlCltE J.. vol. [6. no. 2, p. 218. 1970.
17. Butt, J. 8., AlChE J.. vol. 8, no. , p. 553. 1962.
18. Charpentier, J. C, M. Bakos, and P. LeGof1 PmceedillYs of Ihe 2nd Congress 011 Applied
Physical CherniSlry, Veszprem. Hungary, 1971, vol. 2, p. 31,21-02.
19. Charpentier, J. C. and M. Favler, AlChE J.. vol. 21. no. 6, p. 1213,1975.
20. Chen, B. H., Con. J. Cht'rn. Eny.. vol. SO, p. 436, 1972.
RE. IUEN("E-TIME U1STRIHUTIUN Al'>1J MODELS HJR MACRUMIXING IN fHF RFArTOItS 103
I.
f.
21. Chen. B. H.. l&f(' PI"OCl.'x. DesIgn Del'.. vol. 15. no. I. p. 20.1976.
22. Cholclte. A., and L Cloutier, Can. J. Chem. £ny., vol. 37, p. 105, 1959.
23. Clemenls, W. C Jr., Chern. Eng. S,.i., vol. 24, p. 957, 1969.
24. Co, Pham. and R. Ribaud. Call. J. Chen'!. En!}., vol. 19, p. 727, 1971.
25. Converse. A. 0., A/('hE J., vol. b, no. 2, p. 344, [960.
26. Danckwerts, P. V.. and R. A. M. Wilson. J. Fillid Afecl1.. vol. 16. p. 412.1963.
27. Davidson. J. F., TrutlS. Inst. Chem. EnlJ.. vol. 37, p. 131. 1959.
28. Deans, H A., Soc. Petrol. £ng. J.. vol.], p. 49.1963.
29. Deans, H. A.. and L Lapidus, AlChE J.. parts 1 and 11, vol. 6, no. 4, p. 656, 1960.
30. Deckwer, W. D., Chem. Eny. J., vol. 8, p. I3S, [974.
31. Deckwer. W. D., R. Burckhart, d.nd G. Zoll. Chem. Eng. Sci.. vol. 29. p. 2177. 1974.
32. Deckwer, W. D., If. Graeser, H. Langemann, and Y. Sapemen, ChenL £ng. Sci.. voL 28. p. 1223,
1973.
33. Denbigh, K. G., N. Dombrowski, A. J. Kisiel, and E. R. Place, Chem. £n9. Sri., voL 17, p. 573,
1962.
34. Domnesteanu. R.. ClI(?11. Eng. Sci., vol. 28. p. 2260, 1973.
35. Furzer,!. A., and R. W. Michell, AIChE J., vol. 16, no. 3. p. 380, 1970.
36. GibiJaro.L. G.. Clwm. f;ny. Sci., vol. 26. p. 299.1971.
37. Gihi[aro. 1.. G., H. W. Kropholler, and D. J. Spikins, Chern. Eng. Sci., vol. 22. p. 517. 1967.
3R. Gibilaro, L. G., amI F P. Lees, Chem. Eng. Sci., vol. 24, p. 85, 1%9.
39. Goldfish, L H.. J. A. Kontsky, and R. J. Ad[er, Chem. Enq. Sci., vol. 20. p. 1011, 1965.
40. Gunn, D. J., Chern. Eng. Sci.. vol. 2S. p. 56, 1970.
41. Ham, A.. and H. S. Cae, Chern. Met. Eflg.. voL 19, p. 663.1918.
42. Harrisun, D., M. Lane. and D. J. Walne, Trans. IllS/. Chem. Eng., vol. 40, p. 214, 1962.
43. Hochman. J. M., and E. Hfron, I&EC Fund., vol. 8, no. I, p. 63, 1969.
44. Hochman, J. M., and.l. R. McCord, Chern. En!J. Sri., vol. 25, p. 97, 1970.
45. Hoogendoorn, C. J., and.l. Lips. Can. J. Chem. £ng., vol. 43, p. 125, 1965.
46. Hopkins. M. J.. A. J. Sheppard. and P. Eisenklam. Chern. Eng. Sci.. vol. 24. p. 1131. 1969.
47. Imafuku, K.. T. Y. Wang, K. Koide, and H. Kubota, J. Chern. Eng. Japan, vol. I, no. 2, p. 153,
1968.
48. Johnson, J. L. LT. Fan. and Y. S. Wu, l&f(' Proces. Design Dev., vol. 10, no. 4, p. 425, 1971.
49. Kato, Y., A N"ishiwaki, T. fukuda, and S. Tanaka, J. Chern. Eng. Japan, voL 5, no. 2, p. 112,
1972.
50. Kim. B. 11.1., and T. R. Harris. Chern. 1':l1g. Sri., vol. 28, p. 1653, lQ73.
51. Koslanyan, A. E., Theoret. rOllndllriml Chern. Enfl., vol. 8, p. R61, 1974
52. Kramers, H., and G. Alberda, Chern. El1g. Sci., vol. 2, p. 173, 1958.
51 Kunugita. E., T. Otake, and T. Vamanishi, J. Chern. Eng. Japan. vol 26. p. 800. 1962.
54. Lapidus. L.. Ind. Eng. ('hem.. vol. 49. p. 1000. 1957.
55. Lalinen, G. A., and F. D. Stockton, AIChE National Meel1ng, St. Paul, Minn., Sept., 1969.
56. Levenspiel, 0.. (,hernicQ/ ReQc,ion Engineering, John Wiley & Sons, Inc.. New York. 1972.
57. Levenspiel. 0., B. W. Lai. and C. Y. Chatlynne, Chern. £ng. Sci., vol. 25. p. 1611. 1970.
58. Levenspiel, 0., and W. K. Smith, Chern. Eng. Sci., vol. 6, p. 227, 1957.
59. LevenspieJ, 0., and J. C. R. Turner, Chern. Eng. Sei., vol. 25, p. 1605, 1970.
60. Mah, R. S. H., Chern. Eng. Sci., vol. 26, p. 201,1971.
61. Mashe[kar. R A.. Brit. Chern. Enq.. vol. 15, no. 10. p. 1297, [970.
62. Matsuura, A., T. Akehata, and T. Shirai, J. Chern. Eng. Japan, vol. 9, no. 4, p. 294.1976.
63. Matsuura, A., T Akehata, and T. ShIrai, Kllgllkll KOl/akll Rlmhllnsl.II, vol. 2. p. 98,1976.
64. Meck[enhurgh. J. C. TrOlls. ll1st. ('hem. EII!/., vol. 52. p. 180. 1974.
65. Michell, R. W.. PhD ThesIs, UniversllY of Sydney. Australia., 1972.
66. Michell. R. W..and J. A. Furzer. Trll'ls.ll1st. Chern. fng.. \'01. SO, p. 334,1972.
67. Michell, R. W.. and I. A. Furzer, Chern. Ell!}. J., vol. 4, p. 52,1972.
68. Michelsen. M L., and K. OSlergaard. Ch('m. Eny. Sci.. vol. 25, p. 583, 1970.
69. Michelsen. M. L.. and K. Ostergaard. Chen!. Ell!!. J., vol. 2. p. 37, 1970.
70. MiDoux, N., and J. C. Charpentier, Chern. Eny. J., vol. 4, p. 287, 1972.
:
,
s:
<
t
f.
,
!!
104 GAS-LIQUID-SOLID REACTOR DESIGN
71. Miyauchi, T, Nikkllt! Kogyo Shinbllnsha, Tokyo, 1960.
72. Miyauchi, T, and T Vermeulen, I&EC Fllnd.. vol. 2. p.304, 1963.
73. Nishiwaki, A., and Y. Kato, Can. J. Chern. Eny., vol. 52, p. 276,1974.
74. Nishiwaki, A., T. Kago, and Y Kato, Kagaku Kogaku, vol. 37, p. 966,1973.
75. Nishiwaki, A.. and Y. Kato, Kagakll Kogaku, vol. 36, p. I J 12, 1972.
76. Ohkl, Y., and H. Inoue, Chem. Eng. Sci., vol. 25, p. I, 1970.
77. Onda, K.. H. Takeuchi, and Y. Koyama, Kayakll Koyakll. vol. 31, p. 126. 1967.
78. Ostergaard, K., Adv. Chern. Eng., vol. 7, p. 71, 1968-
79. Ostergaard, K., and M. L. Michelsen, Chem. Eng. J., vol. 2, p. 37, 1970.
80. Parimi, K., and T. R. Harris, Can. J. Chern. Eng., vol. 53, p. 175, 1975.
81. Pavlica, R. T., and J, H. Olson, Ind. Eng. Chem., vol. 62, no. 12, p. 45, 1970.
82. Pharo. Q. T., and R. B. Keey, Chern. Eng. Sci.. vol. 32, p. 786. 1977.
83. Polk, E. M., and W. C. Clements, Vanderhilt Univ. Tech. Report No. 10, 1966.
84. Raghuraman, J., and Y. B. G. Varma, Chem. Eng. SCi., vol. 28, p. 585, 1973.
85. Rao, V. G., and Y. B. G. Varma, AIChE J., vol. 22, no. 3, p. 6[2,1976.
86. Ross, L D., Chern. Eng. Progr., vol. 61, no. 10, p. 77,1965.
87. Rothfield, L. B.. and J. L. Ra[ph. AIChE J., vol. 9. no. 6, p. 852. 1963.
88- Ruszkay, R. D., Engineering Science Dissertation, Department of Chemical Engineering,
Columbia University, New York, 1962.
89. Sachova, J., and Z. Sterbacek, Chern. Enq. J., vol. 6, p. 195, 1973.
90. Saida, T., Mol., vol. 6, no. 3, p. 57, [968-
91. Sater, V. E., and 0 Levenspiel, I&EC Fund., vol. 5, p. 86, 1966.
92. Schiesser, W. E., and L. Lapidus, AIChE J., vol. 7, no. I, p. Ib3, 1961.
93. Schmalzer. D. K., and H E. Hoelscher, A1ChE J., vol. 17, no. I. p. 104, [971.
94. Schugerl, K., Proceedings of an lnlernational Syrnposium on Fluidization, Netherland University
Press. Amsterdam, p. 782,1967.
95. Schwartz, J. G., and G. W. Roberts, I&EC Process DesiO,n Dev., vol. [2, p. 262,1973.
96. Sherwood, T K., and F. J. Jenny, Ind. 1:ong. Chem., vol. 27, p. 265, 1973.
97. Shestopalov, V. V., V. V. Kagarov. and L. I. B[yakhaman, Int. Chem. Eng., vol. 4, no. 1, p. 17,
1964.
98. Shulman, H. 1... C. F. Ulrich, A. Z. Proulx, and 1. O. Zimmerman, AIChE J., vol. I, p. 253,
1955.
99. S[eicher, C. A., AICh£ J., vol. 6, p. 529, 1960.
100. Stephens, G. K., PhD Thesis. University of Birmingham. England. 1970.
101. Stregel, G. J., and Y. T Shah, Can. J. Chern. Eng., vol. 55, p. 3, [977.
102. Stiegel, G. J., and Y. T. Shah, I&EC Process Design Del'., vol. 16. no. I, p. 37. 1977.
103. Tanoka, Y, and '- Inoue, Int. Chern. Eng., vol. 16, no. 3, p. 479, 1976.
104. Turner, J. C. R., Chern. Eng. Sci., vol. 26, p. 549, 1971.
105. Van der Laan, E. Th., Chem. Eng. Sci., vol. 7, p. 187, 1958.
106. Van Swaaij, W. P. M., J. C. Charpentier, and J. Villermaux, Chern. £l1g. Sci., vol. 24, p. 1083,
1969.
107. Vergnes, F., Chem. Eng. Sci., vol. 31, p. 88, 1976.
108. Villermaux, 1., and W. P. M. Van Swaaij, Chem. Eng. Sci., vol. 24, p. 1097, 1969.
109. Watson, J. S., and L. McNeese, l&EC Process Design Dev., vol. 11, no. 1, p. 120, 1972.
110. Wen, C. Y., and L. T. Fan, Models for Flow Syslerns and Chernical Reacwrs, Chemical Processmg
and Engineering Monograph Series, Marcel Dekker. Inc., New York. 1975.
111. Yagi, S., and T. Miyauchi, Kagakll Kogaku, vol. 19, p. 507, J 955.
CHAPTER
FOUR
MATHEMATICAL MODELS FOR
GAS-LIQCID--SOLID REACTORS
In Chap. 2, the gas liquid solid reaction process based on the film theory was
analyzed. In this chapter, some of the reported models for three-phase reactors
are presented. Some models consider only the effectiveness of contact between
the liquid and solid. while others consider the roles of the gas-liquid and liquid -
solid mass-transfer resistances in three-phase gas-liquid-solid reactors. A large
number of models consider the role of the R TO on the reactor performance. Both
isothermal and non-isothermal models are considered here.
4-1 MODELS BASED ON EFFECTIVENESS OF CONTACT,
WITH NO EXTERNAL MASS-TRANSFER RESISTANCES
(MODELS FOR TRICKLE-BED REACTORS)
4-1-1 Plug-flow Model
When (a) there are no external mass-transfer resistances (such as gas -liquid,
liquid -solid, etc.), (b) catalysts are all effectively wetted, (c) there is no radial or
axial dispersion in the liquid phase, (d) a gaseous reactant takes part in the reac-
tion and its concentration in the liquid film is uniform and in excess, (e) reaction
occurs only at the liquid-solid interface, (f) no condensation or vaporization of
the reactant occurs, and (g) the heat effects are negligible, i.e., there is an isothermal
operation, then a differential balance on such an ideal plug-flow trickle-bed
reactor would give
dC k m (1 - f. ) lcm
-- -
d (LHS V)
k;" lcm
- rLH SV) '
o < 1,
(4-1)
105
106 GAS-LiQUID-SOUV RI::ACTOR VEStGN
where C is the concentration of the reactant, k", the intrinsic rate whose unit
depends on the order of the reaction m. For m = I. k 1 is in cubic centimeters of
liquid per cubic centimeter of catalyst pellet volume per hour. 1 is the catalyst
effectiveness factor, c is the void fraction in the catalyst bed, is the dimension-
less distance, and LHS V is the liquid hourly space velocity (in cubic centimeters
of liquid per cubic centimeter of catalyst pellet volume per hour). Normally, for
hydro processing operations, the values of m = 1 and 2 are relevant. For m = I,
Eq. (4- J ) can be integrated as
In ; k't l
Co LHSV'
(4-2)
where k'i is in cubic centimeters of liquid per cubic centimeters of reactor volume
per hour. For 111 = 2,
Co
C.
1
k2 1
LHSV'
(4-3)
1 1
In the above equation, C's are assumed to be in grams per cubic centimeter. Any
other convenient units for C can also be chosen. The above equations can be
used to correlate the data obtained in large-scale isothermal reactors such as
hydrodesulfurization, hydrodenitrogenation reactors, etc.
4-1-2 Holdup Model
In pilot-scale hydroprocessing trickle-bed reactors, low liquid flow rates make the
catalyst effectiveness dependent upon the liquid flow rate. Henry and GilbertI:;
proposed that this may be due to insufficient liquid holdup in the reactor. For
the first-order reaction, they modified Eq. (4-1) as
In C; = . kl lhL
Co (LHSV)'
(4-4)
where h L is the liquid holdup. Based on the liquid holdup relationship proposed
by Satterfield et al.,42 namely,
h L = .B[ GLdpj Jid 1!3l d gpUJi r tlJ,
(4-5)
where p is a constant, d p is the particle diameter. g is the gravitational
acceleration. PL and JiL are the liquid density and viscosity, respectively, and G L
is the mass flux of liquid, they derived a relationship
C.
In C: :x. (L)I,3(LHSV) 2 1 3(d p ) - 2/3(vd'3,
where 1 .is taken as unity, and L is the length of the catalyst bed. The above
relation is valid for 10 < ReL < 600.
As shown in Fig. 4-1, Henry and Gilberti:; argued that a certain minimum
amount ofIiquid holdup is required for 100 percent catalyst utilization. According
(4-6)
MATHEMATICAL MODELS FOR GAS-LIQUID-SOLID REACTORS 107
Liquid holdup
t Cas
phase
holdup
/.-----
/
- 100 pcrcent
catalysl
utilization
. (Fr L / Re L)1/3
Figure 4-1 Effect of fluid dynamIcs on holdup (ojier lIenr.\" olld Cilberr' 'I.
to Eq. (4-5), the liquid holdup value depends upon (Fr L /Red/ 3 , where FrL =
GUpf.dpyand ReL = GLdp/llL. The critical value of (FrL/Re..)t/3, where 100 percent
catalyst utilization first occurs has not been determined. Henry and Gilbert t5
demonstrated that some of the hydrodenitrogenation, hydrodesulfurization, and
hydrocrack1ng data show the dependence of In (CdC o ) on L. LHS and d p , as
predicted by (4-6). They also noted that the change in the order of the reaction
at high conversions, obscrved in some denitrogenation and desulfurization
reactions, can be accounted for by the liquid holdup effect. They showed that
(4-6) can correlate the data for a large range of conversion.
4-1-3 Effective Catalyst Wetting Model
Mears 24 suggested that the fact that (4-6) correlated the data was fortuitous. He
questioned the validity of Eq. (4-5) for the packed-bed trickle-bed reactor, since
this equation was derived from the data taken for the flow over a string of
spheres. He argued that the dependence of reactor performance on velocity in
pilot-scale reactors is due to incomplete catalyst wetting at low flow rates. For a
first-order reaction. he modified Eq. (4-4) as
dC
d
- k't l Aerr C
---
(LHSV) ,
(4-7)
where A eff is the ratio of the wetted area to the actual surface area of packing.
Using the wetted-area correlation of Puranik and Vogelpohl, J9 namely,
( CI ) 0.206
A = 1 0 5 ReO.047 WeO. IJ5
err . L l ,
aL
(4-8)
where WeL = G dp/CIl.lh is the Weber number. CIL is the surface tension of the
108 GAS-UQtJID- SOUD REACTOR DESIGN
liquid, and CIe is the critical value of the surface tension for the given packing
(at this critical value, the contact angle is zero - i.e., the liquid spreads for values
of CIL below CIe) and combining Eqs. (4-7) and (4-8) and integrating, he derived the
relation
In i (X (L)O.32(LHS V)-O.68(dp)O.18(\'d-o.05(CIc/CIdo.21 f](d p )' (4-9)
o
This relation, although conceptually different, is mathematically similar in pre-
dicting the dependence of In (C/C o ) on Land LHS V, However, it differs from the
holdup model in predicting the effects of d p , IiL, and CIL on In (Co/Co).
The commercial hydro processing reactors operate under near-plug-flow
conditions. Nearly complete wetting of catalyst particles should be obtained as
mass velocities typical of commercial reactors are approached. At A crf > 0.6, the
experimental Am falls below the one predicted by Eq, (4-8), suggesting an
asymptotic approach to complete wetting. Mears suggested that Eq. (4-9) cannot
be used as a precise basis for scaleup above a mass velocity of approximately
500 g h I cm - 2. For scaleup purposes. \--Iears indicatcd the use of the correlation
of Onda et at. 33 for ACff' namely,
Aerr = I - exp f -1.36 Ga .05 We .2(CIc/CIdo.75}. (4-10)
The predictions of this correlation are quite close to those of Eq. (4-8) over the
range 50 < G L < 500 g h- t em 2. Because WeL is proportional to ct, Eq. (4-10)
shows that Aerr approaches unity at high mass velocities. Combining Eq. (4-7)
with Eq. (4-10) and integrating, one obtains
C k'l l
In = - [1 - exp { y(L)0.4(LHSV)O.4}],
Co (LHSV)
(4-11 )
in which the dependence on viscosity, surface tension, density, and particle diameter
have been factored into the coefficient y.
It should be noted that the fraction effectively wetted will also be a function
of the initial distribution of liquid in the reactor and its length-to-diameter ratio,
particularly in the case of commercial reactors. 15.40 The development given above
assumes that a uniform initial distribution is provided.
4-1-4 Experimental Verifications of Holdup and Effective Catalyst-
Wetting Models
The dependence of In (CdCo) on liquid velocity was verified by Skripek and
Ballard 50 for VGO desulfurization at 45 < G L < 150 g h - I cm 2. In a series of
articles, Paraskos et al.,37 Montagna and Shah,29 and Montagna et at. 30 evaluated
the applicability of holdup and incomplete catalyst-wetting models to the de-
sulfurization, demetalization, and denitrogenation reactions for a variety of
residue and gas oils. Paraskos et al. 31 showed that although log- log plots of
In (C/C o ) versus l/LHSV for the desulfurization, demetalization (i.e., nickel and
MATHEMATICAL MODELS FOR GAS-LIQUID-SOLID REArTORS 109
vanadium removal reactions), and denitrogenation reactions for 53 percent
reduced Kuwait atmospheric tower bottoms (KA TB) gave straight-line plots, the
slopes of these plots varied from 0.532 to 0.922 and were slightly dependent on
the temperature. These results are shown in Fig. 4-2. Paraskos et al. 3 7 also showed
that log-log plots ofln (CJC o ) versus L for the desulfurization and denitrogenation
reactions of various types of gas oils also were straight lines. However, the slopes
ofthese plots varied from 0.0498 through 0.555. These results are shown in Fig. 4-3.
Montagna and Shah 29 similarly showed that for sulfur, vanadium, nickel, carbon
residue, nitrogen, and pentane insolubles removal reactions for 36 percent KA TB,
log-log plots of In (Cr/C o ) versus L gave almost identical slopes of approximately
0.2. These results are shown in Fig. 4-4. More interestingly, Montagna and
Shah 29 showed that, for fine catalyst SIZe, the conversion for desulfurization
reaction was essentially independent of the catalyst bed-length.
All these results indicate that although. as predicted by both tbe holdup and
the effective catalyst-wetting models. the conversions in pilot-scale hydro process-
ing reactors depend upon the liquid flow rate, and log-log plots of In (C/C o )
versus either llLHSV or L are straight lines, the slopes of these plots depend
upon the nature of the feed, temperature. and the catalyst size.
Ofthe holdup and the effective catalyst-wetting models, the latter one appears
to be physically more realistic. As indicated earlier, the two models show a
f,.)0 5.0
q
.5
° 1.0
G
:E 0.5
W.O
1.0.
0.1
0.5 1.0
I/LHSV(h)
(a)
10.0
- l Slope = 0.532
5.0 Temperature = 394 °c
t- I>./J
!i Slope = 0.619
.5 t:r
TempemlUre ......../Lf"
=416 DC 1>./
1.0 '
O.t 0.5 1.0 5.0 10.0
I/LSHV (h)
(b)
6.0
2.0
Slope =0.747 L>./.
Temperature """,/
=416°C Y'"
Temperature
= 394°C
0.2
0.1
0.5 1.0
I/LHSV (h)
(c)
5.0 10.0
t,;}-
:5
1.0
Slope = 0.852
Slope=0.n2 L>.'
Temperature /
=416°C"\..
1>.71>. Temperature
. = 394 °c
0.4
0.1
0,5 1.0
I/LHSV (h)
(d)
5.0 10.0
Figure 4-2 First-order kinetic plots based on the holdup model for removal reactions (after Parv.,ktJ..
et al. J1 ). (a) the vanadium removal reaction, (b) the sulfur removal reaction, (cJ the nitrogen removal
reaction., (d) the nickel removal reaction.
110 GAS -LIQUID SOLID REACTOR DESIGN
somewhat different dependence of In (C;/C) on the catalyst size. Recently,
Montagna et al. 30 showed that for hydrodesulfuri7ation of 22 percent reduced
Kuwait vacuum tower bottoms and 36 percent reduced Kuwait atmospheric
tower bottoms, the experimental data are better correlated by an effective catalyst
wetting model than the holdup model.
4-1-5 Bondi Correlation
Bondi 2 developed an empirical relationship between the apparent rate constant
ki dpp and the intrinsic rate Constant k'] as
1 ('L
k -- k' t - di l l .
'I "PI'
(4-12)
3.0
sf 2.0 Slope'" 0.0498
g- Slope = O. I 11 .d
..s e
-:= - D -
Slope = 0.0876
1.0
10 20 30 40 50 60 70 8090 100
L (em)
(a)
5
D
,...
4 o Slope = 0.555
,...,.../ Slope'" 0.351
3
,...
S- o /,...
E ........0 .
. .
2
Slope = 0.0518
1.0
[0 20 30 40 50 60 70 80:90, I 00
L (em)
(b)
Figure 4-3 Effects of calulyst bed length on Ihe desulfuriLation (a) and denitrogenation Ihl of gas oi[s-
firsl-order kinetIc plots based on the holdup model (tJ(ter Paraskos etllU'j.
O. Vacuum gas oil, LHSJ/ = [, temperature = 344T; e, vacuum gas oil, LHSJ/ = 2.
temperature = 360°C; 0, Kuwait light gas oil, LHSV = 2, temperature = 344°C.
MA THEMATIC AL MODELS FOR GAS. [[(}UID SOLID REACTORS 111
10
I
s
.------;"' V
.J - .. - Ni
---
___. .__ __ ---CR
_ !::::::.-- N
- .--- ; PI
.....
po
I;j- 1.0......
:5
0.1
I
10
10 2
10 3
L (em)
Figure 4-4 Correlations oflhe experimental data for 36 percent KA TB by the effective catalyst-wetting
and holdup models (c!(ier MOl1ta JnCl and Shah 2 "\.
.. Sulfur; _, vanadium; .... nickel; 0, carbon residue;.. nitrogen; "1', pentane insolubles.
for correlating the pilot-scale data for the hydrodesulfurization of oils, hydro-
genation of glucose. and the reaction between formaldehyde and acetylene to
form butynediol. For these systems {J varied from 0.5 through 0.7 with a median
value of about 2/3. He also noted that the conversion for these reactions was
somewhat dependent on the gas flow rate (the conversion im.:reased with the gas
rate). This effect can be accounted for by multiplying the term Gt by (PG U od h
(PG is the gas density and U OG the superficial gas mass flux), where the ]east-
squares treatment of the data indicated h to be varying between 0.22 and 0.5.
Bondi 2 also pointed out that the effect of a variation in the gas flow rate on
the conversIOn may not be solely a physical effect, because the variation in the
gas flow may also affect the partial pressure of the gaseous reacting species (such
as Hz or HzS in the case of hydrodesulfurizationl. This correlation directly cor-
relates the effectiveness of contact with the ratio k'l "PP/k'I, which is proportional
to the 0.5 through 0.7 power of the liquid velocity at low liquid flow rate, but the
exponent drops sharply at high liquid flow rates.
4-1-6 Axial Dispersion Model
The data-correlation model described above do not take into account the axial
dispersion effect on the performance of the reactor. ]n small catalyst beds,
particularly when they are packed with large catalysts and operated at low liquid
flow rates, the axial dispersion may have a significant effect on the reactor
performance. Furthermore, Hochman and Effron I 7 and others have shown that
112 GAS -LIQUID -SOLID REACTOR DESIGN
axial dispersion in tbe liquid phase under trickle-flow conditions is more significant
than in single-phase reactors.
Mears 23 . 24 showed that the catalyst bed-length effect observed during de-
nitrogenation of gas oils in pilot-scale reactors can be correlated on the basis of
an axial dispersion effect on the reactor performance. Montagna and Shah 29
showed that the bed-length effect observed in desulfurization reaction with 22
percent KVTB and 36 percent KATB (see Fig. 4-4) can also be explained on the
basis of an axial dispersion effect on the reactor performance.
Mears 23 presented a criterion for the minimum L/d p required to hold the
isothermal reactor length within 5 percent of that needed for plug flow. He
suggested that, if
20m C j
L/d p > =-In C'
Pel 0
(4-13)
the n the axial dispersion effect on the reactor performance will be negligible. Here,
PeL is the Peclet (or Bodenstein) number, based on the particle diameter, and In
is the order ofthe reaction. This criterion was verified by Mears 23 . 24 and Montagna
and Shah. 29
It is difficult to ascertain whether the poor performance observed in pilot-scale
trickle-bed reactors is due either to ineffective catalyst wetting or to the axial
dispersion effects, because both these effects are physically realistic and both occur
under similar operating conditions (i.e., low liquid flow, large catalyst size, and
shorter beds). It should be noted, however, that the criterion for removing the
axial dispersion effect is available. A similar criterion for removing ineffective
catalyst wetting is, however, presently not available.
4-2 REACTOR PERFORMANCE BASED ON RESIDENCE-TI
DISTRIBUTION
Another approach to evaluate the performance of a trickle-bed reactor (particu-
larlya pilot-scale reactor) is to incorporate the RTD with intrinsic kinetics. Since
the liquid holdup, catalyst wetting, or the degree ofaxia] dispersion can all be
obtained from the RTD, this approach is not exclusive ofthe ones described above.
For a first-order reaction, if the residence-time distribution E(t) and the degree of
conversion are known, they can both be related by an expression
C J .,.,
- = e K', E(t)dt.
C i 0
(4-14)
Here, E(t) de is the fraction of the exit stream that was present in the reactor for
a residence time between rand r + de. For a plug flow, the above equation reduces
to
CO -K',
-=e
c; .
(4-15)
MATHEMATICAL MODRS FOR GAS LIQUID SOLID REACTORS 113
Here, K' = k't/h dL , where h dL is the dynamic liquid holdup in the reactor. h dL is
assumed to be constant along the length of thc reactor. The reactor efficiency can
be defined as
o = (tp/f m ) x 100
( 4-16)
when t m , the mean residence time in the reactor, is obtained from the relation
t m = t'" tE(t) dt.
(4-17)
The dynamic liquid holdup h dL can be obtained from the mean residence time,
liquid flow QL, and the reactor volume V as h dL = tmQL/J, This approach for
correlating the performances of pilot-scale hydrodesulfurization reactors was
evaluated by Murphree et at., 3t Cecil et al., 5 and Ross. 40 It should be noted that
the efficiency Eo is very sensitive to the percentage conversion at high conversion
levels, where a small change in Eo can significantly change the level of conversion.
There are two problems in this method for correlating the pilot-scale trickle-
bed reactor data. First, the method is strictly valid only for first-order kinetics.
For any other types of kinetics, the conversion is not only a function of RTD but
also ofthe degree of mixedness (micromixing) or segregation of fluid elements as
they pass through the reactor. The true degree of micromixing in a real reactor
cannot be determined, but for a given RTD, limiting bounds on performance for
the two extreme cases of maximum mixedness and complete segregation can be
determined. Second. in Eqs. (4-14) and (4-17), the desired Eft) is for the liquid
external to the catalyst particles, but, in real reactors, the liquid holdup in the
pores contributes to the RTD in the form of excessive tailing. which makes the
calculation of t m inaccurate.]]
4-3 MODEL WHEN REACT ANT PRESENT IN" BOTH LIQUID
A D VAPOR PHASES
The models described above assume that the reaction occurs only in the liquid
phase. In some cases, such as isomerization of cyclopropane to propylene on a
silica. alumina catalyst, 43 reduction of crotonaldehyde over a palladium catalyst,45
and hydration of olefins to alcohols over tungsten oxide,58 the reactions could
occur in the gas as well as in the liquid phases.
If the concentrations of the stoichiometrically-limiting reactant in the two
phases are in equilibrium and if the chemical potential is the driving force, then,
from thermodynamics, it is clear that the reaction rate is unaffected by the nature
of the phase with which the solid is in contact, provided that no mass- and heat-
transfer gradients exist and no blockage of the catalyst sites by the impurities
occurs. However, the competitive adsorption of impurities in the liquid, even if
these are inert to reaction, can markedly affect catalytic behavior. _
Satterfield 4t showed that, if the reactant is present in both phases under
]]4 GAS -LIQUID .SOJ In REACTOR DESIGl\
equilibrium conditions, then, for a first-order reaction with an effectiveness factor
of unity, the following relation is valid for the liquid phase:
In i = Vk'l _
CO LQL + QG(BVL/i;G)J
(4-1 R)
Here, V is the volume of the reactor, QG and QL are the gas and liquid flow
rates, B is the vapor-liquid equilibrium constant (B - y/x, where y and x are mole
fractions in vapor and liquid phase, respectively), and VL and vG are the molar
volumes ofthe liquid and gas phases. respectively, at reactor conditions. Similarly,
for the gas phase, the following relation 41 can be derived:
Yi Vk G
In - = - - .
Yo [QG + QdvG/Btid]'
(4-19)
where kG is measured in cubic centimeters of gas per cubic centimerer of reactor
volume per hour and
k't/k G = BVL/VG.
( 4-20)
Several interesting features of the above simple relationships are noteworthy.
If an inert liquid phase is introduced into an all-gas-phase differential reactor,
keeping the inlet gas-phase composition constant. the reaction rate would, in
general, be distributed between gas and liquid phases; thus reducing the overall
effective concentration of the reactant. In the limiting case, if the feed liquid is
saturated with the reactant, the reaction rate will be unaffccted by the introduction
of liquid. In an integral reactor, the overall reaction rate (as a space-time yield)
would increase if the feed liquid is saturated with the reactant. The conversion is
always decreased by the introduction of liquid because of the contribution of the
term QdvG/Bvd in the denominator of Eq. (4-19).
If the intraparticle resistance is important. then the introduction of inert liquid
will further reduce the overall effective reaction rate, because the catalyst pores
filled with liquid are more likely to cause a diffusion-limitation than an all-gas-
phase reaction under similar conditions.
The introduction of an inert liquid may have an advantage in equilibrium-
controlled reversible reactions. If the product is selectively more soluble in the
liquid than the reactant, then the composition of the reacting mixture shifts from
the equilibrium composition and better conversions are obtained. Zabor et al. 58
have shown this to be the case during equilibrium conversion of propylene to
isopropanol in the presence of an excess of water and tungsten oxide catalyst.
Isopropanol is selectively more soluble in water than propylene, causing reduction
of product concentration at the catalyst surface and resulting in better conversions
of propylene.
It should also be noted that in some reactions, such as Fischer-Tropsch
reactions, an inert liquid is added to absorb the large amount of heat generated
by the reaction. Here, an addition of inert liquid normally reduces conversion, but
better temperature comrol is obtained.
MATHEMATICAl MODELe; FOR GAS LlQUID-SOUD REACTORS 115
4-4 MODELS FOR NONISOTHERMAL TRICKLE-BED
REACTORS
4-4-1 Axial Dispersion Model for Adiabatic Reactors
Large-scale hydroprocessing trickle-hed reactorf, are normally considered to
operate under adiabatic conditions because energy losses from the reactor are
usually negligible compared to the energy generated by the reaction. Some
examples of such operations are residue hydrodesulfurization, petroleum hydro-
genation or FCC feedstocks, hydrodealkylation, hydrocracking, and lube 0[1
hydrotreating. The pilot-scale simulation of such reactors requires the knowledge
of axial dispersion effects on the reactor perf<lfmance. An axial dispersion model
for such reactors has recently been outlined by Shah and Paraskos. 4 7 They have
shown that the critical Peelet number for elimination of the axial dispersion effect
is a function of the heat parameter {J' as well as rate constant R:". Some typical
results are shown in Figs. 4-5 and 4-6. The parameters {J' and R:" in these figures
are defined as
{)' = (EjRgT;)(AH.C,/T,PLC PL ,,-),
"- = 1 + VOGPGCpG/VOLPLCpL,
R;" = AoO £)!C?,- I exp ( - ) .
RgT;
Here Ao and E are the frequency factor and the activation energy for the reaction.
respectively, Rg is the universal gas constant. T; is the reactOr inlet temperature
PG and PL are the gas and liquid densities, respectively, C pG and C pL are the gas
and liquid heat capacities respectively, V OG and VOL are the superficial gas and
liquid velocities respectively, r. is the void fraction of the undiluted catalyst, f is
the space time, C; is the reactor inlet concentration of the reactant, m is the order
of the reaction, and AH, is the heat of reaction. The results shown in Figs. 4-5
(4-21)
(4-22)
(4-23)
100
10
'-'
3
0.\
1.0
[0
Figure 4-5 Pec.it as a function of R;
and (Y for the first-order reaction
(ailer Shah alill Paraskos 47 ).
R'
]
116 GAS LIQUID-SOLID REArTOR DESIGN
[0
1.0
10
Figure 4-6 Peen, as a funclion of R 2
and {J' for 1.5-order (_n_) and second-
order (- .J reactions (alier Shah and
ParllSk(l 4 7 ).
[00
'J
'"
10.
R'
2
and 4-6 indicate that for low values of R;", larger Peclet numbers are required to
eliminate axial dispersion in adiabatic reactors than in isothermal reactors. The
converse is true for larger values of R;".
Shah and Paraskos 47 applied their analysis to evaluate the importance of
axial dispersion on pilot scale (0) residue hydrodesulfurization, (b) gas-oil hydro-
cracking. and (e) shale-oil denitrogenation reactor performances. The calculations
indicated that the axial dispersion effect is less important in case (c) than in cases
(0) and (b). Under certain pilot-scale operations, axial dispersion effects could be
significant in cases (0) and (b).
4-4-2 Dynamics of Commercial Adiabatic Reactors with an Aging
Catalyst (Commercial Hydrodesulfurization Reactor with "Quench
Fluids ")
The commercial trickle-bed reactors, such as hydrodesulfurization and hydro-
cracking reactors, are often operated adiabatically. The temperature rise in such
reactors is often controlled by the additions of a Uquench fluid" (normally
hydrogen) at one or more positions along the length of the reactor. A schematic
of an adiabatic trickle-bed HDS reactor with a single quench is shown in Fig. 4-7.
As time progresses, the catalyst in the HDS reactor decays because of metal
(vanadium and nickel) and coke depositions. The deposition of these metals occurs
nonuniformly along the length of the reactor (more deposits occur near the reactor
inlet than at the reactor outlet). In normal plant operations, the catalyst activity
decline is counterbalanced by a rise in feed temperature, a reduction in the
amount of quench fluids fed to the reactor or both. so as to achieve the same
quality product. The process is terminated upon the attainment of a maximum
allowable temperature (MAT) anywhere in the reactor. The catalyst bed is then
regenerated. The time required to achieve the MATis often called the reactor
cycle life.
MATHEMATICAL MODELS FOR GAS -LIQUID-SOLID REACTORS 117
From a practical standpoint, it is essential to design and operate the reactor
in such a way that the maximum cycle life for the reactor is achieved while
minimizing the number of quenches required. This means that the quenching
position(s) and the variation of feed temperature with time must be optimized
to acbieve the maximum cycle life.
A model for an adiabatic HDS reactor (see Fig. 4-7) with a single quench
is given by Shah et al. 46 Under plug-flow conditions and assuming that there are
no external mass-transfer resistances, the governing material and energy-balance
equations are
dt/1s + R rA..e-e.l(l+IJI.I, = 0
d, s 'f' '/Iy;,
d'/'-
+ R-'t"'- e-.I'",!(t+IJ).L = 0
d m 'l-'m 'I'm,
(4-24)
(4-25)
where
C.
t/J. = C . '
..
Crn
t/1rn= c _. ,
ml
E-
-=
m Rg T; ,
. Es
{J'.=-,
RgT;
T-T
O=
T; ,
= Z/L.
Here C. and C m are sulfur and metal concentrations in the liquid phase, espect-
ively. The activation energies for metal- and sulfur-removal reactions are Em. and
E.. respectively, while T; is the reactor inlet temperature, Rg the universal gas
constant, Z the axial distance, L the reactor length, and 1: the space time (inverse
of weight hourly space velocity) within the reactor. Equations (4-24) and (4-25)
assume tbat both metal and sulfur removal can be approximated over a broad
temperature range by first-order reactions with respect to metal and sulfur
Oil Hydrogen
nn
no
=o
='I)
=1
Figure 4-7 Schematic diagram of an adiabatic
fixed-bed HDS reactor with a single quench
(ofrer Shah et 01. 46 ).
Oil Hydrogen
118 GAS-UQUID-----sOLIO REACTOR DEStGN
concentration. 37 Both parameters 1>. and f/Jrn as well as 1/1, and I/1rn are functions
of time as well as distance along the reactor. In Eqs. (4-24) and (4-25), however,
we assume that ('l/1dh (i = S,111) «(ll/1di'lT, so that, for all practical purposes, we
can neglect the terms iJl/1./i"lt and iJljJrn/Jt from Eqs. (4-24) and (4-25) and express
the material balances in terms of total differentials, as shown above. The activity
functions 4>. and f/Jm are dependent upon both coke and metal deposition. In
practice. however. they are found to be more strongly dependent (particularly
after a short on-stream time) upon the metal concentration of the catalyst. Shah
et a1.,4f> therefore. assumed both f/Jrn and </>, to be functions only of C rne . the metal
concentration of the catalyst. The functions <Pn,(Cmc) and f/J.(C me) were obtained
from aging data obtained in a pilot-scale reactor. It should be noted that f/Jm and
1>. are the ratios of the frequency factors for the metal- and sulfur-removal
reactions at any position Z and time t to their values at time t = O. Thus, at
t = 0, both CP. and <Pm are unity at all Z. For t > 0, 1>. and f/Jrn decrease as time
increases. Furthermore, at any t > 0, 1>, and <Pm for large Z are larger than ones
for the small Z (i.e., the front end of the reactor ages faster than the rear end)
The metal concentration in the catalyst bed, C me , is obtained from the differential
equation
aCme dC m
('1 dT .
(4-26)
Equations (4-24) through (4-26) are applied to both sections of the reactor
with the initial and boundary conditions, C me = 0 for all at t = O. I/1rn - I at
( = O. and 1/1. 1/1. , 1/Jrn = I/1m at = Jl, the dimensionless position of the quench
along the length of the reactor. It should be noted that there are no sharp
changes in I/1rn and I/1s at the point of quench addition because the quench is
considered to be a gas. This would not be the case if the quench were a liquid.
An energy balance on the reactor operating under adiabatic conditions and
assuming negligible feed vaporization is
dB = _ r' dl/1.
d( d '
(4-27)
where
r' = r = LiHrC,jUOLPL/(UOI_PLC"L -t UOGPGC"G)"T;
in Section I (see Fig. 4-7) of the reactor, and
r = r /(1 + Q),
Q = UqpqC pq/(UOLPLCpL + UOGPGC"G)
(4-28)
in Section II of the reactor. For simplicity. we assume C"I and C pG to be
essentially independent of the temperature. Equation (4-27) can be integrated to
obtain
0= r'(1 - 1/1.)
(4-29)
MATHEMATICAL MODELS FOR GAS- LIQUID-SOLID REACTORS 119
in Section I, while
I'
8 - 8 2 " = (1 -I- Q) (1/1", - 1/1,)
(4-30)
in Section II of the reactor. At = '1, a sharp drop in temperature occurs. We
assume that mixing between the reacting fluid and the quench at = '1 is
instantaneous and, thus, f)2 is obtained from an energy balance at = '1 as
02,1=((}t,, QO'j)/(1 + Q).
( 4- 31)
where 81 is the reactor temperature just before the injection of the quench and
02 is the reactor temperature just after injection of the quench. The quench
temperature, Rq is defined as (Tq - T;.)jT;. The quantity Q is the same as defined
above. Equations (4-24) through (4-26) and (4-28) through (4-30), along with the
activity functions, cJ>, and 1>m, completely define the dynamics of the system under
consideration.
The activity functions cJ>. and cJ>rn were correlated to C rne by the empirical
relations
cJ>. = (1 - a JCm :)m
(4-320)
and
cJ>m = (1 - b JC:, )n.
(4-32b)
From the aging data obtained in pilot-scale reactors, Shah et a1. 47 obtained the
values of 0 = b = 1.58, m = 0.8, and n = 0.6.
Equations (4-24) through (4-32) were s lved on the computer by Shah et at. 4 7
For a given set of conditions, a value of Q (as a function of quench position) at
zero time was obtained. This Q was kept constant during the cycle life. As the
reactor aged, the activity decline was counterbalanced by the increase in feed
temperature so as to keep the sulfur conversion constant. The effects of various
system parameters on the reactor cycle life obtained from these calculations are
briefly described below.
I. For each set of system conditions, the reactor cycle life exhibits a maximum
with respect to the quench location.
2. Higher feed temperatures give a smaller cycle life. For a typical set of HDS
conditions, this is illustrated in Fig. 4-8.
3. The quench temperature has little effect on the reactor cycle life, as illustrated
in Fig. 4-9 for a typical set of HDS conditions.
4. Higher sulfur conversion and feed sulfur concentration give a lower cycle life.
For a typical set of conditions, these effects are illustrated in Figs. 4-10 and
4-11, respectively.
5. Higher feed metal concentration and higher activation energy for the metal
removal reaction gives a lower reactor cycle life. For a typical set of conditions,
Figs. 4-12 and 4-13 illustrate these effects.
120 GA!>- LIQUID-SOLID RFACTOR DESIGN
200
'"
:>-0
<'3
150
:;
.,
u
>-
:..>
...
;; 100
:..>
<'3
50
150
'"
'"
'-
'-'
U
>.
u
...
E
w
'"
OJ
Ct:
250
8m = 0.095
1 0 . 115 0.135
I I .
I I I
t 1
I I
I I
I I
I I
I
I
,
l O.5
; Om = O. [35
/Om = 0.115
, , I
/
" I
". ., ° - 0.095
...,.. ..-" :.. ."
--
---
o
0.5
o
1.0
11
200
/
100 /
0'1 = -0.25"
"
50 L...O "= -050 ,,"
q . ,"
....."...- .,,'"
--
--
0'1=-0.75
8'1 =-0.75 0.1
0'1 = -0.50
0'1 = -0.25
o
0.5
'1
1.0
Q
Figure 4-8 Effect of feed temperature on
quench reqUlremem, reactor cycle life.
and optimum quench location (after Shah
f't al. 4b ).
u__. Q versus '1; - cycle life
versus '1. r = 1.265, r - 0.1 (Om = 0.115),
0. = -O.S. I/r... = 0.25. C in. = 71 parts per
million. Em = E. = 17.200 cal g-mol -I
0.4
0.3
0.2 Q
o
1.0
Figure 4-9 Effects of quench tempera-
ture on quench requirement, reactor
cycle life,and optimum quench location
(lifter Shah f't ul. 46 ).
----, Q versus 'I; -, cycle life
versus 1]. = I. tJm=O.lIS. r=O.I,
C m; = 71 paris per million, E, = Em =
17,200 cat g-mol- ',I/r.. = 0.25.
MATHEMATICAL MODELS FOR GAS UQt1ID-SOUD REACTORS 121
200
'"
>.
'"
[SO
I
I
I
I
I
I
I
I
I
1
I
,
,
I
I
I
-... ,
r = 0.05 _-':----...
-----
u
>.
u
100
c-
o
'"
'"
Ct:
50
o
o
0.5
1)
0.4
0.3
0.2
Q
0.1
Figure 4-10 TypIcal effects of feed
sulfur content on quench requirement.
reactor cycle life. and quench [ocalion
(qller Shah et aI. 46).
... -, Q vcrsus '1; -- cyclc life
ver us 'I. 7 = I, 1/1", = 0.25, 8m = 0.115,
0. = -0.5. em; = 71 pans per million.
E. Em = 17,200 cal g.mo[ 1
o
1.0
250
,
I
I
200 I 0.4
,
I
>. I
'" I
150 I 0.3
I
Q
u 1/.1'0 = 0.25 I
>.
:J /
... 100 I 0.2
..9 I
u
'" /
<>
Ct: /
,. Figure 4-11 Eft"ects of desulfurization
,
50 "1/1'0 =0.4 0.1 [evel on quench requ irement and re-
",'" 1/.1'0 0.1 actor cycle life as a function of quench
-'" / location Iqfrer Shah et al. 4h ).
1/.1'0 = 0.25 I/1so = 0.1 "
0 ------ 0 ----, Q versus 'I; -, cycle life
0 0.5 1.0 versus /I. T = I, Om = 0.115,0. = -0.5,
r = 0.1. C.... = 71 parts per million,
1) Em = E. = 17,200 cal g-mol- '.
122 GAS-LIQUJD-SOLID REA(TOR DESIGN
200
'"
>.
'"
2-
ISO
OJ
>,
'-'
o
u
'"
100 r
50 r
0 1
o
1.0
Figure 4-12 Typical effect of feed metals
concentration on reactor cycle life as a func-
tion or quench location (afrer Shah et al.4 ).
,= 1.0, 1jI =0.25, fi m =O.IIS, Oq=
-0.5, E, = Em = 17,200calg-mol-'. r =
0.1
0.5
TJ
150
---
'"
>.
'"
-c
100
OJ
U
>.
'"
...
£
u
'"
OJ
50
Figure 4-13 Typical effect of a variation in
metals removal activation energy on the
reactor cycle life as a function of quench
location (after Shah ft 01. 46 ).
,= I. [' = 0.1, 8m = 0.115. Oq = -0.5.
1.0 1jJ = 0.25, E. = 17.200 cal g-mol -', C m; =
71 pans per million.
o
o
0.5
1)
4-4-3 Optimum Cycle Life for a Liquid Quench or Two Gas Quenches
The analysis presented above was recently extended by Mhaskar et al. 28 for the
cases of a single liquid quench and two gaseous quenches. The mathematical
equations for these cases are direct extensions of the ones described above.
For the case oftwo gaseous quenches. the reactor is divided into three sections
and the mass and energy balances for each section are written in the same manner
as before. For the case of a liquid quench, along with the temperature. the
concentrations of sulfur and metals change at the quench location. The important
conclusions of this study are as follows:
MATHEMATICALS MODELS FOR GAS-LIQUID-SOLID REACTORS 123
1. The reactor cycle life is not significantly changed by the use of a liquid quench
compared to that obtained with the same level of gaseous quench under the
same operating conditions.
2. For a given set of operating conditions, the total amount of quench required
to obtain the desired sulfur conversion is always larger in the case of two
quenches compared to a single quench. For a given set of system conditions,
the total amount of quench as a function of the location of the second quench
is illustrated in Fig. 4-14. The temperatures of both quenches are assumed to
be equal. The figure clearly indicates that the total amount of quench required
in the case of two quenches is larger than in the case of a single quench.
3. For the same amount of total quench. two quenches, in general, provide better
cycle life than one. However, proper distribution of the amount and positions
of two quenches is required to achieve the desired improvement in cycle Jife.
This is illustrated in terms of the reactor cycle life as a function of the location
0.4
16\
+
,a;
II
1&
.ti
u
c:
..,
::1
c-
eo
'0
i-
VIII
0.5
0.3
J I
I I
1 I
I
f
,
,
,
I
I
I
I
I
/
,/
".
......
- '
'II
0.2
'"
,.
--
-
0.1
A
0.05
0.0 0.2
Dimensionless position of the second quench. 1)2
Figure 4-14 Total quench QT as a function of'l> (after Mhaskar et al. 28 ).
flo. = -0.5, [' = 0.1, Y = 1.265,1jr," = 0.25, eo} =. 0.5, /., = 13.81. Curves I and 11, 'II = 0.06;
curves III and IV. '11 = 0.20; curves V and VI, 'II = 0.30; curves VI1 and VIII, 'I, = 0.40. 'I. is the
dimensIonless position of the first quench; 0 01 and e o2 are dimensionless as the temperatures of the
first and second quenches, respectively. -, Q, = 0.05; n__, QI = 0.09; A B represents a single
quench (afrer Shah et al. 47 ).
124 GAS- LIQUID-SOLID REACTOR DESIGN
.
'" 160
:>-0
'"
:3
140
'"
0
:>-0
u
... 120
0
-
u
'"
d>
Ct: 100
220
200
------.....
--
II
180
--
-
.....
....
'IV
80
60
40
0.0 0.2
D
0.6
0.4
0.8
'12
Figure 4-15 Rea<:tor cycle life dS a function of 1/2111{ter Mhaskur l'tal. 28 \.
All parameters are as given in the caption to Fig. 4-14. CD represcnts a single quench maxi-
mum; EF represents lImiting values of 112
of the second quench in Fig. 4-15. The system conditions used for this figure
are the same as those for Fig. 4-14. The figure also shows that, just as in the
case of a smgle gaseous quench, there exists a set of quench locations for two
quenches which would give the optimum reactor cycle life for a given set of
operating conditions.
4-4-4 Use of Other Aging Functions
The analysis presented above uses empirical relations for the catalyst activity
functions for the desulfurization and demetalization reactions. These activity
functions assume that the major cause for the decline of the catalyst activity is
the metal sulfide deposition. In reality, the activity decline would be caused by
coke as well as metal deposition. The extent of activity decline due (0 coke
deposition will depend on the extent of hydrocracking reactions. At high
temperatures, hydrocracking reactions would be important. The studies of
Oxenreiter et al. 35 and Beuther and Schmid I show that the coke deposition on
an HDS catalyst can be very rapid initially, due to uncontrolled hydrocracking.
This initial rapid coke deposition would, however, reach an equilibrium level.
MATHEMATICAL MODELS FOR GAS-LiQUID-SOLID REACTORS 125
Shah et al. 46 also carried out a dynamic analysis of the commercial HDS
reactor similar to the one described above. assuming the activity functions to be
dependent upon the coke content of the catalyst. Exponentially decaying catalyst
activity functions similar to the ones described by Szepe 55 were used. This analysis
gave results qualitatively similar to the ones described above.
A more general model for HDS reactor dynamics should consider catalyst
dcactivation by the simultaneous deposition of both coke and metal sulfides.
Recently, Newson 32 proposed a semiquantitative model to describe catalyst de-
activation with respect to real time when hydro treating process conditions and
catalyst parameters are changed. He described a pore-plugging model which
considers catalyst deactivation by the simultaneous deposition of metal sulfides
and coke. Simplified approaches for describing the catalyst pore-size distributions
and the equations for diffusion and reaction in a catalyst pore were taken. The
deactivation rate ratio (deactivation rate at any time r/deactivation rate at time
r = 0) was correlated to the processing conditions and the catalyst pore structure.
While there are uncertainties in accurately estimating some of the parameters of
this model, the future work on the dynamics of an HDS reactor should consider
the use of such a model for the catalyst aging function.
4-4-5 Optimum Cycle Life in the Case of Constant Wall Temperature
and Constant Heat Flux
Normally, commercial HDS reactors are operated under adiabatic conditions.
The heat removal is achieved by the addition of quench fluids. Mhaskar and
Shah 27 carried out a similar analysis for reactors which are operated non-
isothermally under the conditions of either constant wall temperature or constant
wall heat flux. For simplicity, they assumed that the catalyst desulfurization activity
function 1>< follows the rate equation proposed by Szepe. 55 namely.
dcJ>. = _ R t e-(,..II....O),/.,/,
d! . A 'I'slj/<
(4-33)
where 1 is the dimensionless real time fdedimensionalized with respect to some
reference time t A ), R. is the frequency factor, and If a is the dimensionless
activation energy for the deactivation rate constant (10'. is defined in the same
manner as 6'.). The heat balance was expressed as
dO = A _ r dl/J.
d d
where A = - H(e - Ow) for the case of constant wall temperature, A = - QIt for
the case of constant heat flux.
(4-34)
H = hAw
(UOLPt.CpL -I- UOGPGCpG)A'
QH = qii!h, and Ow = (Tw - T;)/T;. Here, Tv. is the constant reactor wall tempera-
126 GAS-LlQUID-SOLlD REACTOR DESIGN
ture, h is the heat transfer coefficient, A", is the total waIl heal transfer area, A
is the reactor cross-sectional area, and QH is the constant waIl heat flux. All other
nomenc1atureis the same as before. Mhaskar and Shah 27 solved Eqs. (4-24), (4-33),
and (4-34) on a computer, subject to the conditions
t = 0
- ,
=0,
= L
(J = 0,
tJ;.= I,
I/J. = I/J.o,
,p. : I, }
,p. - 1,
(4-35)
and obtained the results of reactor cycle life (defined in the same manner as
earlier) as functions of ii and QH under a variety of operating conditioEs. For a
few typical operating conditions, the results or reactor cycle life versus H and the
reactor cycle life versus QH are illustrated in Figs. 4-16 and 4-17, respectively.
These results indicate the optimum in the reactor cycle life with respect to ii
and QH. Mhaskar and Shah 27 showed that the optimum values of ii (or QH) and the
reactor cycle life are dependent upon the reaction variables, such as feed concen-
tration ohhe reactant, activation energics of the reactions, space time, conversion
levels, and the reactor wall temperature (in the case of constant wall temperaturc).
280
'"
>.
'"
"C
2
u
>.
<.)
B
u
'"
11)
35
1
l
70
o
0.2
0.4
0.6
O.R
H
Figure 4-16 Effect of the heat generation parameter [' on the reactor cycle liFe under constant wall
temperature conditions of heat removal.
1jJ", = 0.25, R,t = 0.111 X 10 7 , 8. = 13.81, tff. = 4.45 at 354 DC, Bw = -0.2, R. = 0.555 x IO-
-I
S .
MATHEMATICAL MODELS FOR GAS-UQUID-SOLID REACTORS 127
280
24S
'"
>-
'"
:s 175
g
... 140
"0
>.
tJ
£ IOS
tJ
'"
Q)
Ct:
70
35
0 0.2 0.4 0.6 0.8
QH
Figure 4-17 Effect of the heat removal parameter QH on the cycle life when the reactor IS operated
at a constant heat rcmoval flux.
r = O.t, R. = 0.111 x 101, R. = 0.555 x IO- 5-', . = 4.45, IJ, - 13.81, """, - 0.25.
4-4-6 Nonisothermal Trickle-bed Reactor with Significant Evaporation of
the Liquid Phase
The models for the hydro processing trickle-bed reactors discussed above assume
no significant evaporation of the liquid phase. In many hydro processing trickIe-
bed reacwrs, such as the hydrocracker and the hydrodesulfurization reactors
operated under high severity, significant evaporation of the liquid phase may
occur. In some high-severity hydrocrackers, the evaporation could be as high as
90 or 100 percent of liquid feed. The modeling of such a reactor is very complex
and, to date, no satisfactory theoretical mode] for such a reactor has been
reported.
The transition from the liquid- to the gas-phase reaction regime is often
accompanied by a marked increase in the reaction rate, because the gas phase
surrounding the catalyst pellet offers less mass-transfer resistance than the liquid
phase. For the case of an exothermic reaction, this may have an undesirable effect,
as it gives rise to a rather narrow reaction zone with steep temperature gradients.
Thus, the catalyst may be exposed to local overheating, which results in subsequent
deactivation ofthe bed or the occurrence of a number of undesirable side reactions.
Furthermore, if the heat removed is insufficient. the hot-spot temperature could
occur.
128 GAS LIQUID SOLID REACTOR DES]G
Occurrence of the hot-spot temperature in a trickle-bed reactor has been
observed 7 during hydrogenation of :x-methyl styrene in a nonadiabatic reactor.
Hanika et al. l :! studied the hot-spot formation in an adiabatic bench-scale
reactor during hydrogenation of cyclohexene. The effects of feed temperature, gas
and liquid flow rates, and the concentration of cyclohexene on the hot-spot
formation were examined. Hanika et al. 14 reported a similar study for hydro-
genation of 1,5-cyclooctadiene dissolved in cyclooctane in the presence of 3 percent
palladium on a charcoal catalyst. They also measured the transient axial
temperature profiles within the reactor. They indicated that the hot-spot tempera-
ture in an adiabatic trickle-bed reactor is caused by the evaporation of the liquid
reaction mixture. Under transient conditions. the hot-spot temperature moves
towards the reactor exit due to axial heat transfer and this movement resembles
propagation of a flame during combustion. They also noted that, at a certain flow
rate, the hot-spot temperature does not travel in the axial direction; a phenomenon
that has also been observed by Pad berg and Wicke 36 and Wicke and Padberg 57
during catalytic oxidation of carbon monoxide. No theoretical study on this
subject is as yet available.
4-5 MODELS WHICH INCLUDE EXTERNAL
MASS-TRANSFER EFFECTS
4-5-1 Model of Sylvester and Pitayagulsarn
Sylvester and Pitayagulsarn 53 . 54 considered combined effects of axial dispersion,
external diffusion (gas--liquid, liquid-solid), intraparticle diffusion, and the intrinsic
kinetics (surface reaction) on the conversion for a first-order irreversible reaction
in an isothermal, trickle-bed reactor. They used the procedure developed by
Suzuki and Smith. 5 1.52 where the zero, first, and second moments of the reactant
concentration in the effluent from a reactor, in response to a pulse introduced,
are taken. The equation for the zero moment can be related to the conversion
X, in the form
I - X = e-A,W,
(4-36)
where
A3 = (Pe/2)[-J(1 -t 4A 2 /Pe) - IJ,
A 2 = 1/(1/A I + I/S).
Al = (3/F)[-J(AoF)coth -J{AoF ) - 1].
Here, the parameter F = UOI.dp/2De(1 - t) considers the effect of intra particle
diffusion, Pe = U oL d p /2EZI. takes into account the effect of axial dispersion,
S = 3(1 - /3)K T /U OL considers the effect of total external mass-transfer resistance,
and Ao = 1J'(l - G)k'ld p /2U OL considers the effect of surface reaction on the con-
version. In these reactions UOL is the superficial liquid velocity, d p is the particle
MATHEMATICAL MODELS !'OR liAS. LlQUID-SOLllJ REACTORS 129
diameter, E is the catalyst bed porosity, pi is the porosity of the catalyst particle,
kit is the intrinsic rate constant, E ZL is the axial dispersion coefficient, De is the
effective diffusivity in the catalyst particle, and K T is the overaIl external mass-
transfer coefficient defined by the equation
I 1 I]
=--+-+-
K T kG HhoG k L Ks'
(4-37)
where kG is the gas-side mass-transfer coefficient, k L is the liquid-side mass-transfer
coefficient, H is the Henry's law constant, and hoc is the gas holdup based on
the total volume of the reactor. W = 2Z/d p . where Z is the axial distance from
the reactor inlet.
The term A3 can be considered to be a pseudoglobal reaction rate. When
the axial dispersion is negligible A3 = 1\2 and when the external diffusion is
negligible A3 = A]. Based on the above equations, Sylvester and Pitayagulsarn
evaluated the effects of transport processes 53 and catalyst wetting 54 on the
conversion in a variety of three-phase reactor systems. The results indicate that
both transport processes and catalyst wctting can significantly affect the con-
version. Recently, Goto 8 modified the above equations to suit a differential
tricklc-bed reactor, in which the concentrations are assumed constant.
4-5-2 General Isothermal Model
We now look at the mathematical equations for a general isothermal steady-state
model for the trickle-bed reactor, which takes into account external mass-transfer
resistances, i.e., gas liquid and liquid-solid, axial dispersion, and the intraparticle
mass-transfer resistances, along with the intrinsic kinetics occurring at the catalyst
surface. Since many practical reactions can be characterized as
CiltCtlySI
A(g) + cm H(I),
Rate = kAsC s ,
(4-3g)
the model is developed for such a reaction.
The relevant material balances can be written as foIlows:
For A,
d 2 Ac dA G
E ZGA dZ 2 - U OG dZ - KlOdAG - Ad = 0,
d2Al dA L
ELLA dZ 2 - (lOl dZ -t KlOdAc - Ad - KSAtlS(Al - As) = 0,
KSAQs(A l - As) = kasAsCsJl:
(4-39)
(4-40)
(4-41 )
ForC,
d 2 C L dC l ,
E ZL dZ2 - (lOL dZ - Kscas(C l - C s ) = 0,
KSCoS(Cl - C s ) = kasAsCs'l;
(4-42)
(4-43)
130 GAS-LiQUID-SOLID REACTOR DESIGN
For B.
d 2 BI dB L
En. dZ 2 - VOL dZ + K SB l1s(B s - Bd = 0:
K SB as (B s Bd = kGsAsCs l.
(4-44)
(4-45)
These equations are subjected to the boundary conditions
dAa at Z = 0+, (4-46)
E WA dZ = VoG(A G - A Gi )
dA L atZ=O+, (4-47)
E ZlA dZ = VoL(AI. - Au)
deL at Z = 0+. (4-48 )
E zLC dZ = VOL(C L - C Li )
dB L at Z = 0+, ( 4-49)
E ZLB dZ = VoL(B L - B Li )
dA G dA L dCI. dB L at Z = L (4-50)
dZ = dZ = dZ = dZ = 0
The above equations are derived on the basis that the axial dispersion model is
applied to both gas and liquid phases separately, although there is some mass
exchange taking place across phase boundaries (see Fig. 4-18). The holdups of
various phases remain constant throughout the column. The parameters E ZGA ,
EZI.A' E ZLB . and E ZLe are the gas-phase axial dispersion coefficient of A. and the
liquid-phase axial dispersion coefficients of species A, B. and C, respectively.
Normally, one may assume E ZLA = E ZLB = E ZL (" Kl.al is the overall gas-liquid
volumetric mass-transfer coefficient, which takes into account both the gas-side
and the liquid-side mass-transfer resistances. KSAlls, KsoGs, and Kscl1s are the
liquid solid mass-transfer coefficients for species A, B. and C, respectively.
Normally, they are taken to be equal. Z is the axial distance from the reactor
inlet with L as the length of the reactor. Aj, Bj, and C j are the concentrations
of species A, B, and C in the jth phase, respectively, '1 is the catalyst effectiveness
factor, and k is the intrinsic surface reaction rate constant V OG and VOl are the
superficial gas and liquid velocities.
Several limiting cases should be noted. If the gas phase moves in plug flow,
the terms containing E ZGA in Eqs. (4-39) and (4-46) drop out If the concentration
of species C is in excess, C L is taken everywhere to be constant and Eqs. (4-42),
(4-43). and (4-48), along with part of Eq. (4-50), will drop out If there are no
liquid solid mass-transfer resistances for the species A, B. and C, AI. = As.
Cl. = C s , and B L = Bs. Similarly, if there is no gas- liquid mass-transfer resistance
for the gaseous species A, Aa = A l > Various limiting cases of the above equations
are outlined by Ostergaard,34 Hoffman, t 8 and Goto et al 9
MATHEMATICAl \fODEr.-; FOR GAS LIQUID-SOLID REACTORS 131
In general. the above equations are best solved in a computer. Goto et a1. 9
ohtained a solution to the case where species C is in excess so that the reaction
is pseudo-first-ordcr. They used the solution to analyze the efficiency of reaction
systems such as oxidation of ethanol, hydrogenation of !X-methyl styrene, and
hydrogenation of aniline. They defined
lr. = 1,(1 + k'.tl: K s)
(where K SA = K R = Ks and k'i is the pseudo-first-order rate constant),
Da = kflaS lLtll :'V OI .,
lo = 1 I[ I + k'i ast]J1LI(kLad lb]'
llo - 1,'(1 -r kLfkGH),
Gas
+
U oe
C c
Ezc
he
KLUL(A C -A L )
-Tt
I
(4-51)
(4-52)
(4-53)
(4-54)
Liquid
U OL
C L
E ZL
ilL
KsuS(A L -As)
Gas Liquid Liquid-solid
film film film
ti-'
I I
I C I
A
I
I
I
I
I
1 -
A(g) -+ C(Q) B(Q)
I B I
-1- - -(
I I
_l.__L
t t
Gas-liquid Liquid-solid
interiace in terface
Figure 4-18 SchematIc diagram of triekle-flow operations for a second-order reaction
132 GAS-LIQUID-SOUD REACTOR DESIGN
where k L and kG are the liquid-side and gas-side mass-transfer coefficients and H
is the Henry's law constant defined by the relation
A = HAt
(4-55)
and
_ Uod R Lo - RLi)/L _ ( Yo _ Yo . ) Jl JIL
Jft - k'lasAG/H - LBD LB. Da'
(4-56)
where
¥t.R = BL/(AG/H).
(4-57)
Here the subscripts 0 and i refer to reactor outlet and inlet conditions, respectively.
The efficiency ofthe reactor J1< was defined as the ratio of the actual production
rate to the intrinsic reaction rate. For small Da (Damkohler number). the
efficiency can be improved by presaturating the liquid feed with gas. For inter-
mediate values of Da. plug Ilow in the liquid phase is preferable to complete
mixing if Y LAi > 1]i, while the latter is preferable to the former if Y LAi < Jl;. For
large values of Da, the role of mass transfer from gas to liquid becomes
important. For the three practical systems they considered, the values of Jl. were
mainly governed by the catalytic effectiveness factor Jl and the effects of axial
dispersion were not significant. Goto et al. 9 also showed that the Mears' criterion 25
for the axial dispersion effect is changed significantly in the presence of other
mass-transfer effects. They showed that the effect of axial dispersion is insignificant
for any operating conditions if the Peclet number for the liquid phase (Pe =
UoLL/Ezd is greater than a certain value.
It should be noted that, as discussed in Chap. 3, liquid-phase macro mixing
in trickle-bed reactors has been characterized by models more sophisticated than
the axial dispersion model described above. With the use of data from laboratory
and full-scale reactors, Schwarz and Roberts 44 have carried out a parametric study
to evaluate the accuracy of the axial dispersion model. This study showed that,
in the case of laboratory reactors, the predicted conversions according to the
dispersion model and according to the crossflow model agreed to within the
accuracy of the representation. It was further noted that the deviations of these
models relative to the pure slug-flow model were relatively small as a rule. For
a full-scale reactor, the predictions of dispersion and crossflow models agreed
with each other at low conversions ( < 80 percent), but at high conversions they
differed with the dispersion model, predicting more conservative values of the
conversion. For full-scale reactors, the predictions of the slug-flow model were
considerably different from either the dispersion or crossflow model.
It appears, at present, that although crossftow and other macromixing models
described earlier give a more correct description of the trickle flow process, the
dispersion model predicts the conversion data satisfactorily. at least for simple
reactions.
MATHEMATICAL MODELS FOR GAS-LIQUID-SOLID REACTORS 133
4-6 MODELS FOR THREE-PHASE SLURRY REACTORS
The standard models. such as the one described in Chap. 2 and the similar ones
outlined by others,4,tt,I2,20,22,49 analyze the steady-state behavior of the system
and consider perfect mixing in the liquid and suspended phases and no change
in thc concentration of the gas phase within the reactor. Here we describe some
other models for the flow systems which relax some of these assumptions.
-I Model for Three-phase Slurry Reaction (i.e., No Liquid Flow)
A large number of gas-I iquid-suspended-sol id operations are operated under no
liquid flow (i.e.. batch) conditions. A transient model for this type of isothermal
reactor is given by Govindarao. lo Here, we briefly describe his model and the
important results obtained from it.
If the reaction is pseudo-first-order with respect to the gaseous reactant (i.e..
if there is liquid reactant taking part in the reaction. its concentration is in
excess and uniform) and if the reaction occurs only at the catalyst surface, the
governing dimensionless material-balance equations for the reacting species in
three phases are given as 10
eC I
ae
I (PC I
PeG ae
aC I N
c - m* (C I - C 2 ).
(4-58)
aC 2 1 a 2 c 2
;w = p --- 2 +NcJ>(CI C 2 )-Mf(C 2 -C J ),
(J[:" eGL v<,
(4-59)
aC J -
- = Mf(C 2 - C 3 ) - QfC 3 .
08 -
(4-60)
where
f=e
Pc
".
(4-6 t)
with conditions
CR,O) = CA ).
i = 1,2,3.
(4-62)
VCI I 0
? 0 = PedC Ii - Cd,
ac t I = 0,
a I
() 2 1 = DC2 1 = o.
0':; 0 c. I
I
f
(4-63).
(4-64)
134 GAS-LIQUID soun REACTOR DEStGN
Here,
= Z/L, (J = UGt/L, C. = AG/AGi 1
C z = mAI./4Gi' C J = mAs/AGj, PeG = UGL/E ZG , J (4-65)
PeGL = UGL/EzL. Pep = U.L/E zp , f = w/Wt. fjJ = h G /(1 - h G ),
N - KLIlLL/V G , (4-66)
M= ,
Q. = k'tQs WrL/V G , (4-68)
t = (Us L/d p ) { 1 - exp (- UsL/drW 1. (4-69)
In the above equations, A G , AI., and As are the g -phase, liquid-phase and
catalyst-surface concentrations of the reacting species, k; is the average gas-phase
concentration at the reactor inlet, Z is the axial distance from the reactor inlet, L
is the total length of the reactor, m* = H/Rg T, where H is the Henry's law
constant (cm J atm g-mol I), Rg is the universal gas constant, and T is the
temperature of the reactor. V G is the mean gas velocity, V, is the mean settling
velocity of the particles. t is the time. k'l is the first-order rate constant, W is
the catalyst loading, EZG and £zp are the axial dispersion coefficicnts for the gas
and solid phases, respectively. FolIowing the studies of Imafuku et at. t9 and Kato
et al.,21 the axial dispersion coefficient for the liquid phase was assumed to be
the same as that for the solid phase. w is the concentration of the particles and
h G the fractional gas holdup. Other parameters have the same meaning as
described earlier.
Equations (4-58) through (4-69) were solved on the computer for a unit step
change in Cr. (Cj[ ,o] for j = 1,2,3 were taken to be zero.) The effects of gas-
phase dispersion, gas velocity, catalyst loading, reactor diameter. particle size, and
reaction rate constant on the dynamics of the system were examined. Table 4-1
describes the values of the parameters used in the numerical evaluation. The
following important conclusions were made from this dynamic study.
1. For an values of the variables studied, the gas-phase dispersion does not show
a significant effect on the steady-state or transient characteristics of the liquid-
phase or surface concentration. This means that, in modeling three-phase slurry
reactors, the gas phase may be assumed to move in plug flow as long as the
performance of the reactor is measured in terms of the change in concentra tio'n
of the liquid phase.
2. In general, higher gas velocities, higher values of catalyst loading, lower particle
diameters, larger reactor diameters. and higher reaction-rate constants make
the system dynamics faster. At any point in the reactor, the liquid-phase
concentration responds faster than the catalyst-surface concentration.
3. Particle diameter and reactor dimensions have a marked influence on the
concentration distribution of the solid particles.
4. A decrease in gas-phase Peclet number PeG, an increase in gas velocity, a
MATHEMATICAL MODELS FOR GAS-LlQUID-SOLlD REACTORS 135
Table 4-1 Parametcrs used for the numerical evaluation of Eqs. (4-58) to (4-64)
(after Govindarao l 0)
Pressu re
Temperature, T
Density of the gas, pr..;
Density of Ihe liquid. PI.
Viscosity of the liquid, I',.
Density of the particles, P.
Bubble diameter, db
Bubble rise velocity, Vhr..;
Henry's con.tam, H
Gas-liquid mass-transrer coefficient. k..
Diffusivity of the gas in the liquid, D
Reactor length, L
Gas-phase Pedet number, Per..;
Superficial velocity of the gas, l" c
Catalyst loading, W
Particle diameter, d.
Reactor diameter. d T
Reaction rate constant, k,
I aIm
29fU K
0.0823 g I I
0.85 g em 3
0.31 cP
3.35 g cm- 3
0.28 cm
21.74 em s I
3.876 x 10 5 atm em' g-mol-. I
2.544 x 10- 2 em s- I
4.82 x 10- 5 cm 2 s
2m
0.05. 1.2.20.500
0.5.1, !,4.6ems I
0.5,5,25, SO g [-,
IO,50/lm
20. 40. 60 em
10- 4 ,2" 10 J. 0.04, 0.5, SO cm s I
decrease in catalyst loading, an increase in particle diameter, and a smaller
reaction rate constant give more uniform distribution of the steady-state
concentration in the gas phase. The reactor diameter does not have a significant
effect on this concentration.
5. Increase in gas velocity or reactor diameter and decrease In catalyst loading,
particle diameter. or reaction-rate constant tend to give more uniform distri-
butions of the concentrations in the liquid phase and on the catalyst surface.
6. The usual assumption of a well-mixed slurry phase is not valid for the
range of conditions examined.
Govindarao lo also postulated generalized nonisothermal (constant reactor
wall temperature) models for batch as weil as cocurrent- and countercurrent-flow
three-phase gas-liquid-solid systems carrying out a first-order reaction.
4-7 )10DELS FOR THE PACKED-BUBBLE-COLUMN
GA8-UQt:"ID REACTOR
Pavlica and Olson JB outlined a generalized axial dispersion model for the iso-
thermal bubble-column reactor in which a pseudo-first-order reaction occurred
in both the gas and liquid phases. The model considered axial mixing in both
the gas and the liquid phases. Here, we review a model for the reactor in which
a generalized (m, n)th-order reaction between a gaseous species A and a liquid
species C is carried out in the liquid phase. There are many chlorination.
nitration, sulfonation, alkylation, and hydrogenation reactions which can be
136 GAS-LIQUID-SOUD REM'TOR DESIGN
approximately modeled by this type of reaction mechanism. No reaction IS
assumed to occur in the gas phase.
The formulation of the mathematical equation depends upon the reaction
regime. If the reaction is slow, most of it would occur in the bulk-liquid phase.
This reaction regime is characterized by the value of the parameter
JM = J {(2/m + l)k;""D A At"'- tc n} /kL
(4-70)
being much less than unity. Here k;"n is the rate constant for the reaction, m and
n are the orders of the reaction with respect to gas and liquid species. respectively,
D A is the diffusivity of the gaseous species A in the liquid phase, At is the
solubility of A in the liquid phase, ct is the gas-liquid interface concentration
of species C. and k L is the liquid mass-transfer coefficient When J7Vf» 1 and
JM «qA, the reaction is considered to be fast. The parameter
qA = CL/ztAt,
(4-71)
where C L is the bulk-liquid phase concentration of the liquid species C and 21
is the stoichiometric coefficient for the reaction
k
A (g) + Z I ('(I) .:;' Products.
( 4-72)
In this regime, the reaction is complete in the diffusion film. JM is of the order
of qA, the reaction is instantaneous, i.e_, it occurs at a plane within the liquid
and species A, and C cannot coexist in the liquid phase. Here, we shall consider
three reaction regimes separately.
4-7-1 Slow Reaction
For a cocurrent flow of gas and liquid at steady state, the governing liquid-phase
differential equations for species A and C in dimensionless form are
1 dlC AL dCAL *. '" n
PeL d"[2 - d( + RdC AL - CAd - PCALC CL = 0,
1 a 2 c n dCn * m " _
PeL d 2 - d - PQ CALC n - 0,
(4-731
(4-74)
where
PeL = UI.L/E zL , CAt = AL/A Lh CCL = CL/C Li , 1
C L = At/ALi' = Z/L, RI = k a (: - hod/U" J
P = (kmnAi.iCLiL/Ud (t; - hOG) Q - LIALi/C Li.
subjected to the boundary conditions
(4-75)
, I dC AL
I=(AI.---,
PeL d
1 dCcl.
I=Ccl.---
Per d
at = 0, (4-76a,b)
MATHEMATICAL MODELS fOR GAS-LiQUID-SOLID REACTORS 137
dC AL = 0
d '
dC CL = 0
d
al =L
(4-77a,b)
All the nomenclature in the above equations is defined in the list of nomenclature
at the end of the chapter.
The above equations assume that the 1iquid-phase reactant C, the product
of the reaction, and the solvent are nonvolatile. The effective interfacial area for
mass transfer (ad and the fractional gas holdup (hod arc independent of the position
of the column. The Peclet number takes into account any varia.tions of concen-
tration and velocity in the radial direction. We assume that Peclet numbers for
both species A and C in the liquid phase are equal. For constant A , Eq. (4-73)
assumes that the gas-phase concentration of species A rcmains essentially constant
throughout the reactor. This assumption is reasonable in many instances. If the
gas-phase concentration does vary, a mass balance for species A in the gas phase
is needed. If the gas phase is assumed to move in plug flow, a relevant equation
would be
dC AG
+ RiJC L CAd = 0,
d
(4-78)
where
C AO = Ao/ALi,
Ri = RLVL/U G .
(4-79)
Equation (4-78) is subjected to the condition C AG = CAli;' Equation (4-73) assumes
that the gas-phase resistance is negligible.
If the liquid were to flow downward (i.c., counrercurrently), Eqs. (4-74),
(4-76b), and (4-77b) are replaced by
d 2 C CL dC n _ P Q *C'" cn - 0
PeL de + d( AI. CL - ,
(4-74')
I dC n
I =C c dl-),--(1-)
PeL d(
CL = 0
d(
at ( = 1,
(4-76b')
at = o.
(4-77b')
A very simple approximate solution to the above equations can also be
obtained by a 'linearization technique suggested by Hlavacek and Hoffman. 16 For
example, Eqs. (4-73) through (4-77) can be rewrilten as
I d 2 YA dYA * n
- p 1 2 - - d ' - RdC AL - 1 + YA) + PO - YA)m(l - yc) = 0, (4-80)
e L l c" C;;
I d2vc dYe
Pel. d 2 - d[ + PQ*(1 - YII)m(1 - Yc)" = 0, (4-81)
dVA
PeL.vA = d '
dvc
PeL Yc = df'
138 GAS-LiQUID-SOLID REACTOR DESIGN
subjected to the conditions
(4-82)
dYA = dye = 0
d de; ,
(4-83)
where
.vA - 1 - C AL
(4-84a)
and
Ye = 1 - CeL.
The linearization technique approximates to
(4-84h)
[ 1 d 2 d ]
Pe L d 2 - d (.vi) -':XYi>
i= A,C,
(4-85)
where
fi. = yf + Pe ,::, !
PeL 4
fl PeL
tan 11 = -2 P 2- ; .
fl - eL 4
Thus, Eqs. (4-73) and (4-74) can be rewrirten as
-aYA - RdCAL - I + VA) + P(1 - YAnl - yd" = 0,
- aYe + PQ*(1 - YA)'''(1 - Yet = 0,
(4-86)
(4-87)
(4-88)
or a relation between YA and Yc can be expressed as
YeIQ* = YA + RL(CAL - I + YA)/i.
(4-89)
The conversions of A and C, i.e., YA and Ye, are thus obtained by solving the
transcendental Eqs. (4-87) through (4-89).
The above solution is rigorous for a completely backmixed reactor and it
becomes less accurate as the PecIet number increases. Similar solutions for other
cases of slow reaction can be obtained in a straightforward manner.
A rigorous analytical solution to Eqs. (4-73) through (4-77) is not possible.
If the liquid reactant C is in excess. the reaction depends only on the concentration
A. For this situation, Pavlica and 0lson 38 have considered the case of m = I.
For In -=F 1, the perturbation solution. such as the one outlined by Burghardt and
Zaleski 3 or a Galerkin solution, such as the one outlined by Szeri et aL. 56 would
be useful. When the species C is not in excess (i.e., completely general case), the
above equations can be solved approximately by the Galerkin or perturbation
methods outlined by Szeri et al. 56 or the collocation method outlined by Shah
and Paraskos. 46
!
I
MATHEMAlICAL MODELS FOR GAS LIQUID -SOLID REACTORS 139
4-7-2 Fast Reaction
When the reaction is completed in the diffusion film of the liquId phase, the
enhancement factor in the absorption rate equals JM. Thus, the absorption rate
and the reaction rate in the diffusion film are equal. The rate of absorption is
given by
R A = JKm l)k;""DA A t m + tct"J.
In general, the gas-phase concentration of species A will decrease. The relevant
material-balances for the gaseous species A and the liquid species C are written
in the gas and liquid phases. respectively. These equations for cocurrent gas-liquid
flow can be expressed as
(4-90)
d 2 C AG _ d C AG _ P cm' C Ii ' - 0
PeG de d I AG CL - .
1 d 2 C CL dC n m' ii'_
PeL - d - PIQICAGCn- 0,
(4-91)
(4-92)
where
PI = - aLL_ J{ ' ( ) k:nn DAAt m + ICt" } ' l
UGhoGA Li m t 1
zlhoGALiUG j
Qt = -- - -, PeG = UGL/E ZG ,
UdE - hoG)C Li
m' = (m + 1)/2, ij' = 11/2.
For countercurrent flow. the second term in Eq. (4-92) would have a positive sign.
Equations (4-91) and (4-92) are subjected to the same boundary conditions as
Eqs. (4-76) and (4-77), except that C AL in these equations is replaced by C AG .
In Eq. (4-93). V G is the gas velocity and E ZG the axial dispersion coefficient in the
gas phase. ALi and C u are the reference (or inlet) concentrations of A in the gas
phase and C in the liquid phase, respectively hOG is the gas holdup and E the bed
porosity.
A numerical solution to Eqs. (4-91) through (4-93) is given by Mhaskar. 26
The approximate Galerkin and perturbation solutions to these equations for the
cocurrent-flow case are recently given by Szeri et al. 56 The method of Hlavacek
and Hofmann t6 outlined for the slow reaction can also be used for this case in a
similar way. In many practical cases. PeG is taken to be infinity (i.e.. the gas phase
is assumed to be in plug flow).
(4-93)
4-7-3 Instantaneous Reaction
The mathematical equations and their analysis for this case are identical to those
for the case of a fast reaction. The last term on the left-hand side of Eqs. (4-91)
140 GAS-LlQutD.-SOLlD REAClOR DESIGN
and (4-92) are replaced by PIC AG -t FlC et and Qt(PIC AG + P 2 C c d, respectively.
Here,
- aLLk L
p t = and
UdtoG
P2 = al LCu Dc kL.
UGhoGALiz\ D A .
(4-94)
Qt is defincd in the same manner as in the fast reaction. Dc is the diffusivity of
species C in the liquid phase. All other nomenclature is the same as that
described earlier. The perturbation and the Galerkin solutions to the rcsulting
equations for the cocurrent-flow case are given by Szeri et al. 51i
4-7-4 Model for a Nonisobaric Column with Variable Gas Velocity
The model described above assumes constant gas velocity and pressure in the
reactor. Recently, Oeckwer 6 outlined a dispersion model which took into account
the opposite effects of gas shrinkage and expansion caused by absorption and
reduced hydrostatic head. A ti.rst-order reaction in the liquid phase was assumed.
Both slow and fast reaction regimes were considered. The governing nonlinear
differential equations were solved on the computer.
The analysis of Oeckwer 6 showed that a sophisticated design of a bubble-
column should account for the axial variations in pressure and the gas flow rate.
Even under isobaric conditions, the gas flow with simultaneous absorption leads
to increased gas residence time; thus, higher conversions are obtained. Based on
his analysis, Oeckwer 6 concluded that simple isobaric constant-gas-velocity
models can be applied without serious errors if the column operates at elevated
pressures, say 20 atm; and if the gas shrinkage by absorption is small. He also
pointed out that, in large-diameter bubble-columns (diameter> 50 cm), gas-phase
dispersion may be important and it may exert a strong influence on the conversion.
A very good practical example, where the nonisobaric vanable-gas-velocity model
of Oeckwer can be applied, is the coal liquefaction reactor. In this reactor, both
significant pressure drop and large absorption of hydrogen can occur in the
reactor.
4-8 GENERAL REMARKS
The mathematical models (largely for hydroprocessing reactors) described in this
chapter, .while varying significantly in their complexities. are, to a large extent,
correlating models. In Chap. 3, sophisticated two-, three-, and even four-parameter
macromixing models for the trickle-bed reactor were reviewed. To date, these
models have not been used to simulate the performance of real hydroprocessing
reactors. Part of the reason for this is that the experimental data obtained in
real reactors are often not accurate enough to discriminate between the predictions
of simple and more sophisticated mixing models.
Finally, it should be noted that flow maldistribution, prevailing thermal
conditions, and the possible differences in the prevailing flow regime in small-
MATHEMATlCAf MODELS FOR GAS -LIQUID-SOLID REACTORS 141
versus large-scale reactors often restrict the usefulness of a mathematical model
for reactor scaleup purposes. For example, as secn earlier. a mathematical model
describiug the performance of a small-scale hydrodesulfurization trickle-bed
reactor is considerably different from the one used to correlate the commercial
reactor data. The reactor hydrodynamics playa very important role in proper
design, scaleup, and modeling of a three-phase reactor.
4-9 RECOMMENDATIONS FOR FUTURE STUDY
Future study in the subject area discussed in this chapter should include the
following topics.
1. Under trickle-flow conditions, determinations of the reactor conditions (i.e..
gas and liquid flow rates, packing size, liquid properties, etc.) when all catalyst
particles are effectively wetted and the catalyst surface is 100 percent utilized.
2. Development of mathematical models for some typical hydro processing
operations (such as hydrodesulfurization, coal liquefaction, etc.) in the
pulsed-flow regime. This flow regime has been currently evaluated for several
hydrogenation reactions.
3. Development of a mathematical model for the gas-liquid-solid reactor where
significant evaporation of the liquid occurs. The reaction could occur either
only in liquid phase or in both liquid and gas phases. Both isothermal as well
as nonisothcrmal operations should be considered. A practical example of such
a reactor is lhe reactor used in high-severity hydrocraeking operations.
4. Development of a mathematical model for a nonisothermal gas-liquid reactor
in which the absorption is accompanied by the generation of a large amount
of heat. The rate of absorption could. therefore, be affected by the heat
release. Several practical examples where this type of analysis would be useful
are noted in Sec. 2-6.
ILLUSTRATION 4-1
A new catalyst for hydrodesulfurization of 36 percent Kuwait atmospheric tower
bottom (KATB) was tested. The reaction conditions used were temperature =
400 c.C, pressure = 136 atm. liquid hourly space velocity (LHSV) = I h- I , and
hydrogen circulation rate = 1.4 x 10 8 cm 3 bbl I (at STP). The reactor was a
6.35-cm i.d. stainless-steel tube equipped with a 0.635-cm o.d. axial thermowell
mounted in the center of the reactor. The catalyst size was 8-14 mesh.
The percentage desulfurization versus liquid flow rate (and, hence, length of
the reactor, since LHSV was kept constant) data obtained with this catalyst are
shown in Fig. 4-19. As one explanation for the effect shown in this figure, it has
been suggested that the axial dispersion in shorter beds causes their poor
performance. Is this a viable explanation? Based on Mears' criterion. what is the
142 GAS LIQUID SOLID REACTOR DESIGN
liquid now rate (cm 3 h- I )
50
90
300
400
c
"'
"'
0.
'-'"
r::
C
-=
'"
N
.C
.: 70
a
"'
o
60 10 20
40 60
80
Figure 4-19 Percentage desulfur-
ization versus catalyst bed-length
and liquid flow rate.
Catalyst bed length (cm)
minimum length required to eliminate axial dispcrsion? Assume that the reactor
was operated isothermally. The relevant liquid properties are PL = 0.93 g cm 3
and JiL = 0.15 cPo The desulfurization reaction can be assumed to be a pseudo-
first-order reaction.
SOLUTION: For cases where axial dispersion effects are important, Montagna and
Shah 29 have shown that a plot of In (CAo/C Ao Ip) (here C Ao Ip is the reactor outlet
concentration under the plug-flow condition) versus L (length of the bed) should
be a straight line with a slope < -1. In the present problem, C Ao I" can be
obtained from the results using the 80-cm-long bed. Values of In (C A.o/C Ao I,,) as
a function of L, obtained from the results shown in Fig. 4-19, are illustrated in
Fig. 4-20. The slope of this plot is, indeed, < - 1. Thus. the axial dispersion
model of Montagna and Shah 29 does correlate the present experimental data and
it gives a plausible explanation for the observed effect.
According to Mears' criterion, the minimum bed-length required to eliminate
the axial dispersion effect can be expressed as
L min = (20d,,/Pe) In (C.;/C so ),
(4-95)
where d p i the catalyst diameter, c.; and c.o are the concentrations of sulfur at
the reactor inlet and outlet, respectively, Pe is the Peelet or Bodenstein number,
which can be estimated using the correlation of Hochman and Effron (see
Chap. 6) as
PeL = 0.042 Re .5,
(4-96)
where ReL is the liquid Reynolds number. based on the catalyst diameter and
the superficial liquid velocity. Using Eqs. (4-95) and (4-96), Lmill can be calculated
for the 10, 20, 40, and 80 cm beds and the results are shown in Table 4-2. The
MATHEMATICAL MODELS FOR GAS IIQUIO-SOLID REACTORS 143
1.0
i
"-
"
r....,< 0.1
--
"
'-"
-=
0.01
1
-'-----'--'---'1_
10
]02
Figure 4-20 Correlation of ex-
perimental data (36 percent
KA TB feed) by the axial dis-
persion model.
L (em)
Table 4-2 Minimum bed-length from Mears' criterion
Catalyst bcd-Ienglh Lm;n from Mears'
(cm) ReL Pe,. criteriont (cm)
10 0.31 0.023 189
20 0.62 0.033 172
40 1.24 0.047 147
!!O 2.4!! 0.066 93
t Lm;n varies with the bed-length because at constant LHSV, as the
bed-length is varied, the liquid flow rate is als" varied.
results indicate that the minimum bed-length required to eliminate the axial
dispersion effect is little more than 80 cm. Mears' criterion in this case gives a
conservative estimate.
NOMENCLATURE
o
°L
a,
A err
Ao
Aw
A
Ai
b}
a constant defined in Eq. (4-32a)
gas-liquid mterfacial area per unit volume
Jiquid -solid interfacial area per unit volume
ratio of wetted area to the actual surface area of packing
frequency factor for the rate constant
wall surface area
cross-sectional area of the reactor
concentration of the reactant A in the ith phase
a constant in Bondi correlation
144 GAS-LlQUID-SOLlD REACTOR DESIGN
b
B
B.
I
C
C t ,C 2 ,C 3
CG,CL,C S
C p
c,nc
db
£IT
Da
d p
De
D i
E
E(t)
Ez
f
Fr
9
Ga
It
h G
h L
hd!.
H
H
hOG
k,km,k:" }
k'",n
kt app
k
K'
k L
kG
K T
K L
Ks
L
LHSV
m,n
m',n'
-I -I
m,n
a constant defined in Eq. (4-32b)
vapor-liquid equilibrium constant
concentration of species B in the ith phase
concentra tion
dimensionless concentrations as.defined by Eq. (4-65)
concentrations of reactant C in the gas, in the liquid, and at the
catalyst surface, respectively
specific heat
metals concentration in the catalyst bed
bubble diameter
reactor diameter
Damkohler number as defined by Eq. (4-52)
packing diameter
effective diffusivity of reactant in the catalyst pores
molecular diffusivity of speeies i in the liquid phase
activation energy for the reaction
residence-time distribution
axial dispersion coefficient
a quantity defined by Eq. (4-61)
Froude number (Gt;pld p )
gravity acceleration
Galileo number defined by Eq. (4-5) (d gpUJ1t)
heat-transfer coefficient .
fractional gas holdup
total liquid holdup
dynamic liquid holdup
Henry's law constam defined by Eq. (4-55)
quantity defined by Eq. (4-34)
gas holdup based on the total volume of the reactor
reaction-rate constants
apparent reaction-rate constant
rate constant defined by Eq. (4-20)
a rate constant defined by Eq. (4-15)
liquid-side mass-transfer coefficient
gas-side mass-transfer coefficient
overall mass-transfer coefficient as defined by Eq. (4-37)
overall gas liquid mass-transfer coefficient
liquid-solid mass-transfer coefficient
length of the catalyst bed
liquid hourly space velocity
orders of the reactions with respect to reacting species
constants defined in Eqs. (4-32a) and (4-32h), respectively
constants defined by Eq. (4-93)
1\-1
M
N
P
PI
Pe
P,.Pl
Pe
q
q"
Q
Q
Q,
QH
Q
Q*
R
Re
R., R., Rm
RI
R
R A
S
!
fA
C m
1...
T
Tq
Tm
U
U o
V.
U bG
r
V
We
X
r
YA. )'c
}-'LB
ZI
Z
MATHEMATICAL MODELS FOR ("iAS LIQUID-SOLID REACTORS 145
a quantity defined by Eq. (4-67)
a quantity defined by Eq. (4-70)
a quantity defined by Eq. (4-66)
a quantity defined by Eq. (4-75)
a quantity defined by Eq. (4-93)
Peclet number based on the length of the bed
quantities defined by Eq. (4-94)
Peclet number or Bodenstein number I Ull.../EzI
heat flux
a quantity defined by Eq. (4-71)
flow rate
a quantity defined by Eq. (4-28)
a quantity defined by Eq. (4-93)
a quantity defined hy Eq. (4-34)
a quantity defined by Eq. (4-60)
a quantity defined by Eq. (4-75)
universal gas constant
Reynolds number defined by Eq. (4-5) (Gl.d...l/-ld
frequency factors defined by Eqs. (4-33). (4-24). and (4-25). respec-
tively
a quantity defined by Eq. (4-75)
a quantity defined by Eq. (4-79)
rate of absorption of A as defined by Eq. (4-90)
a quantity defined hy Eq. (4-36)
dimensionless real time defined with respect to a reference time
reference time
mean residence time
residence time for the plug flow
temperature
quench temperature
maximum allowable temperature in the reactor
interstitial velocity
superficial velocity
mean settling velocity of the particles
bubble-rise velocity
molar volume
reactor volume
Weber numher (Gldp/CILPd
conversion
gas-phase concentration
quantities defined by Eqs. (4-84a) and (4-84h)
a quantity defined by Eq. (4-57)
stoichiometric coefficient
axial distance
146 GAS-LlQUID-SOuD REACTOR DESIGN
Greek Ictters
l
lL, 1 0, lh' lt
E
1>
J1
(J
V
,
(1.
7J
fl
fl'
EO
L
(/
i
AHr
e
4>
</J.. rP",
1
r,r'
em
A
8
Ao,Ah A 2,A3
o
Subscripts
L
G
o
w
s
m,n
m
l
a
S
A,H,C
catalyst effectiveness factor
various types of effectiveness factors as defincd by Eqs. (4-51).
(4-53), (4-54), and (4-56)
bed void fraction
density
viscosity
surface tension
kinematic viscosity
dimensionless distance (Z/L)
a constant defined by Eq. (4-11)
a constant defined by Eq. (4-12)
a constant defined by Eq. (4-5)
a constant defined by Eq. (4-12)
porosity of the catalyst particle
an efficiency parameter defined by Eq. (4-161
space time
a quantity defined by Eq. (4-21)
a quantity defined by Eq. (4-22)
heat of reaction
dimensionless temperaturc defined by Eq. (4-25)
a quantity defined hy Eq. (4-65)
activity functions defined by Eqs. (4-32a) and (4-32h)
dimensionless location of quench (lIt and 1/2 refer to first and
second quench locations)
quantities defined by Eqs. (4-27) and (4-28)
dimensionless maximum allowable temperature (Tm - T./T.)
a quantity defined by Eq. (4-34)
dImensionless activation energy as defined by Eq. (4-25)
parameters defined by Eq. (4-36)
dimensionless time as defined by Eq. (4-65)
refers to liquid
refers to gas
reactor inlet condition
reactor outlet condition
reactor wall condition
refers to sulfur
refers to the orders of the reaction
refers to metals (vanadium + nickel) in HDS reactor
condition at quench location
refers to catalyst activity
refers to catalyst surface condition
refer to reacting species A, H, and C, respectively
MATHEMATICAL MODELS !-"ON. GAS-LIQUID-SOLID REACTORS 147
V,N
P
crit
1,2
refer to vanadium and nickel compounds in oils, respeclively
refers to particle
critical condition
refer to sections I and II of the reactor
Sl!pcrscripts
*
equilibrium condition at the gas liquid interface
REFEREl'.'"CES
I. Beuther, H., and B. Schmid, Sixth World Petroleum Congress, Frankfurt, West Germany, June
21,1963, Section 2, Paper 20, p 297,1963.
2. Bondi, A., Chern. Technol., vol. I, p. 185, March, 1971.
3. Burghardt, A., and T. Za[eskl, ('hem. Eng. Sri., vol. 23, p. 575, 1968.
4. Calderbank. P. H.. F. Evans. F. Farley, G. Jepson. and A. Poli. in Proceeding< ,,{rhl' S\'mpo.,illm
Oil Catalysis, Proactivation. Institute of Chemical Engineers. London, 19(i3, p 66.
5. Cecil. R. R., F X. Mayer, and E. N. Carr, Jr., Paper preo;ented at the AIChE Meeting, Los
Angeles, California, 1968.
6. Deckwer, W. D., Chern. Ellg. Sci., vol. 31, p. 309. 1976.
7. Germain. A. H., A. G. Lefebvre. and G. A. L'Homme. Adv. Chern. Ser.. vol. 133. no 13. p. 164.
1974.
8 Goto, S., Call. J. Chem. El1g., vol. 54, p. 126,1976.
9. Goto. s., S. Watabe, and M. Matsubara, Call- J. Chern. El1g., vol. 54, p. 551,1976.
10. Govindarao, V. M. H., Cltem. ".nfl. J., vol. 9, p. 229, 1975.
11. Gupta. S. S., PhD Thesis. Indian Institute or Science, Bangalore.lndia. 1973.
12. Gupta, S. S., and V. M. H. Govindarao, Papers presented at the 23rd Annual SessIOn of nChE,
Hyderahad, India, December 1970 and 24th Annua[ Session of lIChE. Kanpur, India. February
1972.
]3. Hanika, 1., K. Sporka. V. Ruzicka. and J. Hrstka, Chem. E'lg. J. (in press).
14. Hanika, J., K. Sporka, V. Ruzicka, and R. Pistek, Chern. Ellg. Sci.. vol. 32. p. 525, 1977.
15. Henry, H. c., and 1. B. Gilbert.l&EC Process Design Del'.. vol. [2. p. 328, [973.
Hi H[avacek, V., and H. Hofmann, Chem. Eng. Sci., vol. 25, p. 173.1970.
17. Hochman, J. M., and E. Effron, I&EC Fund., vol. 8, p. 63.1969.
18. Hofman, H., Int. Chen!. Enl}., vol. 17, no. [, p. 19. [977.
19. Imafuku, K., T. Wang, T. Koide, and H. Kupota, J. Chern. E119. Japal1. vol. I, p. 153,1'.168
20. Johns. L. E., and X. B. Reed, Chern. Eng. Sri., vol. 28, p. 275 and p. 1591, 1973.
21. Kata. Y., A. Nishiwaki. T. Fukuda. and S. Tanaka, J. CI1em.l:.ng. Japan. vol. 5, p. 112. 1972.
22. Koelbel, H.. H. Hammer, and U. Meist, in Proceeding., of the Europeall Symposium on Cllemical
Reucllon Engmeering. Perga man Press, Oxrord, 1965, p. II 5.
23. \-tears. D. E, Chern. EII(J. Sci.. vol. 26, p. 1361, 1971.
24. Mears, D. E., Ad!!. Chem. Ser., vol. 133, p. 218, 1974.
25. "'ears. D. E.. Chern. Eng. Sri.. vol. 26. p. 1361, 1971.
26. Mhaskar, R. D., Chern. En9. Sci., vol. 29, p. 897, 1974.
27. Mhaskar. R. D.. and Y. T Shah, Paper submitted to I&EC Process Design Dev., 1977.
28. Mhaskar, R. D., Y. T. Shah, and J. A. Paraskos. J&EC Process De. ign Dev., vol. 17, p. 27,
1978.
29. Montagna. A. A.. and Y T. Shah.I&EC Process Design Del'.. vol. 14, p. 479,1975.
30. Montagna. A. A., Y. T. Shah, and 1. A. Paraskos,l&EC Process Design Dev.. vol. 16. p. 152, 1977.
31. Murphree, E V., A. Voorhies, and F. x. Mayer, I&E(, Process Design Dev.. vol. 3, no. 4, p. 381,
1964.
32. Newson, E..l&EC Process DeSlg'J Dev.. vol. 14, no. I, p. 27,1975.
148 GAS-LiQUID-SOLID REACTOR DESIGN
33. Onda, K., H. Takeuchi, and H. Koyama, KQgaku Kogaku, vol. 31, p. 121, 1976; cf, Onda, K.,
Mern. Fac. £ng.. Nagoya Univ., vol. 24, no. 2, p. 165, 1972.
34. OSlergaard, K., Adl'. Chern. Ser., vol. 26, p. 1361, 1971.
35. Oxenreiter, M F., el aI., Fuel Oil Desulfurization Symposium, Japan Petroleum Ins!., Tokyo,
rererred to in reference 32 above. Nov. 29, 1972.
36. Padberg. G., and E. Wicke, Chem. £ng. Sci., vol. 22, p. 1035, 1967.
37. Paraskos, 1. A.. J. A. Frayer. and Y. T. Shah. I&EC Prv('ess Design Dev.. vol. 14. p. 315. 1975.
38. Pavlica, R. T., and 1. H. Olson, Ind. £ng. Chern., vol. 62, no. 12, p. 45, 1970.
39. Puranik, S. S., and A. Vogelpohl, Chern. F.ng. Sci., vol. 29, p. 501,1974.
40. Ross, L. D., Chern. £ng. Proyr., 1101. 61, no. 10, p. 77,1965.
41. SatterfIeld, eN., AlChE J., 1101. 21, p. 209,1975.
42. Satterfield, C. N., A. A. Pelossof, and T. K. Sherwood, A/ChI:. J., vol. 15, no. 2, p. 226. 1969.
43. Satlerfield, C. N., and P. F. Way, AIChE J., vol. 18, p. 305, 1972.
44. Schwartz. J. G.. and G. W. Roberts. /&EC Process Design Del'., vol. 12, p. 262. 1973
45. Sedricks, W., and C N. Kenny, Chern. Eng. Sci., vol. 28, p. 559, 1973.
46. Shah, Y. T., R. D. Mhaskar, and J. A. Paraskos, I&EC Prncess Design Dev., vol. 15, no. 3, p. 400,
1976.
47. Shah, Y. T., and J. A. Paraskos, Chern. Eng. Sci., vol. 30, p. 1169, 1975.
48. Shah, Y. T., and J. A. Paraskos. Chern. £ny. Sci.. vol. 36. p. 465. 1975.
49. Sherw.ood. T. K., and E. J. Farkas, Chern. Eng. Sci., vol. 21, p. 573,1966.
50. Skripek. M., and J Ballard, Private communication referred in Mcars. 24
51. Suzuki. M., and J. M. Smith, AIChE J., vol. 16, p. 882. 1970.
52. Suzuki, M., and J. M. Smnh, Chem. Eng. SCI., vol. 26, p. 22[, [971.
53. Sylvester. N. D.. and P. Pitayagulsarn, AlChE J.. vol. 19, no. 3. p. 640. [973.
54. Sylvester, N. D.. and P. Pitayagulsarn, Can. J. Chem. £ng.. vol. 52. p. 539, 1974.
55. Szepe. S.. PhD ThesIs, Illinois Insliwle of Techno[ogy, 1966.
56. Szeri, A.. Y. T. Shah, and A. Madgavkar, Chern. Eng. Sci., vol. 31, p. 225,1976.
57. Wicke, E., and G. Pad berg, Chem. Eng. Tuhnol., vol. 40. p. 1033, 1968
58. Zabor. R. C. R C Odioso. B. K. Schmid. and J. R. Kaiser. ACleS du f)euxieme Congrl!sse
lmernationale de Catalyst!, Paris. Editions Technip, Paris, 1961. p. 2601.
CHAPTER
FIVE
LABORATORY REACTORS
5-1 INTRODUCTION
The large number of gas liquid solid reactors used In the laboratory can be
classified into two main categories.
1. Reactors to obtain accurate intrinsic kinetic rate data which are necdcd for
design. scaleup, and optimization purposes. In these reactors the fluid dynamics
and various heat and mass-transfer resistances are either known or amenable
to rigorous calculations.
2. Reactors to simulate closely large-scale reactors so that the information IS
useful and directly relevant for the proper design of a large-scale reactor.
The differential reactor. the rotating-basket continuously-stirred-tank reactor,
and the string-of-spheres reactor are some of the examples of the first category.
The fixed-bed reactor, the segmented-bed reactor, and the straight-through
transport reactor are some of the examples of the second category_ It should be
noted that these categories are not always mutually exclusive. The fixed-bed
trickle-flow reactors are used in industry as well as in the laboratory. Significant
knowledge of flow distribution and various mass-transfer resistances encountered
in these types of reactor is now available.
The laboratory reactors can also be further divided into three sections (see
Table 5-1): some reactors are presently used for gas-liquid-solid reactions. some
reactors are largely used for gas-solid reactions. and these can potentially be used
149
ISO GAS-LlQUID-SOLlD REACTOR DESIGN
Table 5-1 Types of gas- liquid olid reactors
1. Gas-liquid-solid reactors:
u. Differential reactor
b. Fixed-bed reactor
c. Stirred-batch reactor
d. Continuously-stirred-tank reactor
e. Straight-through transporl reactor
1- Recirculating transport rcactor
fl. External recycle reactor
h. Rotating-basket continuously-slirred-tank reactor
i. Segmented-bed reactor
.i- String-of- pheres reactor
2. Gas-solid reactors which can easily be adapted to three-phase systems:
{I. Ball-mill reactor
b Fluidized-bed reactor with :'111 agitator
c. Stirred reactor with the catalyst impregnated on the walls or placed in an annular basket
d. Reactor with catalyst placed m a stationary cylindrical basket
e. Internal recirculation reactor
J. M icroreactor
q. Single-porous-pellet pulse reactor
h. Chromatographic-column reaclor
3. Gas-liquid ahsorbers which may find suilable applications In ga -liquld---j;oIid reaction systems:
{l. Laminar-jet absorber
b. Welled-wall column absorber
c. Rotary-drum absorber
d. Disk column absorber
e. Single-sphere absorher
f. Gradienlless contactor
for gas liquid- solid reactions. Finally, some commonly-used absorbers can be
implemented to study three-phase gas -liquid-solid (reactant) reactions. These
three types of reactors are treated here separately. The reader should note two
excellent review papers on the subject of laboratory reactors by Doraiswamy
and Tajbl l and Weekman. 2
The important factors to be considered in choosing a particular type of
laboratory reactor are:
I. Physical and chemical nature of feed
2. Nature of catalyst and its aging function
3. 1'\ature of reaction
4. Product sampling and analysis
5. Isothermality
6. Residence-time distribution
7. Steady state
8. Ease of construction and cost
9. Meaningful data analysis
10. Flow maldistribution and extraneous mass- and neat-transfer effects
LARORATORY RF.o\CTORS 151
Various laboratory reactors listed in Table 5-1 are evaluated below. based on
the above factors. The pertinent references for these reactors are listed at the end
of the chapter.
5-2. LABORATORY GAS-LIQUID- SOLID REACTORS
5-2-1 Differential Reactor
This type of reactor is very widely used because it is one of the simplest to
construct and it is cheap. Sampling and analysis of the product streams are
generally easy. but they can be difficult to obtain effectively at low conversions.
Isothermalityofthe reactor is generally attainable. particularly at low heat release.
Residence-time distribution measurements can be difficult because of channeling
problems, but this can be somewhat reduced by running the reactor vertically
rather than horizontally.
The reactor operates under unsteady-state conditions and it is necessary to
prepare synthetic feeds conforming to various compositions to facilitate the
measurement of the reaction rate as a function of composition. This is possible
in simple reactions with known reaction paths. In complex reactions, compounds
may be formed which may be difficult to introduce in the feed or whose
presence might not be known a priori. This difficulty can be overcome by using"
an integral reactor to provide the feed for a differential reactor. The shortcomings
of a differential reactor are overcome by: (a) recycling a large part of the effluent
stream. or (b) using a stirred reactor. These reactors give the rates directly. but at
integral conversion levels. A schematic diagram ofthis reactor is shown in Fig. 5-1.
- - Liquid in
Gas in- ....
Catalyst bed
Liquid out
FiRure 5-1 Differenlial reactor.
152 GAS-LIQUID-SOLID REACTOR DESIGN
Table 5-2 Integral reactors versus differential reactors
I. When using a differential reactor in complex reaction systems, synthetIc feeds must be prepared
which match the composition at various stages of conversion.
2. Integral reactor data are intrinsically more accurate than differential reactor data.
3. Data at high conversIOn are usually preferred in dIscriminating statistically belweel1 possible rate
models.
4. Measuring integral data over the complete conversIOn-reciprocal flow rate graph gives more
accurate results when only part of the graph is used.
5. Integral data (a) fits the conversion-space timc graph and, (b) varies in a particular way with
reactant concentration. The differential reactor data have to fit only the reaction rale variation
with initial concentration.
6. Integral reactors are more difficult to keep isothermal. Nonisothermality makes the data analysis
very difficult.
A comparison between a differential and its chief rival, an integral reactor, is made
in Table 5-2.
5-2-2 Fixed-bed Reactor
The construction of this type of reactor is straightforward. It is more costly than
the differential reactor, but the expense is still relatively low. Sampling and
analysis of the product is usuaIly straightforward, but isothermality is generally
difficult to obtain, which makes data analysis complex. Catalyst dilution and
high heat-transfer rates at the outside waJI by sand or sail bath can help obtain
isothermality. Channeling and liquid maldistribution can cause problems in RTD
measurements, e.g., problems encountered in laboratory-scale trickle-bed reactors.
This can be somewhat reduced by running the reactor vertically as opposed to
running it horizontaIly and by using a long packing length.
In general, an unsteady-state operation is obtained as a result of catalyst
aging. The reactor is, of course, nol very useful for gathering the kinetic data
when the catalyst decays rapidly. Multiple taps can be employed to give multiple
conversion and selectivity points for each experimental run. As shown in Chaps.
6 through 8, the RTD characteristics of the gas and liquid phases depend on the
orientation of the gas and liquid flows (e.g., both cocurrent downwards, both
cocurrent upwards, etc.).
Schematic diagrams of various types of fixed-bed reactors are shown in Fig. t -I.
The reactor thus reproduces the industrial reactors on a small scale and it can
be used to obtain the required data for reactor scaleup.
5-2-3 Stirred-hatch Reactor
This type of reactor can be built at reasonable L:ost and it is easy to construCt.
If the catalyst is dispersed in the slurry, the separation of catalyst must be
accomplished by the sampling system. It must provide rapid quenching to prevent
further reaction in the sampling system itself. The catalyst can also be kept in
LABORATORY REACTORS 153
Reactants
in
+
----- ------
-- --- -------
Figure 5-2 Stirred-batch reactor. 2
fixed baskets. Although the reactor can be maintained isothermally, the heating
period can cause prohlems in data analysis. Residence-time distribution for aU
three phases can be obtained accurately if the reaction can be quenched rapidly
at the end of the experiment. The reactor gives an unsteady-state operation and
selectivity time averaging disguise is as poor as in the case of thc fixed-bed reactor.
The gas-liquid. and liquid solid mass-transfer resistances can be minimized by
the intense mixing provided by the agitator. A schematic diagram of this type of
reactor is shown in Fig. 5-2.
5-2-4 Continuously-stirred-tank Slurry Reactor?ti
( This type of reactor (see Fig. 5-3) can be used for both gas-liquid-solid catalytic
I and noncatalytic reactions. The reactor is welI mixed and it can be operated
isothermally. The construction of the reactor is straightforward and inexpensive;
) however. the pumping of liquid-solid slurry, particularly if the reaction is carried
out at high temperature and pressure, may cause problems. The RTD's for all
three phases can be evaluated. The analysis of the kinetic data obtained from
L- this reactor is straightforward.
5-2-5 Straight-through Transport Reactor
The construction of this reactor is relatively simple, except the requirements for
isothermality and products quenching or separation. The cost is reasonable, but
rapid catalyst reactant separation or rapid quenching of the reaction is essential.
Representative sampling may be a problem.
Isothermality in this reactor is difficult to maintain; however. wall heat
transfer is better than for fixed-bed reactors. Salt or sand baths may be required
for isothermality. Residence-time distributions for all three phases can be
measured accurately. At low velocity, slip between phases is a problem, but more
154 GA.<;-LIQUID-SOLID REACTOR DESIGN
Solid and liquid in
Gas out
t
Gas in - --
Solid and liqu id
out
Figure 5-3 A gas-liquid-solid continu-
ously-stirred-tank reactor.
accurate data are obtained at high velocities. In this type of reactor, steady-state
operation can be obtained even for rapidly decaying catalyst. The reactor can
also be used on the pilot scale. A schematic diagram of this type of reactor is
shown in Fig. 1-3.
5-2-6 Recirculating Transport Reactor
This reactor gives more mechanical problems in construction and operation and
is costlier than a straight-through transport reactor. It needs a recirculating pump
or recirculating jet and plugging and flow problems (particularly at the bends)
can be encountered.
In this type of reactor, a well-mixed condition is achieved provided the
recirculation rate is large in comparison to the fresh feed rate. The problems
encountered in sampling and analysis of product are the same as those with the
straight transport reactor. Rapid catalyst. reactant separation or product quench-
ing is required for the achievement of reliable kinetic data. High velocities help
avoid catalyst -reactant slip and, just as in the case of the straight-through trans-
port reactor, it allows good residence-con tact-time measurements. The reactor
can be operated under steady-state conditions and, in general; good selectivity
time averaging disguise is obtained. This type of reactor is widely used in catalytic
studies where the catalyst decays rapidly. The reactor closely resembles large-
scale reactors; bence, it can be used for scaleup studies. Kinetic models for the
LABORATORY REACTORS 155
analysis of data obtained from this reactor are reasonably welI known. Schematic
diagrams of two types of recirculating transport reactor are shown in Fig. 5-4.
5-2-7 External Recycle Reactors
This type of reactor is more difficult to construct and more expensive than a
fixed-bed reactor because of the recirculation pump. Operations should be,
otherwise, relatively problem-free. The pump should have low holdup so that
steady state is reached rapidly.
Urecirculation rates are 10 to 15 times the feed rate. the reactor would tend
to operate nearly isothermalIy. High velocities past the hed of particles could
eliminate almost completely any external mass-transfer influence on the reactor
performance. By varying the circulation rates, the reaction condition for which
tht: mass transfer effect is negligible can be estahlished. Except for the rapidly-
decaying catalyst system, steady state can be achieved effectively. Sampling and
product analysis can be obtained as effectively as in the fixed-bed reactor.
Residence-time distributions for the fluid phases can be measured easily. High
fluid velocities would cause less flow-maldistribution problems.
Products out
)
t
I
t 1
.
t t .2)
t
l )
Products out
t
Reactants in
'Figure 5-4 Two recirculating [fansport reiJctors. 2
156 GAS-LlQVID-SOLlD REACTOR DESIGN
Catalyst bed
.---
1
I
i
Produc( ____
out
Reactants
---- .
m
!
t
Figure 5-5 External recycle reaclOr. 2
The degree of mixing can be controlled and calculated from the recycle rate.
The reactor performance will depend on the recycle rate. A schematic diagram
of this reactor is shown in Fig. 5-5.
5-2-8 Rotating-basket Gas-Liquid -Solid Reactor
The rotating-basket reactor (often known as the Carberry reactor) has been
widely used for gas-solid as well as gas liquid-solid reactions (see Fig. 5-6). Its
construction is not very difficult, but it is more complex and expensive to build
than a batch or fixed-bed reactor. The catalyst baskets can either be attached to
the stirrer [Fig. 5-7(b)] or they can, themselves, be used as the stirrer paddles
[Fig. 5-7(a)]. Furthermore, a small variety of rotating catalyst baskets are
available (see Fig. 5-8). Baskets must. in general. be small in diameter, so that
internal mass-transfer effects are minimized.
Sampling and analysis of product composition are good - only normal
problems are encountered. The reactor is wel1 mixed and isothermal conditions
in the reactor can be maintained. Due to wel1-mixed conditions, the extraneous
heat- and mass-transfer effects are at a minimum.
Residence-time distributions for the gas and liquid phases in this type of
reactor can be evaluated easily. The reactor is operated under transient conditions
if the catalyst decays rapidly. Otherwise, steady-state operation is obtained.
Baffles can be instal1ed to obtain better contact. When both homogeneous and
heterogeneous reactions occur simultaneously, their rates can be separated by
obtaining the results at various stirrer speeds. This type of reactor has several dis-
LABORAlDRY REAClDRS 157
advantages. Erosion of the catalyst may occur under severe agitation and it can
be a problem to keep the powdered catalyst in the baskets. The surface
temperature of the catalyst cannot be measured and it is often erroneously
assumed to be equal to the bulk slurry temperature. The catalyst may not see
the gas liquid mixture uniformly, For these reasons, the use of very small catalyst
'particle sizes is not recommended. Details of a typical rotating-basket reactor
are shown in Fig. 5-6.
Glycerol seal -
Teflon bearing
Thermocouple
well
Bronze
bearing
Catalyst
baskets
Baffles - -
Propellcr
Agitator shaft
Catalyst
pellets
Pulley sheave
Bearing coolant
o ring
Product gas
-- Feed gas
Heating tape
Insulation
Figure 5-6 Details of the CSTCR and the catalyst baskets (after Tajbl er al. 43 ).
158 GAS LlQUID-SOUD REAC10R OF-SIGN
Solid and liquid in
I
f
Gas out
Gas in -
Gas in_
----- ----
--- -- ---
1-
Solid and liquid out
(a)
Figure 5-7 Two type of rota ling-basket gas-liquid
solid re3ctor l
(a)
(b)
Solid and liquid in
Gas out
t
,
Solid and liquid out
(h)
.
IC)
Figure 5-8 Various types of rotating basket. (a) Four rectangular paddle-baskets for a single layer of
catalyst pellets (Carberry"', Tajbl et aI. 43 ), (h) four cylindrical baskets made or wire mesh for catalyst
of any form (Choudhary and DaraisU"aml. 37 \. Ie) wire-mesh circul"r baskel (Bri. k et al. H).
5-2-9 Segmented-bed Reactor
This reactor has been described in Chap. L Compared to other laboratory
reactors, it is difficult to construct and more expensive to build.
The segmented reactor is not an ideal reactor for intrinsic kinetic measure-
ments. because gas-liquid and the interparticle resIstances in this reactor are
difficult to eliminate. However, the laboratory-scale reactor can duplicate the
LABORATORY REACTORS 159
hydrodynamic conditions prevailing in the commercial reactor. Isothermat con-
ditions are difficult to maintain. Since the mixing characteristics as well as the
various mass- and heat-transfer resistances encountered in this reactor are not
well understood. the analysis of data obtained from this reactor may be difficult.
5-2-10 Multiple-sphere String Reactor
When both gas and liquid flow dowf\ward over a string of spheres, it can simulate
a trickle-bed reactor if the liquid flows downward in the form of a thin film. The
hydrodynamics for this type of reactor are reasonably well known. Both the
hydrodynamics of the liquid flow over a single sphere and the phenomena taking
place at the junctions of two spheres have been extensively studied. Flow mal-
distribution encountered in the pilot-scale trickle-bed reactor is eliminated in this
type of reactor. Furthermore, good estimations of the various mass-transfer
resistances can be ascertained. The reactor is successfully used by Satterfield et
al. 50 for the catalytic hydrogenation of :z-methyl styrene. Their experimental setup
is shown in Fig. 5-9.
Gas in ....
____ Liquid feed
Catalyst pellets
---------- Gas out
Figure 5-9 Multiple-sphere cocurrent-downflow
reactor (simulation of Irickle-bed reactor) (l!fter
Salle fi('ld el nl 50)
Liquid products out
160 GAS-UQUID-SOLID REACTOR DESIGN
5-3 REACTORS USED FOR GAS-SOLID REACTIONS THAT
CAN BE ADAPTED TO THREE-PHASE SYSTEMS
Several reactors are presently used for studying gas-solid reactions. These reactors
should, in principle, be useful for studying gas-liquid-solid catalytic reactions.
The reactors are: the baIl-miIl reactor (Fig. 5-10), a fluidized-bed reactor with
an agitator (Fig. 5-11), a stirred reactor with catalyst impregnated on the reactor
waIls or placed in an annular basket (Fig. 5-12), a reactor with catalyst placed in
a stationary cylindrical basket (Fig. 5-13), an internal recirculation reactor (Fig.
5-14), microreactors (Fig. 5-16), a single-pellet pulse reactor (Fig. 5-I7), and a
chromatographic-column pulse reactor (Fig. 5-18). The key features of these
reactors are listed in Tables 5-3 through 5-9. The pertinent references for these
reactors are listed at the end of the chapter.
Table 5-3 Key features of a ball-mill reactor
1. Good solids mixing. The temperature differences between..particles and fluids are low.
2. Well-mixed reactor. isothermality could be maintained.
3. Sampling and analysis of products can be difficult. Precautions need to be taken to keep catalysl
or reacting solid umformly distrihuted in the reactor or to separate them immediately after they
leave the reactor; otherwise, instantaneous quenching of the product stream will be required.
4. Steady state can be achieved for a rapidly decaying catalyst.
5. Residence-time distributions for various phases can be obtained effectively.
6. More effective for viscous slurries where additional mixing is required.
7. Construction is more difficult than for the straightiransport reactor. II is also more expensive to
build and operate than a straight-transport reactor.
.. ," .. ! ...... ,,- ." .. '.. .. .. ..
'to \ -: ...
.'" ;. ..:....
0. ._ .. .
. .
. ." I
- Feed
Products -
: .' ....
. .
.. :..:..:
. .
. .
. . .
.. . ....
. .
Rotating reactor
Support
Figure 5-10 Ball-mill reactor. I
Table 5-4 Key features of a fluidized-bed reactor with an agitator
I. Better mixing is obtained. A wider range of particle sizes can be used and better gas-liquid-solid
contact is possible.
2. Better mixing allows isothermality to be achieved more easily
3. Sampling and producl-analysis problems are of the same nalure as those encountered IJ1 a
straight-transport reactor.
4. Steady state can be achieved.
LABORATORY REACTORS 161
Table 5-4 Continued
5. Residence-time distributions for all phases can be measured. However, the dynamics are more
difficult to model because they depend both on fluIdization as well as stirring (or pulsation)
characteristics.
6. Catalyst is subject to disintegration when internal agitalion is involved. This is not a problem
when an external pulsator (or a pulsating pump) is used.
7. Complex mixing phenomena makes the data analysis difficult.
8. Construction is somewhat difficult and expensive. Operation and proper maIDlenance are expensive.
Accurate data collection requires C;Jreful control of mixing and fluidization phenomena.
Product
Product
t
-- ------
---------
-- ------
------- -
---- -----
---------
---- ----
---------
----- ---
------ -
-- ------
---------
-- -- - -
-- --- --
-- ------
------- -
----- -
- -- ---
---------
--- -----
---- ---
---------
--
t
Pulsator
Feed
(u)
I.
I
Feed
(b)
Figure 5-1] Fluidized-bed reactors. I (0) Fluidized-bed reactor with a mechanical agitator, (b)
fluidized-bed reactor wIth a pulsator.
162 GAS-LIQUID- sOLIn NEACTUR DESIGN
Reactor
walls
Gas out
Liquid In
Gas out
Ga in
---
Gas in
-------
Catalyst
.
UqUHJ OUI Liquid out
fa) (b)
Figure 5-12 Catalync reactors.' IiZI Reactor with catalyst lincd or coated onto the reactor wall.
I'" reactor wilh catalyst placed in an annular basket.
Table 5-5 Key features of a stirred reactor with catalyst impregnated on reactor
walls or p1aced in an annular basket
I WeI:-mixed. isothermalily can bc maintained.
2. Sam?hng and producl-analysis prohlems are the same as in the stirred-tank rcactor.
3 Residence-lime distributions are known or can be easily measured.
4. Steady-slate operation cxcept when the catalyst is rapIdly decaymg.
5. Construction difficulty and cost arc somewhat less than for the rota ling-basket reactor If [he
catalyst is placed in ,(11 anllular basket. Auniform and tightly-hound coating of the catalysl on
the reactor may gIve some construclion problems.
6. I! the catalyst layer is very thin. intraparticle diffu jon is egligible. thus giving . he Irue kineti $
T he ex_ tgnal.mass-transrer effects should. hQwc'<C!. be- miniri1i d by prover mixing.
rf{ the annular baskelsa;:-e used. the interparticle heat- and mass-transfer resistimces. as well as the
il1lraparhcle heat- and mass-transrcr effects. may be large IInless the reaclOr is highly agitaled.
Table 5-5 Continued
LABORA1DR'i REACTORS 163
8. Unlike the rotating-basket reactor, the temperature at the catalyst surface in this type of reactor
can easily be measured.
9. Because of the large reactor open volume to the ealalyst volume. [he use is largely restricted to
hetero -homo reactions. By changing the catalyst volume, the relative Importance of the hetcro-
geneous Icatalyst) reaction can be measured.
Table 5-6 Key features of a reactor with catalyst placed in a stationary cylindrical
basket
I. Well-mixed. isothermal conditions can be achieved.
2. Sampling and product 'lI1alysls are ,IS good as in the rotating-basket reactor.
3. Temperature at the catalyst surface can be measured.
4. Steady-state operation, unless the catalyst IS rapidly deeaymg.
5. Residence-time distributions can be easily measured.
6 Construction and cost are approximately the same as those for Ihc reaclor wIth annular baskets.
7 By changing open volume to catalyst volume, the reactor can be used as a single-particle reactor.
&. Thi reactor usually has low open volume 10 catalyst volume.
9. The heat and mass resistances wIthin the baskets and the intraparticle resistances can be large
unless a hIgh degree of agitation is used. Baffles arc often used 111 the open volume in order to
increase the degrcc of mixing.
Product
t
Impeller
Catalyst
basket
ThermoweU
t t
Gas in Liquid in
(0)
Internal
baffles
Catalyst
basket
Thcrmowcll
Products
Figure 5-13 Stationary cylindrical-basket reactors.' (ul With a rotating impellor. (b) with a rotating
reactor pot.
(b)
164 GAS-LIQUID SOLID REACTOR UESIGN
ern!
Liquid in
Cas out
Liquid in
t
casr!
Cas out
t
,
.
Liquid out
Figure 5-14 Internal recircula-
tion reactors. (a) With catalyst
at the wall. 65 (b) with catalyst
at the center. 04
Liquid out
(a)
(b)
Table 5-7 Key features of an internal recirculation reactor
1. Wcll-mixed, isothermal conditions are achieved.
2. Sampling and product analysIs are good. They arc the same as those for thc rotating-baskel
reactors.
3. Residence-lime distribution can be accurately measured.
4. Combines advantages of both differential and integral reactors. The integral recycle rate can be
accurately measured and comrolled.
5. Heat- and mass-Iransfer rale correiallOns obramed in a fixed-hed reactor can he applIed to Ihis
type of reactor
6. Steady-state operation, unless the catalyst is decaying.
7. Construction difficulty and cost are close to those for the rotating-basket and other similar
continuously-stirred-tank reactors.
8. Internal recirculation would give bettcr mixing in the catalyst baskcts.
9. It can be used for process studies conducted into the flow and mass-Iransfer regimes of the
commercial scale. One can use it to examll1e the phenomena occurring :'11 a specIfic point in the
commercial fixed-bed reactor.
10. Heat- and mass-transfer resistances m the catalyst basket could be significant. This may make
Ihe data analysis difficult.
Reactants
Sampling and dosing device
Microreactor
Chromatographic column
Reactants
Sampling and dosing device
Microreactor
Chromatographic column
LABORATORY REACTORS 165
Carrier gas
Detector cell
Reference
Sensor
(a)
Figure 5-15 (lI) Tail gas and (b) slug (or pulse) techmques (,!tier Dowisw<Jmy und Tujhl').
(b)
Table 5-8 Key features of microreactors
I. Require very small quantities of catalyst (0.01 to I g) and reactants.
2. Isothermal reactor. The reactor can be operated with a larger heat smle if an excessIve amount
of heat is liberated by the reaction
3. Large heat of reactions can, however, lead to a significant tcmperature gradient across the
reactor.
4. Can be operated at a steady state (if the catalyst does not decay rapidlYI or as a pulsed (or
periodic-flow, reactor which is operated under unsteady-stare conditions.
5. Sampling of the products cari be made very convenient by directly injecting the products into
rhe chromatographic column. Wide ranges of conversions and accurate product analysis can be
obtained.
6. In a pulse reactor, the catalyst surface concentration may be changing during the pulse, causing
selectivity disguise If all reaction paths are altered Identically by the e adsorhed species, rhen
the pulse reactor could lead to a selectivity study.
7. In a pulse reactor, short pulses of reactant can follow the mstantaneous behavior.
S. Construction difficulty is the same as for the differential reaClOr. with a small amount of
additional complexity added by the replacement of the addition or accurate pulses of reactant and
dIrect measurement of the product by the chromatograph.
166 GAS L1Q\11D SOUD REACTOR OESIGN
Table 5-8 Continued
9. The dispersion effects would depend strongly on puhe shape, reaction order. and axial Peelet
numher. The dlsper<ion Can significantly complicate the analysis of both stcady-state and pul<e
reactors.
ID. Corrosion of the reactor due to reactants and/or producls is small because of the small quantities
of the reacting mixture.
11. In a pulse reactor, the effect of axial dispersion on the peak width can be minimized by introducing
a dispersion column ahead of the catalys1 bed 10 broaden the Gaussian-shaped pulses.
12. Microc3talytic reactor can be used For surface chemistry and poisoning studies by slug techniqucs
(see Fig. 5-15).
13. Pulse technique can be lIsed to distinguish between various possible kinetic models.
14. A number of microcatalytic reactors can be used in parallel to evaluate qualitatively the activities
of various catalysts at the same time.
15. The contact time may not be known accurately because of dispersion and the residence times of
the reacting species may not all be Ihc same because or adsorption --desorption differences.
Glass wool
Catalyst
Prcheater
r
To GlC
column
Learrier gas
Glass wool
(b)
Bypass tube
-Carrier gas
(a)
L To GLC column
(c)
Figure 5-16 Typical mlcroreactors (afier Doraiswam)' and T ibIJ). (a) A simple microreaclOr.8 (b) a
variable-contact microreactor. 1H (c) a twin-tube injector mlcroreactor."
LABORATORY REACTORS 167
C
Lh,
l ,
(a)
----
)
CD
(-
C
x L
Co
C L
Detector
(hI
Figure 5-17 Typical expenments with a single porous (catalytic) pellet. I02 (a) Dynamic Wicke
Kallenbach experiment for single-pellet-response experiments, (h) dosed-chamber experiment for a
single pellet.
Table 5-9 Key features of a single-porous-pellet pulse reactor
I. Largely used to study the roles of inter and intra particle dillusions on the chemical reaction.
Particular!) suited to study dillusivities in the cat:-IIyst.
2. Backmlxing and other mass-transfer elleets can cause problems with data analysis.
J. Isothcrmality can be maintained. Problems similar to the ones observed in microreactors.
4. Large recycle rate is repulsed to obtain significant conversion.
5. Problems are generally of the same nature as those encountered with pulse microreactors.
168 GAS-LIQUID SOUD REACTOR DESIGN
Table 5-10 Key features of a chromatographic-column pulse reactor
1. Extension of a ingle-pellet pulse reactor.
2. Useful for fasl reactions with low equilibrium constants.
3. Acts as a separator along with the reactor.
4 NOlllo;eful when two reactants are present, as they are also separated along Ihe column.
5. Analysis of the data can be complicaled due to back mixing and other mass-transfer effects.
6. Useful for measurement or physicochemical properties of the catalyst, e.g., diffusivity in the
catalyst pellets. adsorption coefficient. etc.. under reaction conditions. Relative Importance of
adsorption and surface rate processes can be determined from this type of a reactor.
7. Only userul fOT reactions of the type
A B+C,
A+B C+D,
with \'Cry low equilibrium constants.
Impulse
Response
eLL.
II
e
--t
Chromatographic column
Figure 5-18 A chromatographic-column pulse reactor. I 02
Table 5-11 Key features of the laminar-jet absorber
I. Normally useful for fast gas liquid reactions, but sometimes used for dilute slurry (gas-liquid
solid wIth solid as a reactant) reactions.
2. Gas-liquid interfacial area is known sO that gas-liquid mass-transfer coefficient and, hence, IDlrinsic
rate constant can be calculaled.
3. Fluid dynamics of the liquId phase are, at least in principle, well understood and amenable to
rigorous calculations.
4. Physical absorption coefficient can be estimated accurately.
5. Most flexible laboratory absorber By varying jel length and the liquid flow rate, both physical
absorption coefficient and the interfacial area can be varied.
6. In an idealized rod-like cylindrical jet. total exposure time, interracial area, and the physical mass-
transfer coefficient are given by the simple expressiuns l'1
"t" = ndf Lj/4G L ,
ilL = ndiL J ,
K L = (4/nd J ) ..../(DGL/L,).
(5-1)
(5-2)
(5-3)
where T = total exposure time. d j , LJ = diameter and the length of the jet. QL = mterfacial area,
LABORATORY REACTORS 169
Table 5-11 Continued
K L - physical mass Lransfer coetlicient, G L = liquid flow rate, D = diffusion coefficient of absorbing
species.
7. Problems
o. Entrance effects (the velocity profile at the nozzle is not flat).
b. Gravity eftect (under the influence of gravity. the vertical jet accelerates and shrinks).
c. Exit effects (ripples and surface stagnancy induced by the jet receiver).
8. Interfacial area range = 0.3-10 cm'.
Diffusion time = 0.01 -0.1 s.
Nozzle
HtHH
d J
L.
]
Exit effeet
Receiver
.
Figure 5-19 Lammar-jet absorber. I 12
Table 5-12 Key reatures or the wetted-wall column absorber
I. In an Ideal case, hydrodynamics are simple and the liquid-film thickl1t: s is given by' 12
- [3v L GI./nd<y]\iJ. (5-4)
The sudace velocity of the liquid is 3/2 the average velocity, so that the total exposure time is
given by"2
"[ = iL e [lr.d e :'G L f(3\'L/g)].
(5-5)
Here. {) == liquid film thIckness, 9 = gravItatIOnal constant, VI. = kinemi.'tIC vIscosity of liqUId,
de = column diameter, G L = liquid flow rate, L< = column length, r = total exposure lime.
170 GAS-LIQUID-SOUD REAC10R DESIGN
Table 5-12 Continued
2. The physical absorption coefficient x GL".
3. Normall} used for fast gas liquid reactions, but it can be useful for dilute slurry reactions.
4. Amenable 10 rigorous calculations.
5. II can be used for measuring the absorption rate in dilute ga> liquid solid slurries.
6. Problems
a. Interfacial area cannot be varied easily - different length columns need to be used.
h. Entrance effects, ripples, surface renewal, and exit effects may be very important.
c. When long columns are used. measured absorption rates are always grcater than predicted.
7. Range of interfacial area - 10-100 cm!.
DiffusIOn lime = 0.1-1 s.
Velocity
profile
Exit cffect
de
--
1
Lc
Gas in
Figure 5-20 Welted-wall column absorber 112
Table 5-13 Key features of the rotating-drum absorber
I. Diffusion times are better controlled than with a wetted-wall column.
2. Normally used for gas-iiquid reactions, hut can he used for dilute slurry reacllons.
lABORATORY REACTORS 171
5-4 REACTORS OR:vtALL Y USED FOR GAS LIQt:"ID
REACTIONS WHICH CAN BE USED FOR THE
MEASLREME T OF ABSORPTION RA TF.S 11\ DILUTE
GAS-LIQUID-SOLID SLURRIES
Various absorbers used for the measurements of absorption rates in gas-liquid
reaction processes can also bc uscd to make similar measurements for the gas-
liquid-solid reaction processes. Commonly-used absorbers are the laminar-jet
absorber (Fig. 5- L 9). the wetted-wall column absorber (Fig. 5-20), the rotary-drum
absorber, the disk column absorber (Fig. 5-21), the single-pellet absorber (Fig.
5-22). and the gradientless contactor (Fig. 5-23). The key features of these absorbers
Support rod
- Gas 0111
I/J = disk diameter
- disk thick ncss
--- Cas in
Figure 5-21 DIsk column absorber. I 12
172 GAS-LiQUID-SOLID REACTOR DESIGN
are listed in Tables 5-11 through 5- L6. The pertinent list of references for these
absorbers is shown at the end of this chapter.
Table 5-14 Key features of the disk column absorber
I. Easy to operate.
2. Hydrodynamics on one element and the phenomena at the disk junctions are not understood.
3. Useful for studics of chcmical adsorption in conditions which approach fast reaction regime.
4. Can be used on large scale.
5. Normally used for ga -liquid reactions, but it can be used for the dilute slurry reactions.
Table 5-15 Key features of a single-nonporous-pellet absorber
1. Useful ror slow. tranSItion from slow to fast, as well as fast gas-liquid reactions.
2. Hydrodynamics are relatively simple amenable to vigorous calculations.
3. The diffusion time (or exposure time) is given by'11
-r = 2.58(32I'L!T219 1)1,.I Gr 1.3(lI0/21'" (5-6)
and Ihe ph} ical at-osorption coefficient is glvcn by
. K L 2.1 ,,/(DI(911!Mn2\ld I':('GI!', (5-71
where d p = parllcle diamcler. All other nomenclature is the same as berore.
4. In principle more complex than wetted-wall column but it is very satisfactory in operation.
Theoretical prcdictions of physical absorption rates are well confirmed by experiments.
5. The ranges of interfacial area = 10---40 cm 2 .
Diffusion time = 0.1-1 s.
Film thlcl<ness « < d p )
- varies with t/J
+
I
Sustaining
rod
Figure 5-22 Single-sphere absorber used for
gas-liquid reaction.
LABORATORY RI:ACTORS 173
Table 5-16 Key fcatures of the gradientless gas-liquid contactor
I. The reactor is used for the gas-liquid reaction. but it can be used fur gas-liquid---solid reactions,
where th solid is a reaclanL
2. Uniform compositions of both gas and liquid phases.
3. Reactor'can be operated isothermally.
4. It extends the concepts of gradientless gas---solid reactor to the gas liquid reaction systems.
Reliable ma s-transfer coefficients can be obtained.
S. The major difference between this reactor and other gas-hquid reactors such as wetted-wall
column. laminar-Jet absorber, disk contactor. and stirred-cell is that the experimenter has
independent control of the physical factors, such as individual film resistances and interfacial area.
6. In general, the rate IS found without havmg to worry about changing gas and/or liquzd composition
through the reactor, with all its uncenainties.
7. The reactor is used for a second-order gas-liquid reaction. All three reaction regimes, i.e., slow,
fast. and instantaneous, have been examined.
0.635 cm i.d.
< 2 percent open
Uquid
in
Four-blade
turhine
Interface
. plates of
different
t
open area
E
r..>
o
Three-blade
propeller
Four baffles
at the side and
on the bottom
Figure 5-23 Gradientless contractor of Levenspiel and Godfrey. 14
174 GAS-LIQUID-SOLID REACTOR DESIGN
ILLUSTRATION 5-1
For a gas liquid solid catalytic reaction, suggest laboratory reactors to carry out
the following measurements. Briefly justify the answer.
(a) Measurement of heat of reaction. Assume that the intraparticle mass-transfer
resistance can be significant.
(b) Measurement of gas liquid-interface temperature rise.
(c) Measurement of liquid-solid-interface temperature rise.
SOLUTION
(a) One method of estimating the heat of the reaction is to run the reactor
adiabatically and measure the temperature rise of the reacting fluid. If the
intraparticle mass-transfer resistance is important for a reaction system, then
the measurement should be carried out in a reactor in which small particles
of catalyst can be used. A three-phase fluidized-bed (either stirred or unstirred)
would be one such reactor. A completely-stirred rcactor (where all three phases
are completely back mixed) would make the heat balance on the system
simpler and should. therefore, be preferred.
Quite often. it is difficult to achieve adiabatic conditions in small pilot-
scale reactors. If there are heat losses at the reactor walls. the heat of reaction
can be obtained by a setup shown in Fig. 5-24. Rcador I In this figure is a
.
Uquid + catalyst
UQuid + inert solids
Stirrer
Stirrer
Gas
Gas
Uquid +
Gas
Liquid
Gas
..
+ catalyst
Reactor I
Electrical
heater
inert
solids
(rcal rcactor with
some heat loss at the walls)
Mcasurcrnent
device
Reactor 2
(dummy reactor with some
heat loss at the walls)
Figure 5-24 An experimental setup for the measurement of heat of reaction.
LABORATORY REAClDRS 175
hackmixed three-phase fluidi7ed-bed catalytic reactor, in which the reaction
is carried out. The reactor wilI exhibit a certain temperature rise in the presence
of some heat loss through the walls. Reactor 2 is a dummy reactor, which
contains inerts in place of catalyst. This reactor geometry IS identical to that
of reactor I. The heat in this reactor is added e1ectricalIy and it is externally
controlled. For a given set of reaction conditions, the temperature rise in these
two reactors are matched. The amount of heat input in the dummy reactor
would allow an estimation of hea t of reaction.
(b) The gas-liquid-interface temperature rise can be conveniently measured either
in a laminar-jet absorber or a wetted-walI column-type reactor. In the former
case, the jet wilI consist of catalyst and liquid slurry and, in the latter case,
the walIs of the wetted-walI column can be impregnated with the catalyst.
(c) The liquid-solid-interface temperature rise can be conveniently measured in
reactors in which the catalyst is fixed. The catalyst can be impregnated at
the waIls of a stirred-fluidized-bed (gas-liquid) or a wetted-waIl column
reactor. Ofthe two, the stirrcd-fluidized-bed reactor should be preferred when
the gas liqllid mass-transfer resistance is significant.
REFERENCES AND BIBLIOGRAPHY
Gener-"] review papers
I. Doraiswamy, L. K., and D. G. Tajbl. Cawl. ReI'. Sci. En.q.. vol. 10, no. 2, p. 177, 1974
2. Weekman. V. W., Jr., AlChE J.. vol. 20. p. 833. 1974.
Differential reactor
3. Barnard. 1. A.. and D. S. Mitchell. J Carol.. vol. 12, p. 376.1968.
4. Lunde, P J., and F. L. Kester. 1& EC Pmces.. Desiqn Del'., vol. 13, p. 27. 1<)74.
5. Mears, D. E..I&f.C Process DeszYII Dn'., vol. 10. p. 541, 1971.
6. Mezaki. R., and 1. Happel, Catal. De".. vol. 3, p. 241, 1961.
7. Pan sing, W. F.. and J B. Malloy, Chern. El1q. Prog., vol. )8, no. 12, p. 53, 1962.
8. Peterson. T. Land L. Lapidus. Chen!. EmJ. Sci.. vol. 21. p. 655. 1966.
Fixed-bed reaClor
9. Musick, 1. K., F. S. Thomas, and 1. E. Johnson. 1& EC Process Design Dee.. vol. 11, p. 350, 1972.
Slirred-batch reactor
lO. Butt. J. 8.. CA. Walker. and H. Bliss, AlOE J.. vol. 8. p. 42, 1962.
[I. Cassano, A E., T. Matsuura, and 1. M. SmIth, 1&l:.C Fund., vol. 7, p. 655. 1968.
Straight-tbrough transport reactor
12. Bryson, M. C. G. P. Hu[ing, and W. E. Glausser. Hydrncarhnn Proc., vol. 51, p. 85.1972.
13. Epstein. N.. and K. B Mathur. Call. J. Chern. En!/.. vol. 49, p. 467, 1971.
14. Pierce, W. L., R. P. Souther, T. G. Kaufrrum. and D. F. Ryan, HYilrocarbOlI Pro£., vo1. 51, p. 92.
1972.
15. Sadak, S. E., l&EC PI'Ol"l'-',' DeSIIJII Del'.. vol. II, p. 133. [972.
176 GAS-LIQUID-SOUD REACTOR DESJGN
16. Saxton, A. L, and A. C. Worley, Oil Gas J., vol. 68, no. 20, p. 82,1970.
17. Strother, C. W.. W. L Vermillion, and A. J. Conner, Hydrocarbon Proc.. vol. 51, p. 89.1972.
Recirculating transport reactor
18. Harrison, D. P., J. W. Hall. and H. F. Rose, Ind. Eng. Chem., vol. 57, no. I, p. 18, 1965.
19. Kahney, R. H., and T. D. McMinn, Paper presented at AIChE 66th Annual Meeting,
Philadelphia. Pa., 1973.
External recycle reactor
20. Bernard, J. R.. and S. J. Teichner, Bull. Soc. Chirn. Fr., p. 3798. 1969.
21. Butt, J. B., H. B[iss, and C. A. Walker, AlChE J., vol. 8, p. 42,1962.
22. Cassano, A. E., T. Matsuura, and J. M. SmIth, I&EC Fund.. vol. 7, p. 655,1968.
23. Chambers, R. P., N. A. Dougharty. and M. Boudart. J. Cowl., vol. 4. p. 62S, [965.
24. Gillespie, B. M., and J. J. Carberry, I &EC Fund., vol. 5, p. 164, 1966.
25. Gillespie, B. M.. and J. J. Carberry, Chem. Eng. Sci.. vol. 21, p. 472, 1966.
26. Hanson, F. V., and J. E. Benson, J. Catal., vol. 31, p. 471,1973.
27. Langer, R. M., and C. A. Walker, Ind. Eng. Chern., vol. 46, p. 1299, 1954.
28. Leinroth. J. P.. and T. K. Sherwood, AIChE J.. vol. 10, p. 524, 1964.
29. Perkins, T. K., and H. F. Rase, AIChE J., vol. 4, p. 351,1958.
30 Pirjamah, M., H. LivbJerg, and J. Villadsen, Chem. Eng. Sri.. vol 28, p. 328, 1973.
31. Satterfield, C. N., and G. W. Roberts, AIChE J., vol. 14, p. 159,1968.
32. Sidorov, I. P., D. 8. Kazarnovskaga, and P. P. Andreichev, Kinet. Kalal., vol. 3, p. 523, 1962.
33. Temkin, M. I.. Kinet. Katal., vol. 3, p. 509, 1962.
Rorating-basket reactor
34. Bennett, C. 0., M. B. Cutlip, and C. C. Yang, Chern. Eng. Sci., vol. 27, p. 2255, 1972.
3S. Brisk, M. L, R. L Day, M. Jones, and J. B. Warren, Trans. Insc. Chern. Eng., vol. 46, no. I,
p. T-3, 1968.
36. Carberry. J. J.,lnd. Eng. Chern., vol. 56, no. II, p. 39, 1964.
37. Choudhary, V. R., and L K. Doraiswamy,l&EC Process Design Dev., vol. II. p. 420,1972.
38. Halladay, J. 8., and R. V. Mrozek, J. Caral., vol. 28, p. 221, 1973.
39. Smith, W. D., Paper presented at Symposium on Progress towards Gradient[ess Reactors in
Catalysis, 63rd Annual A1ChE Meeting, Chicago, 111., 1970.
40. Tajbl, D. G., I&EC Prncess Design Dev., vol. 8, p. 364. 1969.
41. Tajbl, D. G., Can. J. Chem. Eng.. vol. 47, p. 154, ]969.
42. Tajbl. D. G., H. L Feldkirchner, and A. L. Less. Adv. Chem. Ser., vol. 69. p. 166. 1967.
43. Tajbl, D. G., J. B. Simons, and 1. J. Carberry,l&EC Fund., vol. 5, p. 171, [966.
44. Trifiro. F.. C Banti. G. Caputo, and I. Pasquon, J. C alai.. vol. 28, p. 221. 1973.
Multiple-sphere-string reactor
45. Astarita, G., G. Marrucci, and F. Gioia, Chem. Eng. Sd., vol. 19, p. 94,1964.
46. Astarita, G., G. Marrucci, and F. Gioia, Paper presented at the 3rd European Symposium on
Chemical Reactor Engineering, Amsterdam, 1964, published in a supplement to ("hem. Eng. Sci.,
vol. 20, 1965.
47. Astarici. G.. G. Marrucci. and G. diBlasio. Chim. Ind. (Milan), vol. 44, p. 142, 1962.
48. Davidson, 1. F., Trans. Inst. Chern. Eny., vol. 37, p. 122, 1959.
49. Patierno, A., Chern. Eng. Thesis, University of Naples. [962.
50. Sallerfield, C. N., A. A. Pelossof, and T. K. Sherwood, AIChE J., vol. IS, no. 2, p. 226,1969.
Ball-mill reactor
51. Barrett, D., Trans. Inst. Chern. Eng., vol. 49, p. 80, 1971.
LABORATORY REACTORS 177
Fluidized-hed reactor witb an agitator
52. Ramaswamy. V., and L. K. Doraiswamy, Unpublished material, National Chemical Laboratory,
Poona. 1973.
53. Trotter, I., PhD Thesis, Princeton University. 1960.
Stirred reactor with catalyst impregnated on reactor walls or placed in an annular basket
54. Ford, F. E., and D. D. Perlmutter. Chern. Eng. Sd.. vol 19, p. 37[,1964.
55. Lakshmanan, R., and D. Rouleau, Con J. Che,1!. Eng., vol. 47, p. 45, 1969.
56. Lakshmanan, R and D. Rouleau, J. Appl. Chern., vol. 20. p. 213. 1970.
57. Relyea. D. L., and D. D. Perlmutter, I&EC Process Design Det.., vol. 7, p. 261, 1968.
58. Tajbl. D. G.. H. L Feldkirchner, and A. L Lees, AdlJ. ('hem. Ser., vol. 69. p. 166, 1967.
59. Wentzhcimer, W. W.. PhD Thesis, University of Pennsylvania, 1969.
RCllctor with catalyst placed in a sm tionary cylindrical basket
60. Choudhary, V R.. and L. K. Doraiswamy.I&EC Prnce<s DesIgn Del'.. vol. II. p. 420. 1972.
61. Costa, E. C, and J. M. Smith, AIChE J., vol. 17, p. 947,1971.
Internal recirculation reactor
62. Bennell. CO., M. B. Cutlip. and C C Yang, Chem. Eng. Sci.. vol. 27. p. 2255, 1972.
63. Berty, J. M., Paper presented at Symposium on Laboratory Reactors for Process Research, 66th
Annual AIChE Meeting, Phi[adelphia, Pa.. 1973.
64. Berty, J. M.. J. O. Hambrick, T. R. Malone, and D. S. Ullock, AIChE Meeting, New Orleans,
La., 1969.
65. Brown. C E., and C O. Bennett. AIChE J., vol. 16. p. 8 [7. 1970.
66. Garanin. V. I.. V. M. Kirkchi, and K. M. Minachev. Kiner. Kawl., vol. 8, p. 605,1967.
67. Ge[am, C. Chim. Ind.. Genie ('him., vol. 102. p. 984. 1969
68. Livbjerg. H., and J. ValJadsen, Che,1!. Eng. Sci.. vol. 26. p. [495. 1971.
69. Mahoney, J. A., J. Catal., vol. 32, p.247, 1974.
70. Weycherl. S.. and M Trela. Int. Chem. £ng.. vol. 8. p. 658,1968.
Microreadors
71. Barbu[, M.. Gh. Serhan. I. Ghenjan. and T. FiloUi, Petrol. Ga=e, vol. 19, no. 3, p. 18 [, 1968.
72. Bassett, D. W., and H. W. Habgood, J. Phys. Chem., vol. 64, p. 769. 1960.
73. Bassett. D. W., and H. W. Habgood, Chem. Cat!.. vol. 13, no. 5. p. 50. 1961.
74. B[anton, W. A., C H. Byers, and R. P. Merrill, I&EC Fund., vol. 7, p. 611, 1968.
75. Bmter. E. D., V. L. Davison, and H. J. Dutton. J. Amer. Oil Chern. Soc.. vol 46, p. 113, 1969
76. Celler. W., Przem. Chem., vol. 49. no. 2, p 68. 1970.
77. Danforth, F. D., and 1. H. Roberts, J. Cowl.. vol. 10, p. 252, 1968.
78. DUllon, H. Land T. L Mounts. J. ["alaI.. vol. 3, p. 363, 1974.
79. Ettre, L S., and N. Brenner, J. ChrnrnalOyr., vol. 3, p. 524, [960.
80" Galeski. J. B.. and J. W. Hightower. Cat!. J. Chem. Eng.. vol. 48. p. 151, 1970.
81. Hall, W. K., and P H. Emmett, J. A mer. Chl'm. Soc., vol. 79, p. 2091,1957.
82. Hall, W. K., D. S. Maciver, and H. P. Weber, Ind. Eng. Chern., vol. 52, p. 421. 1960.
83. Harrison, D. P., W. K. Hall, and H. F. Rase, Ind. Eng. Chem., vol. 57, no. I. p. 20.1965.
84. Hartwig, M., Brennst.-Chem., vol. 45, p. 234. 1964.
85. Keulemans, A. J. M., and H. Voge. J. Phys. Cht'm., vol. 63, p. 476,1959.
86. Kokes., R. 1.. H. Tobin, and P. H. Emmett, J. A mer. Chern. SIIC., vol. 77, p. 5860, 1955.
87. Luckner, R. C, and G. B. Wills, J. Cowl., vol. 28, p. 83, [973.
88. Makar, K.. and R. P. Merrill, J. Cawl., vol. 24, p. 546,1972.
89. Norton, C J., Chern. Ind., vol. 6, p. 258, 1962.
90. Norton, C J.. and T. E. Moss. I&EC Process Design Dev., vol. 3, p. 23, 1964.
178 GAS-LIQUID-SOLID REACTOR DESIGI"
91. SI[vcrstcm_ J., and R. Shinnar, 1& EC Prnce"" Desi?}n Del'., vol. [4. no. 2. p. 127, 1975.
92. Singh, H. 8.. G. E. K[inzing. and J M. Coull. Paper presented at Symposium on Recent Advancl:s
in Rcaction Kinetics and Catalysis, 66th Annua[ AIChE Meeting, Philadelphia. Pa., 1973.
93. Steen. K. c._ J. J. Feeman, L Hofer. and R. B. Anderson. liS Bur. Mme, Rull., vol. 608. p. 19,
1962.
94. Topchieva. K. V.. E. Rosolovskaya, and O. L Shakhoskaya. Vest II. ,\1osk. Vniv., Ser 11. vol. 23,
no. I. p. 39. 1968.
95. Verma, A., and S. Ka[iilgume, J. Calal., vol. 30, p 430,1973.
96 Yushchenko, V. V., and T. V. Antipina. Zh. Fiz. Khim., vol. 43, no. 540, p. 2982, 1969.
97. Yushchenko, T. M., G. P. Korneichuk, V. P. Usha-Kova-Stasevich, and Yu. V. Semenyuk,
Kmet. Kl,wl.. vol. 4, p. 154. I% .
Single-porous-pellet pulse reactors
98. Ba[der, J. R., and E. E. Petersen, J. ('(//01" vol. 11, p. 195, 196R.
99. Ba[der. JR., and E. E. Petersen, ('hem. Eny. Sli., vol. 23, p. 12R7, 1968.
[00. Cunningham, R. A., J. J. Carberry. and J. M. Smith, AIChE J., vol. II, p. 636. 1965.
101. Dogu, G., PhD Dissertation. Lniversity of California, Davis, Junc [974.
102. Furusawa. T.. M. Suzuki. and 1. M. Smith. Cawl. ReI'. Sci. Eng.. vol. 13. no. I. p. 43. 1976.
103. Gillespie, B. M., and J. J. Carbcrry,l&IX Fund., vol. 5, p. 164. 1966.
104. Gillespie. B. M., and J. J. Carberry, elI/mI. En.C}. SeL vol. 21, p. 472. t966
105. Maymo, J. A.. and J. M. Smith, AlChE J., vol. 12, p. 845. 1966.
106. Suzuki, M., and J. M. Smith, AIChE J., vol. 18, p. 326. 1972.
107. Weisz. P. B.. and C. D. Prater. At/v. COlel/.. vol. 6. p. 143, 1954.
ChrnmalOgraphic column pulse reactor
108. Furusawa, T., M. Suzuki. and J. M. Snuth, Catal. Rev. Sci. Eng., vol. 13, no. I. p. 43.1976.
109. K[inkenberg, A., Chem. En!J. Sci., vol. IS, p. 255, 1961.
[10. Roginskii, S. Z.. M I. lanovskii, and G. A. Gaziev. Kinet. Kalal., vol. 3, p. 529, 1962.
[[ I. Suzuki. M.. and J. M. Smith. Chell!. En!l. Sci., vol. 26. p. 221. 1971.
Laminar-jet absorber
112. Astarita. G., IHass Trlln.,fer with Chemical Rt,,,ctiot!. Elsevier Publishing Co., Amstcrdam, 1967.
113. Astarita, GoO R,,'. SCI.. vol. 30. p. 658.1960.
114. Astarita, G., Chem. En!!. Sd.. vol 16. p. 202. 1961.
115. Astarita, G., G. Mmrucci, and L Colcti. ("him. Ind. (A.fi/m!). vol. 46, p. 1024. 1964.
116. Beek, W. J., Dissertation, Delft 1962.
117. Bjerle. Y., S. Bengtsson, and K. Frankvist, Chem. t.n!J. Sd.. vol. 27. p. 1853. 1972.
II R. '\Jijsing. R. A. T. 0.. Dissertation, Delft. [957.
I [9. Scriven, l. E., and R. l. Pigford, AIChE J.. vol. 5. p. 397, 1959.
120. Sharma. M. M., and P. V. Danckwerts. Cllem. Eng. Sri.. vol. If\, P 729.1963.
Wetted-wall column absorber
121. Gilliland. E. R., R F. Baddour. and P. L T. Brian, .41ChE J.. vol. 7, p. 223,1961.
122. Nijsmg, R. A. T. 0.. Dissertation. Delft. 1957.
123. Pigford, R. L., PhD Thesis. University of IIhnois, 1941.
124 PortiJlski. S.. PhDThesis, London University, 1960.
125. Port<1lski. S.,l&EC FlIt"l., vol. 3, p. 49.1964.
126. Roberts, D.. and P. V Danckwerts. Chern. EIJ(J. SU., vol. 17. p. 96 I, 1962.
127. Scriven. L. Land R. L. Pigford. A1ChE J.. vol. 4. p. 382,1958.
128. Vivian. 1. E., and D. W. Pcaccman, A/ClIE J., vol. 2. p. 437, 1956.
129. Wilkes, J. 0., and R M. NeddermiJnn, Chem. Eng. Sci.. vol. 17, p. 177, 1962.
LABORATORY REACTORS 179
Rotating-drum absorber
[30. Kennedy, A, M PhI) Thesis, Cambridge. 1960.
Disk column absorber
131. Andrew. S. P. S., Chem. EIIY. Sci., ..01. 3. p. 279, 1954.
132. Astarita. G., ChetJI. Ind.IJ\li/cIl1), vol 42, p. 849.1960.
133. Dhillon. S. S.. and R. H Perry. AIChE J., vol. 8. p. 389. 1962.
134. Morris, D. F.. and S. B. Watkins, Brit. Chl'm. Enel_ vol. 2. p. 16. 1957.
135. Morris, D. F., and S. B. Watkins. Brie. Chern. Ellg vol. 2, p. 79, 1957.
136. Roper, G. H.. Chern. En{l. Sci.. vol. :!, p. III. 1953.
137. Roper, G. H.. Chern. En!]. Scz.. vol. 2. p. 247. 1953.
I3g. Stcphens, E. J., and G. A. Morris. Chel11. En{/. Prog.. vol. 47, p. 232. 1951
Single-nonporous-pellet absorber
1J9. Astarita. G.. Ric. Sci. Rend Ser. A., ..01. I. no. 2, p. 177. 1961.
140. Astarita, G., Chem. Eny. Sci., vol. 17. p. 708. 1962.
141. Davidson, J F., and E. J Cullen. Tran,5. lllst. Chern. Eng., vol. 3S, p. 5[, 1953.
142. Lynn, S., J. R. Straatemeier, and H. Kramers, Chern. Ellg. Sci., vol. 4, p. 63. 1955.
143. Patierno, A., Chem. Eng. Thesis, UniversIty of Nap[es, 1962.
144. Ratcliff. G. A.. and J. G. Ho[dcroft. Chern. Eny. Sci.. vol. IS, p. 100. 1961.
Gradiendess contador
[45. Levenspze[, 0., and J. H. Godfrey. ChetJI. EIII/. Sd.. vol. 29. p. 1723,1974
CHAPTER
SIX
DYNAMICS OF THE COCURRENT-DOWNFLOW
FIXED-BED COLUMN
6-1 FLOW REGIMES
For C.Q.CUHeI lt g.3 -liqlli.d downAillll over a packed bed, various flow regimes such
as trickle-flow (gas continuous), pulsed flow, spray flow, and bubble flow (liquid
continuous) can be obtained, depending upon the gas and liquid flow rates, the
nature and size. of packing, and the nature and properties of the liquid. The
flow-regime transition is usually defined as the condition at which a slight increase
in gas or liquid flow rate causes a sharp increase in the root-mean-square waH-
pressure fluctuations.
In the .trickle-flow regime, the liquid trickles over the packing in the
discontinuous shape of films, rivulets, and drops near a stagnant 1::ontinuous gas
phase. The gas-continuous region or flow includes laminar liquid-laminar gas
flow as well as laminar liquid-turbulent gas flow. As the gas rate is increased, it
will cause a greater velocity in the liquid phase by .increasing the drag force on
the liquid phase. As the rate is further increased. the drag force can become
sufficient to cause turbulence in the liquid phase, particularly at channel
restrictions. Also, some liquid may become separated from the liquid film and
move as slugs or drops down a channel before reforming over the packing. This
type of flow is typical of the rippling or trans.itionIegion. As the gas rate is again
increased, the separated slugs or drops are now large enough to bridge channels.
This momentary blocking of some channels causes increased flow in others and,
thus, increases -the chance of separation and blocking in parallel channels. This
disturbance would, thus, tend to propagate down the bed as p or waves (see
Fig. 6-1).
180
DYN4.MICS OF THE COCURRENT-DOWNFLOW FIXED-BED COI UMN 181
Liquid-rich
region
Gas-rich
region
uquid-rich
region
Pulse
height
Figure 6-1 Idealized pulse flow.
Initially, the pulses always seem to begin in the lower part of the bed, while
rippling flow occurs at the top. Since slightly larger velocities will exist at the
bottom. owing to the lower pressure of the gas phase at that point. the separation
of liquid drops or slugs would occur in this region. With slightly higher gas and
liquid rates, the pulses begin at a short distance from the column inlet and
traverse the entire column.
If the gas flow rate is further increased, the drag effects hetween phases
increase. the slugs become closer and closer. and the limit is reached whcn the
slugs blur rogether with one another and the flow pattern reduces to what is
usually termed spray flow. In this flow regime, the gas phase is continuous, with
part of the liquid being carried through the column suspended as a heavy mist
in the.ga -stream. The packing surface is covered by a liquid layer, the thickness
of which decreases with increasing gas rate, In bubble flow. the liquid phase is
continuous and the gas is the dispersed phase. which. at low gas flow rates.
moves as separ::lJ.e bubhle.... but.at.high} pw rates the bubbles may coalesce.
rfu - air-water sy ster:o. _ C?t al.] presented a summary of the flow-pattern
bollndafies:.Thls IS sh own in Fig. 6-2. Charpentier. and coworkers 10 - t5 indicated
that the boundaries for the flow pattern depend upon the foaming capacity of
the liquid phase. As shown in Fig. 6-3, they presented separate flow-pattern
diagrams for foaming and non foaming liquid$. Their diagram for the nonfoaming
liquids gives results similar to the ones obtained from Fig. 6-2. The coordinate
system shown in Fig. 6-3 was originally proposed by Baker 4 for two-phase flow
maps in empty horizontal pipes.
Very recently, Chou el al. t6 showed that use of the Baker coordinates does
not cause the flow transition to coincide. They showed that the values of GL).Ij;/GG
at which the transition occurs for solutions of 93.9 weight percent ethane] and
20 parts per million of heptyl alcohol in water differ by a factor of 3. Chou et aI. 16
indicated that, besides fluid properties.. the b _dp9 [Osi j;,)C-.and the- weui Ag bara c-
eris.t.ics o.f the particJes are also important in determining the flow transition.
182 GAS-LIQUID-SOLID REACTOR DESIGN
5 x J 0 3
10)
Gas continuous
(blurring)
.<::
N
I
E
u
...
'"'
'-'
\5
10 2
3 x 10
5 x ]02 10)
10 4
G L (gcm- 2 h- I )
10 5
Packing
-.- Turpin and Huntington lOO . 2.59 -mm
Weekman and Myers lO4 .. 5.61 mm
------ Charpentieretal. t5 .. 8.01 mm
............ Wulfert 108 . 1-2.2 mm
- --- Larkins et 31. 48 . 1-6.5 mm
Figure 6-2 A summary or published diagrams for flow-paltern boundary r LJ(ier SlIIfJ et al. "').
Their data indicate that the flow transition from gas-continuous' to pulsed flow
occurs at higher. gas and liquid flow rates for nonwettable solids compared to
wettable solids. The change in transition condition due to s01ids wettability occurs
because a major fraction of the liquid tends to flow as rivulets over the non-
wettable surface and, thus, delays the formation of a liquid film capable of blocking
the interstices between the particles Furthermore, an increase in bed porosity will
also move the transition to occur at higher gas and liquid flow rates.
Chou et a1. 16 also showed an interesting dependence of trickle-ftow-to-pulsed-
flow transition on the fluid properties. The decrease in the surface tension shifted
the transition to lower gas and liquid superficial velocities. The shift in the
transition was, however, not monotonic with the change in the ethanol concen-
tration in water, and an external transition boundary existed for a solution
[JVJ',;AMIrS OF THE CuctJRRENT-DOW FWW FlXEU-BFD CULUMN 183
containing 40 weight percent ethanol. For air -methanol in water systems, up to
a concentration of 50,000 parts per million of methanol in water, the transition
shifted to lower gas and liquid superficial velocities with an Increase in Con-
centration of methanol in water.
Specchia and Baldi 90 denote the trickle-flow or gas-continuous-ftow regime
as a "poor interaction regime" because. in this regime. V !Y .little interaction
betw..een gas and liquid exists. Other flow regimes, such as pulsed flow, spray flow,
etc., in which significant interaction between gas and liquid exists, were all
together denoted as "high interaction" regimes. For the nonfoaming liquids. the
"
S?
...
l:J
. 1000
10
Spray
flow
0.1
om 0.1
Gc;/"A
- 100
"
'2.
...
2 10
Pulsed
flow
Specchi. and Baldi 90
0.1
0.01
0.1
G<;i"A
"
j Figure 6-J
Fal'ier I4 ).
System
PackJl1£
Key
Water-an
C',,'clOhexane-air
WateI jr
Cyc1oh nc-nitTogen
Gasotinc-carbon dioxide
Gasoline-n it ragen
Gasoline-helmm
Pclroleun1 ether-nitrogen
Petroleum ether-carbon dioxide
Sphencal catalyst 0
Sphencal calaly,t I)
(ylmdrlcal catalyst I 0
Cylindrical cataly t '} 6
Cylmdrical catalyst 2 .
Cyhndncal calalysl 2 .
Cylmdneol calaly,! 2 ...
Cylindncal cataly" 2 I
Cylindncal catalyst 2 t
IU)
System
Packing Key
Spherical calalys1 (J
Cylindrical calalysl:! +
Cylindrical catalyst )('
Cylindncal catalyst 2 J.
Cylindrical calalyst 2 *
Cylindrical calalysl 2 1\
Cylind rical catalyst 2 1
Cylindrical calalyst 2 0
Cyhndncal catazyst 2 .
KeroS{,l1c-air
D sulfutized gas oil-carnon dioxIde
DesulfuriLcd gas oil-air
D<sulfuriLe-d gas OIl-helium
Nondesulfunled gas oil-carbon dioxide
Nondesulftuizcd gas oj}..air
NondC'S\llfurizl':c::1 gas oil-he-Hum
K.:rosenc-air
KC'rosenc-nitr en
[ G PL J O.S u.." [ I'I ( P..... ) 1 ] 0.13
A = PWiJI. P lr . I}J u[ Ii:.!! -PI.
Flow-regime boundaries ror (al foaming and (h) nonfoaming hquids (afier Charpemier and
(b)
184 GAS-LIQUID-SOLID REACTOR DESIGN
transition conditions from a poor to high interaction regime obtained by these
authors agreed well with those reported by Charpentier and Favier. 14 Forfoaming
liquids, their results (as shown by the dotted curve in Fig. 6-3) did not quite agree
with the results of Charpentier and Favier. t4
Recommendations At present. the best available flow-pattern diagrams for non-
foaming and foaming liquids are the ones shown in Fig. 6-3 and their use is
recommended when the experimental data are not available. However, in the light
of the results of Chou et al.,16 wherever possible the flow regimes should be
determined experimentally. Better theoretical understanding of the transition from
one flow regime to other is needed.
6-2 PRESSURE DROP
6-2-1 Empirical Correlations
Considerable literature has been published on the pressure drop of cocurrent flow
tprough packed columns. 4B ,70.90.tOO,t06,107 Several empirical and semitheoreti al
correlations are presented. Turpm and Huntington, tOO for instance. correlated their
v nflo .pr s!!rs: gLadj D.t.!esultsJ)y th e re l !.i.on
I {' _ I [ (I1P/I1Z)LGdcgc J
n .ILG - n 2
2PG U OG
= 7.96 - 1.34 (In Z) + 0.0021 (In Z)2 + 0.0078 (In Z}3. 0.2 Z 500.
(6-1)
where
z (d p G G /lldt.t67
(dpGL/lldo.767 '
de = (2/3)d p (t:/O - 10)),
GG and G L are superficial gas and liquid mass'-;;locitieS, respectively, d p is the
particle diameter, PG is the gas-phase density, 6 is- the bed void fraction, IlG and
ilL are the gas and liquid viscosities, respectively, and U.DG is the superficial g;;U;
velocity. -
-- Th e above correlation was generated using approximately 160 experimental
data points taken from gas flow rates extending from about 8 through 2,400 g
cm 2 h- 1 and liquid flow rates having a range of 2,400 through 20,000 g cm- 2 h -I.
Use of the correlations for gas flow rates below 8 g cm - 2 h I is not recommended.
A constant gas viscosity of 0.018 cP and liquid viscosities ranging up to 19 cP
were examined. The bed porosity was approximately 35 percent and the maximum
column operating pressure was less than 3.4 atm. This correlation is not usually
used for evaluating pressure drop in high-pressure, industrial-hydroprocessing
-....
DYNAMICS OF THE roct JRRENT-DOWNFLOW FIXED-BED COLUMN 185
trickle-bed reactors. Turpin and Huntington t 00 also correlated the data of Larkins
et al. 48 by a similar correlation, i.e.,
.s-
In I (IlP;IlZ)L de gc J = 8_37 - 1.372 (In .2 1 ) - 00315 (In ZI)2 + 0.0123 (In Zt)3,
L PG V OG
(6-2)
where ZI = 2(flw Ifldo. 9 and flw is the viscosity of water. The above relation is
valid for 0.2 .:E; Zt 600.
«> A correla.tion more widely used_.!Q. yaluate. he. pre.ssurc dwp...ln lrjckJe"h '
reactors is that 0.D::arkin.,!:.et a 1. 48 According to this correlation, the overaIl two-
pnase -energy loss for the gas and liquid passing through the reactor is related to
the two individual single-phase energy losses as foIlQw :
( bLG ) K 1
log t 0 - "= 2 '
(iL + lI G (log 10 X) + K 2
where b G is the gas-phase energy loss; b L is the liquid-phase cnergy loss, bu. is the
two-phase energy loss and X = (iiLfb G )1/2. Th constant _KJ and Kl have the
v 1ues..DA16.andO.666, respectively. .
Larkins et al. 4M defined the t ?- h e pre syr radient (Il ( IlZk as foIlows:
( IlP ) = b LG - PM.
IlZ LG -- -
(6-3)
(6-4)
In Eq. (6-4), PM is defined as
" PM = hLPL + (I - hdpG.
\
( 6-5)
The liquid holdup h L is defined by the relation
......------- _.- - .
logto h L = -0.774 + 0.52510g to X - 0.109 (lOglO X)2.
(
J where h L is defined as a fraction of the void volume.
.t:t. Abbott et a1. I . 2 used the for.m of Eq. (6-3) to correlate hydrodesulfurization
and hydroprocessing data. The values of K t and K 2 obtained in their correlation
were O.ND and 0.830, respectively. The'liquid holdup was correlated by the
expressIOn
0.05 < X < 30,
(6-6)
loglo h L = -0.440 + 0.400log lo X - 0.120(log10 X)2. (6-7)
Some unpublished experimental data taken with a nitrogen -butane system at
operating pressures between approximately 23.8 and 37.4 atm indicate that the
correlation of Abbott et al.l is applicable over a wide range of practical conditions
when the catalyst size is greater than or equal to 0.16 cm, The correlation, however,
requires refinement when the catalyst size emp10yed is smaller than 0.16 cm.
Reiss 70 found his experimental results to be correlated weIl by a modified form
ofEq. (6-3), namely,
Ilogto I (IlP/IlZ)lG ] = . 416 .. (6-8)
L b L + (jG loglo X + 0.666
l
186 GAS LIQUID SOLID REACTOR DESIGN
Sato et al.,1S,76 on the other hand. correlated their data using the relation
I I APLG ] 0.70 (6-9)
Og10 A P L +AP G = [loglO(xi"/i.2)]2 ::;-1.00'
where XI = J(APdAPG ) and where APJ., and AP G are the pressure losses that
would exist if the liquid and gas were assumed to flow separately in single-phase
flow.at the same rates as those in two-phase flow. AP w is the pressure loss
under the two-phase flow condition. The above equation iridicates a --ptot of
APLG/(AP L + AP G ) versus Xl to be symmetrical about Xl = 1.2. An alternate
relationship for APw has been proposed by the same authors as
(APLG/AP.j°.S = 1.30 + L.85(X I )-0.!js,
0.1 < X I < 20.
(6-10)
ery recen1ly, Sp. ch.i __and Baldi 90 reported experimental datt! in the
pulsed- and spray-flow regimes using both foaming and nonfoaming liquids. Their
data with the non foaming liquids agreed satisfactorily with the correlations
proposed by Sato et at. 74 and Turpin and Huntington, I 00 but disagreed completely
with that of Larkins et al. 4K For foaming liquids, they ohtained data under the
operating conditions of 0.16 VOL 2,5 cm S-I; 1.1 V OG 246 cm S-I;
0.01 Jl.t 0.05 g cm I s I; 0.81 .:E; PI. .:E; 1.070 g em 3; 27 tIt 72 g S 2;
0.0007 PG 0.0012 g em 3. They correlated the data using a modified Turpm
and Huntington correlation, which can be expressed as
,.
,
where the parameter I/J has the same meaning as the one defined in Fig. 6-3.
3. Charpentier et al. t5 compared the two-phase pressure loss AP LG with that for
. single-phase flow of each phase in terms of the energy-based dimensionless groups
and derived the following relations 1QJ f() m ing, pn ke d..and...£pr
In fLG = 7.82 - 1.30 In (Z/l/JI.I)
0.0573 [In (Z/l/JI.I)Jl, . /
(6-11)
LG
log.
';;L + G
M
(log Xl i)2 + N '
(6-12)
where
l' _ I ( GL GG )( AH ) GL + GG
1G - - - + - +
- E PL PG AZ I.G EPM'
(6-13)
. G L [ 1 ( AB ) I J
';;L = --;- PL AZ t + PM '
. GG [ 1 ( AB ) 1 ]
';;G = B PG Ai G + PM .
(6-14)
(6-15)
In these equations,
AH = AP/p",g
(6-16)
and
X tl ' ( " / )
= \I';;L !,G .
(6-17)
DY:\IAMICS OF THE COCLTRRENT-DOW:\IFLOW FIXED-RED C-OLUMN 187
j Table 6-1 Typical values of M and.V
M tv
Raschig rings
Porous and nonporous spheres
Pcllcls
0.416
0.56n
1.416
0.666
0.720
1.020
Equation (6-12) is valid in the range 0.02 < XII < 500. Values of M and N for
Raschig rings, catalyst pellets, and porous and nonporous spheres are presented
in Table 6-1.
The _pressure drop in a trickle-bed reactor can also be obtained using an
E.rgtHt-type equation. This approximate technique is described by Charpentier. 12
J .Ib) Finally, Clements and Schmidt I 8 measured the pressUl.:e drop in a 55-n'lm-iood.
and 15-m-long bed. The liquids (Oow Corning DC200 series silicone fluids) used
had measured viscosities ranging from 1.5 through 8 cPo densities of 0.9 through
0.92 g cm - 3 and a surface tension (compared to air) of 18 through 20 dyne cm - too
Ill rno __ texl' rjments gas phase was air. J30th spherical (with effective diameters
of 1.6 mm and 2.9 mm) and extrudate packings (with effective diameter of I ITIm)
were investigated. Based on their data, they proposed an empirical relationship.
(I1P/I1Zh.G f ( " ) 3 ( Rel; Wee \ - 1i3
- = 1507P11r - ----I (6-18)
(I1P/I1Z)e . I - s; Rei J
Here, d p is in m, It!. in g m. 1 S-I and (I1P/AZ) in atm m- I oo ReG = lipGG/Pe,
ReL = dpGdJ.lL' and Wee = Uf,u1f"PG/(IL, where (II. is the surface tension of the
liquid, Clements and Schmidt 11j showed that, for _h yd rogen=hy roc,"!:rbon systems, ,I
the...above correlation would work better than Eq. (6-3) of Larkins ! 1.4B
6-2-2 Theoretical
A theoretical correlation for the pressure drop under trickle-flow conditions was
recently proposed by Hutton and Leung. 42 They proposed that for a given gas-
liquid system and a given packing, the pressure gradient is a function only of the
gas flQw rate and the liquid holdup, i.e.,
( I1P ) I1P
-- - = -(hol., G e ).
AZ I.G I1Z
(6-19)
The effect ofliquid flow rate on (I1P/I1ZkG is taken into consideratIOn by its
effect on the liquid holdup. The form of Eq. (6-19) is taken as the same as the
Ergunequations25.6o for flow through packed beds using an effective voidage
a_vailable fOI gas flow defined as (I - c - hol. - k), where c is the...v.QIJ.1me fraction
occupied by solid. hol. is the liquid holdup per unit volume of column, and k is
the effective deadspace volume per unit volume of column (taken here to be 0).
188 GAS-LIQUID-SOUD REACTOR DESIGN
Thus, the equation for (I1P/I1Z)LG that they derived is
15 ( I1P ) = [ 8.5!-tGa GG + a.Gb ( /lGas ) O.1 1 l . (6-20)
3 . I1Z LG PG PG GG (I - .:.. - hod
fur e.1..a, is th "))£'cifi'" r>lckin suili!ce area The liquid holdup hOl is assumed
to be dependent only on the liquid rate VOL and the pressure gradient in the
column. Thus,
h OL = h oL (V ol ,(I1PjI1Z)LG)'
(6-21)
Two forms of Eq. (6-21) have been proposed. For low values of the Reynolds
number of liquid flow, liquid holdup in a packed column can be predicted by
consideration of laminar liquid flow down inclined surfaces against a pressure
gradient. In this viscous flow regime,
_ h LPLg_cosl f3 _ ( I1P\ [ It6l cos 2 fJ ( 0 - (' - ho dh L cos 2 fJ ) ]
VOL - -"2 2 ., 2 I ) + 2 h 3 '
3/l l a s (c + hod I1Z/ LG 3!-tla.(c + IOL 2/l L a.(c + od
(6-22)
where fi is the angle to the vertical made by particles. At high.-liquid Re-ynQlds
in the so-called gravity-incrtia regime, the anilysis of Buchanan,1!
I-Iutton and Leung,42 and Hutton et a1. 43 gave the relation
[ . ( ) J I/2
_ hOl tl/2 I1P
- SI d. {J + PI- AZ LG ' (6:-23)
where SI is a shape factorS and d /is 1he--cl4l!acteristic.packing. lengtb" B Com-
binations of either Eqs. (6-20) and (6-22) or .-Eqs. (6-20) and (6-23) give the
complete solution for (I1P/I1Z)w as a function of the independent system variables.
Hutton and Leung 42 claimed a reasonable agreement between their model
and the experimental data of Turpin and Huntington at low gas and liquid flow
rates. Specc.hia and Baldi 90 modified the Hutton and Leung theory.. The y
Q_rrelated the two-pbare-frictiomt:l pressure drop-by lhe .Er-gun-type equation
{j _ K [1 - EO - h sL - hdlW - [1 - E(1 - h. L - hdd ] 2
LG - t 3 (1 h h ) 3 /lGUOG + K 2 3 (1 I J ) 3 - PGU oG .
E - sL - dL E - Isl - 1dL
(6-24)
Here, h sl . and h d [. are the static and dynamic liquid holdups. Kt and K 2 are
coefficients whose values depend on packing shipe and size. They are evaluated (
from for gas flow through a "wetted lc ng: i.e., when only the static liquid i \
holdup is present in the bed (h(ll = 0). K] and K 2 calculated in this way differ
significantly from those for a dry packing, as used by Hutton and Leung: this is
because the wetting changes the packiQg shape. Specchia and Baldi 90 showed
thattheexperimental data for the pressure dropobtainedby them and Charpentier t t
were correlated better by this modified theory than by the original theory of
Hutton and Leung.
DYNAMICS OF THE COCURRENT-DOWNFI.oW FIXED-BED COLUMN 189
6-2-3 pressure-drop Buildup in Industrial Reactors Subject to Fouling
The pressure-drop correlations outlined above assume a constant value of E, the
bed void fraction. In industrial-hydroprocessing trickle-bed operations, such as in
a hydrodesulfurization reactor, the pressure drop has been found to increase with
time. A typical behavior of the pressure drop across an industrial HDS reactor
as a function of time IS shown in Fig. 6-4. The pressure drop remains essentially
constant over a long initial period, where the correlations given above should
be useful. After a while, however, as shown in Fig. 6-4. the pressure drop increases
very rapidly with time until the operation requires termination due to an excessive
pressure drop across the bed.
It is clear that a behavior such as the one shown in Fig. 6-4 is caused by
plugging of the catalyst bed by solids deposition. The plugging causes the bed
void fraction to decrease. Some speculations on the modes of deposition can be
made from analysis of the plugging material. This material consists primarily of
oxides of iron in the form of loose particles and is densely deposited in the inlet
portion of the reactor. The material is probably carried by the fluid while it is
flowing through rusted pipelines. As the rcaction proceeds. bed plugging in an
HDS reactor also occurs as a result of metal deposits, both nickel and vanadium.
and coking of the catalyst.
A mathematical formulation of the transient behavior of pressure in an HDS
reactor is, of course, extremely complex and, as yet, has not been analyzed. In the
limiting case, when the catalyst bed is heavily plugged with solid deposits, the
problem of pressure-drop calculations is very similar to the pressure drop through
an oil reservoir. 72 The well-known Darcy type of equation should be applicable
in this case.
I::.P u ;
Figure 6-4 Typical pressure-drop
Days of operation buildup III a fixed-bed HDS unit.
190 GAS-LiQUID-SOLID REACTOR DESIGN
Recommendalion. In hydroprocessing operations, under trickle-flow conditions,
the correlation of Abbott et al. I (Eqs. (6-3) and (6-7)) should be used when the
catalyst size is larger than 1.59 mm. For the smaller catalyst size, Eq. (6-18) can
be used. In the pulsed- and spray-flow regimes, the use of Eq. (6-11) is
recommended. A theoretical understanding of the pressure drop in the pulsed- and
spray-flow regimes is needed.
6-3 L1QL"ID HOLDUP
As mentioned earlier. the cocurrent gas-liquid downftow and, In particul.ar, the
trickle-flow operation is one of the most widely used three-phase operations in
the hydro processing industry. The liquid holdup in such a reactor takes on added
importance because it is usually low compared to the one for cocurrent ueflQW
under similar flow conditions. Earlier we showed that the pressure drop. i!1"a
trickle-bed reactor can be related to the liquid holdup. The effective catalys.t
\t tting, as well as the thickness of the liquid film surrounding the catalyst
.par tiCle s, also depends strongly on the liquid holdup. --
The effect of liquid holdup on the performance of a trickle-bed reactor
depends upon the nature of the reaction. Some hydro treating operations, such as
hydrodesulfunzation. demetalhzation. and denitrogenation of resIdual gas oils.
require sufl'iciently high liquid holdup that all the catalyst surfaces are effectively
} tt_ed. For these reaetions, low liquid holdup in pilot-scale operations compared
to commercial-scale operations often leads to the ineffective use of the catalyst
and, subsequently, poor performance in the former case. Some reactions, such
as the hydrogenation of crotonaldehyde, the. hydrogenation of diolefins, the
hydrogena tion of benzene to cyclohexane, and the isomerization of cyclopropane
to propylene could occur in both the gas and liquid phases. Since the liquid phase
offers more diffusional resistance than the gas phase, the effective reaction.rate in
lhe cases may well decrease with an increase in the liquid holdup. Furthermore.
if the i!l.tnWar.ticle-.resis.tlJ.ps.e is important. the reaction rate win depend strongly
-o-;l:he amount of liquid in the catalyst pores.
In a dynamic situation, the tot l liquid holdup is the sum of the operating
holdup and static hol.duR: Static holdup is the amount of liquid in the bed after
the Ii{juid inlet is shut off and the column is allowed to drain. The static holdup
largely represents the Ijguid re!ai.nep in the _ pore volume of the catalyst and
depends mainly on the nature of the catalyst used. It also depends somewhat
upon the packing arrangements in the column. Operating holdup. which largely
represents the liquid external to the catalyst particJe , depends upon (in addition
to the catalyst or packing) the liquid and gas flow rates. the liquid and gas
properties such as viscosity, density and surface tension, the reactor dimensions.
and the liquid and gas distributor design.
When the reaction occurs only in the liquid phase, only dynamic or
operating holdup is important for kinetic data evaluation. However, when the
reaction occurs both in the liquid and gas phases, barh st tjc and dynamic liquid
holdups affect the reaction rates.
"
DYNAMICS OF THE COCl:RRENT-DOW1\;FLOW FIXED-BED CQLUMN 191
<>
E
::s
"0
>-
....
o
t>
'"
M
E
'-'
....
Q)
P.
"0
: 0.01
----........
-
... PorouS ca tal ys t
0.[
0.001
I
[0
E
...
.s::.
Eo = Pl g c1 l
°1
',
---- . Figure 6-5 Corre[allon of the
h dup yt Eotvos
numhcl. -
The liquid holdup is largely measured by a tracer technique. In this technique
the total liquid holdup (dynamic -I static) is obtained by muJtiplying the liquid
flow rate by the f!lean residence time. There are a large number of holdup
correlations reported in the literature. Since some correlations are for the total
liquid holdup and some for the dynamic holdup. propcr precautions should be
taken in using these correlations. The liquid holdup has been defined in terms
of either void volume or the total volume of the column
The static liquid holdup is often correlated by the £otvos number, Eo
(= Pl.gd /(Jl' where d p is the nominal particle iameter and 9 the gravitational
acceleration). Such a correlation I 03 is illustrated in Fig. 6-5. The correlation
indicates that smalIer particle diameter and fluid density and larger . surface
tension give larger static liquid holdup. The correlation also indicates that a
porous material gives a larger static liquid holdup than a nonporous material.
BasicalIy, two types of correlation for (he dynamic or total liquid holdup are
reported in the literature. .Some investigators have correlated the liquid holdup
directly to the liquid velocity Sind fluid properties by either dimensional or
dimensionless relations. In more recent investigations, the liquid holdup is
correlated to the Lockhart-Martinelli parameter /1Pl/J1PG (or an equivalent of it.
as discussed in the earlier section).
Schoenemann M8 examined the liquid holdup in trickle-bed reactors used for
hutynediol synthesis. The data were obtained in a technical reactor 16 m high
and 0.8 m in diameter and in a pilot-scale reactor 3.5 m high and 32 mm in
diameter. Cylindrical silica catalyst pellets of 4 mm diameter were investigated.
Th 'r sI11ts s\1Q .ed th<l U he )jquid._h. .9ld.!J. J,:Lwasin depi"nc1p.nt of b_ Qth the gas and
liq'Jid t.'JO UJ rates {in the rang e of .Lthr.ough-+G n+--ft=-lt.and wa s--influellfectby
192 GAS-LiQUID-.SOLID REAClOR DESIGN
.the nature of packing materials. e.g., M l'I ity cl.p'£"cki g . lapidus 47 and Schiesser
and Lapidus 82 showed that the Tl) ang..the totaJ.liquid holdllp depend upon
tbe.por sity of packing and the radial variati.Qn..m...thdiquid flow. Methods were
discussed for separating the hydrodynamic and diffusional contributions to the
residence-time curves. The data for the RTD and the liquid holdup were also
obtained by Glaser and Lichtenstein,32 Glaser and Litt,33 Ross. 73 Prost and
LeGoff. 68 and, most recently, by Schwartz et at. 84 Beimesch and Kessler 6 measured
the liquid holdup in the 'J2Ulse(H lo.w...m . No correlations between the liquid
holdup and the system parameters were. however, obtained in these studies.
Some investigators correlated their data for the liquid holdup in terms of
dimensional relations. Satterfield and Way81 suggested a relation
Iz OL = AV eIlU4 + B, (6-25)
where VOL is in centimeters per second and ilL in centipoises. The constants A
and B are characteristics of the particle size and shape. For the three packings
studied. their values are shown in Table 6-2.
Jesser and EIgin 44 showed that their data with 12,7-, 19.1-, and 25.4-mm glass
spheres, 25.4-mm Berl saddles and 12.7-mm carbon rings indicate that hot oc
vgi2 '00.67
Except for those described above, all other investigators correlated their data
for the liquid holdup in terms of dimensionless correlations. Otake and Okada 65
correlated the..A.Ylli!!!!.Lc__ up for 6.4- through 22-mm spheres by a
relation /, .
./ Iz dL = 1.294 (Redo. 676 (Gad 0.44 (oA,), 10 < ReL < 2000, (6-26)
)1))
and for broken solids they reported
Iz dL = 15.1 ReE.6 7 6 GaL" 0.44 (a.dl')-O.60,
10 < ReL < 2000,
(6-27)
and
Iz dl = 2Ll ReE.51 GaL" 0.44 (a.d p )-O.60, om < Re L < 10, (6-28)
where a. is the total geometrical external surface area contacted by liqUId per
unit volume of the column, ReL = PL V Ldp/J-ILo and GaL (the Galileo number) =
d gpUIl . Other similar correlations are those by Hochman and Effron,39 namely,
h dL = 0.00445 ReE. 76 for 4.8-mm glass spheres, (6-29)
Table 6-2 Constants A and B in Eq. (6-25)
Packing A B
1.6-mm cylinders 0.2[8 0.025
3.2-mm cylinders 0.188 0.02
3-mm cylinders 0.102 0.01
DYNAMICS OF THE COCURRENT-DOWNFLOW FIXED-BED COLUMN 193
and by Davidson et aL 21 and Michell and Furzer,54 namely
h dL x (Rer)o.3 (Gad- 1/3 (a,d p )
for 1.Q.3=. 25.4-, and 50.8-mll1 Raschig and Lessing rings.
Here, Rer = 4P L b r fJdJ1.L, b r is the laminar film thickness, and V L is the mcan
velocity ofliquid mm. Similar correlations were obtained by Michell and Furzer 54
for 0.635- and 2.54-cm rings as
/hdL = 0.68 Re .80 Ga.-:-O. 44 (a,d p )
and, most rece 7 ntly, by Colombo et al. 20 as
h dL = 3.86 (Redo. 565 (Gad-O.42 (a.d p jf,)°.65 (6-32)
for crushed carbon particles of 0.1 cm and carbon cylinders of 0.38 cm x 0.48 cm.
Here, a. = 6(1 - e)/d p .
Other similar relations for the dynamic holdup have been developed by
Buchanan,s Ge1be,29 Mohunta and Laddha,57 and Van Swaaij et aL 103
Buchanan 8 studied R,aschig rings and found that ,for 0.05 < ReL < 1, h dL if Rei,3
and for 10 < ReL < lcP:1i L a:- ReL.'Odbe 2 !l fOTInd-a--simita- nte pen d ence o t h dL on
ReL for a variety of rings when ReL < 1. However, for 1 < ReL < 10 2 , he noted
h dL IX Rei/II. Mohunta and Laddha 57 studied rings and sphere packings and
found h dL x Re .75, a result similar to the one obtained by Van Swaaij et al.,103
who studied Raschig-ring packing and noted that, in the range 10 < ReL < 200,
h dL x Re .68.
Satterfield et al. 80 studied the liquid holdup characteristics of flow over a
string of spheres. Based on their data with 0.825-cm-diameter spherical porous
, l}'st pellets of palladium-on-alumina they proposed the following dimension-
less relation for the dynamic liquid holdup:
h dL _ 198N ( QLPLn ) I/3 ( ptgd ) "J
d 3 -, ° d 2'
PL p J1.L p . J1.L
(6-30)
(6-31) 3.0 t
J. J 'f
(6-33)
where h dl is the dynamic liquid holdup in gra!TIS, QI. is the liquid flow rate in
cubic centimeters per second. and No is the number of particles. For their
system, the static holdup can be estimated using the relation of Turner and
Hewitt 99 which is expressed as
mLfpLd = 0.41(lTLfpLd g)0.79, (6-34)
where mL IS the weight of the liquid in the lens between two spheres.
Turpin and Huntington 1oO obtained their data with ta_bular alumina particles
of 0.76 and 0.823 cm diameter packed in 5.1-, 10.2-, and 15.3-cm-diameter
columns. The air and water flow rate rang s were 8 through 2,400 g cm - 2 h - I
and 2,400 through 20,000 g cm - 2 h - I, respectively. The data for the total liquid
holdup' were correlated using a somewhat different type of relation:
h L = -0:017 + 0.132(GLfGdo. 24 ,
LO (GLfGdo. 24 6.0.
(6-35)
t,arkins e.t al. 48 obtained their data with a variety of gas, liquid!. and solid
194 GAS -LIQUID SOUD REACTOR DESIGN
systems, as shown in Table 6-3, and their data were correlated by Turpin and
Huntington I 00 by a relation similar to Eq. (6-35):
h L = -0.082 + 0.1 54(GdGdo.Z4, 1.0 (G L /Gdo. Z4 6.0. (6-36)
In more recent investigations, the liquid holdup is correlated to the Lockhart -
Martinelli parametcr Xl = tJ.Pt/tJ.PG or to some other equivalent. Larkins et al. 48
correlated their data by Eq. (6-6). Reiss 70 showed that this data with dumped
t27-cm rings and stacked 2.S4-cm rings agreed fairly welI with the predictions
of this equation. AbbO.L1---&t-al.-.!----ffiffiGa-te.d that for .hY.9TOpTO_ces i1Jg mt ms a_
_ be.Her correlation is given by Eq. (6-7). -.
Un-fike Lark ins et"af 48 and Abbo tt et al.,l Sato et at 75 assumed that the
total liquid holdup dep nds on the specific surface area of the bed as well as on
an energy parameter. They correlated their data for the air-water system obtai.ned
in 65.8- and I 22-mm-i.d. columns packed with six different sized packings between
2.59 and 24.3 mm diameter by a relation
h L = 0.4a I.3(XI)0.12,
in which
0.1 < X I < 20,
a = 6(1 - t;)/d\
I I( 4lf p )
J = d p I + 6d:(l _ f.) ,
Table 6-3 Systems investigated by Larkins et al. 48
Gas
Liquid
Air
Air
Air
Water
Water
Water (2.5 weight pcrccnt
melhyl-cellulose)t
Water (0.5 welgh[ percent
methyl-cellulose)
Water (0.033 weight percent soap)
Ethylene glycol
Ethylene glycol
Kerosene II
Kerosene II
Lube oil
Lube oil
Hexane
Air
Air
Air
AIr
Natural gas
Natural gas
Natural gas
Carbon dioxide
Carbon dioxide
t Mildly foaming.
::: Severe foaming.
II Severe foaming dt high rates only.
P(}cking
(6-37)
(6- 38)
(6-39)
Column
diameter
(cm)
O.95-cm Raschig rings
0.95-cm spheres
O.95.cm Raschig ring
0.32-cm cylinders
0.32-cm cylinders
O.95-cm Raschig rings
O.95-cm spheres
0.32-cm cylinders
3-mm spheres
3-mm spheres
3-mm spheres
3-mm sphcres
10.2
10.2
10.2
10.2
10.2
10.2
10.2
5.1
5.1
5.1
5.1
5.1
DYNAMICS OF THE COCURRENT-DUWNFLOW FIXED-BED COLUMN 195
where de is !1 colUtJln d.iameter. Matsuura et al. 51 indicated that their data with
glass. sphere packing ranging from 0.12 through 0.43 cm in diameter would fit
Eq. (6-37) if the coefficient in this equation were to be 0.19 instead of 0.4, as
suggested by Sato et al. 75
Bakos and Charpentier,5 on the other hand, used a more complex relation-
ship, namely,
loglo Ill. = Po + Qo loglo XII + Ro (loglo X] If. (6-40)
The parameters Po, Qo, and Ro for various packings are described in Table 6-4.
A typical comparison between the predictions of the above equation and the
experimental data of Charpentier and Favicr 14 is shown in Fig. 6-6. The figure
also shows that the data of Charpentier and Favier l4 do not correlate so well by
Eqs. (6-6) and (6-37).
Midoux et al. 56 correlated their data with a variety of non foaming liquids
and the packing size and shape by the relation
0.66(XJ 1)0.81
I1 L = "1 + 0.66 ( X 11 )0.8] ,
0.1 < XII < 80.
( 6-4 ])
Their data with a variety of foaming liquids 12 . 13 ,14 were similarly correlated by
the relation
0.92(X II )0.3
h L = I + 0.92(X] 1 ) 0.3 ' 0.05 < Xl J < 100. (6-42)
For hydrocarbon liquids, Midoux et al. 56 recommend the use of Eq. (6-41) for all
flow regimes for nonfoaming liquids. For foaming liquids, they recommend the
use of Eq. (6-41) for the trickle-flow regime and the use of Eq. (6-42) for all other
flow regimes. 12
Specchia and Baldi 90 presented separate correlations for the dynamic liquid
holdup in the poor interaction regime (i.e., gas-coI1'tinuous-fiow regime) and the
high-interaction regime (i.e., pulsed and spray flow). In the poor-interaction regime.
they presented a relation
..---.-.... \
h d ], = 3.86 (Redo. 545 (Gat)-0.42 (a.d p /f.)°.65,
where the liquid-phase Reynolds number, ReL, is defined in terms of superficial
liquid velocity. The modified Galileo number is defined as
Gat = d pdpLg + bLd/J-I.£, (6-44)
Table 6-4 Constants Pu, Qo, and Ro for Eq. (6-40)5.10
Packings Po Q() R(}
Raschig rings -0.570 0.165 -0.095
Porous and nonporous spheres -0.280 0.175 -0.047
Pellets -0.363 0.168 -0.043
--. .--
'I'
196 liAS-LlQUID-SOUD REACTOR DESIGN
0.5
..J
.."
0.2
0.1
+ 20 P.:';. t_ _ _ _
---
----
,_--- -20 percent
....'
,
'" ",'"
..,.. ,..'"
"" ,..
"" '"
// / /
-",
..J
-<:
0.5
0.1
...L...L 1.
1
L I
10
Xl
I
100
I
...
-<:
0.5
0.1
+20 percent
0.1
System
Water-air
.--Wa.w-:=aiL-- _
Cyc1ohexane-air
Kerosene-air
Water-air
Cyclohexane-nitrogen
Gasoline-carbon dioxide
Gasoline-nitrogen
Gasoline-heliun1
Desulfunzed gas oil--.:arbon dioxide
Desulfurized gas oil-air
Desulfurizw gas oil-helium
Nondesulfurized gas oil-carbon dioxide
I'ondesulfurized gas oil-air
Nondesulfuriz d gas oil-helium
Kerosene-air
Kerosene-nitrogen
Petroleum ether-nitrogen
Petroleum ether-carbon dioxide
I 10
XII
Packing Key
Spherical catalyst and
glass spheres in a
I 0 em Lit column
Spherical catalyst
Spherical catalyst
Spherical catalyst
Cylindrical catalyst I
Cylindrical catalyst 2
Cylindrical catalyst 2
Cylindrical catalyst 2
Cylindrical catalyst 2
Cylindrical catalyst 2
Cylindrical catalyst 2
Cylindrical catalyst 2
Cylindrical catalyst 2
Cylindrical catalyst 2
Cylindrical catalyst 2
Cylindrical catalyst 2
Cylindrical catalyst 2
Cylindrical catalyst 2
Cylindrical catalyst 2
o
I)
()
o
6.
.
.
.
+
X
).,
i
1\
.J..
o
.
I
:t:
Figure 6-6 Comparison of total liquid holdup with predictive correlatIons GL = 5 kg m - 2 S I (from
data by Churpemier tlnd Fal:ier 14). (a) Comparison with Eq. (6-6), (b) comparison with EQ. (6-37),
(e) comparison wIth Eq. (6-40).
,J
DYNAMIC'S OF THIi COCURRENT-DOWNFLOW FIXED-BED COLUMN 197
w r .is Jh tw. phase fr.a.c1iQnaLPr ..dro11
regime, they presented relations
h dl = aTZN1. 1 r'(tl s d p /E)o.65, '-,
)
In the high-interac ion
where the constants
(6-45)
a' = 0.125,
a' = 0.0616,
h' = -0.312 for nOnfOf\mingJiqu.i9s, }
h' = -0.172 for foaming IiQ.uids.
(6-46)
The brief review described above indicates that a large amount of data for
both dynamic and total liquid holdup under tr.ickle-, pulsed-, and spray-flow
conditions are reported in the literature. The range of variables and physical
properties examined in these studies can be roughly stated as 0.3 < Rel < 3,000,
0.4 mm < d" < 50 mm, 2.6 < asd p < 6.02, 14 < Gal < 320 for particle shapes
consisting of Raschig rings, Berl saddles, spheres, and irregular granules, Both
foaming and nonfoaming liquids have been examined. Although there are
significant discrepancies in the predictions of various correlations, as shown by
Fig. 6-7, qualitatively they all indicate that the liguid holdup ul)der trickle-flow
..Qnditions increases with liquid velocity and is essentially independent of the gas
I.!ow Jate. Although not completely clear, an increase in particle size appears to
decrease the liquid holdup. 1\n increase in Galile.o number for the liquid also
dec a the liquid holdup.
6-3-1 Theoretical Models
Tht-ee theor ti{;;at odels for the predictions of liquid holdup in a trickle-bed
r c;tor ar worth noting. As described in the.earlier section. Hutton and Leung 42
1.0
0.6
0.4
0.2
-' 0.1
."
0.06
0.04
0.02
0.01
10- 1
"-rh-.JIa{\L
.,.
.,.
.,.
,>" ,,/
'<;!.'I> "
v ?:>/"
o/
,/>'1>/
..;;. '(/
CJ';'.,,/
"
Hochman
and Effron 39
10°
10 1
10 2
[jquid Rcynolds number. Re L
Figure 6-7 Dynamic liquid holdup as a function or liquid Reynolds number. 4
198 GAS-LIQUIO SOLID REACTOR DESIGN
c<?!. I'tted..the-lKru-id holdup to two phase.pressure drop. If the latter is known,
. the former can be estimated from their theoretical relation. Reyni and
Charpentier 7 ] present Q a SD.".called "stratified-pore model" to estimate the liquid
'holdup fromJhe single-phase pressure-drop lJ1e. surem nts. --
The most recent. theoretical model for the liquid holdup under trickle-flow
conditions is by Clements. I 7 He developed a theoretical model for the liquid
holdup by assuming that the packed bed could be treated as a bundle of
capillaries, each containing equal fractions of the overall gas and liquid flows.
The capillary dimensions are functions of the particle size. the ped voj.4-fra l ion .
and the particle shape. The model also assumed that (a) the fractional pressure-
drop contributions ",f the liquid to the overall pressure drop are negligible, (b) the
gravity effect in the liquid phase is negligible, (c) the overall pressure drop across
the region of interest is low enough to allow gas-phase properties to be taken as
averages of entry and exit values, and (d) no slip occurs at the gas-liquid interface.
The model did not take into account the effects of variation in hed parameters
and the intercapillary fluid exchanges on the liquid holdup. Based on his model,
Clcments proposed a relationship
I1 dL = a"(ReG Wee/Red", (6-47)
where RCG, WeG, and ReI, are as defined by Eq. (6-18). h dL is the dynamic liquid
holdup based on the total column volume. The values of a" and n depend upon
the nature of the fluid. Clcments l7 also measured the dynamic holdup under a
wide range of system conditions. The range of experimental variables he tested
arc shown in Table 6-5. Based on his data. Clcments l7 reported a" = 0.245.
n = -0.034 for silieone oil and a" = 0.111, n = -0.15 for water. h should be
noted that. unlike all other relations, this relation predicts a strong effect of the
gas velocity on the dynamic liquid holdup. As a matter of fact, according to
Eq. (6-47), h dL 'X" (UOI,/U&Gr.
Ross 73 points out that at the same temperature and pressure a commercial
hydrodesulfurization reactor gives poorer performance (i.e.. less conversion of
Table 6-5 Range of experimental varia hies tested by Clements l7
Variable
d., column diameter (cm\
dr. effective particle diameter (cm)
&. p<lcking porosity
Uoc,. velocit} of gas (cm s ')
U Ot , velocity ofliquid (cm s- I)
pc;. viscosity of gas (g h - I cm 2)
PL. viscosity of lil)uid (g h - 1 em - 2)
PC], density of gas (g em - 3)
Pc. density of liquid (g cm - 3)
h dL . dynamic liquid holdup
Minimum
5.09
0.104
0.33
1.27
0.067
0.446
35.9
O.OOOfi9
0.82
0.083
Maximum
10.18
0.51)3
0.520
130
6.97
0.673
294.6
0.0066
0.995
0.7U2
DYNAMICS OF THE COCURREKr-DOWNFLOW FIXED-BED COLUMN 199
sulfur) than a pilot-scale reactor. Both gas and liquid velocities in a commercial
reactor are an order of magnitude larger than in a pilot-scale reactor. Clements'
correlation I indicates that the dynamic liquid holdup in a commercial reactor
would be less than in a pilot-scale reactor. This may cause the commercial reactor
to perform poorly.
j.8ecommelldations l!the_ xp rimcJ)tal cllita are not av.ailable, as a first appre!'Ci-
aj:iQD. the static liquid holdup can be estimated from the correlation shown in
Fig. 6-5. For the calculations of dynamic liquid holdup, use Eq. ) under
tr.ick.J€--flo.w.-ro-n d Eq. (6-45) sed--af}d spr y-f1ow conditions.
For hYQro rb9nJiquids,} 9..J(HJ) is recommended for the calculation-.of total
liquid-lilllPlIPlor.@.ll fk,.wYcgunes: (or nonfoaming. liquids. For foaming liquids,
use Eq. ( 41) for {he.trickle-flow condition and Eq. (6-42) for all other flow
regimes. A theoretical understanding for the liquid holdup in the pulsed- and
spray-flow regimes is nt:.eded.
- - --
6-4 RADIAL AND AXIAL GAS AND LIQUID DISTRIBUTIONS
The liquid distribution in a packed tower has been studied by various investi-
gators. 3 ,7,9.4 1 The most recent study Qn radial liquid distribution in cocurrent
two-phase down flow in a packed bed is by Sylvester and Pitayagulsarn. 96 These
investigators found that experiments with three types of packings (a) cylindrical
pellets 0.32 cm x 0.32 cm. (b) 0.634-cm ceramic Inlalox saddles. and (c) ceramic
Raschig rings 0.634 cm o.d. x 0.158 cm thick x 0.634 cm long in the range of air
fluxes 17.2 through 343 g h I em 2, water fluxes 1,310 through 7.260 g h - 1 cm - 2,
and packed-bed heights of 15,30,66, and 9] cm showed approximate plug flow
of liquid in the column. At a constant liquid flow rate and higher gas flow rates,
the liquid flowed faster at the center of the bed packed with pellets and Intalox
saddles. but not with Raschig rings. Moving away from the center (0.2 r/ro 0.8),
good plug flow was observed. Near the wall, the liquid flowed slower, depending
on the type of packing, bed length. and liquid and gas flow rates. At a constant
liquid rate, the gas rate had more effect on the liquid distribution. The increased
gas rate gave more liquid velocity at the center but. in general. the gas rate mildly
affected the shape of the radial liquid velocjty profile. A flatter radial liquid
velocity profile resulted at higher liquid flow rates. At higher gas rates, the liquid
flow rate had less effect on the radial liquid distribution than at lower gas flow
rates. For a certain range of liquid flow rate, operation at higher gas flow rates
resulted in a better liquid distribution. The liquid flow rate had no important
effect on the shape of the radial liquid velocity profiles.
Sylvester and Pltayagulsarn 96 also found that the bed of pellets operated at
high liquid flow rates and low gas flow rates wa!> unstable. A larger bed height
increased the stability of the system and resulted in a better plug flow. Over the
entire ranges of variables studied, a system consisting of Raschig rings or Intalox
saddles was stable and the Raschig rings gave the best plug flow.
jC)
200 GAS- LIQUID-SOLID REACTOR DESIGN
The radial liquid-gas distribution in a cocurrent-downflow system has also
been studied by Reiss 70 and Weekman and Myers. 104 Reiss 70 concluded that
radial liquid distribution was a function of bed height, and gas and liquid rates.
Weekman and Myers 104 found that the liquid flow tended to concentrate near
the wall and also at the center of the bed. Increasing the gas flow rate had the
general effect of giving a more uniform radial liquid distribution. Hoftyzcr 4t and
prost 67 employed an electrical conductance technique to study liquid distribution
on the packing in the gas-continuous regime (i.e.. trickle-flow regime). Using
dumped Raschig rings, Hoftyzer found an irregular distribution of liquid in which
the greater part of the liquid flowed over 5 percent of the surface, and 50 percent
of the surface was hardly wetted. Prost concluded that the velocity and direction
of gas flow influenced the local characteristics of the liquid. Hochman and
Effron 39 measured residence-time distribution for liquid and gas phases and
showed that, in a trickle-t3ow regime, almost no radial liquid or gas velocity
gradients exist.
The distributions of gas and liquid in the pulsed-flow regime have been
studied by Weekman and Myers l04 and Beimesch and Kessler. 6 The former
investigators found that, in the pulsed-flow regime, at high liquid flow rate, the
pulses tend to coalesce as they move down the column. Thus, the frequency of
the pulses would be slightly lower at the bottom than at the top. These pulses
b-
6 b
5 1/_ 0 -
I 4 6f _0
'" 0 0
'"
'" fl /0
'"
:; 3
8
4,,"'- 0
2 I
06-
2,500
5,000
7,500
10,000
12,500
G L , (g watcr h- I cm- 2 )
Air-water system
Bed depth, 79.25 cm
GG = 220 g air h- I cm- 2
6 0.38 cm TCC bcads
a 0.475 em glass spheres
C 0.65 cm alumina spheres
Figure 6-8 Effect or packing size 011
pulsing frequency (fi-om data of Week-
man and Myers '04 ).
DYNAMICS OF THE CO,URRENT-DOWNFLOW FIXED-RED COLUMN 201
120
o
E
90
..:;
'c;
'"
:3
Co
'-
o
60
,
6
\\\ \ 0-
\ \ O rA
't'\S! O D
e e -
....
.c
CI;
.0:;
:I::
30
o
o
5,000
10,000
15,000
G L (g water h l cm- 2 )
Ai r-water system
Bed depth, 117.35 cm
'!J. = 0.475 cm glass spheres
l.ic; (gairh] em 2)
a 147
o 220
6 294
. 392
a 490
Figure 6-9 Effect of liquid rate on
height of pulsing unit Urom data of
WeekmalllllJd Myers 104).
do not bridge the entire column diameter but, rather, have the shape of a wavelike
torus. The typical effects of liquid velocity and the packing size on the pulsing
frequency obtained by Week man and Myers are illustrated in Fig. 6-8. The pulse
velocity increased with both gas and liquid velocities. However, for a given gas
velocity, the height of the pulsing unit showed a minimum with respect to the
liquid velocity. Some typical results obtained by Weekman and Myers l04 are
shown in Fig. 6-9.
Beimesch and Kessler 6 measured the liquid-gas distribution in the pulsed-flow
regime and found that the flow distribution was significantly aftected by position
in the bed, nature of the packing, and gas flow rate, but it was relatively insensitive
to the liquid flow rate. A new model for the phase distribution was proposed.
which included liquid fingers at the center of the pulse and centered around
202 GAS LIQUID-SOLID REACTOR DESIGN
1'/1'0 = 0.667, where 1'0 is the radius of the column and,. the radial distance
measured from the center. A gas channel was present, centered around 1'/1'0 =
0.833, and low liquid fractions were present in the remainder of the radial
positions. They suggested that this gas channel would provide a zone of high
resistance to the radial heat and mass transfer. The finger of liquid would depend
on the colurnn-diameter-to-particle-diameter ratio. The data of Beimesch and
Kessler 6 indicate that the average volumctric liquid fraction of the primary liquid
portion of the pulse 111 their experiments was 0.4; the similar value in the primary
gas portion of the pulse was 0.08.
Rl!mmmendat;ons From the reactor-design point of view. it would be worthwhile
to ohtain some correlations between the radial liquid distribution and the reactor
conditions (e.g., packin size, reactor size, gas and hquid flow rates, liquid
properties, etc.). The correlations are needed for both trickle-flow and pulsed-
flow conditions.
6-5 EFFECTIVE CAT AL YST WETTING
Since, in many hydroprocessing trickle-bed reactors, reaction occurs in the liquid
film surrounding the catalyst particles, it is important that all the catalyst be
\Vetted by the liquid in order to use all active catalytic sites et"fec"tivdy'- The
effectiveness of the catalyst wetting, of course, depenos upon lhe..tiquid-tmidup
as well as proper distribution of liquid. It is commonly accepted that, in com-
mercial hydroprocessing reactors, all the catalyst particles are completely wetted
by the liquid. In bench-scale trickle-bed reactors, on the other hand.. t _liguiQ.__
!low rates are small and visual observations indicate that the liqu d---flo.ws
dQ. !, .!.ds in rivulets which tend to maintain .their. position with....time-..Some
particles are covered with a trickling liquid film while others, although wet, an::
without a liquid film on the surface. This type of flow nonuniformity can cause
the ineffective wetting of the particles at Reynolds numbers as high as 5S (i.e., liquid
flow rate of 1200 g h - 1 em - 2).
Mears,B Paraskos et al.,66 Montagna and Shah,5s and Montagna et a1. 59
have recently shown that iQeffective ca t1!!Ys! _'Yetting can cause the. reactor
performance to be dependent on the liquid velocity:'.ThtY used a correlation-of
Puranik and Vogelpohl 69 for the effectively wetted surface area of the packing
to explain the effects of liquid hourly space velocity and the length of the catalyst
bed on the performance of bench-scale HDS reactors.
Several other reports have also shown the importance of effective catalyst
wetting on the performance of a bench-scale trickle-bed reactor. Hartman and
Coughlin 37 concluded that for sulfur dioxide oxidation in a____ o e -
trickle-bed reactor packed with carbon particles, the catalyst was not completely
wet at low liquid flow rates (of the order of S x to 4 cm s t). Sedricks and
Kenney86 found that, during catalytic hydrogenation of crotonaldehyde in a
cocurrent trickle-bed reactor, !i.9 i __. seer Lint-O dry palladium-on-al . na
DYNAMICS OF THE COCURRENT-f)OWNFWW FIXED-BID COLUMN 203
pellets, causing a decrease in the r:.. a.c;tiQ!Lxa e. The reaction rate was dependent
on the "packing arrangement and whether or not the bed was preflooded. Satter-
field and Oze)?9 found the elft::ct of liquid flow rate on the catalytic hydrogenation
of benzene in a cocurrent trickle-bed reactor. Satterfield and Way81 studied the
effect of the addition of an inert liquid into a gas-phase catalytic reaction. They
studied the isomerization of cyclopropane to propylene on a silica-alumina
catalyst using a variety of hydrocarbon liquids (total of three) in a trickle-bed
reactor. The addition of an inert liqu-id was found to have a significant effect on
the reaction rate.
The effect of catalyst wetting on the performance of a bench-scale trickle-bed
reactur was also theoretically evaluated by Sylvester and Pitayagulsarn.'!4,95
Using the mcthod of moments of Suzuki and Smith,93 they developed a procedure
to show the combined effects of axial dispersion, external diffusion, intraparticle
diffusion, and surlace reaction on the conversion for a first-order irreversible
reaction in an isothermal trickle,.hed reactor and evaluated the effect of catalyst
wetting on these combined effects.
Apart from a nonuniform feed of the liquid phase, there is, in the case of a
poorly designed liquid distributioo system, an incomplete contact between the
catalyst particles and the flowing liquid phase, particularly at 10w Uil!!i.cll .9adi I}
In this case, a large portion of the liquid ftows"downwardaJo-ng the rcactor walls
and predominantly in rivulets through the large spaces between the packing
species; not as a coherent film completely enveloping the catalyst particles. These
two effects lead to a so-called contact efficiency between the liquid and solid. In
the case of nonporous packings, this contact efficiency seldom exceeds a value of
0.8 under film-flow conditions and. in some cases, a contact efficiency of as low as
0.2 is obtained. In the case of porous packings. two types of wetting can be
defined. (a) Internal wetting or pore filling, i.e.. the liquid volume inside the
catalyst pores. This is a measure of internal (active) surface potentially. available
for the reaction. This can be significant since, in some cases, the packing can take
up to 25 through 33 percent of their dry weight in liquid. Due to capillary action,
th!.s type. .of wetti g is usually complete. (b) Externa effective wetting, i.e., the
amount of the outside area of the packing effectively contacted by the liquid.
Almost all the mass exchange between the if!.tc:;rna]-liqu5d and the flowing liquid
occurs through this area. External effective wetting may be different from physical
exter al we_ ting, since the pellets are very' likely to contact semistagnant liquid
zone's that contribute ery little to the mass .!!. r.
At present, very little is known on how the liquid "solid contact efficiency
depends upon the gas and liquid flow rates. It is known that higher ga? 3: d Jiquid
. loadings can improve the contact efficiency. However, it is not clear what effects
-the wettability of the particles and the heat effects occurring during the chemical
reactions nave on the contacting efficiency. A ma1kr .s.urface...J.ension or higher
\jscosity of the liquid appears to increase the contacting efficiepcy.
Generally, it is believed that higher dynamic ho]dupleads to better contacting
efficieney. LeGoff,4'J however, broke down the liquid holdup into three parts;
(a) an isolated part (termed droplet), (b) an anisotropic part (termed rivulets), and
/\J 204 GAS-LIQUID SOUD REAr'IDR DESIGN
(c) an isotropic part (termed film). A large portion of the droplet part is the static
holdup, which remains unchanged with the increased gas and liquid flow. In a
wettable packing, the film region increases with the gas and liquid flow rates. [n
wettabk.p.l! Is-it1g, an increase in gas flow causes no change in the rivulate
percentage. The contacting efficiency is, thus, directly related to the isotropic part
of the tDtalliquid holdup.
Satterfield 78 defined the contacting effectiveness in a chemical reactor in terms
of the pparent kinetic co n stant (k!'H ) obtained in the fixed-bed reactor and the
actual kinetic constant .JkJ. ob ained in the continuously-stirred-tank reactQT.
Based on the literature data, he correlated the contacting effectiveness to the
liquid loading, as shown in Fig. 6-10. Koros 45 studied the effects of catalyst-bed
packing characteristics as well as liquid m ss velocity on the contacting effective-
ness. The reaction studied was the charcoal-catalyzed decomposition of hydrogen
peroxide to water and oxygen. This reaction was carried out in a mixture of 0.3
weight percent H 2 0 2 , 87 weight percent methanol, and 12.7 weight percent water.
:rhe effects of .!ig,yiQ.!!!ill 9!Y, flow uniformity, radial mixing, particle shape,
size, interstitial bed geometry, and reactor diameter on the contacting effectiveness
were examined. The following conclusions were made in this study.
1. Although the value of critical liquid mass veJocity for kapp/kv ""' I is above
0.3 g em - 2 S 1, it is not a universal constant. It is a function of reactor
geometry and catalyst-bed packing and in some instances, no effect of mass
velocity on the contacting effectiveness can be observed.
2. There is Jittle correlation between flow uniformity and the contacting effective-
ness. The contacting effectiveness increases even when flow uniformity remains
poor.
3. The interstitial bed geometry, catalyst shape, and size play important roles in
the contaeting effectiveness. .
4. At high liquid mass velocities, good contacting effectiveness can be obtained
even for reactor/catalyst diameter ratios as low as 1.4/1.
->1 1.0
---
""
!i'
"" 0.8
U>
'"
c:
" 0.6
:t:
u
OJ 0.4
co
c:
-
u
0.2
c:
8
0.001 0.005 0.01 0.05 0.1 0.5 1.0 5.0
Gdg cm- 2 s-t)
!Figtln:. 6-10 Contacting effectiveness as a function of liquid loading (as proposed by Satterfield'8).
,
f
DYNAMICS OF THE COCURRENT-DOWNFLOW FIXED-BED COLUMN 205
Colombo et aL 20 defined the liquid-solid contacting efficiency for a chemical
reactor in terms of the ratio of the apparent (D iapp ) to the actual (D I ) internal
diffusivity of the cata]yst particle. They showed that the contacting effectiveness
defined in this way increased with the liquid flow rate: a result qualitatively in
agreement with the one shown in Fig. 2-5. The ratio Diapp/Dj also depended on
packing size and on the molecular diffusivity of the reactant. The latter influence
was interpreted as due to the semistagnant liquid pockets that may exist in a
trickle bed. A change in the molecular diffusivity changes the mass-transfer
coefficient between the semistagnant liquid zones and the flowing liquid. This
affects the relative importance of the mass-transfer fluxes between the particles
and both the dynamic and the semistagnant liquid, and leads to a variation of
the apparent mean diffusivity value. Thus, they proposed that an evaluation of the
contacting effectiveness should consider the effect of semistagnant liquid pockets.
All the correlations for the contacting efficiency r]c (= total catalyst area
contacted by liquid/total catalyst surface area) reported in the literature are for
nonporous packing. These are summarized by Schwartz et aL 84 and Table 6-6
Table 6-6 Contacting efficiency correlations for nonporous packing (after Schwartz
et aI. 84)
Schulman eL al. :"9
'I. = 0.24(GLfGG)O.2S (12.7-,25.4-, 38..I-mm Raschig rings),
'I. 0.35(GLfGdo. 20 (12.7-, 25.4-mm Berl saddles)
for 5 x 10 2 G L 5 X 10 3 g cm 2 h . " 5 x 10 GG 5 X 10 3 g cm 2 h . I, and 13.4 < Re L <
399.4.
K rauze and Serwinski :46
'I. = 0.655G .36 for 2.88 )( I 0 G L 1.98 X 10 2 g cm - 1 h - I,
'I. = 0.585Gt P for 2.98 x 10 2 G L 2.88 X 10 3 gem - 2h - I
(5-, 7-, 10-, and 17-mm Raschig rings) with 0.75 < Re L < 259.5.
Onda et al. ;63
'I. = I - exp {-1.45 Re .1 Fr;:o.os We .2(o.loL!°'''}
for 0.04 < Re L < 500, 1.2 X 10- 3 < WeL < 0.27, 2.S x 10 9 < FrL < 1.8 x 10- 2 ,0.3 < (!./(h < 2.0,
8.0 < d p < 50.8 mm, 5 x 10 G L 3 X lO3 g cm .2 h - 1 (8-, 17-. 25-, J5-mm Raschig rings; 12.7-,
25.4-mm spheres; 12.7-,25.4-,38.1-, 50.8-mm Bed saddles).
Puranik and Vogelf)(JhI;69
'I. = 1.05 Re? 041 Wef 135 (aL/a,)-0.206 (dynamic),
'1, = 1.045 Ref.o41 Wef.l]] (aL/oJ-O. 182 (total)
for 2.1 x 10- 6 < Wel < 1.2 x 10- 1 ,0.3 < ReL < 85, 7.7 x 10- 1 < Fr L < 4.7 x 10- 3 ,0.3 < ada, <
1.0S, 0.08 < aw/a, < 0.8,9 x 10 < G L < 4.32 X 10 3 g cm- 2 h-\ 0.5 < ILL < 13 cP, 25 < aL < 75
dyne cm - I, 10.0 < do < 37.5 mm.
OlJdu et al.: 62
'1, = 1 - 1.02 exp {- 0.278(G L /a.lldo. 4 }
for column packing with Raschig rings.
ReL Reynolds number (G L d p /lld, WeL = Weber number (Gldp/aLPd, and FrL = Froude
number (GVPLgd p ) (an for liquid phase).
206 GAS-LIQUID-SOUD REACTOR DESIGN
largely reproduces their summary. Schwanz et al. 84 proposed a new method for
measuring contacting efficiency and obtained the data for t7c for both porous as
well as nonporous packings. Their data for the nonporous packings did not agree
with the ones predicted from the correlations of Onda et a!. 63 and Puranik and
Vogelpohl.° 9 They, however, did not present a correlation for their experimental
data.
RecommendatiOIlS Considering the large degree of discrepancy in the predictions
of various correlations, wherever possible the effective catalyst wetting should be
determined experimentally. If the experimental data are not available, the
correlation of Gnda et al. 63 can be used. As shown in Chap. 4, for the proper
design of a pilot-scale trickle-bed reactor, the knowledge of effective catalyst
wetting is important. Further experimental as well as theoretical work on this
subject is needed, particularly for the case of porous packings.
6-6 AXIAL DISPERSION
As discussed in Chap. 3, there are a large number of models proposed to evaluate
macromixing in a trickle-bed reactor. A brief summary of the reported experi-
mental studies on the measurements of RTD in a cocurrent-downflow trickle-bed
reactor is given in Table 6.7. Some of these experimental studies are described in
more detail in a review by Ostergaard. M Here we briefly review some of the
correlations for the axial dispersion in gas and liquid phases based on these
experimental studies.
The experimental studies have shown that, in.gasliquid trickle-bed reactors,
significant axial mixing occurs in both gas and liquid phases. \YJ1en the RTD ata
are correlated by the single-parameter axial dispersion model, the axial dispersion
coefficient (or Peclet number) for the gas phase is dependent upon both the liql!id
a!1d gas flow rates and the size and nature of the packings. The axial dispersion
coeffi ient for the liquid phase is dependent upon the liquid flow rate, liquid
properties, and the nature and size ofthe packings, but it is essentially independent
of the gas flow rate.
Schiesser and Lapidus 82 showed that th ."porosity of the packings could
significantly affect the residence-time distribution and, hence, the axial dispersion
coefficient. This indicates the effect of static holdup on the axial dispersion. Van
Swaaij et al l03 showed that the liquid-phase axial dispersion depends upon t e
ra.tio of dynamic to static liquid holdup (i.e., I1,Jdh,d as long as this ratio is
approximately below 8. If hddhsL > 8, the Peclet number becomes essent iall y
independent of the ratio IJ d dl1 sL . Some results of Van Swaaij et a1. 103 illustrating
this effect are shown in Fig. 6-1"1. Based on these data, Van Swaaij et a1. 103
indicate that, for hddl1'L > 8, the mechanisms for dIspersion under trickle-flow
and single-phase flow are essentially the same.
Tl.!.e Peclet (or Bodenstein) numbers are significantly lower for trickle-Ilow
conditions than in single-phase flow through packed beds. For example, as shown
)
DYNAMICS OF THE COCURRENT-DOWNFLOW FIXED-BED COLUMN 207
in Fig. 6-12, at low liquid Reynolds numbers, Peclet number falls approximately
between 0.5 and 1, while under trickle-flow conditions, PeL is only between 0.1
and 0.2. It is only at high liquid Reynolds number (ReL = 100 through 1,000)
that Peclet numbers for the single-phase and two-phase trickle-flow conditions
/ Table 6-7 A summary of experimental RTD studies in cocurrent-downflow packed-
bed reactors
_____n_ ---- ----
Re"ctor System and flow
Investiga tor Packing Jia meter Reaelor length conditions
--"'/ Michell and fJ.635-em Raschig rings 5.1 em 152.4 em Air-water under trickle.
Furzer S5 2.54-em Lessing rings 61 e11' 121.9 and 243. em flow condilions v
5.I-cm RaschIg rmgs 6] cm 121.9cm
Co and Biband '" 1.27-em. 2.54-em Raschig 12.7,27.''' em J04. em Air-water under Irickle-
rings flow condillom: v
Charpentier cl .a I. t 3 3-mm nonporous gla s 0.1 m 1.58 m Air water. cocurrenl
sphere, 3.mm porou( downflow
molybdenum <:obah
a1umina spheres
Van Sw"",.1 el al. IOJ 6.4-, 103.. and 22.mm 0.1 m. 2.08-2.72 m I\ir-waler under Irickle.
Raschig ril1g 0195 m> flo\\ condillons
Towhidl"" 1.27-cm RaschIg rlnl! 20.3 em 0-2.0.8 em Air-w,,,er under tncl<le.
flow condilions
Stephens" 1.27-. 2.54.om Raschig rings 20.3 em 0-243. cm Air-water under Irick Ie.
flow conditIOns
Sch.esser and Spheres 011.27.cm l!1".., lU.2 em <)1.44cm Air-Miler under trickle.
Lapidus.' 1.27-<:m porous and 110\\ condition>
nonporom.. alumina.
L27-cm porous aILlmmc.t.
0.635-cm moleeula' sieves
Ma] uLlra el LlI.' 1 0.12-,0.26-, and 0.43.<:m 8.0 em 40cm Air--.....aler under Iriekle-
glass spheres flow nllditions
H;nrison et al. 3t1 3.R.cm spheres A vcnical sIring of 128 spheres Air.-w<ller under simu-
1.1 led trlekle.bed
condilions
Lapidus' ' Spherical glass heads. S.! em 91.5 em Air wa tel, all .hydro- ._ -
3.5 mm diameter carhon using lTickle.
Cobalt molyhdale catalyst /low eondnlons
ey]inders. 0.32 em
diameler
Schoenemann MR Silica calalysl pellets, 32 mm 3.5 m BUlynediol synthesis
4 mm diameter 800 mm 16m usinl! mckie-flow
L:onditions
Glaser and Porous and nonporous 0.635 em. CaCh solution-air,
LichtcnsJcin J1 0.16- and O.32-cm 5.' em. and kerosene hydrogen
cylindricat packlngs 30.5 em
Glaser and LUI'u, 10 ] 4 mesh 1''' nIck, 30.5 <:m Wax desulfuriz.llIon
reactor
Ross B Model f 5.1 em 192.6 em Air-water
lo2cm 1,)2.6cm
'"I " to","" "" rn,"' ' . 5.4cm 198.1 cm Calalytic hydrogenation
· ot unrt pellets. 0.48 em t ]98.1 em or pelroleum rraclions
diameter nnd lenglh
CommercIal
unil %0.1 cm
Ho<:hman and 0.48-cm glass beads 15.2cm 198.1 cm "Jilrogen-melhanol under
Effron J " Iriekle-tloweondiuons
\Jo
208 GAS-LIQUID-SOLID REACTOR DESIGN
2
---
....
N
..,r 0.5
....
:;;) 0.4
II
....
"-' 0.3
c...
0.2
.
.
o 0
..
· 0
./60,,;{O
/0/
... 6
/
o
o
0.1
I
2
3 4 5
hdL/h<J
10
20
o
6
.
.
Raschig rings. 6.4 mm wettable
Raschig rings, 10.3 mrn wettable
Raschig rings, 22.0 mm wettable
Raschig rings, ] 0.3 mm non-wettable
Figure 6-11 Axial dispersion as a
fu nction of the ra tio of dynamic to
static liquid holdup. 10]
are comparable and they both appear to achieve an asymptotic limit of about 2.
Just like dynamic holdup, the Peelet number can be correlated to the Reynolds
number and the Galileo number of the liquid, indicating that the Reynolds number
of the gas phase has no influence in pure film flow. 27 .83
Michell and Furzer 55 correlated their data along with numerous other
literature data by a relation
PeL = 1.00 Rer. 70 GaL 0.32. (6-48)
Here, PeL = ULdp/E zL . ReL = d p P L UdJ1L, GaL = d gpUtlt U L is the interstitial
liquid velocity, and E ZL is the liquid-phase axial dispersion coefficient. Furzer
and Michell 28 correlated e Peelet number to the dynamic holdup by a relation
Pel = 4.3(Rel/h d d l/2 (Gad- 1/3) 't5 (6-49)
In this relation. Pei. and Rei. were defined in terms of superficial liquid velocity.
Elenkov and Kolev 24 defined the dimensionless parameters in a somewhat
different manner and presented a relation
I U . 1 _- E 0 068(4U 1 - -. ) 0 78 { 1 -3 2 ) - 0 33
I.. 01. a, ZL = . OL a. \!L' 9 a. \!L '"
'1 .-
Here. a. is the .total dry surface area of packing per unit volume of column. It is
interesting to note that the dependence of Peclet number on the Reynolds number
and Galileo number predicted by Eqs. (6-48) and (6-50) are very similar.
(6-50)
y
DY1\IAMICS OF THF COCURRE r -DOW:-':FLOW FIXED-BED COLUMN 209
The dependence of PeL on GaL' however, outlined above, should not be very
reliable because all the experimental data (except those of Hochman and Effron 39 )
were obtained with air-water systems only. No variations in fluid properties have
been examined. Hochman and Effron 39 correlatcd their data by a relation
PeL = 0.042 Rep.5,
(6-51)
where ReL = U oL P L d p /J.ldl - f.).
Michell and Furzer 54 also reponed a very similar correlation, except that
they used the film Reynolds number. They proposed
PeL = 0.019 Re .50, (6-52)
where Re r = 4D r P L VdJ.lL' Here, Dr is the laminar film thickness and U L is the
mean velocity of liquid film.
Unlike the liquid-phase Peclet number, the gas-phase Peclet number has been
found to be dependent upon both the gas as well as the liquid flow rates. Hochman
and Effron 39 presented a relation
PeG = 1.8 ReCio. 7 IO-O.005Rc,; (6-53)
where Per. = UGdp/E zG , ReG = GGdp/J.lGCI - t;), ReL = GLdp/J.lLO - t;). Here, U G
is the interstitial velocity of gas and EZG is the gas-phase axial dispersion
coefficient.
.... , ""
"t3
r;jl 2i
I.<:j;
Two-phase
trickle-flow
0.2
I
10
100
1,000
Rel == UOLdp/uL
Figure 6-12 Pe and Rel relations for smgle-phase and two-phase trickle flow (lifter Hol};nlln40).
L
Tablc 6-8 Experimental data available in the literature for cocurrent gas-liquid downfJow in packed beds I2
....
:;
Reference
drlmml
Reiss "0
12.51/>1
25 II»
76 II>I
25 lei
Gmnetlo el J. JO.JI
6 1"1
6 In
6 Ih)
6 (hi
N3!",el et al 61
5 (<II
5 (h)
IJfford and Perona 10' 6.3 II»
12.7Ih)
19 I")
Sato et a!." and
Illrose el dl 3"
2.6 In)
5.6Ia)
M 1"1
Shende and Sharma"? 5 (1I1
10 II»
125 (h)
It> (hi
16 (d)
Pack,"!",
d,/cm)
o 72.-O.7S 7. S-IIJ
0.79 0.88
0.7'1
0.68 41
0.41 8
0.59
0.50
0.71
0.41
0.64
I]
10
0.37
o 19
0.41
6.6
11>
15
0.93
Column
Superficial velocity
(lO-'ms ')
0.5
Z (ml Cas Solute Liquid
NH,
H,O 4-30
0.2
0.4
0.6
3.2
o 25 Air
0.30
0.25 N,
0.84
Air
0.'10 N,
1.21
Air
Air
Air
AIr
Air
Air
H,
Air
["01-
O.
H,O
co,
NaOH 0.08-4.4
10.5-2 N)
Na,SO. 0.25-4.4
IJ N)
/';30H 0.25---4.3
(2 N)
NH,
0,
co,
Na.SO,
0.30-3
0.3(}- ]
co,
0.4 K.J
H,O
O.
H,O 1-20
CO,
NaOH I 10
(0.1 I,,)
co.
NaOH
0,
0,
S,O.Na,
S,04 Na ,
0.1-3.5
lIou
k."L IS-') Relation.hips IMKS unil<)
1'111--450 0.]-3
40-230 0.01! 1.6
40-220 0.009 -0.'1
0.012-1.2
40-230 OJI07-0.6
1.5-33
1.5 0
k o "'. = 2.0 + O.IEg.,..
k , "I = 0.03E s
Eo = ( 6P ) VUG; 1:., = ( 6P ) ' I/u.
6Z w t!Z ,.u
'!:..... = 0.27 {( ' I P ) ----=- } u.s
a,(I - "' 67 LO a,IJ - rL
kGf. { (6P16Zh.G }
- = 0.035 .
[JUG IJ!(I'G V 1i + I'LU5,J
Lf. = om r J f.16P/6 Z",,-;_ } O.u, - 1 1
VOL J ",II - r)p,. V o ,
Experimental cur-yes
"I
-_....:... - versus. VOl; for V or = L:lInstant
<1,(1 - f.)
4.3-11 0.00Ii-O.\l6 kL"1 13.5UJi.°oU8c"
k. UI -= 2.1}6{) (3t;gJ.2
5 100 0.02-3
1-100
50-300
kLu l - 2.73V8ig2Ug t>
k, ", ( Uo.. ) o.. .-0.1
-= 0.074 - r.L 1
c t"
= (] /f)Ep 4
,
E, = ( 6P ) VOl
6Z IG ""
Expenmentul curves
{II versus VVG .find UL \'ersus .DI
kGlIL ::=: A UO'u VCL
kGal in g-mol em - s- I alm I
10'.01 11/
!1
Table 6-8 Continued
-'--.-.-'----
Superficial velocity
Packmg Column (10- 2 m S-')
Reference dp(mm) d.(cm) Z(m) Gas Solute Liquid VOL V OG 1<..", (s-') Relalionships (MKS umls)
- ----- - -.- -
25.4 (b) 0.74 20 Air S02 NaOH 25.4 (e) 1.64 0.64 0.38
254 (e) 0.70 0.1,12 25A (d) 1.57 0.65 040
25.4 (d) 0.90-().94 16 ld) 0.61 0.87 0.34
-------- - ----
GOlo and Smith" 4.1 (a) 0.31 2.6 0.15 O 2 O 2 H 2 O 0.05-().5 0-().8 0.002-0.007 k a (I' U d )""40( I' )""'
L_L=4440 I. L_I'
D A 1'1. I"D,.
2.9 (e) 0.44 N 2 O 2 H 2 O 0.005 -0.014 k a (I' U d)""41 (I' f'
::=9080
D A I'L PLD L
Lema y el "I .0 63 (lI) 0.45 7.6 0.76 Air H 2 O 1.2--4 27-55 (I'r
kLnL - L __ versus E L for pu1smg
I" Dr flow only
Sylvester and 3.2 (e) 15 1.0 Air CO 2 H 2 O 0.3-1.7 1 -75 0.1 1.0 k, "I = 1.21,15 " 1O- 6 C:. 2 Cg."
Pitayagul sarn ".l1
Mellvried 52 4.6 (c,) 0.06 Air O 2 H 2 O 1.12.5 42-420
6.31bl 0.\]
Wen et al. JOn 6.3 (hi 0.55 0.6 AIr H,O CaCl, 0.7-2.8 12.5-90 0.13--4
127 (h) 0.74 sol ution
25.4 (b) 0.73 15.24
12 7 k}t 0.71\
25.4 (e)t 0.775
25.4 (elt 0.63
25.4 (crt 0.69
Dodds el al. 2> 25.4 (el.; Air CO 2 Caustic 0.6-3.9 54-360 085.9,1
38.] (l"); solutions
25.4 (hI.;
38 I (hI:
50.8 If)
la) Spheres; (hI Rasch,g nngs; (c) saddles; Id) Pall rings; Ie) pellets; If) sleel rings
t Intalo. saddle..
: Ber saddles.
- In Ihis "tudy, Ihe avenin ffiilss-Ininsfer coefficient K(jllL was measured. The unils for Ihese \lalues arc: lb-mol h - I n- 3 aim I
· Here. G, and C c , are hquid and ga. flow rales in Ib h -. rt - l
212 GAS LIQUID-SOLID RIoACTOR DFStGN
Recommendations Under trickle-flow conditions, for the gas-phase axial dis-
persion, Eq. (6-53) is recommended. For the liquid-phase axial dispersion in
hydrocarbon systems, use ofEq. (6-51) is recommended. More experimental data
with a variety of hydrocarbon systems are, however, needed. Backmixing under
pulsed-flow conditions has not been yet studied. Both experimental as well as
theoretical work on this subject is needed.
6-7 GAS-LIQUID MASS TRANSFER
A summary of the available experimental data for gas -liquid mass transfer under
trickle-flow conditions is given in Tablc 6-8. A significant portion of this table is
derived from Table 4 of Charpentier. t 2 The liquid-phase mass-transfer coefficient
is affected by both gas and liquid flow rates. At high gas and liquid rates, the
values of kLaL may exceed I s - t, a value normally not achieved in any other type
of gas-liquid contactor. When the liquid is trickling over the packing, kLa L values
for the cocurrent operation are of the same order of magnitude as those obtained
in countercurrent operation under similar working conditions.
Just as for the liquid holdup, the correlations for the kLaL are reported in two
ways. Some investigators correlated kLaL to liquid and gas velocities by either
dimensionaI3o.34.35 or dimensionless 34 correlations. The dimensional correlations
assumed kLaL (X U[ V=. The values of rand s for various types of packings reported
by various invesligators are summarized in Table 6-9. Goto and Smith 34 have
correlated Sherwood numbers to the liquid-phase Reynolds and Schmidt numbers.
A large number of investigators have presented an energy correlation (in
which kLo L is related to the two-phase pressure drop) for the gas-liquid mass-
transfer coefficient. A relation between the volumetric mass-transfer coefficient
and E L [ = (AP/!!Z)LGUoll proposed by Charpentier l2 is shown in Fig. 6-13.
According to this figure, for E L > 60 to 100 W m - 3, i.e., in the pulsed and
spray flow, the relation proposed by Reiss (kLo L = O,173Ep.5) is useful. Satterfield,78
however, suggested that the Reiss relation 70 is valid only when the diffusivity,of
the solute (D A ) in the liquid is 2.4 x 10- 9 m 2 S-I and the viscosity of the liquid
is close to that of water. He suggested that a more general relation for kLo L would
be
kLaL = O.OI73E .5(DA/2.4 x 10- 9 )°.5
(6-54)
Table 6-9 Comparison of correlation coefficients
Investigator Packing type i'
I J fford and Pcrona I 0 I 1.9-cm Berl saddles 0.82 0.46
1.3-cm Raschig rings 0.93 0.42
0.63-cm Raschig rings 1.06 0.75
Sato et al. 74 Glass spheres: diameters 0.80 0.80
from 2.50 through 12.17 mm
Sylvester and Pitayagulsarn"7 O.32-em x O.32-cm cylinders 1.20 0.30
--
DYNAMICS OF THE COCURRENT-DOWNFLOW FIXED-BED COLUMN 213
10
0.01
$
-'
':, 0.1
..:c
10-1
10
10 2
10 3
10 4
E L = (t:.P/t:.Z)lG VOL (W m 3)
Fi un: 6-13 Correlations between kLaL values for cocurrent downflow in packed beds.
with
DAJ1 .B = constant,
(6-55)
which would take into account the effects of diffusivity and liquid viscosity on
kLGT.. For E..« 100 W m- 3 , Charpentier J2 and Sylvester and Pitayagulsarn 91
showed considerable discrepancies between . correlation 7U and the data of
some other investigators.30.34.74.JOt Charpentier 1 1 proposed
kluL = 0.00lJEdDA./2.4 x \0-9)
(6-56)
for 5 < E L < WOW m 3. A correction for viscosity can be obtained from Eq. (6-55).
For very small gas and liquid velocities. the energy correlation becomes very
inaccurate. Under these conditions, Charpentier tl proposes kLuL = 0.008 S-I
when d p > 2 mm. More accurate predictions are given by Goto and Smith 34 and
Goto et al. 35 An energy correlation in terms of dimensionless gas-liquid mass-
transfer coefficient and the energy parameter is proposed by Gianetto et al. 30,31
This is shown in Fig. 6-14.
The gas-phase mass-transfer coefficient kGUL under trickle-flow conditions is
also affected by both gas and liquid flow rates. As shown in Table 6-8. Shende
and Sharma B7 obtained dimensional relations between kGUL, V G . and VI. for
various types of pac kings. Reiss 70 and Gianetto et al. 31 have also presented energy
correlations. This type .of correlation proposed by the latter investigators 31 is
shown in Fig. 6-15. It is valid for trickle-, pulsed- and spray-flow regimes and
for a large number of packings. The values of the packi'ng shape coefficient Iii used
in this correlation are listed in Table 6- 10.
Charpentier, 12 however, suggested that, in pulsed and spray flow one should
use the relation
kGUL = 2 -r 0.1 £2. 66 ,
(6-57)
214 GAS-LIQUID-SOLID REACTOR DESIGN
Table 6-10 Values of IJI for Table 6-8 and F'ig. 6-15
Geometrical area.
Packing Porosity a,(m ') I (m ')
Glass spheres (6 mm) 0.41 590 24.5
Berl saddles (6 mm) 0.59 900 IRA
Ceramic rings 16 mml 0.52 872 36.5
Glass rings (6 mm) 0.70 891 .7.1
where EG = (!!P/!!Z)LGlJ OG (E G is in W m 3), and under trickle-flow conditions,
use the correlations of Gianetto et at 31 for 6-mm packings (spheres, ber! saddles,
glass, and ceramic rings). and the correlation of Shende and Sharma B7 for some
other packings (24-mm ceramic Intalox saddles and polypropylene Pall rings and
16-mm stainless-steel Pall rings). For other packings, the results for countercurrent
flow can be used as a first approximation. This would, however, be a conservative
estimate.
In countercurrent operation, the gas liquid interfacial area is independent of
gas velocity up to the loading point. In cocurrent operation, the gas liquid
interfacial area increases with both the gas and liquid velocities. Shende and
Sharma!! 7 showed that the effective interfacial area depends very significantly upon
the nature of pac kings, For each size of packing, they showed tha I the interfacial
area with stainless-steel Pall rings was greater than that for polypropylene Pall
rings. The interfacial area for cocurrent downflow is considerably greater than
that obtained with countercurrent flow and considerably greater than the geo-
metric packing area. The interfacial area is correlated to the energy parameters.
Such a correlation. shown in Fig. 6-16, is recommended by Charpentier. 12 In the
pulsed- and spray-flow regimes.. an equation
ada. = O.25[(!!P/!!ZkG(f./a s )]o.s
(6-58)
IS recommended. Gianetto et aI. 30 indicated that under their experimental
3 x I 0- 2
o
:J
---...
'"
10-. 2 t-
"'"
3 X 10- 3
10
10 2
10 3
(l!.P/l!.Z)LG (gcE/Q,PL UBL)
Figure 6-14 Energy correlation for kL.]1I
lO- t
8
6
5
4
3
0
::.:> 2
"'
"'"
10- 2
8
6
5
4
3 )( 10- 3
10-\
DYNAMICS OF THE COCURRE'\iT-DOWXFLOW FIXED-BED COLUMN 215
/
/
/
+20 pcrcent /
/ /
/ /
/ /
/ /
/ /
/ /
/ / -20 percent
/ /
/ /
/ /
/ /
/ /
/ /
/ /
/ /
/ /
/
/
/
""
""
1
-1
2345681
r. - 2 2 ]
(l!.P/l!.Z)LGI!JI/J(PCUOG +PLUOL)
2
Figure 6.15 Energy correlation
for kG. ] I
conditions, pulsed flow began when
loglo {(UOGPG + UoLPdM I - -! loglo {VOGPG/VoLPd,
(6-59)
where V OG and VOL are in meters per second and PL and PG are in kilograms
per cubic meter. In the trickle-flow conditions. Charpentier 12 suggested
aLia. = 0.05[( P/AZ)LG(E/as)]t.l (6-60)
for ( P/ Z)LG(E/a.) < 12 N m- 2 . The above equation is mainly valid for spheres
and pellets with E < 0.50.
In a trickle-bed reactor, due to a very thin liquid film, gas- liquid and liquid-
solid mass-transfer coefficients are sometimes combined as
1 1 1
-=-+-
K I . s k L Ks'
where k L and Ks are the gas-liquid and liquid-solid mass-transfer coefficients.
Satterfield et aLBO and Sauerfield 77 ,7B described in detail four different methods
for an est mation of K LS'
(6-61 )
Recommendations The best correlations for kl.a L and k L are the energy correlations
shown in Figs. 6-l3.and 6-14. respectively. For kG, the energy correlation of
Gianetto et al. 31 (Fig. 6-15) is recommended. For kG aL, the correlations of Gianetto
216 GAS-LiQUID-SOUD REACTOR DESIGN
5
2
""' 1
'"
I 0.8
'-'
.!:[ 0.6
..J
'"
0.4
0.2
I
O.I
1 10
10 2
Figure 6-16 A correlation of aL for cocurrcnt downftow m packed beds.
(f,p!f,Z)Ld e!u,(I -e)}(N m- 2 )
et at 3t and Shende and Sharma 87 are recommendcd for larger packings (> 6 mm)
and under trickle-flow conditions. whereas Eq. (6-57) is recommended for the
pulsed- and spray-flow regimes. More work on kCaL for smaller packings
«6 mm) and under trickle-flow conditions is needed. In the absence of experi-
mental data, the gas--liquid interfacial area can be estimated from Fig. 6-16.
6-8 LIQUID-SOLID MASS TRANSFER
The liquid-sol1d mass-transfer coefficient under trickle-flow conditions was first
measured by Van Krevelen and Krekels l02 from the rate of dissolution of benzoic
acid with no gas flow. They presented a relation
Ks/a,D = 1.8(P L Uda.J.ldo. 5 (J.lr./P L D)t/3.
(6-62)
This correlation was in reasonable agreement with the low gas flow (GG < 0.01 g
cm - 2 S -1) data of Sato et at 74 for a benzoic acid-water system with 5.5- and
12.2-mm particle diameter. Hirose et al. 38 made extensive measurements in trickle-
flow, I.sed-flow,and bubble-flow regimes and correlated the enhancement
lac_tor in Ks due to parallel gas flow with the liquid velocity. They found that
toisenhancement factor (ratio of Ks in the presence of gas flow to Ks in the absence
of gas flow) was inversely proportional to the total liquid holdup and to a first
approximation has the value 2. Their data for Ks as a function of liquid velocity
DY'\IAMICS OF THE COCURRENT-DOW'\IFLOW FIXED-RED COLUM!>: 2]7
5 x 10- 2
d p = 12 mm
Pulsed
flow
10 2
,.
'"
E
0
'"
10 3
./
/"
/"
1 /' o"'"
/" "I><;e, U OG (cm s-])
AW,"
--S\(\ " 100
/" v 50
/' 0 25
a 10
6. 5
<> 2.5
+ I
2 )( 10- 4 --.l ' I I i I I' --L I .. I I ,j I
10- 2 10-] 10°
11. -'--L1
104-1
UOL (cm S-I)
Figure 6-17 The mass-transfer film coefficient Ks at the liquid-solid mterface in a trickle-flow column
(after Hirose et ul. 38 ).
are shown in Fig. 6-17. Hirose et al.. 8 also showed that, in the case of catalytic
oxidation of ethanol to acetic acid, larger particle gave more resistance at the
liquid-solid interface compared to the gas-liquid interface, but, for smaller
particles, both resistances are comparable because of the increased liquid-solid
surface area and higher transfer coefficients.
The data of Van Krevelen and Krekels t02 for the trickle bed and those of
Evans and Gerald 26 for the liquid-full bed indicate that Ksa, is greater in a trickle
bed than in the liquid-full bed, at the same flow rate, for the larger particles.
This may be due to the larger linear velocities in trickle beds, where part of the
volume is occupied by gas. For small particles (0.0541 cm), however, Goto and
Smith 35 reported a reverse effect. This may possibly be due to the fact that the
entire external surface was not aftected for mass transfer in trickle beds containing
very small particles. If this effect predominates Over the velocity factor, Ks as
(as = 6(1 - f.)/d p ' would be greater for liquid-full operation. Goto and Smith 8 ]
conclude that the effect of particle size on Ksas can change for d p < 2 mm. By
means of data collected at low flow rates, they proposed a relation
KSllS/D = 0!,(Gr.//ldn,Sc ll . 1 .
(6-63)
The values of the parameters ex, and lis for the particle sizes they studied are listed
in Table 6-1 J.
More recently, Goto et al.]5 took some additional data with naphthalene
particles (diameters of 0.0541, 0.108, and 0.241 cm) and correlated these data along
with those of Goto and Smith 34 as a plot of J d [lKsaw/a,UodSc2l3J versus Rei'
This plot is shown in Fig. 6-18. Here. a w is the effective area (J cm - I) for the
218 GAS-LlQUJD-SOLID RFACTOR DF."IGN
Table 6-11 Values of ct, and n.
t]" - 2
fI- 'Japhthol particle size, d p
(cml . (cm) 1/,
0.241 45 0.56
0.0541 153 0.67
mass transfer and Q. (I cm- 1 ) the total particle surface area. Within the range of
gas flow from 1 through 4 cm 3 S-I. the J d versus ReL plot was found to be
essentially independcnt of gas flow rate.
Oharwadkar and Sy]vcster 22 presented another correlation similar to that of
Goto et al. 35 Combining all literature data. they proposed the relation
J D = Ks (u1oJ SC 2 / 3 = 1.637 (Red- 0.331 (O.2 < Re L < 2400). (6-64)
Here, ReL is bascd on the superficial liquid velocity and. unlike the correlation
of Goto et al.,35 J d docs not contain the factor Qw/a,. The mean and standard
3
0.7
---------
--
--
--
--
--
-20 per ;:;-t---_
...-
-....-
-,
--
-...
...........,.....
-...
-------....
--
--
-...
--
--_-...: 20 percent
--
--
--
-,
--
--
'-
......
'-.......
.........
2
J D
I
0.5
Gas flow
= 2 cm 3 s-I
0.3
0.2 0.3
0.5 0.7
2
3
5
7
10
20
Liquid Reynolds number. Re L
Data used are for
0.241 cm naphthalene l
0.108 cm naphthalene Cl5)
0.0541 cm naphthalene
0.241 cm jJ-naphlhol (34,35)
0.054 I cm (3-naphthol (34)
Figure 6-18 J D versus ReI. for cocurrent downftow in a trickle bed uSing parlicles of naphthalene
and p-naphthol.
DYNAMICS OF THF COCURRENT-DOWNFLOW FIXED-BED COLUMN 219
deviations of the above correlations were 7.14 percent and 0.28 percent, respec-
tively. The correlation was valid in the ranges of gas and liquid flow rates of 0
through 2 m stand 0.0005 through I m s - 1. respectively, corresponding to the
gas-continuous-, transition-, pulsed-, and dispersed-bubble-flow regimes. Though
the J d factor increased with gas flow for a given liquid flow, the increase was
not appreciable. Although some dependence of Ks on particle size and shape is
apparent from the literature data, this was not correlated by these investigators.
Lemay et al. so measured KsGs in the pulsed-flow regime (gas velocity range of
27 through 55 em s -1 and the liquid velocity range of 1.2 through 4 em s - 1)
using 6.3-mm benzoic acid spheres with rhodamine B as dye. They correlated
Ks to thc energy parameter as
Ks SC 2/3 = 0.17(EUh/Pthd,
(6-65)
where E L is the energy parameter, as before, and h L is the total liquid holdup,
which was estimated from Larkins et al.'s48 correlation. Based on their data, they
concluded that Ks was not a strong function of radial position, in their column.
Sylvester and Pitayagulsarn 97 measured Ks for 3.2-mm pellets of benzoic acid
in the gas flux range 81.5 through 336 g h - I cm - 2 and the liquid flux range
1,281 through 7,100 g h 1 cm- 2. Under similar flow conditions, their Ks values
were higher than those of Sato et at 74 and Lemay et aJ. 50 This may be due to
the difference in particle shape and size. They presented a relation
Ks = 49.8 x 1O-3[G.-:-o. 78 {1 - eY/(l + eY)}]Gg. 38 , (6-66)
where G L and GG are in Ibm h -1 ft 2, J = 4G L /6350 and Ks is in cm s I. The
correlation was applied to the gas-continuous-, transition-, and pulsed-flow
regimes, and the standard deviation of the correlation was 0.12.
Specehia et al. 91 measured Ksa s in columns of 3.8-cm and 8-cm i.d. wIth
cylinders of benzoic acid 0,3 cm and 0.6 cm in diameter. The ranges of the other
system parameters studied were 0.16 cm S-1 < VOL < 0.83 cm S-I, 0 < V OG <
156 cm s- I, 5f dynes cm I < (jL < 72 dynes cm- 1 , and 1,220 < Sc < 5,400. The
typical effect of gas velocity on Ksas obtained in this study is illustrated in Fig.
6-19. Unlike the results of Lemay et al.,so these data showed asymptotic values
'T
'" 0.01
'"
'"
0.002
o
0.8
1.6
Figure 6-19 K sQs versus V OG for typical VOL for
water and d. = 0.006 m (after SpecchiCi et 01. 91 ).
V OG (m s-t)
220 GAS. LIQUID. SOl Jf) REACTOR DESt(;N
100
10
Figure 6-20 Corrcl:Hion of the K sas for asymptotic
values (after Specclzia et al. ').
!:2.
I
:c
<11
We'
of Ksas at large gas velocities. These asymptotes were explained on the basis of
total wetting of thc packings and the asymptotic value of liquid holdup at high
gas flow rates. Specchia ct al. 91 presented the following correlation for the
asymptotic Ksas values.
In [Sh' (Sc)- t,J] = 7.82 J{ln (W e' x IO J )} - 1.29 In (We' x 103) - 7.61.
(6-67)
Here Sh' is the modified Sherwood number defined as Sh' = Ksusdl,/a,D and We'
is the modified Weber number defined as We' = Ut,LPLdp/hlal' A graphical
illustration of the above correlation is shown in Fig. 6-20. The predictions of
Eq. (6-67) also agree fairly well with the data of Lemay et al. 50 Specchia et al. 91
showed that, in a trickle-flow reactor, K LaL and Ksas are esscntially of the same
order of the magnitudes. They also evaluated the conditions under which the
mass-transfer (gas-liquid and liquid solid) Influences significantly the performance
of a trickle-bed reactor.
Recommendations For large particles (d p > 3 mm) the correlations of Sato et al. 74
and Lemay et apo should be useful. For GG < 0.01 g cm- 2 s- t, Eq. (6-62) would
also be useful For smaller particles, the relations given by Goto and Smith 34
and Gow et al. 35 would be useful. L'nder trickle-flow conditions, it. however,
appears that the gas liquid or liquid -solid mass-transfer resistances are less impor-
tant than the intraparticle resistances. 78 Specchia et al. 91 showed that gas-liquid
and liquid. solid mass-transfer resistances in a trickle-bed reactor can be neglected
if the Thiele modulus for the catalyst is less than unity.
6-9 HEAT TRANSFER
The trickle-bed operation is characterized by comparatively poor heat-transfer
properties. Schoenemann,!!!! for example, indicates difficulties in controlling
temperatures in a trickle-bed reactor.
The only reporte&study on heat transfer is by Weekman and M yers. 1 05 They
measured wall-to-bed heat-transfer coefficients in a cocurrent air.-water downward
flow through a packed column. Three types of packings. 0.65-crn alumina spheres,
0.475-cm glass spheres and O.38-cm TCC beads were examined. The heat-transfer
coefficients were much higher than those observed for single-phase liquid flow.
The transition from homogeneous to pulsed flow corresponded to an increase of
DYNAMICS OF THE COCURRENT-DOWNFLOW FIXED-RED COLUMN 221
several hundred percent in the radial heat-transfer rate. Using the radial transport
model the experimental data were correlated by a relation
kc/kt = 7.71/k l + 0.00174 Rei PrL + (J.I72(k ikd ReG PrG,
(6-68)
where kc is the effective conductivity of the b d, k, and kg are the liquid and gas
conductivities. ReG and ReI. are the gas and liquid Reynolds numbers based on
the superficial velocities and tube diameter. PrG and PrL are the gas and liquid
Prandtl numbers. The heat-transfer coefficient (H) was related to the effective
thermal conductivity by the relation
2.892 k 0.183ro(GICpL + GGC pG .) I h I -20 C -t
H = - . + - - (ca em )
ro < Z '
(6-69)
where ro is the column radius (cm). G l and Gc; are in g h -] cm 2. CpL is the
specific heat of the lIquid and Cpc;' is the specific heat of saturated air (in cal g 1
°C- 1 ). Z is the axial distance from thc inlet (cm).
Week man and Myers l05 indicated that the primary effect of the gas was to
impart a greater velocity to the liquid phase. The radial component of the velocity
was larger in two-phase f1ow. By using the Larkin et a1. 48 relation for the liquid
saturation, Week man and Myers I05 also obtained a relation for ke only in terms
of liquid flow rate and properties as
ke/kl = 7.03/k l + 0.000285 ReL I PrL,
(6-70)
where Rel] = Redl1lc.
In the pulsed-flow regime, the data were correlated by the penetration model.
According to this model
H = 2P L C p I. J (!:I.LF p /n),
(6-71)
where exL is thermal diffusivity of liquid and F p is the pulsing frequency (pulses
s'- I). A comparison of the predictions of above equation with some experimental
data of Weekman and Myers to5 is shown in Fig. 6-21.
Recommendations Cnder trickle-flow conditIons, the use of Eq. (6-68) and, in the
pulsed-flow regime, the use of Eq. (6-70) are recommended. More experimental
as well as theoretical work is needed, particularly with hydrocarbon systems.
ILLUSTRATION 6-1
Proper scaleup of a reactor is always a difficult but very important prohlem. What
system parameter would you consider to be important in the proper scaleup of a
trickle-bed reactor for a gas-liquid solid catalytic reaction if the reaction is
occurring in the liquid phase and is controlled by
(0) the gas- liquid interface mass transfer?
(b) the liquid-solid interface mass transfer?
(c) intrinsic kinetics?
222 GAS-UQUID-SOLID REACTOR DESIGN
400
E
'"
'<3
!;:
..... 300
'"
0-
o U
o
",'"
t: '
E
u
-
.<::
- -.;;
t: U
r.J
:;;':J:::
>
.::;
c;"
(.J.j
o
2
3
4
5
7
Pulse frequency, f (pulses s-l)
legend
J:> 0.38 em TCe beads
o 0.475 em glass spheres
o 0.65 cm alumina spheres
Figurc6-21 Comparisonofpenelration theory
with experimental data (f!frer Weekman and
Myers I os)
Air-waler system; liquid pulse height
< 12.5 cm.
SOLU11ON
(a) If the reaction is controlled by the mass transfer at the gas-liquid interface.
the important system parameters would be gas and liquid velocities, shape and
size of catalyst, and the fluid properties such as density, viscosity, and surface
tension for both phases. If the controlling resistance is in the liquid film,
accordjng to Fig. 6-13, the important scaleup parameters for kLaL are the
two-phase pressure drop and the superficial liquid velocity. If the eontrolling
resistance is in the gas film, Figs. 6-15 and 6-16 would allow the estimations
of kG and aL' These figures indicate that all of the system parameters
mentioned above would be important in matching kGQL values in small and
large reactors.
(b) If the reaction is controlled by the mass transfer at the liquid-solid interface,
according to the correlation of Goto and Smith,83 the important system
parameters far scaleup purposes are superficial liquid velocity, Schmidt and
Reynolds numbers for the liquid, and shape and size of the catalyst.
(c) If the reaction is kinetically controlled, then liquid-solid contacting effective-
ness is an important variable for scaleup purposes. The contacting effectiveness
depends upon the liquid flux, shape and size of the catalyst, and internal
characteristics of the bed. According to the correlation of Onda et al.. 63
Reynolds, Weber, and Froude numbers for the liquid phase and the ratio of
liquid-phase surfaee tension to critical surface tension would be the controlling
DYNAMICS OF THE COCURRENT-DOWNFWW FIXED-BED COLUMN 223
.
parameters in the determination of the liquid-solid contacting efficiency. The
liquid hourly space velocity (in grams of liquid per gram of catalyst per hour)
in small and large reactors, of course, needs to he matched when the reaction
is kinetically controlled.
ILLUSTRATION 6-2
(a) Two reaction conditions are proposed for a gas-liquid-solid catalytic hydro-
processing reaction. Preliminary observations indicate that, under one set of
conditions, the gas-liquid interface mass transfer is the controlling factor;
under the second set or conditions, the liquid solid mass transfer is the
controlling factor. Derive a condition for equal conversion in both eases.
Assume an isothermal plug-flow (in both gas and liquid phases) reactor and
a pseudo-first-order reaction with respect to the gaseous reactant.
(h) In the two cases mentioned in part (a), the first case uses a fixed-bed cocurrent-
upflow bubble-column reactor, whereas the second case uses a cocurrent-
down flow fixed-bed reactor. Tn a typical operation, GG/G L is approximately S .
Based on preliminary data, KGaLP (where P is the total pressure) for the first
case is estimated to be approximately 0.15 s -1. Can the derived condition in
part (a) be satisfied? If the answer is yes. what are the prevailing flow
conditions in the second case. Assume d p = 12 mm and the bed void fraction
c = 0.6. The catalyst particles are assumed to be completely wet.
SOLUTION
(a) When the reaction is controlled by mass transfcr at the gas-liquid interface,
a differential mass baJance on the gas phase can be expressed as
dA G
GG dZ = - KGaLPA G .
(6-72)
Here, GG is the mass flux of gas, AG is the gas-phase concentration of the
reactant, P is the total gas pressure, KGaL is the overall volumetric mass-
transfer coefficient, and Z is the axial distance along the length of the reactor.
[ntegrating the above equation from the reactor inlet to its outlet gives
In (AGJA Go ) = KGaLPL/G G ,
(6-73)
where AGi and AGo are the concentrations of the reactant in the gas phase at
the reactor inlet and outlet, respectively, and L is the length of the reactor.
When the reaction is controlled by mass transfer at the liquid-solid
interface, a similar differential mass balance on the liquid phase would give
dA L
G L dZ = - K SaSAL'
(6-74)
Here, G L is the mass flux of liquid, Ksas is the volumetric liquid solid mass-
transfer coefficient, and A L is the concentration of the reactant in the liquid
224 GAS-LIQUID-SOLID REACTOR DESIGN
phase. An integration of this equation along the length of the reactor gives
In (ALi/ALol = KSllsL/Gt.
(6-75)
where Au and ALa are the concentrations of the reactant in the liquid phase
at the reactor inlet and outlet, respectively.
The conversions for the two cases are defined by the left-hand side of
Eqs. (6-73) and (6-75). Thus, the required condition for equal conversion is
KGllLP GdKsas GG = 1.
(6-76)
It should be noted that, if KGll, P CL/Ksils C G > I, the first case will give
better conversion than the second case and vice versa.
(b) If KGaLP = 0.15 S-l and GG/C, = 5, then Eq. (6-76) is satisfied if Ksas =
0.03 s - t. Now, as = 6(1 - f.)/d p = 6 x 0.4/1.2 = 2 cm I. Thus, the required
value of K s is 0.03/2 = 0.015 (cm s I) or 1.5 x 10- m s - t.
From Fig. 6-17, it is clear that this value of Ks is most likely to be achieved
under pulsed- or bubble-flow regime with superficial liquid velocities greater
than I cm s- I, It will not be achieved under trickle-flow conditions.
NOMENCLATURE
a'
d'
aL
as
iis
Q,
a"
A
b'
B
('
C p
de
de
d p
d'
s
d l
D
D...
D;
D;app
constant in Eq. (6-46)
constant in Eq. (6-47)
gas-liquid interfacial area for mass transfer
specific surface area of the packing matcrial pcr unit solid bed volume
(6(1 - t:)/d p )
specific surface area per unit column volume
total particle surface area per volume of column (which includes the
internal area: at = iis for nonporous packings)
wetted particle surface area (which equals il, or il, when the particJes
are completely wetted)
packing characterization parameter (Eq. (6-25»
constant-in Eq. (6-46)
packing characterization parameter (Eq. (6-25))
volume fraction of column occupied by solids
specific heat
column diameter
equivalent packing diameter
packing diameter
characteristic packing length
modified packing diameter, [dp/(l + 4d p /6d c (1 - r.»]
molecular diffusivity
diffusivity of component A
actual internal diffusivity
apparent internal diffuslvity
E7
E
f
Fp
Fr
(/
Yc
G
Ga
--') hi
.J) lId
h"
- h.
H
II,
J d
k
k. pp
kc
kg
kG
k(
K L
Ks
k,
Kt. K )
K 2 .1\2
Kl.s
m
M
n
n,
N
No
p
[j.p
[j.P J [j.Z
Pe
Pel
Po
Pr
QL
Qo
r
r
DYNAMICS OF THE COC'URRENT-DOWNFWW FIXED-BEtJ COLUMN 225
.j
aXial dispersion coefficient
energy dissipation
friction factor
pulse frequency
Froude number
acceleration of gravity
gravitational constant
liperficial mass velocity
Galileo number (d qpt 'I-d.>
fraction 01" the vOId volume occupied by a phase i
dynamic holdup
total holdup per unit volume of column
static holdup
heat transfer cocfficicnt
height of pulsing unit
mass transfer factor (K sUwJa,H I JU oL H/lt.JpI.D)213
effcctive deadspace volumc per unit volume of column
apparent kinetic ratc constant
overall thermal LOnductivity
gas-phase thcrmal conductivity
gas-phase mass-transfer coefficient lIiquid-to-gas transport)
liquid-phase thermal conductivity
liquid-phase mass-transfer coefficient (liquid-to-gas transport)
liquid-phasc mass-transfer coefficient (particle-to-liquid transport)
actual kinetic rate constant
constants
constants
overall mass-transfer coefficient
weight of ftuid
packing characterization parameter (see Table 6-1)
exponent in Eq. (6-47)
parameter in Eq. (6-63)
packing characterization parameter (see Table 6-1)
number of particles
pressure
pressure drop
pressure drop across the bed length [j.Z
Peclet number (Vd./E z )
Peclet number (Vod,JEz)
packing characterization parameter
Prandtl number
liquid Aow rate
packing characterization parameter
packing characterization parameter
radial distance from the center of column
226 GAS-LIQUID -SOLID REACTOR DESIGN
ro column radius
Re Reynolds number (d.VPlJ1.)
Ref laminar film Reynolds number (4pb r UiJ1.)
ReI Reynolds number (d.VOP!tl)
Re ll modified Reynolds number IRe/he)
s packing characterization parameter
Sc Schmidt number (,,/D)
Sh' Sherwood number (Ksasdp/a,D)
SI shape factor
V interstitial velocity
Va superficial velocity based on single-phase flow in an unpacked column
U mean velocity of fluid in the laminar film
We Weber number (G 2 d p /ap)
We' modified Weber number (VJLPLdp/h[aL)
X (c5Lfb(yi 2
Xl (APd!! dI/2
X J I ( d G)I!2
y 4G.j6350
Z axial distance along the column
Z Ref;.16 7 jRef.767
.2 1 Z{Pw/J1.do. 9
Greek symbol
C1.
:x.
fJ
iJ
be
e
v
.;
v
p
a
a c
'Ic
J1.
;.
I/J
!!H
!!Z
thermal diffusivity
parameter in Eq. (6-63)
angle to the vertical for inclined surfaces
total energy to overcome friction
laminar film thickness
vfid fraction of a packed column
energy parameter defined by Eqs. (6-13), (6-14), and (6-] 5)
kinematic viscosity
density
surface tension
critical surface tension
contacting efficiency (aw/a,)
viscosity
parameter defined in Fig. 6-3
parameter defined in Fig. 6-3
head of fluid
small length of the bed
Subscripts
G gas phase
L liquid phase
S solid phase
DYNAMICS OF THE COCURRENT-DOWNFLOW FIXED-BED COLUMN 227
W water
LG liquid and gas phases flowing simultaneously and concurrently
M flowing mixture of gas and liquid
air refers to air
REFERENCES
I. Abbott. M. D.. G. R. Moore, and 1. L. Ralph, 7th ABG Conference, Paper S-5. 1%7.
2. Abbott. M. D.. and G. 0. Towell. 6th ABG Conference. Paper S-9. 1961
3. Atkinson. B., M. E. Abdel, and R. Ali, Tran. . InST. Chern. Eny., vol. 59, p. 239, 1976.
4. Baker, 0., Oil Go.d., vol. 53, no 12, p. 185,1954.
5. Bakos, M., and 1. C Charpentier. Chern. ElJg. Sci., vol. 25, p. 1922,1970.
6. Beimesch, W. E., and D. P. Kessler, .4lChE J.. vol. 17, p. 1160, 1971.
7. Brignole, E. A.. G. Zacharonek. and J. Mangosio. Chern. Eny. Sci.. vol. 28. p. 1225. 1973.
8. Buchanan, J. E., I&EC Fund., vol. 6. p. 400,1967
9. Buchold. J.. Chern. Eng Sd., vol. 26, p. 746. 1971.
10. Charpentier, J. C, Communication, M1SA '75. Section G. Distillation and Absorption, p. 25,
1975.
I L Charpentier. J. C. Docteur-Ingenieur These, Universite de Nancy. 1968.
12. Chaq:entier, J. C, Chern. Eny. J., vol. II, p. 161, 1976.
13. Charpentier, J. C, M. Bakos, and P. LeGolf, in Proceedinys of the 2nd COl1grl' . I)n Applied
Physicul Chemi.\/r)', Veszprem, Hungary. 1971. vol. 2, p. 31. 21-02.
14. Charpentier, J. C, and M. Favier, AIChE J., vol. 21. p. 1213, 1975.
15. Charpentier, J. c., C Prost, and P. LeGoff. Chern. Eny. Sci., vol. 24. p. 774, 1969.
16. Chou, T. S.. F. L. Worley Jr., and D. Luss. I&EC Pr{)('ess Design Del'., vol. 16. p. 424.1977.
17. Clements. L. D.. Paper presented at Two-Phase Flow and Heat Transfer Symposium Workshop,
Ft. Lauderdale, Florida, 1976.
18. Clements, L D., and P. C Schmidt, Paper presented at 6()th Annual AIChE Meeting, Chicago,
Illinois, 1976.
19. Co. P., and R. Bibaud. CalJ. J. Chern. Eny., vol. 49, p. 727, 1971.
20. Colombo, A. J.. G. Baldi, and S. Slcardi. Chern. Eny. Sci., vol. 31. p. 1101. 1976
21. Davidson, J. F., E. J. Cullen, 0. Harrison. and D. Robess, Trans. Inst. Chern. Eng., vol. 37. p. 122,
1959.
22. Dharwadkar, A., and N. D. Sylvester, AIChE J., vol. 23, no. 3, p. 376. 1977.
23. Dodds, W. S., L. F. Stuzman, B. J. Solami, and R. J. Carter, AIChE J.. vol. 6, p. 197, 1960.
24. Elenkov. D.. and N. Kolev. Chern. ElJg. Techno/.. vol. 44. p. 845, 1972.
25. Ergun, S., Chern. El1g. Proyr., vol. 48, p. 89, 1952.
26. Evans, G. C. and C F. Gerald, Chern. E,IY. Pro!}r., vol. 49, p. 135, 1953.
27. Friebe, J., Dissertation, T. H.. Darmstadr. 1966.
28. Furzer. l. A., and R. W. Michell, A/ChE J., vol. 16.. no. 3, p. 380. 1970.
29. Gelbe. H.. Chen!. EII!I. Sd., vol. 23. p. 1401. 1968.
30. Gianetto, A., G. Bald and V. Specchia, In!!. Chern. (Milan), vol. 6, p. 125, 1970.
31. Gianetto. A., V. Speech la, and G. Baldi, 4IChE J. vol. 19. P 91t., 1973.
32. Glaser, VI. B., and l. Lichtenstein. AIChE J., vol. 9. p. 30,1963.
33. Glaser, M. B.. and H. M. litl, 4IChE J., vol. 9, p. 103, 1963.
34. Goto. S.. and 1. M. Smith. AIChE J.. vol. 21. p. 70ft. 1975.
35. Go'to, S.. J. Levec. and J. M. Smith,I&EC Proce. . Desil/lJ Dev., vol. 14, p. 473,1975.
36. Harrison, D., M. Lane, and D. J. Walne, Trll/1. 1l1st. Chern. EIJY., vol. 40, p. 214.1962.
37. Hartman, M., and R. W. Coughlin, Chern. En!!. Sd., vol. 27, p. 867, 1972.
38. Hirose, T., M. Toda. and Y. Sato. J. Chern. Eng. (Japan), vol. 7, p. 187, 1974.
39. Hochman. J. M.. and E. Effron. I&EC FUl1d.. vol. 8, p. 63.1969.
228 GAS-LIQUID-SOLID REACTOR DESIGN
40. Hofmann, H., Inc. Chern. Enil., vol. 17, p. 19. 1977.
41. Hoftyzer, P. J., Trans. Imt. Chern. Eny., vol. 42, p. TI09, 19M.
n. Hulton. B. E. T., and L. S. Leung, Chern. En!J. Sri., vol. 29, p. 1681.1974.
43. Hutton, B. E. T., L. S. Leung, P. C. Brooks, and D. J. Nicklin, Chern. Eng. Sci., vol. 29. p. 493,
1974.
44. Jesser, B. W., and J. C. Elgin, Trans. Insl. Chern. Eng., vol. 39, p. 277, 1943.
45. Koros. R M.. in Proceedillgs of the 4th International 16th European Syrnposimn 1m Chernical
Reaction Engineering, p. 372, Heidelberg, Federal Republic of Germany. 6-8 April, 1976.
46. Krauze, R., and M. Serwinski, Inzymeria Chemizna, vol. I, p. 415, 1971.
47. Lapidus. LInd. Eng. Chem.. \'01. 49. p. 1000, 1957.
48. Larkins, R. P., R. R. White, and D W. Jeffrey, A/ChE J., vol. 7, p. 231,1961.
49. LeGoff, P., Third DavIs Swindin Memorial LeclUre, Loughborough University. 1967.
50. Lemay. Y., G. Pineau It, and J. A. Reuther,l&EC Process Design Dev., vol. 14, p. 280,1975.
51. Matsuura, A., T. Akehata, and T. Shira J. Chem. Eng. (Japan). vol. 9, no. 4, p. 294, 1976.
52. Mcllvried, H. G.. PhD Thesis, Carnegie Institute of Technology. 1956.
53. Mears, D. E., Adl'. Chern. Ser" no. 133. Chemical Reaction Engineering 11. p. 218, 1974.
54. Michell, R. W., and I. A. rUITer, Trans. IlISt. CIJern. Eng., vol. 50, p. 334, 1972.
55. Michell. R. W., and I. A. Furzer, Chern. Eng. J., vol. 4, p. 53, 1972.
56. Midoux, N., M. Favier. and J. C. Charpentier, J. Chern. Eng. (Japan), vol. 9, no. 5, p. 350, 1976.
57. Mohunta. D. M., and G. S. Laddha. Chern. Eng. Sci.. vol. 20. p. 1069. 1965.
58. Montagna, A. A., and Y. T. Shah, /&EC Process Design Dev., vol. 14, p. 479,1975.
59. Montagna, A. A., Y. T. Shah. and J. A. Paraskos, I &EC Process Design Dev., vol. 16, p. 152, 1977.
60. Morton, F, P. J. King. and B. Atkinson, TrGfls. Insl. Chern. EnlJ., vol. 42, p. 149, 1964.
61. Nagel, 0., H. Kusten, and R. Sinn, Chern. Eng. Techl/ol., vol. 44, p. 367, 1972.
62. Onda. K.. E. Sada, and Y. Murase, AIChE J., vol. 5, p. 135, 1959.
63. Onda, K.. H. Takeuchi, and Y. Koyama, Kagaku Kogaku, vol. 31, p. 126, 1967; Onda, K., Merno.
fac. Eny., Nagoya Unw.. vol. 24. no. 2. p. 165. 1972.
64. Ostergaard, K., Adl'. Chern. EI/g., vol. 7, p. 71, 1968.
65. Otake, T., and K. Okada, Kagaku Kogaku, vol. 17, p. 176, 1963.
66. Paraskos, J. A., J. F. Frayer, and Y. T. Shah,I&EC Process Design Dev., vol. 14, p. 315,1975.
67. Prost, c., Chern. Eng. Sci., vol. 22, p. 1283, 1967.
68. Prost, c., and P. LeGoff, Genie. ChellJ.. vol. 91. p. 6,1964.
69. Puranik, S. S., and A. Vogelpohl, Chern. Eng. Sci., vol. 29, p. 501, 1974.
70. Reiss. L. P.,I&EC Process Design Del'.. vol. 6, p. 486,1967.
71. Reyni , J P., and J. C. Charpentier, Chern. Eng. Sci., vol. 26, p. 1781, 1971.
72. Roebuck, J F., G. E. Henderson, J. Douglas, and W. T. Ford, Soc. Pe/m/. £ng. J., voL 9, p. 115,
1969.
73. Ross, L. D., Chern. ElJg. Progr.. vol. 61, p. 77. 1965.
74. Sato, Y., T. Hirose, F Takahashi, and M. Toda, PACHEC, Section 8, Paper 8.3. p. 1187, 1972.
75. Sato, Y, T. Hirose, F. Takahashi, and M. Toda, J. Chern. Eng. (Japan), vol. 6, no. 2, p_ 147, 1973.
76. Saw, Y., T Hirose, F. Takahashi, M. Toda, and Y Hashigughi, J. Chern. En!). (Japan), vol. 6,
no. 4. p. 315. 1973.
77. Satt rfield, C. N.. Mass Trans{er in Hetert>qelJeous Clllalysi.\, "11T Press, Cambridge. Mass., 1975.
78 Sanerfield, eN., AIChE J., vol. 21, p. 209, 1975.
79. Satterfield, C. N., and F.Ozel. A1ChE 1.. vol. 19. p. 1259, 1973.
80. Satterfield. C. N., A. A. Pelossof, and T. K. Sherwood, AIChE J., vol. 15, p. 226, 1969.
81. Satterfield. C. N., and P. F. Way. AIChE J., vol. 18. p. 305, 1972.
82. Schiesser, W. E., and L. Lapidus, AIChE J., vol. 7, p. 163, 1961.
83. Schwanz, J. G., and G. W. Roberts, I&EC P/'Oce. . DesiglJ Del'., vol. 12. p. 262,1973.
84. Schwartz, J. G., E. Weger, and M. P. Dudukovic, AIChE J., \'01.22, p. 894. 1976.
85. Schwartz, J. G., E. Weger, and M. P. Dudukovic, AIChE J., vol. 22, p. 953, 1973.
86. Sedriks. W.. and C. N. Kenny, Chern. En{J. Sci., vol. 28, p. 559. 1973.
87. Shende, B. W., and M. M. Sharma. Chern. ElJq. Sci., vol. 29, p. 1763, 1974.
88. Shoenemann, K., Dechema Monograph. vol. 21, p. 203,1952.
DYNAMICS OF THE COCURRENT-DOWNFLOW FIXED-BED COLUMN 229
89. Shulman, K. L., C. F. Ulbrich. A. Z. Proulx, and J. O. Zimmerman, AICh£ J., vol. I, p. 253, 1955.
QO. Specchia. V., and G. Baldi, Chem. Eng. Sci.. \'01. 32, p. 515, 1977.
91. Specchia, V., G. Baldi. and A. Gianetto, in Proceedings of the 4th International and 6th European
Symposiurn on Chernical Reaction El1gineerilJg, Heidelberg, Federal Republic of Germany, 6---8
April. 1976, p. 390.
92. Stephens, G. K., PhD Thesis, University of Birmingham, 1968.
93. Suzuki, M., and J. M. Smith, AIChE J.. vol. 16, p. 882,1970.
94. Sylvester, N. D., and P. Pitayagulsarn, AICh£ J., vol. 19, p. 640, 1973.
95. Sylvester, N. D., and P. Pitayagulsarn, Cat!. J. Chern. Eng., \'01. 52, p. 539, 1974
96. Sylvester. N. D., and P. Pitayaguls.1rn. Cat!. J. Chern. En(l.. vol. 53. p. 599. 1975.
97. Sylvester, l'\J. D., and P. Pitayagulsarn, I&EC Process Design Del'., vol. 14, p. 421. 1975.
98. Towhidi, M., MSc Thesis, University of Birmingham, 1966.
99. Turner, G. A., and G. F. Hewitt, Trans. Ins/. Chern. El1g., vol. 37, p. 329, 1959.
100. Turpm. J. L, and R. L. Huntington, AIChE J., vol. 13, p. 1196, 1967.
101. Ufford, R. C.. and J. J. Perona, AICh£ J., \'01. 19, no. 6. p. 1223, 1973.
102. Van Krevelan. D. W., and J. T. C. Krekels, Recueil'Trans. Chern. Pays-Bas. vol. 67, p. 512, 1948.
103. Van Swaaii, W. P. M., J. C. Charpentier, and J. Villermaux. Chem. ElJg. ScL vol. 24, p. 1083, 1969.
104. Week man, Jr.. V. W., and J.t!. Myers, A/ChE J., vol. 10. p. 951, 1964.
105. Weekman, Jr.. V. W., and J. E. Myers, AIChE J., vol. II, p. 13, 1965.
106. Wen, C. y., W. S. O'Brien, and L. T. Fan, J. Chern. £ng. Data, vol. 8, no. I, p. 42.1963.
107. Wen, C. y., W S. O'Brien, and LT. Fan, J. Chern. ElJg. Data, vol. 8, no. I, p. 47, 1963.
108. Wulfert, K. 1., MS Thesis, Purdue University, 1969.
CHAPTER
SEVEN
DYNAMICS OF THE COCURRENT-UPFLOW
FIXED-BED COLUMN
7-1 FLOW REGIMES
The flow regime for cocurrent upflow through a packed column is composed of
various modes, such as liquid-continuous, gas-continuous, and slug-flow (a region
it" which both the former modes flow intermittently). The third phenomenon is
termed the pulsed-flow region; with the frequency of the pulses increasing with in-
creasing gas rates. At very high gas flO\y rates the zones merge and tend to become
gas-continuous. In the pulsed-flow regime, the pulses may not bridge the entire
column cross-section and can be depicted as traversing a sizable portion of the
bed. They sometimes present a sharp leading edge and a trailing edge which tapers
off in the form of a wake. In he_gas continuous regime (often termed .the....spulY-
flow regime), the liquid may flow partly as drops and partly as a film over the
packings. In the liquid-continuous or bubble-flow regime, the bubbles form a
dispersed phase.
The flow-regime boundaries in terms of K s_a c! liqu id mass vs:IQf itice £ rted
irU..h ..li!e;rature are hown in Fig. 7-1. Some data from the Pittsburgh Energy
Research Center21 of the US Energy Research and Development Administration,
and those of Sato et at 2"7 are included in this figure. As shown in Fig. 7-2, the
flow regime boundaries are given in a somewhat difterent manner by Turpin and
Huntington]" and Specchia et al. 32 The data of Specchia et al. 32 are in better
agreement with the data shown in Fig. 7-1 than those of Turpin and Huntington. 37
Most of the data for the flow regimes described above were obtained with
large particle diameters (d p > 0.2 cm). Eisenklam and Ford 5 and Saada 26 obtained
the data characterizing the flow regime for small particles (d p < 0.2 cm). They
230
DYNAMICS OF rHE CO(URRENT-UPFLOW FIXED-BED COLUMN 231
...'"'
,...
",'"
Ga -continuous or spray flow",'"
,
,
I
I
I
T
'"
...
I
E
u
(,:,
'u
0
0:;
>
'"
'"
"
E ° T
'"
'"
lJ
Surging flow
Bubble flow
0.1
I
1.0
I
10
Liquid mass velocity, G L (g crn -2 s-I)
Pittsburgh energy
research center (22)
d p - 1.9 cm )( 1.9 cm
cylindrical particle
shape
Sa to et at. (27)
d p - 1.22 cm spherical
particle shape
j Figure 7-1 Flow-regime boundaries of air-water upflow Ihrough a packed bed.
divided the flow into two regimes. At relatively high gas flow rates, the pores of
the packings are predominantly traversed by both phases together. This is referred
to as the two-phase pore-flow regime. At low gas flow rates. the pores are pre-
dominantly traversed by each phase separately. Thi is referred to as the single-
phase pore-flow regime. The prevailing regime of the flow is actually dependent
not only on the gas flow rate, but also on the liquid flow rate, packing size, and
fluid properties. A flow regime correlation containing several flow parameters is
shown in Fig. 7-3. This correlation uses dimensionless expressions very similar to
those used in the well-known correlation of Lobo et al. I 8 to predict, the onset of
flooding in a packed tower.
Recommelldatiolls F..2I.iID- lr-=-water system , as a first approximation, the flow
regime can be predicted from --either Fig. 7-.1 or Fig. 7-2(h). The effects of the
particle diameter (particularly for small particles) and the fluid properties on the
flow transition need to be examined both experimentally as well as theoretically.
---b
232 GAS LIQUID. SOUtJ REACTOR DESIGN
I. 000
500 Bubble
flow
100
SO I
I
I
I
I
10
S
Turpin and
Huntington (37)
>.
.
o
v
;.
,.
S
Slug flow
,.
2
c
"=j
E
...
;.
(a)
1,000
500
'"
E
"C
'",
c:T
:J
Speechia et
al. (32)
100
SO Bubble flow
Spray flow
10
5
I
5
500
5,000
50,000
Gas mass superficial velocity (g cm- 2 h- I J
Ib) ')0oJ(oc-.l
J Figure 7-2 Hydrodynamic regions observed by (a) Turpin and Huntington)? and (bl Specchia et aL 32
7-2 PRESSURE DROP
An early study on the pressure drop for cocurrent upflow through a packed bed
was reported by Turpin and Huntington. 37 They obtained data with the use of an
air. water system and 5.1-, 10.2-, and 15.3-em-diameter columns packed with
tubular alumina particles of 0.76 and 0.82 cm in diameter. Gas flow rates extending
from about 7.8 through 2,298 g cm - 2 h -1 and liquid flow rates having a range
of 2.347 through 19,560 g cm - 2 h -1 were used. The data were correlated by an
DYt-:AMICS Ot THE COClIRRENT-UPFI..QW FIXED-BED COU IMN 233
y
1,000
100
Regime of
two-phase
pore flow
10
....
d
m
::a.'::a.
L--....J
l,; ....
. Q.I 0.1
I '""
"'
:::.
L....:........J 0.01
Regime of
\ ingle-phase
\ pore flow
\
\
\
\
\
\
\
\
\
,
\
\
\
\
\
\
\
\
\
\
\
\
\
\
\
\
\
0.001
0.0001
0.00001
0.01
10
0.1
( ) vG
:!
100
Figure 7-3 A i::orrelation of
flu", tmnsilion by Saada. 2h
empirical relation illustrated in Fig. 7-4. In this figure, 1LG is the two-phase fraction
factor defined as . -
j . _ (AP/!!Z)I. G d.{/c
I.G - .,. V ' 2
L OG PG I
(7-1)
where /!!P/tJ.Z) is the pressur€ gradient, de is the equh'alent diameter of packing
as defined by
j; V
de = 1 - c S p ,
p
where V p and Sp are the volume and the surface area of the packing particle. £
234 GAS-LIQUID-SOLID REACTOR DESIGN
10,000
1,000
9
""
100
10.0
1.0
0.1
I
1.0
100
1,000
(
Figure 7-4 Friction factor correlation, upward flow.);
_ _ (d p Gc:,IIlG)1.167
z- - - -.---
(dpGl/ll l )0.767
is the packed bed porosity, Yc is the gravitational constant, V OG is the superficial
gas velocity, and PGl is the gas density at the upstream position. An analytical
expression for the correlation shown in Fig. 7-4 is given as
In fLG = 8.0 - 1.12 (In Z) - 0.0769 (In Z)2 + 0.0152 (In Z)3
(0.3 Z :s;; 500).
(7-2)
The above relation covers the parts of both the bubble-flow and pulsed (or
slug-) flow regimes. Z is defined in Fig. 7-4.
Ford" measured the pressure drop in beds packed with approximately I-mm-
diameter particles. He identified the flow regime based on the flow that takes place
inside the pores, namely, "single-phase pore flow" and "two-phase pore flow." He
presented correlations
(L Pf Z)LG = 0.0407 (Red o . 29 (ReG)O.S7 ( /ll ) U.2B
@L
for two-phase pore flow and
(7-3)
DYNAMICS OF THE COCURRENT-UPFWW FIXED-BED COLUMN 235
I ( ) 0.80
- ( P/ Z)LG - 0.0485 {Redo. 67 (Redo.] J1L
L
for single-phase pore flow. Here, ( P/ Z)I.G is the pressure gradient, PL is the
liquid density, /-l-L and J1G are the liquid and gas viscosities, respectively; RCL =
G L d p /J1L and ReG = GGd p /J1G are the liquid and gas Reynolds numbers, G L and
GG are the liquid and gas mass fluxes, and d p is the packing diameter. Ford 6
pointed out that the transition from one flow regime to the other could occur
at a liquid holdup of h L = 0.43. If hI. < 0.43, Fq. (7-3) should be used; if ilL> 0.43,
then Eq. (7-4) should be used for the pressure drop calculation. Saada 26 noted
some inconsistencies in Ford's correlations and. subsequently, repeated and
extended part of Ford's work. He studied the air-water system in a 4.5-cm-i.d.,
40-cm-long column. Three different size packings (0.514-, 0.974-, and 2.064-mm-
nominal-diameter glass-bottom spheres) were examined. He proposed the
following relation for the regime below transition (i.e., single-phase pore flow)
( P ) = 0.024 Reg.J9 Re .60 ( d p ) - 1.1 (7-S)
gPL Z LG de
and the following for the regime above the transition (i.e., two-phase pore flow)
( ) = 0.027 ReS. SI Re ']S ( d r ) - Ll5 (7-6)
gPL Z LG \d e
(7-4)
Here, 9 is the gravity acceleration and de is the column diameter. All other
parameters are the same as defined earlier. The transition from single-phase pore
flow to two-phase pore flow can be obtained from the relation
ReG. = 0.44 Ret (d p /dJI.38,
(7-7)
where ReG" is the minimum value of gas Reynolds number above which the flow
will be in the two-phase pore-flow regime.
The pressure drop data in highly-pulsed- and spray-flow regimes were
obtained in a 10.2-cm-i.d, clear acrylic column by the Pittsburgh Energy Research
Center (PERC).22 Over 300 pressure-drop data points were obtained for both
0.63S-cm x 0.63S-cm and 0.32-cm x 0.32-cm pellets. Some of these data are shown
in Fig. 7-S. These data were well correlated by Tallmadge's correlation,]6 as
shown in Fig. 7-6. Sato et al.,17 on the other hand, correlated their data with
the Lockhart-Martinelli type of relation. They also graphically illustrated some
pressure-drop data in all three: bubble-, pulsed-. and spray- (or gas-continuous)
flow regimes.
Finally, in a relevant study, Gorring and Katz 7 measured drag coefficients
for single air buhhles rising in packed beds of 2.S4-cm glass spheres filled with
stagnant glycerine solutions, water or n-heptane. The drag coefficients in the
hexagonal and random arrays were two to three times greater than the ones in
clear liquids, whereas the drag in a cubic array was the same as that for clear
liquids. The data were correlated by use of the minor bubble diameter in the
drag coefficient and the major diameter in the Reynolds number.
236 GAS-LIQUID SOUD REACTOR DESIGN
18
-
C
)<
.,
E
:.J
.:;.
-;:;
'"
'-3
'" 9
...
""
'"
""
Q:
G L 0.12311 cm- 2 s-t
...;0- G l 0
..........
;0'"
1 -
0.5
Mas flux of gas, Gc; (g em 2 S-I)
0.31 7 )( 0.3 I 7 I.m pellets
0.635 )( 0.635 cm pellets
.'
Gas = Air
LiquId Water
Temperature = lODe
Pressure range = 0-3.4 atm
10.2 cm i.d. column
j Figure 7-5 Typical pressure gradient as a function of the gas and liquid mass fluxe in pulsed-flow
regime. 22
RecnmmenJations For large-size packings, use of Eq. (7-2) is recommended for
the calculation of pressure drop in the bubble- and pulsed-flow regimes. For
small-size packings, wherever possible. PERC data 22 or the data of Sato et al. 27
for the pressure drop could be used. More experimental as well as theoretical
studies on the pressure drop for hydrocarbon systems are needed.
,
.....
.........
..........
DYJ'.:AMICS OF THE C'OC'URREN1-l]PFLOW FIXFD-BED COLUMN 237
0
><
-;'
E
u
E
E 18
<]
Q::
S
10:
Eo
'"0
'"
'"
Q)
'"0
Q)
5
'"
'"
Q)
::;;
0
Prcssure drop from the correlation of Tallmadge,
(8PI Zk(; (atm em - I X 103)
Figure 7-6 Comparison of ex-
perimental pressure-drop data
wilh data oblained using the
correlation of Tallmadge. 22
7-3 GAS AND LIQUID HOLDUPS
Earlier studies on the measurcments of the gas holdup in a packed bubble-column
were performed by Weber,39 Stemberding,33 and Voyer and Miller. 38 Weber
found that the gas holdup was unaffected by the liquid flow rate. a result similar
to the one observed in an unpacked bubble-column. A decrease in the surface
tension of the liquid was also found to i n rease the-Eas h.ol d . The correlations
presented by him arc summarized in Table 7-1.
Table 7-1 Gas holdup correlations of Weber 39 t
Liquid phase
Packmg
Gas holdup
correlaliont
Comment
Water
Water
Water
Waler
Water -r 0.2 percent
ethanol
Watcr + 0.2 percent
ethanol
6-mm Raschig rings
5-mm spheres
4.mm x IO-mm cylinders
2-mm spheres
2-mm spheres
II OG = 0.114Ugii'
hOG = 0.079U8J
live; = 0.079U8d
hOG = 0.078U8,-,2'
110'; = O.113Ugi
h Oi . + hoc. = 0.71
h OL + hOG = 0.33
h m . + hoc; = 0.42
11 01 + IIOG = 0.32
5-mm spheres
110<; = 0.152Ug;?
t Correlations are' valid in thc gas velocity range of 0.15 em s - 1 .;; U 0(, .;; 3 em s - I
+ II OG and hol. are the fr lctions of tOlal bed volume occupied by gas and liquid. respcctively; U oa
is the nominal superficial gas velocily in centimeters per second.
238 GAS-LIQUID-SOLID REA.ITOR DESIGN
Voyer and Miller 38 measured the liffi!J. U.l ldup in a column with screen
packings. The liquid holdup decreased with an increase in gas velocity; however,
no correlations were presented. Turpin and Huntington 37 measured the liquid
holdup in an air-water system and 5.1-, 10.2-, and 15.3-cm-diameter columns
packed with tabular alumina particles of 0.76 and 0.82 cm in diameter. The lotal
liquid hC?ldup was correlated to the ratio of liquid-to-gas mass fluxes by an
e pirieal relation
ilL = -0.035 + 0.182(GLfGG)O.24
(l.O [GLfGdo. 24 6.0),
(7-8)
where G L and GG are the superficial mass velocities of liquid and gas, respectively,
and h L is the total liquid holdup based on the column's void volumc.
Although Turpin and Hunti gton37 report their correlation to be valid for
I (GL/GdO. 24 6, at (G L /Gc}°.24 5.69, hl, according to Eq. (7-8), exceeds
unity. This is impossible, since h L approaches unity when G L »GG. Very recently,
Stiegel and Shah 35 compared their data using equivalent particle diameters of
0.38 and 0.44 cm with those of Turpin and Huntington. 37 This comparison is
shown in Fig. 7-7, Stiegel and Shah 35 also compared their data with an air-water
system using a dimensionless relation
"C 0.8
'"
t:
'"
0
0- 0.6
"C
-0
.c
"C
';i 0.4
cr
-;;
-0
I-
0.2
h l = CI. Re{ Re6 (a.d.)",
(7-9)
-..
1.0
--- Turpin and Huntington (37)
[!; d = 0.44 em } ........
o d: = 0.38 cm Stiegel and Shah (35) A n,........ [!;
It e ..".n 11 Ii
- _J C , / &
° ,....
°A ° .."
Ij .." ....
..,,""
....
....
........
01.0
3.0
2.0
4.0
5.0
(Gl/Gc; )0.24
*For cylindncal extrudates d, = ..J dJ!.Lp 1- d /2 where d p and Lp
are the diameter and the length of the cylinder.
Figure 7-7 Correlation of liquid holdup versus (G L /GG)O.24Y S I
DYNAMICS OF THE COCURRENT-UPFWW FIXED-BED COLUMN 239
where
= 1.47,
f3 = 0.11,
y = -0.19.
17 = -0.41,
(j' - 0.111 ;
(j' = 0.005563;
a' = 0.00488;
(J' = 0.0405.
Here, as is the external surface area per unit volume of column and (j' is the
standard deviation in each variable. ReL and ReG are the liquid and gas Reynolds
numbers based on the particle diameter, d.. It should be noted that, unlike the
report of Weber, 39 the above relation indicates a mild dependence of liquid holdup
on the liquid velocity, a result similar to the one reported independently by
Ohshima et a1. 2 ] Heilman's9 correlation, however, indicates that the gas holdup
(or liquid holdup) is independent of the liquid flow rate as long as the liquid flow
rate is low and the gas holdup remains below 0.54.
The dimensionless correlations between the liquid holdup and the gas and
liquid Reynolds numbers are also given by Ford fi and Saada. 2fi Ford fi suggested
that for h L < 0.43, a relation
"
fIG = 21.2 (ReL/ReG)O.2(pL!J.ldo. 24
(7-10)
can be used to calculate Il G and, hence, hL' Saada 2fi updated the above correlation
with some of his data and presented the relations
ilL = 0.48 (ReL/Re G )0.25
(7-11 )
for. t . si !1gl.e:-phase pore-fl(),# regime a.od
h L = 0.32 (ReLfRed o . o7
(7-12)
for the two-phase pore-flow regime.
The data for Eq. (7-9) were taken in both single-phase pore-flow and two-phase
pore-flow regimes. It is interesting to note that the exponents on ReL and ReG in
Eq. (7-9) lie in between the corresponding ones in Eqs. (7-11) and (7-12), thus
implying some internal consistency in these correlations. Equations (7-11) and
(7-12) also indicate that h L is more strongly dependent upon gas and liqtlid
Reynolds numbers at lower gas flow rates (i.e., in single-phase pore-flow regime).
Achwal and Stepanek t recently measured the holdup profile in a packed
bJ,lhble-c-elu-mn by a method based on measuring thermal conductivity. They
found that the gas holdup in a packed bed increased with height and related
this increase to the change in pressure. Two separate correlations for the average
gas holdup were derived. One, based on the homogeneous flow model, was
expressed as
l/h G = I + 4.33UOLO.433(UoL/UOG)O.563
(7-13)
240 GAS-LIQUID-SOLID REACTOR DI'SIGN
and the other, based on a force balance on the column, was expressed as
11r, = 2[1 + (I + 72.3UOLO.229[UOL/VOG]0.423)I/2]-I.
(7-14)
Here, h G is the gas holdup. It should be noted that the above relations, which
are obtained from curve-fitting the experimental data. differed considerably from
strict theoretical models based on homogeneous flow and force-balance models.
Just as did the data of Stiegel and Shah,35 the data of Achwal and Stepanek t
indicated the mild dependence of liquid velocjty on the gas holdup in the range
0.4 cm s - t < VOL < 7 cm s - t. The gas holdup decreased with an increase in liquid
flow rate.
Sato el al. 27 correlatcd liquid holdup to the Lo.ckhart Martinelli llillj)I!!.. er
for the pressure drop. Based on their own data, they obtained a n::l tio_n
h L = O.6a i3 XO. 16 ,
(7-15)
when as is the specific surface area of the bed [= 6(1 - f.)/d p ], and X is the
Lockhart-Martinelli parameter (= J(AP L/!!.P G ), where !!.P L and !!.P G are the
pressure drops ifliquid and gas flowed separately).
A theoretical model ofthe liquid holdup for cocurrent upflow through a packed
column was proposed by Hutton and Leung. I 2 Like Sato et al.,27 they correlated
-..
0.15
,...
E
,...
.s 0.1
0.
::I
"0
"15
.t::
::s
c:r
:J
0
Concurrent gas liquid upftow
0.02
0.04
0.06
0.08
0.10
Superficial liquid velocity (m s-I )
- Model predictions (12)
o a . Results of Turpin and
Huntington (37)
Curve
No. Data Vue (m s-t)
I 0 1.53
2 a 3.06
3 . 5.05
Figure 7..8 Model of Hutton and leung'2 versu the data of Turpin and Huntington,17 for cocurrcnt
gas liquid upflow.
DYNAMICS Of TIlE COClJRRE:-':T-l.:PFLOW FIXED-BED COLUMN 241
the liquid holdup to the pressure drop. Assuming.that hOL = hOl.(U OI ., ( P/ Z)LG)'
they derived a relation
. h l( P\ I J Ill
VOL = ;,L d t!2 Z)LG p---;' - 0
(7-16)
where d is the characteristic packing length and S' is a shape factor for the
packing. ( P/ Z)LG was given by the rclation 12
( P ) = l s. 5J1.Ga;CE -I- asCi; ( J1. G a, ) O.1 I ----.!-------:3'
z I.G fiG PG C G J(1 - c - hod
(7- J 7)
Here, c is the solid fraction in the column. By combining Eqs. (7-16) and (7-J 7),
hOL as a function of VOL and GG can bc calculated. It should be noted that this
theoretical relation predicted hOL to depend on the gas flow rate. A comparison
between the predictions of Ihis model and the experimental data of Turpin and
Huntington 37 is shown in Fig. 7-8. As illustrated, the agreement was only fair.
With the help of their theoretical model, Hutton and Leung t2 showed that
cocurrent-upflow operation gives higher liquid holdup than cocurrent-downflow
operation under the same gas and liquid flow conditions, a fact demonstrated
experimentally by Turpin and Huntington 37 (see Fig. 7-9).
Very recently, an interesting study of the liquid holdup in a packed column
with cocurrent gas-liquid upflow was carried out by the Pittsburgh Energy
Research Center. 22 In this sludy, a series of radial conductivity measurements waS
performed on air-water flow through a 1O.2-cm-i.d. clear acrylic column, with
various packings. Three packing sizes (1.9-cm x 1.9-cm, O.635-cm x O.635-cm, and
0.32-cm x O.32-cm cylinders) were examined. The conductivity detection system
comprised two solid stainless-steel rods fitted with Teflon jackets, leaving only the
0.25
0.75
Turpin and
Huntmgton (37)
0.
::s
"0
.J::
"0
':;'
0-
;:j
0.50
1.0
2.0
3.0
(G 1 /G C )O.24
4.0
5.0
Figure 7-9 Liquid holdup for cocurrcnl upflo\\" versus cocurrcnt down flow Ihrough a packed hed
242 GAS-IJQUID-SOLID REACTOR DESIGN
parabolic ends exposed to electrical current flow. The rods were mounted normal
to the bulk flow and were set 180 0 apart in the same plane. A eonstant gap of
0.635 em was maintained between the ends of the probes. The probes were fitted
to the column via compression fittings having Teflon seals. These fittings permitted
the radial movement of the probes across the column while the system was flowing
under pressure without leakage (see Fig. 7-10). The probes were connected to a
recorder which monitored the voltage response.
This probe system had many advantages ovcr conventional single-probe-
two-wire systems. First, it provided a high degree of ruggedness, which was
necessary when passing through a tightly packed bed and when exposed to the
violent forces associated with turbulent flow. The elimination of protective guards
permitted the probes to have a diameter equal to or less than that of the pellets.
Also, the measurements were not biased relative to their radial position, inasmuch
as the same length of probe was always present as a flow barrier. Another
important feature was that the probes were axially isotropic with regard to their
orientation vis-a-vis the flow stream. Consequently, errors which resulted from
inconsistent rotational orientation were eliminated.
-..
0.32-cm Stainless-steel probe
fitted with Teflon
shrink tubing
+
a.c.
a.c.
Compression filting
with Teflon seal
placed 75 cm
above entry
Conduction occurs between
noninsulated cnds of probes
10.2-cm-i.d., 121.9-cm-Iong
acrylic tube
i \ I
Figure 7-10 Probe configuration for conductivity measurements.]]
60
50
.., 40
0
><
30
<U
:.J
<:
-
" 20
C<::
10
0
DYNAMICS OF THE COCURRENT-UPFLOW F1XEtJ.BED COLUMN 243
79.2
77.3
75.0
c::
72.2 S
E
68.7 i::
<U
:.J
58.3 r:;
0
u
..
50.0 '0;
C
41.7 ..,
c.J
..
<U
cc
37.5 C
<>
Ib.7 ..
OJ
0-
. 0 cc
-<
. Run no. I
a Run no. 2
Air flux = 0.424 gm cm- 2 50- I
Water flux = 1.374 grn crn- 2 s-t
Av. static pre5OSUr = 2.99 atm
3/8
4/8
518
6/2
7/8
'/'0 = Dimensionless radial distance from center
Figur 7-11 Radial resistance profile in a packed bed of 0.J2-cm x 0.32-cm cylindrical pellets under
high water and moderate air fluxesY
Experimental values of the total liquid holdup were obtained by simultaneous
closure of the inlet and exit solenoid valves, followed by drainage over a IS-min
period. In some experiments, these values were checked by actual weighing of the
section of the column in between the solenoid valves. The liquid holdup data were
obtained by correlating the conductivity to the liquid/gas ratio. The details of
the liquid holdup measurement technique are given in the Pittsburgh Energy
Research Center's quarterly reports. 22
The experimental data were largely obtained in bubble-flow and pulsed-
flow regimes. A typical radial variation in the liquid holdup obtained under
pulsed-flow regime is shown in Fig. 7-1 L Runs nos. 1 and 2 in this figure are
duplicate runs. Although the manner in which the column was packed may have
had some effect on the holdup profile, it is clear from this figure that the liquid
holdup profile was relatively flat in the center of the tube and was very sharp
near the wall. It should be noted that the liquid holdup in this study was defined
in terms of fraction of open reactor volume occupied by the liquid.
The average liquid holdup was found to be a very strong function of actual
gas velocity. U G =- [UoGh(1 - hd]. and a relatively mild function of the liquid
velocity. For 1.9-cm x 1.9-cm packings. typical results of the liquid holdup (both
total and dynamic) as functions of U G and the liquid velocity are shown in Fig.
7-12. These results show a sharp change in the holdup/ftow rate relationships as
the flow regime changes from bubble flow to pulsed flow. Imerestingly, in the
244 GAS-LIQUID -SOlID REACTOR DI;StGN
LO
Total liquid holdup fraction
Dynamic liquid holdup fraction
0.50
...!
'""=
<::
.
;;
Co
::s
'C
'0
.c::
'C 0.10
':;
C'
:::1
Liquid mass
Curve velocily
No. (gm cm- 2 s-l )
I 0.0631
2 0.1071
\ 3 0.5345
4 0.9927
5 1.527
0.02
o
180
360
Actual gas interparticle gas velocity, U G (em s-] )
Figure 7-12 Dynamic and total liquid holdup as a function of average gas II1terpartlcle pore velocity
in a IO.2-cm-i.d. column packed with 1.9-cm x 1.9-cm ceramic cylinders. 22
pulsed-flow regime a plot of total liquid holdup versus V G (at constant liquid
velocity) drawn on semi log paper gives a straight line.
From the liquid holdup data. average liquid residence times were calculated
from the expression 'L = Vt/IL/QL' where V is the volume of the 122-cm section
of the column, where the measurements were taken, and QL is the volumetric
liquid flow rate. The average liquid residence time is shown as a functi :m of V G
and as a function of the liquid flow rate for three packings (0.32 cm x 0.32 cm,
0.635 cm x 0.635 cm. and 1.9 cm x 1.9 cm) in Figs. 7-13 and 7-14. Figure 7-14
shows a sharp change in the lL -CI G relationship (at constant liquid flow rate) as
the flow regime changes from bubble flow to pulsed flow. At a constant V G
DYNAMICS OF THE COCURRENT-UPFLOW FIXED-BED COLUMN 245
and constant liquid flow rate, a larger packing size gave longer average residence
time. The results ilh,lstrated in Figs. 7-13 and 7-14 show that, just like liquid
holdup, the average residence time for a given packing and liquid flow rate is
proportional to e hL\ where b is a constant which is somewhat dependent upon
the packing size and relatively independent ofliqUid flow rate. As one might expect,
the average residence time increased with a decrease in the packing size and the
liquid flow rate.
Stiegel and Shah 34 reported the liquid holdup characteristics of a packed
(with 0.318-cm polyethylene or 0.44-cm equivalent diameter packing) rectangular
(16,8 cm x 2.06 em) column. The column was approximately 122 cm high. The
measurements were carried out with an air (in the flow range oro through 0.203 kg
s- 1m 2 } water system. The total liquid holdup was correlated by the relation
400
300
200
.-..
'-'
--
oJ 100
E
'" 80
u
c::
"'
-c 60
"'
...
:::I
g 40
'"
""'
Q)
20
hI. = a" Ref' Re{,
(7-18)
G L = water flux gm cm- 1 s-l
0.317 em x 0.3 I 7 em catalyst cylindcr
0.635 em x 0.635 em catalyst cylinder
C L =0.127 -_
---_ GL =0.152
--
--
--
--
C L = 0.387 -- _ G L = 0.382
--
--
nm ---
G L =0.777 -__ G L =0.763
-------
--
C L Z. --__:.L = 1.276
---
10 0
300
600
900
Actual gas interparticle gas velocity, Uc; (cm s-I)
Figure '-13 Average liqUId resIdence lime as '1 functIOn of average gas interparticle pore velocily
and liquid flux (air-water upflow in a fixed bed)."
246 GAS-LlQUID-SOLlD REAf'mR Df.5IGN
"
where
" = 0.873,
fi" = 0.052,
i' = - 0.092,
(j' = 0.0329 ;
(j' = 0.00831 ;
(j' = 0.0072.
The results indicated that, under equivalent flow conditions, the liquid holdups
in a rectangular column were, in general, higher (in some cases as much as 50
percent higher) than those obtained in a cylindrical column of equivalent cross-
section.
10 3
Column heigh t = 121.9 cm
10. cm i.d. column
Cylinder packing -
1.9 em x 1.9 em.
I
I
I
--....
Pulsed
flow
or-
'-'
E
-
a.>
u
c::
1)
"0
.;;;
..,
.5
.!2'
1)
01)
E
<>
>
-<
I
o
150
450
Figure 7-14 Average liquid resi-
dence time versus U G - 22
UG(cm s-\)
DYNAMICS (IF THE COCURRENT-UPFU)W FIXED-BED COLUMN 247
Shah et al. 29 measured the gas holdup in a bubble column with vertically
suspended rods and screen baskets packed with 3.2-mm polyethylene extrudatcs.
The gas holdup data obtained in a batch system (i.e., no liquid flow) indicated
that the gas holdup remamed essentially unaffected by the presence of rods or
baskets, as long as the open section of the column was approximately 70 percent
or higher. As the volume occupied by the packed screen baskets or rods increased
above 30 percent of the total column volume, the gas holdup was increased
compared to the holdup in the absence of rods or baskcts. This was presumably
due to an increase in the actual velocity of the gas in the open section of the
column.
Recommendations The gas holdup in the bubble-flow regime can be estimated
using either Eq. (7-13) or Fq. (7-14). For the estimation of liquid holdup in the
bubble-flow regime, use of Eq. (7-9) is recommended. In the pulsed-flow regime,
the data of PERC and Eq. (7-15) would be useful. More experimental work with
the hydrocarbon systems is needed.
7-4 AXIAL DISPERSION IN THE GAS AND LIQUID PHASES
To this author's knowlcdge, no data are currently availahle on the RTD in the
gas phase for co current gas-liquid upflow through a packed column For unpacked
bubble-columns with large length-to-diameter ratios, the gas phase is usually
assumed to be in plug flow. The same should be true for the bubble-flow regime
in a packed bubble-column.
The axial mixing in the liquid phase for eocurrent upflow through a packed
column has been investigated by several investigators. Schoenemann 2B reported
qualitatively that the liquid RTD for cocurrent-upward bubble flow was narrower
than that observed in trickle-flow (down flow) operation, Other earlier studies on
the subject are those by Kunugita et al.. Iii Weber,3Y and Hofmann. J I Weber 39
measured the liquid-phase axial dispersion for the flow of demineralized water
and air in a packed column 5 cm in diameter and I m high. Several glass
packings, 2.0-mm spheres (£ = 0.32), 5.0-mm spheres (f. = 0.33), cylinders of 3.8 mm
diameter and 10 mm length (equivalent sphere diameter, 6 mm, c; = 0.43). and
6.2-mm Raschig rings (equivalent sphere diameter, 6 mm, f: = 0.71) were investi-
gated. The results were correlated by the following expressions:
Pel. = 0.12Xg. 48 for 5-mm spheres,
Pel. = 0.024Xg. 46 for 4-mm x IO-mm cylinders,
Pel. = 0.017Xg. 43 for 6.2-mm Raschig rings.
(7-19)
(7-201
(7-21)
Here, X 0 = (VI./U G ) ReI. SCL. ReI., Sc t _, and Pel. are the Reynolds, Schmidt, and
Peclet numbers for the liquid phase. Pel. and ReI are based on the equivalent
sphere diameters and the nominal liquid and gas velocities, l r l. and U G, respectively.
The correlations are valid for the range 1 < X 0 < 1000. For X 0> 1000, the
248 GAS LIQUID SOLID REACTOR DESIGN
relation
PeL (h Ol + hod = 0.4
(7-22)
was found to be valid. No similar correlation was found for the data with 2-mm
spheres. Weber 39 also found that the liquid-phase surface tcnsion had little effect
on axial mixing.
Hofmann ll derived a relation PeL = f(Re.., Wel.,dc/dp, UL/U G ) based on his
experimental data. Here, We.. (Weber number) = aljpLll , where aL is the liquid
surface tension and db is the bubble diameter. Heilmann and Hofmann] 0 correlated
their data in terms of hdPe.. as a function of Reljhr.d .3. This type of correlation
also fitted the recent data of Stiegel and Shah 35 reasonably well at low liquid
Reynolds numbers. At large liquid Reynolds numbers, the data of Stiegel and
Shah 35 showed somewhat larger values of h../PeL than the ones predicted by
Heilman and Hofmann lO (see Fig. 7-] 5). The data of Stiegel and Shah 35 were
obtained in the range of liquid velocities 0.25 through 3 cm s -] and gas velocities
13 through 75 cm s - I, both of which are higher than those studied by Heilman
and Hofmann. lo They also used particle sizes (equivalent diameter 0.38 cm and
0.44 cm) considerably smaller than those used by Heilman and Hofmann. I 0 These
particles were more representative of the catalyst size used in hydro processing
reactors. Based on their data, Stiegel and Shah 35 also presented a correlation
-.....
10'
0-,
"-
o ' o 0
cPo I{)
l' G3I6
oa, .6 0 0 0
o , 0 6 0
1I '..... 6
i.. t t
"- t
,
.....
o
.....
"'
e:
.:;:..J 100
.c.,A,D
.6
.6
o
Heilmann and Hofmann (10)
Data of Stiegel and Shah f34. 35)
Max. gas flow rate } cylindrical
Min. gas flow rate column
Rectangular column
,
,
,
,
,
,
10- 1
10 2
10 3
Rel/h G d .3
Figure 7-15 Heilmann Hofmann correlation for backmixing in a cocurrent-upflow packed bubble-
column. 34
10 4
DYNAMICS OF THE rOrURRENT-UPFWW FIXED-BED COLUMN 249
wherc
Pel = (1.' Ref Re (ii.d.)'1 .
(7-23)
.'/.' = 0.128, (J' = 0.07, Pe.. = ULd./E zL ;
If = 0.245, (l = 0.0438,
y' = - 0.16, a' = 0.0356, Rel = d, GL! J-lL;
1'1' = 0.53, (l = 0,29, ReG = d.GG/J-lG'
Stiegel and Shah 35 found that the Peclet number was somewhat dependent upon
the bed height. Unlike the unpacked bubble-column, the above correlation indi-
cates that the axial dispersion coefficient in a packed bubble-column is dependent
upon the liquid velocity,
One eommon feature of the studies described above is that they all indicate
that the axial dispersion in the liquid phase (and the same should be true for
the gas phase) of a packed bubble-column is considerably smaller than that
obtained in the liquid phase of an unpacked hubble-column under equivalent flow
conditions.
Stiegcl and Shah 34 measured the liquid-phase axial dispersion coefficient in
a packed rectangular column. Some details of system conditions used in this study
have been described earlier, in Sec. 7-3. The axial dispersion coefficient and the
liquid-phase Peclet number were correlated to the gas and liquid Reynolds
numbers by the expressions
En = a' Ret Re
where En is in centimeters per second, and
d = 0.475,
h' = 0.58,
e' = 0.13,
and
(7-24)
a' = 0.155;
a' = 0.0602 ;
a' = 0.0538 ;
Pel = a" Ref Re ',
(7-25)
where
aU = 0.0775,
b" = 0.31,
c" = -0.097,
a' = 0.0247;
a' = 0.0615;
a' = 0.059 L
The above results indicate that, just as in the case of a cylindrical column,
the axial dispersion coefficient in a packed rectangular bubble-column depends on
the liquid flow rate. The most interesting aspect of this study was that, under
250 GAS-LIQUID. SOLID REACTOR DE.q(.!'.
1.0
0.8
Re L = 125
0.6 ReL = 75
"C Re L =
25
u 0.4
:0
"'
..
0.
0.2
Re L = 125
- Re L = 75
Rectangular column
- Re L = 25
6
8 10 20
ReG
40 60 80100
Figure 7-16 Comparison of the
liquid Peclet number for a packed
rectangular 34 and cylindrical JS
column at various operating
conditions.
0.1
4
equivalent flow conditions. the axial dispersion cocfficient in a rectangular
bubble-column was about 2 or 2.5 times larger than those obtained in a cylindrical
packed column with equivalent cross-sectional area (see Fig. 7-16). The secondary
flow caust:d by the corners in a rectangular column may be the causc of this
increase. The fact that a rectangular column gives more backmixing than a
cylindrical column of equivalent cross-section can also be illustrated in terms of
the Heilman-Hofmann correlation, as shown in Fig. 7-15.
Very recently, Shah et al. 29 studied the liquid-phasc axial mixing in a bubble-
column containing vertically suspended cylindrical tubes or rods. The experimental
data were obtained In a batch (i.e., no liquid flow) system. The gas velocity was
varied from approximately 5 through 19 cm s I. Glass rods and cylindrical screen
-baskets (IO-mesh screen and packed with 3.2-mm polyethylene extrudates) of
various sizes and numbers were investigated. It was found that at low gas
velocities (i.e., in the bubble-flow regime) the presence of glass rods increased the
axial dispersion coefficient. For a given fraction of column volume occupied by
the rods, there was a larger increase in the axial dispersion coefficient for rods
with a larger surface area. At low gas velocities, the presence of screen baskets
filled with 3.2-mm packing gave higher axial dispersion coefficients than for the
empty column. At high gas velocities, both rods and screen baskets seemed to
have a very small effect on the axial dispersion coefficient. With 19-mm diameter
screen baskets in the bubble-flow regime, the axial dispersion coefficient showed
a maximum with respect to the number of baskets. For the same total volume of
baskets, one large diameter (38 mm) basket gave a larger axial dispersion than
four smaller diameter (19 mm) baskets.
Some studies 13.14 on the liquid-phase axial dispersion in horizontally-
sectionalized bubblc-columns have also been rcported. In these studies, the bubble-
column was sectionalized by a series of sieve plates with bubble caps. The data
indicated that the axial dispersion in this type of column was considerably less
than in an open bubble-column. There was no effect of length-to-diameter ratio
up to a ratio of 24 on the axial dispersion. The axial dispersion increased with
DY:-IAMlrS OF THE COrURRENT-UPFLOW FIXED-BED COLUMN 251
an increase in column diameter, but the effect of perforated dimensions on the
axial dispersion was negligible. The authors presented generalized correlations for
the axial dispersion coefficient.
Rt!commt!ndat;on. For a cylindrical packed bubble-column. the use of Eq. (7-23)
for the calculation of axial dispersion coefficient in the liquid phase is recom-
mended. The axial dispersion in the gas phase of large columns needs to be
investigated. Future study on this subject should concentrate on the pulsed-flow
regime and the hydrocarbon systems.
7-5 GAS-LIQUID INTERPHASE MASS TRANSFER
The reported study on gas-liquid interphase mass transfer for upward cocurrent
gas liquid flow is fairly extensive. Mashelkar and Sharma l9 examined the gas-
liquid mass-transfer coefficient (both gas side and liquid side) and effective inter-
facial an:a for cocurrent upflow through 6.6-, 10-, and 20-cm columns packed
with a variety of packings. The absorption of carbon dioxide in a variety of
electrolytic and nonelectrolytic solutions was measured. The results showed that
the introduction of gas at high nozzle velocities (> 20,000 em s I) resulted in &
substantial increase in the overall mass-transfer coefficient. Packed bubble-
columns gave some improvement in the mass-transfer characteristics over those
in an unpacked bubble-column. particularly at lower superficial gas velocities. The
value of the effective interfacial area decreased very significantly when there was
a suhstantial decrease in the superficial gas velocity as the gas traversed the
column. The volumetric gas .liquid mass-transfer coefficient increased with the
superficial gas velocity.
Specehia et al..\2 measured gas- liquid interfacial area and liquid-phase mass-
transfer coefficients in an 8-cm-diameter packed column. Three types of packing,
glass spheres, Berl saddles, and ceramic rings, all of 6 mm, were examined.
Superficial velocities of 14 through 221 cm s - 1 and 0.25 through 4.3 em s- t were
used for the gas and liquid phase. respectively. The gas-liquid interfacial area
was correlated to the pressure drop by an expression
aL = 0. 29 1 ( _ I1P ) J 1.17 + 0.61.
as _ I1Z LG lI,.
Here, aL is the interfacial area per unit volume of column in m - 1. a, in m - 1.
and (I1P/I1Z)LG in kg. m - 3. The relative mean quadratic error for the above
correlation is 6.2 percent. A comparison between Eq. (7-26) and a similar relation
for the downflow conditions is illustrated in Fig. 7-17. The liquid-side mass-
transfer coefficient was similarly correlated to the energy parameter by an
expressIOn
(7-26)
k E; I ( I1P ) (' f. ] 0.275
10 3 + = 7.96 - - de 2 - 9.41.
Liol I1Z LGtl,PLU OL _
(7-27)
252 GAS-UQUID-SOLID REACTOR DF 'iIGN
4
....
'"
3
2
0.6
0.5
0.5
I 2 3 4567
( - fJ.p ) ..f: (k8f m m- 3 )
fJ.Z LG as
Figure 7-17 Energy correlations for aJo,.32
Here, k L is in m s-\ VOL is in m S-l, go is in kg m m kg r t s- 2, PL is in kg m- 3 ,
and a, is in m ]. The above relation is graphically illustrated and compared with
a similar relation for the downf1ow conditions in Fig. 7-18. Better values of k L
are ohtained for slower liquid velocities in upftow compared to downftow,
presumably due to an increase in circulation inside the liquid drops, caused,
among other things, by the greater slip velocity between the liquid and the gas
phase. It should be noted. that the estimation of aL and k L from the above relations
requires a prior knowledge of {tJ.P/tJ.ZkG'
6 x 10 2
....
;;g
"'
....
"'"
4
4 x 10- 3
10 2 4 6 8 10 2 2
( fJ.p ) Egc
fJ.Z LG a.Pl V5l
Figure 7-18 Energy correlations fOT k L . 32
4 6 8 10 3
2 x 10 3
DYNAMICS OF THE COCURRENT-UPFLOW FIXED-BED COLUMN 25..1
3
2
I
8
6
4
i 2
....
....
"< 10-. 1
8
6
4
2
10- 2
I
I I I I1II1 L_
2 4 6 8 10 2 4 6 8 10 2 2
(- ;) LG VOl (kg! m m -3 g-l)
4 5 x 10 2
Figure 7-19 Energy correlations for k L uL. 32
Specchia et al. 32 also showed that the upflow values of kl.UL are, on average,
100 percent greater than downflow values in pulsed- and spray-flow regimes
because the gravitational force leads to higher liquid holdup and pressure drop.
In these regimes, the interfacial area may be as large as three times the geometrical
surface area, and both k L and 0L increase with gas and liquid superficial velocities.
A comparison of the energy correlations for kluL under upflow and downflow
conditions is showf\ in Fig. 7-19.
Just as is shown by the data of Specchia et al.,32 Snider and Perona 3t also
showed that in the bubble-flow regime kLuL varies between 0.08 and 0.4 s- I. Snider
and Perona 3t studied the mass-transfer coefficients for the hydrogenation of (X-
methyl styrene in a column packed with 0.29 cm alumina spheres coated with
palladium catalyst. The mass-transfer coefficient increased as the 112 power of the
liquid flow rate and increased with the gas rate up 10 a gas-phase Reynolds number
of about 50. The severe decrease for higher gas rates was accounted for by the
pulsating nature of the flow. A comparison of the mass-transfer coefficients at
various gas rates obtained by Snider and Perona31 is shown in Fig. 7-20. The
gas- and liquid-phase Reynolds numbers in this figure are defined as ReG =
dpUoGPGI/lGE'., ReL = dpUOLPL/plE'..
Saada 25 measured the gas-liquid mass-transfer coefficients for absorption of
carbon dioxide into NaOH solutions for cocurrent upflow. Gow et al. B evaluated
the liquid-gas mass-transfer coefficients for the desorption of oxygen from water
into nitrogen in a 2.58-cm-i.d. glass tube packed with CuO-ZnO particles
254 GAS UQUID-SOUD REACTOR DESIGN
0.10
/"
/"
./
!:; 0.01 - /"
. /"
->.:...l . /"_
/"
/"
Re G < 1 0 /"
. ./
..,.,"""
..,.,- . 60 < Re., < 75
- - - "Liquid only" correlation
of Williamson et al. (40)
0.001
10
100
1,000
ReL
Figure 7-20 Comparison of gas-liquid mass-transfer coefficients al various gas and liquid flow fates
Illftt'r S/lider and Pero11l1 31 1.
(diameter = 0.0541 or 0.291 cm) and the desorption of naphthalene from water.
In the first case, the liqUId-phase mass transfer was controlling, while in the
second case, the gas-phase mass transfer was controlling. All the data Were taken
at 1 atm pressure, 25 DC temperature with the gas and liquid flow rates in the
range I through 3 and 0.25 through 3 cm 3 s-' I, respectively. All the data were
taken in the bu bble-flow regime of Specchia et al. 3 2 or the single-phase pore-flow
regime of Saada. 2 S
The results for the liquid-side mass-transfer coefficient obtained from the
desorption rates of oxygen showed that kLGI increased with both gas and liquid
flow rates. The dependence of kl.lIL on the gas flow rate was much stronger than
the one predicted by Saada's correlation. 25 The data, when compared with the
cocurrent-downflow data, also showed that the upflow gave larger values of kr.lIL
than the down flow only at high gas and high liquid flow rates.
The results for the gas-side mass-transfer coefficient keG.. obtained from the
desorption rates of naphthalene from water showed that kGlIL was a strong function
of the gas rate. Its dependence on liquid flow rate increased mildly with the gas
flow rate, being negl igible at the gas flow below I cm 3 s - I. Some of their results are
shown in Fig. 7-21. keG.. obtained in this study were larger than those obtained
by the same authors under down flow conditions and the ones reported by Shulman
and Robinson 30 for a larger particle (1.27-cm Raschig rings) under countercurrent-
flow conditions.
DYNAMICS OF THE COCURRENT-UPFLOW FIXED-BED COLUMN 255
10
7
5
3
2
M
0
x
7 Qc 2.0 em 3 s t
...
""
c
"'<
0.7
0.5 Qc = 1.0cm 3 S-I
0.3
0.2
0.2 0.3 0.5 0.7
d p = 0.0541 em
d p = 0.0541 CIll
d p 0.291 cm
d p = 0.0541 em
d p - 0.291 em
2
3
5
7 10
QL(cm 3 S-I)
Fi ure 7-21 Effect of gas and liquid flow rates on k a ,... (after dl1tclji"mn G(Jto el al. 8 ).
Very recently, Ohshima et aL zl measured the liquid-phase mass-transfer
coefficient and gas -liquid interfacial area in a column packed with 0.1-, 0.28-, or
0.43-cm glass beads for the oxidation of sodium sulfite. The measurements were
taken in the superficial velocity ranges of I through 6 and 0.5 through 6 cm s - t
for the liquid and gas, respectively. Their results showed that the stagnant gas
holdup had almost no effect on mass transfer. Both kl.ul. and UI. were well correlated
to the dynamie gas holdup hdG. When the superficial liquid velocity was less than
the minimum fluidization velocity of the liquid, a simple relation of kLuI = .f hdG
(where the value of constant II' depends on particle size dr» was valid. kt.ul. was
found to be affected mainly by gas -liquid interfacial area. Larger packing particles
gave larger values of kl.(/I.. They were larger than those in unpacked bubble-
columns when d p 0.28 cm and smaller when d p :::;: 0.1 cm. The dependence of
k L on hdG in the superficial liquid velocity range of I through 6 cm s I obtained
by these investigators is shown in Fig. 7-22. As shown. for d" = 0.1 cm. k L was
almost independent of 11dG and for d p > 0.1 cm. kl. depended on hdG more strongly
with an increase in d p .
Voyer and Miller 38 measured the gas- liquid interfacial area and the liquid-
phase mass-transfer coefficient for the desorption of CO z from water. The
measurements were carried out in a 14-cm-i.d. column packed with screen packings.
Flow velocities of9.1 through 82 cm s - I and 0.55 through 3 cm s - I were examined
for the gas and liquid, respectively, and column heights of 20.4 through 238 cm-
256 GAS- LIQUID-SOLID REACTOR DESIGN
E
.....
-'C
0.06
0.05
0.04
0.03
0.02
0.04 ,
0.03 1
0.02 r-
0.01 I
d'/
I
,.
'"
cm
03 r
0.02
0.01
o
o
d p = O. I cm
I
O.OS 0.10
.J.
0.15
hdG
Fi/:ure 7-22 Relations between k L and dy-
namic gas holdup.21
were investigated. The results showed that 6-mesh corrugaled screen packings and
1,27-cm 6-mesh cylindrical screen packing both gave an interfacial area between
2 and 4 times that generated in an unpacked column. The mass-transfer coefficient
k L was independent of gas velocity but increased with the liquid velocity. kLaL for
the corrugated screen packings were than those for the cylindrical screen packings;
and both were higher than those for an unpacked column. For a typical superficial
liquid velocity of 1.5 cm s - I, the influence of gas flow rate on kLaL is illustrated
in Fig. 7-23. The influences of column height on k L , aL. and kLaL obtained by
these investigators are illustrated in Figs. 7-24. 7-25, and 7-26. These figures show
that. at short column heights. k L . at> and kLal. decreased with an increase in
column height. This would. at least. be partly.caused by the coalescence of bubbles
as they rise through the column. Larger bubbles would give smaller values of al.
and k L .
Most of the data reported above were taken with packings normally used in
an absorption tower. Some data with smaller packings were estimated from
experiments with reacting systems. Alexander and Shah 2 recently reported data
for the physical volumetric mass-transfer coefficient in a column packed with
various shaped packings normally used in gas-liquid-solid catalytic reactors. The
range of gas flow rates (1.5 through 31 mm S-l) and liquid flow rates (0.9 through
6 mm s- t) were those normally used in pilot-scale catalytic hydrogenation
processes. The measurements were made for the desorption of oxygen from water
in a 60-mm diameter column.
The results were first correlated by an expression of the type
kLaL = A(GdH(GG)l'. (7-28)
"
v
.u '"')
'::0
'- -
8 x
u_
..-
0)'
"
co =
..
- -"
.:,-<
'"
co
::;;:
DYNAMICS OF THE COfTRRENT-UPFWW FIXFD-BEIJ COLUMN 257
150
-6
6
6-6-
0_0
6
100
_0_0
50
o 0
___ - 0
0__0
_0--
VOL = 1.5 cm 5- 1
o
o
, _...L--
30 60
Inlet superficial gas velocity,
Voc; (em -I )
CO 2 -11 2 0 system
column height = 50.9 cm
Symbol Packing
0 None
6 Cylindrical
screen
0 Corrugated
screen
Figure 7-23 Influence of gas flow rate on
k l <lL. 38
Here, G L and GG are in Ibm h 1 ft - 2 and kLGL is in s -1. The packing characteristics
and values of A, B, and Y, and their asymptotic deviations for each packing
obtained from a nonlinear regression analysis of the experimental data are listed
in Tables 7-2 and 7-3, respectively. A parity plot ofEq. (7-28) is shown in Fig. 7-27.
'0
"
:;--
E
....
-'<
36
Cylindrical screen
packing
24
12
Corrugated screen
packing
o
o
120
60
Column height (em)
Column hcight rangc
SO.9 to 127.1 cm
U OG = 33.5 cm I
VOL = 1.5 cm s
Figure 7-24 Vanation of h with column helghl. 38
258 GAS-UQUIDSOLID REACTOR DESIGN
.,
E 5
....}
'"
.0
co
'"
'w
-t
<>
oS
00
8
","-i,,
'o ___ va
o - 0 6_
-0-
i-i
I
60 120 180 240
Column heigh! (cm)
CO 2 -NaOH sol. system
VOl = 1.5 cm s-l
Symbol Packing U OG (cm s-I )
0 None 36
6 72
[] Cylindrical 43.5
0 screen 79.5
. Corrugated 43.5
. screen 79.5
Figure 7-25 Influence of column height on aL. 38
For various packings, typical effects of variations in gas and liquid flow rates
on kLGL are iJlustrated in Figs. 7-28 and 7-29, respectively.
The data were also correlated by the energy correlation of Reiss. 23 This is
shown in Fig. 7-30 and expressed analytically by the relation
k,.Gl = 0.12[Gd Pi Z)LGr!2 = 0.12Et.'2, (7-29)
where EI. is in N m - 2 S 'and kLaL in s t. It should be noted that in calculating
( P/ Z)LG for the above relation, the pressure drop due to liquid head should
be subtracted from the measured ones using the method suggested by Sa to el al. 27
The "head" effect is significant when the pressure drop is small. The scatter in
the correlation shown in Fig. 7-30 may partly be due to channeling and other
flow irregularities (i.e.. excessive wall flow) which appeared to have taken place
because of the low flow rates, small column diameter, and larger packed heights.
Charpentier 4 suggests that if no reliable data or correlations for a given
packing are available, as a first approximation, a conservative value for kLGL in
the bubble-flow regime is 0.15 S-I In the pulsed- and spray-flow regimes, use
kLGl. values 100 percent greater than those calculated from the relations
kr.llL = O.ot 73[( P/ Z)LG VOL]o.s,
(7-10)
where VOL is in m S-I, ( P/ Z)LG is in cm of H 2 0 of packing, and kLll L is in S-I
DYNAMICS OF THE COCURRENT-UPH OW HXED-BED COLUMN 259
100 :D_O No packing
-[;:, ---
50 ------ --- 0_
'0 [;:,_H::
-0 0-0-
o ' I I I I
<:: 150
'-'
.0":1
c
.....-
v x IUD
:.>-
..-
",
t-" :r.
-J". _
<:: 50
c: ..)
""
O '
ISO
100
50
I
00
'0 Cylindrical scrcen
tI"", packing
e
== :.
, 8 Corrugated screen
A :=-e
I
600 I 200
Column height (cm)
CO r H 2 0 system
VOL = 1.5 em s-I
VOG(cm s-I)
a I 1.58
6. 34.44
o 68.58
Figure 7-26 Influence of column height on hilL. J8
and
kLGL = 0.0173[( P/AZ)LG U OL ]0.sWA/2.4 x 10 - 9)0.5,
(7-31 )
where DA. is the diffusivity (in m 2 s 1) of the gas in the liquid and averaged.
Chaqx:ntier 4 also sug.gests that the gas-liquid interfacial area varies with about
{he 0.5 power of the superficial gas velocity. regardless of packing size and type,
column diameter, and liquid superficial velocity.
260 GAS-LIQUID-SOUD REACTOR DESIGN
Table 7-2 Characteristics of catalyst supports studied by
Alexander and Shah 2
SUpport designation
6.35-mm star!rl"
6.35-mm spheres1'
6.35-mm rings t
12.7-mm saddlest
6.35-mm macaroni
9.5-mm macaronir
3.I7-mm eXlrudales
Bed
vo id fraction
.-,
Description
0.53
0.37
0.56
0.72
0.54
0.57
0.35
t Obtained from Norton Company. Chemical Process Products Division.
Akron. Ohio.
Obtained from Harshaw Chemical Company. Cleveland, Ohio.
Four-point stars
6.35 mm wide
6.35 mm long
6.35-rnm-diameter spheres
6.35-mm dmmeter Raschig
rings
Berl saddles
12.7 mm long
6.35-rnm-dlameter hollow
curved cylinders
resembling "macaroni"
in appearance
9.5-mm-diameter hollow
curved cylinders
3.17-mm-standard diameter
cylindrical extrudates
approximately 9.5 mm long
Table 7-3 Results of the nonlinear regression analysis 2
Asymptotic standard deviatIon
Coefficien tst for coefficients
Catalyst support ,4 B Y 4 B y
6.35-mm stars 7.638 x 10- 2 0.4550 0.5557 6.059 ." 10 - 2 0.09234 0.10200
6.35-mm spheres 1.809 x 10 I 0.4004 0.6442 6.234 x 10- 2 0.04209 0.03797
6.35-mm rings 9.042 " 10. ] 0.3964 0.5258 5.1 57 x 10- 2 0.06711 0.07697
12.7-mm saddles 1.]37 x 10- 1 0.8091 0.8281 15.953 0.14200 0.10030
6.35-mm macaroni 1.300 x 10 1.0320 1.6960 21.874 0.19240 0.24590
9.53-mm macaroni 8.012 x 10- 2 0.4262 O.5411J 1.101 x 10-' 0.16160 O.IMIIO
3.17-mm extrudates 6.371 x 10- 2 0.3014 0.4484 1.881 x 10 2 0.037!!9 0.03473
t Defined by Eq. (7.28).
DYNAMICS OF THE roCURRENT-UPFLOW FIXED-BED COLUMN 26]
0.1
a 6.35 mm Rings
0.05 .6 6.35 mm Spheres
0 3. I 7 mm Extrudate tf.
a 9.5 mm Macaroni
0.02 ... 6.35 mm Macaroni
. 12.7 mm Saddles , o
0 6.35 mm Stars
7 0.01
.
-0
d.) .
... 0.005 ... .
a
'"' ... . ; 0 ·
d.)
s
.....
'" ..
.....
..., 0.002 ... .
0.001 - G c =0.014kgm- 2 s-t
. 0.0005
.
0.0002
0.0002
L__ '
0.001
- '
I
0.01
J
0.1
k L 01. calculated (s-I )
Figure 7-27 A panty plot for Eq. [7-281 using the dala of Alexander and Shah. 2
Recommendations The best available correlations for kI.GL' k L , and aL are the
energy correlations shown in Figs. 7-19, 7-18, and 7-17, respectively; and, at least
for large packing size, their use is recommended. For the estimations of kLGL,
the suggestions of Charpentier are possible alternatives. For shaped particles and
in the bubble-flow regime, the correlations of,Alexander and Shah for kLG.. are
recommended. Future work in this area should consider small particles and the
hydrocarbon systems.
7-6 LIQUID-SOLID MASS TRANSFER
Snider and Perona 31 measured Ksas, the volumetric liquid-solid mass-transfer
coefficient, for the case of hydrogenation of -methyl styrene on 3-mm alumina
spheres coated with palladium catalyst. The results were obtained in the bubble-
flow regime. The measurements of Ks, the liquid-solid mass-transfer coefficient
in a nonreacting system, were first reported by Mochizuki and Matsui. 2O They
262 GAS-LIQUID-SOLID RE'\Cl0R DE"IGN
0.1
6.35-mm macaroni
0.05
0.02
o.ot
rings
0.005 3.17-mm extrudates
.....
'"
.....
...,
12.7-mm saddles
0.002
0.001
0.0005
C I = 1000 gm h- I cm- 2
0.0002
0.0001
0.05
0.5
5.0
C G (g h-] cm- 2 )
Figure 7-28 Typical eITect of gas velOl.:ity on kLlI, for various packings.
used the diffusion-current method in which one active platinum particle (5-mm-
diameter and 5-mm-long cylinder) was placed in a dummy particle-packed bed,
and the diffusion current from the platjnum anode particle was measured by
streaming an equimolar solution of potassium ferro- and ferricyanides through
the bed. All the measurements were taken in an 87-mm-diameter column. The
Schmidt number was kept constant at 1,170. The effects of liquid and gas flow
rates on Ks were correlated by the relations
Sh = 48 Re6' ,
for Rel. > ]0
(7-32)
and
ShiSh o = 1 + 4 Re8.55/Re .7,
for ReI. > 10,
(7-331
where
Here,
DYNAMICS OF THE ('On;RRE T-UPFLOW F1XED-RHJ COLUMN 263
Sh o - 0.75 Rd!2 ScL/ 3 .
(7-34)
ReI. = PI. VI dh/flll.'
SCI. = 11L1PI D,
ReG = P G V G d l ,/qlG,
Sh = Ksdh/D,
where d h , the effectivc particle diameter. is defined as
d = F.d r'/[ 1.5( 1 - (;)].
(7-35)
Here, V IS the mean velocity of fluid and D is the molecular difTusivity of the
solute in question in liquid. The subscripts Land G refer to liquid and gas phases,
and the subscript 0 on the Sherwood number represents its value when RCG = O.
The validity of Eqs. (7-32), (7-33), and (7-34) under the conditions of an actual
reactor, where all particles are active, and under the conditions where Sc #- 1,170
0.2
0.1
0.05
b
oJ
t:I 0.02
.J
"""
0.01
0.005
0.5
0.002
6.3S-mm macaroni
GG = 5 gm h- I cm- 2
0.001
SO
500
5,000
Figure 7-29 Typical effeCl of liquid velocity on k,.'IL for various packings.
Gdg h I cm- 2 )
264 GAS-LIQUID-SOLID REACTOR DESIGN
1.0
0.3
o 6.35 mm Macaroni
o 6.35 mm Stars
o 9.5 mm Macaroni
o 6.35 mm Rings
. 3.17 mm Extrudates
Reiss correlation (23)
0.1
o
'T
'"
0.03
'"
...j
...,
0.01
0.003
1
0.1
0.3
1.0
3
10
30
100
El (N m -2 g-I )
Figure 7-30 Energy correlation for k 1 ClI. 2
is questionable. Hence, Eqs. (7-32) and (7-33) should be used only as a first
estimate for Ks.
Goto et al. B measured the liquid-solid mass-transfer coefficient for the
dissolution rates of naphthalene in water in a 2.58-cm-i.d. glass column packed
with small particles (0.054 through 0.24 cm) of naphthalene and CuO Zno. The
measurements were carried out in the bubble-flow regime (liquid flow rate ranging
from 0.25 through 3 cm 3 s- t) and at 25 C and I atm. The results were correlated
as plots of J d = (Ksaw/at)(I/Uod(pl /PLD) versus liquid Reynolds number ReI.'
Here, ReI. is based on the particle diameter, Val is the superficial liquid velocity,
and Ow is the wetted packing area (a w = 0 1 when all the particles are completely
covered by liquid). These plots are shown in Fig. 7-31. As shown, the correlation
depended somewhat On the gas flow rate. Ksas increased with both gas and liquid
flow rates. Figure 7-31 also shows that the liquid-solid mass-transfer coefficient
is somewhat greater for upftow in comparison with the downflow, particularly at
high gas rates and low liquid Reynolds numbers.
Most recently. Kirillov and Nasamanyan t5 carried out a very interesting
unsteady-state analysis of liquid-solid mass transfer for cocurrent upflow in a
fixed-bed reactor. The analysis was compared and verified by the steady-state
measurements of liquid-solid mass-transfer coefficients in a IO-cm x to-cm square
column with a heigh I of 50 cm. Three types of packings, 30-mm and 8-mm
. ,
j
DYNAMICS OF THE COct 'RRENT-UPFLOW FIXED-BED COLUMN 265
spheres and 12-mm x 12-mm x 2-mm Raschig rings, were examined. The true
velocities of gas and liquid varied over the ranges 0 through 50 and 0.01 through
2 cm s - I. respectively. The temperature varied from 5 through 40 cc. The
measurements were carried out by an electrical contact method. Based on their
study, they proposed a correlation for the liquid-solid mass-transfer coefficient as
Sh ( I U (J - h >" 1 °. 62 ) ( R ) t!3
Scl!J = 3.02 0.7 + 0.12 _ ULhG Rel. i3 m
(7-36)
Here, Sh is the Sherwood number based on the equivalent radius of the packing
material, R.is the equivalenl radius of the packing material, ReL = U 1 .R/vdl - h G )
(where VL is the kinematic viscosity of the liquid), Sc is the Schmidt number, and
m is the thickness of the liquid layer on the packing obtained from the relation
m/d p = O.15(UUgd p )o.t, (7-37)
where 9 is the gravitational acceleration. For Raschig rings, the authors defined
R = (1 t d r ,)/4.
Recommendations Under bubble-flow conditions, the use of Eq. (7-36) for large
particles and the correlation shown in Fig. 7-31 for small particles is recommended.
Further experimental work in the pulsed-flow regime and with hydrocarbon
systems is needed.
10
7
5
3
Trickle-bed
data
2
'0
.....
0.7
Data were taken for
d p = 0.241 em,
0.108 em.
0.0541 cm
0.5
0.3
0.2 0.3
0.5 0.7
2
3
5 7 10
20
Liquid Reynolds number, Re L
Figure 7-31 J d versus ReL correlation for cocurrent upflow.
266 GAS-LIQUID-SOLID REACTOR DESIGN
7-7 HEAT TRA SFER
To this author's knowledge, no study on heat transfer in gas liquid cocurrent
upflow through a packed bed has been reported in the literature.
ILLUSTRATION 7-1
It is propoposed to study the intrinsic kinetics of a gas-liquid-solid catalytic
reaction in a bubble-column in which the catalyst is packed in a vertically hung
basket. The reaction between the gaseous reactant (say hydrogen) and a liquid
reactant occurs at the catalyst surface. It is., therefore, essential that possible mass-
transfer resistances for hydrogen transfer to the catalyst surface arc made negligible.
Derive the conditions for eliminating the possible mass-transfer resistances.
Assume that
1. The liquid reactant is in excess and its concentration is uniform in the catalyst
basket.
2. The reaction is a pseudo-first-order reaction with respect to hydrogen concen-
tration in the liquid phase.
3. The important mass-transfer resistances are (a) liquid-film resIstance at the gas
liquid interface and (b) mass-transfer resistance within the catalyst basket. The
mass-transfer resistance of the bulk liquid outside the basket can be assumed
to be negligible.
4. The hydrogen concentration along the length and width of the column (y and
z directions in Fig. 7-32) is uniform.
5. The liquid is stagnant.
What types of experimental data are needed to use the derived conditions
for the proper design of the reaetor?
SOLUTIONS The differential material balance for hydrogen transfer within the
catalyst basket (see Fig. 7-32) can be expressed as
d 2 H
Dx L. = K' H L' (7-38)
dx
Here, a flat slab geometry is assumed. D;x is the dispersion coefficient for hydrogen
in the basket and K' is the first-order kinetic constant. As shown in Fig. 7-32, we
take x = 0 at the center of the catalyst tube. A solution to Eq. (7-38) satisfying
the boundary condition x = 0, dHLfdx = 0 is given as
H L = C] cosh I.J(K 'jD,J x:. (7-39)
The second boundary condition imposed on Eq. (7-38) is
D dH L _ kLuL£V H. _ H
x dx - A f ,L d
1
I
at x = L
(7-40)
DYNAMICS Of THE COCURRENT-UPFLOW FIXED-BED COLUMN 267
Catalyst basket
H L Ix L
lJiL
y
t t
Gas flow
!Lx
dH L I
DxA- d . =klaLEV(HiL -HLlx l)
x x L
FigllTC 7-32 Schematic diagram for a hydrogl:n transfer pWCI:SS in a ga:. liquid solid segmented-bed
reactor.
Here, [JiL is' the hydrogen solubility_ which is assumed to remain essentially
constant along the entire length of the reactor. The quantity I:V is the open
volume of the reactor, A is the transverse cross-sectional area for the hydrogen
transfcr (as shown in Fig. 7-32), k L is the liquid-film mass-transfer coefficient at
the gas -liquid interface, and a.. is the gas-liquid interfacial area per unit volume
of the open space in the reactor. In a physical sense, Eg. (7-39) equates the mass
transfer from the gas into the liquid phase with the mass transfer at the surface
of the catalyst tube. The constant C I in Eg. (7-39) is obtained, by using the
condition (7-40), as
H;l
C I = [ ' K ' .4 . h I i (K ' jD - )L I h i/ K ' /D I L] '
" ,Q,r SIn IV x I + cos IVr- )f
(7-41)
where
, .. JDx ( A )
.w = kLll t:V .
The hydrogen transfer within the catalyst tube per unit catalyst volume and
per unit hydrogen concentration in the bulk gas phase is given by
.! (K ' D - ) ( . h i I (K 'I D ) L t )
, v. x tan t v x I
R H = ----------r.- ["IK'-.c1 tanh : JfK',Dx)q + 1]
or, defimng L' = ....' Dx /L as before, we obtain
(7-42)
, - /---;( ' I tanh (JK'j L') J
R H - V K L _JK'.c1 tanh (J K'jT..:.) + 1 .
(7-43)
268 GAS-LIQUID-SOLID REACTOR DESIGN
. It is clear that RI-. is a function of .rd, K', and ['. (n the kinetically con-
trolled regime, RI-. = K' and, thu.s, R;, is independent of L' and kLaL' [n the
present case, when ...L K'/ I..: «1, Ri-. = K'/[1 -+- K'..«i/I..:], and when "'I/K/I..: »3,
RI-. = jK'L/[1 + JK',«iJ. We are interested in those system conditions where the
maximum RI-. (= K') is achieved. These conditions are achieved when JK' «I..:
and K'. !L' « I or (A E V)(K'L/kLlId « 1. These are the desired conditions.
The conditions derived above would require knowledge of K'. D", and kLlIL.
Both Dx and kLal would bc functions of gas velocity. fluid properties. gas
distributor design, and the thickness of the basket. These functions would be
obtained experimentally.
ILLUSTRATION 7-2
A fixed-bed column is packed with 0.3 cm diameter catalyst. The bed void
fraction is 0.48. The column is 5 cm in diameter and 150 cm long. Gas and liquid
superficial mass fluxes are 10J and 10 4 kg m 2 h - I, respectively. and they flow
cocurrently upwards through the column. Under the reaction conditions, the
relevant gas properties are average molecular weight = 10. density = 0.06 g cm - J,
viscosity = 0.01 cP, and molecular diffusivity of the reacting specie = 0.5 ff h 1.
The relevant liquid properties are average molecular weight = 280, viscosity =
0.6 cP, surface tension = 10 dynes em, specific gravity = 0.9, and thc molecular
diffusivity of the reacting specie in liquid = 10- 3 fe h 1. Estimate
(a) the flow regime
(b) the pressure drop
(c) the gas and liquid holdups
(d) the axial dispersion coefficient
(e) the gas-liquid mass-transfer coefficient (kd , f'
(1) the liquid-solid mass-transfer coefficient (Ks) r;:,rI" v o'QIo--""1
y,o eJ'.....
SOLUTION
(a) Liquid mass velocity = 10 4 kg 2 h - t = 2.79 kg m - 2 S I; gas mass
velocity = 10 3 kg m - 2 h - t = . 79 kg m 2 s I.
For these mass fluxe cording to Fig. 7-1, the bubble-flow regime
would prevail. It shou be noted, however. that for these flows. Fig. 7-2(a)
implies that the prev iling flow regime to be slug flow and Fig. 7-2(b) implies
the flow condition to be on the borderline of bubble- and slug-flow regimes.
(b) The friction factor for two-phase flow can be calculated from Eq. (7-2):
- {d p G G /J1dI.l 67
z-
- (dpGdJ1L)0.767
lO.3 (cm) x (10 3 X 10 1/3,600)(g cm 2 s- I) (0.01 : 10- 2)cS cm g I) J1.I67
l ( 1 ) J O.767
0.3 (cm) x (10 4 x 1O- 1 /3,600)(gcm- 2 S-I) 0.6 x 10- 2 (scmg- 1 )
= 23.2
DYNAMICS OF THE COCURRENT-UPFLOW FIXED-BED COLUMN 269
In fLG = 8.0 - 1.12 (In Z> - 0.0769 (In 2')2 + 0.Dl52 (In ZI 3
= 8.0 - 1.12 (In 23.2) - 0.0769 (In 23.2)2 + 0.0152 (In 23.2)3
= 4.79,
he; = 66.1.
From Eq. (7-1),
(tJ.P / tJ.Z)LG = 2.fLG Uf,GPG/d yc,
(10 3 x 1O- 1 /3,600)(gcm- 2 s '1)
V OG = GG/PG = -- - - - -
0.06 (g em 3)
= 0.463 em s- t.
de = C ,.) Vp/S p ,
,, = 4i3n(0.3/2)3 = 0.01413 cm 3 .
Sp = 4n:(0.3/2)2 = 0.2826 em 2 ,
de = (0.48/0.52) X (0.01413jO.2826) = 0.04615 em,
( tJ.P ) _ 2 x 66.1 x 0.463 x 0.4 6 3 x 0.06
tJ.Z LG 0.04615 x 981
= 0.0375 g cm - 3,
Pressure drop = tJ.P 1 . G = 0.0375 x 150
= 5.63 g em- 2 ,
(c) One needs to know either the liquid or the gas holdup. If one is known, the
other can be calculated. h G can be calculated from Eq. (7-13) as
h G = I -r- 4.33VOI?433(VOI./VOG)O.Sf>3
VOL = Gt!PL = (10,000 x 10- Ij3,600)(g cm - 2 s- 1)/(0.9 g cm - 3)
= 0.308 cm s t.
l/h G = I + 4.33 x (0.3086)-OA.B(0.3086jO.463)o.S63 = 6.7337,
,
h G = 0.148,
hI. = I - h G = I - 0.148 = 0.852.
h G can also be calculated by Eq. (7-14) as
h G = 2L I + (I + 72.3V ol ?229( U OU 'U OG )O.4B)I!2r t
= 2[ I + (I + 72.3(0.3086)- U.229(0.3086!0.463)o.423)O.S] - I
= 0.2.
hI. = 1 - h G = I - 0.2 = 0.8.
Note the discrepancy in the predictions by these two correlations.
270 GAS-L1QlJlD-SOLID REACTOR DE.<;)(;N
(d) The axial dispersion coefficient can be calculated from Eq. (7-23) as
Pel. = 0.128 (Redo.24 (RcG) 0.10 (ii.dJO. 53
J; -'" 0.01413 cm 3 per panicle.
Number of particles per unit volume = N p 0.52/0.014J (cm 3 per particle)
36.8 particles cm - 3
ii, - 36.8[4 x 11"(0.3. '11]
= 10.4 cm 2 cm 3
= J040m I
ReL =- d p GL/J1L
0.3 X ( 10 4 x 1O - 1 /3,60 0)(gcm- 1 S-I)
0.6 x 10'-2 (g m-I S-I).
= 13.9.
ReG = lfpGG/tlG
0 .3 X (10 3 x 10 1/3,600 )(gcm IS-I)
0.01 x 1O- 1 (g cm - 1 s-t)-
= 83.331.
Pel = 0.128(13.888)0.245(83.3.B1 ° Ih x (0.3 X 10⁴)°.53
= 0.2196.
EZI. = VLds/PeL,
V L = VoL/f..
0.30 6/U.48 x 0.3
E -- ' .-
ZI. - 0.2195
= 0.878 em 2 s.
(e) The gas- liquid mass-transfer coefficient k L can be calculated by usmg Eg.
(7-27).
VOl. = 0.3086 cm s I
Since particles are spherical,
G, = 10.4 cm - I (= 6(1 - c)/d p ).
Thus, from Eq. (7-27),
103 x - x 0 . 48
0.3086
(!!Pj!!Z)LG = 0.0375 g cm - 3,
DYNAMICS OF THE COC'URRENT-UPfl OW FIXED-BED COLUMN 271
= :7.96rO.03754 x [981 x 0.48/(10.4 x 0.9)] x (0.3086)2]0.275 - 9Aq
k l . -= :0.3086/(0.48 x 10 3 ):8.69 = 5.58 x 10 3
= 0.00558 cm s - t
(I) The liquid solid mass-transfer coefficient Ks can beca\culated from Eqs. (7-33),
(7-34). and (7-35).
D = Diffusion coefficient = 10 3 ft 2 h I
= 10- 3 (ft 2 h- I ) x (30,54)2 (cm 2 ft 2) x (I/3.600)(h s I)
= 0.000259 cm 2 s I.
Sc = 0.6 x 10 2/(0.9 x 0.000259)
= 25.74.
Sh o = 0.75(13.888)°.5(25.74)°.33
= 8.24l
Sh = 8.243r(1 + 4(83.333)°.51(13.888)°.71
= 55.963,
Ks = (Did,,) x Sh,
d h - (0.48 x 0.3)/(1.5 )( 0.52) = 0.11<46.
Ks = (0.000259iO.1846) )( 55.963
= 0.0785 em S-I.
NOME CLATlfRE
liT- gas-liquid interfacial area
£/s specIfic packing surface area
0, total packing area
a w wetted particle surface area (a w = a, when all particles are com-
pletely wet)
a', a" constants in Eq. (7-24) and (7-25)
A constant in Eq. (7-2!H
h constanl
11', h" constants in Eqs. (7-24) and (7-25)
B constant in Eg. (7-28)
c volume fraction occupied by solids
c', e" constants in Eqs. (7-24) and (7-25)
d h bubble diameter
de equivalent or characteristic packing diameter
d h eftcctive partIcle diameler (f:d /1.5[ I - f:])
p
Pe
Q
diameter of packing particle
(dpL p -t- d /2)112
column diameter
diffusivity
dispersion coefficient
diffusivity of eomponent A
Reiss' energy parameter 23
axial dispersion coefficient
constant
two-phase friction factor
acceleration due to gravity
gravitational constant
superficial mass velocity
lotal holdup bascd on void volume of the packed column
dynamic holdup
total holdup hased on column volume
mass-transfer factor
gas-side mass-transfer coefficient
liquid-side mass-transfer coefficient
liquid-solid mass-transfer coefficient
packing length
thickness of the liquid layer on a particle
pressure
Peelet number. (Vdp/Ez)
volumetric now rate
radial distance from center of column
column radius
equivalent radius of the packing
Reynolds number
Critical Reynolds number as defined by Eq. (7-7)
Schmidt number J1./pD
Sherwood number Ksdh/D
surface area of packing particle
packing-shape factor
residence time
interstitial velocity
superficial velocity
empty column volume
volume of packing particle
Weber number a!pdf,
Lockhart-Martinelli parameter, (tJ.PL/tJ.Pd l / 2
(UoL/Vod ReL SCL
constant in Eq. (7-28)
axial distance
Re _1671 Re ' 787
272 GAS-LIQUID-SOUD REACTOR DESIGN
d p
d s
de
D
Dx
D A
E L
Ez
fp
fw
g
ge
G
h
hd
ho
J d
kG
k L
Ks
Lp
m
r
ro
R
Re
Re*
Sc
Sh
Sp
S'
t
V
U o
JI
,,
We
X
Xo
y
Z
Z
Greek symbols
(t, rJ,', ':I'
/3. /3'. /3"
y, i. y"
t
V
p
(j
a'
I'J, J(
J1
(AP/AZ)w
Subscriprs
G
L
1
LG
REFEREl'\ CES
DYNAMICS OF THE COCURRENT-UPFI.oW FIXED-BED COLUMN 273
constants in Fqs. (7-9), (7-23), (7-18)
constants in Eqs. (7-9), (7-23). (7-18)
constants in Eqs. (7-9). (7-23). (7-H\)
bed void fraction
kinematic viscosity
density
surface tensIOn
standard deviation
constants in Eqs. (7-9), (7-23)
viscosity
two-phase pressure gradient
gas phase
]iquid phase
upstream datum point
mixed-phase flow conditions
I. Achwal. S. K., and J. B. Stepanek, Chern. En!]. J vol. 12, p. 69, 1976.
2. Alexander, B. F., and Y. T. Shah. Call. J. Chem. Eng.. \'01. 54. p. 556. 1976.
3. Boxhes, W., and H. Hofmann, Chern.lng. Techno/.. vol. 44. p. 882,1972.
4. Charpemio:r. J. c., Chern. Eny. J., vol. I I, p. 161, 1976.
5. Eisenklam. P.. and L. H. Ford, in lmeraclion Between Fluid and Particles, Institute of Chemical
Engineers, London, 1962. p. 333.
6. Ford. L. H.. PhD Thesis. University of London. 1960.
7. Gorring, R. L., and D. L Katz. AIChE J.. \'01. 8, P 123. 1961.
8. Gcito. S.. J. Le\'ec, and J. M. Smith, I&EC Pmeess Design Dev., vol. 14, p. 473, 1975.
9. Heilmann, W., PhD Thesis, University of Erlangen- urnberg. Germany, 1969.
10. Heilmann, Von W., and H. Hofmann, in Pl'Oceedings (If 4th Eur(lpean Symp<>siurn (In Chemical
Reaction Etlgineering, Pergamon Press, London, 1971, p. 169.
II. Hofmann, H., Chern. Eng. Sci.. vol. 14, p. 193, 1961.
12. Hutton, B. E. T., and L S. Leung, Chern. Eng. Sci., vol. 29, p. 1681. 1974.
13. 1chikawa. Y., U. Akachi. and M. Kentaso, Kaljaku Kogaku. vol. I, p. 179.1967.
14. Katz. M. 8., and L. S Genin, 1111. Chern. Eng., vol. 7. p. 246,1967.
15. Kirillo\', V. A., and M. A. Nasamanyan,llJt. Chern. ElJg., vol. 16, p. 538, 1976.
16. Kunugila, E., T Otake. and T. Jamanlshi, Kagaku K(lgoku, \'01. 26, p. 800, 1962.
17 Larkins, R. P., PhD ThesIs. University of Michigan, Ann Arbor. 1959.
18. Lobo. W. E.. L. Friend, L. Hashmall, and F. Zenz, AIChE J., \'01. 41, p. 693, 1945.
19. Mashelkar. R. A., and M. M. Sharma, Tratl. . InsC. Chern. Eng., vol. 48, p. TI62, 1970.
20. Mochizuki, S.. and T. Matsui. Chern. ElJg. Sci., \'01. 29, p. 1328. 1974.
21. Ohshima, S., T Takematsu, Y Kuriki, K. ShImada, M Suzuh and J. Kato, J. Chern. £n9.
(Japan). vol. 9. p. 29. 1976.
22. Pittsburgh Energy Research Center Quarterly Reports, 1975-1976; also, D. Smith, A. Reznik,
and A. Pontello, Personal communicatIon 1976.
23. Reiss, L P..l&EC Process Design Dev., \'01. 6, p. 487,1967.
274 GAS-UQUID-SOLID REACTOR DESIGN
24. Saada.:\1. Y.. Che»!. Ind. Genie Chern., vol. 105. p. I. 1972.
25. Saada. \1. Y.. Chern. Ind. Genie Chern., vol. 105. p_ 1415,1972.
26. Saada. MY.. PerioJim Po/J,tcehniQ-Chemi(ul Engineerin!f. vol. 19. p. 317,1975.
27. Sato, Y.. T. Hirose. and T. Ida, KQgaku Kngaku, vol. 38, p. 543, 1974.
28. Schoenemann, K.. DeehemQ Mntingraph. \'01. 21. D. 203. 1952.
29. Shah. Y. T.. C. A. Ratway, and H G. Mdlvried. TrQ/ls. II/st. Chem. E'IIJ. /British), vol. 56, p. lO7,
1978.
30. Shulman, H. Land R. G Robmson. AIChE J., vol. ii, p. 469.1960.
31. Snider. 1. W.. and J. J. Perona. AIChE J., vol. 20. p. 1172, /914.
32. Spccchia, V., S. Sicardi, and A. Gianetto, AIClIE J., vol. 20, p. M6, 1'n4.
33. Stemerding. Ir. S., Chern. EnCl. Sd.. vol. 14, p. 209,1961.
34. Stiegel, G. J.. and Y. T. Shah. Call. J. Chern. En!}.. vol. 55, p. 3.1977.
35. Stiegel. G. J.. and Y. T. Shah. I&F.C Process De. igl1 Dev., vol 16. p. 37, 1977.
36. Tallmadge. 1. A.. AIChE J., vol. 16. D. 1092, 1970.
37. Turpin. J. L and R. L Huntington. AIC/IE J., vol. 13, p. 1196, 1967.
3R Voyer. R. D., and A. I. Miller. CQn J. Chern. Ella.. vol. 46. p. 335. 1968.
39. Wcher, H. H., Dissertallon, Technische Hochschule, Darmsleidt, West Germany, 1961.
40. Williamson, J. E., K. E. Ralaire. and C. J. Geankopli . I&£C f.rmd., vol. 2, p. 126.. 1963.
.
,
CHAPTER
EIGHT
DYNAMICS OF COUNTERCURRENT-FLOW
FIXED-BED COLUMN
8-1 FLOW REGIMES
The countercurrent mode of fixed-bed operation is normally used for physical
absorption or gas liquid reaction processes. rather than gas- liquid solid reaction
processes. An extensive literature review on this type of column. as applied to
the former processes. has already bee reported t 1.45 and will not be repeated
here. T_W.JLJ'Im\' .regimt;s in countercurrent ope a_tio 'lamely trickle-flow an d
bubble-flow, may be useful for gas-liq id-solid reactions. The majority of the
discussion in this chapter will, therefore, be restricted to these flow regimes.
Unlike the cocurrent operation, the countercurrent operation is t1}arkeQ .by
the'flooding problem],'I.J2,45,46 Although the mechanism of flooding in packed
"- - - - ------,
columns remains uncertain. the empirical correlation of Lobo 7,32 is still widely
used today for predictin ()Qgjng..QQw.cr:.ates.in..packed co1u.In.n& This correlation
is illustrated in Fig. 8-1. Although the correlation is not verified very welUor the
column packed with fine partic es (as in the case of gas liquid solid catalytic
reactions), it should be used as a first estimate for correlating flooding data. There
are several types of flooding criteria given in the literature. The one 24 . 51 ,52 often
used states that flooding occurs when the derivative of liquid flow rate with
respect to liquid holdup at a constant gas flow rate becomes zero. This means
that, in the flooded column, an increase in liquid flow does fiot increase the liquid
holdup in the column. A recent theoretical evaluation of the f100ding problem is
given by Hutton et aJ.24
275
276 GAS-LIQUID saUD REACTOR DESIGN
0.1
Curve
I Flooding inertia model
2 Flooding viscous model
3 Flooding data of
Morton et al. (36)
4 Flooding, grid packing
5 Flooding, dumped packing
6 Flooding, stacked rings
:;5 I i,,!
....0
:t. c.:I
c.:I :t.
<=:'ii£
'" ....
NC:
0.01
0.001
0.01
0.1
10
M L N )
M;;" ..; \PL
FiJ.:llre 8-1 Correlation of Lobo for the prediction of flooding rates in fixed-bed columns. 24
Recommendations The information given in Chap. 6 can be used for an approxi-
mate estimation of the flow regime. The flooding conditions can be estimated
from Fig. 8-1.
8-2 PRESSURE DROP
Many empirical equations for predicting pressure gradients jn countercurrent flow
of gas and liquid are available in the literature. 17 ,3t.36 The pressure drop in
countercurrent flow can be represented by an equation of the Carman-Kozeny
type for flow through packed beds. Below the flooding point. the following
equation is suggested 36 and has been shown to agree well with experimental data:
( !!P ) = 8.5PGa;GG + asG/:; ( P Ga, ) O.I . (8-1)
!!Z LG PG PG GG £
Here, (!!P/!!Z)LG is the pressure gradient (in N m 3), PG and PG are the gas density
(in kg m - 3) and viscosity (in kg m I s - t). GG is the mass velocity of the gas (in
kg m - 2 s- I), a. is the surface area per unit volume of the bed (in m 2 m - 3), and
£ is the bed void fraction. Above the flooding point, Eq. (8-1) underestimates the
pressure gradient. Morton et al. 36 suggested the use of an effective gas density in
DYNAMICS OF COUNTERCURRENT-FLOW FIXED-BED COLUMN 277
Eq. (8-1) to take into account the presence of entrained droplets. The pressure
gradient so calculated can still be about 50 percent lower than that measured for
a bed packed with Raschig rings. Hutton et al. 24 suggested the use of e' in place
of e, where e' = I - c - hOL - k, where c is the volume fraction of solids, hOL is the
liquid holdup, and k is the effective volume of dead space in the void, For a given
packing, k. can be estimated from experimental results. Hutton et al. 24 showed
that by modifying Eq. (8-1) in this manner. one makes it fit the experimental data
of Morton et al. 3ti much better. The pressure drop can also be thcoretically
correlated to the liquid holdup, as shown by Hutton et al. 24 This is shown in
the next section. Under similar flow conditions, countercurrent flow renders more
pressure drop than cocurrent downflow through a pach:d bed.
Recommendations The reader should consult Refs. 11 and 45 for the pressure
drop calculations. The Hutton and Leung model should be verified with additional
experimental data obtained with small particles and hydrocarbon systems.
8-3 GAS AND LIQUID HOLDUPS
The determination of the gas or liquid holdup is largely made from RT D
measurements. Some investigators have measured the RTD of the gas phase, while
otl'-ers have studied the liquid phase. It should be noted that, in principle, the
holdup of only one phase is required because the holdup for the other phase
can be calculated if the total voidage is known.
8-3-1 Gas Holdup
DeMaria and Whi te l3 measured the gas holdup in a IO.16-cm diameter column
packed with unglazed porcelain Raschig rings of 0.635, 0.953, and 1.27 cm nominal
diameter, The heights of the column, i.e., 91.44 and 122 em, were examined. A)I
data \\Ier a ken !.mckr trickle-flow conditio.ns. Helium and mixtures of helium
and nitrogen were used as tracers in either step or pulse inputs. The gas holdups
were calculated from the RTD curves and they were correlated by a dimensionless
expression
hOG = 0.9 X 10-3.43" 1O-'(d p !J.)2.31 Re".
[;
(8-2)
Here, hOG is the gas holdup, defined as a volume fraction of the empty column,
and d p and de are the nominal packing and column diameters. The liquid Reynolds
number Re L was defined in terms of nominal packing diameter and average
nominal liquid velocity. The above correlation indicates that in their study the
gas holdup was independent of the gas Reynolds number.
De Waal and Van Mameren l4 studied the RTD in the gas phase for an
air-water system in a 30.48-cm-diameter, 3,05-m-tall countercur ent flow trickle-
278 GAS LIQUID-SOLID REACTOR DE.<;IGN
bed column. The column was packed with 2.54-cm ceramic Raschig rings. They
concluded that the gas holdup in this system was essentially independent of gas
flow rate (in the range 150 through 420 g cm. 2 hI), but was dependent on the
liqu id flow rate.
Woodburn 55 measured the gas-phase RTO for extremely high ratios of liquid
rate/gas rate in a 29.2-cm i.d. and 97-cm tall column packed with 2.5-cm stoneware
Raschig rings (f = 0.714). The data were obtained in the range
15 < ReG (UGP G d p f:/J1.d < 500
and
126 RedV Ol P l d p /J1.d < 1,321.
Here. VOL is the superficial liquid velocity and V G the gas "pore" velocity. The
dynamic holdups were approximately 90 percent of the values anticipated from
the Otake-Okada 3B correlation. The data wcre compared with those obtained
by Dunn et al. t 6 and Sater and Levenspiel. 43
Chen B ,9 studied the gas holdup of a 7-cm i.d. 244-em long column randomly
packed with open-end screen cylinders of various sizes (1.27 cm x 1.27 cm and
1.9 cm x 1.9 cm) and screen meshes (8 14 mesh). The results with an air-water
system were obtained in the bubble-flow regime. The screen cylinders were found
to reduce the gas holdup. The results showed that for V OG < 4 cm s I, the gas
holdup was a linear function of gas velocity, a result similar to the. one obtained
in an unpacked bubble-column bul not in a column packed with Raschig. rings
or other conventional packings. He also showed that for low gas velocity, U OG <
3.64 cm s-\ the parameter (h G - hG)!h G was a unique linear function of liquid
velocity (independent of gas velocity). Here, llG is the gas holdup at zero liquid
velocity. He also obtained a relationship between the gas holdup and the slip
velocity between gas and liquid. All the data were graphically illustrated, however,
no analytical correlation was presented.
Unlike the trickle-flow regime, in the bubble-flow regime the gas holdup
depends on both the gas and liquid velocity. The gas holdup in a packed counter-
current bubble-column was also measured by Hoogendoorn and Li ps 22 and
Carleton et al. 5 The latter investigators measured the gas holdups during the
oxidation of sodium sulfite and the desorption of carbon dioxide from water.
Various columns with diameters ranging from 7.6 through 30.5 cm were studied.
Raschig rings with packing sizes ranging from 0.6 through 3.8 em were investigated.
The data showed that depending on the column diameter the gas holdup in a
packed column may be higher or lower than in an unpacked column operating
under similar flow conditions. In unpacked columns, large bubbles tend to form,
but this is counteracted by recirculation effects. which are particularly marked in
large columns. Unlike the data of Chen, B.9 these investigators' data showed that
at low liquid velocity (0 through 0.3 cm s- I). the gas holdup is essentially un-
affected by the liquid velocity. No correlations for the gas holdup were proposed.
Hoogendoorn and Li ps 22 measured the gas holdup with an air -water system
in a 4O.54-cm-diameter column packed with 1.27-cm Raschig rings. Their results
DYNAMICS OF COUNTERCURRENT-FLOW FIXED-BED COLUMN 279
also showed the gas holdup to be essentially independent of the superficial liquid
velocity in the range 0.091 through 0.52 cm s - I. The gas holdup increased with
the superficial gas velocity. but. under similar flow conditions. it was lower than
that obtained by Weber 53 and Hofmann 21 for cocurrent upflow through a column
packed with 0.635-cm Raschig rings.
8-3-2 Liquid Holdup
The liquid holdup has been measured by several investigators. Earlier investi-
gations by Elgin and Weiss,IB Piret et al.,39 Jesser and Elgin,25 Shulman el al.,4B
and Olake and Okada 3B were in substantial agreement with each other.
Piret et al. 39 studied an air-water system.in a 76.2-cm-diameter l.83-m-packed
height column. The packing was 4.445-cm round gravel. having a bed voidage of
0.388. The results showed that, below flooding, the liquid holdup increased with
the liquid fJow rale but remained independent of gas flow rate. Above flooding,
the liquid holdup increased with gas flow rale.
Shulman et al. 4B measured the liquid holdup for an air-water system in a
25.4-cm-diameter, 91.44-cm-packcd height column. Several packings, i.e., 1.27-,
2.54-, and 3.81-cm unglazed porcelain Raschig rings, 1.27- and 2.54-cm unglazed
porcelain Berl saddles. and 2.54-cm carbon Raschig rings, were investigated. The
total. dynamic and static liquid holdups (all defined in terms of total bed volume)
were measured. For the ranges of air flow rates (48.83 through 488.3 g cm - 2 h -I)
investigated in this study. the dynamic and total liquid holdups were found to be
independent of gas rate and increased with liquid rate below the flooding point.
The static holdup was independent of both of these rates. The total liquid holdup
was approximately proportional to the number of pieces of packing per unit
volume. The static holdup was dependent on the nature of the packing surface,
whereas the dynamic holdup was independent of the packing surface.
Kramers and Alberda 29 measured the RTD for an air water system in a
15-cm-diameter. 66-cm-high column packed with IO-mm Raschig rings, The data
indicated an increase in liquid holdup with the liquid Reynolds number.
Hoogendoorn and Li ps 22 measured the liquid-phase RTD in both the trickle-
flow and bubble-flow regimes using an ammonium chloride tracer. The total
liquid holdup (defined on the basis of the volume of empty column) varied from
12 through 17.5 percent when nominal liquid velocity varied from 0.213 through
0.518 cm S-I. The liquid holdup was independent of gas velocity in the range
of gas velocity 0.09 I through 9.14cm s- t. The static holdup was nearly independent
of liquid velocity at a value of 0.065, which is in agreement with the results of
Shulman et al. 4B for a similar packing. No analytical correlation for the data was
presented.
De Waal and Van Mameren t4 measured the liquid holdup for liquid and gas
flow ranges of 5,000 through 80,000 and 0 through 5,000 kg m 2 h - I, respectively.
The maximum holdup (based on the total column volume) at the flooding point
was approximately 0.15. The liquid holdup was significantly affected by both gas
and liquid flow rates. No correlation was presented.
280 GAS -LIQUID-SOLID REACTOR DESIGN
Prost and Le Goff41 studied an air-70 percent aqueous solution of saccharose
system in a 1O-cm-diameter and 3-m-high packed column. The column was packed
with I-em Raschig rings. The liquid and gas flow rates ranged from 1.12 through
10.3 kg m 2 s I and 0 through 2.5 kg m- 2 S-I, respectively. The liquid holdup
(based on total column volume) varied from 0.07 through 0.35 at zero gas rate.
They also measured the electrical conductivity of tht: irrigated bed in both the
horizontal and vertical directions. The tortuosity of the liquid now was measured
in terms of the liquid holdup, conductivity of the liquid, and the effective con-
ductivity of the bed.
Bennett and Goodridge 2 studied an air-water system in columns of 5.08- and
7.62-cm diameter and 30.48- and 60.96-cm packed heights, Two packings of
nominal packing size 0.953 and 0.635 cm, both of ceramic Raschig rings, were
studied. The liquid flo\\> rates were varied between 7.87 and 39.33 cm 3 s- I and
15.73 through 94.39 cm 3 s- t in the 5.08- and 7.62-cm beds. respectively. Gas flow
rates varied from 0 to a value just extending over the flooding rate. A unique
tracer technique, in which the input is a step decrease in the concentration of an
aqueous ammonium chloride, was used. The results of this study agreed well with
those predicted from the correlation of Morton et al. 36
An empirical correlation for the liquid holdup has been given by Otake and
Okada. 3B They correlated the dynamic liquid holdup to !he liquid-phase Reynolds
number and the Galileo number by a relation
h dL = 1.295 (Redo. b76 (Gad 0.44 (aA,), (8-3)
whcre h dL is the dynamic liquid holdup as fraction of bed volume. ReL =
dpGL!}.tL, GaL = d gpU}.tl, g is thc gravitational acceleration, and G L is the mass
liquid flux: .
Sater and Levenspiel 43 studied an air-water system in a 1O.16-cm-i.d. glass
colupm packed with either 1.27-cm ceramic Berl saddles or 1.27-cm Raschig rings
to a height of 3.66 m. Iodine-131 was used as liquid-phase tracer. The dynamic
liquid holdup data obtained under trickle-flow conditions correlated well with
the above Eq. (8-3) of Otake and Okada. 3B
Theoretical analyses of the liquid holdup are given by Kolar and Broz 2B and I
Hutton et al. 24 Kolar and Broz presented a relation between the liquid holdup
and the flow rates, and physical properties of the fluids. The relationship contains
three parameters, the values of which must be determined by experiment. Hutton
et al. 24 derived relationships between the liquid flow rate, pressure drop, and
liquid holdup. At low Reynolds numbers, oply.gr.a\U.tY_aD_d yiscgu fO .f ere
considered to DeI"mporra:m; an-a-rrom a force balance on the trickle bed, they
derived a relation
MLPLg cos 2 {J ( tJ.P\ ) L h L cos 2 fJ ] MdJ - c - hod cos 2 fi
VOl. = 3 2 h )3 - A z 3 2( J )3 + 2 2 3 '
ILLlI,(e + 01. il LG IL] a, C + 11)L . }.tl as(e + hod
(8-4)
where (tJ.PjtJ.Z) is the pressure gradient (in N m- 3), as is in m 2 m - 3, PI and PI
are in kg m - 3 and kg m'- I s - I, respectively, e is the solid fraction (in m J m - 3),
DYNAMIC'S OF COVKTERC'URRENT-FLOW FIXED-RED COLUMN 281
{J IS m m s 2. VOL is in kg s I, {J is the angle particlcs make to the vertical, and
h OL is in m J m- 3 .
_ t h _ .Yl1olds u bers, they considered gravilational and inertial forces
to be important and derived a corr-e-sponding relation from the force balance as
11 01 . fl/2 ! ( I )( /)"P ) J I12
VOl. = Y d s U - PL /),.Z l(, '
where S' is the shape factor and d the characteristic packing length. Methods for
estimating d and Sf are given by Davidson 12 and Buchanan. 4
(8-5)
Recommendations All existing literature data on gas and liquid holdups for
countercurrent flow systems are for packings normally used in absorption towers
or gas liquid reactors. The validity of these data for small packings that would
normally be uscd in gas-.liquid solid catalytic reactions needs to he checked.
8-4 GAS- AND LIQUID-PHASE AXIAL DISPERSION
Significant- literamre on the axial dispersion in gas and liquid phases for
countercurrent-flow packed-bed columns have been reported. Trickle- and
bubble-flow regimes have been considered. Unlike the holdup, there is quite a
discrepancy In the results of various investigators. Almost all the RTD data arc
correlated by a single-parameter axial dispersion model. A summary of the
reported axial dispersion studies in countcrcurrent flow through a packed bed is
given in Table R-1.
8-4-1 Gas-phase Axial Dispersion
DeMaria and White 13 correlated their RTD data by the axial dispersion model.
The axial dispcrsion coefficient was correlated by the relation
PeG = 2.4 ReGO.20IO-w.Ot3-o.o88dpid,)Rel.,
(8-6)
where ReG is the gas Reynolds number and PeG the gas Peelet number. Both
are based on nominal packing diameter and average nominal velocity.
The gas Peclet number depends upon both the gas and liquid Reynolds
numbers. Although this was also verified by De \Vaal and Van Mameren,14 Sater
and LevenspieL 43 and Dunn et aI., 16 there was significant discrepancy in the values
of Peelet number obtained by these investigators under similar system conditions.
Sater and Levenspiel 43 correlated their data for Raschig ring and Ber! saddles by
the following relation:
PeG = o.0585(a,d p I H ReC;A 10 eRe"
(8-7}
where A = 0.668 .:t 0.184, B = 2.58 :t 0.78, C = 0.00259 :!: 0.00053. This corre-
lation predicted values of PeG an order of magnitude lower than those predicted
by Eq. (8-6). De Waal and Van Mameren l4 showed that the axial dispersion may
'"
OC>
'"
c c.....
Table 8-1 A summary of experimental back mixing studies in countercurrent-flow packed-bed columns
Column diameter Column length
Investigator Packing rcm) (cm) System
Otake and Kunugita 37 0.787-. 1.55-cm Raschig rings 5.08, 5.o 15.24 91.44, 146.3, 164.59 Air water
Kunugila et al. 3O 1.02-. 1.52-,2.03-. 2:54-cm Raschig 13.97 100.58, 152.4 Air water
rings; 2.54-cm Berl saddles
DeMaria and WhiteD 0.635-, 0.953-, 1.27-, 2.54-cm 10.16 137.16 Air water
Raschig rings
Sater and Levensplel 43 1.27-cm Raschig rings; 1.27-cm 10.16 365.76 Alr-waler
Berl saddles
Furzer and Michell 19 0.635-cm Raschig rings 5.08 152.4 Air.-water
Co and BibaudllO 1.27-. 2.54-em Raschig rings 12.7,27.94 304.8 Air water
Dunn et al!" 2.54-, 5.08-cm Raschig rings 60.96 152.4, 304.8 Air-water
Hoogendoorn and Li pS 22 1.27-cm Raschig rings 40.64 304.8.609.6 Air-water
Shestopalov et al. 4 7 I em )( I cm, 1.5 cm x 1.5 cm, 24.59 150.27 Air water
2.5 cm x 2.5 em
Woodburn" 2.S-em Raschig rings 29.21 96.93 Air -water
Anderson et al I 1.27-cm Raschig rings 30.48 91.44 Air water, radial and axial
dispersion
Kramers and Alberda 29 1.02-cm Raschig rings 15.24 67.06 Air-water
Polk and C1ements 4O 0.635-cm Raschig rings; 0.635-cm 1.207 113.82 Air water
Berl saddles
Koen and Nel 27 0.63S-cm Raschig rings; 0.635-em 5.08-7.62. 9.14- 182.88 Air .water
Berl saddles 7.62-15.24
Table 8-1 Continued
In vestiga tor
Packing
Dil'man et al.'s
Mathur and Wellek]J
Carleton et al. S
Bennett and Goodridge Z
Chen 7 - 9
....
QC
....
1.S24-cm Raschig rings
1.27-, 1.953.cm Raschig rings
3.8-, 1.9.. 1.3-, LO.cm stoneware
Raschig rings; 0.6-cm porcelain
Raschig ring; 1.0.cm stom:ware
Lessing ring; 0.6-cm stainless steel
Dixon; 1.3-cm PVC spheres
0.953-, 0.635-cm ceramic Raschig
rings
Open-end screen cylinders: 1.9 cm
(screen mesh 10), 1.27 em (screen
mesh 8), 1.27 cm (screen mesh 10),
1.27 cm (screen mesh 14)
Column diameter '
(cm)
Column length
(em)
1).24
1O.lfi .
7.62, 15.29, 30.48
7.62
7.62
5.08
7.01
594.36
91.44
152.4
30.48
60.96
60.96
129.54. I 9.8'J
(packed height)
System
Air water
COz-N z mixture and water
Oxidation of sodium sulfite,
CO 2 -water
Air .aqueous ammonium
chloride solution
Air-water
. \ -)
'-" -.
284 GAS- I.I(JUID-SOLID REACTOR DESIGN
be insignificant in tall columns. These data lay in between those of DeMaria
and WhiteD and Sater and Levenspiel 43 under similar conditions. Dunn ct al" 6
used helium as a tracer for the gas-phase axial dispersion measurements. He
correlated the data using the random-walk model. Over the rangcs of liquid flow
of 0 through 5,371 g cm 2 h - I and gas \low of 146.48 through 537.08 g cm 2 hI,
they also found that the axial dispersion increases with both gas and liquid flow
rates. They presented dimensional relations for the gas-phase Peclet number in the
form
PeG = (A' - B'QG)IO"CQ"
(8-8)
where QG and QI. are the gas and liquid flow rates. PeG is the Peclet number
based on the equivalent packing diameter. The values of the constants A', B',
and C' depended on the size and nature of the packings. Some are listed in
Table 8-2.
Woodburn 55 obtained gas-phase axial dispersion data at very high irrigation
rates. He found that, over the range [5 < ReG < 500 and 126 < ReL < 1,321
(Reynolds numbers are defined in Sec, 8-3), the gas-phase Peelet number increased
with the superficial gas rate. The data indicated that the gas-phase axial dispersion
coefficient E ZG was proportional to the gas porc velocity: i.e., EZG (f.. U:!" where
n > I for loading conditions and 0 :;:; 11 :;:; I for subloading conditions. The data
in the rangcs 600 ReG:;:; 2,200 and 0 :$; ReL :;:; 375 were well correlated by a
correlation of Dunn ct aI., 16 namely,
Pe = lI <d p ( 0.665 _ 1.9 x 10- 4 Rc ) x 10- 1.13' 1O-.JRe,. ( 8-9 )
G 6( I _ t) G
Woodburn 5s showed that, for ReI :;:; 650, Ihe correlations proposed by
DeMaria and White, 1.1 Sater and Levenspiel,4.! and Dunn et al. 16 could correlate
his data. However, for 650 < ReL < 1,500, the axial dispersion in the gas phase
was independent of the liquid rate. Under these liquid flow conditions, the reverse
gas flow induced by the counterflowing liquid was measured. Thus, he concluded
that an additional dispersive mechanism associated with reverse gas flow becomes
operative at ReL ;:?; 650.
Recently, Mathur and Wellek 33 reponed that there is a significant discrepancy
in the values of the gas-phase Peclet number when the measurements are taken
by the steady-state procedure which they (and also Brittan and Woodburn.!)
employed, as compared with the transient-response techniques employed by
DeMaria and White l3 and Sater and Levenspiel. 43 Mathur and Wellek.l 3 obtained
Table 8-2 Values of constants 4', B', and C' in Eq. (8-8)
Packing A' ll' C'
2.54-cm Bcrl saddles 0.1\22 4.73:><.10'4 3.85 x IO-
2.54-cm RaschIg rings 0.665 3.83 x 10 4 3.1\5 x 10 5
5.08-ern Raschig rings 0.756 1.875 x 10- 4 1.61 x 10 5
- - --- ..---
DYNAMICS Ot' COIJNTERCVRREJ'.:T-FLOW FIXED-BED COLUMN 285
..."
the data in a 10. I 6-cm-i.d. glass column with a packed height of either 91.44 or
152.4 cm. Three packings, 0.635-, 0.953-, and 1.27-cm Raschig rings, were
examined. The data of both Mathur and Wellek B and Brittan and Woodburn,3
illustrating the effect of the liquid phase Reynolds number, agreed qualitatively
with those predicted by Eqs. (8-6) and (8-7). The data of Mathur and Wellek 33
showed that the gas-phase Pedet number initially decreased with an increase in
the gas-phase Reynolds number, and, after passing through a minimum, it
increased with the gas-phase Reynolds number at a constant ReL, packing size,
and bed height. Mathur and Wellek 33 also showed that the Peclet number
increased with packing size and slightly decreased with an increase in packing.
height. Some of the data illustrating these effects are shown in Figs. 8-2 and 8-3.
In these figures, PeG =- UGdp/Ew and ReG = d p Gc;/J1.G. where U G is the true linear
velocity of the gas ph<¥e and Ew is the gas-phase axial dispersion coefficient
8-4-2 Liquid-phase Axial Dispersion
Just as in the case of the gas-phase Peclet number, significant discrepancies in
the reported literature on the liquid-phase Peclet number exist. Kramers and
Alberda 29 showed [hat in a 15-cm-diameter column packed with JO-mm Raschig
1.8
1.6
1.4
, /
.'-. .
, .
.
.--./
D
If 1.2
1.0
0.8
" .'
06 -- . -
. -&
-&-&-
0.4 ,
2
3
4
5
ReG
I
6
7
8
ReL
. 58.99
. 87.73
. 116.96
& 87.73
Packing
(Raschig
rings)
(cm)
0.635
0.953
1.27
0.953
Packing
height
(cm)
91.4
91.4
91.4
152.4
Figure 8-2 Per. versus ReG Vi-om [he dll/ll
(!{" Mathur llnd WeIlek").
286 GAS -LIQUID-SOLID REACTOR DEStGN
1.4 I I I
GG = 3.61 gm h- I cm- 2 I
1.2- .. -
1.0 - -
u I
0.8 -
a G L (gm h I cm -2)
0.6 . .. 1747 -
-
. 2098
. 2450
0.4 I I I
0.6 0.8 1.0 1.2
Packing size (em)
Figure 8-3 PeG versus packing size (fi-om the
dma of" .\-larhur and Wellek B ).
rings, the axial mixing increased with increasing gas Ilow rate and decreasing
liquid flow rate. Their results were not adequately represented by the diffusion
model.
Otake and Kunugita 37 studied an air water system in a column packed with
either 7.85- or 15.5-mm Raschig rings. They proposed a dimensionless relation
for the liquid-phase axial dispersion coefficient EZI in the form
EZI/vL = 0.527 Re .5 Ga .33. (8-10)
Here. ReL and Ga.. are the liquid-phase Reynolds and Galileo numbers based
or the particle diameter and VL is the kinematic viscosity of liquid. Weber 54
obtained much higher values of Ell than those predicted from the above relation.
Hofmann 2 \ indicated some discrepancies between the predictions of the above
correlation and his experimental data.
Sater and Levenspiel 43 correlated their experimental data along with those
of Otake and Kunugita 37 and McHenry and Wilhelm 34 by a relation
V.dp/E ZL = Pel. = A' Re ' Gat' (a.d p )i5, (8-11)
where A' = 19.4, B' = 0.747:!:: 0.]47, C' = -0.693 -t 1.095, D' = 1.968 :!:: 0,997.
Here, V L is the axial liquid velocity.
Because of the slight variations in viscosity and surface area used in their
study, the values of C' and ii' are unreliable. They, therefore, proposed an alternate
relation
PeL = 7.58 x 10- 3 (Redo. 703,
( 8-12)
which included only the liquid Reynolds number.
Dunn et al.] 6 measured the liquid-phase axial dispersion (using sodium
DYNAMICS OF COUNTERCURRENT-FLOW FIXED-BED COLUMN 287
nitrate solution as a tracer) in a 61-cm-diameter and 183-cm-packed height
column. Three packings (2.54-cm Raschig ring (equivalent diameter d p = 0.95 cm),
5.1-cm Raschig rings (d p = 1.9 cm), and 2.54-cm Ber! saddles (d p = 0.6 em» were
used. The dispersion data were fitted by the diffusion model better than the
random-walk model, the mixing-cell model, or the segmented-laminar-flow model.
The axial dispersion decreased with increasing liquid flow rate; but, unlike the
data of Kramers and Alberda,29 in the range of gas flow rates from 0 through
538 g cm 2 h I the axial dispersion remained essentially unchanged with the
variation in the gas flow rate, For the range of liquid flow rates G L from 978
through 5,380 g cm 2 hi, the liquid-phase Peclet number was correlated to G L
in a somewhat different manner1rom that ofOtake and Kunugita. 38 The proposed
relations were
PeL = a' X 104-.93 10 'G,.
(8-13 )
The constant (/' for several packings is shown in Table 8-3. Equation (8-13) is valid
for gas flow rates in the range of 0 < GG < 538 g h - I cm - 2.
Hoogendoorn and Li ps 22 measured the liquid-phase axial dispersion in both
the bubble-flow regime and the trickle-flow regime. In the trickle-flow regime, they
noted excessive tailing in the RTD curve. Thc data were not correlated well by
the single-parameter axial dispersion model, and, consequently, they used a two-
parameter crossf1ow model to correlate their data. (n the bubble-flow regime. the
axial dispersion model correlated the experimental data very well. The calculated
axial dispersion coefficient was essentially independent of liquid flow rate (in the
range of nominal liquid velocities 0.091 through 0,518 em s- 1) and depended only
slightly on the gas flow rate. Their data, obtained with 1.27-cm Raschig rings,
were about an order of magnitude larger than those of Weber, 54- who used 6.2-mm
Raschig rings and a coeurrent-upflow system. Hoogendoorn and Li ps 22 suggested
that their data agreed well with those of Weber,54- if the Peclet number is defined
in terms of bubble velocity.
Carleton et al. 25 obtained the dispersion data in various columns (diameter
ranging from 7.6 through 30.5 cm) and with various size (ranging from 0.6 through
3.8 cm) Raschig ring packings. They showed that, in the bubble-flow regime, the
liquid-phase Peclet number remained essentially independent of gas velocity (in
the range 2 through 9 cm s- t), and that it decreased with column and packing
size. Unlike the data of Hoogendoorn and Lips,22 their data showed a decrease
in the Peclet number with an increase in the interstitial liquid velocity.
Table 8-3 Values of d in Eq. (8-13)
for various packings
Packing
d
2.54-cm Raschig rings
5.I-cm Raschig rings
2.S4-cm Berl saddlt:s
0.038
0.051
0.033
288 GAS-LiQUID-SOL/D REACTOR D£<;IC;r-.;
De Waal and Van Mameren 14 showed that in tall trickle-flow columns, the
effect of the liquid RTD can be neglected. The height of a perfectly mixed stage
was found to be independent of both gas flow (in the range 1,340 through 3,750
kg m - 2 h - 1) and liquid flow (in the range 27,000 through 69,000 kg m 2 hi).
The Otake-Kunugita type of correlation for the Peelet number has also been
used by Co and Bibaud. 1O Bennett and Goodridge 2 and Michell and Furzer. 35
Co and Bibaud 10 examined trickle-flow air-water systems in 12.7- and 27.94-cm
i.d. columns. The columns were packed to 304.8 cm with either 1.27- or 2.54-cm
Raschig rings for the RTD measurement. The data were correlated by the following
relation:
Pel. = A(Redi(Gad' (osdp)D,
(8-14)
where
A -= exp (179.29),
B = 0.334,
E = 1.570,
fj = -99.117,
(J' = 0.095;
a' = 1.415;
(J' = 83.12.
The values of C and D were obviously unreliable because of the small variation
in the packing surface area and fluid properties in the experimental measurementS.
They, therefore, proposed an alternate relation
PeL = exp ( - 4.105) Re .431 3, (8-15)
which correlated the Peclet number only to the liquid-phase Reynolds number.
In the above relations, PeL> Re L , and Gal. are defined in terms of interstitial liquid
velocity and the equivalent particle diameter. Equation (8-15) is valid for the range
of liquid mass flux from 1,953 through 7,323.76 g cm -2 h - 1 and the gas flux below
the flooding point.
Michell and Furzer 35 combined various data from previous investigations and
proposed a relation
PeL = 5.9 Re:__ 3S Gai:"°.72.
(8-16)
Here. once again, PeL and ReL are based on the interstitial liquid velocity. Bennett
and Goodridge 2 obtained data in a 7.62-cm i.d. column with 30.48- and 60.96-cm
packed height. Their measurements with 0.635-, and 0.953-cm Rasehig rings
indicate that the liquid-phase Peelet number is independent of bed length and
can be correlated to the liquid-phase Reynolds number by a relation
PeL = 0.095 Re 's I. (8-17)
The Peelet numbers predicted from the above correlation were lower than the
ones predicted by the correlation ofOtake and Kunugita. 37 A comparison between
these two works is shown in Fig. 8-4.
Chen 9 reported the measurements of the liquid-phase axial dispersion
coefficient obtained in a 7-cm-i.d. plexiglass column packed with a variety of
DYNAMICS OF COUNTERCURRENT-FLOW FIXED-BED COLUMN 289
1.0
0.6
..;
Otake-Kunugita 39
0.2
Raschig rings
OJ
"-
...:- 0.4
'-'
.D
E
:J
'"
'"
<3
0.1
100
200
I
400
600
I I
1000
Reynolds number, ReI.
Figure 8-4 Plot of Peele. number versus Reynolds number.
open-end screen cylinders. The data were obtained in the bubble-flow regime.
Most of the data were obtained in the range of superficial gas velocities from 0
through approximately 3 cm s - t and of superficial liquid velocities from 0 through
approximately 5 cm s - I. Unlike the findings of Hoogendoorn and Li pS 22 and
Carleton et aL,5 the axial dispersion coefficient was found to increase with both
gas and liquid velocities. At high liquid velocities, the relation
En "X U8i. 24
(8-18)
correlated the data. Here, E ZL is the liquid-phase axial dispersion coefficient and
U L IS the interstitial liquid velocity. Chen 9 pointed out that the axial dispersion
coefficient should be correlated to the slip velocity between the gas bubbles and
the liquid phase. The relation
E ZL x (U ot + U b )1.21 (8-19)
correlated his data for each packing at various gas and liqUId velocities. Here,
Vb = U oG /I1 G , where h G is the gas holdup. Chen" indicated that, just like con-
ventional packings, screen cylinders reduced the axial mixing and gave uniform
distribution of bubbles within the column.
Shestopalov et a1.4 measured the liquid-phase axial dispersion in a 246-mm-
diameter and L5-m-high glass column. Randomly stacked Raschig rings with
dimensions of 10 illm x 10 mm, 15 mm x 15 mm. and 25 mm x 25 mm were used
as packing. Methylene blue dye solution was used as a tracer, and its steady-state
290 GAS-LIQUID-SOLID REACTOR DESIGN
concentration along the length of the column was measured by a photoelectric
calorimeter. The axial dispersion coefficients were, thus, evaluated from the
steady-state tracer concentration profiles. The Peclet number, defined in terms of
the average linear velocity of liquid and the length of the column, increased with
the gas velocity over its range of 0.28 through 1.8 m s- t and the liquid flow
rate over its range of 0 through 1.5 x 10 2 kg m 2 hI. The axial dispersion
coefficient was independent of liquid flow rate, and decreased with an increase in
gas velocity. Based on their data, they proposed the following relations:
VGRp/EZL = e 2 . 3 (1.52- t tEl Re6.6
for Re .6 exp [2.3(1.52 - lie)] > 16 and
UGRp/EzL = e 2 . 3 (1.32 6.47£.) Reh. 55 (8-21)
for Re .6 exp [2.3(1.52 - lid] < 16. Here, Va is in m s t. GG is in kg m - 2 S-l
(which was varied from 0.5 through 10). ReG = 4G G /3,600}.tG£l" a. is in m 2 m- 3
and }.tG in kg s - I m -.. Rp = da.. the hydraulic radius of packing in m. The
dependence of ElL on the gas rate obtained in this study is considerably different
from those reported in other studies. The reasons are not clear.
In all the studies described above, only the axial dispersion was considered.
Anderson et at t measured the radial dispersion for the dispersed water phase in
an air-water system. The measurements were carried out in a 30.48-cm-diameter
Lucite tube packed with 91.44 cm of 1.27-cm Raschig rings. A continuous source
of tracer was used. The radial Peelet number deereased with the increase in both
the gas and liquid Reynolds number. Some typical results are shown in Fig. 8-5.
The measurements were carried out up to the flooding point. The entire results
were correlated graphically, as shown in Fig. 8-6. In Figs. 8-5 and 8-6 the Peclet
number was based on the fluid velocity through the column, the nominal packing
(8-20)
10
9
8
7
6
at 5
4
3
2
Ir-
0
0
Re L 229
100
200 300
400 500
600
700
800
900
ReG
Figure 8-5 Effec( of gas flow rate on radial Pedet number for a water phase (from data af Anderson
et al. l }
DYNAMICS OF COUNTERCURRFNT-FLOW t.IXED-BED COLUMN 291
2.0
1.0
0.5
C! 0.2
-
I
.;
e:. 0.1
'"
0.05
0.02
0.01
0.05 0.1 0.2 0.5
R G IRec. r
""
c
I
IG:
I
I
I
1.0
2.0
Filiiure 8-6 Correlation of radial Peclct
number for a watcr phase with flow rates of
both phases ((rom datci /If Anderson et al. I).
diameter. and the radial dispersion coefficient. Both the gas and liquid Reynolds
numbers are based on the superficial velocities of the respective fluid and the
nominal packing diameter. In Fig. 8-6. Pen is the value of the radial Peclet number
under trickle-flow conditions. The slope of the line in this figure is 2.2. At the
flooding point. the radial dispersion coefficient has about twice as high a value
as under trickle-flow conditions. For the four liquid flow rates examined in this
study, the flooding gas flow rates are shown in Table 8-4.
Recommendations As in the case of the holdup, all the data for gas- and liquid-
phase axial dispersion coefficients have been obtained for packings normally used
for absorption or gas liquid reaction processes. These packings are large and
Table 8-4 Gas aud liquid flow rates at flooding
pointt
G L G"
!g cm - 2 h I} !gcm- 2 h- I \ ReL ReG
3.5 10. 5 2.1 53.1 9 105 1.350
5,019.2 512.66 143 1.000
6.523.0 361.31 195 710
8,026.85 256.33 229 500
t Data of Anderson el al.'
.-. co-r("' "?::,t.':C' -,- :'J.' "'- 'JC: - t- /. '''JI.'''J
r-....."'a,....t , ,. .._.,...l-...., oJ I;Q .J.;_".J;o J<>.f'r:J.c "' C ; C."/ r-4....s-J
kol '",;J.-. C''J .,!> I ;- J' . {
,;.;".....f .....4! \; J ,; '1 ;- or- ....c..\ -.r (" .... \.;"'... e"/' "'1, c, t. "'-''t, r
'''t3. 292 GAS-LiQUID-SOLIDREACTORDESIGN \<>"'''" \ fre 'Vel. <..JoP t='C"
nonporous compared to those normally used in gas- liquid-solid catalytic
reactions. Since there is already a large degree of discrepancy in the existing
literature, the usefulness of any given correlation to the particular situation at
J t,.. ",. hand should be experimentally checked, if possible.. t' prc>/'" I c..Ple...
I .....CJ ,;: \., <? .\ec+ " rc>.J..c \ s+r. "'+ 1,''1' L.'f ve 0<:;. ,:j
,.I"""'. "'d "J"-+-l r acl.....: 0< ..'I.J.of'--':1 .!.'.P'r;L..d...'.
,I.so ',...; ; . C' I i'1' J;,<V-r::......f. Dr o. .fec J rc-o-.\'. , ). . ..r:bv-+ ....""
j\ t..l TEl? A EA ;! C ,.\ " -' y-..:,...,I-
"'{f ". ..."' :: \, \'V1 \;:1(' -e. .........0 1\ o- .
. SL......,.r a . b .
Just as In the case of a cocurrent-downuow tnckle- ed column, the unIform
wetting of the packing may also be a problem for a countercurrent system,
particularly under trickle flow. Few studies have reported correlations for the
wctted packing area in a countercurrent flow system.
Shulman et al. 48 measured wetted area for L27-cm and 3.81-cm Raschig rings
and 1.27-cm and 2.54-cm Berl saddles packed in a column operating under
countercurrent-flow (air-water) conditions. The results were well correlated by the
following relations:
_ 0.. ( L,..., ) f- aw/a, = !X[ GLfGGJfJ,
CI-t- e...... .
where !X = 0.35. f3 = 0.20 for Bed saddles and (/. = 0.24. f3 = 0.25 for Raschig rings,
lIw is the wetted area, a, is the total surface area, and G L and GG are the
superficial liquid and gas rates.
DeMaria and Whit e t3 studied wetting of 0.635-, 0.953-, and 1.27-cm nominal
diameter unglazed porcdain Raschig rings in a 10.16-cm-i.d. glass column. They
correlated their data under trickle-flow conditions by the following relationship:
(I J r L,.,.
:"'c L = --
It-
(8-22)
aw/a, = Lit (ReG)- 0.210- \0.013 O.OIH:ltd,!dJ 3....3 x to. h1dp/d)..JI] Rc l ,
(8-23)
where ReG and ReL are the gas- and liquid-phase Reynolds n ;b based on
the superficial gas and liquid velocities.
The above relation indicates that the effective interfacial area decreases with
a decrease in the liquid velocity or an increase in the gas velocity. The effect of
gas rate on lIw may be due to the fact that higher gas flow rates tend to make
the liquid packing more compact, so that it presents less surface area to gas flow.
The rate of decrease in a w with liquid rate is much more pronounced for smaller
sizes of pac kings than It is for larger sizes. The wetted area is inversely proportional
to the particle size, so that the area of the packed bed exposed to gas flow may,
at high liquid flow rates, be larger for larger packing sizes than for the smaller
packing. It should be noted that, even though the column diameter de is included
in the above correlations, all the data were obtained in a single column.
Some other relevant studies are discussed in a recent review by Charpentier. fi
Re£'ommendatiolls For large packing size, Eq. (8-23) can be used for the estimation
of a w or reference can be made to the review by Charpentier. 6 Future study on
this subject should be restricted to the packings normally encountered in gas-
liquid-solid catalytic reactors.
DYNAMICS !If CUUNTERCURRENT-fLOW FIXED-BED COLUMN 293
8-6 GAS- LIQUID MASS TRA.:"JSFER
Gas-liquid mass transfer in a countercurrent packed column has been studied
by various investigators. Carleton et al. 5 measured thc volumetric gas- liquid
mass-transfer coefficient for the desorption of carbon dioxide from water. The
gas-liquid interfacial area was independently measured by studying the rate of
oxidation of a cohalt-catalyzed sodium sulfite solution hy pure oxygen. The
measurements were made with column diameters ranging from 7.6 through 30.5 cm.
Raschig rings with sizes ranging from 0.6 through 3.8 crn were studied. The
rcsults were not correlated to the system parameters, hut they indicated that the
interfacial area and the gas-liquid mass transfer were both higher in a packed
column than in an unpacked column under similar flow conditions.
An early correlation for the liquid-phase mass-transfer coefficient is given by
Sherwood and Holloway.44 Its final form is
k,pr!D = Y.(GL/fldln(Jh/PLD)I- , (8-24)
where klll L is the volumetric gas-liquid mass-transfcr coefficient. D is the molecular
diffusivity, and G L is the liquid flux. The values of IX, 11, and s are dependent upon
the nature of the packing. Houston and Walker 23 studied the absorption of
ammonia. acetone, methanol. and cthanol in water. The data were taken in a
30.48-cm column packed with 60.96 cm of 2.54-cm Raschig rings. The overall and
the gas-side mass-transfer coefficients were both found to increase with the gas
and liquid flow rates. At liquid rates of 244. 13. 488.25. and 976.5 g cm- 2 h I and
gas rates up to 292.9 g cm - 2 h - I. the gas-fil m mass-transfer coefficient was
proportional to the solute difl'usivity to the 2/3 power. At a liquid Ilow rate of
1.464.75 g cm - Z h - I and gas rates up to 292.9 g em 2 hI, the gas-Ii 1m coefficient
was, however, found to be essentially mdependent of the solute diffusivity.
Shulman et al. 50 measured the gas- and liquid-film mass-transfer coefficients
for Raschig rings and Berl saddles. For these types of pac kings. they presented
the correlation
jo = [kGMMP8M/GG][Sc]l,3 = 1.I95[d p G G /lldl - e)]" 0.36
for the gas phase and
(8-25)
[kLdp/Dl = 25.1 [d p GLlIlL]O.45[SC ]£.5
(8-26)
for the liquid phase. Here Sc is the Schmidt number, d p is the diameter of a sphere
possessing the same surface area as a piece of packing. Go and G L are the
superficial gas and liquid mass fluxes, MM is the mean molecular weight of gas,
P BM is the log mean partial pressure of inert gas in the gas phase, D is the
diffusivity of solute in the liquid phase and kG and k L are the gas-film and the
liquid-film mass-transfer coefficients. respectively. Shulman and Robmson 49
subsequently obtained some additional data on a similar system.
An extensive study on the gas-liquid mass transfer is given by Sahay and
Sharma. 42 The mass-transfer characteristics of packed columns ranging from 10
294 GAS-LIQUID-SOLID REACTOR DESIGN
through 38.5 cm in i.d. and packed with a variety of packings (Raschig rings,
Pall rings and Intalox saddles) were studied. The theory of absorption accompanied
by a pseudo-mth-order reaction was used to obtain the values of effective inter-
facial area. The liquid-side mass-transfer coefficients were obtained using the theory
of absorption accompanied by slow chemical reaction. The superficial gas velocity
was varied from 5 through 25 cm s I. The data showed that both gas liquid
interfacial area (ad and the volumetric mass-transfer coefficient (kL.ad were
proportionaJ to the square root of the superficial gas velocity. Both aL and klGI.
for packed columns were considerably larger than the ones for unpacked columns
under otherwise uniform conditions. The overall improvement in the performance
of the coJumn due to the use of packmgs was greater when liquid backmixing
was important. The interfacial area was essentially independent of size and type
of packing, whereas klGl was affected significantly by the size and shape of the
packing, but it was essentially unaffected by the mode of operation and the
superficial liquid velocity in the range 0.17 through 0.5 cm s I. They also noted
that kLGL is independent of the length-to-diameter ratio if it is greater than 4 for
a lO-cm column and over 2 for a 20-cm column (see Fig. 8-7).
Recently, Mathur and Wellek 33 measured the liquid-side mass-transfer
coefficients for the absorption of CO 2 in water from the mixture of CO 2 and
...
o
-;:::
Q} 16
I
...... '-'
(lJ ..J
o '"
U ..J
L. 12
<:: E
.a
I 0
,.
"" c::
E.g
(lJ
"C '"
"¥
:;
. g
..Joe
'"
VI
'"
.&>
b
o-f}-B-De-O-o_-
/::,. v
_/::" _/::"_A_
.-.-.-
4
I
o
2
6
4
8
10
12
Length-to-diameter ratio of the column
o 20.32 cm column: 2.54 cm polypropylene intalox saddles
Air-0.93 M HCI + 3.0 M NaCI + CuCI system; U OG = 14.1 cm/sec
o 10.16 cm column: 0.953 cm ceramic Raschig rings
Air -0.93 M HCI + CuCi system; U OG = 15 cm/sec
/::,. 20.32 cm column: 2.54 cm ceramic Raschig rings
Air -0.93 M HCI + 3.0 M NaCI + CuCI system; U OG = 18.8 cm/sec (with T.C.P.)
. 20.32 cm column: 2.54 cm P.v.c. Raschig rings
Air-O.96 M HCI + 3.0 M NaCI + CuCI system; V OG = 9 4 cm/sec
Figure 8-7 Effect of length.to-diameter ratio of the column on the liquId-side mass-transfer coefficIent
(from data tifSahay alld Shamw 42 )
DYNAMICS OF COUNTERCURRENT-FLOW FlXED-RiiD COLUMN 295
N 2 . The measurements were carried out in a 1 0.16-cm-i.d. column. Several packings
(0.635-, 0.953-, and 1.27-cm Raschig rings, and two packing heights (91.44 and
152.4 cm) were examined. The true volumetric mass-transfer coefficient KLaL,
which takes into account the dispersion effect in the column, was essentially
unaffected hy the gas rate for the packing si7es of 1.27 and 0.953 cm. For the
smaller packing of 0.635 cm, KLaL increased with the gas rate. This was attributed
to the greater interstitial turbulence that is created hy the gas flow when it passes
through and around the smaller size packing. Similar behavior was obtained for
the apparent (based on plug-flow assumption) volumetric mass-transfer coefficient
KLaL. The data were correlated by the following relations.
Case I Plug flow ft!r boclz gas and liquid phases
Packing size and height
0.635-cm Raschig rings, 91.44 cm
0.953-cm Raschig rings, 91.44 cm
l.27-cm Raschig rings, 91.44 em
0.953-cm Raschig rings, 91.44 cm
Correlation
KtaL = OJ)OO33GP 8 Gg. 93
Ki.aL = 0.01 65Gr. 91
KtaL = 0.OO84G .91
KtaL = 0.OOO33Gt 6
Case II Li{Juid phase - plug flow, gas phase hackmixed
Correlation
Packing siLe and height
0.635-cm Raschig rings, 91.44 cm
O.953-cm Raschig rings, 91.44 cm
1.27-cm Raschig rings, 91.44 cm
0.953-cm Raschig rings, 152.4 cm
KLaL = 0.OOO25Gl.. 25 Gg. 8
K LaL = 0.011 G .96
K LOL = 0.GI15G .94
K LaL = 0.OO036Gl.. 6
(8-27)
(8-28)
(8-29)
(8-30)
(8- 31)
(8-32)
(8-33)
(8-34)
The above correlations hold for the ranges 1,398.84 :::;; G L :::;; 2,773.27 g h - 1 cm - 2
and 2.44 < GG < 3.61 g h- 1 cm- z .
The mass-transfer coefficients ohtained from the ahove correlations agreed
very well with those of Brittan and Woodburn 3 at high liquid rates, but were
lower by approximately 25 percent at lower liquid rates. The mass-transfer
coefficients decreased with increasing packing size. With 0.953-cm packing, the
I 52 A-em column gave lower mass-transfer coefficients than the 91.44-cm column.
Furthermore, with the I 52A-em column, the mass-transfer coefficients were low
at low liquid flow rates but increased rapidly as the liquid flow increased. ThIs
was believed to be due to the poor contact between the liquid and gas at low
liquid rates; greater channeling at the greater packing height was responsible for
this behavior.
Most recently, Klykov et aL 26 measured the interfacial contact area in a
column packed with netted packing. The experimental study for the absorption
.296 GAS-LIQUID-SOLID REACTOR DESIGN
of CO 2 from its mixture with air by NaOH solutions in a column with netted
packing (crimped metallic ribbons threaded with fibers) showed this packing to
have between 2 and 5 times as much interfacial surface area as that of Raschig
rings of various sizes (see Fig. 8-8). In the range of gas velocities from 0.3 through
0.7 m s 1, the data for the interfacial contact area were correlated to the liquid
flow rate by the relations .
ar. = 62.02(5.65G .5 - Gd
(8-35)
for packing with a density of 300 kg m - 3,
ar. = 40.52(6.42G .5 - Gd
(8-36)
for packing with a density of 350 kg m - 3, and
ar. = 47.63(6.02G?5 - Gd
(8-37)
for packing with a density of 400 kg m - 3. Here, Or. is In m 2 m 3 and Gr. is in
kg m - 2 S - 1.
Goto et al. 20 showed that the countercurrent operation gives better kr.OL than
the cocurrent downftow operation. They indicated that this may be due to greater
soo
a/-+-- --t')7'-'\
400 I -
Y'
'"'"' 300
<"
I 2,3
E
N +__JL,. -
5 200
,;- r 9 -- 4
100 ) = 5
0
2 4 6 8 10 12 14 16
G L (kg m- 2 s-t)
) -.netted packing with a density of p 300 kg/m 3 ;
2 Raschig rings with dimensions of to x IOx!.5 mm;
...., X,.,. gas vcJocity of 0.29, 0.38, 0.49 and 0.58 m/sec, respectively;
3,4, 5--Raschig rings with sizes of 13, 25 and 38 mm, respectively (55)
Figure 8-8 Interfacial contact area as a function of the welling density.
DYNAMICS OF COL'N'IERCURRENT-FLOW FIXED-BED COLUMN 297
turbulence in the gas phase in countercurrent operation compared to cocurrent-
downflow operation at the same flow rates.
Recommendarions All the literature data are restricted to conventional absorption
tower packings for reasons discussed earlier. For these packings, the recom-
mendations of Charpentier 6 for the estimations of kLo L and OL are reasonable.
Future work on this subject should consider the packings used in gas liquid -solid
catalytic reactors.
8-7 LIQUID-SOLID ASS TRANSFER
Since countercurrent-flow operation is largely used for absorption and gas liquid
reaction processes, no information on liquid-solid mass transfer appears to have
been published.
8-8 HEAT TRANSFER
No information on heal transfer during countercurrent flow operation appears to
have been published
ILLUSTRATION 8-1
...------'
Using the same data given in Illustration 7-2, calculate the following for a
countercurrent-flow fixed-bed column:
1. The pressure drop per unit length.
2. The gas holdup and dynamic liquid holdup.
3. The Peclet numbers lor gas and liquid phases.
4. The ratio of wetted packing area to total packing area for a countercurrent
flow system.
5. The gas-liquid mass-transfer coefficient.
SOLUTION
VI' = 4j3n(0.3,'2)3,= 0.01413 cm 3 per particle.
N p = 0.52/0.01413 (cm 3 per particle) = 36.8 particles cm - 3.
O. = 36.8(4n(O.3j2)2) = 10.4 cm 2 cm - 3.
298 GAS-LIQUID-SOLID REACTOR DESIGN
1. Pressure drop can be calculated by using Eq. (8-1):
( I1P ) = 8.5(0.01 cP)(IO.4 cm 2 cm - 3)2 X (tOO cm m -1)2 X (1.000 kg m - 2 h -1)
I1Z LG
X (1/3,600h s-l)(O.OI g cm- 1 S-l)
0.06 (g cm- 3 )(1 kg/l,Ooo g)(IOO cm m- 1 )3(1,000 g kg-1)(1 m/100 cm)
(lO.4cm 2 cm- 3 )(100cm m- 1 )(I,Oookg m- 2 h)2(l h/3,6oo sf
+ 0.06 (g cm - 3) {I kg/I,Ooo g)(l00 cm m -I }3(0.48)3
X [ 10.4(100)(0.01)(0.01 )(IOO) J O.1
O,Ooo/3,6(0)( 1 ,Ooo)
= 0.426 + 8.71 = 9.13 N m- 3 .
2. Gas holdup can be calculated from Eq. (8-2):
hoa/ e = 0.9 x 10- 3.43 . 10 4(d,Jd.J']I Re,.,
}
0.3 cm (10,000 kg m -2 h -I) 1,000 (g kg-I)
ReL = d s Gdf-1L = 0.6 cP(O.01 g cm- 1 s-lHi OO cm m- 1 }23,600 (s h -I)
= 13.89.
Therefore,
hOG = 0.48 x 0.9 x 10- 3.43 . 10 - 4(0.3/5)1.JI . 13.89
= 0.432.
The dynamic liquid phase holdup can be calculated from Eq. (8-3):
h dL = 1.259 Re .676 Ga 0.44 (a.d p ).
GaL = d gpUf-1t
(0.3 cm)3(98I cm s - 2)(0.9 g cm - 3f
(0.6 CP)2(0.0 1 g cm 1 s - 1)2
= 595,775.
Therefore,
h dL = 1.259( 13.89)°.676(595,775)- 0.44(0.3HlO.4)
= 0.0669.
3. Peclet number for the gas phase can be calculated from Eqs. (8-6), (8-7), and
(8-9). From Eq. (8-6),
Pea = 2.4 ReG 0.210 .W.013-0.088d,Jd)Re...
Re = (0.3 cm)(0.9 g cm - 3)(0.643 cm S - I)
L (0.6cP)(0.0l gcm- 1 5- 1 CP-l)
= 28.9,
DYNAMICS OF C01JNTERCt..:RRE T -FLOW FIXED-BED COLUMN 299
V G .:... 1,000 (kg m 1 h- I ) X (l h;3,6005) X (1.000 g kg-I)
X (1 m/100 cm)2 X (1/0.48)
= 0.9645 em S-I;
Rea =- d p U G /l G /J1a
= 0.3 x 0.9645 x 0.06/(0.01 x 0.01)
= 173.6.
Hence.
Pea = 2.4( 173.6)-0.210- (0.013- 0.088/0.3 i 5)). 211.9
= 0.512.
From Eq. (8-7)
Pea = 0.0585(a.d p I 2 . 58 Rec;0.6681O-0.00259 ReI..
R _ G _ __ 0.3cm(1,000kg m 2h- I }l, OOO gkg- 1
CG - d. a/J1a - 0.01 cP (0.01 gcm -I S-I cP -1)(IOO cm m -If 3,6oo(s \1- I)
= 83.3,
ReL = 13.89,
thercfore,
PeG = 0.0585(10.4 x (0.3»2.SI!(83.3)-0.6681O-0.001S9' 13.89
= 0.0529.
From Eq. (8-9),
P = 10.4 (cm 2 cm -3) 0.3 (cm) [ 0 665 _ 1.9 x 10⁻⁴(83.3) ]
ea (1 - 0.48) .
x 10-1.13-10- 1 - t3.89
= 0.626.
Equations (8-6) and (8-9) give close answers. whereas Eq. (8-8'1 predicts a value
an order of magnitude lower. The Peclet number for the liquid phase can be
calculated from Eqs. (8-11) and (8-12). From (8-11),
PeL = 19.4(13.89)0.747(595.775) 0.693 x (10.-1-(0.3»1.968
= 0.129.
From Eq. (8-12).
PeL = 7.58 X 10- 3 (13.89)°.703
= 0.048.
\
300 GAS-LIQUID -SOLID REACTOR DESIGN
4. Riltio of wetted packing area to total packing area can be obtained from
Eq. (8-23) as
awful = 1.11(173.6)-0.210-[0.013 -O.088i03!4) 3..P x W' "(0 1 '5)' "] 2K'1
= 0.389.
5. Gas liquid mass-transler coefficient can be obtained from Eq. (8-26) as
kLdp/D = 25.l(dpGI.'Jldo.45 SC .5.
0.6 x 10 2
SCL - J I I p D - . .- .
- L, I. -0.9xlO-3(feh-1)x(30.48cmft 1)2x(lh/3,600s)
= 25.833.
Therefore,
k L = 10 3 (ft2 h _ )(3 4 cm ft- 1) 2 (l h/3 ,600 s x 25.1(13.89)045(25.833)0.5
0.3
= 0.358 cm S-I
NO:\tIENCLATURE
£lL
a.
a.
a,
a w
d
A
A'.A,A'
B
B'.RB'
c
C
d,
d p
de
D
D',D'
Er
£z
{J
lh
G
Ga
gas-liquid interfacial area for mass transfer
specific surface area of the packing per unit column volume
specific surface area of the packing per unit bed volume
total surface area
wetted surface
constant for various packings
packing characterization parameter
constants
packing characterization parameter
constants
solids fraction
packing characterization parameter
characteristic packing length
packing diameter
column diameter
molecular diffusivity
constants
radial dispersion coefficient
axial dispersion coefficient
acceleration of gravity
gra vitational constant
superficial mass ....elocity
Galileo number (d /p21112)
' i
.
h
110
IIG
J D
k
kG
k,.
K,.Q,.
Kra,
."vI
,"'1m
n
p
P DM
Pe
Per
Q
Re
Rp
s
Sc
S'
U
Vb
V r
U o
Z
Greek symbols
(i
f3
E
E'
\'
p
Jj
DYNA.MICS OF CUUNTERCURRENT-FLOW FlXED-BED COLUMN 301
total holdup based on void volume
total liquid holdup per unit volumc of column
gas holdup at zero liquid velocity
mass transfer parameter
effective deadspace volume per unit volume of column
gas-film mass-transfer coefficient
liquid-film mass-transfer coefficient
volumetric gas-liquid mass-transfer coefficient
apparent volumetric gas- liquid mass-transfer coefficient
mass flow rate
mean molecular weight
packmg characterization parameter
pressure
log I)1ean partial pressure
Pedet numher (UdpIEz)
radial Peclet number under trickle-now conditions
fI()w rate
Reynolds number (dpU pip)
hydraulic radius of the packing
packing characterization paramctcr
Schmidt number (\'/D)
particle shape factor
interstitial or actual velocity
bubble velocity
film velocity
superficial velocity
column length
packing characterization parameter
angle 10 the vertical for inclined surfaces
void fraction
modified void fraction
kinematic viscosity
density
viscosity
Subscripts
G gas phase
L liquid phase
LG mixed-phase flow condition
\
302 GAS-LIQUID-SOLID REACTOR DESIGN
REFERENCES
I. Anderson, K. L., O. M. Stokke. and R. E. Gilbert,l&EC Fund., vol. 5, no. 3, p. 430,1966.
2. Bennett, A., and F. Goodridge, Trans. Insc. Chem. EnO., vol 48, p T232, 1970.
3. Brittan, M. J., and E. T. Woodburn, AIChE J., vol. 12, p. 541,1966.
4. Buchanan, J. E.,I&EC Fund., vol. 6, p. 400,1967.
5. Carleton, A. L R. J. Flain. J. Rennie, and F. H. H. Valentine, ('hem. £ng. Sci., vol. 22. p. 1839,
1967.
6. Charpentier, J. C, Ch""l. F.JJg. J., vol. 11, p. 161, 1976.
7. Chen, B. H., Chern. Eng., p. 109,1962.
8. Chen, B. H., Can J. Chem. Eng., vol. 53, p. 225, 1973.
9. Chen, B. H..I&EC Process Design Del).. vol. 15. no. I, p. 20,1976.
19- Co. Pham, and R. Bibaud, Can J. Chem. £n(.l., vol. 19, p. 727, 1971.
Danckwerts. P. V.. Gas-Liquid ReacCions, McGraw-Hili Book Co., New York, 1970.
12. Davidson. J. F.. Trans.lnsc. Chon. £n(.l.. vol. 37, p. 131. 1959.
13. DeMaria, F., and R. R. White, AICh£ J., vol. 6. p. 473, 1960.
]4. De Waal. K J A., and A. C Van Mameren, in Proceedings o{SVmposium on Transport Phenomentl,
Institute of Chemical Engineers, London, 1965, p. 65.
15. Dil'man, V. V.. Yu V. Aksel'nod, and T. A. Zhilyaeva, J. Appl. Chem. USSR. vol. 4], p. 2347, 1968
]6. Dunn. W. E., T. Vc:rmeulen. C. R. Wilke, and T. T. Ward. University of California Laboratory
Report 10394, 1963; also, I&£C Fund., vol. 16, no. I, p. 116, 1977.
17. Eckert. J. S.. Chem. Eng. Prog., vol. 57, p. 54. 1961.
18. Elgin, J. C, and E. B. Weiss, Ind. Eng. Chern., vol. 31. p. 435, 19.W.
19. Furzer.1. A., and R. W. Michell, AIChE J., vol. 16, p. 380, 1970.
20. Goto, S., J. Levec, and J. M. Smith, I&EC Proce..s Design Detl., vol. 14. no. 4, p. 473.1975.
21- Hofmann, H., ('hern. En(l. Sci.. vol. 14, p. 193. 1961.
22. Hoogendoorn, C J.. and J. Lips, ClJn. J. Chem. Eng., vol. 43, p. 128, 1965.
23. Houston, R. W., and C. A. Walker, IIJd. Eng. Chern.. vol. 42. no. 6, p. 1105, 1950.
24. Hutton, B. E. T.. L. S. Leung, P. C. Brooks, and D. J. Nicklin. Chern. Eng. Sci.. vol. 29, p. 493.
1974.
25. Jesser. B. W., and J. C Elgin, Trans. Arnn. Ins!. En!!., vol. 39, p. 277, 1955.
26. Klykov, M. V., V I. Rogozin, A. G. Svinukhov, and G. M. Penchenkov, Int. Chern. En!!., vol. 17,
no. I, p. 112, ]977.
27. Koen, J., and C. J. Nel. Souch African Chem. Pmc.. vol. I. p. CP93. 1966.
28. Kolar, V., and Z. Braz. Col/. Czech Chern. Cornrnun., vol. 30, p. 2527, 1965.
29. Kramers, H., and G. Alberda. Chern. Eng. Sci., vol. 2, p. 173,1953.
30. Kunugita, E.. T. Otake. and K. Yoshii, Kl1!!l1ku Kogllku, vol. 26, p. 672, 1962.
31. Leva. M.. Tower Packin!!s and Packed Tower DesIgn, U.S. Stoneware Co., Delaware. 1953, pp. 37-50.
32. Lobo, W. E., L. Friend, F. Hashman, and F. A. Zenz, Tran,. Anler. Inst. Chern. EUlj., vol. 41,
p. 693, 1945.
33. Mathur. V. K., and R M. Wellek. Can. J. Cirelli. Eng., vol. 54, p. 90. 1976.
34. McHenry, K. W., and R. H. Wilhelm, AIChE J., vol. 3. p. 83.1957.
35. Michell. R. W., and I. A. Furzer, Chem. Eng. J., vol. 4, p. 53. 1972.
36. Morton. F., P. J. King, and B. Alkinson, Tmt!S.lnst. Chem. Ef1g., vol. 42, p. 149, 1964.
37. Otake, T., and E. Kunugita, KlIgllku Kngaku, vol. 22, p. 144, 1958.
38. Otake, T.. and K. Okada, Kagaku Kogaku, vol. 17, p. 176, 1953.
39. Piret, E. L., C. A. Mann, and T. Wall Jr., hId. Eny. Chem., vol. 32, p. 861, 1940.
40. Polk. E. M.. and W. C. Clements, Vanderbilt Unil). Tech. Rep., no. 10, 1966.
41. Prost, C. and P. LeGoff, Genie. CI1em., vol. 91, p. 6,1964.
42. Sahay. B. N., and M. M. Sharma, Chern. Eny. Sci., vol. 28, p. 2245,1973.
43. Sater, V. E., and O. Levenspiel, I&EC Fund.. vol. 5. p. 86. 1966.
44. Sherwood, T. K., and F. A. L. Holloway, Trans. Amer. InSI. Chern. Eng., vol. 36, pan I. p. 21,
part II, p 39, 1940.
DYNAMICS OF COUNTERCURRENT-FLOW FIXED-BED COLUMN 303
Sherwood. T. K., R. L. Pigford. ilnd C. R. Wilke. M". s Transfer, McGraw-Hili Book Co.. New
. York, 1975.
46. Sherwood, T K., G. II Shipley, and F A. Holloway, Ind. Ell!}. Cilem.. vol. 30. p. 765, 1938
47. ShesLOpaloli. V. V., V V. Kagasov. and L. I. Blyakhman, Inf. Cht'tJI. En!!.. vol. 4. no. I. p. 17, 1964.
48. Shulman, H. L., C. F. Ullrich, and N. Wells, AIChE J.. vol. I, p. 247, 1955.
49. Shulman. H. Land R. G. Robinson, AIChE J.. \'01. 6, p. 469, 1960.
50. Shulman. H. L., C. F. Ullrich. A. Z. Proulx, and J. O. Zimmerman, AIChE J.. vol. I, no. 2, p. 253.
1955.
51. Tao, L. C.. Hydrocarbon Pmc. Petrol. Ref, vol. 42, p. 205, 1963.
52. Wallis. G. B., One-dimensional TwtJ-phast? Flow, McGraw-Hili Book Co., 1'e'" York, 1969. pp.
336-339.
53. Weber, H., Dissertation, Technische Hochschule. Darmstadt, West Germany, 1960.
54. Weber, H. H.. Dissertallon Technische Hochschule, Darmstadt, West Germany, ]961.
55. Woodburn, E. T., AIChf: J., vol. 20. no. 5, p. 1003, 1974.
\
""\
CHAPTER
NINE
DYNAMICS OF THE GAS-LIQUID-SUSPENDED-
SOLID COLUMN
9-1 INTRODUCTION
There are, in general, five types of three-phase slurry reactor studied m rhe
literature:
1. No liquid flow-batch slurry reactor with no agitation;
2. No liquid flow-batch slurry reactor with agitation;
3. Cocurrent gas. liquid-solid upflow reactor (sometimes referred to as a three-
phase fluidized-bed reactor);
4. Countercurrent (liquid, solid down flow, and gas upftow) flow reactor-three-
phase spouted-bed reactor;
5. No liquid flow-batch pulsating reactor.
In this chapter, we review the reported studies on the hydrodynamics, holdups,
and RTD of the various phases (or axial dispersion in various phases), as well as
the mass-transfer (gas-liquid, liquid-solid, and slurry-waIl), and heat-transfer
characteristics of these types of reactors. It should be noted that the three-phase
slurry reactor is presently a subject of considerable research investigation. In some
cases, the work performed in two-phase (either gas-liquid or liquid solid) reactors
is applicable to three-phase reactors; however, this type of extrapolation is kept
to a minimum. Details of the equivalent two-phase reactors are considered to be
outside the scope of this chapter.
304
DYNAMICS OF THE GAS -L.lQUlD-SUSPENDED-SOLID COLUMN 305
9-2 HVIJRODYNAMICS
9-2-1 Bubble Dynamics
Darton and Harrison 10 studied the hydrodynamics of a single gas bubble with
equivalent diameters in the range 5 through 25 mm in water-fluidized beds of
500-pmand I-mmsand particles in a 22.9-cm-diameter column. The rising velocity
of spherical cap bubbles was correlated by a relation
CD = 2.7 + B/(PoVBd e ).
where Cu, the drag coefficient for the bubble, is given as
en - jy(d./uh
(9-1 )
(9-2)
Here, Po is the fluidized-bed density, d. is the equivalent diameter of the bubble
(where the bubble volume = ][d l(ij, J is the gravitational acceleration, and VB is
the relative velocity of the bubble with respect [0 the fluid. The constant B varies
with bed expansion and particle si . VB can be expressed as
V u = U b
(9-3)
or
VB = Vb - UI./h L ,
(9-4)
where V h is the rising bubble velocity, U L is the liquid velocity. and 11, is the
liquid holdup. Equations (9-3) and (9-4) refer to buhble motion relative to the
stationary-solid and rising-liquid phases, respectively. The relationship between
the rising-bubble velocity and the equivalent diameter of a bubble and the one
between the drag coefficient and the Reynolds number obtained by these workers 10
are shown in Figs. 9-1 and 9-2. The fluidized-bed viscosity as a function of gas
and liquid holdups obtained by these and other investigators is illustrated in
Fig. 9-3. A similar study was also reported by Massimilla et al. ;80 however,
significant wall eflects may be present in their results. The characteristics of large,
two-dimensional bubbles have been srudied by Henriksen and Ostergaard. 39,40
Their results 39 in a two-dimensional column 39.5 cm wide and 112 cm high, with
82 and 90 percent aqueous glycerol and methanol and glass beads, with diameter
of 0.2 mm and 1 mm, showed that the bubble velocity was proportional to the
square root of the radius of curvature of the circular cap. The included angle of
the cap increased as the viscosity of the liquid increased.
Large-diameter solid particles in a three-phase fluidized-bed system cause
bubbles to be small, whereas, in a fine particle slurry, the bubbles can become
large. Henriksen and Ostergaard 40 showed that the large bubbles in the latter
case can break as a result of Taylor instability at the root of the bubble. The
wake properties of bubbles in a three-phase fluidized-bed system have been
studied by Rigby and Capes. 115 They showed that bubble wakes in a three-phase
system consist not only of a stable portion carried with the bubbles but also of
vortices shed by the bubbles.
\
306 GAS-UQUID-SOLID REACTOR DESIGN
.
t.
...... ,..
..... .
... .'"
......... ... ..
+
. '.", .\...."', .
CD =2.7---.- o...,,----
100
'"
U
-
I::
OJ
'u
<=
.....
OJ
0
u
bIJ
OJ
Q
10
500 Jlm particles
<> = 0.40 cm s -I
Q = 0.44 em 5- 1
VOL + = 0.54 cm s-l
0 = 0.81 cm s-I
x = 1.07 cm s .1
1 mm particle
.. = 1.62 cm s-I
VOL . = 1.83 em s-I
. = 2.44 cm s-I
I
0.1
2.0
20
0.2
0.4 0.6 I .0
Reynolds number, Rc
4.0 6.0 10
40 60 100
Figure 9-1 The relationship between CD and Re for gas bubbles in water-fluidized beds (after Darlun
lwd H lJrrison 20 ).
The cocurrent gas-liquid-solid fluidized beds considered are those in which
the liquid supports and completely wets the solid. The gas flow thus constitutes
a perturbation of a liquid fluidized bed. Unlike a gas-so:id or a liquid-solid
fluidized bed, a gas-liquid-solid fluidized bed may either contract or expand when
gas bubbles are introduced into the bottom of the bed. Considerable work has
been done on deriving the criteria for the bed contraction and expansion. The
most up-to-date work on this subject is by Epstein. 18 He derived the criterion for
initial contraction and expansion of three-phase fluidized beds. He suggested that
if the quantity
[n/(tl - 1) + k]UodhL - [(1 + k)U OL + kUw/(n - I)]
[n/(n - I)] (U o dl1.J(Uodhl. + U w )
DyNAMICS OF THE GAS UQUID-SUSPENDED-SOLID COLUMN 307
is less than zero, the bed will contract, and if this quantity is greater than zero,
then the bed will expand. Here k = hw/ha, where h", is the holdup of the wake
region, ha and hI. are the gas and liquid holdups, respectively, VOL is the averagc
superficial velocity of the liquid, and V", is the relative velocity between the gas
and the nonwake liquid, i.e., V w = Va - V lw , where Va is the average linear
velocity of gas and VI'" is the average linear velocity of the nonwake liquid. The
parameter " is a function of settling-particle Reynolds number Rei (Re, =
dpV,pdJld and the ratio dp/dc. Here, d p is the particle diameter, VI is the
terminal free-settling velocity of solid particles in the liquid medium, PL and JJ.L
are the density and viscosity of the liquid, respectively, and de is the column
diameter. The parameter n has been defined by an equation of the Richardson-
Zaki 1l3 . 1l4 type:
V 1w h r = ii w V,h7,
(9-5)
where h r is the average liquid holdup in the particulate region and iiw is the wall-
effect factor, which is a function of dp/d c and Re,. This criterion has been
experimentally verified by Epstein and :\Iicks 29 for a variety of airwater-solid
40
20
"'i
'"
E
.&> 10
:;:,
>. 8.0
'"' 6.0
0
dj
:>-
:J)
c: 4.0
'<ii
C2
2.0 VOl
I
1.0
0.1
..
.
..,
I
..,\
..,
..,
+
filracd tap water
unfil tact.! tap water
, .
'I'
.:1
x = 0.40 em S-I
... = 0.44 cm s-I
+ = 0.54 cm s-l
o = 0.81 cm s-I
.. = 1.07 cm s-I
.
., y'f' ...
0.2
0.4 0.6 0.8 l.0
2.0
4.0 6.0 8.011 0.0
Equivalent diametcr of bubble (cm)
Figure 9-2 Rising velocity or single bubbles 111 beds of SOU-pm sand particles Illfter D£lrllln wid
HtlTri,oI1 20 1.
308 GAS lIQtlJI)-SOLlD REACTOR DESIGN
100
--j
{
to
c::;
I
,
I
I
I
I
I
I
I
I
I
,..,
.
o
:>
o 500 pm pa.rticlcs } (20) -,
o I mm partrcles I
t:. micron particles ( 116)
v 990 11m particles (85) l
---- Correlation of Mooncy (85)
0.1
1.0
2.0. 4.0 6.0 10 20
(l-hl)/(h L -he)
40 60 100
Figure 9-3 Fluidized-bed viscosity (ajil'r Darton and HlIrl"ison 20 ).
systems. They suggested that the parameter k can be estimated from the relation
k = 3.5(1 - hs)J,
(9-6)
where hs is the solid holdup in the column.
The structure of wakes behind the gas bubbles affects several aspects (such
as holdup, gas -liquid mass transfer, etc.) of three-phase fluidized-bed behavior.
The magnitude and composition of such wakes are still not known with any
certainty. Wake holdups have been estimated from experimental measurements
of gas and solid holdups. Jt is commonly assumed that the bed can be divided
into rhree regions; a liquid fluidized region, a gas-bubble region, and a bubble-
wake region; and that the bubbles and their wakes travel at the same velocity.
Different investigators have., however, assumed different values of hws; the ratio
of solids holdup in the wake to the solids holdup in the liquid fluidized region.
Different methods have been used to calculate wake holdups from the experimental
DYNAMICS OF T1-1E GA.S-UQUID-SUSPENDED-SOLID COLUMN 309
data and the resulting empirical correlations for the wake holdups are described.
compared, and assessed by E1-Temtamy and Epstein. 27 Based on the assumption
that the wakes occupy the sphere-completing volumes behind spherical-cap
bubbles, they also derived a relationship for hws as
hws = 1- 0.877(U.lU m J 1: 0.101.
(9-7)
where U 1 = VoL/F.o. /;0 is the hed voidage for zero gas flow, i.e., for liquid
fluidization (1;0 = 1 with no solid flow), and V GL is the velocity of gas relative
to liquid. Equation (9-7) correlated a large number of experimental data fairly
well. This equation alleviates the need for assuming hws in the future study of
bubble hydrodynamics in a three-phase fluidized bed.
9-2-2 Minimum Gas Velocity Required for Fluidization
In a three-phase system. the particles form the fluidized phase with the liquid as
the fluidizing medium. The gas passing through the system imparts the requisite
energy to the liquid to keep the particles suspended. The bed is fluidized when
the superficial velocity past the particles is greater than their settling velocity.
Narayanan et al. 88 studied the minimum gas velocity required to suspend panicles
in a stagnant liquid medium. They showed that the critical gas velocity required
to fluidize particles in a low viscosity fluid (liquid viscosity less than approximately
6 cP) is given by the expression
Uce; = 4.3 c e r e- C.IC.U oe
for C < 10
(9-8a)
and
( de ) n -003C
V co = 1.25"2 e . . V oc ;
for C. > 10.
(9-8b)
where de is the column diameter (in inches). C. is the percentage solid concentration
in the liquid (i.e., g solid per g liquid x 100). The coefficient J) = 0.2 for particle
diameters of the order of 100 ,urn and smaller, and n = 0.5 for particle diameters
greater than 200 ,um. U CG is the superficial critical gas velocity. V OG is obtained
from the solutions of the equatIons
U oo --I .1687 ,,/(UooH ;;) = rjJ
for V oe < 6.7 cm S-1
(9-9)
and
V OG + 5.378 ,, ' (U 8d 8 H o ) = rjJ
for 6.7 < U OG < 21.34 cm s -1. (9-10)
where
cJ> = .Jf2g (pp - PIJ[2d p ,3 pL + H.Ho/(pr> + H,pd]}.
Here, y is the gravitational acceleration. Pr> and PL are the particle and liquid
310 GASLlQU!D SOLID REACTOR DESIGN
densities, respectively, d p is the particle diameter, H. = C ./100 and H ° is the sta tic
slurry height in the column.
Imafuku et al. 46 measured the pressure drop caused by the suspended solids
in the liquid In a batch-column (i.e.. no liquid flow) and used these data to obtain
the critical gas velocity needed to suspend all solid particles completely. The value
of the critical gas velocity was found to be independent of the bottom shape of
the column.
Imafuku et al. 46 also studied the required critical gas velocity for the complete
suspension of solids in a three-phase fluidized-bed system. In this case, they found
that the critical gas velocity for complete suspension of solids was dependent
mainly upon the liquid flow near the gas distributor; and, therefore, to obtain a
small critical gas velocity, the shape of the bottom of the column and the position
of the gas distributor may be very important. Kato S4 presented a graphical
correlation for the critical gas velocity required for complete suspension of glass
spheres (diameter range 0.074 through 0.295 mm), magnetite particles (particle
size from 0.038 through 0.175 mm), and sand particles (particle size 0.147 through
0.295 mm).
Just as the critical gas velocity is required to suspend the particles in a three-
phase fluidization in an agitated reactor, some minimum agitation intensity is
required to keep the particles in suspension. Calderbank II has described the
methods of estimating this minimum agitation intensity. For an agitated liquid-
solid slurry vessel, the correlation of Zweitering 150 for the calculation of the
minimum impeller speed which completely suspends the particles, namely
SV .l d .2(gl1p/ pL)0.45( C.)O.13
N=-- -dP.s5
(9-1 J )
is widely used. In this equation, N is the impeller speed (in rev s -1). d j is the
impeller diameter. C. is the percentage by weight of solids, I1p is the density
difference between liquid and solid, 9 is the gravitational acceleration, VL is the
kinematic viscosity of the liquid. and s is a constant depending on the nature of
the stirrer, baffles, etc. The general form of this equation is in good agreement
wIth that proposed by others 13,60,91,1 07 and has been found to predict the critical
speed for the complete suspension of solids with reasonable accuracy for a wide
variety of conditions. 91
Roy et a1. 118 defined the critical holdup hcs as the maximum quantity of solids
that can be held in suspension in an agitated liquid. They presented the following
correlations for hcs. namely
hcs = 6.84 x 10 4 Rea NbO.23(U,O/Vb)-0.t8y'-3.0CuL
for ReG < 600 and
hcs = 0.1072 Reg. 2 Nb"°.23(U. O /V b )-O.lBy'-3.0C"L (9-13)
for Rea> 600. Here, hcs is the weight of solids/the weight of suspension. Rea is
the superficial gas Reynolds number based on an empty cross-section of column.
V,o is the Stokes free-settling velocity, Vb is the bubble velocity, N b is the bubble
(9-12)
DYNAMICS OF THE GAS -LlQUID-SUSrENDED-SOLID COLUMN 31 I
flow number, i.e., the ratio between the bubble Reynolds number (dt>U h pJ./IlL,
where db is the diameter of bubble) and the bubble Weber number aL/(Uhlld
(where aL and IL are the liquid surface tension and viscosity. respectively): }" is
the relative wettability factor for the solids with respect to quartz (i.e., Y./'Yquartz,
where Ys is the wettability factor for the solids). y. is related to the contact angle
between the solid and the liquid by the expression Y. = I + cos 8. Finally. C "L is
the viscosity correction factor related to viscosity by the relation
C "I. = I - 0.5892 10glo ilL -r O.l02610gio IL,
where ilL is in centipoises.
(9-14)
9-2-3 Pressure Drop
The most recent work on the measurements of pressure drop in a three-phase
fluidized-bed column is by Javdani et al. 48 They measured the pressure drop in
the flow of a nitrogen-B1andol oil-coal slurry in an 0.7-cm-i.d. tube. Three coal
concentrations (of 11. 20.4, and 27.1 weight percent) were examined. The data
showed that the pressure drop increases with the gas velocity and the coal
concentration in the slurry.
9-2-4 Three-phase Fluidization with Countercurrent Flow
A countercurrent (liquid flow down, gas flow up) three-phase fluidized bed can
be operated in two ways: (a) fluidization without flooding; and (b) fluidization
due to incipient flooding. The mode of operation depends mainly on the packing
density and, to a lesser extent. on the packing size. the liquid flow rate, and the
physical properties of the liquid. For low packing densities, fluidization could
occur without flooding. For high packing densities, fluidization would occur due
to incipient flooding. O'Neil et al. 95 have studied the hydrodynamics of these two
modes of operation. They have derived the equations for predicting the transition
from one mode of operation to another, and for predicting the maximum packing
density for the second mode of operation.
The minimum fluidization velocity required for the first mode of operation
is given by Chen and Douglas. t5 This velocit ' depends strongly on the packing
density. In the second mode of operation, the minimum fluidization velocity would
be close to that required for incipient flooding. and is essentially independent of
the packing density.36 The second mode of operation is particularly desirable
when high interfacial mass-transfer rates are needed. This mode of operation
follows the well-known Lobo correlation 76 for predicting flooding flow rates.
The first mode of operation described above possesses certain shortcomings.
There is a tendency towards channeling and backmixing of liquid which makes
true countercurrent operation impossible. Good design can minimize these
channeling problems. 5 ,36.95 An alternative to this mode of operation is a three-
phase spouted-bed column. The hydrodynamics (i.e., pressure drop, bed expansion,
and the liquid holdup) of this type of column have been studied by Vukovic et
312 GAS-UQUID -SOl.1O REACTOR DESIGN
Liquid flow rate
Curve (g cm- 2 S-I)
I 0 4
2 0.188
100 3 0.563 3
6 4 0.938 2
'"
:I: 1
E
oS
f.:)
.....
<1 50
o
o SO 100 150 200
Gas flow rate (m 3 hI)
Figure 9-4 Pressure drop versus flow rate curves ror a three-phase spouted. bed column ({If'ter dllta
(rom Vukot,j,. elll/.'4').
al.,141 and are shown to be very similar to the first mode of operation. Typical
pressure drop flow rate curves obtained by Vukovic et al.,141 are shown in Fig.
9-4. At hIgh gas flow rates, where the pressure drop increases with gas flow rates,
high interfacial mass-transfer rates are expected.
The three-phase fluidized-bed reactor with countercurrent mode of operation
was used by Pruden and Weber 1 10 to study the hydrogenation of /:i-methyl styrene
to cumene in the presence of palladium black catalysts. They used low gas
velocities so that the gas was dispersed as bubbles in the slurry. They showed
that the countercurrent mode of operation was better than the slurry operation
(with no liquid flow), due to improved catalyst usage and improved gas holdup
characteristics.
Ne(:ommendations for future K'ork Either an empirical or a theoretical correlation
for the pressure drop in a three-phase fluidized bed is needed. More experimental
data for the pressure drop are needed with hydrocarbon systems. Equations (9-8a)
and (9-8b) need to be tested against the experimental data with hydrocarbon
systems.
9-3 GAS, LIQUID, AND SOLID HOLDUPS
A th ee-phase slurry reactor is characterized by the holdup of the three phases,
satisfying the equation
ha + h L + hs = I,
(9-15 )
where ha, hb and hs are the gas, liquid, and solid holdups (i.e., volume of gas/total
DYNAMICS OF THE GAS-LIQUID-SUSPE:-JDED-SOLID COLUMN 313
volume of the reactor, etc.) in the reactor. The average solids holdup is easily
determined from bed-expansion measurements. The separate holdup ofthe gaseous
phase and the liquid phase may be determined from pressure-drop measurements
or from measurements of the mean residence time of the fluid phases. In a batch
system (i.e., no liquid flow), the displacement method is often used to measure the
gas holdup. Farley and RayJl have described the measurement of the absorption
of gamma radiation for the determination of the gas holdup in a slurry reactor
for Fischer- Tropsch synthesis.
A review of earlier studies on gas, liquid, and solid holdups in a three-phase
slurry reactor is given by Ostergaard. 97 Kato 54 studied the effects of gas velocity,
particle size, the amount of solids and liquid in the bed, and the density of the
solids on the gas holdup. The gas holdup [defined as volume of gas/(volume of
gas T volume of liquid)] decreased with increasing particle size and amount of
solids in the bed, and with the decreasing nominal gas velocity.
The earlier studies of Turner, 1]6 Ostergaard, I 00 Stewart and Davidson, 1]0
Adlington and Thompson,1 and Ostergaard and Theisen 106 showed that the total
holdup of gas and liquid increased with increasing gas velocity. However, as
indicated in the previous section, the beds may contract with increasing gas
velocity. The reduction in bed expansion caused by gas injection resulted in a
significant reduction in the liquid holdup, which increased with increasing bed
expansion and decreased with increasing particle size. The explanation for this
unique three-phase fluidized-bed phenomenon is given by Stewart and
Davidson,' 30 Ostergaard. K and Ostergaard and Theisen,106 among others
mentioned earlier.
Schiigerl l23 reportcd that the presence of a small amount ofO.25-mm particles
in gas-liquid systems reduced the gas holdup. Sherrard 127 obtained the gas holdup
in gas liquid fluidized beds by measuring x-ray transmission above the bed
surface. He observed that in beds of large or heavy particles (beds of 1.6-mm
glass ballotini, 6-mm acrylic spheres and 12- through 14-mesh lead shot), the gas
holdup decreased with increasing superficial liquid velocity; whereas in beds of
small or light particles (beds of 12- through 14-mesh glass ballotini, 36- through
44-mesh glass ballotinil. the gas holdup remained essentially independent of liquid
velocity.
Ostergaard and Michelsen I 04 measured the gas holdup in beds of 0.25-, 1-,
and 6-mm glass particles using a radioactive tracer technique. They found that
h G <X UBG, where U OG is the superficial gas velocity, and n took values of 0.88,
0.78, and 0.93, respectively, for three particle sizes. The solid-free bubble-column
gave n = 1.05. They also found that, in the solid-free system and in beds of 6-mm
particles, the gas holdup decreased with increasing liquid flow rate; whereas in
beds of 0.25- and I-mm particles, the gas holdup increased with increasing liquid
flow rate.
Michelsen and Ostergaard 81 extended the study of Ostergaard and Michel-
sen 104 to a wider range of flow rates and other system conditions. The data were
obtained in a 15.2-cm-i.d. and Il-m-tall concurrent-upflow air-water solid system.
The RTD of both the gas and liquid phases were measured by a radioactive tracer
3J4 GAS LIQUID "OLID REACTOR DESIGN
'"
.:;:
VOL = 10 em s-l
VOL. '" 14 cm s-I
VOl. = 20 em s-I
20
30
VOG(cm s-l)
(a)
0.4
VOl = 6.6 em s-I
VOL = 8.4 em s-I
VOL = II cm s-I
0.3
'"
0.2
0.1 , I I
0 5 10 15
U OG (em s-I )
(b)
DYNAMICS OF THE GA - LlQU(I)-SUSPENDED-SOLlD COLUMN 315
0.4
VOl = 3.0 cm 5- 1
VOL = 4.2 em s 1
VOl = 5.4 cm 5- 1
0.3
VOL = 6.6 em 5- 1
VOl - 7.8 Cm 5- 1
0.1
o
5
10
15
V()(;(cm S-I)
(c)
Fi ure 9-5 Average solids holdup (1I) ror 6-mm particles. (hI for 3-mm particles, (e) for I-mm particles
(ajrer dlJwfrmn Afichelsen £md OsteryaardH 2 1.
technique. Bromine-82 (ammonium bromide solution) and argon-41 were used as
the liquid and gas tracers, respectively. The results for gas, liquid, and solid
holdups obtained by these investigators are described in Figs. 9-5 through 9-7.
The results show that, while the liquid holdup decreases with increasing gas
velocity and decreasing liquid velocity for all size particles, both gas and solid
holdups show different behavior with different particle size. The gas holdup data
were explained on the basis of bubble coalescence in beds of small particles and
the breakage of large bubbles in beds of large particles. The unusual effect of gas
velocity on the solids holdup with different particle sizes was explained on the
basis of possible expansion and contraction of the beds under different conditions.
Adlington and Thompson 1 reported that the presence of solids had little
influence on gas holdup below nominal gas velocities of about 1.5 cm s -1. At
higher gas velocities, the gas holdup was decreased by the solids but was relatively
independent of the solids particle size. Viswanathan et al. 140 found that, in an
air-water system, the gas holdup in beds of small particles (0.649-, or O.928-mm
glass beads) was lower than in a solid-free system, whereas the gas holdup in beds
of large particles (4-mm glass beads) was higher than in a solid-free system.
316 GAS-LIQUID SOLID REACTOR DESIGN
O.R
VOL = 26 cm s-l
0.7
VOL = 20 cm -I
,..J
..t:
0.6
0.5
VOl. = 14 em 5- 1
VOL = 10 em 5- 1
0.4
o
5
10
V oc (cm s-l)
15
(a)
Figure 9-6 Liquid holdup in a three-phase fluidized bed for (a) 6-mm particles. Ib) 3-mm particles,
(c) I-mm particles (after data (rom Michelsen and Ostergaard 82 ).
Ostergaard 97 found that for very small sand particles, i.e., 40 through 60 and 60
through 80 mesh, the gas (nitrogen) holdup was independent of particle size and
liquid (water) velocity, but increased linearly with nominal gas velocity. The gas
holdup in the gas liquid (solids-free) system was higher than that in a gas-liquid
fluidized bed.
Imafuku et al. 46 measured the gas holdup in a batch (i.e., no liquid flow)
three-phase fluidized-bed column. They found that the presence of solids caused
significant coalescence of bubbles. They correlated the gas holdup with the slip
velocity between the gas and liquid. They found that the gas holdup does not
depend upon the type of gas distributor or the shape of the bottom of the column
when solid particles are completely suspended. Kato et al. 53 found that the gas
holdup in an air water -glass sphere system was somewhat less than that of the
air-water system; and that the larger solid particles showed a somewhat smaller
"---. .-
/
DVNAMICS OF THE GAS-LIQUID-SUSPENDED-SOLID COLUMN 317..-
0.8
VOL = 16cms- 1
0.7
..J
..s::
0.6
0.5
0.4
o
5
10
VOG(cms- l )
0.8
0.7
..J
"'"
0.0
0.5
0.4
o
5
10
Uoc; (em s-l)
U OL = 14 cm s-l
VOL = 8.4 cm s I
U OL = 6.6 cm s-1
(h)
15
VOl = 7.8 em S-I
VOL = 6.6 em s-I
U OL =- 5.4 cm s-I
VOL = 3.0 cm s-I
(d
15
318 GAS-LIQUID-SOLID REACTOR DESIGN
0.3
VOL = 14 cm s-l
0.2
L1
.:;;:
O.!
o
5
10
15
VOl; (cm s-I)
la)
Figure 9-7 Average gas holdup for (a) 6-mm particles, (b) 3-mm particles, (c') I-mm particks (after
daw {rom Michelsen and OSleryaard 82 \.
gas holdup. Based on visual observations. they suggested thai this is caused by
the larger rising velocity of coalesced bubbles in the presence of solid particles.
In the region of high gas velocity, the effect of the concentration of solid particles
on the gas holdup became gradually smaller as the gas velocity increased.
Kim et al. 56 studied the effects of air and water velocity and particle size
ranging from 2.6 through 6.0 mm on the gas and liquid holdups in a two-
dimensional column. Based on their data, they reported the following dimension-
less correlations for the liquid and gas holdups:
(hduC(;= ° - (hd = 0.0025 (Fr L ps/pdo. t4-9 (Frc; Ps/pdO. 161 (Re I ReG)O.259
(a' = 0.018),
(9-16)
where ReG = d p U oG PG/!1a, ReL = dpUOLPLh1L, FrG = ufjc;/dpg, FrL = Ulddpg,
Ps and PL are the densities of the solid and liquid phases. respectively, d p is the
particle diameter, Uoc; and UOL are the superficial gas and liquid velocities.
respectively, 9 is the gravitational acceleration, and IG and IL are the viscosities
ofthe gas and liquid phases, respectively. ReG and FrG are the Reynolds number
and Froude numbers for the gas phase, and ReL and FrL are the Reynolds number
and Froude number for the liquid phase, respectively. a' is the standard error
DYJ'o.:AMICS OF THE GAS.-L1QUID -SUSPENDED-SOL.lD COLUMN 319
r
_ -VOL = 6 cm s-l,
/ - no solids
/'
./
./
/'
/
/
/
I
I
I
I
I
I
I
I
0.1
"
.:;;:
0.05
o
Vex;(cm s I)
(b)
0.1
0.05
o
5
10
Vex; (cm s-l)
(e)
VOL = 7 R cm S-I
VOl. = 4.2 em s-l
15
320 GAS LIQUID SOLID REACTOR DESIGN
......x-\
',.I
of the estimate. The liquid holdup h L at U OG = 0 is calculated from the relation
(hduoG=o = 0.409 (FrLPS/pdo. 193 (Redo.0 74 (a' = om I). (9-17)
The gas holdup is obtained from
h G = 1 h L = 1 - (Wsps/HA)
(a' = Om8),
(9-1 g)
where W s is the total weight of solids in the bed, ps is the solid density, A is the
column cross-sectional area, and H is the expanded bed height obtained from
the relations:
(H/H o ) - (H/Ho)uOG=o = 0.0026 (FrL Ps/pdO. 178 (FrG ps/pa)0.345 (ReL Rea)o.252
(a' = 0.051),
(9-19)
where
(H/Ho)vOG=o = 1.80 (FrL ps/pd. 202 (Red-o.0 12 (a' = 0.052). (9-20)
Here, H ° is the unfluidized bed height.
In a subsequent report, Kim et al. 58 extended their study to cover a wide
range of liquid viscosities (l through 70 cP) and surface tensions (40 through 73
dynes cm 1). Solutions of sugar, aqueous carboxymethyl cellulose of various
concentrations, and acetone-water mixtures were investigated with particle sizes
ranging from 1 through 6 mm. The effect of liquid properties on the liquid holdl!p
and total gas plus liquid holdup were correlated in terms of the dimensionless
Weber number, WedWeL = Uoav'/fh, where aL is the liquid surface tension, v' is
the generalized viscosity constant; fhK8 o- I, where no is the fluid behavior index
and K is the fluid consistency number). For beds which initially expand on the
introduction of gas, they presented the following relation
(h L t ha> = 1.4 (Frdo. '7 (WedO.0 78
(a' = 0.04)
(9-21)
and for beds which initially contract on introducing gas
(h L + h G ) = 1.301 (Frdo. t2H (WedO.0 73 e,O.031(lf.",V...;lh;J (a' = 0.035),
where
(9-22)
h = 1.353 (Fr do. 206 (Re..) - 0. 1 0
(a' = 0.038).
(9-23)
h'L is the liquid holdup in the corresponding liquid-solid fluidized bed. The data
indicated that the bed porosity (i.e., ha + hd increased with the liquid viscosity
for all particle sizes, and the effect of surface tension of the liquid on the bed
porosity depended on the particle size. For 2.6-mm gravel and 6-mm glass beads,
the bed porosity remained essentially independent of surface tension. For I-mm
glass beads, the bed porosity somewhat decreased with an increase in surface
tension. Some typical results illustrating these effects are shown in Fig. 9-8(a) and
(b).
The liquid-phase holdup data in the three-phase systems were correlated in
terms of Froude, Reynolds, and Weber numbers as
h L = 1.504 (Frd. 234 (FrG) -0.086 (Red-o.082 (WedO.0 92 . (9-24)
DYNAMICS OF THE GAS-UQum SUSPioNUED-SOLJD COLUMN 321 P\j
The'data indicated that the liquid holdup increased with liquid viscosity for all
particle sizes, whereas the dependence of h L on the surface tension of the liquid
depended upon both the size and nature of the solid particles. Somc typical results
illustrating these effects are shown in Fig. 9-9(a) and (b). More recently, Javdani
.
0.8 f./
0.7i
I-mm glass beads,
VOL = 5.40 cm s-I
0.7
o
o o i
0.6 / a 2.6-m_m glass bea f'
.... o VOL - 5.40 cm s
o
OJ
0.6 _ -.--_;c{iJ?1
.....................i.......
.---- --.........-::y
0.5 " -"0......... 6-mm glass beads,
I ...--0 ........... VOl. = 5.40 cm S-1
...--.
0.4 I I I I I
2 5 10 20 50 100
Liquid viscosity (cP)
(a)
U OG (cm S-I )
0 0.70
. 1.41
h 2.82
0 5.64
. 10.9
. 16.1
Figure 9-8 Effect of liquid viSCOSity (al and surface tension (b) on bed porosity in Ihree-phase bed
(l!/ier datil (mm Kim et "I. S ").
322 GAS I.IQUID-SOLID REACTOR DESIGN
0.8 0___
o ----.:.g__o _
--0
.
0___
0__0_0
0-0
0.6
o !-mm glass beads,
o VOL = 7.69 cm s 1
o !-mm g1ass beads,
[) VOL = 5.40 cm s-l
0.6 0 0-0 o 2.6-mm glass beads,
a . . . . U Ol = 7.69 em s-l
+
..., 0.5
-<: D 2.6-mm glass bt:ads.
0.5 [] 0 0
. . . . U OL = 5.40 cm s I
0.4
0.6
0.5
0_0_0 -
. - .-.
0.5
o
--0-0
.
.-.
0.4
40
so
60
o 6-mm glass beads,
VOL = 7.69 cm s-l
- .
- 0 6-mm glass beads,
. VOl. = 5.40 cm s-l
I I I
70 80 90
Surface tension (dyne em I)
V OG (cm s-I )
o 0.70
. 1.40
o 5.64
(b)
et aJ.48 measured the liquid holdup in a nitrogen-Blandol oil -coal system. The
liquid holdup was found to increase with. the coal concentration. They attributed
this increase entirely to the increase in viscosity at higher coal concentrations.
For beds of I-mm glass beads and 6-mm glass beads with low-viscosity
solutions. Michelsen and Ostergaard's correlation 83 generally predicted a higher
value of h L than those predicted by the above correlation [Eq. (9-24)j. On the
other hand. a reverse trend was observed for beds of 6-mm glass beads with high-
viscosity solution. The correlation of Razumov et al. 1l2 predicted somewhat lower
liquid holdups than those predicted by the above relation. Another dimensionless
correlation for the liquid holdup was presented by Dakshinamurthy et aJ. 18 ,1'}
Contrary to other investigators' observations, the expression suggested by these
workers. however, predicted a uniform bed expansion with increasing gas flow
rate.
IW:\!AMICS OF HiE GAS-LlQUJl)-St:SPF J)ED-SOLID COLUfI.!N 323
Three-phase columns are often operated with an essentially nonflooding
packing consisting of spheres of low density and large diameter placed between
retaining grids sufficiently far apart to permit mrbulent and random motion of
the packing. This type of turbulent-bed contractor possesses high capacity, high
OJ!
o
I-mm glass beads, __0- _
VOL = 5.40 cm s-I _0 ----=--::::,.
o _I :....- _
o - -'"0 .........
0.6 ::::::=::::-_-
o
O.4r ,.,.mm'""",. 4 .=6 = ' J
0.6\ UOl=5.40 r1- -
0_4
.::f 08 I I I
. 2 4 6 10 . 20
6-m", g)= be"';, .
0.6 VOL -7.69 cm
/-
-/-7'
-----::;::::..-/;
-- --;, /
0-
0.4 ",,--""
5
so
100
Liquid viscosity (cP)
U OG (em S-I)
o 0.70
- 1.41
_ 2.82
o 5.64
o 11.0
"" 16.1
(a)
Figure 9-9 Effect of liquid viscosil} lal and surface tension (hI on II, in three-phase beds (aJter d<ll<l
from Kiln et <II. sa).
324 GAS-LiQUID-SOUD REACTOR DESIGN
, \
'''-./
0.5
0.3
"I' "I'
I-mm glass beads, VOL = 3.81 cm s-I
-----------------------------------
"I'
"I'
--I
J
0.7
I
.
.
.
.
"I' .. .. ..
0.4 J-mm glass beads, VOL = S.40 cm S-I
O.S
.... 0.2
"'"
0.5
0.3
0.4
- .
___. - - 0
__ __ 0 -
::;:::::..-- 2.6-mm gravel, VOL = 3.81 cm s-I
.
___ . - - 0 -
. 0 -
0---- -I
2.6-mm gravel, VOL = 7.68 em s
.
o
.
.
.
.
0.2
"I'
.. "I' ..
6-mm glass beads, VOL = 3.81 em s-t
0.5
.
.
..
.
- .-----..
.. ass beads,
VOL = 7.68 em s-I
60 70 80
0.2
"1'-
Surface tension, (dyne cm -I)
V OG (em S-I)
. 1.41
o 5.64
.. 16.1
(b)
efficiency, and more nonclogging characteristics compared to the conventional
absorber. The liquid holdups in the turbulent bed contactor have been investigated
by several investigators. I 5,59,66.131 ,145 The most recent of these studies is by Kito
et al.,59 who employed a batch (i.e., no liquid flow) system. The test section of
the column was either 5 cm or 10 cm in diameter and 150 cm high. A sieve plate
and a perforated plate with free open areas of 31.51 percent and 1.27 percent,
respectively, were investigated. The spherical particles used had effective densities
of 1 and 0.59 g cm 3 and diameters of 1.1, 2.65, and 2.87 cm. The superficial gas
velocity was varied from 5 through 400 cm S-I. Liquids used were ethanol,
/--
)"
./,
DYNAMICS OF THE GAS-LIQUID SUSPENDED-SOLID COLUMN 325
methanol, water, and 25. 45, 65, and 80 weight percent glycerol solutions. These
liquids gave the propeny ranges of 0.79 g cm 3 < PL < 1.211 g cm- 3,22.3 dyne
cm -( < O"L < 72.8 dyne cm 1, and 0.58 cP < JJ.L < 62 cPo All experiments were
carried out at room temperature. The data for the gas holdup were correlated by
a relation
h G 05 W ) 0.11. I O.22
[h G (1 _ hd 2 r .« = . (eL ("i r£.J .
(9-25)
where h G is the gas holdup based on the total column volume, Wet is the Weber
number = deUf,GPdO". (where de is the column diameter), U OG is the superficial
gas velocity, PL and O"L are the density and surface tension of the liquid, respec-
tively, FrG is the Froude number - UJG/gd e (where 9 is the gravitational
acceleralion). The above equation is valid for 2.0 < WeL J(Fro) < 4.8 x 10 4 . The
data of Kito et aL 59 showed that the gas holdup is independent of the ratio
dc/d p . In the fully fluidized mobile bed, the free open area of the supporting grid,
the density and diameter of packing, and the diameter of the tower have very
little, if any, effect on the gas holdup. The gas holdup in aqueous solutions of
electrolytes is slightly larger than that in nonelectrolyte solutions.
Armstrong et aI. 3 showed that the wettability of solids could significantly
affect the gas and liquid holdups and the fluidized bed height. They made
measurcments in a large two-dimensional bed of 66-cm x 2.54-cm cross-section
and 213 cm height. The superficial gas velocity was varied from 0 through 10.7 cm
S-I. Thc liquid velocity was fixed at 8.4 cm s -1 and 6-mm glass beads and
TefIon-coated glass beads were employed as the wettable and nonwettable solids,
respectively. The effect of gas velocity on the individual phase holdups obtained
for these two types of particles is shown in Fig. 9-10. As shown, the Teflon-coated
beads exhibited a slightly smaller solids holdup and, hence, a greater expansion.
For all gas velocities, the gas holdup was remarkably smaller with the Teflon-
coated beads than with the uncoated beads. For the same gas holdup, Teflon-coated
beads gave larger bed expansion.
Armstrong et aI. 3 indicated that by rendering the solids nonwettable, gas-solid
contact is improved and the liquid wake is inhibited. Smaller liquid wakes would
give larger bed expansion. The larger gas holdup in the case of nonwettable solid
was explained on the basis that the nonwettable solids gave larger gas-solid
contact. For large particles, this results in adherence of the bubbles to the solids
and, thus, breakup is probably reduced. This ultimately results in larger bubbles
and, hence, a reduced gas holdup.
Narayanan et al. 88 correlated gas holdup to the superficial gas velocity
empirically and found h G x U OG for U OG < 6.7 cm S-1 and h G ex. UgJ8 for 6.7 cm
S-1 < U OG < 21.34 cm s- 1. Hovmand and Davidson 43 proposed a slug-flow
model to correlate the gas holdup in gas- liquid-solid fluidized beds at superficial
gas velocities in excess of that required for the incipient fluidization of solids.
They correlated the gas holdup and superficial gas velocity by the equation
h G - ht
ht;
U OG - U G
0.35( ]dc)IJ2 '
(9-26)
326 GAS-LIQUID. SOLID REACTOR OESIGN
'"
-t:
==,
0.5 -._.
."".
.
0.4
0.5
VOL = $1.4 cm s I
.-.-..-.
..£ 0.4 . .
.-.-.-.-
0.3
0.15
.-.-
.----
.--
./
/ .
. .,....-. .
,,-.
...
0.10
. Uncoated beads
. Teflon coated beads
0.0
3
6
9
Fi\:ure 9-10 The effeel of gas
velocity on the individu'll phase
holdups In beds or6.mm wettable
and non"'cttable solids (.law of
A,'m.,trOlI!! 1'/ ,,1.. 1 ).
Uoc. (cm S-I)
where uta is the superficial gas velocity at the incipient fluidization of solid
particles (in cm S 1), Ir"t, is the fractional gas holdup at the incipient f1uidiLation.
de is the column diameter (in cm), and {J is the gravitational acceleration. The
above equation indicates that a plot of the gas holdup against the superficial gas
velocity should be a straight line with a slope equal to IIUO.35(gtfcJ lt2 . Juvekar
and Sharma 52 verified Eq. (9-26) with the help of experimental data taken in 5-cm-
and 20-cm-i.d. bubble-columns.
As noted by the correlation of Kim et al.. 58 any quantitative evaluation of the
holdup characteristics of a three-phase fluidized bed mus[ consider the phenom-
enon of bed contraction. 137 The wakes of the bubbles rising in a three-phase
fluidized bed consist of a particle-free liquid immediately below the bubble
(commonly known as "liquid wake'") and a lower region of particles and liquid
which apparently moves with liquid (known as "particulate region"). Particulate
elutrition is caused by this particulate region. whereas bed contraction is caused
by the liquid wakes,
OVNAMICS OF THE GAS-LlQUJl)-SUSPENDED-SOUn COLUMN 327
Stewart l29 derived a relation between the gas and liquid holdups assuming
the flux of liquid in the wakes of bubbles to be [V OG , where kis the mean value
of liquid-wake volume/bubble volume. He used the principle of continuity and
assumed that if this system is particulately fluidized (i.e., in the case of zero gas
f10w rate), a rela tion proposed by Richardson and Zak i. I 14 namel y.
M. - UorJV,
(9-27)
is valid. Here, VOL is the superficial liquid velocity, V, the particle terminal
velocity and n the Richardson and Zaki expansion index. The relation he derived
can be expressed as
hi. = (VoljV, - kVoGIV,)'/n(l - he; - khd ' 1/11 t- kh G . (9-28)
Efremov and Vakhrushev 25 suggested that k = I(V G . Lit, particle properties).
Darton and Harrison 2 I derived an empirical relationship for [as
] + [ = 1.4(Uo,jVodo.33, (9-29)
based on the experimental data of Efremov and Vakhrushev 25 and Michelsen
and Ostergaard. 82 This relationship suggests that [= 0 at approximately
Vot/V OG = 0.4. This is the value where the flow regime changes and the onset of
slugging occurs. 124 The validity of Eqs. (9-28) and (9-29) is further theoretically
and experimentally analyzed by Darton and Harrison. 22
Equations (9-28) and (9-29) allow the evalua tion of either h G or hI. if the other
is known. In order to predict hoth ha and hI. independently. another relation is
needed. Darton and Harrison 2 t derived this relation based on the drift flux
approach. The gas drift flux VCD is correlated to the gas and liquid holdups as
\'CD = V OG (1 - hd - V oL hc;(1 - h G I/h L .
(9-30)
The gas drift flux calculated from the experimental data of VOG, VOL, h G ,
and hI. and the above relationship can be plotted as a function of ha. The derived
relationship will depend on the flow regIme. In the so-called "churn-turbulent"
regime, the bubbles coalesce and cause radial variations in voidage and velocity;
and large, fast bubbles rise at the center of the column. In this regime, Vco
increases very rapidly with h G , and the approach of Zuber and Findl ay l49 may
be applied. In the "uniform bubbling regime," in which the bubbles are all of
similar size and the gas drift flux is only a function of the gas holdup and the
rising velocity of an isolated bubble, various relations such as
'CD = ha V ho
(9- 31 )
(9-32)
(9-33)
VCD = h G V bo (1 - ha>
Vco = h G V ho(1 - ha)m
are presented. Here V ho is the rising velocity of an isolated single bubble in
stagnant liquid Ddrton and Harrison 21 correlated the data of Michelsen and
OstergaardB 2 ,B3 by a relation
Vco = 180hdmm S-I). (9-34)
Equation (9-31) assumes no interacrion between bubbles. Equation (9-32) is
proposed by Turner. 135 Equation (9-33) is the correlation of Richardson and
Zaki,t 14 where the presence of other. bubbles increases the effective viscosity of
liquid. For gas-liquid systems, Wallis 142 ,143 proposed m = 2.
The transition trom the uniform bubbling regime to the churn-turbulent
regime depends upon the physical properties of the gas and liquid, the particle
size and the fluid flow rates. Very little is known about this transition regime.
The liquid holdup characteristics of a countercurrent, three-phase spouted-
bed column are studied by Vukovic et al. 141 They found that the total liquid
holdup increased with the gas flow rate. Both the total and dynamic liquid
holdups were comparable to those obtained in cocurrent-upflow ,three-phase
fluidized-bed columns operating with similar gas and liquid flow conditions.
.,
1
"
i
'3
.A_ )
328 GAS-LiQUID-SOUD REACTOR DE'iIGN
Recommendations At present, the most widely rested correlations for h L and
h L + ho are those of Kim et al. 56 and, at moderate gas velocities, their use is
recommended. For I rge gas velocities, Eq. (9-26) can be used for an approximate
estimation of ho. Future work should include experimental work with large-
diameter columns.
9-4 AXIAL DISPERSION IN THE GAS, LIQUID, AND
SOLID PHASES
9-4-1 Gas-phase Axial Dispersion
Very few data on the gas-phase axial dispersion in a three-phase fluidized-bed
column are available. Schiigerl '23 and Michelsen and Ostergaard 82 measured the
gas-phase RTD in a three-phase cocurrent-upflow fluidized bed. Quantitative
data on the gas-phase backmixing coefficient have been, however, presented only
by Schiigerl. 123 He reported that (just as in a bubble-column) in a three-phase
fluidized bed, the intensity of mixing in both the gas and liquid phases decreased
from the top to the bottom of the column. A t low liquid velocities. the gas-phase
Peclet number (or Bodenstein number) increased with the gas rate; but, at high
liquid velocities, the Peelet number showed a maximum with respect to gas rate.
From Schiigerrs data, the effect of liquid velocity on the gas-phase Peclet number
is unclear, although at low liquid velocities, the gas-phase Peclet number appears
to decrease wIth an increase in liquid velocity.
To this author's knowledge, no data on three-phase stirred columns are
available. Preliminary observations indicate that the axial dispersion in the gas
phase is considerably reduced by the presence of solid particles. Under certain
conditions, even for a very low L/d e (where L is the length and de the diameter
of the stirred column) the gas phase may move essentially in plug flow.
A review of the gas-phase axial dispersion in a stirred and unstirred
bubble-column in the absence of solid particles is given by Ostergaard. 97
. _/ 2)
DYNAMICS OF THE GAS -LiQUID-SUSPENDEIJ-SOLID COLUMN 329
9-4-2 Uquid-phase Axial Dispersion
A review on earlier studies of liquid-phase axial dispersion in unstirred bubble-
columns with no solids is given by Ostergaard. 97 Van de Vusse l38 has discussed
the liquid-phase RTD in stirred slurry reactors.
The effects of suspended solid particles on liquid-phase axial dispersion in a
cocurrent-upflow system have been studied by Schiigerl 123 and Michelsen and
Ostergaard. 82 They showed that, in a three-phasc column, the axial dispersion
increases with gas rate. Unlike in a gas liquid bubble-column, the liquid-phase
axial dispersion coefficient in a three-phase column depends upon the liquid
velocity. The nature of the effect is, however, dependent upon the gas rate and
solids particle size. Similarly, the nature of the effect of solid size On the axial
dispersion depends on the gas and liquid flow rates.
Michelsen and Ostergaard 82 correlated their data for the axial' dispersion in
a 15.24-cm-i.d. column in tcrms of the height of a mixing unit, HMU, which is
the height equivalent of a perfectly mixed stage. Mathematically, HMU =
2L/Pe = 2EZI./V L , where E ZL is the liquid-phase axial dispersion coefficient and
V L . is the absolute velocity of the liquid in the column. The relationship between
the HMU and the gas and liquid velocities for three different particle sizes,
obtained by Michelsen and Ostergaard, 82 are shown in Figs. 9-11 through 9-13.
The most interesting feature of these results is the increase in HMU with liquid
velocity in beds of 6-mm particles at small gas velocities.
Kim et aL 56 correlated their data for liquid-phase backmixing in a three-phase
rectangular column by a dimensionless correlation:
(HMU/H o ) - (HMU/Ho)uOG=o
= 0.068 (FrL Ps/pdO. t28 (FrG Ps/PG)O.168 (ReL ReG)o,120
50
(a' = 0.036),
(9- 35)
40
30
Voc = 18cms- 1
20
E
::iE
:r:
10
VQG '" 0, 1.5,3.6 cm s I
10
IS 20
VOL(cm s ')
25
Figure 9-11 Liquid-phase mIx-
ing rOT 6-mm particles Urom
clara (If Michel. ell and O. ter-
gaard 82 ).
330 GAS-LIQUID-SOLID REACTOR DESIGN
50
Vob 13.0 em s-I
40
30
20
Voc; = V - V
3.0 cm s-I 4.5 m s-l 6.0 m s-l
20
E \
Vex..; =
=>
1.5 em s-I
::c
10
Voc; = 0 cm s I
I
15
VOL (em s-I)
"'igure 9-12 LiqUId-phase mixing: for 3-mm particles (frtllJl data ,!f Michel.<t'n allli O$lerY'llIrtl 82 ).
o
10
20
where HMU = 2H /Pel., Fr l = U5l/tlp{./, FrG = V5G/d p {./, ReI. 0= dpUo,-p/JI,-, ReG =
d p U oG PG/!1o, and Pel = VoLH/E zl . Here, E Zl is the liquid-phase axial dispersion
coefficient. The quantity (HMU/Ho)v o " = 0 can be estimated from the relation
(HMU/Ho)vc,,=o = 5.0S (Frl Ps/pdO. 842 (Red 0.450 (a' = 0.037). (9-36)
The expanded bed heights can be obtained from Eqs. (9-19) and (9-20) in Sec. 9-3.
It should be noted that although the above relation correlates the backmixing
coefficient to the fluid properties, no experimental data on systems other than air
or nitrogen and water have been reported in the literature. Kato et al. 54 obtained
data in 6.6-, 12.2-, and 2L4-cm-i.d. columns with particle sizes ranging from 63
through 177 Jim and solid concentrations up to 0.2 g solid per cm J of slurry. They
correlated the longitudmal dispersion coefficient of the liquid in the slurry by
the following dimensionless relation:
rr;;.- (f;:\0 85
Pel = UoGdc/EzL = 13(" Frdf(J -r 8(" Frd' ),
where J Fr = Uoo/ J(gd c ).
The above relation very closely resembles the relation
Pel = 13( Frd /(1 + 6.S( JFrG) O.8)
(9-37)
(9-38)
DYNAMICS OF THE GAS-L.!QUID-SUSPENDED-SOUD COLUMN 331
obtained by the same investigators for the solid-rree bubhle-columns. Kato et al. 54
found that En increases with U OG and is proportional to the I 1.5th power of
dc. Unlike other investigators, they found E ZL to be independent of liquid velocity.
9-4-3 Solid-phase Axial Dispersion
Cova 17 measured the axial distribution of catalyst concentration as a function of
gas and liquid flow rates for systems with finite net liquid flow. A theoretical
model for the prediction of axial catalyst concentration profile as a function of
physical properties and operating conditions was prcsented. Although the model
adequately represented both laboratory and pilot-scale operations. no information
on the axial dispersion coefficient was obtained.
K61bel et aI. fi5 studied the axial distribution of catalyst in an air-water system
containing 5 percent hy weight of silicon oxide particles of 0.1 through 0.125 mm
100
'?
60
=>
;;g
40
HO -
V OG = ].5 CIl1 s .1
20
V(J(; = 0 em s-I
2
6
8
4
V OL (ems. 1 )
Figure 9-13 Liquid-phase mixing [or I-mm particles (from data of Michel. en and Osterqaard 82 ).
f
/ .. '.
....... "'- _ .1
332 GAS- LIQUID SOUD REACTOR DESIGN
diameter. The axial distribution of catalyst increased with a decrease in gas
velocity. Higher solids concentration decreased the range of gas velocities that
could be employed in a three-phase fluidized-bed operation without any particle
sedimentation or excessive bubble coalescence.
Farkas and Leblond 30 used the axial distribution of solids to calculate the
values of the axial dispersion coefficient. The data were, however, not correlated
to gas and liquid velocities. A method for characterizing the age distribution of
suspended particles in a continuous bubble-column is given by Yamanaka et at 146
Imafuku et al. 46 and Kato et al. 53 studied the axial dispersion characteristics
ofthe solids in a batch (i.e., no liquid flow) three-phase fluidized column. Imafuku
et al. 46 correlated the axial dispersion coefficient to the settling velocity of the
particle, the gas velocity, and the column diameter. They found that a parameter
V.F(e.)E"Zl> was independent of the gas velocity and proportional to d; 1.5. Here,
F(e.) = exp (- 4.65e.), VI is the settling velocity of particles, e. = 1 - (volume
fraction of solid particles in liquid), and E zs is the axial dispersion coefficient of
the solid particles. They also showed that the quantity VIF(es)/E zs is proportional
to VIO' the terminal velocity of a single particle in stagnant liquid. The axial
dispersion coefficient of the solid particles did not depend on the type of the gas
distributor or on the shape of the bottom of the column. Kato et al. 53 assumed
that the solids concentration in a batch column varied exponentially with the
distance, and showed that their data in 6.6-, 12.2-, and 21.4-cm-diameter columns
follow the relationship Pes (= V.L/E zs , where L is the length of the column)
oc U _75 and Pes = Pes4>i-5. Here, 4>L is the volume fraction of liquid in the slurry,
VI is the mean settling velocity of the particles, U ID is the terminal velocity of a
single particle in a stagnant liquid, and Pes is the value of Pes as cJ;L -+ 1. Kato
et al. 53 found that the Peclet number decreases with an increase in gas velocity
and column diameter and a decrease in particle diameter.
The axial dispersion characteristics of solids in a continuous (cocurrent-
upflow) three-phase flow operation has been studied by Imafuku et aL 46 and
Kato et al. 53 Various types of solid particles (such as glass spheres, Cu powder,
ion exchange resin, etc.) with sizes ranging from 60 through 250 mesh and particle
densities from 1 through 9 g cm - 3 were examined. The column diameter ranged
from 5 through 22 cm, and solids concentrations up to 20 percent were considered,
The most important conclusion of these studies was that for small particles and
io small diameter columns, the longitudinal dispersion coefficient for solids in a
three-phase fluidized bed is the same as that of the liquid and can be given by
Eq. (9-37), if E ZL is replaced by E zs , the axial dispersion coefficient for the
solid particles. For large diameter particles and large columns, Eq. (9-37) was
corrected by Kato et at 53 and can be expressed as
Pes = V E oad <: = 13( .JFra)( l + 0.009 ReI' ( .JFra) -o.S)/O I--- 8( .JFra) O.S5),
zs
!
;
(9-39)
where Re p = dpU,D/VL'
One method for changing the axial dispersion of the solids or the solids
concentration distribution in the three-phase fluidized-bed reactor is to place
jl... "-
..J
DYNAMICS OF THE GAS-LIQUID SUSPENDED-SOLID COLUMN 333
perforated plates in lhe longitudinal direction which positions the bed space. The
solids concentration in such a multistage (positioned) three-phase fluidized bed
has been studied by Suganuma and Yamanishi 133 and Sekizawa and Kubota. 126
The latter authors showed that, just as in the case of a single-stage reactor, the
axial dispersion coefficient for the solid phase in a multistage three-phase fluidized-
bed reactor is approximately equal to the axial dispersion coefficient for the
liquid phase.69.142 The axial dispersion coefficient for the liquid phase in a
multistage column, E ZLM , has been empirically related with the axial dispersion
coefficient oblained in the single-stage bed, E ZL , byt 26
E ZLM ugJ
E ZL - 1 + Cl5(d e /I1L)o.2'
(9-40)
where U OG is in cm s -I . de is the column diameter (in cm), and I1L is the distance
between two consecutive perforated plates (in cm). En is given by Aoyama et aP
and many others, as described earlier.
Kubota and Sekizawa 69 measured the solids concentration distribution in a
multistage three-phase fluidized bed under a wide range of system conditions.
The system conditions analyzed by them are summarized in Table 9-l.
The overall concentration distribution of solids in a multistage column
depends upon the axial dispersion of the solids in each stage and the back flow
of liquid (and solids) at the perforated plate. Kubota and Sekizawa 69 proposed
a model to describe the exchange of solid particles through the perforated partition
plate. The model used a parameter K O which was defined as
KO = I - fJh oG . (9-41)
where fJ is the fractional area of the plate when thl! liquid is ascending and hoG
Table 9-1 Dimensions of experimental apparatus used and
experimental conditions examined by Kubota and Sekizawa 69
Column
Column diameter, de (em)
Plale spacing (cm)
Purritioned plate
Hole diameter, do (em)
Thickness (cm)
Free area fraction
Suspended solid purticles
Material
Mean diameter, do (cm)
Concenlrallon. C. (g em - J)
F low COl1dition.
Gas: air
Liquid: tap water
Superficial gas velocity, U OG (cm s - I)
Superficial liquid velocity, U OL (em 5- 1 )
10
50
0.2. 0.5, 1.0, 1.5, 2.0
0.5, 1.0
0.0700, 0.202
Glass bead
0.089,0.106,0.128,0.153
0.004, 0.4
20°C
1.79, ] 0.8
0.1.8
334 GAS-LIQUID-SOLID REACTOR DESIGN
is the gas holdup in a hole of th partition plate. The experimental data showed
that the value of K O remains essentially independent of the superficial liquid
velocity and the particle size (in the range they considered), but decreases with
the increase in superficial gas velocity, hole diameter on the perforated plate, and
the plate thickness.
The experimental data also showed that when the superficial liquid velocity
is zero or very small, the presence of partition plates gives the stepwise profile of
solid particles. This avoids uniform distribution and gives large solid holdup.
Continuous operation in this range, therefore. results in a higher mean residence
time orthe solid particles than that in the column without partition plates.
When the superficial liquid velocity is large, the partition plates contribute
to the uniform solid distribution and give small solids holdup. When the backflow
ratio, yo, of liquid (i.e., VOL/VOL, where VOL is the superficial velocity of liquid
back flowed through the partition plate and VOl. is the superficial liquid velocity
in the column 126 ) is small, the plates show some effect on the solids distribution;
but this effect becomes increasingly small as 1-'0 increases. Kubota and Sekizawa 69
also presented an expression for the critical liquid velocity, where the solids
concentration at the upper and lower surfaces of the plates become equal. This
critical value of VOL is independent of the backflow ratio Yo. Kubota and
Sekizawa 6Y also pointed out that the fractional open area of plate affects the solids
concentration profile, not only by its contribution to the backflow ratio,126 but
also by its appreciable contribution to the settling of solid particles.
One point concerning the works described above is worth noting. All the
reported experimental work has been carried out under atmospheric pressure
conditions. For the same gas velocity, the flow characteristics in actual high-
pressure reactors may be different. The possible effects of this on the backmixing
in various phases are presently not known. It should be noted that this same
point is also applicable to other transport processes (such as gas -liquid and
liquid .solid mass transfer. etc.) in this type of column, as well as transport and
mixing processes occurring in fixed-bed columns described in the previous three
chapters.
Recommendations For estimating the liquid- and solid-phase axial dispersion
coefficients in a three-phase fluidized-bed column, use of Eqs. (9-37) and (9-39) are
recommended. Future work on this subject should include the measurement of
axial dispersion coefficients in the gas phase, particularly in large-diameter
columns.
9-5 GAS- LlQL"ID INTERFACE MASS TRANSFER
Calderbank 10 and Calderbank and Moo-Young 13 correlated their data for the
gas -liquid mass-transfer coefficient by the following relation:
kdJ1L/P L D)2/3 = 0.3l( PLgllL/p )1/3,
(9-42)
DYNAMICS OF THE '-,AS-UQUIlJ-SU",PE,,"IJED-SOLID COLUMI' 335
where IiPL is the density differcnce between gas bubbles and liquid phase and
k L is the gas-liquid mass-transfer coefficient (in cm s -1). The correlation is
applicable to bubbles rising in a liquid by gravitational forces in the absence of
any mechanical stirring. Although it was developed for a column with no solids
present, it has been applied with some success to bubble-columns containing
solids. B1 When the liquid is stagnant, as a first approximation, the gas-liquid
mass-transfer coefficient can be estimated from a relation Sh = k..db/D = 2, where
db is the bubble diameter. 44
A review of earlier studics on mass transfer across the gas -liquid interface
in three-phase slurry systems is given by Ostergaard. Q ? Kat0 54 studied the
adsorption of oxygen from air in aqueous sodium sulfite solutions containing
cupric ions as a catalyst. The measurements were carried out in a batch system
(i.e., no liquid flow). At low gas velocities, the gas liquid mass-transfer coefficient
decreased not only with a decrcase in gas velocity, but also with an increase in
particle size, solids concentration, and a density difference between the liquid and
solid. At high gas velocities, the mass-transfer coefficient became essentially inde-
pendent of all system parameters. The gas velocity above which the mass-transfer
coefficient remained essentially constant was'related by analytical and graphical
correlations to the amount of solids in the column and to the critical gas velocity
corresponding to complete suspcnsion of the solids. When the mass-transfer
coefficient was constant, the gas-liquid interfacial area was just about constant
at a value of 1,000 m 2 m- J .
Earlier studies on mass transfer across the gas liquid interface in mechanically
agitated systems containing suspended solid particles have been reviewed by
Morris. B6 The studie!'. of Hixon and Gaden,42 Eckenfelder,24 Oldshue,94 and
Johnson et aL 4Q correlated the mass-transfer coefficient with the nominal gas
velocity and the horsepower input to the impeller in the form
K LaL = UiJdHP)J,
(9-43)
where U OG is' in ft h -1 and KLaL in liters h I. The experimental data were
obtained using a turbine impeller and an open pipe sparger. The values of x and
y for various systems are summarized in Table 9-2.
Cooper et al. 111 correlated their data for the absorption of oxygen from air
in a 1.2 N aqueous solution of sodium sulfite as a function of power input to the
Table 9-2 Exponents x and V for Eq. (9_43)97
System
y
y
Reference
Baker's yeast-air
Sewage air
Cannery waste.-air
a-Methyl slyrcne-hydrogen-palladium catalyst
Flue gas--(;alcium hydroxide slurry
Dairy wasle-air
0.68
0.80
0.70
0.75
1.01
0.39
0.56
o
0.54
1.54
4]
24
24
47
83
90
336 GAS-LIQUID 'SOLID REACTOR DESIGN
agitator. The copper ions served as a catalyst for oxidation of the sulfite. Their
corrclation is shown in Fig. 9-14. In this figure, V OG is the superficial velocity
of gas bubbles (in ft h - I) based on inlet gas volume and cross-section of vessel,
Po is the power to the agitator shaft (in ft-Ib min I), V L is the liquid volume in
the vessel (in ft3), R is the universal gas constant, T is the temperaturc, He is the
Henry's law constant, and KLaL is the volumetric mass-transfer coefficient (in ft
h - I). This correlation should be applied with caution to other types of reactor
shape, other types of agitator, and methods of introducing the gas other than the
ones used by Copper et al. 16
In a more recent work, Slesser et al. 128 showed that small amounts of fine
solid particles in an agitated three-phase slurry reaction can change the magnitude
of the volumetric mass-transfer coefficient considerably. Chandrasek ran and
Sharma 14 reported a similar conclusion in the case of the oxidation of sodium
sulfide in the presence of activated carbon. They argued that the presence of solids
prevents bubble coalescence and thus increases the gas-liquid interfacial area.
An interesting study of the gas liquid mass transfer in a three-phase agitated
slurry reactOr was recently reported by Joosten et al. 51 They showed that in the
absence of solids, the volumetric mass-transfer coefficient can be well correlated to
total power (power dissipated by stirrer + gas) per unit volume, but poorly
correlated to the power dissipated by the stirrer only, as done in Fig. 9-14. Their
data were well correlated by the correlation of Van Dierendock. 23
0.007
0 15.2 em tank ,:
0.004 o 20.3 cm tank Vaned 0 ,.'tJ
o 24.1 cm tank disk ,.
,.
0.002 ,.
.. 44 cm tank ,.
- 24.1 cm tank } Flat ,-6 []
0
h 0.001 ... 243.8 cm tank paddle ,o
#..
::t:: : ..
- o 0.0006
,;' Bar indicates ...
-' 0.0004 loaded condition
-
.. '"
0.0002 0,'"
".98
".'"
0.0001 ". 'S'\!.
".'" ""
.1-,..; .;
-
0.00006
400 600 1,000 4.000
2,000
Power per unit volume, PO/V L (ft-Ib min- I ft-3)
Figure 9-14 Gas absorption coefficient as a function of power input per unit volume In mechanically
agitated dispersers.' 6
0.4
0.2
., 0.1
'"
..J
'"
... 0.04
""'"
0.02
0.01
0
DYNAMICS OF THE GAS-LiQUID-SUSPENDED-SOI1D COLUMN 337 .,
g -,
\ ",=1
-0,'-. l
. 0, l
\ l
I
40
_ _.1
10 20
I
30
Solids concentration (volume percent)
h Glass beads 88 JIm
... Class beads 53 JIm
° Sugar 74-105 /-1m
. Polypropylene 53-105 11m
o Polypropylene 250 11m
StilTing power ] 5 kw m- 3
Superficial gas velocity = 25 cm S-I
Figure 9-15 The volumetric mass-
transfer coefficient as a function of the
volume fraction of solids. in the slurry
(from rhe data of Joosren er £11.").
Joosten et al. 51 found diat for a given stirrer power input and superficial
gas velocity, the volumetric mass-transfer coefficient first increased relative to the
value of the "clear" (no solid) liquid when sma]] volume fraction of solids was
added. While this is in qualitative agreement with the observations of Slesser et
al. 12R and Chandrasekaran and Sharma,14 unlike these authors. Joosten et al. 51
found the increase to be rather small (between 10 and 20 percent). Furthermore,
as more solids were added, the volumetric mass-transfer coefficient remained
constant at first, and then started to decline at a specific concentration depending
on solid type and particle size. These data are illustrated in Fig. 9-15.
Joosten et al. 51 eXplained the data based on the increase in the apparent
viscosity of the slurry by the addition of solids. The volumetric mass-transfer
coefficients, as a function of the relative viscosity of slurry obtained by them, are
shown in Fig. 9-16. These data show that as the density of the solids decreased
the value kLaL decreased faster with the increase in the relative viscosity. These
data also show that for particle sizes 250 Jim, the suspended solid particles do
not significantly affect the gas-liquid volumetric mass-transfer coefficient when
the apparent viscosity of the slurry is not higher than four times that in the
liquid. At high solids concentration, bubble coalescence and subsequent reduction
in gas holdup can be the major cause in the reduction of kLaL. The data show
that kLGL in a three-phase slurry depends on the difference in density between
the solids and liquids. The greater inertia of the heavier particles may create a
stronger disturbance at the gas-liquid interface and thus affect the value of k L .
The mass-transfer rate from bubbles in a three-phase fluidized bed with both
gas and liquid flowing cocurrently upwards was studied by Massimilla et aI., 79
0.4
338 GAS-LIQUID-SOLID REACTOR tJESIGN
0.2
0.1
I'
'"
-
'""
'"
'""
0.04
0.02
0.01
I
OA_O-.A
o 0 O AA
o ,,
A
\\
D Sugar 74-1051lm
A Glass beads 53 and 88 pm
o Polypropylenc 53-105 and 250 /-1m
2
40 60
Figure 9-16 The volumetric mass-
transfer coefficient as a function of
.he rcla tive viscosity of the slurry
(frnm tile dllt<1 '!{ Joosten etiJI. SI ).
1
,
4 6 8 10
ReI at ive viscosi ty
20
Adlington and Thompson; and, more recently, by Ostergaard and Suchozebrski! 05
Ostergaard and Fosbol, 103 and Nishikawa et al. 92 A summary of the gas-liquid
solid systems used by these investigators is given in Table 9-3.
Massimilla et aL 79 found that the presence of solid particles reduced the gas-
liquid mass-transfer rate in a bubble-column. This was explained as being due to
the higher rate of bubble coalescence and. consequently, a lower gas- liquid
interfacial area obtained in the presence of solids. They also found that the
absorption rate increased with an increase in the nominal liquid velocity and a
decrease in particle size.
The bubble dynamics in a cocurrent-upflow, three-phase, fluidized-bed system
have been studied by Massimilla et aL 80 Ostergaard,99 and Lee. 70 Massimilla et
aL 80 found that the bubble size decreased with increasing fluidization intensity
(i.e.. with increasing liquid velocity). The rate of bubble coalescence also decreased
with increasing fluidization intensity, the net rate being positive at distances from
I to 1 ft above the orifice and zero at larger distances from the orifice. The
bubble rise velocity increased steadily with bubble size in a manner similar to that
observed for viscous fluids, but different to that observed for water, implying that
a three-phase fluidized bed behaves like a highly viscous liquid fluidized bed. These
results of Massimilla et aL 79,80 were in agreement with a subsequent study of
Ostergaard. 99 He showed the existence of a relationship between bed viscosity
and liquid velocity. The shape of the bubbles was markedly dependent upon liquid
velocity. Adlington and Thompson I found that the gas-liquid interfacial area
decreased with decreasing bed porosity and was less sensitive to changes in particle
size. For large particles and large bubbles, Lee,70 however, showed that bubble
size decreased and that the gas- liquid interfacial area increased with increasing
distance away from the gas distributor. The breakup of bubbles occurred at a
higher rate in beds of low expansion. The presence of solid particles in the case
of large particles increased the absorption rate.
DYNAMICS OF THE GAS LIQUID SUSPENDED-SOLID COLUMN 339
Table 9-3 Summary of gas-liquid interface mass transfer studies for
cocurrent gas-liquid flow in a fluidized bed
No. Gas liquid Solid Reference
I. Absorption of CO 2 (from Silica-sand particles 79
a mixture of CO 2 + N 2 ) (0.22 mm) glass ballotini
in water (0.5 through 0.8 mm)
2. A.bsorption of O 2 in a Glass particles (0.3 through
sodium sulfite solution 3 mm in diameter)
3. Absorption of CO 2 in Glass ballotini (I mm 105
water and 6 mm)
4. Absorption of O 2 in Glass ballotini (I mm 103
wa ter and 6 mm)
5. Absorption of CO 2 (from Spherical beads of diameter 59
a mixture of 5 percent 1.1,2.65, and 2.87 cm
CO 2 and 95 percent and densities I and
atmospheric air) in 0.59 g cm - ]
aqueous sodium
hydroxide solution
6. Absorption of O 2 into Spherical particles of 92
copper-catalyzed sodium diameter 1.01,2.59.
sulfite solution and 4.87 mm
----- "----.-..---- --..........------_._--- .----- --_._--- ---- ----- ."-- -------.--,..
The absorption rate depends upon the gas-liquid interfacial area, the gas
residence time. and the gas iquid mass-transfer coefficient. The gas residence time
is lower and the gas liquid mass-transfer coefficient is higher (due to higher
Reynolds number) in a three-phase fluidized-bed system compared to a bubble-
column with no solids present. It is the first factor (i.e., gas-liquid interfacial
area) that plays an important and complex role on the mass-transfer rate in the
three-phase fluidized-bed system.
The recent studies of Ostergaard and Suchozebrski t05 and Ostergaard and
Fosboll0 3 have shed some further light in relating the bubble dynamics with the
volumetric mass-transfer coefficient. Ostergaard and Suchozebrski l 05 showed that
the volumetric mass-transfer coefficient (i.e., K Lad increased with increasing gas
flow rate, but Was uninfluenced by variations of the liquid velocity. Particle size
was observed to have a pronounced effect on the absorption rate. The volumetric
mass-transfer coefficients with 6-mm particles were about an order of magnitude
larger than those obtained with 1-mm particles. The coefficients in the system
with no particles were of intermediate magnitude. Ostergaard and Fosboll0 3
showed (see Fig. 9-17) that an increase in the superficial liquid velocity had no
effect on the adsorption rate in beds of 6-mm particles and in solid-free bubble-
columns. In beds of I-mm particles, however, an increase in liquid velocity caused
a marked increase on the volumetric mass-transfer coefficient. These results agreed
well with the fact that both the gas holdup and bubble size in beds of 6-mm
particles and in the solid-free bubble-column were independent of liquid velocity,
whereas, in beds of I-mm particles, 99,1 U 1,1 02 an increase in the liquid velocity
caused a marked reduction of bubble size and an increase in gas holdup. The
340 GAS-LIQUID SOLID REACTOR DESIGN
rate of bubble coalescence was higher at low liquid velocities than at high liquid
velocities in beds of l-mm particlcs. 99 Figure 9-17 also shows that an increase in
the gas velocity increases the volumetric mass-transfer coefficient, except at an
intermediate liquid velocity, where a maximum in the mass-transfer coefficient
with respect to the gas velocity may be caused by a change in the nature of bubble
coalescence.
5 X 10 2
'"j'
.c
'-'
..J
<:s
..J
'<
10 2
10
0.5
UOG(cm S-I)
Curve d p (mm)
I 6
2 6
3 6
4 I
5 I
6 I
7 no solids
8 no solids
9 nO solids
2
6
5
I
10
VOL
(cm s-l)
16.2
1!.5
6.8
9.5
6.8
1.95
16.3
1!.5
6.8
Figure 9-17 Average volumetric absorption coefficients for a I78.S-em-tall bed section ({rom data (!{
Osteryaard and Fn. h(j/'VJ).
DYNAMICS OF THE GAS .LlQUID -SUSPENDED-SOUD COLUMN 341
Ostergaard and Fosbol l03 also showed that the volumetric mass-transfer
coefficient was a strong function of bed position. In solid-free bubble-columns
and in beds of I-mm particles. as shown in Figs. 9-1 Rand 9-19, the volumctric
mass-transfer coefficient decreased with the distance away from the gas distributor.
In beds of 6-mm particles, as shown in Fig. 9-20, the volumetric mass-transfer
coefficient first increased and then decreased with the distance away from the
gas distributor.
Nishikawa et al. 92 measured kr.GI. in a three-phase cocurrent gas-liquid-flow
spouted-bed column. Absorption rates of oxygen into copper-catalyzed sodium
sulfite solution were measured. The data indicated that the kr. Q , increased with
both gas and liquid flow rates. As shown by Ostergaard and Fosbol,I03 while
kLGL increased with particle size, its values in the case of tOl-mm particles were
lower than the ones in the absence of solids and otherwise identical conditions.
The effect of particle size on kr.GL obtained by these investigations is shown in
300
100
,
Vot = 11.5 em s -I
V OG
Curve (cm s-l)
200
I
2
3
4
5
6
7
1.14
1.18
2.37
2.38
3.20
3.78
4.10
7
..c:
'-'
..>
"
..J
:.c:
6
o
100
200
300
Z (cm)
Figure 9-18 Volumetric absorption coefficients in bubble-columns (data of O. terga(/rd llnd F(). hol'o.\).
300
342 GAS-UQUIO-SOLIO REACTOR DESIGN
200
Curve
No.
I
2
3
4
5
6
7
8
9
T
:5
'""
<:s
:..:-
100
o
U Ol
(cm s. ')
1.95
1.95
1.95
6.8
6.8
6.8
9.5
9.5
9.5
100
Z-(cm)
U OG
(cm s-I )
1.08
2.25
3.64
1.03
2.18
3.72
0.96
2.36
3.94
Figure 9-19 Volumetric absorption coefficIents in g:!s -liquid fluidized beds of I-mm particles (data
of Ostel"ljaard al1d F osbol' cUI.
Fig. 9-21. The figure also shows that kLGL increased with the amount of solids,
W s . present in the column.
Kito et al. 59 studied the gas-liquid mass-transfer rate in a turbulent bed
contactor for the adsorption of CO 2 from a mixture of 5 percent CO 2 and 95
percent atmospheric air into aqueous sodium hydroxide solution. The details of
their experimental conditions are described earlier, in Sec. 9-3. At high gas
velocities, the values of kGGL obtained in this study had the same magnitude as
those obtained by Kossev et al. ;66 however, they were smaller than that obtai"ned
by Wozniak and Ostergaard.'45 kGQL decreased as the gas velocity increased
(U OG > 200 cm S-I). A result in agreement with that reported by Levesh et al. 73
Kito et a1. 5 ,} found that the effective interfacial area per unit bed volume
increased with decreasing gas velocity up to 200 cm s - I. but decreased at higher
gas velocities. The interfacial area seemed to be nearly independent of the face
opening area of the supporting grid. The value of 01. (gas-liquid interface area
DY"IAMICS OF THE GAS-LlQUD .5USPE:-':DEo-SOUD COLUMN 343
per unit column volume) was estimated to be roughly proportional to vgc:. The
effects of static bed height II 0 on QL (gas-liquid interfacial area per unit liquid
volume) and the expanded bed height H on aL obtained by Kito et al. 59 arc shown
in Fig. 9-22(a) and (b), respectively. The interfacial area GL was found to be
independent of the diameter and packing density. The results of Kito et al. 59 also
showed that QL is proportional to h G up to h G = 0.6.
400 VOL = II.S cm s-I
Curvc U OG
No. (cm s-I )
I 0.99
2 LOS
3 2.24
4 2.27
5 3.92
6 5.22
300
:5- 200
..J
<:I
..J
:roc
3
4
100 2
I
o
Z (em)
Figure 9-20 Volumetric absorption co-
efficients m gas liquid fluidized beds
of 6-mm particle; (data (If Osrergaard
and F()sbol,03).
344 GAS-LiQUID-SOUD REACTOR DESIGN
2.0
0 L5
I
::<".
....
"
..J
...
"
..J
""" 1.0
,
i
I W s = 10 kg
I
I
I
W s = 4 kg
0.5
o
2
3
4
'5
Figure 9-21 Effect of particle Ize on
k"oL (ojier Nishikawa l't 01. 92 ).
dp(nlm)
]uvekar and Sharma 52 measured the gas-liquid interfacial area in bubble-
columns in the presence of fine solid particles. The results were obtained in 5-cm-
and 20-cm-i.d. bubble-columns. The results showed that, unlike in the bubble-
columns with no solid particles. the gas-liquid interfacial area in this case was a
weak function of superficial gas velocity (aL ex. U8i}3). A pronounced slugging of
the gas was visually observed in the presence of solid particles. Hovmand and
Davidson 43 and Ormiston et al. 96 observed that the gas in excess of that required
for incipient fluidization of solid particles passes through the suspension as large
bubbles. Thus, the gas velocity which is above that required for incipient
fluidization is expected to be less effective in increasing the gas-liquid interfacial
area as compared to the situation where solid particles are absent.
Juvekar and Sharma 52 also measured the effect of particle loading on the
gas-liquid interfacial area in bubble- as well as agitated columns. Their results
are shown in Fig. 9-23. The results indicate that the interfacial area was practically
independent of the particle loading up to 20 percent. Even for higher particle
loadings, the effect on the interfacial area was insignificant.
The measurements of gas-liquid interfacial area in a three-phase fluidized
bed were carried out by Strumillo et al. I 31 and Strumillo and Kudra. 132 The
absorption rates of carbon dioxide in aqueous sodium hydroxide were measured
in an 0.085-m-diameter column. Three packing sizes (i.e., 10, 7.5, and 5.0 mm)
were investigated. The ranges of liquid and gas flow rates examined were 33
through 110 m 3 m- 2 h- 1 and 0.5 through 3.5 m s-" respectively. The static
bed heights ranged from 20 through ] 60 mm. The results of the experiments in
the ranges U OG .:::::;; 3 m S-I and Ho .:::::;; 120 mm were correlated by an empirical
DYNAMICS OF THE GAS LlQUID-SUSPENDED-SOL1D COI UMN 345
15
'7 h
E h h
" h
....
E 10 <>
<> <>
-' <>
<3
5 0 0 0 0
0 5 10
0 15
Ho (cm)
IIcighl of clear liquid /I L = 20 em
, d p = 1.1 em
p I <:m cm
Column diametcr 'l.. = !() cm
"
sieve plate
V OG
Key (cm s-I)
0 O
<> H5
h 150
(a)
10
8
,...
I
E 6
0
....
E
-' 4
1<3
2
0
(] IIJ B III
o en e _
Ho(em) llL km)
5 7
10 13
15 20
15 50
<> .
, t::.
,8m
\ m, "'-.9._ 150, 212em S.-I
(]"' - -.-
" <D____ _ 85 cm S-I
0..........
d p = 1.1 cm Q - h-
(J = I gm em-'] U OG = o enl s. I
= I 0 cm
sieve plate
20
60
80
40
Hjcm)
(b)
100
Figure 9-22 (a) Effect of static packmj!
heIght H 0 on interfacial area Vi-om data (If
Kiw I'tl1l. 9).
(b) RelallonshlP between interfacIal
area and expanded bed height H (1l1. 11 from
dartl ot K i/(J el ul. 59 ).
34(i GAS-LIQUID-SOLID REACTOR DESIGN
10
--- 5
..,
I
E 4
u
N 3
E
u
..J
<:! 2
110
-A A
n
200 400
Particle loading (g/Q)
o 5 em i.d. bubble column
V OG = 21 cm s-I
A 12.5 em Ld. mechanically
agitated con[actor speed
oCagitation = 2050 rev m- I
Figure 9-23 Effect of particle
loading on gas-liquid interfacial
area (from dlJrtJ ( ,. Juvekar and
SI1ar/J1as 2).
relationship:
or. = 2.15UU2G .34 Hg. 83 d; 0.94.
(9-44)
Here, lIL is the interfacial mea per unit cross-section of the column (in m 2 m - 2).
U OG is the superficial gas velocity (in m S-I), Ho is the static bed height (in mm),
d p is the packing diameter (in mm), and G L is the liquid flow rate (in m 3 m 2 h -1).
These results show that the gas-liquid inteliacial area increases with an increase
in liquid velocity and a decrease in packing size. Some typical results for the
entire range of gas velocities and static bed heights studied by these investigators
are shown in Fig. 9-24. These results show that the interfacial area attained a
maximum with respect to the static bed height and the superficial gas velocity.
The decrease in interfacial area with an increase in either gas velocity or the static
bed height was believed to be due to nonhomogeneity in the bed, as indicated by
pressure oscillations.
Lemcoff and Jameson 71 measured the volumetric gas-liquid mass-transfer
coefficient during hydrogenation of acetone in a vibrating slurry reactor. They
correlated the data obtained with Raney nickel Nicat 102 catalyst (92 percent
nickel) to the temperature (in the range 7 through 21°C) and the frequency of
oscillationf The correlation is graphically illustrated in Fig. 9-25 and analytically
represented by the equation
10g1o KLl/ L = -4.36 +- 0.02607 + 0.0198f
(9-45)
Here KLl/ L is in s-', 7 in °e, and f in s. I. The results were obtained with
hydrogen pressures of 1.33 through 7.33 x 10 4 N m -2. The results clearly indicated
an improvement in the volumetric mass-transfer coefficient with an increase in the
frequency of oscillation f. Some properties of the solid catalyst used in this study
are listed in Fig. 9-25.
OYI"AMrCS OF THE GAS-LIQUID-SUSPENDED-SOLID COLUMN 347
Ho(mm)
20
120
40
60
80
100
140
160
90
"
.
d p = to mm
.-,
'I'
E
'"'
.5
--'
<:!
60
30
I
o
o Ho = 80 mm,
(] V OG 2 m s-l ,
VOl. = 80 m 3 h- 1 m- 2 I
VOL = 50 m 3 m -1 h- 1
I I
2.5 3.0 3.5
o _.L-
o 0.5
1.0
I
!.5
I
2.0
Voc;(m s-I)
Figure 9-24 InterfacIal areas as functions of gas velocity and static bed heIght If/"Om duw of Strumillo
and Kllt/ra' 32).
Physical properties of Nicat 102 (92% Ni)
solid used in this study
Surface area, m 2 g-1 50.
Porosity 0.51
Apparent density g cm- 3 4.5
Average particle diameter (1-/) 10
o
N
o
o
E-.
--
-'
::..::
to .2
10- 4
o
50
I
100
I
150
l
Pulsation frequency.f(s-')
Figure 9-25 Gas-liquId mass-transfer coefficients as functions of pulsation frequency (from dlltn (!f
Lemcr!tf and J ameMm 7 I ).
\
348 GAS-LIQUID SOLID REArTOR OE<;IGN
In summary, the above studies show thal in a three-phase fluidized bed, large
absorption rates require large particle sizes, smaller beds, and larger gas velocities.
There are no data available on the effect of fluid properties on the volumetric
mass-transfer coefficient in three-phase fluidized beds (with cocurrent gas-liquid
upflow).
Recommendations The best up to date work on gas-liquid interfacc mass-transfer
coefficients in a stirred three-phase column is by Joosten et a!.; I For a three-phase
fluidized bed, the data of Ostergaard and Fosbol,' 03 Kito et al.,59 and Nishikawa
et al. 92 should be used wherever possible. Future work should include the
derivation of a correlation for K LaL for the hydrocarbon systems. At present, the
best available correlation for the gas-liquid interfacial area in a three-phase
fluidized bed is that by Strumillo and Kudra L Eq. (9-44)].
9-6 LIQUID-SOLID MASS TRANSFER
In the limiting case of mass transfer from a single sphere resting in an infinite
stagnant liquid, a simple film-theory analysis l22 indicates that the liquid solid
mass-transfer coefficienl Ks is equal to 2D/dp, where D is the molecular
diffusivity of the solute in the liquid phase and d p is the particle diameter. In
dimensionless form, the Sherwood number
Sh = Ksdp/D
is equal to 2. For nonspherical particles, this is not valid because, in this case,
true steady-state mass-transfer conditions are never achieved.
Any form of convection, of course, increases the value of Ks. In slurry
operation with no liquid flow, gas flow induces convection. In an agitated slurry
reactor, stirring causes convection. In a pulsating slurry reactor, pulsation of the
slurry induces convection; and in a three-phase fluidized bed, the movements of
both gas and liquid phases cause convection. Anyone or more modes of con-
vection will increase the value of the solid- liquid mass-transfer coefficient. In
broad terms, the convective liquid-solid mass-transfer coefficient is correlated by
two steady state theories. Here we briefly review and compare them.
9-6-1 Steady-state Theories
Terminal velocity-slip velocity theory (n this theory, the steady slip velocity
between solid and liquid is used in the correlation for the Sherwood number.
For low particle Reynolds number, Friedlander 33 gave
Sh = 0.1)9( Re p SC)I 3 = 0.99 Pe 1;3, Re p < I, (9-46)
where Re p = dpUSL/VL and U SL = .J [( U .. . - U )2] is the relative velocity of the
solid with respect to the liquid. This relation is almost identical to the solution
. / '-- )
DYNAMIC <; OF THE GAS -LlQUII)-SUSPE"'DF.D-SOLlO COLUMN 349
of levich 74 for small particles and for Pe > 10 4 , For large Re I" FrosslingJ 4 and
Ranz and Marshall! II gave
Sh = 2 + 0.6 R ;i2 SC 113 . (9-47)
For very intense turbulence, the above equation was modified by Sage and
Gall oway l2o as
Sh = 2 + t Re li2 SC l13
I' ,
(9-48)
where A = 0.439 + 0.0513d p + 0.2341(1 + 0.05) Re /2, and I is the longitudinal
turbulence intensity. Jones and Smith 50 presented the equation
, Sh - 2 + 0.055 Re:/ 4 ( Re I' Sc)1/2, (9-49)
where Re c is the bulk Reynolds number.
The experimental data for Ks in the agitated system!> are often correlated by
a dimensionless equation of the form
Sh = 2 + K' Re '2 SC I . 3
(9-50)
(i.e., a form of Frossling equation). Values of the constant K' reported in the
literature lie hetween 0.3 and 1.0. A review of the data of Rowe and Claxton 117
in the Reynolds number range 20 through 2,000 indicates that K' = 0.76 for
liquids. Pruden and Weher, 110 however. reported K' as high as 1.04 for the three-
phase countercurrent-flow fluidized-bed reactor.
The theoretical analysis of mass transfer from small particles by Fnedlander 32
and Brian and Hales!! also showed that the Sherwood number approaches the
limiting value of 2 at low Peclet numbers. For P < 10 4 , Brian and Hales B
presenled a theoretical relation
Sh 2 = 4.0 + 1.21 Pe 2 !3. (9-51)
A review of the theoretical analysis at high Peclet number is given by Yaron and
Gal-Or. 147 Although all these studies were carried out for spherical particles,
Lochiel and Calderbank 77 have shown that they can be extended to nonspherical
particles, if the particle diameter in the relation is replaced by a diameter
corresponding to a sphere having the same ratio of external surface to volume
as the nonspherical particle. It should be noted that Eq. (9-51) can be applied to
mass transfer from a sphere falling at terminal velocity. The Peelet number in
this case is defined as
'p = gd l1p/18J;ID.
(9-52)
The relation between K and the particle diameter under some typical conditions
obtained in this manner is shown in Fig. 9-26. For Levich's asymptote at high
Peclet number, Eg. (9-51) becomes
K! = O.38(YJ1LI1P/P[)ljJ Sc- 2!3, (9-53)
where K is the value of Ks for a sphere settling at its terminal velocity. The
above relation correlates the da ta of Calderbank and Jones 12 well. Brian and
350 GAS-LIQUID-SOLID REACTOR DESIG>-.I
,
,
/-1=0.01 P,PL. '" I gcm- 3
D 10- 5 em s-I
0.05
'"
K*d I D = 2--->"
, p "
J
T
"'
E 0.01
*",
:.c:
0.005
tJ.p = 3.0
tJ.p - 1.0
D.p = 0.1 0
0.001
'2
5
10
400
Sphere diamerer, d p (/-1m)
Figure 9-26 Calculated mass-transfer coefficient for a single sphere settling at its terminal velocIty
in a liquid. s
Hales 8 also analyzed the effects of changing particle size (as would be the case
if the solid is a reactant) and transpiration velocity (the radial diffusion flow) on
Ks.
In real slurry reactors, where particles move at velocities much greater than
the free-settling velocity and where the particles are often large, the actual Ks
is much larger than Kr. Harriott 37 . 38 showed that the ratio Ks/Kt usually falls
between I and 4. As a first estimate, Ks may be twice K . which is estimated,
under conditions of free flowing velocity of a particle. from Eq. (9-51).
The fundamental objection to the above relations is that they are derived
assuming steady-state flow. In practice, the intensity of turbulence in agitated
slurry reactors is time dependent. Also, an accurate estimate of the relative
velocity between the liquid and solid is often difficult. 45 . 125 The relative velocity
has been related to various system parameters by Kuboi et a1. 67 . 68
Yashitome et al. t48 studied the mass transfer from single samples of benzoic
acid suspended in an air-water bubble-column. Spherical, cylindrical. and disk-
shaped samples were used. The diameters of the particles (ranging from 25 through
75 mm) were considerably larger than the catalyst sizes normally used in gas-
liquid-solid catalytic slurry operation. The data were correlated using the slip
velocity theory.
Kobayashi and Sait0 61 correlated their data by a relation
Ksd p = Sh = 2 + 0.212 ( d [P" - PL]g ) I/3 ( d p UOGPL ) U.112 (9-54)
D IhD flL
DYNAMICS OF THE GAS -LIQUID-SUSPENDED-SOUD COLUMN 351
whereas the liquid-solid mass-transfer coefficient in a vibrating slurry reactor has
been studied by Lemcoff and Jameson. 72 Two diffe(ent expressions were obtained.
For the case of bubble-cycling, the Sherwood number was correlated by the
expression
Sh = 2 + 0.434 SC l/3 (fAod,,/vdo.85f2Ao/dp)-O.045
(9-55)
'"
and with no bubble-cycling, a relation
Sh = 2 + 0.0132 SC l/3 (f Aodp/vdo. 75(2Ao/dp) - O.l5(f2 Ao/g) 1.42 (1i-5f)
was suggested. Here, f is the frequency of oscillation (in s - t) and Ao is the
amplitude of oscillation (in cm). The Sherwood number is defined in terms of the
particle diameter.
Kolmogorolf's theory Brian et al.,9 Elenkov et al.,26 and Middleman 84 used
Kolmogoroff's theory of local isotropic turbulence in an attempt to correlate the
effective relative velocity with some macroscopic variables, such as stirrer speed
and particle diameter. From the dimensionless analysis of agitated slurry
reactors,45,84 they suggested a correlation
Sh/ScI/J ex. J{(Sc)[(Pd /vt)IIJ]O.JJ 0.7 t}, (9-57)
where P is the power input per unit mass of slurry. Brian and Hales 8 also
correlated their data using this theory. Some of their typical results are shown
in Fig. 9-27. The relations shown in this figure were verified by various literature
data. The data for power inputs in various types of agitated slurry reactors are
given in the literature. 35 ,93.119
Kuboi et al. 67 derived a relation between Re p and (he specific power group
(Pd:/v3) 1/ 3 . With the help of experimental data, they showed that, to within an
100
.., 10
u
U1
9-
.J"
'"
::..::
0.1 2
10
0.1
10 3
I 10
pI/ 3 d;'3 pL fill
Figure 9-27 Effect of power input on mass transfer to spheres suspended in an agitated liquid Urom
dlllll of Brian lInd H ales s ).
352 GAS LIQUID SOUD REACTOR DESIGN
accuracy of .:!:: 50 percent.
Re p - 1/2(Pd /V3)1/3. (9-58)
Thus, a relation of the type (9-58) may be valid because of the fact that the
specific power group leads to nearly equal particle Reynolds number based on
the relative velocity. Kuboi et aL 67 also showed that, as long as an approximate
relative velocity is used, the steady state theories predict almost as good a mass-
transfer coefficient as the more complex unsteady-state theories, a view not
supported by some other workers.75.1l5 They claimed that the velocity of a
particle relative to the surrounding liquid may correspond closely to the efl"ectivc
relative velocity for particle-to-liquid mass transfer.
Sykes and Gomezplata 134 determined the liquid-solid mass-transfer co-
efficient for 0.32-cm-diameter spherical particles suspended in stirred aqueous
iodine solutions. The particle density was within 5 percent of the liquid density.
The effects of impeller speed (200 through 600 rev min - I). Schmidt number (770
through 11,300), and impeller type (fan-disk turbine, propeller. and 45° paddle
and turbine) on the mass-transfer coefficient were examined. The data were
correlated with an average deviation of 8 percent by the following expression:
Sh = 2 + 0.109 (Re*)0..'8 (Sc)°.50,
(9-59)
where
Re* = ( sodf ) ( IjJ;m p ) I!3
VL IjiFDT
(9-60)
po?)
t/Jimp= d 5'
PLSO i
Here. Po is the impeller power, So is the impeller speed. d j is the impeller diameter.
PL and \!L are the density and kinematic viscosity of the liquids, respectively. The
term t/JM5T adjusts the actual impeller speed to the speed at which a fan-disk
turbine would rotate for the same power input per unit mass, Although no gas
was used in this study, the correlation should be useful as a first estimate for
Ks in various types of stirred three-phase slurry reactors.
Most recently, Sano et atilt derived a relation for the lIquid-solid mass-
transfer coefficient (or Sherwood number) based on Kolmogoroff's theory for
isotropic turbulence. The Reynolds number based on this theory is defined in
terms of E. the rate of energy dissipation per unit mass of liquid. d p . the specific
surface diameter, and VL, the kinematic viscosity of liquid. Thus. the modified
Reynolds number R-e was defined as R.e = Etl /\!l. The Sherwood number was
correlated as
Sh = [2 + 0.4 Re li4 Sc 1 / 3 ]t;bc.
(9-6] )
where £Pc is the Carman surface factor, which is a function of specific surface
diameter and the screen diameter of the particles, as given by the relations
d p = 6/p p (1s>
(9-62)
,.
DYNAMICS OF THE GAS-LIQUID -SUSPENDED-SOLID COLUM1\I 353
0.1
tP c
E;
5
""r::JC-
tP c d p
. 0
* )(
. 0
material
benzoic acid
KMn04
'naphthol
0.1
1
d; (mm)
Figure 9-28 Specific surface diameter
and Carman's surface factor lafter
SlIl1<) et al. 121 1.
0.1
£Pc = 6/(ppa.d ),
(9-63)
where 0, is the specific surface area ofthe particles. For some particles, the rela tions
between CPc, d p , and d obtained by Sano et aI.' 21 are shown in Fig. 9-28. In
Eq. (9-62), Sh is the Sherwood number based on d p , the particle diameter, and Sc,
the Schmidl number of the liqu id.
The relations for the Sherwood number presented by Calderhank and Moo-
Young,13 Kawamura and Sasano,55 and Ishii and Fujita 47 can also be expressed
in the form ofEq. (9-61). They can be represented as
Sh = 0.13 R I 4 Se l !3 (Ref. 13), (9-64)
Sh = 0.72 Re o. 208 SC l/3 (Ref. 55), (9-65)
and
Sh = 0.095 R o.23 Seo. s (Ref. 47). (l)-66 )
A comparison of the various correlations for the Sherwood number in terms of
a ShjSc'j3 versus Re plot is illustrated in Fig. 9-29. As indicated by Sana et al. 121
the same correlations are applicable to agitated vessels and bubble-columns.
9-6-2 Some Remarks and Comparisons of Two Theories
As outlined above, steady-state theories for the liquid-solid mass transfer are
largely classified into two categories; i.e., those based on Kolmogoroff's theory
and those based on the terminal velocity -slip velocity approach.
The Kolmogoroff theory implies that the mass-transfer coefficients are the
same at equal power inputs. Results to the contrary are, however, noted. In a
354 GAS-LIQUID-SOLID REACTOR DESIGN
stirred reactor, at equal power inputs, thc mass-transfer coefficient depends upon
the impeller type, size and position. Levins and Glastonbury 75 have shown that
the Reynolds number for the microscale of turbulence is insufficiently large for
Kolmogoroff's theory to be applicable.
The model based on terminal and slip velocity approach is rather tenuous.
It breaks down as the density difference between liquid and solid approaches zero.
Under highly turbulent conditions, an accurate estimation of slip velocity is
rather difficult, and there is disagreement on whether or not the relative velocity
between the solid and liquid alone is enough to obtain an accurate estimate of
the mass-transfer coefficient.
Nienow B I,I.9o has compared the predictions of the mass-transfer coefficient
from both theories. He has shown that the dependence of mass-transfer rates on
u
.c
CI)
9
Sc=-Pr=- 137 _----
--------
4
0.01
0.1
10
10 2
10 3
Re l / 3 =- (Eai,/vl> 113
Sh =- Sherwood number
Sc =- Schmidt number
E =- rate of flow energy sUPflY per
unit mass of liquid (cm /sec 3 )
d p =- particle diameter (cm)
v L =- kinematic viscosity of liquid (cm 2 /sec)
I. Kawamura and Sasano (55), Sc =- 712 - 1020
2. Ishii and Fujita (47), Sc =- 1000
3. Harriot (37), Sc =- 3600
4. Harriot (38), Sc =- 518
5. Brian et. al. (9), Pr = 13.8
6. Harriot (37), Sc =- 1000 - 11000
7. Barker and Treybal (6), Sc =- 735-1328
8. Wilhelm et. al. (144), Sc =- 950
9. Calderbank and Moo Young (13)
10. Sano et. al. (121)
Figure 9-29 Energy correlation for the liquid-solid mass-transfer coefficient (ofrer Sono el al. 12 ').
DYNAMICS OF rHE GAS-LiQUID-SDSPENDED-SOLID COLUMN 355
the particle diameter and physical properties predicted by these theories is, in
general, similar. He showed that for a system where the particles are just suspended.
Kolmogoroff's theory would predict
Sh Sc- 1/3 CI.(gl1.p/pdO.34d .15 /VP'. 6B .
(9-67)
According to the terminal velocity-slip velocity theory, for particles less than
500 11m,
(Sh* - 2) Se I / 3 = 0.28(gAp/pdo.36d .07/(V .72),
(9-68)
where Sh* corresponds to the mass-transfer coefficient Ks under the terminal
velocity condition. The mass-transfer coefficient at the impeller speed which just
causes complete particle suspension would be greater than Kt. This enhancement
in Ks would increase with increasing particle size, as shown in Fig. 9-30. The
relation shown in this figure can be correlated as
E* = Sh = ( ) O.08
Sh* 40 11m
(9-69)
For d p < 40 lm. Sh Sh*. When Sh* »2,
Sh Sc- l /3 x (gAp/pd.36d .15/V .72.
(9-70)
For d p > 1,500 11m,
Sh Sc- 113 = 0.77E*(gAp/pdo.25d .75/v /2.
(9-71)
The above relationship is somcwhat different from the One obtained from
Kolmogoroff's theory.
1.6
*
i:.o.:I /0
.; 1.4
B
u
"" /00
....
'"
E
'" 0
u 1.2
<=
<II
..c: &ti
<=
u.J
1.0 I I
10 20 50 100 200 500 1,000 2,000 5,000 10,000
d p (/-1m)
Figure 9-30 The dependence of the enhancement factor E* on particle size (from dara of Nienow 90 )
356 GAS -LIQUID-SOUl) REACTOR DE."IGN
Recommendations At present. the best available correlation for the liquid-solid
mass-transfcr coefficient in a three-phase fluidized-hed column is given by Eq.
(9-61), and its use is recommended. The equation, however, needs to be checked
against the experimental data with hydrocarbon systems.
9-7 WALL MASS TRANSFER IN THE SLURRY COLUMN
To the auth()r's knowledge, there are no data presently available on the wall mass
transfer in three-phase slurry column. Postlethwaite and Holdner loB examined the
wall mass transfer of dissolved oxygen in aqueous slurries of sand and iron ore
in the concentration range 10 through 20 weight percent. They corrrelated their
data using Chilton-Colburn's analogy. In a three-phase slurry reactor, the
turbulence caused by bubbles should give considerably higher wall mass transfer
rates than those reported by Postlethwaite and Holdner.loB.lo'} However, their
data can be used only as a first estimate for the wall mass transfer calculations
in three-phase fluidized-bed reactors.
9-8 HEAT TRANSFER
Apparcntly no study on heat transfer in a three-phase agitated reactor has yet
bcen published. The heat transfer in a three-phase fluidized bed from a suspended
cylindrical heating element is given in a series of papers by Kolbel et al. 62 64
and Miiller. B7 Their works show that, in the absence of solids, Nusselt and
Reynolds numbers based on the diameter of the heating element, the conductivity
and viscosity of the liquid, and the nominal gas velocity are related by the
expressions
Nu = 22.4 ReO. 355 ,
Nu = 43.7 Reo. 22 ,
Re < I 50;
Re> 150.
(9-73a)
(9-73b)
The heat-transfer coefficient was constant above nominal liquid velocities of
10 cm s-'. No effect of Prandtl number (varied from 5 through 1,2(0) was
obtained. The heat-transfer coefficient decreased with an increase in viscosity and
a decrease in surface tension allow gas velocities, but was unaffected by changes
in the column diameter (as long as the column diameter-bubble diameter ratio
> 20) and the height above the gas distributor.
Experiments with suspended sand particles (average diameter = 0.12 mm)
indicated an increase in the heat-transfer coefficient with increasing sand concen-
tration with a maximum value (6,000 kcal m 2 h - I °C- t) being achieved at
50 percent (based on the liquid volume) concentration. For a suspension of
Kieselguhr in water and oil, they obtained
Nu = 227.5(v,jv,,)0.1 Re O . 16 ' Pr- O . 038
(9-74)
DV!\;AMICS OF THE GAS LIQUID -SUSPENDED-SOLID COLUMN 357
in the laminar region and
Nu = 454.0(vdv w )o.1 Re o . 113 Pr- O . 135
(9- 7 5)
in the turbulent region. Here, Nu and Re are based on the length of heating
element and VL, V w are the kinematic viscosities of the liquid medium and of water.
respectively. The heat-transfer coefficient increased with the panicle size.
The wall-to-hed heat-transfer coefficient in a three-phase fluidized bed was
measured by Ostergaard lOo and Viswanathan et a1. 140 The first author measured
the wall-to-bed heat-transfer coefficient in an air-water-glass ballotini (O.S-mm-
diameter) system in a 7.62-cm-diamcter bed. It was found that the heat-transfer
coefficient was a strong function of gas velocity but a rather weak functIOn of
liquid velocity. Viswanathan et al. 140 studied the wall-to-bed heat-tra sfer
coefficient in a 5.I-cm bed of air, water, and quartz particles of 0.649- and
. O.928-mm mean diameter. The effects of gas and liquid flow rates and of the solid
concentration were examined. The heat-transfer coefficient showed an optimum
with respect to the gas/liquid ratio and the solids concentration. The measurement
of heat-transfer coefficients and effective thermal conductivity for gas- liquid
fluidized beds has also been reported by Manchanda. 7B
By comparison with a fixed-bed gas-liquid reaction, a three-phase ftuidized-
bed reactor offers the advantage of very high effective thermal conductivity and,
therefore, a more uniform temperature distribution in the reactor. Van Driesen
and Stewart 139 have demonstrated this for large-scale catalytic desulfurization
and hydrocracking of heavy petroleum fractions.
The most recent study on heat transfer in a three-phase fluidizcd bed is
reported by Armstrong et al. 4 rhe experiments were conducted in a large three-
dimensional column 24.1 cm in diameter and 274 cm high. The heat-transfer
surface was concentrically located within the column and consisted of a brass
sheath 6.35 cm in diameter by 25.4 cm long, which housed four 1,500-W electric
heaters. An air-water-glass sphere system was examined. Four particle sizes (0.5,
I, 3, and 5 mm) were studied. The superficial velocities examined for the air
ranged from 0 through 23.77 cm s- t and that for Water from 0.82 through
12.6cm S-I.
The results showed that the heat-transfer coefficient increased with the
superficial gas velocity for all liquid flow rates and particle sizes. For a given
particle size, the heat-transfer coefficient showed a maximum with respect to the
bed porosity. For three particle sizes, namely 1 mm, 3 mm, and 5 mm, the effect
of total gas plus liquid holdup on the heat-transfer coefficient obtained in this
study is illustrated in Fig. 9-31. The results show a close resemblance between
the trends for the two-phase (liquid solid) and three-phase (gas-liquid-solid)
fluidized beds. In general, the maxima in the curves of Fig. lJ-31 shifted to lower
porosities with increasing particle size.
The heat-transfer coefficient also displayed an interesting beha vior with respect
to the particle diameter. Some typical results illustrating this behavior are shown
in Fig. 9-32. These results indicated that, for particle size greater than approxi-
mately 3 mm, the heat-transfer coefficient remained essentially independent of
358 GAS LIQUID SOLID REACTOR DESIGN
the particle size. For small particles (d p less than 3 mm), the heat-transfer coefficient
increased with particle size except at high gas flow rates, where the heat-transfer
coefficient first decreased with an increase in particle size, attained a minima at
d p of about 1.5 mm, and then increased with a further increase in the particle size.
The gas rate at which this local minima in the heat-transfer coefficient with
respect to the particle size first occurred decreased with the liquid rate. The
results also showed that, in general, three-phase beds gave higher heat-transfer
coefficients than two-phase (liquid-solid) beds. A.n exception to this was, however,
observed for liquid-gas beds at relatively low gas rates, which exhibited lower
values of the heat-transfer coefficient than liqu id -solid beds. The heat-transfer
coefficient in a three-phase fluidized bed is, in general, increased by the presence
of both the solid and the gas phases.
Recommendations At present, no correlation for the heat-transfer coefficient in
a three-phase fluidized bed is available and it should he obtained in future study.
Experimental data with hydrocarbon systems are needed. The data of Oster-
400
-;
u
0
I
.<:
'I 350
E
:J
M
2- ><
.... ..s::
c::
.
u 300
Ii::
.....
cu
0
u
....
c::
'II
-i 250
0;
cu
::I:
..... -.....
, ?--......... ........
, / - ."
..... - .-...........
" .-. ....
./ ...................
, . .........,
/ --- -y-...
. . --.- - - -- .......
/ "" - /' 'e...
, , "
,',"11"'" "
",. /
,
,...e-_
,/ ",
/ .
.
I
200
O.S 0.6 0.7 0.8 0.9
ht + ha
dp(mm) V OG (cm s-I )
1 . 0
3 . 5.94
5 . 17.8
Figure 9-31 The effect of holdup on the heat-transfer coefficient in three-phase fluidized beds (data
(It" Ann. troJ1u et al. 4 ).
T
U
o
T
.<::
...
I
E
tJ
'"
-
t=
<)
'u
..:
.....
...
o
tJ
..
...,
<::
'"
!
'"
...
:c
DYNAMICS 01' THE GAS-LIQUID .SUSPENDED-SOLID COL.UMN 359
400
'
Q-
Q
350
300
V OG (cm s-l )
. 17.8
. 1'1.86
o 5.94
Q 0
(liquid-solid)
J
Figure 9-32 The effect of particle SIze
on the heat-transfer coefficient in
three-phase: fluidized beds (data of
Armstrony Cl ,,1. 4 ).
VOL = 9.2 cm s-I
250 ;"
" sff
lool
o
4
6
2
d p (mm)
gaard,100 Viswanathan et al.,140 and Armstrong et al. 4 can be used wherever
possible.
ILLUSTRA TION 9-1
The solvent-refined coal (SRC) reactor is normally operated at 850 of and 2,000
Ib 1 in - 2 pressure. Creosote oil is used as solvent. In a typical operation, coal
particles of approximately 74 11m diameter with a solvent/coal ratio of 2 are used.
The slurry is passed through a 2.5-in-i.d., 4-ft-tall reactor. Assuming that coal
specific gravity = 135, oil specific gravity = 0.9, surface tension of oil under
reaction conditions = 5 dyne cm - I, viscosity of oi] under reaction conditions =
0.7 cP, static slurry height in bed = 10 cm, surface tension of liquid (ad = 10 dyne
cm - I, relative wettability with respect to quartz = r' = 0.5, surface tension of
water (a w ) = 72 dyne cm- l ,
(a) estimate the critical gas velocity reqUIred to completely suspend the coal in
s]urry;
(h) estimate the critical holdups for various phases in the reactor at critical gas
velocity.
360 GAS-UQUlD.-SOLID REACTOR DFSIGN
SOLUTION
(a) The correlation of Narayanan et al. [Eqs. (9-7) through (9-10)] can be used
to estimate the required critical gas velocity:
C. = g coal x 100jg solvent - 50 percent
H, = C/l00 = 0.5.
Equation (9-8) gives
U(,G = 1.25(dj2)"e-o.0 3l , U OG .
tl = 0.2 for particles of diameter of order of 100 J1m. U OG can be obtained
from Eqs. (9-9) and (9-10). For the present case. Pl = 0.9 g cm 3, pp = 1.35 g
cm - 3, H SL = 10 cm, H. = 0.5, d p = 0.0074 cm. From these data and using Eq.
(9-10), one gets
J - ( [ 2 x 0.0074 0.5 x 10 ])
q; = 2 x 981 x (1.35 - 0.9) -- + ... -
. 3 x 0.9 1.35 + 0.9 x 0.5
= 50.
U OG can be obtained by lrial and error using Eqs. (9-9) and (9-10). In the
present case, 4> = 50. Eq. (9-10) is applicable. and this expression gives
U OG = 19.9cms- t .
The critical gas velocity is thus calculated as
(h)
( 2.5 ) 0.2 .
U ea = 1.25 x 2" e .0.03 so x 19.9
= 5.76cms- ' .
U OG = U CG in part (a) = 5.7(-, em s-',
PG = PH, = 4.6 x 10- 3 g cm 3
PG = Pill = 1.7 x 10- 4- g em I s - '.
PG and PG are properties at the operating conditions (2,000 Ib.. in - 2, 850 OF).
ReG = UOGPGdc/ IG'
de = 2.5)( 2.54 = 6.35 cm. Hence,
ReG = 5.7ft x 4.6 x 10- 3 /1.7 x 10 4
= 155.8.
L:sing the correlation of Roy et at.. III!
ha = 1.72 x 10 2LReG(a w lad!3]0.44
= 1.72 x 10⁻²[155.8(72/10)113]°.4-4-
= 0.212
UY"JAMICS or. THF (;AI; L1QUILJ SUSPENDED-SOLID COLUMN 361
Vb - bubble velocity - UOG/h G - 5.76/0212 = 27.2 cm S-I,
N b = modified hubble Reynolds number = (JL!U b J1L
10 x 981
x 100
27.2 x 0.7
= 51,531.6.
From Eq. (9-14),
C/ I .. = 1 - 0.58921og 10 J1L + 0.102610gio J1L.
For J1' = 0.7 cP, C}JI from the above equation can be estimated to be 1.094.
U ,0 = termmal settling velocity of solid particles
= yd (pp - pd./18 IL
= 981 X (0.0074)2 x (1.35 - 0.9)m8 x 0.7 x 10 2)
= 0.192 cm S-I
The critical solid holdup can be calculated from Eq. (9-12). For ReG < 600,
hs = 6.84 x 1O- 4 l 155.8(51531.6)-0.23 x e ;) 0.18(0.5) 3 x 1.0941
= 0.188.
The liquid holdup is thus calculated as
h L = I - hs - h G = 0.6.
[LLUSTRATION 9-2
For a three-phase fluidized-bed coal-liquefaction reactor. estimate
(a, the axial dispersion coefficient for the liquid phase,
(h) the axial dispersion coefficient for the solid phase,
(d the gas- I iquid mass-transfer coellicien t for hydrogen tra nsfcr.
The gas (mainly hydrogen) flow rate can be taken as 0.75 m.1 h" I at the operating
conditions and the slurry flow rate is 100 Ibm h 1. Assume all other reactor
conditions to be the same as those used in the previous illustration. For part (e)
take the molecular difl"usivity in the liquid phase to be 10- 3 cm 2 S-I.
SOLUT10N
(a) Liquid mass flow rate = 2 x 100/3 = 6fi.67 Ibm h I
= 66.67 x /(2.2 x 3,(00) x 1,0oo
= 8.42 g S-I.
362 GAS-UQUID-SOUD REACTOR DESIGN
fi . II ' . d I . 8.42/0.9
Super CIa Iqui ve oClty. VOL = - - - 2
(n/4)(2.5 x 2.54)
= 0.295 cm s I.
_ . . 0.75 x 10 6 /3,600
Superhcml gas veloCIty. V OG = (n/4)(2.5 x 2.54)2
= 6.57 cm S-I.
MdhvdJ We use Eqs. (9-35) and (9-36) to calculate Ezl. the axial dispersion
coefficient for the liquid phase:
Fr L = V"5dd p g
= (0.295)2/(0.0074 x 981) = 0.012,
FrG = V6a/d p Q = 6.57 x 6.57/(0.0074 x 981) = 5.95.
Rel = dpVOI__pL/P-L = 0.0074 x 0.295 x 0.9/0.007 = 0.281,
Rea = dpUoaPG/P-G = 0.0074 x 6.57 x 4.6 x 10- 3/1.7 X 10-4-
= 1.325.
From Eq. (9-36),
( HMU ) ( 0.012 x 1.325 ) 0,842
- - = 5.05 (0.281)-0.45.
Ho Uo,,=O 0.9
= 0.299.
From Eq. (9-35),
( HMU ) = 0.299 + 0.068 ( 0.012 x 1.325 ) 0'12H ( 5.95 x 1.3235 ) 0,168
Ho UU(J 0.9 4.6 x lO-
x (0.281 x 1.325)0. t 2
= 0.425.
Ho = unfluidized bed height = 10 cm. Therefore,
HMU = 0.425 x Ho = 4.25 cm,
HMU = 2H/Pe = 2En/V ol :
hence,
E Zl = VOL HMU/2 = 0.295 x 4.25j2 = 0.626 cm 2 s-'.
DYNAMICS OF THE GAS-LiQum SUSPENDED-SOLID COLUMN 363
Method 2 We use Eq. (9-37):
J(Fro) = Uoa/J{g d e ) .
de = 2.5 in.
Fro = 6.57/981 x 2.5 x 2.54 = 0.0102.
13 x 0.0832
PeL = Uoadc/EZL = (l + 8 x ( 0.0832) 0.85) = 0.55,
E ZL = 6.57 x 2.5 x 2.54/0.55 = 75.85 cm 2 s- t.
It is interesting to note two orders of magnitude difference in the pre-
dictions of E ZL by the two methods described above. Method 1 does not
include the effect of column diameter on E zL , whereas Method 2 does not
include the effects of fluid properties and the particle diameter on E ZL . It is
well known that in gas-liquid (no solids) bubble-columns, the diameter of
the column plays an important role in the determination of EZL' The fluid
properties affect Ezr. only mildly and the solid particles affect E ZL significantly
only when their size is large. For the small particle size examined in this
problem, Method 2 should therefore be more appropriate.
(b) We use Eq. (9-39) to estimate the axial dispersion coefficient for the solid phase.
Thus,
Pes = UoGdc/Ezs = 13 J(Fra)( 1 T 0.009 Rep, /(Fra) 0.8)/(1 + 8" (Fido. 85 )
ReI' = dpU'O/v L = 0.cJ074 )( 0.192 x 0,9/0.007 = 0.183,
Pes = 13 x 0.0832 x (1 + 0.009 x 0.183 x (0.0832)-0.8)/0 + R x (0.0832)°.85)
= 0.562.
E zs = 6.57 x 2.5 x 2.54/0.562 = 74.29 cm 2 s- t.
Note the closeness in the values of Eu (Method 2 above) and E zs .
(c) Equation (9-42) can be used to calculate the mass-transfer coefficient at the
gas-liquid interface. Thus,
kd IL/PLDf/3 = 0.31 I I1PL{JIh/P'f), 13.
I1PL = PI. - PG = 0.9 - 0.0046 0.9,
D= to- 3 cm 2 s- 1 .
Hence,
( 0.9 x 10 2 ) 213 ( 0.9 x 981 x 0 .007 ) 1/3
k L = 0.31
0.9 x 10- 3 0.9 x 0.9
= 0.31 x 1.97/3.94 = 0.155 cm S-I.
364 GAS-LiQUID-SOLlr> REArTOR DESIGN
NOME1'\CLA TURE
£II. gas-liquid interfacial area for mass transfer per unit liquid volume
{lL gas-liquid interfacial area per unit column volume
as specific surface area of a packing
a w wall effect factor
aL interfacial area per unit cross section
A cross-sectional area of a column
Ao amplitude of oscillation
B constant
CD drag coefficient
C. percent solid concentration
C 01 viscosity correlation factor
d h bubble diameter
de column diameter
de equivalent bubble diameter
d; impeller diameter
do hole diameter
d" particle diameter
D molecular diffusivity
E energy dissipation per unit mass of liquid
Ez axial dispersion coefficient
E ZM axial dispersion coefficient in a multistage column
E* enhancement factor
L oscillating frequency
f a function defined by Eq. (9-57)
Fr Froude number (U 2 jd p {J)
9 acceleration due to gravity
G superficial volumetric flow rate per 'unit cross-section
h holdup
hes critical solid holdup
h r average liquid holdup in the particulate region
ho holdup in perforated plate hole
h" holdup in the wake of a bubble
hws ratio of solids holdup in wake to the solids holdup in the liquid-
fluidized region
h. heat-transfer coefficient
11' holdup in a liquid .solid fluidized bed
h* holdup at incipient fluidization
H expanded hed height
He Henry's law constant
H L height of clear liquid
Ho unfluidized bed or static slurry height
H. fractional solids concentration
HP impeller horsepower
HMU
J
k
k
K
k L
KG,KL
Ks
K*
s
K O
K 1
AL
L
III
lvl
n
110
N
N b
Nu
p
Pe
Pe
Po
Pr
R
Re
Re
Re e
Re p
Re p
Re*
s
So
Sc
Sh
T
U
Vb
U bo
U B
U c
U o
DV'\IAMICS OJ TIiE GAS- L1QU1U-SUSPENOED-SOUIJ COLUMN 365
height of a mixing unit as defined in Eg. (9-35)
longitudinal turbulence intensity
defined as hw/hG
ratio of liquid-wake volume to bubble volume
fluid consistency index number
liqUid film mass-transfer coefficient
overall gas-liquid mass-transfer coefficients
liquid-solid mass-transfer coefficient
liquid-solid mass-transfer coefficient for spheres settling at terminal
velocity
a quantity defined by Eq. (9-41)
constant in Eg. (9-50)
distance between two consecutive plates in a multistage column
column length
an exponenr defined by q. (9-33)
consta'nt
parameter dependent on the settling particle Reynolds number or
Richardson and Zaki expansion index
fluid behavior index
impeller speed
bubble flow number
Nusselt number
pressure
Peclet number for axial dispersion
Peclet number for liquid- solid mass transfer
power to agitator
PrandtI number
universal gas constant
Reynolds number
a modified Reynolds number defined in Fig. 9-29
bulk Reynolds number
Reynolds number (dpU p/JL)
settling particle Reynolds number ldpUtoPl.hld
Reynolds number given by Eq. (9-59)
constant dependent on stirrer and baffle conllguration
impeller speed
Schmidt number
Sherwood number
temperature
interstitial velocity
rising velocity of bubbles
rising velocity of a single bubble
relative velocity of bubble and fluid
critical velocity
superficial velocity
366 GAS-LiQUID-SOLID REACTOR DE.'\lGN
ut superficial velocity at incipient fluidization
V superficial hack flow velocity through a perforated plate
V SL relative velocity between particle and fluid
U.. Stokes free settling velocity
VI Vod£o
VOL relative velocity hetween gas and liquid
V, terminal free settling velocity of particles in liquid medium
V ,O terminal velocity of a single particle in a stagnant liquid
V lw average linear velocity of non wake liquid
U... relative velocity between gas and nonwake liquid
V' defined by Eqs. (9-9) and (9-10)
V L volume of liquid in a column
We Weber number
W s total solids wcight
x a constant In Eq. (9-43)
}' a constant in Eq. (9-43)
Y a constant
Greek symbols
fJ fractional area of a plate where liquid is ascending
y relative wettability factor
Yo backflow ratio
lis volume fraction not occupied by solids
v kinematic viscosity
Vw kinematic viscosity of water
VCD gas drift flux
eo bed voidage for zero gas flow
P density
I1.p Pp - PL
I1.PL PI. - PG
Po fluidized bed density
(1 surface tension
J1 viscosity
£Pc Carman's surface factor defined in Eq. (9-28)
£PL volume fraction of liquid in a slurry
Ij!FDT correction factor in Eq. (9-60)
(1' standard deviation
SubscriplS
G gas phase
L liquid phase
S solid phase
t terminal velocity conditions
p particle
DVNAMICS OF THE GAS -LiQUID-SUSPENDED-SOLID COLUMN 367
REFERENCES
I. Adlington, D., and E Thompson, in ProL'eedings of the 3rd European Symposium on Chemical
Reaction Engineering. Pergamon Press, Oxford, 1965, p. 203.
2. Aoyama, Yo, K. Ogush K. Koide, and H. Kubota. J Chon. En!/. (Japan), vol. 1, p. 158. 1969.
3. Armstrong, E. R., C. G. J. Baker, and M. A. Bergougnou, in Fluidization Technology, (D. L.
Keairns, ed.), Hemisphere Publishing Corp., Washington, D.C., 1976, vol. I, p. 405.
4. Armstrong, E. R.. C. G. J. Baker, and M. A. Bergougnou. in Fluidization Technology, (D. L.
Keairns, ed.), Hemisphere Publishing Corp., Washington, D.C., 1976, vol. I, p. 453.
5 Barile, R. G., and D. W. Meyer, Chern. Enq. Progr. Symp. Ser., vol. 67, p. 134,1971.
6. Barker, J. J., and R. E. Treybal, AIChE J., vol. 6, p. 289, 1960.
7. Bhatia, V. K., PhD Thesis, University of British Columbia; also in Proceedings of the Inter-
national Symposium 011 Fluidization al1d Its Applil'lJtions, Cepadues-Editions, Toulouse, 1974, pp.
380-392.703-75.
('8) Brian, P L. T., and H. B. Hales, AIChEJ., vol. 15,419,1969.
'--i Brian. P. L. T., H. B. Hales, and T. K. Sherwood. AICh£ J., vol. 15, p. 727, 1965.
:.10. Calderbank, P. H., Tral1s. Inst. Chern. £lIg., vol. 37, p. 173, 1959.
II. Calderbank, P. H., in Mixing (V. W. Uhl and J. B. Gray, eds.), Acadt:mic Press. New York,
1967, vol. 2. Chap. 6.
12. Calderbank, P. H . and S. J R. Jones, Trans. ItlSl. Chem. £ng.. vol 39. p. 363, 1961
13. Calderbank, P. H., and M. B. Moo-Young, Chern. £ng. Sci., vol. 16, p. 39, 1961.
14. Chandrasekaran, K., and M. M. Sharma, Chem. £ng. Sei., vol. 32, p. 669, 1977.
15. Chen, B. H., and W. J. M. Douglas, Con. J. Chem. £l1g.. vol. 46. p. 245, 1968.
16. Cooper, C. M.. G. A. Fernstrom, and S. A. Miller, Ind. £ng. Chern., vol. 36, p. 504, 1944.
17. Cova, D. R., I&£C Process Design De,;., vol. 5, no. l. p. 20. 1966.
18. Dakshinamurthy, P., K. V. Rao, R. V. Subharaju, and V. Subrahmanyam, l&£C Process
Design Del'" vol. II. p. 318, 1972.
19. Dakshinamurthy. P.. V. Subrahmanyarn, and J. N. Rao. I&EC Process Desi(//1 Dev.. vol.
10, p. 322, 1971.
20. Darton, R. c., and D. Harrison. Trans.lnsl. Che",. £ng., vol. 52, p. 30], 1974.
21. Darton, R. c., and D. Harrison, Chem. £n(/. Sci., vol. 30, p. 581, 1975.
22. Darton, R. c., and D. Harrison, in FlUIdization Technology. (D. L. Keairns, ed.), Hemi.
sphere Publishing Corp.. Washington, D.C., 1976, vol. I. p. 399.
B. Dierendock. L L. Van, Thesis, Enschede, 1970.
24. Eckenfelder, W. W., Jr., Chem. £ng. ProgT.. vol. 52, p. 286.1956.
25. Efremov, G. I., and I. A. Vakhrushev, Int. Chern. £ny., vol. 10, p. 37. 1970.
26. Elenkov, D., and D. C. V. Boyadzhiev, Burg. Acad. Sci., vol. 18, p. 755, 1965.
27. EI-Temtamy, S. A., and N. Epstein, in Proceedings of the Second Pacific Chemical Engineering
Conyress. Denver, Colorado, Auqust 28-31,1977, vol. 2, p. 1397.
28. Epstein, N., Can. J. CI1em. £1Ig., vol. 54, p. 259, 1976.
29. Epstein, N., and D. Nicks, in Fluidization Technology, (D. L. Keairns, ed.), Hemisphere
Publishing Corp., Washington, D.C., 1976, vol. I. p. 389.
30. Farkas. E. J., and P. G. Leblond, Can. J. Chern. £1Ig., vol. 47, p. 215. 1969.
31. Farley, R. and D. J. Ray. Bril. Chem. £ny., vol. 9, p. 830,1964.
32. Friedlander. S. K., AICI1£ J., vol. 7, p. 347. 1961-
33. Friedlander, S. K... AICh£ J.. vol. 3. p. 43, 1957.
34. Frossling, N., Beitr. Geophys., vol. 52, p. 170, 1938.
35. Furusawa, T., and J. M. Smith, I&EC Fund., vol. 12, p. 197, 1973.
36. Gel'perin, N. L, V. Z. Grishko, V. I. Savchenko, and V. M. Shedro, Khimiche.rkoe, NeJiyanoe
Mashil1ostmdll1ie (Chemical and Petroleum Machinery Manufacturing), Nauka, Moscow, 1966.
vol. I, p. 22.
37. Harriott, P., AIChE J., vol. 8, p. 93, 1962.
38. Harriott, P., AIChE J.. vol. 8, p. 101, 1962.
368 GAS-LiQUID-SOLID REACTOR DESIGN
39. Henrik en, H. K.. and K. Os[crgaard. Chern. Eng. J.. vol. 7, p 141. 1974.
40. Henriksen, H. K.. and K. Ostergaard. Chern. Ell!!. Sci.. vol. 29, p. 626. 1974.
41. Henriksen. H. K., PhD Thesis, Denmarks Teknlskc Hojskole. 1972
42. HIxon. A. W.. and L L. Gaden. Jr., Illd. £/11/. Chern.. vol. 41. p. 179:>. 1950.
43. Hovmand. S.. and J. F. David on. Trails. ll1.H. CI'CIll. En!!.. vol. 46. p. T190. I96K.
44. Hughmark. G. A.. I&EC Pm<"t!.<s f)"W/II D<'I".. vol. P. p. 21H. 1967.
45. I--Iughmark. G. A., Chern. Ell!!. Sci.. vol. "!7. p. 537. 1972.
46. Im:lfuku. K.. T. Y. Wang. I< Koidc. ,lI1d 1--1. KubotOi. .I. C/"'II1. En!!. !.Japall). vol. I. 110. 2.
p. 153. 1968.
47. Ishii. T.. and S. Fujita, Ku!/tr/;u K"!/lIku; vol. 19. p. 316, 1965.
48. Javdani. K.. S. Schwalhe. and J Fischer. in P"on.,.tlill'/., '11 l/re Sellmtl 1>L1l'ili,- Chell/lml
Elll/ille,.,-ill!! COIIL/rt'-'S. Delll'L"', C%ruc/o. .4U!/I"1 :'.'1. 31. 1977. vol. I. p. liB.
49. Johnson. D. l.. H. Saito, J. D. Pole.les. and O. .1\. Hougen. A/ClIE J.. vol. J. p. 411. 1957.
50. Jones. S. JR., and W. Smith. InrL'''L/Lri,," BL'IB'L't'n F/11/l1,< L1ml Par/icles. Institute of Chemical
Engineers. london. 1962.
51. Joobten. G. E. H.. J. G. M. Schilder. J. J. Janssen, Chem. Ell!!. SLi.. vol. 31. p. 563. 1977.
52. Juvekar. v. A.. and M. \.1. Sharma, Cirelli. EII!/. Set.. vol. 28. p. 825. 1973.
51 Kato. Y.. A. Nishiwah T Fukuda, and S. Tanaka..J ClIL"". £0'11. (JupemL v,,1 5. no. 2. p. 112
1972.
54. Kato. Y.. KagLlku KOl/llk" (Ahr. English ed.). vol I. p. 1. ] 963.
55. Kawamura. K.. and T Sasano. KIII/aku K(J!!lIku. vol. 29. p. 693. 1965.
56. Kim, S. D.. C G. J. Baker. and M. A. Bergougnou. CUI1. J. Chern. Enl/.. vol. 50. p. 695, 1972.
57. Kim. S. 0.. PhD Thesis. lJniv.:rsi[y of W",tern Ontario. London. Ontano, 1974.
58. Kim. S. D.. C. G. J. Baker, and M. A. Bergougnou. C{(n. 1. Chem. Eny., vol. 53. p. 134. 1975.
59. Kito. M.. M. Shimada, T. Sakal. S. Sugiyama, and C Y. Wen. In F1uidi=tltinrl Talmolofl.V.
ID. l. Keairns. ed.\. Hemisphere Puhlishing Corp.. Washington. D.C.. 1976. vol. I. p. 411.
60. Kncule. F., Chem. In!!,.. Teek. vol. 28. p. 22/.1956.
61. Kobayashi. T.. and 1--1. SailO, KIII/llku KOY(Jku, vol. 3. p. 210. 1965.
62. Kolhe!. H.. E. Borchers. and K. Mullcr. ('1"'111. 11l!Jl". 7 ",'/r.. vol. 30. p.400. IlJ5K
63. Kolbel. H.. [ Borchers. and K. Miillcr, OIL'III. /lIW -r,,/./,.. v<)1. )(\. p. nt). 1<l5H.
64. Kolbe!, 1-1.. E. Borchers. and J. Martins. ('hem. lnl]r. TI'L"h.. vol. 32. p. 84. 1960.
65. Kolbe!. H., H. Hammer, H. J. Henne, and H. G. Macnning. Dech,,"w M(JntJgt"LIph. vol. 49.
p.277, 1964.
66. Kossev..I\.. G. Peev. and D. Elenkov, V,' f{(h"'n-Sre("hnik, vol. 5. p. 340. 1971.
67. Kuhnl. R.. l. Komasawa. T. Otake. and M. Iwasa. elII'm. Ell!/- SI'i.. vol. 29, p. 65Y. 1974.
68. Kuhoi. R.. L Komasawd, and T. Olake. Chem. En9. Sd.. vol. 28. p. 59, 1973.
69. Kuhota. H.. ,lI1d T. Sckizawa. in F!uidi:uti"" T,',.Jr""Ic"Jr. (D. L Kealrns. cd.). Hcmisphere
Puhlishing Corp.. WaShll1!!lOn. DC. 197(,. vol I p.431
70. lee. J. C. in Pron'('dinLJ.\" of the 3/"Ll E(J/"Op"IIII SJ'mpo.till/ll em Chemical R"lI('timl EnlJin(,l'rin!f.
Pergamon Press. Oxford. 1965. p. 211.
71. Lem<:off. N. 0.. and G. J. Jameson. AlChE./.. vol. 21. no. 4. p. 730. 1975.
72. lemcoff. N. 0., (md G. J. Jameson. Ch,'m. E,,!!. S,.;.. vol. 30. p. 363. 1975.
73. lcvesh. I. P.. M. L Niyasov. N. I Krainev. and F. F. Ganikhanova. Inl. Chern. Eny.. vol. 8.
p. 379. 1968.
74. levich, V G., Phy.<io("hemiml Hydro, '''"mi.-. , Prentice. Hall. Englewood Cliff. N.L 1962.
75. levins. R. E.. and J. R. Glastonbury, Trans. Im/. Che111. Enl/.. vol. 50. p. 32 and p. 132, 1972.
76. lobo. W. E.. l. Friend. F. Hashmall. and F. A Zenz. Trails. Am. 111.1"1. Clwm. Eng., vol. 41.
p. 693. 1945.
77. lochicl, A. C. and P. 1--1. Caldcrbank, C/rem. Ell!!. Sri.. vol. 19. p. 471, 1964.
78. Manchanda. K. D., Dissenation. Indian Institute of Technology. Bombay. India. 1963.
79. Ma,similla. L. N. Majuri. and P. Signorini. Rh'. S,.;.. vol. 29. p. 1934. 1959.
80. Masslmilla. L. A. Solimando. and E. Squillace. Brit. ('hem. Ent].. vol. 6, p. 232. 1961.
81. Matsuura. T.. PhD Thesis. Technische ('niversiral. Berlin. 1965.
82. Michelsen. M. l.. and K. Ostergaard. C11L'11I. Ell!!. ./.. vol. I. p. 37, 1970.
/,,,,--\:
DYNAMICS OF THE GAS-LIQUID I\USPENDED-SOUD COLUMN 369
lB. Michelsen. rvl. L. and K. Ostergaard. Preprint 310, Second Joint A IC'hl::-IIA PH Meeting.
Chem. Eng. Progr. Series. I 96!1.
84. Middleman. S.. AIChF:: J.. vol. II. p. 749. 1965.
85. Mooney. M. L C"lIoid Sci., vol. 6. p. 162. 1951.
86. Morns. R. M.. Chem. Inti.. London. p. 1836. 1964.
!!7. I\Hilier. K.. Dissertation. Technische lJni"crsiliil Berlin-Charloltenburg. 1962.
88. l\Iarayanan. S.. V. K. Bhalia, and D. K. Guha, Con. J. 01l:m. En!!., vol. 47, p. 360, 1969.
89. Ncinow, A. Woo Can. 1. Chem. Eng.. vol. 47. p. 24 . 1969.
'W. Neinow. A. W., Chern. Eng. J., vol. 9, p. 153. 1975.
91. Neinow. A. W.. Chem. Eng. So.. vol. 23, p. 1453, 1968.
92. Nishikawa. M.. K. KO&lka, and K. Hashimoto. in Pro'ddi'lg.\' o{ the Se{(",d Pacific Chemical
Engineering C()ngrl'. . . DC'III'l'r. C"lorado. AU'Jll-H 28-31.1977. vol. 2, p. 1389
93. O'Connel, F. Poo and D. E. Mack. Chem. Eml. ProW.. vol. 46. p. 35R, 1950.
94. Oldshue. J. Y.. Ind. Ell!!. Chem.. vol. 48. p. 2194, 1956.
95. O'NciIL B. K.. D .1. Nicklin, N 1. Morg.m. and L S. Leung. Call ./. Chew. 1'"'1.. vol. 50. p. 595.
1972.
96. Ormiston, R. M.. F. R. G. MilChell. and J. f. DavIdson, Tl"lll/s. In.n. 01<'111. EniJ.. vol. 43,
p. T209. 1965.
97. Ostergaard, K.. .4,1". Chern. En!!.. vol. 7. p. 71, 1968-
9X. Ostergaard, K., Ch,'m. f.'n(). St"i.. vol. 20. p. 165. 1965.
99. Ostergaard. K.. Clwm En{/. Sd.. "01. 21. p. 470,1966.
100. Ostergaard, K.. in Flllidi=lI/ion. Society for the Chemical Industry, London, 1964, p. SO.
101. Ostergaard. K., in Fluidizalion. (J. F. D:lvidson and D. Harrison. cds ). Academic Press, New
York. 1971.
102. Ostergaard. K.. Swdres 1){"Ga.\'-Liquitl F!uidialtiml. Danish Technical Press. Copenhagcn, 1969.
103. Ostcrgaard, K.. and P. Fosrol. Ch('1II. Eng. J., vol. 3, p. 105. 1972.
]04. Ostergaard. K., and M. L Michelsen, Symposium on the Fund.ament..1 Applications of
rluidi7;1tion. T;lmpil. Florida. Prcprint 340. 1968.
105. Ostergaard. K., and W. Suchozcbrski, in Proaedillgs 01 Ih" 41h EW'ope/lll Symporium on
Chl'lll11'11l Rellelic)tl Engineering. Pergamon Press. Oxford, 1971. p. 21.
106. Ostergailrd. K., and P. I. Theisen. Chem. En{J. Sci.. vol. 21, p. 412.1966.
107 Oyama, Y.. ilnd K. Endoh. J. Chem. Ell!!. (.l1l!1l1rJ). vol. 42. p. 227. 1%7.
108. Postlclhwaite, J.. and D. N. Holdner. ClIlI. J. Chern. En9.. vol. 53. p. 31,1975.
109. Postlethwaite. J.. and D. 1\1. Holdncr, Ctm. J. C/,em. EII{J.. vol. 54, p. 255. 1976.
110. Pruden. B. B.. and M. E. Weber. CII". J. CII('nl. En!!., vol. 48. p. 162. 1970.
II I. Ranz. W. E., and W. R. Marshall. Chem. En'l. ProW.. vol. 4R. p. 141. 1952.
112. R.vumov. I. M.. V V M.mshllm. .111<1 L L NCI11<:IS, Int. ("I",,,,. bill.. vol. 1 J. p. 57.1')11
113. Richardson. J. F., and W. N. Zaki. Tram. 111.1"/. Cltem. EII4.. vol. 32. P 35. 1959.
114. Richardson,.I. F., and W. N. Zakl. Trllnl. Imt. Chem. En!!.. vol. 39. p. 212. 1954.
115. Righy. G. RoO .lI1d C. E. Capes. Con. J. C/rem. EI1'/" vol. 48. p. 343. 1970.
116. Rigby. G. Roo G. P Van Bloekbnd. \V II. Park. ,md C. E. ('ilpe . ClIl'm. En!!. S6., vol. 25.
p. 1719. 1970.
] 17. Rowe, P. N., and K. T. Claxton. Reports AERE-R4673 and AEIU,-R4675, Chcmical En,:!lI1eering
Division. Atomic Energy EstablishmclIl. Harwell. Englilnd. 1964.
118. Roy, N. K.. D. K. Guha. and \1. N. Ras, Chem. E,,!!. S6.. vol. 19. p. 215.1964
119. Rushton, J. H.. E. W. Costich. ilnd H. J. Everett. Chnn. lOng. Pro",.. vol. 46, p. 395 and 467, 1950.
120. Sage, B. K. and T. R. Galloway, 1111. J. lleat !vfa.u T"c1/I.\{:, vol. 7, p. 283. 1964.
121. Silno. "., N. Yamaguchi, .md T. Adilchi. J. Chern. EI1!I- (Jl/pml). vol. 7. no 4, p. 255. 1974.
122. Satterfield. C. N.. MlI.u Transfer in He,ero{Jl'neOils COIll(I'. i. . MIT Press. Cambridge. Mass..
1970.
123. Schiigerl, K.. Pmcl'l'din!!s of" tin 111lenrtllionlll Symposium ()/) F/uidi=lIIic)tJ, Eindhovcn. PrepriJlts.
9.4. 182, 1967.
124. Schuman. S. c., R. H. Wolk, and M. C. Chervenak. lJ.S.I).ltenl 3,1!!3.1!!0. 1965.
125. Schwartzberg. H. Goo and R. E. Treyb.11. I&EC I'und.. vol. 7. no. I. p. 6.1958.
370 GAS' LIQUID-SOLID REACTOR DESIGN
126. Sekizawa. T.. and H. Kubota, J. Chern. Eng. (Japan), vol. 7. 15:141,1974.
127. Sherrard, A. J.. Dissertation, University College of Swansea, 1%6.
128. Slesser, C. G. M., W. T. Allen, A. R. Cuming, V. Fawlowsky. and J. Shilds, in ChemiCllI
Reactor Enqineering, pp. 41-45. Proceedings of the Fourth European Sympo. illm. Bru,sels. 1968.
supplement to Chemical Engineering Science.
129. Stewart, P. S. B.. PhO Thesis, University of Cambridge. 1965.
130. Stewart, P. S. B., and J. F. Davidson. Chem. Eng. Sci., vol. 19, p. 319, 1964.
131. Strumillo, c., J. Adamice, and T. Kudra, Int. Chem. £ng., vol. 14, p. 652, 1974.
132. Strumillo. c., and T. Kudra, Chem. £l1g. Sci.. vol. 32. p. 229, 1977.
133. Suganuma, T., and T. Yamanishi. Kagaku Kogaku. vol. 31. p. 1006, 1967.
134. Sykes. P., and A. Gomczplata, Can. J. Chem. £ng., vol. 45, p. 189, 1967.
135. Turner, J. C. R., Chem. £ng. Sci., vol. 21,971, 1966.
136. Turner, R., in FluIdization, Society for the Chemical Industry. London. 1964, p. 47.
137. Turner. R., Pmc. Chem. £ng. Group So£". Chem. Ind., vol. 42. p. 47,1963.
138. Van de Vusse, J. G., in Proceedings of a Symposium on Scaling-up. Institute of Chemical
Engineers, London, 1957, p. 41
139. Van Driesen, R. P., and N. C. Stewart, Oil Gas J., vol. 62, no. 20, p. 100, 1%4.
140. Viswanathan, S., A. S. Kakar, and P. S. Murti. Chem. £ng. S£"I.. vol. 20. p. 903. 1965.
141. Vukovic. D. V.. F. K. Zdanski. G. V. Vunjak. Z. B. Grabavcic. and H. Littman, Can. J. Chern.
Eng., vol. 52, p. 180, 1971.
142. Wallis, G. Boo One--dimensional Tim-phase Flow. McGraw-Hili Book Company, New York. 1969.
143. Wallis, G. B., in Proceedings o{ a Sympo..ium on Interaction Between Fluids and Particles,
(P. A. Rottenburg. ed.), Institute of Chemical Engineers, London, 1962. p. 9.
144. Wilhelm, R. H., L. H. Conklin. and T. C. Sauer, Ind. £ng. Chnn., vol. 33, p.453, 1941-
145. Wozmak, M., and K. Ostergaard, Chem. Eng. Sci., vol. 28, p. 167, 1973.
]46. Yamanaka, Y.. T. Sekizawa, and H. Kubola, J. Chem. £ng. (Japan), vol. 3, no. 2, p.264, 1970.
147. Yaron. I., and B. Gal-Or, Int. J. lIear Mass Transfer, vol. 14, p. 727, 1971.
148. Yashitome, H., M. Kakihara. and ¥. Tsuchiya. Kagaku Kogaku, {abr. English ed.I, vol. 2, p. 186,
1965.
149. Zuber, N., and J. A. Findley. Trans. Amer. Soc. Mech. £ng., vol. 87C, p. 453,1965.
150. Zwietering, T. Noo Chem. £ng. Sci., vol. 8, p. 244. 1958.
Absorption rate, 26
, . gas-liquid-solid catalytic reaction, 36-40
gas-liquid-solid reaction. 41--46, 52 54
Absorption with chemical reaction:
mechanism, 24
Adiabatic trickle bed reactors:
without "quench" fluids, 115-116
with "quench" fluids, 1J6--125
Agitated slurry reactor, 17
Axial dispersion model. 7f}- 77
trickle bed reactors, J II 112
Axial dispersion coefficien I:
methods for evaluation, 72-77
AKial mixing, 7. 206, 247, 281, 285, 328, 329. 331
Backflow model, 87-88
Ball mill reactor. 160
Bondi correlation. 11f}-] II
Bypass model, 77-79
INDEX
Cocurrent upflow reactor, 10
axial dispersion. 247-251
flow regime, 23f}-232
gas and liquid holdups, 237-247
gas-liquid mass transfer. 251-261
hca t transfer. 266
pressure drop. 232-237
liquid-solid mas transfer, 261 265
Countercurrent flow reactor, 10
aXIal dIspersIon:
gas phase, 281-285
liquid phase, 285 292
flooding, 275-276
flow regimes, 275-276
gas-liquid mass transfer, 293-297
heated transfer, 297
holdups:
gas, 277
liquid. 279
pressure drop. 276--277
liquid solid mass transfer, 297
wetted area, 292
Continuously stirred tank reactor, 153-154
Crossflow model, 81
Cycle life in trickle bed reactors, 1] 6 125
Chromatographic column pulse reactor. 168
Cocurrent downflow reactor. 10. 14
axial dispersion. 206- 212
effective catalyst wetting, 202-206
flow regime. 180
gas-liquid mass transfer, 212-216
heat transfer. 220
liquid holdup, 19f}-199
liquid-solid mass transfer. 216--220
pressure drop, 184 .190
radial and axial gas and liquid distributions,
199- 202 t./ Effective catalyst wettmg model, 107-110
Desorption with chemical reaction, 28
Differential models, 7f}-86
DIfferential reactor, 151
Disk column absorber. 171
37]
f
\
/
372 I"DEX
Effectiveness fa tor:
calalyst, 49
gas-liquid, 47
liquid olid, 47
overall. 47
External recycle reactors, 155-156
Fast reaction, 26. 38, O. 42. 44. 139
Film theory, 22
Fixed bed gas-liquid solid reactors, 9, 14, 152
Flow regimes, 6. 180.230,275
Flow uniformity, 6
Fluidized bed reactor. 17, 18
with an agilator. I@ 161
with a pulsator, 161
Four parameter macromixing models, 89--92
Gas-liquid reactions, 5
experimental systems, 31. 34-35
finite reaction rates, 29---31
heat effects, 49
instantaneous reaction rates, 32-33
Gas liquid mass and heat transfer, 8, 212, 251.
29l, 334
Gas-liquid---solid reactions. 2
film theory analyses. 41--46
heat effects, 51
Gas liquid-solid catalylic reactions, 3--4
film theory analyses. 36-40
Gas liqUld---sohd fixed bed reactor, 14
Gas-liquid suspended solid reactors, II, 16-- 17
axial dispersion:
gas phase, 328
liquid phase. 329- HI
solid phase. 331-339
bubble dynamics. 305-309
gas-liquid interface mass rransfer, 334 348
gas-liquid and solid holdup , 312
heat transfer, 356 369
liquid-solid mass transfer, 348
Kolmogoroff's theory. 351 .356
steady state theories, 348
terminal velocity-slip velocity theory. 348
351. 353 356
minimum ga.s velocity for tlUldiLation, 309. 311
pressure drop, 31 J
wall mass transfer, 356
Grad.entless gas-.liquld contactor. 173
H.COAL process, 17
HDS reaClor. J 16.122
Heat transfer. 220. 266. 297. 356
Holdups..7. 190, 237. 27.7, 279, 312
HO i:!u'p model, 106 10"0.108-110
Hydrogenation reactions. 2 5
Internal recircu la £IOn reactors, 164
I nterstage recirculation model, 88
Instan taneous reactions, 26, 32. 43, 44. 6. 139-
I O
Intraparticle mass and heat transfer. 8
Intnnsi kinetics, 9
Laminar jet absorber. 168
liquid-solid mass and hcat transfer. 8.216.261.
297, 34
I iquid-solid mass transfer coefficienl:
trickle bed reactor. 48
Macromixing models. 69
differential models, 70-86
stagewise models, 86 93
Mears' criterion, 112, 142-143
Measurement of:
heat of reactIOn. 174 175
transport resistances, 47
Melhod of moments. 72--74.94- 100
\.tethod of :\-fichelsen and Ostergaard. 74-75, 94--.
1110
M icrorea tors, 165- 166
MIxing cell model. 80
Models:
for commercial adiabatic trickle bed reactors.
116 125
for non isothermal Irick Ie bed reactors, 115-116
for packed bubble column gas-liquid reactor,
135 -140
for three phase slurry reactors, 133 135
of Sylvestcr and Pitayagulsarn. 128- 129
of trickle bed reactors whcn reactant prescnt In
both liquid and vapor phases, 113- 114
M nltiple-sphere string reactor. 159
\Ion isobaric column with variable gas velocity,
140
\lonlsothermal reactions- heat effects, 49
Nonisothermal trickle bed reactors, 125.-128
Oxidation reactions, 2..5
PDE model. 82-86
Penetration theory, 23
Plug-flow model, 105 106
Pressure drop, 7. 184.132, 276, 311
Pulsed Aow-cocurrent downwards. 181
heat tran"fer. 221
Pulsed flow-cocurrent upwards. 231
gas and hquid holdups, 237
gas--liquid mass transrer. 251
Reactor performance. [12
Reactor with catalysl lined or coated onlo the
reactor .....,,11. 162
ReaclOr wllh calalYM placed In an annular basket,
162
ReCirculating transport reactors. 154. 155
Recycle flow model wIth crossmixing, 92
Residence time distrihution. 7
bypassing effect, 69
catalyst porosity effect. 70
ResIdence time distribution (c""lIIzut't/)
channeling effect, 68
dead space effecl, 69
methods ror measurement, M 69
seale up problems, 93-"14
Rotatmg-basKet reactor. 156--158
Rotating-drum absorber. 170
Segmented bed reactors. II, 15 16, IS!!
Series or stirred tanks model, 86-87
Single-non porous-pellet absorher, 172
Single porous pellel pulse reactor. 167
Slow n::actions. 26,38-39, 136-138
Slurry reactors. 17 I R
models, 133-135
Stagewise models, 86-92
Stirred hatch rcactor. 152 -153
INDEX 373
Straigh through tramport reactor, 153
Synthod pr s, 13
Three p>'trameters mixing cell model. 88 89
Three phase f1uidizatlon with countercurrent
flow, 311
Time delay model. 8]-82
Tracers, 61 -64
Transport resislance estimalions 47
Trickle bed reactors, 11. 12 '
generalized isothermal model 129-132
mass transfer effects, 128 '
Wall heat transfer. ')
Wall masS transrer. 356
Wetted wall column absorber. 169