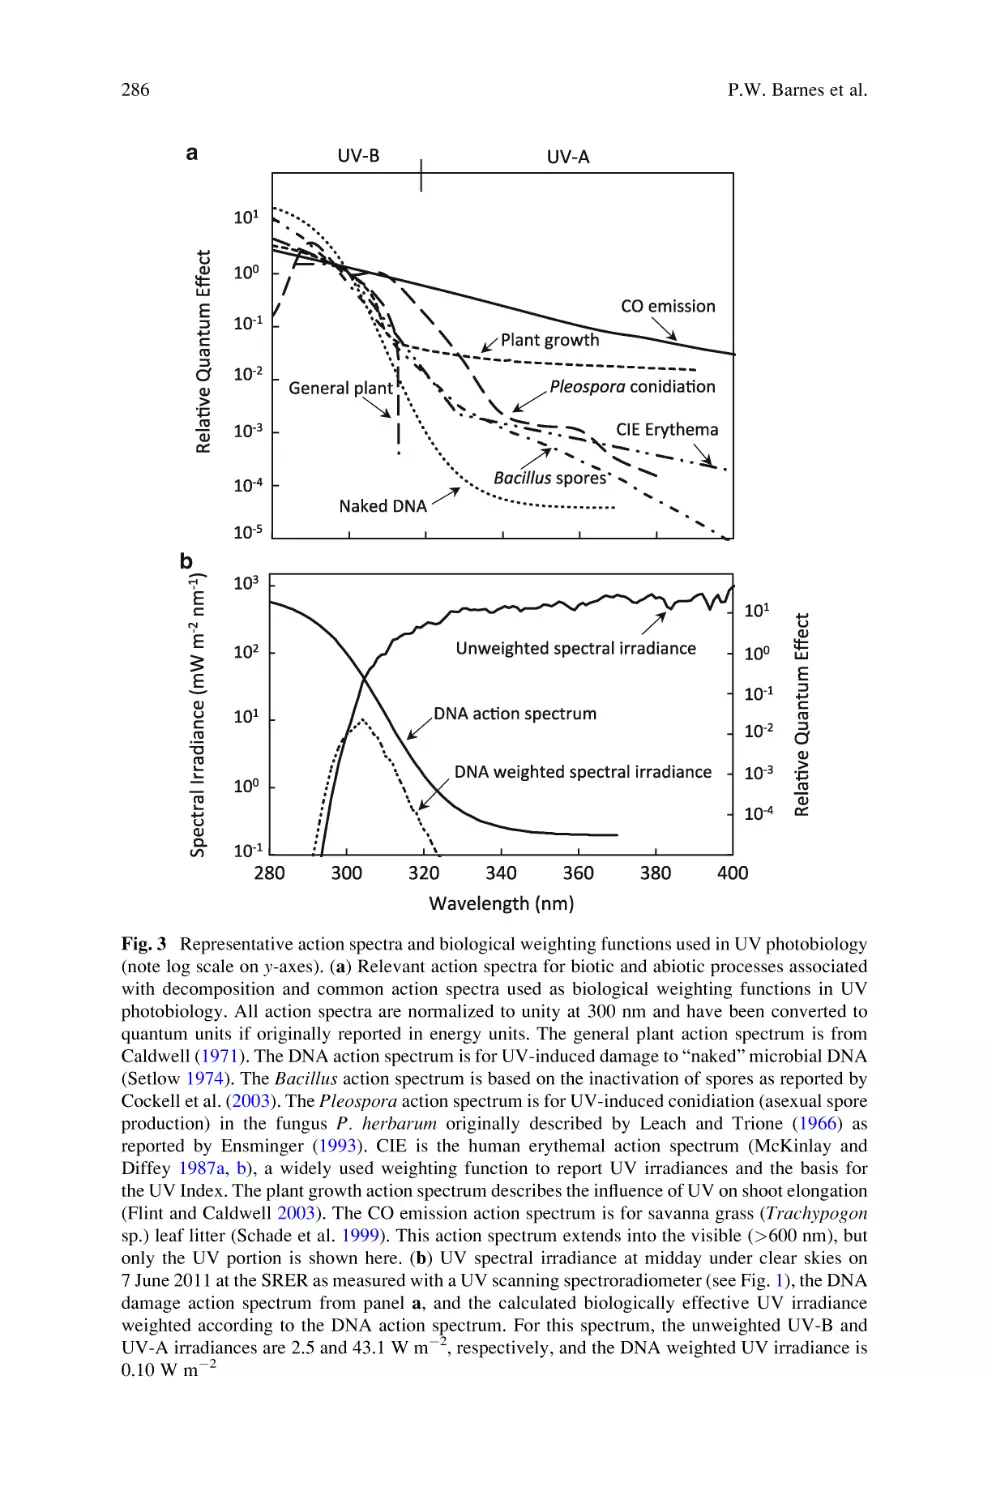
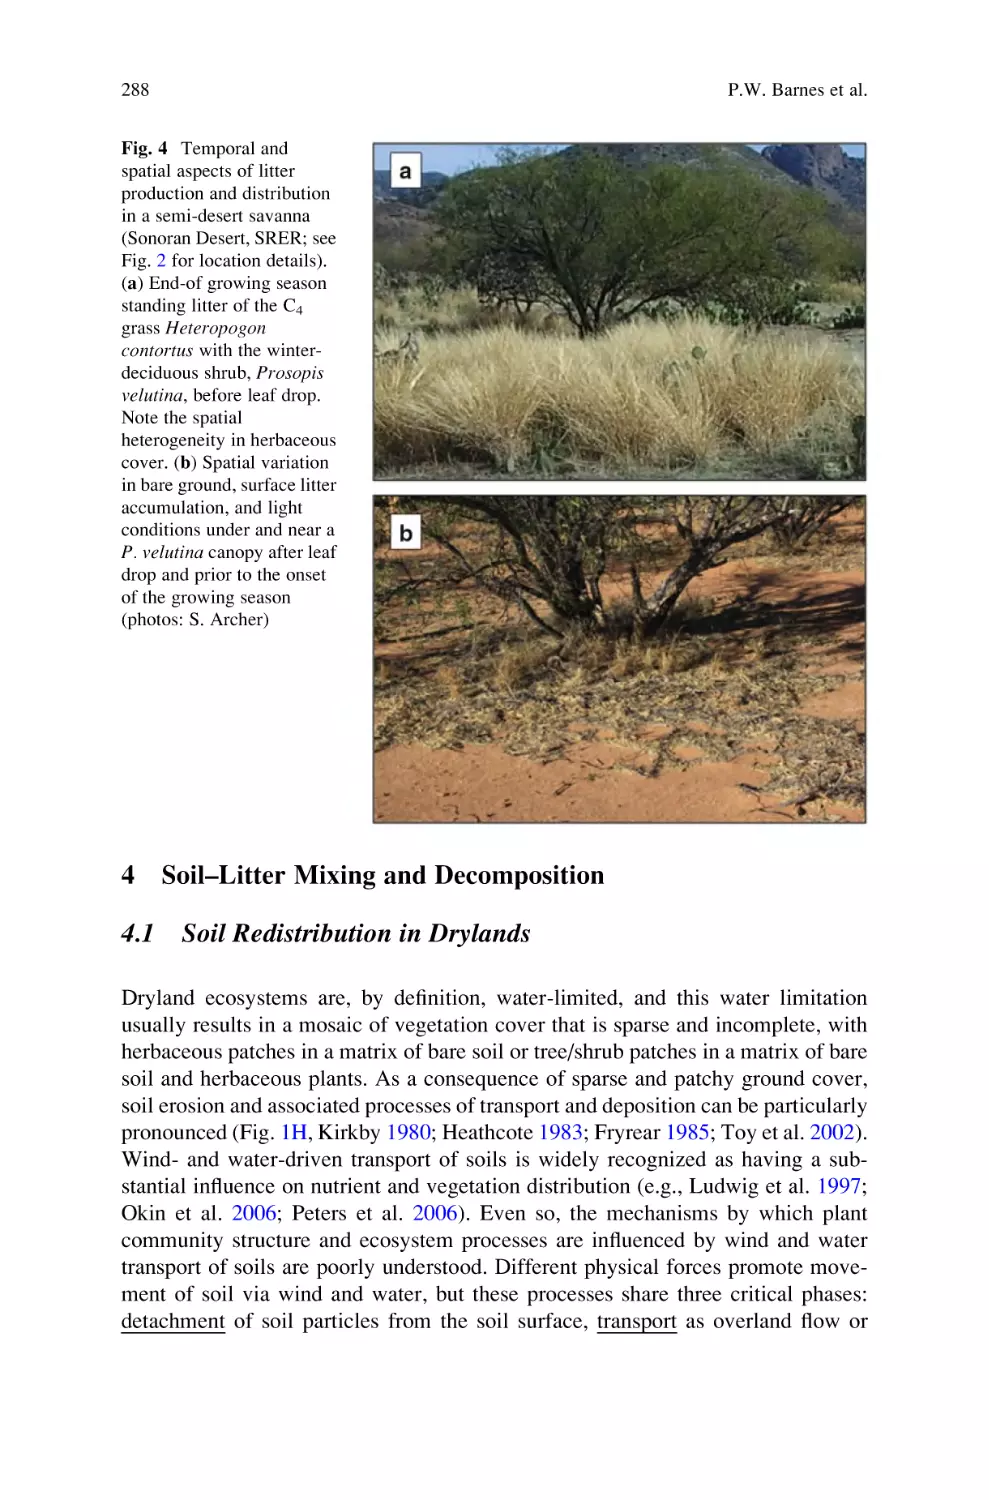
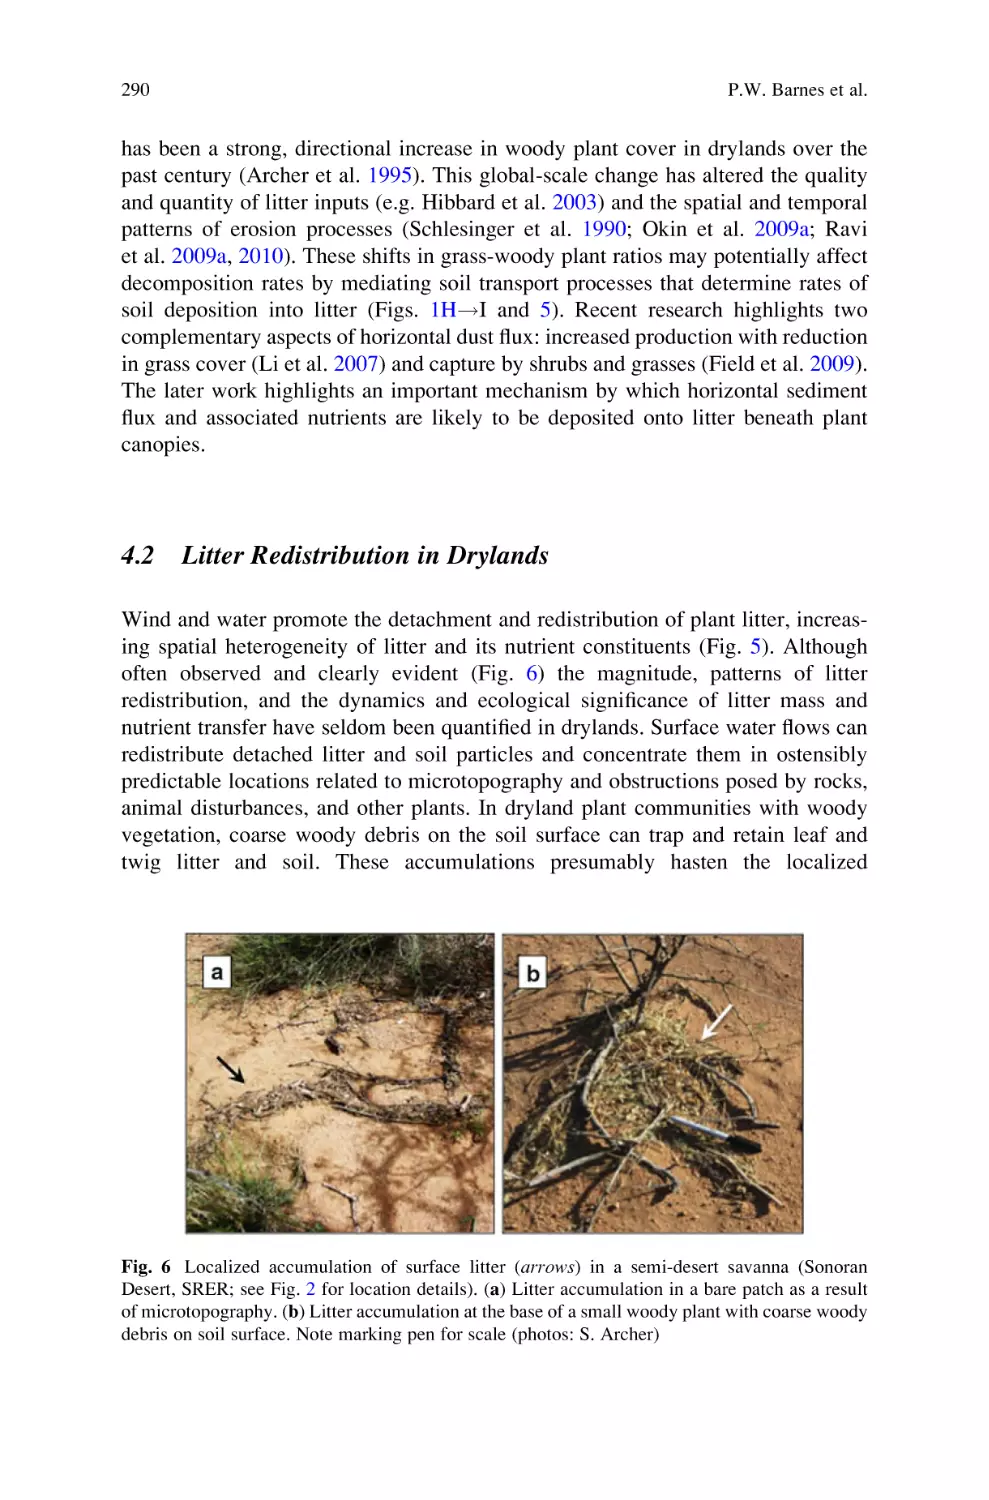
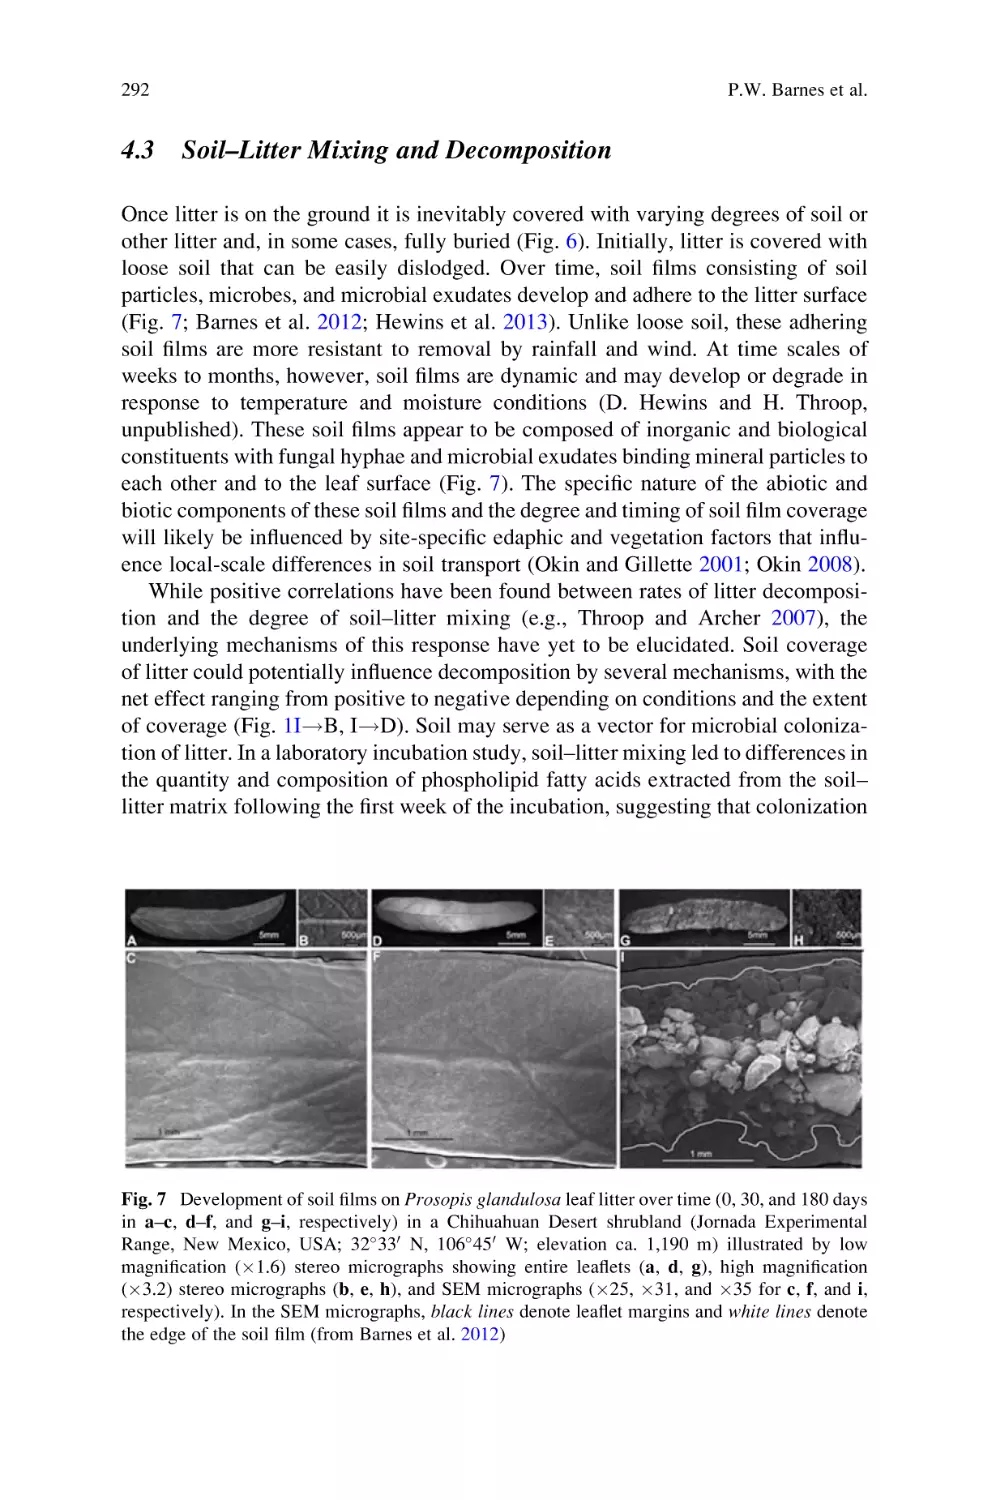
/


![2.3 Plasticity Impeding or Supporting Diversity by Speciation
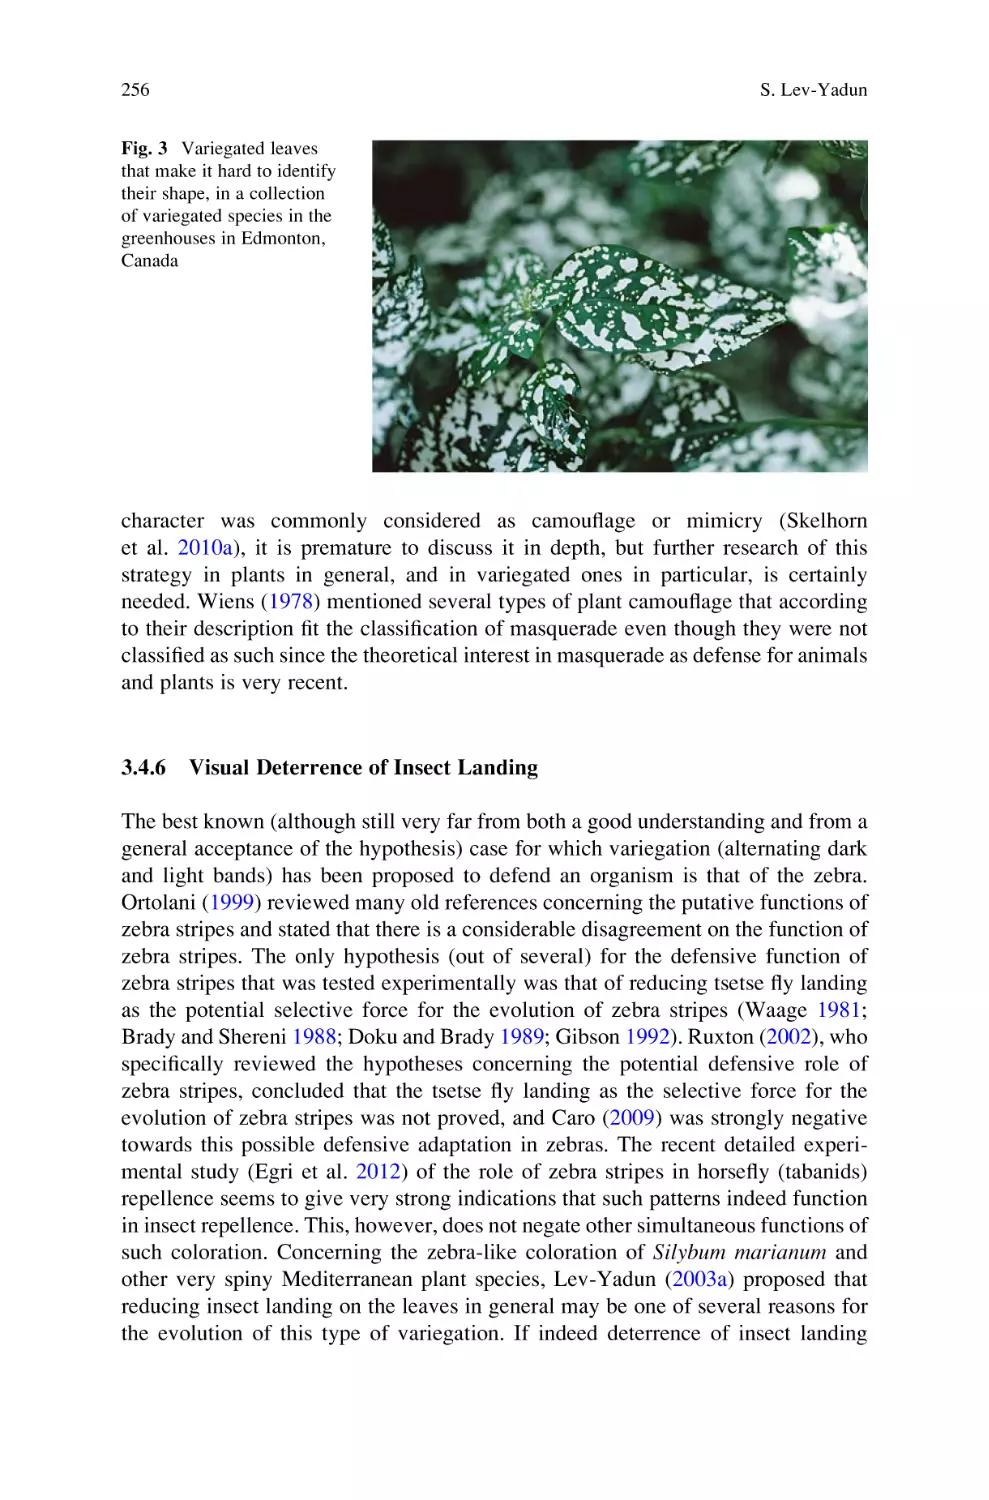
2.3.1 Hindrance of Speciation Due to Flexibility of Stress Responses and Therefore Lower Species Diversity [(ii) in Fig.1]](https://djvu.online/jpg1/2/5/f/25fGCDu6oRoxR/226.webp)
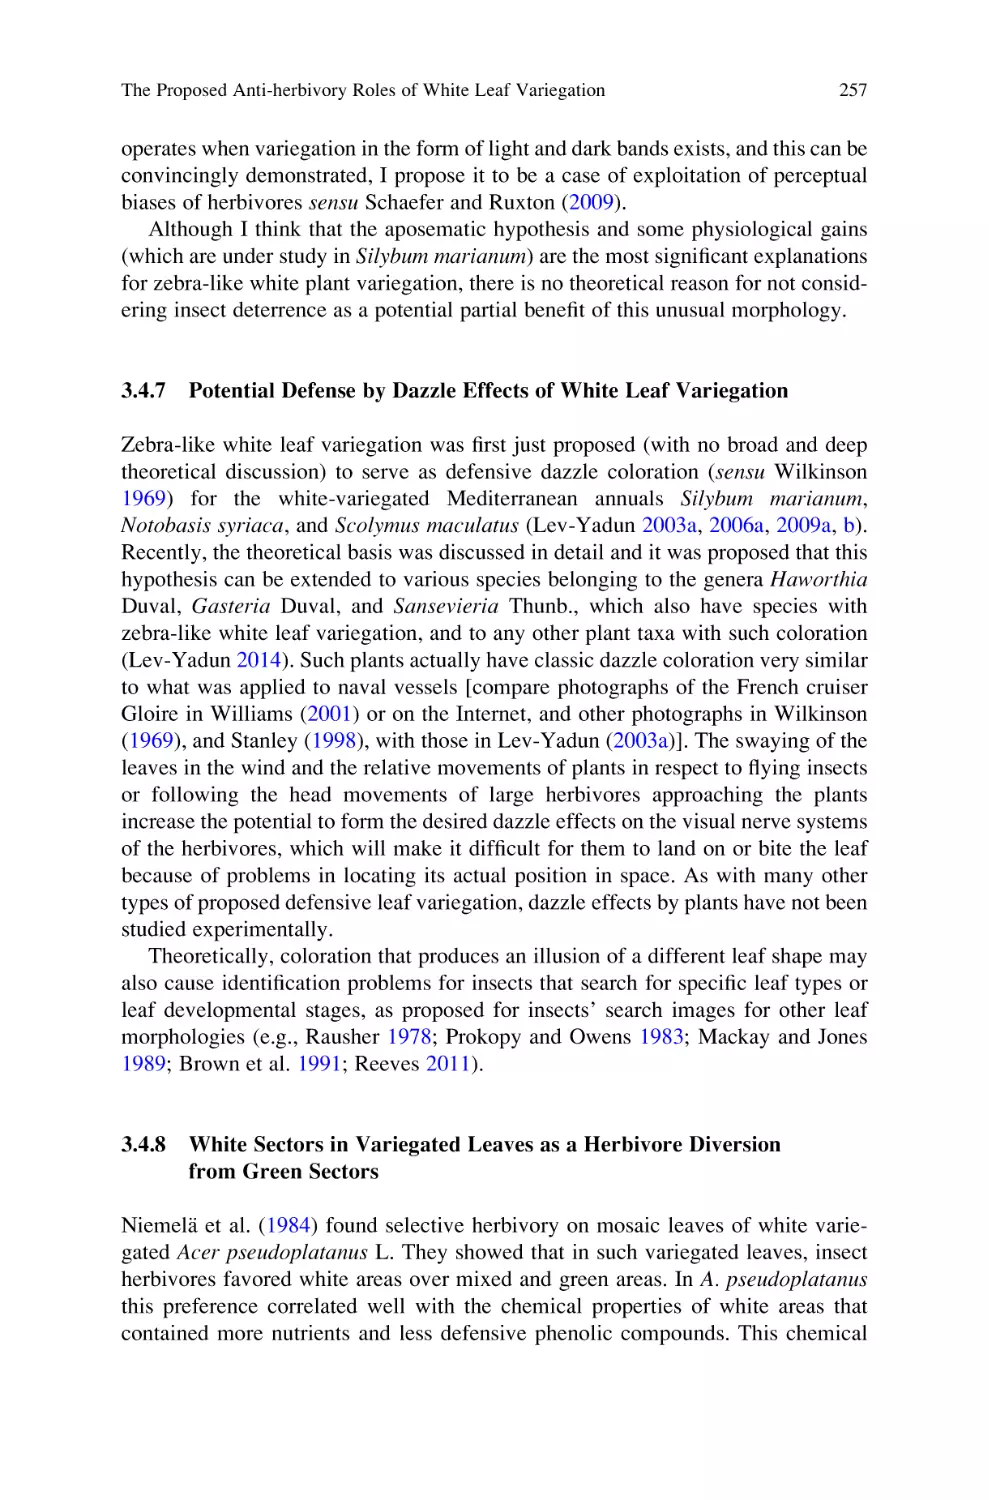
![2.3.2 Support of Speciation and Therefore Increase of Diversity [(iii) in Fig.1]](https://djvu.online/jpg1/2/5/f/25fGCDu6oRoxR/227.webp)
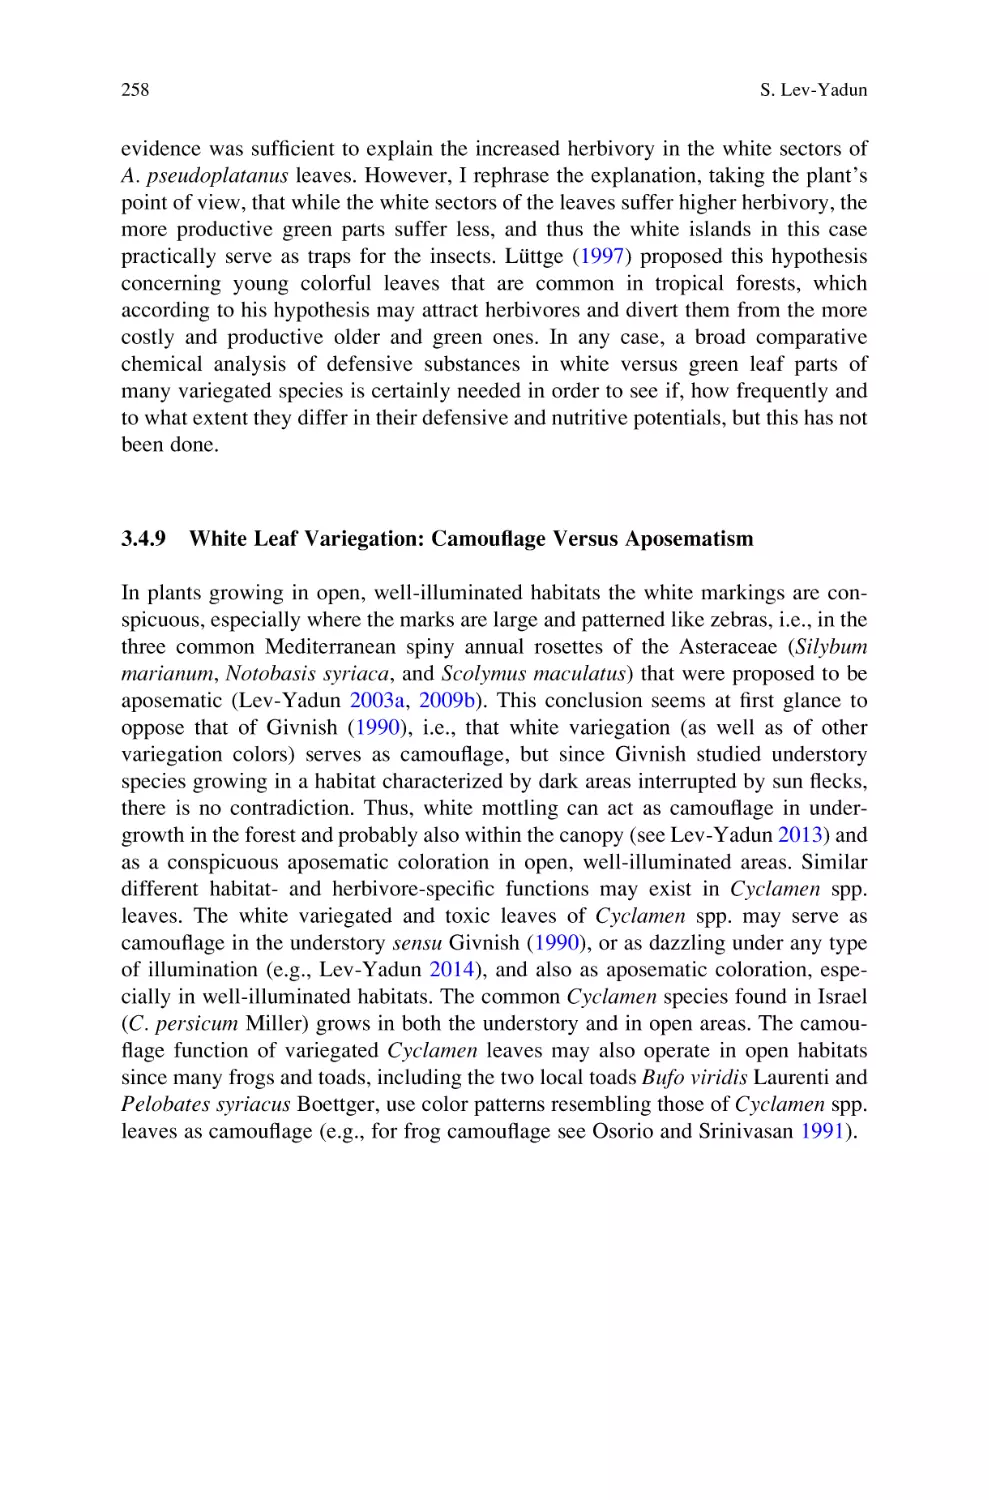
![3.2 Biodiversity Is Stabilizing (Eco-) Systems [(vii) in Fig.1]](https://djvu.online/jpg1/2/5/f/25fGCDu6oRoxR/229.webp)

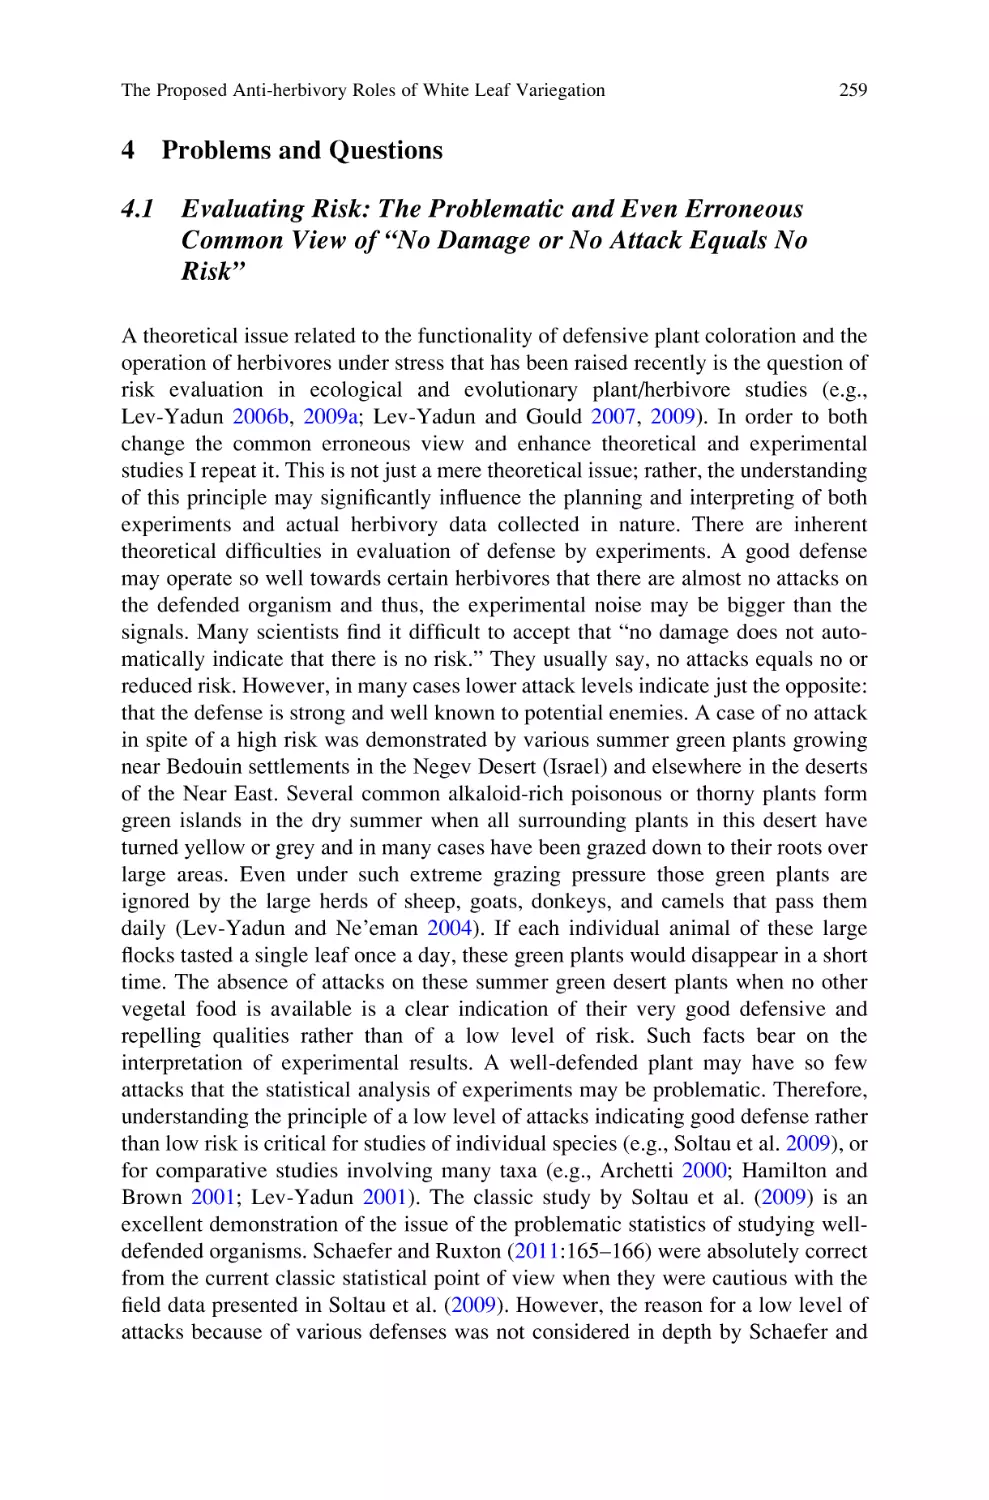
![3.4 Biodiversity Challenging Ecosystems [(viii) in Fig.1]](https://djvu.online/jpg1/2/5/f/25fGCDu6oRoxR/232.webp)


Автор: Lüttge U. Beyschlag W.
Теги: biology botany springer edition geobotany springer publisher plants physiology
ISBN: 0340-4773
Год: 2015


Текст
Progress in Botany
Ulrich Lüttge
Wolfram Beyschlag Editors
Progress in
Botany 76
Progress in Botany
Volume 76
Series Editors
Ulrich Lüttge, TU Darmstadt,
FB Biologie (10), Schnittspahnstraße 3–5,
64287 Darmstadt, Germany
Wolfram Beyschlag, Fakultät für Biologie, Lehrstuhl für
Experimentelle Ökologie und Ökosystembiologie,
Universität Bielefeld, Universitätsstraße 25, 33615 Bielefeld,
Germany
.
Ulrich Lüttge • Wolfram Beyschlag
Editors
Progress in Botany 76
Editors
Ulrich Lüttge
TU Darmstadt FB Biologie
Darmstadt
Germany
Wolfram Beyschlag
Universität Bielefeld W4-105 Lehrstuhl
Experimentelle Ökologie
Bielefeld
Nordrhein-Westfalen
Germany
ISSN 0340-4773
ISBN 978-3-319-08806-8
ISBN 978-3-319-08807-5 (eBook)
DOI 10.1007/978-3-319-08807-5
Springer Cham Heidelberg New York Dordrecht London
Library of Congress Control Number: 2014949152
© Springer International Publishing Switzerland 2015
This work is subject to copyright. All rights are reserved by the Publisher, whether the whole or part
of the material is concerned, specifically the rights of translation, reprinting, reuse of illustrations,
recitation, broadcasting, reproduction on microfilms or in any other physical way, and transmission or
information storage and retrieval, electronic adaptation, computer software, or by similar or dissimilar
methodology now known or hereafter developed. Exempted from this legal reservation are brief excerpts
in connection with reviews or scholarly analysis or material supplied specifically for the purpose of being
entered and executed on a computer system, for exclusive use by the purchaser of the work. Duplication
of this publication or parts thereof is permitted only under the provisions of the Copyright Law of the
Publisher’s location, in its current version, and permission for use must always be obtained from
Springer. Permissions for use may be obtained through RightsLink at the Copyright Clearance Center.
Violations are liable to prosecution under the respective Copyright Law.
The use of general descriptive names, registered names, trademarks, service marks, etc. in this
publication does not imply, even in the absence of a specific statement, that such names are exempt
from the relevant protective laws and regulations and therefore free for general use.
While the advice and information in this book are believed to be true and accurate at the date of
publication, neither the authors nor the editors nor the publisher can accept any legal responsibility for
any errors or omissions that may be made. The publisher makes no warranty, express or implied, with
respect to the material contained herein.
Printed on acid-free paper
Springer is part of Springer Science+Business Media (www.springer.com)
Contents
Part I
Review
Fifty-Five Years of Research on Photosynthesis, Chloroplasts,
and Stress Physiology of Plants: 1958–2013 . . . . . . . . . . . . . . . . . . . . . .
Hartmut K. Lichtenthaler
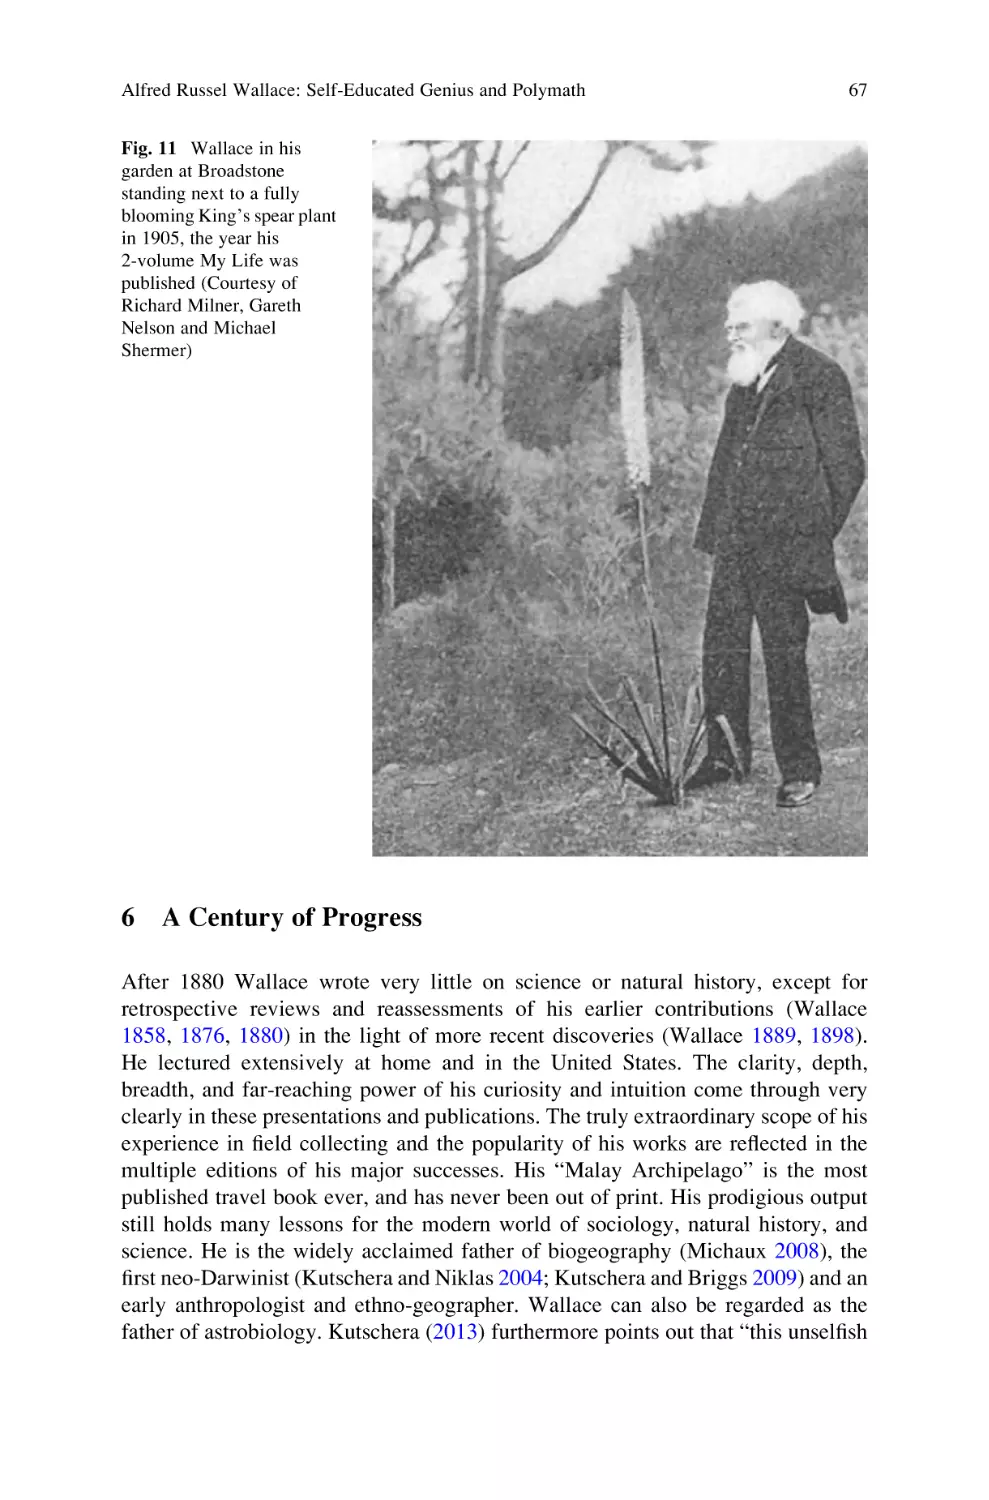
Alfred Russel Wallace: Self-Educated Genius and Polymath . . . . . . . . .
David Lloyd
Part II
3
43
Physiology
The Role of Plasma Membrane H+-ATPase in Salinity Stress
of Plants . . . . . . . . . . . . . . . . . . . . . . . . . . . . . . . . . . . . . . . . . . . . . . . . .
Małgorzata Janicka-Russak and Katarzyna Kabała
Selenium in Plants . . . . . . . . . . . . . . . . . . . . . . . . . . . . . . . . . . . . . . . . .
Elizabeth A.H. Pilon-Smits
77
93
Interplay of Water and Nutrient Transport: A Whole-Plant
Perspective . . . . . . . . . . . . . . . . . . . . . . . . . . . . . . . . . . . . . . . . . . . . . . . 109
Lars H. Wegner
Active and Passive Electrical Signaling in Plants . . . . . . . . . . . . . . . . . . 143
Alexander G. Volkov and Vladislav S. Markin
Adaptations of Chloroplastic Metabolism in Halophytic Plants . . . . . . . 177
Ewa Niewiadomska and Monika Wiciarz
CAM-Like Traits in C3 Plants: Biochemistry and Stomatal Behavior . . . 195
Paulo Tamaso Mioto, Maria Aurineide Rodrigues, Alejandra Matiz,
and Helenice Mercier
v
vi
Contents
Stability as a Phenomenon Emergent from
Plasticity–Complexity–Diversity in Eco-physiology . . . . . . . . . . . . . . . . 211
Gustavo M. Souza and Ulrich Lüttge
The Proposed Anti-herbivory Roles of White Leaf Variegation . . . . . . . 241
Simcha Lev-Yadun
Part III
Ecology
Sunlight and Soil–Litter Mixing: Drivers of Litter Decomposition in
Drylands . . . . . . . . . . . . . . . . . . . . . . . . . . . . . . . . . . . . . . . . . . . . . . . . . 273
Paul W. Barnes, Heather L. Throop, Steven R. Archer, David D. Breshears,
Rebecca L. McCulley, and Mark A. Tobler
Interspecific Competition in Arabidopsis thaliana: A Knowledge Gap Is
Starting to Close . . . . . . . . . . . . . . . . . . . . . . . . . . . . . . . . . . . . . . . . . . . 303
Maik Bartelheimer, Christoph Schmid, Joana Storf, Katharina Hell,
and Sibylle Bauer
Carbon Reserves as Indicators for Carbon Limitation in Trees . . . . . . . 321
Günter Hoch
Consequences of Changing Precipitation Patterns for Ecosystem
Functioning in Grasslands: A Review . . . . . . . . . . . . . . . . . . . . . . . . . . 347
Stephan Unger and Marjan Jongen
Plant-Mediated Ecosystem Effects of Tropospheric Ozone . . . . . . . . . . 395
Hans J. Weigel, Elke Bergmann, and Jürgen Bender
List of Contributors
Steven R. Archer School of Natural Resources and the Environment, University
of Arizona, Tucson, AZ, USA
Paul W. Barnes Department of Biological Sciences, Loyola University New
Orleans, New Orleans, LA, USA
Maik Bartelheimer Institute of Botany, Faculty of Biology and Preclinical Medicine, University of Regensburg, Regensburg, Germany
Sibylle Bauer Institute of Botany, Faculty of Biology and Preclinical Medicine,
University of Regensburg, Regensburg, Germany
Jürgen Bender Thünen Institute of Biodiversity, Braunschweig, Germany
Elke Bergmann Thünen Institute of Biodiversity, Braunschweig, Germany
David D. Breshears School of Natural Resources and the Environment, University of Arizona, Tucson, AZ, USA
Katharina Hell Institute of Botany, Faculty of Biology and Preclinical Medicine,
University of Regensburg, Regensburg, Germany
Günter Hoch Institute of Botany, University of Basel, Basel, Switzerland
Małgorzata Janicka-Russak Department of Plant Molecular Physiology,
Institute of Experimental Biology, Wrocław University, Wrocław, Poland
Marjan Jongen Instituto Superior de Agronomia, Universidade de Lisboa,
Lisboa, Portugal
Katarzyna Kabała Department of Plant Molecular Physiology, Institute of
Experimental Biology, Wrocław University, Wrocław, Poland
Simcha Lev-Yadun Department of Biology and Environment, Faculty of Natural
Sciences, University of Haifa–Oranim, Tivon, Israel
vii
viii
List of Contributors
Hartmut K. Lichtenthaler Botanical Institute 2 (Plant Physiology and Plant
Biochemistry), Karlsruhe Institute of Technology (KIT), University Division,
Karlsruhe, Germany
David Lloyd Cardiff University School of Biosciences, Cardiff, Wales, UK
Ulrich Lüttge Department of Biology, Technical University of Darmstadt,
Darmstadt, Germany
Vladislav S. Markin Department of Neurology, University of Texas, Southwestern Medical Center, Dallas, TX, USA
Alejandra Matiz Department of Botany, Institute of Biosciences, University of
São Paulo, São Paulo, SP, Brazil
Rebecca L. McCulley Department of Plant and Soil Science, University of
Kentucky, Lexington, KY, USA
Helenice Mercier Department of Botany, Institute of Biosciences, University of
São Paulo, São Paulo, SP, Brazil
Paulo Tamaso Mioto Department of Botany, Institute of Biosciences, University
of São Paulo, São Paulo, SP, Brazil
Ewa Niewiadomska The F. Górski Institute of Plant Physiology Polish Academy
of Sciences, Kraków, Poland
Elizabeth A. H. Pilon-Smits Biology Department, Colorado State University,
Fort Collins, CO, USA
Maria Aurineide Rodrigues Department of Botany, Institute of Biosciences,
University of São Paulo, São Paulo, SP, Brazil
Christoph Schmid Institute of Botany, Faculty of Biology and Preclinical Medicine, University of Regensburg, Regensburg, Germany
Gustavo M. Souza Laboratório de Cognição Ecológica em Plantas – ECOLAB,
Presidente Prudente, SP, Brasil
Joana Storf Institute of Botany, Faculty of Biology and Preclinical Medicine,
University of Regensburg, Regensburg, Germany
Heather L. Throop Department of Biology, New Mexico State University, Las
Cruces, NM, USA
Mark A. Tobler Department of Biological Sciences, Loyola University New
Orleans, New Orleans, LA, USA
Stephan Unger Department for Experimental and Systems Ecology, University of
Bielefeld, Bielefeld, Germany
Alexander G. Volkov Department of Chemistry and Biochemistry, Oakwood
University, Huntsville, AL, USA
List of Contributors
ix
Lars H. Wegner Insitute for Pulsed Power and Microwave Technology and
Institute of Botany 1, Karlsruhe Institute of Technology, Karlsruhe, Germany
Hans J. Weigel Thünen Institute of Biodiversity, Braunschweig, Germany
Monika Wiciarz Department of Plant Physiology and Biochemistry, Faculty of
Biochemistry, Biophysics and Biotechnology, Jagiellonian University, Kraków,
Poland
Part I
Review
Fifty-Five Years of Research
on Photosynthesis, Chloroplasts, and Stress
Physiology of Plants: 1958–2013
Hartmut K. Lichtenthaler
Contents
1
2
Introduction . . . . . . . . . . . . . . . . . . . . . . . . . . . . . . . . . . . . . . . . . . . . . . . . . . . . . . . . . . . . . . . . . . . . . . . . . . . . . . . . .
Phylloquinone (Vitamin K1), Its Localization and Function in Chloroplasts Including
Results on Other Prenylquinones . . . . . . . . . . . . . . . . . . . . . . . . . . . . . . . . . . . . . . . . . . . . . . . . . . . . . . . . . . .
3 Osmiophilic Plastoglobuli: Structure, Composition, and Function . . . . . . . . . . . . . . . . . . . . . . .
4 Composition, Structure, and Function of the Photosynthetic Apparatus of Sun and Shade
Chloroplasts . . . . . . . . . . . . . . . . . . . . . . . . . . . . . . . . . . . . . . . . . . . . . . . . . . . . . . . . . . . . . . . . . . . . . . . . . . . . . . . . .
4.1 Differences in Chlorophyll and Carotenoid Composition . . . . . . . . . . . . . . . . . . . . . . . . . . .
4.2 Differences in Photosynthetic Rates of Sun and Shade Leaves . . . . . . . . . . . . . . . . . . . . .
4.3 Differences in Chloroplast Ultrastructure and Thylakoid Arrangement . . . . . . . . . . . .
5 Forest Decline Research . . . . . . . . . . . . . . . . . . . . . . . . . . . . . . . . . . . . . . . . . . . . . . . . . . . . . . . . . . . . . . . . . . . .
6 Mode of Action of Herbicides in Photosynthesis, Chloroplasts, and the Apicoplast . . . . .
7 Chlorophyll Fluorescence and Fluorescence Imaging of Photosynthetic Activity
and Plant Stress . . . . . . . . . . . . . . . . . . . . . . . . . . . . . . . . . . . . . . . . . . . . . . . . . . . . . . . . . . . . . . . . . . . . . . . . . . . . .
7.1 Chlorophyll Fluorescence . . . . . . . . . . . . . . . . . . . . . . . . . . . . . . . . . . . . . . . . . . . . . . . . . . . . . . . . . . . . .
7.2 The Chlorophyll Fluorescence Ratios RFd and F690/F730 . . . . . . . . . . . . . . . . . . . . . . . . .
7.3 Fluorescence Imaging of Plants . . . . . . . . . . . . . . . . . . . . . . . . . . . . . . . . . . . . . . . . . . . . . . . . . . . . . .
8 The Non-mevalonate Chloroplast Pathway for Isopentenyl Diphosphate and Isoprenoid
Biosynthesis, the DOXP/MEP Pathway . . . . . . . . . . . . . . . . . . . . . . . . . . . . . . . . . . . . . . . . . . . . . . . . . . . .
9 Support by Elder Colleagues . . . . . . . . . . . . . . . . . . . . . . . . . . . . . . . . . . . . . . . . . . . . . . . . . . . . . . . . . . . . . . .
10 Cooperations with Scientific Colleagues . . . . . . . . . . . . . . . . . . . . . . . . . . . . . . . . . . . . . . . . . . . . . . . . . . .
11 Epilogue . . . . . . . . . . . . . . . . . . . . . . . . . . . . . . . . . . . . . . . . . . . . . . . . . . . . . . . . . . . . . . . . . . . . . . . . . . . . . . . . . . . . .
12 Curriculum Vitae of Hartmut K. Lichtenthaler . . . . . . . . . . . . . . . . . . . . . . . . . . . . . . . . . . . . . . . . . . . .
References . . . . . . . . . . . . . . . . . . . . . . . . . . . . . . . . . . . . . . . . . . . . . . . . . . . . . . . . . . . . . . . . . . . . . . . . . . . . . . . . . . . . . . . .
4
5
8
10
11
12
13
16
19
20
20
22
23
26
29
32
34
35
37
Abstract In the past 55 years, enormous scientific progress was made in many
fields of plant physiology and plant biochemistry. Throughout these years, our
knowledge on the photosynthetic light processes, the chemical composition and
H.K. Lichtenthaler (*)
Botanical Institute 2 (Molecular Biology and Biochemistry of Plants), Karlsruhe Institute of
Technology (KIT), University Division, Kaiserstr. 12, 76131 Karlsruhe, Germany
e-mail: hartmut.lichtenthaler@kit.edu
© Springer International Publishing Switzerland 2015
U. Lüttge, W. Beyschlag (eds.), Progress in Botany, Progress in Botany 76,
DOI 10.1007/978-3-319-08807-5_1
3
4
H.K. Lichtenthaler
biosynthesis of the photosynthetic apparatus, the ultrastructure of chloroplasts, and
their large adaptation capacity to high-light and low-light was extremely enhanced.
The author of this article reviews the substantial scientific evolution in these and
other fields in which he was actively involved together with his group. The topics
that are reviewed also include forest decline research, the mode of action of
herbicides in photosynthesis, and in blocking biosynthetic pathways of chloroplasts, such as de novo fatty acid and isoprenoid biosynthesis, as well as the
application of chlorophyll fluorescence imaging in the fast noninvasive determination of photosynthetic activity and early detection of plant stress. Moreover, the
detection, elucidation, and metabolic significance of the non-mevalonate chloroplast pathway for isopentenyl diphosphate and isoprenoid biosynthesis, the DOXP/
MEP pathway, is reviewed. The author further documents that this extreme progress in plant science was largely due to the continuous development and application of new scientific methods and instruments.
1 Introduction
In the fall of 1958 when I started my Ph.D. thesis performing scientific research in
the laboratory of the late Professor Dr. August Seybold, Botanical Institute of the
University of Heidelberg, Germany, experimental research in plant physiology and
photosynthesis in Europe and elsewhere was still in its infancy. Most of the modern
scientific instruments and approaches applied as routine methods today did not yet
exist. In fact, in 1958 our knowledge on photosynthetic light reactions, on the
development and biosynthesis of functional chloroplasts, and on the genuine
biosynthetic pathways of plastids and chloroplasts was very limited. By applying
14
CO2 Melvin Calvin (Nobel laureate 1961) and his group had elucidated already in
1956 the path of carbon in photosynthesis known today as Calvin–Benson cycle. It
was yet unknown that there are two light reactions in photosynthesis with associated photosynthetic electron transport processes, that herbicides can specifically
block photosynthesis, and that chloroplasts possess several other unique biosynthetic capacities, such as the non-mevalonate pathway of isoprenoid biosynthesis or
the de novo fatty acid biosynthesis. Though the electron microscopy of leaves and
other plant materials had started, the fine structure of chloroplasts, the biosynthesis
and arrangements of their biomembranes and the processes during biosynthesis and
degradation of the photosynthetic apparatus were not known.
Over the past 55 years, however, an enormous, steadily increasing progress has
been made in science and particularly in plant science which dramatically increased
our knowledge and understanding of the photosynthetic light reactions, of the
pigment, prenylquinone, and lipid composition of the photosynthetic biomembrane,
as well as of the mode of action of herbicides in blocking either photosynthetic
electron transport or special metabolic activities of chloroplasts. Moreover, the
Fifty-Five Years of Research on Photosynthesis, Chloroplasts, and Stress. . .
5
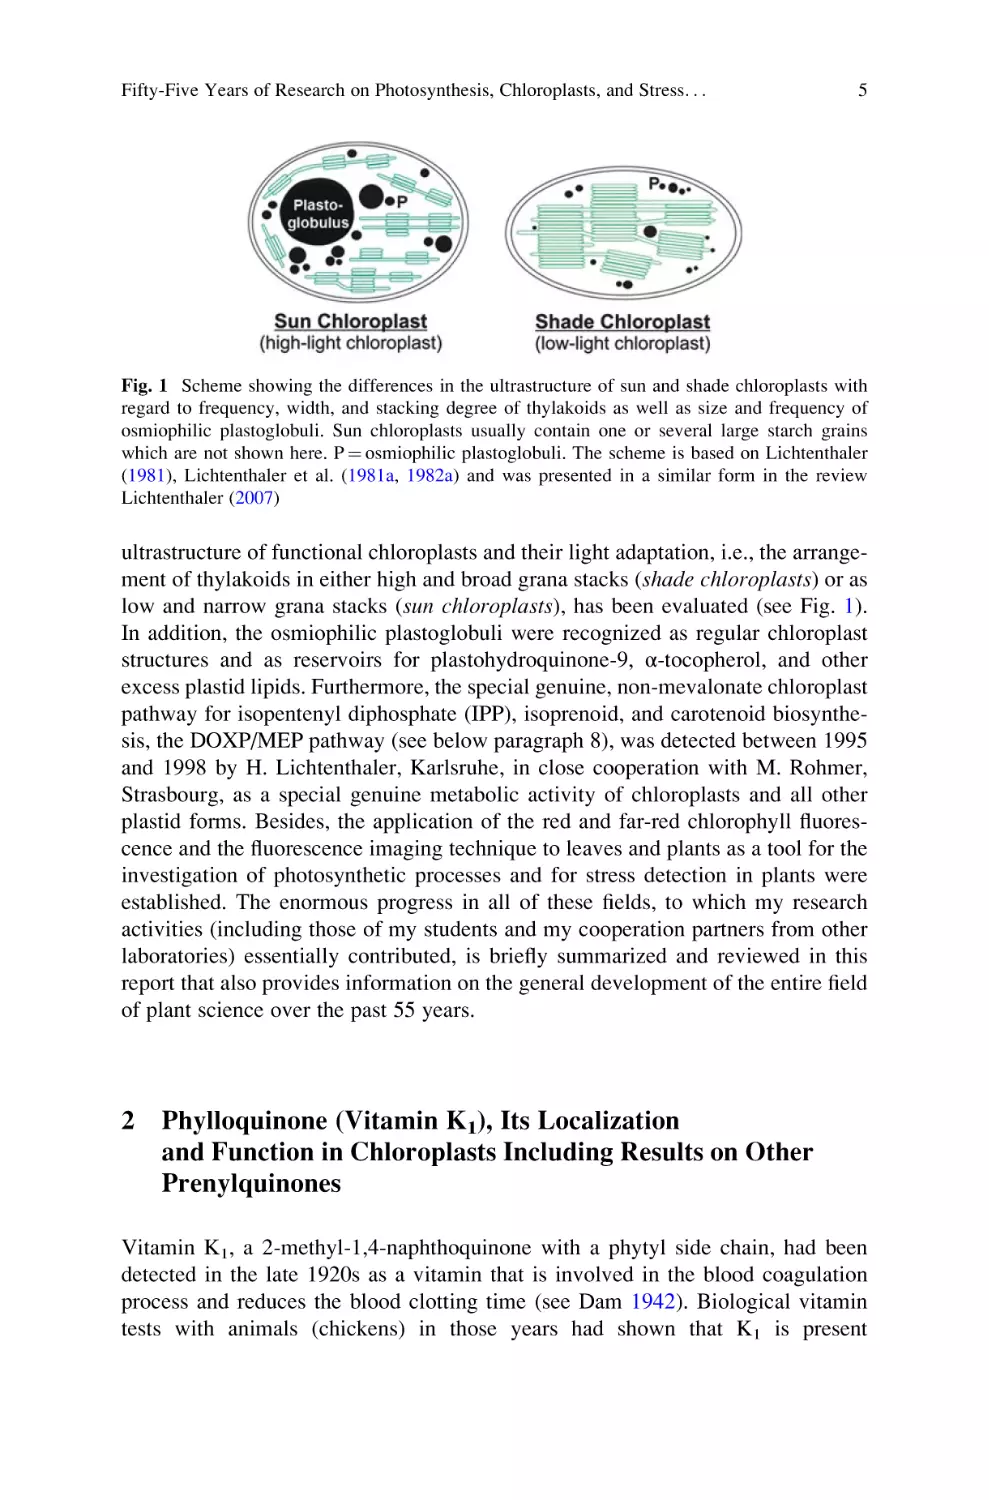
Fig. 1 Scheme showing the differences in the ultrastructure of sun and shade chloroplasts with
regard to frequency, width, and stacking degree of thylakoids as well as size and frequency of
osmiophilic plastoglobuli. Sun chloroplasts usually contain one or several large starch grains
which are not shown here. P ¼ osmiophilic plastoglobuli. The scheme is based on Lichtenthaler
(1981), Lichtenthaler et al. (1981a, 1982a) and was presented in a similar form in the review
Lichtenthaler (2007)
ultrastructure of functional chloroplasts and their light adaptation, i.e., the arrangement of thylakoids in either high and broad grana stacks (shade chloroplasts) or as
low and narrow grana stacks (sun chloroplasts), has been evaluated (see Fig. 1).
In addition, the osmiophilic plastoglobuli were recognized as regular chloroplast
structures and as reservoirs for plastohydroquinone-9, α-tocopherol, and other
excess plastid lipids. Furthermore, the special genuine, non-mevalonate chloroplast
pathway for isopentenyl diphosphate (IPP), isoprenoid, and carotenoid biosynthesis, the DOXP/MEP pathway (see below paragraph 8), was detected between 1995
and 1998 by H. Lichtenthaler, Karlsruhe, in close cooperation with M. Rohmer,
Strasbourg, as a special genuine metabolic activity of chloroplasts and all other
plastid forms. Besides, the application of the red and far-red chlorophyll fluorescence and the fluorescence imaging technique to leaves and plants as a tool for the
investigation of photosynthetic processes and for stress detection in plants were
established. The enormous progress in all of these fields, to which my research
activities (including those of my students and my cooperation partners from other
laboratories) essentially contributed, is briefly summarized and reviewed in this
report that also provides information on the general development of the entire field
of plant science over the past 55 years.
2 Phylloquinone (Vitamin K1), Its Localization
and Function in Chloroplasts Including Results on Other
Prenylquinones
Vitamin K1, a 2-methyl-1,4-naphthoquinone with a phytyl side chain, had been
detected in the late 1920s as a vitamin that is involved in the blood coagulation
process and reduces the blood clotting time (see Dam 1942). Biological vitamin
tests with animals (chickens) in those years had shown that K1 is present
6
H.K. Lichtenthaler
predominantly in green plant tissue such as leaves, yet even in the late 1950s a
chemical analysis of vitamin K1 in plant tissues had not yet been performed. This
then became the topic of my Ph.D. thesis in the fall of 1958 when I started it with
Professor August Seybold at the University of Heidelberg. Due to the fact that
vitamin K1 is a typical genuine plant product particularly in green leaves, it was
later termed phylloquinone. Since it contains a phytyl side chain, as do the two
chlorophylls a and b, our assumption in 1958 was that it could be associated
together with the chlorophylls in chloroplasts and play a role in their photosynthetic
process. Upon column chromatography of leaf pigment extracts with the then
applied sucrose columns, K1 showed up in the β-carotene fraction. By a repetition
of the column chromatography of the β-carotene fraction with a slowed down
elution time I could partially separate K1 from β-carotene. Via a subsequent
paper chromatography the existence of vitamin K1 in all green leaf tissues was
proven, whereas only trace amounts were found in white plant tissues (leucoplasts)
and in orange fruit tissue (chromoplasts). K1 could be well located on the chromatograms because it emits an intense light green color upon illumination with UV light,
which is specific for phylloquinone K1. In contrast, in yeast and various edible fungi
I could not detect any K1. First approaches towards a quantitative determination of
K1 in green leaf extracts of different plants (applying column chromatography
followed by a chemical reduction to its hydroquinone) revealed that K1 was present
in leaves at a low concentration of only about one to two molecules per 100 molecules of chlorophyll (Lichtenthaler 1962).
Laboratory research in botanical institutions in Germany and other European
countries in the 1950s was rather strenuous and difficult. In those postwar times
modern instruments for experimental research were still lacking. The powerful
techniques of thin layer chromatography that allows the separation of minor plant
lipids (e.g., phylloquinone K1) from major plant lipids, such as carotenoids or
chlorophylls, had not yet been developed. Moreover, recording spectrophotometers
were not yet available. In fact, one had to determine the absorbance spectrum of an
isolated pigment by measuring the absorbance step by step at each wavelength, first
for the blind and then for the sample in order to finally obtain an approximate
spectrum of a carotenoid or a chlorophyll in the visible region or of a lipid fraction
enriched with phylloquinone in the UV region.
In contrast to Europe, the working conditions for scientific research were
completely different in the USA at that time. Thus, in 1962 when I joined, as a
postdoctoral research associate, Melvin Calvin’s laboratory at the University of
California in Berkeley for 2 years, I found there excellent scientific equipment and
modern instruments which simplified and advanced scientific research. There I
quickly proved that phylloquinone K1 was, indeed, located in isolated chloroplasts
and also in the smallest thylakoid fragments isolated from sonicated chloroplasts,
then termed “quantasome aggregates”. When I presented M. Calvin a short note to
publish these results, he had just received a manuscript in print by F.L. Crane.
Already in 1959 the latter had discovered plastoquinone-9 in chloroplasts (Crane
1959), and now also described the location of K1 in chloroplasts (Kegel and Crane
1962). For this reason, my K1 results were only published later, together with other
Fifty-Five Years of Research on Photosynthesis, Chloroplasts, and Stress. . .
7
observations on the prenylquinone and carotenoid content of thylakoids
(Lichtenthaler and Calvin 1964). This information is also found in the paper
published with Rod Park where we had summarized the basic lipid and protein
composition of thylakoids (Lichtenthaler and Park 1963). This paper in Nature
being the first description of the complete lipid composition of a biomembrane
strongly stimulated research in other laboratories. Thus, within about 2 years the
lipid composition of various other biomembranes in plants and animals was
published.
Via further analysis of isolated chloroplasts I detected that their thylakoid
membranes also contained α-tocopherol and α-tocoquinone and that
plastoquinone-9 was present in its reduced form plastoquinol-9. In addition, I
could prove that the thylakoid-free 145,000 g supernatant contained a layer of
osmiophilic globuli with high amounts of plastoquinone-9, including its reduced
form plastoquinol-9, as well as α-tocopherol (Lichtenthaler and Calvin 1964). For
more details on osmiophilic globuli, see below paragraph 3.
After my return to Germany these studies were continued and showed that
phylloquinone K1 was enriched in the photosynthetic photosystem I (PSI), whereas
the major part of plastoquinone-9 was bound to photosystem II (PSII)
(Lichtenthaler 1969a). α-tocopherol and α-tocoquinone were not specifically
bound to one photosystem but were found in both PSI and PSII particle fractions.
In further studies on the partition of phylloquinone K1 between digitonin particles
and chlorophyll carotenoid proteins of tobacco we could prove that phylloquinone
K1 is, in fact, exclusively bound to the photosystem I particles (Interschick-Niebler
and Lichtenthaler 1981) where it has a function in photosynthetic electron transport
(Golbeck 1987). Another observation emphasized the essential requirement of
phylloquinone K1 and β-carotene for a functional photosynthetic apparatus. Etiolated leaf tissue already contained plastoquinone-9 and lutein, yet phylloquinone K1
and β-carotene in trace amounts only. However, during the first hours of illumination etiolated leaf tissues synthesize and accumulate phylloquinone K1 and
β-carotene at high rates parallel to the formation of the first thylakoids, whereas
the de novo accumulation of lutein and plastoquinone-9 that had been formed
before in the dark started much later (Lichtenthaler 1969b). Concerning the question which light was responsible for the light-induced biosynthesis of thylakoids
and their carotenoids as well as prenylquinones we could show that active phytochrome, P730, is required (Lichtenthaler and Becker 1972) and that this process
proceeds also in blue light and red light.
It was also an essential finding that plastoquinone-9 and α-tocopherol are present
in the chloroplast envelope membranes and in low levels also phylloquinone K1
which seem to reflect biosynthetic pool sizes (Lichtenthaler et al. 1981b). Moreover, we addressed the question on the occurrence and concentration of ubiquinone
homologues in plants and their mitochondria and found that these contained
ubiquinone-9 and ubiquinone-10, also known as coenzyme Q-9 and Q-10 (Schindler 1984; Schindler and Lichtenthaler 1984).
8
H.K. Lichtenthaler
3 Osmiophilic Plastoglobuli: Structure, Composition,
and Function
A major part of my early research in the 1960s until the mid-1970s was to establish
the fact that osmiophilic plastoglobuli are genuine morphological structures of
chloroplasts and other plastid forms and that they function primarily as a lipid store
for excess lipids, such as α-tocopherol and plastoquinone-9 + plastoquinol-9, as well
as in some plastid stages for glycerolipids and in chromoplasts also for carotenoids.
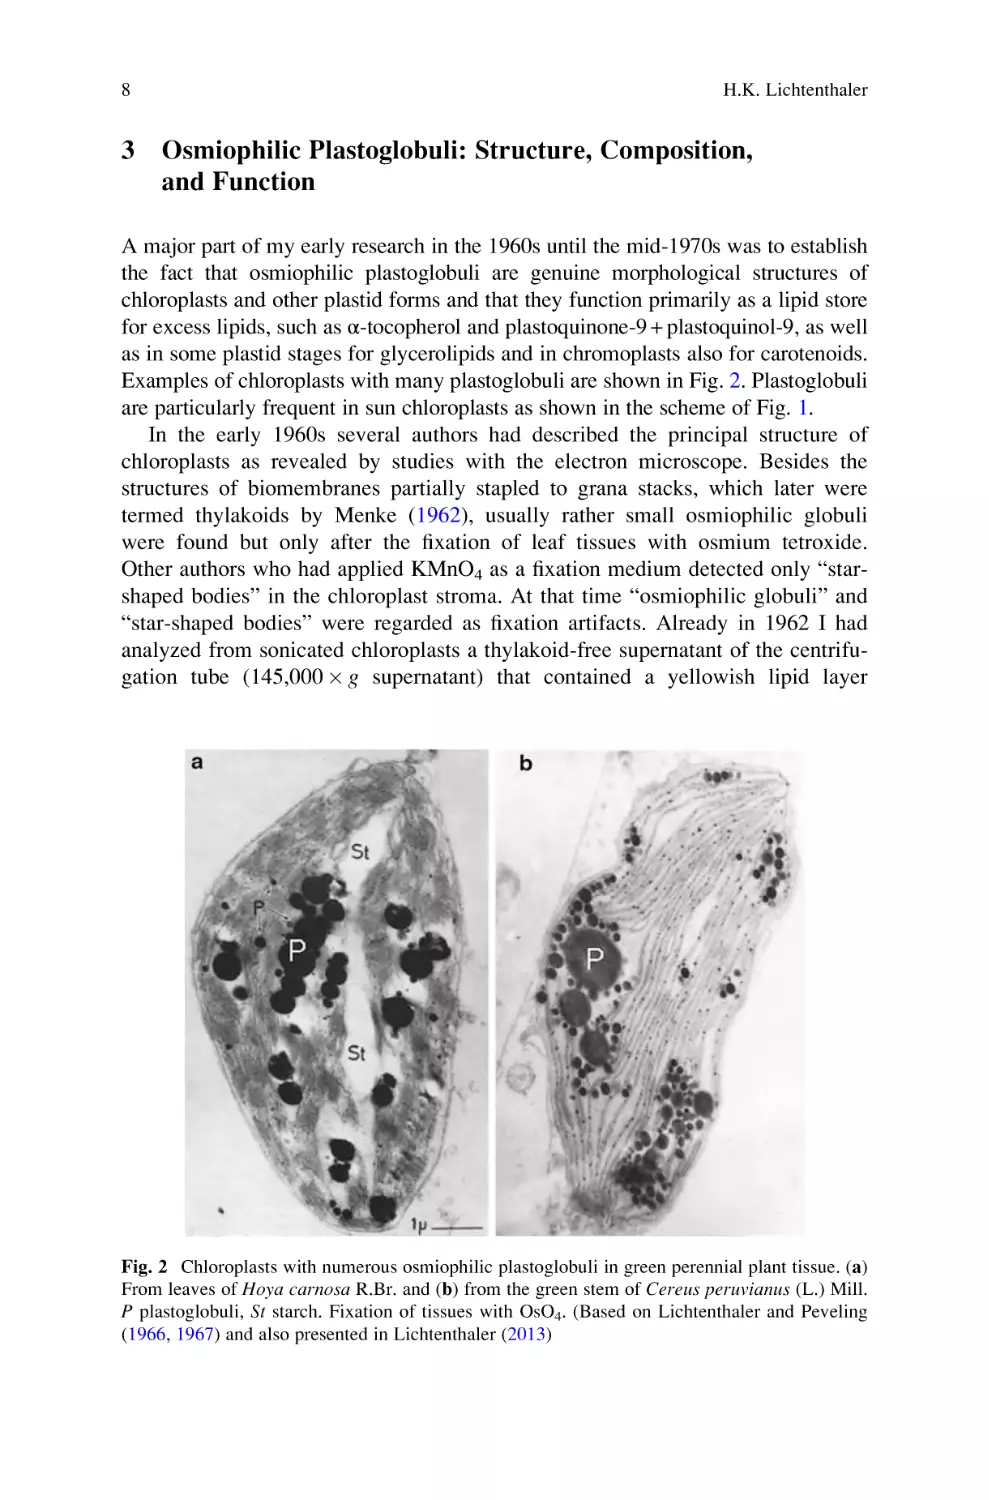
Examples of chloroplasts with many plastoglobuli are shown in Fig. 2. Plastoglobuli
are particularly frequent in sun chloroplasts as shown in the scheme of Fig. 1.
In the early 1960s several authors had described the principal structure of
chloroplasts as revealed by studies with the electron microscope. Besides the
structures of biomembranes partially stapled to grana stacks, which later were
termed thylakoids by Menke (1962), usually rather small osmiophilic globuli
were found but only after the fixation of leaf tissues with osmium tetroxide.
Other authors who had applied KMnO4 as a fixation medium detected only “starshaped bodies” in the chloroplast stroma. At that time “osmiophilic globuli” and
“star-shaped bodies” were regarded as fixation artifacts. Already in 1962 I had
analyzed from sonicated chloroplasts a thylakoid-free supernatant of the centrifugation tube (145,000 g supernatant) that contained a yellowish lipid layer
Fig. 2 Chloroplasts with numerous osmiophilic plastoglobuli in green perennial plant tissue. (a)
From leaves of Hoya carnosa R.Br. and (b) from the green stem of Cereus peruvianus (L.) Mill.
P plastoglobuli, St starch. Fixation of tissues with OsO4. (Based on Lichtenthaler and Peveling
(1966, 1967) and also presented in Lichtenthaler (2013)
Fifty-Five Years of Research on Photosynthesis, Chloroplasts, and Stress. . .
9
consisting of relatively small osmiophilic globuli, first seen by Park and Pon (1961).
This layer contained high amounts of α-tocopherol and plastoquinone-9 +
plastoquinol-9, apparently excess amounts that were not bound to the photochemically active thylakoids (e.g., Lichtenthaler 1964). This globuli fraction was free of
chlorophylls and contained only traces of xanthophylls. Later I showed in a detailed
investigation that the “osmiophilic globuli” are regular structural components of the
chloroplast stroma and are present in practically all differentiation stages of plastids
(see Lichtenthaler 1968). Thus, we termed them “osmiophilic plastoglobuli”
(Lichtenthaler and Sprey 1966). Since α-tocopherol and plastoquinol-9 are strong
reducing agents, the plastoglobuli readily reduce OsO4 and thus appear
osmiophilic. Moreover, we isolated them from several plants, e.g., Billbergia,
Eucharis, Ficus, Spinacia, and Tradescantia, and showed that in chloroplasts of
older green leaves the osmiophilic plastoglobuli possess considerably larger diameters than in young spinach leaves (Lichtenthaler and Sprey 1966; Grumbach and
Lichtenthaler 1974).
Plastoglobuli predominately function as an extra-thylakoidal store for plant
lipids and in particular for excess α-tocopherol and plastoquinone-9 and
plastoquinol-9 which are accumulated in high amounts in sun leaves (see review
Lichtenthaler 2007) and older green leaves of perennial plant tissues e.g., Ficus
(Lichtenthaler and Weinert 1970). In chromoplasts plastoglobuli contain also
carotenoids and secondary carotenoids that are accumulated together with
α-tocopherol and plastoquinone-9 as well as plastoquinol-9 during chromoplast
formation. Further, in etioplasts of dark-grown plant seedlings plastoglobuli contain, besides α-tocopherol and plastoquinone-9 + plastoquinol-9, also xanthophylls
and possibly also glycerolipids, lipids that are used for the light-induced thylakoid
formation. Thus, young chloroplasts are free of osmiophilic plastoglobuli. During
chloroplast degeneration and thylakoid breakdown plastoglobuli become more
numerous, and usually only a few rather large plastoglobuli remain in the final
gerontoplast. Observations by other authors indicate that at a disturbance of normal
thylakoid biosynthesis, e.g., by herbicides or other treatments, even triacylglycerides may accumulate and be deposited in plastoglobuli as well, whereby
also translucent plastoglobuli can be formed because such lipids are less
osmiophilic or not at all [for details and the original references, see the recent
plastoglobuli review by Lichtenthaler (2013)]. All data available so far indicate that
the interior of osmiophilic plastoglobuli is of pure lipid nature. Due to their more
aqueous character proteins cannot be stored inside the plastoglobuli.
Concerning plastoglobuli function, in 1974 we made the highly interesting
observation in several plants that the plastoquinol-9 pool in plastoglobuli becomes
partially photo-oxidized during the first minutes of the light-induced onset of
photosynthetic processes (Grumbach and Lichtenthaler 1974). This photooxidation of the plastoquinol-9 pool proceeded in parallel to the photoreduction
of violaxanthin to zeaxanthin in the xanthophyll cycle, a process that was reversible
in darkness. Thus, it appears that during illumination there occurs an electron flow
from plastoglobuli to thylakoids, a process that is partially or fully reversed in the
dark (Grumbach and Lichtenthaler 1974). This indicates an interesting regulatory
function of the plastoquinol-9 pool of plastoglobuli in the photosynthetic light
10
H.K. Lichtenthaler
reactions and the performance of the xanthophyll cycle. More recent observations
indicate that in chloroplasts plastoglobuli may contain on their outer surface certain
functional chloroplast proteins, which may be coupled to thylakoids and could
function in the biosynthesis of chloroplast lipids and possibly also in an active
channeling of lipid molecules and lipid breakdown products (Austin et al. 2006;
Bréhélin et al. 2007; Bréhélin and Kessler 2008). This opens up an interesting
additional aspect concerning plastoglobuli function but requires much further
research. More literature and many further details on our research on osmiophilic
plastoglobuli as well as references to the parallel observations of other laboratories
are found in a recent comprehensive plastoglobuli review (Lichtenthaler 2013).
4 Composition, Structure, and Function
of the Photosynthetic Apparatus of Sun and Shade
Chloroplasts
An essential part of the research in my group over the last 50 years was to
investigate the adaptation of the photosynthetic apparatus and to establish the
irradiance-induced differences in pigment composition, photosynthetic quantum
conversion, and CO2 fixation rates of sun and shade chloroplasts of trees. This also
included a detailed investigation of the fine structure and in particular of the
differential arrangement and stacking of thylakoids in sun and shade chloroplasts
as well as in high-light and low-light chloroplasts from leaves of plants grown under
high-light and low-light growth conditions (cf. Fig. 1). This research also contained
a detailed investigation of the light-induced biosynthesis of the photosynthetic
apparatus in dark-grown etiolated leaf tissues. In this very broad field of photosynthesis and plant physiology very little was known in the mid-1960s. We made large
progress in our knowledge particularly by applying in parallel various different
techniques, including electron microscopy, spectroscopy, and fluorescence analysis, and also by developing new methods, such as reversed phase high-performance
liquid chromatography (HPLC) for separation of leaf pigments, gel electrophoresis
(PAGE) for the separation of chlorophyll–carotenoid protein complexes of whole
chloroplasts, and the superb technique of chlorophyll fluorescence imaging of the
photosynthetic quantum conversion of intact leaves. In addition, I redetermined the
absorption coefficients of chlorophylls and all individual carotenoids in different
solvents and established new equations for the quantitative determination of chlorophyll a and b and the sum of leaf carotenoids (x + c) next to each other in one leaf
extract solution (Lichtenthaler 1987). This allows an easy determination of the
pigment levels per leaf area or leaf weight unit, including the pigment ratios Chl a/b
and total chlorophylls to total carotenoids (a + b)/(x + c). Today this method is
applied in most laboratories of photosynthesis and plant physiology.
Fifty-Five Years of Research on Photosynthesis, Chloroplasts, and Stress. . .
4.1
11
Differences in Chlorophyll and Carotenoid Composition
The differentiation between sun and shade leaves as well as sun and shade plants
was already made by August Seybold in the 1930s when he analyzed the chlorophyll and carotenoid composition of sun and shade leaves of trees by chromatography of leaf pigment extracts using sugar powder columns. Although he could not
yet separate the different xanthophylls from each other, he already demonstrated
that sun leaves had higher values for the ratio Chl a/b, and considerably lower
values for the ratio xanthophylls to β-carotene, x/c, and also for the ratio of total
chlorophylls to total carotenoids, (a + b)/(x + c) (Seybold and Egle 1937). With the
establishment of thin layer chromatographic (TLC) techniques for the separation of
chlorophylls and individual carotenoids in the 1960s (e.g., Hager and Bertenrath
1962), I reinvestigated the pigment composition of plant leaves in dependence of
the incident light and confirmed these particular pigment ratios that are quite
different for sun leaves as compared to shade leaves. In addition, the individual
levels of the different xanthophylls in sun and shade leaves were determined for the
first time. Moreover, we could demonstrate that the same differences in pigment
ratios and xanthophyll levels as for sun and shade leaves also existed for leaves of
high-light and low-light seedlings that were grown at either high or low irradiances,
respectively. Major parts of these results are briefly summarized in the review of
Lichtenthaler (2007) and Lichtenthaler and Babani (2004). Reversed phase TLC
allowed a distinct separation of zeaxanthin from lutein. Thus, we could clearly
demonstrate that sun leaves and leaves of high-light plants had much higher levels
of xanthophyll cycle carotenoids (zeaxanthin + antheraxanthin + violaxanthin) as
compared to shade leaves or leaves of low-light plants, both on a leaf area as well
as on a total carotenoid or on a total chlorophyll a + b level.
After having established a high-performance liquid chromatography (HPLC)
technique for fast chlorophyll and carotenoid separation within 20 min (e.g., Schindler et al. 1992, 1994), this strict irradiance dependence of the photosynthetic pigment
ratios and the level of xanthophyll cycle carotenoids of chloroplasts during leaf and
chloroplast development was further accentuated. With this powerful HPLC method
we also determined the kinetics of the light-triggered photoreduction of violaxanthin
to zeaxanthin in field-grown maple trees during the course of a sunny and a cloudy
day (Schindler and Lichtenthaler 1996) which showed the spontaneous response of
the redox state of the xanthophyll cycle carotenoids to transient changes in the
irradiance of leaves. Moreover, we could demonstrate in leaves of the tobacco
“aurea” mutant Su/su grown at medium irradiance that at high irradiance stress
zeaxanthin accumulated in a dynamic biphasic process, i.e., not only via a fast
transformation of violaxanthin to zeaxanthin, but by doubling the level of xanthophyll cycle carotenoids within 5 h of high irradiance exposure by de novo biosynthesis and accumulation of new zeaxanthin (Schindler et al. 1992; see also review
Lichtenthaler 2007). In the same time period also the β-carotene pool increased by
one-third via de novo biosynthesis. These results, which were supplemented by
parallel chlorophyll fluorescence measurements and determination of characteristic
12
H.K. Lichtenthaler
fluorescence ratios, such as ratios Fv/Fm, dF/Fm0 as well as photochemical quenching
qP and non-photochemical quenching qN (see also Schindler and Lichtenthaler 1996),
demonstrated the high flexibility and adaptation capacity of chloroplasts and their
photosynthetic pigment apparatus against high-light stress to avoid photo-inhibition
and photo-degradation (Lichtenthaler and Schindler 1992). Moreover, additional
investigations showed that in fully developed and differentiated leaves the complete
photosynthetic pigment apparatus of shade chloroplasts can successively be changed
by partial pigment breakdown and de novo pigment accumulation to that of sun
chloroplasts and vice versa within a few days.
4.2
Differences in Photosynthetic Rates of Sun and Shade
Leaves
That sun and shade leaves may have different rates and capacities in photosynthetic
quantum conversion had long been assumed, e.g., by Seybold in the 1930s. In the late
1960s and early 1970s it had been shown by some authors that sun plants have higher
photosynthetic CO2 fixation rates than shade plants. Yet, a detailed analysis of sun
and shade leaves of the same tree or of plant species grown at different incident light
conditions had not yet been performed in a direct comparative way. Some of the early
general knowledge of that time was later summarized by Boardman 1977. When we
were able to buy one of the (back then still complex) infrared CO2 gas analyzer
systems, I specifically addressed this topic. The small and very handy CO2 measuring
systems (CO2/H2O porometers) of today did not yet exist. As expected, our
measurements showed that the net CO2 fixation rates PN were considerably higher
in sun and high-light leaves as compared to shade and low-light leaves of the same
plants (Lichtenthaler 1981; Lichtenthaler et al. 1981a), which was correlated with a
higher stomata density of the leaves. Further, we could show that sun and high-light
leaves exhibited a higher level of soluble sugars. The highly significant differences in
photosynthetic quantum conversion between sun and shade leaves are found in
different reference systems, not only on a leaf area basis, but also on a total
chlorophyll basis. In addition, these differences also showed up in the Hill activity
of isolated chloroplasts, which proved to be significantly higher in sun and high-light
chloroplasts as compared to shade and low-light chloroplasts.
Furthermore, the same differences were found in the values of the variable
chlorophyll fluorescence decrease ratio RFd that was measured, in parallel, of intact
sun and high-light leaves as well as shade and low-light leaves. In the mid-1970s we
had established this chlorophyll fluorescence decrease ratio RFd (originally
addressed by us as vF) being based on the measurement of the light-induced slow
Chl fluorescence decline during 5 min (slow component of the Kautsky Chl
fluorescence induction kinetics) as a valuable indirect measure of the net photosynthetic rates [e.g., Lichtenthaler et al. (1981a, 1984), see also review
Lichtenthaler and Babani (2004)]. For details see below paragraph 7.2. The method
Fifty-Five Years of Research on Photosynthesis, Chloroplasts, and Stress. . .
13
is much faster than measurements of the photosynthetic CO2 fixation rates, it can
easily be applied in outdoor measurements and was successfully applied as a stress
and damage indicator in our forest decline research in the Black Forest between
1983 and 1990 [e.g., Lichtenthaler (1988a, b), Lichtenthaler and Rinderle (1988a)].
The fact that there is a direct correlation between the RFd values and the photosynthetic net CO2 fixation rates of sun and shade leaves of trees has been confirmed
more recently for various trees at several locations applying the new technique of
Chl fluorescence imaging where several ten thousands RFd values are simultaneously determined for all parts of one leaf (Lichtenthaler et al. 2000a, 2005b,
2007). It has been demonstrated very recently (Lichtenthaler et al. 2013a) that, with
respect to their chlorophyll–carotenoid composition and their photosynthetic activity (PN rates, RFd values), blue-shade and half-shade leaves possess an intermediate
position between sun and shade leaves.
4.3
Differences in Chloroplast Ultrastructure and Thylakoid
Arrangement
Based on the large differences in the chlorophyll–carotenoid composition and
photosynthetic activity between sun and shade leaves and the leaves of high-light
and low-light plants one could anticipate considerable differences in the fine
structure of sun and shade chloroplasts as well as high-light and low-light chloroplasts. In fact, our electron microscopical investigations revealed that the chloroplast ultrastructure of shade and low-light chloroplasts is characterized by a much
higher number of thylakoids per granum stack and a significantly higher stacking
degree of thylakoids, but also by a significantly broader width of grana thylakoids
and grana stacks than in sun and high-light chloroplasts (Lichtenthaler et al. 1981a;
Meier and Lichtenthaler 1981) as summarized in Fig. 1 and Table 1. In addition, sun
chloroplasts exhibit large starch grains (Fig. 3) which are usually missing in shade
and low-light chloroplasts. Moreover, sun and high-light chloroplasts contain more
and larger osmiophilic plastoglobuli and consequently higher levels of excess
α-tocopherol and plastoquinone-9 that are located in the plastoglobuli as compared
to shade and low-light chloroplasts [see the review Lichtenthaler (2007)].
When it had been shown in 1975 that chlorophylls and carotenoids within the
photosynthetic membrane are bound to the different chlorophyll–carotenoid proteins CPa, CPI, CPIa and the light-harvesting chlorophyll–xanthophyll proteins
LHCPs (Thornber 1975), we adopted the gel electrophoresis techniques (PAGE)
for isolated whole chloroplasts and in a quantitative way we studied the presence of
the chlorophyll–carotenoid proteins in sun and shade chloroplasts. This way we
could show that the higher stacking degree of thylakoids in shade and low-light
chloroplasts is, in fact, associated with a significantly higher level of the lightharvesting chlorophyll–carotenoid proteins LHCPs (Lichtenthaler et al. 1982a, b)
that are known to be responsible for thylakoid stacking.
In summary, our comparative investigations revealed that leaves and their
chloroplasts are highly reactive, adaptive, morphological, and biochemical systems
14
H.K. Lichtenthaler
that specifically adapt to the prevailing incident light conditions by forming either
sun and high-light chloroplasts or shade and low-light chloroplasts. Thus, sun and
high-light leaves with their chloroplasts are adapted for high rates of photosynthetic
quantum conversion and CO2 fixation and contain high amounts of xanthophyll
cycle carotenoids to avoid photo-inhibition, whereas the photosynthetic apparatus
of shade and low-light leaves primarily “invests” into increasing the light-absorbing
pigment cross section in order to catch enough light for performance of
Table 1 Major differences in ultrastructure, thylakoid arrangement, pigment composition, and
photosynthetic function of sun and shade chloroplasts
Sun chloroplasts
Shade chloroplasts
Low thylakoid amounts (per chloroplast
section)
Narrow grana stacks (width: 0.20–0.26 μm)
Few thylakoids per granum
Lower stacking degree (%)
Fagus: 57 6
Raphanus: 55 5
Triticum: 54 5
Zea mays: 55 3
Appressed thylakoids: low level
Appressed/exposed thylakoids
Fagus: 1.3
Raphanus: 1.2
Triticum: 1.2
Zea mays: 1.2
Low levels of LHCPs
Numerous and large plastoglobuli
Large starch grains
High values for Chl a/b
3.0–4.3
Pigment ratio x/c
Low values: 1.7–2.3
Pigment ratio (a + b)/(x + c)
Low values: 3.8–4.9
Xanthophyll cycle carotenoids
High levels
High amounts of excess α-T
High level of excess plastoquinone-9
(PQ-9 + PQ-9•H2)
High RFd values
3.5–5.5
High photosynthetic rates PN
4.6–11.5 μmol CO2 m2 s1
High thylakoid amounts (per chloroplast
section)
Broad grana stacks (width: 0.33–0.50 μm)
High grana stacks
High stacking degree (%)
82 6
64 4
73 3
77 3
Appressed thylakoids: high level
Appressed/exposed thylakoids
4.7
1.8
2.7
3.3
High levels of LHCPs
Few small plastoglobuli
No starch
Low values for Chl a/b
2.3–2.7
Pigment ratio x/c
High values: 2.6–4.0
Pigment ratio (a + b)/(x + c)
High values: 5.1–6.5
Xanthophyll cycle carotenoids
Low levels
Low α-T levels
No excess plastoquinone-9
(PQ-9 + PQ-9•H2)
Low RFd values
1.8–2.7
Low photosynthetic rates PN
2.6–3.8 μmol CO2 m2 s1
Fifty-Five Years of Research on Photosynthesis, Chloroplasts, and Stress. . .
15
Fig. 3 Sun chloroplast of
beech (Fagus sylvatica)
with large starch grains
and several translucent
plastoglobuli at the lower
left side within the
chloroplast
photosynthesis. We also checked which other factors besides irradiance control the
formation of sun and shade chloroplasts. We could show that the formation of sun
chloroplasts is induced by blue light (Lichtenthaler et al. 1980) and enhanced by the
phytohormone kinetin (Lichtenthaler and Buschmann 1978), whereas shade chloroplast formation and increased stacking of thylakoids are caused by red light
illumination and is further promoted by the application of photosystem 2 herbicides,
such as bentazon (Meier and Lichtenthaler 1981). This dependence of the formation
of sun and shade chloroplasts on either blue or red light indicates that the phytochrome system—specifically the ratio of red/far-red light—is involved in this
adaptation response of chloroplasts. In fact, the incident light in the shade of trees
Table 1 (continued)
Presented are the differential frequency, width, and stacking degree of thylakoids and the level of
light-harvesting Chl a/b proteins LHCPs, which is also documented in the differential ratios of
appressed to exposed thylakoid biomembranes. In addition, the size and frequency of osmiophilic
plastoglobuli and the differences in the level of total plastoquinone-9 (oxidized and reduced form:
PQ-9 and PQ-9•H2) and α-tocopherol (α-T). Significant differences also exist in the pigment
ratios Chl a/b, xanthophylls to carotenes, x/c, as well as total chlorophylls to total carotenoids
(a + b)/(x + c) that are presented. Moreover, the differences in photosynthetic quantum conversion,
i.e., the variable Chl fluorescence decrease ratio RFd and the net photosynthetic rates PN yielding
high values in sun leaves as compared to shade leaves, are presented
Higher values of individual parameters either present in sun or in shade chloroplasts are shown in
bold print. Concerning the stacking degree of thylakoids and width of grana stacks electromicrographs of Fagus chloroplasts of sun and shade leaves were investigated and in the case of
Raphanus, Triticum, Zea mays chloroplast electromicrographs of seedlings grown at high-light
and low-light conditions. The ultrastructural and thylakoid arrangement data of chloroplasts in this
table are primarily based on Lichtenthaler (1981) and Lichtenthaler et al. (1981a, 1982a, 1984),
whereas the pigment ratio data, the level of α-tocopherol and plastoquinone-9, and the differences
in RFd values and photosynthetic CO2 fixation rates are based on our earlier data reviewed in
Lichtenthaler (2007) and Lichtenthaler and Babani (2004); see also Sarijeva et al. (2007) and
Lichtenthaler et al. (2013a). The significance levels for the differences between sun and shade
leaves and sun and shade chloroplasts in the indicated parameters are ranging from p<0.05 to p<
0.001 as indicated in the original publications cited above.
16
H.K. Lichtenthaler
and forests is enriched with far-red light, whereas sun light and blue skylight only
contain relatively low amounts of far-red light. Thus, in sun light and blue skylight
the ratio red/far-red light amounts to values of 1.56 and 1.52, respectively, whereas
in the shade the red/far-red ratio exhibits a value of 0.21 and in the half-shade of
0.42. The values of the red/far-red ratio presented here were calculated from those
of the reverse ratio given by Lichtenthaler et al. (2013a).
5 Forest Decline Research
In the summer of 1982 I became aware of the reports of several German foresters
who complained about the unusual decline of spruce (Picea abies (L.) H. Karst.)
and fir trees (Abies alba Mill.) at several locations in the Northern Black Forest,
e.g., on the Mauzenberg (altitude 755 m) near the town of Herrenalb. Together with
those foresters I examined this decline and the particular damage symptoms.
Apparently I was one of the first German plant physiologists who took this threat
to our forest trees seriously. The decline started with a considerable loss of the older
3- to 6-year-old needles, a yellowing and bleaching of chlorophyll in younger
needles as well as a reduced accumulation of chlorophylls and carotenoids in
current and first-year needles, combined with a diminished formation and growth
of needles, to just name a few major damage symptoms. In addition, the tree crowns
of spruces having shorter branches and fewer side branches became fairly open,
whereas the tree tops of firs exhibited a strongly reduced growth of length resulting
in compressed tree tops that were termed “stork’s nests” and were easily visible
from the long distance. In each case tree stands on western exposed slopes and
hilltops above 600–1,000 m were affected. The foresters also showed me several
unusual damage symptoms on older beech trees (Fagus sylvatica L.). In the spring
of 1983 more forest sites were affected and the initially more isolated stands were
increasing and extended further. In fact, in some places the development was
dramatic; thus, from mid-June to the beginning of October 1983 all spruces and
firs of a whole mountain top, the Katzenkopf (altitude 900–1,100 m), in the Black
Forest had died off.
The causes for such a fast progressing damage and tree decline in the Black
Forest initially remained mysterious, although one began to discuss the possible
effects of air pollutants, in particular sulfur dioxide, being transported by the
predominantly western winds to the western exposed upper tree stands of the
Black Forest. At that time high sulfur dioxide levels had already been recognized
as the major cause for the forest decline in many mountain areas in Czechoslovakia.
The fact that I had early access to the results of fumigation experiments with
greenhouse plants of English colleagues (see below) allowed me to be among the
first to point out that, in addition to sulfur dioxide, nitrogen oxides—which also
provoke the light-induced formation of ozone—were essential causes for the largescale tree and forest decline.
Fifty-Five Years of Research on Photosynthesis, Chloroplasts, and Stress. . .
17
During a sabbatical in 1981, which I spent at the University of Lancaster, I
learned there about the essential research results of Alan Wellburn and Terry
Mansfield showing that low atmospheric levels of sulfur dioxide plus nitrogen
dioxide had more than additive inhibitory effects on plants cultivated in growth
chambers (Wellburn et al. 1981; Mansfield et al. 1982). The cause for this was the
fact that sulfur dioxide inactivates the plants’ nitrite reductase, which reduces nitrite
and starts its successive transformation into ammonia that is incorporated into
amino acids. When in 1982 and 1983 I checked the measured levels of nitrogen
oxides (NO and NO2) and sulfur dioxide in the Karlsruhe area and in the Black
Forest nearby, it was clear that on a large number of days the levels of these air
pollution gases were much higher than the levels used by Mansfield and Wellburn
in their growth chamber experiments. Therefore, it was evident that in the Black
Forest not only sulfur dioxide but also nitrogen oxides were essentially responsible
for the decline of forest trees. In addition, those high levels of nitrogen oxides
caused the irradiance-induced formation of ozone which, during sunny and hot
summer days, rose to extremely high levels at the Rhine river valley in Karlsruhe
and the nearby Black Forest, levels that were not only dangerous to humans but also
caused considerable damage to plants and their photosynthetic apparatus. We
summarized this information, together with the different damage symptoms of
forest trees presented in photos, in a short review “The forest decline: progression,
causes and consequences” (Lichtenthaler and Buschmann 1983). This review was
sent out to colleagues, to politicians, to people in private industry, as well as to
interested laymen. It received great resonance among the public, politicians, and
also foresters, and it triggered the general discussions in the public. Yet, at that time
many of my German colleagues in plant physiology refused to accept the fact that,
except for the particular situation in the Czech mountains, air pollutants would or
could cause tree damage and forest decline. In fact, several colleagues postulated
infections by unknown fungi and microbes as a primary cause for this large-scale
forest decline.
Moreover, we demonstrated via chlorophyll (Chl) fluorescence measurements
and also by determining the net CO2 fixation rates that the photosynthetic quantum
conversion of the needles of damaged trees was declining and that the Chl and
carotenoid levels of needles declined as well. In addition, together with foresters
and the tree physiologist Donald Pigott of the University of Cambridge, England,
whom I had invited to Karlsruhe, we checked in the Black Forest the different types
of damage symptoms of conifer and broadleaf trees to separate them from symptoms caused by natural stressors, such as heat, cold, or water stress. Then, we
reported our findings on the relationship between photosynthesis and tree decline
(Lichtenthaler and Buschmann 1984a) as well as on air pollutants as a trigger of the
forest decline (Lichtenthaler 1984). For more detailed information, we additionally
published a booklet “The Forest decline from a botanical point of view” in German
language (Lichtenthaler and Buschmann 1984b). Fortunately, we had the chance of
sending several hundred free copies of that booklet to interested colleagues and
laymen in the German Democratic Republic, GDR, where any discussion on forest
decline was officially forbidden.
18
H.K. Lichtenthaler
With the financial support of the W. & E. Heraeus foundation in Hanau,
Germany, I was able to invite, in 1984, 44 foresters and plant physiologists from
six European countries to a small workshop in Bad Honnef, Germany. There,
German, Swiss, and Austrian foresters involved in forest decline research met for
the first time, exchanged their individual observations on forest decline and tree
damage, and discussed the causes and consequences with plant physiologists. This
workshop strongly stimulated future exchange and research cooperations. In a
cooperation with Barry Rock of the NASA, USA, and his team we compared in
1984 and 1985 by means of in situ spectral measurements the forest decline
symptoms in Vermont, USA, and the Black Forest, Germany, and found that the
symptoms were the same in both locations (Rock et al. 1986). In addition, in
cooperation with the German space research center, the Deutsches Zentrum für
Luft- und Raumfahrt (DLR) in Oberpfaffenhofen, Germany, and the NASA, USA,
we classified the trees of damaged spruce stands in the Northern Black Forest by
airborne reflectance and terrestrial Chl fluorescence measurements (Schmuck
et al. 1987; Rinderle and Lichtenthaler 1989). At the Mauzenberg forest location
(altitude 650–755 m) we analyzed the seasonal variation in photosynthetic activity
of healthy and damaged spruce trees over 2 consecutive years, whereby 3 needles
years were studied in parallel. In damaged spruce trees we found not only a reduced
photosynthetic quantum conversion as detected via Chl fluorescence measurements, but even more reduced rates of net CO2 fixation PN, both on a chlorophyll
and on a needle area basis, as well as reduced rates of transpiration and stomatal
conductivity (e.g., Lichtenthaler et al. 1989). Moreover, needles of damaged
spruces (damage class 3–4) could no longer regulate and fully close their stomata,
which caused a fast desiccation and dropping down of needles.
At that time the state of Baden-Württemberg started and supported the interdisciplinary
European
research
project
PEF
(Projekt
Europäisches
Forschungszentrum), where various research groups studied different aspects of
the forest decline in the Black Forest at the same locations, with the Schöllkopf
(altitude 840 m) near the town of Freudenstadt being the most important location.
Within this program we analyzed the performance and pigment composition of the
photosynthetic apparatus of different needle ages of healthy and damaged spruce
trees (e.g., Lichtenthaler et al. 1985, 1989; Zimmer-Rinderle and Lichtenthaler
1995). The results of all those investigations (major parts were later published in the
book by Bittlingmeier et al. 1995) demonstrated that the large-scale forest decline
was caused by a combination of natural environmental stress with air pollution
stress (e.g., SO2, NOx, ozone), whereby the latter considerably enhanced the natural
stress, led to potassium and magnesium deficiency of the soil and trees, caused
bleaching of photosynthetic pigments, and reduced the vitality of trees predominantly by an early decline of the photosynthetic function and a progressing damage
to the photosynthetic apparatus.
Fifty-Five Years of Research on Photosynthesis, Chloroplasts, and Stress. . .
19
6 Mode of Action of Herbicides in Photosynthesis,
Chloroplasts, and the Apicoplast
Besides the Calvin–Benson cycle of CO2 assimilation and the pigment apparatus
catalyzing the photosynthetic light and associated electron transport reactions,
chloroplasts possess various other biosynthetic pathways that are potential targets
for herbicides and natural antibiotics and inhibitors. The goal of our research was to
apply inhibitors and herbicides in order to find out more about the photosynthetic
electron transport reactions, to learn more about the special metabolic pathways of
chloroplasts, and also to detect the mode of action of new herbicides.
Thus, we clarified that the herbicide bentazon blocks the photosynthetic electron
transport by specifically binding to the QB protein of the photosystem 2 reaction
center (Pfister et al. 1974). In addition, we developed isolated chloroplasts and
etioplasts as test systems for inhibitors against de novo fatty acid biosynthesis and
proved that the herbicides diclofop and other aryloxy-phenoxy-propionic acids as
well as sethoxydim, cycloxydim, and other cyclohexane-1,3-diones, all of them
specific graminicides, inhibit the plastidic fatty acid biosynthesis by specifically
blocking the acetyl-CoA carboxylase (Kobek et al. 1988a, b; Lichtenthaler 1989).
They also block the development and replication of chloroplasts (Lichtenthaler and
Meier 1984). Moreover, we detected that the two natural antibiotics cerulenin and
thiolactomycin are also inhibitors of de novo fatty acid biosynthesis in chloroplasts
(Feld et al. 1989; Golz et al. 1994) where they block the β-ketoacyl-ACP synthases
KAS I (cerulenin, thiolactomycin) and KAS III (thiolactomycin). We also showed
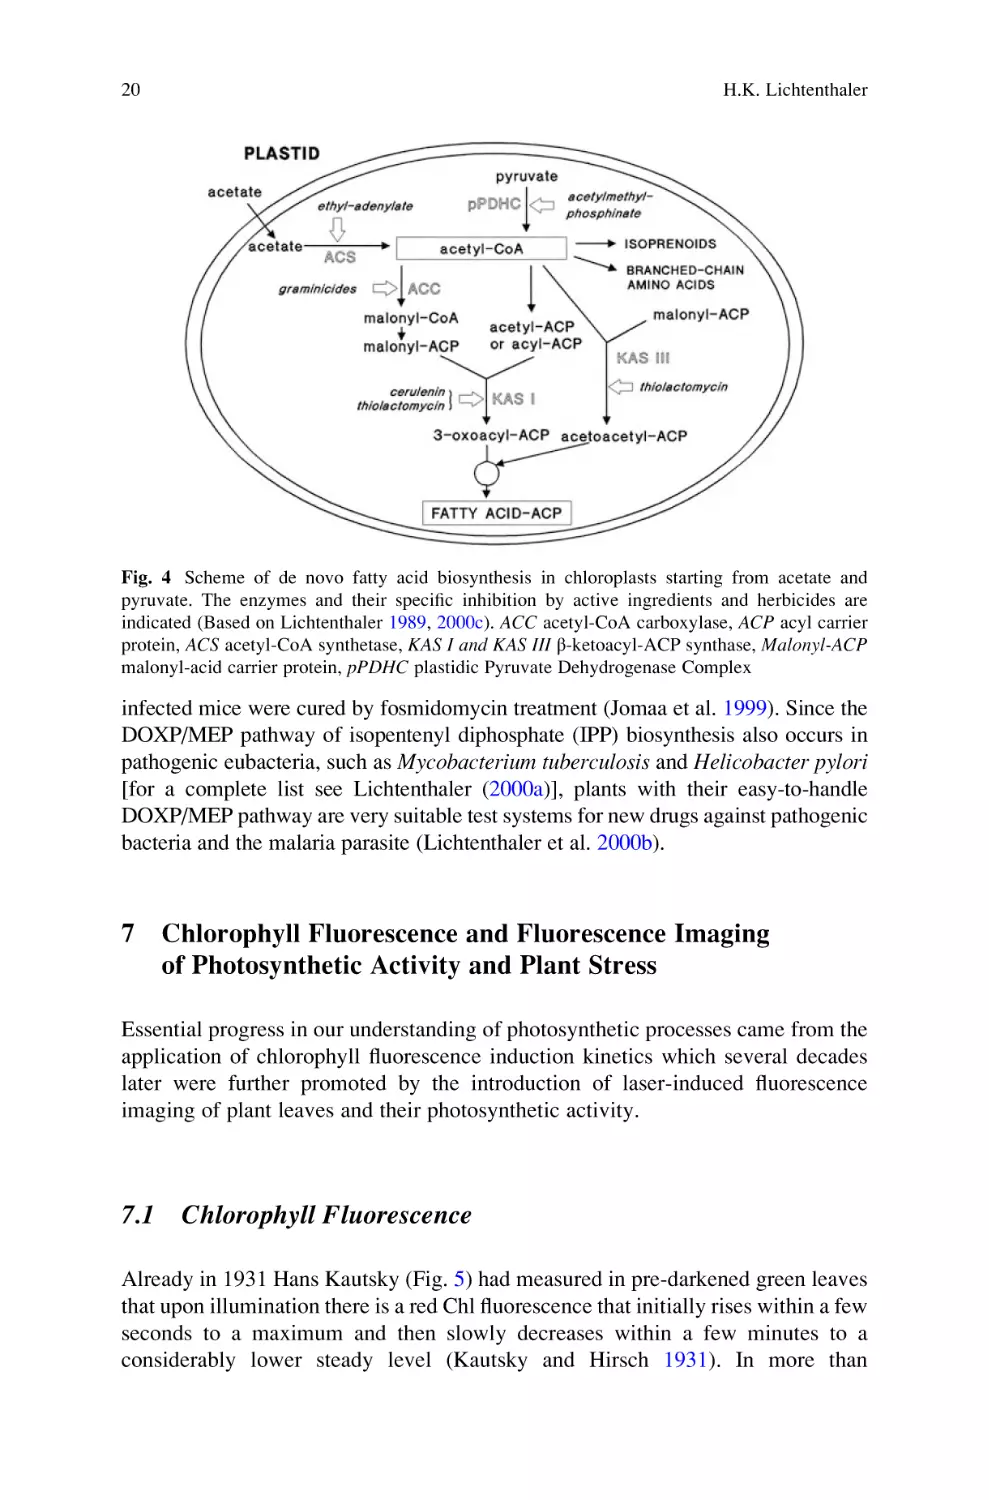
that ethyl-adenylates inhibit the acetyl-CoA synthetase and acetylmethylphosphinates the plastidic pyruvate dehydrogenase complex as shown in Fig. 4
(Golz et al. 1994). Such inhibitors are essential tools for the clarification of the
metabolite flow from either acetate or pyruvate into de novo fatty acid biosynthesis
and into isoprenoids or branched-chain plastidic amino acids. Later we demonstrated that 6-ketoclomazone is a specific inhibitor of the DOXP synthase (1-deoxyD-xylulose-5-phosphate synthase) and fosmidomycin a specific inhibitor of the
DOXP reductase (1-deoxy-D-xylulose-5-phosphate reductase), i.e., the first and
the second enzyme of the plastidic DOXP/MEP pathway of isoprenoid biosynthesis, inhibitors that essentially helped to establish this newly detected
non-mevalonate pathway of isoprenoid biosynthesis (see Lichtenthaler 2000a).
This plastidic DOXP/MEP pathway for isoprenoid biosynthesis is named after its
first and second intermediates: 1-deoxy-D-xylulose-5-phosphate (DOXP) and 2-Cmethyl-D-erythritol-4-phosphate (MEP). Details of the DOXP/MEP pathway are
found below in paragraph 8.
Another observation of particular interest was the finding by several authors that
the malaria inducing parasite Plasmodium falciparum had a nongreen, plastid-type
cell organelle, the apicoplast that, during evolution, was taken up from either a green
or a red alga. Since the malaria parasite is dependent on the metabolic activities of its
apicoplast we cooperated with physicians and proved that the apicoplast possesses the
DOXP/MEP pathway of isoprenoid biosynthesis which can be blocked by the
herbicide fosmidomycin. In fact, in our joint efforts we could show that malaria-
20
H.K. Lichtenthaler
Fig. 4 Scheme of de novo fatty acid biosynthesis in chloroplasts starting from acetate and
pyruvate. The enzymes and their specific inhibition by active ingredients and herbicides are
indicated (Based on Lichtenthaler 1989, 2000c). ACC acetyl-CoA carboxylase, ACP acyl carrier
protein, ACS acetyl-CoA synthetase, KAS I and KAS III β-ketoacyl-ACP synthase, Malonyl-ACP
malonyl-acid carrier protein, pPDHC plastidic Pyruvate Dehydrogenase Complex
infected mice were cured by fosmidomycin treatment (Jomaa et al. 1999). Since the
DOXP/MEP pathway of isopentenyl diphosphate (IPP) biosynthesis also occurs in
pathogenic eubacteria, such as Mycobacterium tuberculosis and Helicobacter pylori
[for a complete list see Lichtenthaler (2000a)], plants with their easy-to-handle
DOXP/MEP pathway are very suitable test systems for new drugs against pathogenic
bacteria and the malaria parasite (Lichtenthaler et al. 2000b).
7 Chlorophyll Fluorescence and Fluorescence Imaging
of Photosynthetic Activity and Plant Stress
Essential progress in our understanding of photosynthetic processes came from the
application of chlorophyll fluorescence induction kinetics which several decades
later were further promoted by the introduction of laser-induced fluorescence
imaging of plant leaves and their photosynthetic activity.
7.1
Chlorophyll Fluorescence
Already in 1931 Hans Kautsky (Fig. 5) had measured in pre-darkened green leaves
that upon illumination there is a red Chl fluorescence that initially rises within a few
seconds to a maximum and then slowly decreases within a few minutes to a
considerably lower steady level (Kautsky and Hirsch 1931). In more than
Fifty-Five Years of Research on Photosynthesis, Chloroplasts, and Stress. . .
21
Fig. 5 Hans Kautsky in
Marburg, around 1950
14 subsequent papers [reviewed in Lichtenthaler (1992)] he analyzed and characterized this Chl fluorescence induction kinetics and its dependence on chemicals
and environmental factors. Back then already Kautsky had concluded that the
photosynthetic light process consisted of two light reactions, one that reduces a
substance (e.g., an electron acceptor) and a second light reaction that oxidizes this
reduced substance. Therefore, it was Kautsky who first detected that the photosynthetic apparatus consisted of two photosystems cooperating with each other. This
knowledge became evident in the photosynthetic community only in the early
1960s when other groups, in particular those of Duysens, Govindjee, and Butler,
repeated and advanced Kautsky’s Chl fluorescence measurements [for references
see Lichtenthaler (1992)]. This was the beginning of the evaluation of the two
photosystems and the photosynthetic electron transport chain and the search for its
components, whereby plastoquinone-9 was detected by Crane in 1959 and
phylloquinone K1 independently of each other by Crane and by Lichtenthaler in
1962 as mentioned above (see paragraph 2). In subsequent years Chl fluorescence
induction kinetics developed to a routine method of photosynthesis research,
various Chl fluorescence parameters, ratios, and coefficients were established,
e.g., the ratio Fv/Fm and the photochemical and non-photochemical quenching
coefficients qP and qN. Much of this research on the role of Chl fluorescence in the
detection of stress conditions in plants was summarized in the comprehensive
review by Lichtenthaler and Rinderle (1988b). Further information is found in the
articles by various authors in the two books on Chl fluorescence by Lichtenthaler
(1988a) and Papageorgiou and Govindjee (2004). An exact guide of how to
measure and correctly apply these Chl fluorescence parameters and ratios was
given more recently by Lichtenthaler et al. (2005a).
We also showed that one should be very cautious with the interpretation of such Chl
fluorescence parameters when they are solely measured at the upper, i.e., the adaxial,
leaf-side. In fact, the values of the Chl fluorescence ratios and quenching coefficients
obtained in that way only reflect the responses and reactivity or inhibition of the
chloroplasts of the upper leaf-half. The chloroplasts of the lower leaf-half, which are
22
H.K. Lichtenthaler
accessible only via Chl fluorescence measurements at the lower leaf-side, may still be
fully functional even if the chloroplasts of the upper leaf-half are fully inhibited. Thus,
in maple leaves exposed to full sunlight on a hot sunny day the Chl fluorescence ratios
Fv/Fm, dF/Fm0 as well as photochemical quenching qP and non-photochemical
quenching coefficients qN, measured at the upper leaf-side, indicated a complete
photo-inhibition of the photosynthetic apparatus, yet the CO2 fixation measurements
clearly proved that the leaves still exhibited about 78 % of their maximum CO2 fixation
rates (Schindler and Lichtenthaler 1996). In this respect see also the corresponding
results described by Lichtenthaler et al. (2005a). Thus, Chl fluorescence measurements
should always be performed on both leaf-sides and be complemented by net CO2
fixation measurements with a CO2/H2O porometer in order to clarify to which degree a
presumed photo-inhibition really exists at the whole leaf level.
7.2
The Chlorophyll Fluorescence Ratios RFd
and F690/F730
Concerning Chl fluorescence I introduced in my research two other Chl fluorescence ratios which are excellent parameters to determine photosynthetic activity
and stress effects in plants. Moreover, based on Hans Selye’s stress concept for
humans I established a general stress concept of plants, a list of stressors and stress
responses in order to simplify the discussion on plant stress (Lichtenthaler 1996).
Fluorescence Ratio RFd The Chl fluorescence decrease ratio RFd, i.e., the ratio of
the slow fluorescence decrease Fd to the steady-state fluorescence Fs reached after 5
min of illumination, ratio Fd/Fs, proved to be an exact indirect indicator of the net
photosynthetic CO2 fixation rates PN as reviewed in Lichtenthaler and Babani
(2004). In the years from 1983 through 1990 we successively applied this Chl
fluorescence decrease ratio RFd in our forest decline research in order to determine
the decline in photosynthetic activity and the damage degree of spruces, firs, and
deciduous forest trees (e.g., Lichtenthaler 1988b). The ratio RFd is also a very
suitable parameter to sense a decline in photosynthetic quantum conversion due
to water stress or other stress events, such as nitrogen deficiency, and also to
describe the differential activities of sun and shade leaves of trees as shown in a
recent original paper (Lichtenthaler et al. 2013a) and reviewed in Lichtenthaler and
Babani (2004).
Fluorescence Ratio F690/F730 We also introduced another Chl fluorescence
ratio, i.e., the ratio of the fluorescence yield in the red (near 690 nm) and far-red
(near 730–740 nm) maxima of the Chl fluorescence emission spectra, i.e., the ratio
F690/F730 also known as ratio F690/F735. With increasing chlorophyll a + b
content of leaves the F690 maximum decreases, whereas that of F730 is almost
unaffected. Thus, the ratio F690/F730 is an inverse indicator of the Chl a + b
content of leaves. Hence, its increase with decreasing Chl content from low regular
values of 0.4–0.6 for green leaves to considerably higher values is an excellent
Fifty-Five Years of Research on Photosynthesis, Chloroplasts, and Stress. . .
23
stress indicator (Rinderle and Lichtenthaler 1988; Hák et al. 1990; see also the
review of Buschmann 2007). The inclusion of the ratio F690/F730 opens new
possibilities for remote sensing of terrestrial vegetation by a combination of laserinduced Chl fluorescence and reflectance measurements (Lichtenthaler 1989). In
further investigations we could retrieve the actually emitted Chl fluorescence
emission spectrum as compared to the measurable spectrum of green leaves by
evaluating the degree of reabsorption of the emitted red Chl fluorescence by means
of absorption and reflectance measurements (Gitelson et al. 1998).
7.3
Fluorescence Imaging of Plants
We also investigated in detail the blue and green fluorescence emission of green
leaves and their spectral characteristics together with the red and far-red Chl
fluorescence of leaves (Stober and Lichtenthaler 1992; Stober et al. 1994). In
contrast to the red and far-red Chl fluorescence, the blue and green fluorescence
of plant leaves are also emitted by nongreen plant leaves and they remain constant
during the Chl fluorescence induction kinetics known as Kautsky effect (Stober and
Lichtenthaler 1993). Thus, the blue fluorescence can be taken as a standard when
the red and far-red Chl fluorescence are decreasing due to stress events. In fact, we
detected that the ratio of blue to red fluorescence can be taken as stress indicator.
The blue fluorescence of plant leaves shows a maximum near 440 nm (F440) and
the green fluorescence mostly a shoulder (sometimes also a maximum) near 520 nm
(F520). As the major substance of the blue-green fluorescence emission of plants
we identified cell wall bound ferulic acid (Lichtenthaler and Schweiger 1998). All
this fluorescence information came from measurements at small individual spots of
a leaf. In order to obtain reliable information for the whole leaf several measurements had to be performed at different spots across the leaf surface.
In cooperation with physicists from the CNRS in Cronenbourg near Strasbourg
we checked the possibilities for laser-induced imaging of the plants’ blue and green
fluorescence together with the red and far-red Chl fluorescence. The advantage of
fluorescence imaging is that one image contains the information of several 10,000
pixels per leaf, and this is of high statistical significance and reliability. The first
fluorescence images were taken of green tobacco leaves (Lang et al. 1994) as shown
in Fig. 6, whereby the fluorescence intensity is indicated in false colors. The images
clearly indicate that the four fluorescence bands are not homogeneously distributed
across the leaf area. The highest blue (F440) and green (F520) fluorescence
emanate from the leaf veins where the chlorophyll content is low. The image also
demonstrates that the blue fluorescence is higher than the green fluorescence. In
contrast, the red (F690) and far-red (F740) chlorophyll fluorescence primarily come
from the vein-free leaf regions where the Chl density is high. In addition, it can be
noticed that the red fluorescence is higher than the far-red fluorescence, and both
Chl fluorescences are higher than the blue and green fluorescence. By a pixel-topixel division one obtains the corresponding fluorescence ratio images blue/green,
24
H.K. Lichtenthaler
Fig. 6 Fluorescence images of the upper side of a green tobacco leaf. The intensity of the blue
(F440) and green (F520) fluorescence as well as the red (F690) and far-red (F740) chlorophyll
fluorescence is shown in false colors, whereby the fluorescence yield in the images increases from
blue (no fluorescence) via green and yellow to red as the highest fluorescence. The highest blue
and green fluorescence are emitted by the leaf veins, whereas the highest chlorophyll fluorescence
comes from the intercostal fields, i.e., the vein-free leaf regions. Note that the scales for the red and
far-red chlorophyll fluorescence are different from those of the blue and green chlorophyll
fluorescence. K in the scales means kilo (¼1,000) counts. [Based on Lang et al. (1994),
Lichtenthaler et al. (1996) modified]. Each image consists of several ten thousand pixels over
the leaf surface
blue/red, and blue/far-red and red/far-red as indicated in detail in Lang et al. (1996)
and Lichtenthaler et al. (1996).
Both fluorescence images and fluorescence ratio images allow the detection of
spatial heterogeneities and small local disturbances in fluorescence yield over the
leaf surface and also in the values of the individual fluorescence ratios, which are
early stress and damage indicators long before a damage can visually be detected.
Thus, a high-resolution fluorescence imaging system allows an early detection of
vegetation stress (Lichtenthaler et al. 1996). We performed fluorescence imaging of
water and temperature stress (Lang et al. 1996); we applied laser-induced fluorescence imaging for monitoring a nitrogen fertilizing treatment (Heisel et al. 1997).
This multicolor fluorescence imaging is an excellent diagnostic tool for the detection of plant stress and changes in photosynthetic quantum conversion
(Lichtenthaler and Miehé 1997). Its principles and characteristics as well as
stress-induced changes of the fluorescence ratios and the application possibilities
of this powerful investigation method were summarized by Buschmann and
Lichtenthaler (1998) and Buschmann et al. (2000).
Fifty-Five Years of Research on Photosynthesis, Chloroplasts, and Stress. . .
25
Fig. 7 Successive loss of the photosynthetic activity of intact green leaves of foxglove (Digitalis
purpurea L.) leaves after the uptake of the photosystem II herbicide diuron as visualized here via
images of the Chl fluorescence ratio RFd that decreases with increasing herbicide uptake. Images of
the Chl fluorescence decrease ratio RFd were taken at different times after application of the
herbicide diuron (105 M) via the root of a young plant. The values of the Chl fluorescence
decrease ratio RFd are given in false colors in absolute values with decreasing values from red
(highest RFd value of 4) via yellow and green to light-blue (low intensity) to dark-blue (zero).
(Based on Lichtenthaler and Miehé 1997 and Lichtenthaler et al. 2013b, modified)
Replacing the expensive HeNe laser by a flash lamp UV excitation we developed
the much smaller Karlsruhe fluorescence image system which was successfully
applied in multicolor fluorescence imaging of sugar beet leaves with different
N-status (Langsdorf et al. 2000) and also for imaging the photosynthetic activity
of leaves. It was already mentioned above that the Chl fluorescence decrease ratio
RFd (the ratio Fd/Fs) is linearly correlated with the photosynthetic net CO2 fixation
PN of leaves (e.g., Lichtenthaler and Babani 2004). By imaging the Chl fluorescence (a) in pre-darkened leaves at the fluorescence maximum Fm reached after an
illumination time period of ca. 1 s and (b) again at the steady level Fs reached after
5 min of illumination, one can form the RFd ratio images of leaves providing ample
information, e.g., on the differences in the photosynthetic activity between sun and
shade leaves of trees including needle twigs of conifers (Lichtenthaler and Babani
26
H.K. Lichtenthaler
2000; Lichtenthaler et al. 2000a, 2005b, 2007). This RFd imaging technique also
allows studying the uptake of the herbicide diuron into green leaves by a
progressing decrease of the RFd values (Lichtenthaler et al. 2013b) as shown in
Fig. 7.
The efficient multicolor fluorescence imaging technique is presently the best and
superior fluorescence method for plant tissue. In the future it may become an
essential method in agriculture, horticulture, silviculture, plant food production,
and agro-forestry. It also allows to track the ripening of fruits as shown for the
ripening of apples during storage (Lichtenthaler et al. 2012).
8 The Non-mevalonate Chloroplast Pathway
for Isopentenyl Diphosphate and Isoprenoid
Biosynthesis, the DOXP/MEP Pathway1
In the early 1950s it had been shown by the groups of Konrad Bloch and Fjodor
Lynen that acetate and acetyl-CoA were the precursors of cholesterol biosynthesis,
in 1956 mevalonic acid (MVA) was detected as an intermediate, and in 1958
isopentenyl diphosphate (IPP) and farnesyl diphosphate. In 1958 the well-known
plant biochemist and carotenoid specialist T.W. Goodwin was the first to study and
to prove the incorporation of 14C-acetate and 14C-MVA yet at low rates, into
carotenoids and sterols of higher plants (e.g., Goodwin 1958). Since the typical
labeling pattern of the acetate/MVA pathway was found by means of the chemical
degradation of 14C-labeled Euglena β-carotene (Steele and Gurin 1960), it was
generally accepted that the isoprenoids of plants, such as sterols as well as the
plastidic carotenoids and chlorophylls (phytol side chain), are all synthesized via
the acetate/MVA pathway as is cholesterol in fungi and animals [for original
literature of the cited authors see the reviews Lichtenthaler (1999), (2000b)].
There remained, however, doubts and several inconsistencies concerning the
biosynthesis of plastidic isoprenoids via the acetate/MVA pathway. Thus, photosynthetically fixed 14CO2 was readily incorporated into carotenoids, phytol, and
cytosolic sterols, whereas 14C-labeled acetate and MVA were readily incorporated
into cytosolic sterols, yet only at very low rates into chloroplast isoprenoids, an
observation made by many authors and first by Goodwin (1958). In addition, we
found that mevinolin, a specific inhibitor of the acetate/MVA pathway, efficiently
blocked the biosynthesis of sterols and the mitochondrial ubiquinones, whereas the
accumulation of chlorophylls (phytol side chain), carotenoids, and other plastidic
isoprenoids was not affected (Bach and Lichtenthaler 1983). Our attempts to detect
a separate plastidic HMG-CoA reductase, which is the key enzyme of the acetate/
1
The plastidic DOXP/MEP pathway for isoprenoid biosynthesis is named after its first and second
intermediates: 1-deoxy-D-xylulose-5-phosphate (DOXP) and 2-C-methyl-D-erythritol-4-phosphate
(MEP).
Fifty-Five Years of Research on Photosynthesis, Chloroplasts, and Stress. . .
27
MVA pathway, were negative. These findings suggested that chloroplasts might
have their own biosynthesis system for IPP and isoprenoid biosynthesis which
should be different from and independent of the cytosolic acetate/MVA pathway.
New progress in this field of chloroplast isoprenoid biosynthesis came from the
application of the 13C-labeling technique combined with high-resolution NMR
spectroscopy that allows an exact location of the 13C-atoms within the carbon
skeleton of carotenoids or any other plant isoprenoid. Using this new evolving
technique my chemist colleague Michel Rohmer in Mulhouse, France, had found in
1988 an unusual labeling of hopanoids in two eubacteria. At the beginning of 1993
we started a very close cooperation of our laboratories using this new technique,
whereby my group grew the sterile algae and plant cultures on 13C-labeled glucose
and Rohmer’s group performed the NMR spectroscopy of the 13C- labeled isoprenoid compounds. This way we detected in 1995 the existence of the non-mevalonate
plastidic pathway for IPP formation, first in green algae (Lichtenthaler et al. 1995;
Schwender et al. 1995, 1996) and later also in higher plants (Lichtenthaler
et al. 1997a, b). This pathway starting from pyruvate and glycerinaldehyde-3phosphate has been termed DOXP/MEP pathway of plastidic IPP and isoprenoid
biosynthesis after the first (DOXP, 1-deoxy-D-xylulose-5-phosphate) and second
intermediate (MEP, 2-C-methyl-D-erythritol-4-phosphate).
In my group we cloned the genes of the first two enzymes of the DOXP/MEP
pathway and found two specific inhibitors: 5-ketoclomazone and fosmidomycin for
these two enzymes (cf. Fig. 8). Later I also cooperated with my brother Frieder
Lichtenthaler, Darmstadt, a sugar chemist, who provided us with 13C-labeled
1-deoxy-D-xylulose (DOX) that was readily incorporated into phytol, carotenoids,
isoprene, and other plastidic isoprenoids by higher plants and algae (Schwender
et al. 1997; Zeidler et al. 1997). There exists a cooperation, a cross talk, between
both cellular isoprenoid biosynthesis pathways which, at photosynthesis conditions,
primarily works via an export of active C5 units from chloroplasts to the cytosol that
are used predominantly for sterol biosynthesis (cf. Fig. 8). An import of short
isoprenoid chains from the cytosol into the plastid may occur as well, however,
only at extremely low rates if at all. In fact, our investigations with inhibitors
demonstrated that the cytosolic acetate/MVA biosynthesis cannot provide the IPP
or short chain isoprenyl phosphates required for carotenoid, chlorophyll, and
prenylquinone biosynthesis in chloroplast when the plastidic DOXP/MEP pathway
has been blocked by fosmidomycin. Once we had detected the plastidic DOXP/
MEP pathway of IPP biosynthesis, various other groups jumped into this new
research field and detected the following enzymes 3–7 of this pathway. Additional
literature references on the detection, establishment and significance of the DOXP/
MEP pathway including contributions of other laboratories are found in the
extended review articles by Lichtenthaler (1999, 2010).
In cooperation with Rohmers group we also checked evolutionary aspects of the
distribution of the DOXP/MEP pathway, e.g., its presence in different algae groups.
28
H.K. Lichtenthaler
Fig. 8 Scheme showing the two independent isoprenoid biosynthesis pathways in plant cells:
(1) the chloroplastidic DOXP/MEP pathway and (2) the cytosolic acetate/mevalonate pathway.
The DOXP/MEP pathway provides the active isoprenic C5 units (IPP, DMAPP) for the biosynthesis of carotenoids, chlorophylls (phytyl side chain), and prenylquinones (phytyl and nonaprenyl
side chains). The acetate/mevalonate pathway delivers the isoprenic C5 units for the biosynthesis
of sterols and the prenyl side chain of the mitochondrial ubiquinones. The specific inhibition of the
DOXP/MEP pathway by 5-ketoclomazone (target DOXP synthase, DXS) and fosmidomycin
(target: DOXP reductase, DXR) and of the acetate/mevalonate pathway by mevinolin (target:
HMG-CoA reductase ¼ HMGR) is indicated. The indicated “cross talk” between the two cellular
biosynthetic isoprenoid pathways primarily consists of an export of IPP from chloroplasts to the
cytosol for sterol biosynthesis. Scheme based on Lichtenthaler et al. (1997a) and Lichtenthaler
(1999, 2010). DMAPP dimethylallyl diphosphate, DOXP 1-deoxy-D-xylulose-5-phosphate, DXR
DOXP reductase, DXS DOXP synthase, IPP isopentenyl diphosphate, FPP farnesyl diphosphate,
GPP geranyl diphosphate, GGPP geranylgeranyl diphosphate, HMG 3-hydroxy-3-methylglutaryl-CoA, HMGR 3-hydroxy-3-methyl-glutaryl-CoA reductase, MEP 2-C-methyl-Derythritol-4-phosphate
It was essential that we could prove the presence of the DOXP/MEP pathway in
cyanobacteria, since cyanobacteria-like organisms are regarded as the ancestors of
chloroplasts. Like higher plants, Rhodophyta and Heterokontophyta possess both
pathways for IPP biosynthesis, whereas Chlorophyta have lost their cytosolic
acetate/MVA pathway during the evolution and they not only synthesize plastidic
isoprenoids but also cytosolic sterols via the DOXP/MEP pathway (e.g.,
Lichtenthaler 2004c).
So far Euglena (Euglenophyta) is the only exception among all algae groups
which, during evolution, has lost its DOXP/MEP pathway of isoprenoid
Fifty-Five Years of Research on Photosynthesis, Chloroplasts, and Stress. . .
29
biosynthesis and therefore is dependent on the acetate/MVA pathway for the
synthesis of all its isoprenoids including carotenoids and chlorophyll (phytol side
chain) [see the reviews Lichtenthaler (2004c) and (2010)]. After Steele and Gurin
(1960) had unequivocally shown via the chemical degradation of 14C-labeled
Euglena β-carotene that it was labeled via the acetate/MVA pathway, nobody
doubted anymore that all photosynthetic organisms made their carotenoids via the
acetate/MVA pathway. If they had taken a different alga instead of Euglena for
their 14C-labeling experiments of β-carotene, they and/or Goodwin and his group
could have detected already then that chloroplasts possess their own pathway for
IPP and isoprenoid biosynthesis.
9 Support by Elder Colleagues
During the start of my research in plant science in 1958 I was essentially supported
by professor August Seybold, Heidelberg, who accepted me as a Ph.D. student in
plant physiology although I had studied pharmacy. He taught me to perform
scientific research always on a broad, comparative level. Seybold who since the
late 1920s had extensively worked on the transpiration of plants, the photosynthetic
pigments in sun and shade plants, and the light perception of plants and algae, also
shaped me for ecophysiological research, in particular for questions on the influence of high and low quanta fluence rates on growth and the photosynthetic
function of plants. I am grateful to him for his inspiring support.
After my Ph.D. I had the chance, in 1961, to work in the laboratory of Paul
Ozenda at the Centre d’Etudes Nucleaire, Grenoble, France, where I learned the
application of radioisotopes in plant physiology research and studied the kinetics of
ion absorption (e.g., 32P) by plant roots. He was very supportive and strongly
encouraged the French-German cooperation.
From 1962 to 1964, I had the great privilege to work in the laboratory of Melvin
Calvin (Nobel laureate 1961) in Berkeley, California (see Fig. 9). This was an
exciting time and an atmosphere of departure in plant sciences and photosynthesis
research. Melvin Calvin showed much interest in my research on the types of
prenylquinones, carotenoids, and lipids in the photosynthetic membrane. He started
his day very early, and discussions with him often took place at 7:00 a.m. He was an
extremely fast thinker and quick to evaluate consequences of a scientific observation and immediately came up with ideas on the essential steps that should follow.
Calvin knew how to stimulate young scientists and gave me the valuable advice to
always concentrate fully on new promising research topics and to avoid performing
parallel research. The whole scientific environment of Calvin’s group was
extremely stimulating; he usually had more than 70 individuals (staff members,
graduate students and many foreign postdocs) in his laboratories. Among them
were chemists, physicists, and plant physiologists, and in the regular Friday
morning seminars we had excellent interdisciplinary discussions that often led to
scientific cooperation. The scientific exchange with Melvin Calvin continued after
30
H.K. Lichtenthaler
Fig. 9 Melvin Calvin,
Berkeley, in his office
in 1986
my return to Germany until his passing. He was, indeed, a great and inspiring
scientist and academic teacher.
In Berkeley I also had extensive and very stimulating discussions with Daniel
Arnon on the function of vitamin K1 in the photosynthetic membrane. He had just
shown that vitamin K3, a methyl-naphthoquinone, catalyzed cyclic photophosphorylation in isolated spinach chloroplasts and wanted to learn more on the
genuine substance phylloquinone K1. At that time the idea of two photosynthetic
photosystems in series came up, a concept that was based on the early observations
of Kautsky (Kautsky and Hirsch 1931). This concept of two photosystems was
intensively discussed by Arnon as well as in all the other photosynthesis research
groups in Berkeley until it was finally established.
In 1963 I became acquainted with Andy Benson who had essentially contributed
to the detection of the photosynthetic carbon reduction cycle, today known as
Calvin–Benson cycle. Back then he worked in La Jolla, California, on the
glycerolipids and the sulfolipid of the photosynthetic membrane. He had invited
me to give a lecture on my paper on the total lipid and protein composition of the
photosynthetic membrane that had just appeared in Nature (Lichtenthaler and Park
1963). We extensively discussed various possibilities how the photosynthetic
pigments and glycero-lipids were arranged in the membrane and finally came up
with the conclusion that the sulfo-, galacto-, and phospholipids were arranged in the
membrane in a double-layer structure into which the pigments and proteins were
integrated or attached to. We developed this concept clearly before the lipid doublelayer structure of biomembranes had been established. Various aspects of our
discussion together with my just published thylakoid lipid table became an essential
Fifty-Five Years of Research on Photosynthesis, Chloroplasts, and Stress. . .
31
Fig. 10 Andy Benson, La Jolla, here shortly after his 90th birthday in Paris, 2007
part of Andy Benson’s review paper “Plant Lipid Membranes” (Benson 1964). This
inspiring discussion, followed by many others on the international photosynthesis
congresses, was the starting point of a lifelong friendship and scientific exchange.
In fact, in 2007 three of us from the photosynthetic community (Bob Buchanan,
Roland Douce and myself) celebrated and honored Andy Benson on the occasion of
his 90th birthday in a famous restaurant in Paris presenting a special issue of the
journal Photosynthesis Research (see Fig. 10) with papers dedicated to him (see
Lichtenthaler et al. 2008).
In 1964, shortly after my return to Germany, Wilhelm Menke who in the 1930,
was the first to isolate chloroplasts from spinach and in 1962 had created the term
“thylakoids” invited me to Köln for a lecture and shortly afterwards André Pirson
invited me to Göttingen. Both photosynthesis researchers accompanied and promoted my further research. I am also grateful to Hans Reznik, then at the University
of Münster, Westphalia, for his offer to continue my photosynthesis research in
Germany and for his promotional support. My research was also inspired by
continuous discussions with Kazuo Shibata, Tokyo, Hemming Virgin, Göteborg,
Kurt M€
uhlethaler and Albert Frey-Wyssling, Zürich, Cyrille Sironval, Liège, and
particularly accentuated in repeated discussions, over many years, with Trevor
W. Goodwin, Liverpool (see Fig. 11), the pioneer and expert of carotenoid and
isoprenoid research in plants, whom I first met in 1968 on the first international
photosynthesis congress in Freudenstadt, Black Forest, Germany.
32
H.K. Lichtenthaler
Fig. 11 Trevor Goodwin, Liverpool (right), with Paul Mazliak, Paris, and Hartmut Lichtenthaler
(left) on a European plant lipid meeting in September 1993 in Karlsruhe
10
Cooperations with Scientific Colleagues
Extremely essential impulses for photosynthesis research as well as European and
international scientific cooperation in plant science came from the first international
photosynthesis congress held by Helmut Metzner (Tübingen) in Freudenstadt,
Black Forest, Germany, in 1968. There, many young as well as older colleagues
from Eastern and Western European countries met for the first time after World
War II and exchanged their ideas on all aspects of photosynthesis. Among them
were physicists, biochemists, classical botanists, plant physiologists, and cytologists. In fact, that congress was the starting point of a broad and interdisciplinary
scientific cooperation on a European and worldwide level, which was further
promoted by the subsequent international photosynthesis congresses that have
been held every 3 years. In this respect I need to emphasize that from the 1960s
through the 1990s a much higher percentage of plant scientists worked on particular
aspects of photosynthesis than today.
With Hubert Ziegler (München) as an essential supporter, Peter Böger (Konstanz), Ulrich L€
uttge (Darmstadt), and other German colleagues I had a close
cooperation on the establishment of the “Section Plant Physiology” within the
German Botanical Society DBG. On a European level discussions went on with
Paul-Emil Pilet (Lausanne), John Dale (Edinburgh), Laszlo Erdei (Szeged), Anders
Kylin (Lund), Valentin Kefeli (Moscow), Stanislav Proch
azka (Brno), Miloje Saric
(Belgrade), Ernesto Vieitez (Santiago de Compostela), Charles Wittigham
(London), Zdenek Sestak (Prague), and many others on a cooperation of
European plant physiologists. In 1975 on the XII. International Botanical Congress
in Leningrad (today St. Petersburg) we had an informal discussion meeting with the
Russian and East European plant physiologists. These discussions, essentially
Fifty-Five Years of Research on Photosynthesis, Chloroplasts, and Stress. . .
33
initiated and supported by Hubert Ziegler (München), led to the formation of a
Federation of European Societies of Plant Physiology, FESPP, which could finally
be founded in 1978 with the participation of several East European countries (for
details see the report of Lichtenthaler 2004a). With other colleagues, such as Paul
Stumpf (Davis, California), Peter Biacs (Budapest), Trevor Goodwin (Liverpool),
Ernst Heinz (Köln), John Harwood (Cardiff), Conny Liljenberg (Göteborg), Paul
Mazliak (Paris), Paul-André Siegenthaler (Neuchatel), Joseph Wintermans (Nijmegen), and Norio Murata (Japan), I cooperated to establish the International
Symposia on Plant Lipids, ISPL which, since 1974, have been held every 2 years
all over the world (details are given by Lichtenthaler 2004b). The large and fast
progress in photosynthesis, biosynthesis, metabolism, and function of plants lipids
as well as in many other topical fields of plant science since the 1970s was, indeed,
possible due to the fact that colleagues of different countries got to know each other
on such regular international conferences and workshops. They started their scientific cooperation and then an exchange of their graduate students and postdocs. In
addition, in 1980 I started with Peter Böger (Konstanz), Aloys Wild (Mainz),
Manfred Kluge (Darmstadt), and Heinrich Fock (Kaiserslautern) annual photosynthesis workshops where our graduate and Ph.D. students as well as our young
scientific staff members could present and discuss their scientific results. Also
these workshops provided distinct impulses for progressing with our photosynthesis
research towards new horizons.
In 1962 my own scientific cooperation had already started with Roderic Park in
Berkeley on the lipids and proteins of the photosynthetic unit in thylakoids. Later, this
was continued with many colleagues mentioned below in a chronological order, such
as Benno Sprey and E. Peveling, Münster, on osmiophilic plastoglobuli, with G€
unter
Retzlaff, BASF, on the mode of action of herbicides in photosynthesis, with Conny
Lilienberg, Göteborg, on the separation of prenols on TLC plates, with Alan Wellburn,
Lancaster, on cytosolic and plastidic isoprenoids and their labeling from 14Cmevalonate, with Pierre Dizengremel, then Paris, on occurrence and function of
different ubiquinone homologues in plants, with Peter Biacs, TU Budapest, on
saponins in plants, with the biochemist Janos Retey, Karlsruhe, on HMG-CoA
reductase in plants, with Roland Douce, Grenoble, on the localization of
prenylquinones and carotenoids in the chloroplast envelope, with Karl Erismann,
Bern, on 14C-labeling kinetics of prenylquinones in Chlorella, with Barry Rock,
NASA, Pasadena, USA, on forest decline in Germany and the USA including remote
sensing and airborne classification of forests, with physicists Laslo Koscany and Peter
Richter, TU Budapest, on creating new instruments for spectroscopy of plant leaves as
well as for indoor and outdoor Chl fluorescence measurements, with biochemist
Wilhelm Boland, Karlsruhe, on the inhibition of fatty acid biosynthesis by cerulenin
derivatives, with Vladimir Saakov, St. Petersburg, on the effect of gamma ray irradiation on the photosynthetic apparatus, with Jiri Santrucek and Pavel Siffel, České
Budějovice, on photosynthetic activity of green tobacco and aurea mutants, with
Nicola D’Ambrosio, Napels, on the carotenoid composition of leaf and stem tissue
of the CAM plant Cissus, with Anatoly Gitelson, Lincoln, Nebraska, on retrieving the
actual Chl fluorescence spectra and emissions by plant leaves via simultaneous
34
H.K. Lichtenthaler
absorbance and reflectance measurements, with Fatbardha Babani, Tirana, Albania,
on fluorescence imaging of photosynthetic activity, with Zoltan Tuba, Gödöllö,
Hungary, on the photosynthetic apparatus of homoio- and poikilochlorophyllous
desiccation-tolerant plants, as well as with Otmar Urban, Brno, on Chl fluorescence
imaging of sun and shade leaves of trees in the Beskydy Mountains. I would also like
to mention here the long-term scientific exchange with Bob Buchanan, Berkeley, on
photosynthetic topics and historical aspects of photosynthetic carbon fixation and the
close cooperation with Tino A. Rebeiz, Champaign, USA, regarding the organization
of the First International Symposium on Chloroplast Bioengineering held at the
University of Illinois, Urbana-Champaign in May 2005 and in editing the book
“The Chloroplast, Basics and Applications” (Rebeiz et al. 2010).
Particularly close and intensive was the cooperation with physicist Joseph Miehé
and coworkers, CRNS, Cronenbourg near Strasbourg, from 1994 through 1998, on
the development and application of laser-induced fluorescence imaging of plants in
the four plant fluorescence emission bands blue, green, red, and far-red as well as
with chemist Michel Rohmer and his coworkers, University of Strasbourg, in the
detection and establishment of the novel DOXP/MEP pathway of chloroplast IPP
and isoprenoid biosynthesis from 1993 through 1999. In fact, such international
cooperations as mentioned here were, for all those active in plant physiology
research, the essential basis for the large progress made in so many fields of plant
science in the last five decades. It was a pleasure that I had the chance of
contributing to this enormous development.
11
Epilogue
The large progress made in photosynthesis and plant science over the past 55 years was
essentially a result of the increasing work with isolated cell organelles and the
continuous invention and application of new and advanced instruments as well as
investigation techniques that allowed the studies and revelations of details of plant
structures, metabolic reactions, and their responses to the environment. Such novel and
superior techniques and approaches were the application of electron microscopy, the
labeling of cellular metabolites with radioisotopes (e.g., 14C), the application of 13C
labeling in combination with high-resolution NMR spectroscopy, the introduction of
PAGE and HPLC techniques, the availability of CO2/H2O porometer systems, the
measurement of laser-induced chlorophyll fluorescence kinetics, the powerful technique of fluorescence imaging of plants and their stress responses as well as the
application of inhibitors to specifically block enzymes in metabolic pathways, and of
course the use of molecular biology, to just name a few major ones. Thus, progress in
science is and has always been dependent on the development of new investigation
techniques. In addition to these new techniques there has been the progressing international scientific cooperation and exchange of scientists that have essentially been
enhanced and promoted by regular international scientific meetings and workshops,
such as the triennial international congresses on Photosynthesis, the biannual meetings
Fifty-Five Years of Research on Photosynthesis, Chloroplasts, and Stress. . .
35
of the European plant physiologists, FESPP, or the biannual international symposia on
plant lipids, ISPL, which are mentioned above. I hope that also in the future the longstanding, successful international cooperation will continue on a worldwide level and
include many more countries. This international cooperation that is so essential for the
progress in science is based on the mutual understanding of and the respect for people.
12
Curriculum Vitae of Hartmut K. Lichtenthaler
Hartmut Lichtenthaler was born on June 20, 1934 in Weinheim, Baden, Germany
Education and Professional Experience
1953–1958: Study of pharmacy in Heidelberg and at the University of Karlsruhe
1958: Masters degree (Staatsexamen) in Pharmacy
Spring 1961: Ph.D. in Botany at the University of Heidelberg with August Seybold
1961: Euratom Research Fellow at the Centre d’Etude Nucléaires and the University of Grenoble/France with Paul Ozenda
1962–1964: Research fellow at the University of California, Berkeley, with Melvin
Calvin
36
H.K. Lichtenthaler
1964–1970: Botanical Institute, University of Münster/Westphalia, scientific assistant,
1967 Habilitation in Botany, then Dozent and Associate Professor
1970–2001: Full professor in Plant physiology, Pharmaceutical Biology and Plant
Biochemistry at the University of Karlsruhe (now: Karlsruhe Institute of Technology, KIT)
since 2001: Professor emeritus
Other Activities
1980–1986: Chairman of the Section Plant Physiology of the German Botanical
Society DBG; 1978 Founding member of the Federation of the European Societies
of Plant Physiology (FESPP) and FESPP President 1984–1986; Founding Member
of the International Symposia on Plant Lipids ISPL 1974–1976. Coordinator and
participant in several European research programs, such as OECD, LASFLEUR,
QAAFFI, INTERREG, PEF.
1973: Visiting professor at the University of California, Berkeley with Melvin
Calvin
1975: Guest professor at the University of Gothenburg, Sweden with Hemming
Virgin
1981: Guest professor at the University of Lancaster, England with Alan Wellburn
Honors
1992: Honorary member of the Hungarian Society of Plant Physiology.
Honorary doctoral degrees: 1996 Mendel University of Brno, Czech Republic;
1997 ELTE University, Budapest; and in 2001 St. Istvan University, Gödöllö,
Hungary. In 2001 “Bundesverdienstkreuz am Bande” (Cross of Merits) of the
Federal Republic of Germany. 2003 Gregor Mendel Medal of the Czech Academy
of Sciences; in 2004 Terry Galliard Medal and in 2010 Corresponding Membership
Award, American Society for Plant Biology ASPB
Acknowledgements I am very grateful to my entire team of former graduate and Ph.D. students
as well as scientific and technical group members who actively participated, over the past 50 years,
in performing some truly pioneering research in photosynthesis and plant science. Without their
continuous effort, enthusiasm and understanding we could not have made such an enormous
progress in our plant science research spanning from biophysics and organic chemistry via pure
physiological and structural investigations using the electron microscope to pure biochemical
topics including some molecular biology. This interdisciplinary research was also made possible
by multiple German and international cooperation partners at universities, research institutions,
and the chemical industry and—last but not least—by the continuous support of granting agencies,
such as the German Research Council DFG, the German Ministry of Research, the European
Community, and various others, all of which is gratefully acknowledged. In addition, I wish to
thank Ms Gabrielle Johnson for her long-term English language assistance with many of my
scientific publications. Last but not least, my special gratitude goes to my wife for her kind
understanding, her patience, and her continuous support of my scientific research over almost five
decades now.
Fifty-Five Years of Research on Photosynthesis, Chloroplasts, and Stress. . .
37
References
Austin JR, Frost E, Vidi P-A, Kessler F, Staehelin LA (2006) Plastoglobules are lipoprotein
subcompartments of the chloroplast that are permanently coupled to thylakoid membranes
and contain biosynthetic enzymes. Plant Cell 18:1693–1703
Bach TJ, Lichtenthaler HK (1983) Inhibition by mevinolin of plant growth, sterol formation and
pigment accumulation. Physiol Plant 59:50–60
Benson A (1964) Plant membrane lipids. Annu Rev Plant Physiol 15:1–16
Bittlingmeier L, Reinhardt W, Siefermann-Harms D (eds) (1995) Waldschäden im Schwarzwald:
Ergebnisse einer interdisziplinären Freilandstudie zur montanen Vergilbung am Standort
Freudenstadt/Schöllkopf. Ecomed Verlagsgesellschaft, Landsberg
Boardman N (1977) Comparative photosynthesis of sun and shade plants. Annu Rev Plant Physiol
28:355–377
Bréhélin C, Kessler F (2008) The plastoglobule: a bag full of lipid biochemistry. Photochem
Photobiol 84:1388–1394
Bréhélin C, Kessler F, van Wijk KJ (2007) Plastoglobule: versatile lipoprotein particles in plastids.
Trends Plant Sci 12:260–266
Buschmann C (2007) Variability and application of the chlorophyll fluorescence emission ratio
red/far-red of leaves. Photosynth Res 92:261–271
Buschmann C, Lichtenthaler HK (1998) Principles and characteristics of multi-colour fluorescence imaging of plants. J Plant Physiol 152:297–314
Buschmann C, Langsdorf G, Lichtenthaler HK (2000) Imaging of the blue, green and red
fluorescence emission of plants: an overview. Photosynthetica 38:483–491
Crane FL (1959) Isolation of two quinones with coenzyme Q activity from alfalfa. Plant Physiol
34:546–551
Dam H (1942) Vitamin K, its chemistry and physiology. Adv Enzymol 2:285–324
Feld A, Kobek K, Lichtenthaler HK (1989) Inhibition of fatty-acid biosynthesis in isolated
chloroplasts by the antibiotics cerulenin and thiolactomycin. Bright Crop Prot Conf Weeds
4D–10:479–486
Gitelson AA, Buschmann C, Lichtenthaler HK (1998) Leaf chlorophyll fluorescence corrected for
re-absorption by means of absorption and reflectance measurements. J Plant Physiol
152:283–296
Golbeck JH (1987) Structure, function and organization of the photosystem I reaction center
complex. Biochim Biophys Acta 895:167–204
Golz A, Focke M, Lichtenthaler HK (1994) Inhibitors of de novo fatty acid biosynthesis in higher
plants. J Plant Physiol 143:426–433
Goodwin TW (1958) Incorporation of 14CO2, [2-14C]acetate and [2-14C]mevalonic acid into
ß-carotene in etiolated maize seedlings. Biochem J 68:26–27
Grumbach HK, Lichtenthaler HK (1974) Photo-oxidation of the plastohydroquinone-9 pool in
plastoglobuli during onset of photosynthesis. In: Avron M (ed) Proceedings of the 3rd
international congress on photosynthesis, Weizmann Institute of Science, Rehovot, Israel,
vol I. Elsevier, Amsterdam, pp 515–523
Hager A, Bertenrath T (1962) Verteilungschromatographische Trennung von Chlorophyllen und
Carotinoiden grüner Pflanzen an Dünnschichten. Planta 58:564–568
Hák R, Lichtenthaler HK, Rinderle U (1990) Decrease of the fluorescence ratio F690/F730 during
greening and development of leaves. Radiat Environ Biophys 29:329–336
Heisel F, Sowinska M, Khalili E, Eckert C, Miehé JA, Lichtenthaler HK (1997) Laser-induced
fluorescence imaging for monitoring nitrogen fertilizing treatments of wheat. In: SPIE proceedings series: advances in laser remote sensing for terrestrial and oceanographic applications, 21–22 April 1997, Orlando, FL. SPIE 3059:10-21
Interschick-Niebler E, Lichtenthaler HK (1981) Partition of phylloquinone K1 between digitonin
particles and chlorophyll-proteins of chloroplast membranes from Nicotina tabacum. Z
Naturforsch 36c:276–283
38
H.K. Lichtenthaler
Jomaa H, Wiesner J, Sanderbrand S, Altincicek B, Weidemeyer C, Hintz M, Türbachova I,
Eberl M, Zeidler J, Lichtenthaler HK, Soldati D, Beck E (1999) Inhibitors of the
nonmevalonate pathway of isoprenoid biosynthesis as antimalarial drugs. Science
285:1573–1576
Kautsky H, Hirsch A (1931) Neue Versuche zur Kohlensäureassimilation. Naturwissenschaften
19:964
Kegel LP, Crane FL (1962) Vitamin K1 in chloroplasts. Nature 154:1282
Kobek K, Focke M, Lichtenthaler HK, Retzlaff G, Würzer B (1988a) Inhibition of fatty acid
biosynthesis in isolated chloroplasts by cycloxydim and other cyclohexane-1,3-diones. Physiol
Plant 72:492–498
Kobek K, Focke M, Lichtenthaler HK (1988b) Fatty-acid biosynthesis and acetyl-CoA carboxylase as a target of diclofop, fenoxaprop and other aryloxy-phenoxy-propionic acid herbicides. Z
Naturforsch 43c:47–54
Lang M, Lichtenthaler HK, Sowinska M, Summ P, Heisel F (1994) Blue, green and red fluorescence signatures and images of tobacco leaves. Bot Acta 107:230–236
Lang M, Lichtenthaler HK, Sowinska M, Heisel F, Miehé JA, Tomasini F (1996) Fluorescence
imaging of water and temperature stress in plant leaves. J Plant Physiol 148:613–621
Langsdorf G, Buschmann C, Babani F, Mokry M, Timmermann F, Lichtenthaler HK (2000)
Multicolour fluorescence imaging of sugar beet leaves with different N-status by flash lamp
UV-excitation. Photosynthetica 38:539–551
Lichtenthaler HK (1962) Vergleichende Bestimmungen der Vitamin K1-Gehalte in Blättern.
Planta 57:731–753
Lichtenthaler HK (1964) Untersuchungen über die osmiophilen Globuli der Chloroplasten. Ber
Deut Bot Ges 78:398–402
Lichtenthaler HK (1968) Plastoglobuli and the fine structure of plastids. Endeavour
XXVII:144–149
Lichtenthaler HK (1969a) Localization and functional concentrations of lipoquinones in chloroplasts. In: Metzner H (ed) Photosynthesis research, vol I. ILaupp Press, Tübingen, pp 304–314
Lichtenthaler HK (1969b) Light-stimulated synthesis of plastid quinones and pigments in etiolated
barley seedlings. Biochim Biophys Acta 184:164–172
Lichtenthaler HK (1981) Adaptation of leaves and chloroplasts to high quanta fluence rates. In:
Akoyunoglou G (ed) Photosynthesis VI. Balaban Internat Science Service, Philadelphia, PA,
pp 273–287
Lichtenthaler HK (1984) Luftschadstoffe als Auslöser des Baumsterbens. Naturwissenschaftl
Rundschau 37:271–277
Lichtenthaler HK (1987) Chlorophylls and carotenoids, the pigments of photosynthetic
biomembranes. In: Douce R, Packer L (eds) Method enzymol, vol 148. Academic,
New York, pp 350–382
Lichtenthaler HK (ed) (1988a) Applications of chlorophyll fluorescence. Kluwer, Dordrecht, 1988
Lichtenthaler HK (1988b) In vivo chlorophyll fluorescence as a tool for stress detection in plants.
In: Lichtenthaler HK (ed) Applications of chlorophyll fluorescence. Kluwer, Dordrecht, pp
129–142
Lichtenthaler HK (1989) Plant lipid biosynthesis as target for biocides. In: Biacs PA, Gruiz K,
Kremmer T (eds) Biological role of plant lipids. Plenum, New York, pp 389–400
Lichtenthaler HK (1992) The Kautsky effect: 60 years of chlorophyll fluorescence induction
kinetics. Photosynthetica 27:45–55
Lichtenthaler HK (1996) Vegetation stress: an introduction to the stress concept in plants. J Plant
Physiol 148:4–14
Lichtenthaler HK (1999) The 1-deoxy-d-xylulose-5-phosphate pathway of isoprenoid biosynthesis
in plants. Annu Rev Plant Physiol Plant Mol Biol 50:47–65
Lichtenthaler HK (2000a) The non-mevalonate isoprenoid biosynthesis: enzymes, genes and
inhibitors. Biochem Soc Trans 28:787–792
Fifty-Five Years of Research on Photosynthesis, Chloroplasts, and Stress. . .
39
Lichtenthaler HK (2000b) Discovery of the two parallel pathways for isoprenoid biosynthesis in
plants. In: Kung S-D, Yang S-F (eds) Discoveries in plant biology, vol III. World Scientific
Publishing, Singapore, pp 141–161
Lichtenthaler HK (2000c) 30 Jahre Botanik II Karlsruhe. Karlsruher Beitr Pflanzenphysiol
37:1–198, ISSN 0173-3133
Lichtenthaler HK (2004a) A history of the Federation of European Societies of Plant Physiology
FESPP since its formation in 1978—including notes on events preceding the foundation and
following re-naming as the Federation of European Societies of Plant Biology (FESPB) in
2002. J Plant Physiol 161:635–639
Lichtenthaler HK (2004b) Thirty years of international symposia on plant lipids. In: Biacs P,
Gerely P (eds) Proceedings of the 16th plant lipid symposium. Mete Publisher, Budapest, pp
I–XXIV. https://drive.google.com/file/d/0B9tGkMMkZ8IkQV9qSWhTRHdoWVE/edit?usp=
sharing
Lichtenthaler HK (2004c) Evolution of carotenoid and sterol biosynthesis in photosynthetic and
non-photosynthetic organisms. In: Biacs P, Gerely P (eds) Proceedings of the 16th plant lipid
symposium, Mete Publisher, Budapest, pp 11–24. https://drive.google.com/file/d/
0B9tGkMMkZ8IkQV9qSWhTRHdoWVE/edit?usp=sharing
Lichtenthaler HK (2007) Biosynthesis, accumulation and emission of carotenoids, α-tocopherol,
plastoquinone and isoprene in leaves under high photosynthetic irradiance. Photosynth Res
92:163–181
Lichtenthaler HK (2010) Chapter 7: The DOXP/MEP pathway of chloroplast isoprenoid biosynthesis. In: Rebeiz C, Bohnert H, Benning C, Daniell H, Hoober K, Lichtenthaler HK, Portis
AR, Tripathy BC (eds) The chloroplast: basics and applications, vol 31, Advances in photosynthesis and respiration. Springer, Dordrecht, pp 95–118
Lichtenthaler HK (2013) Chapter 15: Plastoglobuli, thylakoids, chloroplast structure and development of plastids. In: Biswal B, Krupinska K, Biswal UC (eds) Plastid development during
leaf growth and senescence, vol 36, Advances in photosynthesis and respiration. Springer
Science + Business Media, Dordrecht, pp 337–361
Lichtenthaler HK, Babani F (2000) Detection of photosynthetic activity and water stress by
imaging the red chlorophyll fluorescence. Plant Physiol Biochem 38:889–895
Lichtenthaler HK, Babani F (2004) Light adaptation and senescence of the photosynthetic
apparatus: changes in pigment composition, chlorophyll fluorescence parameters and photosynthetic activity. In: Papageorgiou GC, Govindjee (eds) Chlorophyll fluorescence: a signature
of photosynthesis, Springer, Dordrecht, pp 713–736
Lichtenthaler HK, Becker K (1972) Changes of the plastidquinone and carotenoid metabolism
associated with the formation of functioning chloroplast in continuous far-red and white light.
In: Proceedings of the 2nd international congress on photosynthesis research, vol 3. Dr.
W. Junk, NV Publishers, The Hague, pp 2451–2459
Lichtenthaler HK, Buschmann C (1978) Control of chloroplast development by red light, blue
light and phytohormones. In: Akoyunoglou G et al (eds) Chloroplast development in plant
biology, vol 2. Elsevier, Amsterdam, pp 801–816
Lichtenthaler HK, Buschmann C (1983) Das Waldsterben, Verlauf, Ursachen und Konsequenzen.
Fridericiana 32:38–66, ISSN 0533-0912
Lichtenthaler HK, Buschmann C (1984a) Beziehung zwischen Photosynthese und Baumsterben.
Allgemeine Forst Zeitschrift 39:12–16
Lichtenthaler HK, Buschmann C (1984b) Das Waldsterben aus botanischer Sicht. G. Braun,
Karlsruhe
Lichtenthaler HK, Calvin M (1964) Quinone and pigment composition of chloroplasts and
quantasome aggregates from Spinacia oleracea. Biochim Biophys Acta 79:30–40
Lichtenthaler HK, Meier D (1984) Inhibition by sethoxydim of chloroplast biogenesis, development and replication in barley seedlings. Z Naturforsch 39c:115–122
Lichtenthaler HK, Miehé J (1997) Fluorescence imaging as a diagnostic tool for plant stress.
Trends Plant Sci 2:316–320
40
H.K. Lichtenthaler
Lichtenthaler HK, Park RB (1963) Chemical composition of chloroplast lamellae from spinach.
Nature 198:1070–1072
Lichtenthaler HK, Peveling E (1966) Osmiophile Lipideinschlüsse in den Chloroplasten und im
Cytoplasma von Hoya carnosa R. Br Die Naturwissenschaften 53:534
Lichtenthaler HK, Peveling E (1967) Plastoglobuli und osmiophile cytoplasmatische Lipideinschlüsse in grünen Blättern von Hoya carnosa R. Br. Z Pflanzenphys 56:153–165
Lichtenthaler HK, Rinderle U (1988a) Chlorophyll fluorescence as vitality indicator in forest
decline research. In: Lichtenthaler HK (ed) Applications of chlorophyll fluorescence. Kluwer,
Dordrecht, pp 143–149
Lichtenthaler HK, Rinderle U (1988b) The role of chlorophyll fluorescence in the detection of
stress conditions in plants. CRC Crit Rev Anal Chem 19(Suppl 1):29–85
Lichtenthaler HK, Schindler C (1992) Studies on the photoprotective function of zeaxanthin
at high-light conditions. In: Murata N (ed) Research in photosynthesis, vol IV. Kluwer,
Dordrecht, pp 517–520
Lichtenthaler HK, Schweiger J (1998) Cell wall bound ferulic acid, the major substance of the
blue-green fluorescence emission of plants. J Plant Physiol 152:272–282
Lichtenthaler HK, Sprey B (1966) Über die osmiophilen globulären Lipideinschlüsse der
Chloroplasten. Z Naturforsch 21b:690–697
Lichtenthaler HK, Weinert H (1970) Die Beziehungen zwischen Lipochinonsynthese und
Plastoglobulibildung in den Chloroplasten von Ficus elastica Roxb. Z Naturforsch
25b:619–623
Lichtenthaler HK, Buschmann C, Rahmsdorf U (1980) The Importance of blue light for the
development of sun-type chloroplasts. In: Senger H (ed) The blue light syndrome. Springer,
Berlin, pp 485–494
Lichtenthaler HK, Buschmann C, Döll M, Fietz H-J, Bach T, Kozel U, Meier D, Rahmsdorf U
(1981a) Photosynthetic activity, chloroplast ultrastructure, and leaf characteristics of high-light
and low-light plants and of sun and shade leaves. Photosynth Res 2:115–141
Lichtenthaler HK, Prenzel U, Douce R, Joyard J (1981b) Localization of prenylquinones in the
envelope of spinach chloroplasts. Biochim Biophys Acta 641:99–105
Lichtenthaler HK, Kuhn G, Prenzel U, Meier D (1982a) Chlorophyll-protein levels and stacking
degree of thylakoids in radish chloroplasts from high-light, low-light and bentazon-treated
plants. Physiol Plant 56:183–188
Lichtenthaler HK, Prenzel U, Kuhn G (1982b) Carotenoid composition of chlorophyll-carotenoidproteins from radish chloroplasts. Z Naturforsch 37c:10–12
Lichtenthaler HK, Meier D, Buschmann C (1984) Development of chloroplasts at high and low
light quanta fluence rates. Isr J Bot 33:185–194
Lichtenthaler HK, Schmuck G, Döll M, Buschmann C (1985) Untersuchungen über die Funktionsfähigkeit des Photosyntheseapparates bei Nadeln gesunder und geschädigter Koniferen.
PEF-Bericht KfK-PEF 2. Kernforschungszentrum Karlsruhe, pp 81–105
Lichtenthaler HK, Rinderle U, Haitz M (1989) Seasonal variations in photosynthetic activity of
spruces as determined by chlorophyll fluorescence. Ann Sci Forest 46(suppl):483s–489s
Lichtenthaler HK, Schwender J, Seemann M, Rohmer M (1995) Carotenoid biosynthesis in green
algae proceeds via a novel biosynthetic pathway. In: Mathis P (ed) Photosynthesis: from light
to biosphere. Kluwer, Amsterdam, pp 115–118
Lichtenthaler HK, Lang M, Sowinska M, Heisel F, Miehé JA (1996) Detection of vegetation stress
via a new high resolution fluorescence imaging system. J Plant Physiol 148:599–612
Lichtenthaler HK, Rohmer M, Schwender J (1997a) Two independent biochemical pathways for
isopentenyl diphosphate (IPP) and isoprenoid biosynthesis in higher plants. Physiol Plant
101:643–652
Lichtenthaler HK, Schwender J, Disch A, Rohmer M (1997b) Biosynthesis of isoprenoids in
higher plant chloroplasts proceeds via a mevalonate independent pathway. FEBS Lett
400:271–274
Fifty-Five Years of Research on Photosynthesis, Chloroplasts, and Stress. . .
41
Lichtenthaler HK, Babani F, Langsdorf G, Buschmann C (2000a) Measurement of differences in
red chlorophyll fluorescence and photosynthetic activity between sun and shade leaves by
fluorescence imaging. Photosynthetica 38:521–529
Lichtenthaler HK, Zeidler J, Schwender J, Müller C (2000b) The non-mevalonate isoprenoid
biosynthesis of plants as a test-system for new herbicides and drugs against pathogenic bacteria
and the malaria parasite. Z Naturforsch 55c:305–313
Lichtenthaler HK, Buschmann C, Knapp M (2005a) How to correctly determine the different
chlorophyll fluorescence parameters and the chlorophyll fluorescence decrease ratio RFd of
leaves with the PAM fluorometer. Photosynthetica 43:379–393
Lichtenthaler HK, Langsdorf G, Lenk S, Buschmann C (2005b) Chlorophyll fluorescence imaging
of photosynthetic activity with the flash-lamp fluorescence imaging system. Photosynthetica
43:355–369
Lichtenthaler HK, Ac A, Marek MV, Kalina J, Urban O (2007) Differences in pigment composition, photosynthetic rates and chlorophyll fluorescence images of sun and shade leaves of
four tree species. Plant Physiol Biochem 45:577–588
Lichtenthaler HK, Buchanan BB, Douce R (2008) Honoring Andrew Benson in Paris: a tribut on
his 90th birthday. Photosynth Res 96:181–183
Lichtenthaler HK, Langsdorf G, Buschmann C (2012) Multicolor fluorescence images and fluorescence ratio images of green apples at harvest and during storage. Isr J Plant Sci 60:97–106
Lichtenthaler HK, Babani F, Buschmann C (2013a) Chlorophyll fluorescence kinetics, photosynthetic activity and pigment composition of blue-shade and half-shade leaves as compared to
sun and shade leaves of different trees. Photosynth Res 117:355–366
Lichtenthaler HK, Langsdorf G, Buschmann C (2013b) Uptake of diuron and concomitant loss of
photosynthetic activity in leaves as visualized by imaging the red chlorophyll fluorescence.
Photosynth Res 116:355–361
Mansfield TA, Whitmore ME, Law RM (1982) Effects of nitrogen oxides on plants: two case
studies. In: Schneider T, Grant L (eds) Air pollution by nitrogen oxides. Elsevier, Amsterdam,
pp 511–526
Menke W (1962) Structure and chemistry of plastids. Annu Rev Plant Physiol 13:27–44
Papageorgiou GC, Govindjee (eds) (2004) Chlorophyll a fluorescence: a signature of photosynthesis. Advances in photosynthesis and respiration, vol 19. Springer, Dordrecht
Park RB, Pon NG (1961) Correlation of structure with function in Spinacia oleracea chloroplasts.
J Mol Biol 3:1–19
Pfister K, Buschmann C, Lichtenthaler HK (1974) Inhibition of the photosynthetic electron
transport by bentazon. In: Proceedings of the 3rd international congress on photosynthesis,
vol I. Elsevier Scientific Publisher, Amsterdam, pp 675–681
Rebeiz CA, Benning C, Bohnert HJ, Daniell H, Hoober JK, Lichtenthaler HK, Portis AR, Tripathy
BC (eds) (2010) The chloroplast: basics and applications. Advances in photosynthesis and
respiration, vol 31. Springer, Dordrecht
Rinderle U, Lichtenthaler HK (1988) The chlorophyll fluorescence ratio F690/F735 as a possible
stress indicator. In: Lichtenthaler HK (ed) Applications of chlorophyll fluorescence. Kluwer,
Dordrecht, pp 189–196
Rinderle U, Lichtenthaler HK (1989) The various chlorophyll fluorescence signatures as a basis for
physiological ground truth control in remote sensing of forest decline. In: Internat. Geoscience
and remote sensing symposium, IGARSS ‘89, vol. 2. Vancouver, pp 674–677
Rock BN, Hoshizaki T, Lichtenthaler HK, Schmuck G (1986) Comparison of in situ spectral
measurements of forest decline symptoms in Vermont (U.S.A.) and the Schwarzwald (F.R.G.).
In: Proceedings of the remote sensing symposium (IGARSS), Zürich 1986, vol. III. ESA
Publications Division, Noordwijk, pp 1667–1672
Sarijeva G, Knapp M, Lichtenthaler HK (2007) Differences in photosynthetic activity, chlorophyll
and carotenoid levels, and in chlorophyll fluorescence parameters in green sun and shade
leaves of Ginkgo and Fagus. J Plant Physiol 164:950–955
42
H.K. Lichtenthaler
Schindler S (1984) Verbreitung und Konzentration von Ubichinon-Homologen in Pflanzen. Karlsr
Contrib Plant Physiol 12:1–240
Schindler S, Lichtenthaler HK (1984) Comparison of the ubiquinone homologue pattern in plant
mitochondria and their possible prokaryotic precursors. In: Siegenthaler PA, Eichenberger D
(eds) Structure, function and metabolism of plant lipids. Elsevier, Amsterdam, pp 273–276
Schindler C, Lichtenthaler HK (1996) Photosynthetic CO2 assimilation, chlorophyll fluorescence
and zeaxanthin accumulation in field-grown maple trees in the course of a sunny and a cloudy
day. J Plant Physiol 148:399–412
Schindler C, Burkart S, Lichtenthaler HK (1992) High-light induced accumulation of zeaxanthin
in aurea tobacco: a biphasic process. In: Cherif A, Miled-Daoud DB, Marzouk B, Zarrouk M
(eds) Metabolism, structure and utilisation of plant lipids. Centre National Pedagogique, Tunis,
pp 269–274. ISBN 9973-17-272-8
Schindler C, Reith P, Lichtenthaler HK (1994) Differential levels of carotenoids and decrease of
zeaxanthin cycle performance during leaf development in a green and an aurea variety of
tobacco. J Plant Physiol 143:500–507
Schmuck G, Lichtenthaler HK, Kritikos G, Amann V, Rock B (1987) Comparison of terrestrial
and airborne reflection measurements of forest trees. In: Internat. Geoscience and remote
sensing symposium, IGARSS ‘87, Michigan, vol II. The University of Michigan, Ann Arbor,
MI, pp 1207–1212
Schwender J, Lichtenthaler HK, Seemann M, Rohmer M (1995) Biosynthesis of isoprenoid chains
of chlorophylls and plastoquinone in Scenedesmus by a novel pathway. In: Mathis P
(ed) Photosynthesis: from light to biosphere. Kluwer, Amsterdam, pp 1001–1004
Schwender J, Seemann M, Lichtenthaler HK, Rohmer M (1996) Biosynthesis of isoprenoids
(carotenoids, sterols, prenyl side-chains of chlorophyll and plastoquinone) via a novel pyruvate/glycero-aldehyde-3-phosphate non-mevalonate pathway in the green alga Scenedesmus.
Biochem J 316:73–80
Schwender J, Zeidler J, Gröner R, Müller C, Focke M, Braun S, Lichtenthaler FW (1997)
Incorporation of 1-deoxy-D-xylulose into isoprene and phytol by higher plants and algae.
FEBS Lett 414:129–134
Seybold A, Egle K (1937) Lichtfeld und Blattfarbstoffe I. Planta 26:491–515
Steele JW, Gurin S (1960) Biosynthesis of ß-carotene in Euglena gracilis. J Biol Chem
235:2778–2785
Stober F, Lichtenthaler HK (1992) Changes of the laser-induced blue, green and red fluorescence
signatures during greening of etiolated leaves of wheat. J Plant Physiol 140:673–680
Stober F, Lichtenthaler HK (1993) Studies on the constancy of the blue and green fluorescence
yield during the chlorophyll fluorescence induction kinetics (Kautsky effect). Radiat Environ
Biophys 32:357–365
Stober F, Lang M, Lichtenthaler HK (1994) Studies on the blue, green and red fluorescence
signatures of green, etiolated and white leaves. Remote Sens Environ 47:65–71
Thornber JP (1975) Chlorophyll-proteins: light-harvesting and reaction center components of
plants. Annu Rev Plant Physiol 26:127–158
Wellburn A, Higginson C, Robinson D, Wamsley C (1981) Biochemical exüplanations of more
than additive inhibitory effects of low atmospheric leavels of sulphur dioxide plus nitrogen
dioxide upon plants. New Phytol 88:223–237
Zeidler JG, Lichtenthaler HK, May HU, Lichtenthaler FW (1997) Is isoprene emitted by plants
synthesized via the novel isopentenylpyrophosphate pathway? Z Naturforsch 52c:15–23
Zimmer-Rinderle U, Lichtenthaler HK (1995) Photosyntheseaktivität und Chlorophyllfluoreszenzen geschädigter Fichten. In: Bittlingmeier L et al (eds) Waldschäden im Schwarzwald:
Ergebnisse einer interdisziplinären Freilandstudie zur montanen Vergilbung am Standort
Freudenstadt/Schöllkopf. Ecomed Verlagsgesellschaft, Landsberg, pp 256–287
Alfred Russel Wallace: Self-Educated Genius
and Polymath
David Lloyd
The Childhood shows the man, as morning shows the day. Be
famous then by wisdom; as thy empire must extend, So let
extend thy mind o’er all the world.
John Milton: Paradise Regained (1671)
Contents
1 Early Years . . . . . . . . . . . . . . . . . . . . . . . . . . . . . . . . . . . . . . . . . . . . . . . . . . . . . . . . . . . . . . . . . . . . . . . . . . . . . . . . . . .
2 Back to South Wales . . . . . . . . . . . . . . . . . . . . . . . . . . . . . . . . . . . . . . . . . . . . . . . . . . . . . . . . . . . . . . . . . . . . . . . . .
3 Four Years in Amazonia . . . . . . . . . . . . . . . . . . . . . . . . . . . . . . . . . . . . . . . . . . . . . . . . . . . . . . . . . . . . . . . . . . . . .
4 London and the East . . . . . . . . . . . . . . . . . . . . . . . . . . . . . . . . . . . . . . . . . . . . . . . . . . . . . . . . . . . . . . . . . . . . . . . . .
5 Home Again at Last . . . . . . . . . . . . . . . . . . . . . . . . . . . . . . . . . . . . . . . . . . . . . . . . . . . . . . . . . . . . . . . . . . . . . . . . . .
6 A Century of Progress . . . . . . . . . . . . . . . . . . . . . . . . . . . . . . . . . . . . . . . . . . . . . . . . . . . . . . . . . . . . . . . . . . . . . . .
7 Eclipse, Reassessment, and Overdue Reappraisal . . . . . . . . . . . . . . . . . . . . . . . . . . . . . . . . . . . . . . . . . .
References . . . . . . . . . . . . . . . . . . . . . . . . . . . . . . . . . . . . . . . . . . . . . . . . . . . . . . . . . . . . . . . . . . . . . . . . . . . . . . . . . . . . . . . .
44
46
49
52
65
67
70
71
Abstract Alfred Russel Wallace was a Colossus: courageous, heroic, radical,
modest, and above all, a man of insatiable curiosity. One hundred years on one
can propose that his prescience anticipated many modern scientific developments
and that despite relative neglect his far-ranging insight continues to inspire
even now.
His earliest memories take us to Usk in South Wales, where he was born in 1823,
and many experiences there are fondly recounted as formative influences. Adolescent interest in natural history during apprenticeship to his elder brother, a landsurveyor at the dawn of the railway era in Mid Wales and the Neath valley,
blossomed into a lifelong fascination with the living world. The depth and reach
of his thinking on the diversity and distribution of species outpaced his contemporaries, and he became the undisputed father of biogeography.
Interaction with the ‘poor farmers’ of South Wales and exposure to their humble
conditions inculcated a concern for the deprivation of the underclasses, and were
influential in the shaping of his societal concerns and later activism. After
D. Lloyd (*)
Cardiff University School of Biosciences, Main Building, Museum Avenue, Cathays Park,
Cardiff CF10 3AT, Wales, UK
e-mail: lloydd@cf.ac.uk
© Springer International Publishing Switzerland 2015
U. Lüttge, W. Beyschlag (eds.), Progress in Botany, Progress in Botany 76,
DOI 10.1007/978-3-319-08807-5_2
43
44
D. Lloyd
proposing the basic principles of speciation and of selection and arriving at a novel
and original concept of evolutionary mechanisms, Wallace daringly pursued several non-scientific interests: phrenology, mesmerism, spiritualism, and the great
question of whether we are alone in the cosmos.
Honoured late in a long life, Wallace became regarded as one of the greatest
scientists in the world, despite his enthusiasms for supernatural phenomena.
Eclipsed after his passing in 1913, a gradual realisation of the depth of his
mainstream science as well as premature dismissal of some of his more arcane
insights continues beyond his centenary year.
1 Early Years
Alfred Russel Wallace was the son of an unsuccessful lawyer, Thomas Wallace,
who having difficulty in making ends meet had moved homes from London to the
town of Usk, then as now a rural area in Monmouthshire, South Wales (Hughes
1989). The home where Alfred was born, the eighth of nine children, in 1823
(Fig. 1a) lies on the road leading along the river Usk to Llanbadoc: there in the
churchyard two young sisters who died at 8 and 10 years (possibly of scarlet fever)
are buried. Of the children born to Thomas and Mary Wallace, only five survived to
adulthood. The eldest, William, the surveyor with whom Alfred was to work for
6 years, was to die of pneumonia aged 36, and Herbert, the youngest, died in Pará
(Belem) in South America, after following Alfred to help with specimen collecting
(Wilson 2000).
Five years after Alfred was born the family moved to Hertford, but his earliest
memories of the house and river Usk are recounted in detail in his autobiography
(Wallace 1862, 1905, 1910):
To the time when I was just over three, besides myself, standing on the flat stones and
catching lampreys.
His other strong impression was of the fishermen with their coracles:
An ancient form of boat made of strong wicker-work, somewhat the shape of the deeper
half of a cockle-shell, and covered with bullock’s hide. Each coracle held one man, and it
could be easily carried to and from the river on the owner’s back . . . this extremely
interesting boat, which has been in use from pre-Roman and perhaps even from the
Neolithic Age, should continue to be used on several of the Welsh rivers down to the
present day. There is probably no other type of vessel now in existence which has remained
unchanged for so long a period.
Wallace makes the interesting observation . . . “no doubt common to children of
the same age”.. . . on his . . . “vague shadowy” . . . recollections of his father and
mother, brothers, or sisters at that time. On the other hand, the main features and
even the details of the outdoor and indoor surroundings then were still clear to
Alfred Russel Wallace: Self-Educated Genius and Polymath
Fig. 1 (a) Kensington
Cottage the Birthplace of
Alfred Russel Wallace in
Usk, Monmouthshire, South
Wales, a photograph taken
in around c. 1900 (Courtesy
of A.R. Wallace Memorial
Fund and G.W. Beccaloni).
(b) The Mechanics’
Institute in Neath, designed
by Alfred and his brother,
and still in use. (c) Llantwit
Cottage, where Wallace and
members of his family lived
between 1846 and 1848
45
46
D. Lloyd
Wallace in his old age. His hazy memory of having a scalded arm by contact with
boiling fat led him to suggest that:
The sensation of pain does not, probably, reach its maximum till the whole organism is fully
developed in the adult individual. This is rather a comforting conclusion in view of the
sufferings of so many infants needlessly massacred through the terrible defects of our
vicious social system.
In Hertford, Alfred became an ardent reader of books from the local library, and
was also exposed to Church of England services and to the “rare treats” of the
Quaker’s chapels, but
As however, there was no sufficient basis of intelligible fact or connected reasoning to
satisfy my intellect, this feeling (of religious fervour) soon left me, and has never returned.
Leaving school at 13, Alfred was sent to London to assist his 19-year-old
brother, John, in his apprenticeship as a carpenter. In the evenings they would go
to a ‘Hall of Science’—a kind of mechanics’ institute especially notable for its
members, advanced thinkers, and followers of Robert Owen, the Welsh secularist
and founder of the English Socialist movement renowned for his munificent
management of New Lanark over a period of 26 years. This eighteenth century
cotton-mill town, now a World Heritage Site near Glasgow in Scotland, became a
model for wise philanthropic and effective community administration and child
education.
The “horrible doctrine of eternal punishment as then commonly taught from
thousands of pulpits by both the Church of England and Dissenters” was thus to
give way in Wallace’s belief to religious scepticism.
In 1837, Alfred went with his brother, William, to Bedfordshire to begin his
training as a land-surveyor:
It was here too that during my solitary rambles I first began to feel the influence of nature
and to wish I knew more of the various flowers, shrubs and trees, I daily met with, but of
which for the most part I did not then know the English names. At that time, I hardly
realised that there was such a science as systematic botany, that every flower and every
meanest and most insignificant weed has been accurately described and classified, and that
there was any kind of system or order in the endless variety of plants and animals which I
knew existed.
2 Back to South Wales
In Llanbister and Llandrindod Wells in 1839 the Wallace brothers continued their
land surveying of the Radnorshire countryside, and Alfred rails against the enclosure of common and wasteland by rich country squires and landowners “landrobbery”, a lifelong concern, to be reiterated repeatedly (Wallace 1882, 1898,
1913a).
At Trallong, near Brecon, back in South Wales, the flat portions of summits of
the Brecon Beacons with their still level sub-strata excited Wallace’s attention,
Alfred Russel Wallace: Self-Educated Genius and Polymath
47
Here we are able, as it were, to catch Nature at work.
Further up the valleys of the Neath and Usk rivers he stayed at a “little publichouse” where the people were all thoroughly Welsh, but the landlord of the inn, and
a young man who lived with him, spoke English fairly well! More than a year in the
Neath valley was “on the whole very comfortable, although our first experience was
a rather trying one”. He describes “prompt and thorough measures using some
ounces of corrosive sublimate (mercuric chloride) dissolved in a large pail full of
water and liberally painted on the walls, ceiling, bedstead and furniture to eliminate all traces of Cimex lectularius, or bedbugs, which attacked us by the hundreds,
and altogether banished sleep.”
Wallace’s sojourn in Neath was a time when he had little to do, and he made full
use of this opportunity for “self-education in science and literature”. It was here
rather in Leicester that his interest in natural history emerged and developed
(Hughes 1989, 1991, 1997; Raby 2001). He became especially fascinated with
insects (Claridge 2008) and plant life (Kutschera and Hossfield 2013). His attention
to the lines of demarcation of the Welsh language was to find an echo much later in
his detailed analyses of word usage amongst the inhabitants of discrete regions in
Amazonia and Malaya (Hughes 1997). At 17 or 18 he published his first paper “An
essay on the best method of conducting the Kington Mechanics Institute” (Hughes
1989).
Construction of a telescope enabled him:
to observe the moon and Jupiter’s satellites and some of the larger star clusters; but, of
course very imperfectly-and it also led me throughout my life to be deeply interested in the
grand onward march of astronomical discovery.
But his chief preoccupation was with:
the variety, the beauty, and the mystery of Nature as manifested in the vegetable kingdom.’
I obtained a shilling paper-covered book published by the Society for the Diffusion of
Useful Knowledge . . . a revelation to me and for a year my constant companion . . . Great
was my delight when I found I could identify a Crucifer, an Umbellifer and a Labiate, and
as one or another, the different orders were recognised. I began to realise for the first time
the system that underlay all the variety of nature.
Lindley’s “Elements of Botany”, a rather mistaken early purchase, was not so
useful as a borrowed volume of London’s “Encyclopaedia of Plants” for identification of British species, and he annotated Lindley from it (Raby 2001). His
brother’s disapproval of the time-wasting pastime of construction of a herbarium,
although not directly commented upon, came back to Alfred via a letter from their
mother:
Neither he nor I could foresee that it would have any effect on my future life, and I myself
only looked upon it as an intensely interesting occupation for time that otherwise would be
wasted. . ..
Now I have some reason to believe that this was the turning point of my life, the tide that
carried me on, not to fortune but to whatever reputation I have acquired, and which to me
has certainly been a never-ending source of much health of body and supreme mental
enjoyment.
48
D. Lloyd
Wallace then writes about the humble existence that he and his brothers experienced. During the 7 years with his brother, Alfred
hardly ever had more than a few shillings for personal expenses: but every year or two when
I went home, what new clothes were absolutely necessary were provided for me, with
perhaps ten shillings or a pound as pocket money till my next visit, and this, I think, was
partly or wholly paid out of a small legacy left by my grand-father. . .. Had my father been a
moderately rich man. . .. I might never have turned to nature. . .. I should never have even
undertaken . . . a journey to the almost unknown forests of the Amazon in . . . to observe
nature and make a living by collecting.
During his stay in the Neath area Wallace became curator of the Museum.
Victorian enthusiasm at a time of general intellectual activity and excitement
fired new interests on the part of working people who became highly enthusiastic
to learn of progress in engineering, the sciences, and natural history. There Wallace
also helped collect at first-hand a carefully selected choice of texts (Hughes 1989).
In 1843, Alfred’s father died, his mother gave up the family house in Hoddeston,
Hertfordshire, and his brother informed him that there was no more work in
prospect in Neath; teaching at Leicester became his new occupation. However:
no amount of teaching or practice would ever have made me a good musician, however
much time and study I gave to the subject. I could never have become a good mathematician! . . . still the ever-growing complexities of the higher mathematician had a kind of
fascination for me as exhibiting powers of the human mind so above my own.
In the town subscription library he read Humboldt, Prescott, and most importantly Malthus’s ‘Principles of Population’, his first introduction to “philosophical
biology”, that volume which he kept in his possession for more than two decades
when it was to play a pivotal role in his formulation of his theory of evolution. Also,
at Leicester in 1844, Wallace was introduced to the mysteries of mesmerism and the
study of phrenology. It was a meeting with Henry Bates, a well-regarded young
entomologist that extended Wallace’s interests in the taxonomy of plants to that of
butterflies and beetles; he was amazed to discover that more than a thousand species
could probably be found within a radius of 10 miles of the town. Expeditions took
them to Bradgate Park, Kenilworth Castle, and Derbyshire. The death of his
brother, William, took him back to Neath, where in the absence of John, he
discovered that “the great railway mania” had created levelling and surveying
work for the Vale of Neath to Merthyr Tydfil line proposed to supplement haulage
of coal and iron along the canals.
Here we had to climb over huge rocks as big as houses, ascend cascades and take crosslevels up steep banks and precipices all densely wooded. . .
However, not one tenth of the lines proposed that year were ever made and the
money wasted upon surveyors, engineers, and law expenses must have amounted to
millions.
After brother John had rejoined Alfred, he was persuaded to build a small boat
and the local canals made for many pleasant excursions. Collection of payment of
tithes from local farmers was the least pleasant part of his occupation, as many were
Alfred Russel Wallace: Self-Educated Genius and Polymath
49
very poor, some could not speak English, didn’t understand the system, and even
refused to pay.
This was one of the things that disgusted me with business, and it made me more than ever
disposed to give it all up if I could get anything else to do.
That new activity for the brothers was the design and construction of the
‘Mechanics Institute’ at Neath (Fig. 1b), a sturdy stone building still in use as a
museum office near the town centre. During a 2-year period whilst living at
Llantwit cottage (Fig. 1c), and when working away from home, the brothers always
chose to stay nights in farmhouses where the families spoke Welsh. Lecturing on
basic sciences at the Institute, collection of insects, and bird watching with his
brother further inspired his interests in the natural world, and of the “beauties of the
Vale of Neath scenery, the old Roman road (Sarn Helen), the caves and waterfalls,
and the distant view over the valley to the faint haze of the Bristol Channel”.
3 Four Years in Amazonia
During Wallace’s time at Neath he had maintained his correspondence with
H.W. Bates and it was during their reunion at South Wales a proposal to go
collecting in the tropics was first discussed. At this time in his letters to Bates,
Wallace stated that he had read Chambers’ (1844) ‘Vestiges of the Natural History
of Creation’ and also mentioned works by Lyell, Darwin’s ‘Journal’, and
Humbold’s ‘Personal Narrative’. Local collecting had become rather inadequate:
“I should like to take some one family, to study thoroughly principally with a view to the
theory of the origin of species. “What decided our going to Pará and The Amazon rather
than to any other part of the tropics was the publication in 1847 of ‘A Voyage up the
Amazon’ by Mr. W.H. Edwards. This book was so clearly and brightly written, described so
well the beauty and grandeur of tropical vegetation, and gave such a pleasing account of the
people, while showing that the expenses of living and travelling were very moderate, that
Bates and myself at once agreed that this was the very place to go if there was any chance of
paying our expenses by the sale of our duplicate collections . . . we set sail on April 28th,
1848.” (Wallace 1853a, b).
Bates and Wallace were the only passengers on a 192 t barque, the Mischief, “a
very fast sailer”, and landed at Pará (now Belem) 29 days after leaving Liverpool.
After 4 months, so as to earn more for their collected specimens sent back to
London, they separated so as to get better coverage of the vast area. Bates looked at
the Upper Amazon and Wallace went to the Upper Negro. This was after they had
met Dr. Richard Spruce, the well-known botanist who had travelled to South
America with Wallace’s brother, Herbert. Barra (now Manaus) at the mouth of
the River Negro and the surroundings turned out to be highly rewarding for
botanical studies (Wallace 1853a), but disappointing in terms of insect varieties.
Herbert, already having decided to return to England, caught yellow fever at Pará,
and tragically died after a very few days. Alfred never fully got over this loss of his
50
D. Lloyd
Fig. 2 (a) Wallace’s journeys along the Amazon and Rio Negro (Courtesy of J.G. Wilson 2000).
(b) From 1848 to 1852 Wallace charted unexplored territory along these rivers
younger brother and often in later life expressed his great sorrow at this misfortune
so far away from home (Wilson 2000).
Two voyages along the Amazon and then the Rio Negro took Wallace beyond
Brazil to Javita in Venezuela, and up the Uaupés to Maura (now Macura) in
Columbia (Fig. 2a): he made the first detailed map of the area that included much
hardly charted territory (Fig. 2b). An enthralling account of these adventures and of
Alfred Russel Wallace: Self-Educated Genius and Polymath
51
Fig. 3 Palms from the Amazon The Kew palms on loan to National Museum of Wales from the
Royal Botanical Gardens: these are some of the oldest surviving specimens collected by Wallace
and Bates: (a) the Ghost palm, Mauritiella armarta, (b) the Açai palm Eutrope oleracae, and (c)
the Macaw palm Acrocomia aculeate
their unique scientific contributions (Knapp 2013) also provides a fine collection of
Wallace’s exquisitely delicate pencil line drawings curated at the Natural History
Museum at South Kensington in London.
A succession of fevers and dysentery left Wallace physically debilitated; he
thought it might have been the dreaded fever that had claimed his brother, but it was
probably malaria, only the doses of quinine he was taking were no longer effective.
He became so weak that he became anxious for his own life and decided to leave the
country. Although botanically extremely interesting, his recent excursions had in
any case seemed rather unproductive as far as birds and insects were concerned.
52
D. Lloyd
Then another devastating calamity! His latest collections and live animals were
destroyed on his ship Helen that went on fire Mid-Atlantic. Dried Palm specimens
brought back from the Amazon still survive at The Royal Botanical Gardens at Kew
(Fig. 3).
His voyage home was “rather adventurous”: the dangers and discomforts before
and after the fire had consumed The Helen can hardly be imagined. After 10 days
adrift on an open lifeboat, they were picked up in The Jordeson, bound for London,
and Wallace graphically described their hardship in a letter to Dr. Spruce:
“we have been for some time on the poorest of fare . . . beef or pork of the very worst
quality, I have ever eaten or even imagined to exist. This repeated day after day without any
variation” . . .
The leaky old ship seldom progressed at more than five knots, and an average of
two or three, bringing a cargo of heavy timber back from Cuba. Surviving a fearful
gale in the English Channel which left four foot of water in the hold, after 80 days
out from Pará, Wallace landed in Deal.
4 London and the East
The disastrous shipwreck did not leave Alfred completely destitute as his collection
had been insured: presumably it was only this that allowed him to settle with his
mother and sister (Fig. 4) in a house conveniently close to Regent’s Park and
Zoological Gardens. The very few remnants from his adventures in Amazonia
that had escaped the shipwreck included a tin box in which he had saved some of
his notebooks. One of these included careful pencilled drawings of all the different
species of palms he had seen, together with notes on their distribution and uses. He
visited scientific society meetings and got to know many London zoologists
(including Thomas H. Huxley) and several entomologists; the British Museum
(then in Great Russell Street) was close, and at Kew Herbarium he consulted
botanical literature to identify his palms; and he also published a popular book on
‘Palms of the Amazon and Rio Negro’ (Wallace 1853a). During his stay in London,
it became evident from Wallace’s library and museum researches that it was the
Malayan Archipelago that offered the most exciting and biologically unexplored
region for investigation.
As the journey would be expensive, Wallace applied for a free passage in a
Government ship, and he set out on a Peninsular and Orient steamer, Bengal.
Visiting Malta, Alexandria (where he commented colourfully on the donkeydrivers, the Nile, Pyramids, and Cairo) and then by the horse-drawn buses across
the desert to Suez. This route was a few years later superseded by railway and by the
canal. After Aden, Galle, and Penang his ship traversed the Straits of Malacca to
Singapore, where he remained for several months collecting birds and insects:
“to begin eight years of wandering throughout the Malay Archipelago, which constituted
the central and controlling incident of my life.”. (Fig. 5.)
Alfred Russel Wallace: Self-Educated Genius and Polymath
53
Fig. 4 Wallace in his late twenties or early thirties with his sister Frances and mother Mary Anne
Fig. 5 (a) Wallace’s voyages in Malaya (Courtesy of J.G. Wilson 2000). (b) Ali, Alfred’s
travelling companion and local expert
54
D. Lloyd
Placed immediately upon the equator and surrounded by extensive oceans, it is not
surprising that the various islands of the Archipelago should be almost always clothed with
a forest vegetation from the level of the sea to the loftiest mountains . . . except for a few
small and unimportant tracts, due perhaps, in some cases, to an ancient cultivation or
accidental fires. . .
up at half-past five, bath and coffee. Sit down to arrange and put away my insects from
the day before, we set them in a safe place to dry. Charles (a boy from London who wished
to become a collector), mends our insect-nets, fills our pin-cushions and gets ready for the
day. Breakfast at eight; out to the jungle at nine! . . . To bed at eight or nine. . .
The banks of the Saráwak River are everywhere covered with fruit trees, which supply
the Dyaks with a great deal of their food. The Mangosteen, Lansat, Rambutan, Jack,
Jambou, and Blimbing, are all abundant; but most abundant and most esteemed is the
Durian, a fruit about which is little known in England, but which both by natives and
Europeans in the Malay Archipelago is reconded superior to all others. The old traveller in
Linschott, writing in 1599, says:-“It is of such an excellent taste that it surpasses in flavour
all other fruits of the world, according to those who have tasted it.” And Doctor Paludanus
adds:-“This fruit is of a hot and humid nature. To those not used to it, it seems at first to
smell like rotten onions, but immediately they have tasted it they prefer it to all other food.
The natives give it honourable titles, exalt it, and make verses on it.” . . . eating it out of
doors, I at once became a confirmed Durian eater . . . Poets and moralists, judging from our
English trees and fruits, have thought that small fruits always grow on lofty trees, so that
their fall should be harmless to man, while the large ones trailed on the ground. Two of the
largest and heaviest fruits known however, the Brazil-nut fruit (Bertholletia) and Durian
grow on lofty forest trees, from which they fall as soon as they are ripe, and often wound or
kill the native inhabitants. From this we may learn two things: first, not to draw general
conclusions from a very partial view of nature; and secondly, that trees and fruits, no less
than the varied productions of the animal kingdom, do not appear to be organized with
exclusive reference to the use and convenience of man. . . The bamboo is one of the most
wonderful and most beautiful productions of the tropics, and one of nature’s most valuable
gifts to uncivilised man. . . Pitcher-plants, forming the genus Nepenthes of Botanists, here
reach their greatest development. Every mountain-top abounds with them, running along
the ground, or climbing over shrubs and stunted trees; their elegant pitchers hanging in
every direction. Some of these are long and slender, resembling in form the beautiful
Philippine lace-sponge (Euplectella), which has now become so common; others are broad
and short. Their colours are green, variously tinted and mottled with red or purple. The
finest yet known were obtained on the summit of Kini-balou in North-west Borneo. One of
the broad sort, Nepenthes rajah, will hold two quarts of water in its pitcher. Another,
Nepenthes Edwardsiania, has a narrow pitcher twenty inches long; while the plant itself
grow to a length of twenty feet.
In Sarawak, Wallace wrote his first contribution to the question of the origin of
species (Wallace 1855). This contained a concept that became known as the
‘Sarawak Law’, a milestone publication in the history of evolutionary biology
which stated that:
Every species has come into existence coincidently both in space and time with a
pre-existing closely-allied species, and thus suggested some type of evolutionary change
by a mechanism yet to be discovered.
Wallace’s agent back in London, Mr Stevens, who was responsible for selling
specimens wrote to express regret that several naturalists having read this paper
were concerned that valuable collecting time was being wasted on “theorising.”
Alfred Russel Wallace: Self-Educated Genius and Polymath
55
After this I had in a letter to Darwin expressed surprise that no notice appeared to have been
taken of my paper, to which he replied that both Sir Charles Lyell and Mr Edward Blyth,
two very good men called his attention to it.
Much later (F. Darwin 1888) it came to light that Huxley too had commented on
how little impression the Sarawak paper had made generally (Davies 2008).
Writing to Bates, dated January 4, 1858, Wallace mentions that:
I have been much gratified by a letter from Darwin, in which he says that he agreed with
“almost every word” of my paper. He is now preparing his great work on ‘Species and
Varieties’ for which he has been collecting materials for twenty years. He may save me the
trouble of writing more on my hypothesis by proving that the there is no difference between
the origin of species and of varieties . . . your collections and my own will furnish most
valuable material to illustrate and prove the universal application of the hypothesis. The
connection between the succession of affinities and the geographical distribution of any
group, worked out species by species has never yet been shown as we shall be able to
show it.
In this archipelago there are two distinct faunas rigidly circumscribed, which differ as
much as do those of Africa and South America, and more than those of Europe and North
America, yet there is nothing on the map or on the face of the islands to mark their limits.
The boundary line passes between islands closer together than others belonging to the same
group. I believe the western part to be a separated portion of continental Asia, while the
eastern is a fragmentary prolongation of a former west Pacific continent. In mammalia and
birds the distinction is marked by genera, families, and even orders confined to one region;
in insects by a number of genera, and little groups of peculiar species, the families of insects
having generally a very wide or universal distribution.
Much later in life, Wallace (1905) reminisced that:
This letter proves that at this time I had not the least idea of the nature of Darwin’s proposed
work, nor of the definite conclusions he had arrived at, nor had I myself any expectation of a
complete solution of the great problem to which my paper was merely the prelude. Yet less
than 2 months later that solution flashed upon me and to a large extent marked out a
different line of work from that which I had up to this time anticipated.
The processes involved in the gradual change by which one species gave rise to
another remained unknown. After arrival on Ternate January 8, 1858, Wallace
decided to go to the nearby island of Gilolo (today Helmahera) and while suffering
from an intermittent fever, he became too ill to go collecting, but this intermission
provided a break and led to a moment of deep inspiration. Malthus’s ‘Principles of
Population’ was re-collected from his reading of about 12 years previously:
I thought of his clear exposition of the positive checks to increase; ‘disease, accident, war
and famine’ – which kept down the population of savage races to a much lower average
than most civilized peoples.
Extrapolation to the even more rapid turnover within animal populations led to
the question
why do some die, and some live? And the answer was clearly, that on the whole the best
fitted live” . . . Then it suddenly flashed upon me that this self-activity process would
necessarily improve the race, because in every generation the inferior would be killed off
and the superior would remain – that is, the fittest would survive. . . and as great changes in
the environment are always slow, there would be ample time for the change to be affected
56
D. Lloyd
by the survival of the best fitted in every generation . . . each part of an animal’s organisation could be modified exactly as required, and in the very process of this modification the
unmodified would die out and thus the definite characteristics and the clear isolation of each
new species would be explained. The more I thought over it the more I became convinced
that I had at length found the long-sought-for law of nature that solved the problem of the
origin of species. For the next hour I thought over the deficiencies in the theories of
Lamarck and of the author of the “Vestiges” and I saw that my new theory supplemented
these views and obviated every important difficulty. I waited anxiously for the termination
of my fit, so that I might at once make notes for a paper on the subject. The same evening I
did this pretty fully, and on the two succeeding evenings wrote it out carefully in order to
send it to Darwin by the next post, which would leave in a day or two.
I asked him, if he thought it sufficiently important, to show it to Sir Charles Lyell, who
had thought so highly of my former paper.
“The effect of my paper upon Darwin was at first almost paralyzing. He had, as I
afterwards learnt, hit upon the same idea as my own twenty years earlier, and had occupied
himself in all that long period in study and experiment, and sketching out and partly writing
a great work”. . .
Back in London, three men had become frenetically concerned!
Sir Charles Lyell, the foremost geologist, and the distinguished botanist, Sir
Joseph Dalton Hooker, Director of the Royal Botanic Gardens at Kew, were
Darwin’s only confidants for all this time, and the former had frequently suggested
that the work be published, even if only in outline lest it be forestalled. When
Darwin received Wallace’s letter he wrote to Lyell
Your words have come true with a vengeance – that I should be forestalled. I never saw a
more striking coincidence. . .so all my originality whatever it may amount to, will be
smashed, though my book if it will have any value, will not be deteriorated, as all the
labour consists in the application of the theory. . .I would far rather burn my whole book
than that he (Wallace) or any other man should think I have behaved in paltry spirit.
He therefore left the matter in the hands of his two friends,
and they determined (on their own responsibilities that my essay, together with extracts
from Darwins MSS., which they had seen many years before, should be read before the
Linnean Society and published in its ‘Journal.’
This hasty arrangement by Lyell and Hooker was scheduled for July, 1st 1858; it
was conducted in the absence of Darwin (who was arranging for the funeral of his
baby son, Charles, who had died of scarlet fever on 28 June). The meeting went
ahead without any attempt to request permission from or even inform Wallace (still
in Malaysia) of the event.
Long afterwards, Hooker’s account of the meeting (Fig. 6) tells that:
the interest was intense, but the subject was too novel and too ominous for the old school to
enter into lists before armouring. After the meeting it was talked over with bated breath:
Lyell’s approval, and perhaps in a small way, mine, as his lieutenant in the affair, rather
overawed the Fellows, who would otherwise have flown out against the doctrine.
Wallace reflected long afterwards:
Both Darwin and Dr Hooker wrote to me in the most kind and courteous manner, informing
me of what had been done, of which they hoped I would approve. Of course I not only
approved, but felt that they had given me more honour and credit than I deserved, by putting
Alfred Russel Wallace: Self-Educated Genius and Polymath
57
Fig. 6 (a) Sir Charles Lyell FRS, Professor of Geology, King’s College, London. (b) Sir Joseph
Hooker FRS, Director Royal Botanic Gardens, Kew. (c) A Linnean Society of London meeting
room as it looks with the original furniture from the 1858 meeting. The actual room used for that
historic meeting is elsewhere (courtesy of Michael Shermer)
my sudden intuition – hastily written and immediately sent off for the opinion of Darwin
and Lyell – on the same level with the prolonged labours of Darwin, who had reached the
same point twenty years before me and had worked continuously during that long period, in
order that he might be able to present the theory to the world with such a body of
systematised facts and arguments as would almost compel conviction.
A letter from Hooker to Wallace informing him of what had happened at the
Linnean Society meeting arrived months later with an enclosure from Darwin. It
supplied Wallace with a list of the subjects he intended to write about in his book.
However, and most significantly, the key item missing from Darwin’s list was the
58
D. Lloyd
subject of ‘divergence’. Nevertheless, and very importantly, it should be especially
noted that only when Darwin’s ‘Origin of Species’ book was published more than a
year later, in November 1859, ‘divergence’ is given its proper recognition as the
driving force that Wallace had been exactly discussing and defining for some time
as ‘descent with modification’.
When Darwin wrote to Wallace later that year he told him:
I almost think that Lyell would have proved right and I should never have completed my
large work.
It should be noted here that precedence for Darwin was actually contrived by his
two friends by their ensuring that Darwin’s abstracted works were read first at that
meeting, that the proofs of the Linnean Journal were not sent to Wallace before
publication, and that the Darwin–Wallace theory of evolution by natural selection
rather soon afterwards became attributed solely to Darwin. Davies (2008, 2012,
2013) highlights the clear primacy of Wallace’s understanding of the mechanisms
of divergence, speciation, and selection. It should also be stressed that although the
Darwin–Wallace Theory is mentioned five times in the First Edition of Darwin’s
Origin of Species (Darwin 1859a, b), “My theory” gets 57 entries (Elin Rhys,
personal communication). There was only one belated specific reference to Wallace, on p. 484–5 in the concluding passage of the 2nd Edition (p. 754 in the
Peckham edn.). There were many predecessors, and no specific references or
acknowledgements were made to any of those who had contributed over the years
to various aspects of the eventual synthesis (from Aristotle to Erasmus Darwin,
Edward Blyth (Eiseley 1979, 2009), Robert Chambers, and Patrick Matthew (the
first to write about ‘natural means of selection’) (Stott 2012).
During his 8 years and over 60 voyages from 1854 to 1862 in the Malayan
Archipelago, Wallace (1869, 1890) had collected and later described thousands of
specimens (e.g. 212 new bird species, i.e. 2 % of all the 10,000 bird species now
known). He had travelled from the Indo-Malay islands (Singapore to Malacca,
Borneo, Java, Sumatra) to the Timor group (Bali, Lombock, Timor), the Celebes
group (Celebes, Macassar, Menado), the Moluccas (Banda, Amboyna, Gilolo, the
Kaióa Islands, Bouru), and the Papuan group (Ké, Aru, New Guinea, Waigiou, and
Ternate), altogether more than 14,000 miles.
On a mountain in Java, Wallace wrote in the ‘Malay Archipelago’:
“It is between 2,000 and 5,000 feet that these forests and ravines exhibit the utmost
development of tropical luxuriance and beauty. The abundance of noble Tree-ferns,
sometimes fifty feet high, contributes greatly to the general effect, since of all the forms
of tropical vegetation they are certainly the most striking and beautiful”. . .
“The splendid foliage of the broad-leaved Musaceae and Zingiberaceae, with their
curious and brilliant flowers, and the elegant and varied forms of plants allied to Begonia
and Melastoma, continually attract the attention in this region. Filling up the spaces
between the trees and larger plants on every trunk and stump and branch, are hosts of
Orchids, Ferns and Lycopods which wave and hang and intertwine in ever-ending complexity. At about 5,000 feet I first saw horsetails (Equisetum) very like our own species. At
6,000 feet, Rasberries abound, and thence to the summit of the mountain there are three
species of eatable Rubus. At 7,000 feet Cypresses appear, and forest trees become reduced
in size, and more covered iwith mosses and lichens. From this point upward these rapidly
Alfred Russel Wallace: Self-Educated Genius and Polymath
59
increase, soon the blocks of rock and scoria that form the mountain slope are completely
hidden in a mossy vegetation. At about 8,000 feet European forms of plant become
abundant. Several species of honeysuckle, St. John’s wort, and Gelder-rose abound, and
at about 9,000 feet we first meet with the rare and beautiful Royal Cowslip (Primula
imperialis) which is said to be found nowhere else in the world but on this solitary mountain
summit.”. . .
These extensive expeditions with their intensive prodigious collecting work
were all meticulously detailed with pencilled sketches and notes in careful handwriting in his field notebooks. His superb observational skills enabled Wallace to
propose the boundary between the Oriental and Australian faunal regions, known
ever since as the “Wallace Line” (Fig. 7a). Although not the first to address the
question of the factors that determine the distribution of animals:
“An important problem in Natural history, and one that hitherto has been to too little
agitated, is that of ascertaining the most natural primary divisions of the earth’s surface,
taking the amount of similarity or dissimilarity of organised life solely as our guide.”. . ..
(Sclater 1858),
and one of several who had suggested the demarcation of a Eurasian/Australasian
boundary, it was however Wallace who exactly defined and redefined its location
(Fig. 7b). His proposals still stand, although many investigations highlight differences between different species with respect to their ability to traverse natural
barriers. Not until Wegner’s hypothesis of continental drift of 1910 was superseded
in 1959 by the momentous discovery of plate tectonics, could it be fully realised
that the deep chasm separating Lombok and Bali has an enormously significant
geophysical explanation. Wallace was later (1876) to lay the foundations of a whole
field of investigation on the worldwide distribution of animals and to propose the
major sub-continental divisions referred to as ‘Wallaces’s realms’ (Fig. 8).
Wallace’s description of the flora in these islands (Figs. 9 and 10) could hardly
be bettered today: in 1861 in a letter to his sister, Fanny, he wrote:
The highest peak is an extinct volcano with the crater nearly filled up forming merely a
saucer on the top, in which is a good house built by the government for the old Dutch
naturalist who surveyed & explored the mountain. There are a lot of strawberries planted
there, wh.[ich] do very well but there were not many ripe. The common weeds & plants of
the top were very like English ones such as buttercups, cow-thistle, plantain, wormwood,
chickweed, charlock, St. John’s wort, violets & many others, all closely allied to our
common plants of those names but of distinct species. There was also a honeysuckle & a
tall & very pretty kind of cowslip. None of these are found in the low tropical lands & most
of them only on the tops of these high mountains. Mr. Darwin supposed them to have come
there during a glacial or very cold period when they could have spread over the tropics & as
the heat increased, gradually rose up the mountains. They were as you may [written
vertically at the left hand side of the page] I also visited a semi-active volcano close by
continually sending out steam with a noise like a blast furnace - quite enough to give me a
conception of all other descriptions of volcanoes. Imagine most interesting to me, & I am
very glad that I have ascended one lofty mountain in the tropics, though I had miserable wet
weather & had no view, owing to constant clouds & mist.
The lower parts of the mountains of Java from 3000 to 6000 ft. have the most beautiful
tropical vegetation I have ever seen. Abundance of splendid tree ferns, some 50 feet high, &
some hundreds of varieties of other ferns, - beautiful leaved plants as Begonias Melastomas
60
D. Lloyd
Fig. 7 (a) The Wallace Line (s). (b) Wallace defined and redefined the demarcation between the
Eurasian and Australasian fauna, and was not the only one to be astonished that a 25 mile channel
could mark such an enormous faunal divide. Continental drift and plate techtonics now provide the
explanation
Alfred Russel Wallace: Self-Educated Genius and Polymath
61
Fig. 8 Wallace’s realms: this example is just one map of the great overall partitioning in faunal
distributions over the whole world
& many others & more flowers than are generally seen in the tropics. In fact this region
exhibits all the beauty the tropics can produce, but still I consider & will always maintain
that our own meadows & woods & mountains are more beautiful. Our own weeds &
wayside flowers are far prettier & more varied that those of the tropics. It is only the great
62
D. Lloyd
Fig. 9 A clearing in the Rain forest at Tenggarong in Borneo (painting by Wallace)
leaves & the curious looking plants & the deep gloom of the forests, & the mass of tangled
vegetation, that astonishes & delights Europeans, & it is certainly grand & interesting & is a
certain sense beautiful:- but not the calm sweet warm beauty of our own flowers, - a field of
buttercups, a hill of gorse, or of heath, a bank of foxgloves & a hedge of wild roses & purple
vetches surpass in beauty any thing I have ever seen in the tropics. - This is a fantastic
subject with me but I can not go into it now.
Alfred Russel Wallace: Self-Educated Genius and Polymath
Fig. 10 Some Australasian
plants (a) Hibiscus, possibly
H. rosa-sinensis.
(b) Medinilla myriantha.
(c) Carludovica palmata.
(d) Acalypha hispida.
(e, f) Cycas seemannii.
(g) Cymbidium bicolour.
(Images by Elin Rhys and
Ffion Rees; assignments by
Lara Jewittt, William
Baker, Silke Roch. Courtesy
of Dr. Rhian Smith and the
Royal Botanic Gardens,
Kew)
63
64
D. Lloyd
With the help of Ali (Fig. 5b), his local guide and expert in the ways of the
islanders, he collected a huge total of specimens, many of which he sent to his
agent, Mr. Stevens, for sale back in London, and the rest he had transported home
with him. These totalled 125,660 items, and included 83,200 beetles, 8,050 birds,
13,100 lepidoptera, 13,400 other insects, 7,500 shells, 310 mammals (among those
7 complete hides of orang-utans), and 100 reptiles (Wallace 1869; Fichmann 2004).
Of over 5,000 new species Wallace described, 200 bear his name.
In a letter (dated January 4, 1858) replying to one received from Bates the
previous summer, Wallace wrote:
To persons who have not thought much on the subject I fear my paper on the ‘Succession of
Species’ will not appear so clear as it does to you. That paper is, of course, merely the
announcement of the theory, not its development. I have prepared the plan and written
portions of a work embracing the whole subject, and have endeavoured to prove in detail
what I have as yet only indicated. I have been much gratified by a letter from Darwin, in
which he says that he agrees with ‘almost every word’ of my paper. He is now preparing his
great work on ‘Species and Varieties’, for which he has been collecting materials for twenty
years. He may save me the trouble of writing more on my hypothesis, by proving that there
is no difference in nature between the origin of species and of varieties; or he may give me
trouble by arriving at another conclusion; but, at all events, his facts will be given for me to
work upon. Your collections and my own will furnish most valuable material to illustrate
and prove the universal applicability of the hypothesis. The connection between the
succession of affinities and the geographical distribution of a group, worked out species
by species, has never yet been shown as we shall be able to show it.
He also wrote of the work,
I hoped to do myself in describing, cataloguing, and working out the distribution of my
insects. I had in fact been bitten by the passion for species and their description and if
neither Darwin nor myself had hit upon “Natural Selection,” I might have spent the best
years of my life in this comparatively profitless work. But the new ideas swept all this away.
I have for the most part left others to describe my discoveries, and have devoted myself to
the great generalizations which the laborious work of species-describers had rendered
possible.
Wallace wrote again to Bates from Ternate on December 24, 1860,
I know not how, or to whom, to express fully my admiration of Darwin’s book. To him it
would seem flattery, to others self-praise; but I do honestly believe that with however much
patience I had worked and experimented on the subject, I could never have approached the
completeness of his book, its vast accumulation of evidence, its overwhelming argument,
and its admirable tone and spirit. I really feel thankful that it has not been left to me to give
the theory to the world. Mr Darwin has created a new science and a new philosophy; and I
believe that never has such a complete illustration of a new branch of human knowledge
been due to the labours and researches of a single man. Never have such vast masses of
widely scattered and hitherto quite unconnected facts been combined into a system and
brought to bear upon the establishment of such a grand and new and simple philosophy.
Singapore, January 20, 1862.
I cannot write more now. I do not know how long I shall be here; perhaps a month. Then,
ho! For England!
Then in ‘My Life’, he writes in 1982,
Alfred Russel Wallace: Self-Educated Genius and Polymath
65
While waiting at Singapore for a steamer to take me home I purchased two living specimens
of the smaller bird of paradise. They were in a large cage, and the price asked was
enormous. As they had never been seen alive in Europe I at once secured them, and had
a great deal of trouble with them on my journey home.
Passing through France it was a sharp frost, but they did not seem to suffer; and when we
reached London I was glad to transfer them into the care of Mr. Bartlett, who conveyed
them to the Zoological Gardens. . .. Thus ended my Malayan travels.
5 Home Again at Last
Wallace, still the rather shy, polite, modest, and reclusive person having been
brought up to show older people respect, and to speak only when spoken to, always
maintained a friendly and deferential attitude to Darwin, 15 years his senior.
Despite holding him somewhat in awe, Wallace’s ideas eventually departed markedly and enhanced those of the older man. In correspondence between them,
Wallace writes,
was always cordial, sympathetic and broad minded . . .. In 1870 he had written to me:
“I hope it is a satisfaction to you to reflect – and very few things in my life have ever
been more satisfactory to me – that we have never felt any jealousy towards each other,
though in some sense rivals.”
And again Wallace adds:
This friendly feeling was retained by him to the last, and to have thus inspired and retained
it, not with standing our many differences of opinion, I feel to be one of the greatest honours
of my life.
Four points of difference between their two final positions may be outlined:
1. Wallace believed that “some agency other than natural selection, and analogous
to that which first produced organic life, had brought into being (man’s) moral
and intellectual qualities.”
2. The bright colours or ornaments of males had not arisen by selection through
female choice as Darwin had suggested, but by independent action of natural
selection on each of the two sexes. The females being often more exposed to
danger than the males (as in the case of sitting birds) had acquired more subdued
coloration, whilst the males had remained bright and comparatively
conspicuous.
3. From a study of oceanic islands Wallace concluded that mountain flora had been
derived by transmission of seeds by birds or wind, rather than as a result of
climate change.
4. Whereas Darwin always believed in the inheritance of acquired characteristics,
Wallace was persuaded by the researches of Galton and Weismann that this was
not the case.
It will thus appear that none of my differences of opinion from Darwin imply any real
divergence as to the overwhelming importance of the great principle of natural selection,
while in several directions I believe that I have extended and strengthened it. The principle
66
D. Lloyd
of “utility”, which is one of its chief foundation-stones, I have always advocated unreservedly; while in extending this principle to almost every kind and degree of coloration, and in
maintaining the power of natural selection to increase the infertility of hybrid unions, I have
considerably extended its range. Hence it is that some of my critics declare that I am more
Darwinian than Darwin himself, and in this, I admit, they are not far wrong.
His humble childhood, impecunious condition for most of his life, and his lack of
tenured position, even in his mature years and despite a number of job applications,
made him sympathetic to the uncertain lives of the vast majority in Victorian and
Edwardian times in England. With his Civil List pension he could for the first time
relax somewhat about his own financial state. He was still very active lecturing in
the 1880s and 1890s throughout the country. In 1886/1887 he completed an arduous
6,000 mile 10-month lecture tour of the United States:
Mr. A.R. Wallace’s lectures on Natural History
1. The Darwinian Theory Darwinism, what it is, and how it has been demonstrated.
(Illustrated by Diagrams)
2. The Origin and Uses of the Colours of Animals (Illustrated by coloured Stereopticon views)
3. Mimicry and other exceptional modes of Animal Colouration. . . (Stereopticon
pictures)
4. The Origin and Uses of the Colours of Plants. (Stereopticon)
5. The Permanence of the Oceans and the relations of Islands and Continents (Maps
and diagrams)
6. Oceanic Islands and their Biological History. (Maps)
7. Continental Islands, their past history and Biological relations. (Maps)
8. The Physical and Biological relations of New Zealand and Australia. (Maps)
He continued publishing well into his 90th year (Wallace 1913a, b). In old age he
enjoyed laying out and cultivating his garden (Figs. 11 and 12) and the joys of
family life. Eventually tiring of London he moved several times through the homecounties, and finally to Broadstone in Dorset, where he passed away and is buried.
He wrote more than 800 papers and 22 books. Not until 1893, when he was 70 was
he proposed for Fellowship of the Royal Society, but seemed reluctant to accept:
I have done so little of what is usually considered scientific work,
although, in 1868, he had already been honoured by its Royal Medal, and in 1890 its
(first awarded) Darwin Medal. The Copley Medal followed in 1908, and in the same
year the Linnean Society honoured him with its Darwin–Wallace medal. The
greatest honour the Nation could bestow, the Order of Merit of the British Empire
came also in 1908. In total he received more than 20 awards. Thus, although
recognised as one of the most distinguished scientists in the world at the time of
death in 1913, his huge achievements were soon forgotten, partly due to his
subservient attitude and deference to Darwin throughout, and his reticence and
modesty. Now, in his post-centenary year it is an appropriate occasion to reassess
his scientific legacy.
Alfred Russel Wallace: Self-Educated Genius and Polymath
67
Fig. 11 Wallace in his
garden at Broadstone
standing next to a fully
blooming King’s spear plant
in 1905, the year his
2-volume My Life was
published (Courtesy of
Richard Milner, Gareth
Nelson and Michael
Shermer)
6 A Century of Progress
After 1880 Wallace wrote very little on science or natural history, except for
retrospective reviews and reassessments of his earlier contributions (Wallace
1858, 1876, 1880) in the light of more recent discoveries (Wallace 1889, 1898).
He lectured extensively at home and in the United States. The clarity, depth,
breadth, and far-reaching power of his curiosity and intuition come through very
clearly in these presentations and publications. The truly extraordinary scope of his
experience in field collecting and the popularity of his works are reflected in the
multiple editions of his major successes. His “Malay Archipelago” is the most
published travel book ever, and has never been out of print. His prodigious output
still holds many lessons for the modern world of sociology, natural history, and
science. He is the widely acclaimed father of biogeography (Michaux 2008), the
first neo-Darwinist (Kutschera and Niklas 2004; Kutschera and Briggs 2009) and an
early anthropologist and ethno-geographer. Wallace can also be regarded as the
father of astrobiology. Kutschera (2013) furthermore points out that “this unselfish
68
D. Lloyd
Fig. 12 Wallace in
later life
man in the shadow of Darwin” (Kutschera and Hossfield 2013) was one of the first
to abhor “the plunder of the earth” by the “struggle for wealth” (Wallace 1898) by
uncaring humans.
He dared to question the assumptions and unfairness of the Victorian attitudes to
privilege and class, and was completely against free-enterprise capitalism. He
became increasingly concerned about the aggressively competitive, crude, and
over-simplistic social interpretations of “Darwinism.” His main interest was in
land reform, as the laws of those times favoured only the rich landowners. His
wide-ranging curiosity led him into activities and involvement with controversial
topics. Some of these were clearly mistaken but totally understandable for someone
with an inquiring mind and no formal education to speak of (anti-vaccination,
phrenology, and spiritualism), but others (mesmerism and the possible existence
of extra-terrestrial life) are even now still the subjects of great scientific endeavour.
Hypnotherapy and cognitive psychotherapy are beneficial remedies for depressive
symptoms and anxiety states, often as effective as medical treatment. What would
Wallace have made of the current burgeoning technology that enables us to trace
‘brainwaves’ as encephalographic traces of neuronal electrical activity in 128 channels, of magnetic resonance imaging of the three dimensional ultrastructure of brain
activity in vivo. . .or of deep magnetic stimulation techniques that benefit the brain
or vagus nerve? These developments in the biomedical sciences advance in parallel
with molecular studies on intracellular structure and function to provide novel
treatments in the clinic.
Ecology has also been revolutionised by modern continuous non-invasive
methods of investigation, especially by the availability of rapidly responding and
Alfred Russel Wallace: Self-Educated Genius and Polymath
69
specific sensors, and the ease of automated data collection. For instance, subsurface
methane profiles and gas emissions from wetlands and soils are monitored directly
by mass spectrometry probes (Lloyd et al. 2002; Beckmann et al. 2004), and
photosynthetic activities measured with high spatial and temporal resolution.
Performed at various levels in the tropical canopy, studies for over several months
using arrays of small light sensors enabled the conclusion that actual photosynthesis
of tropical epiphytes was determined by the specific and fluctuating light conditions
of their microhabitat and cannot be ascribed to light-adapted ancestors (Rascher
et al. 2012).
The ideas of Malthus as expanded by Wallace on the checks and balances in
population biology presaged the mathematical theories that underlie oscillatory
dynamics (Lotka 1924, 1956). The control of populations by feedback was likened
by Wallace to the action of the ‘governor’ of a steam engine which swings in and
out as it controls and steadies the rotational speed of the driving shaft. Novel
mathematical and physical principles applied to machines, electronic circuits, as
well as metabolic and signalling networks (Thellier and Lüttge 2013; Murray
et al. 2013) are now widely employed in understanding the complexity and coherence of living cells and organisms (Lüttge and Beck 1992; Lloyd 2009) as well as
the dynamics of populations. Realisation that biological complexity can be
explained strictly in terms of physico-chemical mechanisms would really excite
Wallace. The vast information storage inherent in the simplest organism and the
mode of its transmission down the generations would enable him to understand
many of the unsolved aspects of biology in his lifetime.
We thus find that Darwinian theory, even when carried out to its extreme logical conclusion, not only does not oppose, but lends a decided support to, a belief in the spiritual nature
of man.
It shows us how man’s body may have been developed from that of a lower animal form
under the law of natural selection; but it also teaches us that we possess intellectual and
moral facilities which could not have been so developed but must have another origin, and
for this origin we can only find an adequate cause in the unseen universe of Spirit.
We now see that Wallace partially and intuitively realised (so much more clearly
than Darwin) that:
‘natural selection is not the all-powerful, all-sufficient and only cause of the development of
organic forms’. . .
The progress of many aspects of evolutionary theory has been delayed as a
consequence of the slow appreciation of the details of Wallaceism. The higher
cognitive functions are not bestowed by a supra-vital force or principle. Even these
functions will eventually become explicable in terms of energy fluxes through open
systems so as to allow the emergence of collective properties that are more than the
sum of their constituent parts (Lloyd 2009; Lüttge 2012). Oscillatory non-linear
behaviour in multiple dimensions can give rise to concentration gradients, controllable chaos, symmetry breaking, and pattern formation in space and time. It is these
agencies that explain the generation of increasing complexity in living systems, and
it is these discoveries that illuminate the post-Wallace science.
70
D. Lloyd
Thus Wallace (2013) has pointed out that there are two major inconsistencies in
the neo-Darwinian theory, i.e. that random chromosomal mutations acted upon by
natural selection generate new species. Yet natural selection does not depend on
increasing complexity, although complexity is a signature of life. Furthermore,
human chromosomal DNA sequence variation is either neutral or deleterious, so is
insufficient to introduce the variation adequate to explain either speciation or
predilection to many common human diseases. It is the ovarian selection mechanism that removes deleterious mutations rapidly generated in the multiple copies of
mitochondrial DNA, so that it is only maternally inherited subtle mutations in
energy metabolism that are becoming continuously introduced into the species.
Thereby this process allows adaptation to regional environmental differences and
permits animals to inhabit harsher niches (faster intra-specific variation). There, the
more rare nuclear mutations can accumulate, and give rise to slower processes of
speciation.
The comparative genomics of microorganisms and viruses (Koonin and Wolf
2012) has revealed mechanisms that lie outside not only the neo-Darwinist refinements of the earlier half of the twentieth century (Dobzhanski 1937; Huxley 1942),
but even those being uncovered daily in studies of human genetics. Mutational
change is far from random, it often occurs by large-scale increments, natural
selection is not the only filtering event, and lateral gene transfer is extremely
common. The “Tree of Life” has to be replaced by a rhizome (Raoult 2010; Merhej
and Raoult 2012).
From the molecular to the cosmic, and within a century, the bounds of our senses
have been extended from the subatomic (large Hadron Collider) and submolecular
(X-ray crystallography), to the limits of our Universe (X-ray astronomy), and the
speed and facility for communication (world wide web).
7 Eclipse, Reassessment, and Overdue Reappraisal
The contributions of Wallace’s genius to Darwin’s understanding and written
contributions have not only been considerably underestimated, but essentially
ignored: McKinney (1966), Beddall (1968), Eiseley (1979, 2009), Brackman
(1980), Ospovat (1981), Brooks (1984), Bulmer (2005), Poulton (1913), Marchant
(1916), Darlington (1959), Shermer (2002), James (2008), Lloyd et al. (2010), and
Kutschera and Nicklas (2013), as well as the many contributors to the fascinating
edited volume by Smith and Beccaloni (2008), and that recently available from
Glaubrecht (2013), have all contributed to redress this balance.
Most recently Roy Davies, a highly experienced and extremely well-regarded
freelance investigative journalist, with a formidable portfolio of historical documentaries for the British Broadcasting Corporation, has summarised 18 years of
painstaking work in this field. This research indicates the unfair treatment that has
progressively relegated Wallace to second place (Davies 2008, 2012, 2013). Thus
Alfred Russel Wallace: Self-Educated Genius and Polymath
71
the Darwin–Wallace theory of natural selection became the Darwin theory, and
shortly after Alfred’s death his key role has all but become completely forgotten. In
this centenary year of the death of Wallace, worldwide acclaim has been renewed,
but hardly on the scale of the 200th anniversary of Darwin’s birth and the 150th of
the publication of Origin of Species in 2009 (Beccaloni and Smith 2008). As
pointed out by Pattison (2009) Darwin’s ‘extraordinary ancestors, economic
advantage1, a commitment to learning and a desire to serve others were all part
of his inheritance and upbringing’.
Despite opposition from Van Wyhe and Rookmaaker (2012), Davies (2012,
2013) continues to accumulate new details bearing on the precisely controlled
and documented voyages between the Malayan Archipelago and the English
docks, and the postal service between the English ports of arrival and Darwin’s
residence at Down House, in the village of Downe, in rural Kent. Details of the
exact timing of the postal service with Wallace’s Ternate letter are so essential in
the debate about Darwin’s possible plagiarism of Wallace. Further scrutiny and
insightful literary searches indicate the entrenched errors of conventional opinions
(Glaubrecht 2013). The inescapable conclusion is that if Wallace had not attempted
to evoke the approval of his hero, but instead had submitted his theory directly to a
journal as sole author, it would not be Darwin but Alfred Russel Wallace who
would now be rightly celebrated for our understanding of divergence, speciation,
and natural selection (Glaubrecht 2013).
“The first and wisest of them all professed
To know this only, that he nothing knew”
John Milton: Paradise Regained (1671)
Acknowledgements David Lloyd wishes to thank Professor Dr. Ulrich Lüttge and Dr. John C
Cushman for their interest and encouragement, Roy Davies and Dr. W Alfred Venables for useful
criticism, Dr John G Wilson for permission to reproduce his maps, Elin Rhys and Ffion Rees for
images, and Drusilla Lewis for secretarial help.
References
Beccaloni GW, Smith VS (2008) Celebrations for Darwin downplay Wallace’s role. Nature
45:1050
Beckmann M, Sheppard SK, Lloyd D (2004) Mass spectrometric monitoring of gas dynamics in
peat monoliths: effect of temperature and diurnal cycles on emissions. Atmos Environ
38:6907–6913
Beddall BG (1968) Wallace, Darwin and the theory of natural selection: a study in the development of ideas and attitudes. J Hist Biol 1:261–324
Brackman AC (1980) A delicate arrangement: the strange case of Charles Darwin and Alfred
Russel Wallace. Times Books, New York
1
In August 2010 the estate values were disclosed as Darwin £146,191 in 1882 (worth more than £6
million today), and Wallace £5,023 in 1913.
72
D. Lloyd
Brooks JL (1984) Just before the origin: Alfred Russel Wallace’s theory of evolution. Columbia
University, New York
Bulmer M (2005) The theory of natural selection of Alfred Russell Wallace FRS. Notes Rec R Soc
(Lond) 59:126–136
Chambers R (1844) Vestiges of the natural history of creation. John Churchill, London
Claridge M (2008) Alfred Russel Wallace—a Welsh entomologist! In: Gardinier B, Milner R,
Morris M (eds) The Linnean Society. Special Issue No 9: survival of the fittest. The Linnean
Society, London, pp 17–24
Darlington CD (1959) Darwin’s place in history. Blackwell, Oxford
Darwin C (1859a) On the origin of species. Murray, London
Darwin C (1859b) On the origin of species by means of natural selection, or the preservation of the
favoured races in the struggle for life. John Murray, London
Darwin F (1888) The life and letters of Charles Darwin, 3 vols. John Murray, London
Davies R (2008) The Darwin conspiracy: origins of a scientific crime. Golden Square Books,
London
Davies R (2012) How Charles Darwin received Wallace’s Ternate paper 15 days earlier than he
claimed: a comment on van Wyhe and Rookmaaker (2012). Biol J Linn Soc Lond 105:472–477
Davies R (2013) 1 July 1858: what Wallace knew; what Lyell thought he knew; what both he and
Hooker took on trust; and what Charles Darwin never told them. Biol J Linn Soc Lond
109:725–736
Dobzhanski T (1937) Genetics and the origin of species. Columbia University Press, New York
Eiseley LC (1979) Darwin and the mysterious Mr. X: new light on the evolutionists. J M. Dent,
London
Eiseley LC (2009) Darwin’s century: evolution and the men who discovered it. Barnes and Noble,
New York (reprint of the first edition of 1958)
Fichmann M (2004) An elusive victorian: the evolution of Alfred Russel Wallace. Chicago
University, Chicago, IL
Glaubrecht M (2013) Am Ende de Archipels: Alfred Russel Wallace. Galian Verlag, Berlin
Hughes RE (1989) Alfred Russell Wallace: some notes on the Welsh connection. Br J Hist Sci
22:401–418
Hughes RE (1991) Alfred Russell Wallace (1823-1913): the making of a scientific non-conformist.
Proc Roy Inst 63:175–183
Hughes RE (1997) Alfred Russel Wallace: Gwyddonydd Anwyddonol, Gwasg Prifysgol Cymru,
Caerdydd CF10 4UP Wales
Huxley JS (1942) Evolution the modern synthesis. Allen and Unwin, London
James K (2008). http://blog.hmsbeagleproject.org/2008/07/guest-post-by-wallaces-rottweiler-on.
html
Knapp S (2013) Alfred Russel Wallace in the Amazon: footsteps in the forest. The Natural History
Museum, London
Koonin EV, Wolf YI (2012) Evolution in of microbes and viruses: a paradigm shift in evolutionary
biology? Front Cell Infect Microbiol 2:119
Kutschera U (2013) The age of man: a father figure. Science 340:1287
Kutschera U, Briggs WR (2009) From Charles Darwin’s botanical country-house studies to
modern plant biology. Plant Biol (Stuttg) 11:785–795
Kutschera U, Hossfield U (2013) Alfred Russel Wallace (1823-1913): the forgotten co-founder of
the new-Darwinian theory of biological evolution. Theory Biosci 132:207–214
Kutschera U, Niklas KJ (2004) The modern theory of biological evolution: an expanded synthesis.
Naturwissenschaften 91:255–276
Kutschera U, Niklas KJ (2013) Metabolic scaling theory in plant biology and the three oxygen
paradoxa of aerobic life. Theory Biosci 132:277–288
Lloyd D (2009) Oscillations, synchrony and deterministic chaos. Prog Bot 70:69–91
Alfred Russel Wallace: Self-Educated Genius and Polymath
73
Lloyd D, Thomas KL, Cowie G, Tammam JD, Williams AG (2002) Direct interface of chemistry
to microbiological systems using membrane inlet mass spectrometry. J Microbiol Methods
48:289–302
Lloyd D, Wimpenny J, Venables A (2010) Alfred Russel Wallace deserves better. J Biosci
35:339–349
Lotka AJ (1924, 1956) Elements of physical biology mathematical biology. Williams & Wilkins/
Dover, New York
Lüttge U (2012) Modularity and Emergence: biology’s challenge in understanding life. Plant Biol
(Stuttg) 14:865–871
Lüttge U, Beck F (1992) Endogenous rhythms and chaos in crassulacean acid metabolism. Planta
188:26–38
Marchant J (1916) Alfred Russel Wallace: letters and reminiscences, 2 vols. Cassell & Co, London
McKinney HL (1966) Alfred Russel Wallace and the discovery of natural selection. J Hist Med
Allied Sci 21:333–357
Merhej V, Raoult D (2012) Rhizome of life, catastrophes, sequence exchanges, gene creations, and
giant viruses: how microbial genomics challenges Darwin. Front Cell Infect Microbiol 2
(113):1–16
Michaux B (2008) Alfred Russel Wallace, Biogeographer. In: Smith CH, Beccaloni G (eds)
Natural selection and beyond: the intellectual legacy of Alfred Russel Wallace. Oxford
University Press, Oxford
Murray DB, Amariei C, Sasidharan K, Machné R, Aon MA, Lloyd D (2013) Temporal partitioning
of the yeast cellular network. In: Aon MA, Saks V, Schlattner U (eds) Systems biology of
metabolic and signaling networks: energy, mass and information transfer, 16th edn, Springer
series in biophysics. Springer, Heidelberg, pp 323–350
Ospovat D (1981) The development of Darwin’s theory: natural history, natural theology, and
natural selection, 1838-1859. Cambridge University Press, Cambridge
Pattison A (2009) The Darwins of Shrewsbury. The History Press, Stroud
Poulton EB (1913) Obituary: Alfred Russel Wallace. Nature 92:347
Raby P (2001) Alfred Russel Wallace a life. Chatto & Windus, London
Raoult D (2010) The post-Darwinist rhizome of life. Lancet 375:104–105
Rascher U, Freiberg M, Lüttge U (2012) Functional diversity of photosynthetic light use of
16 vascular epiphyte species under fluctuating light irradiance in the canopy of a giant Virola
michelii (Myristicaceae) tree in The tropical lowland forest of French Guyana. Front Plant Sci
(2012) 2:117. doi:10.3389/fpls.2011.00117.eCollection 2011
Sclater PL (1858) On the general geographical distribution of the members of the class Aves. J
Proc Linn Soc Zool 2:130–137
Shermer M (2002) In Darwin’s shadow: the Life and science of Alfred Russel Wallace, A
biographical study on the psychology of history. Oxford University Press, Oxford
Smith CH, Beccaloni G (2008) Natural selection and beyond: the intellectual legacy of Alfred
Russel Wallace. Oxford University Press, Oxford
Stott R (2012) Darwin’s ghosts: in search of the first evolutionists. Bloomsbury Publishing,
London
Thellier M, Lüttge U (2013) Plant memory: a tentative model. Plant Biol (Stuttg) 15:1–12
Van Wyhe J, Rookmaaker K (2012) A new theory to explain the receipt of Wallace’s Ternate
essay by Darwin in 1858. Biol J Linn Soc 105:249–252
Wallace AR (1853a) Palm trees of the amazon and their uses. John Van Voorst, London
Wallace AR (1853b). A narrative of travels on the Amazon and Rio Negro, with an account of the
native tribes, and observations on the climate, geology, and natural history of the amazon
valley, 2nd edn. (1889) Reeve & Co, London
Wallace AR (1855) On the law that has regulated the introduction of a new species. Ann Mag Nat
Hist 16:184–196
Wallace AR (1858) Note on the theory of permanent and geographical varieties. The Zool
16:5887–5888
74
D. Lloyd
Wallace AR (1862, 1910) My life: a record of event and opinions. Chapman & Hall, London
Wallace AR (1869). The Malay Archipelago; the land of the orang-utan and the bird of paradise; a
narrative of travel with studies of man and nature. Vols. 1 and 2, 10th edn. (1891) Macmillan &
Co, London
Wallace AR (1876) The geographical distribution of animals, with a study of the relations of living
and extinct faunas as elucidating the past changes of the earth’s surface, 2 vol. Macmillan,
London
Wallace AR (1880) Island Life: or, the phenomena and causes of insular faunas and floras,
including a revision and attempted solution of the problem of geological climates, 3rd edn.
(1902) Macmillan & Co, London
Wallace AR (1882) Land nationalization; its necessity and its aims; being a comparison of the
system of landlord and tenant with that of occupying ownership in their influence of the wellbeing of the people, 3rd edn. (1883) Trübner & Co, London
Wallace AR (1889) Darwinism; an exposition of the theory of natural selection with some of its
applications, 3rd edn. (1905) Macmillan &Co, London
Wallace AR (1898) The wonderful century: its successes and failures, 7th edn (1908) Swan
Sonnenschein, London
Wallace AR (1905) My life: a record of events and opinions, vol 1 and 2. Chapman & Hall,
London
Wallace AR (1910) The world of life: a manifestation of creative power, directive, mind and
ultimate purpose, 5th edn. (1911) Chapman and Hall, London
Wallace AR (1913a) Social environment and moral progress. Cassell and Company Ltd, London
Wallace AR (1913b) The revolt of democracy. Cassell and Company Ltd, London
Wallace DC (2013) Bioenergetics in human evolution and disease: implications for the origins of
biological complexity and the missing genetic variation of common diseases. Philos R Trans
Soc Lond B Biol Sci 368:20120267. doi:10.1098/rstb.2012.0267.Print 2013
Wilson JG (2000) The forgotten naturalist: in search of Alfred Russel Wallace. Australian
Scholarly Publishing Pty Ltd, Kew, VIC
Part II
Physiology
The Role of Plasma Membrane H+-ATPase
in Salinity Stress of Plants
Małgorzata Janicka-Russak and Katarzyna Kabała
Contents
1 Introduction . . . . . . . . . . . . . . . . . . . . . . . . . . . . . . . . . . . . . . . . . . . . . . . . . . . . . . . . . . . . . . . . . . . . . . . . . . . . . . . . . . .
2 Regulation of Plant Plasma Membrane H+-ATPase Activity . . . . . . . . . . . . . . . . . . . . . . . . . . . . . . .
3 PM-H+-ATPase in Salt Stress Conditions . . . . . . . . . . . . . . . . . . . . . . . . . . . . . . . . . . . . . . . . . . . . . . . . . . .
4 SOS Signaling Pathway . . . . . . . . . . . . . . . . . . . . . . . . . . . . . . . . . . . . . . . . . . . . . . . . . . . . . . . . . . . . . . . . . . . . . .
5 Conclusion . . . . . . . . . . . . . . . . . . . . . . . . . . . . . . . . . . . . . . . . . . . . . . . . . . . . . . . . . . . . . . . . . . . . . . . . . . . . . . . . . . . .
References . . . . . . . . . . . . . . . . . . . . . . . . . . . . . . . . . . . . . . . . . . . . . . . . . . . . . . . . . . . . . . . . . . . . . . . . . . . . . . . . . . . . . . . .
78
79
80
84
86
87
Abstract Plants have always been exposed to various stress factors in wild conditions. A high concentration of salt in the soil, i.e., salt stress, is one of the
stressogenic stimuli. Salt stress is a complex abiotic stress in which both ionic
and osmotic components are involved. Most plants adapted to salinity maintain a
relatively low concentration of Na+ in the cytosol achieved through the active
exclusion of sodium ions in the apoplast and vacuole. Removal of sodium ions
out of the cell, catalyzed by the specific plasma membrane Na+/H+ antiporter,
depends on the electrochemical membrane proton gradient. The only pump which
generates an electrochemical proton gradient across the plasma membrane is H+ATPase. For this reason, it is believed that plant plasma membrane H+-ATPase
(PM H+-ATPase) plays a major role in salt stress tolerance.
M. Janicka-Russak (*) • K. Kabała
Department of Plant Molecular Physiology, Institute of Experimental Biology, Wrocław
University, ul. Kanonia 6/8, 50-328, Wrocław, Poland
e-mail: malgorzata.janicka@uni.wroc.pl; katarzyna.kabala@biol.uni.wroc.pl
© Springer International Publishing Switzerland 2015
U. Lüttge, W. Beyschlag (eds.), Progress in Botany, Progress in Botany 76,
DOI 10.1007/978-3-319-08807-5_3
77
78
M. Janicka-Russak and K. Kabała
1 Introduction
H+-ATPase is a major enzyme protein of the plant plasma membrane. This protein
belongs to a large superfamily of pumps termed P-type ATPases (Arango
et al. 2003). By the use of the chemical energy of ATP hydrolysis, PM H+-ATPase
extrudes protons from cells of plants to generate electrochemical proton gradients.
The enzyme is a functional single polypeptide chain with mass of about 100 kDa.
H+-ATPase has N- and C-terminal segments, which emerge into the cytoplasm
(Duby and Boutry 2009). The C-terminal fragment of the protein acts as an
autoinhibitory domain (Pedersen et al. 2007). The PM H+-ATPase is kept at a
low-activity level by its C-terminal domain, interacting with cytoplasmic domains
essential for the catalytic cycle (Speth et al. 2010). The catalytic cycle of H+ATPase is described by two main conformational states, E1 and E2. A hallmark of
P-ATPase is the formation of a phosphorylated intermediate during catalysis
(Buch-Pedersen et al. 2009). In the E1 conformation, the transmembrane binding
site has high affinity for the proton and for ATP, whereas in E2 the same site has low
affinity for both ligands but high affinity for inorganic phosphate. The states E1 and
E2 alternate during transport (Buch-Pedersen et al. 2009). The cytoplasmically
positioned domains are in charge of ATP hydrolysis. Conformational changes in
these domains during catalysis lead to simultaneous movements in the membraneembedded part that directs the proton transport. In PM H+-ATPases, a single proton
is believed to be transported per hydrolyzed ATP (Palmgren 2001). However,
partial uncoupling between ATP hydrolysis and proton transport has been
suggested (Buch-Pedersen et al. 2006). The PM H+-ATPase is stimulated by
potassium (Palmgren 2001). K+ is bound to the proton pump by Asp617 in cytoplasmic phosphorylation domain (P-domain). P-domain is located in the large loop,
corresponding to the phosphorylation domain, and contains the aspartate phosphorylated during the catalytic cycle (Buch-Pedersen et al. 2009). Binding of K+ promotes dephosphorylation of the phosphorylated E1P reaction cycle and it controls
the H+/ATP coupling ratio. It was suggested that potassium acts as an intrinsic
uncoupler of the plasma membrane H+-ATPase (Buch-Pedersen et al. 2006).
The generation of a proton gradient by PM H+-ATPase has a major role in
providing the energy for secondary active transport across the plasma membrane.
The PM H+-ATPase is a proton pump which plays a central role in physiological
functions such as nutrient uptake, intracellular pH regulation, stomatal opening, and
cell growth (Serrano 1990). Besides regulation of physiological processes, the
plasma membrane proton pump also plays a role in adaptation of plants to changing
conditions, especially stress conditions. Thus, H+-ATPase can be a common element for resistance mechanisms that are activated in various stress conditions.
Many studies have shown the changes of gene expression of the plasma membrane
H+-ATPase in response to a variety of environmental factors. Moreover, besides the
genetic regulation of the proton pump, its activity may undergo fast posttranslational modulation.
The Role of Plasma Membrane H+-ATPase in Salinity Stress of Plants
79
2 Regulation of Plant Plasma Membrane H+-ATPase
Activity
The molecular study of plant H+-ATPase has shown that this enzyme is encoded by
a multigene family. In Arabidopsis thaliana 12 genes have been identified (Palmgren 2001), in Oryza sativa 10 genes (Baxter et al. 2003), in Nicotiana
plumbaginifolia 9 genes (Ouffatole et al. 2000), and in Zea mays 4 genes (Santi
et al. 2003). The existence of multiple isoforms of the enzyme might indicate that
some pumps could be redundant. Moreover, isoform diversity may also be related
to cellular differentiation with individual isoforms exhibiting tissue- and
development-specific expression (Palmgren 2001). The existence of multiple
isoforms of the enzyme creates the possibility of their role in abiotic stress tolerance, particularly salt stress tolerance. Phylogenetic and gene structure analysis of
plant H+-ATPases divided them into five subfamilies (Arango et al. 2003). Expression of H+-ATPase subfamilies I and II is not restricted to particular organs. These
subfamilies are highly expressed in many cell types. Conversely, expression of
genes belonging to subfamilies III, IV, and V is limited to specific organs or cell
types (Arango et al. 2003). It has been shown that various genes are expressed in the
same organ. Moreover, even within the same cell type at the same developmental
stage, at least two H+-ATPase genes are expressed (Hentzen et al. 1996; Moriau
et al. 1999). In N. plumbaginifolia two different plasma membrane H+-ATPase
genes, PMA2 and PMA4, are expressed in guard cells (Moriau et al. 1999). This
observation suggests that isoforms with distinct kinetics, having slightly different
biochemical and regulatory properties, might coexist in the same cell.
In addition to tissue-specific expression, the plasma membrane H+-ATPases are
differentially expressed according to environmental factors. Several studies have
indicated that the H+-ATPase genes might be activated by various abiotic and biotic
stresses. With such a phenomenon the amount of H+-ATPase might be increased
under conditions requiring greater transport activity. The external signals which
result in changes in plant plasma membrane H+-ATPase gene expression include
salt (Niu et al. 1993; Binzel 1995; Janicka-Russak and Kłobus 2007; JanickaRussak et al. 2013), low temperature (Ahn et al. 1999, 2000; Janicka-Russak
et al. 2012a, b), heavy metals (Janicka-Russak et al. 2008, 2012a, b), dehydration
(Surowy and Boyer 1991), and mechanical stress (Ouffatole et al. 2000).
Phosphorylation and dephosphorylation of proteins is a very common example
of posttranslational modification that has the potential to alter protein activity. The
activity of the enzyme is well known to be regulated by 14-3-3 proteins, the
association of which requires phosphorylation of the penultimate H+-ATPase
residues of Thr 947 in the C-terminus (Svennelid et al. 1999). In the low-activity
state, the C-terminal tail interacts with the catalytic region of enzyme-limiting
pump activity (Portillo 2000). The binding of 14-3-3 regulatory protein displaces
the C-autoinhibitory domain, activating the enzyme. 14-3-3 binding to H+-ATPase
is stabilized by the fungal toxin fusicoccin, which decreases the dissociation rate.
One 14-3-3 protein dimer binds two C-terminal polypeptides simultaneously, so a
80
M. Janicka-Russak and K. Kabała
high activity state of H+-ATPase could involve formation of dimers or multimeric
complexes. An analysis with cryo-electron microscopy showed that the activated
complex consists of six H+-ATPase molecules and six 14-3-3 molecules
(Kanczewska et al. 2005). The protein kinase responsible for this phosphorylation
has not yet been identified. However, it was reported that calcium-dependent
protein kinase (CDPK) leads to phosphorylation-dependent activation of H+ATPase (Yu et al. 2006).
Abiotic stresses lead to changes in the plasma membrane lipid composition
altering the fluidity of the membrane. The modulation of the phospholipid environment of the plasma membrane regulates the activity of H+-ATPase (Kasamo 2003).
The activation of H+-ATPase is dependent on the degree of saturation or
unsaturation of the fatty acyl chain and its length. The activity decreased with an
increase in the length of the fatty acyl chain and in the degree of unsaturation of
fatty acid (Hernandez et al. 2002; Kasamo 2003; Martz et al. 2006). It was found
that lysophosphatidylcholine binds to the C-terminal region of the protein and
displacing the autoinhibitory domain leads to increase of ATPase activity
(Pedechenko et al. 1990; Regenberg et al. 1995).
3 PM-H+-ATPase in Salt Stress Conditions
Under salt stress, Na+ is accumulated excessively in the cytoplasm, leading to
inhibition of plant growth and development. Salinity tolerance of plants is a complex
trait involving adaptation at the level of cells, organs, and the whole plant. The key
factor of salinity tolerance, other than osmotic adjustment, is the control of intracellular ion homeostasis (Niu et al. 1993; Munns et al. 2006). To prevent accumulation
of toxic Na+ amounts in the cytosol, active sodium efflux into the apoplast and its
compartmentalization inside the vacuole occur. Since Na+ pumps responsible for
sodium extrusion in animals and microorganisms are absent in higher plant cells,
secondary sodium/proton antiporters in both the plasma membrane and the tonoplast
are needed to translocate sodium ions against their electrochemical gradients (Apse
and Blumwald 2007). Removal of sodium ions out of the cell, catalyzed by the
specific plasma membrane Na+/H+, depends on the electrochemical membrane
proton gradient. The only pump which generates an electrochemical proton gradient
across the plasma membrane is H+-ATPase (Palmgren 2001). The importance of the
proton pump in plant adaptation to salinity was indicated by the observations carried
out on salt-tolerant plants, showing increased activity of the plasma membrane
proton pump in both normal and salt conditions (Niu et al. 1993; Vera-Estrella
et al. 1994; Chen et al. 2007; Sahu and Shaw 2009). Moreover, the salt treatment
of plants induces the activities of the plasma membrane proton pumps in both
halophytes and glycophytes (Niu et al. 1993; Perez-Prat et al. 1994; Binzel 1995;
Kłobus and Janicka-Russak 2004; Sahu and Shaw 2009; López-Pérez et al. 2009;
Shen et al. 2011; Janicka-Russak et al. 2013). A direct role of H+-ATPase in salt
tolerance was confirmed by studies with transgenic tobacco, using a PMA4 mutant,
The Role of Plasma Membrane H+-ATPase in Salinity Stress of Plants
81
lacking the autoinhibitory domain (ΔPMA4). In the mutant a constitutively activated
PMA4 H+-ATPase isoform was present. The ΔPMA4 plant roots showed better
growth in saline conditions than those of untransformed plants (Géwaudant
et al. 2007). The importance of PM H+-ATPase in salinity tolerance is also
evident from the Shen et al. (2011) study. The authors demonstrated that in rice
phospholipase Dα (PLDα) is involved in salt tolerance by the mediation of
H+-ATPase activity and transcription. When rice suspension-cultured cells were
treated with 100 mM NaCl, PLDα activity increased. The knockdown of OsPLDα1
prevented a NaCl-induced increase in transcript levels of the PM H+-ATPase gene
(OSA2) as well as ATPase activity.
On the other hand, there are few reports about the inhibition or no effect of NaCl
on the PM H+-ATPase in leaves (Chelysheva et al. 2001; Zörb et al. 2005; Pitan
et al. 2009; Wakeel et al. 2010). The authors observed an increase of apoplastic pH
in leaf cells during the first phase of salt stress, thus limiting leaf growth. Pitan
et al. (2009) found that a salt-sensitive genotype of maize showed a notable
decrease in plasma membrane proton pump activity under salinity. Moreover,
salt-resistant genotype showed unchanged PM-H+-ATPase activity under salt
stress.
The salt-dependent activation of the plasma membrane proton pump encompasses the transcriptional as well as posttranslational level. The existence of
multiple isoforms of the enzyme creates the opportunity for their role in abiotic
stress tolerance. NaCl stress induces the expression of PM H+-ATPase (Niu
et al. 1993; Janicka-Russak and Kłobus 2007; Janicka-Russak et al. 2013). Accumulation of mRNAs of H+-ATPase under salinity and the positive correlation with
salt tolerance are well documented (Niu et al. 1993; Perez-Prat et al. 1994; JanickaRussak and Kłobus 2007; Sahu and Shaw 2009). In Oryza sativa salt-tolerant
cultivar accumulation of PM H+-ATPase gene transcript was greater than that in
a non-tolerant cultivar of rice treated with NaCl (Sahu and Shaw 2009). The
significant role of this plasma membrane protein in salt stress tolerance confirms
the emergence of a new isoform of PM H+-ATPase, not detectable in plants not
treated with NaCl. In rice a new isoform of the enzyme (finding maximum homology with OSA7) in response to salt treatment was discovered (Sahu and Shaw
2009). Similarly, in cucumber seedling under salt stress there appears the transcript
of a new PM H+-ATPase gene isoform, CsHA1. Accumulation of the CsHA1
transcript is induced by NaCl exposure, and it is not expressed at detectable levels
in plants not treated with NaCl (Janicka-Russak et al. 2013). Quite similar observations were made by Kalampanayil and Wimmers (2001), who demonstrated
accumulation of the LHA8 transcript induced by NaCl exposure. Appearance of
new isoforms of the PM H+-ATPase transcript in plants, in addition to the increase
in enzyme activity, indicates the important role of the enzyme in maintaining ion
homeostasis in plants under salt stress. That, consequently, allows the plant to
survive stress conditions.
Recently evidence has been presented that NaCl also causes rapid modulation of
proton pumps, which is due to the reversible phosphorylation of enzyme proteins
(Kerkeb et al. 2002; Kłobus and Janicka-Russak 2004; Janicka-Russak et al. 2013).
82
M. Janicka-Russak and K. Kabała
In many plant tissues a salt-inducible shift in the cytoplasmic calcium level was
observed (Danielsson et al. 1996; Knight et al. 1997; Blumwald et al. 2000; Netting
2000; Xiong et al. 2002), suggesting its involvement in the signaling pathway under
NaCl stress conditions. Transient increases in cytosolic Ca2+ can induce the phosphorylation of different proteins in cells, improving the salt tolerance (Hasegawa
et al. 2000). Evidence suggests that the major role in coupling the calcium signal to
specific protein phosphorylation cascade(s) is played by the Ca2+/calmodulindependent protein kinases (CDPKs) and the SOS3 family (salt overly sensitive 3)
of Ca2+ sensors (Xiong et al. 2002; Zhu 2002). The results of Urao et al. (1994) and
Saijo et al. (2000) demonstrated that NaCl rapidly induced CDPK in different plant
tissues. Furthermore, evidence has been presented that Ca2+/calmodulin-dependent
protein kinases are responsible for the phosphorylation of the plasma membrane
H+-ATPase protein (Van der Hoeven et al. 1996; Camoni et al. 2000). Moreover, it
was shown that plasma membrane ATPase phosphorylation, as a target of activation by NaCl, a calcium/calmodulin-dependent protein kinase sensitive to
staurosporine, is involved (Kłobus and Janicka-Russak 2004). Further research
confirmed that in cucumber seedlings under salt stress conditions fast posttranslational modifications take place. Western blot analysis with antibody against
phosphothreonine and 14-3-3 proteins showed that under salt stress conditions the
level of those elements increased (Janicka-Russak et al. 2013).
Ca2+ has been identified as a possible mediator of ABA-induced stimulusresponse coupling (Netting 2000). Abscisic acid is known as a stress hormone,
which mediates responses to a variety of stresses, including water and salt stress
(Skriver and Mundy 1990; Tan et al. 1994; Jia et al. 2001). The endogenous level of
ABA increases when plants are stressed with drought or NaCl, and application of
ABA to unstressed plants results in the induction of numerous water-deficit-related
activities (La Rosa et al. 1985, 1987; Skriver and Mundy 1990; Cowan et al. 1997).
They include triggering of stomatal closure to reduce transpirational water loss by
posttranslational modulation of ion channels in guard cells (Grabov and Blatt
1998), and alterations in gene expression through induction of ABA-responsive
genes coding for structural, metabolic, or transport proteins (Ingram and Bartels
1996; Shinozaki and Yamaguchi-Shinozaki 1996; Barkla et al. 1999). It was
reported that ABA treatment of plants, as well as NaCl treatment, increased activity
of plasma membrane H+-ATPases. ABA treatment of plants elevated the level of
plasma membrane H+-ATPase transcript (Janicka-Russak and Kłobus 2007). On
the other hand in stomata guard cells the plasma membrane H+-ATPase activity is
diminished by ABA treatments, leading to stomatal closing. However the significance of this phenomenon in relationship to stomatal closure is still debated (Merlot
et al. 2007).
Recently, some evidence has indicated that one mode of ABA action is related to
oxidative stress in plant cells. ABA can cause increased generation of reactive
oxygen species (ROS) (Pei et al. 2000; Zhang et al. 2001; Laloi et al. 2004).
Moreover, H2O2 generated in response to ABA treatment was detected in the
apoplast (Hu et al. 2005, 2006). Furthermore, ABA stimulates H2O2 production
by plasma membrane NADPH oxidases (Hu et al. 2005). Genetic evidence
The Role of Plasma Membrane H+-ATPase in Salinity Stress of Plants
83
indicates that increase in expression of NADPH oxidase genes is required for the
production of ROS during ABA-induced stomatal closure (Kwak et al. 2003).
Increased H2O2 accumulation under salt stress conditions was observed (Panda
and Upadhyay 2003; Tsai et al. 2004; Hernandez et al. 2010; Janicka-Russak
et al. 2013). The reactive oxygen species H2O2 is a harmful cellular metabolite,
although it also serves as a signaling molecule that mediates responses of acclimation to abiotic stress in plant cells (Suzuki and Mittler 2006; Jubany-Mari
et al. 2009). It was shown that H2O2 functions as a trigger for induction of many
genes encoding enzymes involved in cellular protection under stress conditions
(Volkov et al. 2006). Treatment of cucumber seedlings with H2O2 markedly
elevated the level of PM H+-ATPase genes (Zhang et al. 2007; Janicka-Russak
et al. 2012a, b).
Fatty acids, as the main component of membrane lipids, are considered to be
important in salt tolerance of plants, too. Non-tolerant plants subjected to salt stress
commonly show decreased levels of 18:3 fatty acid in their membranes (Upchurch
2008). A study with transgenic tobacco showed that overexpression of ω-3
desaturases, which increases 18:3, elevated tolerance to salt stress (Zhang
et al. 2005). Additionally, salt-tolerant plants showed an increase of unsaturated
fatty acids (Lin and Wu 1996). In broccoli plants subjected to NaCl a high degree of
unsaturation in the plasma membrane of roots was observed, as an adaptation
mechanism to salinity (López-Pérez et al. 2009). Moreover, the activity of plant
PM H+-ATPase increased with an increase in the degree of unsaturation of fatty
acid (Kasamo 2003; Martz et al. 2006). Thus the modulation of the phospholipid
environment of the plasma membrane under salt stress regulates the activity of H+ATPase, leading to an increase in its activity.
PM H+-ATPase can also be regulated by other factors. A novel interaction
partner of the AHA1 PM H+-ATPase, named PPI1 (proton pump interactor, isoform
1), was identified in Arabidopsis thaliana (Morandini et al. 2002). This protein
stimulates the activity of the proton pump in vitro. PPI1 homolog in potato (StPPI1)
stimulated H+-ATPase activity and is induced by salt and cold (Muñiz Garcı́a
et al. 2011).
It has been shown that regulation of the activity of PM H+-ATPase involves
modulation of the H+/ATP coupling ratio (Kerkeb et al. 2002). Venema and
Palmgren (1995) suggested that intrinsic uncoupling of H+/ATP is an important
mechanism for regulation of pump activity. Additionally, it was found that the H+/
ATP coupling ratio in the plasma membrane of cucumber seedlings roots subjected
to salt stress significantly increased (Janicka-Russak et al. 2013). Kerkeb
et al. (2002) also observed an enhanced H+/ATP coupling ratio of plasma membrane H+-ATPase in tomato cells under osmotic stress. Moreover, the correlation
between the increase in H+ pumping activity and the posttranslational modification
consisting of phosphorylation of the enzyme protein was demonstrated (Babakov
et al. 2000; Kerkeb et al. 2002; Janicka-Russak et al. 2013). In salt-stressed
cucumber seedlings, a weak effect of salinity on ATP hydrolytic activity of PM
H+-ATPase and significant stimulation of proton transport through the plasma
membrane were observed (Janicka-Russak et al. 2013). It seems that enhancement
84
M. Janicka-Russak and K. Kabała
of the H+/ATP coupling ratio indicates a more efficient use of ATP hydrolysis to
transport protons. This is very beneficial in terms of salinity to generate a proton
gradient that can be used by plasma membrane Na+/H+ antiporter.
4 SOS Signaling Pathway
Sodium efflux from root cells prevents accumulation of toxic levels of Na+ ions in
the cytosol and their translocation to the shoot. In higher plants, the main mechanism for Na+ removal from cells is powered by the operation of the plasma
membrane H+-ATPase generating an electrochemical proton gradient. This
proton-motive force energizes the plasma membrane Na+/H+ antiporter, identified
as SOS1 (Salt Overly Sensitive 1), that couples the downhill movement of H+ into
the cell along its electrochemical gradient to the Na+ extrusion against its electrochemical gradient (Blumwald et al. 2000). From published data it is known that
activity of Na+/H+ antiporter was observed in glycophytes only after salt stress
induction, and was a part of the adaptive mechanism (Wilson and Shannon 1995;
Qiu et al. 2003; Kabała and Janicka-Russak 2012). In addition it is known that in
halophytes, the antiporter is constitutively expressed and is present in both NaCltreated plants and plants growing under NaCl-free conditions (Blumwald
et al. 2000).
The understanding of how Na+ is sensed by plant cells is still very limited. It is
believed that Na+ can be sensed either before or after entering the cell, or both.
Extracellular Na+ may be perceived by a receptor or salt sensor present at the
plasma membrane, whereas intracellular Na+ may be sensed by membrane proteins
or by Na-sensitive cytosolic enzymes (Conde et al. 2011). Na+ sensor or Na+selective ion channels have not yet been identified in plants. Thus, it is probable that
plants contain other proteins with regulatory Na+ binding sites (Maathuis 2013). On
the other hand, some general mechanisms have been described to sense the onset of
salinity stress. These include reduction in water delivery and turgor changes, which
may be recorded by HK1 kinases, and distortion of cell wall-membrane geometry,
which can be relayed by mechanosensitive ion channels (Maathuis 2013).
In Arabidopsis thaliana, the SOS signaling pathway, including SOS1, SOS2, and
SOS3, is an important regulatory system activated by salt stress to maintain ion
homeostasis and salt tolerance. This pathway strictly depends on plasma membrane
proton gradient as well as cytosolic calcium signals. The SOS1 gene has been
shown to encode a transmembrane protein with significant sequence similarity to
plasma membrane Na+/H+ antiporters from bacteria and fungi (Shi et al. 2000).
SOS1, with a molecular mass of about 127 kDa, possesses 12 transmembrane
domains with a highly hydrophilic regulatory C-terminal region predicted to be
cytosolic (Mahajan et al. 2008). Its transcript level is specifically upregulated by
NaCl stress but not by drought or cold (Shi et al. 2000). Although the understanding
of how Na+ is sensed in plant cells is very limited, SOS1 antiporter seems to be a
good candidate for a membrane protein with dual functions of sodium transport and
The Role of Plasma Membrane H+-ATPase in Salinity Stress of Plants
85
sensing (Zhu 2003; Conde et al. 2011). In root epidermal cells, the SOS1 transporter
is involved in sodium exclusion from the cytosol into the root medium. Moreover,
SOS1 gene is expressed preferentially in cells bordering the xylem vessels throughout the plant and strongly affects long-distance sodium transport. Thus, it was
suggested that SOS1 functions in controlling Na+ translocation between roots and
leaves through loading Na+ into and unloading Na+ from the xylem (Shi
et al. 2002). When expressed in a yeast mutant deficient in endogenous sodium
transporters, SOS1 is able to diminish Na+ accumulation and improve salt tolerance
of yeast cells (Shi et al. 2002). Under salinity, transgenic Arabidopsis plants
overexpressing SOS1 accumulate fewer Na+ ions in tissues, demonstrating that
improved salt tolerance could be achieved by limiting sodium content in plant
cells (Shi et al. 2003). Reduction in SOS1 expression in Thellungiella salsuginea
plants adapted to high salinity causes a loss of their halophytic characteristics,
indicating that SOS1 acts as a major salt tolerance determinant (Oh et al. 2009).
Analysis of Arabidopsis sos1-1 mutant plants revealed that SOS1 protein, in
addition to its function as a Na+/H+ antiporter, mediates vacuolar integrity, membrane trafficking, and pH homeostasis under salt stress (Oh et al. 2010). SOS1 is
conserved in higher plants, both monocots and dicots, including rice, tomato, and
poplar (Ji et al. 2013).
Sodium transport activity of SOS1 is regulated by other identified components of
the SOS pathway, SOS2 and SOS3 (Qiu et al. 2002). It is well known that high
salinity (e.g., Na+) initiates a calcium signal that activates SOS pathway. According
to Tuteja (2007), the salt stress signal first activates phospholipase C, which
hydrolyzes phosphatidylinositol bisphosphate to generate inositol triphosphate
and diacylglycerol resulting in an increased level of Ca2+ ions. This change in
cytosolic calcium ions is sensed by calcium sensor such as SOS3, a myristoylated
Ca2+-binding protein. Some of data suggest the existence of Na+-dependent Ca2+
transport activity in vacuolar membranes (Wang et al. 1994). Recently, AtNCL gene
encoding a protein similar to animal NCXs has been identified in Arabidopsis. It
had Na+/Ca2+ exchange activity and was involved in calcium homeostasis under
salt stress (Wang et al. 2012). Upon binding with Ca2+, SOS3 changes its conformation and physically interacts with the serine/threonine protein kinase SOS2,
which belongs to the SnRK3 family of protein kinases, activating its substrate
phosphorylation. The SOS3–SOS2 complex then phosphorylates and activates
antiporter SOS1, causing subsequent extrusion of sodium excess from the cytosol
(Chinnusamy et al. 2005; Ji et al. 2013). It was shown that SOS1 is maintained in a
resting state by an autoinhibitory domain at the C-terminus. The antiporter is
relieved from autoinhibition upon phosphorylation of its autoinhibitory region by
the SOS2–SOS3 complex (Quintero et al. 2011). Quan et al. (2007) found that an
SOS3 homolog, SCaBP8 (SOS3-like Calcium-Binding Protein 8), is an alternative
regulator of SOS2 in the shoots of Arabidopsis, whereas SOS3 functions mainly in
roots.
SOS2 kinase and SOS1 antiporter have emerged as important mediators of salt
stress response and signaling through interactions with other regulatory proteins.
Additional SOS2-interacting molecules are protein phosphatase ABI2 (Ohta
et al. 2003) and H2O2 signaling proteins: nucleoside diphosphate kinase NDPK2
86
M. Janicka-Russak and K. Kabała
and catalases (Verslues et al. 2007) connecting salt stress with ABA signaling and
oxidative stress, respectively. Under salt stress, both SOS1 and SOS2 are believed
to be involved in pathways controlling ROS production and/or detoxification
(Chung et al. 2008; Zhu et al. 2007). Moreover, a long cytoplasmic tail of SOS1
interacts with RCD1 protein, a regulator of oxidative stress responses (KatiyarAgarwal et al. 2006). Further results have shown that SOS2 plays a critical role in
controlling the activities of NHXs, plant vacuolar Na+/H+ exchangers, providing
evidence that there can be coordination of the activities of the sodium antiporters in
the vacuolar and plasma membranes (Qiu et al. 2004; Huertas et al. 2012). Similarly, SOS2 was shown to activate the vacuolar Ca2+/H+ antiporter CAX1 integrating calcium transport and salt tolerance (Cheng et al. 2004). Batelli et al. (2007)
demonstrated that under salinity SOS2 interacts directly with V-ATPase regulatory
subunits B1 and B2, stimulating its proton pumping activity. Such results suggest
that regulation of V-ATPase is an additional key function of SOS2 in promotion of
salt tolerance.
Extensive studies of SOS genes and their biochemical functions indicated that
the SOS3 calcium sensor also plays an important role in salt tolerance. Plants
lacking SOS3 are hypersensitive to salt stress, but this sensitivity could be partially
reversed by the addition of calcium ions. Salt hypersensitivity of the Arabidopsis
sos3 mutant results, at least in part, from disordered actin filaments. Thus, it was
suggested that SOS3 links calcium and microfilament dynamics in the salt stress
response (Ye et al. 2013). Moreover, phenotypic analysis of the sos3-1 mutant
provided evidence that the SOS signaling pathway is involved in lateral root
initiation under low salt. SOS3 plays a regulatory role in lateral root development
by mediating auxin gradient formation and auxin polar transport. These results
indicate that SOS3 is required for sufficient auxin supply to initiate lateral root
development and to maintain their cell division activity under low salt stress (Zhao
et al. 2011).
5 Conclusion
The study revealed that NaCl has an activating effect on PM H+-ATPase in plants.
This supports the crucial role of the enzyme in maintaining ion homeostasis and salt
tolerance. In plants exposed to abiotic stresses an increase in permeability related to
membrane damage is observed. Maintaining ionic balance and replenishing the loss
of essential substances in repair processes is an important issue under such conditions. Support of active transport of ions and organic compounds through the
plasma membrane requires increased generation of a proton gradient by PM H+ATPase. In addition, salinity leads to accumulation of a toxic excess of Na+ ions.
Generation of an electrochemical proton gradient across the membrane results in a
proton-motive force that is used by active transport for assimilation of various
nutrients, as well as for releasing toxic excess of ions from cells. Thus, plasma
The Role of Plasma Membrane H+-ATPase in Salinity Stress of Plants
87
membrane H+-ATPase can be a mutual element for resistance mechanisms that are
activated in salt stress conditions.
References
Ahn S, Im Y, Chung G, Cho B (1999) Inducible expression of plasma membrane H+-ATPase in the
roots of fig leaf gourd plants under chilling root temperature. Physiol Plant 106:35–40
Ahn S, Im Y, Chung G, Seong K, Cho B (2000) Sensitivity of plasma membrane H+-ATPase of
cucumber root system in response to low root temperature. Plant Cell Rep 19:831–835
Apse M, Blumwald E (2007) Na+ transport in plants. FEBS Lett 581:2247–2254
Arango M, Gevaudant F, Oufattole M, Boutry M (2003) The plasma membrane proton pump
ATPase: the significance of gene subfamilies. Planta 216:355–365
Babakov AV, Chelysheva VV, Klychnikov OI, Zinyanz SE, Trofimova MS, De Boer AH (2000)
Involvement of 14-3-3 proteins in the osmotic regulation of H+-ATPase in plant plasma
membrane. Planta 211:446–448
Barkla B, Vera-Estrella R, Maldonado-Gama M, Pantoja O (1999) Abscisic acid induction of
vacuolar H+-ATPase activity in Mesembryanthemum crystallinum is developmentally regulated. Plant Physiol 120:811–819
Batelli G, Verslues PE, Agius F, Qiu Q, Fujii H, Pan S, Schumaker KS, Grillo S, Zhu J-K (2007)
SOS2 promotes salt tolerance in part by interacting with the vacuolar H+-ATPase and
upregulating its transport activity. Mol Cell Biol 27:7781–7790
Baxter I, Tchieu J, Sussman M, Boutry M, Palmgren M, Gribskov M, Harper J, Axelsen K (2003)
Genomic comparison of P-type ATPase ion pumps in Arabidopsis and rice. Plant Physiol
132:618–828
Binzel M (1995) NaCl induced accumulation of tonoplast and plasma membrane H+-ATPase
message in tomato. Physiol Plant 94:722–728
Blumwald E, Aharon GS, Apse MP (2000) Sodium transport in plant cells. Biochim Biophys Acta
1465:140–151
Buch-Pedersen M, Rudashevskaya E, Berner T, Venema K, Palmgren M (2006) Potassium as an
intrinsic uncoupler of the plasma membrane H+-ATPase. J Biol Chem 281:38285–38292
Buch-Pedersen M, Pedersen P, Veierskov B, Nissen P, Palmgren M (2009) Protons how they are
transported by proton pumps. Pflugers Arch Eur J Physiol 457:573–579
Camoni L, Iori V, Marra M, Aducci P (2000) Phosphorylation-dependent interaction between
plant plasma membrane H+-ATPase and 14-3-3 proteins. J Biol Chem 275:9919–9923
Chelysheva V, Zorinyants S, Smolenskaya I, Babakov A (2001) Regulation of H+ pumping by
plants plasmalemma under osmotic stress: the role of 14-3-3 proteins. Russ J Plant Physiol
48:271–280
Chen Z, Pottosin II, Cuin TA, Fuglsang AT, Tester M, Jha D, Zepeda-Jazo I, Zhou M, Palmgren
MG, Newman IA, Shabala S (2007) Root plasma membrane transporters controlling K+/Na+
homeostasis in salt-stressed barley. Plant Physiol 145:1714–1725
Cheng NH, Pittman JK, Zhu J-K, Hirschi KD (2004) The protein kinase SOS2 activates the
Arabidopsis H+/Ca2+ antiporter CAX1 to integrate calcium transport and salt tolerance. J Biol
Chem 279:2922–2926
Chinnusamy V, Jagendorf A, Zhu J-K (2005) Understanding and improving salt tolerance in
plants. Crop Sci 45:437–448
Chung J-S, Zhu J-K, Bressan RA, Hasegawa PM, Shi H (2008) Reactive oxygen species mediate
Na+-induced SOS1 mRNA stability in Arabidopsis. Plant J 53:554–565
Conde A, Chaves MM, Gerós H (2011) Membrane transport, sensing and signaling in plant
adaptation to environmental stress. Plant Cell Physiol 52:1583–1602
88
M. Janicka-Russak and K. Kabała
Cowan A, Richardson G, Maurel J (1997) Stress-induced abscisic acid transients and stimulusresponse-coupling. Physiol Plant 100:491–499
Danielsson A, Larsson C, Larsson K, Gustafsson L, Adler L (1996) A genetic analysis of the role
of calcineurin and calmodulin in Ca2+ dependent improvement of NaCl tolerance of Saccharomyces cerevisiae. Curr Genet 30:476–484
Duby G, Boutry M (2009) The plant plasma membrane proton pump ATPase: a highly regulated
P-type ATPase with multiple physiological roles. Pflugers Arch Eur J Physiol 457:645–655
Géwaudant F, Duby G, Stedingk E, Zhao R (2007) Expression of a constitutively activated plasma
membrane H+-ATPase alters plant development and increases salt tolerance. Plant Physiol
144:1763–1776
Grabov A, Blatt M (1998) Co-ordination of signaling elements in guard cell ion channel control. J
Exp Bot 49:351–360
Hasegawa P, Bressan R, Zhu J, Bohnert H (2000) Plant cellular and molecular responses to high
salinity. Annu Rev Plant Physiol Plant Mol Biol 51:463–499
Hentzen A, Smart L, Wimmers L, Fang H, Schroeder J, Bennett A (1996) Two plasma membrane
H+-ATPase genes expressed in guard cells of Vicia faba are also expressed throughout the
plant. Plant Cell Physiol 37:650–659
Hernandez A, Cooke D, Clarkson D (2002) In vivo activation of plasma membrane H+-ATPase
hydrolytic activity by complex lipid-bound unsaturated fatty acids in Ustilago maydis. Eur J
Biochem 269:1006–1011
Hernandez M, Fernandez-Garcia N, Diaz-Vivancos P, Olmos E (2010) A different role for
hydrogen peroxide and antioxidative system under short and long salt stress in Brassica
oleracea roots. J Exp Bot 61:521–535
Hu X, Jiang M, Zhang A, Lu J (2005) Abscisic acid induced apoplastic H2O2 accumulation
up-regulates the activities of chloroplastic and cytosolic antioxidant enzymes in maize leaves.
Planta 223:57–68
Hu X, Zhang A, Zhang J, Jiang M (2006) Abscisic acid is a key inducer of hydrogen peroxide
production in leaves of maize plants exposed to water stress. Plant Cell Physiol 47:1484–1495
Huertas R, Olı́as R, Eljakaoui Z, Gálvez FJ, Li J, de Morales PA, Belver A, Rodrı́quez-Rosales MP
(2012) Overexpression of SlSOS2 (SlCIPK24) confers salt tolerance to transgenic tomato.
Plant Cell Environ 35:1467–1482
Ingram J, Bartels D (1996) The molecular basis of dehydration tolerance in plants. Annu Rev Plant
Physiol Plant Mol Biol 47:377–403
Janicka-Russak M, Kłobus G (2007) Modification of plasma membrane and vacuolar H+-ATPase
in response to NaCl and ABA. J Plant Physiol 164:295–302
Janicka-Russak M, Kabała K, Burzyński M, Kłobus G (2008) Response of plasma membrane H+ATPase to heavy metal stress in Cucumis sativus roots. J Exp Bot 59:3721–3728
Janicka-Russak M, Kabała K, Wdowikowska A, Kłobus G (2012a) Response of plasma membrane
H+-ATPase to low temperature in cucumber roots. J Plant Res 125:291–300
Janicka-Russak M, Kabała K, Burzyński M (2012b) Different effect of cadmium and copper on
H+-ATPase activity in plasma membrane vesicles from Cucumis sativus roots. J Exp Bot
63:4133–4142
Janicka-Russak M, Kabala K, Wdowikowska A, Kłobus G (2013) Modification of plasma membrane proton pumps in cucumber roots as an adaptation mechanism to salt stress. J Plant
Physiol 170:915–922
Ji H, Pardo JM, Batelli G, Van Oosten MJ, Bressan RA, Li X (2013) The salt overly sensitive
(SOS) pathway: established and emerging roles. Mol Plant 6:275–286
Jia W, Zhang J, Liang J (2001) Initiation and regulation of water deficit-induced abscisic acid
accumulation in maize leaves and roots: cellular volume and water relations. J Exp Bot
52:295–300
Jubany-Mari T, Munne-Bosch S, Lopez-Carbonell Alegre L (2009) Hydrogen peroxide is involved
in the acclimation of the Mediterranean shrub, Cistus albidus L., to summer drought. J Exp Bot
60:107–120
The Role of Plasma Membrane H+-ATPase in Salinity Stress of Plants
89
Kabała K, Janicka-Russak M (2012) Na+/H+ antiport activity in plasma membrane and tonoplast
vesicles isolated from NaCl treated cucumber roots. Biol Plant 56:377–382
Kalampanayil B, Wimmers L (2001) Identification and characterization of a salt-stressed-induced
plasma membrane H+-ATPase in tomato. Plant Cell Environ 24:999–1005
Kanczewska J, Marco S, Vandermeeren C, Maudoux O, Rigaud J, Boutry M (2005) Activation of
the plant plasma membrane H+-ATPase by phosphorylation and binding of 14-3-3 proteins
convert a dimer into a hexamer. PNAS 102:11675–11680
Kasamo K (2003) Regulation of plasma membrane H+-ATPase activity by the membrane environment. J Plant Res 116:517–523
Katiyar-Agarwal S, Zhu J, Kim K, Agarwal M, Fu X, Huang A, Zhu J-K (2006) The plasma
membrane Na+/H+ antiporter SOS1 interacts with RCD1 and functions in oxidative stress
tolerance in Arabidopsis. PNAS 103:18816–18821
Kerkeb L, Venema K, Donaire J, Rodriguez-Rozales M (2002) Enhanced H+/ATP coupling ratio
of H+-ATPase and increased 14-3-3 protein content in plasma membrane of tomato cells upon
osmotic shock. Physiol Plant 16:37–41
Kłobus G, Janicka-Russak M (2004) Modulation by cytosolic components of proton pump
activities in plasma membrane and tonoplast from Cucumis sativus roots during salt stress.
Physiol Plant 121:84–92
Knight H, Trewavas A, Knight M (1997) Calcium signalling in Arabidopsis thaliana responding to
drought and salinity. Plant J 12:1067–1078
Kwak JM, Mori IC, Pei ZM, Leonhardt N, Torres MA, Dangl JL, Bloom RE, Bodde S, Jones JD,
Schroeder JI (2003) NADPH oxidase AtrbohD and AtrbohF genes function in ROS-dependent
ABA signaling in Arabidopsis. EMBO J 22:2623–2633
La Rosa P, Handa A, Hasegawa P, Bressan R (1985) Abscisic acid accelerates adaptation of
cultured tobacco cells to salt. Plant Physiol 79:138–142
La Rosa P, Hasegawa P, Rhodes D, Clithero J (1987) Abscisic acid stimulated osmotic adjustment
and its involvement in adaptation of tobacco cells to NaCl. Plant Physiol 85:174–185
Laloi C, Mestres-Ortega D, Marco Y, Meyer Y, Reichheld JP (2004) The Arabidopsis cytosolic h5
gene induction by oxidative stress and its w-box-mediated response to pathogen elicitor. Plant
Physiol 134:1006–1016
Lin H, Wu L (1996) Effects of salt stress on root plasma membrane characteristics of salt-tolerant
and salt-sensitive buffalograss clones. Environ Exp Bot 36:239–254
López-Pérez L, Martı́nez Ballesta M, Maurel C, Carvajal M (2009) Changes in plasma membrane
lipids, aquaporins and proton pump of broccoli roots, as an adaptation mechanism to salinity.
Phytochemistry 70:492–500
Maathuis FJM (2013) Sodium in plants: perception, signalling, and regulation of sodium fluxes. J
Exp Bot. doi:10.1093/jxb/ert326
Mahajan S, Pandey GK, Tuteja N (2008) Calcium- and salt-stress signaling in plants: shedding
light on SOS pathway. Arch Biochem Biophys 471:146–158
Martz F, Sutinen M, Kiviniemi S, Palta J (2006) Changes in freezing tolerance, plasma membrane
H+-ATPase activity and fatty acid composition in Pinus resinosa needles during cold acclimation and de-acclimation. Tree Physiol 26:783–790
Merlot S, Leonhardt N, Fenzi F, Valon C, Costa M, Piette L, Vavasseur A, Genty B, Boivin K,
Müller A, Giraudat J, Leung J (2007) Constitutive activation of a plasma membrane H+ATPase prevents abscisic acid-mediated stomatal closure. EMBO J 26:3216–3226
Morandini P, Valera M, Albumi C, Bonza M, Giacometti S, Ravera G, Murgia I, Soave C, De
Michelis M (2002) A novel interaction partner for C-terminus of Arabidopsis thaliana plasma
membrane H+-ATPase (AHA1 isoform): site and mechanism of action on H+-ATPase activity
differ from those of 14-3-3 proteins. Plant J 31:487–497
Moriau L, Michelet B, Bogaerts P, Lambert L, Michel A, Oufattole M, Boutry M (1999)
Expression analysis of two gene subfamilies encoding the plasma membrane H+-ATPase in
Nicotiana plumbaginifolia reveals the major transport functions of this enzyme. Plant J
19:31–41
90
M. Janicka-Russak and K. Kabała
Muñiz Garcı́a M, Paı́s S, Téllez-Iñón M, Capiati D (2011) Characterization of StPPI1, a proton
pump interactor from Solanum tuberosum L. that is up-regulated during tuber development and
by abiotic stress. Planta 233:661–674
Munns R, James RA, Läuchli A (2006) Approaches to increasing the salt tolerance of wheat and
other cereals. J Exp Bot 57:1025–1043
Netting A (2000) pH, abscisic acid and the integration of metabolism in plants under stressed and
non-stressed conditions: cellular responses to stress and their implication for plant water
relations. J Exp Bot 343:147–158
Niu X, Narasimhan M, Salzman R (1993) NaCl regulation of plasma membrane H+-ATPase gene
expression in Glycophyte and Halophyte. Plant Physiol 103:712–718
Oh D-H, Leidi E, Zhang Q, Hwang S-M, Li Y, Quintero FJ, Jiang X, D’Urzo MP, Lee SY, Zhao Y,
Bahk JD, Bressan RA, Yun D-J, Pardo JM, Bohnert HJ (2009) Loss of halophytism by
interference with SOS1 expression. Plant Physiol 151:210–222
Oh D-H, Lee SY, Bressan RA, Yun D-J, Bohnert HJ (2010) Intracellular consequences of SOS1
deficiency during salt stress. J Exp Bot 61:1205–1213
Ohta M, Guo Y, Halfter U, Zhu J-K (2003) A novel domain in the protein kinase SOS2 mediates
interaction with the protein phosphatase 2C ABI2. PNAS 100:11771–11776
Ouffatole M, Arango M, Boutry M (2000) Identification and expression of tree new Nicotiana
plumbaginifolia genes which encode isoforms of a plasma-membrane H+-ATPase, and one of
which is induced by mechanical stress. Planta 210:715–722
Palmgren M (2001) Plant plasma membrane H+-ATPase: powerhouse for nutrient uptake. Annu
Rev Plant Physiol Plant Mol Biol 52:817–845
Panda SK, Upadhyay RK (2003) Salt stress injury induces oxidative alterations and antioxidative
defence in the roots of Lemna minor. Biol Plant 48:249–253
Pedechenko V, Nasirova G, Palladina T (1990) Lysophosphatidylcholine specifically stimulates
plasma membrane H+-ATPase from corn roots. FEBS Lett 275:205–208
Pedersen BP, Buch-Pedersen MJ, Morth JP, Palmgren MG, Nissen P (2007) Crystal structure of
the plasma membrane proton pump. Nature 450:1111–1114
Pei ZM, Murata Y, Benning G, Thomine S, Klüsener B, Allen GJ et al (2000) Calcium channels
activated by hydrogen peroxide mediate abscisic acid signaling in guard cells. Nature
406:731–734
Perez-Prat E, Narasimhan M, Niu X, Botella M, Bressan R, Valupesta V, Hasegawa P, Binzel M
(1994) Growth cycle stage dependent NaCl induction of plasma membrane H+-ATPase mRNA
accumulation in de-adapted tobacco cells. Plant Cell Environ 17:327–333
Pitan B, Schubert S, Mühling K (2009) Decline in leaf growth under salt stress is due to an
inhibition of H+ pumping activity and increase in apoplastic pH of maize leaves. J Plant Nutr
Soil Sci 172:535–543
Portillo F (2000) Regulation of plasma membrane H+-ATPase in fungi and plants. Biochim
Biophys Acta 1469:31–42
Qiu Q-S, Guo Y, Dietrich M, Schumaker KS, Zhu J-K (2002) Regulation of SOS1, a plasma
membrane Na+/H+ exchanger in Arabidopsis thaliana, by SOS2 and SOS3. PNAS
99:8436–8441
Qiu QS, Barkla BJ, Vera-Estrella R, Zhu JK, Schumaker KS (2003) Na+/H+ exchange activity in
the plasma membrane of Arabidopsis. Plant Physiol 132:1041–1052
Qiu Q-S, Guo Y, Quintero FJ, Pardo JM, Schumaker KS, Zhu J-K (2004) Regulation of vacuolar
Na+/H+ exchange in Arabidopsis thaliana by the salt-overly-sensitive (SOS) pathway. J Biol
Chem 279:207–215
Quan R, Lin H, Mendoza I, Zhang Y, Cao W, Yang Y, Shang M, Chen S, Pardo JM, Guo Y (2007)
SCaBP8/CBL10, a putative calcium sensor, interacts with the protein kinase SOS2 to protect
Arabidopsis shoots from salt stress. Plant Cell 19:1415–1431
Quintero FJ, Martinez-Atienza J, Villalta I, Jiang X, Kim W-Y, Ali Z, Fujii H, Mendoza I, Yun
D-J, Zhu J-K, Pardo JM (2011) Activation of the plasma membrane Na/H antiporter salt-overly
sensitive 1 (SOS1) by phosphorylation of an auto-inhibitory C-terminal domain. PNAS
108:2611–2616
The Role of Plasma Membrane H+-ATPase in Salinity Stress of Plants
91
Regenberg B, Villalba J, Lanfermeijer F, Palmgren M (1995) C-terminal deletion analysis of plant
plasma membrane H+-ATPase: yeast as a model system for solute transport across the plant
plasma membrane. Plant Cell 7:1655–1666
Sahu B, Shaw B (2009) Salt-inducible isoform of plasma membrane H+-ATPase gene in rice
remains constitutively expressed in natural halophyte, Suaeda maritima. J Plant Physiol
166:1077–1089
Saijo Y, Hata S, Kyozuka J, Shimamoto K, Izui K (2000) Over-expression of a single Ca2+dependent protein kinase confers both cold and salt/drought tolerance on rice plants. Plant J
23:319–327
Santi S, Locci G, Monte R, Pinton R, Varanini Z (2003) Induction of nitrate uptake in maize roots:
expression of a putative high-affinity nitrate transporter and plasma membrane H+-ATPase
isoforms. J Exp Bot 54:1851–1864
Serrano R (1990) Plasma membrane ATPase. In: Larsson C, Moller IM (eds) The plant plasma
membrane. Springer, Berlin, pp 127–154
Shen P, Wang R, Zhang W (2011) Rice phospholipase Dα is involved in salt tolerance by the
mediation of H+-ATPase activity and transcription. J Integr Plant Biol 53:289–299
Shi H, Ishitani M, Kim C, Zhu J-K (2000) The Arabidopsis thaliana salt tolerance gene SOS1
encodes a putative Na+/H+ antiporter. PNAS 97:6896–6901
Shi H, Quintero FJ, Pardo JM, Zhu J-K (2002) The putative plasma membrane Na+/H+ antiporter
SOS1 controls long-distance Na+ transport in plants. Plant Cell 14:465–477
Shi H, Lee B, Wu S-J, Zhu J-K (2003) Overexpression of a plasma membrane Na+/H+ antiporter
gene improves salt tolerance in Arabidopsis thaliana. Nat Biotechnol 21:81–85
Shinozaki K, Yamaguchi-Shinozaki K (1996) Molecular responses to drought and cold stress. Curr
Opin Biotechnol 7:161–167
Skriver K, Mundy J (1990) Gene expression in response to abscisic acid and osmotic stress. Plant
Cell 2:503–512
Speth C, Jaspert N, Marcon C, Oecking C (2010) Regulation of the plant plasma membrane H+ATPase by its C-terminal domain: what we know for sure? Eur J Cell Biol 89:145–151
Surowy T, Boyer J (1991) Low water potentials affect expression of genes encoding vegetative
storage proteins and plasma membrane proton ATPase in soybean. Plant Mol Biol 16:252–262
Suzuki N, Mittler R (2006) Reactive oxygen species and temperature stresses: a delicate balance
between signaling and destruction. Physiol Plant 126:45–51
Svennelid F, Olsson A, Piotrowski M, Rosenquist M, Ottman C, Larsson C, Oecking C, Sommarin
M (1999) Phosphorylation of Thr-948 at the C-terminus of the plasma membrane H+-ATPase
creates a binding site for regulatory 14-3-3 protein. Plant Cell 11:2379–2391
Tan B, Schwartz S, Zeevaart J, Mc Carty R (1994) Genetic control of abscisic acid biosynthesis in
maize. PNAS 94:12235–12240
Tsai YC, Hong CY, Liu LF, Kao CH (2004) Relative importance of Na+ and Cl- in NaCl-induced
antioxidant systems in roots of rice seedlings. Physiol Plant 122:86–94
Tuteja N (2007) Mechanisms of high salinity tolerance in plants. Methods Enzymol 428:419–438
Upchurch RG (2008) Fatty acid unsaturation, mobilization, and regulation in the response of plants
to stress. Biotechnol Lett 30:967–977
Urao T, Katagiri T, Mizoguchi T, Yamaguchi-Shinozaki K, Hayashida N, Shinozaki K (1994)
Two genes that encode Ca2+-dependent protein kinases are induced by drought and high-salt
stresses in Arabidopsis thaliana. Mol Gen Genet 244:331–340
Van der Hoeven P, Siderius M, Korthout H, Drabkin A, De Boer A (1996) A calcium and free fatty
acid modulated protein kinase as putative effector of the fusicoccin 14-3-3 receptor. Plant
Physiol 111:857–865
Venema K, Palmgren MG (1995) Metabolic modulation of transport coupling ratio in yeast plasma
membrane H+-ATPase. J Biol Chem 270:19659–19667
Vera-Estrella R, Barkla B, Higgins V, Blumwald E (1994) Plant defense response to fungal
pathogens (activation of host-plasma membrane H+-ATPase by elicitor-induced enzyme
dephosphorylation). Plant Physiol 104:209–215
Verslues PE, Batelli G, Grillo S, Agius F, Kim Y-S, Zhu J, Agarwal M, Katiyar-Agarwal S, Zhu
J-K (2007) Interaction of SOS2 with nucleoside diphosphate kinase 2 and catalases reveals a
92
M. Janicka-Russak and K. Kabała
point of connection between salt stress and H2O2 signaling in Arabidopsis thaliana. Mol Cell
Biol 27:7771–7780
Volkov RA, Panchuk II, Mullineaux PM, Schöffl F (2006) Heat stress-induced H2O2 is required
for effective expression of heat shock genes in Arabidopsis. Plant Mol Biol 61:733–746
Wakeel A, Hanstein S, Pitann B, Schubert S (2010) Hydrolytic and pumping activity of H+ATPase from leaves of sugar beet (Beata vulgaris L.) as affected by salt stress. J Plant Physiol
167:725–731
Wang YZ, Li RL, Xu XZ, Zhu WC (1994) Ca2+ transport across the tonoplast of wheat roots. J
Wuhan Univ (Nat Sci Ed) 5:111–115
Wang P, Li Z, Wei J, Zhao Z, Sun D, Cui S (2012) A Na+/Ca2+ exchanger-like protein (AtNCL)
involved in salt stress in Arabidopsis. J Biol Chem 287:44062–44070
Wilson C, Shannon MC (1995) Salt-induced Na+/H+ antiport in root plasma membrane of a
glycophytic and halophytic species of tomato. Plant Sci 107:147–157
Xiong L, Schumaker K, Zhu J-K (2002) Cell signaling during cold, drought, and salt stress. Plant
Cell 14:165–183
Ye J, Zhang W, Guo Y (2013) Arabidopsis SOS3 plays an important role in salt tolerance by
mediating calcium-dependent microfilament reorganization. Plant Cell Rep 32:139–148
Yu X, Li M, Gao G, Feng H, Geng X, Peng C, Zhu S, Wang X, Shen Y, Zhang D (2006) Abscisic
acid stimulates a calcium-dependent protein kinase in grape berry. Plant Physiol 140:558–579
Zhang X, Zhang L, Dong F, Gao J, Galbraith D, Song C (2001) Hydrogen peroxide is involved in
abscisic acid-induced stomatal closure in Vicia faba. Plant Physiol 126:1438–1448
Zhang M, Barg R, Yin M, Gueta-Dahan Y, Leikin-Frenkel A, Salts Y, Shabtai S, Ben-Hayyim G
(2005) Modulated fatty acid desaturation via over-expression of two distinct ω-3 desaturases
differentially alters tolerance to various abiotic stresses in transgenic tobacco cells and plants.
Plant J 44:361–371
Zhang F, Wang Y, Wang D (2007) Role of nitric oxide and hydrogen peroxide during the salt
resistance response. Plant Signal Behav 2:473–474
Zhao Y, Wang T, Zhang W, Li X (2011) SOS3 mediates lateral root development under low salt
stress through regulation of auxin redistribution and maxima in Arabidopsis. New Phytol
189:1122–1134
Zhu J-K (2002) Salt and drought stress signal transduction in plants. Annu Rev Plant Biol
53:247–273
Zhu J-K (2003) Regulation of ion homeostasis under salt stress. Curr Opin Plant Biol 6:441–445
Zhu J, Fu X, Koo YD, Zhu J-K, Jenney FE Jr, Adams MWW, Zhu Y, Shi H, Yun D-J, Hasegawa
PM, Bressan RA (2007) An enhancer mutant of Arabidopsis salt overly sensitive 3 mediates
both ion homeostasis and the oxidative stress response. Mol Cell Biol 27:5214–5224
Zörb C, Stracke B, Tramnitz B, Denter D, Sümer A, Mühling KH, Yan F, Schubert S (2005) Does
H+ pumping by plasmalemma ATPase limit leaf growth of corn (Zea mays L.) during the first
phase of salt stress? J Plant Nutr Soil Sci 168:550–557
Selenium in Plants
Elizabeth A.H. Pilon-Smits
Contents
1 Introduction to Selenium in Biology and Natural Systems . . . . . . . . . . . . . . . . . . . . . . . . . . . . . . . . 94
2 Plant Se Physiology: What Can Plants Do with Se? . . . . . . . . . . . . . . . . . . . . . . . . . . . . . . . . . . . . . . 94
3 Genetic and Evolutionary Aspects of Se Tolerance and Accumulation . . . . . . . . . . . . . . . . . . 97
4 Genetic Engineering of Plant Se Metabolism . . . . . . . . . . . . . . . . . . . . . . . . . . . . . . . . . . . . . . . . . . . . . . 99
5 Ecological Aspects of Se (Hyper)Accumulation . . . . . . . . . . . . . . . . . . . . . . . . . . . . . . . . . . . . . . . . . . . 100
6 Conclusions and Future Prospects . . . . . . . . . . . . . . . . . . . . . . . . . . . . . . . . . . . . . . . . . . . . . . . . . . . . . . . . . . 103
References . . . . . . . . . . . . . . . . . . . . . . . . . . . . . . . . . . . . . . . . . . . . . . . . . . . . . . . . . . . . . . . . . . . . . . . . . . . . . . . . . . . . . . . 104
Abstract Selenium (Se) and sulfur (S) are chemically similar. Most plants cannot
discriminate between the two, with the exception of Se hyperaccumulator species,
which preferentially accumulate Se over S. Genetic engineering of various genes
from the S/Se assimilation pathway has successfully enhanced plant Se tolerance,
accumulation, and volatilization, in both laboratory and field. Results from genomic
studies are beginning to shed better light on Se tolerance and (hyper)accumulation
mechanisms, pointing to particular growth regulators (jasmonic acid, salicylic acid,
ethylene) and constitutive upregulation of S/Se uptake and assimilation pathways.
Selenium accumulation in plants profoundly affects ecological interactions. It protects plants from herbivores via both deterrence and toxicity, as well as from
microbial pathogens. High-Se plants do not deter pollinators. Selenium hyperaccumulators enhance Se levels in neighboring plants, which can have a negative
(allelopathic) effect if these are Se sensitive, but a positive effect if they are Se
tolerant, via protection from herbivores. Thus, in seleniferous ecosystems Se
hyperaccumulators may favor Se-resistant ecological partners while selecting
against Se-sensitive partners. In this way, hyperaccumulators may affect species
composition at multiple trophic levels, as well as Se cycling.
E.A.H. Pilon-Smits (*)
Biology Department, Colorado State University, Fort Collins, CO 80523-1878, USA
e-mail: epsmits@lamar.colostate.edu
© Springer International Publishing Switzerland 2015
U. Lüttge, W. Beyschlag (eds.), Progress in Botany, Progress in Botany 76,
DOI 10.1007/978-3-319-08807-5_4
93
94
E.A.H. Pilon-Smits
1 Introduction to Selenium in Biology and Natural Systems
The element selenium (Se) is chemically similar to sulfur (S). Selenium occurs
naturally in soils, typically at very low levels, but up to 100 mg Se kg 1 in
seleniferous soils, such as Cretaceous shale (Beath et al. 1939a, b). Selenium is
essential for mammals and many other animals, as well as for many bacteria and
some algae (Fu et al. 2002). Selenium is part of so-called selenoproteins which
contain selenocysteine (SeCys) in their active site. Some of the most prominent
examples are glutathione peroxidases and thioredoxin reductases (Zhang and
Gladyshev 2009). These proteins have various redox functions, including the
scavenging of free radicals. Thus, Se supplementation has been reported to reduce
the probability of developing cancer (Rayman 2005). Higher plants may have lost
essential Se metabolism during their evolution (Zhang and Gladyshev 2009). While
not essential for higher plants, Se is considered a beneficial element, stimulating
growth at low levels (Pilon-Smits et al. 2009). The mechanisms for this beneficial
effect are still largely unknown but may be associated with enhanced antioxidant
activity (Hartikainen 2005). At elevated levels Se is toxic to most plants, due to
nonspecific incorporation of Se into sulfur (S) compounds, and to oxidative stress
(Stadtman 1996; Van Hoewyk 2013). Compared to most elements, the window
between benefit and toxicity is particularly small for Se, and both deficiency and
toxicity are problems worldwide. Selenium deficiency occurs in areas where soil Se
is low, including parts of Europe, China, North America, Australia, New Zealand,
and Southern Africa (Sors et al. 2005). Selenium toxicity occurs in areas where soil
Se is naturally high, including areas of China, India, and the United States. Toxicity
from naturally occurring Se may be exacerbated by irrigation of seleniferous soil,
mining, and use of Se-rich fossil fuels (Terry et al. 2000). At the basis of the food
chain, plants collect Se from the soil and provide it to higher trophic levels. Using
this principle, plants may be used to remove Se from natural or polluted Se-rich
areas and as a food source to alleviate Se deficiency in humans or animals. The first
process is called phytoremediation (Pilon-Smits 2005), and the second biofortification (White and Broadley 2009). The two may even be combined: plants that
have accumulated Se from polluted soil may be used as fortified food. These
management practices benefit from a thorough understanding of the mechanisms
of plant Se uptake and the fate of Se in different plant species. In addition, it is
important for these technologies to have insight into the ecological effects of plant
Se accumulation.
2 Plant Se Physiology: What Can Plants Do with Se?
Figure 1 summarizes Se metabolism in plants (for other reviews see Lauchli 1993;
Terry et al. 2000; Sors et al. 2005). Environmental selenate (prevalent in oxic
environments) and selenite (prevalent in reducing environments) are typically
taken up non-specifically by plants using transporters for S analogues. Following
Selenium in Plants
95
DMSe
Methyl-SeMet
Met methyltransferase
Met synthase
Sehomocysteine
SeMethionine
Sehomocysteine
Cystathionine-β-lyase
Secystathionine
Protein
Protein
SeCys
Se0 + Ala
SeCys
Lyase
SeCys
methyltransferase
MeSeCys
ECS Secondary
metabolites
Cystathionine- -synthase
OPH
SeCysteine
OAS (thiol) lyase
OAS
Selenide
Sulfite reductase / GSH
SeO32-
GluAPS reductase
APS Kinase
MeSeCys PAPSe
APSe
ATP sulfurylase
ATP
SeO42-
plastid
?
SeO42DMDSe
cytosol
Sultr
SeO42-
Fig. 1 Proposed model for Se assimilation in plants. Enzymes are shown in red and metabolites in
black or gray. Sultr sulfate/selenate transporter, APSe adenosine phosphoselenate, PAPSe phospho
adenosine phosphoselenate, OAS O-acetylserine, OPH O-phosphohomoserine, SeCys
selenocysteine, (Se)Met (seleno)methionine, Ala alanine, MeSeCys methyl-SeCys, gGlu-MeSeCys
g-glutamyl MeSeCys, gECS g-glutamylcysteine synthetase, GSH glutathione, DMSe dimethylselenide, DMDSe dimethyldiselenide
uptake, these inorganic forms of Se may be assimilated via the sulfate assimilation
pathway into selenocysteine (SeCys), selenomethionine (SeMet), and other organic
S compounds. This process can happen in both root and shoot, but is thought to be
more prominent in the shoot. When seleno amino acids inadvertently get incorporated into proteins, replacing Cys and Met, this impairs protein function and thus
results in toxicity (Stadtman 1990). Most plants can metabolize SeMet into volatile
dimethylselenide (DMSe), which may help avoid toxicity (Terry et al. 2000).
Another potential Se detoxification mechanism in plants is the breakdown of
SeCys into elemental Se and alanine (Van Hoewyk et al. 2005). Both volatilization
and breakdown of SeCys are nonspecific, using enzymes that function in S metabolism (Fig. 1; Terry et al. 2000; Van Hoewyk et al. 2007).
96
E.A.H. Pilon-Smits
In addition to these general mechanisms by which plants metabolize Se inadvertently, some plants may be able to discriminate between Se and S analogues, and thus
may be said to have Se-specific metabolism. These plants can, for instance, specifically methylate SeCys into methyl-SeCys, which serves as a very effective Se
detoxification mechanism since methyl-SeCys does not get incorporated into proteins (Neuhierl and Böck 1996). This methylation process is mediated by the enzyme
SeCys methyltransferase (SMT). The best-known plant taxa that contain this enzyme
are the so-called Se hyperaccumulator plants, which can accumulate up to 1.5 % of
their dry weight as Se (15,000 mg kg 1 DW, Beath et al. 1939a, b). However, SMT
has also been found in broccoli (Brassica oleracea) (Lyi et al. 2005), and methylSeCys has been found in several Allium species such as garlic (Ge et al. 1996). These
species are known to be sulfur-loving; they are not hyperaccumulators but do
accumulate appreciable amounts of Se non-specifically due to high levels of sulfate
uptake. They are sometimes referred to as Se accumulators.
True Se hyperaccumulation occurs in 4–5 genera in the Brassicaceae, Fabaceae,
and Asteraceae. They occur predominantly or even exclusively on seleniferous soils
(Beath et al. 1939a, b). Hyperaccumulators of Se have several properties that set
them apart from other species. They accumulate ~100-fold higher Se levels and
have higher tissue Se/S levels than surrounding vegetation (Lauchli 1993). While
most plants accumulate inorganic Se, hyperaccumulators accumulate organic forms
like methyl-SeCys and selenocystathionine (Anderson 1993). Since these forms of
Se do not interfere with S metabolism, hyperaccumulators are completely tolerant
to their extreme Se levels, and often even grow better under high-Se conditions than
without Se (Broyer et al. 1972; El Mehdawi et al. 2012). Like other plants,
hyperaccumulators can volatilize Se, but mostly in the form of dimethyldiselenide
(DMDSe), which originates from methyl-SeCys (Terry et al. 2000). Selenium
hyperaccumulators also show tissue-specific and organ-specific sequestration patterns that are different from other plants. Relative to non-accumulators, a larger
fraction of the Se in hyperaccumulators is translocated from root to shoot; also, a
larger fraction is remobilized from aging leaves to young leaves and reproductive
organs, particularly pollen and ovules (Quinn et al. 2011a, b). Within leaves,
hyperaccumulators store most of their Se in the vacuoles of epidermal cells,
which may include the trichomes (leaf hairs) (Freeman et al. 2006a, 2010). For
comparison, the non-hyperaccumulators Arabidopsis thaliana and Brassica juncea
were found to store most of their Se in the form of selenate in the vascular bundles,
and they contained higher Se levels in leaves than in floral tissues (van Hoewyk
et al. 2005; Freeman et al. 2006a; Quinn et al. 2011a). Interestingly, selenate uptake
in Se hyperaccumulators is not inhibited by sulfate, suggesting they have a selenatespecific transporter; this is in stark contrast to the non-hyperaccumulator B. juncea
(Harris, Schneberg, and Pilon-Smits, unpublished results) and may explain the
elevated Se/S ratios that are typical for hyperaccumulators (White et al. 2007).
Similarly, Se and S remobilization in hyperaccumulators follows different patterns,
both developmentally and seasonally (Galeas et al. 2007; Quinn et al. 2011a).
Selenium levels are highest in young leaves and reproductive tissues, while S levels
are highest in mature leaves. Leaf Se levels in the field peak in early spring, while
Selenium in Plants
97
leaf S levels peak in midsummer. In non-hyperaccumulators both Se and S levels
peaked in midsummer (Galeas et al. 2007).
3 Genetic and Evolutionary Aspects of Se Tolerance
and Accumulation
Plant species vary several orders of magnitude in their capacity to accumulate and
tolerate Se (Beath et al. 1939a, b; White et al. 2007). Based on maximum Se levels in
shoot tissues in the field, species may be classified as Se hyperaccumulator
(>1,000 mg Se.kg 1 DW), Se accumulator (100–1,000 mg Se.kg 1 DW), or
non-Se accumulator (<100 mg Se.kg 1 DW). True Se hyperaccumulation is found
in 4–5 genera from three different families, and probably evolved independently in
each lineage. Even within the genus Astragalus, Se hyperaccumulation may have
evolved multiple times, judged from its occurrence in more derived taxa that do not
form a natural group with a common ancestor. The polyphyletic origin of Se
hyperaccumulation suggests this trait can evolve relatively easily, and may be
controlled by relatively few genes. It is possible that there is a key gene such as a
transcription factor that controls a suite of genes that together bring about the
syndrome of hyperaccumulation and hypertolerance. Several studies have been
carried out to obtain better insight into the molecular mechanisms involved in Se
tolerance and accumulation, both in non-hyperaccumulators and hyperaccumulators.
Making use of model species A. thaliana, a non-Se accumulator, a comparative
study was performed with recombinant inbred lines (RILs). Several quantitative
trait loci (QTL) were identified that co-segregated with the higher selenate tolerance in accession Columbia compared to Landsberg erecta (Zhang et al. 2006a).
Several S-related genes are present in the identified QTL regions, including a
selenocysteine methyl transferase (SMT) homologue, an ATP sulfurylase, and a
serine acetyl transferase (SAT). In another study by Zhang et al. (2006b) comparing
nineteen different ecotypes of Arabidopsis with variable tolerance and accumulation of Se, the traits tolerance and accumulation were found to be not correlated.
Also, tolerance to selenate and selenite appeared to be controlled by different loci.
In another study with A. thaliana, a transcriptome analysis was performed on
plants grown with or without selenate (Van Hoewyk et al. 2008). It was found that
genes involved in ethylene and jasmonic acid pathways were upregulated by Se. In
agreement with a role for these hormones, Arabidopsis mutants with a defect in
genes involved in ethylene synthesis, ethylene signaling, and jasmonic acid signaling were shown to have reduced tolerance to selenate, and overexpression of a
protein involved in ethylene signaling resulted in increased selenate resistance (Van
Hoewyk et al. 2008). A similar study into selenite resistance by Tamaoki
et al. (2008) also pointed to the involvement of ethylene and jasmonic acid and
also suggested reactive oxygen species (ROS) may have a signaling role. Perhaps as
a result of their elevated levels of these hormones, the resistant accessions showed
98
E.A.H. Pilon-Smits
SeO42- / SeO32[ROS]
[Salicylic acid]
[Ethylene]
[Jasmonic acid]
Stress-responsive genes
Sulfur uptake and metabolism genes
Se resistance and accumulation
Fig. 2 Model for cellular plant responses to selenate or selenite that may play a role in Se
resistance and accumulation [from Tamaoki et al. (2008), Freeman et al. (2010)]. Taxa with
enhanced Se resistance were shown to have constitutively higher levels of the plant hormones
and gene transcripts indicated. This was found both for moderately Se-resistant ecotypes of
non-accumulator Arabidopsis thaliana and for Se hyper-tolerant hyperaccumulator Stanleya
pinnata. Note: enhanced reactive oxygen species (ROS) levels were observed in A. thaliana but
not in S. pinnata, while enhanced salicylic acid (SA) levels were observed in the hyperaccumulator
but not in A. thaliana
enhanced expression of genes involved in sulfate uptake and reduction, as well as
higher levels of total S and of reduced antioxidant S compounds. This may help the
plants prevent Se from replacing S in proteins and other S compounds, and prevent
Se-induced oxidative stress. The simple model shown in Fig. 2 summarizes these
responses in plants to selenate or selenite, and how they may lead to Se resistance
and accumulation.
The hyperaccumulator Stanleya pinnata, which is in the same family as
A. thaliana (Brassicaceae), may in part use similar mechanisms for Se tolerance
as A. thaliana (Freeman et al. 2010). The plant hormones JA and ethylene, as well
as the hormone salicylic acid (SA), were constitutively elevated in S. pinnata, as
compared to non-hyperaccumulator S. albescens. Probably as a response to the
elevated levels of these hormones, the hyperaccumulator had constitutively
upregulated expression of several sulfate transporters and S assimilatory enzymes,
and higher levels of total S and of reduced S compounds (including the antioxidant
glutathione), as well as higher levels of total Se. The mechanisms underlying some
of the other attributes of S. pinnata remain to be elucidated, such as its tissue- and
organ-specific Se sequestration patterns, in vacuoles of leaf epidermal cells and in
young leaves and reproductive organs (Freeman et al. 2006a, 2010). Also, the key
Selenium in Plants
99
mechanisms responsible for its capacity to store Se as methyl-SeCys and selenocystathionine remain to be elucidated. More genome-wide and genus-wide studies are
needed to reveal key genes for Se hyperaccumulation in Stanleya.
The driving force for the evolution of increasing plant capacity for Se accumulation and ultimately Se hyperaccumulation may be both physiological and ecological benefits. Many plant species show a positive growth response to Se, perhaps
due to enhanced antioxidant capacity (Cartes et al. 2005; Djanaguiraman
et al. 2005; Hartikainen 2005; Kong et al. 2005). There are also several ecological
benefits of the accumulation of Se, since it can protect the plant from a variety of
herbivores and pathogens, and maybe also have allelopathic effects on neighboring
plants. These ecological effects of plant-accumulated Se are described in more
detail in Sect. 5.
4 Genetic Engineering of Plant Se Metabolism
Several genes from the sulfate assimilation pathway were manipulated in order to
study the effect on plant Se tolerance and accumulation (see Fig. 1 for the function
of each of these enzymes). Overexpression in B. juncea of the key enzyme for the
reduction of selenate to selenite, ATP sulfurylase (from Arabidopsis thaliana),
resulted in enhanced production of organic Se as well as enhanced Se tolerance
and accumulation (Pilon-Smits et al. 1999). Therefore, this enzyme appears to be a
rate-limiting step for selenate assimilation in this Se accumulator. The ATP
sulfurylase overexpressors showed three- to fivefold enhanced Se accumulation
not only under controlled laboratory conditions but also when grown on naturally
seleniferous soil and on polluted sediment in the field, making them interesting
candidates for both biofortification and phytoremediation (Van Huysen et al. 2004;
Bañuelos et al. 2005).
Overexpression of an A. thaliana cystathionine-γ-synthase (CγS) in B. juncea
resulted in threefold enhanced Se volatilization from either selenate or selenite (van
Huysen et al. 2003), showing that this enzyme is a limiting factor for Se volatilization. Probably as a result of their enhanced Se volatilization rate, the CγS plants
accumulated 40 % less Se in their tissues, and were more tolerant to selenate
compared to untransformed plants. Similar results were obtained under laboratory
conditions and in a greenhouse pot experiment using naturally seleniferous soil
(van Huysen et al. 2004).
Another transgenic approach overexpressed SeCys methyltransferase (SMT)
from the Se hyperaccumulator Astragalus bisulcatus in A. thaliana and B. juncea
(Ellis et al. 2004; LeDuc et al. 2004). The SMT transgenics showed enhanced Se
volatilization and tolerance, as well as enhanced Se accumulation in the form of
nontoxic methyl-SeCys (Montes-Bayón et al. 2002; Meija et al. 2002). These
effects were more pronounced when supplied with selenite than selenate,
suggesting that conversion of selenate to selenite was a rate-limiting step for the
selenate assimilation pathway. Indeed, when double transgenic APSxSMT plants
100
E.A.H. Pilon-Smits
were created by crossing APS and SMT transgenics, they accumulated around eight
times more MeSeCys than the wild type and about twofold more than the SMT
transgenics (LeDuc et al. 2006).
In another genetic engineering approach, selenocysteine lyase (SL) from mouse
or from A. thaliana was expressed in A. thaliana and B. juncea. The SL enzyme
breaks down SeCys into alanine and insoluble elemental Se, which was predicted to
reduce the nonspecific incorporation of SeCys into proteins. Indeed, the SL transgenics showed reduced Se incorporation into protein (Pilon et al. 2003; Garifullina
et al. 2003; Van Hoewyk et al. 2005). The SL transgenics also showed enhanced Se
accumulation (up to twofold) compared to wild-type plants, both in controlled
laboratory conditions and in the field on Se-polluted sediment (Bañuelos
et al. 2007).
The results obtained with the various transgenics in the laboratory, greenhouse,
and field were similar. The different transgenics showed enhanced Se accumulation, volatilization, and/or tolerance. These are all promising traits for
phytoremediation or biofortification. Before Se-accumulating plants can be grown
on a large scale, however, whether they are wild type or transgenic, a careful
consideration needs to be done regarding the potential ecological implications
(Bañuelos et al. 2002). Studies on the ecological effects of plant Se accumulation
also help shed light on the functional significance of Se hyperaccumulation, and the
selection pressures that may have driven the evolution of Se hyperaccumulation.
These will be discussed in the next section.
5 Ecological Aspects of Se (Hyper)Accumulation
Plant Se (hyper)accumulation generally has a negative effect on Se-sensitive
ecological partners; this was found to be the case for plant interactions with
herbivores, neighboring plants, microbes, and perhaps also pollinators
(El-Mehdawi and Pilon-Smits 2012, and references therein). Selenium accumulation offers plants a broad protection against herbivores, due to a combination of
deterrence and toxicity. This protective effect can already be observed at tissue
levels as low as 10 mg Se kg 1 DW (Hanson et al. 2004). Selenium may also protect
plants against microbial pathogens (Hanson et al. 2003). There is also evidence that
hyperaccumulator plants use their accumulated Se in their competition with neighboring plants: soil around hyperaccumulators can be tenfold higher in Se due to
litter deposition and root exudation, and this may negatively affect germination and
growth of Se-sensitive competing plants (El Mehdawi et al. 2011a).
While Se in or around hyperaccumulators deters or is toxic to Se-sensitive
neighboring organisms, it also offers a potential exclusive niche for Se-tolerant
partners, which may actually benefit from this interaction via enhanced growth or
stress resistance. This was found for various hyperaccumulator-associated herbivores, microbes, and neighboring plants (for a review see El-Mehdawi and PilonSmits 2012). The two Se hyperaccumulators S. pinnata and A. bisulcatus both
Selenium in Plants
101
harbored Se-resistant herbivores in their natural habitat, which included Lepidoptera (moths), Coleoptera (beetles), and Hymenoptera (wasps). The Se resistance
mechanisms of these herbivores either consisted of an inability to break down
methyl-SeCys (protecting them from toxic SeCys incorporation into protein) or of
excluding Se from their tissues (Freeman et al. 2006b, 2012; Valdez Barillas
et al. 2012). There also is evidence of Se-resistant endophytic bacteria and fungi
in Se hyperaccumulators (Lindblom et al. 2013; Valdez Barillas et al. 2012) and
Se-resistant litter-decomposing microbes and micro-arthropods (Quinn
et al. 2011b). In addition, several Se-tolerant plant species were found to often
occur in the vicinity of Se hyperaccumulators, where they can accumulate an order
of magnitude higher Se levels compared to when growing away from hyperaccumulators. Interestingly, these Se-tolerant plant species profit from their enhanced
tissue Se levels, both physiologically (enhanced growth) and ecologically (reduced
herbivory) (El Mehdawi et al. 2011b). Selenium did not deter honeybees and other
potential pollinators (Quinn et al. 2011a; Hladun et al. 2012). The Se levels in
pollen and nectar of Se hyperaccumulators are extremely high; it remains to be
determined whether ingestion of Se-rich pollen and nectar poses a health hazard to
pollinators. In a preliminary survey the honey from seleniferous areas had slightly
elevated Se levels that would make it suitable as a Se-fortified food source for
Se-deficient consumers (Quinn et al. 2011a).
Through the combined negative and positive effects of Se hyperaccumulators on
their Se-sensitive and Se-resistant ecological partners they may affect plant, microbial, and animal species composition and species richness in the area that is under
their influence. It appears that specialized Se-tolerant herbivores, detritivores,
microbial symbionts, and perhaps also pollinators tend to evolve under the influence of Se hyperaccumulators, to occupy the extreme symbiotic niche offered by
these plants. Owing to these co-evolved symbionts, hyperaccumulator plants may
experience no net evolutionary cost of hyperaccumulation. The only apparent
limitation of Se hyperaccumulation is that it limits the geographic distribution to
seleniferous soils: hyperaccumulators appear to be physiologically or ecologically
dependent on Se for their competitive strength, perhaps because they have lost other
mechanisms to defend themselves against biotic or abiotic stress. There is also to
date no evidence for a physiological cost of Se hyperaccumulation (Prins
et al. 2011).
Selenium hyperaccumulators may play an important role in Se cycling through
seleniferous ecosystems. They transform inorganic forms of Se to organic forms,
concentrate this Se, and then disperse it back into their local environment and up the
food chain via Se-tolerant ecological partners. In Fig. 3 an overview is presented of
the processes in and by plants with respect to Se movement and transformation. It
also summarizes the effects of plant Se and plant processes on the biogeochemistry
of Se in the local ecosystem.
The ecological effects of plant Se accumulation have relevance for the management of seleniferous habitats, as well as applications in agriculture and
phytoremediation. Selenium is an essential trace element for most animals, but
also a toxin at higher level, with a very narrow window between Se deficiency and
102
E.A.H. Pilon-Smits
Plant Se influences
ecological relations
with:
- Pollinators
- Herbivores
- Pathogens
- Rhizosphere &
endophytic microbes
- Neighboring plants
- Decomposers
Volatilization
of DM(D)Se
Se transformation
from inorganic to
organic forms
Se sequestration
Se release
from litter
Se Se Se
Plant Se influences
biogeochemistry:
- Soil Se distribution
- Form of Se
- Se movement in
food chain
- Se cycling
Se translocation
in xylem and phloem
Uptake of inorganic Se
Se
Se
Se
Se exudation
Fig. 3 Plant effects on Se cycling and transformation, and potential effects of plant Se processes
on ecological partners. Inorganic Se: selenate, selenite; organic Se: methylselenocysteine or
selenocystathionine; volatile DM(D)Se: dimethyl(di)selenide. Typically, Se from plants has a
negative effect on Se-sensitive ecological partners, which may protect plants from pathogens
and herbivores, and have allelopathic effects on neighboring plants. Conversely, Se-rich plants
offer a niche to specialized Se-resistant partners (both mutualists and pathogens/herbivores), and
may select for their evolution
toxicity. Selenium from phytoremediation crops can be transferred biologically to
insects and mammals (Bañuelos et al. 2002). This may be beneficial if it reduces
herbivory (higher productivity, reduced need for pesticides) or if it accumulates in
low enough levels in the consumer (e.g., honeybee or other mutualist symbiont) to
have a beneficial health effect. If, however, Se in flowers should negatively affect
honeybee health this may have serious consequences for honeybee populations and
agricultural productivity (Hladun et al. 2012). The other ecological observation that
Se hyperaccumulators enhance Se levels in neighboring plants may be utilized in
co-cropping or intercropping, to boost Se levels in biofortified crops like wheat or
rice. Moreover, Se-tolerant endophytic or rhizosphere microbes isolated from Se
hyperaccumulators may have applications in bio- or phytoremediation, or in
biofortification, either in association with plants or by themselves. De Souza
et al. have already demonstrated the potential of bacteria isolated from seleniferous
Selenium in Plants
103
areas in enhancing plant Se accumulation and volatilization (1999). If Se-rich
plants affect Se cycling through their local ecosystem, this may have complex
ecological implications as well. It is advisable to consider these multifaceted
ecological implications when using Se-accumulating plants in agriculture or environmental restoration.
6 Conclusions and Future Prospects
Combined physiological, biochemical, and genetic/genomic approaches have
shown plant Se metabolism to largely follow S uptake and metabolic pathways.
Most plants cannot discriminate between Se and S and incorporate Se into all S
compounds. An exception to this rule are the Se hyperaccumulator plants, which
appear to be able to discriminate between Se and S, and to preferentially take up Se
over S. These plants also show different spatial and temporal patterns of Se and S
translocation and sequestration in organs and tissues. Selenium responses in plants
appear to involve the growth regulators JA and ethylene, and in hyperaccumulators
also SA. In response to higher levels of these growth regulators, the S assimilation
pathway is upregulated, as well as a variety of stress-related proteins. Se-resistant
taxa tend to have higher levels of these growth regulators and also a constitutively
upregulated S assimilation pathway. More extensive genomic studies are needed to
shed more light on Se hypertolerance and hyperaccumulation mechanisms. The
Brassicaceae hyperaccumulator S. pinnata and its non-Se accumulator, non-Setolerant relatives likely will be a good model system for such studies (El Mehdawi
et al. 2012; Feist and Parker 2001). Genetic engineering of genes from the S/Se
assimilation pathway has been successful in enhancing Se tolerance, accumulation,
and volatilization in plants, both under controlled laboratory conditions and in the
field on contaminated soil. These transgenics may be suitable for phytoremediation
or biofortification. Ecological studies have shown that Se accumulation protects
plants from a wide variety of herbivores, via both deterrence and toxicity, as well as
from some microbial pathogens. Thus, cultivation of high-Se plants may require
less herbicides. High-Se plants do not deter pollinators, and thus their effects on
pollinator health warrant further study. Selenium hyperaccumulators enhance Se
levels in neighboring plants, which may have a negative (allelopathic) effect if
these are Se sensitive, but a positive effect if they are Se tolerant, since it can protect
the neighbors from herbivores as well. Thus, co-cropping or intercropping of
popular phytoremediation/biofortification crops with hyperaccumulators may
enhance crop Se accumulation. In natural seleniferous ecosystems Se hyperaccumulators likely play an important role in Se biogeochemistry and Se movement in
the food chain. Moreover, through their positive effects on Se-resistant ecological
partners and negative effects on Se-sensitive partners, hyperaccumulators may
affect species composition at multiple trophic levels, and thus may be keystone
species. This will be an interesting area of further research.
104
E.A.H. Pilon-Smits
Acknowledgments Funding for Se research by Elizabeth A. H. Pilon-Smits was provided by the
National Science Foundation (grant # IOS-0817748).
References
Anderson JW (1993) Selenium interactions in sulfur metabolism. In: De Kok LJ (ed) Sulfur
nutrition and assimilation in higher plants—regulatory, agricultural and environmental aspects.
SPB Academic, The Netherlands, pp 49–60
Bañuelos GS, Vickerman DB, Trumble JT, Shannon MC, Davis CD, Finley JW, Mayland HF
(2002) Biotransfer possibilities of selenium from plants used in phytoremediation. Int J
phytoremediation 4:315–331
Bañuelos G, Terry N, LeDuc DL, Pilon-Smits EAH, Mackey B (2005) Field trial of transgenic
Indian mustard plants shows enhanced phytoremediation of selenium contaminated sediment.
Environ Sci Technol 39:1771–1777
Bañuelos G, LeDuc DL, Pilon-Smits EAH, Tagmount A, Terry N (2007) Transgenic Indian
mustard overexpressing selenocysteine lyase, selenocysteine methyltransferase, or methionine
methyltransferase exhibit enhanced potential for selenium phytoremediation under field conditions. Environ Sci Technol 41:599–605
Beath OA, Gilbert CS, Eppson HF (1939a) The use of indicator plants in locating seleniferous
areas in the Western United States. I. General. Am J Bot 26:257–269
Beath OA, Gilbert CS, Eppson HF (1939b) The use of indicator plants in locating seleniferous
areas in the Western United States. II. Correlation studies by states. Am J Bot 26:296–315
Broyer TC, Huston RP, Johnson CM (1972) Selenium and nutrition of Astragalus. 1. Effects of
selenite or selenate supply on growth and selenium content. Plant Soil 36:635–649
Cartes P, Gianfreda L, Mora ML (2005) Uptake of selenium and its antioxidant activity in ryegrass
when applied as selenate and selenite forms. Plant Soil 276:359–367
de Souza MP, Chu D, Zhao M, Zayed AM, Ruzin SE, Schichnes D, Terry N (1999) Rhizosphere
bacteria enhance selenium accumulation and volatilization by Indian mustard. Plant Physiol
119:565–574
Djanaguiraman M, Durga Devi D, Shanker AK, Sheeba JA, Bangarusamy U (2005) Selenium—an
antioxidative protectant in soybean during senescence. Plant Soil 272:77–86
El Mehdawi AF, Quinn CF, Pilon-Smits EAH (2011a) Effects of selenium hyperaccumulation on
plant–plant interactions: evidence for elemental allelopathy. New Phytol 191:120–131
El Mehdawi AF, Quinn CF, Pilon-Smits EAH (2011b) Selenium hyperaccumulators facilitate
selenium-tolerant neighbors via phytoenrichment and reduced herbivory. Curr Biol
21:1440–1449
El Mehdawi AF, Cappa JJ, Fakra SC, Self J, Pilon-Smits EAH (2012) Interactions of selenium and
non-accumulators during co-cultivation on seleniferous or non-seleniferous soil—the importance of having good neighbors. New Phytol 194:264–277
Ellis DR, Sors TG, Brunk DG, Albrecht C, Orser C, Lahner B, Wood KV, Harris HH, Pickering IJ,
Salt DE (2004) Production of Se-methylselenocysteine in transgenic plants expressing
selenocysteine methyltransferase. BMC Plant Biol 4:1–11
El-Mehdawi AF, Pilon-Smits EAH (2012) Ecological aspects of plant selenium hyperaccumulation. Plant Biol 14:1–10
Feist LJ, Parker DR (2001) Ecotypic variation in selenium accumulation among populations of
Stanleya pinnata. New Phytol 149:61–69
Freeman JL, Zhang LH, Marcus MA, Fakra S, McGrath SP, Pilon-Smits EAH (2006a) Spatial
imaging, speciation and quantification of selenium in the hyperaccumulator plants Astragalus
bisulcatus and Stanleya pinnata. Plant Physiol 142:124–134
Selenium in Plants
105
Freeman JL, Quinn CF, Marcus MA, Fakra S, Pilon-Smits EAH (2006b) Selenium tolerant
diamondback moth disarms hyperaccumulator plant defense. Curr Biol 16:2181–2192
Freeman JL, Tamaoki M, Stushnoff C, Quinn CF, Cappa JJ, Devonshire J, Fakra S, Marcus MA,
McGrath S, Van Hoewyk D, Pilon-Smits EAH (2010) Molecular mechanisms of selenium
tolerance and hyperaccumulation in Stanleya pinnata. Plant Physiol 153:1630–1652
Freeman JL, Marcus MA, Fakra SC, Devonshire J, McGrath SP, Pilon-Smits EAH (2012) Seeds of
Selenium Hyperaccumulators Stanleya pinnata and Astragalus bisulcatus are colonized by
Se-resistant, Se-excluding wasp and beetle herbivores. PLoS One 7(12):e50516
Fu L-H, Wang X-F, Eyal Y, She Y-M, Donald LJ, Standing KG, Ben-Hayyim G (2002) A
selenoprotein in the plant kingdom: mass spectrometry confirms that an opal codon (UGA)
encodes selenocysteine in Chlamydomonas reinhardtii glutathione peroxidase. J Biol Chem
277:25983–25991
Galeas ML, Zhang LH, Freeman JL, Wegner M, Pilon-Smits EAH (2007) Seasonal fluctuations of
selenium and sulfur accumulation in selenium hyperaccumulators and related
non-accumulators. New Phytol 173:517–525
Garifullina GF, Owen JD, Lindblom S-D, Tufan H, Pilon M, Pilon-Smits EAH (2003) Expression
of a mouse selenocysteine lyase in Brassica juncea chloroplasts affects selenium tolerance and
accumulation. Physiol Plant 118:538–544
Ge HH, Cai X-J, Tyson JF, Uden PC, Denover ER, Block E (1996) Identification of selenium
species in selenium-enriched garlic, onion and broccoli using high-performance ion chromatography with inductively coupled plasma mass spectrometry detection. Anal Commun
33:279–281
Hanson BR, Garifullina GF, Lindblom SD, Wangeline A, Ackley A, Kramer K, Norton AP,
Lawrence CB, Pilon-Smits EAH (2003) Selenium accumulation protects Brassica juncea from
invertebrate herbivory and fungal infection. New Phytol 159:461–469
Hanson BR, Lindblom SD, Loeffler ML, Pilon-Smits EAH (2004) Selenium protects plants from
phloem-feeding aphids due to both deterrence and toxicity. New Phytol 162:655–662
Hartikainen H (2005) Biogeochemistry of selenium and its impact on food chain quality and
human health. J Trace Elem Med Biol 18:309–318
Hladun KR, Smith BH, Mustard JA, Morton RR, Trumble JT (2012) Selenium toxicity to honey
bee (Apis mellifera L.) pollinators: effects on behaviors and survival. PLoS One 7(4):e34137
Kong LA, Wang M, Bi DL (2005) Selenium modulates the activities of antioxidant enzymes,
osmotic homeostasis and promotes the growth of sorrel seedlings under salt stress. Plant
Growth Regul 45:155–163
Lauchli A (1993) Selenium in plants: uptake, functions, and environmental toxicity. Bot Acta
106:455–468
LeDuc DL, Tarun AS, Montes-Bayon M, Meija J, Malit MF, Wu CP, AbdelSamie M, Chiang C-Y,
Tagmount A, deSouza MP, Neuhierl B, Bock A, Caruso JA, Terry N (2004) Overexpression of
selenocysteine methyltransferase in arabidopsis and Indian mustard increases selenium tolerance and accumulation. Plant Physiol 135:377–383
LeDuc DL, AbdelSamie M, Montes-Bayón M, Wu CP, Reisinger SJ, Terry N (2006)
Overexpressing both ATP sulfurylase and selenocysteine methyltransferase enhances selenium
phytoremediation traits in Indian mustard. Environ Pollut 144:70–76
Lindblom SD, Valdez-Barillas JR, Fakra SC, Marcus MA, Wangeline AL, Pilon-Smits EAH
(2013) Influence of microbial associations on selenium localization and speciation in roots of
Astragalus and Stanleya hyperaccumulators. Environ Exp Bot 88:33–42
Lyi SM, Heller LI, Rutzke M, Welch RM, Kochian LV, Li L (2005) Molecular and biochemical
characterization of the selenocysteine Se-methyltransferase gene and Se-methylselenocysteine
synthesis in broccoli. Plant Physiol 138:409–420
Meija J, Montes-Bayón M, LeDuc DL, Terry N, Caruso J (2002) Simultaneous monitoring of
volatile selenium and sulfur species from Se accumulating plants (wild-type and genetically
modified) by GC-MS and GC-ICP-MS using SPME for sample introduction. Anal Chem
74:5837–5844
106
E.A.H. Pilon-Smits
Montes-Bayón M, LeDuc DL, Terry N, Caruso J (2002) Selenium speciation in wild-type and
genetically modified Se accumulating plants with HPLC separation and ICP-MS/ES-MS
detection. J Anal At Spectrom 17:872–879
Neuhierl B, Böck A (1996) On the mechanism of selenium tolerance in selenium accumulating
plants. Purification and characterization of a specific selenocysteine methyltransferase from
cultured cells of Astragalus bisulcatus. Eur J Biochem 239:235–238
Pilon M, Owen JD, Garifullina GF, Kurihara T, Mihara H, Esaki N, Pilon-Smits EAH (2003)
Enhanced selenium tolerance and accumulation in transgenic Arabidopsis thaliana expressing
a mouse selenocysteine lyase. Plant Physiol 131:1250–1257
Pilon-Smits EAH (2005) Phytoremediation. Annu Rev Plant Biol 56:15–39
Pilon-Smits EAH, Hwang S, Lytle CM, Zhu Y, Tai JC, Bravo RC, Chen Y, Leustek T, Terry N
(1999) Overexpression of ATP sulfurylase in Indian mustard leads to increased selenate
uptake, reduction, and tolerance. Plant Physiol 119:123–132
Pilon-Smits EAH, Quinn CF, Tapken W, Malagoli M, Schiavon M (2009) Physiological functions
of beneficial elements. Curr Opin Plant Biol 12:267–274
Prins CN, Hantzis LJ, Quinn CF, Pilon-Smits EAH (2011) Effects of Selenium accumulation on
reproductive functions in Brassica juncea and Stanleya pinnata. J Exp Bot 247(62):5633–5640
Quinn CF, Prins CN, Freeman JL, Gross AM, Hantzis LJ, Reynolds RJB, Yang S, Covey PA,
Bañuelos GS, Pickering IJ, Pilon-Smits EAH (2011a) Selenium accumulation in flowers and its
effects on pollination. New Phytol 192:727–737
Quinn CF, Wyant K, Wangeline AL, Shulman J, Galeas ML, Valdez JR, Paschke MW, PilonSmits EAH (2011b) Enhanced decomposition of selenium hyperaccumulator litter in a seleniferous habitat—evidence for specialist decomposers. Plant Soil 341:51–61
Rayman MP (2005) Selenium in cancer prevention: a review of the evidence and mechanism of
action. Proc Nutr Soc 64:527–542
Sors TG, Ellis DR, Salt DE (2005) Selenium uptake, translocation, assimilation and metabolic fate
in plants. Photosynth Res 86:373–389
Stadtman TC (1990) Selenium biochemistry. Annu Rev Biochem 59:111–127
Stadtman TC (1996) Selenocysteine. Annu Rev Biochem 65:83–100
Tamaoki M, Freeman JL, Pilon-Smits EAH (2008) Cooperative ethylene and jasmonic acid
signaling regulates selenite resistance in Arabidopsis thaliana. Plant Physiol 146:1219–1230
Terry N, Zayed AM, de Souza MP, Tarun AS (2000) Selenium in higher plants. Annu Rev Plant
Physiol Plant Mol Biol 51:401–432
Valdez Barillas JR, Quinn CF, Freeman JL, Lindblom SD, Marcus MS, Fakra SC, Gilligan TM,
Alford ER, Wangeline AL, Pilon-Smits EAH (2012) Selenium distribution and speciation in
hyperaccumulator Astragalus bisulcatus and associated ecological partners. Plant Physiol
159:1834–1844
Van Hoewyk D (2013) A tale of two toxicities: malformed selenoproteins and oxidative stress both
contribute to selenium stress in plants. Ann Bot 112:965–972
Van Hoewyk D, Garifullina GF, Ackley AR, Abdel-Ghany SE, Marcus MA, Fakra S, Ishiyama K,
Inoue E, Pilon M, Takahashi H, Pilon-Smits EAH (2005) Overexpression of AtCpNifS
enhances selenium tolerance and accumulation in Arabidopsis. Plant Physiol 139:1518–1528
Van Hoewyk D, Abdel-Ghany SE, Cohu C, Herbert S, Kugrens P, Pilon M, Pilon-Smits EAH
(2007) The Arabidopsis cysteine desulfurase CpNifS is essential for maturation of iron-sulfur
cluster proteins, photosynthesis, and chloroplast development. Proc Natl Acad Sci U S A
104:5686–5691
Van Hoewyk D, Takahashi H, Hess A, Tamaoki M, Pilon-Smits EAH (2008) Transcriptome and
biochemical analyses give insights into selenium-stress responses and selenium tolerance
mechanisms in Arabidopsis. Physiol Plant 132:236–253
Van Huysen T, Abdel-Ghany S, Hale KL, LeDuc D, Terry N, Pilon-Smits EAH (2003)
Overexpression of cystathionine-γ-synthase in Indian mustard enhances selenium volatilization. Planta 218:71–78
Selenium in Plants
107
Van Huysen T, Terry N, Pilon-Smits EAH (2004) Exploring the selenium phytoremediation
potential of transgenic Brassica juncea overexpressing ATP sulfurylase or cystathionine
γ-synthase. Int J Phytoremediation 6:111–118
White PJ, Broadley MR (2009) Biofortification of crops with seven mineral elements often lacking
in human diets—iron, zinc, copper, calcium, magnesium, selenium and iodine. New Phytol
182:49–84
White PJ, Bowen HC, Marshall B, Broadley MR (2007) Extraordinarily high leaf selenium to
sulfur ratios define ‘Se-accumulator’ plants. Ann Bot 100:111–118
Zhang Y, Gladyshev VN (2009) Comparative genomics of trace elements: emerging dynamic
view of trace element utilization and function. Chem Rev 109:4828–4861
Zhang L, Byrne PF, Pilon-Smits EAH (2006a) Mapping quantitative trait loci associated with
selenate tolerance in Arabidopsis thaliana. New Phytol 170:33–42
Zhang L-H, Ackley AR, Pilon-Smits EAH (2006b) Variation in selenium tolerance and accumulation among nineteen Arabidopsis ecotypes. J Plant Physiol 164:327–336
Interplay of Water and Nutrient Transport:
A Whole-Plant Perspective
Lars H. Wegner
Contents
1
2
Introduction . . . . . . . . . . . . . . . . . . . . . . . . . . . . . . . . . . . . . . . . . . . . . . . . . . . . . . . . . . . . . . . . . . . . . . . . . . . . . . . .
Physico-Chemical Concepts to Describe Interactions
of Water and Nutrient Transport . . . . . . . . . . . . . . . . . . . . . . . . . . . . . . . . . . . . . . . . . . . . . . . . . . . . . . . . . .
3 A Brief Survey of Techniques Used to Measure Nutrient
and Water Fluxes in Plants . . . . . . . . . . . . . . . . . . . . . . . . . . . . . . . . . . . . . . . . . . . . . . . . . . . . . . . . . . . . . . . .
4 Radial Transport of Water and Nutrients in Roots: Transpiring Plants . . . . . . . . . . . . . . . . .
5 Radial Transport of Water and Nutrients in Roots: Root Pressure . . . . . . . . . . . . . . . . . . . . . .
6 Long-Distance Transport of Water and Nutrients in the Xylem . . . . . . . . . . . . . . . . . . . . . . . . .
7 Xylem Unloading and Water and Nutrient Transport in Leaf Tissues . . . . . . . . . . . . . . . . . .
8 Phloem Transport . . . . . . . . . . . . . . . . . . . . . . . . . . . . . . . . . . . . . . . . . . . . . . . . . . . . . . . . . . . . . . . . . . . . . . . . . .
9 The Whole-Plant Perspective: Macronutrients and Transpirational Flow . . . . . . . . . . . . . . .
9.1 Nitrogen (Nitrate and Ammonium) . . . . . . . . . . . . . . . . . . . . . . . . . . . . . . . . . . . . . . . . . . . . . . . . .
9.2 Calcium . . . . . . . . . . . . . . . . . . . . . . . . . . . . . . . . . . . . . . . . . . . . . . . . . . . . . . . . . . . . . . . . . . . . . . . . . . . . . .
9.3 Potassium . . . . . . . . . . . . . . . . . . . . . . . . . . . . . . . . . . . . . . . . . . . . . . . . . . . . . . . . . . . . . . . . . . . . . . . . . . . .
10 Conclusion . . . . . . . . . . . . . . . . . . . . . . . . . . . . . . . . . . . . . . . . . . . . . . . . . . . . . . . . . . . . . . . . . . . . . . . . . . . . . . . . .
References . . . . . . . . . . . . . . . . . . . . . . . . . . . . . . . . . . . . . . . . . . . . . . . . . . . . . . . . . . . . . . . . . . . . . . . . . . . . . . . . . . . . . . .
110
112
115
120
125
126
129
130
131
132
133
134
135
135
Abstract This review aims to summarise the many facets of how water flow in
higher plants affects nutrient transport and vice versa. Initially, some theoretical
background is given on physico-chemical concepts to describe fluxes and their (in)
direct coupling, followed by a brief overview on some of the relevant methods
(pressure probes, ZIM probe, MIFE technique, radioactive and stable isotopes,
MRT flow imaging, heat balance technique, modelling of nutrient fluxes). This
essay focusses on roots, on vascular tissues and on the whole-plant level, with only
occasional in-depth reference to the molecular scale. Radial water and nutrient
transport in roots are discussed in analogy to processes in mammalian epithelia,
L.H. Wegner (*)
Institute for Pulsed Power and Microwave Technology and Institute of Botany 1, Karlsruhe
Institute of Technology, Postbox 3640, 76021 Karlsruhe, Germany
e-mail: lars.wegner@kit.edu
© Springer International Publishing Switzerland 2015
U. Lüttge, W. Beyschlag (eds.), Progress in Botany, Progress in Botany 76,
DOI 10.1007/978-3-319-08807-5_5
109
110
L.H. Wegner
including a possible role of salt/water cotransporters for generating the “nonosmotic” component of root pressure. Moreover, the significance of low reflection
coefficients for the coupling of water and solute transport in roots is critically
addressed. Separate sections deal with interactions of water and nutrient transport
in vascular tissue (xylem, phloem). Finally, a whole-plant perspective is taken; the
significance of transpiration for plant nutrition in general, and for the nutrients N,
Ca and K in particular, is discussed.
1 Introduction
In the preceding volume of Progress in Botany, Lüttge (2013) pleaded for a revival
of an organismic approach to (whole) plant physiology. Examples for a holistic
view on plant science treating vascular plants as a highly integrated functional unit
were presented. The author recurred to earlier work from the 1970s and 1980s when
whole-plant physiology flourished, and also referred to more recent literature
standing in this tradition. Systemic responses of the plant, e.g. to stress or to nutrient
availability are highlighted that are brought about by electric, hydraulic and chemical signaling. The opposing concept that currently seems to dominate plant sciences considers the plant as an assembly of more or less autonomously acting
“modules”. According to this view, it is sufficient to study physiological process at
the molecular or cellular scale, since the key processes shaping plant life are
supposed to take place at this level: Gene expression can be seen entirely as a
cellular process with each cell being fully equipped with the required biochemical
machinery. The same is true for chemical interaction of a cell with its environment,
mediated by membrane proteins like receptors and ion channels; the information is
subsequently transduced, e.g. by transcription factors, leading, via an impact on
gene expression, to a modification of the chemical properties of cells (and, in turn,
of plant organs and the whole organism). Frequently, it is tacitly implied that
features of the organism can largely be extrapolated by simply scaling up cellular
processes. A separate discipline, systems biology, has evolved that is concerned
with the integration of molecular process at a higher organisational level. However,
rather than analysing data obtained by hypothesis-driven research, this discipline is
largely concerned with treating datasets obtained by “omics” approaches, using
statistical tools to find correlations among them. As pointed out by Lüttge, these
concepts of physiology tend to undervalue and neglect synergistic emergence as a
key feature of living organisms.
Here I want to elaborate on Lüttge’s view, referring to an aspect of emergence
that was given less attention in his preceding essay: Integration is not only an issue
with respect to different parts of the plant (e.g. root–shoot) or different tissues or
cell types. Another aspect is the integration of fluxes, namely those of water, ions,
energy and metabolites. Fluxes of energy and matter are key features of living
organisms, essentially operating away from thermodynamic equilibrium. These
fluxes are highly interactive. The focus of this paper, following my own expertise,
Interplay of Water and Nutrient Transport: A Whole-Plant Perspective
111
will be on the interaction of water and ion (nutrient) fluxes, with occasional
references to the other two.
The choice to focus on water and nutrient fluxes in this review article, rather than
on processes at the molecular level, was also guided by the following more specific
considerations:
• Several excellent reviews have been published in the last 5 years that provide a
comprehensive overview on our knowledge of different classes of transport
proteins, including ion channels (Hedrich 2012) and aquaporins (Maurel
et al. 2008). In order to avoid just being repetitive, it was preferable to take a
different viewpoint in this essay. By contrast, integrative features of the plant,
such as nutrient and water fluxes, received comparatively little attention
recently.
• Physiological processes are frequently organised in a highly redundant way with
respect to the contribution of various types of proteins. This contributes to the
plasticity of the organism and serves as a protection against a complete loss of
function by mutations. Hence, it may be difficult to quantify the contribution of a
particular protein to a physiological process (even though there are also striking
counter-examples; see, e.g. Gajdanowicz et al. (2011)).
• Fluxes are quantitative features of a biological system based on a firm physicochemical concept (see below) that are relatively easy to integrate into computational modelling of physiological processes. Theoretically, trans-membrane
fluxes can be traced back to the contribution of individual membrane proteins,
but in practice this link is still out of reach in many cases, among other things
because of the plasticity of transport processes (see previous bullet point).
Generally speaking, extreme environmental conditions provide the best opportunity to link physiological processes to the activity of a limited number of
proteins, since the plant’s response to a stress situation clearly dominates all
other processes. But such a situation may be a rare event in the life of a plant.
• Not all transport phenomena are mediated by proteins! Although membranes
(and membrane proteins) are major sites of control, nutrients and water on their
way from root to shoot pass through the bulk of various cellular and extracellular
compartments. (Electro)diffusion and mass-flow-driven transport of ions,
e.g. are important transport mechanisms.
• Fluxes can readily be interpreted in an ecological context, e.g. when the soil–
plant continuum is considered.
Of course, focussing on fluxes and their interaction does by no means preclude
highlighting the contribution of individual proteins in a transport process where this
is appropriate. Rather, the integrative approach that is favoured here implies that
processes at the higher organisation level (plant tissues, organs and the whole
organism) and emergence phenomena are given at least equal attention.
In this essay, I will focus on the macronutrients K, N (provided either as NO3 or
as NH4+) and Ca and ion-specific aspects of their interaction with water transport
[for their physiological roles, see Marschner (1995)]. Moreover, I will discuss
aspects of flux coupling relevant for all nutrients in a more general way.
112
L.H. Wegner
2 Physico-Chemical Concepts to Describe Interactions
of Water and Nutrient Transport
Generally speaking, a flux, Ji, denotes the number of molecules n of a species
i moving across a boundary area, A, (e.g. a membrane surface) per time increment:
Ji ¼
1 dni
A dt
ð1Þ
In order to quantify the transport of water, it is more convenient from an
experimental point of view to consider volume flow (Jv) rather than transport of
water molecules:
1 dnH2 O
Vw
Jv ¼
A dt
ð2Þ
V w ¼ molar volume of water (Note that for a dilute aqueous solution, the
contribution of the solutes to volume flow can be neglected).
A flux cannot be treated as a singular event, but is part of a complex pattern of
interconnected processes. In most textbooks dealing with this matter, coupling of
water and nutrient transport is solely considered with respect to the osmotic force
that solutes dissolved in water exert on water transport. Net transport of nutrients
across a membrane will alter concentration gradients and, via the concomitant
effect on the osmotic balance, will induce passive water transport. In plant cells,
water flow between a cell and its environment also affects the cell turgor P, i.e. the
hydrostatic overpressure inside the cell. In order to take the interplay of hydrostatic
and osmotic pressure into account, the water potential, Ψ , was defined that is
usually considered as the key parameter for water transport:
Ψ ¼Pπ
ð3Þ
with the osmotic pressure, π, calculated according to van’t Hoff’s law: π ¼ RT c
(R being the gas constant and T the absolute temperature in Kelvin). Where
appropriate, this equation has to be extended by a gravitational term ρ*g*h
(ρ being the density of the media, g the gravitational constant and h the height)
and a matrix potential τ (with a negative sign) taking into account the capillary
forces exerted by the cell wall material that have to be overcome when this material
is (partly) dehydrated.
Water is thought to follow the Ψ gradient, flowing from higher to lower
potential. However, this approach is not unambiguous, and some notes of caution
are required:
• Water flow is not induced by an osmotic gradient per se, but only between
compartments differing in osmotic pressure and separated by a semi-permeable
membrane. This second, mandatory prerequisite is fulfilled when water
Interplay of Water and Nutrient Transport: A Whole-Plant Perspective
113
exchange between cells and their environment is considered, but, e.g. usually not
for water transport within the apoplast. Osmotic gradients within a compartment
(in the absence of a semi-permeable transport barrier) dissipate by diffusion, not
by volume flow!
• Most importantly, direct interaction of water and solute transport during membrane passage is neglected by this approach. A number of studies published in
the 1980s of the last century seemed to justify this approach (e.g. Palta and
Stadelmann 1980). Evidence was provided that plant membranes are ideally
semi-permeable for physiologically relevant salts and sugars, implying that
direct interaction of water and solute transport is negligible, and solutions
exert their full osmotic pressure as a driving force for water transport. However,
recently Wegner (2014) has argued that water-solute cotransport across plant
cellular membranes needs to be re-considered in the light of previous advances
in our understanding of water secretion in mammalian epithelia [for a review,
see Zeuthen and MacAulay (2012)]. In specialised cell types like xylem parenchyma, transport proteins, e.g. those of the CCC class that carry a stoichiometrically fixed number of water molecules together with a salt (e.g. KCl) could
account for the generation of root pressure and refilling of embolised xylem
vessels (for a more detailed discussion of those physiological processes, see
below). Gradients in chemical potential of solutes could drive water secretion
across a membrane in the absence of a water potential gradient, or even against
it. Salt or sugar-driven water transport is not easy to detect, since it is necessarily
associated with a subsequent retrieval of the “lost” solutes by the cell to “recharge the battery” and thus keep the process going. This will, at some step,
require metabolic energy. Only constant cycling of solutes can drive sustained
water secretion, and net solute gradients may even not be affected by this
process. Seemingly futile cycling of solutes has indeed been demonstrated to
occur between symplast and apoplast in plant tissues, using sophisticated
radiaoactive labelling techniques (Britto and Kronzucker 2006). Although
osmotica are involved in this process, water flow is not driven by (local) osmotic
forces as hypothesised by Diamond and Bossert (1967). In their “standing
osmotic gradient” hypothesis that is fundamentally different from the one
proposed here, local cavities play a crucial role that are in free exchange with
the bulk via one end, whereas the other end is closed. Salt is actively transported
into the cavity at the closed end by adjacent cells. Due to passive water flow into
the cavity, the osmotic pressure is decreasing along its length; progressive
dilution towards the open end results in the constant export of a medium of
low osmotic pressure into the bulk. A similar mechanism was also proposed to
operate in plants, e.g. in salt glands (Pate and Gunning 1972; Lüttge 1975) and to
drive root pressure exudation (Katou et al. 1987), but neither in mammalian
epithelia nor in plant tissues clear experimental evidence in favour of this
hypothesis could be obtained.
Co-transport of water and solutes may, in fact, fundamentally change our view
of many processes in plants that involve a shift of water. Inside the water-filled
bladder traps of carnivorous Utricularia species, e.g. a hydrostatic underpressure of
114
L.H. Wegner
up to 17 kPa is generated with respect to the ambient pond water (Bentrup 1979).
Water efflux occurs against an osmotic gradient across the bladder walls consisting
of two cell layers. Hence, water is secreted against the water potential gradient that
favours water influx into the lumen of the trap. This could be brought about by
water-solute cotransport across the cellular membrane of the wall cells facing the
ambient medium, thus overcoming passive water influx. Consistently, generation of
underpressure is correlated with the export of K+, Na+ and Cl from the trap lumen
(Bentrup 1979). Fast movements, e.g. stomatal closure, as well as nastic responses
of leaves and leaflets to touch that are associated with water shift in pulvini, e.g. in
Mimosa pudica, may also operate by a water secretion mechanism involving
cotransport (Zeuthen 1996 p. 109; Morillon et al. 2001).
It should be noted that direct coupling of water and solute flow also occurs in
other transport proteins. Ion channels allow passage of ion and water, and it has
been demonstrated, e.g. for K+ channels that water flow can drive K+ transport
through the pores (Homblé and Véry 1992). Moreover, some aquaporins are not
only permeable to water but also to other small solutes such as urea or CO2 (Uehlein
et al. 2003).
A discussion of fundamental aspects of the coupling of water and nutrient
transport would be incomplete without mentioning unstirred layer effects. When
a transport barrier is more permeable to water than to solutes (as is the case with
semipermeable membranes), volume flow across that barrier will generate a local
concentration gradient across the membrane (and, in turn, an osmotic gradient that
counteracts volume flow). Solutes accumulate at the membrane in the “upstream
compartment” (concentration-polarisation) whereas in the “downstream compartment” solutes are diluted close to the membrane (sweep-away effect). Unstirred
layer effects are most pronounced in compartments that equilibrate by comparatively slow diffusion processes rather than by convection. For membrane transport
processes, actual concentrations at the membrane surface are more relevant than
bulk concentrations, but are also more difficult to measure! Unstirred layer effects
are frequently undervalued. They can have a strong impact on transport processes
and may be the actual cause of many interactions of water and solute transport
reported in the literature that are ascribed to membrane proteins.
A formalism taking co-transport of water and solutes across membranes into
account is provided by the following equation. (For the derivation of this equation
and the theoretical framework provided by the thermodynamics of irreversible
processes, the reader is referred to Zimmermann and Steudle (1978)):
J v ¼ LP ðΔP σΔπ Þ
ð4Þ
with LP being the hydraulic conductance of the transport barrier. Direct interaction
of water and solute transport is accounted for by the reflection coefficient σ. If the
membrane is ideally semipermeable, σ is close to unity and water and solutes move
independently across the membrane; σ values <1 provide evidence for an interaction of solute and water fluxes, e.g. by solute–water cotransport (Wegner 2014).
Solute-driven water flow counteracts water flow driven by osmotic forces (that is
Interplay of Water and Nutrient Transport: A Whole-Plant Perspective
115
largely mediated by aquaporins) and, hence, reduces the apparent impact of the
osmotic pressure gradient (whereas turgor-driven water flow remains unaffected).
Correspondingly, solute transport, Js, can be described as a sum of two components, one of them comprising the interaction with water flow (“solvent drag”),
whereas the other is equivalent to diffusion, i.e. flux driven by a concentration
gradient across the membrane (other forces are not taken into account):
J s ¼ J v cs ð1 σ Þ þ ϖΔcs
|fflfflfflfflfflfflffl{zfflfflfflfflfflfflffl} |fflffl{zfflffl}
solvent drag
ð5Þ
diffusion
c s and ω denote the averaged concentration of the solute s in both compartments
separated by a transport barrier (membrane) and the permeability for this solute,
respectively. These equations are unsuitable to describe the complex transport
phenomena at membrane level in all details (e.g. they neglect electrical forces).
However, they provide a simple mathematical framework for taking the interaction
of water and nutrient transport into account and can potentially be extended on the
basis of the simple formalism provided by the thermodynamics of irreversible
processes (Zimmermann and Steudle 1978). Interestingly, Eq. (5) is also valid in
the absence of a semipermeable membrane, e.g. when mass flow in the capillaries of
the cell wall matrix and in xylem vessels is considered. Under these conditions, σ
attains a value of zero, and Js is equal to Jv cs (ignoring the relatively slow
diffusion process that will make a small contribution to Js under these conditions).
Further refinement of our physico-chemical concepts will be required in the
future, e.g. to take non-linearities in the relationships between fluxes and driving
forces into account (Ciancio and Verhás 1994).
3 A Brief Survey of Techniques Used to Measure Nutrient
and Water Fluxes in Plants
In experimental sciences, progress is bound to the available methods, their advantages and limitations. Hence, it appears appropriate to introduce some of the
methods that are routinely used for recording nutrient and water fluxes and their
interactions. This summary and the information given on each of these methods
cannot be comprehensive, and suggestions for further reading will also be provided.
Pressure Probe Techniques In plants, hydrostatic pressures can vary over a wide
range, with overpressures of up to about 1 MPa prevailing in the cells (the “turgor
pressure”) to values below vacuum in functional xylem vessels [for a review, see
Zimmermann et al. 2004)]. Pressure gradients provide a major driving force for
volume flow; frequently, hydrostatic pressure data can be used to obtain information on changes in osmotic pressure and to determine the hydraulic conductivity of
a biological structure. The basic concept of the turgor pressure probe was initially
116
L.H. Wegner
introduced by Zimmermann et al. (1969); a fine-tipped glass capillary suitable for
impaling a cell is attached to a microbaric chamber carrying a miniature pressure
sensor. The interior of the chamber and the capillary are filled with silicone oil
forming—once being inserted—a meniscus with the cells sap that is kept at a
constant position close to the cell surface to eliminate artefacts related to the
elasticity of the probe during pressure recording (Tomos and Leigh 1999). Later,
this tool was modified in order to measure root pressure in excised roots (“root
pressure probe”; Steudle and Jeschke 1983), and to record xylem pressure in
individual vessels (“xylem pressure probe”; Balling and Zimmermann 1990). The
latter is filled with degassed water (or electrolyte solution) instead of oil (for
experimental details on this type of probe, see Zimmermann et al. (2004); Wegner
(2012)). Still later, an advanced version of the xylem pressure probe, the
multifunctional xylem probe, was developed (Fig. 1a). In addition to measuring
xylem pressure, this tool allows simultaneous recording of the electrical potential in
a xylem vessel with respect to a reference electrode outside the plant (the so-called
trans-root potential) and of ion concentrations (or rather, activities) in the xylem.
For multifunctional xylem probes, double-barreled electrodes are used; one barrel
serves for measuring xylem pressure and electrical potential. This barrel is attached
to the body of the microbaric probe (now additionally containing an Ag/AgCl
electrode), whereas the other one is prepared as an ion-selective electrode. For
more technical details, the reader is referred to a recent review by Wegner (2012).
Note that this instrument is particularly well suited to measure interactions of water
and nutrient transport, since the main driving forces for water and nutrient transport
are accessible at a particular site in the vascular system; probes measuring K+ and
pH have been published; moreover, a nitrate selective probe has been designed
(S. Scherzer and L.H. Wegner, unpublished).
The types of pressure probes introduced so far were predominantly devised for
use in the laboratory or greenhouse. They are hardly suitable for field studies,
though, and their use requires some effort and skill. Recently, however, a novel
type of pressure probe, the ZIM probe, has been introduced by Zimmermann and
coworkers, which offers a simple and inexpensive way for measuring relative
values of turgor pressure (changes) both in the field and the laboratory in real
time and with high precision. The ZIM probe makes use of a miniature pressure
sensor embedded in a polymeric matrix that is pressed to a leaf by magnetic force
(Fig. 1b); a magnetic counterpad is required at the opposite side of the leaf. Turgor
pressure of cells in the leaf patch covered by the probe tends to oppose the magnetic
force exerted upon the clamped leaf area. As a consequence, the pressure sensed by
the pressure sensor (the “output pressure”) is relieved, i.e. turgor pressure and
output pressure are inversely related [for details on the measuring principle, see
Zimmermann et al. (2013); Westhoff et al. (2009); Zimmermann et al. (2008);
Rüger et al. (2010)]. The ZIM probe has great potential for application, e.g. in plant
phenotyping and irrigation scheduling (Bramley et al. 2013), but it is also a very
useful tool for basic research. Rüger et al. (2010) could, e.g. monitor water shifting
in the canopy of Avocado and Eucalyptus trees when branches were differently
Interplay of Water and Nutrient Transport: A Whole-Plant Perspective
117
a
pressure transducer
double barreled
microcapillary
electrode 2
electrode 1
X
ISM
b
Fig. 1 Diagrams showing advanced pressure probe techniques. (a) Multifunctional xylem pressure probe (left), consisting of a microbaric Perspex chamber with miniaturised pressure sensor
attached to it. An Ag/AgCl electrode (electrode 1) is integrated into the probe for simultaneous
recording of hydrostatic pressure and electrical potential in an individual xylem vessel (x). A
double-barreled microcapillary is used. One barrel connects (in the impaled state) the lumen of the
xylem conduit with the probe for recording pressure and electrical potential, the second one is
designed as an ion-selective electrode (electrode 2) to measure, e.g. K+ or H+. The very tip of this
barrel is filled with an ion-selective matrix (ISM; under the “magnification glass”). An Ag/AgCl
electrode is inserted into this barrel to record the K+ potential. The experimental design for roots
is shown in the scheme on the right side. The potential difference of the two barrels corresponds
to the K+ potential; this potential is used to calculate the xylem K+ activity (aK+,xyl) based on
pre-/post-calibration of the ion-selective electrode. Moreover, the electrical potential difference
between a xylem vessel and an external electrode, the trans-root potential (TRP), is recorded. For
further details, see Wegner (2012). (b) Schematic diagram of the measuring principle of the
magnetic ZIM-probe. For more details, see the text
exposed to light; water was re-directed to those branches that suffered from
temporary drought stress. Uneven allocation of water to different branches was
also observed in oak trees during the course of the day (Fig. 2).
The MIFE Technique An elegant way to quantify ion fluxes at the surface of
plant organs or isolated cells is provided by the Microelectrode Ion Flux Estimate
(MIFE) technique originally designed by Ian Newman (for reviews, see Newman
2001; Shabala et al. 2012). The basic concept relies on the fact that ion fluxes across
118
L.H. Wegner
125
Pp [kPa]
100
75
50
100
T [°C]
60
40
10
00
04
08
12
16
20
R.H. [%]
80
20
24
Time [h]
Fig. 2 Multiple probe readings with the ZIM probe (Fig. 1b) on leaves of a 30-m tall oak tree for
one day (02 July 2013, Germany) together with the corresponding profiles of local air temperature
(T; lower panel; red line) and relative humidity (R.H.; lower panel, blue line; unpublished data,
U. Zimmermann and S. Rüger). Pp values (that are inversely proportional to leaf turgor pressures)
were normalised to the Pp range of the respective probes located on the west side. Nocturnal hours
are marked by grey bars. Probes were clamped in the east (black line) and in the west (grey line).
Please note the Pp oscillations due to stomatal oscillations during the day. For details see also
Zimmermann et al. (2008) and Rüger et al. (2010)
a membrane or the surface of a plant organ (such as the root) will establish an ion
gradient in a dilute medium bordering on that surface. This gradient is experimentally accessible by using ion-selective microelectrodes that constantly migrate
between two positions (at a distance of a few μm). From the known diffusion
coefficient of the dilute medium, ion fluxes can directly be calculated at a high
temporal and spatial resolution. An important prerequisite of this approach is,
however, that volume flow across the membrane is negligible, since volume flow
tends to build up local unstirred layers [see above, sect. 2. In fact, Pohl and
co-workers even made use of this fact to quantify volume flow across an ideally
semi-permeable membrane; Pohl et al. (1997)]. These volume-flow induced ion
gradients would tend to be misinterpreted in the theoretical framework of the MIFE
theory.
Use of Isotopes to Label H2O or Certain Nutrients An early boost in plant
transport physiology in the 1960s and 1970s profited from the availability of
radioactive tracers for chemical elements relevant for plant nutrition, particularly
H (3H, to label water), K (86Rb), N (13N), S (35S) and 32P. When fed, e.g. to the root,
distribution of these tracers in the plant could easily be followed by local recording
of radiation, e.g. by scintillation. Moreover, techniques for measuring and
interpreting washout kinetics of radioactive tracers (Metzner et al. 2008) were
developed (Britto and Kronzucker 2013). A particular challenge is provided by
Interplay of Water and Nutrient Transport: A Whole-Plant Perspective
119
short-lived radioisotopes such as 42K (half life about 12 h). In the meantime, rare
stable isotopes also gained popularity as tracers (e.g. 41K, 26Mg, 15N, 44Ca, 18O and
2
H (¼deuterium) for labelling water); these isotopes can be identified by mass
spectrometry, e.g. with high spatial resolution in combination with cryomicroscopy (Secondary Ion Mass Spectrometry ¼ SIMS-technique; Metzner
et al. 2008). A definite advantage of using isotopes as tracers is that unidirectional
fluxes can (initially) be measured. This can provide information, e.g. about rapid
cycling of ions across membranes (Britto and Kronzucker 2006) that is unavailable
by any other technique.
Isotope labelling proved to be ineffective for measuring water flow in plants
because of the extremely fast exchange kinetics of water, but other techniques are
available to measure volume flow.
Flow Imaging by MRT Nuclear magnetic resonance tomography (MRT) provides a convenient way to monitor, among other things, volume flow with a high
temporal and spatial resolution. It is a big advantage of this technique that it is truly
non-invasive. The technique has been used, among other things, to monitor xylem
and phloem flow simultaneously (Rokitta et al. 1999; Peuke et al. 2001). Flow
imaging takes advantage of the fact that non-aligned H-spins move into the
measuring plane during scanning. From the data, a flow velocity can be calculated;
by multiplication with the conducting area (that can be obtained from flow images)
volume flow becomes accessible (e.g. Schulze-Till et al. 2009).
Sapflow Measurements Based on Local Heating While the MRT technique
provides very detailed information on volume flow, but is challenging from a
technical point of view and requires sophisticated equipment, the heat dissipation
or heat balance techniques provide a simpler alternative suitable for field studies
(Smith and Allen 1996; Renninger and Schäfer 2012). Local, constant heating of a
shoot (e.g. a tree trunk) leads to subsequent convection in the tissue until a constant
temperature (measured with respect to a second thermocouple some 10–15 cm
below the first one, serving as a reference) is attained. At this point of time energy
input equals dissipation. Sap flow passing the electrode will lower this temperature,
and the temperature drop is a direct measure of volume flow (also called thermal
dissipation or Granier-style probe). Alternatively, sapwood is heated locally and the
asymmetrical temperature increase below and above that site (upstream and downstream, respectively) is monitored that is related to volume flow (heat balance
technique in the strict sense, or heat field deformation). Because of their technical
simplicity these as well as related methods have frequently been used especially to
measure transpirational flow in trees, but there is some debate on the reliability of
volume flow data obtained this way (Shackel et al. 1992; Renninger and Schäfer
2012).
Flow Modelling According to the Method of Pate and Jeschke An amazingly
simple and efficient way of ex post modelling of fluxes of nutrients between root
and shoot is provided by tapping xylem and phloem sap from individual plants and
subsequently harvesting root and shoot biomass to analyse them with respect to the
120
L.H. Wegner
particular nutrient of interest (Jeschke and Pate 1991). From these data, xylem and
phloem fluxes as well as total net uptake by the root can be estimated for the whole
lifetime of the plant [summarised, e.g. by Peuke (2010)]. A critical point is that the
composition of vascular saps may be highly variable with time and data just
represented a—somewhat arbitrary—snapshot, whereas the nutrient content of
root and shoot tissue has evolved over the whole lifetime of that plant.
4 Radial Transport of Water and Nutrients in Roots:
Transpiring Plants
Uptake of water and nutrients by roots and subsequent radial transport into xylem
vessels provides a good case study to illustrate the more general considerations
outlined in Sects. 1 and 2. The cellular membrane of cortex cells is frequently
considered to be the primary interface separating the plant from its local environment, the adjacent soil (Schroeder et al. 2013; Wang et al. 2012). A plethora of
transport proteins co-located in this membrane has been studied in much detail.
However just focusing on the membrane level would be too reductionist a view on
transport processes in this highly complex organ. It is more adequate to adopt a
concept well known from animal physiology and to consider root tissue as an
epithelium consisting of several cell layers that separate two extracellular compartments: The lumens of the (dead) xylem vessels in the root centre, and the soil
solution at the periphery of the root. In analogy to mammalian epithelia, transfer of
water and nutrients across this barrier can occur symplastically—via the cells and
plasmodesmata connecting them—or apoplastically, i.e. via the cell walls.
Apoplastic transport is limited by the Casparyian band, with suberin depositions
in the cell wall of the endodermis in its mature state, separating the cortex from the
stele in the root centre. In some species the exodermis forms an additional, more
peripheral transport barrier in the root apoplast. Some research effort has been
invested into quantifying the relative contributions of the two transport pathways—
symplastic and apoplastic—to radial water and nutrient transport. Many researchers
favoured the “composite transport model” that was originally proposed and promoted by E. Steudle and coworkers (Steudle and Peterson 1998; Steudle 2000a),
based on results obtained with the root pressure probe. When the root is challenged
with a hyper-osmotic shock by adding various osmotica to the ambient medium, in
many cases the root pressure drop did not match the change in external osmotic
pressure, indicating that the radial reflection coefficient (calculated from the ratio
σ r ¼ ΔP/Δπ) is significantly lower than unity. Following the “composite
membrane” model, the root reflection coefficients were considered a measure to
quantify the contribution of the cellular pathway (for which σ r ¼ 1 was assumed for
many osmotica) to overall volume flow; consistently, a σ r value of 0 was ascribed to
the apoplastic pathway (Steudle 2000b). Steudle and co-workers concluded from
their root pressure probe measurements that the apoplastic pathway contributed
Interplay of Water and Nutrient Transport: A Whole-Plant Perspective
121
significantly to radial water transport in many species. However, more recently the
composite transport model and the experimental approach on which it was based
were heavily critisised for various reasons. Bramley et al. (2007) identified
technical flaws in the use of the root pressure probe and the interpretation of the
probe data when performing experiments with two probes each attached to one cut
surface of a root segment. Moreover, Bramley et al. insisted that the experimental
procedures to determine hydraulic conductivity and reflection coefficient of the root
were prone to produce artefacts, since they tend to affect local gradients in water
potential (and gradients in solute concentrations) and give rise to unstirred layers
(see also the rebuttal by Steudle and coworkers; Knipfer et al. (2007)). Unstirred
layer effects could also be responsible for low values of radial root reflection
coefficients. Most likely the significance of the apoplastic pathway is erroneously
over-estimated when these effects are neglected.
The same conclusion was drawn, about a decade before, by Schneider
et al. (1997a, b) from their osmotic experiments on intact seedlings of maize, barley
and wheat using the xylem pressure probe. Schneider et al. observed that the radial
reflection coefficient in roots challenged with an osmotic shock strongly depended
on the transpiration rate. In accordance with Steudle (2000a, b), apparent σ values
were significantly smaller than one in roots of non-transpiring plants and at low
transpiration rates, but increased to unity when transpiration was stimulated by the
light regime. Only at peak photon densities prevailing in greenhouses on Hawaii at
noon, σ values passed through a maximum and tended to decrease again. Schneider
et al. (1997a) argued that transpiration-driven flow would tend to abolish unstirred
layer effects to some extent, leading to an increase of apparent σ values. Consistently, it could be shown that the transpiration rate remained unaffected by the
osmotic challenges in those experiments, with the exception of seedlings exposed to
extremely high irradiation rates. It was concluded that radial water flow was
predominantly symplastic and that low σ values were due to unstirred layer effects,
but not to an apoplastic bypass for water transport, at least in the cereals tested in
those studies. The same conclusion was later drawn by Knipfer and Fricke (2010)
when repeating earlier experiments on barley with the root pressure probe while
stirring the external medium. Evidence against the composite transport model was
also obtained by Fritz and Ehwald (2011). For maize, they investigated radial
transport into the root xylem of mannitol and other test solutes that are known to
be almost membrane-impermeable. Hence, radial root transport of these solutes is
necessarily predominantly apoplastic. In contrast to the predictions of the composite transport model, no evidence for a solvent drag effect in the transport rates of
these solutes was obtained and the radial root reflection coefficient was close to
unity; transport into the xylem did occur, however, but it was largely diffusive,
leading Fritz and Ehwald to the conclusion that the endodermis prevented radial
water transport in the root, but retained some permeability to solutes like mannitol.
The same conclusion may be true for Ca2+ (White 2001). Suberins and waxes are
generally thought to form an effective diffusion barrier. Therefore, apoplastic
diffusion of solutes across the endodermis is most likely restricted to the developing
root zone where cell walls are not fully suberised, especially at passage cells, and at
122
L.H. Wegner
sites of lateral root formation. However, no real quantitative information is available on the permeability of suberin layers to solutes as pointed out, e.g. by
White (2001).
While radial reflections coefficients were apparently misinterpreted in the past,
this is no reason to dismiss these results. On the contrary, apparent reflection
coefficients provide insight into the response of the plant root to an osmotic
challenge. Values significantly lower than one imply that the impact of soil osmotic
pressure fluctuations on xylem pressure is damped. This is highly beneficial for the
plant, since a drop in xylem pressure to very negative values could entail cavitation.
The previous discussion of radial root transport at the organ level has revealed
severe conceptual as well as methodological problems of techniques to measure
interaction of water and nutrient transport at the organ level. Even though there are
no “artefact-free” methods in physiology, it is important to remain aware of
potential sources of error and to minimise them as far as possible. A major problem
of the root pressure probe (and some other techniques) is that work is done on
excised roots and relevance for intact, transpiring plants is questionable (Shabala
et al. 2009). Moreover, transport parameters and flux data are extracted under rather
non-physiological conditions. It was vigorously debated, e.g. whether pressure
clamp or pressure pulse relaxation protocols would be more suitable to determine
the hydraulic conductance of the root, but the reader is left with the conclusion that
eventually both approaches are inadequate. Physiologically meaningful data on root
hydraulic conductance of transpiring plants can only be obtained with steady-state
volume flow and at a “free-running” xylem pressure under transpirational control.
While volume flow can be assessed gravimetrically (Wegner and Zimmermann
2009), using the heat balance technique or by gas exchange measurements, xylem
probes are the only instruments to provide us with relevant data on hydrostatic
xylem pressure. Therefore, Wegner and Zimmermann (2009) revisited the problem,
using a multifunctional xylem probe that allowed to record xylem K+ in addition to
xylem pressure (Fig. 3). With this approach, root hydraulic conductance could be
calculated for intact maize seedlings according to Eq. (4) using steady-state data.
All parameters were experimentally accessible, assuming the osmolarity of the sap
to be four times the K+ activity. Interestingly, both hydraulic conductance and
radial K+ transport depended in a non-linear way on radial volume flow (Fig. 4a–c),
but not directly on hydrostatic xylem pressure, the main driving force for radial
volume flow. However, in the light of the context described above this was not
interpreted in terms of a solvent drag effect in the strict sense. Rather, it was argued
that radial volume flow into the xylem leads to an accumulation of K+ in xylem
parenchyma cells, building up a steep K+ concentration gradient across the membrane of these cells. This will lead to an enhanced rate of K+ efflux because of an
increase in the driving force; moreover, the open probability of the relevant ion
channel, the K+ outward rectifier SKOR (Liu et al. 2006), is enhanced by an
increase in cytosolic K+, providing an additional feedforward effect. Non-linear
dependence of volume flow on the driving force is probably due to the regulation of
aquaporins in inner cortex and endodermis cells that serve as a bottleneck for radial
water transport (Wegner and Zimmermann 2009). Evidence for an enhancement of
Interplay of Water and Nutrient Transport: A Whole-Plant Perspective
123
a
Px (MPa)
*
10
70
300
0.1
0.0
-0.1
50
100
150
Time (min)
-1
Jv,r (µl min gFW )
b
-1
10
5
4
0
)
FW
-1
0
-1
(nmol min g
JK+,cx; JK+,exp
10
a K+,xyl (mM)
2
5
0
50
100
150
80
1
1
20
10
1
1
60
0
5
10
15
-1
-1
Jv,r (µl min gFW )
40
1
1
10
1
5
1
1
0
80
-1
40
5
d
-1
60
-1
-1
JK+,cx (nmol min gFW )
c
JK+,cx (nmol min gFW )
Time (min)
20
0
-0.15
1
-0.10
-0.05
0.00
0.05
Px (MPa)
Fig. 3 Dependence of various water and K+ transport parameters on a varying light regime in a
maize seedling. Response of xylem pressure (Px), radial volume flow (Jv,r), xylem K+ activity
(aK+,xyl), K+ flux into the xylem (JK+,cx) and K+ export to the shoot (JK+,exp) to a stepwise increase
and subsequent decrease of light irradiation was recorded with a multifunctional xylem probe (see
Fig. 1a) and simultaneous gravimetrical recording of water uptake by the seedling. Bars on top of
the figures indicate the time schedule of light regime changes (in μmol m2 s1); Fig. 1a shows the
time course of xylem pressure. Impalement of a xylem vessel (indicated by asterisk) at laboratory
light (10 μmol m2 s1) was associated with a pressure drop from atmospheric to 0.44 MPa. In (b),
the radial volume flow (top trace), the xylem K+ activity (middle trace) as well as the K+ flux into
the root xylem (bottom, thin line) and, almost identically, the K+ export to the shoot (bottom, thick
line) are plotted with time for the same experiment. Note that for technical reasons, recording of
Jv,r started with a delay of about 15 min with respect to impalement. For this ( filled inverted
124
L.H. Wegner
LP (m s-1 MPa-1 10-7)
1.5
1
0.5
0
1
3
5
7
9
11
Days after Transfer
Fig. 4 The hydraulic conductance recorded on individual root cortex cells of cotton depends on
the nutritional status of the plant. The experiment was performed with a cell pressure probe. Seeds
were allowed to germinate on moist vermiculite and transferred at day 3 (arrow) either to a full
nutrient solution (open symbols) or to a –N medium composed in the same way except for nitrate
being replaced by chloride (solid symbols). Note that hydraulic conductance dropped on a daily
basis in root cells deprived of N, whereas the drop in fully supplied roots was less pronounced.
After Radin and Matthews (1989), with modifications
K+ and nitrate loading into the xylem by volume flow was also obtained by Schurr
and Schulze (1995) on intact castor bean plants (but not on detopped root systems!).
Xylem sap was sampled locally at a site of incision of the shoot while pressurising
the root system. This approach was retrospectively justified by the observation of
Wegner and Zimmermann (2009) that xylem pressure has no direct effect on the
rate of xylem loading of K+. Schurr and Schulze found little dependence of the K+
and nitrate concentrations in the xylem sap on volume flow in the range tested
experimentally (in contrast to the detopped root system that rendered a hyperbolic
dependence). This pinpoints to an increase in the rate of xylem loading for both ions
with the radial volume flow. Moreover, the importance of using intact plants for
those studies is again highlighted by their study!
Fig. 3 (continued) triangle) as well as four other seedlings, dependence of JK+,cx on Jv,r and Px is
shown in (c) and (d), respectively. The sequences of light regimes for these experiments were
(irradiance in μmol m2 s1): 10–70–300–70–10 ( filled circle, filled inverted triangle, filled
triangle); 10–70–300 ( filled square). The index “1” indicates the starting value for the respective
experiment. Despite some hysteresis, plants could be divided into two groups with respect to the
dependence of JK+,cx on Jv,r as indicated by shaded areas in (c): In three plants, K+ flux was close to
zero in the absence of volume flow, whereas in two further plants, extrapolation yielded a
considerable rate of xylem loading at zero volume flow (about 15 nmol min1 gFW1). A weak
correlation was also found between JK+,cx and Px (d), but separate experiments revealed that
varying Px at a constant volume flow would not affect xylem loading of K+ (not shown). For more
details, see Wegner and Zimmermann (2009)
Interplay of Water and Nutrient Transport: A Whole-Plant Perspective
125
5 Radial Transport of Water and Nutrients in Roots: Root
Pressure
The xylem pressure probe and its further developments proved to be very useful
tools to study water and nutrient transport in transpiring plants. However, since a
below -atmospheric pressure is required to locate the probe tip in a vessel with
certainty, these probes are not suited to impale roots of non-transpiring plants
building up root pressure. From a physiological point of view, root pressure is a
special case; it dominates long distance water transport, e.g. in very young seedlings and at a water-saturated atmosphere. According to most textbooks, radial
water flow is driven by an osmotic overpressure of the xylem sap with respect to the
ambient medium. However, this explanation is at least insufficient to describe the
phenomenon adequately; there are many reports in the literature that water secretion into the vessels prevails in the absence of an osmotic gradient between xylem
sap and ambient medium, or even against such a gradient. The latter observation has
puzzled researchers for decades (Oertli 1966; Enns et al. 2000). Recently Wegner
(2014) has reviewed the available experimental evidence and suggested a new
hypothesis to explain root pressure [and root pressure exudation; i.e. constant
“bleeding” from the cut surface(s) of excised roots, root segments and even cortex
sleeves after the removal of the stele (Volkov and Zholkevich 1993)] by a “nonosmotic” mechanism. It was suggested that water secretion across the plasma
membrane of xylem parenchyma cells is driven by a cotransport of water and
solutes as previously shown for mammalian epithelia; solute concentration gradients across the cellular membrane of xylem parenchyma cells are supposed to
provide the free energy to drive water secretion into the xylem vessels, even against
a gradient in the chemical potential of water (or “water potential”). For various
mammalian epithelia, T. Zeuthen and his co-workers provided multiple evidence
for the existence of membrane transporters that co-translocate solutes and water at a
fixed stoichiometry (Zeuthen and MacAulay 2012; Zeuthen 2010). A key role is
apparently played by transporters of the CCC type that transport either KCl, NaCl
or both salts simultaneously together with a fixed number of 150–500 water
molecules. In order to maintain the ionic gradient across the membrane that is
dissipated by this transport step, ions have to be retrieved again from the extracellular compartment at the expense of metabolic energy.
Interestingly, homologues of the CCC family have also been discovered in
plants. Kong et al. (2011) cloned a cation-chloride cotransporter in rice that
seems to translocate K+, but not Na+. These authors tested subcellular localisation
of a CCC–GFP fusion protein and could demonstrate that the protein was predominantly allocated to the plasma membrane. The only CCC-type transporter found in
Arabidopsis showed also highest homology with the subfamiliy of KCl
cotransporters (the KCCs), but reconstitution in oocytes showed that 86Rb+ (as a
tracer for K+) was only translocated in the presence of Na+, indicating that this
transporter functions like cotransporters that transport Na+ and K+ together with
two Cl ions (the NKCCs; Colmenero-Flores et al. (2007)). Interestingly, the
126
L.H. Wegner
cotransporter found in Arabidopsis turned out to be prominently expressed in
vascular tissue. It is well conceivable that these transporters are involved in the
directed, radial transport of water into xylem vessels by which root pressure is built
up, although availability of Na+ and Cland the gradients of these ions are a critical
factor. It is unknown whether the plant transporters can also work with other anions
like nitrate that are of no relevance for the animal system, nor is any information on
water permeability of the plant transporters available yet. A major challenge to the
“water cotransport hypothesis” both in mammalian and plant tissues is also provided by the presence of aquaporins in the cellular membranes of the cells that tend
to dissipate any water potential gradient; however, it could be shown by model
calculations (Wegner 2014) that cotransporters could operate against a moderate
hydraulic conductance of the membrane. Re-absorption of K+ and Na+ (required for
“keeping the battery charged”) would be brought about by inward-rectifying K+
channels in xylem parenchyma cells (Wegner and Raschke 1994; Wegner
et al. 1994) and HKT transporters, respectively. For Cl, this role could be played
by Cl/2H+ symporters. Note that salt release by cotransporters is an electroneutral
process (Zeuthen and MacAulay 2012) and would not interfere with K+ re-uptake
by ion channels that requires a membrane potential more negative than the Nernst
potential of K+, which is maintained by proton pump activity. Evidence for “simultaneous” uptake and release of K+ has indeed been obtained for root tissue, using
refined radioactive tracer techniques (Britto and Kronzucker 2006). Rapid, seemingly “futile cycling” of ions is apparently a common phenomenon at root membranes that was found for K+, Na+ and Cl and becomes more prominent at elevated
concentrations of these ions.
Co-transport of water together with one or more substrates is not a unique
property for the CCC transporters. The Na+-glucose co-transporter SGLT1 and
the glucose transporter GLUT1 also translocate water at a fixed stoichiometry (Loo
et al. 1999; Zeuthen 2010), and evidence was obtained that the same is true for a
range of amino acid transporters, including those from plants. Even ion channels,
that co-transport 4–12 water molecules together with one ion, could be involved in
water secretion (Wegner 2014), provided that ion release into the xylem and
re-absorption occur via different pathways and differ in ion/water stoichiometry,
and that the membrane potential oscillates continuously. Further research into this
direction is required in the near future. For more details on this matter, the reader is
referred to the original publication (Wegner 2014).
6 Long-Distance Transport of Water and Nutrients
in the Xylem
Axial transport of water and nutrients from roots to shoot occurs via the xylem,
more precisely—in angiosperms—via both xylem vessels (trachees) and tracheids
that form a continuum of highly interconnected pipelines extending from the fine
Interplay of Water and Nutrient Transport: A Whole-Plant Perspective
127
roots to the leaves. Nutrients dissolved in the xylem sap are transported upwards by
the transpiration-driven mass flow, i.e. nutrient transport is proportional to volume
flow. Volume flow depends on vessel anatomy, i.e. on the geometric properties of
the conduits, and on local pressure gradients and is, to a first approximation, well
described by Hagen–Poiseuille’s law (Nobel 1991). Mechanisms of mass flow in
the xylem against gravity have been debated violently during the last decades; the
more than 100-year-old cohesion-tension theory has been questioned repeatedly
and obviously needs at least modifications and extension (Zimmermann et al. 2004;
Wegner 2014), but this will not be discussed in more detail here.
While coupling of nutrient and water transport in the xylem conduits follows
quite simple physical principles, some aspects require special attention. Those are
(1) the ion exchanger properties of the matrix of the xylem walls that can buffer
changes in the ionic composition of the xylem sap by selective de- and resorption of
ions; (2) the effect of K+ and other cations dissolved in the xylem sap on the
hydraulic conductance of the interconnecting pits and, hence, the entire xylem and
(3) the role of adjacent cells in changing the composition of the xylem sap.
The “chromatographic effect” of the xylem walls for ions results mainly from
fixed negative charges of polygalacturonic acids that are part of the pectic matrix;
this effect is highly dependent on the protonation of carboxylic groups and, hence,
on xylem sap pH (Wolterbeek 1987). The interaction, preferentially of divalent
cations with xylem walls and the role of these processes in translocation in the
xylem, was investigated in a range of classical papers (Bell and Biddulph 1963; van
Ieperen et al. 2000; de Geijn and Petit 1979; Wolterbeek 1987). Xylem walls were
found to have a fixed cation exchange capacity (CEC) and tend to bind divalent
cations (Ca2+, Cd2+) tightly (but less than chelators like EDTA). Hence, an increase
in divalent cation concentration in the sap would be buffered by the xylem wall.
This buffering effect would be even more pronounced with respect to ion exchange
between xylem and adjacent cells and the phloem.
While in the past the xylem conduits were considered to have a fixed hydraulic
conductivity mostly resulting from the length and diameter of the vessels and being
invariant to short-term adjustment, this view started to change gradually during the
last decade. Ion-mediated regulation of xylem conductivity (frequently shorttermed the “the ionic effect”) was originally demonstrated by M. Zimmermann
(1978) and later revisited by van Ieperen et al. (2000) and Zwieniecki et al. (2001).
These reports caused much excitement and since then numerous follow-up studies
have dealt with this topic (summarised, e.g. by Nardini et al. 2011) even though the
physiological significance of the effect is still under debate (van Ieperen 2007) and
may be highly species-dependent (Herbette and Cochard 2010). In short, it was
observed that the axial hydraulic conductance of shoot segments and individual
conduits increased with an increase in the electrolyte concentration in the xylem
fluid (mostly monovalent and divalent cations). Other osmolytes had no comparative effects. Conductivity increased by 1.9 up to 58 % in 35 species tested (Nardini
et al. 2011). However, these results were, in the vast majority, obtained with
artificial perfusion media that frequently did not reflect the natural composition of
the xylem sap (van Ieperen 2007). As pointed out by this author, it is inadequate to
128
L.H. Wegner
use distilled water as a reference solution, since this medium is non-physiological
and will affect the mechanical properties of cell walls and in particular the pectin
structure of inter-conduit pit membranes that were identified as the major axial
resistance for longitudinal water flow. These are highly susceptible to the ionic
composition of the ambient medium. Swelling and shrinking of pectin matrix, and
concomitant changes in pit membrane porosity, or rather membrane thickness (Lee
et al. 2012), was identified as the most likely molecular mechanism underlying the
ionic effect (Zwieniecki et al. 2001; Nardini et al. 2011). Van Ieperen has argued
that in the presence of Ca2+-free media not matching the natural composition of the
xylem sap properties of the pectin gel matrix may change in a non-physiological
way. Moreover, the ionic effect tends to saturate with increasing Ca2+ and K+
concentration in the xylem. The most dramatic effect occurs when distilled water
is exchanged for (artificial) xylem sap containing the usual background ionic
concentrations (but see also Nardini et al. (2007)). Despite this ambiguity with
respect to the physiological relevance of the ionic effect, it was discussed as an
important mechanism of short-term adjustment of xylem conductivity at sites where
a large fraction of vessels is blocked by embolisms (Trifilò et al. 2008, 2011), for
water allocation to branches receiving sunlight (Sellin et al. 2010; Nardini
et al. 2011), for seasonal adjustments in xylem conductivity, or at fluctuating
environmental conditions (Nardini et al. 2012). Maximum increase in xylem
hydraulic conductivity was observed when adjacent vessels became dysfunctional
by embolism (Trifilò et al. 2008); at those sites, increase in xylem K+ under natural
conditions appears to be most pronounced (Trifilò et al. 2011), and evidence for a
physiological relevance is most compelling. Increased local K+ concentration may
also reflect an elevated osmotic pressure that may be part of mechanisms to repair
embolism (Wegner 2014) and to circumvent embolised vessels with water passing
through ray cells (Zimmermann et al. 2004). More research on this “ionic effect”,
its variability and its molecular basis are required to establish its physiological
significance unambiguously.
This discussion on the interplay of xylem ionic composition and volume flow in
the xylem would be incomplete without a few words on the role of xylem parenchyma cells in controlling the composition of the xylem sap. This topic would merit
a separate review paper because of tremendous recent progress on this issue.
Unfortunately, it can only be covered in the form of case studies here. Since the
role of xylem parenchyma ion channels in controlling composition of the xylem sap
was highlighted for the first time 20 years ago (Wegner and Raschke 1994), a great
number of transport proteins located at the plasma membrane of cells bordering on
xylem vessels have been identified and characterised with respect to their role in
long-distance transport. In the methodological and conceptual context discussed
here, the elegant work of Metzner et al. (2010b) on lateral water and nutrient
exchange between the xylem and adjacent cells in Phaseolus vulgaris deserves
particular attention. These authors used cryo-mircroscopy in combination with
time-of-flight secondary ion mass spectrometry (SIMS) to trace the distribution of
stable isotopes in tissues (Metzner et al. 2008) that were fed via the xylem conduits
across the cut surface of the excised stem. A very high spatial resolution could be
Interplay of Water and Nutrient Transport: A Whole-Plant Perspective
129
realised (<1 μm in some of the images), allowing to separate apoplastic and
symplastic transport. First of all, this work highlighted again the importance of
the exchange of water and nutrients (K, Mg, Ca) between xylem vessels and their
environment. Complete equilibration of labelled water between lumens of the
vessel and adjacent tissues occurred very fast [with the exception of lignified cell
walls in the vicinity of the vessels Metzner et al. (2010b)]. Unexpectedly, however,
the investigated rare isotopes of K+ and even Ca2+ and Mg2+ supplied via the
transpirational stream also equilibrated rapidly with both apoplastic and symplastic
pools of xylem parenchyma, and to a lesser extent also with other tissues, indicating
that these ions were highly mobile and permeability of cellular and vacuolar
membrane were comparatively high. In a separate study (Metzner et al. 2010a)
evidence was presented that ion exchange occurred by diffusion and that solvent
drag was not likely to play a major role. A modelling approach to these datasets
would probably be rewarding, since it potentially offers the possibility to quantify
individual fluxes at the single-cell level and possibly relate them, e.g. to ion channel
activity.
The control of relative ion concentrations seems to be of major importance for
the plant, rather than adjusting absolute xylem sap concentrations that are subject to
perpetual fluctuations. A good example is maintenance of the K+/Na+ ratio that is
optimised in salt-tolerant barley cultivars when exposed to mild salt stress, whereas
absolute concentrations seem to be less important (Shabala et al. 2010). Much
progress has recently been made in unraveling the mechanisms of how xylem sap
Na+ load is adjusted and Na+ accumulation in the shoot is reduced, e.g. by retrieval
of Na+ from the xylem sap by xylem parenchyma cells at root and shoot base
(Jacoby 1979), and by re-circulation via the phloem (Davenport et al. 2007; for
more details, see Sect. 8). Circulation of ions between xylem and phloem seems to
be a general mechanism in higher plants contributing to ion homeostasis (Lüttge
2013).
7 Xylem Unloading and Water and Nutrient Transport
in Leaf Tissues
While nutrients allocated to leaves remain there serving various physiological
functions, or are, to a varying extent, recirculated via the phloem, the water is
mostly lost to the atmosphere by evaporation via stomatal pores and the epidermis.
This implies a constant mass flow from the vascular tissue to substomatal cavities
and to the epidermis, passing through mesophyll tissue. Water could move either
apoplastically via cell walls, or through the symplast. Like in the root, this is of
relevance for the coupling of flows. Fluorescent dyes have been used as tracers to
explore pathways of water and solutes in leaves, but it was not before the
landmarking review of Canny (1990) that a firm basis for the correct interpretation
of these data was established. Canny argued that local apoplastic accumulation of a
130
L.H. Wegner
dye (called “swamps”) marks sites where partitioning of water and solutes occurs,
and water passes cellular membranes to enter the symplast (termed “flumes”).
Visible traces of the dye extending through cell walls from the vasculature to the
epidermis result from diffusive transport starting at swamps. From the evaluation of
a large series of micrographs, he concluded that water transport in the leaf is
predominantly symplastic. This was later confirmed by other techniques,
e.g. measurements of turgor pressure (Ye et al. 2008). It is well known that nutrients
are unevenly distributed among different cell types (and sites) in the leaf, but little
attention was paid so far to the impact of water flow. An exception is the work of
Fricke (2004), who observed for barley leaves that Cl and Ca were preferentially
accumulated in the epidermis cells, while P was primarily found in the mesophyll.
Changes in the transpiration rate affected this distribution significantly and
increased Ca levels close to the substomatal cavity. Basic patterns were, however,
not affected.
8 Phloem Transport
When discussing the interplay of water and nutrient transport, the phloem seems, at
first glance, to be the least obvious candidate. Nutrient transport is usually not
associated with phloem function nor with the transport mechanism. According to a
general consensus, volume flow in the phloem is thought to be driven by a pressure
gradient supported by phloem loading of mainly sucrose at source tissues (and
subsequent passive water uptake by sieve tubes) and phloem unloading (and, in
turn, water release) at the sinks. This so-called pressure flow (“Druckstrom”)
hypothesis first introduced by (Münch 1930) is based on tight coupling of water
and solute flow, but corresponding to the main function of the phloem associated
with assimilate transport, major osmolytes are supposed to be sugars rather than
salts. However, this textbook scenario may oversimplify the real situation; K+
seems to play a previously undervalued role in phloem transport, particularly
when photosynthesis is reduced and sucrose loading at the sink is limiting, or
when the H+ ATPase activity is insufficient to energise transport across the sieve
tube membrane. First evidence for this was obtained by Hartt (1970), and later a
detailed model was worked out by Lang (1983). K+ gradients in phloem sap tapped
along the shoot provided direct evidence for K+ loading at the source and K+ release
associated with the sink (Vreugdenhil and Koot-Gronsveld 1989). Consistently,
Deeken et al. (2002) demonstrated that in mutants that lacked the phloem-located
K+ channel AKT2, phloem transport was strongly affected. More recently,
Gajdanowicz et al. (2011) undertook a comprehensive study on the role of this
channel in phloem transport. Mutants expressing an inward-rectifying version of
AKT2 (in the wild type, the channel mediated both K+ influx and efflux across the
sieve tube membrane) were deficient with respect to phloem transport, especially at
low rates of photosynthesis. Combining experimental work with extensive modelling, the authors came to the conclusion that maintenance of a K+ gradient across
Interplay of Water and Nutrient Transport: A Whole-Plant Perspective
131
the sieve tube membrane serves as an energy source for loading assimilates into the
phloem even at low H+ ATPase activity.
A final remark on the phloem refers to its role in re-circulation of nutrients from
the shoot to the root that was already discussed in detail by Lüttge (2013).
Particularly excess K+ is transported back to the root via the phloem and may
serve as a shoot-to-root signal on the K+ status of the shoot (Wegner and De Boer
1997).
9 The Whole-Plant Perspective: Macronutrients
and Transpirational Flow
While the previous paragraphs deal with coupling of water and nutrient transport in
plant organs, such as the root, and in vascular tissues representing “functional units”
within the plant, the remaining part of this essay is dedicated to the main
macronutrients K, N and Ca, and their interaction with long-distance volume flow
(that is to a great extent identical with transpirational flow). Interaction is truly
mutual, since, on the one hand, nutrients (and nutrient availability) regulate hydraulic properties of plant tissue, e.g. via gating of aquaporins and by affecting stomatal
function. On the other hand, evidence has been presented for transpirational flow
having impact on the allocation of nutrients in the shoot and among parts of it
(e.g. younger and older leaves) in a nutrient-specific way.
The latter aspect touches a long-standing, more fundamental debate on the
significance of transpiration for nutrient supply to the shoot. Tanner and Beevers
(1990, 2001) provided evidence that transpiration is essentially not required to
provide the shoot of sunflower plants with the full spectrum of nutrients. No
evidence for nutrient deficiencies were found in sunflower plants that had been
grown on hydroponics in a climate chamber, and that received mineral nutrients
only during the dark period when the shoot was exposed to nearly 100 % humidity.
Tanner and Beevers argued that water circulating between xylem and phloem and
growth water would induce xylem flow sufficient for supplying the shoot with
nutrients. It should be noted, though, that some residual transpiration was retained
(about 7 % compared to the rate of control plants), that still contributed about 50 %
to the total water flow from root to shoot in the humidity-exposed plants. Hence, a
complete uncoupling of nutrient supply to the shoot from transpirational flow could
not be achieved by their experimental approach. The case of Tanner and Beevers is
supported by findings on aquatic higher plants growing in a submerged state. These
plants maintain acropetal xylem water flow in the complete absence of transpiration, most likely to supply leaves with mineral nutrients like P, Fe and Mn that are
hardly available from the ambient water at the leaf surface. These nutrients have to
be taken up by the roots from sediments and are transported to the shoot by mass
flow via xylem conduits (Pedersen and Sand-Jensen 1993, 1997). Independence of
nutrient transport on transpiration as advocated by Tanner and Beevers contrasts,
132
L.H. Wegner
however, with other reports that established a link between down-regulation of
transpiration (e.g. as a consequence of elevated ambient CO2 partial pressures) and
reduced nutrient supply to the shoot (Conroy and Hocking 1993). Considerable
transpiration rates at night were also hypothesised to serve the function of supplying
the shoot with nutrients. The issue may be solved by stating that transpiration is,
strictly speaking, not required to provide the shoot with nutrients, but since it is
there and unavoidable under most conditions, plants have “learned” to make use of
it. In habitats that do not require strict optimisation of water use efficiency, part of
the transpirational flow being in excess of water requirements of the shoot may
serve other purposes, such as optimising nutrient supply (Cramer et al. 2009).
Interactions of nutrient and water at the whole-plant level cannot exclusively be
described in a mechanistic way, since various indirect effects have to be taken into
account, e.g. regulation of stomatal conductance and photosynthesis (Cramer
et al. 2009). Therefore, it is more adequate in some cases to talk rather about
trade-offs.
9.1
Nitrogen (Nitrate and Ammonium)
The prime candidate for considering interactions and trade-offs of transport of
water and inorganic ions in plants is certainly nitrate. Transport of water and nitrate
interacts in various ways that have been a matter of extensive research since the
1980s of the last century. Radin and Boyer (1982) were among the first to detect that
root hydraulic conductance was strongly affected by the availability of nitrate. In
low nitrate medium, hydraulic conductance would be about half that of roots well
supplied with nitrate. Transpiration was affected in the same way. Consistently,
turgor pressure probe experiments revealed that the hydraulic conductance of
cortex cells in roots deprived of nitrate was significantly lower compared to roots
grown in full medium (Fig. 4; Radin and Matthews 1989). Later, this effect could be
ascribed to a regulation of aquaporin activity in those cells. Nitrate complementation to roots grown in N free medium was shown to induce an up-regulation of
aquaporin expression in fava bean roots (Guo et al. 2007), and N deprivation would
suppress aquaporin expression (Clarkson et al. 2000). Moreover, regulation of
aquaporin gating by (intracellular) nitrate independent of aquaporin expression
was reported for maize (Gorska et al. 2008a, b). Both effects would contribute to
an improved water supply to the shoot of plants well provided with nitrate and, in
turn, an increase in transpiration and up-regulation of photosynthesis. Gorska
et al. (2008a) and Cramer et al. (2009) have argued that an increased water flow
would facilitate nitrate acquisition in soil by solvent drag. This may be particularly
important in soils with local differences in nitrate availability, a situation that
appears to be quite common in natural soils. The effect would favour effective
exploitation of local nitrate resources over uptake of ammonium that does not
induce a similar effect. However, when linking this effect to the response of the
whole plant, complexity increases. In split-root experiments on bean with part of
Interplay of Water and Nutrient Transport: A Whole-Plant Perspective
133
the root supplied with nitrate and the other provided with ammonium, Schulze-Till
et al. (2009) using the MRT technology, observed higher rates of water flow in the
nitrate-fed roots due to a larger number of vessels per root contributing to flow than
in those provided with ammonium. Flow velocity and xylem pressure of conducting
xylem elements did not differ much, though, and anatomical properties were also
unaffected by the N-form. Schulze-Till et al. hypothesised that part of the vessels
remained non-functional in the ammonium-fed roots and thus were “switched off”
to prevent cavitation.
Consistent with a facilitated water supply in the presence of nitrate, stomatal
conductance (gs) was found to increase when N-deficient plants received nitrate
(Wilkinson et al. 2007). However, the dependence of gs on soil nitrate was found to
follow an optimum curve. High nitrate concentrations would tend to induce partial
stomatal closure. Cramer et al. (2009) hypothesised that high nitrate delivery to the
shoot (that would not only depend on nitrate uptake, but also on the nitrate
assimilation rate in the root tissues) would lead to an increased NO production in
the leaf and, in turn, to stomatal closure. Note that CO2 uptake is also coupled to
nitrate reduction in the leaves for adjustment of malate synthesis. Malate produced
in the leaves neutralises OH formed as a by-product of nitrate reduction; moreover, malate replaces NO3 as a counter-ion for excess K+ that is transported from
root to shoot in the xylem conduits and is subsequently recirculated back to the
roots via the phloem [see also Sect. 9.3 and Lüttge (2013)].
From this survey of various tight interactions of N fluxes and transpirational
flow, it is not surprising that N supply was found to have strong impact on transport
and accumulation of other nutrients, including K+ and Ca2+ (Matimati et al. 2014).
9.2
Calcium
Calcium distribution in the plant is predominantly shaped by apoplastic water flow,
since symplastic mobility of this divalent ion is low. Cytosolic Ca 2+ concentrations
are kept at extremely low levels of up to about 500 nM—values exceeding this low
regime are sensed as a stress signal. Vacuolar Ca2+ concentrations are much higher,
but this Ca2+ pool is rather immobile and does not contribute to Ca2+ transport.
Clarkson (1993) reported that radial transport of Ca2+ into the xylem was restricted
to apical parts of the root and correlated with the maturation of the endodermis; he
concluded that root Ca2+ transport was mainly apoplastic and only for
circumventing the suberin barrier of the Casparian strip, Ca2+ was taken up and
subsequently released into the stelar apoplast. By contrast, White (2001)
hypothesised that Ca2+ may be transported into xylem vessels by a purely apoplastic
pathway, and that Ca2+ in a complexed form may also be mobile in the symplast.
Ca2+ transport in the phloem is also supposed to be negligible (and hence, root-toshoot net Ca2+ transport is supposed to equal total Ca2+ transport in apical direction). Note that his view has also been questioned repeatedly (Biddulph et al. 1959;
Ringoet et al. 1968). But apart from these uncertainties, Ca2+ predominantly moves
134
L.H. Wegner
in the apoplast (interacting with fixed negative charges of the cell wall, see above).
Local apoplastic Ca2+ accumulation allows to identify sites at which increased
cellular water uptake by adjacent cells takes place. Ca2+ and water flow interact
mutually, though, since Ca2+ can also exert feedback on water flow, e.g. by a
regulation of aquaporins (Gilliham et al. 2011), or by its effect on stomatal aperture
(Atkinson et al. 1992). An elegant model on this interaction was proposed by
Gilliham et al. (2011). At elevated apoplastic Ca2+ levels, cytosolic Ca2+ will also
increase with time, leading to a down-regulation of aquaporin activity; as a consequence, transcellular water flow is down-regulated and translocation of water will
be restricted to the apoplast, contributing to a wash out of local apoplastic Ca2+
accumulation. The scenario can be extended and refined by taking Ca2+ secretion
via the plasma membrane by Ca2+ ATPases as well as Ca2+ exchange between
cytosol and vacuole into account. Physiological models with this degree of complexity will require quantitative modelling to identify strategies for experimental
validation.
In his study on Ca2+ transport in maize, Engels (1999) came to the conclusion
that root-to-shoot translocation correlates to some extent with transpiration; additionally, radial transport in the root is adjusted to shoot demand.
9.3
Potassium
Despite its abundance in the plant and its importance for various physiological
processes, the link of K+ transport to water flow (and vice versa) seems to be less
“spectacular” than for NO3 and Ca2+. K+ transport from roots to the shoot is under
tight control of shoot demand (Engels 1999), and excess K+ in leaves is circulated
back to the roots via the phloem (White 1997; Lüttge 2013). Radial translocation of
K+ in the root is strongly enhanced by volume flow, as stated previously (Wegner
and Zimmermann 2009; Schurr and Schulze 1995, see also above), most likely due
to K+ accumulation in stelar cells. It was also shown previously that xylem K+ is
buffered at short-term changes in the external K+ concentration (Wegner and
Zimmermann 2002).
Rather than the presence of K+, its deprivation seems to have a marked effect on
plant water relations, though. At low K+ availability in the soil solution, root
hydraulic conductance and transpirational water flow are increased with respect
to values at normal K+ supply, and water use efficiency is reduced (Quintero
et al. 1998; Fournier et al. 2005). Low K+ prevents stomatal closure under mild
drought stress conditions (Benlloch-González et al. 2008, 2010). These symptoms
may be part of a mechanism to enhance K+ retrieval from the soil by solvent drag.
Only at a severe K+ starvation, stomatal function is compromised by reduced
availability of K+ as an osmoticum in guard cells required to maintain stomatal
conductance (Humble and Raschke 1971). As a consequence, stomata tend to close
under these conditions (Hsiao and Lauchli 1986).
Interplay of Water and Nutrient Transport: A Whole-Plant Perspective
10
135
Conclusion
Far from being comprehensive, this overview of nutrient and water transport in
plants was meant to provide the reader with some insight into the complexity of
their interactions. Information on these phenomena is ever increasing, e.g. by the
advent of new techniques like the ZIM probe. Moreover, interactions among ion
fluxes were hardly considered here, but obvious constraints like electro-neutrality
of transport processes in steady state imply tight coupling of nutrient fluxes.
It is clear from these considerations that plant nutrition needs a conversion to
become a quantitative science in the near future, making use of the fast progress in
computer modelling of complex systems that is currently taking place. The uprise
of meteorology and climate sciences provides a good example and can be seen as an
encouragement. However, these environmental sciences also demonstrate that a
firm physico-chemical basis is mandatory for such an approach to be successful. It
is an advantage of transport physiology over other disciplines of plant sciences that
its subject is readily treated in a quantitative way in the form of fluxes, and that
well-established concepts like the thermodynamics of irreversible processes are
available to describe coupling of these fluxes in a comprehensive way. More efforts
are required in the future to extend and adjust these concepts, e.g. to include
non-linearities and regulatory processes in the quantitative treatment of transport
processes.
Acknowledgements I would like to thank Prof U. Zimmermann, Henningsdorf, for many
stimulating discussions and for critical reading of the manuscript. Thanks are also due to Prof.
Zimmermann and S. Rüger for providing diagrams showing the ZIM probe and a hitherto
unpublished model experiment.
References
Atkinson CJ, Ruiz LP, Mansfield TA (1992) Calcium in xylem sap and the regulation of its
delivery to the shoot. J Exp Bot 43:1315–1324. doi:10.1093/jxb/43.10.1315
Balling A, Zimmermann U (1990) Comparative measurements of the xylem pressure of Nicotiana
plants by means of the pressure bomb and pressure probe. Planta 182:325–338. doi:10.1007/
BF02411382
Bell CW, Biddulph O (1963) Translocation of calcium. Exchange versus mass flow. Plant Physiol
38:610–614
Benlloch-González M, Arquero O, Fournier JM et al (2008) K + starvation inhibits water-stressinduced stomatal closure. J Plant Physiol 165:623–630. doi:10.1016/j.jplph.2007.05.010
Benlloch-González M, Fournier JM, Benlloch M (2010) K + deprivation induces xylem water
and K + transport in sunflower: evidence for a co-ordinated control. J Exp Bot 61:157–164.
doi:10.1093/jxb/erp288
Bentrup FW (1979) Reception and transduction of electrical and mechanical stimuli. Encyclopedia
Plant Physiol 7:42–70
Biddulph O, Cory R, Biddulph S (1959) Translocation of calcium in the bean plant. Plant Physiol
34:512–519
136
L.H. Wegner
Bramley H, Turner NC, Turner DW, Tyerman SD (2007) Comparison between gradientdependent hydraulic conductivities of roots using the root pressure probe: the role of pressure
propagations and implications for the relative roles of parallel radial pathways. Plant Cell
Environ 30:861–874. doi:10.1111/j.1365-3040.2007.01678.x
Bramley H, Ehrenberger W, Zimmermann U et al (2013) Non-invasive pressure probes
magnetically clamped to leaves to monitor the water status of wheat. Plant Soil
369:257–268. doi:10.1007/s11104-012-1568-x
Britto DT, Kronzucker HJ (2006) Futile cycling at the plasma membrane: a hallmark of
low-affinity nutrient transport. Trends Plant Sci 11:529–534. doi:10.1016/j.tplants.2006.09.
011
Britto DT, Kronzucker HJ (2013) Flux measurements of cations using radioactive tracers. Methods
Mol Biol Clifton NJ 953:161–170. doi:10.1007/978-1-62703-152-3_10
Canny MJ (1990) What becomes of the transpiration stream? New Phytol 114:341–368
Ciancio V, Verhás J (1994) On the nonlinear generalizations of Onsager’s reciprocal relations.
J Non-Equil Thermody 19:184–194
Clarkson DT (1993) Roots and the delivery of solutes to the xylem. Philos Trans R Soc Lond B
Biol Sci 341:5–17
Clarkson DT, Carvajal M, Henzler T et al (2000) Root hydraulic conductance: diurnal aquaporin
expression and the effects of nutrient stress. J Exp Bot 51:61–70
Colmenero-Flores JM, Martı́nez G, Gamba G et al (2007) Identification and functional characterization of cation-chloride cotransporters in plants. Plant J Cell Mol Biol 50:278–292.
doi:10.1111/j.1365-313X.2007.03048.x
Conroy J, Hocking P (1993) Nitrogen nutrition of C3 plants at elevated atmospheric CO2
concentrations. Physiol Plant 89:570–576. doi:10.1111/j.1399-3054.1993.tb05215.x
Cramer MD, Hawkins H-J, Verboom GA (2009) The importance of nutritional regulation of plant
water flux. Oecologia 161:15–24. doi:10.1007/s00442-009-1364-3
Davenport RJ, Muñoz-Mayor A, Jha D et al (2007) The Na + transporter AtHKT1;1 controls
retrieval of Na + from the xylem in Arabidopsis. Plant Cell Environ 30:497–507. doi:10.1111/j.
1365-3040.2007.01637.x
de Geijn SCV, Petit CM (1979) Transport of divalent cations. Cation exchange capacity of intact
xylem vessels. Plant Physiol 64:954–958. doi:10.1104/pp. 64.6.954
Deeken R, Geiger D, Fromm J et al (2002) Loss of the AKT2/3 potassium channel affects sugar
loading into the phloem of Arabidopsis. Planta 216:334–344. doi:10.1007/s00425-002-0895-1
Diamond JM, Bossert WH (1967) Standing-gradient osmotic flow a mechanism for coupling of
water and solute transport in epithelia. J Gen Physiol 50:2061–2083. doi:10.1085/jgp.50.8.
2061
Engels C (1999) Regulation of xylem transport of calcium from roots to shoot of maize by growthrelated demand. J Plant Nutr Soil Sci 162:287–294. doi:10.1002/(SICI)1522-2624(199906)
162:3<287::AID-JPLN287>3.0.CO;2-N
Enns LC, Canny MJ, McCully ME (2000) An investigation of the role of solutes in the xylem
sap and in the xylem parenchyma as the source of root pressure. Protoplasma 211:183–197.
doi:10.1007/BF01304486
Fournier JM, Roldán ÁM, Sánchez C et al (2005) K + starvation increases water uptake in whole
sunflower plants. Plant Sci 168:823–829. doi:10.1016/j.plantsci.2004.10.015
Fricke W (2004) Solute sorting in grass leaves. The transpiration stream. Planta 219:507–514.
doi:10.1007/s00425-004-1262-1
Fritz M, Ehwald R (2011) Mannitol permeation and radial flow of water in maize roots. New
Phytol 189:210–217. doi:10.1111/j.1469-8137.2010.03452.x
Gajdanowicz P, Michard E, Sandmann M et al (2011) Potassium (K+) gradients serve as a mobile
energy source in plant vascular tissues. Proc Natl Acad Sci USA 108:864–869. doi:10.1073/
pnas.1009777108
Gilliham M, Dayod M, Hocking BJ et al (2011) Calcium delivery and storage in plant leaves:
exploring the link with water flow. J Exp Bot 62:2233–2250. doi:10.1093/jxb/err111
Interplay of Water and Nutrient Transport: A Whole-Plant Perspective
137
Gorska A, Ye Q, Holbrook NM, Zwieniecki MA (2008a) Nitrate control of root hydraulic
properties in plants: translating local information to whole plant response. Plant Physiol
148:1159–1167. doi:10.1104/pp. 108.122499
Gorska A, Zwieniecka A, Holbrook NM, Zwieniecki MA (2008b) Nitrate induction of root
hydraulic conductivity in maize is not correlated with aquaporin expression. Planta
228:989–998. doi:10.1007/s00425-008-0798-x
Guo S, Kaldenhoff R, Uehlein N et al (2007) Relationship between water and nitrogen uptake in
nitrate- and ammonium-supplied Phaseolus vulgaris L. plants. J Plant Nutr Soil Sci 170:73–80.
doi:10.1002/jpln.200625073
Hartt CE (1970) Effect of potassium deficiency upon translocation of 14C in detached blades of
sugarcane. Plant Physiol 45:183–187. doi:10.1104/pp. 45.2.183
Hedrich R (2012) Ion channels in plants. Physiol Rev 92:1777–1811. doi:10.1152/physrev.00038.
2011
Herbette S, Cochard H (2010) Calcium is a major determinant of xylem vulnerability to cavitation.
Plant Physiol 153:1932–1939. doi:10.1104/pp. 110.155200
Homblé F, Véry AA (1992) Coupling of water and potassium ions in K channels of the tonoplast of
Chara. Biophys J 63:996–999
Hsiao TC, Lauchli A (1986) Role of potassium in plant-water relations. Adv Plant Nutr 2:281–312
Humble GD, Raschke K (1971) Stomatal opening quantitatively related to potassium transport.
Evidence from electron probe analysis. Plant Physiol 48:447–453. doi:10.1104/pp. 48.4.447
Jacoby B (1979) Sodium recirculation and loss from Phaseolus vulgaris L. Ann Bot 43:741–744
Jeschke WD, Pate JS (1991) Modelling of the partitioning, assimilation and storage of nitrate
within root and shoot organs of castor bean (Ricinus communis L.). J Exp Bot 42:1091–1103.
doi:10.1093/jxb/42.9.1091
Katou K, Taura T, Furumoto M (1987) A model for water transport in the stele of plant roots.
Protoplasma 140:123–132. doi:10.1007/BF01273721
Knipfer T, Fricke W (2010) Root pressure and a solute reflection coefficient close to unity exclude
a purely apoplastic pathway of radial water transport in barley (Hordeum vulgare). New Phytol
187:159–170. doi:10.1111/j.1469-8137.2010.03240.x
Knipfer T, Das D, Steudle E (2007) During measurements of root hydraulics with pressure probes,
the contribution of unstirred layers is minimized in the pressure relaxation mode: comparison
with pressure clamp and high-pressure flowmeter. Plant Cell Environ 30:845–860.
doi:10.1111/j.1365-3040.2007.01670.x
Kong X-Q, Gao X-H, Sun W et al (2011) Cloning and functional characterization of a cationchloride cotransporter gene OsCCC1. Plant Mol Biol 75:567–578. doi:10.1007/s11103-0119744-6
Lang A (1983) Turgor-regulated translocation. Plant Cell Environ 6:683–689. doi:10.1111/13653040.ep11589312
Lee J, Holbrook NM, Zwieniecki MA (2012) Ion induced changes in the structure of bordered pit
membranes. Front Plant Sci 3:55. doi:10.3389/fpls.2012.00055
Liu K, Li L, Luan S (2006) Intracellular K + sensing of SKOR, a Shaker-type K + channel from
Arabidopsis. Plant J 46:260–268. doi:10.1111/j.1365-313X.2006.02689.x
Loo DD, Hirayama BA, Meinild AK et al (1999) Passive water and ion transport by cotransporters.
J Physiol 518(Pt 1):195–202
Lüttge U (1975) Salt glands. In: Hall LJ, Baker DA (eds) Ion transport plant cells tissues. North
Holland Publishing, Amsterdam, pp 335–376
Lüttge U (2013) Whole-plant physiology: synergistic emergence rather than modularity. In:
Lüttge U, Beyschlag W, Francis D, Cushman J (eds) Progress in botany. Springer, Berlin,
pp 165–190
Marschner H (1995) Mineral nutrition of higher plants, 2nd edn. Academic Press, London, p 889
Matimati I, Verboom GA, Cramer MD (2014) Nitrogen regulation of transpiration controls massflow acquisition of nutrients. J Exp Bot 65:159–168. doi:10.1093/jxb/ert367
138
L.H. Wegner
Maurel C, Verdoucq L, Luu D-T, Santoni V (2008) Plant aquaporins: membrane channels with
multiple integrated functions. Annu Rev Plant Biol 59:595–624. doi:10.1146/annurev.arplant.
59.032607.092734
Metzner R, Schneider HU, Breuer U, Schroeder WH (2008) Imaging nutrient distributions in plant
tissue using time-of-flight secondary ion mass spectrometry and scanning electron microscopy.
Plant Physiol 147:1774–1787. doi:10.1104/pp. 107.109215
Metzner R, Schneider HU, Breuer U et al (2010a) Tracing cationic nutrients from xylem into stem
tissue of French bean by stable isotope tracers and cryo-secondary ion mass spectrometry.
Plant Physiol 152:1030–1043. doi:10.1104/pp. 109.143776
Metzner R, Thorpe MR, Breuer U et al (2010b) Contrasting dynamics of water and mineral
nutrients in stems shown by stable isotope tracers and cryo-SIMS. Plant Cell Environ
33:1393–1407. doi:10.1111/j.1365-3040.2010.02157.x
Morillon R, Liénard D, Chrispeels MJ, Lassalles JP (2001) Rapid movements of plants organs
require solute-water cotransporters or contractile proteins. Plant Physiol 127:720–723
Münch E (1930) Die Stoffbewegungen in der Pflanze. Fischer, Jena
Nardini A, Gascò A, Trifilò P et al (2007) Ion-mediated enhancement of xylem hydraulic
conductivity is not always suppressed by the presence of Ca2+ in the sap. J Exp Bot
58:2609–2615. doi:10.1093/jxb/erm105
Nardini A, Salleo S, Jansen S (2011) More than just a vulnerable pipeline: xylem physiology in the
light of ion-mediated regulation of plant water transport. J Exp Bot 62:4701–4718.
doi:10.1093/jxb/err208
Nardini A, Dimasi F, Klepsch M, Jansen S (2012) Ion-mediated enhancement of xylem hydraulic
conductivity in four Acer species: relationships with ecological and anatomical features. Tree
Physiol 32:1434–1441. doi:10.1093/treephys/tps107
Newman IA (2001) Ion in roots: measurement of fluxes using ion-selective microelectrodes to
characterize transporter function. Plant Cell Environ 24:1–14. doi:10.1046/j.1365-3040.2001.
00661.x
Nobel PS (1991) Physicochemical and environmental plant physiology. Academic, San Diego, CA
Oertli JJ (1966) Active water transport in plants. Physiol Plant 19:809–817. doi:10.1111/j.13993054.1966.tb07067.x
Palta JP, Stadelmann EJ (1980) On simultaneous transport of water and solute through plant cell
membranes: evidence for the absence of solvent drag effect and insensitivity of the reflection
coefficient. Physiol Plant 50:83–90. doi:10.1111/j.1399-3054.1980.tb02689.x
Pate JS, Gunning BES (1972) Transfer cells. Annu Rev Plant Physiol 23:173–196. doi:10.1146/
annurev.pp. 23.060172.001133
Pedersen O, Sand-Jensen K (1993) Water transport in submerged macrophytes. Aquat Bot
44:385–406. doi:10.1016/0304-3770(93)90079-C
Pedersen O, Sand-Jensen K (1997) Transpiration does not control growth and nutrient supply in
the amphibious plant Mentha aquatica. Plant Cell Environ 20:117–123. doi:10.1046/j.13653040.1997.d01-12.x
Peuke AD (2010) Correlations in concentrations, xylem and phloem flows, and partitioning of
elements and ions in intact plants. A summary and statistical re-evaluation of modelling
experiments in Ricinus communis. J Exp Bot 61:635–655. doi:10.1093/jxb/erp352
Peuke AD, Rokitta M, Zimmermann U et al (2001) Simultaneous measurement of water flow
velocity and solute transport in xylem and phloem of adult plants of Ricinus communis over a
daily time course by nuclear magnetic resonance spectrometry. Plant Cell Environ
24:491–503. doi:10.1046/j.1365-3040.2001.00704.x
Pohl P, Saparov SM, Antonenko YN (1997) The effect of a transmembrane osmotic flux on the ion
concentration distribution in the immediate membrane vicinity measured by microelectrodes.
Biophys J 72:1711–1718
Quintero JM, Fournier JM, Ramos J, Benlloch M (1998) K + status and ABA affect both exudation
rate and hydraulic conductivity in sunflower roots. Physiol Plant 102:279–284. doi:10.1034/j.
1399-3054.1998.1020216.xJ
Interplay of Water and Nutrient Transport: A Whole-Plant Perspective
139
Radin JW, Boyer JS (1982) Control of leaf expansion by nitrogen nutrition in sunflower plants:
role of hydraulic conductivity and turgor. Plant Physiol 69:771–775
Radin JW, Matthews MA (1989) Water transport properties of cortical cells in roots of nitrogenand phosphorus-deficient cotton seedlings. Plant Physiol 89:264–268. doi:10.1104/pp. 89.1.
264, http://dx.doi.org/10.1104/pp.89.1.264
Renninger HJ, Schäfer KVR (2012) Comparison of tissue heat balance- and thermal
dissipation-derived sap flow measurements in ring-porous oaks and a pine. Front Plant Sci
3:103. doi:10.3389/fpls.2012.00103
Ringoet A, Sauer G, Gielink AJ (1968) Phloem transport of calcium in oat leaves. Planta 80:15–20
Rokitta M, Peuke AD, Zimmermann U, Haase A (1999) Dynamic studies of phloem and xylem
flow in fully differentiated plants by fast nuclear-magnetic-resonance microimaging.
Protoplasma 209:126–131. doi:10.1007/BF01415708
Rüger S, Ehrenberger W, Arend M et al (2010) Comparative monitoring of temporal and spatial
changes in tree water status using the non-invasive leaf patch clamp pressure probe and the
pressure bomb. Agric Water Manag 98:283–290. doi:10.1016/j.agwat.2010.08.022
Schneider H, Zhu J, Zimmermann U (1997a) Xylem and cell turgor pressure probe measurements
in intact roots of glycophytes: transpiration induces a change in the radial and cellular
reflection coefficients. Plant Cell Environ 20:221–229. doi:10.1046/j.1365-3040.1997.d0165.x
Schneider H, Wistuba N, Miller B, Geßner P, Thürmer F, Melcher P, Meinzer F, Zimmermann U
(1997b) Diurnal variation in the radial reflection coefficient of intact maize root determined
with the xylem pressure probe. J Exp Bot 48:2045–2053. doi:10.1093/jxb/48.12.2045
Schroeder JI, Delhaize E, Frommer WB et al (2013) Using membrane transporters to improve
crops for sustainable food production. Nature 497:60–66. doi:10.1038/nature11909
Schulze-Till T, Kaufmann I, Sattelmacher B et al (2009) A 1H NMR study of water flow
in Phaseolus vulgaris L. roots treated with nitrate or ammonium. Plant Soil 319:307–321.
doi:10.1007/s11104-008-9871-2
Schurr U, Schulze E-D (1995) The concentration of xylem sap constituents in root exudate, and in
sap from intact, transpiring castor bean plants (Ricinus communis L.). Plant Cell Environ
18:409–420. doi:10.1111/j.1365-3040.1995.tb00375.x
Sellin A, Ounapuu E, Karusion A (2010) Experimental evidence supporting the concept of
light-mediated modulation of stem hydraulic conductance. Tree Physiol 30:1528–1532.
doi:10.1093/treephys/tpq091
Shabala S, Pang J, Zhou M et al (2009) Electrical signalling and cytokinins mediate effects of light
and root cutting on ion uptake in intact plants. Plant Cell Environ 32:194–207. doi:10.1111/j.
1365-3040.2008.01914.x
Shabala S, Shabala S, Cuin TA et al (2010) Xylem ionic relations and salinity tolerance in barley.
Plant J Cell Mol Biol 61:839–853. doi:10.1111/j.1365-313X.2009.04110.x
Shabala S, Cuin TA, Shabala L, Newman I (2012) Quantifying kinetics of net ion fluxes from plant
tissues by non-invasive microelectrode measuring MIFE technique. Methods Mol Biol Clifton
NJ 913:119–134. doi:10.1007/978-1-61779-986-0_7
Shackel KA, Johnson RS, Medawar CK, Phene CJ (1992) Substantial errors in estimates of sap
flow using the heat balance technique on woody stems under field conditions. J Am Soc Hortic
Sci 117:351–356
Smith DM, Allen SJ (1996) Measurement of sap flow in plant stems. J Exp Bot 47:1833–1844
Steudle E (2000a) Water uptake by roots: effects of water deficit. J Exp Bot 51:1531–1542
Steudle E (2000b) Water uptake by plant roots: an integration of views. Plant Soil 226:45–56.
doi:10.1023/A:1026439226716
Steudle E, Jeschke WD (1983) Water transport in barley roots: measurements of root pressure and
hydraulic conductivity of roots in parallel with turgor and hydraulic conductivity of root cells.
Planta 158:237–248. doi:10.1007/BF01075260
Steudle E, Peterson CA (1998) How does water get through roots? J Exp Bot 49:775–788.
doi:10.1093/jxb/49.322.775
140
L.H. Wegner
Tanner W, Beevers H (1990) Does transpiration have an essential function in long-distance ion
transport in plants? Plant Cell Environ 13:745–750. doi:10.1111/j.1365-3040.1990.tb01089.x
Tanner W, Beevers H (2001) Transpiration, a prerequisite for long-distance transport of minerals
in plants? Proc Natl Acad Sci USA 98:9443–9447. doi:10.1073/pnas.161279898
Tomos AD, Leigh RA (1999) The pressure probe: a versatile tool in plant-cell biology. Annu Rev
Plant Biol 50:447–472. doi:10.1146/annurev.arplant.50.1.447
Trifilò P, Lo Gullo MA, Salleo S et al (2008) Xylem embolism alleviated by ion-mediated increase
in hydraulic conductivity of functional xylem: insights from field measurements. Tree Physiol
28:1505–1512
Trifilò P, Nardini A, Raimondo F et al (2011) Ion-mediated compensation for drought-induced loss
of xylem hydraulic conductivity in field-growing plants of Laurus nobilis. Funct Plant Biol
38:606–613
Uehlein N, Lovisolo C, Siefritz F, Kaldenhoff R (2003) The tobacco aquaporin NtAQP1 is a
membrane CO2 pore with physiological functions. Nature 425:734–737. doi:10.1038/
nature02027
Van Ieperen W (2007) Ion-mediated changes of xylem hydraulic resistance in planta: fact or
fiction? Trends Plant Sci 12:137–142. doi:10.1016/j.tplants.2007.03.001
Van Ieperen W, van Meeteren U, van Gelder H (2000) Fluid ionic composition influences
hydraulic conductance of xylem conduits. J Exp Bot 51:769–776
Volkov VS, Zholkevich VN (1993) Exudation parameters depending on spatial orientation of root
segments of Zea mays L. Doklady Akad Nauk 332:526–528
Vreugdenhil D, Koot-Gronsveld EAM (1989) Measurements of pH, sucrose and potassium
ions in the phloem sap of castor bean (Ricinus communis) plants. Physiol Plant 77:385–388.
doi:10.1111/j.1399-3054.1989.tb05657.x
Wang Y-Y, Hsu P-K, Tsay Y-F (2012) Uptake, allocation and signaling of nitrate. Trends Plant Sci
17:458–467. doi:10.1016/j.tplants.2012.04.006
Wegner LH (2012) Using the multifunctional xylem probe for in situ studies of plant water and ion
relations under saline conditions. In: Shabala SN, Cuinn TA (eds) Salt tolerance—methods and
protocols, vol 913, Methods in molecular biology., pp 35–66. doi:10.1007/978-1-61779-9860_3
Wegner LH (2014) Root pressure and beyond: energetically uphill water transport into xylem
vessels? J Exp Bot 65:381–393. doi:10.1093/jxb/ert391
Wegner LH, De Boer AH (1997) Properties of two outward-rectifying channels in root xylem
parenchyma cells suggest a role in K+ homeostasis and long-distance signaling. Plant Physiol
115:1707–1719. doi:10.1104/pp. 115.4.1707, http://dx.doi.org/10.1104/pp.115.4.1707
Wegner LH, Raschke K (1994) Ion channels in the xylem parenchyma of barley roots
(A Procedure to Isolate protoplasts from this tissue and a patch-clamp exploration of salt
passageways into xylem vessels). Plant Physiol 105:799–813
Wegner LH, Zimmermann U (2002) On-line measurements of K + activity in the tensile water of
the xylem conduit of higher plants. Plant J Cell Mol Biol 32:409–417
Wegner LH, Zimmermann U (2009) Hydraulic conductance and K + transport into the xylem
depend on radial volume flow, rather than on xylem pressure, in roots of intact, transpiring
maize seedlings. New Phytol 181:361–373. doi:10.1111/j.1469-8137.2008.02662.x
Wegner LH, De Boer AH, Raschke K (1994) Properties of the K + inward rectifier in the plasma
membrane of xylem parenchyma cells from barley roots: effects of TEA+, Ca2+, Ba2+ and
La3+. J Membr Biol 142:363–379
Westhoff M, Reuss R, Zimmermann D et al (2009) A non-invasive probe for online-monitoring of
turgor pressure changes under field conditions. Plant Biol 11:701–712. doi:10.1111/j.14388677.2008.00170.x
White PJ (1997) Cation channels in the plasma membrane of rye roots. J Exp Bot 48 Spec
No:499–514. doi:10.1093/jxb/48.Special_Issue.499
White PJ (2001) The pathways of calcium movement to the xylem. J Exp Bot 52:891–899.
doi:10.1093/jexbot/52.358.891
Interplay of Water and Nutrient Transport: A Whole-Plant Perspective
141
Wilkinson S, Bacon MA, Davies WJ (2007) Nitrate signalling to stomata and growing leaves:
interactions with soil drying, ABA, and xylem sap pH in maize. J Exp Bot 58:1705–1716.
doi:10.1093/jxb/erm021
Wolterbeek HT (1987) Cation exchange in isolated xylem cell walls of tomato. I. Cd2+ and Rb
+ exchange in adsorption experiments. Plant Cell Environ 10:39–44. doi:10.1111/j.1365-3040.
1987.tb02077.x
Ye Q, Holbrook M, Zwieniecki MA (2008) Cell-to-cell pathway dominates xylem-epidermis
hydraulic connection in Tradescantia fluminensis (Vell. Conc.) leaves. Planta
227:1311–1319. doi:10.1007/s00425-008-0703-7
Zeuthen T (1996) Molecular mechanisms of water transport. RG Landes Compagny, Austin, TX
Zeuthen T (2010) Water-transporting proteins. J Membr Biol 234:57–73. doi:10.1007/s00232009-9216-y
Zeuthen T, MacAulay N (2012) Transport of water against its concentration gradient: fact or
fiction? Wiley Interdiscip Rev Membr Transp Signal 1:373–381. doi:10.1002/wmts.54
Zimmermann MH (1978) Hydraulic architecture of some diffuse-porous trees. Can J Bot
56:2286–2295. doi:10.1139/b78-274
Zimmermann U, Steudle E (1978) Physical aspects of water relations of plant cells. Adv Bot Res
6:45–117
Zimmermann U, Räde H, Steudle E (1969) Kontinuierliche Druckmessung in Pflanzenzellen.
Naturwissenschaften 56:634. doi:10.1007/BF01185741
Zimmermann U, Schneider H, Wegner LH, Haase A (2004) Water ascent in tall trees:
does evolution of land plants rely on a highly metastable state? New Phytol 162:575–615.
doi:10.1111/j.1469-8137.2004.01083.x
Zimmermann D, Reuss R, Westhoff M et al (2008) A novel, non-invasive, online-monitoring,
versatile and easy plant-based probe for measuring leaf water status. J Exp Bot 59:3157–3167.
doi:10.1093/jxb/ern171
Zimmermann U, Bitter R, Marchiori PER et al (2013) A non-invasive plant-based probe for
continuous monitoring of water stress in real time: a new tool for irrigation scheduling and
deeper insight into drought and salinity stress physiology. Theor Exp Plant Physiol 25:2–11.
doi:10.1590/S2197-00252013000100002
Zwieniecki MA, Melcher PJ, Michele Holbrook NM (2001) Hydrogel control of xylem hydraulic
resistance in plants. Science 291:1059–1062. doi:10.1126/science.1057175
Active and Passive Electrical Signaling
in Plants
Alexander G. Volkov and Vladislav S. Markin
Contents
1 Introduction . . . . . . . . . . . . . . . . . . . . . . . . . . . . . . . . . . . . . . . . . . . . . . . . . . . . . . . . . . . . . . . . . . . . . . . . . . . . . . . . .
2 Signaling in Mimosa pudica . . . . . . . . . . . . . . . . . . . . . . . . . . . . . . . . . . . . . . . . . . . . . . . . . . . . . . . . . . . . . . . .
2.1 Propagation of Mechanical Response and Branching Points . . . . . . . . . . . . . . . . . . . . . . . .
2.2 Velocity of Propagation . . . . . . . . . . . . . . . . . . . . . . . . . . . . . . . . . . . . . . . . . . . . . . . . . . . . . . . . . . . . . .
2.3 Electrical Nature of the “Alert” Wave . . . . . . . . . . . . . . . . . . . . . . . . . . . . . . . . . . . . . . . . . . . . . . .
2.4 Distribution of Electrical Potentials in Different Parts of Mimosa pudica . . . . . . . . .
3 Mechanisms of Electrical Signaling . . . . . . . . . . . . . . . . . . . . . . . . . . . . . . . . . . . . . . . . . . . . . . . . . . . . . . . .
3.1 Hydraulic Wave and a Streaming Potential in a Xylem . . . . . . . . . . . . . . . . . . . . . . . . . . . . .
3.2 Electrical Signal Propagation Can Induce Electroosmotic Flow . . . . . . . . . . . . . . . . . . . .
3.3 Electrical or Hydraulic Conductance of Excitation? . . . . . . . . . . . . . . . . . . . . . . . . . . . . . . . .
4 Action Potentials in the Lamina of the Venus Flytrap . . . . . . . . . . . . . . . . . . . . . . . . . . . . . . . . . . . .
5 Passive Propagation of Electrical Signals . . . . . . . . . . . . . . . . . . . . . . . . . . . . . . . . . . . . . . . . . . . . . . . . . .
5.1 Electrotonic Potentials . . . . . . . . . . . . . . . . . . . . . . . . . . . . . . . . . . . . . . . . . . . . . . . . . . . . . . . . . . . . . . . .
5.2 Electrical Stimulation at Low Voltages . . . . . . . . . . . . . . . . . . . . . . . . . . . . . . . . . . . . . . . . . . . . . .
5.3 Electrical Stimulation at High Voltages: From Electrotonic to Action Potential . .
5.4 Interaction Between Active and Passive Impulses in the Venus Flytrap . . . . . . . . . . .
6 Conclusions . . . . . . . . . . . . . . . . . . . . . . . . . . . . . . . . . . . . . . . . . . . . . . . . . . . . . . . . . . . . . . . . . . . . . . . . . . . . . . . . . .
References . . . . . . . . . . . . . . . . . . . . . . . . . . . . . . . . . . . . . . . . . . . . . . . . . . . . . . . . . . . . . . . . . . . . . . . . . . . . . . . . . . . . . . .
144
145
146
148
149
152
156
157
158
159
159
161
161
163
170
172
173
173
Abstract Electrical signaling on long and short distances exists in plants. There
are three major types of electrical signaling in plants and animals: action potentials,
electrotonic potentials, and graded potentials. The action potential in plants can
propagate over the entire length of the cell membrane and along the conductive
A.G. Volkov (*)
Department of Chemistry and Biochemistry, Oakwood University, 7000 Adventist Blvd.,
Huntsville, AL 35896, USA
e-mail: agvolkov@yahoo.com
V.S. Markin
Department of Neurology, University of Texas, Southwestern Medical Center, Dallas,
TX 75390-8813, USA
e-mail: MarkinA@swbell.net
© Springer International Publishing Switzerland 2015
U. Lüttge, W. Beyschlag (eds.), Progress in Botany, Progress in Botany 76,
DOI 10.1007/978-3-319-08807-5_6
143
144
A.G. Volkov and V.S. Markin
bundles of tissue with constant amplitude, duration, and speed. Electrotonic potentials exponentially decrease with distance. An intermediate place takes so-called
graded potentials that involve the process of electrical excitation but do not evolve
into full-fledged action potentials. A graded potential is an electrical signal that
corresponds to the size of the stimulus. Electrical signals can propagate along the
plasma membrane on short distances in plasmodesmata, and on long distances in a
phloem. In this chapter, we discuss electrical signaling in the Venus flytrap and
Mimosa pudica.
1 Introduction
There are many different types of signaling in plants. Electrical signaling is a
detectable physical quantity or impulse such as a voltage or electrical current by
which information can be transmitted. The cells of many biological organs generate
electrical potentials that can result in the flow of electric currents (Mohr and
Schopfer 1995; Volkov et al. 1998; Volkov 2006a, b, 2012a, b). Electrical impulses,
as a result of stimulation, can propagate to adjacent excitable cells. This propagation can be either active, representing an action potential, or passive, described as
electrotonic potential. There are three major types of electrical signaling in plants
and animals: action potentials, electrotonic potentials, and graded potentials. The
action potential can propagate over the entire length of the cell membrane and along
the conductive bundles of tissue with constant amplitude, duration, and speed
(Beilby 2007; Eschrich 1989; Hedrich 2012; Shimmen 2006; Volkov 2000). Electrotonic potentials in plants exponentially decrease with distance (Volkov
et al. 2013b). An intermediate place takes graded potentials that involve the process
of electrical excitation but do not evolve into full-fledged action potential. A graded
potential is a wave of electrical excitation that corresponds to the size of the
stimulus. Electrical signals can propagate along the plasma membrane on short
distances in plasmodesmata, and on long distances in a phloem.
Plants are continuously exposed to a wide variety of perturbations; these include
variation of temperature, light, mechanical forces, gravity, air and soil pollution,
drought, deficiency or surplus of nutrients, attacks by insects and pathogens, etc.
Therefore, it is essential for all plants to have survival sensory mechanisms against
such perturbations. Plants have evolved sophisticated systems to sense environmental
stimuli for adaptation and signals from other cells for coordinated action. Consequently, plants generate intracellular and intercellular electrical signals in response to
these environmental changes (Bertholon 1783; Bose 1907, 1913, 1918, 1926, 1928;
Ritter 1811; Takamura 2006). Neurotransmitter-like compounds, such as acetylcholine, dopamine, histamine, noradrenaline, and serotonin, participate in the information
processes in plants (Roshchina 2001). Wounding an Arabidopsis leaf results in the
propagation of electrical signaling that stimulates the production of jasmonates, plant
hormones that confer resistance against herbivores and pathogens, at undamaged sites
some distance from the wound. The process is mediated by cation channels encoded
by the GLR genes (Christmann and Grill 2013).
Active and Passive Electrical Signaling in Plants
145
This field has both theoretical and practical significance. Discovering these
mechanisms would greatly advance our knowledge of natural phytosensors, principles of their functioning and integration into general system of defense and attack.
These systems play a very important role in the life of plants, but their nature is still
very poorly understood. The cells, tissues, and organs of plants transmit electrochemical impulses over short and long distances. It is conceivable that action
potentials are the mediators for intercellular and intracellular communication in
response to environmental irritants. An action potential is a momentary change in
electric potential on the surface of a cell that takes place when it is stimulated.
Initially, plants respond to irritants at the site of stimulation; however, excitation
waves can be conducted along the membranes throughout the entire plant. Bioelectrical impulses travel from the root to the stem and vice versa (Volkov et al. 2013a, b).
Chemical treatment, intensity of the irritation, mechanical wounding, previous
excitations, temperature, and other irritants influence the speed of propagation.
Plants can perceive mechanical stimuli. This process involves mechanosensitive
channels that were found in all types of cells, from animal and plant cells to fungi
and bacteria. The omnipresence of these channels underlines their important physiological function in the regulation of osmolarity, cell volume, and growth. These
channels are ideal transducers of physiologically relevant mechanical forces.
Mechanosensory ion channels in plants are activated by mechanical stress and
then transduce this information into electrical signals. These channels are involved
in the growth, development, and response to environmental stress in higher plants.
In terms of electrophysiology, plant responses can be considered in three stages:
(1) stimulus perception, (2) signal transmission, and (3) induction of response. In
Chara the first stage is due to the receptor potential, a transient depolarization with
a critical threshold that triggers action potentials, which are responsible for stages
(2) and (3). Receptor potentials are generated by mechanosensory ion
channels. Action potentials involve a transient influx of Ca2+ to the cytoplasm,
effluxes of K+ and Cl, and a temporary decrease of turgor pressure. Like the action
potential, a critical threshold depolarization triggers Ca2+ influx, opening of Ca2+sensitive Cl channels and K+ channels; effluxes that last over an hour and result in
turgor regulation. However, since higher plants are composed of complex tissues,
detailed analysis of electrical phenomena is rather difficult, and so the mechanism
for generating the receptor potential has not yet been established.
In this review, we shall consider both active and passive propagation of electrical
signals in the Venus flytrap (Dionaea muscipula Ellis) and Mimosa pudica L.
2 Signaling in Mimosa pudica
The Mimosa pudica is one of the marvels of plant electrical, mechanical, and
biochemical engineering. Among several other interesting features, it has the ability
to change the shape of its leaves. Movements in this sensitive plant are associated
with fast responses to environmental stimuli that appear to be regulated through
electrical signal transduction. The change of shape can be caused by touch or by
146
A.G. Volkov and V.S. Markin
Fig. 1 The structure of
Mimosa pudica
burns. In this section, we analyze propagation of electrical signals and hydromechanical responses in Mimosa pudica induced by brief flaming. Propagation of
impulses was studied along the plant shown in Fig. 1. The Mimosa pudica contains
long slender branches, called petioles, which can fall due to mechanical, thermal, or
electrical stimuli. The petioles contain small pinnules, arranged on the rachis or
midrib of the pinna. The pinnules are the smallest leaflets while the entire leaf
contains the petioles, pinnae, and pinnules. A pulvinus is a joint-like thickening at
the base of a plant leaf or leaflet that facilitates thigmonastic movements (Fig. 1).
Primary, secondary, and tertiary pulvini are responsible for the movement of the
petiole, pinna, and leaflets, respectively (Shimmen 2006).
2.1
Propagation of Mechanical Response and Branching
Points
Touching of a pinnule induces the closing of pinnules in the pinna in an upward
fashion and propagation of this process to the branching point with speed of about
1 cm/s. Signal goes from the very end of the pinna, i.e., from the farthest pinnule
touched in the experiment to the secondary pulvinus, causing in the process the
pinnules in this pinna to ascend and to close. As soon as the “alert” wave reaches the
secondary pulvinus, pinnules in the other three pinnae start to close beginning from
Active and Passive Electrical Signaling in Plants
147
Fig. 2 Closing of Mimosa pudica pinnules and falling down of the petiole after stimulation of a
pinnule by brief flaming
the secondary pulvinus to apices of the leaflet along midribs. The excitation does
not propagate across the secondary pulvinus to a petiole. Therefore, this branching
point together with pulvinus represents a barrier for propagating signal and a logical
point. Block of the signal means that in this case the rest of the plant does not need
to know about this local alert.
However, this branching point barrier can be overcome if a brief flaming
involves a pinnule or a rachis (Fig. 2). Flaming induces a mechanical movement
of pinnules, and excitation propagates through the secondary pulvinus to a petiole.
Brief flaming of a pinnule and a rachis for 1 s induces closing of pinnules in the
stimulated pinna, in three neighboring pinnae of the leaf, and hangs down petiole by
petiole along the Mimosa pudica plant. In 3-month-old plants all pinnules close and
the petioles hang down after brief flaming, but in large 5- to 6-month-old plants
some leaves at the bottom of a plant do not move. The “alert” signal breaks through
the branching point and secondary pulvinus when a brief flaming involves rachis.
This damage is perceived as a severe threat to the plant and the signal is transferred
to the whole plant or almost the whole plant. If nothing else occurs, the Mimosa
pudica is able to relax within 20 min (Fig. 3). In this process, the shape of the
pulvinus changes. Its abaxial side has higher volume and curvature when a petiole is
in a relaxed state (Fig. 3, 0 s and 23 min). After stimulation reaches the pulvinus, the
volume and curvature in the adaxial part of the pulvinus increase and a petiole
hangs down (Fig. 3). A pulvinus changes its shape during the movement of a
petiole. Figure 3 shows the kinetics of a single petiole bending, triggered by brief
flaming stimulation. A petiole bending is synchronized with the increased volume
of the adaxial part of a pulvinus and the decreased volume of the abaxial part of a
pulvinus. Petiole bending can be caused by a rapid shrinking of the abaxial side of a
pulvinus and synchronous increasing of the adaxial part of the pulvinus.
148
A.G. Volkov and V.S. Markin
Fig. 3 Morphing structures of a pulvinus and a petiole movement of Mimosa pudica after thermal
stimulation of pinnules and the top of a rachis by a flame
2.2
Velocity of Propagation
Movements in the Mimosa pudica are related to changes of turgor and “alert”
wave’s propagation (Bose 1918; Haberlandt 1914; Hooke 1667; Houwink 1935,
1938; Malone 1994). Malone (1994) monitored pinnules’ thickness after brief
flaming and found propagation of an “alert” wave with initial speed of 1.5 cm/s.
Propagation of mechanical responses of leaves along Mimosa pudica was
recorded by video camera. The dots in Fig. 4 represent the speed of mechanical
response of petioles falling after a brief flaming. Initial speed of mechanical
response varies from 0.8 to 1.5 cm/s (Mean 1.011 cm/s, Median 1.000 cm/s, Std.
Dev. 0.079 cm/s, Std. Err. 0.008 cm/s, n ¼ 99) in different Mimosa pudica plants.
Due to this reason, the normalized speed of “alert” wave propagation in Fig. 4 was
presented. This speed is approximately constant in the beginning, between point of
flame stimulation of pinna and secondary pulvinus, but then slowly decreases at
each next pulvinus during propagation of an “alert” wave along the stem.
Active and Passive Electrical Signaling in Plants
1.0
0.8
v/vmax
Fig. 4 Dependence of
normalized speed V/Vmax of
“alert” wave propagation in
Mimosa pudica induced by
1 s flame stimulation of
pinnules and the top of a
rachis on the distance.
Experimental points are an
average of
16 measurements
149
0.6
0.4
0.2
0.0
0
10
20
30
40
Distance (cm)
2.3
Electrical Nature of the “Alert” Wave
Brief flaming of a petiole induces propagation of electrical signals along the plant
tissue as a transient change of voltage (Fromm and Lautner 2007; Kaiser and Grams
2006; Koziolek et al. 2003) or electrical current (Houwink 1935, 1938). Malone
(1994) suggested that the “alert” wave in Mimosa pudica might be a hydraulic
wave. However, we believe that the “alert” wave might have an electric nature. To
prove this, we used very efficient chemical tools: ion channel blockers. We deposited a few 10 μL drops of inhibitors on all pinna of Mimosa pudica plant for 20 h
before the experiments. We selected the anion channels blocker
9-anthracenecarboxylic acid (A-9-C), Ca2+-penetrable ion channels blockers
ZnCl2 and BaCl2, and also K+ voltage-gated ion channel blocker tetraethylammonium chloride (TEACl). All of these blockers exponentially decrease the
speed of an “alert” wave propagation along the plant induced by a brief flaming of
pinnules and rachis (Fig. 5a–c) in comparison with a plant non-treated by inhibitors
(Fig. 4). Speed of “alert” wave propagation along the Mimosa pudica was recorded
by video camera.
Uncouplers
carbonylcyanide-3-chlorophenylhydrazone
(CCCP)
and
2,4-dintrophenol (DNP) also exponentially decrease the speed of “alert” wave
propagation along the stem of Mimosa pudica (Fig. 5d). Uncouplers, which are
soluble in both water and lipid phases, permeate the lipid phase of a membrane and
transfer protons across the membrane, thus eliminating the transmembrane proton
concentration gradient. Uncouplers do not interact with voltage-gated ion channels,
but they can indirectly induce opening or closing of voltage-gated ion channels
caused by depolarization of membranes.
We have also studied effect of anesthetics on morphing process in this plant. If
Mimosa pudica and a Petri dish with 5 mL of chloroform are covered by a 12-l glass
jar for 10 min, anesthetic agent chloroform inhibits pinnule closing and leaflets
movement after stimulation of a leaf by flaming. The effect of anesthetic is
150
a
A.G. Volkov and V.S. Markin
c
1.2
1.0
1.0
0.8
A-9-C
V / Vmax
V/Vmax
1.2
0.6
0.8
TEACl
0.6
0.4
0.4
0.2
0.2
0.0
0.0
0
5
10
15
20
25
0
30
5
10
b
15
d
1.0
25
1.0
0.8
0.8
BaCl2
0.6
V/Vmax
V/Vmax
20
Distance (cm)
Distance (cm)
0.4
ZnCl2
DNP
0.6
0.4
CCCP
0.2
0.2
0.0
0.0
5
10
15
20
0
Distance (cm)
10
20
30
40
Distance (cm)
Fig. 5 Dependencies of a normalized speed V/Vmax of mechanical response propagation in
Mimosa pudica induced by 1 s flame stimulation of pinnules and the top of a rachis on the distance
20 h after deposition on all pinna of 10 μL drops of inhibitors: 5 mM 9-anthracenecarboxylic acid
(A-9-C) (a); 5 mM ZnCl2 or 5 mM BaCl2 (b); 10 mM tetraethylammonium chloride (TEACl) (c);
10 μM carbonylcyanide-3-chlorophenylhydrazone (CCCP); or 0.5 mM 2,4-dinitrophenol (DNP)
(d)
reversible: when the anesthetic is taken away, the leaves recover, and pinnules can
close again. Effects of anesthetics on mechanical stimulation and responses in the
Mimosa pudica were first described by Bose (1913, 1918). The disappearance of
thigmonastic mobility of Mimosa pudica, caused by volatile or local anesthetic
agents, was observed by Bernard (1878), Milne and Beamish (1999), Okazaki
et al. (1993), Paes and De Luccia (2012), and Wallace (1931).
Variation of speed of the “alert” wave propagation in Mimosa pudica with
distance x in Fig. 5 can be parameterized by the two-exponential function:
V
¼ c þ a Expðb xÞ:
V max
ð1Þ
Parameters a, b, and c, are different in each case; they are presented in Table 1.
The most informative parameter in this function is b: it gives the rate of velocity
decrease along the path of the wave. The inverse value 1/b gives the distance at
which velocity decreases e-times. Interestingly enough this distance for most of
these agents is only few centimeters, varying from 2 to 5 cm, and only for CCCP it
Active and Passive Electrical Signaling in Plants
151
Table 1 Parameters of Eq. (1)
Inhibitor
a
b (cm1)
c
9-Anthracenecarboxylic acid (A-9-C)
BaCl2
ZnCl2
Tetraethylammonium chloride (TEACl)
2,4-dinitrophenol (DNP)
Carbonylcyanide-3-chlorophenylhydrazone (CCCP)
3.0846
1.9932
2.8602
2.7274
21.6115
1.1291
0.4405
0.1893
0.2500
0.2870
0.2768
0.0660
0.1732
0.3595
0.2760
0.3501
0.3413
0.0872
rises to 15 cm. The most potent agent is A-9-C, which eliminates the wave at
characteristic distance of 2 cm.
Ion channel inhibitors and uncouplers can regulate the plasma membrane potential. The sensitivity of the propagation of “alert” waves to the blockers of ionic
channels shows that electrical signal propagation is certainly involved in the
process.
To study the propagation of electrical signals along the Mimosa pudica plant, we
used two sets of electrodes inserted in the stem; their recordings are presented in
Fig. 6. Results show two-phase electrical responses that propagate in the stem
between two pulvini with constant amplitude and approximately the same duration.
The time delay between two traces shows that the speed of these electrical signals
was 1 cm/s. Electrical signals in a stem of Mimosa pudica propagate in both
basipetal and acropetal directions. Electrical signals in Mimosa pudica caused by
a brief flaming are referred to as variation potentials or currents (Houwink 1935),
because their amplitude decreases with distance of propagation along the stem.
Houwink (1935) suggested that the propagation of variation electrical current is
caused by a diffusion of an unknown chemical compound along the plant, “which is
sucked in from the wound by the negative pressure in the vessels, and is transported
by the transpiration stream.” Fromm and Lautner (2007) found that two-phase
electrical signals propagate in Mimosa pudica and their amplitude decreases with
distance from the site of flaming. However, the authors did not study the amplitude
dependence of the electrical signals on distance. A decreasing electrical response
can be monotonous along the plant stem, or it can drop after passing through
pulvini. To address this point, we analyzed amplitude of electrical signals transduction in pulvini and in a stem of Mimosa pudica.
If electrodes are located in the stem at two different sides from a pulvinus, they
show that the drop in the amplitude of electrical signal is more pronounced after
passing through the pulvinus (Fig. 7).
Electrical signals propagate from the point of a flaming application through the
pinna, secondary pulvinus, petiole, pulvinus, and stem. This two-phase electrical
signal propagates along the petiole with a speed of about 1 cm/s and duration of
about 2.5 s; amplitude between peaks is about 0.05–0.06 V (Figs. 6 and 7).
152
A.G. Volkov and V.S. Markin
0.02 Ch 1
Ch 2
0.01
0.00
U (V)
Fig. 6 Electrical signal
propagation in a stem of
Mimosa pudica between
Ag/AgCl electrodes.
Position of electrodes in the
stem is shown on the
inserted photo. Distance
from 1 s flaming application
was about 22 cm. U is
voltage between electrodes
in channels (Ch 1 and Ch 2)
-0.01
-0.02
-0.03
-0.04
15
20
25
30
Time (s)
+ Ref
Flame Ch1
2.4
+ Ref
Ch 2
Distribution of Electrical Potentials in Different Parts
of Mimosa pudica
Our studies showed some peculiar properties of potential distribution in a running
electrical wave. Figure 8 compares electrical response in a petiole along it and in
the perpendicular direction. The idea of this experiment might look crazy, because
nobody would expect to find different potentials in the same cross section of the
petiole. We did not expect it either, and actually we did it after we observed
something unexpected in the pulvinus. We found a two-phase signal in the longitude direction (channel 2) and no signal in the perpendicular direction—zero line
for channel 1. Both sides of the petiole at the same cross section remained at the
same potential when the signal propagated along the petiole.
When we came to the pulvinus (Fig. 9), we found that the electrical response
along the pulvinus (in the x direction) was much shorter than in the petiole (Figs. 6,
7, and 8); it lasted for only 0.2–0.3 s. This response also had two-phase character
with similar amplitude of 0.05–0.06 V between peaks.
Active and Passive Electrical Signaling in Plants
0.03
0.02
0.01
U (V)
Fig. 7 Electrical signal
propagation in a stem of
Mimosa pudica between
Ag/AgCl electrodes.
Position of electrodes in the
stem is shown in the
inserted photo
153
0.00
-0.01
-0.02
Ch 2
-0.03
Ch 1
-0.04
-0.05
14
16
18
20
22
24
Time (s)
Ch 2
+ Ref
Flame
Ch 1
Ref
+
In this experiment, presented in Fig. 9, the second set of electrodes was inserted
across the pulvinus in the vertical direction along the z-axis (channel 2). Interestingly enough, it shows that the abaxial sides of the pulvinus acquire different
potentials when the “alarm wave” arrives. In the beginning the adaxial side
becomes negative, up to 0.04 V, and then positive, up to +0.02 V. This signal
looks similar to action potential; this action potential might induce redistribution of
pressure between two layers of flexor and extensor cells, changing shape of the
pulvinus, and causing the down movement of the petiole. The transporters in the
upper part are influenced by the incoming action potentials in a way different from
those in the lower part (e.g., different voltage-controlled channels). We believe that
the voltage difference generated across the pulvinus triggers the chain of events
bringing the change of osmotic pressure in upper and lower parts of pulvinus and
eventually to the movement of the petiole.
Duration of both signals is the same, but the amplitude of the electrical signal in
the direction across the pulvinus is a little smaller (Fig. 9). To complete this
experiment we checked if potential difference is generated in the horizontal direction along the y-axis. We did not register any electrical response in channel 3.
154
A.G. Volkov and V.S. Markin
Fig. 8 Two-channel
recording of electrical
signal propagation in a
petiole of Mimosa pudica
between Ag/AgCl
electrodes induced by 1 s
flame stimulation of
pinnules and the top of a
rachis. Position of
electrodes in a petiole and a
pulvinus is shown in the
inserted photo
Ref 2
Flame
Ch 2
Ch 1
Ref 1
0.02
Ch 2
U (V)
0.00
-0.02
Ch 1
-0.04
14
15
16
17
18
Time (s)
Propagation of electrical signals through pulvini is bidirectional (Figs. 9 and 10).
After a brief flaming, electrical signal propagates along a petiole through the
pulvinus to the stem, in which it propagates in basipetal and acropetal directions
(Fig. 10a). When the electrical signal reaches the next pulvinus, it propagates in the
direction from the stem to a pinna inducing pinnules closing in the acropetal
direction against the gravitational field.
When signal reaches the pulvinus, it produces electrical potential difference not
only along a pulvinus, but also in the vertical direction along plasmodesmata. This
causes a redistribution of water and ions in a pulvinus with reversible elastic change
in the shape of the pulvinus (Fig. 10). There is an electrical coupling between
vascular bundles and plasmodesmata in the pulvinus, which is responsible for the
propagation of electrical signal in the direction perpendicular to vascular bundles in
the pulvinus. Fleurat-Lessard and Bonnemain (1978) found large number of
branched plasmodesmata in the pulvinus. Plasmodesmata are membrane-lined
channels which are functionally comparable to animal gap junctions (Roberts
2005).
Active and Passive Electrical Signaling in Plants
155
Ch2
U (V)
0.02
0.00
-0.02
Ch1
Ch3
-0.04
6.9
7.0
7.1
7.2
7.3
7.4
Time (s)
Fig. 9 Three-channel recording of electrical signal propagation in a pulvinus of Mimosa pudica
between Ag/AgCl electrodes induced by 1 s flame stimulation of pinnules and the top of a rachis.
Position of electrodes in the pulvinus is shown in the inserted photo
To measure the dependence of amplitude of electrical “alert” wave on distance,
Ag/AgCl electrodes were inserted in the stem (stars) and at both sides of each
pulvinus (closed circles) (Fig. 11). The amplitude of the electrical signal in a stem is
constant between any two neighboring pulvini (Figs. 6 and 11), but decreases in the
stem after each pulvinus (Figs. 7 and 11). This property of the pulvinus is similar to
the property of electrical synapse in neuronal networks (Hormuzdi et al. 2004).
There is a correlation between decreasing the amplitude of the electrical signal
propagation through pulvini (Fig. 11) and speed of mechanical “alert” wave
propagation along the plant (Fig. 4). The speed of electrical signal propagation
along the Mimosa pudica plant is constant, but the speed of the mechanical “alert”
wave propagation and amplitude of electrical signal decreases with distance after
propagation through pulvini.
156
A.G. Volkov and V.S. Markin
Fig. 10 A schematic diagram of propagation of electrical signals in Mimosa pudica induced by 1 s
flame stimulation of pinnules and the top of a rachis from a petiole to a stem (a) and along a stem
(b). Long arrows correspond to signal transduction along vascular bundles and short arrows show
electrical signal propagation in a pulvinus through branched plasmodesmata
3 Mechanisms of Electrical Signaling
Mechanical movements in the Venus flytrap and Mimosa pudica are quite different
though both have electrical background. Literature data on electrical signaling in
Mimosa pudica has very significant discrepancies between different groups of
researchers and even between different publications from the same group.
According to literature, the amplitude of action potentials varies from 16 to
210 mV, and the duration of electrical signals varies from 1.2 to 2,000 s (Abe
1980, 1981; Abe and Oda 1976; Eschrich 1989; Fromm 1991; Fromm and Eschrich
1988; Fromm and Lautner 2007; Houwink 1935; Kaiser and Grams 2006; Koziolek
et al. 2003; Oda and Abe 1972; Roblin 1979, 1982; Sibaoka 1962, 1966, 1969,
1991; Stoeckel and Takeda 1993; Umrath 1937).
Several factors which account for this large discrepancy include but are not
limited to: (1) aliasing due to a low scanning rate of data acquisition systems
without low-pass filters or with slow voltmeters (Shannon 1949); (2) slow
ion-sensitive electrodes with membranes; and (3) high impedance of Mimosa
pudica tissue which does not permit the use of fast oscilloscopes or high speed
data acquisition systems with a low input impedance. While the effect of aliasing on
the reproducibility of electrical signals measurements in plants was discussed in
detail by Jovanov and Volkov (2012), electrical signaling in Mimosa pudica
requires additional study. It is possible that various stimuli generate different
electrical signals in the pulvinus, stem, and leaves of Mimosa pudica.
There are two possible mechanisms of effect of brief flaming of a pinnule:
generation of action potentials, which can induce an electroosmotic wave or
induction by a hydraulic wave electrical streaming potential in the plant. There
are two possible pathways of signal transduction through a xylem or phloem.
Active and Passive Electrical Signaling in Plants
157
Fig. 11 Dependence of
amplitude of electrical
signals in pulvini (closed
circles) and in a stem (stars)
on distance from flame
stimulation of pinnules and
the top of a rachis. Ag/AgCl
electrodes were inserted
along pulvini and a stem
Ch1
Ch2
Ch3
Ch4
Ch5
1.0
Uamp /Umax
0.8
0.6
0.4
0.2
0.0
5
10
15
20
25
30
35
40
Distance (cm)
3.1
Hydraulic Wave and a Streaming Potential in a Xylem
The propagation of hydraulic waves in a xylem was described by Malone (1994)
and various other authors. If hydrostatic pressure is much higher near a point of
flaming than in a plant, it could induce a hydraulic wave in the direction of
decreasing hydrostatic pressure, which can be described by the Poiseuille law:
Jv ¼
r 2 ∂P
,
8η ∂l
ð2Þ
where r is a radius of a capillary, η is the viscosity of the aqueous phase, l is the
capillary length, and P is pressure. Since a radius of a xylem vessel is about 17 μm
158
A.G. Volkov and V.S. Markin
(Fleurat-Lessard and Bonnemain 1978), η ¼ 103 Pa s, and Jv is 102 m/s, the
gradient dP/dl should be equal to 0.277 MPa/m.
Electrokinetic phenomena play important roles in the transport of water through
the xylem. Even in iso-osmotic conditions, water can flow from the soil through the
xylem due to electro-osmosis (Fensom 1980; Fensom and Spanner 1969; Ksenzhek
and Volkov 1998). Heyl (1933) and Keller (1930) found that electro-osmotic flow
of water from soil through xylem is caused by root pressure. The movement of an
electrolyte solution along a capillary generates a streaming potential and a streaming electrical current between the upstream and downstream ends of a liquid flow.
Equations for the streaming potential U and hydraulic pressure P can be written as
follows:
U¼
ε0 ε
Pζ,
ηκ
ð3Þ
where ε0 is the dielectric permittivity of a vacuum (8.85 1012 C/Vm), ε is the
dielectric permittivity of the aqueous phase, P stands for the pressure gradient
causing the relative movement of the phases along the interface, η is the viscosity
of the aqueous phase, κ is the conductivity of a aqueous phase, and ζ is the
electrokinetic or zeta potential equal to the potential difference between the
immobilized and mobile phases of the electric double layer which varies from
zero to a few millivolts. Dainty (1963) estimated from Eq. (3) that pressure of
1 MPa is required for 10 mV streaming potential. It means that at least 6 MPa of
pressure difference is required for propagation of 60 mV streaming potential in a
xylem. Such pressure gradient will lead to much higher velocity of a hydraulic
wave than 1 cm/s. Velocity of a hydraulic wave in a xylem should not depend on
blockers of voltage-gated ion channels and anesthetics. Therefore, propagation of
hydraulic wave with synchronous 60 mV streaming potential in a xylem is
doubtful.
3.2
Electrical Signal Propagation Can Induce
Electroosmotic Flow
The phloem is a possible pathway for transduction of electrical signals in the
Mimosa pudica. Action potential in the phloem can induce electroosmotic flow
with velocity vosm:
vosm ¼
ε0 εζE
:
η
ð4Þ
Amplitude of electrical signal is about 0.06 V, the length of signal is
2 s·1 cm/s ¼ 0.02 m and E ¼ 3 V/m. If ε ¼ 80, ζ ¼ 20 mV, η ¼ 103 Pa s, one
Active and Passive Electrical Signaling in Plants
159
can find from Eq. (4) that vosm ¼ 42 nm/s. Tinz-Füchmeier and Gradmann (1990)
found that speed of hydraulic flow in the Mimosa pudica induced by brief flaming
is in the range of 10–100 nm/s. Their results confirm the primary role of electrical
signaling in mechanical responses of Mimosa pudica after localized thermal
stress.
3.3
Electrical or Hydraulic Conductance of Excitation?
There are many different opinions in the literature about how an electrical signal
induces the streaming of a hydraulic wave or a hydraulic wave induces the
streaming potential, which looks like an action or variation potential. TinzFüchmeier and Gradmann (1990) used a laser-interferometer and an electrometer
and found the primary role of electrical signaling in rapid conductance of the
“alert” wave with speed of 1 cm/s in Mimosa pudica induced by a flaming.
Inhibition of the “alert” wave propagation in Mimosa pudica by blockers of
voltage-gated ion channels (Fig. 5) shows that the generation and propagation
of electrical signals is a primary effect responsible for turgor change and propagation of the “alert” wave. Chloroform, a volatile anesthetic agent, also blocks
closing pinnules and propagation of the “alert” wave proving an electrical nature
of signaling.
4 Action Potentials in the Lamina of the Venus Flytrap
Plant response to mechanical stimulation has long been known. Perhaps all plants
can react in response to the mechanical stimuli, though only certain plants with
rapid and highly noticeable touch-stimulus response have received much attention, for example, the trap closure of the Venus flytrap or pinnules closing in
Mimosa pudica. Mechanosensation is a physiological process by which a distortion of the cell membrane is converted into an electrical and/or biochemical
signal. Since mechanical forces exist in plants, it would have been essential for
all living cells, including the earliest microorganisms on earth, to have a survival
mechanism against these forces. For this reason, mechanosensation is considered to
have evolved as one of the oldest sensory mechanisms in living organisms. The rapid
closure of the Venus flytrap lamina in about 0.2 s is one of the fastest movements in the
plant kingdom. When a prey touches the trigger hairs, these mechanosensors trigger a
receptor potential (Benolken and Jacobson 1970; Buchen et al. 1983; Jacobson 1965),
which generates an electrical action potential. There are eight steps between closing
and opening of the trap (Fig. 12). Two stimuli generate two action potentials, which
close the trap at room temperature in a fraction of a second. Propagation of action
potentials and the trap closing can be blocked by uncouplers, inhibitors of
160
A.G. Volkov and V.S. Markin
1
Open trap
Second stimulation
First stimulation
Wait for mechanical stimulation by a prey
Receptor potential
Receptor potential
2
3
Uncouplers, Ion channel blockers
Action potential
Electrical charge transduction
and charge accumulation
Action potential
4
Electrical charge
transduction
5
Uncouplers, aquaporin blockers
ATP hydrolysis, fast H+ transport, water transport
through aquaporins, fast trap closure in 0.3 s
small
6
large
Prey size
The holes in the
cilia mesh allow
small prey to escape
Trap reopens
in 2 days
Cilia mesh and
lock the trap
Prey digestion and absorption
(4-5 days)
7
8
Fig. 12 The mechanism of trap closure (modified from Volkov et al. 2008b)
voltage-gated channels, and aquaporins (Volkov et al. 2008d). The trap closure
has been investigated by the mechanical stimulation of the trigger hairs by a
cotton thread (Fig. 12, step 1; Darwin 1880), by 7.35 μm laser with 50 μW power
(Fig. 12, step 2; Eisen et al. 2013), by electrical stimulation between the lobes and
midrib of the Venus flytrap (Fig. 12, step 4; Volkov et al. 2008b), and by various
chemicals.
Electrical signaling and rapid closure of the carnivorous plant Dionaea muscipula
Ellis (Venus flytrap) have been attracting the attention of researchers since nineteenth
century (Burdon-Sanderson 1873; Darwin 1880; Hedrich 2012; Volkov et al. 2009a;
Yang et al. 2010). In contrast to chemical signals such as hormones, electrical signals
are able to transmit information rapidly over long distances. Electrical form of energy
has no entropy content and 100 % of this energy can be used for work, synthesis of
chemical compounds, and information transduction (Ksenzhek and Volkov 1998;
Volkov et al. 1998). Biologically closed electrical circuits performing these functions
Active and Passive Electrical Signaling in Plants
161
operate over large distances in biological tissues (Nordestrom 1983; Volkov
et al. 2009b, 2010a–e, 2011a). The activation of such circuits can lead to various
physiological and biophysical responses. It is often convenient to represent the real
electrical and electrochemical properties of biointerfaces with idealized equivalent
electrical circuit models consisting of discrete electrical components. We investigated
the biologically closed electrical circuits in the lamina of the Venus flytrap and
proposed the equivalent electrical circuit.
The Venus flytrap can be closed by mechanical stimulation of two of the six
trigger hairs inside the lamina of the Venus flytrap using a cotton thread or wooden
stick. The Venus flytrap can also be closed by an electrical pulse with amplitude of
1.5 V between the midrib and the lobe of the lamina without mechanical stimulation. The closing was achieved by electrical stimulation with a positive electrode
connected to the midrib and a negative electrode located in one of the lobes (Volkov
et al. 2007, 2008b, 2009b; Eisen et al. 2013). It is noted that the inverted polarity
pulse was not able to close the plant and that the closed trap would not open by
electrical stimulus of either sign lasting up to 100 s.
The trap can also be closed by electrostimulation of the petiole, if one of the
stimulating electrodes is located a few millimeters from the midrib or in a lobe
(Volkov et al. 2013b). Electrical stimulation of the petiole induces electrical
signals, which resemble action potentials in the trap between lobes and the
midrib. The trap closes if the stimulating voltage is above the threshold
level of 4.4 V with a positive poll near the midrib and a negative poll a few
millimeters down the petiole. Since both electrical potential amplitude and
electrical charge are important for the trap closing, we used low-frequency
electrostimulation.
Possible pathways of action potential propagation include vascular bundles
and plasmodesmata in the lamina of the Venus flytrap (Volkov et al. 2007).
Markin et al. (2008) observed that the trap closure by electrical stimulus obeys
the all-or-none law, which states that there is no reaction for under-threshold
stimulus, and the speed of closing does not depend on stimulus strength above
threshold.
Mechanical stimulation of a trigger hair in the trap induces action potential
propagating between the trigger hairs in a lobe and the midrib with amplitude of
0.16–0.18 V (Escalante-Pérez et al. 2011; Volkov et al. 2007).
5 Passive Propagation of Electrical Signals
5.1
Electrotonic Potentials
Action potentials in the Venus flytrap do not penetrate to the petiole. However, we
did find small electrical potentials in the petiole, which look similar to graded
potentials or electrotonic potentials (Volkov et al. 2007, 2008a). To understand the
162
A.G. Volkov and V.S. Markin
Fig. 13 Dependence of the
electrical signal on distance
from the midrib in the
petiole induced by a gentle
touch of two trigger hairs
inside the lamina of the
Venus flytrap by a cotton
thread. The solid line was
calculated according to
Eq. (1). The frequency of
scanning was
250,000 samples/s with a
low-pass filter at
125,000 scans/s
Electrode 1 Channel 1
Ref 1
Electrode 2
Channel 2
Ref 2
Electrode 3
Channel 3
Ref 3
Electrode 4
Channel 4
Ref 4
-8
U (mV)
-6
-4
-2
0
0
2
4
6
8
Distance (cm)
nature of these electrical potentials in the petiole, we measured their dependence on
the distance from the midrib (Fig. 13). The amplitude of these electrical potentials
decreases exponentially with distance (Fig. 13) and can be described by the cable
equation:
U ¼ U 0 ExpðDistance=λÞ
ð5Þ
with parameters U0 ¼ 7.7812 mV and λ ¼ 1.77 cm. Therefore, the constant of
length, which indicates how far an electrical signal will spread in the petiole of the
Venus flytrap, is λ ¼ 1.77 cm. In small neurons, electrical potentials decreasing
exponentially are referred to as electrotonic potentials (Jack et al. 1975).
Active and Passive Electrical Signaling in Plants
5.2
163
Electrical Stimulation at Low Voltages
For electrostimulation of the Venus flytrap, we used the function generator
selecting either square pulses or sinusoidal waves applied between the midrib and
a lobe or to a petiole. Since the Venus flytrap can close the trap if electrical
stimulation of 1.5 V and electrical charge of 14 μC are applied between a midrib
and a lobe of the trap (Markin and Volkov 2012; Volkov et al. 2007, 2008a, b,
2011b), we applied voltages of 1 V or less from a function generator to the lamina
and petiole.
Figure 14 shows results of electrostimulation of the Venus flytrap by square
steps from the function generator at U0 ¼ 1 V from the bottom of the petiole of the
Venus flytrap. The electrical responses on electrostimulation are nonlinear with a
duration time about 10 ms (Fig. 14b, c).
These electrical responses are not action potentials since their amplitude and
polarity depend on the applied voltage. The amplitude of these nonlinear electrical
responses exponentially decreases with distance (Fig. 15) as typical electrotonic
potentials and can be described by Eq. (2) with the constant of length λ ¼ 1.32 cm.
Channel 3 in Fig. 14 is located in the trap and from Fig. 16 we can conclude that the
difference in RC time constants in the petiole and in the lamina is about 1.5 times.
As a result, the time dependence of electrical response in the trap crossed the time
dependence in the petiole.
Figure 16 shows dependencies of electrotonic potential on time measured at two
different channels in the petiole of the Venus flytrap during electrostimulation by
the function generator. To estimate the speed of electrotonic potentials, we sent a
single pulse and measured arriving time at each electrode pair. The speed of
electrotonic potentials in the petiole was estimated by dividing the distance between
channels by the time difference between two minimums in Fig. 16. The speed of
electrotonic potential propagation is equal to 1 cm/2.5 ms ¼ 4 m/s (Mean 3.91 m/s,
Median 4.00 m/s, Std. Dev. 0.11 m/s, Std. Err. 0.03 m/s, n ¼ 14).
Amplitude and polarity of electrical responses depend on the applied voltage
(Fig. 17). One can notice that points in Fig. 17 represent two straight lines with
slope of 0.178 V/V at the right side and slope of 0.067 V/V at the left. Transition
between them occurs at U0 ¼ 0.4 V. Application of a sinusoidal electrical stimulation from the function generator to the lobe of the Venus flytrap generates linear
electrical responses in the petiole in the form of graded potentials which are
changes in polarization where the magnitude of the change varies with the strength
of the stimulus (Fig. 18). Amplitude of this response linearly depends on applied
voltage with a slope of 0.049 V/V (Fig. 19a). Dependence on distance initially is
also linear, but then the curve quickly approaches zero (Fig. 19b). The output is
entirely consistent with the tissue behaving as an RC circuit.
The response in Fig. 18 indicates that the time constant is short compared to the
period of the input and the tissue of the Venus flytrap behaves as a differentiator
with voltage determined by equation:
164
A.G. Volkov and V.S. Markin
a
Channel 3
Channel 2
Channel 1
Function generator
b
0.2
U (V)
0.1
0.0
-0.1
-0.2
0.0
0.5
1.0
1.5
2.0
Time (s)
c
0.20
U (V)
0.15
0.10
0.05
0.00
0.84
0.86
0.88
0.90
0.92
0.94
Time (s)
Fig. 14 Electrostimulation of the Venus flytrap by a square pulse from function generator at
U0 ¼ 1.0 V from the bottom of the petiole of the Venus flytrap. (a) Location of 8 Ag/AgCl
electrodes in the Venus flytrap; (b, c) Electrical responses in channels 1, 2, and 3. The frequency of
scanning was 250,000 samples/s with a low-pass filter at 125,000 scans/s. Frequency of electrostimulation was 1 Hz
Active and Passive Electrical Signaling in Plants
a
1
Ref 1
2
Ref 2
3
Ref 3
4
Ref 4
5
Ref 5
Function generator
b
40
U (mV)
20
0
-20
-40
1
2
3
4
5
6
7
Distance (cm)
c
300
200
100
U (mV)
Fig. 15 (a) Location of Ag/
AgCl electrodes in the
Venus flytrap. Dependence
of electrical signal in the
petiole on distance from the
electrodes induced by a
function generator at (b)
U0 =±0.25 V and (c)
U0 =±1.0 V. The frequency
of scanning was 250,000
samples/s with a low pass
filter at 125,000 scans/s
165
0
-100
-200
-300
1
2
3
4
5
Distance (cm)
6
7
166
A.G. Volkov and V.S. Markin
Fig. 16 Time dependence
of electrical signal in the
petiole induced by a square
pulse from a function
generator at U0 ¼ 0.5 V.
The frequency of scanning
was 100,000 samples/s with
a low-pass filter at
50,000 scans/s. Frequency
of electrostimulation was
1 Hz
Fig. 17 Dependence of
maximal amplitude U of
electrical signals induced by
a square pulse from the
function generator on
applied voltage U0 between
Ag/AgCl electrodes
(channel 1) located in the
Venus flytrap petiole at
2 cm distance from
electrodes connected to the
function generator.
Frequency of
electrostimulation was
1 Hz. Measurements were
performed at
100,000 scans/s with a
low-pass filter at
50,000 scans/s
Electrode
Channel 1
Ref
Function generator
200
150
U (mV)
100
50
0
-50
-100
-150
-1.0 -0.8 -0.6 -0.4 -0.2 0.0 0.2 0.4 0.6 0.8 1.0
U0 (V)
Active and Passive Electrical Signaling in Plants
167
a
Function Generator
Ref
Electrode 1
Electrode 2
Ref 1 and Ref 2
b
0.04
0.5
2
0.00
0.0
-0.02
U0 (V)
U (V)
0.02
1.0
Function
Generator
1
-0.5
-0.04
-1.0
0.0
0.5
1.0
1.5
2.0
U (V)
0.4
1.0
0.2
0.5
0.0
0.0
-0.2
-0.5
-0.4
0.0
U0 (V)
Time (s)
c
-1.0
0.5
1.0
1.5
2.0
Time (s)
Fig. 18 (a) Location of Ag/AgCl electrodes in the Venus flytrap. Time dependence of electrical
signal in the petiole induced by sinusoidal wave (b) and by square pulse (c) from function
generator at U0 =±1.0 V. The frequency of scanning was 100,000 samples/s with a low-pass filter
at 50,000 scans/s. Frequency of electrostimulation was 1 Hz
168
a
40
20
U (V)
Fig. 19 Dependence of
maximal amplitude U of
electrical signals induced by
a sinusoidal wave from the
function generator
connected to electrodes in
the trap on applied voltage
U0 (a) and distance (b)
between Ag/AgCl
electrodes located in the
Venus flytrap petiole.
U0 ¼ +1 V (1) or 1 V (2).
Frequency of
electrostimulation was
1 Hz. Measurements were
performed at
100,000 scans/s with a
low-pass filter at
50,000 scans/s
A.G. Volkov and V.S. Markin
0
-20
-40
-1.0
-0.5
0.0
0.5
1.0
U0 (V)
b
60
40
1
U (V)
20
0
-20
2
-40
-60
1
2
3
4
5
6
7
Distance (cm)
U ¼ RCðdU 0 =dtÞ RCðdU=dtÞ:
ð6Þ
This equation predicts the phase shift of the response in the case of electrostimulation by a sine wave shown in Fig. 18b. The analysis of the response to the sine
wave shows the dependence of the amplitude and phase shift of the response on the
frequency and amplitude of the signal. The square electrostimulating waves generate nonlinear responses as spikes (Fig. 18c), as predicted by Eq. (3) for a
differentiator in the electrical network of the Venus flytrap.
Figure 20 shows nonlinear responses in the Venus flytrap induced by a square
pulse electrostimulation from the function generator, which was applied to the
lamina of the Venus flytrap. The dependence of the amplitude of response on the
amplitude of stimulus is well described by Boltzmann function with appropriate
parameters:
Active and Passive Electrical Signaling in Plants
Fig. 20 Dependence of
maximal amplitude U of
electrical signals between
Ag/AgCl electrodes located
in the Venus flytrap petiole
(channel 1) induced by a
square pulse from the
function generator
connected to Ag/AgCl
electrodes in the Venus
flytrap lamina on applied
voltage U0. Frequency of
electrostimulation was
1 Hz. Measurements were
performed at
100,000 scans/s with a
low-pass filter at
50,000 scans/s. Solid line
was plotted according to
Eq. (2)
169
a
Function Generator
Channel 1
Electrode 1
Ref 1
Channel 2 Electrode 2
Ref 2
Channel 3 Electrode 3
Ref 3
Electrode 4
Channel 4
Ref 4
b
0.10
U (V)
0.05
0.00
-0.05
-0.10
-1.0
-0.5
0.0
0.5
1.0
U0 (V)
U ¼ 0:10747½1 expð2:6777U 0 Þ =½1 þ expð2:6777U0 Þ:
ð7Þ
In order to induce a nonlinear response, there must be an instantaneous increase
or decrease in the stimulus voltage. Any stimulation that is not instantaneous, such
as a sinusoidal or triangular function, results in electrotonic potentials. The duration
of electrotonic potentials does not depend on the amplitude of the applied voltage
(Figs. 14 and 16). Only one electrical signal, which resembles a spike, was
generated in the lamina and in the petiole of the Venus flytrap during a single
square pulse from the function generator. The amplitude of electrical response is
proportional to the amplitude of the stimulus and does not obey the all-or-none rule.
Therefore, it is not an action potential but rather corresponds to the propagating
electrotonic potential. Amplitude of electrotonic potentials does not depend on
frequency of electrostimulation (Fig. 21), if the applied square pulse stimulus has
a frequency less than 10 scans/s and decreases at higher frequency. The reason is
that if the frequency of the square wave is too fast compared to the RC constant, the
plant tissue capacitors do not have time to charge or discharge.
170
A.G. Volkov and V.S. Markin
Fig. 21 Dependence of
electrical responses induced
by a square pulse from
function generator on
frequency of
electrostimulation
(U0 ¼ 0.5 V, distance from
function generator is 4 cm)
Channel 1
Function generator
65
60
U (mV)
55
50
45
40
35
-1
0
1
2
3
Log10(Samples/s)
5.3
Electrical Stimulation at High Voltages: From
Electrotonic to Action Potential
Electrotonic potentials can induce action potentials in the lamina of the Venus
flytrap if the applied voltage of electrostimulation to the petiole exceeds the
threshold value. Figure 22 shows electrical responses in the Venus flytrap between
the midrib and the lobe when square electrical stimuli were applied to the petiole
with a distance of 5 mm from the midrib. If the amplitude of the applied voltage was
less than 4.4 V, only electrotonic potentials were generated in the trap with the same
polarity as polarity of the stimulating voltage (Fig. 22a, b). Figure 22a shows
electrical response in the trap when the amplitude of applied voltage was 1 V;
Fig. 21b corresponds to the applied voltage of 4 V. Figure 22c, d shows that if the
applied voltage has an amplitude of 4.5 V, electrotonic potentials with an amplitude
of 0.85 V and action potential with amplitude of 0.175 V propagate in the trap.
Figure 22d shows in extended scale a portion of Fig. 22c. Polarity of electrotonic
Active and Passive Electrical Signaling in Plants
c
Ref
Channel 1
171
1.0
+
Function Ref
0.8
0.6
0.4
U (V)
a
U (V)
Generator
0.2
0.0
0.20
-0.2
0.15
-0.4
0.10
-0.6
0.05
-0.8
0.00
-1.0
0
-0.05
2
4
6
8
10
Time (s)
-0.10
-0.15
-0.20
0
2
4
6
8
10
d
0.20
Time (s)
0.15
b
0.8
U (V)
0.6
U (V)
0.4
0.2
0.0
0.10
0.05
-0.2
-0.4
0.00
-0.6
-0.8
0
2
4
6
Time (s)
8
10
0.8
1.0
1.2
1.4
1.6
1.8
2.0
2.2
Time (s)
Fig. 22 Electrical signaling in the lamina of the Venus flytrap induced by electrostimulation of
the petiole. (a) U0 ¼ 1 V, 0.2 Hz; (b) U0 ¼ 4 V, 0.2 Hz; (c, d) U0 ¼ 4.5 V, 1 Hz (Volkov
et al. 2013b)
potentials coincides with polarity of electrostimulating voltage (Fig. 21c), but
negative electrotonic potential induce positive nonlinear responses in the trap,
which are action potentials (Fig. 22c, d). Amplitude of these action potentials
does not depend on applied voltage in the range from 4.4 to 6.0 V.
If the same electrical stimulation by a square wave with amplitude of 4.5 V is
applied to the petiole of the Venus flytrap with an open trap near a midrib, the trap
closes. If the amplitude is less than 4.5 V, the trap does not close. If the additional
square pulse is applied to the petiole of the Venus flytrap with a closed trap, action
potential between a midrib and the lobes generates, which then causes the tightening and constriction of the trap. Action potentials can be generated by applied
voltage between 4.5 and 6.0 V. Higher voltages give complicated shapes of
electrical responses and induce downward movement of the trap.
According to Fig. 22c, amplitude of electrical responses is 0.175 V and duration
is about 0.2 s. Similar amplitudes of action potentials in the Venus flytrap were
reported in the literature (Escalante-Pérez et al. 2011; Hodick and Sievers 1988;
Trebacz and Sievers 1998; Volkov et al. 2007). DiPalma et al. (1966) reported
similar duration of action potential (0.24 s). Duration and amplitude of an action
potential in the Venus flytrap depend on Ca2+ concentration (Hodick and Sievers
172
A.G. Volkov and V.S. Markin
1986, 1988) and in the presence of EDTA amplitude decreases and duration of an
action potential increases (Krol et al. 2012). With increasing external Ca2+ concentration the amplitude of action potential grew while the duration shortened (Krol
et al. 2006).
5.4
Interaction Between Active and Passive Impulses
in the Venus Flytrap
Electrostimulation by a square pulse of the lamina or petiole of the Venus flytrap
induces electrotonic potentials, which can propagate from the petiole to the lamina
and from the lamina to the petiole. Electrostimulation of the petiole by a square pulse
with amplitude of 4.4 V induces the propagation of electrotonic potential in the
petiole and lamina and action potential in the trap, which induce the trap closing.
Action potential can propagate from mechanosensitive trigger hairs in the lamina to
the midrib, but does not penetrate to the petiole. Trebacz et al. (1996) studied action
potentials in the trap induced by electrostimulation and found that the threshold is
between 0.5 and 0.6 V. Krol et al. (2006) applied up to 4 V for electrostimulation of
the trap for generation of action potentials in the Venus flytrap.
Action potentials that are induced by the touching of trigger hairs do not
propagate from the lamina to the petiole (Volkov et al. 2007, 2008c). This is
consistent with the findings of Pavlovič et al. (2010) who found that the irritation
of trigger hairs and a subsequent generation of action potentials resulted in a
decrease in the effective photochemical quantum yield of photosystem II and the
rate of net photosynthesis in the trap, but not in the petiole of the Venus flytrap.
Electrotonic potentials are also well known in animal tissue such as in neurons,
the heart, and muscles (Sampson and Henriquez 2005; Shepherd 1994). Amplitude
of an electrotonic potential exponentially decreases with distance in both plants and
animal tissues. These potentials play a rather important role. For example, the
spread of a receptor potential is accomplished by means of electrotonic potentials
(Shepherd 1994). Some small neurons have only electrotonic potentials; some
neurons utilize electrotonic potentials to trigger the action potential. Electrotonic
potentials can influence on duration of action potentials (Sampson and Henriquez
2005). In animal tissue, the study of both action potentials and electrotonic potentials is very advanced and can be done at the level of single excitable cell. This is
almost impossible with plant tissue. The rare exceptions are Chara and Nitella
(Beilby 2007; Shimmen 2006). In other cases, we deal with ensemble of cells and
we are not sure about position of electrodes. Therefore, it is not surprising that
researchers observe different shapes of electrical signals with single phase or two
phases of electrical oscillations (DiPalma et al. 1961). Plant tissues are rather
complex and do not make these studies easy. Even the application of the popular
cable model to observed data is not always very justified. Nevertheless, the joint
efforts of many laboratories have helped to better understand plant
electrophysiology.
Active and Passive Electrical Signaling in Plants
173
6 Conclusions
Plants are ideal adaptive structures with smart sensing capabilities. The knowledge
gained from studying electrical, mechanical, and hydraulic processes in plants is
key input for designing adaptive structures and intelligent materials. Understanding
mechanisms in functioning of phytosensors and phytoactuators is very important
not only for botany and plant physiology, but has important applications in
bio-inspired engineering and technology (Lee et al. 2010; Shahinpoor 2011; Taya
2003; Volkov and Markin 2012).
Acknowledgments This review is based upon work supported in part by the National Science
Foundation under Grant No. CBET-1064160 and in part by the U.S. Army Research Office under
contract/grant number W911NF-11-1-0132.
References
Abe T (1980) The shortening and action potential of the cortex in the main pulvinus of Mimosa
pudica. Bot Mag Tokyo 93:247–251
Abe T (1981) Chloride ion efflux during an action potential in the main pulvinus of Mimosa
pudica. Bot Mag Tokyo 94:379–383
Abe T, Oda K (1976) Resting and action potentials of excitable cells in the main pulvinus of
Mimosa pudica. Plant Cell Physiol 17:1343–1346
Beilby MJ (2007) Action potentials in charophytes. Int Rev Cytol 257:43–82
Benolken RM, Jacobson SL (1970) Response properties of a sensory hair excised from Venus’s
flytrap. J Gen Physiol 56:64–82
Bernard C (1878) Lectures on phenomena of life common to animals and plants. J.B. Balliere and
Son, Paris
Bertholon M (1783) De l’electricite des vegetaux: ouvrage dans lequel on traite de l’electricite de
l’atmosphere sur les plantes, de ses effets sur leconomie des vegetaux, de leurs vertus medico.
P.F. Didot Jeune, Paris
Bose JC (1907) Comparative electro-physiology, a physico-physiological study. Longmans, Green
& Co, London
Bose JC (1913) Researches on irritability of plants. Longmans, London
Bose JC (1918) Life movements in plants. B.R. Publishing Corp, Delhi
Bose JC (1926) The nervous mechanism of plants. Longmans, Green and Co., London
Bose JC (1928) The motor mechanism of plants. Longmans Green, London
Buchen B, Hensel D, Sievers A (1983) Polarity in mechanoreceptor cells of trigger hairs of
Dionaea muscipula. Planta 158:458–468
Burdon-Sanderson J (1873) Note on the electrical phenomena which accompany stimulation of the
leaf of Dionaea muscipula. Philos Proc R Soc Lond 21:495–496
Christmann A, Grill E (2013) Plant biology: electric defence. Nature 500:404–405
Dainty J (1963) Water relations of plant cells. Adv Bot Res 1:279–326
Darwin C (1880) The power of movements in plants. John Murra, London
DiPalma JR, Mohl R, Best W (1961) Action potential and contraction of Dionaea muscipula
(Venus flytrap). Science 133:878–879
DiPalma JR, McMichael R, DiPalma M (1966) Touch receptor of Venus flytrap, Dionaea
muscipula. Science 152:539–540
174
A.G. Volkov and V.S. Markin
Eisen D, Janssen D, Chen X, Choa FS, Kostov D, Fan J (2013) Closing a Venus Flytrap with
electrical and mid-IR photon stimulations. In: Proceedings of SPIE 8565, Photonic therapeutics
and diagnostics IX, 85655I (March 8, 2013); doi:10.1117/12.2005351
Escalante-Pérez M, Krol E, Stange A, Geiger D, Al-Rasheid KAS, Hause B, Neher E, Hedrich RA
(2011) Special pair of phytohormones controls excitability, slow closure, and external stomach
formation in the Venus flytrap. Proc Natl Acad Sci U S A 108:15492–15497
Eschrich W (1989) Stofftransport in Bäumen. Sauerländer, Frankfurt
Fensom DS (1980) Problems arising from Munch-type pressure flow mechanism of sugar transport
in phloem. Can J Bot 59:425–432
Fensom DS, Spanner DC (1969) Electro-osmotic and biopotential measurement on phloem strands
of Nymhoides. Planta 88:321–331
Fleurat-Lessard P, Bonnemain J (1978) Structural and ultrastructural characteristics of vascular
apparatus of the sensitive plant (Mimosa pudica L). Protoplasma 94:127–143
Fromm J (1991) Control of phloem unloading by action potentials in Mimosa. Physiol Plantarum
83:529–533
Fromm J, Eschrich W (1988) Transport processes in stimulated and non-stimulated leaves of
Mimosa pudica. I. The movement of 14C-labelled photoassimilates. Trees 2:7–17
Fromm J, Lautner S (2007) Electrical signals and their physiological significance in plants. Plant
Cell Environ 30:249–257
Haberlandt G (1914) Physiological plant anatomy. Macmillan, London
Hedrich R (2012) Ion channels in plants. Physiol Rev 92:1777–1811
Heyl JG (1933) Der Einfluss von Aussenfaktoren auf das Bluten der Pflanzen. Planta 20:294–353
Hodick D, Sievers A (1986) The influence of Ca2+ on the action potential in mesophyll cells of
Dionaea muscipula Ellis. Protoplasma 133:83–84
Hodick D, Sievers A (1988) The action potential of Dionaea muscipula Ellis. Planta 174:8–18
Hooke R (1667) Micrographia. The Royal Society, London
Houwink AL (1935) The conduction of excitation in Mimosa pudica. Recuril des Travaux
Botaniques Neerlandais 32:51–91
Houwink AL (1938) The conduction of excitation in Clematis zeylanica and in Mimosa pudica.
Annales du Jardin Botanique de Buitenzorg 48:10–16
Hormuzdi SG, Filippov MA, Mitropoulou G, Monyer H, Bruzzone R (2004) Electrical synapses: a
dynamic signaling system that shapes the activity of neuronal networks. Biochim Biophys Acta
1662:113–137
Jack JJ, Noble D, Tsien RW (1975) Electric current flow in excitable cells. Clarendon, Oxford
Jacobson SL (1965) Receptor response in Venus’s flytrap. J Gen Physiol 49:117–129
Jovanov E, Volkov AG (2012) Plant electrostimulation and data acquisition. In: Volkov AG
(ed) Plant electrophysiology – methods and cell electrophysiology. Springer, Berlin, pp 45–67
Kaiser H, Grams TEE (2006) Rapid hydropassive opening and subsequent active stomatal closure
follow heat-induced electrical signals in Mimosa pudica. J Exp Bot 57:2087–2092
Keller R (1930) Der elektrische Factor des Wassertransporte in Luhte der Vitalfarbung. Ergeb
Physiologie 30:294–407
Koziolek C, Grams TEE, Schreiber U, Matyssek R, Fromm J (2003) Transient knockout of
photosynthesis mediated by electrical signals. New Phytol 161:715–722
Krol E, Dziubinska H, Stolarz M, Trebacz K (2006) Effects of ion channel inhibitors on cold- and
electrically-induced action potentials in Dionaea muscipula. Biol Plantarum 50:411–416
Krol E, Płachno BJ, Adamec L, Stolarz M, Dziubińska H, Trebacz K (2012) Quite a few reasons
for calling carnivores ‘the most wonderful plants in the world’. Ann Bot 109:47–64
Ksenzhek OS, Volkov AG (1998) Plant energetics. Academic Press, San Diego
Lee H, Xia C, Fang N (2010) First jump of microgel: actuation speed enhancement by elastic
instability. Soft Matter 6:4342–4345
Malone M (1994) Wound-induced hydraulic signals and stimulus transmission in Mimosa pudica
L. New Phytol 128:49–56
Active and Passive Electrical Signaling in Plants
175
Markin VS, Volkov AG (2012) Morphing structures in the Venus flytrap. In: Volkov AG (ed) Plant
electrophysiology – signaling and responses. Springer, Berlin, pp 1–31
Markin VS, Volkov AG, Jovanov E (2008) Active movements in plants: mechanism of trap
closure by Dionaea muscipula Ellis. Plant Signal Behav 3:778–783
Milne A, Beamish T (1999) Inhalation and local anesthetics reduce tactile and thermal responses
in Mimosa pudica. Can J Anaesth 46:287–289
Mohr H, Schopfer P (1995) Plant physiology. Springer, Berlin, pp 528–529
Nordestrom BEW (1983) Biologically closed electrical circuits. Clinical, experimental and theoretical evidence for an additional circulatory system. Nordic Medical Publications, Uppsala
Oda K, Abe T (1972) Action potential and rapid movement in the main pulvinus of Mimosa
pudica. Bot Mag Tokyo 85:135–145
Okazaki N, Takai K, Sato T (1993) Immobilization of a sensitive plant, Mimosa pudica L., by
volatile anesthetics. Mausi 42:1190–1193
Paes T, De Luccia B (2012) Mimosa pudica, Dionaea muscipula and anesthetics. Plant Signal
Behav 7:1163–1167
Pavlovič A, Demko V, Hudak J (2010) Trap closure and prey retention in Venus flytrap (Dionaea
muscipula) temporarily reduces photosynthesis and stimulates respiration. Ann Bot 105:37–44
Ritter JW (1811) Electrische Versuche an der Mimosa pudica L. In Parallel mit gleichen
Versuchen an Fröschen. Denkschr Köningl Akad Wiss (München) 2:345–400
Roberts AG (2005) Plasmodesmal structure and development. In: Oparka KJ (ed) Plasmodesmata.
Blackwell, Oxford, pp 1–32
Roblin G (1979) Mimosa pudica: a model for the study of the excitability in plants. Biol Rev
54:135–153
Roblin G (1982) Movements, bioelectrical events and proton excretion induced in the pulvini of
Mimosa pudica L. by a period of darkness. Zeitschrift Pflanzenphysiologie 108:295–304
Roshchina VI (2001) Neurotransmitters in plant life. Science Publishers, Inc., Enfield, NH
Sampson KJ, Henriquez CS (2005) Electrotonic influences on action potential duration dispersion
in small hearts: a simulation study. Am J Physiol Heart Circ Physiol 289:H350–H360
Shahinpoor M (2011) Biomimetic robotic Venus flytrap (Dionaea muscipula Ellis) made with
ionic polymer metal composites. Bioinspir Biomim 6:046004-1-11. doi:10.1088/1748-3182/6/
4/046004
Shannon CE (1949) Communication in the presence of noise. Proc Inst Radio Eng 37:10–21
Shepherd GM (1994) Neurobiology. Oxford University Press, New York
Shimmen T (2006) Electrophysiology in mechanosensing and wounding response. In: Volkov AG
(ed) Plant electrophysiology. Theory and methods. Springer, Berlin, pp 319–339
Sibaoka T (1962) Excitable cells in Mimosa. Science 137:226–226
Sibaoka T (1966) Action potentials in plant organs. Symp Soc Exp Biol 20:49–74
Sibaoka T (1969) Physiology of rapid movements in higher plants. Ann Rev Plant Physiol
20:165–184
Sibaoka T (1991) Rapid plant movements triggered by action potentials. Bot Mag Tokyo
104:73–95
Stoeckel H, Takeda K (1993) Plasmalemmal, voltage-dependent ionic currents from excitable
pulvinar motor cells of Mimosa pudica. J Membr Biol 131:179–192
Takamura T (2006) Electrochemical potential around the plant root in relation to metabolism and
growth acceleration. In: Volkov AG (ed) Plant electrophysiology – theory and methods.
Springer, Berlin, pp 341–374
Taya M (2003) Bio-inspired design of intelligent materials. Proc SPIE 5051:54–65
Tinz-Füchmeier A, Gradmann D (1990) Laser-Interferometric re-examination of rapid conductance of excitation in Mimosa pudica. J Exp Bot 41:15–19
Trebacz K, Bush MB, Hejnowicz Z, Sievers A (1996) Cyclopiazonic acid disturbs the regulation
of cytosolic calcium when repetitive action potentials are evoked in Dionaea traps. Planta
198:623–626
176
A.G. Volkov and V.S. Markin
Trebacz K, Sievers A (1998) Action potential evoked by light in traps of Dionaea muscipula Ellis.
Plant Cell Physiol 39:369–372
Umrath K (1937) Der Erregungsvorgang bei höheren Pflancen. Ergebnis Biologie 14:1–42
Volkov AG (2000) Green plants: electrochemical interfaces. J Electroanal Chem 483:150–156
Volkov AG (2006a) Electrophysiology and phototropism. In: Balushka F, Manusco S, Volkman D
(eds) Communication in plants. Springer, Berlin, pp 351–367
Volkov AG (ed) (2006b) Plant electrophysiology – theory and methods. Springer, Berlin
Volkov AG (ed) (2012a) Plant electrophysiology. Methods and cell electrophysiology. Springer,
Berlin
Volkov AG (ed) (2012b) Plant electrophysiology. Signaling and responses. Springer, Berlin
Volkov AG, Markin VS (2012) Phytosensors and phytoactuators. In: Volkov AG (ed) Plant
electrophysiology – signaling and responses. Springer, Berlin, pp 173–206
Volkov AG, Deamer DW, Tanelian DL, Markin VS (1998) Liquid interfaces in chemistry and
biology. Wiley, New York
Volkov AG, Adesina T, Markin VS, Jovanov E (2007) Closing of Venus flytrap by electrical
stimulation of motor cells. Plant Signal Behav 2:139–144
Volkov AG, Adesina T, Jovanov E (2008a) Charge induced closing of Dionaea muscipula Ellis
trap. Bioelectrochemistry 74:16–21
Volkov AG, Adesina T, Markin VS, Jovanov E (2008b) Kinetics and mechanism of Dionaea
muscipula trap closing. Plant Physiol 146:694–702
Volkov AG, Carrell H, Adesina T, Markin VS, Jovanov E (2008c) Plant electrical memory. Plant
Signal Behav 3:490–492
Volkov AG, Coopwood KJ, Markin VS (2008d) Inhibition of the Dionaea muscipula Ellis trap
closure by ion and water channels blockers and uncouplers. Plant Sci 175:642–649
Volkov AG, Carrell H, Baldwin A, Markin VS (2009a) Electrical memory in Venus flytrap.
Bioelectrochemistry 75:142–147
Volkov AG, Carrell H, Markin VS (2009b) Biologically closed electrical circuits in Venus flytrap.
Plant Physiol 149:1661–1667
Volkov AG, Foster JC, Ashby TA, Walker RK, Johnson JA, Markin VS (2010a) Mimosa pudica:
electrical and mechanical stimulation of plant movements. Plant Cell Environ 33:163–173
Volkov AG, Foster JC, Baker KD, Markin VS (2010b) Mechanical and electrical anisotropy in
Mimosa pudica. Plant Signal Behav 5:1211–1221
Volkov AG, Foster JC, Jovanov E, Markin VS (2010c) Anisotropy and nonlinear properties of
electrochemical circuits in leaves of Aloe vera L. Bioelectrochemistry 81:4–9
Volkov AG, Foster JC, Markin VS (2010d) Signal transduction in Mimosa pudica: biologically
closed electrical circuits. Plant Cell Environ 33:816–827
Volkov AG, Foster JC, Markin VS (2010e) Molecular electronics in pinnae of Mimosa pudica.
Plant Signal Behav 5:826–831
Volkov AG, Baker K, Foster JC, Clemmens J, Jovanov E, Markin VS (2011a) Circadian variations
in biologically closed electrochemical circuits in Aloe vera and Mimosa pudica. Bioelectrochemistry 81:39–45
Volkov AG, Pinnock MR, Lowe DC, Gay MS, Markin VS (2011b) Complete hunting cycle of
Dionaea muscipula: consecutive steps and their electrical properties. J Plant Physiol
168:109–120
Volkov AG, O’Neal L, Volkova MI, Markin VS (2013a) Morphing structures and signal transduction in Mimosa pudica L. induced by localized thermal stress. J Plant Physiol
170:1317–1327
Volkov AG, Vilfranc CL, Murphy VA, Mitchell CM, Volkova MI, O’Neal L, Markin VS (2013b)
Electrotonic and action potentials in the Venus flytrap. J Plant Physiol 170:838–846
Wallace RH (1931) Studies of sensitivity of Mimosa pudica. 1. The effect of certain animal
anesthetics upon sleep movements. Ann J Bot 18:102–111
Yang RT, Scott CL, Zhang MJ, Xia LJ (2010) A mathematical model on the closing and opening
mechanism for Venus flytrap. Plant Signal Behav 5:968–978
Adaptations of Chloroplastic Metabolism
in Halophytic Plants
Ewa Niewiadomska and Monika Wiciarz
Contents
1 Introduction . . . . . . . . . . . . . . . . . . . . . . . . . . . . . . . . . . . . . . . . . . . . . . . . . . . . . . . . . . . . . . . . . . . . . . . . . . . . . . . . .
2 Protection of Photosystem II . . . . . . . . . . . . . . . . . . . . . . . . . . . . . . . . . . . . . . . . . . . . . . . . . . . . . . . . . . . . . . .
2.1 Photoinhibition . . . . . . . . . . . . . . . . . . . . . . . . . . . . . . . . . . . . . . . . . . . . . . . . . . . . . . . . . . . . . . . . . . . . . . . .
2.2 Reduction of PSII Antenna Size . . . . . . . . . . . . . . . . . . . . . . . . . . . . . . . . . . . . . . . . . . . . . . . . . . . . . .
2.3 Xanthophyll Cycle . . . . . . . . . . . . . . . . . . . . . . . . . . . . . . . . . . . . . . . . . . . . . . . . . . . . . . . . . . . . . . . . . . . .
3 Protection at PSI and Changes in the Chloroplast Ultrastructure . . . . . . . . . . . . . . . . . . . . . . . . .
4 Changes in Carbon Metabolism . . . . . . . . . . . . . . . . . . . . . . . . . . . . . . . . . . . . . . . . . . . . . . . . . . . . . . . . . . . .
4.1 Rubisco Activity and Activation . . . . . . . . . . . . . . . . . . . . . . . . . . . . . . . . . . . . . . . . . . . . . . . . . . . . .
4.2 CO2 Concentrating Mechanisms . . . . . . . . . . . . . . . . . . . . . . . . . . . . . . . . . . . . . . . . . . . . . . . . . . . . .
5 Redox Regulation . . . . . . . . . . . . . . . . . . . . . . . . . . . . . . . . . . . . . . . . . . . . . . . . . . . . . . . . . . . . . . . . . . . . . . . . . . .
6 Cross-Tolerance . . . . . . . . . . . . . . . . . . . . . . . . . . . . . . . . . . . . . . . . . . . . . . . . . . . . . . . . . . . . . . . . . . . . . . . . . . . . .
7 Antioxidants and Role of ROS . . . . . . . . . . . . . . . . . . . . . . . . . . . . . . . . . . . . . . . . . . . . . . . . . . . . . . . . . . . . .
8 Concluding Remarks . . . . . . . . . . . . . . . . . . . . . . . . . . . . . . . . . . . . . . . . . . . . . . . . . . . . . . . . . . . . . . . . . . . . . . . .
References . . . . . . . . . . . . . . . . . . . . . . . . . . . . . . . . . . . . . . . . . . . . . . . . . . . . . . . . . . . . . . . . . . . . . . . . . . . . . . . . . . . . . . .
178
179
179
180
181
181
182
183
184
184
186
186
187
188
Abstract Halophytism is of complex nature and polyphyletic origin in plants. One
of the common points of various strategies is a protection of the photosynthetic
machinery for a long term. Here we summarize the recent data obtained with
halophytic, as with glycophytic plants, concerning the protective strategies against
salinity stress operating in chloroplasts composed of protecting both the light
capturing machinery and the step of photosynthetic CO2 assimilation. The involvement of reactive oxygen species (ROS) and redox tuning is also discussed.
E. Niewiadomska (*)
The F. Górski Institute of Plant Physiology Polish Academy of Sciences, 30-239, Kraków,
Poland
e-mail: e.niewiadomska@ifr-pan.krakow.pl
M. Wiciarz
Department of Plant Physiology and Biochemistry, Faculty of Biochemistry, Biophysics and
Biotechnology, Jagiellonian University, Gronostajowa 7, 30-387, Kraków, Poland
© Springer International Publishing Switzerland 2015
U. Lüttge, W. Beyschlag (eds.), Progress in Botany, Progress in Botany 76,
DOI 10.1007/978-3-319-08807-5_7
177
178
E. Niewiadomska and M. Wiciarz
1 Introduction
Increasing soil salinity is one of the major abiotic stress factors limiting yield of
crop plants. As hypothesized by Tsugane et al. (1999), plants initially had a high
salinity resistance, but it was lost during evolution. This idea has been illustrated by
a recessive photoautotrophic salt tolerance1 (pst1) mutant of Arabidopsis thaliana
(L.) Heynh. which appeared resistant to salt, but also to methyl viologen and high
irradiance. Since these factors affect the chloroplastic metabolism directly one may
suppose that resistance to salinity may be associated, at least in part, with mechanisms operating in this organelle.
However, resistance to salinity is a much more complex phenomenon. The
overall amount of 2,171 salt-responsive protein identities has been dug out by an
integrated analysis of available proteomics-based studies (Zhang et al. 2012). They
represent 561 unique proteins identified from leaves, roots, shoots, seedlings,
grains, hypocotyls, radicles, and panicles from 34 plant species. In a halophytic
monocot Puccinellia tenuiflora Scribn. & Merr. more than 218 proteins were found
(Yu et al. 2011). From a number of papers, a broad spectrum of salt stress responses
may be categorized into the following groups: (1) control of ion uptake and
compartmentation, (2) stress signaling, (3) scavenging of reactive oxygen species
(ROS), (4) osmotic adjustment, (5) repair, (6) redirection of cell metabolism, and
(7) acceleration of development (for review see Zhu 2001; Wang et al. 2003;
Flowers and Colmer 2005; Parida and Das 2005; Tuteja 2007; Munns and Tester
2008).
All these strategies are not unique and several lines of evidences point out that
halophytes are using similar metabolic pathways as glycophytes to cope with
salinity, but in a more effective way and at different transcriptional control (Bohnert
et al. 1995; Dassanayake et al. 2011). Hence, a salinity tolerance may be largely
attributed to a different regulation of the same genes, as demonstrated by Kant
et al. (2006). A detailed transcript profiling after salinity stress made by Gong
et al. (2005) documented that in A. thaliana a bigger pool of salinity-induced
transcripts was associated with stress defense in comparison to Thellungiella
halophila O.E. Schulz, in which upregulation of transcripts linked with protein
folding, posttranslational modification, and protein distribution were found. A
similar tendency was noted in salinity-treated Mesembryanthemum crystallinum
L. plants (Cushman et al. 2008b). Besides, a bigger pool of genes of unknown
function appeared to be upregulated by salinity, and modulate salinity tolerance
(Cushman et al. 2008b). The abovementioned data may indicate that halophytic
species invest more energy in the changes made on existing proteins rather than in
the de novo synthesis, what may be more profitable for the overall energy budget.
Halophytes are often so strictly adapted to saline environment that they grow
better under salinity than without it. A positive effect of salinity on growth was
noted for example in Atriplex centralasiatica Iljin (Qiu et al. 2003), Sarcocornia
fruticosa (L.) A.J. Scott (Redondo-Gómez et al. 2006), Sesuvium portulacastrum
(L.) L. (Rabhi et al. 2010), M. crystallinum (Haider et al. 2012), and with a wild
Adaptations of Chloroplastic Metabolism in Halophytic Plants
179
halophytic rice Porteresia coarctata (Roxb.) Tateoka (Sengupta and Majumder
2009). On the other hand, one of the obvious effects of salinity is closure of stomata,
which restricts entry of carbon dioxide into the leaves. This reaction is typical for
both halophytic and glycophytic plants. In consequence of damped CO2 assimilation, more ROS may be formed aside the photosynthetic electron transport (PET),
which is harmful for the cells. Therefore it might be hypothesized that specific
adaptations of chloroplastic metabolism belong to key elements of resistance to
salinity stress. In order to verify that, we analyzed the recent state of research
obtained with halophytic and glycophytic plants with an emphasis of photosynthetic metabolism.
2 Protection of Photosystem II
2.1
Photoinhibition
Studies made in algae and higher plants documented that salinity, similarly to the
other stress factors (cold, moderate heat, oxidative stress, etc.), enhances the extent
of photoinhibition of PSII. This process is determined by the balance between the
rate of photodamage to PSII and the rate of its repair. Within this balance the most
sensitive part seems to be the repair, in particular, transcription and translation of
D1 protein (Allakhverdiev and Murata 2008; Takahashi and Murata 2008), and not
a PSII photodamage itself.
According to the current view on photoinhibition, damage to PSII starts from its
donor side due to the disruption of the manganese cluster of the oxygen evolving
complex (OEC) upon absorption of light (Tyystjärvi 2008). As a result of blocked
supply of electrons from water, a primary electron donor of PSII, P680 remains
oxidized, which is harmful for the reaction center. In view of this, it is striking that
in the extreme halophyte Salicornia veneta Pignatti & Lausi some OEC proteins are
lacking (PsbQ) or are less abundant (PsbP) without any negative effect on PSII
activity (Pagliano et al. 2009). It is suggested that these two polypeptides are
probably not so important for electron flow through OEC, but play other functions,
for example, during the assembly of PSII and retention of inorganic cofactors Ca2+
and Cl (Nelson and Yocum 2006). It is worth noting that increased concentration
of Cl ions may exert some protection on OEC, since the lowered rate of O2
evolution due to the removal of another polypeptide (PsbO) might be reconstituted
simply by high concentrations of this ion (Seidler 1996). A different strategy is used
by a halophytic rice P. coarctata and two mangrove species Bruguiera gymnorrhiza
(L.) Lam. and Tamarix hispida Willd., in which salinity caused an induction of
PsbO protein as a necessary step to stabilize PSII structure (Sengupta and
Majumder 2009). A proteomic comparison of two cultivars of tomato differing in
the salinity resistance revealed a higher salinity-dependent increase of PsbO and
PsbP in the more resistant one (Chen et al. 2009).
180
E. Niewiadomska and M. Wiciarz
On the other hand, photoinhibition, as long as reversible during the night, is a
protective process which limits the extent of excitation of PSII antennae (Lüttge
2000). A reversible midday photoinhibition has been noted frequently in halophytic
species (A. centralasiatica—Qiu et al. 2003, Artemisia anethifolia Weber ex
Stechm.—Lu et al. 2003a, S. fruticosa and Arthrocnemum macrostachyum
(Moric.) C. Koch—Redondo-Gómez et al. 2006 and 2010, and M. crystallinum—
Schöttler et al. 2002; Barker et al. 2004; Broetto et al. 2007). However, the maximal
PSII efficiency (Fv/Fm) seems to be more resistant to salinity than PSII efficiency in
a light adapted state (A. centralasiatica—Qiu et al. 2003, Suaeda salsa Pall.—Lu
et al. 2003b, A. anethifolia—Wen et al. 2005, T. halophila—M’rah et al. 2006;
Stepien and Johnson 2009), and M. crystallinum—Broetto et al. 2007; Gawronska
et al. 2013). This feature seems to be in common also for glycophytes, such as Zea
mays L. and A. thaliana (Yang and Lu 2005; Stepien and Johnson 2009). Parameters describing electron transport in the proximity of PSII are sometimes even
enhanced under salinity, as noted in the halophytic plant S. fruticosa (RedondoGómez et al. 2006). This implies that efficient protective strategies are induced and
that further steps of PET are more sensitive to salinity than electron transfer at PSII.
2.2
Reduction of PSII Antenna Size
Among the powerful strategies to diminish the excitation pressure at PSII under
salinity is a reduction of photosynthetic antennae (Parida and Das 2005). A reduction of the antennae size is represented by decreased chlorophyll content in
A. macrostachyum (Redondo-Gómez et al. 2010), diminished amount of proteins
belonging to the light harvesting complex of PSII (LHCII) in S. portulacastrum
(Rabhi et al. 2010), and decreased amount of chlorophyll a/b binding proteins in
P. tenuiflora (Yu et al. 2011). An illustration of that strategy might be also results of
Wang et al. (1999) obtained with Amaranthus tricolor L. that leaf fragments with
less chlorophyll and LHCII appeared more salinity resistant. A similar conclusion
might be taken from an increased chl a/b ratio in salinity-resistant species compared
with sensitive ones: Hordeum maritimum Stokes vs H. vulgare L. (Innocenti
et al. 2009) and T. halophila vs A. thaliana (M’rah et al. 2006).
However, such a reaction is not always the case. The two halophytic species
Aster tripolium L. and S. portulacastrum have a different response in this respect
(Ramani et al. 2006). Also, in S. salsa and Suaeda aegyptiaca (Hasselq.) Zohary an
induction of PSII-related proteins, i.e., chlorophyll a/b binding proteins, was noted
after salinity (Yu et al. 2011). Besides, a halophytic C4 monocot Aeluropus
lagopoides (L.) Thrin. ex Thwaites was turned to harvest more light under salt
conditions due to the increase of chlorophyll a/b binding protein of LHCII type III
under a mild NaCl treatment (Sobhanian et al. 2010).
Adaptations of Chloroplastic Metabolism in Halophytic Plants
2.3
181
Xanthophyll Cycle
Excess excitation energy at PSII could be dissipated harmlessly as heat with
involvement of the xanthophyll cycle. This can be illustrated by increased
non-photochemical quenching, NPQ (Niyogi 1999). This strategy is employed by
some halophytic species, but not all. Increased NPQ has been documented in
A. centralasiatica (Qiu et al. 2003) and S. fruticosa (Redondo-Gómez
et al. 2006). Conversely, low or unchanged NPQ due to salinity was reported in
A. anethifolia (Lu et al. 2003a), T. halophila (Stepien and Johnson 2009),
A. macrostachyum (Redondo-Gómez et al. 2010), and M. crystallinum (Broetto
et al. 2007; Niewiadomska et al. 2011; Gawronska et al. 2013). Variable protective
strategies employed under salinity in the two halophytes A. tripolium and
S. portulacastrum are also envisaged by a different extent of NPQ increase (Ramani
et al. 2006). It may be hypothesized that NPQ is strongly engaged under salinity as
long as PSII antenna are not reduced.
3 Protection at PSI and Changes in the Chloroplast
Ultrastructure
PSI seems to be more stress resistant than PSII, with the exception of certain
combinations of chilling temperatures and moderate light intensities (Scheller and
Haldrup 2005). However, low CO2 causes an acceptor side limitation of PSI which
may increase ROS production in the proximity of PSI. Some protection against
photoinhibition and ROS formation could be given by a cyclic electron transport
(CET) around PSI (Golding and Johnson 2003; Joliot and Joliot 2006; Takahashi
et al. 2009). Activation of CET under salinity has been documented in
cyanobacteria [as reviewed in Bukhov and Carpenter (2004)], while data on higher
plants are still missing.
With respect to PSI data on halophytes are scarce. A salinity-caused stimulation
of transcripts for PSI reaction center was demonstrated in halophytic rice (Sengupta
and Majumder 2009) and in M. crystallinum (Niewiadomska et al. 2011),
suggesting an increased protection of PSI. Keiller et al. (1994) supplied an indication of the state 1–state 2 transition (stt) in M. crystallinum-CAM plants by
stimulation of the slowly relaxing component of non-photochemical quenching.
An increased acceptor side limitation of PSI due to salinity was also noted in this
species together with a decreased Rubisco content (Niewiadomska et al. 2011). In
contrast to that, an increased donor side limitation of PSI represents a typical effect
of stress, as described repeatedly (Klughammer and Schreiber 1994; Johnson 2005).
This phenomenon results from the acidification of the thylakoid lumen which, on
the one hand, activates the xanthophyll cycle, while on the other hand, it inhibits cyt
b6f activity (Sacksteder and Kramer 2000; Johnson 2005). In agreement with this
view, in salinity-treated A. thaliana increased NPQ was associated with a more
182
E. Niewiadomska and M. Wiciarz
oxidized P700 under a steady-state photosynthesis, while in salinity-treated
T. halophila the value of NPQ stayed low and P700 stayed reduced (Stepien and
Johnson 2009). Intriguingly, in T. halophila an indication of stt was found in
controls, but not after salinity treatment, as shown by changes in a 77K chlorophyll
emission spectra (Wiciarz et al. 2014). Because a reduced PQ pool promotes stt
(Tikkanen and Aro 2012), a less reduced PQ pool might be expected after salinity
treatment than in controls. This supposition is in agreement with the activation of
chlororespiration in a salt-treated T. halophila plants demonstrated by Stepien and
Johnson (2009).
The actual engagement of the two photosystems may be visualized by chloroplast ultrastructure, as shown repeatedly (Edwards et al. 2004; Darie et al. 2006;
Chuartzman et al. 2008). However, under salinity changes in the osmotic pressure
and ionic composition should also be considered as a modifying factor. As
described by Parida and Das (2005), salt stress caused a notable disorganization
of the thylakoid structure in halophytic Bruguiera parviflora Wight & Arn. ex
W. Griffth. and Eucalyptus microcorys F. Muell. In M. crystallinum salinity
diminished the number of thylakoids and content of starch, while it increased the
number of plastoglobuli (Paramonova et al. 2004), similarly to S. veneta collected
in natural saline conditions (Pagliano et al. 2009). However, it appears that in
M. crystallinum thylakoid swelling is, at least partly, reversible during the night
(Niewiadomska et al. 2011). Due to the similar picture of daytime swelling to that
described for A. thaliana under state 1–state 2 transition (Chuartzman et al. 2008) it
has been hypothesized that it may visualize stt (Niewiadomska et al. 2011). However, further study is necessary to verify whether this phenomenon is confined to
CAM or to salinity in this species.
4 Changes in Carbon Metabolism
The rate of photosynthesis (PN) is declining under salinity due to several limitations
imposed by the stomata and other factors limiting the diffusion of CO2 to and in
mesophyll cells (Chaves et al. 2009). In this respect it is worth noting that some of
the halophytic species are characterized by a lower PN rate already under control
conditions. Such a feature was reported for H. maritimum in comparison to
H. vulgare (Innocenti et al. 2009). On the other hand, some of the halophytes
show an increase in PN after treatment with salinity. This reaction has been
documented for: S. salsa (Lu et al. 2003b), S. fruticosa (Redondo-Gómez
et al. 2006), and A. macrostachyum (Redondo-Gómez et al. 2010). As noted by
Munns and Tester (2008), a paradox of increased PN at decreased stomatal conductance might be explained by the changes in anatomy into the smaller and thicker
leaves with a higher density of chloroplasts per leaf area.
The inhibition of several enzymes of the Calvin cycle under salt stress has been
noted repeatedly. Salinity-induced changes of proteome of S. salsa leaves detected
a significant decrease in several proteins involved in the Calvin cycle, such as
Adaptations of Chloroplastic Metabolism in Halophytic Plants
183
glyceraldehyde-3-phosphate dehydrogenase, sedoheptulose-1,7-bisphosphatase,
and Rubisco large subunit (Li et al. 2011). However, it does not diminish the rate
of CO2 assimilation. On the other hand, stimulation of photorespiration under
salinity might be expected, by similarity to plants’ response to drought, documented
by Wingler et al. (1999). In agreement with that a transgenic rice overexpressing a
photorespiratory enzyme glutamine synthetase from tobacco was characterized by
enhanced photorespiratory flux and was more resistant to salinity (Hoshida
et al. 2000). Similarly, in a halophytic rice P. coarctata salt-enhanced production
of glutamine synthetase was found (Sengupta and Majumder 2009). Apart from
being an important electron sink for electrons from PET, this pathway does also
supply metabolites for synthesis of some compatible solutes and is a possible route
for the dissipation of excess reducing power originated in chloroplasts. However,
due to the sophisticated way of Rubisco activation (see Houtz and Portis (2003) for
a review), several limitations of photorespiration have to be considered. Thus,
photorespiration may represent an important strategy against photoinhibition as
long as enzymatic and nonenzymatic machinery responsible for Rubisco activation
is efficient.
4.1
Rubisco Activity and Activation
Several factors, associated with salinity, may affect the activity of Rubisco directly.
Oxidative stress is capable to trigger degradation of Rubisco (Desimone
et al. 1998). Moreover, low CO2/high O2 conditions cause a loss of Rubisco
activity, named often as “Rubisco follover.” Rubisco follover happens due to the
increased production of misfire products which block the active sites of the enzyme,
among them are 3-ketoarabinitol-1,5-bisphosphate, and D-glycero-2,3pentodiulose-1,5-bisphosphate (Kim and Portis 2006; Parry et al. 2008). Therefore,
the supporting enzyme—Rubisco activase (RCA)—is necessary to revitalize the
Rubisco active sites. Due to this function, RCA has to be included in a still-growing
pool of so-called stress enzymes.
Indeed, an increased amount of Rubisco activase has been reported in salinitytreated Oryza sativa L. (Parker et al. 2006), P. coarctata (Sengupta and Majumder
2009), and S. salsa (Li et al. 2011). In contrast, in M. crystallinum a decreased
amount of soluble RCA was found after salinity treatment. Despite that, Rubisco
appeared to be more highly activated in vitro (Davies and Griffiths 2012). Our
recent study made on T. halophila revealed that a majority of RCA is attached to the
thylakoid membranes, in contrast to A. thaliana where the soluble form is predominant (Wiciarz et al. 2014). This is associated by a higher Rubisco activation state in
the former species. Eichelmann et al. (2009) suggested that a temporary attachment
of RCA to the thylakoid membranes (close to cyt b6f) is necessary for the restoration of its active form in close correlation with PSI activity. A further light into this
phenomenon was put by Chen et al. (2010), who demonstrated that attachment of
RCA is correlated with a low pH gradient across the thylakoid membrane, hence
184
E. Niewiadomska and M. Wiciarz
with low ATP production. In view of this, it is likely that some halophytes may
demand enhanced Rubisco activation, achieved by a closer contact of RCA with
PSI, as a compensation for a low ATP supply.
4.2
CO2 Concentrating Mechanisms
A drastic decline of photosynthesis at limited CO2 supply may be, at least partly,
overcome by metabolic strategies which concentrate CO2 around the Rubisco
active sites. The two known CO2 Concentrating Mechanisms (CCMs) operating
in higher plants are crassulacean acid metabolism (CAM) and C4 metabolism.
Several CAM species are to be found in the salinas; however, their resistance
depends mainly on the avoidance of stress, i.e., ability to perform photosynthesis
behind closed stomata and scavenging respiratory CO2 (as reviewed by Lüttge
2004). A comparison of the halophytic C3 plant S. salsa with a drought-resistant
CAM plant Kalanchoë daigremontiana Raym.-Hamet & H. Perrier demonstrated
that in halophytic species efficient mechanisms are activated by salinity, among
them tonoplast H+-ATPase and H+-PPase, which are more critical than CAM
decisive for salinity resistance than CAM itself (Kefu et al. 2003). In the facultative
halophyte and C3-CAM intermediate plant M. crystallinum metabolism switch
takes place in response to salinity or drought (Winter and Holtum 2007). Nevertheless, a characterization of a null-CAM mutant of M. crystallinum, defective in
the production of starch, revealed that the change of photosynthetic metabolism
into CAM is not an absolute demand for the high salinity resistance of this species
(Cushman et al. 2008a; Haider et al. 2012).
Some halophytic species perform the C4 type of photosynthesis. In the C4
halophyte Atriplex halimus L. subjected to NaCl and osmotic stress (treatment
with PEG) beneficial effects of salinity were found (Martinez et al. 2005). NaCl
induced a more efficient osmotic adjustment, probably through the increase in total
soluble sugars, proline and glycine betaine (GB). A study made on another C4
halophyte Spartina densiflora Brongn. revealed a positive effect of elevated CO2 in
the atmosphere on plant growth under salinity (Mateos-Naranjo et al. 2010). This
was associated with improved water relations, greater leaf area, and enhanced
PEPC carboxylation capacity. A comparison of C4 (maize) and C3 (wheat) utilizing
monocots revealed that maize is better protected against salinity due to the more
efficient antioxidant scavenging system (Stepien and Klobus 2005).
5 Redox Regulation
Decreased CO2 assimilation, caused by salinity, elicits accumulation of NADPH
and deficit of NADP+ (Takahashi and Murata 2008). Such a situation leads to the
over-reduction of PET carriers and intensive generation of ROS. Hence, recycling
Adaptations of Chloroplastic Metabolism in Halophytic Plants
185
of NADPH under salt stress, with help of several dehydrogenases: ferredoxinNADP reductase (FNR), glucose-6-phosphate dehydrogenase (G6PDH), isocitrate
dehydrogenase (ICDH), and malic enzyme (ME), may contribute to the tolerance of
salinity (Valderrama et al. 2006).
In T. halophila a higher accumulation of the stromal thioredoxin CDSP32 due to
salinity was documented, in comparison to A. thaliana (M’rah et al. 2007). This
may suggest the increased reduction of the chloroplast stroma or a stronger activation of defense mechanisms in the halophytic species. A part of reducing power
may be exported to the cytosol or mitochondria by the so-called malate valve with
engagement of chloroplastic and cytosolic malate dehydrogenases (Scheibe
et al. 2005). A chloroplastic NADP-MDH is activated in the light by a reduced
thioredoxin, which links its activity with the increased redox state of the stroma
(Voss et al. 2008). Data obtained on M. crystallinum suggest that activation of the
chloroplastic NADP-MDH may be under control of salinity, since its activation was
found under salinity and not after high irradiance (Gawronska et al. 2013).
It is well established that the redox state at the plastoquinone pool modulates
numerous stress responses in plants (Pfannschmidt 2003; Pfannschmidt et al. 2009).
Most typically, stress situations increase an excitation pressure at PSII which leads
to the enormous reduction of the PQ pool. In consequence, not fully defined redox
signals arise, which upregulate the expression of genes associated with cell defense.
Intriguingly, in the halophytic M. crystallinum plant kind of the opposite was found,
namely, transcripts for FeSOD and CuZnSOD were not induced by conditions
reducing the PQ pool (high light, DBMIB), but by conditions oxidizing it
(DCMU), as demonstrated by Ślesak et al. (2003). This may indicate that salinity
resistance is associated with the specific modulation of the redox state of PQ pool. It
may also be suggested that the PQ pool is actually more reduced in control
conditions than after stress treatment. In support for this view, a comparison of
the glycophytic H. vulgare with the more resistant H. maritimum revealed a higher
PQ reduction in the latter one in control and under salinity than in its glycophytic
counterpart H. vulgare (Innocenti et al. 2009).
One possibility to oxidize the PQ pool under stress is the chlororespiratory
pathway. It diminishes PQ pool reduction due to the directing of electrons to
oxygen by a plastidic terminal oxidase (PTOX, IMMUTANS). Therefore, this
enzyme is considered as a safety valve for PET under stress (Rumeau
et al. 2007). However, its action is not fully understood and overexpression of
PTOX did not bring about an enhanced resistance toward photooxidative stress in
Arabidopsis and tobacco (Joёt et al. 2002; Rosso et al. 2006; Heyno et al. 2009).
Nonetheless, several highly resistant species possess a high constitutive activity of
this enzyme, for example, the high mountain plant Ranunculus glacialis L. (Streb
et al. 2005), and the stress-resistant Brassica fruticulosa Cirillo (Dı́az et al. 2007).
Stepien and Johnson (2009) reported on the increased activity and amount of PTOX
in T. halophila after salt treatment. An increased transcripts for IMMUTANS were
also found in the salinity-treated M. crystallinum (Cushman et al. 2008b). Further
work is necessary to define the precise function of this enzyme in prevention or
response to stress.
186
E. Niewiadomska and M. Wiciarz
6 Cross-Tolerance
When a plant encounters a stress situation of low or moderate extent, it often
becomes more resistant to another unfavorable environmental factor (so-called
“cross-tolerance”). This phenomenon is an important element of plants’ adaptation
to changing environment where they are subjected simultaneously or in sequence to
different stress stimuli. The halophytic A. anethifolia after treatment with NaCl
became more tolerant to high light (Lu et al. 2003a) and to high temperature (Wen
et al. 2005). Similarly, after salinity treatment of A. centralasiatica and
M. crystallinum an increased resistance to photoinhibition was noted (Qiu
et al. 2003; Gawrońska et al. 2013), whereas salinity-treated A. halimus revealed
an increased resistance to drought (Martinez et al. 2005).
Studies made on S. salsa and A. anethifolia revealed that salinity treatment
increases the thermostability of the PSII reaction center, LHCII and OEC
(Lu et al. 2003b; Wen et al. 2005). This phenomenon arises mainly from increased
abundance of heat shock proteins and of late embryogenesis abundant (LEA)
proteins, as well as from the accumulation of GB, which have a stabilizing function
on the multimeric pigment–protein photosynthetic complexes and on Rubisco
holoenzyme (Sakamoto and Murata 2002; Wang et al. 2003; Chen et al. 2009). In
support of that, numerous studies documented alleviation of stress by the application of GB or its overproduction in transgenic plants (reviewed in Sakamoto and
Murata 2002). Giri (2011) summarized the recent achievements obtained in the
field of stress tolerance due to the introduction of GB biosynthetic genes into plants.
Another aspect of a multifactor stress tolerance might be that halophytic species
are “from definition” more resistant to the other stresses such as drought and cold.
An example is T. halophila which is also highly resistant to cold and freezing
(Griffith et al. 2007; Amtmann 2009). Stress responses to salinity and drought,
although having a lot of similarities, have also specific traits. Ma et al. (2006) used
an extensive transcript profiling to make a distinction between genes responding
specifically to salinity and to the other factors of abiotic and biotic stress, respectively. Similarities and differences in plant responses to the salinity and water stress
have also been summarized by Chaves et al. (2009).
7 Antioxidants and Role of ROS
A huge body of data links resistance to salinity with upregulation of the enzymatic
and nonenzymatic antioxidants (Ashraf and Harris 2004; Parida and Das 2005, and
references therein). In chloroplasts upregulation of thylakoid-bound and stromal
superoxide dismutase (SOD) and ascorbate peroxidase (APX), as well as soluble
glutathione peroxidase (GPX), glutathione reductase (GR), and enzymes of glutathione synthesis, is a common response to salinity (Miszalski et al. 1998; Mittova
et al. 2003; Cai-Hong et al. 2005; Qiu-Fang et al. 2005). In agreement with that
Adaptations of Chloroplastic Metabolism in Halophytic Plants
187
transgenic tobacco plants overexpressing Arabidopsis CuZnSOD in the chloroplast
stroma revealed enhanced tolerance to NaCl (Badawi et al. 2004). However, in
T. halophila antioxidants were not significantly induced under salinity, in contrast
to A. thaliana, as shown by M’rah et al. (2006). This may suggest that more efficient
strategies are most likely those which prevent a high ROS formation.
In the phenomenon of stress tolerance ROS have been recognized as important
players (Mittler et al. 2011). Gomez et al. (2004) provided evidence that a H2O2
signaling originating from PET may activate a stromal APX in salinity-treated pea.
Verslues et al. (2007) found an indication that H2O2 is a point of cross talk between
the salinity-specific signaling (involving SOS2) and ROS signaling. Another illustration of such a protective involvement of ROS is a beneficial effect of H2O2
pretreatment on the salinity resistance of maize plants (Azevedo Neto et al. 2005).
In view of this it may not be so surprising that Arabidopsis mutants deficient in the
H2O2 scavenging enzymes (cytosolic and thylakoid ascorbate peroxidase) appeared
more resistant to salinity stress (Miller et al. 2007).
In T. halophila, in comparison to A. thaliana, elevated levels of several compatible solutes and transcripts associated with their synthesis, as well as with
synthesis of abscisic acid (ABA) and ABA-responsive genes, have been
documented already in control conditions (Hasegawa et al. 2000; Inan
et al. 2004; Taji et al. 2004; Gong et al. 2005; Kant et al. 2006). Our recent data
point to a much higher generation of H2O2 by PET in T. halophila in comparison to
A. thaliana (Wiciarz et al. 2014). Similarly, in leaves of S. salsa the level of H2O2
was found to be lower after salinity than in control conditions (Cai-Hong
et al. 2005). It is therefore tempting to speculate that a high H2O2 production by
PET under steady-state photosynthesis is amongst the pre-adaptive features for a
high stress resistance.
8 Concluding Remarks
Saline soils make a particularly harsh environment for plants, because of combined
action of osmotic and ionic stresses, which may be further intensified by high
irradiance and high temperature. Therefore, it is a tempting task to reveal powerful
strategies of stress resistance demonstrated by halophytic plants. The genetic and
molecular potential of halophytes has been intensively explored for the last few
decades. This enabled to recognize several stress-associated proteins and pathways,
as well as whole plant’s metabolic strategies. With respect to chloroplastic metabolism, halophytic plants developed very effective mechanisms to avoid the excessive reduction of the PQ pool and to diminish ROS formation under stress.
However, several aspects still need to be elucidated, among them: role of chlororespiration, involvement of CET, mechanism of Rubisco activation secured by
activase, and role of H2O2 in a stress preparedness of plants.
188
E. Niewiadomska and M. Wiciarz
Acknowledgments Authors are thankful to anonymous reviewers for their comments on the text,
and to the Polish National Science Center project 2011/03/B/NZ9/01619 for a financial support.
References
Allakhverdiev SI, Murata N (2008) Salt stress inhibits photosystems II and I in cyanobacteria.
Photosynth Res 98:529–539
Amtmann A (2009) Learning from evolution: Thellungiella generates new knowledge on essential
and critical components of abiotic stress tolerance in plants. Mol Plant 2:3–12
Ashraf M, Harris PJC (2004) Potential biochemical indicators of salinity tolerance in plants. Plant
Sci 166:3–16
Azevedo Neto AD, Prisco JT, Eneas-Filho J, Medeiros JV, Gomes-Filho E (2005) Hydrogen
peroxide pre-treatment induces salt-stress acclimation in maize plants. J Plant Physiol
162:1114–1122
Badawi GH, Yamauchi Y, Shimada E, Sasaki R, Kawano N, Tanaka K, Tanaka K (2004)
Enhanced tolerance to salt stress and water deficit by overexpressing superoxide dismutase
in tobacco (Nicotiana tabacum) chloroplasts. Plant Sci 166:919–928
Barker DH, Marszalek J, Zimpfer JF, Adams WW III (2004) Changes in photosynthetic pigment
composition and absorbed energy allocation during salt stress and CAM induction in Mesembryanthemum crystallinum. Funct Plant Biol 31:781–787
Bohnert HJ, Nelson DE, Jensen RG (1995) Adaptations to environmental stresses. Plant Cell
7:1099–1111
Broetto F, Duarte HM, Lüttge U (2007) Responses of chlorophyll fluorescence parameters of the
facultative halophyte and C3–CAM intermediate species Mesembryanthemum crystallinum to
salinity and high irradiance stress. J Plant Physiol 164:904–912
Bukhov N, Carpenter R (2004) Alternative photosystem I-driven electron transport routes: mechanisms and functions. Photosynth Res 82:17–33
Cai-Hong P, Su-Jun Z, Zhi-Zhong G, Bao-Shan W (2005) NaCl treatment markedly enhances
H2O2-scavenging system in leaves of halophyte Suaeda salsa. Physiol Plant 125:490–499
Chaves MM, Flexas J, Pinheiro C (2009) Photosynthesis under drought and salt stress: regulation
mechanisms from whole plant to cell. Ann Bot 103:551–560
Chen S, Gollop N, Heuer B (2009) Proteomic analysis of salt-stressed tomato (Solanum
lycopersicum) seedlings: effect of genotype and exogenous application of glycinebetaine. J
Exp Bot 60:2005–2019
Chen J, Wang P, Mi HL, Chen GY, Xu DG (2010) Reversible association of ribulose-1,5bisphosphate carboxylase/oxygenase activase with the thylakoid membrane depends upon
the ATP level and pH in rice without heat stress. J Exp Bot 11:2939–2950
Chuartzman SG, Nevo R, Shimoni E, Charuvi D, Kiss V, Ohad I, Brumfeld V, Reich Z (2008)
Thylakoid membrane remodeling during state transition in Arabidopsis. Plant Cell
20:1029–1039
Cushman JC, Agarie S, Albion RL, Elliot SM, Taybi T, Borland AM (2008a) Isolation and
characterization of mutants of common ice plant deficient in Crassulacean acid metabolism.
Plant Physiol 147:228–238
Cushman JC, Tillett RL, Wood JA, Branco JM, Schlauch KA (2008b) Large-scale mRNA
expression profiling in the common ice plant, Mesembryanthemum crystallinum, performing
C3 photosynthesis and crassulacean acid metabolism (CAM). J Exp Bot 59:1875–1894
Darie CC, De Pascalis L, Mutschler B, Haehnel W (2006) Studies of the Ndh complex and
photosystem II from mesophyll and bundle sheath chloroplasts of the C4-type plant Zea
mays. J Plant Physiol 163:800–808
Adaptations of Chloroplastic Metabolism in Halophytic Plants
189
Dassanayake M, Oh D-H, Hong H, Bohnert HJ, Cheeseman JM (2011) Transcription strength and
halophytic lifestyle. Trends Plant Sci 16:1–3
Davies BN, Griffiths H (2012) Competing carboxylases: circadian and metabolic regulation of
Rubisco in C3 and CAM Mesembryanthemum crystallinum L. Plant Cell Environ
35:1211–1220
Desimone M, Wagner E, Johanningmeier U (1998) Degradation of active-oxygen-modifed
ribulose-1,5-bisphosphate carboxylase/oxygenase by chloroplastic proteases requires
ATP-hydrolysis. Planta 205:459–466
Dı́az M, De Haro V, Munoz R, Quiles MJ (2007) Chlororespiration is involved in the adaptation of
Brassica plants to heat and high light intensity. Plant Cell Environ 30:1578–1585
Edwards GE, Franceschi VR, Vosniesenskaya EV (2004) Single-cell C4 photosynthesis versus the
dual-cell (Kranz) paradigm. Annu Rev Plant Biol 55:173–196
Eichelmann H, Talts E, Oja V, Padu E, Laisk A (2009) Rubisco in planta kcat is regulated in
balance with photosynthetic electron transport. J Exp Bot 60:4077–4088
Flowers TJ, Colmer TD (2005) Salinity tolerance in halophytes. New Phytol 179:945–963
Gawronska K, Romanowska E, Miszalski Z, Niewiadomska E (2013) Limitation of C3–CAM shift
in the common ice plant under high irradiance. J Plant Physiol 170:129–135
Giri J (2011) Glycinebetaine and abiotic stress tolerance in plants. Plant Signal Behav
6:1746–1751
Golding AJ, Johnson GN (2003) Down-regulation of linear and activation of cyclic electron
transport during drought. Planta 218:107–114
Gómez JM, Jiménez A, Olmos E, Sevilla F (2004) Location and effects of long-term NaCl stress
on superoxide dismutase and ascorbate peroxidase isoenzymes of pea (Pisum sativum cv.
Puget) chloroplasts. J Exp Bot 55: 119–130.
Gong Q, Li P, Ma S, Rupassara SI, Bohnert HJ (2005) Salinity stress adaptation competence in the
extremophile Thellungiella halophila in comparison with its relative Arabidopsis thaliana.
Plant J 44:826–839
Griffith M, Timonin M, Wong ACE, Gray GR, Akhter SR, Saldanha M, Rogers MA, Weretilnyk
EA, Moffatt B (2007) Thellungiella: an Arabidopsis-related model plant adapted to cold
temperatures. Plant Cell Environ 30:529–538
Haider MS, Barnes JD, Cushman JC, Borland AM (2012) A CAM- and starch-deficient mutant of
the facultative CAM species Mesembryanthemum crystallinum reconciles sink demands by
repartitioning carbon during acclimation to salinity. J Exp Bot 63:1985–1996
Hasegawa PM, Bressan RA, Zhu JK, Bohnert HJ (2000) Plant cellular and molecular responses to
high salinity. Annu Rev Plant Physiol Plant Mol Biol 51:463–499
Heyno E, Gross CM, Laureau C, Culcasi M, Pietri S, Krieger-Liszkay A (2009) Plastid alternative
oxidase (PTOX) promotes oxidative stress when overexpressed in tobacco. J Biol Chem
284:31174–31180
Hoshida H, Tanaka Y, Hibino T, Hayashi Y, Tanaka A, Takabe T, Takabe T (2000) Enhanced
tolerance to salt stress in transgenic rice that overexpresses chloroplast glutamine synthetase.
Plant Mol Biol 43:103–111
Houtz RL, Portis AR (2003) The life of ribulose 1,5-bisphosphatecarboxylase/oxygenase –
posttranslational facts and mysteries. Arch Biochem Biophys 414:150–158
Inan G, Zhang Q, Li P, Wang Z, Cao Z, Zhang H, Zhang C, Quist TM, Goodwin SM, Zhu J, Shi H,
Damsz B, Charbaji T, Gong Q, Ma S, Fredricksen M, Galbraith DW, Jenks MA, Rhodes D,
Hasegawa PM, Bohnert HJ, Joly RJ, Bressan RA, Zhu JK (2004) Salt Cress. A halophyte and
cryophyte Arabidopsis relative model system and its applicability to molecular genetic analyses of growth and development of extremophiles. Plant Physiol 135:1718–1737
Innocenti ED, Hafsi Ch, Guidi L, Navari-Izzo F (2009) The effect of salinity on photosynthetic
activity in potassium-deficient barley species. J Plant Physiol 166:1968–1981
Johnson GN (2005) Cyclic electron transport in C3 plants: fact or artefact? J Exp Bot 56:407–416
Joliot P, Joliot A (2006) Cyclic electron flow in C3 plants. Biochim Biophys Acta 1757:362–368
190
E. Niewiadomska and M. Wiciarz
Joёt T, Genty B, Josse EM, Kuntz M, Cournac L, Peltier G (2002) Involvement of a plastid
terminal oxidase in plastoquinone oxidation as evidenced by expression of the Arabidopsis
thaliana enzyme in tobacco. J Biol Chem 277:31623–31630
Kant S, Kant P, Raveh E, Barak S (2006) Evidence that differential gene expression between the
halophyte, Thellungiella halophila, and Arabidopsis thaliana is responsible for higher levels of
the compatible osmolyte proline and tight control of Na+ uptake in T. halophila. Plant Cell
Environ 29:1220–1234
Kefu Z, Hai F, San Z, Jie S (2003) Study on the salt and drought tolerance of Suaeda salsa and
Kalanchoë daigremontiana under iso-osmotic salt and water stress. Plant Sci 165:837–844
Keiller DR, Slocombe SP, Cockburn W (1994) Analysis of chlorophyll a fluorescence in C3 and
CAM forms of Mesembryanthemum crystallinum. J Exp Bot 45:325–334
Kim K, Portis AR Jr (2006) Kinetic analysis of the slow inactivation of Rubisco during catalysis:
effects of temperature, O2 and Mg++. Photosynth Res 87:195–204
Klughammer C, Schreiber U (1994) An improved method, using saturating light pulses, for the
determination of photosystem I quantum yield via P700+-absorbance changes at 830 nm.
Planta 192:261–268
Li W, Zhang Ch LQ, Wen X, Lu C (2011) The combined effect of salt stress and heat shock on
proteome profiling in Suaeda salsa. J Plant Physiol 168:1743–1752
Lu C, Qiu N, Lu Q (2003a) Photoinhibition and the xanthophyll cycle are not enhanced in the saltacclimated halophyte Artimisia anethifolia. Physiol Plant 118:532–537
Lu C, Qiu N, Wang B, Zhang J (2003b) Salinity treatment shows no effects on photosystem II
photochemistry, but increases the resistance of photosystem II to heat stress in halophyte
Suaeda salsa. J Exp Bot 54:851–860
Lüttge U (2000) Light-stress and crassulacean acid metabolism. Phyton 40:65–82
Lüttge U (2004) Ecophysiology of crassulacean acid metabolism (CAM). Ann Bot 93:629–652
M’rah S, Ouerghi Z, Berthomieu C, Havaux M, Jungas C, Hajji M, Grignon C, Lachaâl M (2006)
Effects of NaCl on the growth, ion accumulation and photosynthetic parameters of
Thellungiella halophila. J Plant Physiol 163:1022–1103
M’rah S, Ouerghi Z, Eymery F, Rey P, Hajji M, Grignon C, Lachaâl M (2007) Efficiency of
biochemical protection against toxic effects of accumulated salt differentiates Thellungiella
halophila from Arabidopsis thaliana. J Plant Physiol 164:375–384
Ma S, Gong Q, Bohnert HJ (2006) Dissecting salt stress pathways. J Exp Bot 57:1097–1107
Martinez J-P, Kinet J-M, Bajji M, Lutts S (2005) NaCl alleviates polyethylene glycol-induced
water stress in the halophyte species Atriplex halimus L. J Exp Bot 56:2421–2431
Mateos-Naranjo E, Redondo-Gómez S, Álvarez R, Cambrollé J, Gandullo J, Figueroa ME (2010)
Synergic effect of salinity and CO2 enrichment on growth and photosynthetic responses of the
invasive cordgrass Spartina densiflora. J Exp Bot 61:1643–1654
Miller G, Suzuki N, Rizhsky L, Hegie A, Koussevitzky S, Mittler R (2007) Double mutants
deficient in cytosolic and thylakoid ascorbate peroxidase reveal a complex mode of interaction
between reactive oxygen species, plant development, and a response to abiotic stress. Plant
Physiol 144:1777–1785
Miszalski Z, Ślesak I, Niewiadomska E, Baczek-Kwinta R, Lüttge U, Ratajczak R (1998)
Subcellular localization and stress responses of superoxide dismutase isoforms from leaves
in the C3-CAM intermediate halophyte Mesembryanthemum crystallinum L. Plant Cell Environ 21:169–179
Mittler R, Vanderauwera S, Suzuki N, Miller G, Tognetti VB, Vandepoele K, Gollery M,
Shulaev V, Van Breusegem F (2011) ROS signaling: the new wave? Trends Plant Sci
16:300–309
Mittova V, Tal M, Volokita M, Guy M (2003) Up-regulation of the leaf mitochondrial and
peroxisomal antioxidative systems in response to salt-induced oxidative stress in the wild
salt-tomato species Lycopersicon pennellii. Plant Cell Environ 26:845–856
Munns R, Tester M (2008) Mechanisms of salinity tolerance. Annu Rev Plant Biol 59:651–681
Adaptations of Chloroplastic Metabolism in Halophytic Plants
191
Nelson N, Yocum CF (2006) Structure and function of photosystems I and II. Annu Rev Plant Biol
57:521–565
Niewiadomska E, Bilger W, Gruca M, Mulisch M, Miszalski Z, Krupinska K (2011) CAM-related
changes in chloroplastic metabolism of Mesembryanthemum crystallinum L. Planta
233:275–285
Niyogi KK (1999) Photoprotection revisited: genetic and molecular approaches. Annu Rev Plant
Physiol Plant Mol Biol 50:333–359
Pagliano C, La Rocca N, Andreucci F, Deák Z, Vass I, Rascio N, Barbato R (2009) The extreme
halophyte Salicornia veneta is depleted of the extrinsic PsbQ and PsbP proteins of the oxygenevolving complex without loss of functional activity. Ann Bot 103:505–515
Paramonova NV, Shevyakova NI, Kuznetsov VV (2004) Ultrastructure of chloroplasts and their
storage inclusions in the primary leaves of Mesembryanthemum crystallinum affected by
putrescine and NaCl. Russ J Plant Physiol 51:86–96
Parida AK, Das AB (2005) Salt tolerance and salinity effects on plants: a review. Ecotoxicol
Environ Saf 60:324–349
Parker R, Flowers TJ, Moore AL, Harpham NVJ (2006) An accurate and reproducible method for
proteome profiling of the effects of salt stress in the rice leaf lamina. J Exp Bot 57:1109–1118
Parry MAJ, Keys AJ, Madgwick PJ, Carmo-Silva AE, Andralojc PJ (2008) Rubisco regulation: a
role for inhibitors. J Exp Bot 59:1569–1580
Pfannschmidt T (2003) Chloroplast redox signals: how photosynthesis controls its own genes.
Trends Plant Sci 8:33–41
Pfannschmidt T, Bräutigam K, Wagner R, Dietzel L, Schröter Y, Steiner S, Nykytenko A (2009)
Potential regulation of gene expression in photosynthetic cells by redox and energy state:
approaches towards better understanding. Ann Bot 103:599–607
Qiu N, Lu Q, Lu C (2003) Photosynthesis, photosystem II efficiency and the xanthophyll cycle in
the salt-adapted halophyte Atriplex centralasiatica. New Phytol 159:479–486
Qiu-Fang Z, Yuan-Yuan L, Cai-Hong P, Cong-Ming L, Bao-Shan W (2005) NaCl enhances
thylakoid-bound SOD activity in the leaves of C3 halophyte Suaeda salsa L. Plant Sci
168:423–430
Rabhi M, Giuntini D, Castagna A, Remorini D, Baldan B, Smaoui A, Abdelly C, Ranieri A (2010)
Sesuvium portulacastrum maintains adequate gas exchange, pigment composition, and thylakoid proteins under moderate and high salinity. J Plant Physiol 167:1336–1341
Ramani B, Reeck T, Debez A, Stelzer R, Huchzermeyer B, Schmidt A, Papenbrock J (2006) Aster
tripolium L. and Sesuvium portulacastrum L.: two halophytes, two strategies to survive in
saline habitats. Plant Physiol Biochem 44:395–408
Redondo-Gómez S, Wharmby C, Castillo JM, Mateos-Naranjo E, Luque CJ, de Cires A, Luque T,
Davy AJ, Figueroa ME (2006) Growth and photosynthetic responses to salinity in an extreme
halophyte, Sarcocornia fruticosa. Physiol Plant 128:116–124
Redondo-Gómez S, Mateos-Naranjo E, Figueroa ME, Davy AJ (2010) Salt stimulation of growth
and photosynthesis in an extreme halophyte, Arthrocnemum macrostachyum. Plant Biol
12:79–87
Rosso D, Ivanov AG, Fu A, Geisler-Lee J, Hendrickson L, Geisler SG, Krol M, Hurry V, Rodermel
SR, Maxwell DP, Hüner NPA (2006) IMMUTANS does not act as a stress-induced safety
valve in the protection of the photosynthetic apparatus of Arabidopsis during steady-state
photosynthesis. Plant Physiol 142:574–585
Rumeau D, Peltier G, Cournac G (2007) Chlororespiration and cyclic electron flow around PSI
during photosynthesis and plant stress response. Plant Cell Environ 30:1041–1051
Sacksteder CA, Kramer DM (2000) Dark-interval relaxation kinetics (DIRK) of absorbance
changes as a quantitative probe of steady state electron transfer. Photosynth Res 66:145–158
Sakamoto A, Murata N (2002) The role of glycine betaine in the protection of plants from stress:
clues from transgenic plants. Plant Cell Environ 25:163–171
Scheibe R, Backhausen JE, Emmerlich V, Holtgrefe S (2005) Strategies to maintain redox
homeostasis during photosynthesis under changing conditions. J Exp Bot 56:1481–1489
192
E. Niewiadomska and M. Wiciarz
Scheller HV, Haldrup A (2005) Photoinhibition of photosystem I. Planta 221:5–8
Schöttler MA, Kirchhoff H, Siebke K, Weis E (2002) Metabolic control of photosynthetic electron
transport in crassulacean acid metabolism-induced Mesembryanthemum crystallinum. Funct
Plant Biol 29:697–705
Seidler A (1996) The extrinsic polypeptides of Photosystem II. Biochim Biophys Acta 1277:35–60
Sengupta S, Majumder AL (2009) Insight into the salt tolerance factors of a wild halophytic rice,
Porteresia coarctata: a physiological and proteomic approach. Planta 229:911–929
Ślesak I, Karpinska B, Surówka E, Miszalski Z, Karpinski S (2003) Redox changes in the
chloroplast and hydrogen peroxide are essential for regulation of C3–CAM transition and
photooxidative stress responses in the facultative CAM plant Mesembryanthemum
crystallinum L. Plant Cell Physiol 44:573–581
Sobhanian H, Motamed N, Jazii FR, Nakamura T, Komatsu S (2010) Salt stress induced differential proteome and metabolome response in the shoots of Aeluropus lagopoides, a halophyte
C4 monocot plant. J Proteome Res 9:2882–2897
Stepien P, Johnson GN (2009) Contrasting responses of photosynthesis to salt stress in the
glycophyte Arabidopsis and the halophyte Thellungiella: role of the plastid terminal oxidase
as an alternative electron sink. Plant Physiol 149:1154–1165
Stepien P, Klobus G (2005) Antioxidant defense in the leaves of C3 and C4 plants under salinity
stress. Physiol Plant 125:31–40
Streb P, Josse E-M, Gallouët E, Baptist F, Kuntz M, Cornic G (2005) Evidence for alternative
electron sinks to photosynthetic carbon assimilation in the high mountain plant species
Ranunculus glacialis. Plant Cell Environ 28:1123–1135
Taji T, Seki M, Satou M, Sakurai T, Kobayashi M, Ishiyama K, Narusaka Y, Narusaka M, Zhu
J-K, Shinozaki K (2004) Comparative genomics in salt tolerance between Arabidopsis and
Arabidopsis-related halophyte salt cress using Arabidopsis microarray. Plant Physiol
135:1697–1709
Takahashi S, Murata N (2008) How do environmental stresses accelerate photoinhibition? Trends
Plant Sci 13:178–182
Takahashi S, Milward SE, Fan D-Y, Chow WS, Badger MR (2009) How does cyclic electron
transport flow alleviate photoinhibition in Arabidopsis. Plant Physiol 149:1560–1567
Tikkanen M, Aro EM (2012) Thylakoid protein phosphorylation in dynamic regulation of photosystem II in higher plants. Biochim Biophys Acta 1817:232–238
Tsugane K, Kobayashi K, Niwa Y, Ohba Y, Wada K, Kobayashia H (1999) A recessive
Arabidopsis mutant that grows photoautotrophically under salt stress shows enhanced active
oxygen detoxification. Plant Cell 11:1195–1206
Tuteja N (2007) Mechanisms of high salinity tolerance in plants. Methods Enzymol 428:419–438
Tyystjärvi E (2008) Photoinhibition of photosystem II and photodamage of the oxygen evolving
manganese cluster. Coord Chem Rev 252:361–376
Valderrama R, Corpas FJ, Carreras A, Gómez-Rodrı́guez MV, Chaki M, Pedrajas JR, FernándezOcaña A, Del Rı́o LA, Barroso JB (2006) The dehydrogenase-mediated recycling of NADPH
is a key antioxidant system against salt-induced oxidative stress in olive plants. Plant Cell
Environ 29:1449–1459
Verslues PE, Batelli G, Grillo S, Agius F, Kim YS, Zhu J, Agarwal M, Katiyar-Agarwal S, Zhu J-K
(2007) Interaction of SOS2 with nucleoside diphosphate kinase 2 and catalases reveals a point
of connection between salt stress and H2O2 signaling in Arabidopsis thaliana. Mol Cell Biol
27:7771–7780
Voss I, Koelmann M, Wojtera J, Holtgrefe S, Kitzmann C, Backhausen JE, Scheibe R (2008)
Knockout of major leaf ferredoxin reveals new redox-regulatory adaptations in Arabidopsis
thaliana. Physiol Plant 133:584–598
Wang Y, Meng Y-L, Ishikawa H, Hibino T, Tanaka Y, Nii N, Takabe T (1999) Photosynthetic
adaptation to salt stress in three-color leaves of a C4 plant Amaranthus tricolor. Plant Cell
Physiol 40:668–674
Adaptations of Chloroplastic Metabolism in Halophytic Plants
193
Wang W, Vinocur B, Altman A (2003) Plant responses to drought, salinity and extreme temperatures: towards genetic engineering for stress tolerance. Planta 218:1–14
Wen X, Qiu N, Lu Q, Lu C (2005) Enhanced thermotolerance of photosystem II in salt-adapted
plants of the halophyte Artemisia anethifolia. Planta 220:486–497
Wiciarz M, Gubernator B, Kruk J, Niewiadomska E. (2014) Enhanced chloroplastic generation of
H2O2 in stress-resistant Thellungiella salsuginea in comparison to Arabidopsis thaliana.
Physiol Plant (2014). doi:10.1111/ppl.12248
Wingler A, Quick WP, Bungard RA, Bailey KJ, Lea PJ, Leegood RC (1999) The role of
photorespiration during drought stress: an analysis utilizing barley mutants with reduced
activities of photorespiratory enzymes. Plant Cell Environ 22:361–373
Winter K, Holtum JAM (2007) Environment or development? Lifetime net CO2 exchange and
control of the expression of crassulacean acid metabolism in Mesembryanthemum
crystallinum. Plant Physiol 143:98–107
Yang X, Lu C (2005) Photosynthesis is improved by exogenous glycine betaine in salt-stressed
maize plants. Physiol Plant 124:343–352
Yu J, Chen S, Zhao Q, Wang T, Yang C, Diaz C, Sun G, Dai S (2011) Physiological and proteomic
analysis of salinity tolerance in Puccinellia tenuiflora. J Proteome Res 10:3852–3870
Zhang H, Han B, Wang T, Chen S, Li H, Zhang Y, Dai S (2012) Mechanisms of plant salt
response: insights from proteomics. J Proteome Res 11:49–67
Zhu J-K (2001) Plant salt tolerance. Trends Plant Sci 6:66–71
CAM-Like Traits in C3 Plants: Biochemistry
and Stomatal Behavior
Paulo Tamaso Mioto, Maria Aurineide Rodrigues, Alejandra Matiz,
and Helenice Mercier
Contents
1
2
3
4
Introduction . . . . . . . . . . . . . . . . . . . . . . . . . . . . . . . . . . . . . . . . . . . . . . . . . . . . . . . . . . . . . . . . . . . . . . . . . . . . . . . . .
General Features of Typical CAM Behavior . . . . . . . . . . . . . . . . . . . . . . . . . . . . . . . . . . . . . . . . . . . . . .
Driving Forces of CAM Evolution . . . . . . . . . . . . . . . . . . . . . . . . . . . . . . . . . . . . . . . . . . . . . . . . . . . . . . . . .
Key Biochemical Candidates for Adaptive Selection of CAM-Related Features . . . . . . . .
4.1 The Synchronous Modulation of Non-photosynthetic PEPC, MDH, PPDK, and ME
by Abiotic Constraints: A “Precondition” for CAM Cycle? . . . . . . . . . . . . . . . . . . . . . . . .
5 The Establishment of CAM Stomatal Behavior Could Happen Independently
of Biochemistry? . . . . . . . . . . . . . . . . . . . . . . . . . . . . . . . . . . . . . . . . . . . . . . . . . . . . . . . . . . . . . . . . . . . . . . . . . . . .
5.1 Is Stomatal Control in CAM Similar to Its C3 Counterpart? . . . . . . . . . . . . . . . . . . . . . . . .
5.2 CO2 Sensing: The Interaction Between Biochemistry and Stomatal Control . . . . . .
6 Conclusions and Perspectives . . . . . . . . . . . . . . . . . . . . . . . . . . . . . . . . . . . . . . . . . . . . . . . . . . . . . . . . . . . . . .
References . . . . . . . . . . . . . . . . . . . . . . . . . . . . . . . . . . . . . . . . . . . . . . . . . . . . . . . . . . . . . . . . . . . . . . . . . . . . . . . . . . . . . . .
196
196
197
198
199
201
202
203
205
205
Abstract Although it is generally accepted that Crassulacean Acid Metabolism
(CAM) originated from C3 ancestors through a co-option process, this is rarely
discussed in terms of specific characteristics and putative mechanisms behind this
event. Here we discuss the available data concerning the biochemical and stomatal
traits that are present in C3 plants and could have been enrolled in the CAM cycle.
In summary, the biochemical machinery of CAM seems to have originated from a
potential stress-driven recruitment of key non-photosynthetic enzymes of the C3
background which have entrained circadian rhythm. CAM stomatal behavior could
be either a direct consequence of an upregulation of the biochemical machinery or it
might require additional changes in the signaling/perception pathways controlling
stomatal aperture. Considering that CAM has multiple origins, it is likely that each
plant group developed it through different combinations of biochemical/stomatal
changes, resulting in various degrees of plasticity of this photosynthetic pathway.
P.T. Mioto • M.A. Rodrigues • A. Matiz • H. Mercier (*)
Department of Botany, Institute of Biosciences, University of São Paulo, CEP 05508-090 São
Paulo, SP, Brazil
e-mail: hmercier@usp.br
© Springer International Publishing Switzerland 2015
U. Lüttge, W. Beyschlag (eds.), Progress in Botany, Progress in Botany 76,
DOI 10.1007/978-3-319-08807-5_8
195
196
P.T. Mioto et al.
1 Introduction
It has been over 70 years since the term Crassulacean Acid Metabolism (CAM) was
used for the first time to indicate the nocturnal acidification observed in species of
the genus Kalanchoë (Thomas and Beevers 1949; Ranson and Thomas 1960). Ever
since, scientists have tried to unravel the mechanisms behind this phenomenon and
how it could have appeared along evolution. The emergence of CAM plants
multiple times in different taxa and habitats suggests that CAM might have
originated by a co-option process in which ancient metabolic pathways were
reorganized to generate new functions through modifications in some alreadyexisting key proteins involved in numerous non-photosynthetic processes of C3
plants (Silvera et al. 2010; Aubry et al. 2011; West-Eberhard et al. 2011; Berry
et al. 2013). Apparently, the recruitment of these biochemical elements into the
CAM pathway depended on significant increases in the expression of genes
involved in both production and transport of C4-organic acids, as well as alteration
in their diel rhythm, coupled with an inversion of stomatal aperture pattern (Taybi
et al. 2004; Silvera et al. 2010; Borland et al. 2014). However, a discussion of how
elements from C3 plants could be recruited into CAM is still uncommon. In this
chapter we intend to share some insights into the mechanisms that may have led to
CAM behavior.
2 General Features of Typical CAM Behavior
The basic C3 pathway serves as the primary mechanism for the photosynthetic
carbon fixation employed by most terrestrial plant species. This mode of CO2
assimilation, also known as Calvin–Benson cycle, operates with the central participation of RuBP carboxylase-oxygenase (Rubisco, EC 4.1.1.39) as the sole carboxylating enzyme in C3 plants. Concurrently, in plants performing typical CAM,
Rubisco re-fixates the carbon that was previously assimilated by phosphoenolpyruvate carboxylase (PEPC, EC 4.1.1.31) during the nocturnal phase of the CAM
cycle (Berry et al. 2013). The atmospheric carbon fixed by PEPC at night is stored
in the form of malic acid in the vacuole, also known as Phase I. Then, on the
following day, while the stomata remain closed, the malic acid stored during the
night is decarboxylated, allowing the CO2 generated to be photosynthetically
reduced in the chloroplasts via Calvin cycle (Phase III), concentrating CO2 around
Rubisco in this phase (Cushman and Bohnert 1999; Dodd et al. 2002; Lüttge 2002,
2004; Keeley and Rundel 2003; Crayn et al. 2004; Silvera et al. 2010; Matiz
et al. 2013). Phases II and IV are transitional states between Phases I and III.
Phase II occurs at early light period through open stomata, when Rubisco is
becoming active while PEPC is being inactivated and CO2 fixation can happen
via both enzymes. In the transition from light period to dark period, the Phase IV
occurs, which is characterized by the reopening of the stomata when the storage of
CAM-Like Traits in C3 Plants: Biochemistry and Stomatal Behavior
197
organic acids is already exhausted, allowing atmospheric CO2 assimilation via
Rubisco (Osmond 1978; Dodd et al. 2003; Lüttge 2008; Kluge 2008).
3 Driving Forces of CAM Evolution
It has been proposed that atmospheric CO2/O2 ratio reduction in the early Miocene
allowed the uprising of CO2-concentrating mechanisms, such as CAM and C4
photosynthesis (Ehleringer et al. 1991; Ehleringer and Monson 1993; Raven and
Spicer 1996; Winter and Smith 1996; Edwards and Ogburn 2012). Decreasing
atmospheric CO2 had an important impact for terrestrial plants, not only favoring
photorespiration by the increasing oxygenase activity of Rubisco (Edwards and
Ogburn 2012) but also increasing transpirational cost per unit of carbon fixed
(Raven and Spicer 1996; Brodribb and Feild 2010). Thus, by opening stomata
during the night and closing them during most of the day, CAM plants achieve a
higher water use efficiency than C3 plants, providing a selective advantage in dry
environments (Ehleringer and Monson 1993; Drennan and Nobel 2000; Keeley and
Rundel 2003; Winter et al. 2008; Borland et al. 2009, 2014). In fact, terrestrial
CAM plants are commonly found in habitats with low water availability, such as
deserts and the canopy of tropical forests. Therefore, water deficit and low CO2
concentrations were important selective driving forces for the emergence of CAM
photosynthesis (Keeley and Rundel 2003).
Although the biochemistry of CAM is frequently coupled with nocturnal stomatal opening, sometimes they seem to be independent. Isoëtes species, for example,
commonly grow in aquatic environments with depleted CO2 and bicarbonate during
the day, due to high photosynthetic activity of the other organisms. As a result,
CAM allows the uptake of inorganic carbon (both from water and respiration) at
night by storing it as organic acid (Keeley 1985; Ting 1985; Keeley and Rundel
2003). In these taxa the stomata are generally absent or nonfunctional, but all the
biochemical machinery of CAM is active. More evidence showing an uncoupling
between CAM biochemistry and nocturnal stomatal opening was found in some
pseudobulbs and roots of orchids, which are capable of expressing the biochemical
reactions of the CAM pathway, but are unable to express typical CAM due to a lack
of stomata (Rodrigues et al. 2013). In other words, the biochemistry of CAM may
happen despite the absence of stomata or in the case of plants performing CAM
cycling and idling, without nocturnal stomatal aperture. In the following sections, it
will be discussed how CAM biochemistry could have been selected independently
of the nocturnal stomatal opening. Besides, some evidence will be presented about
the occurrence of nocturnal stomatal opening without the expression of CAM
biochemical machinery. Finally, we are going to address some insights into the
potential interactions between the biochemical and stomatal modules operating in
the CAM cycle, and their impact on controlling the plasticity of this photosynthetic
pathway.
198
P.T. Mioto et al.
4 Key Biochemical Candidates for Adaptive Selection
of CAM-Related Features
Although our current knowledge regarding the evolutionary progression of specific
genes selected for CAM expression is somewhat limited, studies of the PEPC gene
family have indicated that similar changes to those described for the C4 pathway
might have occurred during the recruitment of non-photosynthetic enzymes from
C3 background into CAM (Silvera et al. 2010). Some important candidates for the
evolution of C4 and CAM photosynthesis appear to involve genes that encode the
key enzymes for the carboxylation and decarboxylation processes, such as PEPC,
PEPC kinase, malate dehydrogenase (MDH, EC 1.1.1.37), pyruvate orthophosphate
dikinase (PPDK, EC 2.7.9.1), and NADH or NADPH-dependent malic enzyme
(NADP-ME, EC 1.1.1.40, or NAD-ME, EC 1.1.1.39) (Doubnerová and Ryslavá
2011; Berry et al. 2013).
PEPC activity is thought to be a major factor in limiting the magnitude of the
CAM pathway (Taybi et al. 2004); therefore, the essential characteristics of this
enzyme should be considered in the context of potential mechanisms involved in
determining the evolution and expression plasticity of CAM photosynthesis. In fact,
PEPC is a tightly regulated enzyme that is present in the cytosol of all vascular
plants and is also broadly distributed in green algae and bacteria. This enzyme
represents a crucial regulatory point at a key branch of plant metabolism that
confers a highly flexible aspect for synchronizing the carbon partitioning with
changing environmental conditions (O’Leary et al. 2011; Shane et al. 2013). The
diverse PEPC functions include the regulation of malate production/homeostasis
during stomatal conductance modulation, environmental stress responses, and
N2-fixing nodule development in legume roots, among others (Nimmo 2000;
Aubry et al. 2011). Furthermore, plant-type PEPCs are particularly relevant for
supplying carbon skeletons to the tricarboxylic acid (TCA) cycle, which allows the
anaplerotic replenishment of the TCA intermediates redirected for biosynthesis and
ammonium assimilation (Gennidakis et al. 2007; Masumoto et al. 2010; Aubry
et al. 2011; O’Leary et al. 2011; Shane et al. 2013). O’Leary et al. (2011) considered
that, although certainly valid, such a traditional view of the non-photosynthetic
PEPC participating only in the replenishment of TCA intermediates oversimplifies
the broader contribution of this enzyme to plant metabolism.
In CAM and C4 plants, PEPC catalyzes the first and pivotal step in CO2
assimilation which involves the irreversible β-carboxylation of phosphoenolpyruvate (PEP) to yield oxaloacetate (OAA) and inorganic phosphate (Nimmo 2000;
Gennidakis et al. 2007). All plant-type PEPCs are regulated by a complex set of
posttranslational mechanisms that control their day/night activities, which includes
allosteric effectors, phosphorylation, monoubiquitination, and other protein–protein interactions (O’Leary et al. 2011; Shane et al. 2013). Since plant-type PEPCs
are allosteric enzymes inhibited by malate and activated by glucose-6-phosphate
(Glc-6-P), phosphorylation represents one essential activator of PEPC activity by
simultaneously reducing PEPC sensitivity to malate inhibition while enhancing
CAM-Like Traits in C3 Plants: Biochemistry and Stomatal Behavior
199
Glc-6-P activation. In CAM species, therefore, such a posttranslational modification allows this enzyme to overcome feedback inactivation by the end product of
nighttime CO2 fixation (e.g., malate), enabling the abundant nocturnal accumulation of C4-organic acids required for the proper operation of the CAM cycle
(Nimmo 2000; Taybi et al. 2004; Gennidakis et al. 2007; Kluge 2008; Aubry
et al. 2011; Berry et al. 2013; Shane et al. 2013).
The PEPC phosphorylation is catalyzed by the presence of a specific Ca2+independent PEPC protein kinase termed PEPC kinase. In C3 and C4 plants,
PEPC kinase seems to be activated exclusively by light (Gousset-Dupont
et al. 2005; Shenton et al. 2006), while in CAM plants this is a night-specific
enzyme whose transcription is mostly under the influence of an internal circadian
rhythm (Hartwell et al. 1999, 2002; Nimmo 2000, 2003). Although it is possible
that there is a direct connection between the circadian oscillator and the expression
of PEPC kinase in CAM plants, through a potential transcription factor directly
associated with the endogenous circadian clock, compelling evidence in favor of
such a link is still elusive (Nimmo 2000). Another hypothesis concerning the
connection between the regulation of PEPC kinase and the circadian clock during
the CAM cycle suggests that the circadian rhythm of PEPC kinase expression may
be a consequence of fluctuations in the primary metabolism related to the cellular
distribution/levels of malate. This hypothesis is based on results showing that the
abundance of PEPC kinase transcripts was inversely correlated with cytoplasmic
malate concentrations, thus indicating that malate levels could negatively affect
PEPC kinase expression and/or its mRNA stability (Borland et al. 1999; Nimmo
2000; Borland and Taybi 2004; Cushman et al. 2008). All together, these evidence
indicate that PEPC kinase modulation (by gene expression and/or enzyme activity)
might represent one of the strongest candidates required for both the establishment
and the maintenance of the core CAM machinery, due to its influence on PEPC
expression.
4.1
The Synchronous Modulation of Non-photosynthetic
PEPC, MDH, PPDK, and ME by Abiotic Constraints: A
“Precondition” for CAM Cycle?
Environmental challenges such as drought, unfavorable temperatures, salinity, and
other harsh conditions can considerably hamper the photosynthesis in most plants
due to consequences of stress-induced impairment of the photosystems, which,
therefore, limit the CO2 reduction process and can generate oxidative stress (Ashraf
and Harris 2013). However, these challenging conditions might have contributed to
the adaptive recruitment of specific non-photosynthetic enzymes from the C3
background into photosynthetic functions in C4 and CAM plants (Silvera
et al. 2010; Berry et al. 2013; Cowling 2013). The selective recruitment of
non-photosynthetic genes to a photosynthetic role generally involves modifications
200
P.T. Mioto et al.
in their default C3-expression patterns that cause greatly enhanced transcription
levels, thus leading to the accumulation of their respective proteins in leaves
(Hibberd and Covshoff 2010; Langdale 2011; Williams et al. 2012; Berry
et al. 2013). Böcher and Kluge (1978) have already suggested that a pathway of
carbon flow similar to CAM could be established in some C3 plants. In fact, it is
generally accepted that CAM evolved through increased expression of C3 genes
involved in both production and transport of organic acids (Taybi et al. 2004).
Some essential components for the CO2-concentrating process during CAM
cycle, such as representatives of the families PEPC, MDH, PPDK, and ME,
frequently show increased expression and/or activities in virtually all plants under
various types of abiotic constraints (Gonzalez et al. 2003; Aubry et al. 2011;
Doubnerová and Ryslavá 2011; Langdale 2011; Cowling 2013). As illustrated in
Fig. 1, it is suggested that these enzymes under adverse conditions can form an
alternative cycle, which may confer adaptive metabolic adjustments for C3 plants
exposed to challenging environments (Doubnerová and Ryslavá 2011). The
coupled activities of PEPC and cytosolic MDH can generate organic acids (such
as malate) with important implications in the cellular redox balance (Sriram
et al. 2007). Furthermore, the oxidation of malate to pyruvate by ME results in
both NAD(P)H production and carbon supply at the involved cellular compartment,
which could contribute to a redistribution of the reducing power among different
compartments of the cell. Additionally, the combined activities of PEPC, MDH,
and ME can form an alternative metabolic flux which provides the ability to respire
OAA generated from PEP, instead of relying only on the reaction catalyzed by the
cytosolic pyruvate kinase (EC 2.7.1.40) to generate pyruvate. Finally, PPDK
activity can regenerate PEP which can be used as substrate for the PEPC reaction.
Therefore, this potential alternative cycle formed by PEPC, MDH, ME, and PPDK
(Fig. 1) provides and/or redistributes CO2 and NAD(P)H that can be used by the
TCA cycle, antioxidant system, and amino acid metabolism (Doubnerová and
Fig. 1 Scheme of a
hypothetical cycle formed
by the major key enzymes
of CAM in C3 plants under
adverse conditions. PEPC
carboxylates PEP, yielding
OAA, which undergoes
reduction by MDH into
malate. Malate is
decarboxylated by ME into
pyruvate, which, in turn, is
converted to PEP by PPDK,
closing the cycle. OAA,
malate, and pyruvate can be
also used to replenish the
intermediates of the TCA
cycle
CAM-Like Traits in C3 Plants: Biochemistry and Stomatal Behavior
201
Ryslavá 2011; O’Leary et al. 2011; Rodrigues et al. 2014). It is tempting to
hypothesize that the recruitment of these metabolic elements used by C3 plants as
a potential strategy to couple with unfavorable conditions, together with the selection of a circadian control of these reactions, might represent important steps for the
origin of CAM.
Undoubtedly, a better understanding of the non-photosynthetic roles of these
proteins in C3 species would be useful in predicting the metabolic alterations in a C3
tissue when components of the CAM pathway are artificially introduced. This is
especially relevant when considering that CAM can be interpreted as the most
flexible and adaptive photosynthetic pathway and that it has been suggested that
economically and ecologically important CAM species should be exploited to
support sustainable production in the future(Borland et al. 2011; Cowling 2013).
Furthermore, some exciting prospects have been recently envisioned by the scientific community concerning the development of bioenergy feedstocks and food
crops engineered with a functional CAM system into C3 crops (Borland et al. 2014).
5 The Establishment of CAM Stomatal Behavior Could
Happen Independently of Biochemistry?
Curiously, stomatal opening during the night does not seem to be exclusive of
CAM, as it has already been reported in C3 and C4 plants. However, when C3 and C4
plants open stomata during nighttime, there is no CO2 assimilation (Caird
et al. 2007), indicating that nighttime stomatal opening in these cases seems to be
independent of the enzymatic machinery required for CAM. A recent review
pointed out that the possible factors controlling C3 and C4 nocturnal stomatal
opening may include microclimatic conditions both in soil and in leaves, speciesspecific variations, and plant and/or leaf age (Zeppel et al. 2013). In the same
review, the authors speculate on possible advantages of nocturnal stomatal opening
without CO2 fixation, including embolism removal and nutrient transport (Zeppel
et al. 2013). It was also suggested that root temperature may influence nocturnal
stomatal conductance in Vitis vinifera (Rogiers and Clarke 2013). Interestingly, it
was recently discovered that there are specialized stomata in leaves of Nelumbo
nucifera that open during the night (besides the “normal” ones that open during
daytime) and this opening seems to be mainly regulated by darkness (Matthews and
Seymour 2013). Undoubtedly, the phenomenon of nocturnal stomatal opening in C3
and C4 plants deserves more attention in order to determine its exact consequences
for the plant metabolism. Stomatal closure during the day can happen in C3 plants
mainly in response to environmental factors, as will be discussed below.
202
5.1
P.T. Mioto et al.
Is Stomatal Control in CAM Similar to Its C3
Counterpart?
As a general assumption, stomata can respond to several environmental factors,
such as light, CO2, drought, pathogens/elicitors, and also endogenous factors, such
as circadian rhythm (Klüsener et al. 2002; Chen et al. 2012). Since under drought or
pathogen attack both C3 and CAM plants close their stomata (resulting in CAM
idling when CAM biochemistry is present), the differences in stomatal behavior
between them are likely to depend on signaling by light, CO2, or the endogenous
clock. For this reason, we will focus on how stomata respond to these factors and
the possible changes that may have occurred to yield CAM.
The control of stomata by light, especially in blue wavelength, is already well
established for C3 plants. For instance, AtMYB60 and AtMYB61 are A. thaliana
transcription factors involved with stomatal control that appear to be regulated by
photoreceptors such as cryptochrome and phototropins (Chen et al. 2012). While
AtMYB60 is a positive regulator of stomatal aperture and accumulates in the light,
AtMYB61 appears to have the opposite function of closing the stomata and
accumulates during the dark period (Cominelli et al. 2005; Liang et al. 2005).
Additionally, it has been recently shown in A. thaliana that the transcription factor
ELF3 (EARLY FLOWERING 3) is negatively involved in stomatal aperture, while
FT (FLOWERING LOCUS T) is positively linked to stomatal control (Kinoshita
et al. 2011). The same authors suggest that the transcription factor FT either
controls an intermediary component in blue-light signaling pathway that mediates
stomatal opening or it is the component itself. Interestingly, both ELF3 and FT are
also strongly regulated by the circadian clock (Hicks et al. 1996; Covington
et al. 2001; Liu et al. 2001; Onai et al. 2004; Hubbard and Webb 2011). In fact,
elf3-201 mutants showed continued open stomata in continuous light with a 50-fold
increase in FT expression, while ft-1 mutants showed continued closed stomata in
the same conditions (Kinoshita et al. 2011). Therefore, at least in the C3 plant
A. thaliana, light and circadian clock appear to work together to promote the
opening of stomata during the day.
CAM plants, however, would require a dampening of stomatal response to light,
possibly relying more on circadian rhythms and/or CO2 levels instead, in order to
close stomata during the day. In fact, it was observed that in both Mesembryanthemum crystallinum and Portulacaria afra, the induction of CAM suppresses the
stomatal opening in response to blue light (Lee and Assmann 1992; Tallman
et al. 1997). The mechanisms of how this dampening occurs, however, are still
unknown. In CAM-induced M. crystallinum, an ELF3 ortholog shows a pattern of
expression very similar to that of its C3 counterpart, accumulating its transcripts
during the evening. Therefore, the possible differences between light-regulated
stomatal control after induction of CAM do not change expression of ELF3 and,
possibly, FT (Boxall et al. 2005). These results indicate that although the central
clock remains the same, the output for stomatal aperture in CAM plants may be
somehow different from that of A. thaliana and other C3 plants. Mechanisms of
CAM-Like Traits in C3 Plants: Biochemistry and Stomatal Behavior
203
stomatal opening during the night in CAM plants are not known in detail, but it
seems there is a strong circadian component since even in continuous light condition stomata of CAM plants continue to open during the subjective night (Wilkins
1984; Lüttge and Beck 1992; Wyka and Lüttge 2003).
5.2
CO2 Sensing: The Interaction Between Biochemistry
and Stomatal Control
It has been known that stomata can respond to intercellular CO2 concentration, but
the mechanism underlying this observation still remains largely unknown. It is
discussed, for example, whether the guard cells can perceive internal CO2 directly
or whether this gas is perceived by the mesophyll cells (Flexas et al. 2008; Mott
et al. 2008; Araújo et al. 2011). In A. thaliana, the kinase HT1 (HIGH LEAF
TEMPERATURE 1, EC 2.7.11.1) seems to be one of the few components that
promotes stomatal aperture and is highly influenced by CO2 concentrations (Hashimoto et al. 2006). It was also proposed that two carbonic anhydrases (βCA1 and
βCA4, EC 4.2.1.1) somehow appear to sense high CO2 concentrations and promote
stomatal closure by inhibiting HT1 activity, indicating that the sensing of CO2
depends on HCO3 generation (Kim et al. 2010). It is important to note that changes
in these components affect only CO2-induced stomatal closure, while stomatal
closure in response to the phytohormone abscisic acid (ABA) and blue light
remains largely unaffected.
More recently, Merilo et al. (2013) found that OST1 (OPEN STOMATA 1, EC
2.7.11.1), responsible for phosphorylation of SLAC1 (SLOW ANION CHANNELASSOCIATED 1), appears to be essential in CO2-mediated stomatal closure.
SLAC1 was demonstrated to activate Ca2+-dependent slow anion channels and
promote stomatal closure (Vahisalu et al. 2008). It is also suggested that there are
possibly several points of interaction between the signaling pathways of CO2,
darkness, ozone, drought, and ABA during stomatal closure, including OST1
(Merilo et al. 2013).
Until now, biochemical pathways of stomatal control in charge of sensing intracellular CO2 concentration were not investigated in plants expressing CAM. Perhaps
the expression patterns of HT1 and OST1 orthologs could provide some insight into
how CO2 mediates stomatal behavior in CAM plants; furthermore, since CO2 could
be perceived as HCO3 , carbonic anhydrases may also be an important target for
research. If there are no changes in these components, then it is probable that malate
decarboxylation could generate a sufficiently high internal CO2 concentration during
daytime to induce stomatal closure, while CO2 assimilation by PEPC during the night
may lead to CO2 concentrations low enough to cause stomata to open during this
period (Lüttge 2002; Kluge 2008). Alternatively, stomata of CAM plants could
increase their sensibility to CO2 to follow the organic acid fluctuations.
In a very interesting group of experiments, plants of the CAM species Kalanchoë
daigremontiana were kept in N2 during one night, which resulted in a severe
204
P.T. Mioto et al.
reduction in nocturnal malate accumulation during Phase I (Borland and Griffiths
1997; Borland et al. 1999). The results showed that on the following day CO2
assimilation values were higher and lasted longer during Phase II. The authors
suggested that this effect could be due to higher PEPC activity as a consequence of
lower malate content (as malate inhibits PEPC) and activation by PEPC kinase.
However, these plants still showed a Phase III and not much difference was
detected in Phase IV. Further work in the same species under continuous light
showed that the circadian rhythm of CO2 uptake and stomatal conductance was not
heavily affected by nocturnal malate depletion (Wyka et al. 2004).
Von Caemmerer and Griffiths (2009) tested stomatal CO2 responses in both
K. daigremontiana and K. pinnata by manipulating CO2 availability during different moments in the CAM cycle and also by depleting intracellular malate accumulated during the night. Interestingly, they found that stomata did not open during
phase III, even when combining a lowering of internal CO2 (reduction in malate
accumulation in the previous night) and atmospheric CO2. They suggest that there
must be a signal other than CO2 that causes stomata to close during phase III. The
developmental changes in expression of CAM in Peperomia scandens, a plant
capable of going from CAM cycling to typical CAM, showed that the stomatal
behavior changed regardless of alterations in the amount of organic acids accumulated during the night (Holthe et al. 1987), suggesting that in this species it was not
an upregulation of biochemical machinery that caused the changes in stomatal
behavior.
Recently, Owen and Griffiths (2013) developed a model to predict CAM behavior based on K. daigremontiana, showing that metabolic control may be a major
factor in determining the CAM phases. It was also shown that, at least theoretically,
it is possible to extinguish phase III with a severe downregulation of malate
decarboxylation. Although this model was built mainly over stomatal control by
metabolic factors, this leads to the hypothesis that a simple upregulation of CAM
biochemistry could generate CO2 variations high enough to result in CAM stomatal
behavior. Accordingly, Kluge (1968) already demonstrated that phase III is shortened under high light due to more rapid consumption of nocturnally stored malate,
resulting in earlier stomatal opening for phase IV than in low light.
Gathering all these observations, it is still not clear whether the stomatal
behavior of CAM plants could simply be a consequence of the biochemical
machinery (generation of CO2 variations large enough to supplant other stimuli)
or whether it would require changes in other control mechanisms (abolishment of
opening in response to light, inversion of circadian rhythms, increased sensitivity to
CO2, etc.). More likely, both factors contribute differently in each species, conferring different degrees of plasticity. A biochemistry-driven stomatal control could
probably result in a more rapid and plastic expression of CAM, allowing a species
to be capable of going from C3 to CAM and back in response mainly to the
environment. Examples of this plasticity are rare so far, as it was only confirmed
that species such as Calandrinia polyandra, Clusia pratensis, and Clusia minor are
capable of such event (Lüttge 2008; Winter et al. 2008; Winter and Holtum 2014).
On the other hand, species such as M. crystallinum are not capable of returning to a
CAM-Like Traits in C3 Plants: Biochemistry and Stomatal Behavior
205
C3 state once CAM has been established (Winter and Holtum 2007; Winter
et al. 2008), perhaps due to permanent changes in stomatal control. Undoubtedly,
even irreversible CAM plants show some degree of metabolic control over stomatal
aperture that confers some plasticity regarding the strength of CAM.
6 Conclusions and Perspectives
The discussion presented in this review, although still speculative to some extent,
raises some interesting questions that deserve further attention in future research. It
is still not known whether the stomata of CAM plants function, in terms of
perception and response to signals, are similar to those of C3 plants. We believe
that permanent changes in stomatal behavior would lead to a less plastic CAM. The
understanding of circadian clock elements and their functions is definitely vital for
the comprehension of how crucial enzymes such as PEPC, MDH, ME, and PPDK
started to show diverse patterns of activity along the day/night cycle. A key point
seems to rest on understanding the upstream controllers of PEPC kinase expression
and activity.
A very interesting subject of study is the so-called C3-CAM facultative plants.
Winter et al. (2008) demonstrated that the switch from C3 to CAM can occur in
response to the environment as well as to ontogeny, in a degree that varies with the
plant species: some species are heavily affected by the environment, while others
rely mainly on ontogeny, with numerous behaviors between these extremes. These
massive changes in metabolism could answer some questions as to how CAM
stomatal behavior is achieved: is it simply through upregulation of the biochemical
machinery or through changes in perception of signals related to stomatal control?
Does the biochemical machinery consist of specific isoenzymes for CAM or does it
originate from the same isoenzymes present in the C3 mode?
The answers to those questions would certainly lead to important targets to work
on engineering CAM into C3 crops, allowing these plants to grow in semiarid
habitats and, therefore, increase agricultural production (Borland et al. 2014).
Acknowledgements The authors would like to thank Dr. Luciano Freschi for valuable discussions on the topic of this review.
References
Araújo WL, Fernie AR, Nunes-Nesi A (2011) Control of stomatal aperture, a renaissance of the old
guard. Plant Signal Behav 6:1305–1311
Ashraf M, Harris PJC (2013) Photosynthesis under stressful environments: an overview.
Photosynthetica 51:163–190
Aubry S, Brown NJ, Hibberd JM (2011) The role of proteins in C3 plants prior to their recruitment
into the C4 pathway. J Exp Bot 62:3049–3059
206
P.T. Mioto et al.
Berry JO, Yerramsetty P, Zielinski AM, Mure CM (2013) Photosynthetic gene expression in
higher plants. Photosynth Res 117:91–120
Böcher M, Kluge M (1978) The C4-pathway of C-fixation in Spinacea olearacea II. Pulse chase
experiments with suspended leaf slices. Zeitschriftfür Pflanzenphysiologie 86:405–421
Borland AM, Griffiths H (1997) A comparative study on the regulation of C3 and C4 carboxylation
processes in the constitutive crassulacean acid metabolism (CAM) plant Kalanchoe
daigremontiana and the C3-CAM intermediate Clusia minor. Planta 201:368–378
Borland A, Taybi T (2004) Synchronization of metabolic processes in plants with crassulacean
acid metabolism. J Exp Bot 55:1255–1265
Borland AM, Hartwell J, Jenkins GI, Wilkins MB, Nimmo HG (1999) Metabolite control overrides circadian regulation of phosphoenolpyruvate carboxylase kinase and CO2 fixation in
crassulacean acid metabolism. Plant Physiol 121:889–896
Borland AM, Griffiths H, Hartwell J, Smith JAC (2009) Exploiting the potential of plants with
crassulacean acid metabolism for bioenergy production on marginal lands. J Exp Bot 60:2879–
2896
Borland AM, Zambrano VAB, Ceusters J, Shorrock K (2011) The photosynthetic plasticity of
crassulacean acid metabolism: an evolutionary innovation for sustainable productivity in a
changing world. New Phytol 191:619–633
Borland AM, Hartwell J, Weston DJ, Schlauch KA, Tschaplinski TJ, Tuskan GA, Yang X,
Cushman JC (2014) Engineering crassulacean acid metabolism to improve water-use efficiency. Trends Plant Sci 19:327–338
Boxall SF, Foster JM, Bohnert HJ, Cushman JC, Nimmo HG, Hartwell J (2005) Conservation and
divergence of circadian clock operation in a stress-inducible crassulacean acid metabolism
species reveals clock compensation against stress. Plant Physiol 137:969–982
Brodribb TJ, Feild TS (2010) Leaf hydraulic evolution led a surge in leaf photosynthetic capacity
during early angiosperm diversification. Ecol Lett 13:175–183
Caird MA, Richards JH, Donovan LA (2007) Nighttime stomatal conductance and transpiration in
C3 and C4 plants. Plant Physiol 143:4–10
Chen C, Xiao Y-G, Li X, Ni M (2012) Light-regulated stomatal aperture in Arabidopsis. Mol Plant
5:566–572
Cominelli E, Galbiati M, Vavasseur A, Conti L, Sala T, Vuylsteke M, Leonhardt N, Dellaporta SL,
Tonelli C (2005) A guard-cell-specific MYB transcription factor regulates stomatal movements and plant drought tolerance. Curr Biol 15:1196–1200
Covington MF, Panda S, Liu XL, Strayer CA, Wagner DR, Kay SA (2001) ELF3 modulates
resetting of the circadian clock in Arabidopsis. Plant Cell 13:1305–1315
Cowling SA (2013) Did early land plants use carbon concentrating mechanisms? Trends Plant Sci
18:120–124
Crayn MC, Winter K, Smith JAC (2004) Multiple origins of Crassulacean acid metabolism and the
epiphytic habit in the Neotropical family Bromeliaceae. Proc Natl Acad Sci U S A 101:3703–
3708
Cushman JC, Bohnert HJ (1999) Crassulacean acid metabolism: molecular genetics. Annu Rev
Plant Physiol Plant Mol Biol 50:305–332
Cushman JC, Tillett RL, Wood JA, Branco JM, Schlauch KA (2008) Large-scale mRNA expression profiling in the common ice plant, Mesembryanthemum crystallinum, performing C3
photosynthesis and Crassulacean acid metabolism (CAM). J Exp Bot 59:1875–1894
Dodd AN, Borland AM, Haslam RP, Griffiths H, Maxwell K (2002) Crassulacean acid metabolism: plastic, fantastic. J Exp Bot 53:569–580
Dodd AN, Griffiths H, Taybi T, Cushman JC, Borland AM (2003) Integrating diel starch
metabolism with the circadian and environmental regulation of crassulacean acid metabolism
in Mesembryanthemum crystallinum. Planta 216:789–797
Doubnerová V, Ryslavá H (2011) What can enzymes of C4 photosynthesis do for C3 plants under
stress? Plant Sci 180:575–583
Drennan PM, Nobel PS (2000) Responses of CAM species to increase atmospheric CO2 concentrations. Plant Cell Environ 23:767–781
CAM-Like Traits in C3 Plants: Biochemistry and Stomatal Behavior
207
Edwards EJ, Ogburn RM (2012) Angiosperm responses to a low-CO2 world: CAM and C4
photosynthesis as parallel evolutionary trajectories. Int J Plant Sci 173:724–733
Ehleringer JR, Monson JK (1993) Evolutionary and ecological aspects of photosynthetic pathway
variation. Annu Rev Ecol Syst 24:411–439
Ehleringer JR, Sage RF, Flanagan LB, Pearcy RW (1991) Climate change and the evolution of C4
photosynthesis. Trends Ecol Evol 6:95–99
Flexas J, Ribas-Carbó M, Diaz-Espejo A, Galmés J, Medrano H (2008) Mesophyll conductance to
CO2: current knowledge and future prospects. Plant Cell Environ 31:602–621
Gennidakis S, Rao S, Greenham K, Winter K, Uhrig RG, O’Leary B, Snedden WA, Lu C, Plaxton
WC (2007) Bacterial- and plant-type phosphoenolpyruvate carboxylase polypeptides interact
in the hetero-oligomeric Class-2 PEPC complex of developing castor oil seeds. Plant J 52:839–
849
Gonzalez MC, Sanchez R, Cejudo FJ (2003) Abiotic stresses affecting water balance induce
phosphoenolpyruvate carboxylase expression in roots of wheat seedlings. Planta 216:985–992
Gousset-Dupont A, Lebouteiller B, Monreal J, Echevarria C, Pierre JN, Hodges M, Vidal J (2005)
Metabolite and post-translational control of phosphoenolpyruvate carboxylase from leaves and
mesophyll cell protoplasts of Arabidopsis thaliana. Plant Sci 169:1096–1101
Hartwell J, Nimmo G, Wilkins M, Jenkins G, Nimmo H (1999) Phosphoenolpyruvate carboxylase
kinase is a novel protein kinase regulated at the level of gene expression. Plant J 20:333–342
Hartwell J, Nimmo GA, Wilkins MB, Jenkins GI, Nimmo HG (2002) Probing the circadian control
of phosphoenolpyruvate carboxylase kinase expression in Kalanchoë fedtschenkoi. Funct Plant
Biol 29:663–668
Hashimoto M, Negi J, Young J, Israelsson M, Schroeder JI, Iba K (2006) Arabidopsis HT1 kinase
controls stomatal movements in response to CO2. Nat Cell Biol 8:391–397
Hibberd JM, Covshoff S (2010) The regulation of gene expression required for C4 photosynthesis.
Annu Rev Plant Biol 61:181–207
Hicks KA, Millar AJ, Carré IA, Somers DE, Straume M, Meeks-Wagner DR, Kay SA (1996)
Conditional circadian dysfunction of the Arabidopsis early-flowering 3 mutant. Science
274:790–792
Holthe PA, Sternberg LSL, Ting IP (1987) Developmental control of CAM in Peperomia
scandens. Plant Physiol 84:743–747
Hubbard KE, Webb AAR (2011) Circadian rhythms: FLOWERING LOCUS T extends opening
hours. Curr Biol 21:636–638
Keeley JE (1985) The role of CAM in the carbon economy of the submerged-aquatic Isoetes
howellii. Verhandlungen des Internationalen Verein Limnologie 22:2909–2911
Keeley JE, Rundel PW (2003) Evolution of CAM and C4 carbon-concentrating mechanisms. Int J
Plant Sci 164:55–77
Kim T-H, Böhmer M, Hu H, Nishimura N, Schroeder JI (2010) Guard cell signal transduction
network: advances in understanding abscisic acid, CO2, and Ca2+ Signaling. Annu Rev Plant
Biol 61:561–591
KinoshitaT ON, HayashiY MS, Nakamura S, Soda M, Kato Y, Ohnishi M, Nakano T, Inoue S,
Shimazaki K (2011) FLOWERING LOCUS T regulates stomatal opening. Curr Biol 21:1232–
1238
Kluge M (1968) Untersuchungenüber den Gaswechsel von Bryophyllum während der
Lichtperiode. Planta 80:359–377
Kluge M (2008) Ecophysiology: migrations between different levels of scaling. Prog Bot 69:5–34
Klüsener B, Young JJ, Murata Y, Allen GJ, Mori IC, Hugouvieux V, Schroeder JI (2002)
Convergence of calcium signaling pathways of pathogenic elicitors and abscisic acid in
Arabidopsis guard cells. Plant Physiol 130:2152–2163
Langdale JA (2011) C4 cycles: past, present, and future research on C4 photosynthesis. Plant Cell
23:3879–3892
Lee DM, Assmann SM (1992) Stomatal responses to light in the facultative crassulacean acid
metabolism species, Portulacaria afra. Physiol Plant 85:35–42
208
P.T. Mioto et al.
Liang YK, Dubos C, Dodd IC, Holroyd GH, Hetherington AM, Campbell MM (2005) AtMYB61,
an R2R3-MYB transcription factor controlling stomatal aperture in Arabidopsis thaliana. Curr
Biol 15:1201–1206
Liu XL, Covington MF, Fankhauser C, Chory J, Wagner DR (2001) ELF3 encodes a circadian
clock–regulated nuclear protein that functions in an Arabidopsis PHYB signal transduction
pathway. Plant Cell 13:1293–1304
Lüttge U (2002) CO2-concentrating: consequences in crassulacean acid metabolism. J Exp Bot
53:2131–2142
Lüttge U (2004) Ecophysiology of crassulacean acid metabolism (CAM). Ann Bot 93:629–652
Lüttge U (2008) Clusia: Holy Grail and enigma. J Exp Bot 59:1503–1514
Lüttge U, Beck F (1992) Endogenous rhythms and chaos in crassulacean acid metabolism. Planta
188:28–38
Masumoto C, Miyazawa SI, Ohkawa H, Fukuda T, Taniguchi Y, Murayama S, KusanoM SK,
Fukayama H, Miyao M (2010) Phosphoenolpyruvate carboxylase intrinsically located in the
chloroplast of rice plays a crucial role in ammonium assimilation. Proc Natl Acad Sci U S A
107:5226–5231
Matiz A, Mioto PT, Mayorga AY, Freschi L, Mercier H (2013) CAM photosynthesis in bromeliads
and agaves: what can we learn from these plants? In: Dubinsky Z (ed) Photosynthesis. Intech,
Rijeka, Croatia, pp 91–134
Matthews PGD, Seymour R (2013) Stomata actively regulate internal aeration of the sacred lotus
Nelumbo nucifera. Plant Cell Environ 37:402–413
Merilo E, Laanemets K, Hu H, Xue S, Jakobson L, Tulva I, Gonzalez-Guzman M, Rodruiguez PL,
Schroeder JI, Broschè M, Kollist H (2013) PYR/RCAR receptors contribute to ozone-, reduced
air humidity-, darkness-, and CO2-induced stomatal regulation. Plant Physiol 162:1652–1668
Mott KA, Sibbernsen ED, Shope JC (2008) The role of the mesophyll in stomatal responses to light
and CO2. Plant Cell Environ 31:1299–1306
Nimmo HG (2000) The regulation of phosphoenolpyruvate carboxylase in CAM plants. Trends
Plant Sci 5:75–80
Nimmo HG (2003) Control of the phosphorylation of phosphoenolpyruvate carboxylase in higher
plants. Arch Biochem Biophys 414:189–196
O’Leary B, Park J, Plaxton WC (2011) The remarkable diversity of plant PEPC (phosphoenolpyruvate carboxylase): recent insights into the physiological functions and post-translational
controls of non-photosynthetic PEPCs. Biochem J 436:15–34
Onai K, Okamoto K, Nishimoto H, Morioka C, Hirano M, Kami-ike N, Ishiura M (2004) Largescale screening of Arabidopsis circadian clock mutants by a high-throughput real-time bioluminescence monitoring system. Plant J 40:1–11
Osmond CB (1978) Crassulacean acid metabolism: a curiosity in context. Annu Rev Plant Physiol
29:379–414
Owen NA, Griffiths H (2013) A system dynamics model integrating physiology and biochemical
regulation predicts extent of crassulacean acid metabolism (CAM) phases. New Phytol
200:1116–1131
Ranson SL, Thomas M (1960) Crassulacean acid metabolism. Annu Rev Plant Physiol 11:81–110
Raven JA, Spicer RA (1996) The evolution of crassulacean acid metabolism. In: Winter K, Smith
JAC (eds) Crassulacean acid metabolism. Biochemistry, ecophysiology and evolution.
Springer, Berlin, pp 360–385
Rodrigues MA, Matiz A, Cruz AB, Matsumura AT, Takahashi CA, Hamachi L, Félix LM, Pereira
PN, Latansio-Aidar SP, Aidar MPM, Demarco D, Freschi L, Mercier H, Kerbauy GB (2013)
Spatial patterns of photosynthesis in thin- and thick-leaved epiphytic orchids: unravelling
C3-CAM plasticity in an organ-compartmented way. Ann Bot 112:17–29
Rodrigues MA, Freschi L, Pereira PN, Mercier H (2014) Interactions between nutrients and
crassulacean acid metabolism. Prog Bot 75:167–186
Rogiers SY, Clarke SJ (2013) Nocturnal and daytime stomatal conductance respond to root-zone
temperature in ‘Shiraz’ grapevines. Ann Bot 111:433–444
CAM-Like Traits in C3 Plants: Biochemistry and Stomatal Behavior
209
Shane MW, Fedosejevs ET, Plaxton WC (2013) Reciprocal control of anaplerotic phosphoenolpyruvate carboxylase by in vivo monoubiquitination and phosphorylation in developing
proteoid roots of phosphate-deficient. Plant Physiol 161:1634–1644
Shenton M, Fontaine V, Hartwell J, Marsh JT, Jenkins GI, Nimmo HG (2006) Distinct patterns of
control and expression amongst members of the PEP carboxylase kinase gene family in C4
plants. Plant J 48:45–53
Silvera K, Neubig KM, Whitten M, Williams NH, Winter K, Cushman JC (2010) Evolution along
the crassulacean acid metabolism continuum. Funct Plant Biol 37:995–1010
Sriram G, Fulton DB, Shanks JV (2007) Flux quantification in central carbon metabolism of
Catharanthus roseus hairy roots by C-13 labeling and comprehensive bondomer balancing.
Phytochemistry 68:2243–2257
Tallman G, Zhu J, Mawson BT, Amodeo G, Nouhi Z, Levy K, Zeiger E (1997) Induction of CAM
in Mesembryanthemum crystallinum abolishes the stomatal response to blue light and lightdependent zeaxanthin formation in guard cell chloroplasts. Plant Cell Physiol 38:236–242
Taybi T, Nimmo HG, Borland AM (2004) Expression of phosphoenolpyruvate carboxylase and
phosphoenolpyruvate carboxylase kinase genes. Implications for genotypic capacity and phenotypic plasticity in the expression of Crassulacean acid metabolism. Plant Physiol 135:587–598
Thomas M, Beevers H (1949) Physiological studies on acid metabolism in green plants.
II. Evidence of CO2 fixation in Bryophyllum and the study of diurnal variation of acidity in
this genus. New Phytol 48:421–447
Ting IP (1985) Crassulacean acid metabolism. Annu Rev Plant Physiol 36:595–622
Vahisalu T, Kollist H, Wang YF, Nishimura N, Chan WY, Valerio G, Lamminmäki A, Brosché M,
Moldau H, Desikan R, Schroeder JI, Kangasjärvi J (2008) SLAC1 is required for plant guard
cell S-type anion channel function in stomatal signaling. Nature 452:487–491
Von Caemmerer S, Griffiths H (2009) Stomatal responses to CO2 during a dielcrassulacean acid
metabolism cycle in Kalanchoë daigremontiana and Kalanchoë pinnata. Plant Cell Environ
32:567–576
West-Eberhard MJ, Smith JAC, Winter K (2011) Photosynthesis, reorganized. Science 332:311–312
Wilkins MB (1984) A rapid circadian rhythm of carbon-dioxide metabolism in Bryophyllum
fedtschenkoi. Planta 161:381–384
Williams BP, Aubry S, Hicks JM (2012) Molecular evolution of genes recruited into C4 photosynthesis. Trends Plant Sci 17:213–220
Winter K, Holtum JAM (2007) Environment or development? Lifetime net CO2 exchange and
control of the expression of Crassulacean acid metabolism in Mesembryanthemum
crystallinum. Plant Physiol 143:98–107
Winter K, Holtum JAM (2014) Facultative crassulacean acid metabolism (CAM) plants: powerful
tools for unravelling the functional elements of CAM photosynthesis. J Exp Bot. doi:10.1093/
jxb/eru063
Winter K, Smith JAC (1996) Crassulacean acid metabolism. Current status and perspectives. In:
Winter K, Smith JAC (eds) Crassulacean acid metabolism. Biochemistry, ecophysiology and
evolution. Springer, Berlin, pp 389–426
Winter K, Garcia M, Holtum JAM (2008) On the nature of facultative and constitutive CAM:
environmental and developmental control of CAM expression during early growth of Clusia,
Kalanchoë, and Opuntia. J Exp Bot 59:1829–1840
Wyka TP, Lüttge U (2003) Contribution of C3 carboxylation to the circadian rhythm of carbon
dioxide uptake in a Crassulacean acid metabolism plant Kalanchoë daigremontiana. J Exp Bot
54:1471–1479
Wyka TP, Bohn A, Duarte HM, Kaiser F, Lüttge U (2004) Perturbations of malate accumulation
and the endogenous rhythms of gas exchange in the crassulacean acid metabolism plant
Kalanchoë daigremontiana: testing the tonoplast-as-oscillator model. Planta 219:705–713
Zeppel M, Logan B, Lewis JD, Phillips N, Tissue D (2013) Why lose water at night? Disentangling
the mystery of nocturnal sap flow, transpiration and stomatal conductance – when, where,
who? Acta Hortic 991:307–312
Stability as a Phenomenon Emergent from
Plasticity–Complexity–Diversity
in Eco-physiology
Gustavo M. Souza and Ulrich Lüttge
Contents
1 Introduction . . . . . . . . . . . . . . . . . . . . . . . . . . . . . . . . . . . . . . . . . . . . . . . . . . . . . . . . . . . . . . . . . . . . . . . . . . . . . . . . .
2 Plasticity . . . . . . . . . . . . . . . . . . . . . . . . . . . . . . . . . . . . . . . . . . . . . . . . . . . . . . . . . . . . . . . . . . . . . . . . . . . . . . . . . . . . .
2.1 Intraspecific Plasticity . . . . . . . . . . . . . . . . . . . . . . . . . . . . . . . . . . . . . . . . . . . . . . . . . . . . . . . . . . . . . . . .
2.2 Analysis of Multi-variant Traits and Their Integration for Plastic Emergence
of Phenotypes . . . . . . . . . . . . . . . . . . . . . . . . . . . . . . . . . . . . . . . . . . . . . . . . . . . . . . . . . . . . . . . . . . . . . . . . .
2.3 Plasticity Impeding or Supporting Diversity by Speciation . . . . . . . . . . . . . . . . . . . . . . . . .
3 Biodiversity: Interspecific Diversity, Species Diversity (Also Implying Complexity) . . .
3.1 Diversity Is the Basis of Complexity . . . . . . . . . . . . . . . . . . . . . . . . . . . . . . . . . . . . . . . . . . . . . . . . .
3.2 Biodiversity Is Stabilizing (Eco-) Systems [(vii) in Fig. 1] . . . . . . . . . . . . . . . . . . . . . . . . .
3.3 Biodiversity and Relations of Competition and Facilitation . . . . . . . . . . . . . . . . . . . . . . . .
3.4 Biodiversity Challenging Ecosystems [(viii) in Fig. 1] . . . . . . . . . . . . . . . . . . . . . . . . . . . . . .
4 Complexity . . . . . . . . . . . . . . . . . . . . . . . . . . . . . . . . . . . . . . . . . . . . . . . . . . . . . . . . . . . . . . . . . . . . . . . . . . . . . . . . . .
5 Outlook on Practical Implications: Stability and Sustainability . . . . . . . . . . . . . . . . . . . . . . . . . . .
References . . . . . . . . . . . . . . . . . . . . . . . . . . . . . . . . . . . . . . . . . . . . . . . . . . . . . . . . . . . . . . . . . . . . . . . . . . . . . . . . . . . . . . .
212
215
215
221
222
224
224
225
226
228
229
229
231
Abstract The network of plasticity, diversity, complexity, and stability is drawn as
a quadruped-scheme. Plasticity is on the top of the scheme and stability is in the
center. Plasticity is discussed in some detail. Examples are given of intraspecific
plasticity, especially of photosynthesis. Plasticity allows escape from the dilemma
of growth or defense of the growth differentiation balance theory (GDB). Analysis
by principal component analysis (PCA) of multi-variant traits and their integration
explain plastic emergence of phenotypes. Via the phenotypes plasticity can both
G.M. Souza
Laboratório de Cognição Ecológica em Plantas – ECOLAB, Rod. Raposo Tavares km 572,
Presidente Prudente, SP, Brasil
e-mail: gumaia.gms@gmail.com
U. Lüttge (*)
Department of Biology, Technical University of Darmstadt, Schnittspahnstraße 3 – 5, 64287,
Darmstadt, Germany
e-mail: luettge@bio.tu-darmstadt.de
© Springer International Publishing Switzerland 2015
U. Lüttge, W. Beyschlag (eds.), Progress in Botany, Progress in Botany 76,
DOI 10.1007/978-3-319-08807-5_9
211
212
G.M. Souza and U. Lüttge
impede or support diversity by speciation. Diversity, or as we say in the realm of
life “biodiversity,” governs spatiotemporal dynamics of competition/facilitation
equilibria in stress gradients (stress gradient hypothesis, SGH). Diversity is the
basis of complexity. Both, biodiversity and complexity, are challenging and stabilizing in terms of sustaining ecosystems. Via the different connections in the
network of the quadruped plasticity, diversity and complexity affect stability.
Understanding of the quadruped network offers an outlook on potential applications
in environmental management and agro-forest ecology.
1 Introduction
Biological systems are, by definition, open systems thermodynamically in
non-equilibrium (Nicolis and Prigogine 1977; Schneider and Kay 1994). They
represent multi-level organization in spatiotemporal terms (Novikoff 1945; Ravasz
et al. 2002). System organization (considered herein as the integration between the
structure and functionality throughout the system’s persistence) depends, therefore,
on continuous flow of energy driving exchanges of matter and information with the
surrounding environment (Schneider and Kay 1994). The physical environment
(abiotic and biotic) of a living system is naturally variable. The amplitude and
frequency of such variation is contextual, yet always present at some level. Thus,
biological systems must constantly deal with a variation of the available resources
(energy, water, nutrients) that eventually may limit or threaten their organization
and survival (Souza et al. 2005; Wagner 2005).
Therefore, one of the fundamental aspects of a biological system is the maintenance of its stability. Considering stability in this essay we realize, as said above,
that all living systems, such as individual organisms, populations, and ecosystems,
are open systems through which a continuous flow of material and energy occurs.
Hence, the living systems are not stable in a static sense of thermodynamics.
However, the open systems arrive at dynamic equilibria, also called pseudo-steady
states, which may prove to show stability within certain time windows. This is
immediately evident for example when we realize organisms including plants as
unitary self-organized living systems with internal integrity and extend this view to
higher scalar levels of biological organization (Lüttge 2012b). Thus, here we use
stability in the context of General Systems Theory and System Dynamic Theory.
This accounts for both homeostatic capacity of the system (steady-state; maintenance of the internal structural and functional integrity of the system) and its
flexibility (resilience upon organizational disturbances, the return to initial condition
after perturbation). With this understanding of stability we adopt the concept of
Lyapunov stability (Souza et al. 2004; Solé and Bascompte 2006) referring to the
dynamic equilibrium of the system, i.e., its pseudo-steady state and NOT its thermodynamic steady state. This is appropriate use in ecology, i.e., stability conferring
robustness to the whole system as a prerequisite of the system’s persistence.
One problem that emerges from the complex nature of biological systems is to
determine the characteristic settings and mechanisms of the system’s internal
Stability as a Phenomenon Emergent from Plasticity–Complexity–Diversity in. . .
213
integrity. Under a systemic approach (Lüttge 2012b) the determination of the
internal integrity depends directly on the spatiotemporal observation scale used to
define the object/phenomenon under investigation, and as a consequence, also sets
up what is the environment of the system. Thus, if individuals are the objects of
study, the internal integrity arises from the cellular constitution and related physiological and metabolic processes. Conversely, if the system under study is a
population or even a community, the internal integrity arises from individuals/
species and their respective dynamics (for instance, temporal changes in gene
frequencies, fluctuations in the number of individuals).
The ability to face the complexity of the environmental changes is particularly
essential for sessile organisms such as plants. Because of the limited capacity of
locomotion, plants must deal with all sorts of environmental variation in their surroundings. As a result, their stability requires dynamic elements that confer some
degree of organizational flexibility. The set of possible changes in response to external
stimuli is what we call phenotypic plasticity (DeWitt and Scheiner 2004). Therefore,
there is a close correlation between the stability of a system and the plasticity of
phenotypic responses (which are naturally limited by the genetic constitution of
organisms). In essence phenotypic plasticity gives the system the ability to expand
its capacities of physiological acclimation (in the case of individuals) or genetic
adaptation (in the case of populations/species). The plasticity, particularly the modulation/control of plasticity, is related to patterns of organization of biological systems
which are characterized by complex networks (Hütt and Lüttge 2005; Souza
et al. 2009). Indeed, biological systems are essentially complex adaptive systems.
Complex systems are formed by elements, in general of many different natures,
which have cause-effect based relationships to each other, among which necessarily
some ones must be nonlinear. Such nonlinear relationships, often found in natural
systems, commonly follow positive feedbacks, which amplify signals, or negative
feedbacks, which attenuate signals, giving the system the ability to self-regulation
(Camazine et al. 2001; Mitchell 2009). The set of relations between the elements of
a complex system is often topologically structured as a network with small-world
characteristics. In addition, depending on the size and hierarchic organization of
networks, distribution and disposition of elements within relationships may also be
scale-invariant. Small-world networks typically display small structural distances
on average between elements. Scale-free networks are small-world networks in
which the distribution of nodes (elements) with a number of relationships (links)
follows a power law. In practical terms, networks that have a very small number of
elements are densely connected (hubs—elements with many relations with other
elements) and most elements have few connections (Barabási 2002). Such topological network structure shows higher robustness than random networks. Herein,
robustness is considered as the capacity of a network to stay stable despite of
random removing of nodes. For instance, in ecological food webs showing scalefree topology the removal of the most connected species (hubs) causes more
disturbance than does the random removal of species (Proulx et al. 2005). Moreover, networks with power-law distribution have high information transmission
efficiency through the entire system, for instance, allowing the spread of diseases
214
G.M. Souza and U. Lüttge
with low transmission rates (May and Lloyd 2001). This supports the establishment
of nonlocal interactions between different parts of the system, allowing the possibility of synchronization and collective behavior (emergent behavior). Such features, in the case of living beings, enable new phenotypic states, creating
morphotypes or physiotypes (Hütt and Lüttge 2005).
In different contexts, such systems have the ability to shape themselves through
changes in the pattern of connection of the network elements, even in different
scales (in the case of hierarchical systems), providing self-regulation to the system
(Souza et al. 2009; Lucas et al. 2011; Bertolli et al. 2013, 2014). Such systemic
changes occur due to flow of information in the system, allowing local signals from
the system to reorganize certain structures and/or processes, or to reorganize it as a
whole (nonlocal actions). The reorganization processes of the system can be
incorporated into its informational network that, with repeated reinforcement of
similar experiences, can create recurring behaviors (habits) in the establishment and
maintenance of new connections (Barabási and Oltvai 2004; Hütt and Lüttge 2005;
Csermely 2006).
Conversely, diversity may reach a local maximum. This is related to the extent to
which individuals and populations become more stable by forming new habits.
Thus, new processes of speciation may become reduced due to the maintenance of
the stability of individuals, thereby stabilizing current populations. This, naturally,
limits the ecological complexity, taking into account both biological diversity and
the space-time dynamics of the populations. The stability of a system depends
positively on the complexity of the system up to a certain limit, because at the same
time that diversity gives plasticity to the system, redundancy in some essential
elements of the system (e.g., copies of regulatory genes or greater number of
individuals of a key-species in a community) provides greater system robustness
(Edelman and Gally 2001; Wagner 2005).
Therefore, despite of a plethora of stability definitions and uses (Grimm and
Wissel 1997), herein stability is defined not as a property of the system itself, but
rather as a concept that involves three fundamental properties woven in complexity:
(1) Homeostasis, the system’s resistance to change, keeping self-regulation of the
system and being reflected by resilience (Cannon 1932); (2) resilience, the ability of
the system to return to its initial state after a disturbance (McCann 2000); (3) persistence, the maintenance of the identity of the system as a whole (Grimm and
Wissel 1997), i.e., representing robustness as reflecting some kind of stability.
Hence, systemic features are kept invariant, for example, genetic constitution of
an individual, or the typical physiognomy of a vegetation. The three properties can
be related as follows: under changing environmental conditions, the first reaction of
the system (if the changes are actually perceived) is to maintain its homeostasis by a
sort of mechanisms counteracting the external influence, conferring resistance
capacity to the system. However, if the homeostatic mechanisms are overloaded,
homeostasis can be lost. Depending on the level of injury, after cessation of the
external disturbance, the system can return to previous state (manifestation of
resilience capacity), can assume a new state of organization (reorganization of the
system, reaching a new homeostatic state) or, if injury was too harmful, the system
Stability as a Phenomenon Emergent from Plasticity–Complexity–Diversity in. . .
Fig. 1 Quadruped-scheme
of plasticity, diversity, and
complexity and their
interactions creating
stability. Complexity is
closely related to diversity
(vi). Both support stability
(vii, viii, ix). Plasticity can
do this directly (iv, v), via
affecting diversity (ii, iii) or
via its inherent qualities of
complexity (i). (The text
refers to the roman numbers
where these relations are
elaborated)
215
Plascity
iv
v
ii
iii
vii
viii
Diversity
i
Stability
ix
vi
Complexity
may collapse. In this context, homeostatic maintenance and resilience capacity
support the persistence of the system.
In Fig. 1, we suggest a scheme (the quadruped-scheme) showing the relationships among plasticity, diversity, and complexity creating stability. Thus, in the
following sections we shall give a number of examples of intraspecific plasticity
and show how it can facilitate choices between options of plant performance in
dilemmas in resource allocation imposed by stress situations. We shall see how
plasticity can support emergence of phenotypes positively or negatively affecting
speciation and diversity. In this way understanding plasticity will allow to assess
the roles of diversity and complexity for stability.
2 Plasticity
2.1
Intraspecific Plasticity
Intraspecific plasticity is given and interspecific diversity becomes visible when
species and often even individual plants express different phenotypes under the
influence of environmental cues. These may be morphological variations of
morphotypes and functional variations of performance or physiotypes (Bradshaw
1965). Functional plasticity is a very wide field in plant performance. As sessile
organisms which cannot move around in the search of appropriate external conditions, plants must be particularly well equipped with options for acclimation to
varying conditions at their growth sites. This is given by multifunctional regulatory
capacity. It is based on network structures with multiple branching points for
feedback and feed-forward regulations. Such networks provide high degrees of
flexibility for reversible expression of physiotypes (Hütt and Lüttge 2005; Lucas
et al. 2011). Plant life is full of examples. We chose here (1) the network of energy
216
G.M. Souza and U. Lüttge
metabolism driving ion transport at membranes, (2) the modes of photosynthesis,
where morphotypic and physiotypic plasticity interact, (3) the growth-defense
dilemma, where plasticity provides pathways of escape.
2.1.1
Metabolic Energy Networks for Energization of Membrane
Transport of Ions
It is just a historical recollection here, when we are recalling intensive studies in the
1970s investigating whether there were specific reactions of energy metabolism
driving specific processes of membrane transport of ions. However, this is a very
illustrative example of functional physiological plasticity given by network dynamics in plants. The starting point was the hypothesis by Lundegårdh that mitochondrial electron transport would drive anion uptake by plant cells (Lundegårdh and
Burström 1933, 1935; Lundegårdh 1950, 1955). Similarly it was proposed that
photosynthetic electron transport would directly power anion uptake in green algal
cells (MacRobbie 1965; Raven 1967). This elicited a large number of studies where
various techniques were used to separate specific mechanisms of energy metabolism in order to see if per se they could drive ion transport. These included use of
various metabolic inhibitors of electron transport and phosphorylation, anaerobiosis, variation of wavelengths distinguishing activation of the two photosystems,
photosynthesis mutants, variegated leaves, and greening etiolated leaves. It turned
out that any given energy source if isolated in the appropriate way can drive ion
transport. As long as any meshes in the network were maintaining cellular energy
state with energy charge and redox poise, this could sustain energy-dependent ion
transport at membranes (Lüttge and Higinbotham 1979).
2.1.2
Plastic Expression of Modes of Photosynthesis
Although for the stoichiometry of plant life sensu Körner (Körner 2013; see also
Lüttge 2012a), we must not neglect the integration of the nutrient cycle with the
carbon cycle, photosynthesis remains the primary event in the production of new
biomass. In the physiological ecology of photosynthesis, we find a pronounced
plasticity of plants in response to factors such as light, water and nutrients, and
carbon. We also note that intermediateness can occur between the three major
modes of photosynthesis, i.e., C3, C4, and Crassulacean Acid Metabolism (CAM).
There are C3/CAM, C3/C4, and C4/CAM intermediate species.
Sun and Shade Forms
In the ecophysiology of photosynthesis we can distinguish sun plants and shade
plants (Boardman 1977; Larcher 2001; Lichtenthaler et al. 2007; Lichtenthaler
2014), where the adaptation to and the demand of high and low irradiance,
Stability as a Phenomenon Emergent from Plasticity–Complexity–Diversity in. . .
217
respectively, is genetically constitutive. In the context of plasticity of photosynthesis, it is important to mention, however, that sun and shade phenotypes can also be
expressed by the same genotype. A well-known example of this intraspecific
plasticity is that of the leaves of European beech, Fagus sylvatica L. Exposed
leaves at the surface of the crown are sun type and shaded leaves in the inner part of
the crown are shade type leaves. The sun leaves are thicker and have multilayerpalisade parenchyma. Sun leaves have higher leaf area-related respiration and
maximum photosynthetic rates (but not so when based on dry mass), higher light
compensation points, higher light saturation points, and lower quantum yield of
photosynthesis than shade leaves. Compared to sun plants shade plants have lower
chlorophyll a/b ratios, lower rates of electron flow along the redox chain in the
thylakoids related to chlorophyll, less soluble protein (especially less enzyme
protein of ribulose-bis-phosphate carboxylase/oxygenase, RubisCO) in relation to
chlorophyll, larger photosystem II/photosystem I ratios, larger chloroplasts, and
more grana formation (summarized in Lüttge 2008a). With this acclimation to light
regimes, C3-photosynthesis shows plasticity.
Another well-studied example of sun and shade forms is the Crassulacean acid
metabolism (CAM) plant Bromelia humilis Jacq. growing in tropical deciduous dry
forests and on sand plains where the tank-forming leaf rosettes which they develop
on the same ramets are dark green when shaded under shrubs and trees, pale green
in semi-shade, and lemon-yellow in open sun exposure (Lee et al. 1989; Fetene
et al. 1990; Lüttge 2008a). These morphotypic differences are correlated with
physiotypic differences especially in the expression of CAM-phases and the internal recycling of CO2 with CAM-idling as explained in the following subsection.
Phases of Crassulacean Acid Metabolism
Crassulacean acid metabolism (CAM) is a mode of photosynthesis which in itself is
an outstanding example of plasticity. This is due to the most flexible expression of
the four phases of CAM as they were first defined by Osmond and Ziegler (Osmond
and Ziegler 1975; Osmond 1978). Phase I is nocturnal uptake and fixation of CO2
via phosphoenolpyruvate carboxylase (PEPC) and accumulation of the resulting
malic acid in the vacuoles. This is the phase responsible for the water saving
capacity of CAM as stomata are opened in the dark period with low evaporative
demand of the atmosphere and therefore low transpiratory loss of water vapor.
Phase II is a transition phase in the early morning when PEPC is down-regulated
and RubisCO is up-regulated. Phase III is daytime remobilization of the organic
acid from the vacuoles and decarboxylation and refixation of the CO2 via RubisCO
behind closed stomata preventing transpiration when water potential of the atmosphere is low. Phase IV in the afternoon occurs when the nocturnally accumulated
organic acid is consumed and stomata open for CO2 uptake and direct
C3-photosynthesis via RubisCO. Expression of these phases (reviewed in Lüttge
2004, 2006, 2007b) is modulated by the availability of water. Under scarcity of
water they are gradually suppressed which begins with reduction and elimination of
218
G.M. Souza and U. Lüttge
phases II and IV followed by a delay of and reduction of the amplitude of phase I in
the dark period as water stress becomes more severe. This is observed in the
laboratory (Smith and Lüttge 1985) and also with the yellow morphotypes of
B. humilis in the field (Lee et al. 1989). The climax is stomatal closure all of the
time during day and night when respiratory CO2 is refixed in the dark period and
recycled in the light period, a mode of CAM called CAM-idling. It allows the plants
to overcome extended periods of dry conditions. Another way of using the phases is
stomatal closure in the dark period and recycling of respiratory CO2 accompanied
by stomatal opening during the light period when both external CO2 and CO2
coming from the organic acid stored during recycling of CO2 serve
C3-photosynthesis via RubisCO, a mode of CAM called CAM-cycling. Among
the species of the genus Kalanchoë in Madagascar, obligate C3 and CAM species
are localized to the wetter and drier regions of the island, respectively, while
C3-CAM cycling species are more common under varying degrees of drought stress
(Kluge et al. 2001).
The extraordinary flexible expression of the CAM-phases makes CAM plants
particularly fit for tropical environments where environmental stress mostly is not
due to a single given factor but to multiple factors including water, irradiance,
temperature, CO2, and minerals (nutrients and salinity) (Lüttge 2004, 2010a;
Herrera 2009; Rodrigues et al. 2014). These environmental parameters form a
network (Figure 1 in Lüttge 2004) which regulates the multifactorial stress reactions of CAM plants.
C3/CAM Intermediate Plants
The plasticity of CAM is topped by the C3/CAM intermediate plants which can
alternatively express CAM with all its phases and pure genuine C3-photosynthesis,
respectively. Quite a number of C3/CAM intermediate genera and species have
been described in the literature among them—to name just a few—Codonanthe
crassifolia (Guralnick et al. 1986), Guzmania monostachia (Maxwell 2002), Kalanchoë blossfeldiana (Brulfert et al. 1973), Portulacaria afra (Huerta and Ting 1988),
Sedum telephium (Lee and Griffiths 1987). Two of them need special mentioning:
One is the annual plant Mesembryanthemum crystallinum, where CAM is induced
by salinity (Winter and von Willert 1972), and which has now developed to a
widely studied model species of plant stress biology. Induction of CAM is associated with the development of more succulent leaves. CAM induction is only
partially reversible. The other one is the tropical tree genus Clusia comprising
both obligate C3 and CAM species and also many C3/CAM intermediate species of
which Clusia minor L. is the most well-studied one (monographs: Lüttge 2006,
2007a, b, 2008b). This plant in terms of its photosynthetic modes is the most
flexible we know of. Switches between C3 and CAM are rapidly reversible. Two
leaves of the same node in the same plant can perform either mode if artificially
kept at different atmospheric water potentials (Schmitt et al. 1988). C. minor is an
Stability as a Phenomenon Emergent from Plasticity–Complexity–Diversity in. . .
219
example for plasticity providing broad amplitude of niche occupation (Lüttge
2007c; Sect. 2.3.2).
C3/C4 Intermediate Plants
The C4-mode of photosynthesis ecophysiologically adapts plants to high irradiance
and low water availability. In the typical case the green leaf tissue is differentiated
in a peripheral mesophyll tissue and an internal bundle-sheath tissue surrounding
central bundle sheaths. In the mesophyll cells CO2 is fixed via PEPC, malate is
transported to the bundle-sheath cells where it is decarboxylated, and the CO2
gained is refixed via RubisCO (Hatch and Osmond 1976; Hatch 1987; Sage
2004). This is a CO2 concentrating mechanism as it results in a considerable
increase of CO2 partial pressures at RubisCO in the bundle sheaths, i.e., about
sixfold as compared with atmospheric CO2. The major ecophysiolgical advantages
are (1) good CO2 acquisition, even if stomata are partially closed, accompanied by
reduced transpiratory loss of water (probably being the crucial point in C4 evolution), because PEPC has an about 60-fold higher affinity to CO2 than RubisCO,
(2) a lowered CO2 compensation point of photosynthesis, and (3) a reduction or
even elimination of photorespiration due to the high CO2 levels at RubisCO, and
therefore higher productivity as observed in water non-limited agricultural C4
plants. There are a number of structural and biochemical variations and modifications which we do not need to detail here for the purpose of drawing attention to
C3/C4 intermediate species and for demonstration of the separation of C3 and C4
species in principle component analysis of multi-variant traits (Sect. 2.2).
The formation of C3/C4 intermediateness, however, is different from C3/CAM
intermediateness. The latter is dynamic short-term phenotypic plasticity on the
basis of given genotypes in relation to the dominant interest of the present essay.
C3/C4 intermediateness is genetically constitutive anchorage of photosynthetic
characteristics intermediate between the two modes of photosynthesis. In other
words, it is more long-term evolutionary plasticity. In fact it is discussed as a
possible path on the way to the evolution of the full C4-syndrome (Peisker 1986;
Moore et al. 1987; Rawsthorne 1992; Westhoff and Gowik 2010; Ueno 2011). It is
also considered, however, to offer avenues for molecular engineering for creating
novel phenotypes with reduced photorespiration and higher productivity (Sect. 5).
C4/CAM Intermediate Plants
C4/CAM plasticity has been observed to occur in some succulent C4 dicotyledons
which are capable of diurnal fluctuations of organic acids. Dark-respiratory CO2 is
trapped in bundle sheaths by PEPC and the water storage tissue in the succulent
leaves may also participate in the fixation of internally released CO2
(Ku et al. 1981). This may also be a form of CAM-cycling occurring in C4-plants
like in C3-plants. Examples of C4/CAM intermediate species are Peperomia
220
G.M. Souza and U. Lüttge
camptotricha (Nishio and Ting 1993), Portulaca oleracea (Koch and Kennedy
1980, 1982; Mazen 1996), and Portulaca grandiflora (Koch and Kennedy 1980,
1982; Ku et al. 1981; Kraybill and Martin 1996; Guralnick and Jackson 2001;
Guralnick et al. 2002).
2.1.3
Plasticity and the Escape from the Growth-Defense Dilemma
Competition and defense are contrasting strategies under abiotic and biotic environmental stress. Competition requires vigorous growth. Defense under biotic
stress requires structural and in plants predominantly chemical means. Both compete in resource allocation. This dilemma is addressed by the growth-differentiation
balance (GDB) theory, which originally was posed as a hypothesis (Loomis 1953).
However, recent reviewing of it acquired evidence that it needs to be regarded as a
theory at immature stage (Matyssek et al. 2012b).
The GDB theory assumes a trade-off with a branching point between the
requirements of resources for growth and defense, respectively (Loomis 1953;
Herms and Mattson 1992; Matyssek et al. 2002, 2005). With affluent resources
and high primary production of biomass by photosynthesis (gross primary productivity, GPP), growth as an irreversible increase in biomass is stimulated. This is the
strategy for remaining competitive in continuing acquisition of resources. Competition for carbon, for water and nutrients (Schenk 2006; Novoplansky 2009; Hodge
2009, 2010; Cahill 2013), for light (Küppers 1989; Grams and Lüttge 2011; Cahill
2013), and even just for space as a resource (Grams and Lüttge 2011; Grams
et al. 2012; Grams 2013) supports growth, and vice versa, growth allows competition. An evident example is competition for light, where growth and with it size
per se is the basis of successful competing via shading the competitors (Cahill
2013). With scarcity of resources, on the contrary, at the cost of growth resources
are used for defense mechanisms in order to keep the status of the resources already
incorporated. Defense mechanisms are particularly important under biotic stress for
repelling pathogens, predators, and herbivores. (The term differentiation in GDB
addresses the resource-investment in structural and chemical modifications serving
defense.) For plants especially chemical defense mechanisms are characteristic
including compounds such as phenolics, phenyl-propane derivatives, terpenoids,
or tannins (Oßwald et al. 2012; Kolosova and Bohlmann 2012). One has often
termed these compounds secondary metabolites. However, this is somewhat misleading and the dilemma of resource allocation sensu GDB is more intimate. For
example phenyl-propane derivatives are needed for both lignin synthesis essential
for growth and the synthesis of pathogen-repellent chemicals (phytoalexins). By
producing phenyl-propanes the shikimic acid pathway, which is unique to plants, is
a key switch between growth and defense (Gayler and Priesack 2013). Proteins may
also have antimicrobial defense functions in addition to structural and functional
growth functions. Hence, it is considered preferable to speak of growth and
defense-related metabolism instead of primary and secondary metabolites, respectively (Matyssek et al. 2012b, c; Gayler and Priesack 2013).
Stability as a Phenomenon Emergent from Plasticity–Complexity–Diversity in. . .
221
Two recent books present a wealth of data and theoretical interpretations
addressing the question as to whether GDB with the dilemma of the strict choice
between two contrasting alternatives is valid under all circumstances or there is
escape from the dilemma (Matyssek et al. 2012a, 2013). It is evident that defense
metabolism diverts energy and material from growth metabolism and that growth
priority reduces energy and material available for defense. Looking at it in this way,
we see the plant at a branching point of resource allocation towards either of two
alternative linear outcomes. However, the situation changes completely if we
introduce nonlinear network dynamics (Hütt and Lüttge 2002, 2005) where links
or pathways (edges) between processes or functional mechanisms and pools of
metabolites (knots) provide multi-variant branching points. Only superficially it
appears that competition may reduce diversity by outcompeting compatriots.
Competition-plasticity relations are nonlinear spatiotemporal systems as can be
nicely documented in mathematical-model simulations (Gayler and Priesack 2013).
Multifunctional regulatory capacity confers plasticity, and the degree of plasticity is
correlated with the degree of complexity of the networks. We cannot talk about
plasticity without talking about complexity [(i) in Fig. 1]. The two books mentioned
above provide examples. The dilemma is broken for instance where growth can
serve both resource acquisition and defense. One example is localized growth with
sacrificing redundant and easily replaceable organs. In this way surplus GPP serves
defense by the plant giving up organs whose growth is limited by mechanisms other
than GPP. Another example is secondary metabolism driving both growth and
defense, e.g., by lignification (Matyssek et al. 2012b, c). In conclusion, the GDB
theory needs modification (Matyssek et al. 2012c) as we realize that plasticity and
complexity modulate growth-defense relations and in this way provide stability to
the existence of plant species and individuals (Fig. 1).
2.2
Analysis of Multi-variant Traits and Their Integration
for Plastic Emergence of Phenotypes
The responses of plants to environmental complexity are the sum of all of their
modular responses to local conditions plus all of the interaction effects resulting
from the integration of individual modules (de Kroon et al. 2005). Indeed, the
integration of modules allows for the emergent properties of biological systems to
be revealed (Lüttge 2012b).Therefore, there is no single scale that represents the
whole-plant plasticity (Vı́tolo et al. 2012; Bertolli et al. 2013, 2014).
An approach to assess the role of multi-variant traits for plastic emergence of
phenotypes is to measure complementary sets of data relevant in ecophysiological
performance and to submit them to principal component analysis (PCA). The main
purpose of PCA is to condense the information from a large number of original
variables into a smaller set of new compound dimensions with a minimal loss of
information (McGarigal et al. 2000). Such a procedure allows to verify the grouping
222
G.M. Souza and U. Lüttge
of the different plant responses to environmental cues, taking into account the entire
set of measured physiological parameters, and further to simulate how the plant
responses were grouped when different sets of data are analyzed separately
according to different scales of observation (Vı́tolo et al. 2012).
In a study comparing the plasticity between two species with different photosynthetic metabolism (C3 and C4) in response to water deficit and high temperature,
a whole set of parameters at different scales (from biochemistry to whole-plant
biomass) was evaluated in the same population. The results were virtually different
when single scales or sub-sets of parameters were analyzed separately (Vı́tolo
et al. 2012; Bertolli et al. 2013, 2014). It was expected that the C3 species would
be more plastic than the C4 species (Sage and McKown 2006); however, the multivariant analyses showed that the level of plasticity was scale-dependent. In particular, just the whole set of parameters was representative of the plant as an entire
organism, indicating the non-reductive character of plant plasticity (Vı́tolo
et al. 2012; Bertolli et al. 2013, 2014).
2.3
Plasticity Impeding or Supporting Diversity by Speciation
Phenotypic plasticity is an outcome of genetic diversity (Booy et al. 2000). Plasticity “may buffer or promote various evolutionary processes” (Novoplansky 2002).
That genotype and phenotype are intimately related is the reason for why there is
controversial debate of whether plasticity enhances or impedes diversity. By selection of new genotypes from diverse phenotypes it may support development of
species diversity. Conversely, plasticity may hinder speciation by protecting genotypes from environmental pressures, and hence, from speciation [(ii) and (iii) in
Fig. 1; Grime et al. 1986; West-Eberhard 1986, 1989, 2003; Solbrig 1994; Lüttge
1995a,b, 2000; Gehrig et al. 2001].
2.3.1
Hindrance of Speciation Due to Flexibility of Stress Responses
and Therefore Lower Species Diversity [(ii) in Fig. 1]
Plasticity with flexibility of species can stabilize the persistence of individuals and
individual species [(iv) in Fig. 1]. An example may be the shift from
C3-photosynthesis to CAM in M. crystallinum elicited by salinity (Sect. 2.1.2).
The annual plant begins its life cycle with C3-photosynthesis. For stabilization it is
noteworthy that in principle the plant can complete its annual life cycle without
shifting to CAM. There is no age-related induction of CAM. However, stress of
salinity and drought induces CAM (Winter and Holtum 2005, 2007). This is only
partially reversible upon stress removal as plants age (Ratajczak et al. 1994), and
age also makes the plant more sensitive to stress-dependent CAM induction (Winter and Holtum 2005, 2007). Under feedback from the phenotype, the genotype
Stability as a Phenomenon Emergent from Plasticity–Complexity–Diversity in. . .
223
switches the plant from the C3-physiotype to the CAM-physiotype and stabilizes
completion of the annual cycle of the plant (Lüttge 2005).
We may consider this type of metabolic C3-CAM plasticity as an example of
plasticity with the more focused meaning of “developmental plasticity” which is
normally irreversible (Novoplansky 2002). The case of salinity-induced C3/CAMshift in M. crystallinum is also an excellent example of the documentation of links
between the environmental influence (salinity) and the genotypic capacity in the
molecular expression of the CAM-phenotype (Cushman and Bohnert 1999, 2002;
Borland and Taybi 2004; Taybi et al. 2004).
2.3.2
Support of Speciation and Therefore Increase of Diversity
[(iii) in Fig. 1]
Dwelling on the plasticity of CAM we reach completely different dimensions when
we consider the versatile realization of the various CAM-phases and CAM-modes
(CAM idling, CAM cycling) (Sect. 2.1.2) in the perennial woody plants of Clusia,
especially C. minor, as compared to the simple C3-CAM switch in the annual
herbaceous M. crystallinum (Sect. 2.3.1). This is plasticity in the broader sense,
i.e., not purely developmental but broadly adaptive to environmental conditions.
We just need to recall that the two opposite leaves of the same node of C. minor in
experiments can perform simultaneously C3-photosynthesis and CAM, respectively, depending on atmospheric moisture in leaf chambers (Sect. 2.1.2). It has
never been focused on in the C3-CAM literature, but it is intriguing that we find the
more specific developmental plasticity of M. crystallinum and the broad adaptive
plasticity of C. minor, respectively, in the same metabolic frame of C3/CAM.
The versatile flexibility equips C. minor with a particularly large ecophysiological niche amplitude so that it can occupy a niche width extended from semi-shaded
sites of tropical dry forests into fully sun-exposed savannas (Herzog et al. 1999;
Lüttge 1999). Possibly the broad niche amplitudes are an important basis of the high
degree of evolutionary changes and speciation and therefore high diversity currently apparent in the large neo-tropical tree genus Clusia (Lüttge 2005, 2007b;
Gustafsson et al. 2007; Vaasen et al. 2007).
Plasticity has its intrinsic costs for plants. Not always and not necessarily
plasticity is adaptive. Prima facie expansion of niche width decreases species
diversity (Novoplansky 2002). However, ecological amplitudes may also separate
populations with reduced sets of genotypes which are specially adapted to particular sites. Such new genetically stable populations are called ecotypes (Kinzel
1982; Turesson 1992). Subsequently to separation of ecotypes, segregation leads
to speciation in the path of the wanderings of populations in the space of genotypes
(Schuster 1998). Environmental cues are the input to the network built up of
genotypes, phenotypes, and ecotypes (Figure 1 in Lüttge 2005), and the relationship
between genotype and phenotype only becomes meaningful in environmental
context (Schlichting and Smith 2002). As an output of the network type interactions
the development of phenotypes from genotypes proves to be the real origin of
224
G.M. Souza and U. Lüttge
complexity (Schuster 1998). Conversely, network modulation can promote system
stabilization across different environmental conditions (Bertolli et al. 2013, 2014).
Under environmental constrains, the network organization of plants, at different
scales, can change the level of network connectance (Amzallag 2001; Souza
et al. 2005) providing physiological adjustments under different external conditions. In a study with tropical tree species of different forest-successional groups
(pioneer and late secondary) grown under contrasting environments (gap and
understory), regardless of the successional group, all species showed similar network changes under the same forest conditions. Under gap conditions, the potentially most potential stressful environment, the plants increased the network
connectance, which allows fine-tuning adjustments (Souza et al. 2005), supporting
plant stability (Souza et al. 2009).
In the Darwinian gradual evolution new species originate from the transformation of populations, i.e., selection replaces existing species by new species and so
plasticity can destabilize the existence of individuals and individual species [(ii) in
Fig. 1]. Thus, there is no change in diversity. Nevertheless, when plasticity creates
different ecotypes via which new species are selected this also results in an increase
in diversity [(iii) in Fig. 1]. Diversity always increases in Eldredgian/Gouldian
punctual evolution because not the entire existing population and species is
merging in the new species (Darwinian) but new species branch off from
sub-populations of the existing species and speciation is due to splitting of lineages
(Gould 2002). When, as noted above, the development of phenotypes from genotypes proves to be the actual origin of complexity, it is not astonishing that
epigenetically based phenotypic variation can accelerate evolutionary speciation
(Zhang et al. 2013). Stress-dependent epigenetic changes, e.g., due to methylation/
demethylation of epigenetically plastic DNA are inheritable and can be an origin
for the evolution of new species [Saze 2008; Verhoeven et al. 2010; for more
references in relation to epigenetic memory see Thellier and Lüttge (2013)].
3 Biodiversity: Interspecific Diversity, Species Diversity
(Also Implying Complexity)
3.1
Diversity Is the Basis of Complexity
Diversity in general, and specifically biodiversity in the realm of life, is implicating
complexity. Interspecific diversity is given with different species as the players.
Floristic diversity considers the number of different species occurring in a given
area. We can distinguish α-diversity at the level of communities, ß-diversity at the
level of ecosystems, and γ-diversity at the level of landscapes comprising several
ecosystems (Whitmore 1990; Lüttge 2008a). In addition ecophysiological aspects
are introduced in the assessment of diversity of species so that we arrive at
functional interspecific diversity, which may also be termed as functional
Stability as a Phenomenon Emergent from Plasticity–Complexity–Diversity in. . .
225
biodiversity. When the various species building up the biodiversity communicate in
network pattern-type interactions, it becomes evident that the larger the richness of
species, i.e., the higher the interspecific diversity, the higher is the complexity of
systems [(vi) in Fig. 1].
3.2
Biodiversity Is Stabilizing (Eco-) Systems [(vii) in Fig. 1]
Although in late successional stages ecosystems may be persistent while diversity
declines, in principle diversity is correlated positively with ecosystem stability,
especially when species diversity is including functional diversity (McCann 2000;
Tilman et al. 2006). The stabilizing function of diversity has been highlighted by
Körner (2012): “The diversity of organisms . . . . . . . . . is an intrinsic feature of life.
. . . . . . . . . Uniformity is fatal. There is no future when variation fades.”
“The more species, the more different traits, the more functional niches in an
ecosystem are explored/occupied, the better are resources utilized and converted
into biomass” (Körner 2012). Modeling suggests that diversity of trees in forests
increases productivity and that even a single environmental factor, light in this case,
can be the decisive cue (Morin et al. 2011). Productivity of grasslands is related to
species richness and functional group richness (Hector et al. 1999). Examples given
by Körner (2012) are the resources of irradiance and nutrients in grassland ecosystems (meadows). Light transmission and with it light use is better in diverse
grasslands (Spehn et al. 2000). Nutrient supply in ecosystems can determine
biodiversity of plants. Conversely, biodiversity can determine nutrient availability
and acquisition by different species (Richards et al. 2010). Below ground exploration of nutrients, e.g., nitrate, is more exhaustive, i.e., the nutrient efficiency of the
entire system is higher, under larger diversity of plant species (Niklaus et al. 2001).
In a Malaysian rainforest species diversity of trees and vines was found to be
highest on soils with medium combined phosphorus and potassium concentrations
and lower at lower and higher P + K indices of the soil, respectively (Tilman 1982).
Medium and non-extreme conditions prove to be stabilizing.
A multiplicity of species can cause the so-called portfolio effect named after the
stock exchange when a broadly scattered portfolio in which different stocks oscillate non-synchronously prevents extreme losses (or gains). The average performance of an ecosystem remains more stable with the contribution of diverse species
with different levels of individual performances (Cottingham et al. 2001). Vegetation and arthropod diversity are correlated and control insect pests (Andow 1991;
Altieri 1999). Illustrative examples also come from pollination biology, e.g., from
broad studies of the coexistence of plant and pollinator species in meadows. In a
reciprocal way a higher diversity of pollinator species contributes to increased
pollination success of plants and a higher diversity of flowering plants is a resource
for sustaining the species diversity of consumers. Flower diversity and flowervisitor diversity are positively correlated, and this functionally gives a good
226
G.M. Souza and U. Lüttge
example of portfolio effects (Fründ et al. 2010; Blüthgen and Klein 2011; Weiner
et al. 2011).
In addition to diversity also the existence of significant redundancy (Edelman
and Gally 2001) within the network buffers the primary pathways or mechanisms
within biological systems against external perturbations. Systems with sufficient
redundancy provide robustness in performance even when the system suffers an
external disturbance, e.g., via transmission across alternate pathways, providing
overall stability to the ensemble system (Amzallag 2001; Edelman and Gally 2001).
Indeed, complexity is, somehow, between homogeneity (regularity) and randomness (Mitchell 2009). Theoretically, there is a critical threshold between increasing
complexity and gain of stability (Gardner and Ashby 1970). It seems reasonable to
consider that in a hypothetical system without any redundancy (e.g., each species
with only one individual) the loss of any component can be potentially disruptive,
even more so if the component was a hub in the system network.
3.3
Biodiversity and Relations of Competition
and Facilitation
A prominent example of interrelations between species in ecosystems is mycorrhizae (Teste et al. 2009). However, beyond such mutualism biotic interactions
comprise competition and facilitation. Facilitation is given when neighboring
species support each other indirectly as a kind of integrated outcome from interactions. Facilitation can reach as far as particular species exerting nurse effects so that
other species can get established in their vicinity (Da Silva et al. 1995; Feyera
et al. 2002; Grams and Lüttge 2011; Grams 2013). In this way new niches are
created and new systems are established where diversity leads to ecological
stabilization.
The role of plant–plant interactions, in particular based on the self- and non selfreference capacity, has been recognized as an important factor to establish ecological organizational patterns of distribution and diversity (Novoplansky 2009). Many
are the evidences of the abilities of plants to discriminate their neighbors, developing in different ways due to the recognition of individuals of the same species or
different species, showing a range of behaviors varying according to the genetic
relationships (Kelly 1996; Dudley and File 2007), physiological responses
(Gruntman and Novoplansky 2004), and ecotypes (Mahall and Callaway 1996).
In the soil, despite the availability of resources to be a major factor determining the
behavior of the roots (van Vuuren et al. 1996; Hodge et al. 1998), there are many
evidences that the presence of neighboring plants significantly influences the
response of roots. Plants are capable of self/non-self reference, with further growth
in the presence of foreign plants and reduction of root elongation in the presence of
roots of the same plant or plants with same genotype (Caldwell et al. 1996; Falik
et al. 2006). The roots are capable of distinguishing “self” (roots of the same plant)
Stability as a Phenomenon Emergent from Plasticity–Complexity–Diversity in. . .
227
of “non-self” (roots of other plants), even when plants are genetically identical, and
even without physical contact between the roots (Falik et al. 2003, 2006). Root–root
recognition has been evaluated in studies that compared the performance of plants
which grew in groups of siblings and non-siblings individuals. The recognition
mechanisms in Miscanthus sinensis, for example, were entirely genetic: root
growth was strongly enhanced by contact with roots belonging to a different
genotype, but was significantly inhibited when in contact with roots belonging to
the same genotype (de Kroon et al. 2003). The mechanisms involved in self/nonself reference are still unclear, but possibilities include chemical communication
through root exudates and release of volatile molecules and enzymes that act on the
cell surface. The electrical signaling has also been considered as a possible signaling mechanism (Schenk et al. 1999; Falik et al. 2003).
Extirpation-resistant species among a large diversity of species present in a
system can functionally compensate for the loss of species under stress and deterioration (Davies et al. 2012). However, this is not always given. A very interesting
feature of biodiversity is that the power of facilitation can be hidden within the
diversity and only comes out under sudden extreme stress (Körner 2012). At high
diversity among the many species there may be hidden species without any obvious
important functions for the ecosystem. However, such species may have capacities
to protect the system under suddenly occurring extreme events, such as Festuca
valesiaca stabilizing gully erosion of grasslands or species-diverse forests under
extreme environmental pressures (Scherer-Lorenzen et al. 2005; Caprez et al. 2012;
Körner 2012; Huck et al. 2013). Systems fail when because of low diversity such
species do not happen to be there. These examples also underline that stability is not
a static property of systems as they show that diversity supports stability under
dynamic change as a dynamic equilibrium (Hillebrand and Fitter 2013).
Pseudo-steady states in system behavior are not only provided by facilitation but
also by competition. With time facilitation can shift to competition (Callaway and
Walker 1997). In networks competition and facilitation may interchange and
interact; they do not act in isolation (Lin et al. 2012; Callaway 2013). They occur
simultaneously within the same community and are difficult to separate from each
other (Callaway and Walker 1997; Callaway 1998, 2013; Lin et al. 2012; del Rı́o
et al. 2014). The balance between them is the topic of the stress-gradient hypothesis
(SGH). Facilitation dominates in harsh and stressful environments with abiotic as
well as biotic stress, while competition rules in fertile benign environments under
affluence (Bertness and Callaway 1994; Callaway and Walker 1997; Dangles
et al. 2013). This spatial view of SGH has been recently extended by introducing
the temporal aspect. For mixed-species forests of Central Europe at the stand level
(Pretzsch 2013; del Rı́o et al. 2014) show that there are temporal shifts between
facilitation and competition, e.g., between different years being “bad” or “good” for
productivity. A similar picture is inherent in a meta-analysis of the dynamic treegrass systems of global savannas (Dohn et al. 2013). Moreover, the SGH requires
refinement when different types of facilitation are considered. These reach from
completely symmetric, where all plants receive the same degree of benefit, to
completely asymmetric, where only the beneficiary plants receive benefit and no
228
G.M. Souza and U. Lüttge
advantage is given to the benefactor, with intermediate modes in between (Lin
et al. 2012). The nonlinear spatiotemporal stress-gradient effects are based on
plasticity and provide a fine illustration of the interactions shown in Fig. 1.
Working with microcosms Grime et al. (1987) showed that high richness of
species and stabilization of diversity occurred within a window of stress conditions.
At high stress only a few well adapted specialists survive. At low stress only a few
very robust and competitive species gain dominance. As we noted above there is
stabilization under medium conditions of mineral nutrition, and stabilizing diversity
is lost under extreme conditions of low or high resource availability. Only medium
stress allows the unfolding of variability and its stabilizing effects. This has led us
earlier to suggest that the rules of deterministic chaos may govern species diversity
and stability of ecosystems (Lüttge 2008a). At low resource densities, r, systems in
deterministic chaos are monotonous, and at high r they become chaotic, while at
medium r there appear stable oscillations between different states (Schuster 1995).
Here we also may recall Lyapunov stability (see Introduction). The time it takes a
system to move from small differences in the initial conditions into chaos is related
to an exponent named Lyapunov exponent, λ (eλt). This time is equal to 1/λ. In the
region of the system with stable oscillations, λ is always positive whereas in the
chaotic region it is mostly negative (Schuster 1995).
Ecologically the best examples are tropical rain forests with their extraordinary
plant biodiversity and their characteristic multifactorial stress of medium intensity
(Lüttge 2004, 2008a; Sect. 2.1.2). These forests are characterized by an oscillating
spatiotemporal mosaic pattern of series of states of successions (Remmert 1985,
1991; Whitmore 1990). Oscillatory systems can be regulated by nonstructured
completely irregular so-called white noise. When peaks of oscillations remain
below a threshold only above which rhythmicity would be overtly expressed, this
can be modulated by noise. Nothing happens when the noise is weak. Conversely
noise overrides the oscillations when it is too strong. However, at medium intensity
noise may just lift the peaks of oscillations above threshold. In this way noise
creates the output of overt rhythmicity, or in other words, noise creates order and
stability [(iv) and (v) in Fig. 1]. This is called stochastic coherence or stochastic
resonance (Hütt and Lüttge 2002, 2007). In this way noise can have stabilizing
effects via diversity and complexity.
3.4
Biodiversity Challenging Ecosystems [(viii) in Fig. 1]
Biodiversity may also challenge ecosystems. For example disturbance and clearings, e.g., building roads across ecosystems, will provide new and different conditions for plants and therefore increase γ-diversity. Another process of at least
temporarily increasing species diversity is the mostly anthropogenic introduction
of invasive species or neophytes (Elton 1958; Kowarik 2010). Such species often
have high phenotypic plasticity (Williams et al. 1995; Willis et al. 2000; Alpert and
Simms 2002). Their arrival first increases species diversity when they coexist with
Stability as a Phenomenon Emergent from Plasticity–Complexity–Diversity in. . .
229
native species, and they also can create new niches. They may have adverse effects
on ecosystems not only via competition with native species. Hybridization may
affect the gene pool of native species. New species can emerge. Eventually invasive
species threaten biodiversity. Existing systems can be destabilized (Klotz 2013).
4 Complexity
The previous sections repeatedly have referred to complexity. Complexity
– is based on biodiversity [(ii) > (iii) > (vi) in Fig. 1],
– is modulated by plasticity [(i) in Fig. 1],
– stabilizes systems [(ix) in Fig. 1].
This is due to the fact that complexity is an intrinsic property of interactions
within networks, such as that of Fig. 1 itself and any others. There are alternatives
via different pathways of connections of edges and knots in networks. There is no
one-sidedness of either positive or negative interactions and in the effects on
stability. It is a basic feature of the organization of networks that they always
comprise positive and negative feedbacks (Hütt and Lüttge 2005; Souza
et al. 2009).
5 Outlook on Practical Implications: Stability
and Sustainability
The theoretical considerations presented in this essay on how plasticity, diversity,
and complexity support stability have enormous practical implications because
stability of systems, in the sense discussed here, is a prerequisite of sustainability.
Menace and hope are currently deeply attached to sustainability. Failure and
success, respectively, of sustainability determine the fate of mankind on Earth.
Hence, the mechanisms supporting stability must be considered and studied in
relation to agriculture, forestry, agro-forestry, and other human activities.
Plasticity, diversity, and complexity, all of them are based on integration of
modules at different scalar levels which leads to emergence of phenotypes with new
functional properties as compared to the properties of the modules they incorporate
(Lüttge 2012a, b). The new approach of applying principle component analysis
(PCA) to multi-variant functional traits, i.e., the modules, should be applied more
broadly. This then will prove the great power of functional PCA for understanding
emergent integrated systems at scalar levels of ecology (Sect. 2.2; Vı́tolo
et al. 2012; Bertolli et al. 2013, 2014). It unravels many practical outlooks for
applications on environmental management and agro-forest ecology.
230
G.M. Souza and U. Lüttge
The interrelations of plasticity, diversity, and complexity in the establishment of
stability (Fig. 1) are setting the scene for projects of conservation (Lüttge 2010b).
Plasticity is the basic property conferring flexibility to species, which recently have
been named “stem-species” serving the emergent establishment of new ecosystems
on deteriorated sites (Lüttge et al. 2012; Scarano and Garbin 2013).
Plasticity of modes of photosynthesis, especially as seen in the C3/C4 intermediate species (Sect. 2.1.2), has been considered to open avenues for molecular
engineering of crop plants for the higher productivity attained in the C4-syndrom.
The C3/C4-intermediate phenotypes as they occur especially in the genus Flaveria
(Westhoff and Gowik 2010) may help to identify master genes for engineering (see
Lüttge 2013).
PCA of multi-variant functional traits should be applied to agro- and forest
ecosystems and their combination in agro-forestry. In currently fashionable
so-called bio-agriculture, we can distinguish (1) biodynamic agriculture, which is
an anthroposophic occultism (Treue 2002); (2) organic farming, which is highly
expanding worldwide and acquiring markets for its products but has lower productivity and causes a variety of ecological problems; and, by great contrast to the two
former ways, (3) agro-ecology as a serious interdisciplinary approach applying
ecological principles to agriculture (Wikipedia 2011, see Lüttge 2013).With the
challenge of feeding increasing human populations on Earth functional PCA shall
be important for developing approaches of sustainable agro-ecology.
The discussion of ecological agriculture (agro-ecology) traditionally focuses on
ecophysiolgical autecology, i.e., ecophysiology at the level of individual (crop-)
plants or species. This comprises ecological evaluations of relations of the individual species to resources, such as water, nutrients, CO2, light, and others. Genotype
improvements and engineering also concern the autecological level. Considering
the quadruped (Fig. 1) we can ask if one could extend ecological agriculture to
ecophysiological synecology, i.e., ecophysiology at the community level (Lüttge
and Scarano 2004, 2007; Lüttge 2005). It would involve the terms plasticity and
diversity of the quadruped and evaluate the aim of stability (i.e., “sustainability” in
eco-agriculture). It would address the question of the role of plasticity in challenges
related to the growth differentiation balance theory (GDB) and the stress gradient
hypothesis (SGH) as discussed in this essay. It would need to assess the spatiotemporal dynamics of interacting competition and facilitation in species diverse agroecosystems.
A major question would be the relation to biodiversity. For a start we might learn
from intercropping or cocultivation, e.g., of cereal and legume species (Bedoussac
and Justes 2010), or mixed stands of forest trees (Scherrer et al. 2011; Pretzsch
2013; Pretzsch et al. 2013; del Rı́o et al. 2014). Often these only have a “diversity”
of two species (Richards et al. 2010). We also may learn much from agro-forestry.
Agro-forestry conserves biodiversity in various ways, e.g., by providing habitat
structures, by enhancing soil fertility, by reducing erosion, by improving water
quality, and by other ecosystem services (McNeely 2004; Jose 2009). Can agroecosystems be further diversified? Agro-ecosystems with higher crop diversity are
of great interest (Altieri 1999), because species diversity can increase ecosystem
Stability as a Phenomenon Emergent from Plasticity–Complexity–Diversity in. . .
231
services and productivity (Balvanera et al. 2006; Tilman et al. 2006). Can ecological agriculture manage agricultural landscapes with land use mosaics to host
increased biodiversity where crop diversity and diversity of adjacent “natural”
vegetation interactively add complexity (Altieri 1999)? Stabilizing effects of complexity could foster sustainability of agro-ecosystems (Fig. 1) (Altieri 1999; Scherr
and McNeely 2008). Such expectations are qualitatively underlined by many
observations, such as nutrient cycling, effects on micro-climate including hydrology, pest control, etc. (Altieri 1999). However, is all that feasible in view of the
challenge to increase production for feeding increasing humankind (Lüttge 2013)?
Ecological agriculture might bring about some immediate or short-term reduction
of productivity. However, there could be a profitable long-term return by minimization of degradation and support of agro-ecosystems’ stability. Can the stabilizing
effects of diversity and complexity in ecological agriculture maintain or increase
agricultural output meeting an increased demand for agricultural products (Scherr
and McNeely 2008)? Quantitative assessments are urgently required.
Acknowledgment We thank Rainer Matyssek, Weihenstephan, Freising, for valuable comments
on the manuscript.
References
Alpert P, Simms EL (2002) The relative advantages of plasticity and fixity in different environments: when is it good for a plant to adjust? Evol Ecol 16:285–297
Altieri M (1999) The ecological role of biodiversity in agroecosystems. Agric Ecosyst Environ
74:19–31
Amzallag GN (2001) Data analysis in plant physiology: are we missing the reality? Plant Cell
Environ 24:881–890
Andow DA (1991) Vegetational diversity and arthropod population response. Ann Rev Entomol
36:561–586
Balvanera P, Pfisterer AB, Buchmann N, He J-S, Nakashizuka T, Raffaelli D, Schmid B (2006)
Quantifying the evidence for biodiversity effects on ecosystem functioning and services. Ecol
Lett 9:1146–1156
Barabási A-L (2002) Linked: the new science of networks. Perseus, London
Barabási A-L, Oltvai ZN (2004) Network biology: understanding the cell’s functional organization. Nat Rev Genetics 5:101–113
Bedoussac L, Justes E (2010) The efficiency of a durum wheat-winter pea intercrop to improve
yield and wheat grain protein concentration depends on N availability during early growth.
Plant Soil 330:19–35
Bertness MD, Callaway R (1994) Positive interactions in communities. Trends Ecol Evol 9:191–
193
Bertolli SC, Vitolo HF, Souza GM (2013) Network connectance analysis as a tool to understand
homeostasis of plants under environmental changes. Plants 2:473–488
Bertolli SC, Mazzafera P, Souza GM (2014) Why is it so difficult to identify a single indicator of
water stress in plants? A proposal for a multivariate analysis to assess emergent properties.
Plant Biol 16:578–585
Blüthgen N, Klein A-M (2011) Functional complementarity and specialization: the role of
biodiversity in plant-pollinator interactions. Basic Appl Ecol 12:282–291
232
G.M. Souza and U. Lüttge
Boardman N (1977) Comparative photosynthesis of sun and shade plants. Annu Rev Plant Physiol
28:355–377
Booy G, Hendriks RJJ, Smulders MJM, van Groenendael JM, Vosman B (2000) Genetic diversity
and the survival of populations. Plant Biol 2:379–395
Borland AM, Taybi T (2004) Synchronization of metabolic processes in plants with crassulacean
acid metabolism. J Exp Bot 55:1255–1265
Bradshaw AD (1965) Evolutionary significance of phenotypic plasticity in plants. Adv Genet
13:115–155
Brulfert J, Guerrier D, Queiroz O (1973) Photoperiodism and enzyme activity: balance between
inhibition and induction of the crassulacean acid metabolism. Plant Physiol 51:220–222
Cahill JF (2013) Plant competition: can understanding trait-behavior linkages offer a new perspective on very old questions? Nova Acta Leopoldina 114(391):115–125
Caldwell MM, Manwaring JH, Durham SL (1996) Species interactions at the level of fine roots in
the field: influence of soil nutrient heterogeneity and plant size. Oecologia 106:440–447
Callaway RM (1998) Competition and facilitation on elevation gradients in subalpine forests of
the northern Rocky Mountains, USA. Oikos 82:561–573
Callaway RM (2013) Facilitation, competition and the organization of plant communities. Nova
Acta Leopoldina 114(391):147–157
Callaway RM, Walker LR (1997) Competition and facilitation: a synthetic approach to interactions in plant communities. Ecology 78:1958–1965
Camazine S, Deneubourg J-L, Franks NR, Sneyd J, Theraulaz G, Bonabeau E (2001) Selforganization in biological systems. Princeton University Press, Princeton, NJ
Cannon WB (1932) The wisdom of the body. Norton, New York, NY
Caprez R, Spehn E, Nakhutrishvili G, Körner C (2012) Drought at erosion edges selects for a
“hidden” keystonae species. Plant Ecol Divers. doi:10.1080/17550874.2011.600343
Cottingham KL, Brown BL, Lennon JT (2001) Biodiversity may regulate the temporal variability
of ecological systems. Ecol Lett 4:72–85
Csermely P (2006) Weak links: stabilizers of complex systems from proteins to social networks.
Springer, Berlin
Cushman JC, Bohnert HJ (1999) Crassulacean acid metabolism: molecular genetics. Annu Rev
Plant Physiol Plant Mol Biol 50:305–332
Cushman JC, Bohnert HJ (2002) Induction of crassulacean acid metabolism by salinity – molecular aspects. In: Läuchli A, Lüttge U (eds) Salinity: environment – plants – molecules. Kluwer,
Dordrecht, pp 362–393
Da Silva MC, Scarano FR, De Souza CF (1995) Regeneration of an Atlantic forest formation in the
understory of a Eucalyptus grandis plantation in south-eastern Brazil. J Trop Ecol 11:147–152
Dangles O, Herrera M, Anthelme F (2013) Experimental support of the stress-gradient hypothesis
in herbivore-herbivore interactions. New Phytol 197:405–408
Davies TW, Jenkins SR, Kingham R, Hawkins SJ, Hiddink JG (2012) Extirpation-resistant species
do not always compensate for the decline in ecosystem processes associated with biodiversity
loss. J Ecol 1000:1475–1481
de Kroon H, Mommer L, Nishiwaki A (2003) Root competition: towards a mechanistic understanding. In: de Kroon H, Visser EJW (eds) Root ecology. Springer, Berlin
de Kroon H, Huber H, Stuefer JF, van Groenendael JM (2005) A modular concept of phenotypic
plasticity in plants. New Phytol 166:73–82
del Rı́o M, Schütze G, Pretzsch H (2014) Temporal variation of competition and facilitation in
mixed species forests in Central Europe. Plant Biol 16:166–176
DeWitt TJ, Scheiner SM (2004) Phenotypic plasticity: functional and conceptual approaches.
Oxford University Press, New York, NY
Dohn J, Dembélé F, Karembé M, Moustakas A, Amévor KA, Hanan N (2013) Tree effects of grass
growth in savannas: competition, facilitation and the stress-gradient hypothesis. J Ecol
101:202–209
Dudley SA, File AL (2007) Kin recognition in an annual plant. Biol Lett 3:435–438
Stability as a Phenomenon Emergent from Plasticity–Complexity–Diversity in. . .
233
Edelman GM, Gally JA (2001) Degeneracy and complexity in biological systems. Proc Natl Acad
Sci USA 98:13763–13768
Elton CS (1958) The ecology of invasions by animals and plants. The University of Chicago Press,
Chicago
Falik O, de Kroon H, Novoplansky A (2003) Self/non-self discrimination in roots. J Ecol 91:
525–531
Falik O, de Kroon H, Novoplansky A (2006) Physiologically mediated self/non-self root discrimination in: Trifolium repens has mixed effects on plant performance. Plant Signal Behav
1:116–121
Fetene M, Lee HSJ, Lüttge U (1990) Photosynthetic acclimation in a terrestrial CAM bromeliad,
Bromelia humilis Jacq. New Phytol 114:399–406
Feyera S, Beck E, Lüttge U (2002) Exotic trees as nurse-trees for the regeneration of natural
tropical forests. Trees 16:245–249
Fründ J, Linsenmair KE, Blüthgen N (2010) Pollinator diversity and specialization in relation to
flower diversity. Oikos 119:1581–1590
Gardner MR, Ashby R (1970) Connectance of large dynamic (cybernetic) systems: critical values
for stability. Nature 228:784
Gayler S, Priesack E (2013) Carbohydrate allocation to growth and defense-related metabolism – a
modeling approach at the whole-plant level. Nova Acta Leopoldina 114(391):99–114
Gehrig H, Gaussmann O, Marx H, Schwarzott D, Kluge M (2001) Molecular phylogeny of the
genus Kalanchoë (Crassulaceae) inferred from the nucleotide sequences of the IST-1 and
IST-2 regions. Plant Sci 160:827–835
Gould JG (2002) The structure of evolutionary theory. Harvard University Press, Cambridge, MA
Grams TEE (2013) A space-related perspective on plant-plant competition. Nova Acta Leopoldina
114(391):127–134
Grams TEE, Lüttge U (2011) Space as a resource. Prog Bot 72:349–370
Grams TEE, Daigo MJ, Winkler JB, Gayler S, Matyssek R (2012) Growth and space use in
competitive interactions between juvenile trees. In: Matyssek R, Schnyder H, Oßwald W,
Ernst D, Munch JC, Pretzsch H (eds) Growth and defence in plants. Resource allocation at
multiple scales. Springer, Heidelberg, pp 273–286
Grime JP, Crick JC, Rincon JE (1986) The ecological significance of plasticity. In: Jennings DH,
Trewavas AJ (eds) Plasticity in plants. Cambridge University Press, Cambridge, pp 5–29
Grime JP, Mackey JML, Hillier SH, Read DJ (1987) Floristic diversity in a model system using
experimental microcosms. Nature 328:420–422
Grimm V, Wissel C (1997) Babel, or the ecological stability discussions: an inventory and analysis
of terminology and a guide for avoiding confusion. Oecologia 109:323–334
Gruntman M, Novoplansky A (2004) Physiologically mediated self/non-self discrimination in
roots. Proc Natl Acad Sci USA 101:3863–3867
Guralnick LJ, Jackson MD (2001) The occurrence and phylogenetics of Crassulacean acid
metabolism in the Portulacaceae. Int J Plant Sci 162:257–262
Guralnick LJ, Ting IP, Lord EM (1986) Crassulacean acid metabolism in the Gesneriaceae. Am J
Bot 53:336–345
Guralnick LJ, Edwards G, Ku MSB, Hockema B, Franceschi VR (2002) Photosynthetic and
anatomical characteristics in the C4-crassulacean acid metabolism-cycling plant, Portulca
grandiflora. Funct Plant Biol 29:763–773
Gustafsson MHG, Winter K, Bittrich V (2007) Diversity, phylogeny and classification of Clusia.
In: Lüttge U (ed) Clusia. A woody neotropical genus of remarkable plasticity and diversity, vol
194, Ecological studies. Springer, Berlin, pp 95–116
Hatch MD (1987) C4 photosynthesis: a unique blend of modified biochemistry, anatomy and
ultrastructure. Biochim Biophys Acta 895:81–106
Hatch MD, Osmond CB (1976) Compartmentation and transport in C4 photosynthesis. In: Stocking CR, Heber U (eds) Transport in plants III. Intracellular interactions and transport processes,
vol 3, Encyclopedia of plant physiology NS. Springer, Berlin, pp 144–184
234
G.M. Souza and U. Lüttge
Hector A, Schmid B, Beierkuhnlein C, Caldeira MC, Diemer M, Dimitrakopoulus PG, Finn JA,
Freitas H, Giller PS, Good J, Harris R, Högberg P, Huss-Danell K, Joshi J, Jumpponen A,
Körner C, Leadley PW, Loreau M, Minns A, Mulder CPH, O’Donovan G, Otway SJ, Pereira
JS, Prinz A, Read DJ, Scherer-Lorenzen M, Schulze E-D, Siamantziouras A-SD, Spehn EM,
Terry AC, Troumbis AY, Woodward FI, Yachi S, Lawton JH (1999) Plant diversity and
productivity experiments in European grasslands. Science 286:1123–1127
Herms DA, Mattson WJ (1992) The dilemma of plants: to grow or defend. Q Rev Biol 67:283–335
Herrera A (2009) Crassulacean acid metabolism and fitness under water deficit stress: if not for
carbon gain, what is facultative CAM good for? Ann Bot 103:645–653
Herzog B, Hoffmann S, Hartung W, Lüttge U (1999) Comparison of photosynthetic responses of
the sympatric tropical C3-species Clusia multiflora H.B.K. and the C3-CAM intermediate
species Clusia minor L. to irradiance and drought stress in a phytotron. Plant Biol 1:460–470
Hillebrand H, Fitter A (2013) Biodiversität und Stabilität. Neue Erkenntnisse zu einem
ökologischen Paradigma. In: Beck E (ed) Die Vielfalt des Lebens. Wiley-VCH, Weinheim,
pp 111–181
Hodge A (2009) Root decisions. Plant Cell Environ 32:628–640
Hodge A (2010) Roots: the acquisition of water and nutrients from the heterogeneous soil
environment. Prog Bot 71:307–337
Hodge A, Stewart J, Robinson D, Griffiths BS, Fitter AH (1998) Root proliferation, soil fauna and
plant nitrogen capture from nutrient-rich patches in soil. New Phytol 139:479–494
Huck C, Körner C, Hitbrunner E (2013) Plant species dominance shifts across erosion edgemeadow grassland soils. Oecologia 171:693–703
Huerta AJ, Ting IP (1988) Effects of various levels of CO2 on the induction of crassulacean acid
metabolism in Portulacaria afra (L.) Jacq. Plant Physiol 88:183–188
Hütt M-T, Lüttge U (2002) Nonlinear dynamics as a tool for data analysis and modeling in plant
physiology. Plant Biol 4:281–297
Hütt M-T, Lüttge U (2005) Network dynamics in plant biology: current progress in historical
perspective. Prog Bot 66:277–310
Hütt M-T, Lüttge U (2007) Noise-induced phenomena and complex rhythms: theoretical considerations, modeling and experimental evidence. In: Manusco S, Shabala S (eds) Rhythms in
plants: phenomenology, mechanisms, and adaptive significance. Springer, Berlin, pp 313–339
Jose S (2009) Agroforestry for ecosystem services and environmental benefits: an overview.
Agroforestry Syst 76:1–10
Kelly JK (1996) Kin selection in the annual plant Impatiens capensis. Am Naturalist 147:899–918
Kinzel H (1982) Pflanzenökologie und Mineralstoffwechsel. Ulmer, Stuttgart
Klotz S (2013) Globaler Austausch, eine neue Herausforderung: Biologische Invasionen – Gefahr
im Verzug? In: Beck E (ed) Die Vielfalt des Lebens. Wiley-VCH, Weinheim, pp 191–201
Kluge M, Razanoelisoa B, Brulfert J (2001) Implications of genotypic diversity and phenotypic
plasticity in the ecophysiological success of CAM plants, examined by studies on the vegetation of Madagascar. Plant Biol 3:214–222
Koch K, Kennedy RA (1980) Characteristics of Crassulacean acid metabolism in the succulent C4
dicot, Portulaca oleracea L. Plant Physiol 65:193–197
Koch K, Kennedy RA (1982) Crassulacean acid metabolism in the succulent C4 dicot, Portulaca
oleracea L. under natural environmental conditions. Plant Physiol 69:757–761
Kolosova N, Bohlmann J (2012) Conifer defense against insects and fungal pathogens. In:
Matyssek R, Schnyder H, Oßwald W, Ernst D, Munch JC, Pretzsch H (eds) Growth and
defence in plants. Resource allocation at multiple scales, vol 220, Ecological studies. Springer,
Heidelberg, pp 85–109
Körner C (2012) Biological diversity – the essence of life and ecosystem functioning. Nova Acta
Leopoldina 116(394):147–159
Körner C (2013) Growth controls photosynthesis – mostly. Nova Acta Leopoldina 114(391):273–
283
Stability as a Phenomenon Emergent from Plasticity–Complexity–Diversity in. . .
235
Kowarik I (2010) Biologische Invasionen, Neophyten und Neozoen in Mitteleuropa, 2nd edn.
Ulmer, Stuttgart
Kraybill AA, Martin CE (1996) Crassulacean acid metabolism in three species of the genus
Portulaca. Int J Plant Sci 157:103–109
Ku S-B, Shieh YJ, Reger BJ, Black CC (1981) Photosynthetic characteristics of Portulaca
grandiflora a succulent C4 dicot. Cellular compartmentation of enzymes and acid metabolism.
Plant Physiol 68:1073–1080
Küppers M (1989) Ecological significance of above-ground architectural patterns in woody plants
– a question of cost-benefit relationships. Trends Ecol Evol 4:375–379
Larcher W (2001) Ökophysiologie der Pflanzen, 6th edn. Ulmer, Stuttgart
Lee HSJ, Griffiths H (1987) Induction and repression of CAM in Sedum telephium L. in response
to photoperiod and water stress. J Exp Bot 38:834–841
Lee HSJ, Lüttge U, Medina E, Smith JAC, Cram WJ, Diaz M, Griffiths H, Popp M, Schäfer C,
Stimmel K-H, Thonke B (1989) Ecophysiology of xerophytic and halophytic vegetation of a
coastal alluvial plain in northern Venezuela. III. Bromelia humilis Jacq., a terrestrial CAM
bromeliad. New Phytol 111:253–271
Lichtenthaler HK (2014) Fifty-five years of research on photosynthesis, chloroplasts and stress
physiology of plants: 1958–2013. In: Lüttge U, Beyschlag W (eds) Progress in botany: genetics
– physiology – systematics – ecology, vol 76. Springer, Heidelberg
Lichtenthaler HK, Ac A, Marek MV, Kalina J, Urban O (2007) Differences in pigment composition, photosynthetic rates and chlorophyll fluorescence images of sun and shade leaves of
four tree species. Plant Physiol Biochem 45:577–588
Lin Y, Berger U, Grimm V, Ji Q-R (2012) Differences between symmetric and asymmetric
facilitation matter: exploring the interplay between modes of positive and negative plant
interactions. J Ecol 100:1482–1491
Loomis WE (1953) Growth and differentiation – an introduction and summary. In: Loomis WE
(ed) Growth and differentiation in plants. Iowa State College Press, Ames, IA, pp 1–17
Lucas M, Laplaze L, Bennett MJ (2011) Plant systems biology: network matters. Plant Cell
Environ 34:535–553
Lundegårdh H (1950) The translocation of salts and water through wheat roots. Plant Physiol
2:103–151
Lundegårdh H (1955) Mechanisms of absorption, transport, accumulation, and secretion of ions.
Ann Rev Plant Physiol 6:1–24
Lundegårdh H, Burström H (1933) Untersuchungen über die Salzaufnahme der Pflanzen. III.
Quantitative Beziehungen zwischen Atmung und Anionenaufnahme. Biochem Z 261:235–251
Lundeghårdh H, Burström H (1935) Untersuchungen über die Atmungsvorgänge in
Pflanzenwurzeln. Biochem Z 277:223–249
Lüttge U (1995a) Ecophysiological basis of the diversity of tropical plants: the example of the
genus Clusia. In: Heinen HD, San José JJ, Caballero-Arias H (eds) Nature and human ecology
in the neotropics, vol 5, Scientia Guaianae, pp 23–36
Lüttge U (1995b) Clusia: Ein Modellfall der ökophysiologischen Plastizität in einer tropischen
Gattung. In: Rundgespräche der Kommission für Ökologie der BAdW. 10: 173–186.
Bayerische Tropenforschung einst und jetzt. Dr. Pfeil, München
Lüttge U (1999) One morphotype, three physiotypes: sympatric species of Clusia with obligate
C3-photosynthesis, obligate CAM and C3-CAM intermediate behaviour. Plant Biol 1:138–148
Lüttge U (2000) Photosynthese-Physiotypen unter gleichen Morphotypen, Species und bei
Klonen: Kann ökophysiologische Plastizität zur Entstehung von Diversität beitragen? Ber
Reinhold Tüxen Ges 12:319–334
Lüttge U (2004) Ecophysiology of crassulacean acid metabolism (CAM). Ann Bot 93:629–652
Lüttge U (2005) Genotypes – phenotypes – ecotypes: relations to crassulacean acid metabolism.
Nova Acta Leopoldina 92(342):177–193
Lüttge U (2006) Photosynthetic flexibility and ecophysiological plasticity: questions and lessons
from Clusia, the only CAM tree, in the tropics. New Phytol 171:7–25
236
G.M. Souza and U. Lüttge
Lüttge U (2007a) Clusia: a woody neotropical genus of remarkable plasticity and diversity, vol
194, Ecological studies. Springer, Berlin
Lüttge U (2007b) Photosynthesis. In: Lüttge U (ed) Clusia. A woody neotropical genus of
remarkable plasticity and diversity, vol 194, Ecological studies. Springer, Berlin, pp 135–186
Lüttge U (2007c) Physiological ecology. In: Lüttge U (ed) Clusia. A woody neotropical genus of
remarkable plasticity and diversity, vol 194, Ecological studies. Springer, Berlin, pp 187–234
Lüttge U (2008a) Physiological ecology of tropical plants, 2nd edn. Springer, Heidelberg
Lüttge U (2008b) Clusia: holy grail and enigma. J Exp Bot 59:1503–1514
Lüttge U (2010a) Ability of crassulacean acid metabolism plants to overcome interacting stresses
in tropical environments. AoB Plants 2010. doi:10.1093/aobpla/plq005
Lüttge U (2010b) Plasticity and conservation. Natureza Conservãço 8:120–126
Lüttge U (2012a) Whole-plant physiology: synergistic emergence rather than modularity. Prog
Bot 74:165–190
Lüttge U (2012b) Modularity and emergence: biology’s challenge in understanding life. Plant Biol
14:865–871
Lüttge U (2013) The planet Earth: can it feed nine billion people. Nova Acta Leopoldina 114
(391):345–364
Lüttge U, Higinbotham N (1979) Transport in plants. Springer, New York, NY
Lüttge U, Scarano FR (2004) Ecophysiology. Rev Bras Bot 27:1–10
Lüttge U, Scarano FR (2007) Synecological comparisons sustained by ecophysiological fingerprinting of intrinsic photosynthetic capacity of plants as assessed by measurements of light
response curves. Braz J Bot 30:355–364
Lüttge U, Garbin ML, Scarano FR (2012) Evo-devo-eco and ecological stem species: potential
repair systems in the planetary biosphere crisis. Prog Bot 74:191–212
MacRobbie EAC (1965) The nature of the coupling between light energy and active ion transport
in Nitella translucens. Biochim Biophys Acta 94:64–73
Mahall BE, Callaway RM (1996) Effects of regional origin and genotype on intraspecific root
communication in the desert shrub Ambrosia dumosa (Asteraceae). Am J Bot 83:83–98
Matyssek R, Schnyder H, Elstner E-F, Munch J-C, Pretzsch H, Sandermann H (2002) Growth and
parasite defence in plants: the balance between resource sequestration and retention. Plant Biol
4:133–136
Matyssek R, Agerer R, Ernst D, Munch J-C, Oßwald W, Pretzsch H, Priesack E, Schnyder H,
Treutter D (2005) The plant’s capacity in regulating resource demand. Plant Biol 7:560–580
Matyssek R, Gayler S, zu Castell W, Oßwald W, Ernst D, Pretzsch H, Schnyder H, Munch JC
(2012a) Predictability of plant resource allocation: new theory needed? In: Matyssek R,
Schnyder H, Oßwald W, Ernst D, Munch JC, Pretzsch H (eds) Growth and defence in plants.
Resource allocation at multiple scales, vol 220, Ecological studies. Springer, Heidelberg, pp
433–449
Matyssek R, Koricheva J, Schnyder H, Ernst D, Munch JC, Oßwald W, Pretzsch H (2012b) The
balance between resource sequestration and retention: a challenge in plant science. In:
Matyssek R, Schnyder H, Oßwald W, Ernst D, Munch JC, Pretzsch H (eds) Growth and
defence in plants. Resource allocation at multiple scales, vol 220, Ecological studies. Springer,
Heidelberg, pp 3–24
Matyssek R, Schnyder H, Oßwald W, Ernst D, Munch JC, Pretzsch H (eds) (2012c) Growth and
defence in plants. Resource allocation at multiple scales, vol 220, Ecological studies. Springer,
Heidelberg
Matyssek R, Lüttge U, Rennenberg H (eds) (2013) The alternatives growth and defense: resource
allocation at multiple scales in plants. Nova Acta Leopoldina 114(391):1–369
Maxwell K (2002) Resistance is useful: diurnal patterns of photosynthesis in C3 and crassulacean
acid metabolism epiphytic bromeliads. Funct Plant Biol 29:679–687
May RM, Lloyd AL (2001) Infection dynamics on scale-free networks. Phys Rev E 64(6):066112
Stability as a Phenomenon Emergent from Plasticity–Complexity–Diversity in. . .
237
Mazen AMA (1996) Changes in levels of phosphoenolpyruvte carboxylase with induction of
crassulacean acid metabolism (CAM)-like behavior in the C4 plant Portulaca oleracea.
Physiol Plant 98:111–116
McCann KS (2000) The diversity – stability debate. Nature 405:228–233
McGarigal K, Cushman S, Stafford SG (2000) Multivariate statistics for wildlife ecology research.
Springer, New York, NY
McNeely JA (2004) Nature vs. nurture: managing relationships between forests, agroforestry and
wild biodiversity. Agroforestry Syst 61:155–166
Mitchell E (2009) Complexity: a guided tour. Oxford University Press, New York, NY
Moore BD, Franceschi VR, Cheng S-H, Wu J, Ku MSB (1987) Photosynthetic characteristics of
the C3-C4 intermediate Parthenium hysterophorus. Plant Physiol 85:984–989
Morin X, Fahse L, Scherer-Lorenzen M, Bugmann H (2011) Tree species richness promotes
productivity in temperate forests through strong complementarity between forests. Ecol Lett
14:1211–1219
Nicolis G, Prigogine I (1977) Self-organization in nonequilibrium systems. Wiley, New York, NY
Niklaus PA, Kandeler E, Leadley PW, Schmid B, Tscherko D, Körner C (2001) A link between
plant diversity, elevated CO2 and soil nitrate. Oecologia 127:540–548
Nishio JN, Ting IP (1993) Photosynthetic characteristics of the palisade mesophyll and spongy
mesophyll in the CAM/C4 intermediate plant Peperomia camptotricha. Bot Acta 106:120–125
Novikoff AB (1945) The concept of integrative levels and biology. Science 101:209–215
Novoplansky A (2002) Developmental plasticity in plants: implications of non-cognitive behavior.
Evol Ecol 16:177–188
Novoplansky A (2009) Picking battles wisely: plant behaviour under competition. Plant Cell
Environ 32:726–741
Osmond CB (1978) Crassulacean acid metabolism: a curiosity in context. Ann Rev Plant Physiol
29:379–414
Osmond CB, Ziegler H (1975) Schwere Pflanzen und leichte Pflanzen: Stabile Isotope im
Photosynthesestoffwechsel und in der biochemischen Ökologie. Naturw Rundsch 28:323–328
Oßwald W, Fleischmann F, Treutter D (2012) Host-parasite interactions and trade-offs between
growth- and defence-related metabolism under changing environments. In: Matyssek R,
Schnyder H, Oßwald W, Ernst D, Munch JC, Pretzsch H (eds) Growth and defence in plants.
Resource allocation at multiple scales, vol 220, Ecological studies. Springer, Heidelberg, pp
53–83
Peisker M (1986) Models of carbon metabolism in C3-C4 intermediate plants as applied to the
evolution of C4 photosynthesis. Plant Cell Environ 9:627–635
Pretzsch H (2013) Facilitation and competition in mixed-species forests analyzed along an
ecological gradient. Nova Acta Leopoldina 114(391):159–174
Pretzsch H, Schütze G, Uhl E (2013) Resistance of European tree species to drought stress in
mixed versus pure forests: evidence of stress release by inter-specific facilitation. Plant Biol
15:483–495
Proulx SR, Promislow DEL, Phillips PC (2005) Network thinking in ecology and evolution.
Trends Ecol Evol 20:345–353
Ratajczak R, Richter J, Lüttge U (1994) Adaptation of the tonoplast V-type H+-ATPase of
Mesembryanthemum crystallinum to salt stress, C3-CAM transition and plant age. Plant Cell
Environ 17:1101–1112
Ravasz E, Somera AL, Mongru DA, Oltvai ZN, Barabási AL (2002) Hierarchical organization of
modularity in metabolic networks. Science 297:1551–1555
Raven JA (1967) Light stimulation of active transport in Hydrodictyon africanum. J Gen Physiol
50:1627–1640
Rawsthorne S (1992) C3-C4 intermediate photosynthesis: linking physiology to gene expression.
Plant J 2:267–274
Remmert H (1985) Was geschieht im Klimax-Stadium? Ökologisches Gleichgewicht durch
Mosaik aus desynchronen Zyklen. Naturw 72:505–512
238
G.M. Souza and U. Lüttge
Remmert H (1991) The mosaic cycle of ecosystems, vol 85, Ecological studies. Springer, Berlin
Richards AE, Forrester DI, Bauhus J, Scherer-Lorenzen M (2010) The influence of mixed tree
plantations on the nutrition of individual species: a review. Tree Physiol 30:1192–1208
Rodrigues MA, Freschi L, Pereira PN, Mercier H (2014) Interactions between nutrients and
crassulacean acid metabolism. Prog Bot 75:167–186
Sage RF (2004) Evolution of C4 photosynthesis. New Phytol 161:341–370
Sage RF, McKown AD (2006) Is C4 photosynthesis less phenotypically plastic than C3 photosynthesis? J Exp Bot 57:303–317
Saze H (2008) Epigenetic memory transmission through mitosis and meiosis in plants. Semin Cell
Dev Biol 19:527–536
Scarano FR, Garbin ML (2013) Stem species: plant species that function as regenerating cells of
Gaia. Nova Acta Leopoldina 114(391):317–324
Schenk HJ (2006) Root competition beyond resource depletion. J Ecol 94:725–739
Schenk HJ, Callaway RM, Mahall BE (1999) Spatial root segregation: are plants territorial? Adv
Ecol Res 28:145–180
Scherer-Lorenzen M, Körner C, Schulze ED (eds) (2005) Forest diversity and function. Temperate
and boreal systems, vol 176, Ecological studies. Springer, Berlin
Scherr SJ, McNeely JA (2008) Biodiversity conservation and agricultural sustainability: towards a
new paradigm of ‘ecoagriculture’ landscapes. Phil Trans Roy Soc B Biol Sci 363:477–494
Scherrer D, Bader MKF, Körner C (2011) Drought-sensitivity ranking of deciduous tree species
based on thermal imaging of forest canopies. Agric For Meteorol 151:1632–1640
Schlichting CD, Smith H (2002) Phenotypic plasticity: linking molecular mechanisms with
evolutionary outcomes. Evol Ecol 16:189–211
Schmitt A, Lee HSJ, Lüttge U (1988) The response of the C3-CAM tree, Clusia rosea, to light and
water stress. J Exp Bot 39:1581–1590
Schneider ED, Kay JJ (1994) Life as a manifestation of the second law of thermodynamics.
Mathematical Computation Modeling 19:25–48
Schuster HG (1995) Deterministic chaos. VCH, Weinheim
Schuster P (1998) Evolution in molekularer Auflösung. Ber Abh Berlin-Brandenb Akad Wiss
6:187–215
Smith JAC, Lüttge U (1985) Day-night changes in leaf water relations associated with the rhythm
of crassulacean acid metabolism in Kalanchoë daigremontiana. Planta 163:272–282
Solbrig OT (1994) Plant traits and adaptive strategies: their role in ecosystem function. In: Schulze
E-D, Mooney HA (eds) Biodiversity and ecosystem function, vol 99, Ecological studies.
Springer, Berlin, pp 97–116
Solé RV, Bascompte J (2006) Self-organization in complex ecosystems. Princeton University
Press, Princeton, NJ
Souza GM, de Oliveira RF, Cardoso VJM (2004) Temporal dynamics of stomatal conductance of
plants under water deficit: can homeostasis be improved by more complex dynamics. Arquivos
de Biologia e Tecnologia, Curitiba 47:423–431
Souza GM, Pincus SM, Monteiro JAF (2005) The complexity-stability hypothesis in plant gas
exchange under water deficit. Braz J Plant Physiol 17:363–373
Souza GM, Ribeiro RV, Prado CHBS, Damineli DSC, Sato AM, Oliveira MS (2009) Using
network connectance and autonomy analyses to uncover patterns of photosynthetic responses
in tropical woody species. Ecological Complexity 6:15–26
Spehn EM, Joshi J, Schmid B, Diemer M, Körner C (2000) Above-ground resource use increases
with plant species richness in experimental grassland ecosystems. Funct Ecol 14:326–337
Taybi T, Nimmo HG, Borland AM (2004) Expression of phosphoenolpyruvate carboxylase and
phosphoenolpyruvate carboxylase kinase genes. Implications for genotypic capacity and
phenotypic plasticity in the expression of crassulacean acid metabolism. Plant Physiol
135:587–598
Stability as a Phenomenon Emergent from Plasticity–Complexity–Diversity in. . .
239
Teste FP, Simard SW, Durall DM, Guy RD, Jones MD, Schoonmaker AL (2009) Access to
mycorrhizal networks and roots of trees: importance of seedling survival and resource transfer.
Ecology 90:2808–2822
Thellier M, Lüttge U (2013) Plant memory: a tentative model. Plant Biol 15:1–12
Tilman D (1982) Resource competition and community structure. Princeton University Press,
Princeton, NJ
Tilman D, Reich PB, Knops JMH (2006) Biodiversity and ecosystem stability in a decade-long
grassland experiment. Nature 441:629–632
Treue P (2002) Blut und Bohnen. Der Paradigmenwechsel im Künast-Ministerium ersetzt Wissenschaft durch Okkultismus. Frankfurter Allgemeine Zeitung, 13–03–2002, Nr 61, p 12
Turesson G (1992) The genotypic response of the plant species to the habitat. Hereditas 3:211–350
Ueno O (2011) Structural and biochemical characterization of the C3-C4 intermediate Brassica
gravinae and relatives, with particular reference to cellular distribution of Rubisco. J Exp Bot
62:5347–5355
Vaasen A, Scarano FR, Hampp R (2007) Population biology of different Clusia species in the state
of Rio de Janeiro. In: Lüttge U (ed) Clusia. A woody neotropical genus of remarkable plasticity
and diversity, vol 194, Ecological studies. Springer, Berlin, pp 117–127
van Vuuren MMI, Robinson D, Griffiths BS (1996) Nutrient inflow and root proliferation during
the exploitation of a temporally and spatially discrete source of nitrogen in soil. Plant Soil
178:185–192
Verhoeven KJF, Jansen JJ, van Dijk PJ, Biere A (2010) Stress-induced DNA methylation changes
and their heritability in asexual dandelions. New Phytol 185:1108–1118
Vı́tolo HF, Souza GM, Silveira J (2012) Cross-scale multivariate analysis of physiological
responses to high temperature in two tropical crops with C3 and C4 metabolism. Environ
Exp Bot 80:54–62
Wagner A (2005) Robustness and evolvability in living systems. Princeton University Press,
Princeton, NJ
Weiner CN, Wemer M, Linsenmair KE, Blüthgen N (2011) Land use intensity in grasslands:
changes in biodiversity, species composition and specialisation in flower visitor networks.
Basic Appl Ecol 12:292–299
West-Eberhard MJ (1986) Alternative adaptations, speciation, and phylogeny (a review). Proc
Natl Acad Sci USA 83:1388–1392
West-Eberhard MJ (1989) Phenotypic plasticity and origins of diversity. Ann Rev Ecol Syst
20:249–278
West-Eberhard MJ (2003) Developmental plasticity and evolution. Oxford University Press,
Oxford
Westhoff P, Gowik U (2010) Evolution of C4 photosynthesis – looking for the master switch. Plant
Physiol 154:598–601
Whitmore TC (1990) An introduction to tropical rainforests. Oxford University Press, Oxford
Wikipedia (2011) http://en.wikipedia.org/wiki/Agroecology
Williams DG, Mack RN, Black RA (1995) Ecophysiology of introduced Pennisetum setaceum on
Hawaii – the role of phenotypic plasticity. Ecology 76:1569–1580
Willis AJ, Memmott J, Forrester RI (2000) Is there evidence for the post-invasion evolution of
increased size among plant species. Ecol Lett 3:275–283
Winter K, Holtum JAM (2005) The effects of salinity, crassulacean acid metabolism and plant age
on the carbon isotope composition of Mesembryanthemum crystallinum L., a halophytic
C3-CAM species. Planta 222:201–209
Winter K, Holtum JAM (2007) Environment or development? Lifetime net CO2 exchange and
control of the expression of crassulacean acid metabolism in Mesembryanthemum
crystallinum. Plant Physiol 143:98–107
Winter K, von Willert DJ (1972) NaCl-induzierter Crassulaceensäurestoffwechsel bei Mesembryanthemum crystallinum. Z Pflanzenphysiol 67:166–170
Zhang Y-Y, Fischer M, Colot V, Bosdorf O (2013) Epigenetic variation creates potential for
evolution of plant phenotypic plasticity. New Phytol 197:314–322
The Proposed Anti-herbivory Roles of White
Leaf Variegation
Simcha Lev-Yadun
Contents
1 Introduction . . . . . . . . . . . . . . . . . . . . . . . . . . . . . . . . . . . . . . . . . . . . . . . . . . . . . . . . . . . . . . . . . . . . . . . . . . . . . . . . .
2 White Variegation in Plants: At Least Nine Different Types of Formation . . . . . . . . . . . . . .
3 The Anti-herbivory Role . . . . . . . . . . . . . . . . . . . . . . . . . . . . . . . . . . . . . . . . . . . . . . . . . . . . . . . . . . . . . . . . . . .
3.1 Evidence (Evidence of Defense by Leaf Variegation, Functioning by Unknown
Mechanisms) . . . . . . . . . . . . . . . . . . . . . . . . . . . . . . . . . . . . . . . . . . . . . . . . . . . . . . . . . . . . . . . . . . . . . . . . . .
3.2 The Global Perspective . . . . . . . . . . . . . . . . . . . . . . . . . . . . . . . . . . . . . . . . . . . . . . . . . . . . . . . . . . . . . . .
3.3 Operating Under Stress in Nature Limits the Need for Perfect Defensive
Mechanisms . . . . . . . . . . . . . . . . . . . . . . . . . . . . . . . . . . . . . . . . . . . . . . . . . . . . . . . . . . . . . . . . . . . . . . . . . . .
3.4 Possible Mechanisms . . . . . . . . . . . . . . . . . . . . . . . . . . . . . . . . . . . . . . . . . . . . . . . . . . . . . . . . . . . . . . . . .
4 Problems and Questions . . . . . . . . . . . . . . . . . . . . . . . . . . . . . . . . . . . . . . . . . . . . . . . . . . . . . . . . . . . . . . . . . . . .
4.1 Evaluating Risk: The Problematic and Even Erroneous Common View of “No
Damage or No Attack Equals No Risk” . . . . . . . . . . . . . . . . . . . . . . . . . . . . . . . . . . . . . . . . . . . . .
4.2 Testing the Hypotheses: A Very Complicated Issue . . . . . . . . . . . . . . . . . . . . . . . . . . . . . . . .
4.3 Open Questions . . . . . . . . . . . . . . . . . . . . . . . . . . . . . . . . . . . . . . . . . . . . . . . . . . . . . . . . . . . . . . . . . . . . . . .
5 Conclusions . . . . . . . . . . . . . . . . . . . . . . . . . . . . . . . . . . . . . . . . . . . . . . . . . . . . . . . . . . . . . . . . . . . . . . . . . . . . . . . . .
References . . . . . . . . . . . . . . . . . . . . . . . . . . . . . . . . . . . . . . . . . . . . . . . . . . . . . . . . . . . . . . . . . . . . . . . . . . . . . . . . . . . . . . .
242
243
245
245
245
247
248
259
259
260
261
262
262
Abstract It has been suggested that white variegation, the outcome of various
developmental, genetic, and physiological processes, may defend leaves and other
plant organs from herbivory by several proposed mechanisms: camouflage,
aposematism (including Müllerian and Batesian mimicry), mimicry of insect damage and fungal attacks, dazzle effects that make it hard for large herbivores to
decide where to bite the leaves and for insects to land on them, and by visual
repellence of insects from landing as well as by unknown mechanisms. Very few
cases of these suggested leaf defenses by variegation have been examined in depth.
Some such studied cases were indeed found to actually operate as defense from
S. Lev-Yadun (*)
Department of Biology and Environment, Faculty of Natural Sciences, University of Haifa–
Oranim, Tivon 36006, Israel
e-mail: levyadun@research.haifa.ac.il
© Springer International Publishing Switzerland 2015
U. Lüttge, W. Beyschlag (eds.), Progress in Botany, Progress in Botany 76,
DOI 10.1007/978-3-319-08807-5_10
241
242
S. Lev-Yadun
herbivory either in nature or in experiments, suggesting the potential defensive
function of others. However, the specific operating defensive mechanism by white
variegation was not always identified or even proposed, even when variegation was
found to be associated with reduced herbivory. Studying white variegation has a
significant advantage over studying other types of plant defensive coloration
because even bi-chromatic vision is sufficient to see these patterns. Moreover,
white variegation is probably visible under most types of natural light conditions,
including strong moonlight. While in this essay I wish to stimulate an effort for a
broader and deeper understanding of the defensive roles of white variegation, the
possible simultaneous physiological roles of white leaf variegation that will not be
reviewed here should not be ignored.
1 Introduction
Defensive plant coloration (camouflage, aposematism, mimicry, undermining herbivorous insect camouflage, exploiting animals’ perceptual biases, various types of
signaling) has received very limited attention (e.g., Wiens 1978; Rothschild 1986;
Givnish 1990; Lev-Yadun 2001, 2006a, 2009a; Lev-Yadun et al. 2004a; Archetti
et al. 2009; Schaefer and Ruxton 2011) compared to defensive animal coloration
(e.g., Cott 1940; Kettlewell 1973; Edmunds 1974; Majerus 1998; Ruxton
et al. 2004; Caro 2005). Harper (1977) in his seminal book about plant demography
wrote concerning his view of the potential defensive role of leaf variegation:
“botanists were reluctant to accept things that are commonplace for zoologists
and often seem reluctant to see the animal as a powerful selective force in plant
evolution except in the curiously acceptable realm of adaptation to pollination! It
may be that much of the fantastic variation in leaf form, variegation, dissection, and
marking that is known in the plant kingdom is accounted for by the selective
advantage to the plant of associating nonpalatability with a visual symbol.” This,
however, should be changed, and this essay on the specific issue of white variegation is a continuation of the recent efforts to bridge this gap, reviewed in Lev-Yadun
(2006a, 2009a), Lev-Yadun and Gould (2007, 2009), Archetti et al. (2009) and
Schaefer and Ruxton (2009, 2011). I focus on the potential defensive functions of
white leaf variegation, a well-known morphological phenomenon in thousands of
plant species and thousands of additional white variegated mutants of usually
non-variegated species that have been identified by horticulturists and cloned as
ornamentals. Although outside the scope of this essay, the possible simultaneous
physiological roles of white leaf variegation must always be kept in mind.
Since some of the proposed defensive functions of white variegated leaves
involve mimicry, I cite the two major types (out of a longer list) of plant defensive
mimicry, which certainly do not cover all possible mimicry types used by plants, an
issue also outside the scope of this review. Müllerian mimicry is a phenomenon in
which two or more species with effective defenses share a similar appearance or
The Proposed Anti-herbivory Roles of White Leaf Variegation
243
signaling, thus also sharing and by this reducing the cost of associative learning by
their enemies. Batesian mimicry is a phenomenon in which members of a palatable
species gain protection from predation by resembling an unpalatable or defended
species (Cott 1940; Wickler 1968; Ruxton et al. 2004). There are, however,
intermediate types between these two extremes (e.g., Rowland et al. 2010). Most
of our knowledge about defensive mimicry has emerged from animal studies, and
while even the better-studied animal mimicry systems, like butterfly aposematism
and its Müllerian and Batesian mimicry, are still not fully understood (e.g., Forbes
2009), the level of understanding of the operation of defensive mimicry in plants
and its ecology and evolution is much lower (e.g., Hinton 1973; Wiens 1978;
Lev-Yadun 2009a, b; Schaefer and Ruxton 2009, 2011). The evolution of mimicry
requires a model and a mimic. The model should be another species or a group of
species, or their actions (e.g., release of chemicals or physical damage to other
organisms) (Wickler 1968). Organisms may also mimic a biological or
nonbiological substrate on which they grow as a camouflage against enemies or
to hide from potential prey (Cott 1940; Wickler 1968; Ruxton et al. 2004). Masquerade (close resemblance of inedible and often inanimate objects) (Endler 1981;
Allen and Cooper 1985; Skelhorn et al. 2010a, b) is a related visual defense but not
by crypsis. This character may sometimes initially evolve not for defense but for
physiological reasons like the common light plant coloration that reflects excess
light in coastal or desert environments, resulting (probably as a secondary gain) in
actual substrate mimicry that may potentially also reduce herbivory by camouflage
or by just not being green (Lev-Yadun 2006b; Reeves 2011). Such multifunctional
situations make it difficult to evaluate the relative role of the mimicry in various
morphologies and types of coloration, but may explain the advantages during early
stages of the evolution of such cases (Schaefer and Ruxton 2009). Another significant theoretical problem that was posited recently is the difficulty in distinguishing
between cases in which plants exploit perceptual biases of animals that may by
convergent evolution arrive at a morphology or coloration that just looks like
mimicry but is not a true mimicry (Schaefer and Ruxton 2009). For the convenience
of discussion and because of the very small number of experiments with defensive
plant mimicry, I will refer only to mimicry, because of our current limited ability to
distinguish between the situations of exploitation of perceptual biases of herbivores
by plants, and true mimicry.
2 White Variegation in Plants: At Least Nine Different
Types of Formation
Visually distinct white variegation in leaves or in other organs occurs as the
outcome of one of the nine different currently known possible mechanisms (structural, biochemical, and genetic), which may sometimes partly overlap. In the first,
the epidermis is not attached to the green photosynthetic parenchyma and the air
244
S. Lev-Yadun
Fig. 1 A variegated spiny
leaf of Silybum marianum
from Israel. The very
conspicuous white markings
are the outcome of
sub-epidermal air spaces
spaces thus formed reflect light, resulting in white coloration (Hara 1957; Scarchuk
and Lent 1965; Tsukaya et al. 2004; Fig. 1). In this case the white color does not
result in loss of photosynthetic ability, and the air spaces may even have various
physiological functions (e.g., Konoplyova et al. 2008). The second and related type
of white variegation is formed by the formation of a single loose layer of short
palisade cells instead of a compact layer or two of long palisade cells in the green
sectors of variegated leaves (La Rocca et al. 2011). The third type of variegation is
formed by regulated lack of expression of chlorophyll in certain cell groups
(Lev-Yadun et al. 2004b; Lee 2007). This pattern is usually developmentally
regulated, and in order to distinguish between this type and white variegation
resulting from air spaces, anatomical examination should be conducted. The fourth
type of white variegation results from a genetic chimera, where two cell genotypes,
one expressing chlorophyll and one not, are found in growth apices, and the
incidence of directions and numbers of cell divisions in the apices results in
variegation patterns that may greatly fluctuate from leaf to leaf, or even between
various parts of the same leaf (Tilney-Bassett 1986; Poethig 1987; Evenari 1989).
The fifth type of white variegation results from mutations in which an unbalanced
redox state in the photosynthetic electron transport chain predisposes the chloroplasts to photooxidation, which bleaches them, resulting in variegation (Rosso
et al. 2009). The sixth type of white variegation results from dense groups of
short white spines (glochids in cacti’s areoles) or trichomes in other taxa. The
seventh type of white variegation results from carotenoid cleavage and is common
in flowers (Ohmiya et al. 2006). The eighth type of white variegation is the outcome
of the lack of transcript expression or activity of enzymes of anthocyanin synthesis
(e.g., Kotepong et al. 2011). The ninth type is actually composed of a collection of
various biochemical modifications that alter chloroplast development, structure,
and biochemistry and may overlap types number 3, 4, and 5 (e.g., Aluru et al. 2006;
Yu et al. 2007), many of which could probably be determined as specific variegation types if the mutations that give rise to them were known, but in the vast
majority of variegated genotypes they have not been studied in detail.
The Proposed Anti-herbivory Roles of White Leaf Variegation
245
3 The Anti-herbivory Role
In general, it is important not to overlook the role of vision in finding a host plant by
insects (e.g., Rausher 1978; Prokopy and Owens 1983; Reeves 2011). It has been
proposed that white plant variegation has several defensive (anti-herbivory) functions (Cole 1970; Cahn and Harper 1976a, b; Harper 1977; Wiens 1978; Niemelä
et al. 1984; Smith 1986; Givnish 1990; Allen and Knill 1991; Brown et al. 1991;
Lev-Yadun 2001, 2003a, 2006a, 2009a, b, c, 2013, 2014; Cole and Cole 2005; Lee
2007; Campitelli et al. 2008; Wilkinson and Sherratt 2008; Soltau et al. 2009;
Skelhorn et al. 2010a; Yamazaki 2010; Zheng et al. 2010; Schaefer and Ruxton
2011) (Table 1) and these hypotheses, along with several new hypotheses proposed
here will be described and discussed below.
3.1
Evidence (Evidence of Defense by Leaf Variegation,
Functioning by Unknown Mechanisms)
Several studies showed that white leaf variegation is associated with lower herbivory, but without proposing a defensive mechanism. Cahn and Harper (1976a)
showed that the frequency of variegated leaves in Trifolium repens L. decreased
with increasing grass length and concluded that this was related to grazing. Later,
Cahn and Harper (1976b) showed in a field experiment with rumen-fistulated sheep
(which enabled sampling of what had just been grazed) that non-variegated leaves
of T. repens were clearly preferred over variegated ones. Shifriss (1981) found that
Cucurbita L. plants with silvery leaves are better protected from insect-transmitted
virus infections. Similarly, Campitelli et al. (2008) showed that leaf variegation is
associated with reduced herbivore damage in Hydrophyllum virginianum L.,
although the actual defensive mechanism is not known. Zheng et al. (2010) induced
white leaf variegation by disruption of carotenoid biosynthesis in transgenes and
found that Pieris rapae L. butterflies have an innate ability to visually discriminate
between green and variegated plants, preferring the non-variegated type. Moreover,
their caterpillars grew less when fed on variegated plants compared to those fed on
the green ones.
3.2
The Global Perspective
If white leaf variegation has several defensive roles, then it should be more
widespread in ecosystems with historically strong grazing or insect herbivory
pressure than in areas with a lower level of herbivory, a question that must be
studied with a global perspective. It is well known that defense by sharp appendages
(thorns, spines, and prickles) is more common in hot arid regions (Grubb 1992;
246
S. Lev-Yadun
Table 1 Various previous hypotheses for defense from herbivory via white variegation
Proposed
defensive
mechanism
Camouflage
Masquerade
Mimicry of
tunneling
Mimicry of bird
droppings
Aposematism
Deterring insect
landing
Dazzle effect
Diverting herbivores away
from green
tissuesa
Comments
References
Lithops sp., South African
deserts
Cole (1970); Cole and Cole (2005);
Wilkinson and Sherratt (2008);
Schaefer and Ruxton (2011)
Givnish (1990); Allen and Knill (1991)
Understory herbs in New
England forests
Unripe fleshy fruits
Lithops sp., South African
deserts
Smilax aspera in understory
Vine species Byttneria aculeata
General note
Silybum marianum
Various species
Caladium steudneriifolium
(Including experiments)
Theoretical discussion
Various species
Leaf variegation in many
species
Many species belonging to
cacti, Euphorbia, Aloe, wild
plants in Israel
Unripe fleshy fruits
Müllerian and Batesian
mimicry
Silybum marianum
Silybum marianum
Various plants
Acer pseudoplatanus
Lev-Yadun (2013)
Skelhorn et al. (2010a)
Lev-Yadun (2009b)
Smith (1986)a
Brown et al. (1991)
Lev-Yadun (2003a, 2006a, 2009a, b)
Lee (2007)
Soltau et al. (2009)b
Schaefer and Ruxton (2011)
Yamazaki (2010)
Yamazaki (2010)
Harper (1977); Wiens (1978)
Lev-Yadun (2001, 2003a, 2006a,
2009a, b, c)
Lev-Yadun (2013)
Lev-Yadun (2003a, 2006a, 2009a, b, c)
Lev-Yadun (2003a, 2006a, 2009a)
Lev-Yadun (2003a, 2006a, 2009a)
Lev-Yadun (2014)
Niemelä et al. (1984)
(continued)
The Proposed Anti-herbivory Roles of White Leaf Variegation
247
Table 1 (continued)
Proposed
defensive
mechanism
Unexplained
defense
Mimicry of insect
eggs
Comments
Trifolium repens, a field experiment with rumen-fistulated
sheep
General comment
Hydrophyllum virginianum
reduced herbivore damage
in variegated morph
Variegation in transgenic plants
Broad theoretical discussions
Unripe fleshy fruits
References
Cahn and Harper (1976a, b)a
Harper (1977)
Campitelli et al. (2008)a
Zheng et al. (2010)a
Schaefer and Ruxton (2011)
Lev-Yadun (2013)
a
Found to operate
Found to operate and the type of defensive mechanism examined
b
Lev-Yadun 2001; Ronel et al. 2010; Ronel and Lev-Yadun 2012). This trend is in
accordance with the general pattern of stronger anti-herbivory defense found in
slow-growing plants in habitats with limited resources (McKey et al. 1978; Coley
et al. 1985; Endara and Coley 2011). Within the milkweeds (Asclepias spp. L.)
there is a clear geographical gradient in defense by cardenolides, with species from
lower latitudes better defended and with higher inducible and greater diversity and
stronger toxicity (Rasmann and Agrawal 2011), a pattern also true for aposematic
coloration in animals (Schemske et al. 2009). While it is impossible for a single
person to examine in depth the flora of the entire world, I conducted field surveys to
compare the heavily grazed arid Near East with the floras of several temperate and
even boreal countries (Canada, Estonia, Finland, Sweden, Norway, and Russia),
each of which has different assemblages of local plant and animal taxa, and all with
a much lower current and historical grazing impact than in the hot and arid Near
East. The field work I conducted in the temperate and boreal regions clearly
indicated a dramatically lower level of spininess in these ecosystems, along with
much lower levels of genuine white leaf variegation. Thus, the geographical
distribution of white leaf variegation supports (but does not prove) the various
hypotheses of the probable common anti-herbivory functions of white leaf variegation discussed above.
3.3
Operating Under Stress in Nature Limits the Need
for Perfect Defensive Mechanisms
Herbivores, which are usually not well defended against fierce carnivores at close
range, operate under various risks (see Brown 1999; Preisser 2009; Sheriff
et al. 2009; Hawlena and Schmitz 2010; Embar et al. 2011). Thus, part of the
248
S. Lev-Yadun
attention of herbivorous animals is always drawn away from their prey, the plants,
and this helps the defending plants that have evolved characters that add various
visual difficulties that prolong the time needed for decision making, thus exploiting
for defense the herbivore’s limited attention (Jones et al. 2006). Staying for a long
time in one place to graze, browse, or collect seeds increases the risks of predation.
If an herbivore has to spend a longer time in searching or decision making because
of a plant’s defensive coloration, it may increase the risk of herbivore predation,
sometimes making it safer to skip the problematic plants altogether. Accumulating
evidence shows that the risk of predation is so significant that it influences herbivore activity in ways that may even change vegetation structure (e.g., Pfister
et al. 1990; Terlouw et al. 1998; Brown and Kotler 2004; Ripple and Beschta
2004). I propose that various types of plant coloration, including white variegation,
may operate in this way because they result in certain cases in a longer foraging and
decision-making time by the herbivores compared to plants without these types of
visual defenses.
3.4
3.4.1
Possible Mechanisms
Aposematism
Mechanical (Thorns, Spines, Prickles)
Wiens (1978), in the first review ever to discuss many aspects of defensive plant
mimicry, proposed in brief that leaf variegation might be aposematic and that it
should be examined for aposematic effects and for possible mimicry by
non-protected associated plants. Lev-Yadun (2001) proposed that in many spiny
taxa (e.g., over 1,000 species of cacti, Agave L., Aloe L., and Euphorbia L.) white
variegation and other white markings along with various other color patterns
contribute to the putative aposematic signals of these plants. Lev-Yadun (2003a)
proposed that not only the conspicuous white variegation of the very spiny annual
species of open Mediterranean habitats, Silybum marianum (L.) Gaertner, a member of the Asteraceae, but also two related spiny and white variegated species
(Notobasis syriaca (L.) Cass. and Scolymus maculatus L.), which resemble
“green zebras” with their alternating white and dark bands, are visually aposematic.
In Silybum marianum the widths of typical variegation bands correlate highly with
the length of the longest spines at leaf margins and the number of spines along leaf
circumference. The zebra-like white variegation has thus been proposed to be a
special case of aposematic coloration, although other defensive and physiological
functions of this variegation were also proposed to operate simultaneously
(Lev-Yadun 2003a, 2006a, 2009a, b, c, 2011, 2014). Interestingly, many spiny
animals, including both invertebrates and vertebrates of both terrestrial and aquatic
habitats, have colorful or contrasting black and white spines (Cott 1940; Inbar and
Lev-Yadun 2005; Caro 2009).
The Proposed Anti-herbivory Roles of White Leaf Variegation
249
The Near East, the cradle of Old World agriculture (e.g., Zohary et al. 2012;
Lev-Yadun et al. 2000), which included large-scale herding, has witnessed a very
long history of intense grazing that selected for various anti-herbivory defenses
(Zohary 1962, 1973, 1983; Ronel et al. 2009, 2010; Ronel and Lev-Yadun 2009,
2012). The preagricultural grazing impact during the Pleistocene by large mammals
that thrived in the region lasted more than two million years during the Pleistocene
(e.g., Tchernov 1979; Davis 1987; Bar-Oz 2004; Steiner 2005), probably also for
millions of years already in the Tertiary. The long history of intensive grazing in the
Near East has selected for plants that are better protected and resilient and thus
suffer less from grazing, and induced an increase in their proportion practically
everywhere (Zohary 1962, 1983; Noy-Meir et al. 1989; Perevolotsky and Seligman
1998; Nassar and Lev-Yadun 2009; Ronel et al. 2009, 2010; Ronel and Lev-Yadun
2012). Out of more than 20 spiny species with white-variegated leaves in the flora
of Israel (Lev-Yadun 2009b), the most conspicuous white-variegated leaves are
found in the three very spiny annual plants (Silybum marianum, Notobasis syriaca,
and Scolymus maculatus). These three species are among the most common tall
annuals that survive very strong mammalian grazing pressures and are especially
common along unpaved field roads, where large numbers of cattle, sheep, and goats
pass by, and their dry plant skeletons remain intact during the summer in rangelands
when most other nonwoody plants are grazed to the roots. Their abundance under
strong grazing pressure is excellent evidence of their very strong defensive character, and they serve as a natural experiment for the probable defensive role of their
spines combined with conspicuousness (Lev-Yadun 2003a, 2006a, 2009a, b, c,
2011, 2014; Ronel and Lev-Yadun 2012). Of course, additional defensive mechanisms may be involved, as it has been found that the very spiny S. marianum
produces pyrazine, which probably functions as olfactory aposematism (Rothschild
and Moore 1987) and because the variegation may mimic leaf infestation or be
involved in other types of defense (Lev-Yadun 2003a, 2009b, 2014).
The defensive potential of white variegation was further studied in spiny, thorny,
prickly, and white variegated plants in relation to their potential aposematism, and
the existence of Müllerian and Batesian mimicry rings of such plants has been
proposed (Lev-Yadun 2003a, 2009a, b, c). Lev-Yadun (2009b) compiled the
information on geographical distribution of 21 wild, spiny plant species in the
flora of Israel that have white-variegated leaves. The general overlapping geographical distribution and the overlapping of specific habitats of many of these species
and also that of the relevant large wild and domesticated mammalian herbivores
that have fed on them for millennia indicate that they probably form Müllerian
mimicry rings. Moreover, in the members of the genus Launaea Cass. (Asteraceae)
growing in Israel and elsewhere in the Near East, there are several species that are
both white variegated and spiny or thorny (a defended Müllerian mimicry ring), and
four non-thorny but variegated plants (a Batesian mimicry ring). The latter may
mimic both other thorny and spiny Launaea species as well as spiny variegated
species belonging to other taxa with an overlapping distribution.
Symmetry has been proposed to increase the efficiency of visual aposematic
displays in animals (Forsmann and Merilaita 1999; Forsman and Herrström 2004),
250
S. Lev-Yadun
and Lev-Yadun (2011) suggested that it may also be true for many aposematic
spiny or poisonous plants, including those with white variegation, for instance both
the spiny leaf rosettes and flowering heads of S. marianum, N. syriaca, and
S. maculatus.
Micro-mechanical and Biochemical (Raphids, Toxins, Bacteria)
While the potential aposematic coloration of spiny plants has received significant
recent attention (Lev-Yadun 2001, 2003a, b, 2006a, 2009a, b, c, 2011; Midgley
et al. 2001; Lev-Yadun and Ne’eman 2004, 2006; Midgley 2004; Rubino and
McCarthy 2004; Ruxton et al. 2004; Speed and Ruxton 2005; Halpern
et al. 2007a, b, 2011; Lev-Yadun and Halpern 2008; Fadzly et al. 2009;
Lev-Yadun and Gould 2009; Lev-Yadun et al. 2009; Ronel et al. 2009, 2010;
Burns 2010; Fadzly and Burns 2010; Schaefer and Ruxton 2011; Ronel and
Lev-Yadun 2012), the potential aposematism of poisonous plants forming internal
spines (raphids—microscopic needles made of calcium oxalate) has received much
less attention (Lev-Yadun and Halpern 2008; Lev-Yadun 2009a; Halpern
et al. 2011). Thousands of plant species belonging to many families, including
many white and otherwise variegated species, produce raphids with or without
associated toxins (Franceschi and Horner 1980). Raphids are always elongated,
needle-shaped, and have two sharp pointed ends. Raphids are usually formed in
specific parenchymatic cells that differ from their neighboring cells and are called
idioblasts. The raphids are formed in idioblasts in large numbers and are packed
compactly, aligned parallel to each other, but spread when the tissue is wounded
(Fahn 1990). Because of their small size, raphids can internally wound the mouth
and digestive system not only of large vertebrate herbivores but also of insects and
other small herbivores that manage to avoid thorns, spines, and prickles by passing
between them.
The physical wounding of the herbivores by the sharp-ended raphids is not the
whole story. Studies conducted with a scanning electron microscope have revealed
that in many cases, the raphids may be barbed or may have deep grooves running
along them. The grooves serve as channels through which plant toxins are introduced into the tissues of the herbivores (Sakai et al. 1972; Franceschi and Horner
1980) in a way resembling the action of hollow fangs of venomous snakes.
Moreover, Lev-Yadun and Halpern (2008) and Halpern et al. (2011) proposed
that pathogenic bacteria and fungi found on the plant surfaces and within the
herbivore’s digestive system may also enter the herbivore’s body through these
microscopic wounds and either operate in parallel to plant toxins or independently.
These potentially severe and even lethal consequences of spines and raphids of
white variegated leaves strengthen the honesty of the proposed aposematic signals
of white variegation (Lev-Yadun and Halpern 2008; Lev-Yadun 2009a; Halpern
et al. 2011).
Here I use the case of the poisonous American genus Dieffenbachia Schott to
demonstrate the probably broad, but overlooked phenomenon of association and
The Proposed Anti-herbivory Roles of White Leaf Variegation
251
mutual defensive function of raphids and white (as well as nonwhite) leaf variegation. Leaves of wild members of the genus Dieffenbachia growing in the forests of
Central and South America are typically variegated in white (Lee 2007). The plants
are well defended from herbivores by the large amounts of sharp grooved raphids
that, in addition to wounding, administer various plant toxins into the wounded
tissues of the herbivores (or humans) that eat them (Arditti and Rodriguez 1982;
Evans 1987; Gardner 1994; Bradbury and Nixon 1998). The combination of visual
conspicuousness with unpalatability in the genus Dieffenbachia points to the
probable aposematic effect of their leaf variegation. Interestingly, studies on field
behavior of herbivores such as Dorcas gazelles (Gazelle dorcas L.) have shown that
they specifically avoid plant tissues containing raphids (Ward et al. 1997; Salts and
Ward 2000).
I propose that a broad comparative taxonomic study should be conducted to
examine whether there is a nonrandom association of white- or colorful variegated
leaves with the formation of raphids and possibly also with toxins. Comparing
variegated and non-variegated species of various genera, or genera within families,
or of various genotypes of species found in areas that significantly differ in
herbivory pressure, is required in order to test the generality of this hypothesis.
Mixed Defensive Strategies in Plants with White Variegated Leaves
Because visual anti-herbivory defenses in plants have not been studied much, it is
no surprise that there are only meager data or even untested hypotheses on mixed
defensive strategies related to plants with white variegated leaves. The best
described case seems to be that of the variegated Mary’s thistle (Silybum
marianum). Rothschild and Moore (1987) proposed that S. marianum uses olfactory
aposematism via pyrazine. Later, Lev-Yadun (2003a, 2009b, 2011) proposed that
the very conspicuous white variegation of this very spiny annual species of open
habitats is a special case of aposematic coloration. Since spines in other species
sharing its habitat harbor pathogenic bacteria that can defend plants from herbivores (Halpern et al. 2007a, b, 2011), there is no reason to assume that the spines of
S. marianum are free of such bacteria. This adds to the significance of its physically
based spine aposematism (see Halpern et al. 2007a, 2011). It is thus likely that in
this species two types of aposematism (visual and olfactory) operate simultaneously, possibly towards different herbivores and simultaneously with other
types of defense (Lev-Yadun 2003a, 2009a). Moreover, S. marianum, being a
ruderal plant, sometimes accumulates large amounts of nitrate (like many other
plant species), to a level making it toxic to large mammalian herbivores, killing
cattle, sheep, and horses that consume these plants (Kendrick et al. 1955), thus
adding to the other types of aposematism in this species, a potential chemically
based one. In addition to the above, it has been proposed that S. marianum is also
visually defended by tunneling mimicry, by dazzle effects, and by reducing the
tendency of insect to land on its variegated leaves (Lev-Yadun 2003a, 2014). Thus,
the fact that both olfactory and visual (possibly not only in the visible light but also
252
S. Lev-Yadun
in the U.V.) aposematism, or other defense mechanisms, both known and as yet
unknown, may be involved in the defense of white variegated leaves and other
variegated plant parts should always be kept in mind.
Toxic White Variegated Leaves
Since some of the plants with leaves variegated in white (or with other colors) (e.g.,
Cyclamen spp. L. and certain Trifolium spp. L. and Medicago spp. L.) may be
poisonous, because Cyclamen species are known to be rich in alkaloids and
saponins (Hornell 1941; Reznicek et al. 1989), and because there are cyanogenic
types in Trifolium spp. and Medicago spp. (Crawford-Sidebotham 1972; Dirzo and
Harper 1982), visual aposematism of such variegated leaves should be considered
(see Lev-Yadun 2009a, 2013). Müllerian and Batesian mimicry rings are expected
to exist in such cases.
3.4.2
Mimicry
Insect Tunneling Damage Mimicry
Insect damage mimicry, especially of tunneling, was the first specific ecological
hypothesis that tried to explain the evolution and ecology of white leaf variegation.
The first to discuss in detail white leaf variegation in the context of possible
aposematism was Smith (1986), and while he rejected the aposematic hypothesis
for the species (Byttneria aculeata Jacq.) he studied, he gave a clear and detailed
formulation of the aposematic hypothesis for poisonous plants: “The benefits to the
plant of chemical defense against herbivores would be greater if herbivores avoided
such plants altogether, rather than testing leaves for palatability, and so causing
some damage. A distinct leaf color pattern linked with chemical defense might
function in this way. Polymorphism for leaf color should then coincide with polymorphisms for chemical defense. Müllerian and Batesian mimicry could result in
evolution of similar patterns of variegation, with or without associated toxicity,
among other species which have herbivore species in common with the model
species.” Mimicry of tunneling insect damage was also one of the several types of
proposed defensive functions of white leaf variegation of Silybum marianum
(Lev-Yadun 2003a), making it look as if it were already infested to prevent further
insect attacks. Originally, this was the first potential defensive function of the
variegation of this species that I thought about, but later, aposematism took priority
because the three annual plant species of the Near Eastern flora that express this
morphology to the highest extent (Silybum marianum, Notobasis syriaca, and
Scolymus maculatus) are all very spiny (Lev-Yadun 2003a, 2006a, 2009a, b, c,
2011). Lee (2007) also proposed that certain types of white variegation may serve
as a defense by mimicking leaf infestation. Soltau et al. (2009) experimentally
manipulated the visual appearance of Caladium steudneriifolium Engl. (Araceae),
The Proposed Anti-herbivory Roles of White Leaf Variegation
253
an understory plant from the Podocarpus National Park in South East Ecuador
plants by painting artificial white variegation on non-variegated green leaves. The
leaves of C. steudneriifolium are either plain green or patterned with whitish
variegation. In nature, about a third of the leaves are variegated and both morphs
are frequently attacked by mining moth caterpillars. The variegated zones of the
leaves strongly resemble recent mining damage and was hypothesized to mimic
recent mining attacks. Infestation was found to be 4–12 times higher in plain green
leaves than for variegated ones. They studied the level of herbivore damage and
showed that painting artificial white variegation on plain green leaves resulted in
reduced attacks from 7.88 % to 0.41 %, leading them to propose that the variegation
is probably the mimicry of mining damage to deter ovipositing moths (Soltau
et al. 2009). Yamazaki (2010) also proposed that tunneling damage in the form of
white variegation may deter herbivores.
There is solid evidence that plants infested by insects are avoided by various
other insects because of several risks: cannibalism or interspecific predation,
competition, induction of host defensive mechanisms that reduce its palatability
and increase its toxicity, and in the case of leaves, flowers, fruits, and young
branches, also the risk of organ shed (habitat destruction) (e.g., Addicott 1982;
Lev-Yadun and Gould 2007; Karban 2007; Yamazaki 2010; Schaefer and Ruxton
2011). The common phenomenon that wounded leaves signal via odor to attract
predators and parasitoids (e.g., Kessler and Baldwin 2001; De Moraes et al. 2001;
Kappers et al. 2005) should also be considered. For instance, Finch and Jones
(1989) reported that large colonies of the cabbage aphid Brevicoryne brassicae
L. and the peach aphid Myzus presicae Sulzer deter ovipositing by the root fly Delia
radicum L. Inbar et al. (1999) demonstrated that homopterans (whiteflies) not only
alter adult cabbage looper (Trichoplusia ni Hübner) host selection but also actually
reduce the feeding efficiency of their offspring. Thus, variegation that mimics
herbivore damage might serve as mimicry of an already infected leaf and deter
female insects from laying eggs (see Smith 1986; Soltau et al. 2009).
Bird Droppings Mimicry
One of the known masquerade types in animals is the mimicry of bird droppings
(Wickler 1968; Skelhorn et al. 2010c). Yamazaki (2010) proposed that some
tunneling damage in leaves may reduce herbivory because it mimics bird droppings. I propose that various types of leaf variegation should be compared visually
(including their U.V. spectra) to actual bird droppings and that the possibility of
bird dropping mimicry by variegated plants should be examined in much more
detail. Because bird droppings may contain both parasites and pathogenic bacteria,
and because white variegation may look like bird droppings, this may be a basis for
some of the defense provided by white variegation.
254
S. Lev-Yadun
Fig. 2 A variegated leaf of
Acer pseudoplatanus from
Turku (Finland)
3.4.3
Mimicry of Fungal Attacks
In many cases white leaf variegation visually mimics fungal attacks to such an
extent that only a close and careful examination allows us to distinguish between
them. Fungal attack mimicry by white variegation has the potential of being
ecologically important. Lev-Yadun (2006b) described and discussed the potential
mimicry of fungal infestation by whitish-colored leaves. I found many leaves were
mottled by white fungal hyphae in the flora of the Near East; in Central, Northern,
and Eastern Europe; as well as in North America. Since white leaf variegation
(Fig. 2) looks in many cases like fungal colonies on leaves, it is logical to propose
that it may mimic fungal attacks. The question is why should herbivores refrain
from consuming plant tissues infested with fungi? The answer seems to be clear:
many fungi produce toxic chemicals that in many cases are known to defend their
hosts from herbivory. Fungal endophyte-mediated alkaloids provide the basis for
the acquired chemical defense against herbivory (Porter 1994; Justus et al. 1997;
Saikkonen et al. 1998; Lev-Yadun and Halpern 2007) and recent field data support
the aposematic function of ergot mutualism in Festuca rubra L. plants in grazed
areas in Finland (Wäli et al. 2013). Moreover, leaves attacked by fungi may have
lower palatability for various other reasons, since the attacks induce various
defensive mechanisms and because some of their nutritive resources have already
been exploited by the fungi. There are very good indications that plant parts that
may be infested by fungi are rejected by herbivorous animals. Frugivores, for
instance, regularly avoid eating damaged fruits, especially large ones (Janzen
1977; Herrera 1982; Manzur and Courtney 1984; Borowicz 1988; Buchholz and
Levey 1990). Lev-Yadun (2006b) therefore proposed that certain white plant
surfaces may mimic fungal-infested plants and that this character may reduce the
tendency of herbivores to consume such plants.
The Proposed Anti-herbivory Roles of White Leaf Variegation
3.4.4
255
Camouflage
Plant camouflage has received only marginal, almost anecdotal treatment. After
many years of neglect, this aspect of visual plant defense has recently been both
discussed and examined (Lev-Yadun 2006a, b; Fadzly et al. 2009; Klooster
et al. 2009; Burns 2010; Fadzly and Burns 2010; Schaefer and Ruxton 2011;
Lev-Yadun and Ne’eman 2013; La Rocca et al. 2014), but there is a clear need to
conduct many more studies on defense from herbivory by camouflage in plants, like
the many studies done with animals (e.g., Cott 1940; Edmunds 1974; Merilaita
1998; Ruxton et al. 2004; Caro 2005; Cuthill et al. 2005; Schaefer and Stobbe 2006;
Stevens et al. 2006).
Cole (1970) and later Cole and Cole (2005) clearly described how difficult it is to
identify in the field the camouflaged plants of various Lithops N. E. Br. species,
which are variegated in various shades including white, among the gravel that
covers the soil in the arid South African regions where they grow. Lithops species
are found in open arid regions, where the light is strong and evenly distributed.
Schaefer and Ruxton (2011) noted that even this apparent case of putative plant
camouflage was not examined experimentally. However, a different hypothesis,
about the defensive role via camouflage, has been proposed for various types of leaf
variegation, including white, for herbs that occupy the forest understory where sun
flecks are common. Givnish (1990) proposed that camouflage from color-blind
vertebrate herbivores is the major selective agent for their commonly variegated
leaves. Givnish’s hypothesis was positively discussed by Allen and Knill (1991),
but as with many aspects of plant camouflage it was not pursued further. Blanco and
Martén-Rodrı́guez (2007) also proposed that colorful variegation in understory
palm leaves may be a type of disruptive coloration, camouflaging them from
large color-blind herbivores. A similar hypothesis concerning a possible role in
camouflage (and in other defensive and physiological functions) of white variegation in green, unripe fleshy fruits was recently proposed (Lev-Yadun 2013).
At first glance, Givnish’s (1990) hypothesis, i.e., that white variegation serves as
camouflage, may seem to oppose that of the aposematic or dazzle hypotheses of leaf
variegation (e.g., Lev-Yadun 2003a, 2009b, 2014), but since Givnish studied
understory species growing in a habitat characterized by sun flecks, and
aposematism of spiny plants or dazzle effects by white variegation was proposed
for plants growing in open and well-illuminated areas (Lev-Yadun 2001, 2003a,
2009a, b, c, 2014), there is no contradiction. Thus, white leaf mottling (Fig. 3) can
probably act both as camouflage in forest undergrowth, and as a conspicuous
aposematic or dazzle coloration, in open, well-illuminated areas.
3.4.5
Masquerade
Masquerade (close resemblance to common inedible and inanimate objects) has
been proposed to operate in Lithops species (Skelhorn et al. 2010a). Since this
256
S. Lev-Yadun
Fig. 3 Variegated leaves
that make it hard to identify
their shape, in a collection
of variegated species in the
greenhouses in Edmonton,
Canada
character was commonly considered as camouflage or mimicry (Skelhorn
et al. 2010a), it is premature to discuss it in depth, but further research of this
strategy in plants in general, and in variegated ones in particular, is certainly
needed. Wiens (1978) mentioned several types of plant camouflage that according
to their description fit the classification of masquerade even though they were not
classified as such since the theoretical interest in masquerade as defense for animals
and plants is very recent.
3.4.6
Visual Deterrence of Insect Landing
The best known (although still very far from both a good understanding and from a
general acceptance of the hypothesis) case for which variegation (alternating dark
and light bands) has been proposed to defend an organism is that of the zebra.
Ortolani (1999) reviewed many old references concerning the putative functions of
zebra stripes and stated that there is a considerable disagreement on the function of
zebra stripes. The only hypothesis (out of several) for the defensive function of
zebra stripes that was tested experimentally was that of reducing tsetse fly landing
as the potential selective force for the evolution of zebra stripes (Waage 1981;
Brady and Shereni 1988; Doku and Brady 1989; Gibson 1992). Ruxton (2002), who
specifically reviewed the hypotheses concerning the potential defensive role of
zebra stripes, concluded that the tsetse fly landing as the selective force for the
evolution of zebra stripes was not proved, and Caro (2009) was strongly negative
towards this possible defensive adaptation in zebras. The recent detailed experimental study (Egri et al. 2012) of the role of zebra stripes in horsefly (tabanids)
repellence seems to give very strong indications that such patterns indeed function
in insect repellence. This, however, does not negate other simultaneous functions of
such coloration. Concerning the zebra-like coloration of Silybum marianum and
other very spiny Mediterranean plant species, Lev-Yadun (2003a) proposed that
reducing insect landing on the leaves in general may be one of several reasons for
the evolution of this type of variegation. If indeed deterrence of insect landing
The Proposed Anti-herbivory Roles of White Leaf Variegation
257
operates when variegation in the form of light and dark bands exists, and this can be
convincingly demonstrated, I propose it to be a case of exploitation of perceptual
biases of herbivores sensu Schaefer and Ruxton (2009).
Although I think that the aposematic hypothesis and some physiological gains
(which are under study in Silybum marianum) are the most significant explanations
for zebra-like white plant variegation, there is no theoretical reason for not considering insect deterrence as a potential partial benefit of this unusual morphology.
3.4.7
Potential Defense by Dazzle Effects of White Leaf Variegation
Zebra-like white leaf variegation was first just proposed (with no broad and deep
theoretical discussion) to serve as defensive dazzle coloration (sensu Wilkinson
1969) for the white-variegated Mediterranean annuals Silybum marianum,
Notobasis syriaca, and Scolymus maculatus (Lev-Yadun 2003a, 2006a, 2009a, b).
Recently, the theoretical basis was discussed in detail and it was proposed that this
hypothesis can be extended to various species belonging to the genera Haworthia
Duval, Gasteria Duval, and Sansevieria Thunb., which also have species with
zebra-like white leaf variegation, and to any other plant taxa with such coloration
(Lev-Yadun 2014). Such plants actually have classic dazzle coloration very similar
to what was applied to naval vessels [compare photographs of the French cruiser
Gloire in Williams (2001) or on the Internet, and other photographs in Wilkinson
(1969), and Stanley (1998), with those in Lev-Yadun (2003a)]. The swaying of the
leaves in the wind and the relative movements of plants in respect to flying insects
or following the head movements of large herbivores approaching the plants
increase the potential to form the desired dazzle effects on the visual nerve systems
of the herbivores, which will make it difficult for them to land on or bite the leaf
because of problems in locating its actual position in space. As with many other
types of proposed defensive leaf variegation, dazzle effects by plants have not been
studied experimentally.
Theoretically, coloration that produces an illusion of a different leaf shape may
also cause identification problems for insects that search for specific leaf types or
leaf developmental stages, as proposed for insects’ search images for other leaf
morphologies (e.g., Rausher 1978; Prokopy and Owens 1983; Mackay and Jones
1989; Brown et al. 1991; Reeves 2011).
3.4.8
White Sectors in Variegated Leaves as a Herbivore Diversion
from Green Sectors
Niemelä et al. (1984) found selective herbivory on mosaic leaves of white variegated Acer pseudoplatanus L. They showed that in such variegated leaves, insect
herbivores favored white areas over mixed and green areas. In A. pseudoplatanus
this preference correlated well with the chemical properties of white areas that
contained more nutrients and less defensive phenolic compounds. This chemical
258
S. Lev-Yadun
evidence was sufficient to explain the increased herbivory in the white sectors of
A. pseudoplatanus leaves. However, I rephrase the explanation, taking the plant’s
point of view, that while the white sectors of the leaves suffer higher herbivory, the
more productive green parts suffer less, and thus the white islands in this case
practically serve as traps for the insects. Lüttge (1997) proposed this hypothesis
concerning young colorful leaves that are common in tropical forests, which
according to his hypothesis may attract herbivores and divert them from the more
costly and productive older and green ones. In any case, a broad comparative
chemical analysis of defensive substances in white versus green leaf parts of
many variegated species is certainly needed in order to see if, how frequently and
to what extent they differ in their defensive and nutritive potentials, but this has not
been done.
3.4.9
White Leaf Variegation: Camouflage Versus Aposematism
In plants growing in open, well-illuminated habitats the white markings are conspicuous, especially where the marks are large and patterned like zebras, i.e., in the
three common Mediterranean spiny annual rosettes of the Asteraceae (Silybum
marianum, Notobasis syriaca, and Scolymus maculatus) that were proposed to be
aposematic (Lev-Yadun 2003a, 2009b). This conclusion seems at first glance to
oppose that of Givnish (1990), i.e., that white variegation (as well as of other
variegation colors) serves as camouflage, but since Givnish studied understory
species growing in a habitat characterized by dark areas interrupted by sun flecks,
there is no contradiction. Thus, white mottling can act as camouflage in undergrowth in the forest and probably also within the canopy (see Lev-Yadun 2013) and
as a conspicuous aposematic coloration in open, well-illuminated areas. Similar
different habitat- and herbivore-specific functions may exist in Cyclamen spp.
leaves. The white variegated and toxic leaves of Cyclamen spp. may serve as
camouflage in the understory sensu Givnish (1990), or as dazzling under any type
of illumination (e.g., Lev-Yadun 2014), and also as aposematic coloration, especially in well-illuminated habitats. The common Cyclamen species found in Israel
(C. persicum Miller) grows in both the understory and in open areas. The camouflage function of variegated Cyclamen leaves may also operate in open habitats
since many frogs and toads, including the two local toads Bufo viridis Laurenti and
Pelobates syriacus Boettger, use color patterns resembling those of Cyclamen spp.
leaves as camouflage (e.g., for frog camouflage see Osorio and Srinivasan 1991).
The Proposed Anti-herbivory Roles of White Leaf Variegation
259
4 Problems and Questions
4.1
Evaluating Risk: The Problematic and Even Erroneous
Common View of “No Damage or No Attack Equals No
Risk”
A theoretical issue related to the functionality of defensive plant coloration and the
operation of herbivores under stress that has been raised recently is the question of
risk evaluation in ecological and evolutionary plant/herbivore studies (e.g.,
Lev-Yadun 2006b, 2009a; Lev-Yadun and Gould 2007, 2009). In order to both
change the common erroneous view and enhance theoretical and experimental
studies I repeat it. This is not just a mere theoretical issue; rather, the understanding
of this principle may significantly influence the planning and interpreting of both
experiments and actual herbivory data collected in nature. There are inherent
theoretical difficulties in evaluation of defense by experiments. A good defense
may operate so well towards certain herbivores that there are almost no attacks on
the defended organism and thus, the experimental noise may be bigger than the
signals. Many scientists find it difficult to accept that “no damage does not automatically indicate that there is no risk.” They usually say, no attacks equals no or
reduced risk. However, in many cases lower attack levels indicate just the opposite:
that the defense is strong and well known to potential enemies. A case of no attack
in spite of a high risk was demonstrated by various summer green plants growing
near Bedouin settlements in the Negev Desert (Israel) and elsewhere in the deserts
of the Near East. Several common alkaloid-rich poisonous or thorny plants form
green islands in the dry summer when all surrounding plants in this desert have
turned yellow or grey and in many cases have been grazed down to their roots over
large areas. Even under such extreme grazing pressure those green plants are
ignored by the large herds of sheep, goats, donkeys, and camels that pass them
daily (Lev-Yadun and Ne’eman 2004). If each individual animal of these large
flocks tasted a single leaf once a day, these green plants would disappear in a short
time. The absence of attacks on these summer green desert plants when no other
vegetal food is available is a clear indication of their very good defensive and
repelling qualities rather than of a low level of risk. Such facts bear on the
interpretation of experimental results. A well-defended plant may have so few
attacks that the statistical analysis of experiments may be problematic. Therefore,
understanding the principle of a low level of attacks indicating good defense rather
than low risk is critical for studies of individual species (e.g., Soltau et al. 2009), or
for comparative studies involving many taxa (e.g., Archetti 2000; Hamilton and
Brown 2001; Lev-Yadun 2001). The classic study by Soltau et al. (2009) is an
excellent demonstration of the issue of the problematic statistics of studying welldefended organisms. Schaefer and Ruxton (2011:165–166) were absolutely correct
from the current classic statistical point of view when they were cautious with the
field data presented in Soltau et al. (2009). However, the reason for a low level of
attacks because of various defenses was not considered in depth by Schaefer and
260
S. Lev-Yadun
Ruxton (2011). This common approach among “statistically correct” ecologists
may allow for accepting results only when less-defended organisms are studied, and
the role of a strong defense may thus be overlooked in many cases. For instance,
there are fewer lion attacks on elephants, hippopotamus, and rhinoceros than on
gazelles and zebras, and even with many years of field observations the statistics of
lion attacks on these well-defended herbivorous animals will be extremely low
compared to those on the much less-defended herbivores. I think that the statistically problematic, but in my understanding, real and very important results of
Soltau et al. (2009) fall into the same category of the low level of lion attacks on
elephants, hippopotamus, and rhinoceros. There is a strong need to develop
(or borrow from other academic disciplines) such tests and make them a standard
for testing cases of low frequency events against a huge background noise in
ecology. Otherwise only large effects will be agreed on and published, while
smaller effects, which are probably much more common and of considerable
ecological and evolutionary importance, will not be recognized (see Martı́nezAbraı́n 2008; Gotelli and Ulrich 2012; Mudge 2013). Alternatively, since statistics
is not proving anything in any case, and cannot handle various other questions, the
actual numbers may be sufficient in such cases. Very small differences in survival
rate may over many generations result in strong evolutionary advantages (see von
Helversen et al. 2013).
4.2
Testing the Hypotheses: A Very Complicated Issue
An important issue for hypothesis validity in general is the possibility of testing
it. Intuitively it sometimes seems simple, but in reality it is very complicated to test
defensive hypotheses in plants and there are contradicting theoretical considerations that I discuss below.
If white variegation has an aposematic role, then it should deter herbivores with
previous foraging experience, but not naı̈ve ones. However, some young and naı̈ve
herbivores learn from their parents to avoid certain plants (Landau et al. 1999). The
problem is that since aposematism is a very old and common phenomenon, there are
no genetically naı̈ve animals towards aposematism, but only inexperienced (usually
young) individuals. When several defense mechanisms operate simultaneously it is
very hard to distinguish between their relative contributions. For instance, the
possibility that thorny, spiny, and prickly plants simultaneously use visual and
olfactory aposematism and that such plants are also poisonous was never studied
systematically (see Lev-Yadun 2009a), and the same is true for the various pathogenic bacteria harboring in spines (Halpern et al. 2007a, 2011) that contribute an
additional level of defense. La Rocca et al. (2014) found that in leaves of the early
flowering understory Erythronium dens-canis L. that are variegated temporary in
both brown and silvery flecks, the brown mottling probably functions only as
camouflage and the persistent silvery flecks function also in attraction of pollinators
later in the season. Such cases as well as those of many unripe white-mottled green
The Proposed Anti-herbivory Roles of White Leaf Variegation
261
fleshy fruits (Lev-Yadun 2013) demonstrate the functional and therefore ecologically and evolutionary complex situation. Moreover, when non-defensive gains due
to white variegation occur, it may be difficult to distinguish them from direct
defenses because better resource acquisition may allow a larger allocation to
various types of defense and to growth and reproduction. All these mentioned
factors and probably others complicate the analyses and evaluation of whatever
results one gets (see Grubb 1992). All these complicated issues have not yet been
studied in depth in plants to give a realistic and balanced view.
4.3
Open Questions
Because of the historical reluctance of botanists to consider defensive plant coloration (Harper 1977), what is known about it lags behind what we know about
defensive animal coloration by a century if not more. I list several issues that should
be studied concerning white plant variegation in order to better understand it:
(1) The anatomical/developmental aspects of variegation. (2) Documenting variegation in all floras in general and according to the geographic and ecological
distribution in particular. (3) The phylogenetic aspect of white leaf variegation.
(4) Correlation of plant life history parameters with the defensive characters.
(5) The genetic aspects. (6) The physiological aspects: is there a physiological
component that operates simultaneously with anti-herbivory, what is its relative
importance and does it fluctuate with time, with developmental stage and with
environmental changes? (7) Is there an epigenetic component in the expression of
variegation? (8) What types of defense does variegation provide (camouflage,
aposematism, dazzle, mimicry, etc.)? (9) If there is more than one type of defense,
what is the relative importance of each mechanism and are the relationships
between them constant or do they fluctuate with time, age, and growth conditions?
(10) Is variegation expressed more or less following herbivore attacks? (11) Do
herbivores learn to avoid such plants? (12) Is there a genetic component in
herbivore avoidance of white plant variegation? (13) If the variegation actually
defends plants from herbivory, to what extent? (14) Mutants should be studied.
(15) Are there fluctuations in the selection towards variegation with time according
to biotic and abiotic environmental changes?
Advancing these questions and probably others that will emerge while studying
the above questions, to the level of understanding of defensive coloration in
animals, will probably take the whole twenty-first century if not more. For instance,
Cott’s (1940) hypotheses about defensive animal coloration are still being studied
more than 70 years later.
262
S. Lev-Yadun
5 Conclusions
White variegation of various developmental types has been proposed to defend
leaves from herbivory by several mechanisms: camouflage, aposematism when it is
associated with spines (including Müllerian and Batesian mimicry), toxins and
raphids, mimicry of insect damage, mimicry of fungal attacks, mimicry of bird
droppings, dazzle effects, and also by causing visual repellence of insects from
landing. Very few cases of proposed leaf defense by white variegation have been
studied in depth to date and found to actually operate as defense from herbivory in
nature or in experiments. Moreover, the type of operating defensive mechanism
was not always proposed or identified even when white variegation was found to be
actually associated with reduced herbivory. Studying white variegation has a
significant advantage over studying other types of defensive coloration in plants
because even bichromatic vision, so common in mammalian herbivores, is sufficient to see these patterns. A broader and deeper effort to understand the defensive
roles of white variegation and other types of defensive plant coloration is certainly
needed. While studying defensive plant coloration, the possible simultaneous
physiological roles of these types of coloration should not be ignored.
Acknowledgments I thank Moshe Flaishman, Amots Dafni, Shahal Abbo, Ron Sederoff, Gidi
Ne’eman, Moshe Inbar, Gadi Katzir, Ido Izhaki, Michal Ronel, Malka Halpern, Kevin Gould, Pilli
Urbas, Martin Schaeffer, Marco Archetti, Pekka Niemelä, Jarmo Holopainen, Tamar Keasar, Aki
Sinkkonen, and Kazuo Yamazaki for stimulating discussions and for field work or trips concerning
defensive plant coloration. I thank Professor Lüttge and an anonymous reviewer for their valuable
comments and suggestions.
References
Addicott FT (1982) Abscission. University of California Press, Berkeley, CA
Allen JA, Cooper JM (1985) Crypsis and masquerade. J Biol Educ 19:268–270
Allen JA, Knill R (1991) Do grazers leave mottled leaves in the shade? Trends Ecol Evol
6:109–110
Aluru MR, Yu F, Fu A, Roderme S (2006) Arabidopsis variegation mutants: new insights into
chloroplast biogenesis. J Exp Bot 57:1871–1881
Archetti M (2000) The origin of autumn colours by coevolution. J Theor Biol 205:625–630
Archetti M, Döring TF, Hagen SB, Hughes NM, Leather SR, Lee DW, Lev-Yadun S, Manetas Y,
Ougham HJ, Schaberg PG, Thomas H (2009) Unravelling the evolution of autumn colours: an
interdisciplinary approach. Trends Ecol Evol 24:166–173
Arditti J, Rodriguez E (1982) Dieffenbachia: uses, abuses and toxic constituents: a review. J
Ethnopharmacol 5:293–302
Bar-Oz G (2004) Epipalaeolithic subsistence strategies in the Levant: a zooarchaeological perspective, The American School of Prehistoric Research (ASPR) monograph series. Brill
Academic Publishers, Boston, MA
Blanco MA, Martén-Rodrı́guez S (2007) The stained-glass palm, Geonoma epetiolata. Palms
51:139–146
The Proposed Anti-herbivory Roles of White Leaf Variegation
263
Borowicz VA (1988) Do vertebrates reject decaying fruit? An experimental test with Cornus
amomum fruits. Oikos 53:74–78
Bradbury JH, Nixon RW (1998) The acridity of raphides from the edible aroids. J Sci Food Agric
76:608–616
Brady J, Shereni W (1988) Landing responses of the tsetse fly Glossina morsitans morsitans
Westwood and the stable fly Stomoxys calcitrans (L.) (Diptera: Glossinidae & Muscidae) to
black-and-white patterns: a laboratory study. Bull Entomol Res 78:301–311
Brown JS (1999) Vigilance, patch use and habitat selection: foraging under predation risk. Evol
Ecol Res 1:49–71
Brown JS, Kotler BP (2004) Hazardous duty pay and the foraging cost of predation. Ecol Lett
7:999–1014
Brown VK, Lawton JH, Grubb PJ (1991) Herbivory and the evolution of leaf size and shape. Phil
Trans R Soc Lond B 333:265–272
Buchholz R, Levey DJ (1990) The evolutionary triad of microbes, fruits, and seed dispersers: an
experiment in fruit choice by cedar waxwings, Bombycilla cedrorum. Oikos 59:200–204
Burns KC (2010) Is crypsis a common defensive strategy in plants? Speculation on signal
deception in the New Zealand flora. Plant Signal Behav 5:9–13
Cahn MG, Harper JL (1976a) The biology of the leaf mark polymorphism in Trifolium repens L. 1.
Distribution of phenotypes at a local scale. Heredity 37:309–325
Cahn MG, Harper JL (1976b) The biology of the leaf mark polymorphism in Trifolium repens L. 2.
Evidence for the selection of leaf marks by rumen fistulated sheep. Heredity 37:327–333
Campitelli BE, Steglik I, Stinchcombe JR (2008) Leaf variegation is associated with reduced
herbivore damage in Hydrophyllum virginianum. Botany 86:306–313
Caro T (2005) Antipredator defenses in birds and mammals. University of Chicago Press, Chicago,
IL
Caro T (2009) Contrasting coloration in terrestrial mammals. Phil Trans R Soc B 364:537–548
Cole DT (1970) Lithops in habitat. In: Sprechman DL (ed) Lithops. Fairleigh Dickinson University Press, Cranbury, NJ, pp 21–32
Cole DT, Cole NA (2005) Lithops – flowering stones. Cactus & Co., Venegono, Italy
Coley PD, Bryant JP, Chapin FS III (1985) Resource availability and plant antiherbivore defense.
Science 230:895–899
Cott HB (1940) Adaptive coloration in animals. Methuen & Co., London
Crawford-Sidebotham TJ (1972) The role of slugs and snails in the maintenance of the cyanogenesis polymorphisms of Lotus corniculatus and Trifolium repens. Heredity 28:405–411
Cuthill IC, Stevens M, Sheppard J, Maddocks T, Párraga CA, Troscianko TS (2005) Disruptive
coloration and background pattern matching. Nature 434:72–74
Davis SJM (1987) The archaeology of animals. Yale University Press, New Haven, CT
De Moraes CM, Mescher MC, Tumlinson JH (2001) Caterpillar-induced nocturnal plant volatiles
repel conspecific females. Nature 410:577–580
Dirzo R, Harper JL (1982) Experimental studies on slug-plant interactions IV. The performance of
cyanogenic and acyanogenic morphs of Trifolium repens in the field. J Ecol 70:119–138
Doku C, Brady J (1989) Landing site preferences of Glossina morsitans morsitans Westwood
(Diptera: Glossinidae) in the laboratory: avoidance of horizontal features? Bull Entomol Res
79:521–528
Edmunds M (1974) Defence in animals. A survey of anti-predator defences. Longman, Harlow
Egri Á, Blahó M, Kriska G, Farkas R, Gyurkovszky M, Åkesson S, Horváth G (2012) Polarotactic
tabanids find striped patterns with brightness and/or polarization modulation least attractive: an
advantage of zebra stripes. J Exp Biol 215:736–745
Embar K, Kotler BP, Mukherjee S (2011) Risk management in optimal foragers: the effect of
sightlines and predator type on patch use, time allocation, and vigilance in gerbils. Oikos
120:1657–1666
Endara MJ, Coley PD (2011) The resource availability hypothesis revisited: a meta-analysis. Funct
Ecol 25:389–398
264
S. Lev-Yadun
Endler JA (1981) An overview of the relationships between mimicry and crypsis. Biol J Linn Soc
16:25–31
Evans CRH (1987) Oral ulceration after contact with the houseplant Dieffenbachia. Br Dental J
162:467–468
Evenari M (1989) The history of research on white-green variegated plants. Bot Rev 55:106–139
Fadzly N, Burns KC (2010) Hiding from the ghost of herbivory past: evidence for crypsis in an
insular tree species. Int J Plant Sci 171:828–833
Fadzly N, Jack C, Schaefer HM, Burns KC (2009) Ontogenetic colour changes in an insular tree
species: signalling to extinct browsing birds? New Phytol 184:495–501
Fahn A (1990) Plant anatomy, 4th edn. Pergamon, Oxford
Finch S, Jones TH (1989) An analysis of the deterrent effect of Aphids on cabbage root fly (Delia
radicum) egg-laying. Ecol Entomol 14:387–391
Forbes P (2009) Dazzled and deceived: mimicry and camouflage. Yale University Press, New
Haven, CT
Forsman A, Herrström J (2004) Asymmetry in size, shape, and color impairs the protective value
of conspicuous color patterns. Behav Ecol 15:141–147
Forsmann A, Merilaita S (1999) Fearful symmetry: pattern size and asymmetry affects aposematic
signal efficacy. Evol Ecol 13:131–140
Franceschi VR, Horner HT Jr (1980) Calcium oxalate crystals in plants. Bot Rev 46:361–427
Gardner DG (1994) Injury to the oral mucous membranes caused by the common houseplant,
diffenbachia. A review. Oral Surg Oral Med Oral Pathol 78:631–633
Gibson G (1992) Do tsetse flies ‘see’ zebras? A field study of the visual response of tsetse to striped
targets. Physiol Entomol 17:141–147
Givnish TJ (1990) Leaf mottling: relation to growth form and leaf phenology and possible role as
camouflage. Funct Ecol 4:463–474
Gotelli NJ, Ulrich W (2012) Statistical challenges in null model analysis. Oikos 121:171–180
Grubb PJ (1992) A positive distrust in simplicity – lessons from plant defences and from
competition among plants and among animals. J Ecol 80:585–610
Halpern M, Raats D, Lev-Yadun S (2007a) Plant biological warfare: thorns inject pathogenic
bacteria into herbivores. Environ Microbiol 9:584–592
Halpern M, Raats D, Lev-Yadun S (2007b) The potential anti-herbivory role of microorganisms on
plant thorns. Plant Signal Behav 2:503–504
Halpern M, Waissler A, Dror A, Lev-Yadun S (2011) Biological warfare of the spiny plant:
introducing pathogenic microorganisms into herbivore’s tissues. Adv Appl Microbiol
74:97–116
Hamilton WD, Brown SP (2001) Autumn tree colours as a handicap signal. Proc R Soc Lond B
268:1489–1493
Hara N (1957) Study of the variegated leaves, with special reference to those caused by air spaces.
Jap J Bot 16:86–101
Harper JL (1977) Population biology of plants. Academic, London
Hawlena D, Schmitz OJ (2010) Herbivore physiological response to predation risk and implications for ecosystem nutrient dynamics. Proc Natl Acad Sci U S A 107:15503–15507
Herrera CM (1982) Defense of ripe fruit from pests: its significance in relation to plant-disperser
interactions. Am Nat 120:218–241
Hinton HE (1973) Natural deception. In: Gregory RL, Gombrich EH (eds) Illusion in nature and
art. Duckworth, London, pp 97–159
Hornell J (1941) Fishing-poisons. Man 41:126–128
Inbar M, Lev-Yadun S (2005) Conspicuous and aposematic spines in the animal kingdom.
Naturwiss 92:170–172
Inbar M, Doostdar H, Mayer RT (1999) Effects of sessile Whitefly nymphs (Homoptera:
Aleyrodidae) on leaf-chewing larvae (Lepidoptera: Noctuidae). Environ Entomol 28:353–357
Janzen DH (1977) Why fruits rot, seeds mold, and meat spoils. Am Nat 111:691–713
The Proposed Anti-herbivory Roles of White Leaf Variegation
265
Jones KA, Krebs JR, Whittingham MJ (2006) Interaction between seed crypsis and habitat
structure influence patch choice in a granivorous bird, the chaffinch Fringilla coelebs. J
Avian Biol 37:413–418
Justus M, Witte L, Hartmann T (1997) Levels and tissue distribution of loline alkaloids in
endophyte-infected Festuca pratensis. Phytochem 44:51–57
Kappers IF, Aharoni A, van Herpen TWJM, Luckerhoff LLP, Dicke M, Bouwmeester HJ (2005)
Genetic engineering of terpenoid metabolism attracts bodyguards to Arabidopsis. Science
309:2070–2072
Karban R (2007) Deciduous leaf drop reduces insect herbivory. Oecologia 153:81–88
Kendrick JW, Tucker J, Peoples SA (1955) Nitrate poisoning in cattle due to ingestion of
variegated thistle, Silybum marianum. J Am Vet Med Assoc 126:53–56
Kessler A, Baldwin IT (2001) Defensive function of herbivore induced plant volatile emissions in
nature. Science 291:2141–2144
Kettlewell B (1973) The evolution of melanism. Clarendon, Oxford
Klooster MR, Clark D, Culley TA (2009) Cryptic bracts facilitate herbivore avoidance in the
mycoheterotrophic plant Monotropsis odorata (Ericaceae). Am J Bot 96:2197–2205
Konoplyova A, Petropoulou Y, Yiotis C, Psaras GK, Manetas Y (2008) The fine structure and
photosynthetic cost of structural leaf variegation. Flora 203:653–662
Kotepong P, Ketsa S, van Doorn WG (2011) A white mutant of Malay apple fruit (Syzygium
malaccense) lacks transcript expression and activity for the last enzyme of anthocyanin
synthesis, and the normal expression of a MYB transcription factor. Funct Plant Biol 38:75–86
La Rocca N, Rascio N, Pupillo P (2011) Variegation in Arum italicum leaves. A structuralfunctional study. Plant Physiol Biochem 49:1392–1398
La Rocca N, Pupillo P, Puppi G, Rascio N (2014) Erythronium dens-canis L. (Liliaceae): an
unusual case of change of leaf mottling. Plant Physiol Biochem 74:108–117
Landau SY, Ben-Moshe E, Shlosberg A, Bellaiche M, Perevolotsky A (1999) Conditioned
aversion to minimize Ferula communis intake by orphaned lambs. J Range Manag 52:436–439
Lee D (2007) Nature’s palette. The science of plant color. University Chicago Press, Chicago, IL
Lev-Yadun S (2001) Aposematic (warning) coloration associated with thorns in higher plants. J
Theor Biol 210:385–388
Lev-Yadun S (2003a) Why do some thorny plants resemble green zebras? J Theor Biol
244:483–489
Lev-Yadun S (2003b) Weapon (thorn) automimicry and mimicry of aposematic colorful thorns in
plants. J Theor Biol 244:183–188
Lev-Yadun S (2006a) Defensive coloration in plants: a review of current ideas about antiherbivore coloration strategies. In: Teixeira da Silva JA (ed) Floriculture, ornamental and
plant biotechnology: advances and topical issues, vol IV. Global Science Books, London, pp
292–299
Lev-Yadun S (2006b) Defensive functions of white coloration in coastal and dune plants. Isr J
Plant Sci 54:317–325
Lev-Yadun S (2009a) Aposematic (warning) coloration in plants. In: Baluska F (ed) Plantenvironment interactions, vol II, From sensory plant biology to active behavior. Springer,
Berlin, pp 167–202
Lev-Yadun S (2009b) Müllerian and Batesian mimicry rings of white-variegated aposematic spiny
and thorny plants: a hypothesis. Isr J Plant Sci 57:107–116
Lev-Yadun S (2009c) Müllerian mimicry in aposematic spiny plants. Plant Signal Behav
4:482–483
Lev-Yadun S (2011) Fearful symmetry in aposematic plants. Plant Signal Behav 6:1739–1740
Lev-Yadun S (2013) Theoretical and functional complexity of white variegation of unripe fleshy
fruits. Plant Signal Behav 8:e25851
Lev-Yadun S (2014) Potential defence from herbivory by dazzle effects and trickery coloration of
leaf variegation. Biol J Linn Soc 111:692–697
266
S. Lev-Yadun
Lev-Yadun S, Gould KS (2007) What do red and yellow autumn leaves signal? Bot Rev
73:279–289
Lev-Yadun S, Gould KS (2009) Role of anthocyanins in plant defense. In: Gould KS, Davies KM,
Winefield C (eds) Life’s colorful solutions: the biosynthesis, functions, and applications of
anthocyanins. Springer, Berlin, pp 21–48
Lev-Yadun S, Halpern M (2007) Ergot (Claviceps purpurea) - an aposematic fungus. Symbiosis J
43:105–108
Lev-Yadun S, Halpern M (2008) External and internal spines in plants insert pathogenic microorganisms into herbivore’s tissues for defense. In: Van Dijk T (ed) Microbial ecology research
trends. Nova Scientific, New York, NY, pp 155–168
Lev-Yadun S, Ne’eman G (2004) When may green plants be aposematic? Biol J Linn Soc
81:413–416
Lev-Yadun S, Ne’eman G (2006) Color changes in old aposematic thorns, spines, and prickles. Isr
J Plant Sci 54:327–333
Lev-Yadun S, Ne’eman G (2013) Bimodal colour pattern of individual Pinus halepensis Mill.
seeds – an adaptation for crypsis. Biol J Linn Soc 109:271–278
Lev-Yadun S, Gopher A, Abbo S (2000) The cradle of agriculture. Science 288:1602–1603
Lev-Yadun S, Dafni A, Flaishman MA, Inbar M, Izhaki I, Katzir G, Ne’eman G (2004a) Plant
coloration undermines herbivorous insect camouflage. Bioessays 26:1126–1130
Lev-Yadun S, Flaishman MA, Atzmon N (2004b) Nonchimeric variegated mutation in Cupressus
sempervirens L. Int J Plant Sci 165:257–261
Lev-Yadun S, Ne’eman G, Izhaki I (2009) Unripe red fruits may be aposematic. Plant Signal
Behav 4:836–841
Lüttge U (1997) Physiological ecology of tropical plants. Springer, Berlin
Mackay DA, Jones RE (1989) Leaf shape and the host-finding behaviour of two ovipositing
monophagous butterfly species. Ecol Entomol 14:423–431
Majerus MEN (1998) Melanism. Evolution in action. Oxford University Press, Oxford
Manzur MI, Courtney SP (1984) Influence of insect damage in fruits of hawthorn on bird foraging
and seed dispersal. Oikos 43:265–270
Martı́nez-Abraı́n A (2008) Statistical significance and biological relevance: a call for a more
cautious interpretation of results in ecology. Acta Oecol 34:9–11
McKey D, Waterman PG, Mbi CN, Gartlan JS, Struhsaker TT (1978) Phenolic content of
vegetation in two African rain forests: ecological implications. Science 202:61–64
Merilaita S (1998) Crypsis through disruptive coloration in an isopod. Proc R Soc Lond B
265:1059–1064
Midgley JJ (2004) Why are spines of African Acacia species white? Afr J Range Forage Sci
21:211–212
Midgley JJ, Botha MA, Balfour D (2001) Patterns of thorn length, density, type and colour in
African Acacias. Afr J Range Forage Sci 18:59–61
Mudge JF (2013) Explicit consideration of critical effect sizes and costs of errors can improve
decision-making in plant science. New Phytol 199:876–878
Nassar O, Lev-Yadun S (2009) How prickly is a prickly pear? Isr J Plant Sci 57:117–124
Niemelä P, Tuomi J, Siren S (1984) Selective herbivory on mosaic leaves of variegated Acer
pseudoplatanus. Experientia 40:1433–1434
Noy-Meir I, Gutman M, Kaplan Y (1989) Responses of Mediterranean grassland plants to grazing
and protection. J Ecol 77:290–310
Ohmiya A, Kishimoto S, Aida R, Yoshioka S, Sumitomo K (2006) Carotenoid cleavage
dioxygenase (CmCCD4a) contributes to white color formation in chrysanthemum petals.
Plant Physiol 142:1193–1201
Ortolani A (1999) Spots, stripes, tail tips and dark eyes: predicting the function of carnivore colour
patterns using the comparative method. Biol J Linn Soc 67:433–476
Osorio D, Srinivasan MV (1991) Camouflage by edge enhancement in animal coloration patterns
and its implications for visual mechanisms. Proc R Soc Lond B 244:81–85
The Proposed Anti-herbivory Roles of White Leaf Variegation
267
Perevolotsky A, Seligman N (1998) Role of grazing in Mediterranean rangeland ecosystems.
Inversion of a paradigm. BioScience 48:1007–1017
Pfister JA, Müller-Schwarze D, Balph DF (1990) Effects of predator fecal odors on feed selection
by sheep and cattle. J Chem Ecol 16:573–583
Poethig RS (1987) Clonal analysis of cell lineage patterns in plant development. Am J Bot
74:581–594
Porter JK (1994) Chemical constituents of grass endophytes. In: Bacon CW, White JF (eds)
Biotechnology of endophytic fungi of grasses. CRC, Boca Raton, FL, pp 103–123
Preisser EL (2009) The physiology of predator stress in free-ranging prey. J Anim Ecol
78:1103–1105
Prokopy RJ, Owens ED (1983) Visual detection of plants by herbivorous insects. Annu Rev
Entomol 28:337–364
Rasmann S, Agrawal AA (2011) Latitudinal patterns in plant defense: evolution of cardenolides,
their toxicity and induction following herbivory. Ecol Lett 14:476–483
Rausher MD (1978) Search image for leaf shape in a butterfly. Science 200:1071–1073
Reeves JL (2011) Vision should not be overlooked as an important sensory modality for finding
host plants. Environ Entomol 40:855–863
Reznicek G, Jurenitsch J, Robien W, Kubelka W (1989) Saponins in Cyclamen species: configuration of cyclamiretin C and structure of isocyclamin. Phytochem 28:825–828
Ripple WJ, Beschta RL (2004) Wolves and the ecology of fear: can predation risk structure
ecosystems? BioScience 54:755–766
Ronel M, Lev-Yadun S (2009) Spiny plants in the archaeological record of Israel. J Arid Environ
73:754–761
Ronel M, Lev-Yadun S (2012) The spiny, thorny and prickly plants in the flora of Israel. Bot J Linn
Soc 168:344–352
Ronel M, Khateeb S, Lev-Yadun S (2009) Protective spiny modules in thistles of the Asteraceae in
Israel. J Torrey Bot Soc 136:46–56
Ronel M, Ne’eman G, Lev-Yadun S (2010) Spiny east-Mediterranean plant species flower later
and in a drier season than non-spiny species. Flora 205:276–281
Rosso D, Bode R, Li W, Krol M, Saccon D, Wang S, Schillaci LA, Rodermel SR, Maxwell DP,
Hüner PA (2009) Photosynthetic redox imbalance governs leaf sectoring in the Arabidopsis
thaliana variegation mutants immutans, spotty, var1, and var2. Plant Cell 21:3473–3492
Rothschild M (1986) The red smell of danger. New Sci 111:34–36
Rothschild M, Moore B (1987) Pyrazines as alerting signals in toxic plants and insects. In:
Labeyrie V, Fabres G, Lachaise D (eds) Insects – plants. Dr W. Junk, Dordrecht, pp 97–101
Rowland HM, Mappes J, Ruxton GD, Speed MP (2010) Mimicry between unequally defended
prey can be parasitic: evidence for quasi-Batesian mimicry. Ecol Lett 13:1494–1502
Rubino DL, McCarthy BC (2004) Presence of aposematic (warning) coloration in vascular plants
of southeastern Ohio. J Torrey Bot Soc 131:252–256
Ruxton GD (2002) The possible fitness benefits of striped coat coloration for zebra. Mammal Rev
32:237–244
Ruxton GD, Sherratt TN, Speed MP (2004) Avoiding attack. The evolutionary ecology of crypsis,
warning signals and mimicry. Oxford University Press, Oxford
Saikkonen K, Faeth SH, Helander M, Sullivan TJ (1998) Fungal endophytes: a continuum of
interactions with host plants. Annu Rev Ecol Syst 29:319–343
Sakai WS, Hanson M, Jones RC (1972) Raphids with barbs and grooves in Xanthosoma
sagittifolium (Araceae). Science 178:314–315
Salts D, Ward D (2000) Responding to a three-pronged attack: desert lilies subject to herbivory by
dorcas gazelles. Plant Ecol 148:127–138
Scarchuk J, Lent JM (1965) The structure of mottled-leaf summer squash. J Hered 56:167–168
Schaefer HM, Ruxton GD (2009) Deception in plants: mimicry or perceptual exploitation? Trends
Ecol Evol 24:676–685
268
S. Lev-Yadun
Schaefer HM, Ruxton GD (2011) Plant-animal communication. Oxford University Press,
New York, NY
Schaefer M, Stobbe N (2006) Disruptive coloration provides camouflage independent of background matching. Proc R Soc Lond B 273:2427–2432
Schemske DW, Mittelbach GG, Cornell HV, Sobel JM, Roy K (2009) Is there a latitudinal gradient
in the importance of biotic interactions. Annu Rev Ecol Evol Syst 40:245–269
Sheriff MJ, Krebs CJ, Boonstra R (2009) The sensitive hare: sublethal effects of predator stress on
reproduction in snowshoe hares. J Anim Ecol 78:1249–1258
Shifriss O (1981) Do Cucurbita plants with silvery leaves escape virus infection? Cucurbit
Genetics Cooperative Report 4:42–43
Skelhorn J, Rowland HM, Ruxton GD (2010a) The evolution and ecology of masquerade. Biol J
Linn Soc 99:1–8
Skelhorn J, Rowland HM, Speed MP, Ruxton GD (2010b) Masquerade: camouflage without
crypsis. Science 327:51
Skelhorn J, Rowland HM, Speed MP, De Wert L, Quinn L, Delf J, Ruxton GD (2010c) Sizedependent misclassification of masqueradinf prey. Behav Ecol 21:1344–1348
Smith AP (1986) Ecology of leaf color polymorphism in a tropical forest species: habitat
segregation and herbivory. Oecologia 69:283–287
Soltau U, Dötterl S, Liede-Schumann S (2009) Leaf variegation in Caladium steudneriifolium
(Araceae): a case of mimicry? Evol Ecol 23:503–512
Speed MP, Ruxton GD (2005) Warning displays in spiny animals: one (more) evolutionary route
to aposematism. Evolution 59:2499–2508
Stanley RM II (1998) To fool a glass eye. Camouflage versus photoreconnaissance in World War
II. Smithsonian Institute Press, Washington, DC
Steiner MC (2005) The faunas of Hayonim Cave (Israel): a 200,000-year record of Paleolithic diet,
demography and society. Peabody Museum of Archaeology and Ethnology, Cambridge
Stevens M, Cuthill IC, Windsor AMM, Walker HJ (2006) Disruptive contrast in animal camouflage. Proc R Soc B 273:2433–2438
Tchernov E (1979) Quaternary fauna. In: Horowitz A (ed) The quaternary of Israel. Academic,
New York, NY, pp 257–290
Terlouw EMC, Boissy A, Blinet P (1998) Behavioural responses of cattle to the odours of blood
and urine from conspecifics and to the odour of faeces from carnivores. Appl Anim Behav Sci
57:9–21
Tilney-Bassett RAE (1986) Plant chimeras. Edward Arnold, London
Tsukaya H, Okada H, Mohamed M (2004) A novel feature of structural variegation in leaves of the
tropical plant Schismatoglottis calyptrata. J Plant Res 117:477–480
von Helversen B, Schooler LJ, Czienskowski U (2013) Are stripes beneficial? Dazzle camouflage
influences perceived speed and hit rates. PLoS One 8:e61173
Waage JK (1981) How the zebra got its stripes – biting flies as selective agents in the evolution of
zebra coloration. J Ent Soc S Afr 44:351–358
Wäli PP, Wäli PR, Saikkonen K, Tuomi J (2013) Is the pathogenic ergot fungus a conditional
defensive mutualist for its host grass? PLoS One 8:e69249
Ward D, Spiegel M, Saltz D (1997) Gazelle herbivory and interpopulation differences in calcium
oxalate content of leaves of a desert lily. J Chem Ecol 23:333–346
Wickler W (1968) Mimicry in plants and animals. Weidenfeld and Nicolson, London
Wiens D (1978) Mimicry in plants. Evol Biol 11:365–403
Wilkinson N (1969) A brush with life. Seeley Service & Co, London
Wilkinson D, Sherratt TN (2008) The art of concealment. Biologist 55:10–15
Williams D (2001) Naval camouflage 1914–1945. A complete visual reference. Naval Institute
Press, Annapolis
Yamazaki K (2010) Leaf mines as visual defensive signals to herbivores. Oikos 119:796–801
The Proposed Anti-herbivory Roles of White Leaf Variegation
269
Yu F, Fu A, Aluru M, Park S, Xu Y, Liu H, Liu X, Foudree A, Nambogga M, Rodermel S (2007)
Variegation mutants and mechanisms of chloroplast biogenesis. Plant Cell Environ
30:350–365
Zheng S-J, Snoeren TAL, Hogewoning SW, van Loon JJA, Dicke M (2010) Disruption of plant
carotenoid biosynthesis through virus-induced gene silencing affects oviposition behaviour of
the butterfly Pieris rapae. New Phytol 186:733–745
Zohary M (1962) Plant life of Palestine. Israel and Jordan. Ronald Press, New York, NY
Zohary M (1973) Geobotanical foundations of the Middle East. Gustav Fischer, Stuttgart
Zohary M (1983) Man and vegetation in the Middle East. In: Holzner W, Werger MJA, Ikusima I
(eds) Man’s impact on vegetation. Dr W. Junk, The Hague, pp 287–295
Zohary D, Hopf M, Weiss E (2012) Domestication of plants in the Old World, 4th edn. Clarendon,
Oxford
Part III
Ecology
Sunlight and Soil–Litter Mixing: Drivers
of Litter Decomposition in Drylands
Paul W. Barnes, Heather L. Throop, Steven R. Archer, David D. Breshears,
Rebecca L. McCulley, and Mark A. Tobler
Contents
1 Introduction . . . . . . . . . . . . . . . . . . . . . . . . . . . . . . . . . . . . . . . . . . . . . . . . . . . . . . . . . . . . . . . . . . . . . . . . . . . . . . . . .
2 Overview . . . . . . . . . . . . . . . . . . . . . . . . . . . . . . . . . . . . . . . . . . . . . . . . . . . . . . . . . . . . . . . . . . . . . . . . . . . . . . . . . . . .
3 Sunlight, UV Radiation and Decomposition . . . . . . . . . . . . . . . . . . . . . . . . . . . . . . . . . . . . . . . . . . . . . . .
3.1 Brief History and Overview of Experimental Approaches . . . . . . . . . . . . . . . . . . . . . . . . . .
3.2 Mechanisms for Solar Radiation Influence on Decomposition . . . . . . . . . . . . . . . . . . . . .
3.3 Evaluating the Role of Sunlight on Decomposition in Natural Settings . . . . . . . . . . . .
4 Soil–Litter Mixing and Decomposition . . . . . . . . . . . . . . . . . . . . . . . . . . . . . . . . . . . . . . . . . . . . . . . . . . . .
4.1 Soil Redistribution in Drylands . . . . . . . . . . . . . . . . . . . . . . . . . . . . . . . . . . . . . . . . . . . . . . . . . . . . . .
4.2 Litter Redistribution in Drylands . . . . . . . . . . . . . . . . . . . . . . . . . . . . . . . . . . . . . . . . . . . . . . . . . . . . .
4.3 Soil–Litter Mixing and Decomposition . . . . . . . . . . . . . . . . . . . . . . . . . . . . . . . . . . . . . . . . . . . . . .
5 Integrated Conceptual Model of UV and Soil Mixing Effects on Dryland Decomposition . . .
6 Summary and Conclusions . . . . . . . . . . . . . . . . . . . . . . . . . . . . . . . . . . . . . . . . . . . . . . . . . . . . . . . . . . . . . . . . .
References . . . . . . . . . . . . . . . . . . . . . . . . . . . . . . . . . . . . . . . . . . . . . . . . . . . . . . . . . . . . . . . . . . . . . . . . . . . . . . . . . . . . . . .
274
276
279
279
280
283
288
288
290
292
293
294
295
P.W. Barnes (*) • M.A. Tobler
Department of Biological Sciences, Loyola University New Orleans, New Orleans, LA 70118,
USA
e-mail: pwbarnes@loyno.edu; tobler@loyno.edu
H.L. Throop
Department of Biology, New Mexico State University, Las Cruces, NM 88003, USA
e-mail: throop@nmsu.edu
S.R. Archer • D.D. Breshears
School of Natural Resources and the Environment, University of Arizona, Tucson, AZ 85721,
USA
e-mail: sarcher@ag.arizona.edu; daveb@email.arizona.edu
R.L. McCulley
Department of Plant and Soil Science, University of Kentucky, Lexington, KY 40546, USA
e-mail: rebecca.mcculley@uky.edu
© Springer International Publishing Switzerland 2015
U. Lüttge, W. Beyschlag (eds.), Progress in Botany, Progress in Botany 76,
DOI 10.1007/978-3-319-08807-5_11
273
274
P.W. Barnes et al.
Abstract Decomposition of leaf litter is a key component of biogeochemical
cycles but the mechanisms driving it in arid and semiarid ecosystems (drylands)
remain unresolved. Here, we review recent findings that demonstrate dual roles of
solar radiation (ultraviolet and photosynthetically active radiation) and soil–litter
mixing as drivers of decomposition in drylands. We focus on the known and
potential mechanisms by which these factors influence leaf litter decomposition,
explore how the importance of these two drivers may shift over time, and propose
possible avenues by which these factors may interact. Special attention is given to
UV in sunlight, as this radiation is known to have multiple roles in influencing
decomposition and has received considerable recent research attention. We also
identify important uncertainties and challenges and offer a generalized conceptual
model to guide future research aimed at enhancing our mechanistic understanding
and quantitative modeling of the processes by which soil deposition and solar
radiation together influence leaf litter decomposition rates in globally extensive
dryland ecosystems.
1 Introduction
Decomposition of organic material strongly controls patterns of nutrient and carbon
(C) retention and release in ecosystems. Although C and nutrients in the litter pool
account for only a small portion of system-wide totals, the relatively rapid turnover
of this pool makes leaf litter decomposition a key component of biogeochemical
cycles (Aerts 1997; Berg and Laskowski 2005). Traditionally, the prevailing drivers
of litter decomposition in terrestrial ecosystems have been viewed as a combination
of abiotic (e.g., temperature, moisture) and biotic (e.g., litter quality) factors
interacting to mediate decomposer community composition and metabolic
activity, and considerable progress has been made in developing a mechanistic
understanding of the controls over decomposition at local, regional, and global
scales (Meentemeyer 1978; Couteaux et al. 1995; Aerts 1997; Hibbard et al. 2005;
Cable et al. 2011). However, predicting decomposition dynamics in globally
extensive arid and semi-arid systems (hereafter “drylands”) has proven to be
problematic, with models typically underestimating its rates (Whitford
et al. 1981; Moorhead and Reynolds 1991; Kemp et al. 2003; Parton et al. 2007;
Adair et al. 2008).
The disconnect between decomposition models and measurements suggests
controls over decomposition in drylands differ fundamentally from those in wetter
environments and that unique drivers may be operating in drylands (reviewed in
Throop and Archer 2009; Austin 2011; King et al. 2012). Recently, several studies
have shown that ultraviolet (UV; 280–400 nm) and photosynthetic active radiation
(PAR; 400–700 nm) in ambient sunlight can accelerate litter mass loss in drylands
via the process of photodegradation (Austin and Vivanco 2006; Brandt et al. 2007;
Day et al. 2007; Brandt et al. 2010). Although the magnitudes and proposed
Sunlight and Soil–Litter Mixing: Drivers of Litter Decomposition in Drylands
275
mechanisms of photodegradation are variable and poorly understood (King
et al. 2012; Song et al. 2013a), it may be an important, historically overlooked
driver that could potentially explain, at least in part, why traditional models
typically underpredict decomposition rates in drylands (Throop and Archer 2009;
Austin 2011). Photodegradation results in the direct loss of a number of gases,
including CO2 (Brandt et al. 2009; Lee et al. 2012), CH4 (McLeod et al. 2008;
Bloom et al. 2010), CO (Schade and Crutzen 1999; Lee et al. 2012), and N2O
(Foereid et al. 2010), and recent analyses suggest that photodegradation of surface
litter could have a measurable influence on landscape-level CO2 flux rates, and
ultimately C storage (Brandt et al. 2009; Rutledge et al. 2010).
While the climate and low and sparse vegetation cover of drylands create
conditions of high solar radiation flux near ground level, these environments also
favor considerable soil movement via wind and water transport (Breshears
et al. 2003; Okin et al. 2009b), which can partially cover and eventually bury
plant litter on the soil surface (Throop and Archer 2007). This combination of litter
and the soil that covers it (the “soil–litter matrix”) includes both loose soil mixed
with litter and soil that, over time, adheres to leaf surfaces to form a complex
aggregate of soil and microbial products (Throop and Archer 2009; Barnes
et al. 2012; Hewins et al. 2013). Although the nature and development of this
soil–litter matrix remains poorly understood, available evidence indicates that
decomposition in drylands can be strongly correlated with levels of soil accumulation onto litter and hence the development of this soil–litter matrix (Throop and
Archer 2007). The mechanisms underlying this response have yet to be fully
elucidated; however, the mixing of soil and litter and the resultant soil–litter matrix
appears to enhance microbial activity (Hewins et al. 2013) while simultaneously
shielding litter from photodegradation (Barnes et al. 2012). Soil coverage may also
shield sensitive microbes from potential detrimental effects of solar UV (Moody
et al. 1999; Johnson 2003; Cockell et al. 2008). An increased understanding of the
factors that influence soil deposition onto litter, the processes governing soil–litter
matrix development, and the mechanisms by which solar radiation and soil–litter
mixing interact to influence decomposition appears critical to understanding litter
decomposition in drylands and resolving seemingly conflicting views on this
process.
Here we examine the dual roles of sunlight and soil–litter mixing as drivers of
litter decomposition in dryland ecosystems. Specifically, we focus on the known
and potential mechanisms by which these factors influence leaf litter degradation,
explore how the importance of these two drivers may shift over time, and propose
possible avenues by which these factors may interact to influence decomposition.
We give special attention to UV in sunlight, as this radiation is known to have
multiple roles in influencing decomposition and has received considerable recent
research attention. We also identify important uncertainties and challenges and
offer a generalized conceptual model to guide future research aimed at enhancing
our mechanistic understanding and quantitative modeling of the processes by which
soil deposition and solar radiation together influence leaf litter decomposition rates
in globally extensive dryland ecosystems.
276
P.W. Barnes et al.
2 Overview
Solar radiation (UV and PAR) and soil–litter mixing can influence decomposition
of leaf litter in dryland ecosystems by multiple mechanisms, and interactions
between these and other environmental factors can further modify these effects
(Fig. 1; see Table 1 for definition of terms). The total radiation exposure of litter
(Fig. 1B) will be influenced by a combination of climatic, landscape/vegetation,
and species-specific factors (Fig. 1A) that determine the timing and duration of
exposure. The effects of solar radiation (primarily UV) on biotic processes generally reduce rates of decomposition () though there is the potential for some
beneficial effects (Fig. 1D). The effects of sunlight on abiotic processes (primarily
photodegradation) tend to enhance (+) decomposition (Fig. 1E). Both of these
processes exhibit distinct spectral sensitivities (i.e., action spectra) depending on
the underlying chromophores and mechanisms involved (Fig. 1C). Solar radiation
can also influence decomposition via its effects on leaf chemistry and structure
Fig. 1 Potential effects of solar radiation (UV and PAR) and soil–litter mixing on leaf litter
decomposition in drylands, including interactions with other environmental factors. See Table 1
for definition of terms
Abiotic/
biotic
Biotic
Photopriming
(Fig. 1E!1D)
Microbially enhanced
photodegradation
(Fig. 1D!1E)
Microbial
photoinhibition
(Fig. 1D)
Biotic
Abiotic
Solar radiation stress on microbial
physiology/communities,
affecting microbial
decomposition
Low temperature (<100 C)
breakdown of chemical bonds
in litter; may occur in absence
of solar radiation; enhances
photodegradation
Primary and/or secondary
photodegradation that affects
subsequent microbial
decomposition
Microbes modify litter which then
influences photodegradation
Breakdown of litter via reactive
intermediates formed by
primary photodegradation
Abiotic
Thermal degradation
Solar radiation breaks chemical
bonds in litter via the direct
absorption of radiation by
photoreactive compounds
Abiotic
Primary
photodegradation
(Fig. 1E; aka
photolysis;
photooxidationa)
Secondary
photodegradation
(Fig. 1E)
Process
Mediation
Name
Microbes
Microbes
Litter
Litter
Litter
Litter
Material
intercepting
radiation
Usually, but not always,
decreased microbial activity
and reduced mass loss
Increased mass loss
Often, but not always, enhanced
microbial activity promoting
mass loss
Fragmentation and mass loss;
increased potential for
leaching, increased surface
area for microbial attack
Efflux of gaseous compounds
and mass loss
Efflux of gaseous compounds
and mass loss
Outcome for plant litter
decomposition
(continued)
Duguay and Klironomos
(2000); Verhoef
et al. (2000);
Newsham et al. (1997)
Ma et al. (2012)
Foereid et al. (2010)
Austin and Vivanco
(2006); Brandt
et al. (2009); Lee
et al. (2012)b
Lee et al. (2012)
Austin and Vivanco
(2006); Brandt
et al. (2009); Lee
et al. (2012)
Examples
Table 1 Terminology used to describe the various mechanisms by which solar radiation influences terrestrial litter decomposition. Although
“photodegradation” is sometimes used broadly to include all radiation effects on mass loss, including microbial effects, we use it in a strict sense to refer
only to abiotic effects on mass loss
Sunlight and Soil–Litter Mixing: Drivers of Litter Decomposition in Drylands
277
Mediation
Abiotic/
biotic
Process
Solar radiation-induced changes
in plant tissue structure and/or
chemical composition that
affect later microbial
decomposition and/or
photodegradation
Material
intercepting
radiation
Live plants
including
leaves
and stems
Outcome for plant litter
decomposition
Attenuated microbial activity
leading to reduced mass loss;
effects on photodegradation
unknown at present
Examples
Gehrke et al. (1995);
Rozema et al. (1997);
Pancotto et al. (2003)
Lee et al. (2012) found that O2 was not required for this process; thus photo-oxidation is apparently one of several pathways for photodegradation of
compounds in litter
b
Field and laboratory methods to date do not differentiate between abiotic decomposition from primary or secondary photodegradation
a
Name
Plant photochemistry
(Fig. 1G)
Table 1 (continued)
278
P.W. Barnes et al.
Sunlight and Soil–Litter Mixing: Drivers of Litter Decomposition in Drylands
279
(Fig. 1G), which subsequently influences both biotic and abiotic degradation
processes when foliage dies (Fig. 1D, E).
Soil accumulation onto litter will be influenced by meteorological, vegetation,
landscape, and edaphic factors (Fig. 1A) that influence the rate, magnitude, and
direction of soil and litter transport and soil deposition (Fig. 1H). Over time, and
depending on soil mineralogy and particle size composition, a complex mixture of
soil, plant material, and microbial products can develop to form an adhesive soil–
litter matrix (Fig. 1I) that can shield litter from solar radiation (Fig. 1B), reduce
photodegradation (Fig. 1E), and enhance microbial processes (Fig. 1D).
Ultimately, the net effect of solar radiation and soil deposition on the rates of
decomposition, nutrient cycling, and carbon storage (Fig. 1F) will depend on the
weighted contribution of biotic and abiotic processes and may be positive, negative,
or neutral depending on the relative strength of the individual effects. Subsequent
sections review our current understanding of the factors itemized in Fig. 1, examine
how interactions among them might play out under field conditions, and address
some of the knowledge gaps and challenges associated with quantifying them.
3 Sunlight, UV Radiation and Decomposition
3.1
Brief History and Overview of Experimental Approaches
The solar spectrum at the Earth’s surface consists of a mixture of UV, PAR, and
near-infrared (IR) radiation, with the majority of the energy and photon flux coming
from the latter two wavebands. Although the UV component of the spectrum
comprises a small (<5 %) portion of the total surface solar irradiance, its influence
on terrestrial plants and ecosystems can be significant (Day and Neale 2002; Ballaré
et al. 2011; Paul et al. 2012; Wargent and Jordan 2013). Historically, research
examining UV effects on decomposition was undertaken to evaluate potential
ecological impacts of the changing solar ultraviolet-B (UV-B; 280–320 nm) regime
associated with stratospheric ozone depletion, and field studies were therefore often
conducted in high-latitude ecosystems where ozone loss was acute (Gehrke
et al. 1995; Pancotto et al. 2003; Zaller et al. 2009). These studies typically
employed plastic films to reduce ambient solar UV-B (i.e., UV-exclusion experiments) or filtered UV-emitting lamps to simulate elevated solar UV-B conditions
(i.e., UV-B-enhancement experiments) associated with ozone depletion. More
recently, efforts have shifted to explore the mechanisms and fundamental roles of
UV-B, UV-A (320–400 nm), and PAR in influencing terrestrial decomposition and
biogeochemistry using a combination of field radiation-attenuation experiments
and controlled laboratory experiments with artificial light sources. Although the
technical issues and uncertainties associated with the different experimental
approaches to UV experiments are beyond the scope of this review (but see
Caldwell et al. 1983a; Flint et al. 2003; Aphalo et al. 2013), it is worth noting
280
P.W. Barnes et al.
that the detection of UV effects on decomposition appears to be influenced by the
nature and type of experiments conducted (i.e., field UV-exclusion vs. lamp studies
and field vs. laboratory studies, King et al. 2012; Song et al. 2013a). These findings
suggest that experimental techniques used to manipulate UV exposure and the
maintenance of proper spectral balances (i.e., UV-B:UV-A:PAR ratios) are important in interpreting both the quantitative and qualitative effects of UV radiation on
decomposition (Fig. 1D, E), as has been well documented for UV studies on higher
plants (e.g., Caldwell and Flint 1989; Flint et al. 2003; Krizek 2004).
3.2
Mechanisms for Solar Radiation Influence
on Decomposition
Findings to date indicate that UV (and PAR), either at ambient or enhanced levels,
can influence litter decomposition in terrestrial ecosystems via multiple mechanisms including effects on microbes (Fig. 1D) and abiotic photochemistry (Fig. 1E)
as well as effects mediated through alterations in leaf chemistry (Fig. 1G and recent
meta-analyses of King et al. 2012; Song et al. 2013a). These processes also interact
with one another [e.g., abiotic processes such as photodegradation may enhance or
retard biotic (microbial) process; Fig. 1E!D] and multiple pathways can occur
within a given process (e.g., different pathways of photodegradation as described
below). The terminology surrounding these processes and the mechanism underlying them is somewhat ambiguous in the literature, and interpretations are further
complicated with respect to what constitutes “primary” vs. “secondary” and
“direct” vs. “indirect” effects. Table 1 summarizes the definitions and interpretations used in this paper.
Photodegradation (Fig. 1E) is an abiotic process that occurs via photochemical
mineralization of photo-reactive compounds (King et al. 2012), such as lignin (i.e.,
primary photodegradation; Table 1), and/or the transformation of compounds as a
result of solar radiation-induced formation of reactive oxygen species and other
intermediates (i.e., secondary photodegradation; Rozema et al. 1997; Anesio
et al. 1999; Gallo et al. 2006; Day et al. 2007; Austin and Ballaré 2010; King
et al. 2012). Photodegradation is enhanced in the presence of oxygen but also
occurs under anoxic conditions, suggesting there are multiple chemical pathways
involved (Lee et al. 2012). While photodegradation has long been viewed as an
important mechanism influencing decomposition in aquatic ecosystems (e.g., Zepp
et al. 1995), only recently has it been shown to be an important driver of decomposition in terrestrial ecosystems (Henry et al. 2008; Brandt et al. 2010; Song
et al. 2012). In a semi-arid Patagonian steppe, Austin and Vivanco (2006) found
that reducing solar radiation affected decomposition much more strongly than
reducing microbial decomposition with a biocide treatment, and they attributed
about 60 % of the observed litter mass loss to shortwave radiation. About half of
this mass loss was due to UV-B. Similarly, 14–22 % of leaf mass loss was attributed
Sunlight and Soil–Litter Mixing: Drivers of Litter Decomposition in Drylands
281
to solar UV-B in a field litterbag experiment in the Sonoran Desert (Day
et al. 2007). However, not all investigators have found significant photodegradation
effects (e.g., Kirschbaum et al. 2011) and there is evidence that the degree of
photodegradation may vary with litter chemical composition (Uselman
et al. 2011; Lee et al. 2012) and moisture (Schade and Crutzen 1999; Andrady
et al. 2003; Gallo et al. 2006). Photodegradation rates increase with increasing
ambient temperature (Lee et al. 2012). Furthermore, thermal degradation, the
thermal decay of litter compounds at relatively low temperatures (<100 C; well
below the ignition point), can account for a substantial component of measured
trace gas fluxes in photodegradation experiments (Lee et al. 2012). Increases in
temperature from solar radiation may therefore influence litter decay both through
enhancing photodegradation and from thermal degradation alone.
The effects of UV radiation on bacteria and fungi (Fig. 1D) tend to be negative,
with growth, survival, and the production and germination of spores generally
inhibited, especially by UV-B (Table 1, Caldwell et al. 2007). These “microbial
photoinhibition” effects of sunlight are generally thought to be manifestations of
detrimental impacts on DNA and repair processes (Hughes et al. 2003; Johnson
2003; Jacobs et al. 2005; Gunasekera and Sundin 2006). However, species vary in
their UV sensitivity (Moody et al. 1999; Braga et al. 2001; Ulevičius et al. 2004),
resulting in shifts in microbial community composition when material is exposed to
sunlight (Kadivar and Stapleton 2003; Rangel et al. 2004). The UV tolerance of
microbes may be related to the solar UV environment of origin, with microbes from
sites with low UV exposures being more sensitive to UV insult than those from sites
experiencing higher UV fluxes (Gunasekera et al. 1997; Zucconi et al. 2002).
Microbes isolated from deserts, where natural UV exposure is high (e.g., the
Atacama, Gobi, and Negev Deserts), can be relatively tolerant to wide ranges of
UV irradiation (including UV-C; <280 nm) (Paulino-Lima et al. 2013), especially
when present as desiccated spores and associated with soil particles (Cockell
et al. 2008; Osman et al. 2008).
Not all effects of UV on microbes are negative, however. UV (together with blue
light) can stimulate spore production and hyphal development in some fungi
(Gressel and Rau 1983; Nagahashi and Douds 2003) and benefit microbial growth.
Also, the effects of UV on microbes will depend on prevailing environmental
conditions (i.e., temperature, moisture, and substrate availability) that influence
microbial activity (Rangel et al. 2004; Gunasekera and Paul 2007; Belnap
et al. 2008). Consequently, the overall effect of solar UV (UV-B + UV-A) on the
community composition and function of microbial decomposers may be complex
(Denward et al. 2001; Johnson 2003; Kadivar and Stapleton 2003). In relatively wet
ecosystems (e.g., forests, marshes, and bogs), solar UV-B has been shown to retard
litter mass loss and microbial activity and change microbial community composition, but effects are often subtle and variable over time (Newsham et al. 1997;
Moody et al. 2001; Pancotto et al. 2003; M. Tobler and P. Barnes, unpubl data). The
effect of UV on microbial-driven decomposition is little understood in drylands. It
is conceivable that UV effects would be less important and more temporally
variable in drylands as compared to moist environments due to the more extreme
282
P.W. Barnes et al.
temperatures and the sparse, intermittent nature of precipitation in drylands that
govern microbial activity, and therefore potential sensitivity to UV (see for example Belnap et al. 2008). Alternatively, the often intense UV in drylands may be
sufficient to exceed the UV tolerances of microbial decomposers, at least under
certain conditions.
Solar radiation also influences decomposition by altering the chemistry and
structure of live plant tissue (“plant photochemistry” effects; Table 1; Fig. 1G).
Exposure to ambient or enhanced UV-B typically elevates levels of
phenylpropanoid compounds (flavonoids and related phenolics) that serve as
UV-absorbing compounds and free radical scavengers (Caldwell et al. 1983b;
Day 1993; Searles et al. 2001; Agati and Tattini 2010). Changes in UV-B during
plant growth has also been linked with changes in leaf C, N, P, K, and lignin
concentrations (Song et al. 2013b). How these UV-induced changes in live leaf
chemistry might influence subsequent litter photodegradation is unknown. It does
appear that UV-absorbing compounds can persist for some time even in dried leaf
tissue (Ryel et al. 2010) and this may protect inner mesophyll cells in litter from
photodegradation effects. Nonetheless, the potential for these plant photochemistry
effects on decomposition suggests that differences in decomposition rates may exist
between sun- and shade leaves of the same plant as there can be significant variation
in phenolics and other chemical constituents in leaves within plant canopies
depending upon the light environment experienced during development (Barnes
et al. 2013). Also, both UV and PAR can alter leaf structure (e.g., leaf size or area,
thickness, and area/mass ratios (Fig. 1G) (Boardman 1977; Barnes et al. 2005),
which may then influence subsequent photodegradation (e.g., Anesio et al. 1999).
Changes in leaf chemistry induced by UV exposure (Fig. 1G) can, in turn,
influence decomposer organisms (Fig. 1D). For example, Gehrke et al. 1995)
found significantly lower rates of microbial decomposition in Vaccinium
uliginosum litter collected from plants growing in an arctic heathland exposed to
enhanced UV-B and attributed the differences to increased polyphenol and reduced
cellulose contents in the litter. Similar UV-induced increases in phenolics and
changes in other chemical constituents have been linked to decreases in mass loss
and/or microbial activity in decomposing leaves of Calamagrostis epigeios
(Rozema et al. 1997), Hordeum vulgare (Pancotto et al. 2005), and Alnus incana
(Kotilainen et al. 2009), but not all plant species exhibit these responses (Newsham
et al. 2001; Kotilainen et al. 2009; Song et al. 2013b).
In addition to modifying microbial decomposition through changing live leaf
chemistry, solar radiation may affect decomposition through photodegradation that
then modifies subsequent microbial decomposition (Fig. 1E!D). The
“photopriming” of litter (Table 1) may break down or partially degrade compounds,
leaving litter with a higher proportion of constituents more susceptible to microbial
decomposition. Thus, even when primary and secondary photodegradation may
have little effect on litter mass loss, respiration rates in subsequent incubations with
moisture and soil can be positively correlated with length of prior radiation
Sunlight and Soil–Litter Mixing: Drivers of Litter Decomposition in Drylands
283
exposure (Foereid et al. 2010). Photopriming may be of particular importance in the
“conditioning” of standing litter prior to its detachment and incorporation into the
soil (Fig. 1B). However, photopriming can also enhance C mineralization from
surface soil organic matter (Mayer et al. 2012). Although some laboratory studies
have not observed photopriming (Brandt et al. 2009; Kirschbaum et al. 2011), these
may have been of insufficient time, radiation intensity, or incorrect wavelengths to
produce measureable change. It is also likely that there will be considerable
variation in plant species susceptibility to photopriming, with species most susceptible to mass loss through primary photodegradation also being the most affected by
photopriming. Future photopriming experiments with multiple species in field
situations are needed to assess whether this is a frequent or important facet of the
photodegradation processes.
3.3
Evaluating the Role of Sunlight on Decomposition
in Natural Settings
It is clear from field and laboratory studies to date that UV and PAR can play
substantive roles in decomposition under experimental conditions, but it is likely
that their effect will be attenuated by other factors under field conditions. The
overall net effect of UV on litter decomposition under field conditions will reflect a
balance between positive (e.g., photodegradation, photopriming, microbially
enhanced photodegradation) and negative (e.g., microbial photoinhibition, plant
photochemistry) effects (Table 1) such that decomposition may be increased,
decreased, or unaffected by UV exposure depending on prevailing environmental
conditions and litter chemistry (Fig. 1F; e.g., Rozema et al. 1997; Moody
et al. 2001; Pancotto et al. 2005; Brandt et al. 2007; Smith et al. 2010; Uselman
et al. 2011). This balance will also be influenced by the amount, wavebands, and
timing of solar UV radiation received by litter (Fig. 1B, Song et al. 2013a).
Understanding radiation loads that litter typically experiences under field conditions and assessing the impact of these exposures on decomposition is a crucial next
step for advancing our understanding of the role of sunlight in influencing abiotic
and biotic processes in natural systems.
Little is known of the precise nature of the dose–response relationships for the
various mechanisms of UV-driven decomposition and whether there are differences
in dose responses for abiotic and biotic mechanisms. Certainly, the UV exposure of
standing and ground litter will vary over short (e.g., diurnal) and long (e.g., seasonal)
time scales, and these patterns can be modified by cloud cover (Fig. 2a, b). Indeed,
during the summer monsoon period in the North American Sonoran Desert
(July–August), clouds can reduce daily UV-B levels by 50 % relative to seasonal
maximum clear sky conditions (Fig. 2a). Due to the strong seasonality of solar UV,
the timing of litter production is also important in influencing litter UV exposure,
and differences in UV doses would be expected between dryland plant growth forms
284
P.W. Barnes et al.
Daily Plant Effec ve Irradiance (kJ m-2 d-1)
a
8.0
6.0
4.0
2.0
0.0
1
2
3
4
5
6
7
8
9
10 11 12
Month of Year
Plant Effec ve Irradiance (mW m-2)
b
Above Canopy
400
300
Understory
clouds
200
sunflecks
100
0
5 6 7 8 9 10 11 12 13 14 15 16 17 18 19
Hour of Day (MST)
Fig. 2 The surface solar UV radiation environment in a semi-desert savanna [Sonoran Desert,
Santa Rita Experimental Range (SRER), southeastern Arizona, USA; 31 470 3600 N, 110 530 400
W; elevation ca. 1,000 m]. (a) Integrated daily UV-B irradiance [weighted according to the
generalized plant action spectrum of Caldwell (1971) and normalized to unity at 300 nm] over
2012. UV measurements were made with a broadband UV sensor (UVB-1 pyranometer; Yankee
Environmental Systems, Inc.; Turners Falls, MA, USA) calibrated against a double monochromator scanning UV spectroradiometer (OL 756; Gooch & Housego, Orlando, FL, USA). (b) Representative diurnal course of plant effective UV-B irradiance above and below the canopy of an
isolated, mature Prosopis velutina shrub (Fig. 4) on 22 May 2013. Measurements were made with
calibrated broadband UV-B sensors (SKU 430; Skye Instruments, Ltd., Powys, UK)
which differ in leaf chemistry (Sect. 3.2, Fig. 1G) and also in leaf phenology and leaf
area duration (e.g. C3 and C4 grasses, grasses and shrubs, evergreen and deciduous
shrubs; Figs. 1A and 4a). High photodegradation potential is likely in settings where
the primary growing season occurs during wet, warm spring months, leaving large
Sunlight and Soil–Litter Mixing: Drivers of Litter Decomposition in Drylands
285
amounts of standing dead and surface litter exposed to solar radiation during dry,
hot summer months when cloud cover is low. Photodegradation accounted for a
substantial portion of the dry season ecosystem CO2 flux in a California annual
grassland (Rutledge et al. 2010)—ostensibly a consequence of the Mediterranean
climate. Unfortunately, many of the field UV-exclusion decomposition studies
conducted to date do not report UV or PAR irradiances, which makes it difficult
to both interpret and compare results from studies conducted at different locations
and times of year. At a minimum, total daily PAR and appropriate effective UV
irradiances (UV-B and UV-A; see below) should be reported over the time period
when decomposition data are collected.
The effectiveness of incident radiation in driving litter decomposition will be
determined, in part, by the spectral sensitivity of the underlying decomposition
processes (Fig. 1C). Action spectra represent the relative effectiveness of different
wavelengths of radiation in causing biophysical responses and are typically developed under very controlled laboratory conditions (Holmes 1997). While few action
spectra specific to decomposition have been developed, representative action spectra of related processes may yield insights. Potentially important action spectra for
biotic and abiotic processes involved in litter decomposition are shown in Fig. 3,
along with action spectra commonly used in UV photobiology studies. These
indicate that UV effects on both biotic and abiotic processes are strongly
wavelength-dependent, with shorter wavelengths showing greater quantum effectiveness than longer wavelengths (Fig. 3a). However, the slopes of these curves can
vary considerably. For example, within the UV-B range (280–320 nm), the effectiveness of UV in damaging DNA can increase five orders of magnitude with
decreasing wavelength. By comparison, UV-induced CO emission increases less
than one order of magnitude over this same waveband. The relatively flat action
spectrum for this aspect of photodegradation is consistent with experiments demonstrating that photodegradation can be caused by UV-A and visible (PAR) in
addition to UV-B (Anesio et al. 1999; Austin and Ballaré 2010).
Action spectra are used to identify potential chromophores mediating photobiological responses and, in UV studies, as weighting functions to derive measures of
biologically effective UV irradiance. In the case of weighting functions, measured
raw spectral irradiances (Fig. 3b) are multiplied by relative effectiveness derived
from the action spectrum, and then summed over the appropriate wavelength range,
to give the biologically effective radiation (Fig. 3b, Caldwell and Flint 1997). Thus,
the selection of the action spectrum can significantly influence the calculated
biologically effective radiation. Steep action spectra (e.g., microbial DNA damage)
amplify the importance of the shorter wavelengths (i.e., UV) to a greater degree
than flatter action spectra (e.g., CO emissions; Fig. 3a). Because of this, differences
in the spectral sensitivities of biotic and abiotic decomposition processes (Fig. 1C)
would have important implications for experimental procedures and for interpreting
the consequences of stratospheric ozone depletion and latitudinal UV gradients on
decomposition. For example, using a relatively steep action spectrum, such as that
286
P.W. Barnes et al.
a
b
Fig. 3 Representative action spectra and biological weighting functions used in UV photobiology
(note log scale on y-axes). (a) Relevant action spectra for biotic and abiotic processes associated
with decomposition and common action spectra used as biological weighting functions in UV
photobiology. All action spectra are normalized to unity at 300 nm and have been converted to
quantum units if originally reported in energy units. The general plant action spectrum is from
Caldwell (1971). The DNA action spectrum is for UV-induced damage to “naked” microbial DNA
(Setlow 1974). The Bacillus action spectrum is based on the inactivation of spores as reported by
Cockell et al. (2003). The Pleospora action spectrum is for UV-induced conidiation (asexual spore
production) in the fungus P. herbarum originally described by Leach and Trione (1966) as
reported by Ensminger (1993). CIE is the human erythemal action spectrum (McKinlay and
Diffey 1987a, b), a widely used weighting function to report UV irradiances and the basis for
the UV Index. The plant growth action spectrum describes the influence of UV on shoot elongation
(Flint and Caldwell 2003). The CO emission action spectrum is for savanna grass (Trachypogon
sp.) leaf litter (Schade et al. 1999). This action spectrum extends into the visible (>600 nm), but
only the UV portion is shown here. (b) UV spectral irradiance at midday under clear skies on
7 June 2011 at the SRER as measured with a UV scanning spectroradiometer (see Fig. 1), the DNA
damage action spectrum from panel a, and the calculated biologically effective UV irradiance
weighted according to the DNA action spectrum. For this spectrum, the unweighted UV-B and
UV-A irradiances are 2.5 and 43.1 W m2, respectively, and the DNA weighted UV irradiance is
0.10 W m2
Sunlight and Soil–Litter Mixing: Drivers of Litter Decomposition in Drylands
287
for DNA, to report effective UV radiation may be inappropriate for
photodegradation studies and could result in large errors if UV doses were applied
using lamps that differ in spectral composition relative to natural sunlight (i.e., UV
fluorescent bulbs, Flint and Caldwell 1996). Furthermore, the shift in the UV
spectrum in favor of the shorter wavelengths as a result of ozone depletion becomes
significant only if a relatively steep action spectrum exists (Caldwell et al. 1986).
Finally, because of latitudinal variation in stratospheric ozone thickness and
prevailing solar angles, there is a potential natural latitudinal gradient in ambient
solar UV-B (Caldwell et al. 1980; Barnes et al. 1987). However, this latitudinal UV
gradient would be trivial for responses exhibiting a relatively flat action spectrum,
such as that for CO emissions. If other photodegradation processes exhibit a
similarly flat action spectrum, this may explain, in part, why Brandt et al. (2010)
found no strong differences in UV-driven photodegradation across a latitudinal
gradient of grassland sites in North America. Because of the fundamental importance of action spectra in UV photobiology, additional studies are needed to
develop and test appropriate action spectra/weighting functions for processes
involved in litter decomposition.
The UV environment of litter in drylands also exhibits substantial spatial
variability as a result of the pronounced discontinuous nature of vegetative cover
in these ecosystems (i.e., herbaceous patches in a matrix of bare soil or tree/shrub
patches in a matrix of bare soil and herbaceous plants, Noy-Meir 1979/80; West
1983; Evenari et al. 1985). In systems with discontinuous cover of woody plants,
litter often accumulates in the understories of woody plants (Fig. 4b) and thus
receives considerably less UV (and PAR) than that in the intercanopy zones
(Fig. 2b). The UV exposure of litter will also depend on the depth of litter layer
(Henry et al. 2008) and vertical position within the litter layer (Lin and King 2013)
(Fig 1B). The angle at which litter is oriented would also have strong influences
over its exposure to solar radiation, with vertically oriented standing dead (e.g.,
grasses; Fig. 4a) potentially intercepting less radiation than would detached litter
resting horizontally on the soil surface. Orientation effects would, however, be less
for UV than PAR because of the pronounced diffuse (isotropic) nature of solar UV
radiation.
Once the litter falls to the soil surface, it may become covered with loose soil and
tightly bound soil–litter films that can block solar radiation from hitting the litter
and consequently negate photodegradation (Fig. 1I!B, Barnes et al. 2012).
Because of these complexities, quantifying the actual UV exposure of litter in
field environments is challenging. The use of inexpensive biological or synthetic
UV dosimeters (e.g., Rahn and Lee 1998; Turner et al. 2009) deployed in a variety
of habitats and conditions over varying time periods would aid in quantifying the
patterns of UV exposure at spatial and temporal scales relevant to litter
decomposition.
288
P.W. Barnes et al.
Fig. 4 Temporal and
spatial aspects of litter
production and distribution
in a semi-desert savanna
(Sonoran Desert, SRER; see
Fig. 2 for location details).
(a) End-of growing season
standing litter of the C4
grass Heteropogon
contortus with the winterdeciduous shrub, Prosopis
velutina, before leaf drop.
Note the spatial
heterogeneity in herbaceous
cover. (b) Spatial variation
in bare ground, surface litter
accumulation, and light
conditions under and near a
P. velutina canopy after leaf
drop and prior to the onset
of the growing season
(photos: S. Archer)
4 Soil–Litter Mixing and Decomposition
4.1
Soil Redistribution in Drylands
Dryland ecosystems are, by definition, water-limited, and this water limitation
usually results in a mosaic of vegetation cover that is sparse and incomplete, with
herbaceous patches in a matrix of bare soil or tree/shrub patches in a matrix of bare
soil and herbaceous plants. As a consequence of sparse and patchy ground cover,
soil erosion and associated processes of transport and deposition can be particularly
pronounced (Fig. 1H, Kirkby 1980; Heathcote 1983; Fryrear 1985; Toy et al. 2002).
Wind- and water-driven transport of soils is widely recognized as having a substantial influence on nutrient and vegetation distribution (e.g., Ludwig et al. 1997;
Okin et al. 2006; Peters et al. 2006). Even so, the mechanisms by which plant
community structure and ecosystem processes are influenced by wind and water
transport of soils are poorly understood. Different physical forces promote movement of soil via wind and water, but these processes share three critical phases:
detachment of soil particles from the soil surface, transport as overland flow or
Sunlight and Soil–Litter Mixing: Drivers of Litter Decomposition in Drylands
289
Fig. 5 Schematic representation of wind and water redistribution of soil and plant litter leading to
the development of a soil–litter matrix (Fig. 1H, I) in drylands characterized by herbaceous patches
in a matrix of bare soil or tree/shrub patches in a matrix of bare soil and herbaceous plants. In this
figure a single shrub (large plant) is surrounded by grasses (small plants) and bare ground.
Aerosols, saltating soil particles, and overland flow transfer soils and litter from areas of low
vegetation cover to areas of higher vegetation cover. Net exchanges and source–sink relationships
are mediated by the area, density, spacing, and stature of vegetated patches, the size and
connectivity of bare gaps, topography, and disturbances such as fire and grazing
aerosols, or via saltation, and deposition at a location (Toy et al. 2002). These
processes are interrelated and produce a net flux that can result in either an
accumulation or erosional loss of soil at a given location (Fig. 5). Within sites,
winderosion (net vertical dust flux) appears to be correlated with wind-driven
transport (horizontal dust flux; Whicker et al. 2006). Evaluating the role of erosion
on fine-scale processes such as decomposition requires coupled estimates of transport and deposition (Fig. 1H). Numerous studies have documented broad-scale or
long-term manifestations of wind and water erosion, but few have focused on
erosion and associated transport and especially redistribution at the finer spatial
scales (cm–m) and the shorter time frames (weeks to a few years) relevant to litter
decomposition (e.g., Whicker et al. 2002; Ludwig et al. 2005). Rates of wind
erosion are poorly documented relative to those of water erosion, even though a
recent evaluation that included major dryland ecosystem types (grassland, shrubland, woodland) found that annual rates of wind-driven soil transport could exceed
those of water-driven transport by an order of magnitude or more (Breshears
et al. 2003).
Soil transport by both wind and water is highly dependent on and sensitive to
changes in woody plant cover (Fig. 1A!H, Bagnold 1941; Fryrear 1985; Reid
et al. 1999; Wilcox et al. 2003; Warner 2004; Breshears et al. 2009). Notably, there
290
P.W. Barnes et al.
has been a strong, directional increase in woody plant cover in drylands over the
past century (Archer et al. 1995). This global-scale change has altered the quality
and quantity of litter inputs (e.g. Hibbard et al. 2003) and the spatial and temporal
patterns of erosion processes (Schlesinger et al. 1990; Okin et al. 2009a; Ravi
et al. 2009a, 2010). These shifts in grass-woody plant ratios may potentially affect
decomposition rates by mediating soil transport processes that determine rates of
soil deposition into litter (Figs. 1H!I and 5). Recent research highlights two
complementary aspects of horizontal dust flux: increased production with reduction
in grass cover (Li et al. 2007) and capture by shrubs and grasses (Field et al. 2009).
The later work highlights an important mechanism by which horizontal sediment
flux and associated nutrients are likely to be deposited onto litter beneath plant
canopies.
4.2
Litter Redistribution in Drylands
Wind and water promote the detachment and redistribution of plant litter, increasing spatial heterogeneity of litter and its nutrient constituents (Fig. 5). Although
often observed and clearly evident (Fig. 6) the magnitude, patterns of litter
redistribution, and the dynamics and ecological significance of litter mass and
nutrient transfer have seldom been quantified in drylands. Surface water flows can
redistribute detached litter and soil particles and concentrate them in ostensibly
predictable locations related to microtopography and obstructions posed by rocks,
animal disturbances, and other plants. In dryland plant communities with woody
vegetation, coarse woody debris on the soil surface can trap and retain leaf and
twig litter and soil. These accumulations presumably hasten the localized
Fig. 6 Localized accumulation of surface litter (arrows) in a semi-desert savanna (Sonoran
Desert, SRER; see Fig. 2 for location details). (a) Litter accumulation in a bare patch as a result
of microtopography. (b) Litter accumulation at the base of a small woody plant with coarse woody
debris on soil surface. Note marking pen for scale (photos: S. Archer)
Sunlight and Soil–Litter Mixing: Drivers of Litter Decomposition in Drylands
291
formation of soil–litter matrices. The self-facilitated burial of coarse woody
debris would also accelerate its breakdown.
Redistribution of surface litter by overland flow of water is supplemented by
wind-mediated transfers. Nutrient inputs can be substantially augmented by litter
transferred from upwind to downwind communities (Shen et al. 2011). Redistribution of litter by wind from ridge tops to leeward locations in the Arctic can lead to
increases in C and N inputs and subsequent increases in soil respiration in depositional locations (Fahnestock et al. 2000). As with water, litter transported by wind
accumulates in predictable locations that likely vary depending on the size, shape,
density, and mass of the litter and vegetation and landscape features that cause
turbulence and alter wind speed and direction (Fig. 1H).
Assessing the biogeochemical consequences of litter redistribution and its subsequent decomposition at a given site requires quantifying inputs (gains) and outputs (losses). Most of the litter generated by a plant falls on the ground near the
plant subsequent to detachment (input), but some litter is transported away from the
plant by wind or overland flow (output) (Fig. 5). Litter deposited near a plant’s
canopy may be supplemented by litter transferred from other plant patches on the
landscape (input). However, quantifying these litter inputs and outputs is challenging. Litter deposition has typically been quantified using litter traps, but the design
of such traps is generally strongly biased toward the collection of gravity-deposited
litter, and it is difficult to know what fraction of the litter in a trap, if any, is derived
from external sources. Quantifying litter ground cover and its change through time
offers alternative perspectives on the net outcomes of local litter gains and losses,
but here too, it is difficult to know the amount of litter arriving from external
sources. Furthermore, local surface litter cover reflects a hard-to-quantify combination of reductions (owing to burial by soil, comminution by arthropods and
weathering) and increases (associated with inputs of new litter from local or
external sources). Litter arriving from outside sources may also differ in quality
relative to that of the locally produced litter and such differences may be pronounced in drylands consisting of heterogeneous patches of annuals, perennial
grasses, and shrubs.
In locales where litter accumulates, the soil surfaces may be stabilized by
formation of the soil–litter matrix, likely reducing ground surface temperatures
and PAR and UV radiation levels. These changes could also promote the establishment of plants whose wind- and water-dispersed seeds would be likely to accumulate in the litter deposition zones. Locations where the soil–litter matrix forms via
the processes outlined in Sect. 4.1 may therefore represent nutrient cycling “hot
spots,” a nascent phase in the formation of vegetated patches and a feedback
mechanism reinforcing the persistence and expansion of vegetated patches. At the
landscape scale, the dynamics of soil–litter patches will depend on the degree of
bare gap connectivity (Okin et al. 2009b), and source–sink relationships governed
by interactions among disturbance (e.g., grazing, fire), topography, and prevailing
winds (e.g., Ravi et al. 2009b; Bestelmeyer et al. 2013). Multiple drivers interacting
across scales probably combine with positive feedbacks to govern litter–soil distribution and redistribution (e.g., D’Odorico et al. 2012).
292
4.3
P.W. Barnes et al.
Soil–Litter Mixing and Decomposition
Once litter is on the ground it is inevitably covered with varying degrees of soil or
other litter and, in some cases, fully buried (Fig. 6). Initially, litter is covered with
loose soil that can be easily dislodged. Over time, soil films consisting of soil
particles, microbes, and microbial exudates develop and adhere to the litter surface
(Fig. 7; Barnes et al. 2012; Hewins et al. 2013). Unlike loose soil, these adhering
soil films are more resistant to removal by rainfall and wind. At time scales of
weeks to months, however, soil films are dynamic and may develop or degrade in
response to temperature and moisture conditions (D. Hewins and H. Throop,
unpublished). These soil films appear to be composed of inorganic and biological
constituents with fungal hyphae and microbial exudates binding mineral particles to
each other and to the leaf surface (Fig. 7). The specific nature of the abiotic and
biotic components of these soil films and the degree and timing of soil film coverage
will likely be influenced by site-specific edaphic and vegetation factors that influence local-scale differences in soil transport (Okin and Gillette 2001; Okin 2008).
While positive correlations have been found between rates of litter decomposition and the degree of soil–litter mixing (e.g., Throop and Archer 2007), the
underlying mechanisms of this response have yet to be elucidated. Soil coverage
of litter could potentially influence decomposition by several mechanisms, with the
net effect ranging from positive to negative depending on conditions and the extent
of coverage (Fig. 1I!B, I!D). Soil may serve as a vector for microbial colonization of litter. In a laboratory incubation study, soil–litter mixing led to differences in
the quantity and composition of phospholipid fatty acids extracted from the soil–
litter matrix following the first week of the incubation, suggesting that colonization
Fig. 7 Development of soil films on Prosopis glandulosa leaf litter over time (0, 30, and 180 days
in a–c, d–f, and g–i, respectively) in a Chihuahuan Desert shrubland (Jornada Experimental
Range, New Mexico, USA; 32 330 N, 106 450 W; elevation ca. 1,190 m) illustrated by low
magnification (1.6) stereo micrographs showing entire leaflets (a, d, g), high magnification
(3.2) stereo micrographs (b, e, h), and SEM micrographs (25, 31, and 35 for c, f, and i,
respectively). In the SEM micrographs, black lines denote leaflet margins and white lines denote
the edge of the soil film (from Barnes et al. 2012)
Sunlight and Soil–Litter Mixing: Drivers of Litter Decomposition in Drylands
293
may be influenced by soil–litter mixing (Lee et al. 2014). Soil–litter mixing may
also buffer litter and resident microbes from the high temperatures and desiccation
that commonly occur in drylands (Moorhead and Reynolds 1991). These effects
could enhance decomposition by extending windows of opportunity for microbial
activity following rainfall events (e.g., Cable et al. 2011). Indeed, soil–litter mixing
strongly enhanced C mineralization in a laboratory experiment when the soil–litter
matrix was subjected to wetting–drying cycles (Lee et al. 2014). The arrival of soil
at the litter surface via saltating soil particles or the translocation of litter via
overland flow may also promote surface abrasion and increase the surface area
available to microbial colonization, leaching, or fragmentation (Throop and Archer
2009; Uselman et al. 2011). Enhanced microbial colonization of recently detached
litter may be offset by the negative effects of solar UV on microbes (Sect. 3.2), but
subsequent soil coverage, either as an adhering soil film or as loose soil, could
partially and eventually fully shield litter from UV radiation and therefore ameliorate its adverse effects (Cockell et al. 2003; Barnes et al. 2012). Soil cover may
therefore mediate photodegradation and other abiotic forces (Fig. 1D, E).
5 Integrated Conceptual Model of UV and Soil
Mixing Effects on Dryland Decomposition
Based on findings from field and laboratory studies, we have proposed a generalized
conceptual model for UV-soil mixing effects in dryland decomposition (Fig. 8,
Barnes et al. 2012). Over a continuum of soil coverage of litter from none (e.g.,
standing dead) to partial (e.g., recently detached) to full burial, the mechanisms
driving decomposition are predicted to shift from strongly abiotic (photodegradation
of standing dead driven by UV together with PAR) to strongly biotic (microbial
degradation of buried litter). Intermediate conditions consist of a combination of
these processes whose influence varies depending on the extent of development of
the soil–litter matrix, its biogeochemical constituency (e.g., litter quality, soil mineral
composition, and organic matter content of soil [Fig. 1G, I]), the microbial community composition and activity (Fig. 1D), and the prevailing moisture/temperature
conditions (Fig 1A). As the relative importance of photodegradation and microbial
decomposition change through time, the overall rate of decomposition may approximate a unimodal curve that reflects the outcome of interactions between the speed
of the concurrent drivers of decomposition and the recalcitrance of the chemical
constituents present in the litter.
294
P.W. Barnes et al.
Fig. 8 Conceptual model of dryland decomposition following leaf senescence, illustrating the
shifting relative importance of abiotic (photodegradation, Table 1) and biotic (microbial) processes through time and consequent changes in the overall rate of decomposition (Fig. 1F).
Additional processes that may be important in decomposition, such as UV effects on microbes
(Fig. 1D), leaching, fragmentation (Fig. 1E), or effects of UV on leaf chemistry/structure (Fig. 1G)
are not illustrated. Recently senesced plant material is initially subject to high rates of
photodegradation while it is standing dead (A). Limited microbial decomposition may occur on
leaf surfaces at this time. While the majority of decomposition that occurs at this time is from
photodegradation, the overall rates of decomposition remain low. When standing dead plant
material falls to the soil surface (B), the soil–litter matrix develops (Figs. 1I and 6), gradually
covering the litter (C). During this time the relative importance of photodegradation declines while
microbial decomposition increases due to colonization opportunities, favorable microclimate, or
abrasion afforded by the litter–soil matrix. Decomposition rates increase with microbial colonization, and overall rates of decomposition peak due to rapid losses of easily decomposable
chemical constituents in the litter. Negative effects of UV on microbes are small and transient
initially but increase over time in association with increased microbial biomass and activity until
soil coverage negates these negative effects. Eventually nearly all the litter surface is cover by soil
(D) and photodegradation accounts for a trivial portion of decomposition while microbial degradation prevails. The overall rate of decomposition is low as remaining litter is highly recalcitrant.
From Barnes et al. (2012)
6 Summary and Conclusions
Over the past several decades, significant progress has been made in understanding
the nature and importance of solar radiation in influencing litter decomposition in
terrestrial ecosystems. Although a number of uncertainties remain, the information
available indicates that solar UV (UV-B and UV-A) and PAR can have positive,
negative, or minimal effects on decomposition depending on the balance of abiotic
(photodegradation) and biotic (microbial) processes (Fig. 1D, E). In moisturelimited ecosystems (i.e., grasslands, savannas, and deserts), the net effects of
sunlight/UV on decomposition are generally positive and photodegradation is
now being considered as an important driver of decomposition that may account
for the discrepancies between measurements and model predictions of
Sunlight and Soil–Litter Mixing: Drivers of Litter Decomposition in Drylands
295
decomposition rates. However, the majority of studies to date that have explored the
effects of UV and PAR on decomposition in drylands have done so without
explicitly considering soil–litter mixing. While such studies may reasonably ascertain decomposition of standing plant litter, their extrapolation to decomposition of
detached plant litter on soil surfaces fails to take into account the formation of soil–
litter complexes (Fig. 1I) that can strongly mediate or even negate these abiotic
effects. Soil and litter movement and translocation are common in moisture-limited
environments with low and patchy vegetation cover, and litter on the ground is
frequently covered to varying degrees with soil and eventually buried. This mixing
of soil and litter is associated with increased rates of decomposition. Although the
mechanisms underlying these soil-mixing effects remain to be fully explored, it is
likely that the formation of soil–litter–microbial complexes enhance microbial
activity while simultaneously shielding litter from photodegradation. Thus, extrapolating the importance of photodegradation from measurements obtained in environments with either no soil or soil with restricted movement (e.g., litter boxes or
glass jars) would overestimate the importance of photodegradation. Additional
studies conducted under realistic field conditions are needed to fully explore how
solar radiation and soil coverage interact through time to influence litter decomposition in dryland ecosystems characterized by soil movement and deposition. A
greater understanding of the interactive effects of soil deposition and sunlight may
aid, at least in part, in resolving the seemingly contradictory findings reported in
photodegradation and soil deposition studies. Ongoing shifts in dryland life-form
composition (e.g., from grass to shrub domination), driven by changes in land use
and climate, will likely increase soil movement in these environments (Okin
et al. 2009b). The role of soil deposition on litter decomposition in globally
extensive dryland ecosystems may thus be magnified under future conditions.
Acknowledgments Financial support was provided by the US National Science Foundation
(DEB 0815897 [Loyola University], DEB 0815808 [New Mexico State University], DEB
0816162 [University of Arizona], DEB 0814461 [University of Kentucky]), the Loyola University
J.H. Mullahy Endowment for Environmental Biology, and the Jornada Basin LTER (DEB
0618210). Additional support was provided by the Arizona and Kentucky Agricultural Experiment
Stations, and the University of Arizona – Universidad Nacional Autonoma de Mexico Drylands
Research Consortium (#15), and US National Science Foundation (EAR 0724958 and 1331408
[University of Arizona]). We thank Jason P. Field, Daniel B. Hewins, Dean Keller, Darin J. Law,
Hanna Lee, Eva Levi, Cianna Logie, Rachel Power, Katie Predick, Theresa Melhem, and Lee
Chedister for related research and discussions.
References
Adair EC, Parton WJ, Del Grosso SJ, Silver WL, Harmon ME, Hall SA, Burke IC, Hart SC (2008)
Simple three-pool model accurately describes patterns of long-term litter decomposition in
diverse climates. Glob Change Biol 14:2636–2660
Aerts R (1997) Climate, leaf litter chemistry, and leaf litter decomposition in terrestrial ecosystems: a triangular relationship. Oikos 79:439–449
296
P.W. Barnes et al.
Agati G, Tattini M (2010) Multiple functional roles of flavonoids in photoprotection. New Phytol
186:786–793
Andrady AL, Hamid HS, Torikai A (2003) Effects of climate change and UV-B on materials.
Photochem Photobiol Sci 2:68–72
Anesio AM, Tranvik LJ, Graneli W (1999) Production of inorganic carbon from aquatic macrophytes by solar radiation. Ecology 80:1852–1859
Aphalo PJ, Albert A, Björn LO, McLeod A, Robson TM, Rosenqvist E (eds) (2013) Beyond the
visible: a handbook of best practice in plant UV photobiology. University of Helsinki,
Department of Biosciences, Division of Plant Biology, Helsinki
Archer S, Schimel DS, Holland EA (1995) Mechanisms of shrubland expansion: land use, climate
or CO2? Clim Change 29:91–99
Austin AT (2011) Has water limited our imagination for aridland biogeochemistry? Trends Ecol
Evol 26:229–235
Austin AT, Ballaré CL (2010) Dual role of lignin in plant litter decomposition in terrestrial
ecosystems. Proc Natl Acad Sci U S A 107:4618–4622
Austin AT, Vivanco L (2006) Plant litter decomposition in a semi-arid ecosystem controlled by
photodegradation. Nature 442:555–558
Bagnold RA (1941) The physics of blown sand and desert dunes. Chapman and Hall, London
Ballaré CL, Caldwell MM, Flint SD, Robinson SA, Bornman JF (2011) Effects of solar ultraviolet
radiation on terrestrial ecosystems. Patterns, mechanisms, and interactions with climate
change. Photochem Photobiol Sci 10:226–241
Barnes PW, Flint SD, Caldwell MM (1987) Photosynthesis damage and protective pigments in
plants from a latitudinal arctic/alpine gradient exposed to supplemental UV-B radiation in the
field. Arctic Alpine Res 19:21–27
Barnes PW, Shinkle JR, Flint SD, Ryel RJ (2005) UV-B radiation, photomorphogenesis and plantplant interactions. Prog Bot 66:313–340
Barnes PW, Throop HL, Hewins DB, Abbene ML, Archer SR (2012) Soil coverage reduces
photodegradation and promotes the development of soil-microbial films on dryland leaf litter.
Ecosystems 15:311–321
Barnes PW, Kersting AR, Flint SD, Beyschlag W, Ryel RJ (2013) Adjustments in epidermal
UV-transmittance of leaves in sun-shade transitions. Physiol Plant 149:200–213
Belnap J, Phillips SL, Flint SD, Money J, Caldwell MM (2008) Global change and biological soil
crusts: effects of ultraviolet augmentation under altered precipitation regimes and nitrogen
additions. Glob Change Biol 14:670–686
Berg B, Laskowski R (eds) (2005) Litter decomposition: a guide to carbon and nutrient turnover.
Elsevier, London
Bestelmeyer BT, Duniway MC, James DK, Burkett LM, Havstad KM (2013) A test of critical
thresholds and their indicators in a desertification-prone ecosystem: more resilience than we
thought. Ecol Lett 16:339–345
Bloom AA, Lee-Taylor J, Madronich S, Messenger DJ, Palmer PI, Reay DS, McLeod AR (2010)
Global methane emission estimates from ultraviolet irradiation of terrestrial plant foliage. New
Phytol 187:417–425
Boardman NK (1977) Comparative photosynthesis of sun and shade plants. Annu Rev Plant
Physiol Plant Mol Biol 28:355–377
Braga GUL, Flint SD, Miller CD, Anderson AJ, Roberts DW (2001) Variability in response to
UV-B among species and strains of Metarhizium isolated from sites at latitudes from 61 degrees
N to 54 degrees S. J Invertebr Pathol 78:98–108
Brandt LA, King JY, Milchunas DG (2007) Effects of ultraviolet radiation on litter decomposition
depend on precipitation and litter chemistry in a shortgrass steppe ecosystem. Glob Change
Biol 13:2193–2205
Brandt LA, Bohnet C, King JY (2009) Photochemically induced carbon dioxide production as a
mechanism for carbon loss from plant litter in arid ecosystems. J Geophys Res Biogeosci 114:
G02004. doi:10.1029/2008jg000772
Sunlight and Soil–Litter Mixing: Drivers of Litter Decomposition in Drylands
297
Brandt LA, King JY, Hobbie SE, Milchunas DG, Sinsabaugh RL (2010) The role of
photodegradation in surface litter decomposition across a grassland ecosystem precipitation
gradient. Ecosystems 13:765–781
Breshears DD, Whicker JJ, Johansen MP, Pinder JE (2003) Wind and water erosion and transport
in semi-arid shrubland, grassland and forest ecosystems: quantifying dominance of horizontal
wind-driven transport. Earth Surf Process Landforms 28:1189–1209
Breshears DD, Whicker JJ, Zou CB, Field JP, Allen CD (2009) A conceptual framework for
dryland aeolian sediment transport along the grassland–forest continuum: effects of woody
plant canopy cover and disturbance. Geomorphology 105:28–38
Cable J, Ogle K, Lucas R, Huxman T, Loik M, Smith S, Tissue D, Ewers B, Pendall E, Welker J,
Charlet T, Cleary M, Griffith A, Nowak R, Rogers M, Steltzer H, Sullivan P, Gestel N (2011)
The temperature responses of soil respiration in deserts: a seven desert synthesis. Biogeochemistry 103:71–90
Caldwell MM (1971) Solar UV irradiation and the growth and development of higher plants.
Photophysiology 6:131–177
Caldwell MM, Flint SD (1989) Plant response to UV-B radiation: comparing growth chamber and
field environments. In: Payer HD, Pfirrmann T, Mathy P (eds) Environmental research with
plants in closed chambers, Commission of the European Communities Report No. 26, Brussels,
pp 264–270
Caldwell MM, Flint SD (1997) Uses of biological spectral weighting functions and the need of
scaling for the ozone reduction problem. Plant Ecol 128:66–76
Caldwell MM, Robberecht R, Billings WD (1980) A steep latitudinal gradient of solar ultravioletB radiation in the arctic-alpine life zone. Ecology 61:600–611
Caldwell MM, Gold WG, Harris G, Ashurst CW (1983a) A modulated lamp system for solar
UV-B (280-320 nm) supplementation studies in the field. Photochem Photobiol 37:479–485
Caldwell MM, Robberecht R, Flint SD (1983b) Internal filters: prospects for UV-acclimation in
higher plants. Physiol Plant 58:445–450
Caldwell MM, Camp LB, Warner CW, Flint SD (1986) Action spectra and their key role in
assessing biological consequences of solar UV-B radiation change. In: Worrest RC, Caldwell
MM (eds) Stratospheric ozone reduction, solar ultraviolet radiation and plant life. Springer,
Berlin, pp 87–111
Caldwell MM, Bornman JF, Ballaré CL, Flint SD, Kulandaivelu G (2007) Terrestrial ecosystems,
increased solar ultraviolet radiation, and interactions with other climate change factors.
Photochem Photobiol Sci 6:252–266
Cockell CS, Rettberg P, Horneck G, Scherer K, Stokes MD (2003) Measurements of microbial
protection from ultraviolet radiation in polar terrestrial microhabitats. Polar Biol 26:62–69
Cockell CS, McKay CP, Warren-Rhodes K, Horneck G (2008) Ultraviolet radiation-induced
limitation to epilithic microbial growth in and deserts – dosimetric experiments in the
hyperarid core of the Atacama Desert. J Photochem Photobiol B Biol 90:79–87
Couteaux MM, Bottner P, Berg B (1995) Litter decomposition, climate and litter quality. Trends
Ecol Evol 10:363–367
D’Odorico P, Okin GS, Bestelmeyer BT (2012) A synthetic review of feedbacks and drivers of
shrub encroachment in arid grasslands. Ecohydrology 5:520–530
Day TA (1993) Relating UV-B radiation screening effectiveness of foliage to absorbingcompound concentration and anatomical characteristics in a diverse group of plants. Oecologia
95:542–550
Day TA, Neale PJ (2002) Effects of UV-B radiation on terrestrial and aquatic primary producers.
Annu Rev Ecol Syst 33:371–396
Day TA, Zhang ET, Ruhland CT (2007) Exposure to solar UV-B radiation accelerates mass and
lignin loss of Larrea tridentata litter in the Sonoran Desert. Plant Ecol 194:185–194
Denward CMT, Anesio AM, Granéli W, Tranvik LJ (2001) Solar radiation effects on decomposition of macrophyte litter in a lake littoral. Archiv fur Hydrobiologie 152:69–80
298
P.W. Barnes et al.
Duguay KJ, Klironomos JN (2000) Direct and indirect effects of enhanced UV-B radiation on the
decomposing and competitive abilities of saprobic fungi. Appl Soil Ecol 14:157–164
Ensminger PA (1993) Control of development in plants and fungi by far-UV radiation. Physiol
Plant 88:501–508
Evenari M, Noy-Meir I, Goodall DW (eds) (1985) Hot deserts and arid shrublands. Elsevier,
Amsterdam
Fahnestock JT, Povirk KL, Welker JM (2000) Ecological significance of litter redistribution by
wind and snow in arctic landscapes. Ecography 23:623–631
Field JP, Belnap J, Breshears DD, Neff JC, Okin GS, Whicker JJ, Painter TH, Ravi S, Reheis MC,
Reynolds RL (2009) The ecology of dust. Front Ecol Environ 8:423–430
Flint SD, Caldwell MM (1996) Scaling plant ultraviolet spectral responses from laboratory action
spectra to field spectral weighting factors. J Plant Physiol 148:107–114
Flint SD, Caldwell MM (2003) A biological spectral weighting function for ozone depletion
research with higher plants. Physiol Plant 117:137–144
Flint SD, Ryel RJ, Caldwell MM (2003) Ecosystem UV-B experiments in terrestrial communities:
a review of recent findings and methodologies. Agric Forest Meteorol 120:177–189
Foereid B, Bellarby J, Meier-Augenstein W, Kemp H (2010) Does light exposure make plant litter
more degradable? Plant Soil 333:275–285
Fryrear DW (1985) Soil cover and wind erosion. Trans ASAE 28:781–784
Gallo ME, Sinsabaugh RL, Cabaniss SE (2006) The role of ultraviolet radiation in litter decomposition in arid ecosystems. Appl Soil Ecol 34:82–91
Gehrke C, Johanson U, Callaghan TV, Chadwick D, Robinson CH (1995) The impact of enhanced
ultraviolet-B radiation on litter quality and decomposition processes in Vaccinium leaves from
the subarctic. Oikos 72:213–222
Gressel J, Rau W (1983) Photocontrol of fungal development. In: Shropshire W Jr, Mohr H (eds)
Photomorphogenesis, vol 16B, Encyclopedia of plant physiology. Springer, Heidelberg, pp
603–639
Gunasekera TS, Paul ND (2007) Ecological impact of solar ultraviolet-B (UV-B: 320-290 nm)
radiation on Corynebacterium aquaticum and Xanthomonas sp. colonization on tea
phyllosphere in relation to blister blight disease incidence in the field. Lett Appl Microbiol
44:513–519
Gunasekera TS, Sundin GW (2006) Role of nucleotide excision repair and photoreactivation in the
solar UVB radiation survival of Pseudomonas syringae pv. syringae B728a. J Appl Microbiol
100:1073–1083
Gunasekera TS, Paul ND, Ayres PG (1997) Responses of phylloplane yeasts to UV-B (290–320
nm) radiation: interspecific differences in sensitivity. Mycol Res 101:779–785
Heathcote RL (1983) The arid lands: their use and abuse. Longman, New York
Henry HAL, Brizgys K, Field CB (2008) Litter decomposition in a California annual grassland:
interactions between photodegradation and litter layer thickness. Ecosystems 11:545–554
Hewins DB, Archer SR, Okin GS, McCulley RL, Throop HL (2013) Soil–litter mixing accelerates
decomposition in a Chihuahuan desert grassland. Ecosystems 16:183–195
Hibbard KA, Schimel D, Archer S, Ojima D, Parton W (2003) Grassland to woodland transitions:
integrating changes in landscape structure and biogeochemistry. Ecol Appl 13:911–926
Hibbard KA, Law BE, Reichstein M, Sulzman J (2005) An analysis of soil respiration across
northern hemisphere temperate ecosystems. Biogeochemistry 73:29–70
Holmes MG (1997) Action spectra for UV-B effects on plants: monochromatic and polychromatic
approaches for analysing plant responses. In: Lumsden PJ (ed) Plants and UV-B: responses to
environmental change. Cambridge University Press, Cambridge, pp 31–50
Hughes KA, Lawley B, Newsham KK (2003) Solar UV-B radiation inhibits the growth of
Antarctic terrestrial fungi. Appl Environ Microbiol 69:1488–1491
Jacobs JL, Carroll TL, Sundin GW (2005) The role of pigmentation, ultraviolet radiation tolerance, and leaf colonization strategies in the epiphytic survival of phyllosphere bacteria. Microb
Ecol 49:104–113
Sunlight and Soil–Litter Mixing: Drivers of Litter Decomposition in Drylands
299
Johnson D (2003) Response of terrestrial microorganisms to ultraviolet-B radiation in ecosystems.
Res Microbiol 154:315–320
Kadivar H, Stapleton AE (2003) Ultraviolet radiation alters maize phyllosphere bacterial diversity.
Microb Ecol 45:353–361
Kemp PR, Reynolds JF, Virginia RA, Whitford WG (2003) Decomposition of leaf and root litter of
Chihuahuan desert shrubs: effects of three years of summer drought. J Arid Environ 53:21–39
King JY, Brandt LA, Adair EC (2012) Shedding light on plant litter decomposition: advances,
implications and new directions in understanding the role of photodegradation. Biogeochemistry 111:57–81
Kirkby MJ (1980) The problem. In: Kirkby MJ, Morgan RPC (eds) Soil erosion. Wiley, New York,
pp 1–16
Kirschbaum MUF, Lambie SM, Zhou H (2011) No UV enhancement of litter decomposition observed
on dry samples under controlled laboratory conditions. Soil Biol Biochem 43:1300–1307
Kotilainen T, Haimi J, Tegelberg R, Julkunen-Tiitto R, Vapaavuori E, Aphalo PJ (2009) Solar
ultraviolet radiation alters alder and birch litter chemistry that in turn affects decomposers and
soil respiration. Oecologia 161:719–728
Krizek DT (2004) Influence of PAR and UV-A in determining plant sensitivity and photomorphogenic responses to UV-B Radiation. Photochem Photobiol 79:307–315
Leach CM, Trione EJ (1966) An action spectrum for light-induced sporulation of Pleospora
herbarum and Alternaria dauci. Photochem Photobiol 5:621–630
Lee H, Rahn T, Throop H (2012) An accounting of C-based trace gas release during abiotic plant
litter degradation. Glob Change Biol 18:1185–1195
Lee H, Fitzgerald J, Hewins DB, McCulley RL, Archer SR, Rahn T, Throop HL (2014) Soil-litter
mixing effects are limited to early stage decomposition and modified by soil moisture in a
controlled environment study. Soil Biol Biochem 72:123–132
Li J, Okin GS, Alvarez L, Epstein H (2007) Quantitative effects of vegetation cover on wind
erosion and soil nutrient loss in a desert grassland of southern New Mexico. Biogeochemistry
85:317–332
Lin Y, King JY (2013) Effects of UV exposure and litter position on decomposition in a California
grassland. Ecosystems. doi:10.1007/s10021-013-9712-x
Ludwig JA, Tongway DJ, Freudenberger D, Noble J, Hodgkinson K (1997) Landscape ecology
function and management: principles from Australia’s rangelands. CSIRO, Collingwood,
Australia
Ludwig JA, Wilcox BP, Breshears DD, Tongway DJ, Imeson AC (2005) Vegetation patches and
runoff–erosion as interacting ecohydrological processes in semiarid landscapes. Ecology
86:288–297
Ma S, Baldocchi D, Hatala J, Detto JM, Yuste J (2012) Are rain-induced ecosystem respiration
pulses enhanced by legacies of antecedent photodegradation in semi-arid environments? Agric
Forest Meteorol 154–155:203–213
Mayer LM, Thornton KR, Schick LL, Jastrow JD, Harden JW (2012) Photodissolution of soil
organic matter. Geoderma 170:314–321
McKinlay AF, Diffey BL (1987a) A reference action spectrum for ultra-violet induced erythema in
human skin. In: Passchier WF, Bosnjakovic BF (eds) Human exposure to ultraviolet radiation:
risks and regulations. Elsevier, Amsterdam, pp 83–87
McKinlay AF, Diffey BL (1987b) A reference action spectrum for ultraviolet induced erythemal in
human skin. CIE J 6:17–22
McLeod AR, Fry SC, Loake GJ, Messenger DJ, Reay DS, Smith KA, Yun BW (2008) Ultraviolet
radiation drives methane emissions from terrestrial plant pectins. New Phytol 180:124–132
Meentemeyer V (1978) Macroclimate and lignin control of litter decomposition rates. Ecology
59:465–472
Moody SA, Newsham KK, Ayres PG, Paul ND (1999) Variation in the responses of litter and
phylloplane fungi to UV-B radiation (290-315 nm). Mycol Res 103:1469–1477
300
P.W. Barnes et al.
Moody SA, Paul ND, Björn LO, Callaghan TV, Lee JA, Manetas Y, Rozema J, GwynnJones D,
Johanson U, Kyparissis A, Oudejans AMC (2001) The direct effects of UV-B radiation on
Betula pubescens litter decomposing at four European field sites. Plant Ecol 154:27–36
Moorhead DL, Reynolds JF (1991) A general model of litter decomposition in the northern
Chihuahuan Desert. Ecol Model 56:197–219
Nagahashi G, Douds DD (2003) Action spectrum for the induction of hyphal branches of an
arbuscular mycorrhizal fungus: exposure sites versus branching sites. Mycol Res 107:1075–
1082
Newsham KK, McLeod AR, Roberts JD, Greenslade PD, Emmett BA (1997) Direct effects of
elevated UV-B radiation on the decomposition of Quercus robur leaf litter. Oikos 79:592–602
Newsham KK, Anderson JM, Sparks TH, Splatt P, Woods C, McLeod AR (2001) UV-B effect on
Quercus robur leaf litter decomposition persists over four years. Glob Change Biol 7:479–483
Noy-Meir I (1979/80) Structure and function of desert ecosystems. Isr J Bot 28:1–19
Okin GS (2008) A new model of wind erosion in the presence of vegetation. J Geophys Res 113:
F02S10. doi:10.1029/2007JF000758
Okin GS, Gillette DA (2001) Distribution of vegetation in wind-dominated landscapes: implications for wind erosion modeling and landscape processes. J Geophys Res 106:9673–9684
Okin GS, Herrick JE, Gillette DA (2006) Multi-scale controls on and consequences of aeolian
processes in landscape change in arid and semiarid environments. J Arid Environ 65:253–275
Okin GS, D’Odorico P, Archer SR (2009a) Impact of feedbacks on Chihuahuan desert grasslands:
transience and metastability. J Geophys Res Biogeosci 114:G01004. doi:10.1029/
2008JG000833
Okin GS, Parsons AJ, Wainwright J, Herrick JE, Bestelmeyer BT, Peters DC, Fredrickson EL
(2009b) Do changes in connectivity explain desertification? Bioscience 59:237–244
Osman S, Peeters Z, LaDuc MT, Mancinelli R, Ehrenfreund P, Venkateswaran K (2008) Effect of
shadowing on survival of bacteria under conditions simulating the Martian atmosphere and UV
radiation. Appl Environ Microbiol 74:959–970
Pancotto VA, Sala OE, Cabello M, Lopez NI, Robson TM, Ballaré CL, Caldwell MM, Scopel AL
(2003) Solar UV-B decreases decomposition in herbaceous plant litter in Tierra del Fuego,
Argentina: potential role of an altered decomposer community. Glob Change Biol 9:1465–
1474
Pancotto VA, Sala OE, Robson TM, Caldwell MM, Scopel AL (2005) Direct and indirect effects
of solar ultraviolet-B radiation on long-term decomposition. Glob Change Biol 11:1982–1989
Parton W, Silver WL, Burke IC, Grassens L, Harmon ME, Currie WS, King JY, Adair EC, Brandt
LA, Hart SC, Fasth B (2007) Global-scale similarities in nitrogen release patterns during longterm decomposition. Science 315:361–364
Paul ND, Moore JP, McPherson M, Lambourne C, Croft P, Heaton JC, Wargent JJ (2012)
Ecological responses to UV radiation: interactions between the biological effects of UV on
plants and on associated organisms. Physiol Plant 145:565–581
Paulino-Lima IG, Azua-Bustos A, Vicuña R, González-Silva C, Salas L, Teixeira L, Rosado A, da
Costa Leitao AA, Lage C (2013) Isolation of UVC-tolerant bacteria from the Hyperarid
Atacama Desert, Chile. Microb Ecol 65:325–335
Peters DPC, Bestelmeyer BT, Herrick JE, Fredrickson EL, Monger HC, Havstad KM (2006)
Disentangling complex landscapes: new insights into arid and semiarid system dynamics.
Bioscience 56:491–501
Rahn R, Lee MA (1998) Iodouracil as a personal dosimeter for solar UVB. Photochem Photobiol
68:173–178
Rangel DEN, Braga GUL, Flint SD, Anderson AJ, Roberts DW (2004) Variations in UV-B
tolerance and germination speed of Metarhizium anisopliae conidia produced on insects and
artificial substrates. J Invertebr Pathol 87:77–83
Ravi S, D’Odorico P, Collins SL, Huxman TE (2009a) Can biological invasions induce desertification? New Phytol 181:512–515
Sunlight and Soil–Litter Mixing: Drivers of Litter Decomposition in Drylands
301
Ravi S, D’Odorico P, Wang L, White C, Okin G, Macko S, Collins S (2009b) Post-fire resource
redistribution in desert grasslands: a possible negative feedback on land degradation. Ecosystems 12:434–444
Ravi S, Breshears DD, Huxman TE, D’Odorico P (2010) Land degradation in drylands: interactions
among hydrologic, aeolian erosion and vegetation dynamics. Geomorphology 116:236–245
Reid KD, Wilcox BP, Breshears DD, MacDonald L (1999) Runoff and erosion in a piñon-juniper
woodland: influence of vegetation patches. Soil Sci Soc Am J 63:1869–1879
Rozema J, Tosserams M, Nelissen HJM, Vanheerwaarden L, Broekman RA, Flierman N (1997)
Stratospheric ozone reduction and ecosystem processes: enhanced UV-B radiation affects
chemical quality and decomposition of leaves of the dune grassland species Calamagrostis
epigeios. Plant Ecol 128:284–294
Rutledge S, Campbell DI, Baldocchi D, Schipper LA (2010) Photodegradation leads to increased
carbon dioxide losses from terrestrial organic matter. Glob Change Biol 16:3065–3074
Ryel RJ, Flint SD, Barnes PW (2010) Solar UV-B radiation and global dimming: effects on plant
growth and UV-shielding. In: Gao W, Schmoldt DL, Slusser J (eds) UV radiation in global climate
change. Measurements, modeling and effects on ecosystems. Springer, New York, pp 370–394
Schade GW, Crutzen PJ (1999) CO emissions from degrading plant matter (II). Estimate of a
global source strength. Tellus Ser B Chem Phys Meteorol 51:909–918
Schade GW, Hofmann RM, Crutzen PJ (1999) CO emissions from degrading plant matter (I).
Measurements. Tellus Ser B Chem Phys Meteorol 51:889–908
Schlesinger WH, Reynolds JF, Cunningham GL, Huenneke LF, Jarrell WM, Virginia RA,
Whitford WG (1990) Biological feedbacks in global desertification. Science 24:1043–1048
Searles PS, Flint SD, Caldwell MM (2001) A meta-analysis of plant field studies simulating
stratospheric ozone depletion. Oecologia 127:1–10
Setlow RB (1974) The wavelengths in sunlight effective in producing skin cancer: a theoretical
analysis. Proc Natl Acad Sci U S A 71:3363–3366
Shen W, Lin Y, Jenerette G, Wu J (2011) Blowing litter across a landscape: effects on ecosystem
nutrient flux and implications for landscape management. Landsc Ecol 26:629–644
Smith WK, Gao W, Steltzer H, Wallenstein MD, Tree R (2010) Moisture availability influences
the effect of ultraviolet-B radiation on leaf litter decomposition. Glob Change Biol 16:484–495
Song X, Jiang H, Zhang HL, Peng CH, Yu SQ (2011) Elevated UV-B radiation did not affect
decomposition rates of needles of two coniferous species in subtropical China. Eur J Soil Biol
47:343–348
Song XZZ, Zhang HLL, Chang SX, Jiang H, Peng CHH, Yu SQQ (2012) Elevated UV-B radiation
increased the decomposition of Cinnamomum camphora and Cyclobalanopsis glauca leaf litter
in subtropical China. J Soils Sediments 12:307–311
Song X, Peng C, Jiang H, Zhu Q, Wang W (2013a) Direct and indirect effects of UV-B exposure
on litter decomposition: a meta-analysis. PLoS One 8(6):e68858. doi:10.1371/journal.pone.
0068858
Song XZ, Zhang HL, Jiang H, Donaldson LA, Wang HL (2013b) Influence of elevated UV-B
radiation on leaf litter chemistry and subsequent decomposition in humid subtropical China. J
Soils Sediments 13:846–853
Throop HL, Archer SR (2007) Interrelationships among shrub encroachment, land management,
and litter decomposition in a semidesert grassland. Ecol Appl 17:1809–1823
Throop HL, Archer SR (2009) Resolving the dryland decomposition conundrum: some new
perspectives on potential drivers. Prog Bot 70:171–194
Toy TJ, Foster GR, Reynard KG (2002) Soil erosion: processes, prediction, measurement and
control. Wiley, New York
Turner J, Parisi AV, Turnbull DJ (2009) Dosimeter for the measurement of plant damaging solar
UV exposures. Agric Forest Meteorol 149:1301–1306
Ulevičius V, Pečiulyte D, Lugauskas A, Andriejauskiene J (2004) Field study on changes in
viability of airborne fungal propagules exposed to UV radiation. Environ Toxicol 19:437–441
302
P.W. Barnes et al.
Uselman SM, Snyder KA, Blank RR, Jones TJ (2011) UVB exposure does not accelerate rates of
litter decomposition in a semi-arid riparian ecosystem. Soil Biol Biochem 43:1254–1265
Verhoef HA, Verspagen JMH, Zoomer HR (2000) Direct and indirect effects of ultraviolet-B
radiation on soil biota, decomposition and nutrient fluxes in dune grassland soil systems. Biol
Fertil Soils 31:366–371
Wargent JJ, Jordan BR (2013) From ozone depletion to agriculture: understanding the role of UV
radiation in sustainable crop production. New Phytol 197:1058–1076
Warner TT (2004) Desert meteorology. Cambridge University Press, New York
West N (ed) (1983) Temperate deserts and semi-deserts, vol 5, Ecosystems of the world. Elsevier,
Amsterdam
Whicker JJ, Breshears DD, Wasiolek PT, Kirchner TB, Tavani RA, Schoep DA, Rodgers JC
(2002) Temporal and spatial variation of episodic wind erosion in unburned and burned
semiarid shrubland. J Environ Qual 31:599–612
Whicker JJ, Pinder JE, Breshears DD (2006) Increased wind erosion from forest wildfire: implications for contaminant-related risks. J Environ Qual 35:468–478
Whitford WG, Meentemeyer V, Seastedt TR, Cromack K, Crossley DA, Santos P, Todd RL, Waide
JB (1981) Exceptions to the AET model – deserts and clear-cut forest. Ecology 62:275–277
Wilcox BP, Breshears DD, Allen CD (2003) Ecohydrology of a resource-conserving semiarid
woodland: effects of scale and disturbance. Ecol Monogr 73:223–239
Zaller JG, Caldwell MM, Flint SD, Ballare CL, Scopel AL, Sala OE (2009) Solar UVB and
warming affect decomposition and earthworms in a fen ecosystem in Tierra del Fuego,
Argentina. Glob Change Biol 15:2493–2502
Zepp RG, Callaghan T, Erickson D (1995) Effects of increased solar ultraviolet radiation on
biogeochemical cycles. Ambio 24:181–187
Zucconi L, Ripa C, Selbmann L, Onofri S (2002) Effects of UV on the spores of the fungal species
Arthrobotrys oligospora and A. ferox. Polar Biol 25:500–505
Interspecific Competition in Arabidopsis
thaliana: A Knowledge Gap Is Starting
to Close
Maik Bartelheimer, Christoph Schmid, Joana Storf, Katharina Hell,
and Sibylle Bauer
Contents
1 Why Study Interspecific Interactions in Arabidopsis thaliana . . . . . . . . . . . . . . . . . . . . . . . . . . . .
1.1 Ecological Characteristics of Arabidopsis thaliana . . . . . . . . . . . . . . . . . . . . . . . . . . . . . . . . .
1.2 Advantages Offered by the Arabidopsis Molecular Toolbox . . . . . . . . . . . . . . . . . . . . . . .
2 Literature Survey . . . . . . . . . . . . . . . . . . . . . . . . . . . . . . . . . . . . . . . . . . . . . . . . . . . . . . . . . . . . . . . . . . . . . . . . . . . .
2.1 Studies Examining Competitive Effects of A. thaliana . . . . . . . . . . . . . . . . . . . . . . . . . . . . .
2.2 Studies Examining Competitive Response of A. thaliana . . . . . . . . . . . . . . . . . . . . . . . . . . .
3 Conclusions . . . . . . . . . . . . . . . . . . . . . . . . . . . . . . . . . . . . . . . . . . . . . . . . . . . . . . . . . . . . . . . . . . . . . . . . . . . . . . . . . .
References . . . . . . . . . . . . . . . . . . . . . . . . . . . . . . . . . . . . . . . . . . . . . . . . . . . . . . . . . . . . . . . . . . . . . . . . . . . . . . . . . . . . . . .
304
304
305
307
307
310
315
316
Abstract The model species Arabidopsis thaliana offers an interesting ecological
background as a non-mycorrhizal annual species and it can be analysed by outstanding molecular tools. However, its interspecific interactions are scarcely
analysed, especially its competitive effect, which is found to be strong despite the
species’ small size. A. thaliana’s competitive response has received more attention
during the last few years. Mechanisms were found to be multi-faceted and to
involve resource competition for shifting limiting resources, impacts of environmental factors including environmental stress, perception of neighbours as well as
responses to allelopathy and neighbour-associated mycorrhiza. Most mechanisms
underlying A. thaliana interspecific interactions still require clarification and offer
research perspectives both for plant molecular biology and plant ecology.
M. Bartelheimer (*) • C. Schmid • J. Storf • K. Hell • S. Bauer
Institute of Botany, Faculty of Biology and Preclinical Medicine, University of Regensburg,
93040 Regensburg, Germany
e-mail: maik.bartelheimer@biologie.uni-regensburg.de;
christoph.schmid@biologie.uni-regensburg.de; joana.storf@stud.uni-regensburg.de;
katharina.hell@stud.uni-regensburg.de; sibylle.bauer@biologie.uni-regensburg.de
© Springer International Publishing Switzerland 2015
U. Lüttge, W. Beyschlag (eds.), Progress in Botany, Progress in Botany 76,
DOI 10.1007/978-3-319-08807-5_12
303
304
M. Bartelheimer et al.
1 Why Study Interspecific Interactions in Arabidopsis
thaliana
Plant–plant interactions can either occur between individuals of the same species
(intraspecific) or between individuals of different species (interspecific). In natural
ecosystems up to 89 species can co-occur on a single square metre (Wilson
et al. 2012), meaning that interspecific encounters are very common in vascular
plants. Different views exist on the relative intensity of intraspecific competition
and interspecific competition. One common notion is that competition between
individuals of the same species should be most intense, because they have exactly
the same resource requirements and their niche overlap should therefore be maximal (e.g. MacArthur and Levins 1967). However, practically all plants have a
common requirement for a basic set of resources, whether they are conspecifics or
not, since they all need light, water, and mineral nutrients. Hence, the intensity of
resource competition is not so much ruled by the degree of niche overlap, but by the
question which resource is limiting plant growth at a site and which species is most
efficient in its uptake (Tilman 1982). Whether a species can occur at a site is
therefore strongly co-determined by its adaptations and its interspecific interactions. Ecological research has intensely investigated interspecific interactions and
some species are especially favoured. For instance, a keyword based search by the
ISI Web of Knowledge search engine (accessed December 2013) produces 62 hits
for the term combination ‘Lolium perenne’ AND ‘interspecific competition’ and it
produced 56 hits, when the species name is replaced by ‘Trifolium repens’.
However, the else most commonly used model species A. thaliana is almost
neglected in the topic of interspecific interaction research (23 hits, of which many
only used ‘Arabidopsis thaliana’ as a ‘KeyWord Plus’). This finding contrasts to
the obvious advantages the species has to offer considering its interesting ecology
as a non-mycorrhizal, (winter-)annual species and the molecular toolbox that has
been developed to facilitate its use in research.
1.1
Ecological Characteristics of Arabidopsis thaliana
Arabidopsis thaliana (L.) Heynh. (mouse-ear cress) is a small flowering plant in the
mustard family (Brassicaceae) widely used as a model organism in plant molecular
genetics (see below). It is a rosette annual (rarely biennial) native to Europe, North
Africa and North America (Mitchell-Olds 2001), with a maximum height of 40
(-70) cm (Tutin et al. 1993). A. thaliana mainly occurs in open or disturbed rocky,
sandy or loamy habitats, for example riversides, roadsides or rocky hills
(Al-Shehbaz and O’Kane 2002). In Europe it belongs to the plant association of
Sedo-Scleranthetea with persistent, succulent or summer annual species (Sempervivum arachnoideum, S. soboliferum and S. tectorum, Sedum acre and S. annuum,
Potentilla neumanniana, Myosotis ramosissima, Cerastium glutinosum). It also
Interspecific Competition in Arabidopsis thaliana: A Knowledge Gap Is. . .
305
occurs in the association of Aperion spicae-venti (Apera spica-venti, Centaurea
cyanus, Vicia hirsuta and V. angustifolia) on nutrient poor fields and DigitarioSetarion (Erodium cicutarium, Galinsoga parviflora and G. ciliata, Setaria viridis,
S. glauca, S. digitaria and S. ischaemum, Echinochloa crus-galli, Stachys arvensis,
Anchusa arvensis, Chrysanthemum segetum) on dry sandy and loamy soils
(Oberdorfer 2001; Pott 1995). A. thaliana is classified as a ruderal/stress-tolerant
species (Grime et al. 2007) and exhibits rapid growth and is able to complete its life
cycle in less than 6 weeks with prolific seed production and high rates of germination. Considering that competition is often assumed to be of lesser relevance for
short-lived and prolific seed producing species occurring in disturbed habitats
(Grime et al. 2007), the ecology of A. thaliana and most of its plant properties
would not suggest a species of strong competitive ability, nor that competition is of
major importance during its life cycle. Yet, A. thaliana usually co-occurs with
15–23 species per m2 (Grime et al. 2007), making interspecific encounters likely.
Furthermore, a number of studies find strong competitive ability in the species
(e.g. Bauer 2010; Müller and Bartelheimer 2013), describing its extraordinarily fine
roots as a potential reason for this. A. thaliana’s high reproductive efficiency could
give a hint to its high competitive ability, because reproductive efficiency has been
proposed as a hypothesis for explaining evolutionary success of small species
(Aarssen et al. 2006). By producing a higher number of offspring, genetic variants
are generated faster and could allow for better adaptation to changing environments
with the opportunity for emergence of new ecotypes. Also, Bonser and Ladd (2011)
point out that competition has been important in the evolution of strategies in many
A. thaliana genotypes. Over 750 natural accession of A. thaliana are available from
seed stock centres like ABRC and NASC. Beyond morphology they vary for
example in flowering time, seed dormancy, resistance to pathogens, enzyme activity, DNA methylation and gene expression level (Koornneef et al. 2004). The
species is non-mycorrhizal, but it does have symbiotic endophytic fungi like
Piriformospora indica (Peškan‐Berghöfer et al. 2004; Sherameti et al. 2008). The
bacterial flora hosted by Arabidopsis roots is in part dependent on soil type, but
notably it is in part also typical of the plant species (Bulgarelli et al. 2012).
1.2
Advantages Offered by the Arabidopsis Molecular
Toolbox
The possibilities offered by the use of the model species A. thaliana for answering
ecological questions are highly diverse and valuable. One advantage is its small
genome of 125 Mbp consisting of five chromosomes, which was fully sequenced in
the year 2000 (Arabidopsis Genome Initiative 2000). This makes the species most
suitable for combining morphological studies with molecular analyses. The knowledge of the plant’s genome, proteome and metabolome greatly facilitates working
procedures, starting from simple in silico work, through availability of suitable
306
M. Bartelheimer et al.
hard- and software (e.g. for micro-array analyses), to data interpretation based on
current information on gene function. For most genes (77 %) such functional
annotations have already been assigned (Lamesch et al. 2012). These can be used
for the identification of regulatory mechanisms reacting to the applied manipulation. Not only do so-called “omics studies” provide the opportunity to gain insights
into the physiological background of any given experimental manipulation. The
existence and availability of a wide range of mutant lines (cf. TAIR; Lamesch
et al. 2012) and well-established laboratory techniques, such as quantitative PCR
techniques, RNAi, GC/MS analysis or immunolabelling, allow for studying such
mechanisms in any detail both in vitro and in vivo. Furthermore, many
characterised natural Arabidopsis ecotypes can be purchased, offering the opportunity to study their differential reactions to the intended manipulation. Additionally, data can be transferred to species related to A. thaliana quite easily. For many
ecological topics these possibilities have already been adopted with good success.
Proteome studies already have provided valuable information on several topics in
plant ecology, e.g. in plant–microbe interactions (Kav et al. 2007; Cheng
et al. 2010). In pollination biology the combined informations gained from
metabolomics, proteomics and genomics led to a quite detailed understanding of
the underlying mechanisms for both plants and insects (Heil 2011). As a very
versatile set of tools without the need of sequence information, metabolomic studies
have a broad range of applications (Macel et al. 2010). Successful applications
include the chemical ecology of plant–herbivore interactions (e.g. Ramadan
et al. 2011). A variety of transcriptome studies on the reactions to abiotic stressors
has already been conducted. One example here is the identification of a conserved
set of genes in iron deficiency responses of several A. thaliana ecotypes (e.g. Stein
and Waters 2012). Concerning interactions with other organisms, much progress
has been made, e.g. in plant–pathogen interactions (e.g. Attard et al. 2010) or in
using Medicago truncatula as a model species in mutualistic communities
(e.g. Küster et al. 2007). Even for plant–plant interactions some exciting research
including transcriptome analysis has been conducted. However, the latter is true
only for intraspecific competition (Biedrzycki et al. 2011; Masclaux et al. 2012). So
far research on interspecific competition has scarcely made use of the advantages
brought about by the model species in experimental research. What is more, there
are only a very limited number of studies on A. thaliana that deal with its
characteristics in interspecific competition. To our knowledge there are currently
only 13 publications that are in one way or another related to the topic in question
(see below). Some of these involve the use of different ecotypes in order to
investigate their differences in competitive effect and response, and few make
attempts to profit from the model species as a molecular toolbox.
For these reasons, we believe that interspecific interactions of A. thaliana will be
interesting for at least two large groups of researchers with (1) interaction ecologists
wishing to make use of the molecular possibilities offered by a model plant’s
molecular toolbox and (2) plant scientists working with A. thaliana and wishing
to elaborate on the (interaction-)ecological relevance of their findings.
Interspecific Competition in Arabidopsis thaliana: A Knowledge Gap Is. . .
307
2 Literature Survey
Existing literature was screened using the Web of Knowledge v.5.12 search engine
(assessed in December 2013) with the following keyword combinations:
‘Arabidopsis thaliana AND interspecific AND competition’, ‘Arabidopsis thaliana
AND interspecific AND interaction’, ‘Arabidopsis thaliana AND allelopathy’.
There are but 13 studies examining interspecific interactions of A. thaliana, 10 of
which were published only during the last 5 years (Table 1).
We structure these studies following one of the most important distinctions in
plant–plant interaction ecology, competitive effect and competitive response
(Goldberg and Fleetwood 1987). The competitive effect is one component of
competitive ability describing how strongly a plant or species of interest affects
its neighbour’s performance. The competitive response is the second component of
competitive ability describing how strongly the plant or species of interest is
affected by its neighbours, i.e. its tolerance to competition.
2.1
Studies Examining Competitive Effects of A. thaliana
In a greenhouse pot experiment, Bauer (2010) used A. thaliana wild type from field
collections to compare its competitive effect on a phytometer, Hieracium pilosella.
The latter is known to be a sensitive indicator of competitive pressure (Weigelt
et al. 2007). A. thaliana was found to inflict stronger competitive effects than any
other of the tested sandy grassland species including two forbs (Cerastium
semidecandrum and H. pilosella) and two grasses (Deschampsia flexuosa and
Koeleria glauca). The astonishing finding in this was that A. thaliana had the
lowest biomass of all species (together with D. flexuosa), meaning that the smallest
species had the largest competitive effect. Plant size (or biomass as its surrogate) is
often seen as a prime plant property lending competitive ability, since large plants
are especially capable of extensive resource uptake. Here, A. thaliana represents an
example of a strong effect competitor of small plant size, posing the question by
which mechanism this competitive pressure is inflicted. The following synopsis is
intended to give an overview of current knowledge on this topic (also see Table 1).
Apparently, these mechanisms do not involve negative allelopathic effects. To
the contrary, in a study by Tomita-Yokotani et al. (2003) germination and growth of
seeds of Celosia cristata exposed to germinating seeds of A. thaliana wild type on
agar petri dishes were promoted as compared to the control (i.e. in absence of
A. thaliana). In a second part experiment, this promotive effect could be tracked to
seedling exudates. While this one single study on A. thaliana allelopathic effects is
insufficient for a sound statement, negative allelopathic interactions are an unlikely
explanation for A. thaliana competitive effects. In fact, two manipulative studies by
Bossdorf et al. (2009) and Müller and Bartelheimer (2013) suggest that the background to A. thaliana competitive ability is a multi-faceted matter. Bossdorf
Competitive effect/competitive
response
Competitive effect/competitive
response
Celosia cristata
Senecio vulgaris/Anagallis arvensis (densities 0 or 1 per pot)
H. pilosella for Competitive effect. Species mixture of Aira caryophyllea,
Conyza canadensis, Deschampsia
flexuosa, Hieracium pilosella, Rumex
acetosella for competitive response
Brachypodium distachyon (densities 0 or
1 per pot)
Trifolium repens
Shokei (wild collection at Shokei
University, Japan)
Various wild-type
genotypes collected from across
Europe
Col-0
n.a.
Effect and response concerning
metabolites
Response of A. thaliana in biomass
and metabolic fingerprinting.
Effect of A. thaliana on its neighbour’s biomass and metabolic
fingerprint
Allelopathic effect of A. thaliana
seeds
H. pilosella
Col-0
Examined feature
Competitive effect
Competing species
Ecotype of A. thaliana
Wild type; field
collection (Bayreuth, Germany)
Table 1 Overview of studies examining A. thaliana interactions with other species
Outcome of interaction
Biomass in A. thaliana sig. reduced by
neighbour. Neighbour biomass unaffected by A. thaliana, but allocation
measures responded
Metabolic fingerprint: no changes in
A. thaliana, significant changes in
B. distachyon
Interaction increases 34 metabolites in
A. thaliana and decreases another 54;
conversely it increases 20 metabolites
in T. repens and decreases another 33
Competitive effect of A. thaliana was
stronger than that of four other species, despite A. thaliana had the lowest biomass
Growth of Celosia cristata seedlings promoted when A. thaliana seeds were
present in the petri dish
Clear ranking of competitive ability
(Senecio > Arabidopsis > Anagallis).
Competitive effect (especially on
Anagallis) depended on genotype
Competitive response ability was highly
context-dependent (diverse responses
of genotypes to the different
neighbours)
Aberrant root phenotypes with differential
impact on competitive ability in
competitive effect/competitive
response
Pedersen
et al. (2013)
Gidman
et al. (2003)
Müller and
Bartelheimer
(2013)
Bossdorf
et al. (2009)
Tomita-Yokotani
et al. (2003)
Bauer (2010)
308
M. Bartelheimer et al.
Competitive response and
transcriptomic reactions
Competitive response in root secreted
proteins
Competitive response
H. pilosella (densities 0 or 1 per pot)
Capsella rubella (densities 0 or 1 per
magenta box)
Phragmites australis, genotypes BB and
P38 Exp. 1 densities 0 or 1 per pot.
Exp. 2 densities 0 or 1 per pot; with/
without activated charcoal
Exp. 1. Arbuscular mycorrhiza
(AM) supported by Trifolium
pratense (densities 0 or 3 per pot)
Exp. 2. AM supported by Lolium
multiflorum (densities 0 or 3 per pot)
Col-0
Col-0
Competitive response
Competitive response
Bromus inermis/Andropogon gerardii
(densities 0 or 2 per pot)
Various ecotypes from
Europe and North
America
Col-0
Exp. 1: Col-0; Exp. 2:
Col-0; myb72-1;
jin1-2
Competitive response
Artificial communities dominated by
forbs, grasses or legumes
Mix of various
genotypes
Competitive response
Poa annua (density 0, 4, or 8 per pot)
Inbred lines of Col-0
and Ri-0
Strong transcriptomic reactions induced
by neighbour. Similarity between
neighbour perception and pathogen
response
Levels of root excreted defense-related
proteins significantly increased with
C. rubella
At the same time, the number of individual proteins identified was reduced
Survival drastically reduced with
P. australis. Charcoal strongly
increased seed survival to match survival under control conditions
Presence of a neighbour, albeit divided
from A. thaliana by nylon mesh, significantly reduced A. thaliana growth.
With AM inoculums, this effect was
strongly reinforced
Competition delays anthesis, reduces
flowering time and the duration of the
period of reproduction. It also reduces
seed output, though this was not statistically significant
Seedling emergence reduced in forbdominated as compared to grassdominated communities
Competitive pressure from both grasses
reduced in elevated CO2
Veiga
et al. (2013)
Rudrappa
et al. (2007)
Badri
et al. (2012)
Schmid
et al. (2013)
Lau et al. (2010)
Hovick
et al. (2012)
Brachi
et al. (2012)
Interspecific Competition in Arabidopsis thaliana: A Knowledge Gap Is. . .
309
310
M. Bartelheimer et al.
et al. (2009) found a clear competition hierarchy in three forbs when examining
Senecio vulgaris, Anagallis arvensis and A. thaliana in a pot experiment with a
presence/absence approach. Interestingly, competitive effect of A. thaliana varied
between its genotypes. In addition, the competitive effect of A. thaliana on the
inferior A. arvensis also varied with the nutrient or clipping treatment the
Arabidopsis maternal generation had previously received (maternal effects). A
part experiment with activated carbon showed that allelopathy was not involved
in A. thaliana’s competitive effect. In a recent study, Müller and Bartelheimer
(2013) focused on a single plant property (root hairs) and its role for competitive
ability. Their pot experiment with phosphorus-deficient soil examined competitive
effects of wild type or of aberrant root phenotypes either in intraspecific competition or on the above-mentioned phytometer H. pilosella. Differences between root
phenotypes were strongest in intraspecific competition, but they also showed in
interspecific interaction, where wild type was stronger than the aberrant phenotypes. Following a metabolomic approach, Gidman et al. (2003) used an additive
design in a greenhouse experiment and cultivated Brachypodium distachyon and
A. thaliana either as solitary plants or in 1:1 mixtures. While Arabidopsis’ competitive effect on B. distachyon was negligible in terms of total biomass, it did
impact on B. distachyon’s allocation and metabolism. Root–shoot allocation was
significantly shifted towards higher root biomass, possibly indicating the importance of below ground processes in this experiment. Likewise, the general
metabolomic fingerprint was significantly altered, though specific patterns were
indistinct. Clearly, to date only incomplete knowledge exists on what determines
the often considerable competitive effect of A. thaliana on other species. While it
appears that plant size and allelopathy can be excluded, an array of other factors
concerning resource competition remains to be explored. The above-mentioned
notion that A. thaliana’s competitive effect does not depend on allelopathy by far
does not imply that chemical compounds are not important in its interactions with
other species. To the contrary it is clear that beyond resource competition plant–
plant communication involves root exudates. This has been demonstrated repeatedly for intraspecific interactions of A. thaliana (e.g. Biedrzycki et al. 2010; Caffaro
et al. 2011, 2013). However, merely one study has, to date, investigated
Arabidopsis’ interaction effects on another species, when resource competition
itself is prevented. Pedersen et al. (2013) co-cultivated A. thaliana and Trifolium
repens in nutrient medium for 2 weeks and found that A. thaliana impacted on
T. repens metabolic profile by significantly affecting 53 of its metabolites, of which
20 were increased. This might indicate the strong potential of A. thaliana’s
non-toxic exudates to influence other species as potential interaction partners.
2.2
Studies Examining Competitive Response of A. thaliana
Four of the studies mentioned above (Bossdorf et al. 2009; Müller and Bartelheimer
2013; Pedersen et al. 2013; Gidman et al. 2003) not only investigated competitive
Interspecific Competition in Arabidopsis thaliana: A Knowledge Gap Is. . .
311
effects but also competitive responses. A further seven studies (Table 1) plus two
very recent studies outlined below investigated competitive response exclusively.
First we will summarize the findings on competitive response from the four studies
already mentioned in Sect. 2.1 (see above) and then continue with the
remaining ones.
Similar to its ranking in competitive effect, A. thaliana takes an intermediate
position in competitive response in the experiments by Bossdorf et al. (2009). It was
shown that to some extent, A. thaliana responded negatively to allelopathy (manipulated by activated carbon) from both S. vulgaris as superior competitor and
A. arvensis as inferior competitor. On a general basis, A. thaliana suffered a
biomass loss of 57 % when competing with S. vulgaris and 18 % when competing
with A. arvensis. Different A. thaliana genotypes responded differently to competition, i.e. both their reactions to the two competing species and reactions to
allelopathy depended on genotypes. The authors point out that such variation in
competitive ability between genotypes is known for other species as well and that
this might reflect the potential of evolution of competitive ability on short temporal
scales (Bossdorf et al. 2009). It is tempting to speculate that this potential might be
especially high in a species with a short life cycle and tremendous potential seed
output like A. thaliana. Interestingly, maternal effects, which had been found to be
important for competitive effect, were unimportant for competitive response.
In contrast to the findings by Bossdorf et al. (2009), Müller and Bartelheimer
(2013) found competitive response to not depend on geno- nor phenotype. As
mentioned in Sect. 2.1 they compared different root phenotypes in a pot experiment
with phosphorus deficiency. All phenotypes were shown to be unaffected by a
community of six sandy grassland species, though among these six species competition was intense. This example might well represent a case where growing
conditions resemble a natural situation favourable to A. thaliana: a combination of
relatively resource-poor soil, slow-growing neighbours and a low degree of canopy
closure. It is conceivable that the species’ competitive response would be stronger,
and likely with more pronounced differences between phenotypes, when conditions
match less well with the species realized habitat niche (see introduction for a brief
description). In fact, our gap of knowledge is starting to close as far as Arabidopsis’
different morphological, phenological and physiological responses to competition
are concerned. Current knowledge can be compiled as follows.
In the study by Gidman et al. (2003) growth of A. thaliana is significantly
reduced, though impacts on its metabolomic fingerprint were not detected. Pedersen
et al. (2013) found that different metabolites were altered by the presence of
T. repens. Brachi et al. (2012) used A. thaliana plants in standard culture soil in
the presence of 0, 4, or 8 plants of naturally co-occurring Poa annua to test for
different phenological traits. They observed that seed production (represented by
cumulative silique length) was reduced by competition. Likewise, anthesis was
delayed and so was the duration of the reproductive period. In an experiment on
A. thaliana colonization success in four types of constructed plant communities,
A. thaliana seedling emergence was reduced in forb-dominated communities relative to grass-dominated ones (Hovick et al. 2012). The authors concluded that forbs,
312
M. Bartelheimer et al.
being most productive in that experiment, brought about higher plant cover, to
which A. thaliana responded negatively. This conclusion is interesting, because it
suggests that competition for light is of high relevance for A. thaliana competitive
response. While for competitive effect it is somewhat obvious that this rosette
species can hardly inflict severe shading on its neighbours, preconditions are
different for competitive response. Once Arabidopsis switches to reproductive
state, it does produce stems with considerable amounts of green tissue above the
leaf rosette that might cover the plant’s energy demand. However, the study by
Hovick et al. (2012) suggests that this species has a weak competitive response
ability when competition takes place aboveground. There are two other studies that
investigated how A. thaliana’s ability to respond to competition changes with
altered environmental conditions. One is a study by Lau et al. (2010) that varies
presence/absence of intraspecific competition or competition from grasses (the
C3-grass Bromus inermis and the C4-grass Andropogon gerardii) in pots subjected
to ambient or elevated CO2. Elevated CO2 led to an increase of intraspecific
competition intensity, but to a decrease of interspecific competition intensity. The
authors discuss that with elevated CO2 a shift might have occurred concerning the
resource most strongly limiting growth of A. thaliana (e.g. A. thaliana being limited
by water under ambient CO2 but limited by nitrogen under elevated CO2). This
might have led to the named shifts in competitive rankings. While competitive
rankings shifting with environmental factors is by no means an extraordinary
finding in itself (Goldberg 1996), this illustrates how strongly the competitive
response of A. thaliana depends on various factors and that it is not much of a
species’ inherent property in itself.
Additionally, a study by Hell (2014) finds the intensity of A. thaliana competitive response to vary with a manipulated environmental factor, in this case water
table depth (Fig. 1). The applied additive design compared solitary A. thaliana
plants to those growing together with plants from six other Brassiceaen species
(ranging from indicators of drought to indicators of waterlogging). Water table
depth was varied in three factor levels (Fig. 1a). Combined effects of water table
depth and competition are evident from Fig. 1b. On the one hand, competition does
severely affect A. thaliana and reduces its growth tremendously, especially under
dry to intermediate water conditions. On the other hand, waterlogging has strongly
negative effects by itself, reducing growth to a fraction of what is found for solitary
plants under dry conditions. The combined effects of waterlogging and competition
did result in the lowest total dry weight, but this was not significantly different from
most other treatments. Consequently, once Arabidopsis’ growth was strongly
impeded by waterlogging, competition did not have as much extra effect as under
drier conditions. It appears that the observed differences in competition intensity
were not primarily due to shifts in the limiting resource (as in Lau et al. 2010), but to
environmental stress (in this case anoxia) resulting in overall reduced biomass.
Besides Arabidopsis’ general preference for drier conditions, this study illustrates
how severely competition can affect Arabidopsis’ growth (up to 97 % reduction
under dry conditions) (Fig. 1b).
Interspecific Competition in Arabidopsis thaliana: A Knowledge Gap Is. . .
313
A study by Storf (2014) examined A. thaliana vertical root distribution in
response to competition from Vulpia bromoides and varied water availability
(well-watered vs. drought treatments, Fig. 2). Drought resulted in pronounced
growth reductions both in A. thaliana and V. bromoides. A. thaliana competitive
response (in terms of growth reduction relative to the control) was very severe and
similar between water treatments. The calculated Relative Neighbour Effect (RNE,
an indicator of competition intensity with max. values of 1.0, see Markham and
Chanway 1996) was RNEwell-watered ¼ 0.89 0.03 and RNEdrought ¼ 0.87 0.05,
respectively (not shown). However, root distribution patterns responded differentially (Fig. 2b, c). In the well-watered treatment (Fig. 2b), A. thaliana formed the
great majority of its roots in the uppermost soil layer, with near to zero roots in the
bottom soil layer. In the presence of competition root amounts were drastically
reduced, but the deepest soil layer did contain some deep reaching roots. In the
drought treatment (Fig. 2c) control plants distributed their roots quite evenly along
the soil layers, while competition resulted in such small root systems that no roots
could even reach the deepest soil layer. Clearly, strong biomass effects on root
distribution were evident, here. Additionally, at least in the well-watered treatment
(Fig. 2b), it appears that the A. thaliana root system is capable of plastically
avoiding competition by favouring deeper soil layers. Similar rooting strategies
have been observed before (Tosti and Thorup-Kristensen 2010), where an alternative interpretation was suggested and the occupation of certain soil layers during
early stages of competition led to dominance in these layers later on.
A different approach to test for A. thaliana root reactions was taken by Schmid
et al. (2013). An additive design with presence/absence of H. pilosella was used to
investigate A. thaliana horizontal root distribution and for transcriptomic response
to the neighbour. Similar to the above study by Storf (2014) it was found that the
A. thaliana root system is capable of plastic reactions, avoiding the neighbour by
preferentially placing roots in the adverse direction (root segregation). The examined transcriptomic response made use of the advantages of A. thaliana as a model
plant of molecular biology. It was found that even though A. thaliana biomass was
not significantly reduced by the neighbour, there was a far reaching transcriptomic
reaction. Analyses concerning the identity of responding transcripts revealed induction especially of those transcripts usually responding to pathogen attacks. A
possible explanation brought up by the authors was that neighbour roots, their
exudates, or their associated microbiological flora are perceived by A. thaliana
with mechanisms else active during pathogen attacks.
A recent study by Badri et al. (2012) also investigates neighbour recognition.
The A. thaliana ecotype Col-0 was cultured on MS medium as a solitary plant or
with either different A. thaliana ecotypes or with Capsella rubella. Short term
reactions in root exudates were examined. The observed patterns of excreted proteins were complex, but there was a distinct increase in the amount of excreted
defence proteins in the plant combination Col-0 vs. C. rubella as compared to Col-0
as solitary plant. At the same time the secretion of stress-related proteins decreased
in the named comparison. The authors conclude that some proteins are specifically
314
M. Bartelheimer et al.
Fig. 1 Method and result illustrations of a competition experiment (Hell 2014) with A. thaliana
(Col-0) and six other species from the family of Brassicaceae with (a) picture of an experimental
unit containing a mixture of competing A. thaliana, Arabis hirsuta, Arabis nemorensis, Barbarea
vulgaris, Berteroa incana, Cochlearia pyrenaica, Erysimum odoratum. Cache pots were used to
set water tables. (b) Total dry weight (means SE) in A. thaliana in reaction to water table depth
and interspecific interaction. Different minor letters indicate statistically significant differences in
Welch-ANOVA with post-hoc Tamhane (n ¼ 6–7)
Fig. 2 Method and result illustrations of a competition and root distribution experiment (Storf
2014) with A. thaliana (Col-0) as focal species and Vulpia bromoides as competitor. (a) Picture of
an experimental unit (left) consisting of a PVC tube filled with sandy loam and planted with
A. thaliana (Col-0) as focal plant (not visible) in the centre of six plants of V. bromoides. Upon
harvest, the soil was stratified in 4 cm strata (right) and roots were washed out and sorted by
species. Control treatments consisted of one solitary plant of A. thaliana without V. bromoides. (b)
A. thaliana root distribution (means SE; n ¼ 3–5) in the well-watered treatment with and without
competition, respectively. (c) A. thaliana root distribution (means SE; n ¼ 7–8) in the dry
treatment with and without competition, respectively. Different minor letters indicate statistically
significant differences in Kruskal–Wallis Test with corrected p-values
secreted depending on the identity of the neighbour and that some level of neighbour recognition is possible even before resource competition is taking place.
Allelopathy also appears to be a potentially important factor for A. thaliana
competitive response (also see above for Bossdorf et al. 2009). Due to its sensitivity
to allelochemicals A. thaliana is progressively gaining importance for bioassays,
gradually replacing Lepidium sativum as prime test species (e.g. Qin et al. 2007;
Interspecific Competition in Arabidopsis thaliana: A Knowledge Gap Is. . .
315
Abhilasha et al. 2008). However, such bioassays are usually carried out by challenging A. thaliana with plant extracts, meaning that actual interspecific interaction
is not examined in these studies. As an exception Rudrappa et al. (2007) tested
A. thaliana response to Phragmites australis and its allelopathy. Pots were seeded
with A. thaliana and presence/absence of 40-day-old P. australis was varied. The
application of activated charcoal was used to absorb allelochemicals. A. thaliana
survival and growth was largely reduced by P. australis, but restored almost to
control condition when activated charcoal was applied. Together with the findings
by Bossdorf et al. (2009) (see above), it is clear that allelopathy can play an
important role in A. thaliana’s competitive response.
A newly emerging research area is how A. thaliana competitive response is
influenced by mycorrhiza. A. thaliana is known to be non-mycorrhizal, but it can
still interact with mycorrhizal plants. An exciting finding in that respect was
presented by Veiga et al. (2013). They grew A. thaliana in dual compartment
systems as solitary plants or with either Trifolium pratense or Lolium perenne.
Root systems of neighbour plants were separated by mesh, which can be penetrated
by hyphae but not by roots. It was found that arbuscular mycorrhiza (AM) inoculum
caused 50 % growth reduction in A. thaliana, but only when P. pratense or
L. perenne were present to support the AM network. In the latter case, roots of
A. thaliana were found to be colonized by AM. The authors discussed that
A. thaliana likely suffered from nutrient removal by AM hyphae that were further
allocated to the neighbouring plant.
3 Conclusions
The term ‘underused’ is seldom associated with A. thaliana, but it is appropriate in
connection with this species when it comes to interspecific competition. Especially
our current knowledge on competitive effect is scarce. It would be rewarding to
further investigate this in A. thaliana, as this is a rare example of a species that has
strong competitive effects despite being comparatively small. Its competitive
ability appears to be brought about by (so far unknown) morphological or physiological plant properties beyond plant size. For the sake of a clearer picture,
investigations on A. thaliana effects on more than just a handful of species will
be necessary.
As far as the competitive response is concerned, the above synopsis shows that
especially over the last few years A. thaliana is becoming more recognized as a
valuable species for studying interspecific interaction. The matter is complex and
involves resource competition for shifting limiting resources, impacts of environmental factors including environmental stress, perception of neighbours as well as
responses to allelopathy and neighbour-associated mycorrhiza. Consequently, it
appears important to continue to make full use of the possibilities offered by this
model plant.
316
M. Bartelheimer et al.
Generally speaking there are almost no field experiments on interspecific interactions of A. thaliana (but see Lau et al. 2010), and, to our knowledge, also just one
field experiment on intraspecific interactions (Fitter et al. 2002). Considering the
high level of complexity of biotic interactions in the field, the use of a model plant
to identify mechanisms suggests itself. Moreover, it can be taken for granted that
plant interactions in the field are strongly influenced, if not mediated, by
microbiota. A. thaliana, being at the forefront of research on plant-associated
microorganisms suggests itself even in this area. For field experiments the use of
natural genotypes is one possibility, while the use of genetically modified knockdown or knock-out mutants is usually prohibited. However, there is still a very good
possibility available using chemically mutagenized material screened by ‘targeting
induced local lesions in genomes’ (TILLING, McCullum et al. 2000). The whole
screening process can be completed within 4 months (Bush and Krysan 2010) and is
therefore well within a reasonable time frame for many projects.
Also concerning the near-to-natural situation, it would be worthwhile to have
more studies of A. thaliana interacting with species it naturally co-occurs with. One
way to prove the ecological relevance of many results from molecular plant biology
could be to grow the respective knock-down or overexpression mutants together
with species from their natural habitat and to show thereby the impacts on competitive ability.
Plant ecologists, especially those interested in ecophysiological mechanisms,
might find powerful approaches in the Arabidopsis molecular toolbox. Access to
methods and know-how are nowadays often facilitated by service units, companies
and collaboration partners. Molecular methods continue to become more powerful
and more and more available also for non-model species.
References
Aarssen LW, Schamp B, Pither J (2006) Why are there so many small plants? Implications for
species coexistence. J Ecol 94:569–580
Abhilasha D, Quintana N, Vivanco JM, Joshi J (2008) Do allelopathic compounds in invasive
Solidago canadensis s.l. restrain the native European flora? J Ecol 96:933–1001
Al-Shehbaz IA, O’Kane SL Jr (2002) Taxonomy and phylogeny of Arabidopsis (Brassicaceae).
Arabidopsis Book 1:e0001, American Society of Plant Biologists
Arabidopsis Genome Initiative (2000) Analysis of the genome sequence of the flowering plant
Arabidopsis thaliana. Nature 408:796
Attard A, Gourgues M, Callemeyn-Torre N, Keller H (2010) The immediate activation of defense
responses in Arabidopsis roots is not sufficient to prevent Phytophthora parasitica infection.
New Phytol 187:449–460
Badri DV, De-la-Peña C, Lei Z, Manter DK, Chaparro JM, Guimarães RL, Sumner LW, Vivanco
JM (2012) Root secreted metabolites and proteins are involved in the early events of plantplant recognition prior to competition. PLoS One 7:e46640
Bauer S (2010) Experimentell-ökologische Untersuchungen zur Bedeutung der Aluminiumtoxizität für die Konkurrenzkraft von Pflanzenarten aus Sandökosystemen. Bachelor thesis,
University of Regensburg
Interspecific Competition in Arabidopsis thaliana: A Knowledge Gap Is. . .
317
Biedrzycki ML, Jilany TA, Dudley SA, Bais HP (2010) Root exudates mediate kin recognition in
plants. Commun Integr Biol 3:28–35
Biedrzycki ML, Venkatachalam L, Bais HP (2011) Transcriptome analysis of Arabidopsis
thaliana plants in response to kin and stranger recognition. Plant Signal Behav 6:1515–1524
Bonser SP, Ladd B (2011) The evolution of competitive strategies in annual plants. Plant Ecol
212:1441–1449
Bossdorf O, Shuja Z, Banta JA (2009) Genotype and maternal environment affect belowground
interactions between Arabidopsis thaliana and its competitors. OIKOS 118:1541–1551
Brachi B, Aimé C, Glorieux C, Roux F (2012) Adaptive value of phenological traits in stressful
environments: predictions based on seed production and laboratory natural selection. PLoS
One 7:e32069
Bulgarelli D, Rott M, Schlaeppi K, van Theemat EVL, Ahmadinejad N, Assenza F, Rauf P,
Huettel B, Reinhardt R, Schmelzer E, Peplies J, Gloeckner FO, Amann R, Eickhorst T,
Schulze-Lefert P (2012) Revealing structure and assembly cues for Arabidopsis rootinhabiting microbiota. Nature 488:91–95
Bush SM, Krysan PJ (2010) iTILLING: a personalized approach to the identification of induced
mutations in Arabidopsis. Plant Physiol 154:25–35
Caffaro MM, Vivanco JM, Gutierrez-Boem FH, Rubio G (2011) The effect of root exudates on
root architecture in Arabidopsis thaliana. Plant Growth Regul 64:241–249
Caffaro MM, Vivanco JM, Botto J, Rubio G (2013) Root architecture of Arabidopsis is affected by
competition with neighbouring plants. Plant Growth Regul 70:141–147
Cheng Z, Woody ZO, Glick RB, McConkey JB (2010) Characterization of plant-bacterial interactions using proteomic approaches. Curr Proteomics 7:244–257
Fitter AH, Williamson L, Linkohr B, Leyser O (2002) Root system architecture determines fitness
in an Arabidopsis mutant in competition for immobile phosphate ions but not for nitrate ions.
Proc R Soc Lond 269:2017–2022
Gidman E, Goodacre R, Emmett B, Smith AR, Gwynn-Jones D (2003) Investigating plant-plant
interference by metabolic fingerprinting. Phytochemistry 63:705–710
Goldberg DE (1996) Competitive ability: definitions, contingency and correlated traits. Philos
Trans R Soc Lond B 351:1377–1385
Goldberg DE, Fleetwood L (1987) Competitive effect and response in four annual plants. J Ecol
75:1131–1143
Grime JP, Hodgson JG, Hunt R (2007) Comparative plant biology—a functional approach to
common British species. Castlepoint, Colvend
Heil M (2011) Nectar: generation, regulation and ecological functions. Trends Plant Sci 16:191–
200
Hell C (2014) Differenzierung hydrologischer Nischen bei Vertretern der Familie der
Brassicaceen. Exam thesis, University of Regensburg
Hovick SM, Gümüşer ED, Whitney KD (2012) Community dominance patterns, not colonizer
genetic diversity, drive colonization success in a test using grassland species. Plant Ecol
213:1365–1380
Kav NN, Srivastava S, Yajima W, Sharma N (2007) Application of proteomics to investigate
plant-microbe interactions. Curr Proteomics 4:28–43
Koornneef M, Alonso-Blanco C, Vreugdenhil D (2004) Naturally occurring genetic variation in
Arabidopsis thaliana. Annu Rev Plant Biol 55:141–172
Küster H, Vieweg MF, Manthey K, Baier MC, Hohnjec N, Perlick AM (2007) Identification and
expression regulation of symbiotically activated legume genes. Phytochemistry 68:8–18
Lamesch P, Berardini TZ, Li D, Swarbreck D, Wilks C, Sasidharan R, Muller R, Dreher K,
Alexander DL, Garcia-Hernandez M, Karthikeyan AS, Lee CH, Nelson WD, Ploetz L, Singh S,
Wensel A, Huala E (2012) The Arabidopsis Information Resource (TAIR): improved gene
annotation and new tools. Nucleic Acids Res 40:D1202–D1210
318
M. Bartelheimer et al.
Lau JA, Shaw RG, Reich PB, Tiffin P (2010) Species interactions in a changing environment:
elevated CO2 alters the ecological and potential evolutionary consequences of competition.
Evol Ecol Res 12:435–455
MacArthur R, Levins R (1967) The limiting similarity, convergence, and divergence of coexisting
species. Am Nat 101:377–385
Macel M, Van Dam NM, Keurentjes JJB (2010) Metabolomics: the chemistry between ecology
and genetics. Mol Ecol Resour 10:583–593
Markham JH, Chanway CP (1996) Measuring plant neighbour effects. Funct Ecol 10:548–549
Masclaux F, Bruessow F, Schweizer F, Gouhier-Darimont C, Keller L, Reymond P (2012)
Transcriptome analysis of intraspecific competition in Arabidopsis thaliana reveals organspecific signatures related to nutrient acquisition and general stress response pathways. BMC
Plant Biol 12:227
McCullum CM, Comai L, Greene EA, Henikoff S (2000) Targeted screening for induced mutations. Nat Biotechnol 18:455–457
Mitchell-Olds T (2001) Arabidopsis thaliana and its wild relatives: a model system for ecology
and evolution. Trends Ecol Evol 16:693–700
Müller B, Bartelheimer M (2013) Interspecific competition in Arabidopsis thaliana: root hairs are
important for competitive effect, but not for competitive response. Plant Soil 371:167–177
Oberdorfer E (2001) Pflanzensoziologische Exkursionsflora für Deutschland und angrenzende
Gebiete. Ulmer, Stuttgart
Pedersen HA, Kudsk P, Fiehn O, Fomsgaard IS (2013) The response of Arabidopsis to
co-cultivation with clover investigating plant-plant interactions with metabolomics. In: Beck
JJ, Coats RJ, Duke SO, Koivunen ME (eds) Pest management with natural products. American
Chemical Society, Washington, DC, pp 189–201
Peškan‐Berghöfer T, Shahollari B, Giong PH, Hehl S, Markert C, Blanke V, Kost G, Varma A,
Oelmüller R (2004) Association of Piriformospora indica with Arabidopsis thaliana roots
represents a novel system to study beneficial plant–microbe interactions and involves early
plant protein modifications in the endoplasmic reticulum and at the plasma membrane. Physiol
Plant 122:465–477
Pott R (1995) Die Pflanzengesellschaften Deutschlands. Ulmer, Stuttgart
Qin B, Lau JA, Kopshever J, Callaway RM, McGray H, Perry LG, Weir TL, Paschke MW, Hierro
JL, Yoder J, Vivanco JM, Strauss S (2007) No evidence for root-mediated allelopathy in
Centaurea solstitialis, a species in a commonly allelopathic genus. Biol Invasions 9:897–907
Ramadan A, Muroi A, Arimura G-i (2011) Herbivore-induced maize volatiles serve as priming
cues for resistance against post-attack by the specialist armyworm Mythimna separata. J Plant
Interact 6:155–158
Rudrappa T, Bonsall J, Gallagher JL, Seliskar DM, Bais HP (2007) Root-secreted allelochemicals
in the noxious weed Phragmites australis deploys a reactive oxygen species response and
microtubule assembly disruption to execute rhizotoxicity. J Chem Ecol 33:1898–1918
Schmid C, Bauer S, Müller B, Bartelheimer M (2013) Belowground neighbor perception in
Arabidopsis thaliana studied by transcriptome analysis: roots of Hieracium pilosella cause
biotic stress. Front Plant Sci 4:296
Sherameti I, Tripathi S, Varma A, Oelmüller R (2008) The root-colonizing endophyte
Piriformospora indica confers drought tolerance in Arabidopsis by stimulating the expression
of drought stress-related genes in leaves. Mol Plant Microbe Interact 21:799–807
Stein RJ, Waters BM (2012) Use of natural variation reveals core genes in the transcriptome of
iron-deficient Arabidopsis thaliana roots. J Exp Bot 63:1039–1055
Storf J (2014) Die Rolle des hydrotropischen Wurzelwachstums für die Konkurrenzfähigkeit von
Arabidopsis thaliana. Exam thesis, University of Regensburg
Tilman D (1982) Resource competition and community structure. Princeton University Press,
Princeton, NJ
Interspecific Competition in Arabidopsis thaliana: A Knowledge Gap Is. . .
319
Tomita-Yokotani K, Kato T, Masud Parvez M, Mori Y, Goto N, Hasegawa K (2003) Approach of
allelopathy study with Arabidopsis thaliana (L.) Hevnh. and Neurospora crassa. Weed Biol
Manage 3:93–97
Tosti G, Thorup-Kristensen K (2010) Using coloured roots to study root interaction and competition in intercropped legumes and non-legumes. J Plant Ecol 3:191–199
Tutin G, Heywood VH, Burges NA, Valentine DH, Moore DM (1993) Flora Europaea. Cambridge
University Press, Cambridge, UK
Veiga RSL, Faccio A, Genre A, Pieterse CMJ, Bonfante P, van der Heijden MGA (2013)
Arbuscular mycorrhizal fungi reduce growth and infect roots of the non-host plant Arabidopsis
thaliana. Plant Cell Environ 36:1926–1937
Weigelt A, Schumacher J, Walther T, Bartelheimer M, Steinlein T, Beyschlag W (2007) Identifying mechanisms of competition in multi-species communities. J Ecol 95:53–64
Wilson JB, Peet RK, Dengler J, Pärtel M (2012) Plant species richness: the world records. J Veg
Sci 23:796–802
Carbon Reserves as Indicators for Carbon
Limitation in Trees
Günter Hoch
Contents
1
2
3
4
Introduction . . . . . . . . . . . . . . . . . . . . . . . . . . . . . . . . . . . . . . . . . . . . . . . . . . . . . . . . . . . . . . . . . . . . . . . . . . . . . . . . .
How to Assess the Carbon Supply Status of Tall Trees? . . . . . . . . . . . . . . . . . . . . . . . . . . . . . . . . . .
Which Carbon Reserves? . . . . . . . . . . . . . . . . . . . . . . . . . . . . . . . . . . . . . . . . . . . . . . . . . . . . . . . . . . . . . . . . . . .
How Likely Is Carbon Limitation in Trees? . . . . . . . . . . . . . . . . . . . . . . . . . . . . . . . . . . . . . . . . . . . . . . .
4.1 Carbon Relations Under Benign Climatic Conditions . . . . . . . . . . . . . . . . . . . . . . . . . . . . . . .
Independency of Growth from Stored Carbon Reserves . . . . . . . . . . . . . . . . . . . . . . . . . . . .
Independency of Mast Fruiting from Stored Carbon Reserves . . . . . . . . . . . . . . . . . . . . .
4.2 Carbon Relations Under Environmental Stress . . . . . . . . . . . . . . . . . . . . . . . . . . . . . . . . . . . . . .
Cold Limits of Tree Growth . . . . . . . . . . . . . . . . . . . . . . . . . . . . . . . . . . . . . . . . . . . . . . . . . . . . . . . . . .
Hydraulic Limits of Tree Growth . . . . . . . . . . . . . . . . . . . . . . . . . . . . . . . . . . . . . . . . . . . . . . . . . . . .
5 Concluding Remarks . . . . . . . . . . . . . . . . . . . . . . . . . . . . . . . . . . . . . . . . . . . . . . . . . . . . . . . . . . . . . . . . . . . . . . . .
References . . . . . . . . . . . . . . . . . . . . . . . . . . . . . . . . . . . . . . . . . . . . . . . . . . . . . . . . . . . . . . . . . . . . . . . . . . . . . . . . . . . . . . .
322
322
324
325
326
326
328
329
330
334
340
341
Abstract In view of the current increase of atmospheric CO2 concentrations, the
question if carbon is a limiting resource for tree growth or not gained large attention
over the last decades. This review summarizes how tissue concentrations of
nonstructural carbon (C) reserves compounds can be used to assess the C-supply
status of trees. Studies that investigated the tissue concentrations of C-reserves and
their seasonal variations in trees growing under natural conditions suggested that
tree growth and reproduction are currently not limited by photosynthesis under
benign or non-stressful climatic conditions. The comparative analysis of C-reserves
in trees exposed to environmental stresses like cold temperatures and drought
revealed that against previous assumption, the stress-induced decline of growth is
also not caused by insufficient C-assimilation. However, recent studies on the
C-relation in dying trees exposed to sustained drought indicated organ-specific
G. Hoch (*)
Institute of Botany, University of Basel, Schönbeinstrasse 6, 4056 Basel, Switzerland
e-mail: guenter.hoch@unibas.ch
© Springer International Publishing Switzerland 2015
U. Lüttge, W. Beyschlag (eds.), Progress in Botany, Progress in Botany 76,
DOI 10.1007/978-3-319-08807-5_13
321
322
G. Hoch
different reactions of tissue C-reserve concentrations, probably as a result of
impaired C-transport and reserve re-mobilization under drought stress.
1 Introduction
Like all C-autotrophic life forms, trees depend on the continuous supply of C that is
bound from atmospheric CO2. On average, about half of all dry biomass consists
of C, rendering C the quantitatively most important element in plants. Historically,
the photosynthetic fixation of inorganic C has thus been received as the physiological key process, which ultimately drives all other plant functions, especially
growth. As it has been previously put forward by Körner (2006), the perception
of C as the limiting resource for plant growth gained further acceptance by the
development of mobile and easy to use CO2 gas exchange analyzing systems, and
the resulting finding that the net-photosynthesis of most terrestrial plants is yet not
saturated at ambient atmospheric CO2 concentrations (close to 400 ppm at the time
of writing of this article). Mature trees in particular were supposed to be limited in
terms of C-supply, since the majority of tissues are heterotrophic and dependent on
the import of assimilated C from green leaves that make up only a small fraction of
the entire biomass in this plant growth form (Yoda et al. 1965). However, over the
last decades there has been increasing observational and experimental evidence that
growth and reproduction of trees living under natural (un-fertilized) conditions are
most likely not directly controlled by photosynthetic C-uptake, but by other factors
like the availability of soil nutrients, water, or space (Bader et al. 2013; Körner
2003; Norby et al. 2010). Despite the likelihood of sufficient C-supply for growth
under benign conditions at current atmospheric CO2 concentrations, trees might
still face C-limitation under certain environmental or biological stresses, like cold
temperatures, drought, or leaf-loss by herbivores. To assess the C-balance of large
trees is a methodological challenge, and apart from expensive large-scale CO2enrichment studies, the prediction of the absence or presence of C-limitation has to
rely on indirect clues and models. Here, I will discuss the usefulness of mobile
C-reserve compound concentrations as a proxy for a tree C-source-sink-balance,
and summarize our current knowledge about mobile C-reserves in trees under
potential C-limiting situations.
2 How to Assess the Carbon Supply Status of Tall Trees?
Unlike for single leaves, small plants but also entire ecosystems, the C-exchange
cannot be directly measured as a whole for individual tall trees. Hence, predictions
for the net C-balance of trees have to (1) either rely on models that integrate
selective measurements of photosynthesis and respiration with climatic records
Carbon Reserves as Indicators for Carbon Limitation in Trees
323
(temperature and light) as well as estimates for the proportional biomass of different
organs (e.g., leaves, sapwood, fine roots, etc.) or (2) use the comparative analyses of
the tissue concentrations of mobile C-reserves. Gas-exchange measurements can be
achieved precisely at an areal base for single tissue types (e.g., leaves, bark) and
short periods (i.e., seconds to minutes). However, the uncertainty for the modeled
net exchange of an entire tree increases markedly with spatial and temporal
upscaling (e.g., from cuvette area to the whole organ, from single measurements
to whole season integrals). Even more important, a model for the C-supply status of
a plant has to account also for all C-sink activities apart from respiration, like
growth, reproduction, exudation, etc., which again can at best be approximated
from temporally and spatially punctual measurements in tall trees. Obviously,
precise determinations of all C-source and -sink activities over longer periods are
laborious and time-consuming, thus limiting the number of trees that can be
assessed in a single study. Hence, except for very obvious situations like deep
shade, direct measurements of C-source and sinks will generally result in more or
less rough estimates about whether or not the availability of C is driving specific
plant processes, like growth.
An alternative approach is the comparative analysis of the concentrations of
carbon-reserve compounds in tree tissues. As photosynthesis and C-sink processes
(and thus the ratio between C-source and -sink activities) are not constant over time,
but vary diurnally, seasonally, or ontogenetically, plants are experiencing periods
where C-assimilation exceeds C-usage alternating with periods where the demand
for C is higher than the photosynthetic supply. Mobile C-reserves (e.g., starch or
low molecular weight sugars) are metabolites that are produced during periods
when C is assimilated faster than used for the diverse C-sinks within a plant, while
they are dissipated and serve as a C-source whenever the demand for C exceeds the
rate of C-assimilation (Chapin et al. 1990; Dickson 1991; Sala et al. 2011). A
simple “bucket-model” for C-reserves (Fig. 1a) thus assumes expanding reserve
a
b
Fig. 1 Simplified “bucket-model” for the size of a plant’s C-reserve store in dependency of its
C-source-sink-relations. C-sources (photosynthesis) and C-usage (all C-sinks) can be actively
controlled. (a) If all C-reserve compounds can be used as C-sources, the C-reserve pool would
be completely depleted at C-starvation. (b) Not all compounds that can serve as C-reserves can be
completely depleted at C-limitation, forming a de facto sequestered fraction within the
C-reserve pool
324
G. Hoch
concentrations whenever the C-influx from photosynthesis outbalance the net usage
of C, and shrinking C-reserves if the demand for C-assimilates is higher than the
current photosynthetic activity. In this respect it is important to note that in view of
the indicative nature of C-reserves for the C-supply status of a plant, they are the
actual tissue concentrations rather than the total reserve pool per plant, which are
the decisive factor. A large C-limited tree will show lower tissue concentrations of
C-reserves compared to a small well C-supplied sapling, but it will have the larger
total C-reserve pool. Based on these assumptions, the comparison of the sizes of
C-reserve concentrations among species, dates, or treatments has been used as an
integrative proxy for a plant’s C-supply status. The sensitivity of C-reserve concentrations to changed C-supplies could be demonstrated in an experiment that
exposed plants from different functional groups (including trees) to artificially very
low or high CO2 concentrations (Schädel et al. 2010). A recent study by Hartmann
et al. (2013a) showed an almost complete depletion of starch and very low concentrations of low molecular weight sugars in different tissues of Picea abies
seedlings treated with extremely low atmospheric CO2 concentrations. Also, trees
exposed to deep shade exhibited very strong declines of their C-reserve concentrations (e.g., Piper et al. 2009; Sevanto et al. 2014). On the other hand, C-reserve
pools might be formed against a prevailing C-sink demand during certain phenological or developmental stages, especially for C storage before dormant periods in
seasonal climates, and probably also under environmental stress (Wiley and
Helliker 2012; but see also Palacio et al. 2014). Nevertheless, trees exposed to
C-starvation should use up these reserves before death. Otherwise, these
C-compounds should be considered as “sequestered” (in terms of not retrievable)
rather than “stored” (Millard et al. 2007).
3 Which Carbon Reserves?
In principal, all organic compounds within a plant that can be reintroduced into
primary metabolism (recycled) can serve as C-reserves for C-sink activities if the
requirement for C exceeds the C-supply by current photosynthesis (Chapin
et al. 1990). In this respect, it is important to note that most of these compounds
serve primarily other functions than storage (Hoch 2007). For example, low molecular weight sugars are present in all living plant cells, and are used as intermediate
metabolites, C-transport compounds, or osmolytes. Nevertheless, they can also
serve as C-sources for structural growth or respiration. The multifunctional nature
of many low molecular C-compounds entails that there cannot be a complete
depletion of all potential C-reserves in living plant tissue (Hoch 2007), comparable
with the concentration of blood sugar in mammals, which cannot decrease to zero
even if individuals should starve to death. This is especially important if C-reserve
concentrations are used as proxies for the C-supply status of plants, since there are
C-reserves present even in severely C-limited plants, detectible as a lower minimum concentration of C-reserves (e.g., Piper et al. 2009; Schädel et al. 2010;
Carbon Reserves as Indicators for Carbon Limitation in Trees
325
Veneklaas and den Ouden 2005; Fig. 1b). The identification of this lower C-reserve
threshold in different species and tissues certainly will be an important future
research task, in order to improve the diagnostic potential of C-reserve concentrations for a plant’s C-supply status.
Besides the large number of C-compounds that can principally be used as
reserves but primarily serve other functions, only two C-compound classes are
synthesized exclusively as storage compounds, namely, nonstructural polysaccharides (starch and fructans) and neutral lipids (triacylglycerols). These “strict”
C-reserves are also expected to react strongest to C-source-sink imbalances. On
one hand, there is principally no lower concentration limit for starch or storage
lipids that is determined by immediate cell-physiological needs like, for example,
for free sugars (see above). On the other hand, polysaccharides as well as neutral
lipids are mostly osmotically inactive, which means that they can accumulate to
high concentrations without interfering with other cell-biological processes.
Indeed, it could be shown that changes in the nonstructural carbohydrate concentrations of plants in response to different atmospheric CO2 supplies are largely due
to changes in starch concentrations while tissue concentrations of low molecular
weight sugars stayed relatively constant (Schädel et al. 2010). Interestingly, to my
knowledge, there are no reports of a complete depletion of starch reserves, even
under sever C-limitation. This might indicate the presence of a lower minimum
concentration for starch, which is likely not related to direct cell-physiological
needs like for low molecular sugars, but due to steric constraints for the complete
degradation of starch granules (e.g., Srichuwong and Jane 2007). Nevertheless,
compared to low molecular weight sugars, starch shows generally much stronger
variability towards C-source sink imbalances. With respect to the usage of
C-reserve concentrations as a proxy for the C-supply status of plants, our main
concern might thus be with nonstructural polysaccharides and storage lipids, with
the latter being of quantitative importance in only a limited number of species
(Hoch et al. 2003). However, the majority of studies dealing with C-reserves in
plants reported the sum of low molecular weight sugars plus starch, which is
generally referred to as either as “nonstructural carbohydrates” (NSC) or “total
nonstructural carbohydrates” (TNC).
4 How Likely Is Carbon Limitation in Trees?
Photosynthesis is the quantitatively most significant assimilation process in plants.
However, the central role of C-assimilation for plant growth does not automatically
mean that productivity is determined by the photosynthetic activity of plants. The
differentiation between C-assimilation and C-usage, and the fact that the former
does not necessarily drive the latter has been extensively reviewed previously (e.g.,
Körner 2003, 2006; Körner 2013; Millard et al. 2007). The question, if and under
which conditions plant growth is limited by the supply of photoassimilates, is of
special interest in view of the future increase of atmospheric CO2 concentrations.
326
G. Hoch
Because globally about 90 % of the C fixed in biomass is sequestered in forests
(Körner 2003), the dependency of tree growth on C-assimilation is of prime
importance. In the following, I will provide an overview of the likelihood of
C-limitation in trees as it can be derived from comparative analyses of tissue
C-reserve concentrations. First, I will focus on trees growing under more or less
benign conditions, and thereafter, I will address two situations of climatic stresses,
which potentially can lead to C-starvation, namely cold temperatures and drought.
Many of the reported data are results of my own studies during the last decade,
which will be compared to findings on C-reserves in trees from other research
groups. In addition, these results will be put in a broader plant-physiological
context, to better assess the existence or absence of C-limitation independent
from the comparative analyses of C-reserves.
4.1
Carbon Relations Under Benign Climatic Conditions
Research over the last two decades has largely indicated that tree growth is driven
by other factors than C-supply under non-stressful conditions. Traditionally it has
been assumed that trees from seasonal climates (especially deciduous species) rely
strongly on stored C-reserves for spring bud break and the consecutive early season
growth, implying that the amount of C-reserves that can be stored throughout one
season is significantly affecting the growth potential in the following season. In
contrast, more recent studies that investigated the C-relations in temperate trees
could not confirm the assumed strong dependency of deciduous trees on stored
C-reserves.
4.1.1
Independency of Growth from Stored Carbon Reserves
A study at the Swiss Canopy Crane facility investigated the seasonal variations of
NSC stores in seven deciduous and three evergreen temperate forest tree species
(Hoch et al. 2003). This survey revealed only moderate changes of NSC from
before bud break to the end of the growing season, indicating that early season
growth does not strain the stored C-reserves in these trees, except for reserves in
very young branches during spring bud break (Schädel et al. 2009). On average,
deciduous trees showed a seasonal variation of NSC of about 30 % in branch wood
and only 10 % in stem sapwood. Surprisingly, the magnitude of the seasonal
variations of the trees’ C-reserve pools were similar between deciduous and evergreen species (but the seasonal patterns are in opposite directions, see Hoch
et al. 2003), clearly contradicting the old paradigm that deciduous trees rely to a
larger extend on stored C than evergreen species. In addition, the seasonal NSC
variations occurred on top of large total C-reserve pools. Averaged across all broadleaved deciduous species, the estimated nonstructural carbohydrate reserves stored
only in the aboveground wood of these 100-year old trees accounted for over four
Carbon Reserves as Indicators for Carbon Limitation in Trees
327
times the entire C incorporated in all leaves. Additionally, some of the species
investigated in Hoch et al. (2003), e.g., Tilia platyphyllos and Pinus sylvestris, had
high sapwood concentrations of storage lipids that did not change significantly
across the entire growing season. Similar to this study in temperate trees, yearround relatively high levels of C-reserve concentrations had been documented for
trees at other temperate sites (e.g., Barbaroux and Breda 2002; Fischer and Höll
1992; Landhäusser and Lieffers 2003) and also in tropical forest trees (Würth
et al. 2005). In view of the overall large C-reserve pools of trees and the fact that,
unlike other nutrients like nitrogen, nonstructural C-compounds are often not
recovered from senescent tissues, Millard et al. (2007) proposed that trees are
sufficiently supplied with C up to a point where considerable portions of a trees’
C-reserves are never remobilized and de facto sequestered.
The often weak seasonal fluctuations of nonstructural C-reserves in mature trees
led to the conclusion that the productivity of forests is likely not limited by
photosynthesis under current atmospheric CO2 concentrations (Körner 2003).
This notion was supported by CO2 enrichment experiments that were applied in
natural or near-natural forests. An 8-year, 550 ppm CO2, Free Air CO2 Experiment
(FACE) with mature deciduous trees at the Swiss Canopy Crane facility revealed no
sustained increase in tree biomass production (Bader et al. 2013; Körner
et al. 2005), despite higher leaf-level net-photosynthesis, which was on average
40 % higher in trees exposed to high atmospheric CO2 compared to ambient CO2
control trees (Bader et al. 2010; Zotz et al. 2005). Hence, the extra C assimilated at
high CO2 conditions likely increased the C-flux through these trees, without
enhancing growth (Körner et al. 2005). Within a North-American long-term
FACE experiment (550 ppm CO2), trees of a sweetgum (Liquidambar styraciflua)
forest reacted to increased CO2 supply with a significant +24 % enhancement of
NPP during the initial 6 years of the experiment, but their productivity declined to
the level of ambient CO2 control trees during the following 5 years, most likely due
to declining N availability under elevated CO2 at this site (Norby et al. 2010). A
third long-term FACE experiment with larger trees investigated Pinus taeda trees in
an afforestation 11-year-old at the beginning of the experiment. Although this study
on young trees found a sustained enhancement of tree productivity at elevated CO2
over the course of 10 consecutive years of CO2 enrichment, it could be shown that
the effect of elevated CO2 was primarily driven by the availability of soil nitrogen
and water (McCarthy et al. 2010). Hence, in the long term, soil nutrients and water
rather than C are the limiting resource for tree growth in mature forests under
current atmospheric CO2 concentrations.
There is additional evidence for abundant C-supply for trees under non-stressed
growth conditions from yet another field of research: the analyses of radiocarbon
(14C) bomb spike signals as tracers for the age of C used for growth or metabolism
in trees. By cross-dating 14C-signals in CO2 from stem respiration, in tree ring
cellulose, as well as in stem wood NSC reserves in maple trees (Acer rubrum),
Carbone et al. (2013) demonstrated that metabolism and growth largely rely on C
that is younger than 1 year, whereas the average age of stored NSC was found to be
10 years, and the old C-reserves are readily available and not sequestered if needed
328
G. Hoch
(Richardson et al. 2013). As a consequence, C-reserve pools are likely to increase
with tree age under benign conditions (Carbone et al. 2013), again signifying the
abundant C-supply of trees under current atmospheric CO2 concentrations.
4.1.2
Independency of Mast Fruiting from Stored Carbon Reserves
While the above-mentioned studies delivered clear evidence that vegetative tree
growth is currently not under C-limitation in unfertilized sites, the phenomenon of
mast seeding (i.e., the production of high fruit loads in some years intermitted by no
to very low fruit production in all other years; Silvertown 1980) might be related to
a restricted availability of C-reserves in trees. It has been hypothesized that the
formation of high fruit loads in one season might deplete tree-internal pools of a
resource, and it therefore takes one or more seasons to refill this pool before the next
masting event can take place (Isagi et al. 1997; Kelly 1994). Traditionally,
C-reserves are thought to be likely candidates for this limiting resource in plants
with masting reproduction behavior (e.g., Crone et al. 2009; Kozlowski et al. 1991).
However, the analysis of NSC reserves in stem wood of Fagus sylvatica and
Quercus petraea did not show significant concentration differences between
masting and non-masting years (Körner 2003). Obeso (1998) and Hoch (2005)
tested the dependency of fruit production on stored C-reserves by applying ringgirdling (i.e., the removal of a stripe of phloem without interrupting the xylem sap
flow) treatments on fruiting shoots of different broad-leaved tree species in order to
cut off the terminal, fruit-bearing part of the shoot from C-reserves stored in other
parts of the tree. These experiments showed uniformly that gridling alone had no
effect on the final fruit-number and -biomass, suggesting that fruit production can
be supplied exclusively from current photosynthesis by leaves and photosynthetically active fruit tissue on the girdled branches. Even a 50 % defoliation on girdled
branches led to no or a relatively small reduction in final fruit biomass, while
girdling and complete defoliation massively reduced fruit number and biomass.
Accordingly, NSC reserve concentrations in the xylem of girdled branches were
also found to be unaffected relative to controls in undefoliated and 50 %-defoliated
branches, but were significantly reduced in girdled and completely defoliated
branches (Hoch 2005), reflecting the branches’ negative C-balance. The exclusive
usage of current photoassimilates for fruiting were recently confirmed in a study
that estimated the age of C used for fruit production in ten temperate deciduous tree
species by radiocarbon (14C) analyses (Ichie et al. 2013). Finally, an unambiguous
indication for the independency of fruiting from stored C-reserves in masting tree
species was revealed within a study at the Swiss Canopy Carne site. In this study,
adult trees that had been labeled with a low δ13C signal for eight consecutive
seasons, produced fruits in the first season after the labeling that carried exclusively
the ambient δ13C of control trees but no traces of the δ13C-label of old C-reserves
(Hoch et al. 2013).
Overall, studies performed over the last two decades clearly contradicted the
classical view that mast fruiting depletes C-reserves in trees. However, this does not
Carbon Reserves as Indicators for Carbon Limitation in Trees
329
inevitably suggest that there is no constraint on the C-supply for growth for the
entire tree. Indeed, several studies indicated that high fruit loads constrain the
vegetative growth of either the fruit-bearing shoot (Han et al. 2011) or the entire
tree (Mund et al. 2010), although others did not find a pronounced effect of mast
seeding on tree stem increments (Sala et al. 2012a; Yasumura et al. 2006). Probably, lower vegetative growth in masting seasons might indicate that, although fruit
growth is not directly constraining stored reserves, the increased C-sink strength
from fruits for currently assimilated C might compete with allocation of C to
growth of stems or roots. This would also explain observations of lower
C-reserve concentrations in wood of fruiting branches (Miyazaki et al. 2002). In
contrast, the reduced vegetative growth in masting trees could be unrelated to C, but
driven by a limitation of other nutrients, since high fruit production has also been
described to decrease pools of nitrogen and/or phosphorus on the fruiting shoots as
well as on the whole tree level (Han et al. 2014; Ichie and Nakagawa 2013;
McDowell et al. 2000; Miyazaki et al. 2002; Sala et al. 2012a).
4.2
Carbon Relations Under Environmental Stress
Perhaps, the reason for the abundant C-supply of trees today is due to the fact that
most of the currently existing tree species evolved in atmospheres where CO2
concentrations were below 300 ppm CO2 (compared to currently about 400 ppm),
with all physiological processes optimized to operate under much lower atmospheric CO2 than today (Körner 2006). While this finding has far-reaching consequences for all models on tree growth under future climates, there might be specific
situations, where abiotic or biotic stress results in C-limitation for trees, not
ameliorated by today’s increased atmospheric CO2 concentrations.
Environmental stress can theoretically have different effects on a plant’s
C-balance (Fig. 2). First, the stressor can affect primarily photosynthetis, thus
leading to C-limitation for all C-sinks (direct C-limitation; arrow “a” in Fig. 2).
Second, the stressful (limiting) environmental factor can affect C-sinks, like
growth, before or stronger than photosynthesis (direct C-sink limitation; arrow
“b” in Fig. 2). Third, plants might also react with the active accumulation of
C-reserves as an immediate stress response (Wiley and Helliker 2012). This
accumulation of reserves could be in competition with other C-sink activities of
the plant (indirect C-limitation via enhanced C allocation to storage; arrow “c” in
Fig. 2). With respect to the usage of C-reserve concentrations as proxies for a
plant’s C-supply status, it can be assumed that C-reserve concentrations are declining relative to unstressed plants, in the case of a direct C-limitation. At direct sink
limitation, but also if C-reserves are actively formed against a prevailing C-sink
strength, C-reserve concentrations are assumed to increase in stressed trees. In this
case, the comparative analyses of C-reserve concentrations alone cannot predict the
absence or presence of C-limitation, but further physiological information is needed
to decide on the dominant biological mechanism behind the limitation of growth
330
G. Hoch
Fig. 2 Schematic presentation of plant internal C-fluxes (1, 2, 3) and the potential effects of
environmental stressors on these fluxes (a, b, c). The direction of the stress effect on C-source
activity, C-sink-activity, or C-reserve pools are indicated by ( ) decrease or (+) increase. See text
for further explanations
(Palacio et al. 2014). In the following, I will give an overview of our current state of
knowledge about the C-supply status of trees exposed to two environmental
stressors that potentially can induce reduced productivity and tree mortality via
C-limitation, namely, cold temperature and hydraulic constraints.
4.2.1
Cold Limits of Tree Growth
Along elevational or latitudinal gradients from warmer to colder sites, different tree
species are reaching their species-specific cold limit at very different temperature
isoclines. However, if only alpine treelines (i.e., the cold limits of the life form tree)
are considered, their elevational situations exhibit a remarkable climatic similarity,
despite the fact that treelines are a world-wide phenomenon occurring at elevations
between close to sea level to almost 5,000 m a.s.l. Independent of the length of the
growing season, the average temperature across the local growing season at alpine
treelines was found to fall within a narrow temperature window of around 6.5 C
(Körner and Paulsen 2004). Considering that the actual tree species which form
these different treelines are from phylogenetically very different branches (including conifers and angiosperms), and that besides the mean growing season temperatures, all environmental factors (including soil properties, precipitation, and partial
Carbon Reserves as Indicators for Carbon Limitation in Trees
331
pressure) can be very different among treelines; this uniform isocline suggests one
common process behind the formation of treelines worldwide. As discussed in
detail in Körner (1998), there are basically two mechanisms that might be responsible for the decline of tree growth at the treeline: (1) C-limitation via insufficient
photosynthesis or (2) a direct restriction of meristematic growth at cold temperatures. Within a global series of studies along gradients from closed montane forests
to the uppermost occurrences of trees, the question, if C-limitation can be the cause
for the decline of tree growth at alpine treelines, was addressed by investigating
tissue concentrations of NSC in 14 different tree species at 13 locations between
68 N and 46 S (Hoch and Körner 2012). These surveys showed that NSC did not
decline with elevation, but revealed a clear increase towards treeline, indicating that
a direct C-limitation is unlikely the physiological cause for treeline formation.
Across all species and sites, the elevational increase of NSC was mainly driven
by higher concentrations of starch (+40 % at treeline), while there was only an
insignificant increase in the concentrations of low molecular weight sugars. Hence,
the observed increase of NSC is not an immediate physiological adjustment to cold
temperatures (e.g., by increasing cytoplasmatic concentrations of osmotically
active sugars), but an accumulation of osmotically inactive C-reserves. In addition
to starch, storage lipids in sapwood were also found to increase significantly in three
different pine species along treeline ecotones, and lipids concentrations of pines at
alpine treelines were found to be about twice that of pines from lowland sites (Hoch
and Körner 2003). The elevational patterns found in the global survey by Hoch and
Körner (2012) were also described in several other studies (e.g., Piper et al. 2006;
Shi et al. 2006), and the increase of NSC could be shown to be of a similar
magnitude between evergreen and deciduous species (Fajardo et al. 2013). To my
knowledge, there is so far only one single study that investigated the C-balance
along elevational gradients in trees that do not reach the alpine treeline. Within a
recent survey, NSC concentrations in stem wood of eight European broad-leaved
tree species were investigated along elevational gradients from the species’ upper
distribution limit (which differed by almost 1,000 elevational meter among species)
downslope to about 1,200 m below the species’ upper limit (A. Lenz, unpublished
data). Across all investigated species, this survey revealed no or increasing trends
of NSC concentrations with elevation, indicating that also for tree species that do
not reach the alpine treeline, C-limitation is unlikely the growth limiting mechanism at their respective cold limits.
Investigation of trees along different elevations have to deal with a shift in
phenology along these gradients (e.g., an earlier start of the growing season at
lower elevations, Fig. 3). Thus, comparisons of NSC between sites at different
elevations should be either conducted with trees at the same phenological stage
(i.e., at different dates for different elevations) or at a period during the year at
which trees are at the same phenological stage across the whole elevational gradient
(e.g., at the end of the season or during the dormant period). Consequently, studies
that investigated NSC trends in evergreen trees across the alpine treeline ecotone at
different dates during the growing season (Li et al. 2008; Sveinbjornsson
et al. 2010) reported also a decline of NSC from lower to higher sites during the
332
G. Hoch
a
b
Fig. 3 The phenological shift in bud break dates between low and high elevation tree stands leads
to an elevational shift in the seasonal NSC patterns in evergreen conifer needles (a) and deciduous
branch wood (b). 1, 2, and 3 show three different sampling dates for NSC analyses along the
growing season, indicating the stronger phenological bias on comparative NSC analyses along
elevational gradients at sampling dates 1 and 2 compared to date 3 at the end of the growing season
first half of the growing season. Most likely, this is not an indication of reduced
C-supply at higher elevations, but a bias from sampling trees at different
phenophases around bud break, a period where temporal changes in NSC concentrations are most pronounced and fast (Fig. 3; Fischer and Höll 1991; Hoch
Carbon Reserves as Indicators for Carbon Limitation in Trees
333
et al. 2002, 2003). For example, a sampling campaign on date 1 in Fig. 3 would
reveal higher reserve concentrations at lower elevations in evergreen species and
lower concentrations at low elevation species of deciduous species, while the
situation would be reversed at sampling date 2 (Fig. 3).
The observed increase of tissues C-reserve concentrations towards treeline has
been interpreted as an indication of an oversupply of C resulting from a disproportional decrease of growth relative to photosynthesis (Hoch and Körner 2012;
Körner 1998). In contrast, it has been also assumed more recently that this
elevational pattern might be due to an internal (in the sense of “intentional”)
upregulation of C-stores in trees facing cold stress (Wiley and Helliker 2012), in
which case the increased investment into C-storage might be even in competition
with growth. However, there is unequivocal physiological evidence that cell growth
in cold adapted trees ceases at considerable warmer temperature than
net-photosynthesis (e.g., Grace et al. 2002; Palacio et al. 2014 and references
therein). Tree growth becomes negligible below ca. 5 C (Alvarez-Uria and Körner
2007; Rossi et al. 2007) and comes to a complete stop between 2 and 3 C
depending on species (Halter et al. 1997; Solfjeld and Johnsen 2006; Schenker
et al. 2014), while in cold adapted trees considerable positive net-photosynthesis
has been reported near 0 C and below (Körner 2012; Wieser and Tausz 2007).
Hence, there is substantial evidence apart from the analyses of C-reserve concentrations that points at a direct limitation of growth processes at cold treeline
temperatures, rendering the hypothesis of a cold-induced reserve formation on the
expense of growth rather unlikely.
It has been also suggested that the higher NSC concentrations found in trees at
alpine treelines are ecotypical (genetic) adaptations to the cold and often harsher
environment (Smith et al. 2003; Sveinbjörnsson 2000), resulting in tree populations
at treeline that differ from trees at lower elevations by intrinsically higher C-reserve
stores (Monson et al. 2006). However, recent investigations could largely rebut this
hypothesis. A study that investigated dwarfed Picea abies trees growing on montane permafrost patches in the Swiss Jura mountains showed significantly enhanced
NSC and lipid concentrations in different tissues of these trees compared to tall
growing trees of the same age in the immediate neighborhood (Hoch 2008). The
fact that the trees on these permafrost sites are most likely recruited from the
surrounding tall forests, suggests that the NSC increase on permafrost cannot be a
genetically fixed trait. An even stronger evidence for the absence of ecotypic
adaptations with respect to higher NSC concentrations at treeline was delivered
recently by Fajardo et al. (2012), who found consistently increasing NSC concentrations in wood and leaves in afforested trees (Larix decidua, Pinus cembra, Pinus
sylvestris) from single seed sources that were planted along elevational gradients
from lower montane sites up to the alpine treeline. These studies together with ex
situ experiments (see below) that also used trees from single provenances, clearly
suggest that the observed increase of NSC at cold, growth limiting temperatures is
an immediate physiological effect and not an evolved ecotypic adaptation.
The increasing C-reserve concentrations in tree tissues towards alpine treelines
and the presence of direct growth limitation at cold growing season temperatures
334
G. Hoch
typically found at these sites were largely confirmed in experimental studies.
Within a phyotoron experiment, seedlings of Pinus mugo and Larix decidua were
treated with 20 weeks growing seasons with either mean temperatures of 6 C
(corresponding to the mean season temperature at natural treelines) or of 12 C.
Seedlings treated with low temperatures showed significantly enhanced NSC concentrations while their growth was severely reduced compared to warm treated
controls (Hoch and Körner 2009). The same study tested also the effect of seasonally variable temperatures versus completely constant temperatures on growth and
C-relations. Interestingly, this comparison revealed very similar reaction of wholeseason growth and NSC concentrations, independent of if temperatures varied
diurnally and seasonally or not (Hoch and Körner 2009). Higher tissue concentrations of C-reserves were also found in seedlings of the broad-leaved species Betula
pendula treated with growth limiting cold root zone temperatures (Solfjeld and
Johnsen 2006) and in first year seedlings of Abies lasiocarpa and Pseudotsuga
menziesii transplanted to treeline compared to seedlings grown 550 elevational
meters below (Bansal and Germino 2010).
Up to date, there has been only one single study that tested the growth-limitation
hypothesis at treeline by directly applying elevated CO2 concentrations (Dawes
et al. 2011, 2013; Handa et al. 2005). In this study that investigated afforested Larix
decidua and Pinus uncinata which were exposed to elevated CO2 by a FACE
system for 9 consecutive years at the alpine treeline ecotone, both species reacted
to high CO2 with a significant increase of their NSC tissue concentrations.
P. uncinata showed no stimulation of growth under elevated CO2 throughout the
experiment, suggesting a strong direct limitation of growth in this species. In
contrast, L. decidua treated with high CO2 exhibited a significant increase in
aboveground wood production (average of 33 % larger tree rings over all 9 years,
Dawes et al. 2013). However, while the CO2 stimulation of growth in L. decidua
was high during the first 7 years of the experiment, it seemed to have leveled off
towards the end of the 9-year study period (Dawes et al. 2011). Hence, the initially
very positive CO2 effect on growth might have been transient (similar to the
findings for temperate forests by Norby et al. (2010) discussed above) and was
probably also influenced by a series of unusually warm growing seasons at the
beginning of the experiment, including the extreme European heat-wave summer of
2003 (Jolly et al. 2005).
4.2.2
Hydraulic Limits of Tree Growth
Hydraulic constraints for water transport in trees induces a reduction of stomatal
conductance, which in turn might lead to C-limitation for growth or even
C-starvation as the cause for tree die-off. Hydraulic limitation on tree growth and
drought-induced tree mortality have gained growing attention over the last few
years, mainly because large-scale tree mortality that is very likely related to water
shortage has increased globally during the last two decades (Allen et al. 2010).
Global climate models predict significant reductions of precipitation within the next
Carbon Reserves as Indicators for Carbon Limitation in Trees
335
century (IPCC 2013) in many regions worldwide, including areas that are already
currently facing water shortage, like the south-west of the USA or south-western
Europe. In addition the future increase of temperatures will enhance the atmospheric evaporative demands, leading to an increasing vapor pressure deficit
(VPD), thus potentially inducing water limitation also in regions that will not
experience a direct decrease of precipitation in the years to come (Breshears
et al. 2013; Will et al. 2013; Williams et al. 2013). Finally, warmer temperatures
will probably further burden the C-balance of trees by an increase of respiration
(Adams et al. 2009; Zhao et al. 2013). Drought-induced tree mortality on larger
areas have dramatic effects for ecological and biogeochemical processes, including
the ecosystem water balance, soil erosion, and ecosystem C-sequestration, but it
might also have drastic feedback effects on the global climate (Bonan 2008). In
order to better understand and assess these scenarios, precise models that predict the
development of forests facing drought are needed. A thorough understanding of the
underlying physiological processes responsible for the observed effects of drought
is necessary to improve the current, largely correlative vegetation models (Powell
et al. 2013). However, there are still large uncertainties about the actual biological
mechanisms that lead to reduced growth and mortality in drought-stressed trees.
Here I will summarize, how the analyses of C-reserve concentrations in tree tissues
are used to investigate these mechanisms. Whenever hydraulic constraints in trees
are discussed, it is important to consider the initial nonlethal drought stress that
limits growth separately form severe and lethal drought stress. Likely, the physiological mechanisms behind growth limitation are different from the processes
involved in tree mortality under drought. Of course, growth limitation and tree
mortality are occurring not independently with the first occurring before the latter
on a continuous gradient of drought stress severity (Fig. 4). In the following, I will
first consider the effects and physiological mechanisms of hydraulic constraints on
growth and then discuss the current state of knowledge about the mechanisms
behind drought-induced tree mortality in context of a tree’s C-relation.
Hydraulic Constraints on Tree Growth
It is well established in forestry that tree productivity decreases with decreasing site
water availability. Ryan and Yoder (1997) hypothesized that also the decline of
productivity in trees reaching their maximum height is due to increasing hydraulic
constraints, since growing trees have to move water against gravity to even higher
positions. Like in plants that are facing soil water shortage, the decreasing water
potential in tree crowns that approach their maximum height enforce earlier stomatal closure (Woodruff et al. 2004), which in turn results in declining photosynthetic rates at the leaf level (Koch et al. 2004). Consequently, it has been proposed
that the decline of productivity in trees on dry sites as well as in old trees is caused
by C-limitation, resulting from the disproportional decrease of net-photosynthesis
over C-sink demands (“hydraulic limitation hypothesis,” Ryan and Yoder 1997).
336
G. Hoch
a
b
Fig. 4 Schematic concept for the interdependency of photosynthesis, respiration, and growth on a
tree’s C-reserve pool at sustained drought stress, and the interrelated effect of xylem cavitation,
phloem failure, and pathogen infestation on the size of the C-reserve pool at the time of tree death.
In terms of C-relations, growth limitation needs to be considered separately from tree mortality
under drought, indicated by the two arrows at the top of the figures. (a) Situation in trees with
sustained hydraulic conductivity and pathogen resistance at drought. (b) Situation in trees with fast
hydraulic conductivity loss and high vulnerability against pathogens at drought. The point of tree
death is indicated by the vertical grey bar; the arrow indicates the level of the C-reserve pool at
tree die-off. This scheme is a simplified synthesis of a previous concept presented in McDowell
et al. (2011)
Carbon Reserves as Indicators for Carbon Limitation in Trees
337
To investigate this hypothesis, the analysis of C-reserve concentrations in tree
tissue is a promising approach.
The hydraulic limitation hypothesis was first evaluated by comparative NSC
analyses in a study that investigated Pinus ponderosa trees growing on two sites
differing in soil moisture (Sala and Hoch 2009). Against the initial hypothesis by
Ryan and Yoder (1997), this study revealed significantly increasing concentrations
of NSC in sapwood and needles, and of storage lipids in branch wood as the trees
approach their site-specific maximum heights. Importantly, the average concentrations of C-reserves, as well as their relative increase with tree height, were found to
be higher in trees at a dry stand with smaller trees compared to a moister site with
larger trees (Sala and Hoch 2009). This study suggested clearly that the hydraulic
constraints in tall growing trees do not exert negative C-balances, and C-limitation
can thus unlikely be the responsible physiological mechanism behind declining
growth. The results described in Sala and Hoch (2009) were confirmed by
Woodruff and Meinzer (2011), who analyzed the seasonal course of NSC in
wood and needles of Pseudotsuga menziesii trees of different heights between
2 and 57 m. Cross-seasonal average NSC concentrations were higher and seasonal
variations of NSC were smaller the higher the trees. The study by Woodruff and
Meinzer (2011) could further show a very strong negative correlation between NSC
concentrations in branch wood and shoot elongation, since smaller trees had
stronger shoot growth and lower NSC concentrations. The same study found also
a negative correlation between NSC concentration and the branch water potential
(i.e., higher NSC concentrations at lower water potentials). In conclusion, these
results point to a growth limiting process, which, in contrast to the original
hydraulic limitation hypothesis, leads to a relative oversupply with photoassimilates, despite the observed reduced stomatal conductance. Thus, under
hydraulic constraints, meristematic growth (cell division and expansion) declines
significantly earlier than photosynthesis (Fig. 4), and in analogy to the processes at
the cold growth limit of trees, this direct limitation of growth processes is indicated
by higher NSC tissue concentrations in taller trees and drier sites (see also the initial
increase in NSC in Fig. 4). In fact, the higher sensitivity of growth compared to
photosynthesis to decreasing plant water potentials has been documented already
more than 40 years ago in different plants (e.g., Boyer 1970; Hsiao and Acevedo
1974) and has been recently reviewed by Muller et al. (2011). Hence, NSC analyses
are in line with predictions from independent physiological measurements of
growth rates and photosynthesis, and the observed growth declines are not caused
by C-limitation but by a direct growth limitation, likely induced by increasing
difficulties to establish the necessary turgor for cell division and expansion within
growing meristems (Woodruff et al. 2004).
Drought-Induced Tree Mortality
Although C-limitation is most likely not decisive for growth reduction under
hydraulic constraints, it might be a significant process for tree mortality under
338
G. Hoch
severe drought. Hypothesized first in the seminal review by McDowell et al. (2008),
and exhaustively discussed thereafter in several papers (e.g., McDowell et al. 2011;
Sala et al. 2010; Sevanto et al. 2014), drought-induced tree mortality might occur
by three processes that likely are not acting separately, but in combination (1)
hydraulic failure (i.e., a lethal loss of conductivity in the xylem), (2) C-starvation
(i.e., the depletion of C-reserves to a point where they cannot supply basic
C-needs), and (3) biotic attack (i.e., the infestation of pathogenic insects or fungal
infection). While biotic attacks might often follow the weakening of trees by either
(1) or (2) or both, the debate if and under which conditions, either hydraulic failure
or C-starvation is the initial cause for tree mortality is ongoing. In addition,
hydraulic limitations of xylem water transport are probably also impairing the
phloem movement of photoassimilates as well as the remobilization of stored C,
thereby linking hydraulic constraints and C-relations beyond the effect of drought
on stomatal conductance (e.g., McDowell et al. 2011; Sala et al. 2010; Sevanto
2014). Finally, trees depend on the presence of a certain amount of carbohydrates
for the osmoregulation of C-transport and the maintenance of the hydraulic conductivity in the sapwood, which likely limits the degree to which living trees can
degrade C-reserve stores under drought (Sala et al. 2012b).
The comparative analysis of C-reserve concentrations in tree tissues has been
used in a number of recent studies to test the absence or presence of C-starvation in
drought-stressed trees. So far, these tests revealed very different results ranging
from a significant increase of NSC concentrations, over no changes to an almost
complete depletion of C-reserves under drought. For example, Anderegg (2012)
reported increasing NSC concentrations in drought-stressed Populus tremuloides,
with the strongest increase occurring in roots. Similarly, a very strong increase of
starch concentrations in roots was found in the same species treated with experimental drought under green house conditions (Galvez et al. 2011). Anderegg and
Anderegg (2013) found no significant changes in seedlings of two conifers
(Juniperus osteosperma and Pinus edulis) at drought-induced mortality, but severe
losses of hydraulic conductivity. A study on two Nothofagus species revealed
opposite NSC reactions in response to experimentally applied drought (Piper
2011). While NSC concentrations increased in the more drought-tolerant
N. dombeyi, it decreased in the more drought-sensitive N. nitida. Other experimental drought studies reported changes in C-reserve concentrations that differed
among organs. A recent study on Populus balsamifera and Populus tremuloides
seedlings showed decreased C-reserve concentrations especially in roots, but to a
lesser extend in leaves and stems in drought-stressed seedlings under outdoor
conditions (Galvez et al. 2013). The lowered NSC concentrations in roots in the
study by Galvez et al. (2013) were probably responsible for higher rates of winter
mortality following the dry season. A drought experiment by Hartmann
et al. (2013b) in Picea abies trees showed a very strong decline of NSC (especially
of starch) reserves in roots in drought treated trees at the time of death, while starch
and sugar concentrations in aboveground organs were similar to watered controls.
The same pattern was reported in Hartmann et al. (2013a), where it was additionally
shown that P. abies decreased C-reserves much faster under CO2-depletion than
Carbon Reserves as Indicators for Carbon Limitation in Trees
339
under drought, indicating that hydraulic failure rather than C-starvation was the
cause for drought-induced mortality in trees at ambient CO2 in that study. Finally,
significantly lower starch concentrations in stem collar sapwood of Quercus robur
in autumn after the extreme European heat- and drought-summer of 2003 were
reported for trees that exhibited high branch die-back in the following spring (Bréda
et al. 2006), and a survey of heavily drought-stressed individuals of mature Pinus
sylvestris trees showed almost a complete depletion of NSC in their stem sapwood
the season before they died (Galiano et al. 2011).
The contrasting results for tissue NSC concentrations in response to lethal
drought among the above-mentioned studies, deliver important information about
the effect of drought on the tree C-balance. There are three potential explanations
that are likely causes for these varying results: (1) species-specific differences (i.e.,
different tree species show different sensitivities to cavitation and C-starvation),
(2) differences in the experimentally applied drought (i.e., severity and/or duration
of drought among studies), and (3) differences among tree organs (i.e., C-starvation
does not occur simultaneously throughout the whole tree, but is restricted to one
organ). Certainly, the species-specific vulnerability to conductivity loss is an
important factor determining, if a tree can survive long enough under drought to
deplete its C-reserves. Cavitation is supposed to occur earlier in so-called
anisohydric species (Fig. 4b) than in isohydric species, which avoid critical negative tree water potentials by earlier stomata closure at drought (Fig. 4a; McDowell
et al. 2008). In addition, the speed with which cavitation occurs depends on the
severity of the applied drought. A slow decline of soil water potential will more
likely lead to C-starvation in trees than an abrupt change in soil water availability,
as could be experimentally shown recently in Pinus edulis trees (Sevanto
et al. 2014), where fast dying trees had higher NSC branch reserve concentrations
than trees that survived longer under drought. Several studies that investigated
above- and belowground NSC concentrations found no decline, or even an increase
of NSC in leaves and branch wood, but sometimes significant declines of NSC in
stem and especially in roots. Such a local decline of C-reserves in tissue furthest
away from leaves might be indicative of an insufficient downward transport of
C-assimilates in the phloem as a consequence of hydraulic constraints to the upward
water movement in the xylem (Sala et al. 2010; Sevanto 2014) and reduced
translocation of recent carbon form leaves in drought-stressed trees (Ruehr
et al. 2009). Hence, while the drought-induced reduction of productivity is unlikely
driven by C-limitation, C-starvation might occur locally (i.e., restricted to specific
organs) in dying trees experiencing sustained and mild drought. However, the
majority of the existing studies on drought-induced tree mortality suggest that in
most species and under most conditions, hydraulic conductivity loss by cavitation
generally precedes carbon starvation (e.g., Hartmann et al. 2013a; Sevanto
et al. 2014).
340
G. Hoch
5 Concluding Remarks
Over the last decades, the comparative analysis of C-reserve concentrations in plant
tissue has been established as a valuable tool to assess the C-supply status of trees.
The principal responsiveness of the C-reserves to changes of a plant’s C-sourcesink-balance could be demonstrated unequivocally in previous experiments. Most
importantly, environmental stressors that affect exclusively photosynthesis, like
deep shade and low CO2, lead to a significant depletion of C-reserves in plant tissue.
Hence, the increasing tissue concentrations of NSC and storage lipids found in trees
that experience growth restriction at cold temperatures and under hydraulic constraints are very likely indicative for a direct limitation of growth processes and the
absence of C-limitation under these adverse conditions (Palacio et al. 2014). However, to improve the usability of quantitative C-reserve analyses for predictions of a
plant’s C-supply status, further research in the line of Schädel et al. (2009) and
Schädel et al. (2010) will be needed to clarify which cell compounds beside NSC
and lipids can serve as C-sources. In addition, because C-limitation will never lead
to a complete depletion of all C-reserves in living cells, experimental studies and
meta-analyses over existing studies should identify the minimum and maximum
concentrations of C-reserve compounds in different plant groups and tissues.
Finally, we are still lacking a conclusive picture about how and to which extent
intrinsic reserve formation, like C storage before the dormant season, does interfere
with the simple “bucket-model” of C-reserve dynamics in trees by allocating
photoassimilates to storage against other C-sink demands. Such information is
needed to unequivocally predict C-starvation in plants by quantitative C-reserve
analyses.
The temporal dynamics of C-reserves within entire trees will be only understood
once the long-distance C-transport via the phloem can be measured quantitatively
and continuously. Up to date the phloem C-flux has been mainly inferred from pulse
labeling experiments with either 13C or 14C labeled photoassimilates (e.g.,
Dannoura et al. 2011; Hansen and Grauslun 1973; Streit et al. 2013). However, in
order to accurately interpret the local depletion of C-reserves found in some of the
experimental studies that investigated drought-induced tree mortality, a continuous
and nondestructive monitoring of phloem transport would be needed. In this respect
two new techniques appear promising: the concurrent and continuous measurement
of bark and xylem diameter changes (e.g., Mencuccini et al. 2013; Sevanto
et al. 2003) and the usage of nuclear magnetic resonance imaging (e.g., Windt
et al. 2006). Combining quantitative analyses of C-reserve concentrations with
gas-exchange and new techniques of sap-flux measurements in field studies and
ex situ experiments will certainly help to further improve our understanding of the
C-relations of trees under environmental stress.
Acknowledgments I would like to thank all colleagues, students, and field helpers who contributed
to my research over the last years. Especially I thank Christian Körner, Anna Sala, Frida Piper, Alex
Fajardo, and Qingmin Han for the fruitful collaborations in experiments and field surveys about
the C-supply status of trees. During the time of writing this manuscript, I received funding from the
European Research Council (ERC) grant No. 233399 (project ‘TREELIM’ to Christian Körner).
Carbon Reserves as Indicators for Carbon Limitation in Trees
341
References
Adams HD, Guardiola-Claramonte M, Barron-Gafford GA, Villegas JC, Breshears DD, Zou CB,
Troch PA, Huxman TE (2009) Temperature sensitivity of drought-induced tree mortality
portends increased regional die-off under global-change-type drought. Proc Natl Acad Sci U
S A 106(17):7063–7066. doi:10.1073/pnas.0901438106
Allen CD, Macalady AK, Chenchouni H, Bachelet D, McDowell N, Vennetier M, Kitzberger T,
Rigling A, Breshears DD, Hogg EH, Gonzalez P, Fensham R, Zhang Z, Castro J, Demidova N,
Lim JH, Allard G, Running SW, Semerci A, Cobb N (2010) A global overview of drought and
heat-induced tree mortality reveals emerging climate change risks for forests. Forest Ecol
Manage 259(4):660–684. doi:10.1016/j.foreco.2009.09.001
Alvarez-Uria P, Körner C (2007) Low temperature limits of root growth in deciduous and
evergreen temperate tree species. Funct Ecol 21(2):211–218
Anderegg WRL (2012) Complex aspen forest carbon and root dynamics during drought A letter.
Clim Change 111(3–4):983–991. doi:10.1007/s10584-012-0421-9
Anderegg WRL, Anderegg LDL (2013) Hydraulic and carbohydrate changes in experimental
drought-induced mortality of saplings in two conifer species. Tree Physiol 33(3):252–260.
doi:10.1093/treephys/tpt016
Bader MKF, Siegwolf R, Körner C (2010) Sustained enhancement of photosynthesis in mature
deciduous forest trees after 8 years of free air CO2 enrichment. Planta 232(5):1115–1125.
doi:10.1007/s00425-010-1240-8
Bader MKF, Leuzinger S, Keel SG, Siegwolf RTW, Hagedorn F, Schleppi P, Körner C (2013)
Central European hardwood trees in a high-CO2 future: synthesis of an 8-year forest canopy
CO2 enrichment project. J Ecol. doi:10.1111/1365-2745.12149
Bansal S, Germino MJ (2010) Unique responses of respiration, growth, and non-structural
carbohydrate storage in sink tissue of conifer seedlings to an elevation gradient at timberline.
Environ Exp Bot 69:313–319
Barbaroux C, Breda N (2002) Contrasting distribution and seasonal dynamics of carbohydrate
reserves in stem wood of adult ring-porous sessile oak and diffuse-porous beech trees. Tree
Physiol 22(17):1201–1210
Bonan GB (2008) Forests and climate change: forcings, feedbacks, and the climate benefits of
forests. Science 320(5882):1444–1449. doi:10.1126/science.1155121
Boyer JS (1970) Leaf enlargement and metabolic rates in corn, soybean, and sunflower at various
leaf water potentials. Plant Physiol 46(2):233–235. doi:10.1104/pp. 46.2.233
Bréda N, Huc R, Granier A, Dreyer E (2006) Temperate forest trees and stands under severe
drought: a review of ecophysiological responses, adaptation processes and long-term consequences. Ann Forest Sci 63:625–644
Breshears DD, Adams HD, Eamus D, McDowell N, Law DJ, Will RE, Williams AP, Zou CB
(2013) The critical amplifying role of increasing atmospheric moisture demand on tree
mortality and associated regional die-off. Front Plant Sci 4:266
Carbone MS, Czimczik CI, Keenan TF, Murakami PF, Pederson N, Schaberg PG, Xu X,
Richardson AD (2013) Age, allocation and availability of nonstructural carbon in mature red
maple trees. New Phytol 200:1145–1155. doi:10.1111/nph.12448
Chapin FS, Schulze ED, Mooney HA (1990) The ecology and economics of storage in plants.
Annu Rev Ecol Syst 21:423–447
Crone EE, Miller E, Sala A (2009) How do plants know when other plants are flowering? Resource
depletion, pollen limitation and mast-seeding in a perennial wildflower. Ecol Lett 12
(11):1119–1126. doi:10.1111/j.1461-0248.2009.01365.x
Dannoura M, Maillard P, Fresneau C, Plain C, Berveiller D, Gerant D, Chipeaux C, Bosc A,
Ngao J, Damesin C, Loustau D, Epron D (2011) In situ assessment of the velocity of carbon
transfer by tracing 13C in trunk CO2 efflux after pulse labelling: variations among tree species
and seasons. New Phytol 190(1):181–192. doi:10.1111/j.1469-8137.2010.03599.x
342
G. Hoch
Dawes MA, Hättenschwiler S, Bebi P, Hagedorn F, Handa IT, Körner C, Rixen C (2011) Speciesspecific tree growth responses to 9 years of CO2 enrichment at the alpine treeline. J Ecol 99
(2):383–394. doi:10.1111/j.1365-2745.2010.01764.x
Dawes MA, Hagedorn F, Handa IT, Streit K, Ekblad A, Rixen C, Körner C, Hättenschwiler S
(2013) An alpine treeline in a carbon dioxid-rich world: synthesis of a nine-year free-air carbon
dioxide enrichment study. Oecologia 171:623–637. doi:10.1007/s00442-012-2576-5
Dickson RE (1991) Assimilate distribution and storage. In: Raghavendra AS (ed) Physiology of
trees. Wiley, New York, pp 51–85
Fajardo A, Piper FI, Pfund L, Körner C, Hoch G (2012) Variation of mobile carbon reserves in
trees at the alpine treeline ecotone is under environmental control. New Phytol 195:794–802
Fajardo A, Piper FI, Hoch G (2013) Similar variation in carbon storage between deciduous and
evergreen treeline species across elevational gradients. Ann Bot 112:623–631
Fischer C, Höll W (1991) Food reserves of scots pine (Pinus sylvestris L.) I. Seasonal changes in
the carbohydrate and fat reserves of pine needles. Trees 5:187–195
Fischer C, Höll W (1992) Food reserves of scots pine (Pinus sylvestris L.) II. Seasonal changes and
radial distribution of carbohydrate and fat reserves in pine wood. Trees 6:147–155
Galiano L, Martı́nez-Vilalta J, Lloret F (2011) Carbon reserves and canopy defoliation determine
the recovery of Scots pine 4 yr after a drought episode. New Phytol 190(3):750–759. doi:10.
1111/j.1469-8137.2010.03628.x
Galvez DA, Landhäusser SM, Tyree MT (2011) Root carbon reserve dynamics in aspen seedlings:
does simulated drought induce reserve limitation? Tree Physiol 31(3):250–257. doi:10.1093/
treephys/tpr012
Galvez DA, Landhäusser SM, Tyree MT (2013) Low root reserve accumulation during drought
may lead to winter mortality in poplar seedlings. New Phytol 198(1):139–148. doi:10.1111/
nph.12129
Grace J, Berninger F, Nagy L (2002) Impacts of climate change on the tree line. Ann Bot 90:537–
544
Halter R, Sands R, Ashton DH, Nambiar EKS (1997) Root growth of subalpine and montane
Eucalyptus seedlings at low soil temperatures. Trees 12(1):35–41
Han Q, Kabeya D, Hoch G (2011) Leaf traits, shoot growth and seed production in mature Fagus
sylvatica trees after 8 years of CO2 enrichment. Ann Bot 107(8):1405–1411. doi:10.1093/aob/
mcr082
Han Q, Kabeya D, Iio A, Inagaki Y, Kakubari Y (2014) Nitrogen storage dynamics are affected by
masting events in Fagus crenata. Oecologia 174:679–687. doi:10.1007/s00442-013-2824-3
Handa IT, Körner C, Hattenschwiler S (2005) A test of the tree-line carbon limitation hypothesis
by in situ CO2 enrichment and defoliation. Ecology 86(5):1288–1300
Hansen P, Grauslun J (1973) 14C-studies on apple-trees. 8. Seasonal-variation and nature of
reserves. Physiol Plant 28(1):24–32
Hartmann H, Ziegler W, Kolle O, Trumbore S (2013a) Thirst beats hunger – declining hydration
during drought prevents carbon starvation in Norway spruce saplings. New Phytol 200(2):340–
349. doi:10.1111/nph.12331
Hartmann H, Ziegler W, Trumbore S (2013b) Lethal drought leads to reduction in nonstructural
carbohydrates in Norway spruce tree roots but not in the canopy. Funct Ecol 27(2):413–427.
doi:10.1111/1365-2435.12046
Hoch G (2005) Fruit-bearing branchlets are carbon autonomous in mature broad-leaved temperate
forest trees. Plant Cell Environ 28(5):651–659
Hoch G (2007) Cell wall hemicelluloses as mobile carbon stores in non-reproductive plant tissues.
Funct Ecol 21(5):823–834
Hoch G (2008) The carbon supply of Picea abies trees at a Swiss montane permafrost site. Plant
Ecol Divers 1(1):13–20
Hoch G, Körner C (2003) The carbon charging of pines at the climatic treeline: a global
comparison. Oecologia 135(1):10–21
Carbon Reserves as Indicators for Carbon Limitation in Trees
343
Hoch G, Körner C (2009) Growth and carbon relations of tree line forming conifers at constant
vs. variable low temperatures. J Ecol 97(1):57–66. doi:10.1111/j.1365-2745.2008.01447.x
Hoch G, Körner C (2012) Global patterns of mobile carbon stores in trees at the high-elevation tree
line. Glob Ecol Biogeogr 21(8):861–871. doi:10.1111/j.1466-8238.2011.00731.x
Hoch G, Popp M, Körner C (2002) Altitudinal increase of mobile carbon pools in Pinus cembra
suggests sink limitation of growth at the Swiss treeline. Oikos 98(3):361–374
Hoch G, Richter A, Körner C (2003) Non-structural carbon compounds in temperate forest trees.
Plant Cell Environ 26:1067–1081
Hoch G, Siegwolf RTW, Keel SG, Körner C, Han Q (2013) Fruit production in three masting tree
species does not rely on stored carbon reserves. Oecologia 171:653–662
Hsiao TC, Acevedo E (1974) Plant responses to water deficits, water-use efficiency, and drought
resistance. Agric Meteorol 14:59–84
Ichie T, Nakagawa M (2013) Dynamics of mineral nutrient storage for mast reproduction in the
tropical emergent tree Dryobalanops aromatica. Ecol Res 28:151–158. doi:10.1007/s11284011-0836-1
Ichie T, Igarashi S, Yoshida S, Kenzo T, Masaki T, Tayasu I (2013) Are stored carbohydrates
necessary for seed production in temperate deciduous trees? J Ecol 101(2):525–531. doi:10.
1111/1365-2745.12038
IPCC (2013) Climate change 2013: The Physical Science Basis. Working Group I Contribution to
the 5th Assessment Report of the Intergovernmental Panel on Climate Change. Cambridge
University Press, New York
Isagi Y, Sugimura K, Sumida A, Ito H (1997) How does masting happen and synchronize? J Theor
Biol 187(2):231–239. doi:10.1006/jtbi.1997.0442
Jolly WM, Dobbertin M, Zimmermann NE, Reichstein M (2005) Divergent vegetation growth
responses to the 2003 heat wave in the Swiss Alps. Geophys Res Lett 32(18). doi:10.1029/
2005GL023252
Kelly D (1994) The evolutionary ecology of mast seeding. Trends Ecol Evol 9(12):465–470
Koch GW, Sillett SC, Jennings GM, Davis SD (2004) The limits to tree height. Nature 428
(6985):851–854
Körner C (1998) A re-assessment of high elevation treeline positions and their explanation.
Oecologia 115(4):445–459
Körner C (2003) Carbon limitation in trees. J Ecol 91:4–17
Körner C (2006) Plant CO2 responses: an issue of definition, time and resource supply. New Phytol
172(3):393–411
Körner C (2012) Alpine treelines: functional ecology of the global high elevation tree limits.
Springer, Berlin
Körner C (2013) Growth controls photosynthesis – mostly. Nova Acta Leopoldina 31(5):713–732
Körner C, Paulsen J (2004) A world-wide study of high altitude treeline temperatures. J Biogeogr
31(5):713–732
Körner C, Asshoff R, Bignucolo O, Hättenschwiler S, Keel SG, Pelaez-Riedl S, Pepin S, Siegwolf
RTW, Zotz G (2005) Carbon flux and growth in mature deciduous forest trees exposed to
elevated CO2. Science 309(5739):1360–1362
Kozlowski TT, Davis WJ, Pallardy SG (1991) The physiological ecology of woody plants.
Academic, San Diego
Landhäusser SM, Lieffers VJ (2003) Seasonal changes in carbohydrate reserves in mature
northern Populus tremuloides clones. Trees 17:471–476
Li MH, Xiao WF, Wang SG, Cheng GW, Cherubini P, Cai XH, Liu XL, Wang XD, Zhu WZ
(2008) Mobile carbohydrates in Himalayan treeline trees I. Evidence for carbon gain limitation
but not for growth limitation. Tree Physiol 28(8):1287–1296
McCarthy HR, Oren R, Johnsen KH, Gallet-Budynek A, Pritchard SG, Cook CW, LaDeau SL,
Jackson RB, Finzi AC (2010) Re-assessment of plant carbon dynamics at the Duke free-air
CO2 enrichment site: interactions of atmospheric [CO2] with nitrogen and water availability
over stand development. New Phytol 185(2):514–528. doi:10.1111/j.1469-8137.2009.03078.x
344
G. Hoch
McDowell SCL, McDowell NG, Marshall JD, Hultine K (2000) Carbon and nitrogen allocation to
male and female reproduction in Rocky Mountain Douglas-fir (Pseudotsuga menziesii var.
glauca, Pinaceae). Am J Bot 87(4):539–546. doi:10.2307/2656598
McDowell N, Pockman WT, Allen CD, Breshears DD, Cobb N, Kolb T, Plaut J, Sperry J, West A,
Williams DG, Yepez EA (2008) Mechanisms of plant survival and mortality during drought:
why do some plants survive while others succumb to drought? New Phytol 178(4):719–739.
doi:10.1111/j.1469-8137.2008.02436.x
McDowell NG, Beerling DJ, Breshears DD, Fisher RA, Raffa KF, Stitt M (2011) The
interdependence of mechanisms underlying climate-driven vegetation mortality. Trends Ecol
Evol 26(10):523–532. doi:10.1016/j.tree.2011.06.003
Mencuccini M, Holtta T, Sevanto S, Nikinmaa E (2013) Concurrent measurements of change in
the bark and xylem diameters of trees reveal a phloem-generated turgor signal. New Phytol 198
(4):1143–1154. doi:10.1111/nph.12224
Millard P, Sommerkorn M, Grelet GA (2007) Environmental change and carbon limitation in
trees: a biochemical, ecophysiological and ecosystem appraisal. New Phytol 175(1):11–28
Miyazaki Y, Hiura T, Kato E, Funada R (2002) Allocation of resources to reproduction in Styrax
obassia in a masting year. Ann Bot 89(6):767–772
Monson RK, Rosenstiel TN, Forbis TA, Lipson DA, Jaeger CH (2006) Nitrogen and carbon
storage in alpine plants. Integr Comp Biol 46(1):35–48
Muller B, Pantin F, Genard M, Turc O, Freixes S, Piques M, Gibon Y (2011) Water deficits
uncouple growth from photosynthesis, increase C content, and modify the relationships
between C and growth in sink organs. J Exp Bot 62(6):1715–1729. doi:10.1093/jxb/erq438
Mund M, Kutsch WL, Wirth C, Kahl T, Knohl A, Skomarkova MV, Schulze ED (2010) The
influence of climate and fructification on the inter-annual variability of stem growth and net
primary productivity in an old-growth, mixed beech forest. Tree Physiol 30(6):689–704.
doi:10.1093/treephys/tpq027
Norby RJ, Warren JM, Iversen CM, Medlyn BE, McMurtrie RE (2010) CO2 enhancement of forest
productivity constrained by limited nitrogen availability. Proc Natl Acad Sci U S A 107
(45):19368–19373. doi:10.1073/pnas.1006463107
Obeso JR (1998) Effects of defoliation and girdling on fruit production in Ilex aquifolium. Funct
Ecol 12(3):486–491
Palacio S, Hoch G, Sala A, Körner C, Millard P (2014) Does carbon storage limit tree growth?
New Phytol 201:1096–1100
Piper FI (2011) Drought induces opposite changes in the concentration of non-structural carbohydrates of two evergreen Nothofagus species of differential drought resistance. Ann Forest Sci
68(2):415–424
Piper FI, Cavieres LA, Reyes-Diaz M, Corcuera LJ (2006) Carbon sink limitation and frost
tolerance control performance of the tree Kageneckia angustifolia D. Don (Rosaceae) at the
treeline in central Chile. Plant Ecol 185(1):29–39
Piper FI, Reyes-Diaz M, Corucera LJ, Lusk CH (2009) Carbohydrate storage, survival, and growth
of two evergreen Nothofagus species in two contrasting light environments. Ecol Res 24:1233–
1241
Powell TL, Galbraith DR, Christoffersen BO, Harper A, Imbuzeiro HMA, Rowland L, Almeida S,
Brando PM, da Costa ACL, Costa MH, Levine NM, Malhi Y, Saleska SR, Sotta E, Williams M,
Meir P, Moorcroft PR (2013) Confronting model predictions of carbon fluxes with measurements of Amazon forests subjected to experimental drought. New Phytol 200(2):350–365.
doi:10.1111/nph.12390
Richardson AD, Carbone MS, Keenan TF, Czimczik CI, Hollinger DY, Murakami P, Schaberg
PG, Xu XM (2013) Seasonal dynamics and age of stemwood nonstructural carbohydrates in
temperate forest trees. New Phytol 197(3):850–861. doi:10.1111/nph.12042
Rossi S, Deslauriers A, Anfodillo T, Carraro V (2007) Evidence of threshold temperatures for
xylogenesis in conifers at high altitudes. Oecologia 152(1):1–12
Ruehr NK, Offermann CA, Gessler A, Winkler JB, Ferrio JP, Buchmann N, Barnard R (2009)
Drought effects on allocation of recent carbon: from beech leaves to soil CO2 efflux. New
Phytol 184:950–961. doi:10.1111/j.1469-8137.2009.03044.x
Carbon Reserves as Indicators for Carbon Limitation in Trees
345
Ryan MG, Yoder BJ (1997) Hydraulic limits to tree height and tree growth. Bioscience 47(4):235–
242
Sala A, Hoch G (2009) Height-related growth declines in ponderosa pine are not due to carbon
limitation. Plant Cell Environ 32(1):22–30. doi:10.1111/j.1365-3040.2008.01896.x
Sala A, Piper FI, Hoch G (2010) Physiological mechanisms of drought-induced tree mortality are
far from being resolved. New Phytol 186:274–281
Sala A, Fouts W, Hoch G (2011) Carbon storage in trees: does relative carbon supply decrease
with tree size? In: Meinzer FC, Dawson TE, Ladenbruch B (eds) Size- and age-related changes
in tree structure and function. Springer, Heidelberg, pp 287–306
Sala A, Hopping K, McIntire EJB, Delzon S, Crone EE (2012a) Masting in whitebark pine (Pinus
albicaulis) depletes stored nutrients. New Phytol 196(1):189–199. doi:10.1111/j.1469-8137.
2012.04257.x
Sala A, Woodruff DR, Meinzer FC (2012b) Carbon dynamics in trees: feast or famine? Tree
Physiol 32:764–775
Schädel C, Blöchl A, Richter A, Hoch G (2009) Short-term dynamics of nonstructural carbohydrates and hemicelluloses in young branches of temperate forest trees during bud break. Tree
Physiol 29(7):901–911. doi:10.1093/treephys/tpp034
Schädel C, Richter A, Blöchl A, Hoch G (2010) Hemicellulose concentration and composition in
plant cell walls under extreme carbon source-sink imbalances. Physiol Plant 139(3):241–255.
doi:10.1111/j.1399-3054.2010.01360.x
Schenker G, Lenz A, Körner C, Hoch G (2014) Physiological minimum temperatures for root
growth in seven common European broad-leaved tree species. Tree Physiol 34(3):302–313.
doi:10.1093/treephys/tpu003
Sevanto S (2014) Phloem transport and drought. J Exp Bot 65:1751–1759. doi:10.1093/jxb/ert467
Sevanto S, Vesala T, Peramaki M, Nikinmaa E (2003) Sugar transport together with environmental conditions controls time lags between xylem and stem diameter changes. Plant Cell Environ
26(8):1257–1265. doi:10.1046/j.1365-3040.2003.01049.x
Sevanto S, McDowell NG, Dickman LT, Pangle R, Pockman WT (2014) How do trees die? A test
of the hydraulic failure and carbon starvation hypotheses. Plant Cell Environ 37:153–161.
doi:10.1111/pce.12141
Shi P, Körner C, Hoch G (2006) End of season carbon supply status of woody species near the
treeline in western China. Basic Appl Ecol 7(4):370–377
Silvertown JW (1980) The evolutionary ecology of mast seeding in trees. Biol J Linean Soc
14:235–250
Smith WK, Germino MJ, Hancock TE, Johnson DM (2003) Another perspective on altitudinal
limits of alpine timberlines. Tree Physiol 23(16):1101–1112
Solfjeld I, Johnsen O (2006) The influence of root-zone temperature on growth of Betula pendula
Roth. Trees 20(3):320–328
Srichuwong S, Jane JL (2007) Physicochemical properties of starch affected by molecular
composition and structures: a review. Food Sci Biotechnol 16(5):663–674
Streit K, Rinne KT, Hagedorn F, Dawes MA, Saurer M, Hoch G, Werner RA, Buchmann N,
Siegwolf RTW (2013) Tracing fresh assimilates through Larix decidua exposed to elevated
CO2 and soil warming at the alpine treeline using compound-specific stable isotope analysis.
New Phytol 197(3):838–849. doi:10.1111/nph.12074
Sveinbjörnsson B (2000) North American and European treelines: external forces and internal
processes controlling position. Ambio 29(7):388–395
Sveinbjornsson B, Smith M, Traustason T, Ruess RW, Sullivan PF (2010) Variation in carbohydrate source-sink relations of forest and treeline white spruce in southern, interior and northern
Alaska. Oecologia 163(4):833–843. doi:10.1007/s00442-010-1597-1
Veneklaas EJ, den Ouden F (2005) Dynamics of non-structural carbohydrates in two Ficus species
after transfer to deep shade. Environ Exp Bot 54:148–154. doi:10.1016/j.envexpbot.2004.06.010
346
G. Hoch
Wieser G, Tausz M (2007) Current concepts for treelife limitation at the upper timberline. In:
Wieser G, Tausz M (eds) Trees at their upper limit: treelife limitation at the alpine timberline.
Springer, Berlin, pp 1–10
Wiley E, Helliker B (2012) A re-evaluation of carbon storage in trees lends greater support for
carbon limitation to growth. New Phytol 195:285–289
Will RE, Wilson SM, Zou CB, Hennessey TC (2013) Increased vapor pressure deficit due to higher
temperature leads to greater transpiration and faster mortality during drought for tree seedlings
common to the forest–grassland ecotone. New Phytol 200(2):366–374. doi:10.1111/nph.12321
Williams AP, Allen CD, Macalady AK, Griffin D, Woodhouse CA, Meko DM, Swetnam TW,
Rauscher SA, Seager R, Grissino-Mayer HD, Dean JS, Cook ER, Gangodagamage C, Cai M,
McDowell NG (2013) Temperature as a potent driver of regional forest drought stress and tree
mortality. Nat Clim Chang 3(3):292–297. doi:10.1038/nclimate1693
Windt CW, Vergeldt FJ, De Jager PA, Van As H (2006) MRI of long-distance water transport: a
comparison of the phloem and xylem flow characteristics and dynamics in poplar, castor bean,
tomato and tobacco. Plant Cell Environ 29(9):1715–1729. doi:10.1111/j.1365-3040.2006.
01544.x
Woodruff DR, Meinzer FC (2011) Water stress, shoot growth and storage of non-structural
carbohydrates along a tree height gradient in a tall conifer. Plant Cell Environ 34(11):1920–
1930. doi:10.1111/j.1365-3040.2011.02388.x
Woodruff DR, Bond BJ, Meinzer FC (2004) Does turgor limit growth in tall trees? Plant Cell
Environ 27(2):229–236
Würth MKR, Pelaez-Riedl S, Wright SJ, Körner C (2005) Non-structural carbohydrate pools in a
tropical forest. Oecologia 143(1):11–24
Yasumura Y, Hikosaka K, Hirose T (2006) Resource allocation to vegetative and reproductive
growth in relation to mast seeding in Fagus crenata. Forest Ecol Manage 229(1–3):228–233
Yoda K, Shinozaki K, Ogawa H, Hozumi K, Kira T (1965) Estimation of the total amount of
respiration in woody organs of trees and forest communities. J Biol Osaka City Univ 16:15–26
Zhao J, Hartmann H, Trumbore S, Ziegler W, Zhang Y (2013) High temperature causes negative
whole-plant carbon balance under mild drought. New Phytol 200(2):330–339. doi:10.1111/
nph.12400
Zotz G, Pepin S, Körner C (2005) No down-regulation of leaf photosynthesis in mature forest trees
after three years of exposure to elevated CO2. Plant Biol 7(4):369–374
Consequences of Changing Precipitation
Patterns for Ecosystem Functioning
in Grasslands: A Review
Stephan Unger and Marjan Jongen
Contents
1 Introduction . . . . . . . . . . . . . . . . . . . . . . . . . . . . . . . . . . . . . . . . . . . . . . . . . . . . . . . . . . . . . . . . . . . . . . . . . . . . . . . . .
1.1 Climate Change Influence on Precipitation Regimes . . . . . . . . . . . . . . . . . . . . . . . . . . . . . . . .
1.2 Grassland Ecosystems . . . . . . . . . . . . . . . . . . . . . . . . . . . . . . . . . . . . . . . . . . . . . . . . . . . . . . . . . . . . . . . .
1.3 Drivers of Ecosystem Processes in Grasslands . . . . . . . . . . . . . . . . . . . . . . . . . . . . . . . . . . . . . .
1.4 Experimental Designs to Study Precipitation Impacts at the Ecosystem Scale . . . .
1.5 Problems Associated with Precipitation Manipulation Experiments . . . . . . . . . . . . . . .
2 Methods . . . . . . . . . . . . . . . . . . . . . . . . . . . . . . . . . . . . . . . . . . . . . . . . . . . . . . . . . . . . . . . . . . . . . . . . . . . . . . . . . . . . .
2.1 Data Compilation . . . . . . . . . . . . . . . . . . . . . . . . . . . . . . . . . . . . . . . . . . . . . . . . . . . . . . . . . . . . . . . . . . . . .
2.2 Data Analysis . . . . . . . . . . . . . . . . . . . . . . . . . . . . . . . . . . . . . . . . . . . . . . . . . . . . . . . . . . . . . . . . . . . . . . . . .
3 The Impact of Changes in the Amount of Precipitation . . . . . . . . . . . . . . . . . . . . . . . . . . . . . . . . . . .
3.1 Precipitation Addition . . . . . . . . . . . . . . . . . . . . . . . . . . . . . . . . . . . . . . . . . . . . . . . . . . . . . . . . . . . . . . . .
3.2 Precipitation Reduction . . . . . . . . . . . . . . . . . . . . . . . . . . . . . . . . . . . . . . . . . . . . . . . . . . . . . . . . . . . . . . .
3.3 Sensitivity to Changes in the Amount of Precipitation . . . . . . . . . . . . . . . . . . . . . . . . . . . . . .
4 The Impact of Changes in Precipitation Variability . . . . . . . . . . . . . . . . . . . . . . . . . . . . . . . . . . . . . . .
5 The Impact of Changes in Precipitation Intensity . . . . . . . . . . . . . . . . . . . . . . . . . . . . . . . . . . . . . . . . .
6 Effects of Changing Precipitation Patterns on Synchronicity of the Matter Cycles . . . . . .
7 Synthesis . . . . . . . . . . . . . . . . . . . . . . . . . . . . . . . . . . . . . . . . . . . . . . . . . . . . . . . . . . . . . . . . . . . . . . . . . . . . . . . . . . . . .
References . . . . . . . . . . . . . . . . . . . . . . . . . . . . . . . . . . . . . . . . . . . . . . . . . . . . . . . . . . . . . . . . . . . . . . . . . . . . . . . . . . . . . . .
348
348
351
352
353
355
356
356
356
366
366
370
371
372
376
378
380
385
Abstract Grassland ecosystems worldwide provide agricultural goods and important ecosystem services. Productivity and other ecosystem processes in grasslands
are, in most cases, strongly linked to the ecosystems’ water status, a factor that is
predicted to experience major alterations with global climate change. Future predictions include changes in the amount, distribution, frequency, and intensity of
S. Unger (*)
Department for Experimental and Systems Ecology, University of Bielefeld, Universitätsstr.
25, 33615 Bielefeld, Germany
e-mail: stephan.unger@uni-bielefeld.de
M. Jongen
Instituto Superior de Agronomia, Universidade de Lisboa, Tapada da Ajuda, 1349-017 Lisboa,
Portugal
© Springer International Publishing Switzerland 2015
U. Lüttge, W. Beyschlag (eds.), Progress in Botany, Progress in Botany 76,
DOI 10.1007/978-3-319-08807-5_14
347
348
S. Unger and M. Jongen
precipitation, which, particularly in grasslands, may have important consequences
for ecosystem state and functioning. This review analyses the effects of experimental precipitation manipulation on plant productivity, species diversity, soil/
ecosystem respiration, and soil nitrogen in grassland-type ecosystems over a wide
range of climate types, synthesising the results from 72 studies.
We found that sensitivity of ecosystem processes to changes in precipitation
amounts increased with aridity. In addition, ecosystem processes were more
responsive to precipitation addition than to precipitation reduction. However, we
did observe high resilience of grassland ecosystems to both changing precipitation
amounts and variability, which may be explained by the fact that the applied
manipulation scenarios often lie within the range of the natural inter-annual precipitation variability experienced by ecosystems, and by evolutionary adaptation of
grassland ecosystems to these natural inter-annual differences. Long-term effects of
altered precipitation regimes on ecosystem processes, i.e. by changes in species
composition and soil properties, are rarely covered within the time frame of most
studies and thus cannot be ruled out as a possible consequence of a gradually
changing climate.
Increasing the comparability between individual precipitation manipulation
studies is needed to facilitate the evaluation of ecosystem responses to altered
precipitation regimes. We recommend future precipitation manipulation studies to
aim at capturing possible long-term effects with comparable designs and
standardised data compilation.
1 Introduction
1.1
Climate Change Influence on Precipitation Regimes
Anthropogenic fossil fuel emissions continue to impinge on global climate change,
resulting in ecosystems worldwide being subjected to altered temperature and
precipitation regimes. Basic theory and empirical evidence suggest that state,
functioning and service provision of ecosystems worldwide are increasingly
influenced by this development. A major goal in current research is to achieve a
comprehensive understanding of the possible consequences of climatic changes for
ecosystem processes and subsequently develop adequate mitigation strategies.
However, in view of the complex tangle of co-dependent ecosystem processes
(e.g. productivity, biodiversity, mineralisation, soil carbon and nutrient cycling
and storage), all potentially exhibiting differential responses to environmental
change, the scientific community is still far from achieving this aim.
One of the major factors affected by climate change is the water status of
terrestrial ecosystems all over the globe. With the ongoing temperature increase,
and a 7 % higher water holding capacity of the atmosphere per 1 C warming
(Wentz et al. 2007; Trenberth 2011), overall evaporation and atmospheric water
vapour concentrations will increase. The latter will promote cloud formation in
humid regions (Meehl et al. 2007; Trenberth 2011), leading to increases in
Consequences of Changing Precipitation Patterns for Ecosystem Functioning. . .
349
Fig. 1 Multi-model mean changes in precipitation (mm day1). Regions are stippled where at least
80 % of the climate models agree on the sign of the mean change. Changes are annual means for the
SRES A1B scenario for the period 2088–2099 relative to 1988–1999. Taken from Meehl et al.
(2007, their Fig. 10.12)
precipitation (Fig. 1). In contrast, arid regions are expected to experience a decrease
in precipitation (Fig. 1), as here adequate surface moisture, a determinant of
increased evaporation, is lacking (Meehl et al. 2007; Trenberth 2011). Indeed,
long-term observations for the period between 1900 and 2005 have already demonstrated significant increases in precipitation in eastern North and South America,
northern Europe, and northern and central Asia, and significant decreases in precipitation in the Sahel, southern Africa, the Mediterranean, and southern Asia
(Trenberth et al. 2007). In addition to the expected changes in precipitation amount,
the type of precipitation might change in temperate regions, with much of the
precipitation usually falling as snow increasingly falling as winter rain, thus
reducing water storage in snow packs, and concomitantly reducing water availability in summer (Trenberth et al. 2007).
While alterations in the amount of precipitation may have large implications for
ecosystem functioning in the affected regions, precipitation distribution, frequency
and intensity are regarded as nonetheless important (Easterling et al. 2000). Over
the twentieth century, estimates suggest that atmospheric water vapour concentrations have increased by 5 %, which has generally increased the intensity of
precipitation events (Trenberth et al. 2007). Scenarios predict an almost universal
increase in precipitation intensity (Fig. 2a), although particularly at middle and high
latitude regions where mean precipitation (Fig. 1) is also projected to increase
(Meehl et al. 2007). However, both increases and decreases in consecutive dry days
between precipitation events can be found (Fig. 2b), with regions located in the
350
S. Unger and M. Jongen
Fig. 2 Changes in spatial patterns of simulated precipitation intensity and dry days between two
20-year means (2080–2099 minus 1980–1999) for the A1B scenario. Stippling denotes areas where
at least five of the nine models concur in determining that the change is statistically significant.
Changes are given in units of standard deviation, following Frich et al. (2002). Taken from Meehl
et al. (2007, their Fig. 10.18)
Consequences of Changing Precipitation Patterns for Ecosystem Functioning. . .
351
subtropics and lower mid-latitudes exhibiting an increased run of dry days, thus
having a concomitant greater risk of drought (Meehl et al. 2007).
In this review we will concentrate on understanding the effects of altered
precipitation regimes on one of the most important terrestrial ecosystem types
worldwide: grasslands. With precipitation being one of the most important determinants of the majority of ecosystem processes, the observed and predicted changes
in amount, intensity and frequency of precipitation are particularly threatening for
future stability and functioning of these ecosystems.
1.2
Grassland Ecosystems
Grasslands are disturbance-dependent terrestrial ecosystems dominated by
graminoid and herbaceous vegetation in climates with a distinct seasonality of
productivity (Smith 1973), which are maintained by fire, grazing, drought, and/or
freezing temperatures (Anderson 1982). These factors provide selective pressure
for a short ruderal life cycle involving early reproduction with a high number of
seeds, a high turnover of aboveground biomass, high belowground carbon investment and the location of perennating organs near the soil surface (Sala et al. 1996),
which promotes the dominance of graminoids and forbs. However, grasslands
encompass not only non-woody systems but also savannas, woodlands, shrublands,
and tundra (White et al. 2000). Estimates of the extent of the earth’s land area in
grasslands (excluding Greenland and Antarctica), depending on land cover characterisation, range from ~42 to 56 million km2, or ~31 to 43 % (Whittaker and Likens
1975; Atjay et al. 1979; Olson et al. 1983). Figure 3 gives the global distribution of
grasslands, with the largest areas found in central and southern Asia, southern South
America, Africa and central North America (Sala et al. 1996).
Grassland ecosystems are of high economic importance for provisioning of
agricultural goods as, together with the livestock they sustain, they constitute one
Fig. 3 Grasslands and climate zones. From White et al. (2000) and UNEP (1992)
352
S. Unger and M. Jongen
of the earth’s major food resources (Singh et al. 1983). Apart from their vital role in
food production, grasslands goods and services include wildlife and biodiversity
conservation, resource storage, prevention of soil degradation as well as supporting
tourism and recreational activities, and offering aesthetic and spiritual gratification
(White et al. 2000). The provision of these ecosystem services depends on the
maintenance of grassland ecosystem state (Miller et al. 2011). As the extent of
drought, fire and grazing determines the state transition of grasslands into deserts or
shrublands and forest ecosystems (Sala et al. 1996), state shifts may easily occur
with climate and land use change, afforestation, eutrophication, or the invasion of
neophytes (Faber-Langendoen and Josse 2010), with restoration of previous conditions being difficult, costly, or effectively unfeasible (Miller et al. 2011). In
relation to changing temperature and precipitation patterns, this problem has
increased the interest of grassland ecosystem research on biotic and abiotic attributes conferring ecosystem resilience with changing environmental conditions and
thus subsequently reducing system susceptibility to state shifts.
1.3
Drivers of Ecosystem Processes in Grasslands
There are a range of factors controlling ecosystem processes in grassland ecosystems, of which precipitation and temperature are thought to exhibit the strongest
ties to grassland functioning (Sala et al. 1996). Accordingly, a wide range of studies
describe the relationship of these factors with important ecosystem traits such as
productivity, biodiversity, soil and ecosystem carbon cycling, and soil nutrient
dynamics. Precipitation and consequently soil moisture have been shown to modulate the carbon cycle of grassland ecosystems, with arid systems generally
exhibiting significantly lower plant productivity (e.g. Huxman et al. 2004a), biodiversity (Sala et al. 1996), soil and ecosystem carbon fluxes (e.g. Merbold
et al. 2009), and soil nutrient cycling (Aranibar et al. 2004), as compared to semiarid or mesic systems. However, negative effects of precipitation on the carbon and
nitrogen cycles in grasslands have been observed, particularly with large precipitation pulses interrupting long dry periods (e.g. Kim et al. 2012; Unger et al. 2012).
These precipitation pulses can lead to large carbon and nitrogen losses through high
soil respiration rates (Kim et al. 2012) and leaching of nitrogen, particularly nitrate,
below the rooting zone (Austin et al. 2004). In contrast to arid and semi-arid
grasslands, ecosystem processes in mesic grasslands, where moisture is not limiting, are controlled by temperature, with increasing temperatures generally enhancing productivity (e.g. Flanagan and Adkinson 2011) and soil microbial activity
(e.g. Davidson et al. 2006), thus resulting in higher carbon and nitrogen cycling
(Aranibar et al. 2004).
Apart from the climatic controls on ecosystem functioning in grasslands, natural
disturbance factors in the form of fire and grazing or land use factors like
fertilisation, mowing, and tillage are known to affect ecosystem functioning.
While disturbance is necessary to maintain ecosystem state in grasslands,
Consequences of Changing Precipitation Patterns for Ecosystem Functioning. . .
353
particularly in the more humid regions, where natural succession favours tree
growth (Anderson 1982), an increase in disturbance with land use intensification
or even transformation of grasslands into croplands has a negative effect on
ecosystem functioning and stability leading to diversity loss, increasing ecosystem
vulnerability to climate change or irreversible ecosystem collapse (MacDougall
et al. 2013).
1.4
Experimental Designs to Study Precipitation Impacts
at the Ecosystem Scale
Knowledge of the impacts of alterations in precipitation on ecosystem processes
can be gained from multi-year observational records. For example, over a 20-year
period (1986–2005), inter-annual variation in aboveground productivity in a Mediterranean grassland was found to correlate with annual precipitation (Vázquez-deAldana et al. 2008). However, a 22-year measurements series (1982–2003) from an
Inner Mongolia grassland revealed a correlation of aboveground productivity with
previous-year precipitation (Ma et al. 2010).
More recently, several studies have interpreted multi-year eddy flux data to
explain productivity–precipitation relationships. For example, on an annual basis,
ecosystem CO2 exchange correlated with annual precipitation in a Mediterranean
grassland in Portugal (Jongen et al. 2011), whereas the inter-annual variation in
ecosystem CO2 exchange in a Mediterranean grassland in California depended
primarily on the timing of precipitation, rather than total annual precipitation
(Ma et al. 2007).
However, analysis of impacts of precipitation on ecosystem state using both of
the above-mentioned approaches, observational records or eddy flux measurements, may be confounded by other co-varying factors. Precipitation manipulation
experiments enable replication, control for confounding factors, and allow for
multiple scenarios to be studied simultaneously. They can therefore contribute to
our understanding of impacts of precipitation on ecosystem state. Water manipulation experiments at the pot and mesocosm scale are widely conducted (e.g. Li
et al. 2011; Nagy et al. 2013; O’Brien et al. 2013). However, they do not necessarily
reflect natural conditions, often are of short duration, and are limited in the number
of parameters studied (i.e. through destructive sampling). Extending the outcome of
these studies to the field or ecosystem scale or incorporating their results into
modelling approaches is therefore in most cases not appropriate. To achieve a
thorough picture of potential effects of changes in precipitation on ecosystem
functioning, field studies with experimentally manipulated precipitation in natural
ecosystems with global representation are needed.
Although not always a requirement (e.g. in those studies with only simulation of
addition scenarios), precipitation manipulation experiments often involve the use of
354
S. Unger and M. Jongen
Fig. 4 Experimental designs to study the effects of precipitation manipulation: (a) closed shelters
after Jongen et al. (2013b); (b) throughfall shelters, after Yahdjian and Sala (2002), picture from
K. Tielbörger; and (c) movable shelters, after Báez et al. (2013), picture from S. Collins
rainout shelters, which enables control of the amount and/or timing of precipitation
received by the vegetation. To date three different designs have been employed:
1. ‘Closed shelters’ (Fig. 4a), covered by a complete roof, which excludes almost
all precipitation from the experimental plots. Consequently, the researcher has
full control over the precipitation regime, generally through fixed sprinklers.
Although shelter sides and ends remain open to maximise air movement and
minimise temperature and relative humidity artefacts, closed shelters have the
disadvantage of altering the microclimate, in particular solar radiation (Fay
et al. 2000). Comparison to unsheltered control plots to evaluate the impacts
of the shelter is thus desirable (Owens 2003). However, closed shelters have the
advantage of being easily constructed and dismantled and comparatively inexpensive, allowing for a necessary number of replications. There are a range of
shelter designs with different sizes, supports, and roofing materials, the choice of
which depends largely on site-specific demands and research objectives
(e.g. short-term versus long-term investigations). Nevertheless, shelters should
be sufficiently large to allow for the exclusion of edge effects. The RaMPS
(Rainfall Manipulation Plot Study) installed at the Konza Prairie Biological
station in northeast Kansas, USA, is an example of this experimental set-up,
with timing and quantity of precipitation being experimentally manipulated
since 1997.
2. ‘Throughfall shelters’ (Fig. 4b), originally based on the design of Yahdjian and
Sala (2002), have angled roofs composed of bands of transparent acrylic,
blocking a certain amount of precipitation. This design gives the possibility to
collect the intercepted rain and subsequently use it to irrigate other experimental
plots (e.g. Holub et al. 2013), making throughfall shelters useful for manipulation experiments where a combination of addition/reduction scenarios is investigated. However, the throughfall shelter design does not allow for a full control
of the amount and timing of precipitation received by the experimental plots,
with vegetation being subjected to intra- and inter-annual variations in the
amount of precipitation. In comparison to closed shelters, alterations in microclimate are reduced, with wind convection, temperature, and solar radiation less
affected (Gherardi and Sala 2013).
Consequences of Changing Precipitation Patterns for Ecosystem Functioning. . .
355
3. ‘Movable shelters’ (Fig. 4c) have a design with roofs or curtains that slide
diagonally along rollers to cover the experimental plots, activated by a rain
sensor (e.g. Báez et al. 2013). These shelters have the advantage that the effect of
the shelter on the microclimate is small. Nevertheless, care must be taken to
ensure that the parked shelter does not create shade on a part of the experimental
plot (Owens 2003). The disadvantages of movable shelters are higher costs for
acquisition and maintenance.
1.5
Problems Associated with Precipitation Manipulation
Experiments
In order to adapt current models on future ecosystem behaviour with climate
change, manipulation experiments should cover the global range of ecosystems
under representative current and future climate scenarios (Beier et al. 2012). In a
comprehensive review, Beier et al. (2012) describe that, whereas precipitation
manipulation experiments in grasslands and forest ecosystems are widely
conducted, other important ecosystem types, such as arable lands and tundra, are
underrepresented. In addition, experiments representing the Southern hemisphere,
in particular Africa, and experiments conducted in high rainfall zones (>1.500 mm)
were scarce. Additionally, the chosen scenarios are often relatively conservative
and related to historical or current conditions, while in the future many ecosystems
are likely to be exposed to climates exceeding historical and current climatic
variations (Beier et al. 2012; IPCC 2012). In many studies, the applied precipitation
regimes lie within the range of natural year-to-year climatic variability, explaining
the often-found resilience of many ecosystem processes. Therefore, a major issue
with precipitation manipulation experiments is to choose the right climate change
scenarios for the ecosystems under study. Further issues identified by Beier
et al. (2012) are the (1) relatively short duration of most studies, which therefore
do not reflect long-term integrated effects on ecosystem performance that might be
expected from a future climate scenario, (2) the lack of appropriate reference
conditions (i.e. controls being subjected to large inter-annual variation), (3) the
unequal distribution of precipitation, caused by some irrigation set-ups or the
presence of slopes and soil type gradients, (4) the lack of grazing in fenced off
areas altering plant communities and productivity measures, and (5) the often
limited plot size constraining sampling strategy and exacerbating problems associated with edge effects and disturbance caused during sampling and measurements.
However, many of these issues are hard to avoid and have to be accounted for when
incorporating data into modelling approaches.
356
S. Unger and M. Jongen
2 Methods
2.1
Data Compilation
In this review on the effects of changing precipitation patterns on ecosystem
processes, data collection was restricted to studies in which precipitation was
experimentally manipulated in the field, as they represent the best way to explore
cause–effect relationships between water availability and ecosystem functioning.
We incorporated studies conducted in grassland ecosystems in the broad sense,
i.e. grasslands, savannas, woodlands, shrublands, and tundras (White et al. 2000). In
addition, we only incorporated those studies with a precipitation manipulation for a
period of at least two consecutive months. For each selected study, we collected
information on ecosystem type, latitude, longitude, mean annual temperature
(MAT), mean annual precipitation (MAP), data on experimental duration and
set-up, and magnitude of manipulation. In the case of multifactor experiments
(e.g. precipitation in combination with warming, nutrients, or CO2), we only used
data of the precipitation treatments, in relation to the controls, with the other factors
kept at ambient levels. In relation to ecosystem type we used the following criteria:
ecosystems with MAP < 300 mm were denoted as arid, MAP between 300 and
600 mm as semi-arid, and MAP > 600 mm as mesic. Studies in which the amount of
precipitation was manipulated (addition or reduction) are assembled in Table 1,
while studies aiming at altering the variability of precipitation, without changing
the absolute amount of rainfall received by the vegetation, are assembled in Table 2.
2.2
Data Analysis
Collected data on the magnitude of change with precipitation manipulation was
grouped into three categories of response variables: (1) productivity, including
aboveground net primary productivity (ANPP), belowground net primary productivity (BNPP), absolute growth rate (AGR), gross ecosystem photosynthesis (GEP),
vegetation cover, and additional growth parameters (e.g. shoot length, leaf length,
number of leaves), (2) diversity, including data on species richness (i.e. number of
species), species composition, and diversity indices such as the Shannon-Wiener
and Simpson’s indices, and (3) soil respiration (RS), ecosystem respiration (RECO)
and responses of soil nitrogen (N-availability, N-mineralisation or concentration of
nitrate, ammonium, or total N). For multi-year studies, we calculated the average
response for inclusion in the analysis. The aridity index (AI) was calculated
according to Köppen (1923), with AI ¼ MAP/(MAT + 33). To normalise the
responses to the magnitude of the treatment imposed, we calculated the sensitivity
index as the % change in response variable divided by % change in precipitation
following the manipulation. The sensitivity index yields positive values if the
response is unidirectional with the treatment imposed (i.e. productivity increase
205
250
268
19
13.9
13.2
2.8
Arid: coastal sand dune
Arid: Arctic shrub tundra,
dominated by Betula
nana
Arid: Grassland
Arid: grasslands and
shrublands
Arid: Grassland
Arid: native grassland, shrubland, grass-shrub ecotone
Arid: grassland
Arid: montane tundra, dominated by Dryas
octopetala
Cabo de Gata natural
park, Spain
N36 490 , W02 150
Kytalyk, NE-Siberia,
Russia
N70 490 , E147 280
El Cautivo, Tabernas
basin, Spain
N37 000 , W02 260
PSA (site, Tabernas
basin, Spain
N37 050 , W02 210
PSA site, Tabernas
basin, Spain
N37 050 , W02 210
LTER Sevilleta, New
Mexico, USA
N34 200 , W106 430
LTER Sevilleta, New
Mexico, USA
N34 200 , W106 430
Eagle Summit, Alaska,
USA
N65 260 , W145 300
13.2
17
18
18
200
0.1
Arid: Steppe
DREX, Bayan Unjuul,
Mongolia, China
N47 020 , E105 570
250
250
242
230
163
115
7.8
Arid: desert shrubland, dominated by Nitraria
tangutorum
Minqin County, China
N38 340 , E102 580
MAP (mm)
Ecosystem
Location
MAT
( C)
No shelter
No shelter
Movable
shelter
Closed shelter
Closed shelter
Closed shelter
No shelter
Closed shelter
Closed shelter
No shelter
Experimental
design
1979–1980
2007–2008
2002–2008
Oct. 2005–June
2006
2006–2009
Oct. 2005–June
2006
2007–2009
Oct. 2005–June
2006
2005
2009
Study period
ND
ANPP: #~75 %
BNPP: 0
ANPP:
(1) and (2): 0
May–August:
#100 %
(1) #25 %
(2) #50 %
ANPP:
2006 + 2007: 0
2009: #~50 %
ANPP:
(1) #35 % (ns)
(2) #60 % (ns)
#30 %
(1) #25 %
(2) #50 %
Summer:
"~100 %
July–Sept.:
"55 %
Leaf number per shoot:
0
Shoot growth rate: 0
ANPP:
"86 %
Vegetation cover:
(1) B. eriopoda
(grass) #
(2) B. eriopoda
(grass) "
Shrub cover: no
consistent effect
ANPP:
(1) 0
(2) #60 %
(1) #25 %
(2) #50 %
April–Nov.:
(1) #~50 %
May–Oct.:
(2) "42 %
ANPP: 0
Length increment
B. nana: "~30 %
Summer:
"~100 %
References
ND
(continued)
McGraw (1985)
Thomey et al. (2011)
RS:
"32 %
ND
Báez et al. (2013)a
ND
Species composition: shifts
in (1)
and (2)
ND
Miranda et al. (2009)
Miranda et al. (2011)
Miranda et al. (2009)
Keuper et al. (2012)
Miranda et al. (2009)
Shinoda et al. (2010)
Song et al. (2012)
ND
RS:
2007: 0
2009: #~65 %
Soil N ’07: 0
ND
ND
ND
ND
RS:
" 31–59 %
Respiration, soil
nitrogen
Diversity:
(1) 0
(2) #25–30 %
ND
Diversity:
(1) 0
(2) #~60 %
ND
Diversity:
(1) and (2): 0
ND
ANPP:
(1) " 7 %
(2) " 44 %
(3) " 83 %
(4) " 266 %
May–Sept.:
(1) "25 %
(2) "50 %
(3) "75 %
(4) "100 %
Diversity
Productivity
Precipitation
manipulation
Table 1 Summary of precipitation manipulation studies with rainfall addition or reduction—effects on productivity, biodiversity, respiration, and soil nitrogen
Consequences of Changing Precipitation Patterns for Ecosystem Functioning. . .
357
17
Semi-arid: Mediterranean
grassland
Semi-arid: Mediterranean
grassland
Semi-arid: shortgrass steppe
Semi-arid: shortgrass steppe
Irvine Range Land
Reserve, Orange
County, California, USA
N33 620 , W117 780
Irvine Range Conservancy, Irvine, California, USA
N33 440 , W117 420
CPER Nunn, Colorado,
USA
N40 490 , W104 460
CPER Nunn, Colorado,
USA
N40 490 , W104 460
8.2
8.2
17
300
0.5
Semi-arid: Sphagnum fuscumdominated bog
Stordalen, Sweden
N68 210 , E19 030
341
341
325
325
300
18.4
Semi-arid: shrubland
Eshkolot, Israel
N31 230 , E34 540
~300
0.8
271
4
Semi-arid: subarctic heath
ecosystem
271
4
Abisko Scientific
Research Station,
Sweden
N68 210 , E18 490
MAP (mm)
MAT
( C)
Arid: Arctic tundra, dominated
by Cassiope tetragona
Arid: subarctic tundra dominated by Dryas
octopetala
Ecosystem
Isdammen, Svalbard,
Norway
N78 1220 , E15 440
Location
´
Ny Ålesund, Svalbard,
Norway N78 560 ,
E11 500
Table 1 (continued)
Movable
shelter
Movable
shelter
Closed
shelters in
reduction
plots
No shelters
No shelter
Throughfall
shelter
No shelter
No shelter
No shelter
Experimental
design
Evans and Burke (2013)
April–Oct.:
(1) #50 %
(2) #75 %
ND
(1) RS: #25 %
(2) RS: #33 %
In (1) and (2)
N avail.: 0 2009:
NO3 and NH4+
"
2008–2009
(end of 11-year
drought
experiment)
(1)
ANPP:#~26 %
BNPP: 0
(2)
ANPP: #~42 %
BNPP: #~16 %
Evans et al. (2011)
ND
Species composition:
2005–2009:
B. gracilis:
#~12–
38 %
ruderals:
"~1–20 %
Vegetation cover:
(1) ’03: #~45 %
’09: #~55 %
Other years: 0
(2) ’99–’01: 0
’02!:#35–80 %
April–Oct.:
(1) #50 %
(2) #75 %
Potts et al. (2012)
RECO:
(1) #~50 %
(2) "~30 %
N avail:
(1) #~65 %
(2) "~60 %
ND
ANPP:
(1) #~70 %
(2) "~275 %
Nov.–June:
(1) #23 %
(2) "52 %
2006–2007 growing season
Note: severe
drought with
ambient of
79.4 mm
1999–2009
(11-year drought
experiment)
Harpole et al. (2007)
ND
Species richness and
abundance of
forbs: 0
Keuper et al. (2012)
Sternberg (2011),
Talmon
et al. (2011)
E.g. Press et al. (1998)
Weijers et al. (2013)
Robinson et al. (1998)
References
ND
RS:
(1) #10 %
(2) "31 %
ND
ND
ND
Respiration, soil
nitrogen
ANPP: 0
BNPP: 0
ND
Richness and
diversity:
(1) and (2): 0
ND
ND
ND
Diversity
March–May:
"~85 %
ANPP: 0
ANPP:
(1) 0
(2) "~80 %
(1) #30 %
(2) "30 %
Summer:
"~100 %
ANPP: 0
Growth parameters
(shoot and leaf
length, number of
leaves): 0
Cover vegetation
groups and several species: 0
Productivity
Summer:
"50 %
Mid-June to
late
August:
"100 %
June–August:
"50 %
Precipitation
manipulation
2006
2007–2009
2003–2010
RS: 2006–2007
1991–1994
2005–2008
1991–1995
Study period
358
S. Unger and M. Jongen
386
400
3.3
3.3
8
8.3
~5.8
2.1
2
Semi-arid: temperate steppe
Semi-arid: temperate steppe
Semi-arid: mixed-grass prairie
Semi-arid: shortgrass steppe
Semi-arid: short/mixed
grassland
Semi-arid: temperate steppe
Semi-arid: subarctic foresttundra with Empetrum
nigrum and Vaccinium
vitis-idaea
Semi-arid: shortgrass steppe
Semi-arid: Mediterranean
shrubland
Semi-arid: Mediterranean
heathland
Duolun County, Inner
Mongolia, China
N42 020 , E116 16’
HPGRS, Cheyenne,
Wyoming, USA
N41 200 , W104 890
Sand Creek NHS, Eads,
Colorado, USA
N38 320 , W102 31’
Lethbridge, Alberta,
Canada
N49 470 , W112 940
Duolun County, Inner
Mongolia, China
N42 020 , E116 170
Kevo Subarctic
Research Station,
Lapland, Finland
N69 450 , E27 010
Fort Union NM, New
Mexico, USA
N35 910 , W105 010
CLIMAITE, Garraf,
Spain
N41 180 , E01 490
CLIMAITE Kiskunság,
Hungary
N46 880 , E19 380
10.4
15.1
9.4
504
455
425
386
385
384
383
382
342
Duolun County, Inner
Mongolia, China
N42 270 , E116 410
7.2
Semi-arid: shortgrass steppe
341
CPER Nunn, Colorado,
USA
N40 490 , W104 460
8.2
Semi-arid: shortgrass steppe
CPER LTER Nunn,
Colorado, USA
N40 490 , W104 460
Movable
shelters
Movable
shelters
Throughfall
shelters
No shelter
No shelter
Throughfall
shelter
Throughfall
shelters
No shelter
No shelter
No shelter
Throughfall
shelters
Throughfall
shelters
1999–2005
1999–2005
2007–2008
1992–1994
2005–2006
2011
2007–2008
2006
2008–2009
2006–2007
2007–2008
2008–2010
Species richness: #
Species richness: 0
ANPP: 0
ANPP: 0
Two-month
period in
growing
season:
#65–90 %
Two-month
period in
growing
season:
#65–90 %
ND
(1) and (2): ANPP: 0
(1) #50 %
(2) #80 %
ND
ND
Growth parameters
E. nigrum #~25 %
V. vitis-idaea "~45 %
GEP:
"7–34 %
ND
ND
(continued)
Peñuelas et al. (2007)
Emmett et al. (2004),
Peñuelas
et al. (2007)
RS: 0
N-mineralisation: 0
ND
Cherwin and Knapp
(2012)
ND
Shevtsova et al. (1997)a
Niu et al. (2008)
RECO:
"11–26 %
ND
Flanagan et al. (2013)
(1) and (2): RS: 0
Bachman et al. (2010)
RECO: "90 %
ND
Cherwin and Knapp
(2012)
Yan et al. (2011b)
RS: "15–43 %
ND
ND
Liu et al. (2009), Yan
et al. (2010, 2011a)
ND
RS: "19–61 %
RECO:
"11–71 %
Byrne et al. (2013)
Cherwin and Knapp
(2012)
ND
ND
ND
ND
June–August:
"13–69 %
July–August:
"~30 %
(1) and (2): ANPP: 0
BNPP: 0
ANPP:
(1) #~0–35 %
(2) #~0–51 %
(1) #50 %
(2) #80 %
May–Oct.:
(1) #50 %
(2) "50 %
Vegetation cover:
"38 %
GEP: "121 %
ANPP:"40–60 %
BNPP: 0
May–Aug.:
"115 %
June–August:
"~30 %
ANPP:"24–63 %
BNPP:"33–42 %
GEP: "11–90 %
ANPP:
(1) #~17–20 %
(2) #~25–42 %
(1) #50 %
(2) #80 %
July–August:
"~30 %
(1) ANPP:
2008 + 2009: 0
2010: "~27 %
BNPP: 0
(2) ANPP: 0
BNPP: 2010: 0
2009: #~59 %
Growing
season:
(1) #60 %
(2) "~70 %
Consequences of Changing Precipitation Patterns for Ecosystem Functioning. . .
359
620
622
640
655
~16.5
~16.5
14.9
16.8
14.6
Semi-arid: Mediterranean
shrubland
Semi-arid: understorey herbaceous vegetation
Semi-arid: mixed grass prairie
Mesic: serpentine grassland
Mesic: non-serpentine
grassland
Mesic: Meditteranean shrubland dominated by Cistus
ladanifer
Mesic: shrubland
Mesic: Mediterranean grassland dominated by annual
species
Mesic: agricultural crop 2009:
T. aestivum
2010: H. vulgare
Satara, Kruger National
Park, South Africa
S24 240 , E31 440
Saline experimental
range, Hays, Kansas, USA
N38 520 , W99 230
McLaughlin Reserve,
Lower Lake, California, USA
N38 51, W123 300
McLaughlin Reserve,
Lower Lake, California, USA
N38 510 , W123 300
Los Yébenes, Toledo,
Spain
N39 250 , W04 040
Porto Conte Capo
Caccia, Sardinia,
Italy
N40 370 , E08 100
JRBP, Woodside, California, USA
N37 240 , W122 140
Hohenheim Climate
Change experiment, Heidfeldhof,
Germany
N48 420 , E09 110
8.7
12.1
22.9
17.7
679
620
583
547
540
529
Mata, Israel
N31 420 , E35 030
9.6
Semi-arid: lowland Festuca
grassland
MAP (mm)
Podyjı́ National Park,
Znojmo, Czech
Republic
N48 490 , E16 000
MAT
( C)
Ecosystem
Location
Table 1 (continued)
Closed shelter
No shelters
Movable
shelter
Movable
shelter
No shelters
No shelters
Throughfall
shelters
Throughfall
shelter
Throughfall
shelter
Throughfall
shelters
Experimental
design
2009–2010
1999–2003
2002–2004
2009
2010
2010
2008–2010
2004–2008
2003–2010
RS: 2006–2007
2006–2010
Study period
ND
ND
(1) ANPP: 0
BNPP:0–#~35 %
(2) ANPP: "31–55 %
BNPP:0–#~40 %
June–August:
#25 %
Nov.–June:
"50 %
April–May and
Oct.–
Nov.:
#100 %
March–Sept.:
(1) #25 %
(2) #45 %
Spring:
"50 %
Spring:
"50 %
Growing season:
(1) #50 %
(2) "~60 %
ND
ND
ANPP (DPM measurements):
(1) #25–30 %
(2) "20–25 %
ND
AGR C. ladanifer:
(1) 0
(2) # 40 %
ANPP: 0
ANPP: 0
BNPP: 0
ND
ND
ND
ND
ANPP: "~50 %
ND
ND
ANPP: 0
Dukes et al. (2005)
Poll et al. (2013)
RS: 0
de Dato et al. (2010)
RS: 0
ND
Parra et al. (2012)
Fernandez-Going and
Harrison (2013)
Fernandez-Going and
Harrison (2013)
ND
ND
ND
Byrne et al. (2013)
February et al. (2013)
Sternberg (2011),
Talmon
et al. (2011)
RS: (1) #5 %
(2) "12 %
(1) #50 %
(2) "50 %
Richness and
diversity:
(1) and (2): 0
Fiala et al. (2009, 2012),
Tůma et al. (2009),
Holub et al. (2013)
References
Soil properties
(a.o. N) in
(1) and (2): 0
ANPP:
(1) and (2): 0
Respiration, soil
nitrogen
(1) #30 %
(2) "30 %
Species composition:
shifts in both
(1) and
(2),
grasses #
and
forbs "
Diversity
(1) ANPP:#21 %
BNPP: 0
root incr.:# 21 %
(2) ANPP:"36 %
BNPP: 0
root incr.: "38 %
Productivity
(1) #50 %
(2) "50 %
Precipitation
manipulation
360
S. Unger and M. Jongen
22.4
21.9
16.0
9.4
7
Mesic: grass- to woodland
Mesic: understorey herbaceous
vegetation
Mesic: annual grassland
Mesic: heath land
Mesic: highland Cirsium
grassland
Mesic: grassland
Mesic: herbaceous vegetation,
shrubland and forest
Mesic: upland tallgrass prairie
Mesic: lowland tallgrass
prairie
La Copita Research
Area, Central, Rio
Grande Plains,
Texas, USA
N27 400 , E98 120
Pretoriuskop, Kruger
National Park,
South Africa
S25 070 , E31 130
SFREC, Browns Valley,
California, USA
N39 150 , W121 170
CLIMAITE, Mols, Denmark
N56 230 , E10 570
Kameničky, Hlinsko,
Czech Republic
N49 450 , E15 540
Clermont Ferrard,
France
N45 430 , E03 010
La Cortijuela, Sierra
Nevada NP, Granada, Spain
N37 050 , W03 280
Konza Prairie, Kansas,
USA
N39 050 , W96 350
Konza Prairie, Kansas,
USA
N39 050 , W96 350
13
13
14.3
12.4
15.5
Mesic: woodland understorey
vegetation
Herdade da Giblaceira,
Montemor-ONovo, Portugal
N38 360 , W08 100
10
Mesic: calcareous grassland
Wytham, Oxford, UK
N51 460 , W01 300
835
835
816
780
762
758
750
737
716
700
680
No shelters
No shelters
Throughfall
shelters
in (1)
Closed shelters
Throughfall
shelters
Movable
shelters
No shelters
Throughfall
shelter
No shelters
Closed shelter
Movable shelter in (1)
1991–2009
1991–2009
2007
2005–2007
2006–2010
1999–2005
2003–2007
2004–2008
1996–1997
2008
1994–1998
Diversity:
#17 %
Species composition: 0
Species richness: 0
ANPP: #44 %
BNPP: 0
ND
ANPP (DPM measurements):
(1) #25–30 %
(2) "20–25 %
ANPP: "~35 %
BNPP: 0
ANPP: 0
(1) BNPP:#18 %
root incr.: 0
(2) BNPP:"17 %
root incr.:"15 %
Growing
season:
#32 %
"~300 %
(1) #50 %
(2) "50 %
"50 %
Two-month
period in
growing
season:
#65–90 %
(1) #50 %
(2) "50 %
ND
ND
Cover:
"~22 %
ANPP: "51 %
Cover:
"~9 % (ns)
April–Sept.:
(1) #35 %
(2) "50 %
"31 %
"31 %
Richness and
diversity:
0
Richness and
diversity:
0
Diversity: 0
Species comp.:
0
ANPP: 0
June–Aug.:
#20 %
ND
ND
ND
ND
ANPP:
(1) #~7 %
(2) "~38 %
(1) July–
August:#100 %
(2) June–Sept.:
"20 %
ND
(continued)
Collins et al. (2012),
Knapp et al. (2012)
Collins et al. (2012)
Matı́as et al. (2012)
RS:
(1) #19.2 %
(2) "14.6 %
ND
Bloor et al. (2010)
ND
Fiala et al. (2009, 2012),
Tůma et al. (2009)
Emmett et al. (2004),
Peñuelas
et al. (2007)
RS: 0
N-mineralisation.: 0
Soil properties
(a.o. N) in
(1) and (2): 0
Chou et al. (2008)
February et al. (2013)
McCulley et al. (2007)
Jongen et al. (2009)
Grime et al. (2000)
RS: "~10 %
ND
RS: "48–131 %
RS: #12 %
Soil N: 0
ND
Consequences of Changing Precipitation Patterns for Ecosystem Functioning. . .
361
6.8
16.3
~1
10.1
Mesic: Mediterranean: foreststeppe
Mesic: mixed-grass prairie
Mesic: Alpine grassland
Mesic: tallgrass prairie
Mesic: grasslands (5 sites)
Mesic: heathland/grassland
Mesic: old-field grassland
Mesic: planted meadow
CLIMAITE, Porto
Conte Capo
Caccia, Italy
N40 620 , E08 170
KAEFS, McClain
County, Oklahoma, USA
N34 590 , W97 310
Alp Weissenstein, Switzerland
N46 340 , E09 470
KFFL, McClain County,
Oklahoma, USA
N34 590 , W97 310
Yellowstone National
Park, Wyoming,
USA
N44 500 , W110 330
CLIMAITE Oldebroek,
Netherlands
N52 240 , E05 550
BACE, Waltham, Massachusetts, USA
N42 230 , W71 130
Chamau, Switzerland
N47 120 , E08 240
9.8
10.3
2.3
16.3
13
Mesic: tallgrass prairie
RaMPs facility, Konza
Prairie, Kansas,
USA
N39 050 , W96 350
MAT
( C)
Ecosystem
Location
Table 1 (continued)
No shelters
Closed shelters
Throughfall
shelters
Movable
shelters
Closed shelters
Experimental
design
1179
1063
1042
Closed shelters
Throughfall
shelters
Movable
shelters
site-dependent No shelters
967
918
914
840
835
MAP (mm)
2005–2007
2009–2010
1999–2005
2005
2003
2006–2007
2010–2011
1999–2005
1998–2000
Study period
ND
ANPP:#65–69 %
BNPP: 0
ANPP: "~80 %
BNPP: 0
Two to threemonth
exclusion
#100 %
"100 %
Species richness: 0
Diversity: 0
ND
ANPP: 0
(1) and (2) ANPP: 0
BNPP: 0
ANPP: 0
BNPP: 0
Two-month
period in
growing
season:
#65–90 %
(1) #50 %
(2) "50 %
Two- to threemonth in
spring/
summer
#100 %
ND
GEP: 0
April–Sept.:
"~50 %
ND
(1) and (2):
ANPP: 0
BNPP: 0
(1) #50 %
(2) "100 %
ND
Species richness: 0
ANPP: 0
Two-month
period in
growing
season:
#65–90 %
Diversity
ND
Productivity
ANPP:
#10–15 %
#30 %
Precipitation
manipulation
References
Emmett et al. (2004),
Peñuelas
et al. (2007)
RS: 0
N-mineralisation: #
ND
Gilgen and Buchmann
(2009)
Hoeppner and Dukes
(2012), Suseela
et al. (2012)
Risch and Frank (2007)
RS: 0
RECO: 0
RH:
(1) #21 %
(2) 0
Zhou et al. (2006, 2012),
Sherry et al. (2008)
Gilgen and Buchmann
(2009)
Xu et al. (2013)
Peñuelas et al. (2007)
Fay et al. (2003, 2011),
Harper et al. (2005)
RS: " 9 %
N availability: 0
ND
ND
ND
RS:
#7–8 %
Respiration, soil
nitrogen
362
S. Unger and M. Jongen
2
6.8
Mesic: dwarf- shrub heathland
Mesic: mountain Nardus
grassland
Mesic: managed pasture
Mesic: shrubland
Monte Rondinaio,
northern Apennines, Italy
N44 080 , E10 350
Bı́ly Křı́ž, MoravianSilesian Beskydy
mountain, Czech
Republic
N49 300 , E18 320
Früebüel, Switzerland
N47 060 , E08 310
CLIMAITE Clocaenog,
UK
N53 030 , W03 280
1741
1632
1312
1300
1300
1300
Movable
shelters
Closed shelters
Throughfall
shelters
No shelter
Movable shelter in (1)
Movable shelter in (1)
1999–2005
2005–2007
2006–2010
1999–2003
2004 (ANPP)
2006 (species richness) after
>11 year
manipulation
1994–1998
Two-month
period in
growing
season:
#65–90 %
Two- to threemonth in
spring/
summer
#100 %
ANPP: 0
ANPP: 0
BNPP: 0
(1) ANPP: 0
BNPP: #11 %
root incr.: 0
(2) ANPP: 0
BNPP: 0
root incr.:"54 %
(1) #50 %
(2) "50 %
Species
richness:
0
ND
Species richness and
composition in
(1) and
(2): 0
Species
richness:
0
Gilgen and Buchmann
(2009)
Emmett et al. (2004),
Peñuelas
et al. (2007)
RS: 0
N-mineralisation: 0
Fiala et al. (2009, 2010,
2012), Tůma
et al. (2009), Holub
et al. (2013)
Brancaleoni et al. (2007)
ND
Soil properties
(a.o. N) in
(1) and (2): 0
Soil N: 0
Grime et al. (2008)
ND
Species richness:
(1) #~25 %
(2) 0
ANPP:
(1) #~35 %
(2) 0
ANPP: 0
Grime et al. (2000)
ND
ND
ANPP:
(1) #~5 %
(2) "~20 %
June–Sept.:
"~35 %
(1) July–
August:#100 %
(2) June–Sept.:
"20 %
(1) July–
August:#100 %
(2) June–Sept.:
"20 %
ANPP aboveground net primary productivity, BNPP belowground net primary productivity, AGR absolute growth rate, GEP gross ecosystem photosynthesis, RS soil
respiration, RH heterotrophic soil respiration, RECO ecosystem respiration, MAT mean annual temperature, MAP mean annual precipitation, ND not determined. Effect
is indicated as positive ("), negative (#), or no effect (0)
a
Studies excluded from analysis, as no numerical results given, or results depended on species
8.2
7.7
8
Mesic: calcareous grassland
BCCIL, Buxton, UK
N53 200 , W02 000
8
Mesic: calcareous grassland
BCCIL, Buxton, UK
N53 200 , W02 000
Consequences of Changing Precipitation Patterns for Ecosystem Functioning. . .
363
250
242
19
18
17
18
Arid:
coastal sand dune
Arid:
grassland
Arid:
grassland
Arid:
grasslands and
shrublands
Arid:
grassland
Semi-arid:
sagebrush
steppe
Semi-arid:
shortgrass
steppe
Semi-arid:
shortgrass
steppe
El Cautivo, Tabernas
basin, Spain
N37 00 , W02 260
PSA site, Tabernas
basin, Spain
N37 50 , W02 210
PSA site, Tabernas
basin, Spain
N37 50 , W02 210
LTER Sevilleta,
New Mexico,
USA
N34 200 , W106 430
Northern Great
Basin Experimental Range,
Oregon, USA
N43 290 , W119 340
CPER LTER Nunn,
Colorado, USA
N40 490 , W104 460
CPER, LTER Nunn,
Colorado, USA
N40 490 , W104 460
8.6
8.6
7.6
13.2
321
321
300
~250
230
200
168
Cabo de Gata natural
park, Spain
N36 490 , W02 150
8.4
Arid:
Patagonian steppe
Rı́o Mayo, Chubut,
Argentina
S45 410 , W70 160
MAP
(mm)
Ecosystem
Location
MAT
( C)
Closed
shelters
Closed
shelters
Closed
shelters
No shelter
Closed
shelters
Closed
shelters
Closed
shelters
Closed
shelters
No shelters
Experimental
design
2005
2006
1994–2000
July–Sept. 2007 and
2008, during
monsoon season
2006–2009
Oct. 2005–June 2006
Oct. 2005–June 2006
Oct. 2005–June 2006
?
Study period
References
Heisler-White
et al. (2009)
Soil N: "~60 % with
large infrequent rainfall
events
Species richness
and
composition: 0
ND
ANPP: "30 % with
large infrequent
rainfall events
ANPP: "70–-75 %
with larger
infrequent rainfall events
Altered distribution during May–Sept. (dry
period of 10, 20, or 30 days), total:
190 mm
Altered distribution during May–Sept. (dry
period of 10, 20, or 30 days), total:
191 mm
Heisler-White
et al. (2008)
Bates et al. (2006)
ND
ND
Density and cover of
A. tridentata: 0
ANPP herba-ceous
vegetation:
in (1) #~50 %
ND
Thomey et al. (2011),
Vargas
et al. (2012)
RS:
"15–30 % with large
infrequent
rainfall events
ND
ANPP:"28 % (ns)
ANPP Bouteloua
eriopoda: "54 %
with large infrequent rainfall
events
Precipitation addition with altered distribution: weekly (12 5 mm) or monthly
(3 20 mm)
Altered distribution
(1) 80 % of precipitation between Oct. and
March
(2) 80 % of precipitation between April and
July
Miranda et al. (2011)
RS: 0
soil N: 0
ND
Miranda et al. (2009)
Miranda et al. (2009)
Miranda et al. (2009)
Yahdjian and Sala
(2010)
ND
ND
ND
N-mineralisation
#30 %, NO3
leaching
"~15 % with
large events
Respiration, soil
nitrogen
ANPP: 0
Diversity: 0
Diversity: 0
ANPP: "~50 % with
biweekly
watering
ANPP: 0
Diversity: 0
ND
ND
ANPP: 0
Diversity
Productivity
Seasonal distribution changed (autumn and
spring 15 %, winter +30 %)
Altered distribution (dry period of 1, 2, or
4 weeks), total: 224 mm y-1
Altered distribution (dry period of 1, 2, or
4 weeks), total: 224 mm year1
Altered distribution (dry period of 1, 2, or
4 weeks), total: 224 mm year1
Precipitation addition with altered distribution: Oct., Dec., and Jan.:
1 15 mm or 3 5 mm
Precipitation manipulation
Table 2 Summary of precipitation manipulation studies with changes in the distribution of precipitation
364
S. Unger and M. Jongen
13
13
13
4.4
Mesic:
tallgrass prairie
Mesic:
tallgrass prairie
Mesic:
tallgrass prairie
Mesic:
tallgrass prairie
Mesic:
grassland
Konza Prairie, Kansas, USA
N39 050 , W96 350
RaMPs facility,
Konza Prairie,
Kansas, USA
N39 050 , W96 350
RaMPs facility,
Konza Prairie,
Kansas, USA
N39 050 , W96 350
RaMPs facility,
Konza Prairie,
Kansas, USA
N39 050 , W96 350
Echo Bay, Ontario,
Canada
N46 250 , W84020
906
835
835
835
Closed
shelters
Closed
shelters
Closed
shelters
Closed
shelters
Closed
shelters
Closed
shelters
Closed
shelters
Closed
shelters
1998
2007–2011
2003–2007
1998–2000
2006
2009–2010
Oct. 2010–June 2012
2006
Altered distribution during the period of
June–Sept. (dry period of 2, 4, 8, 14, or
28 days), total: 252 mm
Altered distribution with 50 % increase in
dry period
Altered distribution with 50 % increase in
dry period
Altered distribution with 50 % increase in
dry period
Altered distribution during the period of
May–Sept. (dry period of 10, 20, or
30 days),
total: 450 mm
Altered distribution during June–August
with 50 % increase in dry period
Altered distribution, with dry period of
1 and 3 weeks (Nov. 2010–June 2011)
and 3 and 6 weeks (Nov. 2011–June
2012), total: 580 mm
Altered distribution during May-Sept. (dry
period of 10, 20, or 30 days), total:
340 mm
Diversity:
"~15 %
ANPP: #10–15 %
Diversity: 0
ND
ANPP: 0
ANPP: #31 %
(ns) with large
infrequent rainfall events
ND
Species richness
and
composition: 0
ANPP: #18 % with
large infrequent
rainfall events
ANPP: 0
ND
Species composition: 0
Species richness
and
composition: 0
ANPP: 0
ANPP: 0
BNPP: 0
ANPP: "70 % with
larger infrequent
rainfall events
RS: #44 % with large
infrequent
rainfall events
ND
Laporte et al. (2002)
Koerner et al. (2014)
Fay et al. (2011)
Heisler-White
et al. (2009)
Soil N: "~100 %
with large
infrequent
rainfall events
RS: 0
Poll et al. (2013)
RS: 0
Knapp et al. (2002),
Fay et al. (2003,
2011), Harper
et al. (2005)
Jongen et al. (2013a,
b, c)
RS: 0
soil N: 0
RS: #13–16 %
Heisler-White
et al. (2009)
Soil N: 0
ANPP aboveground net primary productivity, BNPP belowground net primary productivity, RS soil respiration, MAT mean annual temperature, MAP mean annual
precipitation, ND not determined. Effect is indicated as positive ("), negative (#), or no effect (0)
13
679
8.7
Mesic:
agricultural crop
(2009:
T. aestivum,
2010:
H. vulgare)
Hohenheim Climate
Change experiment,
Heidfeldhof,
Germany
N48 420 , E09 110
835
680
15.9
Mesic:
woodland
understorey
herbaceous
vegetation
576
LTER montado,
Coruche, Portugal
0
Nd 8 , W8 200
11.9
Semi-arid:
mixed grass
prairie
Saline experimental
range, Hays,
Kansas, USA
N38 53’,
W99 230
Consequences of Changing Precipitation Patterns for Ecosystem Functioning. . .
365
366
S. Unger and M. Jongen
with water addition, or productivity decrease with water reduction). Finally, for the
Partial Least Squares Regression (PLSR) analysis we differentiated the data
according to ecosystem (arid, semi-arid, and mesic), with an additional climate
classification: cold (MAT < 5 C), temperate (5 C < MAT < 15 C), and warm
(MAT > 15 C), thus giving a set of nine different biomes. PLSR (Wold et al. 1983,
2001) was applied to model percentage change in aboveground productivity
(response variable, Y data) using MAT, MAP and percent manipulation as
explaining variables (X data). By visually inspecting the scores and loading plots,
the main factors determining the percent change in productivity can be assessed
depending on ecosystem types, and relationships between potential explaining
variables can be evaluated. X and Y data were mean centred and weighted by
1/(standard deviation). NIPALS algorithm was used. PLSR calculations were
performed using the software package The Unscrambler X 10.3 (CAMO Software
AS, Oslo, Norway).
3 The Impact of Changes in the Amount of Precipitation
3.1
Precipitation Addition
A total of 61 publications were included in the analysis for effects of changing
precipitation quantity on ecosystem processes, 44 of which describe results of
rainfall addition experiments, with a total number of 34 ecosystems (7 arid,
13 semi-arid, and 14 mesic systems) and 45 addition scenarios studied (Table 1).
Addition experiments usually do not require shelters, and are often conducted in
combination with precipitation exclusion, using the intercepted rainfall of a
throughfall manipulation experiment (e.g. Talmon et al. 2011; Hoeppner and
Dukes 2012; Byrne et al. 2013; Flanagan et al. 2013). The applied addition
scenarios increased precipitation between 20 and 115 %, with the exception of
McCulley et al. (2007), adding 300 % of rainfall. Some of these addition studies
were conducted in ecosystems where climate change scenarios predict an increase
in precipitation, such as in northern Europe (Press et al. 1998; Robinson et al. 1998;
Keuper et al. 2012; Weijers et al. 2013), central Asia (Niu et al. 2008; Liu
et al. 2009; Yan et al. 2010, 2011a, 2011b), or cold tundra regions in northern
Russia (Keuper et al. 2012) and North America (McGraw 1985). However, several
other addition studies, conducted in warm and temperate arid and semi-arid systems
(e.g. Harpole et al. 2007; Evans et al. 2011; Talmon et al. 2011; Potts et al. 2012;
Báez et al. 2013; Xu et al. 2013), investigated the effect of an increase in precipitation, although this is in contrast to future climate change scenarios, with these
studies generally done by mere opportunity (e.g. using intercepted precipitation
from throughfall shelters) or aiming at studying the effects of inter-annual variation
in precipitation. The main parameters studied in precipitation addition experiments
in the field were aboveground productivity (AP), totaling 40 observations, and soil/
Consequences of Changing Precipitation Patterns for Ecosystem Functioning. . .
367
ecosystem respiration (RS/ECO), with 16 observations; less attention was given to
effects on biodiversity (9 observations) and soil nitrogen properties
(6 observations).
Figure 5 shows the variation of percentage response in the above-mentioned
parameters to precipitation addition scenarios. None of the addition studies reported
a negative response to any of the studied parameters. Both AP and RS/ECO showed
the largest response to precipitation addition in arid regions, with average increases
of 54 % and 46 %, respectively. Parameter increases in semi-arid (40 % for AP, and
31 % for RS/ECO) and mesic regions (20 % for AP and 21 % for RS/ECO) were lower.
A 0-response was shown for diversity (Fig. 5d) in semi-arid and mesic ecosystems,
a result which has to be interpreted carefully due to the low observation count.
Similarly, 5 out of 6 studies reporting on soil N properties in semi-arid and mesic
ecosystems gave a 0-response (Fig. 5h). In arid ecosystems, none of the studies
reported on diversity and soil N properties (Fig. 5d, h). The highest percentage
responses to precipitation addition were found in an arid shrubland in central China,
with maximum increases of 266 % in AP and 59 % in RS (Song et al. 2012), and a
semi-arid Mediterranean grassland in California, with maximum increases of
275 %, 30 %, and 60 % in AP, RECO, and soil N, respectively (Potts et al. 2012).
Relating the percentage of manipulation to the percentage of productivity
response (Fig. 6) or respiration response (Fig. 7) for all addition studies revealed
a higher responsiveness of arid and semi-arid ecosystems to precipitation addition,
as compared to mesic ecosystems. A 50 % increase in the amount of precipitation
would result, on average, in a productivity increase of 37 %, 27 %, and 23 % in arid,
semi-arid, and mesic ecosystems, respectively (Fig. 6). In addition, respiration
would increase by 29 %, 35 %, and 13 % in arid, semi-arid, and mesic ecosystems,
respectively, with a 50 % water addition (Fig. 7). However, the respiration results
have to be regarded with care, due to the low number of replicate studies. Further,
site-specific differences in other well-known drivers of soil respiration, such as soil
nutrient and carbon availability, can be expected to affect these results.
Considering the strong moisture relationship with plant productivity generally
found in terrestrial ecosystems (e.g. Nippert et al. 2006), it is remarkable that many
of the applied addition scenarios did not result in significant increases in ecosystem
processes. In total, 18 out of the 40 studied scenarios did not find increases in
productivity responses, with approximately equal representation of arid and semiarid ecosystems (44 % and 40 %, respectively), while 8 out of the 16 addition
scenarios in mesic systems did not result in a productivity response. Notably, the
four studies finding no response in arid systems were all performed in cold Tundra
climates (McGraw 1985; Robinson et al. 1998; Keuper et al. 2012; Weijers
et al. 2013). Respiration was generally found to be more responsive to water
addition than productivity, with only 3 out of 16 studied scenarios reporting no
effects.
368
S. Unger and M. Jongen
Fig. 5 Boxplot of variation in the range of percentage change in (a, b) aboveground productivity
(AP), (c, d) diversity, (e, f) soil/ecosystem respiration (RS/ECO), and (g, h) soil N properties
observed in arid, semi-arid, and mesic ecosystems (see Table 1) in response to precipitation
addition (a, c, e, g) or reduction (b, d, f, h). Number (n) refers to sample size. Boxplots visualise
the first, second, and third quartile, and the mean values (dotted lines), with whiskers indicating the
maximum and minimum. Outliers are shown as dots
Consequences of Changing Precipitation Patterns for Ecosystem Functioning. . .
369
Fig. 6 Correlation between the percentage manipulation versus the percentage change in aboveground productivity (AP), for arid, semi-arid, and mesic ecosystems
Fig. 7 Correlation between the percentage manipulation versus the percentage change in soil/
ecosystem respiration (RS/ECO), for arid, semi-arid, and mesic ecosystems
370
3.2
S. Unger and M. Jongen
Precipitation Reduction
Of the 61 publications that were included in the analysis for effects of changing
precipitation quantity on ecosystem processes, 41 described results of rainfall
reduction experiments (Table 1). In total, these studies covered 38 ecosystem
types (5 arid, 12 semi-arid, and 21 mesic systems) with 52 reduction scenarios
applied. Experiments were performed using any type of the shelter designs
described in Sect. 1.4, with the applied scenarios reducing precipitation between
20 and 100 % of natural precipitation during the experimental period. Most studies
were conducted in ecosystems with future climate change prognoses indicating
decreasing amounts of precipitation (e.g. Miranda et al. 2009, 2011; Evans
et al. 2011; Talmon et al. 2011; Cherwin and Knapp 2012; Potts et al. 2012; Báez
et al. 2013; Byrne et al. 2013). However, some studies, especially those conducted
in northern European mesic ecosystems, chose to study precipitation reduction
without a clear consensus of climate model predictions (e.g. CLIMAITE project
studies of Emmett et al. 2004; Peñuelas et al. 2007).
AP, totaling 48 observations, was the most studied parameter, followed by
biodiversity (18 observations), RS/ECO (17 observations), and soil N properties
(11 observations). None of the featured reduction studies reported a positive
response of either parameter with a decrease of precipitation (Fig. 5). Both biodiversity and soil N were found to be resilient to water reduction (Fig. 5c, g), with the
exception of biodiversity in two arid ecosystems, exhibiting a negative response of
60 % and 27 % (Fig. 5c; Miranda et al. 2009), and a semi-arid grassland giving a
65 % decrease in soil N availability (Potts et al. 2012).
AP and RS/ECO showed the highest responsiveness to precipitation reduction in
arid ecosystems, with average decreases of 31 and 33 %, respectively. Parameter
decreases in semi-arid (17 % for AP, 18 % for RS/ECO, respectively) and mesic
ecosystems (12 % for AP, 7 % for RS/ECO, respectively) were considerably lower
(Fig. 5). Most responsive to precipitation reduction was an arid steppe in Mongolia,
with a decrease in AP of ~75 % (Shinoda et al. 2010), and a semi-arid warm
grassland in California (Potts et al. 2012), where AP decreased by 70 % in response
to a mere 23 % water reduction. Surprisingly large reductions in AP were reported
for an Alpine grassland (mesic ecosystem), where a 2–3 month exclusion of
precipitation resulted in a decrease in AP of ~67 % (Gilgen and Buchmann
2009). In addition, in an arid warm grassland ecosystem in Spain (Miranda
et al. 2009), exposed to a 50 % precipitation reduction, AP was reduced by 60 %.
Relating the percentage of manipulation to the percentage of productivity
response (Fig. 6) or respiration response (Fig. 7) for all reduction studies revealed
a higher responsiveness of arid ecosystems to precipitation reduction, as compared
to semi-arid and mesic ecosystems. On average, a 50 % precipitation reduction
would lead to productivity decreases of 37 %, 13 %, and 8 % in arid, semi-arid, and
mesic grassland ecosystems, respectively (Fig. 6). However, the magnitude of
responses of RS/ECO to precipitation reduction was substantially lower, with average
decreases of 14 % and 4 % in semi-arid and mesic ecosystems, respectively, with a
Consequences of Changing Precipitation Patterns for Ecosystem Functioning. . .
371
50 % precipitation reduction (Fig. 7). The response of arid systems could not be
estimated due to the lack of observations.
In total, 24 out of the 48 studied precipitation reduction scenarios found no
significant treatment responses in AP (38, 45, and 69 % of the studies in arid, semiarid, and mesic systems, respectively). With regard to RS/ECO, 7 out of the 17 studied
scenarios reported the absence of a significant treatment effect, with this
non-responsiveness particularly pronounced in mesic ecosystems (5 out of
9 studies).
3.3
Sensitivity to Changes in the Amount of Precipitation
Our findings (Figs. 5, 6, and 7) indicate a hierarchy in the responsiveness of
ecosystems to water manipulation, with largest responses to changing precipitation
amounts in arid ecosystems, immediately followed by semi-arid ecosystems, while
most mesic ecosystems were resilient to both water addition and reduction. In
addition, in all three ecosystem types, responsiveness to water addition was higher
as compared to water reduction.
The magnitude of the changes in a response parameter likely depends on the
magnitude of the exposed addition/reduction scenario. For example, Song
et al. (2012), being the only study including more than one addition scenario,
reported a progressively increasing productivity response (from 7 to 266 %), with
increasing precipitation addition (from 25 to 100 %). Similarly, several studies,
including two reduction scenarios (e.g. Evans et al. 2011; Cherwin and Knapp
2012; Evans and Burke 2013), reported higher parameter reductions with increasing
precipitation reduction. Thus, the higher responsiveness of arid ecosystems to
precipitation may be due to a coincidentally higher amount of manipulation in
these ecosystems. To estimate the possible impact of this effect, we calculated a
sensitivity index, by weighing the ecosystem parameter response to the relative
magnitude of exposed manipulation. Subsequently, we evaluated the effect of
aridity index (after Köppen 1923), which accounts for both temperature and
precipitation, by combining MAP and MAT, on the sensitivity index. Note that
by definition a high aridity index means a humid climate while a low aridity index
means an arid climate.
Figure 8 demonstrates this cause–effect relationship, with sensitivity of ecosystem parameters to changes in the amount of precipitation strongly decreasing with
the aridity index. The average sensitivity index to water addition was 0.70, 0.77,
and 0.18, while reduction scenarios gave values of 0.44, 0.40, and 0.14 for arid,
semi-arid, and mesic ecosystems, respectively.
Deviating from the sensitivity–aridity relationship are the results reported in
Potts et al. (2012). In this study, a semi-arid Mediterranean-type grassland,
subjected to relatively small manipulations of the precipitation amount, gave
exceptionally high sensitivity indices in both addition scenarios (5.3, 0.6, and 1.1
for AP, RECO, and soil N, respectively) and reduction scenarios (3.0, 2.2, and 2.8 for
372
S. Unger and M. Jongen
Fig. 8 Sensitivity index of arid, semi-arid, and mesic ecosystems with precipitation reduction or
addition versus Köppen aridity index
AP, RECO, and soil N, respectively). However, the study was performed during a
year characterised by natural drought, with severe consequences for the ambient
treatment, which highlights the importance of considering climate conditions in the
controls with precipitation manipulation studies. Omitting this study, the sensitivity
indices for semi-arid ecosystems are smaller, i.e. 0.57 with water addition and 0.18
with reduction. In short, arid ecosystems showed the highest sensitivity to water
manipulation, followed by semi-arid and mesic ecosystems. Thus, the observed
hierarchy of ecosystem sensitivity to changes in the amount of precipitation with
aridity is not an artefact of either the magnitude of manipulation or MAT.
Overall, ecosystem processes were more sensitive to water addition than to
water reduction, with sensitivity indices of 0.45 and 0.28, respectively (Fig. 8).
This effect was particularly pronounced in arid (0.70 with addition, 0.44 with
reduction) and semi-arid regions (0.77 versus 0.40, respectively), while mesic
ecosystems did not differ much in their responsiveness to either water addition or
reduction (0.18 with addition, 0.14 with reduction). However, the trend towards
higher sensitivity with aridity was maintained (Fig. 8).
4 The Impact of Changes in Precipitation Variability
In many ecosystems, a consequence of future climate change will be increasing
intra-annual precipitation variability, with heavier rainfall events but longer intervening dry periods (see Sect. 1.1; Fig. 2). In recent years, several precipitation
manipulation experiments have been conducted to study these scenarios. While
some studies (e.g. Fay et al. 2003; Miranda et al. 2009) include a scenario of
Consequences of Changing Precipitation Patterns for Ecosystem Functioning. . .
373
decreased precipitation amount (see Sect. 3.2), others try to single out the sole
effect of altered precipitation distribution, frequency, and intensity on ecosystem
performance (Knapp et al. 2002; Laporte et al. 2002; Heisler-White et al. 2008,
2009; Jongen et al. 2013a, b, c; Koerner et al. 2014). The experimental design
usually involves closed shelters, with the collection and subsequent redistribution
of natural precipitation according to the implemented scenario.
To date, the effects of precipitation variability, without altering total annual
precipitation inputs, are still rarely studied, with only 18 publications included in
the analysis. These studies were performed in 12 different ecosystem types (5 arid,
3 semi-arid, and 4 mesic systems) and 28 variability scenarios were studied
(Table 2). The applied variability scenarios differed widely, with 0.5- to 14-fold
increases in the both the extent of the normal dry period and the applied precipitation intensity (on average ~2-fold). Two studies given in Table 2 (i.e. Bates
et al. 2006; Miranda et al. 2011) followed a different approach by altering the
seasonal distribution of precipitation between the winter and the spring/summer
periods. Main records made are on AP (27 observations), whereas observations on
biodiversity (16), RS (11), and soil N properties (10) are reported upon with less
frequency. Figure 9a shows the variation of responses in AP to all applied precipitation variability scenarios in arid, semi-arid, and mesic systems. Observations in
arid ecosystems consistently reported that AP was non-responsive to changes in the
distribution pattern of precipitation (Miranda et al. 2009; Thomey et al. 2011;
Vargas et al. 2012). However, Thomey et al. (2011) did report significant productivity increases in the dominant grass species with large infrequent rainfall events.
In marked contrast, Heisler-White et al. (2008; 2009) with 6 observations in two
different semi-arid ecosystems found a strong positive effect of larger infrequent
precipitation pulses, with an increase in AP of on average 59 %, whereas negative
effects on AP (10 to 31 %) have been reported for mesic systems (Knapp
et al. 2002; Laporte et al. 2002; Fay et al. 2003; Harper et al. 2005; HeislerWhite et al. 2009). However, 9 out of 12 observations in mesic ecosystems report
no significant response of AP with precipitation variability (Laporte et al. 2002; Fay
et al. 2011; Jongen et al. 2013b, c; Poll et al. 2013; Koerner et al. 2014).
In a conceptual model (‘bucket model’) Knapp et al. (2008) predicted the
responses of terrestrial ecosystems to more extreme intra-annual precipitation
patterns. The model is based on the expected change in the amplification of the
fluctuations of soil water content with respect to certain stress thresholds (e.g. field
capacity and permanent wilting point) with increasing precipitation intensities and
longer intervening dry periods. According to the ‘bucket model’, in mesic ecosystems, the altered fluctuations will increase the duration of soil moisture exceeding
the stress thresholds, leading to more frequent and higher water stress with increasing precipitation variability, thus resulting in future negative responses in
AP. However, arid ecosystems will experience the opposite effect, with a decrease
in seasonal water stress with increasing precipitation variability, as the amplification of soil water dynamics would result in deeper soil water infiltration, thereby
permitting soil moisture to be maintained above drought stress thresholds for longer
periods (Knapp et al. 2008). The results, with a 0- or an on-average positive
374
S. Unger and M. Jongen
Fig. 9 Boxplot of variation
in the range of percentage
change, with mean values
separately indicated (dotted
lines) in measures of (a)
productivity (AP), (b)
diversity, and (c) soil
respiration (RS) observed in
arid, semi-arid, and mesic
ecosystems (see Table 2) in
response to precipitation
variability. Number (n)
refers to sample size.
Boxplots visualise the first,
second, and third quartile,
and the mean values (dotted
lines), with whiskers
indicating the maximum
response of AP in arid and semi-arid ecosystems, respectively, and an on-average
negative response in mesic systems, support the predictions made in the ‘bucket
model’. However, the majority of the observations (19 out of 27) report no response
of AP to altered precipitation variability, similar to the studies on the impacts of
precipitation addition or reduction on AP (see Sects. 3.1 and 3.2).
In contrast to AP responses, the changes in biodiversity parameters with
increased precipitation variability were very small (Fig. 9b). Arid and semi-arid
ecosystems proved to be non-responsive, while mesic ecosystems exhibited a slight
increase in biodiversity with decreasing precipitation frequency (Fig. 9b). This
increase, however, was due to a single observation (Knapp et al. 2002), with none
Consequences of Changing Precipitation Patterns for Ecosystem Functioning. . .
375
of the other studies in mesic ecosystems reporting significant biodiversity
responses.
Changes in soil respiration were found to reflect the responses of AP to increased
precipitation variability, with an 11 % increase (only 2 observations) and a 10 %
decrease in arid and mesic ecosystems, respectively (Fig. 9c). Unfortunately, none
of the studies in semi-arid ecosystems report results on RS. Regarding soil nitrogen,
general conclusions are difficult due to the small number of studies reporting on
these parameters (10 observations). Nevertheless, soil nitrogen responses to
decreasing precipitation frequency were extremely variable, with 7 observations
finding no significant changes, while three observations report strong responses of
30 %, 60 %, and 100 % in arid, semi-arid, and mesic ecosystems, respectively
(Heisler-White et al. 2009; Yahdjian and Sala 2010). As increasing AP and RS in
the arid/semi-arid regions should promote soil nitrogen mineralisation and turnover, the 0- and negative responses of soil N are unexpected. However, as not only
precipitation frequency but also pulse size was altered, the increased precipitation
intensity could enhance nitrogen losses from soils, which might counteract the
expected positive effects of increased AP and RS (see Sect. 4). Further, high
temperatures in warm arid and semi-arid ecosystems can be expected to facilitate
NH3 volatilisation from soils (e.g. Fan et al. 2011).
What remains is the question why the majority of the observations (45 out of 63)
report a non-responsiveness of ecosystem processes with increasing precipitation
variability. Of major importance is the question whether an increase in precipitation
variability actually causes an increase in variability of soil water content. As the
fluctuations in soil moisture can easily be expressed as the coefficient of variation of
daily average soil water content (CVSWC) (e.g. Fay et al. 2011; Jongen et al. 2013b,
c), we suggest the inclusion of this parameter in future studies, as
non-responsiveness can be explained by the lack of a significant change in
CVSWC. In addition, the lack of responsiveness to increased precipitation variability
can be explained by the resilience of grassland vegetation to short-term decreases in
soil moisture during the growing period (Miranda et al. 2011; Jongen et al. 2013c).
Indeed, plants have the ability to cope with irregularities of precipitation patterns
through a high degree of phenotypic plasticity (Jump and Peñuelas 2005) and the
possibility to employ strategies that improve water uptake and reduce water consumption (Moreno et al. 2008). Also, manipulation of precipitation variability
during sensitive periods such as germination, seedling establishment, or the peak
growing period can cause strong limitations on AP and dependent parameters that
would not occur when studying less sensitive times, such as the end of the growing
season. Finally, the length of the period that ecosystems experienced an increase in
precipitation variability could be another reason for the non-responsiveness
observed in many cases (Fay et al. 2011; Beier et al. 2012; Poll et al. 2013).
Long-term effects of precipitation manipulation, including the loss of resilience,
the possibility for adaptation, or a steady change in soil properties caused by the
manipulation, might result in different ecosystem responses than those found in
short-term studies (Beier et al. 2012). For example, the studies conducted in Konza
Prairie reported no effects on AP and RS in the long term (Fay et al. 2011; Koerner
376
S. Unger and M. Jongen
et al. 2014), while negative effects were found in the first 2 years of manipulation
(Knapp et al. 2002; Fay et al. 2003; Harper et al. 2005).
5 The Impact of Changes in Precipitation Intensity
With future climate scenarios predicting a change in precipitation distribution
(Sect. 1.1), the effects of extended dry periods between precipitation events
(Fig. 2b) on ecosystem processes will be accompanied by effects of increased
precipitation intensity (Fig. 2a). Studies addressing this increase in precipitation
variability (Sect. 4, Table 2) often show a lack of responsiveness of grassland
ecosystems. However, the presented analysis only included studies with a minimum
duration of 2 months of precipitation manipulation, with parameter responses taken
for each year or growing season. Thus, the effects of individual precipitation pulses
on parameter responses on the short term, and ultimately on ecosystem functioning
in the long term, should be considered.
For arid and semi-arid ecosystems, it has been hypothesised that discrete precipitation pulses stimulate brief but important episodes of biological activity
(Huxman et al. 2004b), with pulse size and frequency differentially affecting
above- and belowground biota. With the response thresholds of plants and microbes
being determined by the ability of the organisms to utilise precipitation events of
different infiltration depth, there is a hierarchical view of precipitation pulse
patterns and their effect on ecosystem processes (Huxman et al. 2004b; Schwinning
and Sala 2004). This suggests that small rainfall events will only stimulate soil
microbes in the uppermost soil layer, subsequently increasing microbial respiration,
while the stimulation of carbon assimilation in higher plants requires larger rainfall
events, with concomitant increase in infiltration depth. Indeed, most studies show a
positive effect of increased precipitation intensity on short-term plant performance
(e.g. photosynthetic carbon uptake, phenology, reproductive traits) after a precipitation pulse, which, however, is seldom reflected in productivity increases
(e.g. Patrick et al. 2007; Chen et al. 2009; Angert et al. 2010).
In relation to aboveground biological activity, several studies have shown that
the magnitude and duration of the photosynthetic response were related to the size
of the precipitation event (Chen et al. 2009; Jongen et al. 2013d) and that photosynthetic assimilation responds with a delay to precipitation pulses (Ogle and
Reynolds 2004; Potts et al. 2006b). In addition, the plants’ response differs across
species and functional types, and depends on phenology, morphology, and physiological status (Huxman et al. 2004b; Ogle and Reynolds 2004; Potts et al. 2006a;
Patrick et al. 2007; Angert et al. 2010).
In relation to belowground activity, a rapid increase in soil CO2 efflux following
precipitation pulses has been observed in various ecosystems (Mariko et al. 2007;
Chen et al. 2009; Unger et al. 2010; Fan et al. 2012; Jongen et al. 2013a). This
phenomenon of increased carbon and nitrogen losses after rewetting of dry soils,
commonly termed ‘Birch effect’, has become an important subject in ecological
Consequences of Changing Precipitation Patterns for Ecosystem Functioning. . .
377
studies. Although a complete understanding of the processes underlying the Birch
effect has not yet been achieved (Borken and Matzner 2009), it is commonly
accepted to be a direct response of the soil microbial and fungal community to
changing moisture conditions (Borken and Matzner 2009; Inglima et al. 2009;
Unger et al. 2010, 2012; Kim et al. 2012). Many studies agree on the theory of a
positive effect of rewetting on soil microbial performance through a stimulation of
microbial growth and matter transformation (e.g. Austin et al. 2004). However,
several studies favour the hypothesis of a negative effect of precipitation pulses,
with the large carbon and nitrogen losses being triggered by a hypo-osmotic stress
response of soil microbes and fungi (Fierer and Schimel 2003; Xu and Baldocchi
2004; Jarvis et al. 2007; Unger et al. 2010, 2012). The majority of studies show that
length and severity of the dry period prior to rewetting play a key role in the soil
microbial response to such sudden changes in soil water status (Kieft et al. 1987;
Fierer and Schimel 2003; Xu and Baldocchi 2004; Cable et al. 2008; Unger
et al. 2010), with large and transient carbon pulses corresponding to high microbial
stress (Unger et al. 2010; Meisner et al. 2013). Furthermore, wetting rate and
infiltration to a soil seem to affect the microbial response to changing soil water
potentials (Unger et al. 2012). Thus, the magnitude of change in soil water content
related to a precipitation pulse is probably a key factor determining pulse effects on
microbial activity and matter turnover.
Additionally, precipitation pulses may cause higher losses of nutrients, in particular the easily soluble components such as nitrate, due to higher water infiltration
and leaching below the rooting zone (Yahdjian and Sala 2010; Jongen et al. 2013a).
As both increased Birch effects and leaching are to be expected with an increase
of precipitation intensities, overall negative effects on soil microbial activity,
nutrient availability, and hence productivity are a likely consequence. This effect
might be exacerbated by larger precipitation pulses causing temporarily anoxic soil
environments, impacting negatively on root and microbial performance (water
logging, e.g. Jackson and Colmer 2005). However, the potential effects of increased
precipitation intensity are masked by the concomitant effects of increasingly pulsed
water availability and the longer intervening dry periods and therefore difficult to
disentangle. Further, the impact of effects of increased leaching and soil nitrogen
and carbon losses on ecosystem functioning is likely to be significant in the long
term, and thus seldom detected in short-term observations.
For example, Patrick et al. (2007) found decreased soil respiration rates with
concomitantly increased leaf level photosynthesis with a large precipitation pulse in
summer during a 7-day observation period, resulting in an increase in carbon
sequestration. However, the reduced soil respiration rates are likely to indicate
substrate limitation or stress for soil microbes after the pulse, which could, in the
long term, hamper the observed increase in carbon sequestration.
Although grassland ecosystems often show a lack of responsiveness to an
increase in precipitation variability (Sect. 4, Table 2), this finding was particularly
noticeable in arid and mesic ecosystems. In semi-arid ecosystems, overall positive
effects of increased precipitation variability on productivity have been reported
(Fig. 9), a finding that does not support the hypothesis of increased precipitation
378
S. Unger and M. Jongen
intensity causing negative effects due to the increased leaching and Birch effects in
these ecosystems. Probably, the duration of most studies was not long enough to
account for these long-term effects. In addition, it can be argued that the positive
effect of longer periods with soil moisture being above stress thresholds, as
hypothesised in the ‘bucket model’ for water-limited ecosystems (Knapp
et al. 2008), counteracts negative effects of increased precipitation intensity on
ecosystem functioning. However, Jongen et al. (2013c), increasing precipitation
variability within the same experimental site for two subsequent years, reported
lower soil nitrogen and productivity in the second year of manipulation, which
could be related to negative effects of increased leaching and Birch pulses in the
first year. Nevertheless, the results highlight a need for more long-term observation
studies, ideally across several years, to assess the impact of precipitation intensity
changes on ecosystem functioning.
6 Effects of Changing Precipitation Patterns
on Synchronicity of the Matter Cycles
Due to the co-dependence of plant productivity and soil microbial mineralisation,
there is a close linkage of ecosystem cycling of carbon and mineral nutrients. On the
one hand, the temporal availability of carbon provided by plants, mainly through
litter fall, root turnover, and exudation of organic substances to the soil, is a
prerequisite for soil microbial growth (e.g. Kuzyakov and Gavrichkova 2010),
while on the other hand, soil organic matter turnover and the mineralisation of
nutrients, particularly of nitrogen, by soil microbes are vital for plant performance
(e.g. Vitousek and Howarth 1991). Temporal synchronicity between both supply
and demand of carbon and mineral nutrients is therefore crucial for ecosystem
functioning (Augustine and McNaughton 2004).
The lack of soil moisture limitation in mesic ecosystems generally assures a tight
coupling between microbial nutrient supply and plant nutrient demand
(e.g. Vitousek et al. 1998; McCulley et al. 2009; Bobbink et al. 2010), with
synchronicity between microbial and plant processes being mediated by intraannual temperature variation, thereby minimising the loss of available nitrogen
through leaching and gaseous emissions. However, in water-limited arid and semiarid ecosystems, several studies observed an asynchronicity between nitrogen
supply by microbes and nitrogen demand by plants (Jackson et al. 1988; Augustine
and McNaughton 2004), due to the large fluctuations in soil moisture, with differences in the hierarchy, intricately linked to differences in thresholds, of the
responses of plants and microbes to changes in soil water (Schwinning and Sala
2004; Collins et al. 2008). Such decoupling between peaks of mineral nutrient
supply and plant growth can lead to substantial losses of mineral nutrients from the
system, and result in a shift from a closed internal nitrogen cycle to an ‘open’ cycle,
with the excess nitrogen being leached and/or emitted from the ecosystem
(de Schrijver et al. 2008). For example, Yahdjian et al. (2006) suggested that net
Consequences of Changing Precipitation Patterns for Ecosystem Functioning. . .
379
Fig. 10 Percentage change in AP versus percentage change of RS/ECO for precipitation addition
(circles), reduction (squares), and variability (triangles) studies in arid (black), semi-arid (grey),
and mesic (white) ecosystems. The dashed line indicates an exponential function (y ¼ 59.7
(1e(0.01x)), r2 ¼ 0.73, p < 0.0001), whereas the 1:1 relationship is indicated by a solid line
mineralisation of nitrogen during long dry periods is less affected than plant and
microbial nitrogen immobilisation, resulting in an accumulation of nitrate in the
soil that is subsequently lost by leaching during first precipitation events, thereby
leading to nitrogen limitation and decreased productivity.
With altered precipitation amount, frequency, and intensity, the response thresholds of plants and soil microbes might experience a larger deviation, amplifying the
asynchronicity in nitrogen processes, and resulting in extended periods of
decoupling between nitrogen and carbon cycles throughout the year.
Figure 10 shows the observed percentage responses of RS/ECO versus AP in arid,
semi-arid, and mesic ecosystems, considering all reduction, addition, and variability scenarios. Only those studies with simultaneous measurements of RS/ECO and
AP responses were included. Regardless of the ecosystem type, negative responses
in AP, as found in precipitation reduction scenarios, were accompanied by negative
responses of the same magnitude in RS/ECO, indicating that a decrease in precipitation does not result in asynchronicity of plant and microbe performances
(Fig. 10). This finding is unexpected, as moisture limitation has previously been
found to enhance the possibility of asynchronicity (e.g. Evans and Burke 2013).
However, although Evans and Burke (2013) found significant increases in soil
inorganic nitrogen pools with a simulated long-term drought in a semi-arid grassland in California, the decoupling of AP and soil respiration due to different drought
sensitivities of ecosystem processes was small (42 % and 33 %, respectively).
In contrast to the observed synchronicity between AP and RS/ECO in studies with
precipitation reduction, the different ecosystem compartments (AP and RS/ECO)
tended to show larger residuals from the 1:1 line with precipitation addition. In
those precipitation addition studies with positive responses in AP and RS/ECO, the
AP response was often much stronger than the RS/ECO response. This effect became
more pronounced with increasingly positive responses in AP and was observed in
2 arid (Thomey et al. 2011; Song et al. 2012), 2 semi-arid (Sternberg 2011; Talmon
380
S. Unger and M. Jongen
et al. 2011; Potts et al. 2012), and 1 mesic ecosystem (Zhou et al. 2006, 2012;
Sherry et al. 2008). Thus, if precipitation manipulation increased plant growth, this
was not always reflected in the same order of magnitude in soil or ecosystem
respiration, which is indicative of a decoupling between carbon production and
nitrogen mineralisation, potentially leading to a lagged nutrient deficiency of
plants. As this effect was most pronounced in arid and semi-arid ecosystems,
where asynchronicity of the matter cycles is reflected in nitrogen accumulation
during longer dry periods, a higher response of plant productivity as compared to
soil microbial activity might be expected, as additional water enables plants to
better assimilate the readily available nitrogen pool. While this explains how, in the
short term, precipitation addition accelerates plant growth in soils without nutrient
limitation, the lagged effect of smaller nutrient supply by microbes with larger
nutrient fixation by plants is not considered. However, the studies showing the most
extreme deviations from the 1:1 line in Fig. 10 can be regarded as exceptions, with
Potts et al. (2012) comparing precipitation addition to a control subjected to severe
natural drought, and Song et al. (2012) studying an extreme addition scenario in the
most arid ecosystem reported upon. Under these extreme conditions, a higher
response of AP as compared to the response of RS/ECO with precipitation addition
might be expected, as (1) nutrient accumulation during drought periods is expected
to be higher, and (2) high soil water potential changes might cause greater stress to
soil microbes (Sect. 5) than to plants.
Reports on both AP and RS/ECO in studies manipulating precipitation variability,
without altering total precipitation inputs (Table 2), did not find pronounced
differences between soil and plant treatment responses (Fig. 10). Dijkstra
et al. (2012) showed that nitrogen release by soil microbes was enhanced as
compared to plant nitrogen uptake with large and infrequent precipitation pulses,
indicating that changes in precipitation event sizes could exacerbate losses of
nitrogen in a semi-arid system. However, such short-term effects were not
reproduced in any of the longer-term manipulation studies, most of them finding
a near 1:1 response in AP and RS/ECO (Fig. 10).
Thus, in general, we found that in most ecosystems reported upon, both AP and
RS/ECO did respond synchronously to precipitation manipulation scenarios. This is
supported by the general lack of significant treatment effects on soil nitrogen
availability or mineralisation with precipitation manipulation (Tables 1 and 2),
with the exception of only four studies (Heisler-White et al. 2009; Yahdjian and
Sala 2010; Potts et al. 2012; Evans and Burke 2013). Therefore, increased
asynchronicity of the matter cycles will not likely be a threat with changing
precipitation patterns as predicted with future climate scenarios.
7 Synthesis
Experimentally manipulating precipitation patterns is an indispensable tool to
describe and model future climate change impacts on ecosystem processes (Reichstein et al. 2013; Reyer et al. 2013; Vicca et al. 2013). During the last two decades, a
Consequences of Changing Precipitation Patterns for Ecosystem Functioning. . .
381
growing body of studies has emerged reporting on manipulative experiments in a
variety of ecosystems, with some of these studies including the effects of changing
precipitation patterns. In this review, the findings of these individual studies were
synthesised in order to make inferences from the combined results and to identify
and refine strategies for future research. An earlier meta-analysis of precipitation
manipulation studies, carried out by Wu et al. (2011), synthesised 39 studies,
conducted in 34 ecosystems with different vegetation types, their analysis focusing
on plant growth parameters and ecosystem carbon balance. They found that supplemental precipitation stimulated plant productivity and ecosystem carbon fluxes,
whereas reduced precipitation suppressed these parameters (Wu et al. 2011). Our
review analyses the effects of in situ precipitation manipulation on plant productivity, species diversity, soil/ecosystem respiration, and soil nitrogen in grassland
type ecosystems over a wide range of climate types (MAT range: 13.9 C to
22.9 C; MAP range: 115–1,741 mm), synthesising the results from 72 studies. Our
analysis showed a hierarchy in the responsiveness of grassland ecosystems to
changing precipitation quantity, with largest responses found in arid ecosystems,
immediately followed by semi-arid ecosystems, while the majority of mesic ecosystems did not respond to either water addition or reduction. Furthermore, our
analysis indicated that, independent of ecosystem type, ecosystem processes were
more responsive to water addition than to water reduction, which agrees with Wu
et al (2011), reporting higher sensitivity to increased precipitation than to decreased
precipitation. In a review on precipitation reduction experiments, Vicca
et al. (2013) reported no evidence of differential effects of experimental drought
over sites with different MAP, which is in contrast to our results for grassland type
ecosystems, where responsiveness to manipulation was higher in arid regions than
in mesic regions. This, however, is plausible, as productivity losses through water
reduction in shallow-rooted grassland ecosystems are potentially stronger in arid
regions, which might not be the case with deeper-rooted forest ecosystems (Reichstein et al. 2013). In agreement, Knapp and Smith (2001) concluded that systems
dominated by herbaceous vegetation may be more responsive to future precipitation
regimes, as their productivity shows generally larger inter-annual variability than
forests. Hsu et al. (2012) reported higher sensitivity of aboveground productivity to
changes in mean annual precipitation in semi-arid ecosystems as compared to arid
ecosystems, concluding that at the driest sites, sensitivities may be lower due to low
relative growth rates, density limitations, and high evaporation rates. This is in
contrast to our results, with grassland ecosystems showing higher sensitivity with
increasing aridity. However, the conclusion of Hsu et al. (2012) is based on two
semi-arid sites with exceptionally high sensitivity.
Our analysis indicated that a large part of the studies reported a resilience of
grassland ecosystems to changes in precipitation patterns. However, Wu
et al. (2011) do not mention resilience in their findings. The resilience to changing
precipitation amounts was most evident in mesic ecosystems, followed by semi-arid
and arid ecosystems, for both addition and reduction scenarios. Furthermore,
resilience was more evident for diversity, soil nitrogen, and productivity as compared to respiration processes. This resilience might be because the applied
382
S. Unger and M. Jongen
manipulation scenarios often lie within the range of the natural inter-annual precipitation variability experienced by ecosystems, and a long-term evolutionary
adaptation of ecosystem components to these natural differences (Sardans and
Peñuelas 2013).
To test the observed hierarchy in responsiveness of ecosystems towards changing precipitation amounts with increasing aridity, we performed a Partial Least
Squares Regression analysis (PLSR) of the productivity responses with changing
precipitation quantity. The x-score plot of the factors MAP, MAT, and manipulation amount revealed a separation between grassland responses towards manipulation in different biomes (Fig. 11). PLSR showed that x-scores at factor 1 (amount of
manipulation) explained 29 % of the y-variance (response variable), while x-scores
at factor 2 (MAP and MAT) explained only 2 % of the y-variance. Thus, although
high loadings of MAT and MAP on factor 2 are observed, the variance in AP
response is mainly explained by the amount of manipulation or other unknown
factors, which is indicated in similar directions of the manipulation and response
vectors. MAP and MAT influences on ecosystem response variance cannot be
Fig. 11 Scores plot of the first two factors of a Partial Least Squares Regression (PLSR) analysis
to model percentage change in aboveground productivity in grassland ecosystems (response
variable, y-data) using MAT, MAP, and precipitation addition and reduction scenarios (percent
manipulation) as explaining variables (x-data). Samples originating from nine different biomes are
sorted by MAP (arid, semi-arid, mesic) and MAT (cold, temperate, warm). Arrows indicate mean
x-and y-loadings of the predictor variables and the response. Explained variance in x and y,
respectively, is given in brackets in the axes labels. n ¼ 87
Consequences of Changing Precipitation Patterns for Ecosystem Functioning. . .
383
separated as they showed similar loading vectors; however, neither parameter
contributed significantly to ecosystem responses towards manipulation.
The poor fit of the PLSR model, with only 38 % and 25 % of x-variance being
explained by factors 1 and 2, respectively, can be an indication for data distribution
being prejudiced by the resilience of many systems (0-responses). Thus, resilience,
as indeed observed in most studies, overall seemed to have more impact than the
hierarchy of different climate types in those studies that did observe ecosystem
responses with precipitation manipulation. However, it has to be considered that the
PLSR model is not only driven by MAT, MAP, and percentage manipulation, but
also influenced by site-specific factors (e.g. soil properties, species composition,
herbivory, management, climatic and site history) and means of experimental
conduct (e.g. length and timing of experimental manipulation, seasonality, interannual variation in precipitation, shelter effects), which hampers generalisation and
direct comparability of results in between sites.
In relation to changes in precipitation variability, resilience was prominent in
arid and mesic grassland ecosystems, while semi-arid ecosystems showed an
increase in productivity with increasing variability, although this result is based
on a single study by Heisler-White et al. (2009). The hierarchy with a 0- or an
on-average positive response of AP in arid and semi-arid ecosystems, respectively,
and an on-average negative response in mesic systems in studies reporting effects
towards precipitation variability experiments (Fig. 9), supports the predictions
made in the ‘bucket model’ by Knapp et al. (2008). However, it must be considered
that this conclusion is only based on a small amount of observations and, similar to
the findings for changing precipitation amounts, is overshadowed by the resilience
found in most studies. In addition, the hypothesised negative effects of increased
leaching and gaseous carbon and nitrogen losses with higher precipitation pulse
intensity in arid and semi-arid ecosystems could not be confirmed. This could be
due to two reasons: (1) either the precipitation variability studies conducted are not
long enough to account for negative long-term effects of soil nitrogen and carbon
depletion or (2) the positive effects of soil moisture being above stress thresholds
for longer periods counteract negative effects of increased precipitation intensity on
ecosystem functioning.
For those studies that reported upon both AP and RS/ECO, synchronous responses
of both parameters towards precipitation manipulation scenarios were found, with
the exception of some addition studies, with higher responses of productivity as
compared to RS/ECO. Therefore, increased asynchronicity of the matter cycles will
not likely be a threat with the changing precipitation patterns that are predicted with
future climate scenarios.
In a recent publication, Vicca et al. (2012) highlighted the necessity of a
common metric to increase comparability of precipitation manipulation experiments in different ecosystems, this metric combining an index of both stress
duration and stress intensity, thereby reflecting the actual treatments as experienced
by plants. Indeed, it has to be considered that altering precipitation amounts might
not always result in an equivalent change in available soil water for plants and
microorganisms, as processes that distribute precipitation in the soil are complex,
with interception, infiltration, run-off, seepage below the rooting zone, soil
384
S. Unger and M. Jongen
evaporation, plant water use, and hydraulic redistribution strongly differing
between soil and ecosystem types (Loik et al. 2004) and differing between season
and quantity of applied precipitation (Parton et al. 2012). Thus, these factors, by
determining the available water for plants, might play a crucial role in determining
whether ecosystems display either resilience or responsiveness to changing precipitation patterns. In addition, Sala et al. (2012) found that the responsiveness of
ecosystem processes to changing water availability is influenced by a lagged effect
of the previous year’s situation, pointing to the need to incorporate information
about climate legacies when interpreting results from precipitation manipulation
experiments. Furthermore, most of the studies included in our review were
conducted over short time periods. Shifts in species composition that can occur in
the long term are thus rarely observed in precipitation manipulation studies
(Weltzin et al. 2003). Considering climate change as a directional process, ecosystem responses will depend on both the magnitude of change and the time frame
being considered (Sala et al. 2012).
The problem when comparing the results of a large number of individual studies
to address large-scale ecological questions has recently been raised by Fraser
et al. (2013), recommending the use of coordinated distributed experiments
(CDEs), a possible solution to increase the level of in-between study comparability.
CDEs provide a collaborative, coordinated, and hypothesis-driven approach for
standardised experimental conduct and data analysis on an international level, thus
controlling for site and study effects on both spatial and temporal scales, allowing to
address important large-scale ecological issues, that would otherwise be difficult to
resolve (Fraser et al. 2013).
We strongly support both the necessity to introduce a common metric to improve
inter-study comparability, as proposed by Vicca et al. (2012), and the use of
ecological CDEs, proposed by Fraser et al. (2013). In this review, we tried to
improve inter-study comparability by relating the relative amount of ecosystem
response with the relative amount of manipulation (sensitivity index, Sect. 2.2) and
attempting to assess whether differences in ecosystem responses were driven by
MAT and MAP. In addition, particularly for those manipulation experiments
investigating the effects of precipitation variability, we suggest the use of the
coefficient of variation of daily average soil water content (CVSWC) to be included
in future studies.
Although this review of precipitation manipulation experiments finds a general
resilience of grassland ecosystems towards a range of manipulation scenarios, the
question how future precipitation changes will affect ecosystem processes in global
grasslands is far from answered. Thus, coordinated precipitation manipulation
experiments with long-term field observations and increased comparability are
desirable to capture and compare possible long-term effects (e.g. through changes
in species composition and soil properties) on ecosystem state and functioning.
Acknowledgements The authors wish to thank Christine Hellmann for help and advice with the
PLRS, and Peter Fay and Scott Collins for helpful suggestions on the manuscript. The authors
gratefully acknowledge the financial support by FCT (Fundação para a Ciência e Tecnologia),
through a postdoctoral fellowship to Marjan Jongen (SFRH/BPD/79662/2011).
Consequences of Changing Precipitation Patterns for Ecosystem Functioning. . .
385
References
Anderson RC (1982) An evolutionary model summarizing the roles of fire, climate and grazing
animals in the origin and maintenance of grasslands: an end paper. In: Estes J, Tyrl R, Brunken
J (eds) Grasses and grasslands: systematics and ecology. University of Oklahoma Press,
Norman, OK, pp 297–308
Angert AL, Horst JL, Huxman TE, Venable DL (2010) Phenotypic plasticity and precipitation
response in Sonoran Desert winter annuals. Am J Bot 97:405–411
Aranibar JN, Otter L, Macko SA, Feral CJW, Epstein HE, Dowty PR, Eckardt F, Shugart HH,
Swap RJ (2004) Nitrogen cycling in the soil-plant system along a precipitation gradient in the
Kalahari sands. Glob Change Biol 10:359–373
Atjay GL, Ketner P, Duvigneaud P (1979) Terrestrial primary production and phytomass. In:
Bolin B, Degens ET, Kempe S, Ketner P (eds) The global carbon cycle. Wiley, Chichester, pp
129–181
Augustine DJ, McNaughton SJ (2004) Temporal asynchrony in soil nutrient dynamics and plant
production in a semiarid ecosystem. Ecosystems 7:829–840
Austin AT, Yahdjian L, Stark JM, Belnap J, Porporato A, Norton U, Ravetta DA, Schaeffer SM
(2004) Water pulses and biogeochemical cycles in arid and semiarid ecosystems. Oecologia
141:221–235
Bachman S, Heisler-White JL, Pendall E, Williams DG, Morgan JA, Newcomb J (2010) Elevated
carbon dioxide alters impacts of precipitation pulses on ecosystem photosynthesis and respiration in a semi-arid grassland. Oecologia 162:791–802
Báez S, Collins SL, Pockman WT, Johnson JE, Small EE (2013) Effects of experimental rainfall
manipulations on Chihuahuan Desert grassland and shrubland plant communities. Oecologia
172:1117–1127
Bates JD, Svejcar T, Miller RF, Angell RA (2006) The effects of precipitation timing on sagebrush
steppe vegetation. J Arid Environ 64:670–697
Beier C, Beierkuhnlein C, Wohlgemuth T, Peñuelas J, Emmett B, Körner C, de Boeck H,
Christensen JH, Leuzinger S, Janssens IA, Hansen K (2012) Precipitation manipulation
experiments—challenges and recommendations for the future. Ecol Lett 15:899–911
Bloor JMG, Pichon P, Falcimagne R, Leadley P, Soussana J-F (2010) Effects of warming, summer
drought, and CO2 enrichment on aboveground biomass production, flowering phenology, and
community structure in an upland grassland ecosystem. Ecosystems 13:888–900
Bobbink R, Hicks K, Galloway J, Spranger T, Alkemade R, Ashmore M, Bustamante M,
Cinderby S, Davidson E, Dentener F, Emmett B, Erisman J-W, Fenn M, Gilliam F,
Nordin A, Pardo L, de Vries W (2010) Global assessment of nitrogen deposition effects on
terrestrial plant diversity: a synthesis. Ecol Appl 20:30–59
Borken W, Matzner E (2009) Reappraisal of drying and wetting effects on C and N mineralization
and fluxes in soils. Glob Change Biol 15:808–824
Brancaleoni L, Gualmini M, Tomaselli M, Gerdol R (2007) Responses of subalpine dwarf-shrub
heath to irrigation and fertilization. J Veg Sci 18:337–344
Byrne KM, Lauenroth WK, Adler PB (2013) Contrasting effects of precipitation manipulations on
production in two sites within the Central Grassland Region, USA. Ecosystems 16:1039–1051
Cable JM, Ogle K, Williams DG, Weltzin JF, Huxman TE (2008) Soil texture drives responses of
soil respiration to precipitation pulses in the Sonoran Desert: implications for climate change.
Ecosystems 11:961–979
Chen S, Lin G, Huang J, Jenerette GD (2009) Dependence of carbon sequestration on the
differential responses of ecosystem photosynthesis and respiration to rain pulses in a semiarid
steppe. Glob Change Biol 15:2450–2461
Cherwin K, Knapp AK (2012) Unexpected patterns of sensitivity to drought in three semi-arid
grasslands. Oecologia 169:845–852
386
S. Unger and M. Jongen
Chou WW, Silver WL, Jackson RD, Thompson AW, Allen-Diaz B (2008) The sensitivity of
annual grassland carbon cycling to the quantity and timing of rainfall. Glob Change Biol
14:1382–1394
Collins SL, Sinsabaugh RL, Crenshaw C, Green L, Porras-Alfaro A, Stursova M, Zeglin LH
(2008) Pulse dynamics and microbial processes in aridland ecosystems. J Ecol 96:413–420
Collins SL, Koerner SE, Plaut JA, Okie JG, Brese D, Calabrese LB, Carvajal A, Evansen RJ,
Nonaka E (2012) Stability of tallgrass prairie during a 19-year increase in growing season
precipitation. Funct Ecol 26:1450–1459
Davidson EA, Janssens IA, Luo YQ (2006) On the variability of respiration in terrestrial ecosystems: moving beyond Q10. Glob Change Biol 12:154–164
de Dato GD, De Angelis P, Sirca C, Beier C (2010) Impact of drought and increasing temperatures
on soil CO2 emissions in a Mediterranean shrubland (gariga). Plant Soil 327:153–166
de Schrijver A, Verheyen K, Mertens J, Staelens J, Wuyts K, Muys B (2008) Nitrogen saturation
and net ecosystem production. Nature 451:E1. doi:10.1038/nature06578
Dijkstra FA, Augustine DJ, Brewer P, von Fischer JC (2012) Nitrogen cycling and water pulses in
semiarid grasslands: are microbial and plant processes temporally asynchronus? Oecologia
170:799–808
Dukes JS, Chiariello NR, Cleland EE, Moore LA, Shaw MR, Thayer S, Tobeck T, Mooney HA,
Field CB (2005) Responses of grassland production to single and multiple global environmental changes. PLoS Biol 3:1829–1837
Easterling DR, Evans JL, Groisman PY, Karl TR, Kunkel KE, Ambenje P (2000) Observed
variability and trends in extreme climate events: a brief review. Bull Am Meteorol Soc
81:417–442
Emmett BA, Beier C, Estiarte M, Tietema A, Kristensen HL, Williams D, Peñuelas J, Schmidt I,
Sowerby A (2004) The response of soil processes to climate change: results from manipulation
studies of shrublands across an environmental gradient. Ecosystems 7:625–637
Evans SE, Burke IC (2013) Carbon and nitrogen decoupling under an 11-year drought in the
shortgrass steppe. Ecosystems 16:20–33
Evans SE, Byrne KM, Lauenroth WK, Burke IC (2011) Defining the limit to resistance in a
drought-tolerant grassland: long-term severe drought significantly reduces the dominant species and increases ruderals. J Ecol 99:1500–1507
Faber-Langendoen D, Josse C (2010) World grasslands and biodiversity patterns. NatureServe,
Arlington, VA
Fan XH, Li YC, Alva AK (2011) Effects of temperature and soil type on ammonia volatilization
from slow-release nitrogen fertilizers. Commun Soil Sci Plant Anal 42:1111–1122
Fan J, Jones SB, Qi LB, Wang QJ, Huang MB (2012) Effects of precipitation pulses on water and
carbon dioxide fluxes in two semiarid ecosystems: measurement and modeling. Environ Earth
Sci 67:2315–2324
Fay PA, Carlisle JD, Knapp AK, Blair JM, Collins SL (2000) Altering rainfall timing and quantity
in a mesic grassland ecosystem: design and performance of rainfall manipulation shelters.
Ecosystems 3:308–319
Fay PA, Carlisle JD, Knapp AK, Blair JM, Collins SL (2003) Productivity responses to altered
rainfall patterns in a C4-dominated grassland. Oecologia 137:245–251
Fay PA, Blair JM, Smith MD, Nippert JB, Carlisle JD, Knapp AK (2011) Relative effects of
precipitation variability and warming on tallgrass prairie ecosystem function. Biogeosciences
8:3052–3068
February EC, Higgins SI, Bond WJ, Swemmer L (2013) Influence of competition and rainfall
manipulation on the growth responses of savanna trees and grasses. Ecology 94:1155–1164
Fernandez-Going BM, Harrison S (2013) Effects of experimental water addition depend on
grassland community characteristics. Plant Ecol 214:777–786
Fiala K, Tůma I, Holub P (2009) Effect of manipulated rainfall on root production and plant
belowground dry mass of different grassland ecosystems. Ecosystems 12:906–914
Consequences of Changing Precipitation Patterns for Ecosystem Functioning. . .
387
Fiala K, Tůma I, Holub P (2010) Interannual variability in plant below-ground biomass in a
mountain grassland affected by manipulated rainfall. Beskydy 3:133–138
Fiala K, Tůma I, Holub P (2012) Interannual variation in root production in grasslands affected by
artificially modified amount of rainfall. ScientificWorldJournal 2012:805298
Fierer N, Schimel JP (2003) A proposed mechanism for the pulse in carbon dioxide production
commonly observed following the rapid rewetting of a dry soil. Soil Sci Soc Am J 67:798–805
Flanagan LB, Adkinson AC (2011) Interacting controls on productivity in a northern Great Plains
grassland and implications for response to ENSO events. Glob Change Biol 17:3293–3311
Flanagan LB, Sharpa EJ, Letts MG (2013) Response of plant biomass and soil respiration to
experimental warming and precipitation manipulation in a Northern Great Plains grassland.
Agric For Meteorol 173:40–52
Fraser LH, Henry HAL, Carlyle CN, White SR, Beierkuhnlein C, Cahill JF, Casper BB, Cleland E,
Collins SL, Dukes JS, Knapp AK, Lind E, Long R, Luo Y, Reich PB, Smith MD, Sternberg M,
Turkington R (2013) Coordinated distributed experiments: an emerging tool for testing global
hypothesis in ecology and environmental science. Front Ecol Environ 11:147–155
Frich P, Alexander LV, Della-Marta P, Gleason B, Haylock M, Klein Tank AMG, Peterson T
(2002) Observed coherent changes in climatic extremes during the second half of the twentieth
century. Clim Res 19:193–212
Gherardi LA, Sala OE (2013) Automated rainfall manipulation system: a reliable and inexpensive
tool for ecologists. Ecosphere 4:article 18
Gilgen AK, Buchmann N (2009) Response of temperate grasslands at different altitudes to
simulated summer drought differed but scaled with annual precipitation. Biogeosciences
6:2525–2539
Grime JP, Brown VK, Thompson K, Masters GJ, Hillier SH, Clarke IP, Askew AP, Corker D,
Kielty JP (2000) The response of two contrasting limestone grasslands to simulated climate
change. Science 289:762–765
Grime JP, Fridley JD, Askew AP, Thompson K, Hodgson JG, Bennett CR (2008) Long-term
resistance to simulated climate change in an infertile grassland. PNAS 105:10028–10032
Harper CW, Blair JM, Fay PA, Knapp AK, Carlisle JD (2005) Increased rainfall variability and
reduced rainfall amount decreases soil CO2 flux in a grassland ecosystem. Glob Change Biol
11:322–334
Harpole WS, Potts DL, Suding KN (2007) Ecosystem responses to water and nitrogen amendment
in a California grassland. Glob Change Biol 13:2341–2348
Heisler-White JL, Knapp AK, Kelly EF (2008) Increasing precipitation event size increases
aboveground net primary productivity in a semi-arid grassland. Oecologia 158:129–140
Heisler-White JL, Blair JM, Kelly EF, Harmoney K, Knapp AK (2009) Contingent productivity
responses to more extreme rainfall regimes across a grassland biome. Glob Change Biol
15:2894–2904
Hoeppner SS, Dukes JS (2012) Interactive responses of old-field plant growth and composition to
warming and precipitation. Glob Change Biol 18:1754–1768
Holub P, Fabšičová M, Tůma I, Záhora J, Fiala K (2013) Effects of artificially varying amounts of
rainfall on two semi-natural grassland types. J Veg Sci 24:518–529
Hsu JS, Powell J, Adler PB (2012) Sensitivity of mean annual primary production to precipitation.
Glob Change Biol 18:2246–2255
Huxman TE, Smith MD, Fay PA, Knapp AK, Shaw MR, Loik ME, Smith SD, Tissue DT, Zak JC,
Weltzin JF, Pockman WT, Sala OE, Haddad BM, Harte J, Koch GW, Schwinning S, Small EE,
Williams DG (2004a) Convergence across biomes to a common rain-use efficiency. Nature
429:651–654
Huxman TE, Snyder KA, Tissue D, Leffler AJ, Pockman W, Ogle K, Sandquist D, Potts DL,
Schwinning S (2004b) Precipitation pulses and carbon balance in semi-arid and arid ecosystems. Oecologia 141:254–268
Inglima I, Alberti G, Bertoloni T, Vaccari FP, Giolo B, Miglietta F, Cortufo MF, Peressortti A
(2009) Precipitation pulse enhance respiration of Mediterranean ecosystems: the balance
between organic and inorganic components of increased soil CO2 efflux. Glob Change Biol
15:1289–1301
388
S. Unger and M. Jongen
IPCC (2012) Summary for policymakers. In: Field CB, Barros V, Stocker TF et al (eds) Managing
the risks of extreme events and disasters to advance climate change adaptation: a special report
of working groups I and II of the intergovernmental panel on climate change. Cambridge
University Press, Cambridge, pp 1–19
Jackson MB, Colmer TD (2005) Response and adaptation by plants to flooding stress. Ann Bot
96:501–505
Jackson LE, Strauss RB, Firestone MK, Bartolome JW (1988) Plant and soil nitrogen dynamics in
California annual grassland. Plant Soil 110:9–17
Jarvis PG, Rey A, Petsikos C, Wingate L, Rayment M, Pereira JS, Banza J, David JS, Miglietta F,
Borgetti M, Manca G, Valentini R (2007) Drying and wetting of Mediterranean soils stimulates
decomposition and carbon dioxide emission: the “Birch effect”. Tree Physiol 27:929–940
Jongen M, Caldeira MC, Pereira JS (2009) The effect of drought and subsequent precipitation
pulse on productivity, species composition, and carbon fluxes of the herbaceous understorey in
a cork oak woodland. Nat Prec. doi:10.1038/npre.2009.3706.1
Jongen M, Pereira JS, Aires LM, Pio CA (2011) The effects of drought and timing of precipitation
on the inter-annual variation in ecosystem-atmosphere exchange in a Mediterranean grassland.
Agric For Meteorol 151:595–606
Jongen M, Lecomte X, Unger S, Fangueiro D, Pereira JS (2013a) Precipitation variability does not
affect soil respiration and nitrogen dynamics in the understorey of a Mediterranean oak
woodland. Plant Soil 372:235–251
Jongen M, Lecomte X, Unger S, Pintó-Marijuan M, Pereira JS (2013b) The impact of changes in
the timing of precipitation on the herbaceous understorey of Mediterranean oak woodlands.
Agric For Meteorol 171–172:163–173
Jongen M, Unger S, Fangueiro D, Cerasoli S, Silva JMN, Pereira JS (2013c) Resilience of
montado understorey to experimental precipitation variability fails under severe natural
drought. Agric Ecosyst Environ 178:18–30
Jongen M, Unger S, Pereira JS (2013d) Effects of precipitation variability on carbon exchange in
the understorey of a nitrogen-limited montado ecosystem. Oecologia, submitted
Jump AS, Peñuelas J (2005) Running to stand still: adaptation and the response of plants to rapid
climate change. Ecol Lett 8:1010–1020
Keuper F, Parmentier F-JW, Blok D, van Bodegom PM, Dorrepaal E, van Hal J, van Logtestijn
RSP, Aerts R (2012) Tundra in the rain: differential vegetation responses to three years of
experimentally doubled summer-precipitation in Siberian shrub and Swedish bog tundra.
Ambio 41:269–280
Kieft TL, Soroker E, Firestone MK (1987) Microbial biomass response to a rapid increase in water
potential when dry soil is wetted. Soil Biol Biochem 19:119–126
Kim D-G, Vargas R, Bond-Lamberty B, Turetsky MR (2012) Effects of soil rewetting and thawing
on soil gas fluxes: a review of current literature and suggestions for future research.
Biogeosciences 9:2459–2483
Knapp AK, Smith MD (2001) Variations among biomes in temporal dynamics of aboveground
primary productivity. Science 291:481–484
Knapp AK, Fay PA, Blair JM, Collins SL, Smith MD, Carlisle JD, Harper CW, Danner BT, Lett
MS, McCarron JK (2002) Rainfall variability, carbon cycling, and plant species diversity in a
mesic grassland. Science 298:2202–2205
Knapp AK, Beier C, Briske DD, Classen AT, Luo Y, Reichstein M, Smith MD, Smith SD, Bell JE,
Fay PA, Heisler JL, Leavitt SW, Sherry RA, Smith B, Weng E (2008) Consequences of more
extreme precipitation regimes for terrestrial ecosystems. Bioscience 58:811–821
Knapp AK, Briggs JM, Smith MD (2012) Community stability does not preclude ecosystem
sensitivity to chronic resource alteration. Funct Ecol 26:1231–1233
Koerner SE, Collins SL, Blair JM, Knapp AK, Smith MD (2014) Rainfall variability has minimal
effects on grassland recovery from repeated grazing. J Veg Sci 25:36–44
Köppen W (1923) Die Klimate der Erde. Walter de Gruyter, Berlin
Consequences of Changing Precipitation Patterns for Ecosystem Functioning. . .
389
Kuzyakov Y, Gavrichkova O (2010) Time lag between photosynthesis and carbon dioxide efflux
from soil: a review of mechanisms and controls. Glob Change Biol 16:3386–3406
Laporte MF, Duchesne LC, Wetzel S (2002) Effect of rainfall patterns on soil surface CO2 efflux,
soil moisture, soil temperature and plant growth in a grassland ecosystem of northern Ontario,
Canada: implications for climate change. BMC Ecol 2:article 10
Li Y, Yang H, Xia J, Zhang W, Wan S, Li L (2011) Effects of increased nitrogen deposition and
precipitation on seed and seedling production of Potentilla tanacetifolia in a temperate steppe
ecosystem. PLoS One 6:e28601
Liu W, Zhang Z, Wan S (2009) Predominant role of water in regulating soil and microbial
respiration and their responses to climate change in a semiarid grassland. Glob Change Biol
15:184–195
Loik ME, Breshears DD, Lauenroth WK, Belnap J (2004) A multi-scale perspective of water
pulses in dryland ecosystems: climatology and ecohydrology of the western USA. Oecologia
141:269–281
Ma S, Baldocchi DD, Xu L, Hehn T (2007) Inter-annual variability in carbon dioxide exchange of
an oak/grass savanna and open grassland in California. Agric For Meteorol 147:157–171
Ma W, Liu Z, Wang Z, Wang W, Liang C, Tang Y, He J-S, Fang J (2010) Climate change alters
interannual variation of grassland aboveground productivity: evidence from a 22-year measurement series in the Inner Mongolian grassland. J Plant Res 123:509–517
MacDougall AS, McCann KS, Gellner G, Turkington R (2013) Diversity loss with persistent
human disturbance increases vulnerability to ecosystem collapse. Nature 494:86–89
Mariko S, Urano T, Asanuma J (2007) Effects of irrigation on CO2 and CH4 fluxes from
Mongolian steppe soil. J Hydrol 333:118–123
Matı́as L, Castro J, Zamora R (2012) Effect of simulated climate-change on soil respiration in a
Mediterranean-type ecosystem: rainfall and habitat-type are more important than temperature
or the soil carbon pool. Ecosystems 15:299–310
McCulley RL, Boutton TW, Archer SR (2007) Soil respiration in a subtropical savanna parkland:
response to water additions. Soil Sci Soc Am J 71:820–828
McCulley RL, Burke IC, Lauenroth WK (2009) Conservation of nitrogen increases with precipitation across a major grassland gradient in the Central Great Plains of North America.
Oecologia 159:571–581
McGraw J (1985) Experimental ecology of Dryas octopetala ecotypes, III. Environmental factors
and plant growth. Arct Alp Res 17:229–239
Meehl GA, Stocker TF, Collins WD, Friedlingstein P, Gaye AT, Gregory JM, Kitoh A, Knutti R,
Murphy JM, Noda A, Raper SCB, Watterson IG, Weaver AJ, Zhao Z-C (2007) Global climate
projections. In: Solomon S, Qin D, Manning M et al (eds) Climate change 2007: the physical
science basis. Contribution of working group I to the fourth assessment report of the intergovernmental panel on climate change. Cambridge University Press, Cambridge, pp 747–846
Meisner A, Bååth E, Rousk J (2013) Microbial growth responses upon rewetting soil dried for four
days or one year. Soil Biol Biochem 66:188–192
Merbold L, Ardo J, Arneth A, Scholes RJ, Nouvellon Y, de Grandcourt A, Archibald S, Bonnefond
JM, Boulain N, Brueggemann N, Bruemmer C, Cappelaere B, Ceschia E, El-Khidir HAM,
El-Tahir BA, Falk U, Lloyd J, Kergoat L, Le Dantec V, Mougin E, Muchinda M, Mukelabai
MM, Ramier D, Roupsard O, Timouk F, Veenendahl EM, Kutsch WL (2009) Precipitation as
driver of carbon fluxes in 11 African ecosystems. Biogeosciences 6:1027–1041
Miller ME, Belote RT, Bowker MA, Garman S (2011) Alternative states of a semiarid grassland
ecosystem: implications for ecosystem services. Ecosphere 2:article 55
Miranda JD, Padilla FM, Lázaro R, Pugnaire FI (2009) Do changes in rainfall patterns affect
semiarid annual plant communities? J Veg Sci 20:269–276
Miranda JD, Armas C, Padilla FM, Pugnaire FI (2011) Climatic change and rainfall patterns:
effects on semi-arid plant communities of the Iberian Southeast. J Arid Environ 75:1302–1309
Moreno M, Gulı́as J, Lazaridou M, Medrano H, Cifre J (2008) Ecophysiological strategies to
overcome water deficit in herbaceous species under Mediterranean conditions. Opt Médit
79:247–256
390
S. Unger and M. Jongen
Nagy L, Kreyling J, Gellesch E, Beierkuhnlein C, Jentsch A (2013) Recurring weather extremes
alter the flowering phenology of two common temperate shrubs. Int J Biometeorol 57:579–588
Nippert JB, Knapp AK, Briggs JM (2006) Intra-annual rainfall variability and grassland productivity: can the past predict the future? Plant Ecol 184:65–74
Niu S, Wu M, Han Y, Xia J, Li L, Wan S (2008) Water-mediated responses of ecosystem carbon
fluxes to climatic change in a temperate steppe. New Phytol 177:209–219
O’Brien MJ, Philipson CD, Tay J, Hector A (2013) The influence of variable rainfall frequency on
germination and early growth of shade-tolerant Dipterocarp seedlings in Borneo. PLoS One 8:
e70287
Ogle K, Reynolds FJ (2004) Plant responses to precipitation in desert ecosystems: integrating
functional types, pulses, thresholds, and delays. Oecologia 141:282–294
Olson JS, Watts JA, Allison LJ (1983) Carbon in live vegetation of major world ecosystems.
Report ORNL-5862. Environmental Sciences Division, Oak Ridge National Laboratory, Oak
Ridge, TN
Owens MK (2003) Approaches and techniques of rainfall manipulation. In: Weltzin JF,
McPherson GR (eds) Changing precipitation regimes and terrestrial ecosystems: a North
American perspective. University of Arizona Press, Tucson, AZ, pp 72–89
Parra A, Ramı́rez DA, Resco V, Velasco Á, Moreno JM (2012) Modifying rainfall patterns in a
Mediterranean shrubland: system design, plant responses, and experimental burning. Int J
Biometeorol 56:1033–1043
Parton W, Morgan J, Smith D, Del Grosso S, Prihodko L, Lecain D, Kelly R, Lutz S (2012) Impact
of precipitation dynamics on net ecosystem productivity. Glob Change Biol 18:915–927
Patrick L, Cable J, Potts D, Ignace D, Barron-Gafford G, Griffith A, Alpert H, van Gestel N,
Robertson T, Huxman TE, Zak J, Loik ME, Tissue D (2007) Effects of an increase in summer
precipitation on leaf, soil, and ecosystem fluxes of CO2 and H2O in a sotol grassland in Big
Bend National Park, Texas. Oecologia 151:704–718
Peñuelas J, Prieto P, Beier C, Cesaraccio C, de Angelis P, de Dato G, Emmett BA, Estiarte M,
Garadnai J, Gorissen A, Kovács Láng E, Kröel-Dulay G, Llorens L, Pellizzaro G, RiisNielsen T, Schmidt IK, Sirca C, Sowerby A, Spano D, Tietema A (2007) Response of plant
species richness and primary productivity in shrublands along a north-south gradient in Europe
to seven years of experimental warming and drought. Reductions in primary productivity in the
heat and drought year of 2003. Glob Change Biol 13:2563–2581
Poll C, Marhan S, Back F, Niklaus PA, Kandeler E (2013) Field-scale manipulation of soil
temperature and precipitation change soil CO2 flux in a temperate agricultural ecosystem.
Agric Ecosyst Environ 165:88–97
Potts DL, Huxman TE, Cable JM, English NB, Ignace DD, Eilts JA, Mason MJ, Weltzin JF,
Williams DG (2006a) Antecedent moisture and seasonal precipitation influence the response of
canopy-scale carbon and water exchange to rainfall pulses in a semi-arid grassland. New
Phytol 170:849–860
Potts DL, Huxman TE, Enquist BJ, Weltzin JF, Williams DG (2006b) Resilience and resistande of
ecosystem functional response to a precipitation pulse in a semi-arid grassland. J Ecol
94:23–30
Potts DL, Suding KN, Winston GC, Rocha AV, Goulden ML (2012) Ecological effects of
experimental drought and prescribed fire in a southern California coastal grassland. J Arid
Environ 81:59–66
Press MC, Potter JA, Burke MJW, Callaghan TV, Lee JA (1998) Responses of a subarctic dwarf
shrub heath community to simulated environmental change. J Ecol 86:315–327
Reichstein M, Bahn M, Ciais P, Frank D, Mahecha MD, Seneviratne SI, Zscheischler J, Beer C,
Buchmann N, Frank DC, Papale D, Rammig A, Smith P, Thonicke K, van der Velde M,
Vicca S, Walz A, Wattenbach M (2013) Climate extremes and the carbon cycle. Nature
500:287–295
Consequences of Changing Precipitation Patterns for Ecosystem Functioning. . .
391
Reyer CPO, Leuzinger S, Rammig A, Wolf A, Bartholomeus RP, Bonfante A, de Lorenzi F,
Dury M, Gloning P, Abou Jaoudé R, Klein T, Kuster TM, Martins M, Niedrist G, Riccardi M,
Wohlfahrt G, de Angelis P, de Dato G, François L, Menzel A, Pereira M (2013) A plant’s
perspective of extremes: terrestrial plant responses to changing climatic variability. Glob
Change Biol 19:75–89
Risch AC, Frank DA (2007) Effects of increased soil water availability on grassland ecosystem
carbon dioxide fluxes. Biogeochemistry 86:91–103
Robinson CH, Wookey PA, Lee JA, Callaghan TV, Press MC (1998) Plant community responses
to simulated environmental change at a high arctic polar semi-desert. Ecology 79:856–866
Sala OE, Lauenroth WK, McNaughton SJ, Rusch G, Zhang X (1996) Biodiversity and ecosystem
functioning in grasslands. In: Mooney HA, Cushman JH, Medina E, Sala OE, Schulze E-D
(eds) Functional roles of biodiversity: a global perspective. Wiley, Chichester, pp 129–149
Sala OE, Gherardi LA, Reichmann L, Jobbágy E, Peters D (2012) Legacies of precipitation
fluctuations on primary productivity: theory and data synthesis. Philos Trans R Soc B
367:3135–3144
Sardans J, Peñuelas J (2013) Plant-soil interactions in Mediterranean forest and shrublands:
impacts of climatic change. Plant Soil 365:1–33
Schwinning S, Sala OE (2004) Hierarchy of responses to resource pulses in arid and semi-arid
ecosystems. Oecologia 141:211–220
Sherry RA, Weng E, Arnone JA, Johnson DW, Verburg PS, Wallace LL, Luo Y (2008) Lagged
effects of experimental warming and doubled precipitation on annual and seasonal aboveground biomass production in a tallgrass prairie. Glob Change Biol 14:2923–2936
Shevtsova A, Haukioja E, Ojala A (1997) Growth response of subarctic dwarf shrubs, Empetrum
nigrum and Vaccinium vitis-idaea, to manipulated environmental conditions and species
removal. Oikos 78:440–458
Shinoda M, Nachinshonhor GU, Nemoto M (2010) Impact of drought on vegetation dynamics of
the Mongolian steppe: a field experiment. J Arid Environ 74:63–69
Singh JS, Lauenroth WK, Milchunas DG (1983) Geography of grassland ecosystems. Progr Phys
Geogr 7:46–80
Smith FM (1973) Abiotic functions in grassland ecosystems. In: van Dyne GM (ed) Analysis of
structure, function, and utilization of grassland ecosystems, vol 2, A progress report. Colorado
State University, Fort Collins, CO, pp 29–96
Song W, Chen S, Wu B, Zhu Y, Zhou Y, Li Y, Cao Y, Lu Q, Lin G (2012) Vegetation cover and
rain timing co-regulate the responses of soil CO2 efflux to rain increase in an arid desert
ecosystem. Soil Biol Biochem 49:114–123
Sternberg M (2011) Climate change in unpredictable terrestrial ecosystems: an integrative
approach along an aridity gradient in Israel. Paper presented at the 1st Interface workshop:
how do we improve earth system models: integrating earth system models, ecosystem models,
experiments and long-term data, February 28–March 3, Captiva Island, FL
Suseela VA, Conant RT, Wallenstein MD, Dukes JS (2012) Effects of soil moisture on the
temperature sensitivity of heterotrophic respiration vary seasonally in an old-field climate
change experiment. Glob Change Biol 18:336–348
Talmon Y, Sternberg M, Grünzweig JM (2011) Impact of rainfall manipulations and biotic
controls on soil respiration in Mediterranean and desert ecosystems along an aridity gradient.
Glob Change Biol 17:1108–1118
Thomey ML, Collins SL, Vargas R, Johnson JE, Brown RF, Natvig DO, Friggens MT (2011)
Effect of precipitation variability on net primary production and soil respiration in a
Chihuahuan Desert grassland. Glob Change Biol 17:1505–1515
Trenberth KE (2011) Changes in precipitation with climate change. Clim Res 47:123–138
Trenberth KE, Jones PD, Ambenje P, Bojariu R, Easterling D, Klein Tank A, Parker D,
Rahimzadeh F, Renwick JA, Rusticucci M, Soden B, Zhai P (2007) Observations: surface
and atmospheric climate change. In: Solomon S, Qin D, Manning M et al (eds) Climate change
2007: the physical science basis. Contribution of working group I to the fourth assessment
report of the intergovernmental panel on climate change. Cambridge University Press, Cambridge, pp 235–336
392
S. Unger and M. Jongen
Tůma I, Fiala K, Holub P, Záhora J (2009) Can soil properties in different grasslands be altered
after three years of experimentally manipulated rain? Beskydy 2:71–76
UNEP United Nations Environment Programme (1992) World Atlas of Desertification. Arnold A
(ed). UNEP, London, pp 69
Unger S, Máguas C, Pereira JS, David TS, Werner C (2010) The influence of precipitation pulses
on soil respiration—Assessing the “Birch effect” by stable carbon isotopes. Soil Biol Biochem
42:1800–1810
Unger S, Máguas C, Pereira JS, David TS, Werner C (2012) Interpreting postdrought rewetting
effects on soil and ecosystem carbon dynamics in a Mediterranean oak savannah. Agric For
Meteorol 154–155:9–18
Vargas R, Collins SL, Thomey ML, Johnson JE, Brown RF, Natvig DO, Friggens MT (2012)
Precipitation variability and fire influence the temporal dynamics of soil CO2 efflux in an arid
grassland. Glob Change Biol 18:1401–1411
Vázquez-de-Aldana BR, Garcı́a-Ciudad A, Garcı́a-Criado B (2008) Interannual variations of
above-ground biomass and nutritional quality of Mediterranean grasslands in Western Spain
over a 20-year period. Aust J Agric Res 59:767–779
Vicca S, Gilgen AK, Camino Serrano M, Dreesen FE, Dukes JS, Estiarte M, Gray SB,
Guidolotti G, Hoeppner SS, Leakey ADB, Ogaya R, Ort DR, Ostrogovic MZ, Rambal S,
Sardans J, Schmitt M, Siebers M, van der Linden L, van Straaten O, Granier A (2012) Urgent
need for a common metric to make precipitation manipulation experiments comparable. New
Phytol 195:518–522
Vicca S, Estiarte M, Bahn M, Peñuelas J, Janssens I (2013) Synthesizing effects of precipitation
manipulation on plant production and soil respiration—results and challenges. Geophys Res
Abstr 15:EGU2013-2363-2011
Vitousek PM, Howarth RW (1991) Nitrogen limitation on land and in the see: how can it occur?
Biogeochemistry 13:87–115
Vitousek PM, Hedin LO, Matson PA, Fownes JH, Neff J (1998) Within-system element cycles,
input-output budgets, and nutrient limitation. In: Pace ML, Groffmann PM (eds) Successes,
limitations, and frontiers in ecosystem science. Springer, New York, pp 432–451
Weijers S, Auliaherliaty L, van Logtestijn R, Rozema J (2013) Effects of manipulated precipitation and shading on Cassiope tetragona growth and carbon isotope discrimination: a high arctic
field study. Arct Antarc Alp Res 45:1–11
Weltzin JF, Loik ME, Schwinning S, Williams DG, Fay PA, Haddad BM, Harte J, Huxman TE,
Knapp AK, Lin G, Pockman WT, Shaw MR, Small EE, Smith MD, Smith SD, Tissue DT, Zak
JC (2003) Assessing the response of terrestrial ecosystems to potential changes in precipitation.
Bioscience 53:941–952
Wentz FJ, Ricciardulli L, Hilburn K, Mears C (2007) How much more rain will global warming
bring? Science 317:233–235
White RP, Murray S, Rohweder M (2000) Pilot analysis of global ecosystems: grassland ecosystems. World Resources Institute, Washington, DC
Whittaker RH, Likens E (1975) The biosphere and man. In: Lieth H, Whittaker RH (eds) Primary
productivity of the biosphere, ecological studies no. 14. Springer, Berlin
Wold S, Martens H, Wold H (1983) The multivariate calibration problem in chemistry solved by
the PLS method. In: Kågström B, Ruhe A (eds) Matrix pencils. Springer, Berlin, pp 286–293
Wold S, Sjöström M, Eriksson L (2001) PLS-regression: a basic tool of chemometrics. Chemometr
Intell Lab 58:109–130
Wu A, Dijkstra P, Koch GW, Peñuelas J, Hungate BA (2011) Responses of terrestrial ecosystems
to temperature and precipitation change: a meta-analysis of experimental manipulation. Glob
Change Biol 17:927–942
Xu L, Baldocchi DD (2004) Seasonal variation in carbon dioxide exchange over a Mediterranean
annual grassland in California. Agric For Meteorol 123:79–96
Consequences of Changing Precipitation Patterns for Ecosystem Functioning. . .
393
Xu X, Sherry RA, Niu S, Li D, Luo Y (2013) Net primary productivity and rain-use efficiency as
affected by warming, altered precipitation, and clipping in a mixed-grass prairie. Glob Change
Biol 19:2753–2764
Yahdjian L, Sala OE (2002) A rainout shelter design of intercepting different amounts of rainfall.
Oecologia 133:95–101
Yahdjian L, Sala OE (2010) Size of precipitation pulses controls nitrogen transformation and
losses in an arid Patagonian ecosystem. Ecosystems 13:575–585
Yahdjian L, Sala OE, Austin AT (2006) Differential controls of water input on litter decomposition and nitrogen dynamics in the Patagonian steppe. Ecosystems 9:128–141
Yan L, Chen S, Huang J, Lin G (2010) Differential responses of auto- and heterotrohpic soil
respiration to water and nitrogen addition in a semiarid temperate steppe. Glob Change Biol
16:2345–2357
Yan L, Chen S, Huang J, Lin G (2011a) Increasing water and nitrogen availability enhanced net
ecosystem CO2 assimilation of a temperate semiarid steppe. Plant Soil 349:227–240
Yan L, Chen S, Huang J, Lin G (2011b) Water regulated effects of photosynthetic substrate supply
on soil respiration in a semiarid steppe. Glob Change Biol 17:1990–2001
Zhou X, Sherry RA, An Y, Wallice LL, Luo Y (2006) Main and interactive effects of warming,
clipping, and doubled precipitation on soil CO2 efflux in a grassland ecosystem. Glob
Biogeochem Cy 20, GB1003. doi:10.1029/2005GB002526
Zhou X, Fei S, Sherry R, Luo Y (2012) Root biomass dynamics under experimental warming and
doubled precipitation in a tallgrass prairie. Ecosystems 15:542–554
Plant-Mediated Ecosystem Effects
of Tropospheric Ozone
Hans J. Weigel, Elke Bergmann, and Jürgen Bender
Contents
1
2
3
4
Introduction . . . . . . . . . . . . . . . . . . . . . . . . . . . . . . . . . . . . . . . . . . . . . . . . . . . . . . . . . . . . . . . . . . . . . . . . . . . . . . . . .
Ozone Levels: Trends and Variation in Space and Time . . . . . . . . . . . . . . . . . . . . . . . . . . . . . . . . . .
Methods to Study Ozone Impacts . . . . . . . . . . . . . . . . . . . . . . . . . . . . . . . . . . . . . . . . . . . . . . . . . . . . . . . . . .
Ozone Impacts at the Single Plant Level . . . . . . . . . . . . . . . . . . . . . . . . . . . . . . . . . . . . . . . . . . . . . . . . . . .
4.1 Deposition of O3 and Plant Uptake . . . . . . . . . . . . . . . . . . . . . . . . . . . . . . . . . . . . . . . . . . . . . . . . . .
4.2 Effects on Stomatal Functioning . . . . . . . . . . . . . . . . . . . . . . . . . . . . . . . . . . . . . . . . . . . . . . . . . . . . .
4.3 Physiological Effects . . . . . . . . . . . . . . . . . . . . . . . . . . . . . . . . . . . . . . . . . . . . . . . . . . . . . . . . . . . . . . . . . .
4.4 Effects on Growth and Reproduction . . . . . . . . . . . . . . . . . . . . . . . . . . . . . . . . . . . . . . . . . . . . . . . .
4.5 Abiotic and Biotic Factors Modifying O3 Responses . . . . . . . . . . . . . . . . . . . . . . . . . . . . . . .
5 O3 Impacts at the Ecosystem Level . . . . . . . . . . . . . . . . . . . . . . . . . . . . . . . . . . . . . . . . . . . . . . . . . . . . . . . .
5.1 Effects on Water Relations and Hydrology . . . . . . . . . . . . . . . . . . . . . . . . . . . . . . . . . . . . . . . . . .
5.2 Below-Ground Effects . . . . . . . . . . . . . . . . . . . . . . . . . . . . . . . . . . . . . . . . . . . . . . . . . . . . . . . . . . . . . . . .
5.3 Plant Competition and Community Composition . . . . . . . . . . . . . . . . . . . . . . . . . . . . . . . . . . .
5.4 Ecosystem Productivity . . . . . . . . . . . . . . . . . . . . . . . . . . . . . . . . . . . . . . . . . . . . . . . . . . . . . . . . . . . . . . .
6 Conclusions . . . . . . . . . . . . . . . . . . . . . . . . . . . . . . . . . . . . . . . . . . . . . . . . . . . . . . . . . . . . . . . . . . . . . . . . . . . . . . . . . .
References . . . . . . . . . . . . . . . . . . . . . . . . . . . . . . . . . . . . . . . . . . . . . . . . . . . . . . . . . . . . . . . . . . . . . . . . . . . . . . . . . . . . . . .
396
397
399
401
401
403
405
407
409
411
412
413
416
423
424
425
Abstract Tropospheric ozone (O3) is considered as the most significant phytotoxic
pollutant in the atmosphere and is already responsible for widespread effects on
crops, trees and native plant species. Globally, there is evidence that the background O3 concentrations are further increasing. Most research has been conducted
on plant and tree species of commercial value, but very little is known about the
impacts of O3 on the scale of forest-, agro- or grassland ecosystems. Exposure to
elevated O3 causes oxidative stress, which results in reduced photosynthesis, visible
injury, decreased growth and productivity. We present examples showing that
impacts of O3 on vegetation may lead to long-term effects on ecosystem structure
and function. Recent experiments have shown that O3 can cause a shift in plant
H.J. Weigel (*) • E. Bergmann • J. Bender
Thünen Institute of Biodiversity, Bundesallee 50, 38116 Braunschweig, Germany
e-mail: hans.weigel@ti.bund.de
© Springer International Publishing Switzerland 2015
U. Lüttge, W. Beyschlag (eds.), Progress in Botany, Progress in Botany 76,
DOI 10.1007/978-3-319-08807-5_15
395
396
H.J. Weigel et al.
species composition and can indirectly affect soil processes. Ozone has also been
shown to affect water cycling through its effect on stomata and can alter overall
ecosystem productivity.
1 Introduction
During the last 60 years tropospheric or ground-level ozone (O3) has emerged as an
air pollution problem of global dimension with respect to its harmful impacts on
human health and vegetation (Akimoto 2003; Royal Society 2008). As a secondary
air pollutant O3 is formed in the troposphere through a number of sunlight driven
photochemical reactions involving the main precursor substances: nitrogen monoand dioxide (NO/NO2), volatile organic compounds (VOC), methane (CH4) and
carbon monoxide (CO) (Staehelin 2001). These precursors are produced naturally
or emitted from anthropogenic activities such as vehicles, power plants, biomass
burning and all other forms of combustion.
Terrestrial ecosystems are the major sink for tropospheric O3 and consequently,
vegetation is at particular risk from this pollutant. Ozone enters the plant interior
through the stomata and as a strong oxidant O3 and its breakdown products,
respectively, are able to impact plants by altering plant cellular functions and by
reducing photosynthesis and changing other important physiological functions.
Collectively, this may result in visible leaf injury, growth and biomass reduction
and overall inferior plant vigour (Ashmore 2005; Booker et al. 2009; Matyssek
et al. 2010a, b). Whether or not these effects at the single plant level have
implications or are relevant in an ecosystem context is still a matter of debate
(Laurence and Andersen 2003).
In the past four decades O3 effects have been thoroughly investigated with crops
(reviewed by, e.g. Heagle 1989; Fiscus et al. 2005; Booker et al. 2009; Mills and
Harmens 2011) and particularly with deciduous and coniferous trees (reviewed
e.g. by; Sandermann et al. 1997; Percy et al. 2003a, b; Matyssek et al. 2010a, b,
2013). Other types of natural or semi-natural vegetation have only recently and to a
lesser extent received attention (reviewed by, e.g. Fuhrer 1997; Davison and Barnes
1998; Ashmore 2005; Hayes et al. 2007). While the interest related to O3 effects on
crops and commercially relevant trees was mainly driven by concerns about the
potential economic losses, the more recent emphasis in assessing its potential
effects on ecosystem integrity and related ecosystem functions and services is
based on concerns of the potential threats of O3 to the biodiversity of these habitats,
and the long-term, more subtle impacts on ecosystem functions and services such as
carbon sequestration, nutrient cycling, water relations and pollination.
While there is a wealth of information on O3 effects on plant metabolism and
plant growth, respectively (e.g. Fiscus et al. 2005; Heath 2008; Booker et al. 2009;
Cho et al. 2011), it is the intention of the present contribution to report on the
Plant-Mediated Ecosystem Effects of Tropospheric Ozone
397
progress that emerged from O3 effects research with different types of vegetation
during the last approx. 15 years with an emphasis on studies that addressed potential
implications of this pollutant in an ecosystem context. With this objective we will
not address and discuss the large body of information that has emerged during this
period with respect to adequate O3 risk assessments for vegetation, particularly with
regard to the progress that has been made in describing phytotoxically relevant
“absorbed O3 doses” by overcoming the concept of O3 exposure of vegetation
(e.g. Matyssek et al. 2013). Rather, we focus on a more qualitative description of
potential O3 effects on plants and ecosystems, respectively, primarily without
considering dose–response relationships.
In the following sections we first describe current and future O3 exposure
scenarios and the most common methods by which O3 effects on vegetation are
assessed. We then briefly summarise the current understanding of O3-induced
impairments at the individual plant level that are relevant for the understanding
of its ecosystem effects (Fig. 1). Predominately we then address selected examples
of how these O3 effects relate to the ecosystem level, and consider and discuss
results that are equally relevant for managed and unmanaged, natural ecosystems.
2 Ozone Levels: Trends and Variation in Space and Time
Naturally occurring O3 concentrations in the troposphere (ground-level) in the
pre-industrial era have been described to range between approx. 5–20 parts per
billion (ppb) (Marenco et al. 1994). Since the pre-industrial era the global annual
mean background O3 concentrations have increased considerably to values between
approx. >20–45 ppb depending on the geographical location (Vingarzan 2004)
with a rate of increase in the annual mean values ranging between 0.1 and 1.0 ppb
per year. This increase has been observed over large areas of Europe and North
America, and more recently in many countries in Asia (e.g. China, India, Pakistan),
South America (e.g. Brazil) and Africa with rapidly emerging industrialisation and
hence increasing emissions of precursors of O3. In these countries, O3 has reached
levels in ambient air which are of concern with respect to vegetation damage and
human health effects (Emberson et al. 2003; Royal Society 2008).
The pattern of O3 exposure of vegetation is changing on a global scale. While in
large parts of Western Europe, North America and Japan, a trend of decreasing
frequencies of O3 peak values (“photosmog episodes”) can be observed due to
control measures on the emission of the precursor compounds, background O3
values are increasing (Oltmans et al. 2006; Jonson et al. 2006). In the northern
hemisphere at mid-latitudes, mean values at background sites have been increasing
by 0.5–2 % per year (Derwent 2008). Future changes of the O3 levels will be
determined by the trends of the emissions of the precursors and of temperature and
solar radiation. Ongoing global population growth coupled to increasing demands
for resources such as land, fossil fuels and polluting activities like energy production, agriculture and transport will lead to enhanced production of natural and
398
H.J. Weigel et al.
Fig. 1 General scheme of major endpoints that are affected by O3 exposure at different levels of
biological organisation in plants and ecosystems
anthropogenic O3 precursors like VOC’s, NOx, CH4 and CO. Higher surface
temperatures along with climate change may also trigger the formation of surface
O3 levels. While predictive models, e.g. based on IPCC-SRES global emission
scenarios, indicate that background O3 concentrations will continue to increase at a
rate of 0.5–2 % per year in the Northern Hemisphere during the next 100 years and
will be in the range of ca. 42–84 ppb by 2100 (Prather et al. 2003; Vingarzan 2004;
Jacob and Winner 2009; Fig. 2), recent models predict more moderate increases of
O3 levels until 2050 (Wild et al. 2012). These changes of the global O3 exposure
will be accompanied by other predicted changes in atmospheric chemistry
(e.g. increasing atmospheric CO2 concentrations) and climate which again may
modify O3 effects in the future.
Plant-Mediated Ecosystem Effects of Tropospheric Ozone
January
399
January
80 º N
January
10
70
40
8
6
30
4
2
60
40 º N
50
40
0º
20
0
30
20
40 º S
–2
–4
10
–6
10
0
Latitude
–8
–10
0
80 º S
July
July
80 º N
July
10
75
40
8
6
30
4
2
65
40 º N
55
45
0º
20
0
10
–2
–4
35
25
40 º S
–6
15
0
–8
–10
0
80 º S
100 º W
0º
100 º E
100 º W
0º
100 º E
100 º W
0º
100 º E
Longitude
Fig. 2 Modelled surface O3 (ppb) in January and July from the present-day simulation (left) and
changes in surface O3 (ppb) between 2000 and 2100 due to anthropogenic emission changes
(right). Reprinted from Zeng et al. (2008)
Ozone concentrations influenced by human activities vary significantly with
time (diurnally, seasonally, inter-annually) and with geographic location. This
variability is of particular relevance for the effects on vegetation, as different
vegetation types or developmental stages of plants, respectively, may be exposed
to very different levels of O3 during the course of the year. As O3 formation is
dependent on sunlight and as some of the chemical reactions involved in the O3
formation in the troposphere are temperature-dependent, O3 concentrations are
particularly high at warm sunny days (Royal Society 2008). This link to the weather
conditions also contributes to the inter-annual variation of O3 concentrations. At
least in large parts of Europe, peak O3 concentrations occur especially in spring and
summer. While at low elevation sites O3 concentrations show diurnal cycles with
low concentrations during the night and in the morning and high and peak concentration during the afternoon, high elevation sites mostly do not show such distinct
diurnal variation (Stockwell et al. 1997). In general, at a particular location the
build-up of phytotoxic O3 concentrations depends on the local meteorology, the
topography and the regional sources of O3 precursors.
3 Methods to Study Ozone Impacts
The interpretation of plant responses to O3 to a large extend depends on the
methodology that is used to study its impacts. Therefore, a brief description of
the most prominent methods in O3 effects research is given here. Methods to
investigate O3 effects on vegetation can broadly be categorised into methods
involving experimental exposure to O3 and methods where plants are exposed to
O3 in ambient air. Each method has its particular advantages or disadvantages and
400
H.J. Weigel et al.
its usefulness depends on the questions to be addressed and the objectives and
budgetary circumstances of the respective study (Manning and Krupa 1992).
Experimental techniques to expose single plants, plant communities and segments
of ecosystems to modified O3 concentrations range from controlled environmental
chambers, greenhouses, field chambers to open-air O3 exposure systems. Most of
the information of the effects of O3 on plants is derived from the use of various
types of indoor and outdoor chambers.
Laboratory fumigation chambers of various designs (e.g. Heck et al. 1978; Payer
et al. 1993) which provide highly reproducible environmental and O3 exposure
conditions have widely been used for assessing visible injury or physiological and
biochemical O3 effects. However, due to different microclimatic conditions in the
chambers compared to open air (“chamber effects”), plants often show morphological or physiological differences compared to field-grown plants. Moreover,
laboratory chambers are limited in space and mostly only useful for small scale
pot or mesocosm studies. To overcome some of these limitations, open-top chambers (OTCs) were developed (Heagle et al. 1973) and have been the most widely
used O3 exposure system up to now (e.g. Heagle et al. 1988; Jäger et al. 1999;
Zheng et al. 2013; Oksanen et al. 2013; Burkart et al. 2013). In OTCs, plants can be
grown in their natural soil environment, in pots or as artificial model communities
(mesocosms). Air either enriched with O3 or filtered to remove O3 from ambient air
is introduced into the chamber with a blower system. Open-top chambers are best
suited for in situ studies with low stature vegetation, e.g. like most crop or grassland
species. As with the laboratory fumigation chambers for the interpretation of O3
effects, the chamber microclimate may interfere with O3 effects. For example,
when used in species-rich systems like in certain grasslands, the differences
between the ambient and OTC climate can lead to changes in vegetation structure
in the chambers in comparison to chamberless ambient air plots (Grünhage and
Jäger 2003).
To allow studies with taller trees, large versions of OTCs have been constructed
(Musselman and Hale 1997). According to Kolb and Matyssek (2001) chamber
studies with trees cover only a short period of the entire life history of a forest stand;
they are thus limited in predicting longer-term ecosystem effects of O3.
To overcome the various types of “chamber effects” in any kind of enclosure
system used for O3 effect studies and to overcome space limitations and restricted
plant root volumes, respectively, chamberless O3 exposure facilities have been
developed (McLeod 1995). The most often used chamberless exposure system for
O3 effect studies is a modification of the circular free air carbon dioxide enrichment
(FACE) system (Hendrey et al. 1999; Miglietta et al. 2001), which was modified to
dispense O3 into plant canopies. During the last two decades large-scale FACE-type
O3 exposure systems have been employed in O3 effects studies with crops like
soybean (Morgan et al. 2004), rice and wheat (Tang et al. 2011), and young tree
species (Karnosky et al. 1999). A similar custom-designed circular free air O3
exposure system was used by Volk et al. (2003) in a Swiss grassland system. A
free air O3 fumigation system in mature tree crowns of beech and spruce in
Germany was developed by Werner and Fabian (2002) and tested and used by
Plant-Mediated Ecosystem Effects of Tropospheric Ozone
401
Matyssek et al. (2010a, b, 2013). A similar system has recently been established in
northern Japan addressing potential impacts of O3 on deciduous oak and white birch
(Watanabe et al. 2013). FACE-type O3 exposure systems require sophisticated
infrastructures and can be only used to increase O3 levels in ambient air. In free
air O3 exposure systems, the coupling between the atmosphere and the plant canopy
as well as between the canopy and the respective soil volume largely remains
unchanged. Thus, in situ water and nutrient fluxes at the ecosystem level can be
investigated. Ideally, FACE type O3 exposure systems allow O3 effect research at
various hierarchical levels, for example, to link molecular biology with ecophysiological research.
Among the methods of O3 exposure where there is no manipulation of the O3
concentration surrounding the plants are ambient gradient studies. Plants or plant
community responses are examined along gradients of O3 concentrations across a
landscape or regional transect providing multiple levels of exposure to O3 that are
naturally occurring. Forest tree species and ecosystem responses to O3 in the USA
have been assessed using gradient studies (Winner et al. 1989; McLaughlin
et al. 2007a, b). Examples of other methods to assess O3 effects on plants are the
use of protecting chemicals against O3 stress (Manning et al. 2011), biomonitoring
techniques using indicator plants (Manning et al. 2002) and the use of plant growth
models (Martin et al. 2001; Hogsett et al. 2008).
4 Ozone Impacts at the Single Plant Level
Ozone impacts on ecosystems result from excessive uptake of O3 by plants, direct
toxicity and cell damage, or from indirect effects mediated by the individual
organisms. Although extrapolation of results from studies with individual plants
or plant assemblages to the ecosystem level is difficult to make, the knowledge of
the processes and mechanisms by which plants are affected by O3 is an essential
prerequisite to understand ecosystem responses to O3. In this section, we briefly
summarise the current understanding of the major mechanisms of O3 effects at the
individual plant scale governing vegetation response to O3 including uptake, altered
physiology such as stomatal functioning, photosynthesis, carbon allocation,
reduced growth (above- and below-ground) and reproduction. These individual
plant-scale responses to O3 in the short term may lead to long-term changes in
species and genetic composition, changes in water economy and functioning of
species communities and, hence, ecosystem structure and function (Sect. 5).
4.1
Deposition of O3 and Plant Uptake
Vegetation is an important natural sink for O3. Ozone is transferred from the
atmosphere onto plant canopies by turbulent diffusion (deposition), which is
402
H.J. Weigel et al.
Fig. 3 Major pathways of
the transfer of O3 to
terrestrial surfaces. The
uptake by vegetation is
attributed to both stomatal
and non-stomatal (external
plant surfaces and soil)
deposition. The thickness of
the arrows denotes the
relative importance of the
respective pathway.
Reprinted with permission
from Dr. Lisa Emberson,
SEI York, UK
governed by micro-meteorological conditions (radiation, temperature, wind, etc.)
and the roughness of the vegetation. The uptake of O3 by vegetation is attributed to
both non-stomatal and stomatal deposition (Fig. 3). Non-stomatal deposition
includes deposition to soil, stems, cuticles and other external surfaces. It has long
been known (Kerstiens and Lendzian 1989; Massman and Grantz 1995) that
penetration of O3 through the plant cuticle is of minor importance in comparison
to the route of uptake through the stomata. This transfer of the gas through the
atmosphere (turbulent diffusion) into the plant via molecular diffusion through the
stomata is currently considered the key process in relating O3 exposure to plant
responses (Fowler et al. 2009; Fig. 3). Consequently, all environmental factors that
modify the stomatal aperture (e.g. temperature, light and soil water conditions,
other pollutants, atmospheric CO2 concentration) and which thus affect leaf gas
exchange have an influence on the uptake of O3 into the plant interior (Fiscus
et al. 2005; Fuhrer 2009).
Field measurements of O3 deposition (flux) in various ecosystems indicate that
total dry deposition is largely dominated by stomatal uptake during the most active
parts of the growing season, but, at other times of the year and depending on
vegetation type and weather conditions, non-stomatal deposition can be larger
than stomatal uptake (Cieslik 2004; Cape et al. 2009). For example, continuous
multi-year O3 flux measurements over moorland vegetation in Scotland indicated
that over a seasonal scale non-stomatal deposition dominated the overall O3 flux
and represented 70 % of the total O3 deposition (Fowler et al. 2001). Nunn
et al. (2010) compared sap flow measurements—i.e. tree level transpiration—and
eddy co-variance approaches—i.e. stand level transpiration—in mixed beech/
spruce stands and found that stomatal O3 flux amounted to 33 % of the total stand
O3 flux. The concentration of O3 diminishes as one moves down a canopy to the
soil. In addition, gas-phase reactions between O3 and biogenic volatile organic
compounds (BVOCs) and nitric oxide (NO) emitted from the ecosystem contribute
to the removal of O3 from the atmosphere (Fares et al. 2010). Canopy architecture
and the density of the foliage may also determine to which O3 concentration
Plant-Mediated Ecosystem Effects of Tropospheric Ozone
403
individual leaves are finally exposed. For example, in comparison to dense plant
canopies, in open canopies like in widely spaced crop rows leaves inside the canopy
will be exposed to similar O3 concentration as at the canopy surface.
4.2
Effects on Stomatal Functioning
There has been long-term and widespread evidence that elevated O3 levels alter
stomatal performance and hence stomatal conductance (gs) of various plant species
(Darrall 1989; Mansfield 1998; Robinson et al. 1998). However, the type of
stomatal responses to O3 exposure is still not fully clear. While high O3 concentrations appear to reduce gs, there are variable results under more moderate O3
levels, i.e. those resembling current ambient conditions (Paoletti and Grulke 2005;
Wittig et al. 2007). For example, under chronic exposure conditions O3 may lead
either to enhanced stomatal aperture and a delayed stomatal closure during the night
or to a reduction of the stomatal conductance. Moreover, exposure to O3 has been
shown to aggravate the heterogeneous stomatal aperture across the leaf surface,
which is known as patchiness (Beyschlag and Eckstein 1998). This increase of
stomatal patchiness upon O3 exposure implies that only the integrated response of
groups of stomata will determine the response to O3 at the larger scales of the total
plant and the canopy, respectively (Paoletti and Grulke 2005).
Stomata closure and reduced gs due to O3 exposure are often found when
measured under steady-state high light conditions. In a recent meta-analysis (Wittig
et al. 2007), which compiled results of 73 primary research articles of O3 effects on
photosynthesis and gs of various tree species, the authors found that the O3 levels in
the atmosphere today suppresses gs by, on average, 13 % compared to pre-industrial
O3 levels. When ambient background versus elevated O3 was compared, gs
decreased by 6 % in the elevated O3 treatment. Evidence for an O3-induced
stomatal closure is also available from recent studies with crops under chamberless
O3 exposure (Morgan et al. 2003; Kitao et al. 2009). Current assumptions of the
possible mechanisms that may explain O3-induced stomatal closure include
(1) reduced photosynthesis and increased substomatal CO2 concentration, (2) direct
impact on guard cells, (3) altered calcium homeostasis or (4) altered hormone
production (McAinsh et al. 2002; Wittig et al. 2007; Wilkinson and Davies
2010). Overall, this kind of stomatal responses implies that plants are protected
from water loss.
However, often the measurements of gs were carried out under conditions that
normally do not prevail in the field in the course of a day, i.e. high light and steadystate vapour pressure deficit. Consequently, when measurements are compared that
were carried out under more variable environmental conditions, stomatal aperture
was not uniformly decreased by O3 during the day. Such a “sluggish” stomatal
response has long been known (Keller and Häsler 1984) and describes the delay in
stomatal response to changing environmental factors relative to controls (Paoletti
and Grulke 2010). Sluggish stomatal responses have been observed in O3 effect
404
H.J. Weigel et al.
studies, e.g. with tree (Wallin and Skarby 1992; Matyssek et al. 1995; Grulke
et al. 2007) or grass species (Mills et al. 2009). Thus, if stomata fail to close
under low light or water-stressed conditions, water loss may be greater over time.
In other situations, it is possible that sluggish stomata may fail to completely open
in response to environmental stimuli and result in decreased water loss.
As O3 may affect plant stomata in relation to the response to other environmental
variables like vapour pressure deficit, drought and light (Uddling et al. 2009;
McAinsh et al. 2002; Paoletti and Grulke 2010), the resulting stomatal sluggishness
may result in increasing gs and hence increased water use under conditions which
normally induce stomatal closure (e.g. drought, high vapour pressure deficit and
low light). Such an increase of gs even under reduced water supply in response to O3
exposure was observed in several recent studies with grassland species (Mills
et al. 2009; Wilkinson and Davies 2010; Hayes et al. 2012). It was suggested that
O3 can prevent stomatal closure under drought by altering the sensitivity of stomata
to abscisic acid, a plant hormone stimulating stomatal closure under drought
conditions (Wilkinson and Davies 2010; Wilkinson et al. 2012).
There are also recent research results, where O3 apparently has no effects on
stomata at all. In a multi-year FACE-type exposure of soybean to O3 concentrations
predicted by approx. 2050, there were no significant effects on midday gs, and no
effects on instantaneous gs on 13 of the 15 measurement days (Bernacchi
et al. 2006).
Ozone-induced physiological changes, such as reduced leaf area index and
accelerated leaf senescence, have also been suggested to have an effect on wateruse efficiency of plants. For example, some previous and more recent chamber and
field studies have shown that that O3 exposure is correlated with lower foliar
retention (e.g. Karnosky et al. 1996, 2003; Topa et al. 2001).
Overall, there is still a high variability in the results of stomata responses to an
O3 exposure (Table 1). Thus, a better understanding of O3 effects on leaf stomatal
Table 1 Summary of studies investigating O3 effects on stomatal functioning in trees, crops and
grassland species [after Mills et al. (2013)]
Crops (no. of species)
Crops (no. of experiments)
Trees (no. of species)
Trees (no. of experiments)
Grasslands (no. of species)
Grasslands (no. of expts.)
Total (no. of species)
Total (no. of experiments)
Ozone range (ppb) (25th to
75th percentile)
Mean ozone concentration
Total
number
No
effect
Sluggish
control
Increased
opening
Stomatal
closing
16
22
44
60
8
11
68
93
1
2
12
12
2
2
15
16
35–80
2
2
4
10
1
1
7
13
70–120
1
1
13
17
2
5
16
23
50–90
12
17
15
21
3
3
30
41
59–100
59 ppb
91 ppb
67 ppb
89 ppb
Plant-Mediated Ecosystem Effects of Tropospheric Ozone
405
functioning remains a challenge, as this type of O3 impacts on plants may have
wider implications for the overall hydrology at the ecosystem level (see Sect. 5.1).
4.3
Physiological Effects
Once O3 molecules have passed the stomatal pore, its subsequent effects on the
plant include reactions with the apoplastic fluid and generation of reactive oxygen
species (ROS), effects on the cell membrane structure and function, changes of cell
metabolism and cellular events, which finally result in the generation of observable
plant responses like chlorotic or necrotic tissue damage, reduced photosynthesis,
temporal shifts in the plant’s development and losses in productivity (Cho
et al. 2011; Dizengremel et al. 2013; Fig. 1).
In the substomatal cavity O3 rapidly reacts with water which results in the
generation of ROS like hydrogen peroxide, singlet oxygen and hydroxyl radicals
and with various compounds in the adjacent cell walls or on their outer cell
membranes (Iriti and Faoro 2008). Based on this rapid chemical turnover, it has
long been assumed that the O3 concentration in the substomatal cavity is close to
zero (Laisk et al. 1989); however, there is no unequivocal evidence for this
assumption. According to the present understanding the reaction products of O3
with the apoplastic fluid and with various biomolecules, respectively, are assumed
to interfere with a signalling pathway of the plant cell which is related to cell death
and which is triggered by ROS (e.g. Baier et al. 2005; Kangasjarvi et al. 2005; Cho
et al. 2011). Apoplastic antioxidants (e.g. ascorbic acid, glutathione), the role of
which is to protect cell membranes from a ROS attack, can interfere with O3 or its
reaction products. For example, reaction with the apoplastic acorbate pool seems to
be a particular important process for ROS detoxification and is believed to be the
first line of defence against O3 injury, although other defence compounds may also
be involved (Fiscus et al. 2005; Fuhrer 2009). Detoxification occurs from both
existing antioxidants and those stimulated by O3 itself. Defence reactions require
energy for regeneration of antioxidants, i.e. particularly at prolonged O3 exposure
detoxification capacity may decline due to decreased rates of carbon assimilation
and limited available energy (Wieser and Matyssek 2007). In general, cell injury or
death of plant tissues occurs when the O3 uptake exceeds the detoxification capacity. ROS that remain unscavenged can cause a variety of leaf injury symptoms such
as necrotic stippling, bronzing, chlorosis or premature senescence.
Visible injury resulting from ambient O3 pollution has been observed on a wide
range of plant species including trees, crops and species of semi-natural vegetation
in North-America and in Europe (Flagler 1998; Innes et al. 2001; Mills et al. 2010)
and is usually classified as acute or chronic. While acute injury involves the death of
the cells and develops within a few hours or days following exposure to high
pollutant levels, chronic injury typically develops more slowly within days or
weeks following O3 exposure. While on broad-leaved plants visible injuries include
stippling, flecking, surface bleaching, bifacial necrosis, pigmentation
406
H.J. Weigel et al.
(e.g. bronzing) and chlorosis, for conifers visible injury includes chlorotic banding,
tip-burn, flecking and chlorotic mottling (Flagler 1998). For both plant types
O3-induced symptoms of premature senescence of leaves and needles, respectively,
can be observed. These foliar lesions can vary between and within taxonomic
groups and the degree and extent of visible foliar injury development may vary
from year to year and site to site. The extent of O3-induced visible foliar injury is
often related to the amount of soil moisture available to the respective plants during
the year in which the visible foliar injury is being assessed. As drought conditions
generally decreases stomatal conductance and limit the amount of O3 entering the
plant leaf, the result can be less injury. Several studies have shown that dry periods
in local areas tend to decrease the incidence and severity of O3-induced visible
foliar injury (Matyssek et al. 2006; Grulke et al. 2003). Therefore, the incidence of
visible foliar injury is not always higher in years and areas with higher O3.
Ozone-induced visible injury is of particular significance when the quality and
the marketable value of a plant depend on the appearance of the foliage. Such O3
damage has been observed on a number of horticultural crops in several countries
(Fumagalli et al. 2001; Kostka-Rick et al. 2002; Sheu and Liu 2003).
At chronic O3 exposure, visible injury is often not observed, but decreased rates
of CO2 assimilation indicate adverse O3 effects on plant vitality. The response of
photosynthesis to O3 has received much attention in order to explain O3-induced
losses of plant productivity in a wide variety of tree and crop species as well as in
grassland and other native plant species (Reich 1987; Morgan et al. 2003; Fiscus
et al. 2005; Wittig et al. 2007; Booker et al. 2009; Fuhrer 2009). It may be assumed
that plant growth retardation under longer-term O3 exposure at moderately
enhanced concentrations is mostly the result of reduced rates of assimilation at
the leaf level, although within-tree alterations of carbon allocation due to disturbed
phytohormonal regulation have also been shown to affect tree growth (Winwood
et al. 2007; Kitao et al. 2012). For example, a recent analysis of results from
different experimental O3 fumigation studies with tree species covering ambient
or near-ambient O3 concentrations revealed that O3 levels of approximately 40 ppb
can suppress net assimilation rate on average by 11 % compared with pre-industrial
(10 ppb) O3 exposure conditions (Wittig et al. 2007). Summarising 53 O3 exposure
studies with soybean in a meta-analytic approach Morgan et al. (2003) found a
ca. 20 % reduction in net assimilation rate due to an average O3 exposure of 70 ppb.
The impairment of photosynthesis by O3 has been attributed to effects on the
electron transport system (light reactions), a decline in the efficiency of carboxylation (dark reactions), and indirect effects on stomata, i.e. lower rates of diffusion of
CO2 into the leaf interior (Paoletti and Grulke 2005).
Recent studies with plants of natural ecosystems (Scebba et al. 2006), tree
species (maple: Calatayud et al. 2007) and crops (tomato: Degl’Innocenti
et al. 2007; soybean: Singh et al. 2009), particularly using chlorophyll fluorescence
as a measurement tool, have shown that O3 can alter photosynthetic processes at the
level of the electron transport. The effects were connected with decreases in leaf
chlorophyll content, reduction in the efficiency of excitation capture, reduced
Plant-Mediated Ecosystem Effects of Tropospheric Ozone
407
numbers of intact or open photosystem II reaction centres or increases in dissipation
of energy through heat.
However, loss of carbon assimilation capacity is mostly considered as the
primary reason for a decline of photosynthesis under O3 exposure. This reduction
in carbon assimilation is primarily the result of an O3-induced decline in the amount
and activity of Rubisco (Long and Naidu 2002; Matyssek and Sandermann 2003;
Singh et al. 2009). Both, a decrease in Rubisco synthesis and an enhanced degradation of the protein contribute to the measured reduction in its quantity. This
impairment of Rubisco is accompanied by a loss of the mRNA coding for the small
(rbcS) and large (rbcL) subunits of the enzyme. For example, declines in rbcS
mRNA were measured in beech saplings in a free air O3 exposure system (Olbrich
et al. 2009). Effects of O3 on proteins involved in carbon assimilation have also
been observed, as reductions in quantities of the small and large subunit (rbcL) of
Rubisco and Rubisco activase were measured in soybean plants exposed to 120 ppb
O3 for 3 days (Ahsan et al. 2010). Similar results were observed with wheat
(approx. 70 ppb O3 for 50 days for 5 h day 1) (Sarkar and Agrawal 2010).
Overall recent research results confirm earlier studies that decreased photosynthesis is commonly observed in plants grown under elevated O3 concentration.
Although many different changes are observed in the photosynthetic apparatus,
decreased activity and amount of Rubisco appear to be the prevailing causes of loss
of photosynthetic capacity.
4.4
Effects on Growth and Reproduction
Reduced photosynthesis due to an O3 exposure may finally result in decreased
growth rates and reduced overall plant productivity. Along with these effects
impaired translocation of assimilates from source (e.g. leaves) to sink (e.g. roots;
seeds) organs and early senescence likely contribute to O3 effects on plant growth
and reproduction. In particular, O3 exposure has been shown to reduce the allocation of carbohydrate from shoots to roots and thus lower the root/shoot biomass
ratio (fraction of total biomass in root tissue) (Cooley and Manning 1987), an effect
that may have wider implications for below ground processes in the plant’s
environment (see Sect. 5.2) Several recent meta-analyses have summarised the
available information across various types of plants (trees, crops, grassland and
native species) and O3 exposure conditions (Morgan et al. 2003; Grantz et al. 2006;
Wittig et al. 2009; Wang and Taub 2010). For example, according to the literature
compilation of Grantz et al. (2006), who used a root:shoot allometric coefficient k,
which is the relative ratio growth rate of the root and shoot, to describe O3 effects,
O3 reduced k on average by 5.6 %. Out of 125 observations of changes in k, 55 %
yielded a decrease in k. However, about a third of all observations yielded an
increase in k. Wang and Taub (2010) examined root mass fraction (i.e. the fraction
of root to total biomass) of mostly herbaceous and a few woody species and found
that, on average, O3 reduced biomass allocation by 8.5 %. Wittig et al. (2009)
408
H.J. Weigel et al.
focused on tree species only and concluded from their analysis that the root-toshoot ratio indicated a greater sensitivity to O3 than shoot production. Their results
also pointed to a greater sensitivity of angiosperm species in comparison to
gymnosperms, which may have wider implications for community persistence
(see Sect. 5.3). On the other hand, there are also reports of positive O3 effects on
root biomass production and root-to-shoot ratios especially in tree species
(Pregitzer et al. 2008; Matyssek et al. 2010a, b). Overall, although the results of
the majority of investigations point to a reduction of carbon allocation to roots,
there is still uncertainty as such an effect depends on the respective O3 concentration, the duration of exposure, the plant species or genotype, respectively, and on
modifying factors of other growth variables. For example, already Maurer and
Matyssek (1997) pointed out that the outcome of an O3 effect on the root/shoot
ratio of birch trees may be co-determined by the nutritional status of the respective
plants.
There has been clear evidence over the last years that exposure to O3 decreases
growth in numerous plants representing important species of agro- and forest
ecosystems as well as of different natural ecosystems. Wittig et al. (2009), for
example, analysed growth responses of forest species from 263 studies over the past
40 years and found that elevated O3 concentrations (97 ppb) decreased annual total
biomass growth by 11–17 %. The decreased effect at current ambient concentrations as reported in these studies was 7 %. Detrimental O3 effects on growth and
yield of the major global food crop species, such as wheat, rice, soybean and cotton,
have repeatedly been described (e.g. Heagle 1989; Morgan et al. 2003; Fiscus
et al. 2005; Ashmore 2005; Ainsworth 2008; Booker et al. 2009). Mills
et al. (2007) analysed O3 exposure-response data for 19 agricultural and horticultural crops, respectively, and identified wheat, water melon, pulses, cotton, turnip,
tomato, onion, soybean and lettuce as the most O3-sensitive crops, while, for
instance, barley was classified as O3 resistant. Morgan et al. (2003) calculated an
average yield loss of soybean of 24 % compared to charcoal-filtered air with small
losses (approx. 8 %) at low (30–60 ppb) and high losses (approx. 35 %) at high (80–
120 ppb) O3 concentrations when they compiled 53 studies which included chamber and open-air O3 exposure studies. Feng et al. (2008) calculated yield losses of
winter and spring wheat ranging from 20 % at 42 ppb (7-h daily average) to 60 % at
153 ppb. According to a review of rice studies by Ainsworth (2008), average rice
yields declined by 14 % when exposure to O3 at a concentration of 62 ppb was
compared to charcoal-filtered air. Despite this evidence of negative O3 effects, one
of the most common observations in studies with crop species is that there is
considerable genotypic variability in O3 sensitivity, suggesting that there is potential to breed for O3 tolerance (Ainsworth et al. 2008; Booker et al. 2009). Production
of biomass in grassland or pasture plants can also be negatively influenced by O3
(Fuhrer 1997, 2009), but for species grown in mixtures other endpoints than
biomass growth such as seed output or species composition may be important
(see Sect. 5.3).
Studies conducted during the last three decades have repeatedly demonstrated
that various stages of reproductive development are clearly sensitive to O3. A recent
Plant-Mediated Ecosystem Effects of Tropospheric Ozone
409
meta-analysis of O3 effects on reproductive growth and development of various
plant species indicated that current ambient O3 concentrations significantly reduced
seed number, fruit number and fruit weight, while there was a trend towards
increasing flower number and flower weight at elevated O3 (Leisner and Ainsworth
2012). Negative effects on the reproductive performance in response to O3 may
result from a reduction in plant growth, a decreased reproductive allocation or from
direct effects on reproductive structures (Black et al. 2000). Bender et al. (2006a)
observed contrasting effects on resource allocation to the vegetative and reproductive organs of 17 herbaceous species that were exposed to different O3 regimes from
the seedling stage to the flowering stage. Although O3 caused comparable reductions in both vegetative and reproductive growth in the majority of the investigated
species, three species (Chenopodium album, Matricaria discoidea, Stellaria media)
showed a greater vegetative growth and reduced reproductive allocation. Germinability of the seeds was affected by O3 such that germination rate was up to 30 %
lower in O3-treated plants compared to control plants (Bender et al. 2006a). Similarly, Darbah et al. (2008) investigated the effects of elevated O3 on reproductive
fitness in paper birch (Betula papyrifera) under free air O3 exposure. Elevated O3
increased flowering, but decreased seed weight and germination rate. These results
suggest that O3 can significantly affect resource allocation patterns and reproductive fitness which may have significant implications for the establishment and
survival of the progeny and hence for plant productivity and composition of plant
communities under the influence of O3 (see Sect. 5.3).
Any impact of O3 exposure on the timing of flowering may also play an
important role in reproductive success, particularly for species in which flowering
is closely synchronised with pollinating species (Black et al. 2000; Hayes
et al. 2012). However, the impact of O3 on the timing of flowering varies markedly
between species. Such O3 effects have particularly been investigated in herbaceous
species of grassland and ruderal ecosystems. For example, O3 exposure has been
reported to delay flowering in two species (Campanula rotundifolia and Vicia
cracca) of simulated meadow community mesocosms (Rämö et al. 2007). In
mesocosms representing “calcareous grassland”, O3 has been found to accelerate
the timing of the maximum number of flowers in Lotus corniculatus (Hayes
et al. 2012). By contrast, Bergmann et al. (1996) showed that the timing of
flowering and seed set in 17 wild plant species were not significantly influenced
by season-long exposure to 1.5 ambient O3 concentration in OTCs. However,
O3-induced changes in flowering timing could have large ecological impacts on
plant pollination and the food supply of nectar feeding insects.
4.5
Abiotic and Biotic Factors Modifying O3 Responses
There are complex interactions between O3 effects on plants and other abiotic and
biotic factors, as O3 effects may be modified by these factors or O3 itself may
modify plant responses to these other factors. Important abiotic modifiers are
410
H.J. Weigel et al.
temperature, humidity, light, water and nutrient availability, the occurrence of other
air and soil pollutants and altered atmospheric chemistry (e.g. CO2 concentration).
On the other hand, biotic factors that interfere with O3 effects are insect pests and
other diseases or pathogens and root microorganisms, resulting in either detrimental
biological effects or mutually beneficial relationships (e.g. root nodulation by
Rhizobium; mycorrhizal infection). There is a very large body of previous information ranging from controlled environment to field experimentation that has
investigated these interactions. Although these modifying factors may be of particular relevance for an assessment of O3 cause–effect relationships at the ecosystem
level, the vast scope of their possible interactions cannot be listed here in detail.
Rather, we will provide a brief summary evaluation on important modifying factors
of O3 effects based on recent studies.
Light, temperature and air humidity are prominent abiotic factors that interfere
with O3 effects. Increased light intensity has been claimed to increase the sensitivity
to O3 of light-tolerant species while decreasing that of shade-tolerant species; this
assumption has many exceptions (Topa et al. 2001). While previous studies
revealed little modifying influence of temperature, some recent field studies have
indicated that O3 impact significantly increases with increased ambient temperature
(Mills et al. 2000). On the other hand, there is no new evidence to contradict that O3
enhances the sensitivity of plants to low temperature stress. It is also known that air
humidity enhances the adverse effects of O3 by affecting stomatal conductance and
thereby increasing O3 flux into the plant. For the current understanding of
O3 drought interactions refer to Sect. 4.2.
It has also long been known that the nutritional status of plants can influence its
response to O3; however, the interaction of O3 with specific nutrients is still
contradictory. While some experiments point to higher sensitivity towards O3
under low nutrient supply, other research results with trees suggest that O3 and
nutrient supply do not interact. With respect to forest and other nutrient poor
ecosystems, the co-occurrence of nitrogen (N) deposition and O3 impacts are of
particular concern. Generally, existing information including several more recent
studies with tree (Handley and Grulke 2008; Thomas et al. 2006; Watanabe
et al. 2007) and pasture species (Bassin et al. 2007b; Volk et al. 2011; Wyness
et al. 2011) shows that the interactive effects of N deposition and O3 vary among
species and ecosystems, i.e. there is no consistent information whether N deposition
either enhances O3 toxicity or increases tolerance of plants towards O3 stress. There
are hardly any recent studies on interactions of other air pollutants such as sulphur
dioxide or nitrogen oxide with O3.
Along with the increasing concern about climate change effects on ecosystems
during the last decades, research into O3 interactions particularly with elevated
atmospheric CO2 concentrations [eCO2] has increased (Fuhrer 2003; Paoletti and
Grulke 2005; Lindroth 2010). As [eCO2] is known to stimulate photosynthesis, to
decrease stomatal conductance and mostly to enhance plant growth, while O3 has
negative impacts on photosynthesis and plant growth, interactions between the two
gases can be expected. Consistent across different vegetation types and derived
from various experimental approaches, there is evidence that [eCO2] has the
Plant-Mediated Ecosystem Effects of Tropospheric Ozone
411
potential to mitigate negative effects of O3, mainly due to a CO2-induced reduction
in stomatal conductance, which reduces O3 uptake. On the other hand, negative O3
effects limit positive responses to [eCO2] in many plants as well (Fiscus
et al. 2005). While the CO2 O3 interaction is of little relevance for the current
ambient conditions, it may be suggested that the continuing future increase of the
CO2 component of climate change may be ameliorative for the effects of O3.
Among the interactions of O3 with biotic factors, plant pathogens and insect
pests have repeatedly been studied in various experimental approaches (Percy
et al. 2003a, b; Eastburn et al. 2011). While it may be assumed that reduced plant
vigour due to O3 stress can make plants more susceptible to plant pathogens,
general predictions of O3 effects on particular plant–pathogen systems are difficult
to make, because the available data for specific pests and diseases remain controversial. With respect to agricultural plants there is no fundamentally new recent
information to replace the summary by Manning and von Tiedemann (1995), that
increased susceptibility after O3 exposure can be expected for necrotrophic pathogens, while obligate biotrophic infections tend to be diminished by O3.
Insects can respond to O3-induced changes in the plant chemical composition or
insect performance is directly affected by O3. Overall assessments and some more
recent studies, respectively (Holopainen 2002; Valkama et al. 2007; Bidart-Bouzat
and Imeh-Nathaniel 2008; Lindroth 2010), can be interpreted that an O3 exposure
may increase the likelihood and success of chewing insect attacks. Existing studies
on interactions of O3 with sucking insects such as aphids do not allow to deduce
consistent trends. Among the aspects of the many other biotic factors that interact
with O3 or which modify plant O3 responses, respectively, symbioses with mycorrhizae and plant–plant interactions by competition are partly addressed in Sects. 5.2
and 5.3.
5 O3 Impacts at the Ecosystem Level
The recent emphasis of the importance of ecosystems for the functioning of the
biosphere and their role in providing goods and services to humans has resulted in
various attempts to assess the role of O3 at the ecosystem scale (MEA 2005).
However, ecosystem effects of O3 are difficult to detect and to evaluate, as the
different systems vary at spatial and temporal scales. With the exception of two
recent multi-year field experiments in a rapidly growing tree plantation (Karnosky
et al. 2001) and in an adult forest tree stand (Matyssek et al. 2013), the number of
studies at the scale of forest-, agro- or grassland ecosystems especially under
exposure to O3 over several growing seasons is still very limited, which is even
more true for other types of vegetation like fens, bogs, etc. The following section
will consider selected examples where O3 effects may be relevant in an ecosystem
context (Fig. 4).
412
H.J. Weigel et al.
Fig. 4 Schematic representation of structural elements and processes in ecosystems that are
potential direct and indirect targets of an O3 exposure and which are partly described in the text
5.1
Effects on Water Relations and Hydrology
As shown in Sect. 4.1, the main route of entry of O3 into the plant interior is via
stomatal uptake at the leaf level. This role of the stomata has also been proofed at
larger scales. For example, previous studies of Duyzer et al. (1995) in forest
ecosystems have demonstrated that O3 deposition is related to gs at the stand
level. However, as O3 effects on gs have been variable (Sect. 4.2), there remains
uncertainty with respect to O3 responses of water use at the canopy or stand level.
Investigations with tree species under open-air O3 exposure conditions using sap
flux measurements have shown that stand level water use per unit ground area of
aspen clones was not significantly affected by elevated O3 although the treatment
decreased leaf area index by 22 % and basal area by 20 % (Uddling et al. 2008).
Uddling et al. (2009) attributed this to an increased leaf area-specific hydraulic
conductance. The O3 effect was assumed to be caused by the sluggish stomatal
response (Sect. 4.1), as under O3 exposure the stomatal closure response to increasing vapour pressure deficit was less sensitive than under the control treatment.
Moreover, mid-day leaf water potential was more negative under elevated O3
compared to controls. The lack of an O3 effect on stand-level water use may also
Plant-Mediated Ecosystem Effects of Tropospheric Ozone
413
be caused by a higher proportion of sun leaves in trees under elevated O3 compared
with control trees (Uddling et al. 2008). Also, in an experiment with aspen and
birch, Rhea et al. (2010) found that O3 changed the branch architectural parameters,
which may alter tree crown interception of precipitation and thus affect
evapotranspiration.
Field studies in a deciduous forest in eastern Tennessee provided some insight
into the possible consequences of stomatal sluggishness at the leaf level for
ecosystem water cycling (McLaughlin et al. 2007a, b). It was found that daily O3
levels with maxima ranging from 69 to 82 ppb reduced stem growth by up to 50 %
in 1 year with high O3 levels. The authors suggested that peak hourly O3 exposures
resulted in an increase of the rate of water loss through transpiration as indicated by
an increased stem sap flow. Due to the increased canopy water loss water uptake by
the trees increased as reflected in reduced soil moisture in the rooting zone. At the
landscape level this change in tree water use was assumed to lead to further impacts
on the hydrological cycle and O3 has been reported to contribute to variation in lateseason streamflow by as much as 23 % in areas of highest exposure in forested
watersheds in Tennessee (Sun et al. 2012). A loss in stomatal sensitivity associated
with increased evapotranspiration and reduced streamflow can be expected to
increase drought episodes and to have implications for flow-dependent aquatic
biota (Sun et al. 2012). Recent studies with several crops and grassland species
have also indicated an O3-induced loss of stomatal sensitivity to drought, light and
vapour pressure deficit (Wilkinson et al. 2012; see Sect. 4.2), but the implication of
these observations on individual plant species for intact agro- and grassland ecosystems remains unclear.
Although there is no clear pattern of the impact of O3 on stomatal functioning
(see Sect. 4.2), recent ecosystem models that address the larger scale effects of O3
on water turnover are often based on the assumption that O3 induces a stomatal
closure. For example, in order to assess the interactions of O3, climate, elevated
CO2 and N limitation on the hydrological cycle in the eastern USA, Felzer
et al. (2009) used the terrestrial ecosystem model TEM-Hydro. According to this
model elevated CO2 decreased evapotranspiration by 2–4 % and increased runoff
by 3–7 %, as compared to the effects of climate alone. Including O3 damage and N
limitation into the calculations, evapotranspiration was reduced by an additional 4–
7 % and runoff was increased by an additional 6–11 %. Hanson et al. (2005) using a
stand-level simulation model found a modest 3 % reduction in water use when the
O3 concentration was raised by about 20 ppb above the prevailing ambient level.
5.2
Below-Ground Effects
Atmospheric ground level O3 exposure does not directly affect structural and
functional soil properties. However, above- and below-ground processes are
interconnected via plant shoot and root communication mediated by the flow of
carbon (see Sect. 4.4). Consequently, any O3-induced alteration of the quantity and
414
H.J. Weigel et al.
quality of carbon supply from either photosynthates or from litter fall to the soil or
from an enhanced carbon allocation to above-ground processes due to an
O3-induced stimulation of the production of antioxidants and other chemical
compounds for defence and repair processes may exert indirect O3 effects on the
soil system (Cooley and Manning 1987; Andersen 2003; Pregitzer and Talhelm
2013). Moreover, reduced biomass allocation to roots may lower the water availability to plants, which feeds back to stomatal conductance, canopy water flux,
hydrology (Sect. 5.1) and nutrient cycling. Examples of O3 effects on the soil
system include changes in litter quality and consequences for various soil biota.
Additional effects like alterations of soil carbon formation and of decomposer
activities as well as of soil food web structures are not considered here.
Modification in the quality of litter (e.g. soluble sugars, tannins, phenolics,
lignin, macro- and micronutrients) released from plants exposed to O3 have repeatedly been observed. In their review Kasurinen et al. (2007a) concluded from
existing information with boreal and temperate forest trees that O3 effects on litter
chemistry were mostly observed only at high O3 concentrations. For example in an
OTC study with birch (Betula pendula) clones O3 slightly increased the content of
leaf low molecular weight phenolic compounds, an effect which did not persist over
the 3-year study. On the other hand, litter chemistry was not affected by short-term
O3 exposure in a study with beech Fagus sylvatica (Schloter et al. 2005). In free air
type O3 exposure experiments, it has been demonstrated that O3-induced changes in
litter quality of Populus tremuloides and Betula papyrifera communities led to
reduced inputs of hemicellulose and lignin (Liu et al. 2005; Meehan et al. 2010) and
thus caused a decrease in nutrient flux into soil (Liu et al. 2007). In contrast,
Stoelken et al. (2010) detected additional nitrogen incorporation into the soil
down to 30 cm resulting from an enhanced nitrogen mobilisation from leaf litter
in an O3 exposure experiment with Fagus sylvatica grown in lysimeters.
Ozone effects on soil biota have received more recent attention especially with
respect to possible implications for soil biodiversity; however, there is little evidence from experimental studies in real ecosystems with their respective native soil
properties. Effects of O3 on the soil microbial community have been investigated
both in the rhizosphere and in the bulk soil of trees, grassland and arable crop
species.
In an OTC study with potted plants total bacterial biomass was decreased by O3
in the soil of the N2-fixing herbaceous legume Lathyrus pratensis, but not in the soil
of the grass Agrostis capillaris (Manninen et al. 2010). In a multi-year mesocosm
study with Pinus ponderosa, elevated O3 tended to increase the ratio of fungal to
bacterial biomass (Olszyk et al. 2001) and such an effect was also observed under
similar O3 exposure conditions for blue wildrye (Elymus glaucus, Yoshida
et al. 2001). For the tree species Fagus sylvatica, a shift in the overall community
structure of soil microorganisms based on phospholipid fatty acids (PLFA) analysis
as a biomarker in response to O3 (Pritsch et al. 2009) has been found to be
associated with a reduction in the potential nutrient turnover (Schloter
et al. 2005) and a higher abundance of plant-carbon utilising microbes (Esperschutz
et al. 2009).
Plant-Mediated Ecosystem Effects of Tropospheric Ozone
415
Aneja et al. (2007) characterised the diversity of microbial communities
colonising control and O3-exposed litter from Fagus sylvatica/Picea abies and
provided evidence that changed litter quality due to elevated O3 influenced the
structure of litter-colonising microbial communities. In peat-land microcosms
(Eriophorum vaginatum), Morsky et al. (2008) found an O3-induced increase in
microbial biomass only at the end of a 3-year exposure experiment, a result which
supports the conclusion of Kasurinen et al. (2007a) that the onset of microbial
responses due to an O3 impact may take years.
Dohrmann and Tebbe (2005) studied the rhizosphere bacterial community
composition of five low-managed grassland species using genetic profiling of
PCR amplified 16S rRNA gene sequences based on single-strand conformation
polymorphism (SSCP). They found that a 5-week exposure to elevated O3 did not
select for a different bacterial community composition. This was also true if other
more O3 susceptible herbaceous plant species with severe visible O3 injury were
studied (Dohrmann and Tebbe 2006). Also with a grassland system Kanerva
et al. (2008) in a 3-year O3 exposure study provided evidence that elevated O3 is
able to modify the structure of the microbial community in a meadow soil, as
bacterial, actinobacterial and fungal PLFA biomass were decreased simultaneously.
Again this study points to the fact that long-term observations are necessary to
understand the effects of O3 on the biology of soil processes in ecosystems.
Because of its implication for nutrient acquisition, mycorrhization is of high
importance for ecosystem function. An ectomycorrhizal community responded to
changes in environmental conditions with a change in its total amount of
extramatrical mycelium, leading to changes in space occupation, and consequently,
to alterations in its capacity to exploit soil resources (Agerer et al. 2012). Several
recent studies described effects on mycorrhizal abundance when host trees were
exposed to O3. For example, for Betula pendula Kasurinen et al. (2005) found a
stimulation of total mycorrhiza infection, Haikio et al. (2009) an increased mycorrhizal status for hybrid aspen (Populus tremula L. x Populus) and Pritsch
et al. (2009) and Grebenc and Kraigher (2007a) a higher total number of mycorrhiza
types under OTC and free air O3 exposure conditions. For ectomycorrhizae collected underneath mature Norway spruce trees at the “Kranzberger Forst” free-air
O3 fumigation site, differences in carbon allocation to the mycorrhizal communities
have been shown between the different O3 treatments by means of differences in the
enzyme activity profiles of the ectomycorrhizae communities (Agerer et al. 2012).
Moreover, there is past and recent evidence from studies with tree species that O3
impacts the microbial diversity also in terms of mycorrhizal species composition as
shown for Pinus taeda (Edwards and Kelly 1992), Betula pendula (Kasurinen
et al. 2005), Fagus sylvatica, (Haberer et al. 2007; Grebenc and Kraigher 2007b)
and for an aspen and aspen-birch community in a free air O3 exposure experiment
(Edwards and Zak 2011). On the other hand, data about O3 effects on the
mycorrhization of grassland and other crop species are limited. The mycorrhizal
colonisation of blue wildrye (Elymus glaucus) was reduced in response to O3, and it
has been demonstrated that this effect depends on the genotype of the grass tested
(Yoshida et al. 2001).
416
H.J. Weigel et al.
Until now few studies have addressed possible implications of plant exposure to
O3 for detritivore invertebrate communities and particularly soil mesofauna composition which are important for ecosystem functioning. In a free air O3 exposure
experiment with temperate forest tree species (aspen and aspen-birch communities)
the individual density of soil mites was reduced by nearly 50 % under elevated O3
conditions, whereas the abundances of collembolans remained unchanged
(Loranger et al. 2004). Feeding experiments with litter with altered quality due to
previous O3 exposure of trees were able to demonstrate that growth rates were
reduced for the earthworm (Lumbricus terrestris) fed with birch litter (Kasurinen
et al. 2007b) or for a collembolean species fed with aspen litter (Meehan
et al. 2010). With regard to arable agroecosystems Schrader et al. (2009) observed
a decrease in the individual density of enchytraeids, collembolans and soil mites in
the rhizosphere of O3-exposed wheat plants in OTCs and Chang et al. (2011) found
a reduction in the abundance and diversity of collembolans associated with cotton
plants exposed to O3. Overall, these few selected examples clearly show that the
above-ground impact of O3 on plant performance may translate into significant
secondary below-ground implications in the ecosystem.
5.3
Plant Competition and Community Composition
Driven by concerns about the global changes in biodiversity and the well-known
fact that plant growth responses to O3 vary significantly between species and
genotypes, an arising question is whether exposure of vegetation to high levels of
O3 may alter the strength of competitive interactions between different plant
species and whether this may lastly result in changes of plant community composition. The way by which elevated levels of O3 will shape the composition includes
a change in the cover or abundance of single plant species, which in turn will
change the genetic structure of the community. The challenge to describe O3 risks
on plant communities is the understanding of how competitive interactions may
modify growth responses of individual species to O3 and, conversely, how the
impact of O3 may modify their competitive ability within a plant assemblage.
Research on this issue comprises both, experiments with older, established ecosystems and artificially newly created plant communities with the majority of experiments designed to study two-species mixtures or model plant communities under
laboratory and field conditions.
Artificial forest communities have been investigated under laboratory and field
conditions. Phytotron studies to test O3 effects on the competition between Fagus
sylvatica and Picea abies revealed that the responses to O3 strongly depended on
the type of competition: although the response to O3 of P. abies was not significantly affected by either intra- or interspecific competition, the competitive ability
of this species was scarcely affected by O3 as indicated by an enhanced aboveground growth of the competing F. sylvatica plants (Grams et al. 2002; Kozovits
et al. 2005). Under conditions of interspecific competition, P. abies was found to be
Plant-Mediated Ecosystem Effects of Tropospheric Ozone
417
superior in nitrogen acquisition whereas F. sylvatica in turn appeared to be
nitrogen-limited (Grams and Matyssek 2010; Kozovits et al. 2005). Effects on
nutrient efficiency indicate that processes of stress defence due to O3 exposure
trigger a nutrient demand at the expense of above-ground competition
(Rodenkirchen et al. 2009). Recently, Grams et al. (2012) demonstrated that the
more intense the competition between F. sylvatica and P. abies is, the stronger the
response to other stressors may be modified.
Under free air O3 exposure conditions, stands of different clones of Populus
tremuloides (aspen) or mixed stands with either Betula papyrifera or Acer
saccharum were investigated during a 12-year experiment. The growth response
of P. tremuloides depended on clone and competitive status (Kubiske et al. 2007;
McDonald et al. 2002). After 7 years of exposure, O3 slightly enhanced the rate of
conversion of a P. tremuloides stand to a B. pendula stand (Kubiske et al. 2007),
whereas the cumulative nitrogen-acquisition decreased in both species (Zak
et al. 2007). When the experiment went on for 12 years, the rank order of
nitrogen-acquisition among P. tremuloides genotypes was not shifted over time,
indicating no change when juvenile trees mature (Zak et al. 2012).
In the above experiment an understory community established which consisted
of more than plant 30 species dominated by perennial old field vegetation.
Observed effects on total and individual species biomass, N content, and 15N
recovery of this understory vegetation could not be related directly to the O3
treatments but rather reflected the effects on the structure of the overstory community, which is determined by the present tree species and their response to the
treatments (Bandeff et al. 2006).
Ozone effects on established forest plant communities have already been
assessed in some earlier studies. For example, Nygaard (1994) and Steubing
et al. (1989) investigated the responses of understory species growing in an intact
conifer or beech forest, respectively, to relatively high O3 exposures and found high
variability between species in O3 sensitivity. Barbo et al. (1998) examined the
response to sub-ambient and enhanced O3 levels of an early successional plant
community associated with Pinus taeda. In this study, O3 exposures caused shifts in
the competitive interactions between plants and the abundance of the five most
common species was affected already in the first year. The authors concluded that
total vegetative cover, vertical density of foliage as well as species richness,
diversity and evenness may be at risk by the prevailing ambient O3 exposures.
A group of beech and spruce trees within a 55-year-old Norway spruce stand
(Kranzberger Forst, Germany) has been exposed for 8 years to enhanced O3 levels
using a newly developed free-air O3 fumigation system (Matyssek et al. 2010a, b,
2013). One of the results showed that individuals of both tree species, spruce and
beech, grew faster in mixture than in pure stands reflecting a facilitation of spruce
and a reduction in competitiveness of beech. The results of this research project led
to the conclusion that increasing levels of O3 stress may change the pattern of
carbon allocation in mixed stands of beech and spruce and the outcome of competition (Pretzsch and Schutze 2009). Actually, Pretzsch et al. (2010) demonstrated a
shift in the resource allocation in mature trees caused by exposure to high O3 levels.
418
H.J. Weigel et al.
In comparison to studies with forest plants, a much large number of more recent
studies on O3 effects on plant competition are available for grassland communities.
This may be due to the fact that a generally accepted outcome of screening
experiments with single plants or monocultures is that members of Fabaceae
(legumes) with the genus Trifolium in particular belong to the most O3-sensitive
plant species, whereas members of the family Poaceae are much less responsive to
O3 (Fuhrer 1997). Experimental approaches to address O3 effects on interspecific
competition between herbaceous plant species have thus focused on grass/clover
mixtures.
With respect to artificial grassland communities, more recent experiments with
potted plants of artificial grass/clover mixtures confirm earlier results such that
markedly negative growth response of the clover to O3 exposure is observed,
whereas the grass species were hardly impaired by O3 (González-Fernández
et al. 2008; Haldemann and Fuhrer 2005; Hayes et al. 2009, 2010a). If the total
biomass of the species mixture was largely influenced by the more sensitive
component, a decline in total yield of the mixture has been recorded under O3
exposure (e.g. for Trifolium repens/Lolium perenne, Hayes et al. 2009; for Trifolium pratense/Trisetum flavescens, Nussbaum et al. 2000). On the other hand, a
range of O3 exposure experiments resulted in unchanged total yield quantities
(e.g. for Trifolium repens/Lolium perenne, González-Fernández et al. 2008; or
grass/alfalfa, Johnson et al. 1996). This result derives from the fact that an
O3-induced decline in the relative yield of clover entailed an increase in the relative
yield of the grass component. In addition, it has been argued that altered root/shoot
ratios (Haldemann and Fuhrer 2005) and reduced remobilisation of reserves after
grazing (Nussbaum et al. 2000) due to the O3 impact could facilitate the less
sensitive species. Thus, O3 may interact with cutting or grazing by reducing the
capacity for regrowth from energy reserves (Ashmore and Ainsworth 1995). It
should be mentioned that these recent findings from experiments using potted
plants had already been observed with similar tendencies in older field experiments
with natural grass/clover communities, where plants were exposed to O3 under
OTC conditions (Blum et al. 1983; Rebbeck et al. 1988; Heagle et al. 1989).
There is also recent evidence that the presence of an interspecific competitor
(grass) may affect the response of the clover species to O3. In two-species mixtures,
adverse effects of O3 on productivity may be enhanced by competition as shown for
Trifolium pratense in competition with Trisetum flavescens (Haldemann and Fuhrer
2005) or mitigated by competition as shown for Trifolium repens in competition
with Lolium perenne (González-Fernández et al. 2008).
Ozone effects on plant competition of two-species mixture have recently also
been investigated without legumes. Using a phytometer approach, the response of
early season O3 stress on model communities of wet grassland species (Tonneijck
et al. 2004) and ten different extensively managed grassland species (Bender
et al. 2002, 2006b) was investigated over three seasons under OTC conditions
with moderately enhanced O3 levels. In the latter studies, for none of the ten species
O3 impacts on growth were detected when grown in monoculture. Target species
differed significantly in their competitive ability against the phytometer (Poa
Plant-Mediated Ecosystem Effects of Tropospheric Ozone
419
pratensis) but the experiments did not provide evidence that interspecific competition altered the harmful effects of an early season O3 stress on aboveground
growth. Only for Veronica chamaedrys, O3 was shown to affect its competitive
ability against Poa pratensis negatively (Bender et al. 2002, 2003). A similar
increase in the grass cover ratio under O3 exposure was demonstrated for
Anthoxanthum odoratum and Dactylis glomerata, respectively, when grown in
competition with Leontodon hispidus (Hayes et al. 2011).
In previous studies with artificial pasture model plant communities composed of
grasses, clover and weeds, the decline in the clover component, T. repens and/or
T. pratense due to the O3 impact, was associated with a slight increase in the yield
of grasses (e.g. field-sown, Fuhrer et al. 1994 and pot-sown, Ashmore et al. 1996).
Conversely, in a simulated community representing a typical multi-species UK
upland grassland, the grass Anthoxanthum odoratum was most affected by an
experimental O3 exposure in terms of aboveground biomass reduction and this
effect contributed to a decrease in total community biomass and grass:forb ratio
(Hayes et al. 2010b). In Finland, in a study with meadow species in mesocosms,
after only 2 years of moderate exposure to O3, the early season coverage of plant
communities was decreased (Rämö et al. 2007); however, the reductions in aboveground biomass were not reflected in changes in the dominance of different
functional groups or in the total community root biomass (Rämö et al. 2006).
There are also reports that describe modifying effects of plant competition in
grassland communities on the impact of O3 on plant flowering and visible leaf
injury. Among characteristic species of therophytic dehesa grasslands, flower
production of Trifolium cherleri, Trifolium subterraneum and Trifolium striatum
was suppressed by O3 in competition with the grass species Briza maxima, but there
was no interaction between competition and O3 response (Gimeno et al. 2003). In a
complex grassland model community, the timing of flowering and the number of
flowers of Lotus corniculatus were accelerated by O3, while a significant reduction
in the numbers of flowers with increasing O3 levels was found for Campanula
rotundifolia, Scabiosa columbaria and Vicia cracca (Hayes et al. 2012; Rämö
et al. 2007). Such changes in timing and number of flowers could have implications
for pollination and the long-term outcome of the whole community development.
Reduced proportions of injured leaves on O3 exposed grasses due to the presence of
a competitor have been described. For example, Trisetum flavescens responded
more strongly in mixture with the low stature species Centaurea jacea than in
mixture with Trifolium pratense (Nussbaum et al. 2000). Similarly, Leontodon
hispidus exhibited a larger increase in O3-induced senescence observed in the
more open canopy of A. odoratum compared to the denser canopy of
D. glomerata (Hayes et al. 2011). Modification of microclimate and canopy structure are thought to be potential mechanisms that influence the interaction between
O3 responses and competition (Haldemann and Fuhrer 2005; Hayes et al. 2010a).
Investigations on O3 effects on older, established communities of managed and
semi-natural grassland have been done in several earlier and more recent studies
(Table 2) and will be discussed here in more detail. For example, Nebel and Fuhrer
(1994) classified 31 species according to the appearance of visible injury when
420
H.J. Weigel et al.
Table 2 Effects of O3 exposures on species composition in experiments with established grassland communities
Effect on species
composition
Community
Main species
Exposure
Mesotrophic
grassland
Festuca rubra
Bromus erectus
Filipendula vulgaris
Pimpinella saxifraga
Arrhenatherum
elatius
Dactylis glomerata
Holcus lanatus
Festuca rubra
Campanula
rotundifolia
Galium verum
Plantago lanceolata
Festuca rubra
Arrhenatherum
elatius
Bromus erecta
Poa pratensis
Dactylis glomerata
OTC
Trends of changes
in species
composition
Shift towards a
more calcareous grassland
community
Ashmore
et al. (1995)
OTC
Thwaites
et al. (2006)
Festuca violacea
Nardus stricta
Carex
sempervirens
Ranunculus
villarsii
Leontodon
helveticus
Ligusticum
mutellina Potentilla aurea
Agrostis capillaris
Festuca rubra
Poa pratensis
Veronica
chamaedrys
Trifolium repens
Plantago lanceolata
Stellaria graminea
Free air
Consistent decline
in cover of
F. rubra
C. rotundifolium
was lost from
all ozone treatments
Increase in frequency of
G. verum
Increase in frequency of
P. lanceolata
No effects on the
abundance of
the most frequent species
No change in species richness
Effect on the proportion of grass
to forb cover
values
T. repens and
V. chamaedrys
increased in
cover
A. capillaris
decreased in
cover
Evans and
Ashmore
(1992)
Semi-natural
chalk
grassland
Low managed
grassland
Geo-MontaniNardetum
(Alp Flix)
Semi-natural
grassland
Arrhenatheretum
elatiusFestuca rubra
subcommunity
OTC
References
Bassin
et al. (2007b)
(continued)
Plant-Mediated Ecosystem Effects of Tropospheric Ozone
421
Table 2 (continued)
Community
Arrhenatherion
elatioris
Low-to-medium
productivity
30-year–old field
(Le Mouret)
Main species
Bromus hordeaceus
Holcus lanatus
Trisetum flavescens
Alopecurus
pratensis
Arrhenatherum
elatius
Plantago lanceolata
Ranunculus
friesianus
Trifolium pratense
Exposure
Free-air
Mesotrophic
grassland
Festuca rubra
Holcus lanantus
Anthoxanthum
odoratum
Free-air
Effect on species
composition
Change in fraction
of functional
groups
Legume fraction
shows a negative response
Negative effects of
ozone on grass
and legume
fraction
No response of the
forb fraction
Influence on the
composition of
the herb and
legume group
References
Volk
et al. (2006)
Stampfli and
Fuhrer
(2010)
Wedlich
et al. (2012)
grown in soil blocks of intact semi-natural grassland vegetation and Evans and
Ashmore (1992) showed that during a season with relative high O3 levels total
aboveground biomass of a semi-natural grassland community was decreased. More
recently, an old, species-rich (53 species) pasture at a mid-elevation site in Switzerland was exposed for seven years to O3 in a free air exposure system under real
field conditions (Volk et al. 2003). For individual growth periods, no relationship
between the O3 exposure level and yield differences was observed. After 5 years a
loss in annual dry matter yield of about 23 % was calculated for conditions of
moderately elevated O3 levels (1.5 ambient air) showing a strong negative
response of the yield of the fraction of legumes (Volk et al. 2006) but not of the
frequency of legumes at the experimental plots (Stampfli and Fuhrer 2010). In a
natural upland mesotrophic grassland in UK, Wedlich et al. (2012) revealed clear
evidence for a cumulative effect of moderately elevated O3 levels (free-air exposure) over time (3 years) on species biomass composition as there was a significant
negative effect of O3 exposure on herb biomass, but not on total grass or legume
biomass suggesting that finally O3 had become the dominant factor influencing
species composition within the combined herb and legume component.
Particularly for semi-natural calcareous grassland, a shift in species composition
has been recorded which was indicated either by a decline (e.g. of the dominant
grass species Festuca rubra or Campanula rotundifolia) or an increase (Galium
verum and Plantago lanceolata) in cover or frequency of species (Thwaites
et al. 2006). Bassin et al. (2007b) concluded that in old, species-rich grassland
communities, effects of elevated O3 on the productivity and floristic composition
seem to develop rather slowly, as evidenced from the lack of significant vegetation
responses of the sub-alpine grassland community to the elevated O3 treatment over
7 years (Bassin et al. 2013). With respect to species-specific traits Bassin
422
H.J. Weigel et al.
et al. (2009) suggested that commonly used principles of functional growth analysis
do not directly hold under the specific conditions of such plant communities. As a
reason, an adaptation to oxidative stress of the alpine species was discussed to
account for the low sensitivity in response to the chronic low-level O3 exposure
used in this experiment (Bassin et al. 2013).
In summary, the studies cited above indicate that current and future O3 concentrations could affect natural and semi-natural grassland communities and point out
that detrimental effects on species balance may occur. In clover:grass mixtures a
shift in species composition is the predominant effect, favouring the tillering of the
grass component, whereas the effect on the total forage yield seems to be determined by the susceptibility of the individual species. Experiments with newly
established grassland communities indicate that nitrogen-poor meadows are potentially very sensitive towards an O3 impact. Mesotrophic grassland communities are
characterised by the occurrence of faster growing species which are known to be
more susceptible to O3 than the slower growing calcareous grassland species. The
low susceptibility of old, species rich grassland communities to O3 is linked to
specific characteristics of these systems. Low productivity vegetation such as
subalpine grassland is mainly composed of species with a stress-tolerant growth
strategy, which have been considered relatively unresponsive to O3 (Bassin
et al. 2007a). Probably, the high genetic diversity and the large rooting system,
which entails resources to allow repeated establishment of a new photosynthetic
canopy are the basis for a large resilience against declining biomass production
(Bassin et al. 2007a, b; Volk et al. 2011).
As already shown for grassland communities, any differential O3 susceptibility
between plant species in terms of growth or fitness may alter their competitive
interactions. This may also be assumed for plant competition in agro-ecosystems
and has been shown for crop–weed interactions. Unfortunately, overall knowledge
about this issue is rather scarce. Ozone impacts on competition between crops and
the C-4 weed Cyperus esculentus have been investigated by Grantz and Shrestha
(2005, 2006) and Shrestha and Grantz (2005). Fruit productivity of Lycopersicon
esculentum in competition with this weed was reduced under low and moderate O3
levels, whereas the crop responded only to high O3 levels in the absence of the weed
(Shrestha and Grantz 2005). In competition with Gossypium barbadense, O3
impacts were compounded by C. esculentus (Grantz and Shrestha 2005) suggesting
that high O3 concentrations appear to increase the competitiveness of the weed with
respect to cotton (Grantz and Shrestha 2006). Grantz et al. (2010) thus assumed that
it is more likely that the level of threat to agricultural production from C. esculentus
may increase due to enhanced competition for edaphic resources driven by the O3
impact. Pfleeger et al. (2010) observed the response of a plant community emerging
from a farm soil over several generations. Individuals from some of the species
appeared to be diminished in number by the third year, such as Capsella bursapastoris, Erodium cicurtarium and Spergula arvensis, while biomass decreased
with increasing O3 exposure. Changes in competitive interactions and community
dynamics seemed to be an indirect effect of premature senescence of taller species
by altering light availability.
Plant-Mediated Ecosystem Effects of Tropospheric Ozone
5.4
423
Ecosystem Productivity
Ozone effects on plant vigour, water relations and soil processes may finally all
contribute to altered net primary productivity which is one of the key characteristics
of any ecosystem function and service.
Forest productivity is of particular interest not only for timber production but
also due to its implications for the global carbon cycle and climate change. Current
O3 levels are considered an important stressor of over 30 % of the world’s forests
(IPCC 2007; Royal Society 2008) and also constitute a risk for forests in Europe
(Ashmore 2005; Matyssek et al. 2008). Such assessments of O3 effects on forest
ecosystem properties are based on experiments and models, but still remain uncertain. For example, most experimental approaches addressing this question were
carried out with seedlings or individual young tree species, therefore extrapolation
to the results of mature forest stands is limited (Karnosky et al. 2007).
DeMarco et al. (2013) applied a generalised linear/non-linear regression model
to assess cause–effect relationships between primary productivity of Quercus
cerris, Quercus ilex and Fagus sylvatica and climate and pollutants including O3
in Italy and concluded that O3 did not significantly affect net primary productivity.
But this conclusion must be viewed with caution, because the authors only considered the external O3 concentration (as AOT40; accumulated hourly mean O3
concentration above 40 ppb), i.e. the O3 exposure in their model rather than the
O3 uptake into the plants, which is toxicologically relevant for any risk assessment.
Ollinger et al. (1997) combined leaf-level O3 response data from O3 fumigation
studies with a forest ecosystem model in order to simulate the effects of ambient O3
on mature hardwood forests in the northeastern United States. The predicted
declines in annual net primary production in this modelling study ranged from
3 to 16 %.
Information on O3 effects on the productivity of natural and semi-natural
vegetation are to a large extent represented by studies on grassland (Bassin
et al. 2007a; Fuhrer 2009; see Sect. 5.3). As grasslands comprise a variety of
habitats described as meadows and fens, as well as agricultural grassland used for
grazing, albeit maintained to conserve species diversity, a general assessment of an
O3 impact on these ecosystem type is difficult. Although O3 has been reported to
decrease productivity in individual grassland species grown in simulated mixtures
(see Sect. 5.3), the few experiments with established grassland ecosystems have
shown that their net primary production is quite resilient to elevated O3 (Thwaites
et al. 2006; Volk et al. 2011).
Ozone effects on agroecosystem productivity at the field scale and related to this
the consequences for regional and global yields and agricultural productivity,
respectively, have been assessed by experimental field studies and by regression
models using the O3 dose–response functions derived from these experiments. The
most prominent examples of this approach are the previous multi-site field studies
in National Crop Loss Assessment Network in the USA (Heagle 1989) and in the
European Open-top Chamber Network (Jäger et al. 1992), where various crop
424
H.J. Weigel et al.
species were exposed to O3 in OTCs. Data from these experiments have been used
widely to develop O3 exposure–response models which again formed the basis to
estimate regional or global productivity losses (in terms of crop yields) caused by
O3 (Wang and Mauzerall 2004; van Dingenen et al. 2009). For example, yield
losses of important US crops crop species (maize wheat, sorghum, soybean) were
calculated to be in the range of approx. 10 % when exposed to an average O3
concentration below 50 ppb (7-h day 1) or when exposed to O3 concentrations
above 80 ppb (7-h day 1) (Booker et al. 2009). According to Mills et al. (2007)
more than 20 % of the European crop production area is at risk for yield losses of
about 5 % at current O3 levels. Also, mostly based on OTC studies considerable
yield losses of crops in Asian countries like India, Pakistan (Wahid 2006) and China
have been estimated (Cho et al. 2011). Aunand et al. (2000) estimate that yield
losses of soybean and wheat may range between 20 and 30 % by 2020 in China.
More recently, the only two free air O3 exposure experiments with crops worldwide
have similarly shown that modest enhancements of ambient O3 concentrations
(which ranged between 42 and 62 ppb) resulted in yield losses of 5–18 % for rice
(Shi et al. 2009), 15–25 % for soybean (Morgan et al. 2006) and 10–35 % for wheat
(Zhu et al. 2011). Overall, the above examples all provide reasonable evidence that
the productivity of important agro-ecosystems are at risk from current and future O3
exposure. From the perspective of the growing global population with ever increasing future needs for food supply, the estimated yield losses of these crops are of
concern. However, there remains uncertainty with these estimates as they rely on
exposures to the external O3 concentration rather than on the actual O3 uptake into
the crops.
6 Conclusions
Globally there is widespread evidence that tropospheric O3 concentrations tend to
increase. There is also long-term evidence that O3 is highly phytotoxic and that
vegetation is at particular risk from this pollutant. Driven by concerns about the
potential losses in food crop and timber productivity due to O3 exposures the mode
of action of O3 on individual plant species has been studied intensively during the
last decades. Consequently, we now have a reasonable understanding how plant
metabolism, physiology and growth vigour is affected by this pollutant and evidence that O3 exposure causes yield losses of crops and forest trees. More recently,
along with overall concerns about the pressures on global ecosystems derived from
land use, climate change and overexploitation, etc. emphasis on the importance of
ecosystems for the overall functioning of the biosphere has raised new questions
about the role of O3 as an additional threat to that role of terrestrial ecosystems.
Here we have highlighted O3 effects on plant water relations and the possible
consequences for the hydrology of whole ecosystems, the possible consequences
of an O3-induced alteration of the carbon transfer between above- and belowground plant parts for soil carbon and soil organisms and the potential role of O3
Plant-Mediated Ecosystem Effects of Tropospheric Ozone
425
as a driver of plant biodiversity in vegetation. It is evident that in comparison to the
level of single plants much of the existing information that would allow us to assess
O3 effects at the ecosystem level is still missing and inconsistent.
From the perspective of ecosystem effects this is particularly due to a paucity of
adequate research efforts to study O3 effects at the system level. This is equally true
for agro-, forest- and other semi(natural) or grassland ecosystems, albeit these
different systems require to consider different time horizons to assess any risk
from O3 stress. While two recent large-scale O3 experiments with a forest plantation
and a mature forest stand applying free air O3 enrichment techniques have provided
important information on the multitude of potential O3 effects at the system or stand
level, we need more of such experiments. This holds true not only with respect to
other forest ecosystems at other sites but similarly also for other types of natural or
semi-natural vegetation such as, e.g. pastures and grassland, particularly with an
increased emphasis on biodiversity issues under the impact of O3. Also for
agroecosystems where O3 effects have almost always been considered under
aspects of food security, the challenge remains to clearly demonstrate at the field
level the “true” extent of either direct or indirect O3 impacts on crop yield and
quality. To address the various inconsistencies in the current understanding of O3
effects at the ecosystem level especially long-term factorial experimental
approaches are required that address questions of interactions of O3 with other
environmental factors more systematically. Such efforts should be underpinned by
a more mechanistic research trying to better understand the various interactive
feedbacks of the components of a particular system under O3 exposure, e.g. by
applying ecophysiological and molecular approaches.
Acknowledgements This work was partly supported by the German Federal Environmental
Agency (Umweltbundesamt, FKZ: 3711 63 235).
References
Agerer R, Hartmann A, Pritsch K, Raidl S, Schloter M, Verma R, Weigt R (2012) Plants and their
ectomycorrhizosphere: cost and benefit of symbiotic soil organisms. In: Matyssek R, Schnyder
H et al (eds) Growth and defence in plants. Springer, Berlin, pp 213–242
Ahsan N, Nanjo Y, Sawada H, Kohno Y, Komatsu S (2010) Ozone stress-induced cell death,
hormone biosynthesis and gene expression in Arabidopsis thaliana. Plant J 58:1–12
Ainsworth EA (2008) Rice production in a changing climate: a meta-analysis of responses to
elevated carbon dioxide and elevated ozone concentration. Glob Change Biol 14:1642–2650
Ainsworth EA, Rogers A, Leakey ADB (2008) Targets for crop biotechnology in a Future high
CO2 and high O3 world. Plant Physiol 147:13–19
Akimoto H (2003) Global air quality and pollution. Science 302:1716–1719
Andersen CP (2003) Source-sink balance and carbon allocation below ground in plants exposed to
ozone. New Phytol 157:213–228
Aneja MK, Sharma S, Fleischmann F, Stich S, Heller W, Bahnweg G, Munch JC, Schloter M
(2007) Influence of ozone on litter quality and its subsequent effects on the initial structure of
colonizing microbial communities. Microb Ecol 54:151–160
426
H.J. Weigel et al.
Ashmore MR (2005) Assessing the future global impacts on vegetation. Plant Cell Environ
28:949–964
Ashmore MR, Ainsworth N (1995) The effects of ozone and cutting on the species composition of
artificial grassland communities. Funct Ecol 9:708–712
Ashmore MR, Thwaites RH, Ainsworth N, Cousins DA, Power SA, Morton AJ (1995) Effects of
ozone on calcareous grassland communities. Water Air Soil Pollut 85:1527–1532
Ashmore MR, Power SA, Cousins DA, Ainsworth N (1996) Effects of ozone on native grass and
forb species: a comparison of responses of individual plants and artificial communities. In:
Kärenlampi L, Skärby L (eds) Critical levels for ozone: testing and finalizing the concepts.
UN-ECE Workshop Report, Kuopio, pp 193–197
Aunand K, Berntsen TK, Seip HM (2000) Surface ozone in China and its possible impact on
agricultural crops. Ambio 29:294–301
Baier M, Kandlbinder A, Golldack D, Dietz K (2005) Oxidative stress and ozone: perception,
signaling and response. Plant Cell Environ 28:1012–1020
Bandeff JM, Pregitzer KS, Loya WM, Holmes WE, Zak DR (2006) Overstory community
composition and elevated atmospheric CO2 and O3 modify understory biomass production
and nitrogen acquisition. Plant Soil 282:251–259
Barbo DN, Chappelka AH, Somers GL, Miller-Goodman MS, Stolte K (1998) Diversity of an
early successional plant community as influenced by ozone. New Phytol 138:653–662
Bassin S, Volk M, Fuhrer J (2007a) Factors affecting the ozone sensitivity of temperate European
grasslands: an overview. Environ Pollut 146:678–691
Bassin S, Volk M, Suter M, Buchmann N, Fuhrer J (2007b) Nitrogen deposition but not ozone
affects productivity and community composition of subalpine grassland after 3 yr of treatment.
New Phytol 175:523–534
Bassin S, Werner RA, Sorgel K, Volk M, Buchmann N, Fuhrer J (2009) Effects of combined ozone
and nitrogen deposition on the in situ properties of eleven key plant species of a subalpine
pasture. Oecologia 158:747–756
Bassin S, Volk M, Fuhrer J (2013) Species composition of subalpine grassland is sensitive to
nitrogen deposition, but not to ozone, after seven years of treatment. Ecosystems 16:1105–
1117
Bender J, Bergmann E, Dohrmann A, Tebbe CC, Weigel HJ (2002) Impact of ozone on plant
competition and structural diversity of rhizosphere microbial communities in grassland
mesocosms. Phyton 42:7–12
Bender J, Bergmann E, Weigel HJ (2003) Multi-year experiments on ozone effects on semi-natural
vegetation: implications for the development of critical levels. In: Karlsson PE, Selldén G,
Pleijel H (eds) Establishing ozone critical levels II. UNECE workshop report. IVL report B
1523, Gothenburg, Sweden, pp 211–217
Bender J, Bergmann E, Weigel HJ (2006a) Responses of biomass production and reproductive
development to ozone exposure differ between European wild plant species. Water Air Soil
Pollut 176:253–267
Bender J, Muntifering RB, Lin JC, Weigel HJ (2006b) Growth and nutritive quality of Poa
pratensis as influenced by ozone and competition. Environ Pollut 142:109–115
Bergmann E, Bender J, Weigel HJ (1996) Effects of chronic ozone stress on growth and
reproduction capacity of native herbaceous plants. In: Knoflacher M, Schneider J, Soja G
(eds) Exceedances of critical loads and levels: spatial and temporal interpretation of elements
in landscape sensitivity to atmospheric pollutants. Federal Ministry for Environment, Youth
and Family, Vienna, Austria, pp 177–185
Bernacchi CJ, Leakey ADB, Heady LE, Morgan PB, Dohleman FG, McGrath JM, Gillespie KM,
Wittig VE, Rogers A, Long SP, Ort DR (2006) Hourly and seasonal variation in photosynthesis
and stomatal conductance of soybean grown at future CO2 and ozone concentrations for 3 years
under fully open-air field conditions. Plant Cell Environ 29:2077–2090
Beyschlag W, Eckstein J (1998) Stomatal patchiness. In: Behnke K, Esser K, Kadereit JW,
Lüttge U, Runge M (eds) Progress in botany, vol 60. Springer, Berlin, pp 283–298
Plant-Mediated Ecosystem Effects of Tropospheric Ozone
427
Bidart-Bouzat MG, Imeh-Nathaniel A (2008) Global change effects on plant chemical defenses
against insect herbivores. J Integr Plant Biol 50:1339–1354
Black VJ, Black CR, Roberts JA, Stewart CA (2000) Impact of ozone on the reproductive
development of plants. New Phytol 147:421–447
Blum U, Heagle AS, Burns JC, Linthurst RA (1983) The effects of ozone on fescue-clover
forage—regrowth, yield and quality. Environ Exp Bot 23:121–132
Booker F, Muntifering R, McGrath M, Burkey K, Decoteau D, Fiscus E, Manning KS,
Chappelka A, Grantz D (2009) The ozone component of global change: potential effects on
agricultural and horticultural plant yield, product quality and interactions with invasive
species. J Integr Plant Biol 51:337–351
Burkart S, Bender J, Tarkotta B, Faust S, Castagna A, Ranieri A, Weigel HJ (2013) Effects of
ozone on leaf senescence, photochemical efficiency and grain yield in two winter wheat
cultivars. J Agro Crop Sci 199:275–285
Calatayud V, Cervero J, Sanz MJ (2007) Foliar, physiological and growth responses of four maple
species exposed to ozone. Water Air Soil Pollut 185:239–254
Cape JN, Hamilton R, Heal MR (2009) Reactive uptake of ozone at simulated leaf surfaces:
implications for ‘non-stomatal’ ozone flux. Atmos Environ 43:1116–1123
Chang LA, Liu XH, Ge F (2011) Effect of elevated O3 associated with Bt cotton on the abundance,
diversity and community structure of soil Collembola. Appl Soil Ecol 47:45–50
Cho K, Tiwar S, Agrawal SB, Torres NL, Agrawal M, Sarkar A, Shibato J, Agrawal GK, Kubo A,
Rakwal R (2011) Troposheric ozone and plants: absorption, responses, and consequences. In:
Whitacre DM (ed) Reviews of environmental contamination and toxicology, vol 212, pp 61–
111
Cieslik SA (2004) Ozone uptake by various surface types: a comparison between dose and
exposure. Atmos Environ 38:2409–2420
Cooley DR, Manning WJ (1987) The impact of ozone on assimilate partitioning in plants: a
review. Environ Pollut 47:95–113
Darbah JNT, Kubiske ME, Nelson N, Oksanen E, Vapaavuori E, Karnosky DF (2008) Effects of
decadal exposure to interacting elevated CO2 and/or O3 on paper birch (Betula papyrifera)
reproduction. Environ Pollut 155:446–452
Darrall NM (1989) The effect of air pollutants on physiological processes in plants. Plant Cell
Environ 12:1–30
Davison AW, Barnes JD (1998) Effects of ozone on wild plants. New Phytol 139:135–151
Degl’Innocenti E, Guidi L, Soldatini GF (2007) Effects of elevated ozone on chlorophyll a
fluorescence in symptomatic and asymptomatic leaves of two tomato genotypes. Biol Plant
51:313–321
DeMarco A, Screpanti A, Attore F, Proietti C, Vitale M (2013) Assessing ozone and nitrogen
impact on net primary productivity with a generalised non-linear model. Environ Pollut
172:250–263
Derwent R (2008) New directions: prospects for regional ozone in north-west Europe. Atmos
Environ 42:1958–1960
Dizengremel P, Jolivet I, Tuzet A, Ranieri A, LeThiec D (2013) Integrative leaf-level phytotoxic
ozone dose assessment and forest risk modelling. In: Matyssek R, Clarke N, Cudlin P,
Mikkelsen TN, Tuovinen J-P, Wieser G, Paoletti E (eds) Climate change, air pollution and
global challenges: understanding and perspectives from forest research. Developments in
Environmental Science, vol 13, Elsevier, pp 267–282
Dohrmann AB, Tebbe CC (2005) Effect of elevated tropospheric ozone on the structure of
bacterial communities inhabiting the rhizosphere of herbaceous plants native to Germany.
Appl Environ Microbiol 71:7750–7758
Dohrmann AB, Tebbe CC (2006) Genetic profiling of bacterial communities from the rhizospheres
of ozone damaged Malva sylvestris (Malvaceae). Eur J Soil Biol 42:191–199
Duyzer JH, Weststrate H, Walton S (1995) Exchange of ozone and nitrogen oxides between the
atmosphere and coniferous forest. Water Air Soil Pollut 85:2065–2070
428
H.J. Weigel et al.
Eastburn DM, McElrone AJ, Bilgin DD (2011) Influence of atmospheric and climatic change on
plant-pathogen interactions. Plant Pathol 60:54–69
Edwards GS, Kelly JM (1992) Ectomycorrhizal colonization of loblolly pine seedlings during
three growing seasons in response to ozone, acidic precipitation, and soil Mg status. Environ
Pollut 76:71–77
Edwards IP, Zak DR (2011) Fungal community composition and function after long-term exposure of northern forests to elevated atmospheric CO2 and tropospheric O3. Glob Change Biol
17:2184–2195
Emberson LD, Ashmore MR, Murray F (2003) Air pollution impacts on crops and forests: a global
assessment. Imperial College Press, London
Esperschutz J, Pritsch K, Gattinger A, Welzl G, Haesler F, Buegger F, Winkler JB, Munch JC,
Schloter M (2009) Influence of chronic ozone stress on carbon translocation pattern into
rhizosphere microbial communities of beech trees (Fagus sylvatica L.) during a growing
season. Plant Soil 323:85–95
Evans PA, Ashmore MR (1992) The effects of ambient air on a semi-natural grassland community.
Agric Ecosyst Environ 38:91–97
Fares S, McKay M, Holzinger R, Goldstein AH (2010) Ozone fluxes in a Pinus ponderosa
ecosystem are dominated by non-stomatal processes: evidence from long-term continuous
measurements. Agric For Meteorol 150:420–431
Felzer BS, Cronin TW, Melillo JM, Kicklighter DW, Schlosser CA (2009) Importance of carbonnitrogen interactions and ozone on ecosystem hydrology during the 21st century. J Geophys
Res 114:G01020
Feng ZZ, Kbayashi K, Ainsworth EA (2008) Impact of elevated ozone concentration on growth,
physiology and yield of wheat (Triticum aestivum L.): a meta-analysis. Glob Change Biol
14:2696–2708
Fiscus EL, Booker FL, Burkey KO (2005) Crop responses to ozone: uptake, modes of action,
carbon assimilation and partitioning. Plant Cell Environ 28:997–1011
Flagler RB (1998) Recognition of air pollution injury to vegetation. Air and Waste Management
Association, Pittsburgh
Fowler D, Flechard C, Cape JN, Storeton-West RL, Coyle M (2001) Measurements of ozone
deposition to vegetation quantifying the flux, the stomatal and non-stomatal components.
Water Air Soil Pollut 130:63–74
Fowler D, Pilegaard K, Sutton MA et al (2009) Atmospheric composition change: ecosystemsatmosphere interactions. Atmos Environ 43:5193–5267
Fuhrer J (1997) Ozone sensitivity of managed pastures. In: Cheremisinoff PN (ed) Ecological
issues and environmental impact assessment. Gulf Publishing, Houston, pp 681–706
Fuhrer J (2003) Agroecosystern responses to combinations of elevated CO2, ozone, and global
climate change. Agric Ecosyst Environ 97:1–20
Fuhrer J (2009) Ozone risk for crops and pastures in present and future climates. Naturwissenschaften 96:173–194
Fuhrer J, Shariatmadari H, Perler R, Tschannen W, Grub A (1994) Effects of ozone on managed
pasture. 2. Yield, species composition, canopy structure, and forage quality. Environ Pollut
86:307–314
Fumagalli I, Gimeno B, Velissariou D, DeTemmerman L, Mills G (2001) Evidence of ozoneinduced adverse effects on crops in the Mediterranean region. Atmos Environ 35:2583–2587
Gimeno BS, Bermejo V, Sanz J, de la Torre D, Gil JM (2003) Ozone and competition adversely
affect the reproductive ability of three clover species from Iberian rangelands. In: Karlsson PE,
Selldén G, Pleijel H (eds) Establishing ozone critical levels II. UNECE workshop report. IVL
report B 1523, Gothenburg, Sweden, pp 218–223
González-Fernández I, Bass D, Muntifering R, Mills G, Barnes J (2008) Impacts of ozone
pollution on productivity and forage quality of grass/clover swards. Atmos Environ
42:8755–8769
Plant-Mediated Ecosystem Effects of Tropospheric Ozone
429
Grams TEE, Matyssek R (2010) Stable isotope signatures reflect competitiveness between trees
under changed CO2/O3 regimes. Environ Pollut 158:1036–1042
Grams TEE, Kozovits AR, Reiter IM, Winkler JB, Sommerkorn M, Blaschke H, Häberle KH,
Matyssek R (2002) Quantifying competitiveness in woody plants. Plant Biol 4:153–158
Grams TEE, Daigo MJ, Winkler JB, Gayler S, Matyssek R (2012) Growth and space use in
competitive interactions between juvenile trees. In: Matyssek R, Schnyder H et al (eds) Growth
and defence in plants. Springer, Berlin, pp 273–286
Grantz DA, Shrestha A (2005) Ozone reduces crop yields and alters competition with weeds such
as yellow nutsedge. Calif Agric 59:137–143
Grantz DA, Shrestha A (2006) Tropospheric ozone and interspecific competition between yellow
nutsedge and pima cotton. Crop Sci 46:1879–1889
Grantz DA, Gunn S, Vu HB (2006) O3 impacts on plant development: a meta-analysis of root/
shoot allocation and growth. Plant Cell Environ 29:1193–1209
Grantz DA, Shrestha A, Vu HB (2010) Ozone impacts on assimilation and allocation to reproductive sinks in the vegetatively propagated C-4 weed, yellow nutsedge. Crop Sci 50:246–252
Grebenc T, Kraigher H (2007a) Changes in the community of ectomycorrhizal fungi and increased
fine root number under adult beech trees chronically fumigated with double ambient ozone
concentration. Plant Biol 9:279–287
Grebenc T, Kraigher H (2007b) Types of ectomycorrhiza of mature beech and spruce at ozonefumigated and control forest plots. Environ Monit Assess 128:47–59
Grulke NE, Johnson R, Esperanza A, Jones D, Nguyen T, Posch S, Tausz M (2003) Canopy
transpiration of Jeffrey pine in mesic and xeric microsites: O3 uptake and injury response.
Trees Struct Funct 17:292–298
Grulke N, Neufeld H, Davison A, Roberts M, Chappelka A (2007) Stomatal behavior of ozonesensitive and -insensitive coneflowers (Rudbeckia laciniata var. digitata) in Great Smoky
Mountains National Park. New Phytol 173:100–109
Grünhage L, Jäger HJ (2003) From critical levels to critical loads for ozone: a discussion of a new
experimental and modelling approach for establishing flux–response relationships for agricultural crops and native plant species. Environ Pollut 125:99–110
Haberer K, Grebenc T, Alexou M, Gessler A, Kraigher H, Rennenberg H (2007) Effects of longterm free-air ozone fumigation on delta N-15 and total N in Fagus sylvatica and associated
mycorrhizal fungi. Plant Biol 9:242–252
Haikio E, Makkonen M, Julkunen-Tiitto R, Sitte J, Freiwald V, Silfver T, Pandey V, Beuker E,
Holopainen T, Oksanen E (2009) Performance and secondary chemistry of two hybrid aspen
(Populus tremula L. x Populus tremuloides Michx.) clones in long-term elevated ozone
exposure. J Chem Ecol 35:664–678
Haldemann C, Fuhrer J (2005) Interactive effects of CO2 and O3 on the growth of Trisetum
falvescens and Trifolium pratense grown in monoculture or a bi-species mixture. J Crop
Improv 13:275–289
Handley T, Grulke NE (2008) Interactive effects of O3 exposure on California black oak (Quercus
kelloggii Newb.) seedlings with and without N amendment. Environ Pollut 156:53–60
Hanson PJ, Wullschleger SD, Norby RJ, Tschaplinski TJ, Gunderson CA (2005) Importance of
changing CO2, temperature, precipitation, and ozone on carbon and water cycles of an uplandoak forest: incorporating experimental results into model simulations. Glob Change Biol
11:1402–1423
Hayes F, Jones MLM, Mills G, Ashmore M (2007) Meta-analysis of the relative sensitivity of
semi-natural vegetation species to ozone. Environ Pollut 146:754–762
Hayes F, Mills G, Ashmore M (2009) Effects of ozone on inter- and intra-species competition and
photosynthesis in mesocosms of Lolium perenne and Trifolium repens. Environ Pollut
157:208–214
Hayes F, Mills G, Ashmore M (2010a) How much does the presence of a competitor modify the
within-canopy distribution of ozone-induced senescence and visible injury? Water Air Soil
Pollut 210:265–276
430
H.J. Weigel et al.
Hayes F, Mills G, Jones L, Ashmore M (2010b) Does a simulated upland grassland community
respond to increasing background, peak or accumulated exposure of ozone? Atmos Environ
44:4155–4164
Hayes F, Mills G, Harmens H, Wyness K (2011) Within season and carry-over effects following
exposure of grassland species mixtures to increasing background ozone. Environ Pollut
159:2420–2426
Hayes F, Williamson J, Mills G (2012) Ozone pollution affects flower numbers and timing in a
simulated BAP priority calcareous grassland. Environ Pollut 163:40–47
Heagle AS (1989) Ozone and crop yield. Annu Rev Phytopathol 27:397–423
Heagle AS, Body DE, Heck WW (1973) An open-top field chamber to assess the impact of air
pollution on plants. J Environ Qual 2:365–368
Heagle AS, Kress LW, Temple PJ, Kohut RJ, Miller JE, Heggestad HE (1988) Factors influencing
ozone dose-yield response relationships in open-top field chamber studies. In: Heck WW,
Taylor OC, Tingey DT (eds) Assessment of crop loss from air pollutants. Elsevier Applied
Science, London, pp 141–149
Heagle AS, Rebbeck J, Shafer SR, Blum U, Heck WW (1989) Effects of long-term ozone exposure
and soil-moisture deficit on growth of a ladino clover tall fescue pasture. Phytopathology
79:128–136
Heath RL (2008) Modification of the biochemical pathways of plants induced by ozone: What are
the varied routes to change? Environ Pollut 155:453–463
Heck WW, Philbeck RB, Dunning JA (1978) A continuous stirred tank reactor (CSTR) system for
exposing plants to gaseous air contaminants: principles, specifications, construction, and
operation. USDA, ARS-S-81. U.S. Government Printing Office, Washington, DC
Hendrey GR, Ellsworth DS, Lewin KF, Nagy J (1999) A free-air enrichment system for exposing
tall forest vegetation to elevated atmospheric CO2. Glob Change Biol 5:293–309
Hogsett WE, Tingey DT, Lee EH, Beedlow PA, Andersn CP (2008) An approach for evaluating
the effectiveness of various ozone Air Quality Standards for protecting trees. Environ Manage
41:937–948
Holopainen JK (2002) Aphid response to elevated ozone and CO2. Entomol Exp Appl 104:137–
142
Innes JL, Skelly JM, Schaub M (2001) Ozone and broadleaved species. A guide to the identification of ozone-induced foliar injury. Haupt, Bern
IPCC (Intergovernmental Panel on Climate Change) (2007) Climate change 2007: synthesis
report. Contribution of working groups I, II and II to the fourth assessment report of the
IPCC. IPCC, Geneva
Iriti M, Faoro F (2008) Oxidative stress, the paradigm of ozone toxicity in plants and animals.
Water Air Soil Pollut 187:285–301
Jacob DJ, Winner DA (2009) Effects of climate change on air quality. Atmos Environ 43:51–63
Jäger HJ, Unsworth MH, De Temmerman L, Mathy P (1992) Effects of air pollution on agricultural crops in Europe—results of the European open-top chamber project. Air Pollution
Research Report 46, Commission of the European Communities, Brussels
Jäger HJ, Hertstein U, Fangmeier A (1999) The European stress physiology and climate change
experiment—project 1: wheat (ESPACE-wheat): introduction, aims and methodology. Eur J
Agron 10:155–162
Johnson BG, Hale BA, Ormrod DP (1996) Carbon dioxide and ozone effects on growth of a
legume-grass mixture. J Environ Qual 25:908–916
Jonson JE, Simpson D, Fagerli H, Solberg S (2006) Can we explain the trends in European ozone
levels. Atmos Chem Phys 6:51–66
Kanerva T, Palojarvi A, Ramo K, Manninen S (2008) Changes in soil microbial community
structure under elevated tropospheric O3 and CO2. Soil Biol Biochem 40:2502–2510
Kangasjarvi J, Jaspers P, Kollist H (2005) Signalling and cell death in ozone-exposed plants. Plant
Cell Environ 28(1021):1036
Plant-Mediated Ecosystem Effects of Tropospheric Ozone
431
Karnosky DF, Gagnon ZE, Dickson RE, Coleman MD, Lee EH, Isebrands JG (1996) Changes in
growth, leaf abscission, biomass associated with seasonal tropospheric ozone exposures of
Populus tremuloides clones and seedlings. Can J For Res 26:23–37
Karnosky DF, Mankovska B, Percy K, Dickson RE, Podila GK, Sober J, Noormets A, Hendrey G,
Coleman MD, Kubiske M, Pregitzer KS, Isebrandts JG (1999) Effects of tropospheric ozone on
trembling aspen and interaction with CO2: results from an O3-gradient and a FACE experiment. Water Air Soil Pollut 116:311–322
Karnosky DF, Gielen B, Ceulemans R, Schlesinger WH, Norby RJ, Oksanen E, Matyssek R,
Hendrey GR (2001) FACE systems for studying the impacts of greenhouse gases on Forest
Ecosystems. In: Karnosky DF, Scarascia-Mugnozza G, Ceulemans R, Innes JL (eds) The
impacts of carbon dioxide and other greenhouse gases on forest ecosystems. CABI Press,
Wallingford, pp 297–324
Karnosky DF et al (2003) Tropospheric O3 moderates responses of temperate hardwood forests to
elevated CO2: a synthesis of molecular to ecosystem results from the Aspen FACE project.
Funct Ecol 17:289–304
Karnosky DF, Werner H, Holopainen T, Percy K, Oksanen T, Oksanen E, Heerdt C, Fabian P,
Nagy J, Heilman W, Cox R, Nelson N, Matyssek R (2007) Free-air exposure systems to scale
up ozone research to mature trees. Plant Biol 9:181–190
Kasurinen A, Keinanen MM, Kaipainen S, Nilsson LO, Vapaavuori E, Kontro MH, Holopainen T
(2005) Below-ground responses of silver birch trees exposed to elevated CO2 and O3 levels
during three growing seasons. Glob Change Biol 11:1167–1179
Kasurinen A, Peltonen P, Holopainen JK, Vapaavuori E, Holopainen T (2007a) Leaf litter under
changing climate: Will increasing levels of CO2 and O3 affect decomposition and nutrient
cycling processes? Dynamic Soil, Dynamic Plant. Glob Sci Books 1:58–67
Kasurinen A, Peltonen PA, Julkunen-Tiitto R, Vapaavuori E, Nuutinen V, Holopainen T,
Holopainen JK (2007b) Effects of elevated CO2 and O3 on leaf litter phenolics and subsequent
performance of litter-feeding soil macrofauna. Plant Soil 292:25–43
Keller T, Häsler R (1984) The influence of a fall fumigation with ozone on the stomatal behavior of
spruce and fir. Oecologia 64:284–286
Kerstiens G, Lendzian KJ (1989) Interaction between ozone and plant cuticles: I. ozone deposition
and permeability. New Phytol 112:13–19
Kitao M, Löw M, Heerdt C, Grams TEE, Häberle KH, Matyssek R (2009) Effects of chronic
elevated ozone exposure on gas exchange response of adult beech trees (Fagus sylvatica) as
related to the within-canopy light gradient. Environ Pollut 157:537–544
Kitao M, Winkler JB, Loew M, Nunn AJ, Kuptz D, Haeberle K-H, Reiter IM, Matyssek R (2012)
How closely does stem growth of adult beech (Fagus sylvatica) relate to net carbon gain under
experimentally enhanced ozone stress? Environ Pollut 166:108–115
Kolb TE, Matyssek R (2001) Limitations and perspectives about scaling ozone impact in trees.
Environ Pollut 115:373–393
Kostka-Rick R, Bender J, Bergmann E, Weigel HJ (2002) Symptoms of ozone-induced foliar
injury on horticultural crops. In: Klumpp A, Fomin A, Klumpp G, Ansel W (eds) Bioindication
and air quality in European cities. G. Heimbach, Stuttgart, pp 191–196
Kozovits AR, Matyssek R, Blaschke H, Gottlein A, Grams TEE (2005) Competition increasingly
dominates the responsiveness of juvenile beech and spruce to elevated CO2 and/or O3 concentrations throughout two subsequent growing seasons. Glob Change Biol 11:1387–1401
Kubiske ME, Quinn VS, Marquardt PE, Karnosky DF (2007) Effects of elevated atmospheric CO2
and/or O3 on intra- and interspecific competitive ability of aspen. Plant Biol 9:342–355
Laisk A, Kull O, Moldau H (1989) Ozone concentration in leaf intercellular air spaces is close to
zero. Plant Physiol 90:1163–1167
Laurence JA, Andersen CP (2003) Ozone and natural systems: understanding exposure, response,
and risk. Environ Int 29:155–160
Leisner CP, Ainsworth EA (2012) Quantifying the effects of ozone on plant reproductive growth
and development. Glob Change Biol 18:606–616
432
H.J. Weigel et al.
Lindroth RL (2010) Impacts of elevated atmospheric CO2 and O3 on forests: phytochemistry,
trophic Interactions, and ecosystem dynamics. J Chem Ecol 36:2–21
Liu LL, King JS, Giardina CP (2005) Effects of elevated concentrations of atmospheric CO2 and
tropospheric O3 on leaf litter production and chemistry in trembling aspen and paper birch
communities. Tree Physiol 25:1511–1522
Liu L, King JS, Giardina CP (2007) Effects of elevated atmospheric CO2 and tropospheric O3 on
nutrient dynamics: decomposition of leaf litter in trembling aspen and paper birch communities. Plant Soil 299:65–82
Long SP, Naidu SL (2002) Effects of oxidants at the biochemical, cell and physiological level. In:
Bell JNB, Treshow M (eds) Air pollution and plant life. Wiley, Chichester, pp 69–88
Loranger GI, Pregitzer KS, King JS (2004) Elevated CO2 and O3 concentrations differentially
affect selected groups of the fauna in temperate forest soils. Soil Biol Biochem 36:1521–1524
Manninen S, Aaltonen H, Kanerva T, Ramo K, Palojarvi A (2010) Plant and soil microbial
biomasses in Agrostis capillaris and Lathyrus pratensis monocultures exposed to elevated O3
and CO2 for three growing seasons. Soil Biol Biochem 42:1967–1975
Manning WJ, Krupa SV (1992) Experimental methodology for studying the effects of ozone on
crops and trees. In: Lefohn AS (ed) Surface level ozone exposure and their effects on
vegetation. Lewis, Chelsea, pp 93–156
Manning WJ, von Tiedemann A (1995) Climate change: potential effects of increased atmospheric
carbon dioxide (CO2), ozone (O3) and ultraviolet-B (UV-B) radiation on plant diseases.
Environ Pollut 88:219–245
Manning WJ, Godzik B, Musselman R (2002) Potential bioindicator plant species for ambient
ozone in forested mountain areas of central Europe. Environ Pollut 119:283–290
Manning WJ, Paoletti E, Sandermann H, Ernst D (2011) Ethylenediurea (EDU): a research tool for
assessment and verification of the effects of ground level ozone on plants under natural
conditions. Environ Pollut 159:3283–3293
Mansfield TA (1998) Stomata and plant water relations: does air pollution create problems?
Environ Pollut 101:1–11
Marenco AH, Gouget PN, Pages JP (1994) Evidence of a lon-term increase in tropospheric ozone
from Pic Du Midi data series: consequences positive radiative forcing. J Geophys Res 99:166–
177
Martin MJ, Host GE, Lenz KE, Isebrands JG (2001) Simulating the growth response of aspen to
elevated ozone: a mechanistic approach to scaling a leaf-level model of ozone effects on
photosynthesis to a complex canopy architecture. Environ Pollut 115:425–436
Massman WJ, Grantz DA (1995) Estimating canopy conductance to ozone uptake from observations of evapotranspiration at the canopy scale and at the leaf scale. Glob Change Biol 1:183–
198
Matyssek R, Sandermann H (2003) Impact of ozone on trees: an ecophysiological perspective.
Prog Bot 64:349–403
Matyssek R, Gunthardt-Georg MS, Maurer S, Keller T (1995) Nighttime exposure to ozone
reduces whole-plant production in Betula pendula. Tree Physiol 15:159–165
Matyssek R, LeThiec D, Low M, Dizengremel P, Nunn AJ, Häberle KH (2006) Interactions
between drought and O3 stress in forest trees. Plant Biol 8:11–17
Matyssek R, Sandermann H, Wieser G, Booker F, Cieslik S, Musselman R, Ernst D (2008) The
challenge of making ozone risk assessment for forest trees more mechanistic. Environ Pollut
156:567–582
Matyssek R, Karnosky DF, Wieser G, Percy K, Oksanen E, Grams TEE, Kubiske M, Hanke D,
Pretzsch H (2010a) Advances in understanding ozone impact on forest trees: messages from
novel phytotron and free-air fumigation studies. Environ Pollut 158:1990–2006
Matyssek R, Wieser G, Ceulemans R, Rennenberg H, Pretzsch H, Haberer K, Low M, Nunn AJ,
Werner H, Wipfler P, Oßwald W, Nikolova P, Hanke DE, Kraigher H, Tausz M, Bahnweg G,
Kitao M, Dieler J, Sandermann H, Herbinger K, Grebenc T, Blumenrother M, Deckmyn G,
Grams TEE, Heerdt C, Leuchner M, Fabian P, Haberle KH (2010b) Enhanced ozone strongly
Plant-Mediated Ecosystem Effects of Tropospheric Ozone
433
reduces carbon sink strength of adult beech (Fagus sylvatica): resume from the free-air
fumigation study at Kranzberg Forest. Environ Pollut 158:2527–2532
Matyssek R, Clarke N, Cudlin P, Mikkelsen TN, Tuovinen J-P, Wieser G, Paoletti E (eds) (2013)
Climate change, air pollution and global challenges: understanding and perspectives from
forest research. Developments in environmental science, vol 13, Elsevier, p 622
Maurer S, Matyssek R (1997) Nutrition and the ozone sensitivity of birch (Betula pendula),
II. Carbon balance, water-use efficiency and nutritional status of the whole plant. Trees
12:11–20
McAinsh MR, Evans NH, Montgomery LT, North KA (2002) Calcium signalling in stomatal
responses to pollutants. New Phytol 153:441–447
McDonald EP, Kruger EL, Riemenschneider DE, Isebrands JG (2002) Competitive status influences tree-growth responses to elevated CO2 and O3 in aggrading aspen stands. Funct Ecol
16:792–801
McLaughlin SB, Nosal M, Wullschleger SD, Sun G (2007a) Interactive effects of ozone and
climate on tree growth and water use in a southern Appalachian forest in the USA. New Phytol
174:109–124
McLaughlin SB, Wullschleger SD, Sun G, Nosal M (2007b) Interactive effects of ozone and
climate on water use, soil moisture content and streamflow in a southern Appalachian forest in
the USA. New Phytol 174:125–136
McLeod AR (1995) An open-air exposure system for exposure of young trees to sulphur dioxide
and ozone. Plant Cell Environ 18:215–225
MEA (Millennium Ecosystem Assessment) (2005) Ecosystems and human well-being: synthesis.
Island Press, Washington, DC
Meehan TD, Crossley MS, Lindroth RL (2010) Impacts of elevated CO2 and O3 on aspen leaf litter
chemistry and earthworm and springtail productivity. Soil Biol Biochem 42:1132–1137
Miglietta F, Peressotti A, Vaccari FP, Zaldei A, deAngelis P, Scarascia-Mugnozza G (2001) Freeair CO2 enrichment (FACE) of a poplar plantation: the POPFACE fumigation system. New
Phytol 150:465–476
Mills G, Harmens H (eds) (2011) Ozone pollution: a hidden threat to food security. Report
prepared by the ICP Vegetation. Centre for Ecology and Hydrology, Bangor
Mills G, Ball G, Hayes F, Fuhrer J, Skarby L, Gimeno B, De Temmerman L (2000) Development
of a multi-factor model for predicting the effects of ambient ozone on the biomass of white
clover. Environ Pollut 109:533–542
Mills G, Buse A, Gimeno B, Bermejo V, Holland M, Emberson L, Pleijel H (2007) A synthesis of
AOT40-based response functions and critical levels of ozone for agricultural and horticultural
crops. Atmos Environ 41:2630–2643
Mills G, Hayes F, Wilkinson S, Davies WJ (2009) Chronic exposure to increasing background
ozone impairs stomatal functioning in grassland species. Glob Change Biol 15:1522–1533
Mills G, Hayes F, Simpson D, Emberson L, Norris D, Harmens H, Büker P (2010) Evidence of
widespread effects of ozone on crops and (semi-)natural vegetation in Europe (1990–2006) in
relation to AOT40- and flux-based risk maps. Glob Change Biol 17:592–613
Mills G, Wagg S, Harmens H, Bender J, Bergmann E (2013) Effects of ozone on ecological
processes and supporting ecosystem services. In: Mills G, Wagg S, Harmens H (eds) Ozone
pollution: impacts on ecosystem services and biodiversity. Report prepared by the ICP
Vegetation. Centre for Ecology and Hydrology, Bangor, pp 17–23
Morgan PB, Ainsworth EA, Long SP (2003) How does elevated ozone impact soybean? A metaanalysis of photosynthesis, growth and yield. Plant Cell Environ 26:1317–1328
Morgan PB, Bernacchi CJ, Ort DR, Long SP (2004) An in vivo analysis of the effect of seasonlong open-air elevation of ozone to anticipated 2050 levels on photosynthesis in soybean. Plant
Physiol 135:2348–2357
Morgan PB, Mies TA, Bollero GA, Nelson RL, Long SP (2006) Season-long elevation of ozone
concentration to projected 2050 levels under fully open-air conditions substantially decreases
the growth and production of soybean. New Phytol 170:333–343
434
H.J. Weigel et al.
Morsky SK, Haapala JK, Rinnan R, Tiiva P, Saarnio S, Silvola J, Holopainen T, Martikainen PJ
(2008) Long-term ozone effects on vegetation, microbial community and methane dynamics of
boreal peatland microcosms in open-field conditions. Glob Change Biol 14:1891–1903
Musselman R, Hale BA (1997) Methods for controlled and field ozone exposures of forest tree
species in North America. In: Sandermann H, Wellburn AR, Heagle A (eds) Forest decline and
ozone. Ecological studies, vol 127. Springer, Berlin, pp 277–315
Nebel B, Fuhrer J (1994) Interspecific and intraspecific differences in ozone sensitivity in seminatural plant communities. Angew Bot 68:116–121
Nunn AJ, Cieslik S, Metzger U, Wieser G, Matyssek R (2010) Combining sap flow and eddy
covariance approaches to derive stomatal and non-stomatal O3 fluxes in a forest stand. Environ
Pollut 158:2014–2022
Nussbaum S, Bungener P, Geissmann M, Fuhrer J (2000) Plant-plant interactions and soil moisture
might be important in determining ozone impacts on grasslands. New Phytol 147:327–335
Nygaard PH (1994) Effects of ozone on Vaccinium myrtillus, Hylocomium splendens, Pleurozium
schreberi and Dicranum polysetum. Rapport fra skogforsk, pp 1–17
Oksanen E, Pandey V, Pandey AK, Keski-Saari S, Kontunen-Soppela S, Sharma C (2013) Impacts
of increasing ozone on indian plants. Environ Pollut 177:189–200
Olbrich M, Gerstner E, Welzl G, Winkler JB, Ernst D (2009) Transcript responses in leaves of
ozone-treated beech saplings seasons at an outdoor free air model fumigation site over two
growing seasons. Plant Soil 323:61–74
Ollinger SV, Aber JD, Reich PB (1997) Simulating ozone effects on forest productivity: interactions among leaf-, canopy-, and stand-level processes. Ecol Appl 7:1237–1251
Olszyk DM, Johnson MG, Phillips DL, Seidler RJ, Tingey DT, Watrud LS (2001) Interactive
effects of CO2 and O3 on a ponderosa pine plant/litter/soil mesocosm. Environ Pollut 115:447–
462
Oltmans SJ, Lefohn AS, Harris JM, Galbally I, Scheel HE, Bodeker G, Brunke E, Claude H,
Tarasick D, Johnson BJ, Simmonds P, Shadwick S, Anlauf K, Hayden K, Schmidlin F,
Fujimoto T, Akagi K, Meyer C, Nichol S, Davies J, Redondas A, Cuevas E (2006) Longterm changes in tropospheric ozone. Atmos Environ 40:3156–3173
Paoletti E, Grulke NE (2005) Does living in elevated CO2 ameliorate tree response to ozone? A
review on stomatal responses. Environ Pollut 137:483–493
Paoletti E, Grulke NE (2010) Ozone exposure and stomatal sluggishness in different plant
physiognomic classes. Environ Pollut 158:2664–2671
Payer HD, Blodow P, Kofferlein M, Lippert M, Schmolke W, Seckmeyer G, Seidlitz HK,
Strube D, Thiel S (1993) Controlled environment chambers for experimental studies on plant
responses to CO2 and interactions with pollutants. In: Schulze ED, Mooney HA (eds) Ecosystems research report Nr. 6: Design and execution of experiments on CO2 enrichment. Commission European Communities, Brussels, pp 127–145
Percy KE, Legge AH, Krupa SV (2003a) Tropospheric ozone: a continuing threat to global
forests? In: Karnosky DF, Percy KE, Chappelka AH, Simpson C, Pikkarainen J (eds) Air
pollution, global change and forests in the new millennium. Elsevier, Amsterdam, pp 85–118
Percy KE, Mankovska B, Hopkin A, Callan B, Karnosky DF (2003b) Ozone affects leaf surfacepest interactions. In: Karnosky DF, Percy KE, Chappelka AH, Simpson C, Pikkarainen J (eds)
Air pollution, global change and forests in the new millennium. Elsevier, Oxford, pp 247–258
Pfleeger TG, Plocher M, Bichel P (2010) Response of pioneer plant communities to elevated ozone
exposure. Agric Ecosyst Environ 138:116–126
Prather M, Gauss M, Berntsen T, Isaksen I, Sundet J, Bey I, Brasseur G, Dentener F, Derwent R,
Stevenson D, Grenfell L, Hauglustaine D, Horowitz L, Jacob D, Mickley L, Lawrence M, von
Kuhlmann R, Muller J, Pitari G, Rogers H, Johnson M, Pyle J, Law K, van Weele M, Wild O
(2003) Fresh air in the 21st century. Geophys Res Lett 30:1100–1104
Pregitzer KS, Burton AJ, King JS, Zak DR (2008) Soil respiration, root biomass, and root turnover
following long-term exposure of northern forests to elevated atmospheric CO2 and tropospheric O3. New Phytol 180:153–161
Plant-Mediated Ecosystem Effects of Tropospheric Ozone
435
Pregitzer KS, Talhelm AF (2013) Below ground carbon cycling at Aspen FACE: Dynamic
responses to CO2 and O3 in developing forest. In: Matyssek R, Clarke N, Cudlin P, Mikkelsen
TN, Tuovinen J-P, Wieser G, Paoletti E (eds) Climate change, air pollution and global
challenges: understanding and perspectives from forest research. Developments in Environmental Science, vol 13, Elsevier, pp 209–226
Pretzsch H, Schutze G (2009) Transgressive overyielding in mixed compared with pure stands of
Norway spruce and European beech in Central Europe: evidence on stand level and explanation on individual tree level. Eur J For Res 128:183–204
Pretzsch H, Dieler J, Matyssek R, Wipfler P (2010) Tree and stand growth of mature Norway
spruce and European beech under long-term ozone fumigation. Environ Pollut 158:1061–1070
Pritsch K, Esperschuetz J, Haesler F, Raidl S, Winkler B, Schloter M (2009) Structure and
activities of ectomycorrhizal and microbial communities in the rhizosphere of Fagus sylvatica
under ozone and pathogen stress in a lysimeter study. Plant Soil 323:97–109
Rämö K, Kanerva T, Nikula S, Ojanpera K, Manninen S (2006) Influences of elevated ozone and
carbon dioxide in growth responses of lowland hay meadow mesocosms. Environ Pollut
144:101–111
Rämö K, Kanerva T, Ojanpera K, Manninen S (2007) Growth onset, senescence, and reproductive
development of meadow species in mesocosms exposed to elevated O3 and CO2. Environ
Pollut 145:850–860
Rebbeck J, Blum U, Heagle AS (1988) Effects of ozone on the regrowth and energy reserves of a
ladino clover tall fescue pasture. J Appl Ecol 25:659–681
Reich PB (1987) Quantifying plant response to ozone: a unifying theory. Tree Physiol 3:63–91
Rhea L, King J, Kubiske M, Saliendra N, Teclaw R (2010) Effects of elevated CO2 and
tropospheric O3 on tree branch growth and implications for hydrologic budgeting. Environ
Pollut 158:1079–1087
Robinson M, Heath J, Mansfield T (1998) Disturbances in stomatal behaviour caused by air
pollutants. J Exp Bot 49:461–469
Rodenkirchen H, Gottlein A, Kozovits AR, Matyssek R, Grams TEE (2009) Nutrient contents and
efficiencies of beech and spruce saplings as influenced by competition and O3/CO2 regime. Eur
J For Res 128:117–128
Royal Society (2008) Ground-level ozone in the 21st century: future trends, impacts and policy
implications. RS policy document 15/08. The Royal Society, London
Sandermann H, Wellburn AR, Heath RL (1997) Forest decline and ozone: a comparison of
controlled chamber and field experiments. Ecological studies, vol 127, Springer, Berlin
Sarkar A, Agrawal SB (2010) Elevated ozone and two modern wheat cultivars: an assessment of
dose dependent sensitivity with respect to growth, reproductive and yield parameters. Environ
Exp Bot 69:328–337
Scebba F, Giuntini D, Castagna A, Soldatini G, Ranieri A (2006) Analysing the impact of ozone on
biochemical and physiological variables in plant species belonging to natural ecosystems.
Environ Exp Bot 57:89–97
Schloter M, Winkler JB, Aneja M, Koch N, Fleischmann F, Pritsch K, Heller W, Stich S, Grams
TEE, Gottlein A, Matyssek R, Munch JC (2005) Short term effects of ozone on the plantrhizosphere-bulk soil system of young beech trees. Plant Biol 7:728–736
Schrader S, Bender J, Weigel HJ (2009) Ozone exposure of field-grown winter wheat affects soil
mesofauna in the rhizosphere. Environ Pollut 157:3357–3362
Sheu BH, Liu CP (2003) Air pollution impacts on vegetation in Taiwan. In: Emberson L,
Ashmore M, Murray F (eds) Air pollution impacts on crops and forests: a global assessment.
Imperial College Press, London, pp 145–163
Shi GY, Yang LX, Wang YX, Kobayashi K, Zhu JG, Tang HY, Pan ST, Chen T, Liu G, Wang YL
(2009) Impact of elevated ozone concentration on yield of four Chinese rice cultivars under
fully open-air field conditions. Agric Ecosyst Environ 131:178–184
Shrestha A, Grantz DA (2005) Ozone impacts on competition between tomato and yellow
nutsedge: above- and below-ground effects. Crop Sci 45:1587–1595
436
H.J. Weigel et al.
Singh E, Tiwari S, Agrawal M (2009) Effects of elevated ozone on photosynthesis and stomatal
conductance of two soybean varieties: a case study to assess impacts of one component of
predicted global climate change. Plant Biol 11:101–108
Staehelin J (2001) Ozone measurements and trends (troposphere). In: Meyers RA (ed) Encyclopedia of physical science and technology, vol 11. Academic, New York, pp 539–561
Stampfli A, Fuhrer J (2010) Spatial heterogeneity confounded ozone-exposure experiment in seminatural grassland. Oecologia 162:515–522
Steubing L, Fangmeier A, Both R, Frankenfeld M (1989) Effects of SO2, NO2, and O3 on
population development and morphological and physiological-parameters of native herb
layer species in a beech forest. Environ Pollut 58:281–302
Stockwell WR, Kramm G, Scheel HE, Mohnen VA, Seiler W (1997) Ozone formation, destruction
and exposure in Europe and the United States. In: Sandermann H Jr, Wellburn AR, Heath RL
(eds) Forest decline and ozone, a comparison of controlled chamber and field experiments.
Ecological studies, vol 127. Springer, Berlin, pp 1–38
Stoelken G, Pritsch K, Simon J, Mueller CW, Grams TEE, Esperschuetz J, Gayler S, Buegger F,
Brueggemann N, Meier R, Zeller B, Winkler JB, Rennenberg H (2010) Enhanced ozone
exposure of European beech (Fagus sylvatica) stimulates nitrogen mobilization from leaf litter
and nitrogen accumulation in the soil. Plant Biosyst 144:537–546
Sun G, McLaughlin SB, Porter JH, Uddling J, Mulholland PJ, Adams MB, Pederson N (2012)
Interactive influences of ozone and climate on streamflow of forested watersheds. Glob Change
Biol 18:3395–3409
Tang H, Liua G, Hana Y, Zhu J, Kobayashi K (2011) A system for free-air ozone concentration
elevation with rice and wheat: control performance and ozone exposure regime. Atmos
Environ 45:6276–6282
Thomas VFD, Braun S, Fluckiger W (2006) Effects of simultaneous ozone exposure and nitrogen
loads on carbohydrate concentrations, biomass, growth, and nutrient concentrations of young
beech trees (Fagus sylvatica). Environ Pollut 143:341–354
Thwaites RH, Ashmore MR, Morton AJ, Pakeman RJ (2006) The effects of tropospheric ozone on
the species dynamics of calcareous grassland. Environ Pollut 144:500–509
Tonneijck AEG, Franzaring J, Brouwer G, Metselaar K, Dueck TA (2004) Does interspecific
competition alter effects of early season ozone exposure on plants from wet grasslands? Results
of a three-year experiment in open-top chambers. Environ Pollut 131:205–213
Topa MA, Vanderklein DW, Corbin A (2001) Effects of elevated ozone and low light on diurnal
and seasonal carbon gain in sugar maple. Plant Cell Environ 24:663–677
Uddling J, Teclaw RM, Kubiske ME, Pregitzer KS, Ellsworth DS (2008) Sap flux in pure aspen
and mixed aspen-birch forests exposed to elevated concentrations of carbon dioxide and ozone.
Tree Physiol 28:1231–1243
Uddling J, Teclaw RM, Pregitzer KS, Ellsworth DS (2009) Leaf and canopy conductance in aspen
and aspen-birch forests under free-air enrichment of carbon dioxide and ozone. Tree Physiol
29:1367–1380
Valkama E, Koricheva J, Oksanen E (2007) Effects of elevated O3, alone and in combination with
elevated CO2, on tree leaf chemistry and insect herbivore performance: a meta-analysis. Glob
Change Biol 13:184–201
Van Dingenen R, Dentener FJ, Raes F, Krol MC, Emberson L, Cofala J (2009) The global impact
of ozone on agricultural crop yields under current and future air quality legislation. Atmos
Environ 43:604–618
Vingarzan R (2004) A review of surface ozone background levels and trends. Atmos Environ
38:3431–3442
Volk M, Geissmann M, Blatter A, Contat F, Fuhrer J (2003) Design and performance of a free-air
exposure system to study long-term effects of ozone on grasslands. Atmos Environ 37:1341–
1350
Volk M, Bungener P, Contat F, Montani M, Fuhrer J (2006) Grassland yield declined by a quarter
in 5 years of free-air ozone fumigation. Glob Change Biol 12:74–83
Plant-Mediated Ecosystem Effects of Tropospheric Ozone
437
Volk M, Obrist D, Novak K, Giger R, Bassin S, Fuhrer J (2011) Subalpine grassland carbon
dioxide fluxes indicate substantial carbon losses under increased nitrogen deposition, but not at
elevated ozone concentration. Glob Change Biol 17:366–376
Wahid A (2006) Influence of atmospheric pollutants on agriculture in developing countries: a case
study with three new wheat varieties in Pakistan. Sci Total Environ 371:304–313
Wallin G, Skarby L (1992) The influence of ozone on the stomatal and non-stomatal limitation of
photosynthesis in Norway spruce, Picea abies (L.) Karst, exposed to soil moisture deficit. Trees
Struct Funct 6:128–136
Wang XP, Mauzerall DL (2004) Characterizing distributions of surface ozone and its impact on
grain production in China, Japan and South Korea: 1990 and 2020. Atmos Environ 38:4383–
4402
Wang XZ, Taub DR (2010) Interactive effects of elevated carbon dioxide and environmental
stresses on root mass fraction in plants: a meta-analytical synthesis using pairwise techniques.
Oecologia 163:1–11
Watanabe M, Yamaguchi M, Tabe C, Iwasaki M, Yamashita R, Funada R, Fukami M,
Matsumura H, Kohno Y, Izuta T (2007) Influences of nitrogen load on the growth and
photosynthetic responses of Quercus serrata seedlings to O3. Trees Struct Funct 21:421–432
Watanabe M, Hoshika Y, Inada N, Wang X, Mao Q, Koike T (2013) Photosynthetic traits of
Siebold’s beech and oak saplings grown under free air ozone exposure in northern Japan.
Environ Pollut 174:50–56
Wedlich KV, Rintoul N, Peacock S, Cape JN, Coyle M, Toet S, Barnes J, Ashmore M (2012)
Effects of ozone on species composition in an upland grassland. Oecologia 168:1137–1146
Werner H, Fabian P (2002) Free-air fumigation of mature trees—a novel system for controlled
ozone enrichment in grown-up beech and spruce canopies. Environ Sci Pollut Res 9:117–121
Wieser G, Matyssek R (2007) Linking ozone uptake and defense towards a mechanistic risk
assessment for forest trees. New Phytol 174:7–9
Wild O, Fiore AM, Shindell DT, Doherty RM, Collins WJ, Dentener FJ, Schultz MG, Gong S,
MacKenzie IA, Zeng G, Hess P, Duncan BN, Bergmann DJ, Szopa S, Jonson JE, Keating TJ,
Zuber A (2012) Modelling future changes in surface ozone: a parameterized approach. Atmos
Chem Phys 12:2037–2054
Wilkinson S, Davies WJ (2010) Drought, ozone, ABA and ethylene: new insights from cell to
plant to community. Plant Cell Environ 33:510–525
Wilkinson S, Mills G, Illidge R, Davies WJ (2012) How is ozone pollution reducing our food
supply? J Exp Bot 63:527–536
Winner WE, Lefohn AS, Cotter IS, Greitner CS, Nellessen J, McEvoy LR Jr, Olson RL, Atkinson
CJ, Moore LD (1989) Plant responses to elevational gradients of O3 exposures in Virginia. Proc
Natl Acad Sci USA 86:8828–8832
Winwood J, Pate AE, Price J, Hanke DE (2007) Effects of long-term, free-air ozone fumigation on
the cytokinin content of mature beech trees. Plant Biol 9:265–278
Wittig VE, Ainsworth EA, Long SP (2007) To what extent do current and projected increases in
surface ozone affect photosynthesis and stomatal conductance of trees? A meta-analytic review
of the last 3 decades of experiments. Plant Cell Environ 30:1150–1162
Wittig VE, Ainsworth EA, Naidu SL, Karnosky DF, Long SP (2009) Quantifying the impact of
current and future tropospheric ozone on tree biomass, growth, physiology and biochemistry: a
quantitative meta-analysis. Glob Change Biol 15:396–424
Wyness K, Mills G, Jones L, Barnes JD, Jones DL (2011) Enhanced nitrogen deposition exacerbates the negative effect of increasing background ozone in Dactylis glomerata, but not
Ranunculus acris. Environ Pollut 159:2493–2499
Yoshida LC, Gamon JA, Andersen CP (2001) Differences in above- and below-ground responses
to ozone between two populations of a perennial grass. Plant Soil 233:203–211
Zak DR, Holmes WE, Pregitzer KS, King JS, Ellsworth DS, Kubiske ME (2007) Belowground
competition and the response of developing forest communities to atmospheric CO2 and O3.
Glob Change Biol 13:2230–2238
438
H.J. Weigel et al.
Zak DR, Kubiske ME, Pregitzer KS, Burton AJ (2012) Atmospheric CO2 and O3 alter competition
for soil nitrogen in developing forests. Glob Chang Biol 18:1480–1488
Zeng G, Pyle JA, Young PJ (2008) Impact of climate change on tropospheric ozone and its global
budgets. Atmos Chem Phys 8:369–387
Zheng F, Wang X, Zhang W, Hou P, Lu F, Du K, Sun Z (2013) Effects of elevated O3 exposure on
nutrient elements and quality of winter wheat and rice grain in Yangtze River Delta, China.
Environ Pollut 179:19–26
Zhu XK, Feng ZZ, Sun TF, Liu XC, Tang HY, Zhu JG, Guo WS, Kobayashi K (2011) Effects of
elevated ozone concentration on yield of four Chinese cultivars of winter wheat under fully
open-air field conditions. Glob Change Biol 17:2697–2706