/


Автор: Li G.
Теги: medicine biology microbiology practical medicine springer publisher bionics laser micro nanofabrication
ISBN: 2190-5053
Год: 2018


Текст
Springer Theses
Recognizing Outstanding Ph.D. Research
Aims and Scope
The series “Springer Theses” brings together a selection of the
very best Ph.D. theses from around the world and across the
physical sciences. Nominated and endorsed by two recognized
specialists, each published volume has been selected for its
scientific excellence and the high impact of its contents for the
pertinent field of research. For greater accessibility to nonspecialists, the published versions include an extended introduction,
as well as a foreword by the student’s supervisor explaining the
special relevance of the work for the field. As a whole, the series will
provide a valuable resource both for newcomers to the research
fields described, and for other scientists seeking detailed
background information on special questions. Finally, it provides an
accredited documentation of the valuable contributions made by
today’s younger generation of scientists.
Theses are accepted into the series by invited nomination
only and must fulfill all of the following criteria
They must be written in good English.
The topic should fall within the confines of Chemistry, Physics,
Earth Sciences, Engineering and related interdisciplinary fields
such as Materials, Nanoscience, Chemical Engineering,
Complex Systems and Biophysics.
The work reported in the thesis must represent a significant
scientific advance.
If the thesis includes previously published material, permission
to reproduce this must be gained from the respective copyright
holder.
They must have been examined and passed during the 12
months prior to nomination.
Each thesis should include a foreword by the supervisor
outlining the significance of its content.
The theses should have a clearly defined structure including an
introduction accessible to scientists not expert in that particular
field.
More information about this series at http://www.springer.com/
series/8790
Guoqiang Li
Bionic Functional Structures by
Femtosecond Laser
Micro/nanofabrication Technologies
Doctoral Thesis accepted by the University of Science and
Technology of China, Hefei, China
Guoqiang Li
Department of Precision Instrument and Machinery, University of Science
and Technology of China, Hefei, China
ISSN 2190-5053 e-ISSN 2190-5061
Springer Theses
ISBN 978-981-13-0358-6 e-ISBN 978-981-13-0359-3
https://doi.org/10.1007/978-981-13-0359-3
Library of Congress Control Number: 2018940408
© Springer Nature Singapore Pte Ltd. 2018
This work is subject to copyright. All rights are reserved by the
Publisher, whether the whole or part of the material is concerned,
specifically the rights of translation, reprinting, reuse of illustrations,
recitation, broadcasting, reproduction on microfilms or in any other
physical way, and transmission or information storage and retrieval,
electronic adaptation, computer software, or by similar or dissimilar
methodology now known or hereafter developed.
The use of general descriptive names, registered names,
trademarks, service marks, etc. in this publication does not imply,
even in the absence of a specific statement, that such names are
exempt from the relevant protective laws and regulations and
therefore free for general use.
The publisher, the authors and the editors are safe to assume that
the advice and information in this book are believed to be true and
accurate at the date of publication. Neither the publisher nor the
authors or the editors give a warranty, express or implied, with
respect to the material contained herein or for any errors or
omissions that may have been made. The publisher remains neutral
with regard to jurisdictional claims in published maps and institutional
affiliations.
This Springer imprint is published by the registered company
Springer Nature Singapore Pte Ltd. part of Springer Nature
The registered company address is: 152 Beach Road, #21-01/04
Gateway East, Singapore 189721, Singapore
Supervisor’s Foreword
With the development of industry and society, more environmental
problems such as atmospheric pollution resulting from the heavy use
of paint and the exhaust emission, and water pollution from industrial
discharge of organic solvents, offshore oil accidents, and marine
transportation have emerged as a critical worldwide issue, imposing
severe environmental and ecological damage. The creatures in
nature can skillfully and easily solve these thorny problems which
have been bothering human beings. Thanks to the development of
science and technology, people have gradually revealed the
mysteries of nature, such as the structural colors of butterfly, selfcleaning effect of lotus leaf, and underwater superoleophobicity of
fish scales. Very recently, the biomimetic preparation has attracted a
wide range of interests, and inspired by nature, people also have
imitated their structures by various methods, thus realizing the
functions.
Based on the above background, this doctoral thesis by
Guoqiang Li proposed the research of “Bionic Functional Structures
by Femtosecond Laser Micro/nanofabrication Technologies.” Laser
processing has emerged as one-step and fast method without mask
and harsh environment to prepare special surface
micro-/nanostructures, even complex 3D structures overcoming the
disadvantages of traditional methods. In this doctoral thesis, a
variety of bionic functional structures are designed and produced by
combining the advanced femtosecond laser micro-/nanofabrication
technology and cutting-edge bionic technology.
As a supervisor of Dr. Guoqiang Li, I’m very pleased to be
informed that he was entitled as reward-gainer of the excellent Ph.D.
dissertations by the Chinese Academy of Sciences. We believe the
original and novel works presented in this doctoral thesis will attract
the readers of various research fields including
micro/nanofabrication, biosurface, chemistry, physics, and would be
of general interest to the broad readership.
Prof. Jiaru Chu
Hefei, China
April 2018
Abstract
Some living organisms have developed the obviously morphological
and anatomical characteristics during the long period of stringent
evolution to maintain habits and lifestyles in harmony with nature.
Learning from nature, the living organisms in nature give us
inspiration to design and create high-performance functional
structures and devices to solve the tough problems in daily life.
In this work, the preparation of bionic functional
micro/nanostructures was proposed by combining the advanced
femtosecond laser micro/nanofabrication technology and cuttingedge bionic design. The details are given as follows:
(1) Based on the understanding of the relationship between the
structures and the colors in nature, such as peacock feathers,
butterfly wings, we prepared various micro/nanostructures and
realized colorizing the material’s surface without pigment. By
adopting different laser pulse overlaps, several kinds of
structural colors that are independent of the viewing angles,
such as golden, white, gray, and black, were produced on the
aluminum surfaces. Considering the laser-induced periodic
surface structures (LIPSSs) as a kind of grating structures, we
not only discussed the combined influence of incident light
angle and the ripples orientation on the diversity of structural
colors, but also proposed the possibility of producing
multipatterns constituted by ripples with different orientations,
and realized the diverse and exclusive display. In addition, an
innovative method was proposed to produce three-dimensional
effect patterns on metal surface by translating each layer in one
direction.
(2) A facile approach was developed to prepare large-area
functional polymer surface duplicated from the metal. The
aluminum was firstly scanned by femtosecond laser beam with
different pulse overlaps to form hierarchical structures. Then,
the aluminum pieces acted as template masters and the
hierarchical structures were subsequently transferred onto
hierarchical structures were subsequently transferred onto
polydimethylsiloxane (PDMS) surfaces. It was found that the
polymer replicas are endowed with tunable wetting properties.
The reusability of metal master and easiness of soft lithography
make it to be a very simple, fast, and cost-efficient way for
mass production of functional polymeric surfaces.
(3) The capability to realize 2D–3D controllable metallic
micro/nanostructures is of key importance for various fields
such as plasmonics, electronics, bioscience, and chemistry due
to unique properties such as electromagnetic field
enhancement, catalysis, photoemission, and conductivity.
However, most of the present techniques are limited to lowdimension (1D–2D), small-area, or single function. Here, we
reported the assembly of self-organized three-dimensional (3D)
porous metal micro/nanocage arrays on nickel surface by
ethanol-assisted femtosecond laser irradiation. The underlying
formation mechanism was investigated by a series of
femtosecond laser irradiation under different exposure time. We
also demonstrated the ability to control the size of
micro/nanocage arrays from 0.8 to 2 μm by different laser pulse
energy. This method features rapidness (~10 min), simplicity
(one-step process), and ease of large-area (4 cm 2 or more)
fabrication. The 3D cage-like micro/nanostructures exhibit not
only improved antireflection from 80% to 7% but also enhanced
hydrophobicity from 98.5° to 142° without surface modification.
(4) The preparation of superhydrophilic, superoleophilic,
underwater superoleophobic surfaces is inspired by natural
surfaces such as fish scales possessing hierarchical
micro/nanostructures. We reported the assembly of selforganized hierarchical microcone arrays on a nickel surface by
sucrose solution-assisted femtosecond laser irradiation. The
processed surface is superhydrophilic (13.47° ~ 4.01°),
superoleophilic (7.45° ~ 3.73°), and underwater
superoleophobic (135.22° ~ 166.16°) which are comparable to
those of fish scales. The wettabilities of the processed surfaces
are tunable by adjusting the mass ratio of sucrose to water and
y j
g
pulse energy to control the height (1.62 ~ 10.34 μm) and size
(2.1 ~ 2.81 μm) of the microcones. Multifunctional liquid
manipulation such as microdroplet transferring, static and
dynamic storage, liquid transportation, and mixing is
demonstrated.
(5) A new approach based on liquid (ethanol and sucrose
solution)-assisted femtosecond laser irradiation on silicon
substrates was proposed for the preparation of controllable
microcones and micromolars arrays. Their height can be
controlled from 3.3 to 17.6 μm for microcones and 5.9 ~ 33.7
μm for micromolars by adjusting the pulse energy. The
processed surfaces are superhydrophilic (25.05° ~ 2.46°),
superoleophilic (7.22° ~ 0), and underwater superoleophobic
(124.9° ~ 169.2°). The surfaces further demonstrate many
distinct functions such as fog collecting and volatilizing, droplet
storage and transportation, and liquid directional transfer.
(6) A kind of novel multifunctional ultrathin aluminum foil which
consists of large-area regular micropore arrays covered with
nanostructures was presented. These hierarchical
micro/nanostructures show underwater superoleophobic ability
and oil/water separation function. The novel foils were realized
by one-step femtosecond laser irradiation, which is a simple
and promising method for preparing special
micro/nanostructures due to its high precision, excellent
controllability, one-step processing, and compatibility with
various materials. In addition, the micropore-arrayed aluminum
foil also shows robust filtering performance for particles with
different sizes, exhibiting multifunctional applications.
Keywords
Bionic functions · Femtosecond laser processing ·
Micro/nanostructures · Structural colors · Superhydrophobic ·
Underwater superoleophobic
Parts of this thesis have been published in the
following journal articles:
1. Guoqiang Li, Hua Fan, Feifei Ren, Chen Zhou, Zhen Zhang,
Bing Xu, Sizhu Wu, Yanlei Hu, Wulin Zhu, Jiawen Li, Yishan
Zeng, Xiaohong Li, Jiaru Chu and Dong Wu, 2016,
Multifunctional ultrathin aluminum foil: oil/water separation and
particle filtration. Journal of Materials Chemistry A , 4 , 18832–
18840. DOI: 10.1039/C6TA08231A.
2. Guoqiang Li, Yang Lu, Peichao Wu, Zhen Zhang, Jiawen Li,
Wulin Zhu, Yanlei Hu, Dong Wu and Jiaru Chu, 2015, Fish scale
inspired design of underwater superoleophobic microcone
arrays by sucrose solution assisted femtosecond laser
irradiation for multifunctional liquid manipulation. Journal of
Materials Chemistry A , 3 , 18675–18683. DOI:
10.1039/C5TA05265C.
3. Guoqiang Li, Jiawen Li, Chenchu Zhang, Yanlei Hu, Xiaohong
Li, Jiaru Chu, Wenhao Huang and Dong Wu, 2014, Large-area
one-step assembly of three-dimensional porous metal
micro/nanocages by ethanol-assisted femtosecond laser
irradiation for enhanced antireflection and hydrophobicity. ACS
Applied Materials & Interfaces , 7 , 383–390. DOI:
10.1021/am506291f.
4. Guoqiang Li, Zhen Zhang, Peichao Wu, Sizhu Wu, Yanlei Hu,
Wulin Zhu, Jiawen Li, Dong Wu, Xiaohong Li and Jiaru Chu,
2016, One-step facile fabrication of controllable microcone and
micromolar silicon arrays with tunable wettability by liquidassisted femtosecond laser irradiation. RSC Advances , 6 ,
37463–37471. DOI: 10.1039/C6RA06949E.
Guoqiang Li Jiawen Li Liang Yang Xiaohong Li Yanlei Hu
5.
Guoqiang Li, Jiawen Li, Liang Yang, Xiaohong Li, Yanlei Hu,
Jiaru Chu, Wenhao Huang, 2013, Evolution of aluminum surface
irradiated by femtosecond laser pulses with different pulse
overlaps. Applied Surface Science , 276 , 203–209. DOI:
10.1016/j.apsusc.2013.03.067.
6. Guoqiang Li, Jiawen Li, Yanlei Hu, Chenchu Zhang, Xiaohong
Li, Jiaru Chu, Wenhao, 2014, Realization of diverse displays for
multiple color patterns on metal surfaces. Applied Surface
Science , 316 , 451–455. DOI : 10.1016/j.apsusc.2014.08.030.
7. Guoqiang Li, Jiawen Li, Yanlei, Chenchu Zhang, Xiaohong Li,
Jiaru Chu, Wenhao Huang, 2016, Femtosecond laser color
marking stainless steel surface with different wavelengths.
Applied Physics A , 118 , 1189–1196. DOI : 10.1007/s00339014-8868-3.
8. Yanlei Hu, Guoqiang Li, Jianwen Cai, Chenchu Zhang, Jiawen
Li, Jiaru Chu, Wenhao Huang, 2014, Facile fabrication of
functional PDMS surfaces with tunable wettablity and high
adhesive force via femtosecond laser textured templating. AIP
Advances , 4 , DOI: 10.1063/1.4905052.
Contents
1 Introduction
1.1 Structural Colors
1.1.1 Common Structural Colors in Nature
1.1.2 Research Progress of Bionic Structural Colors
1.2 Basic Concept of Wettability
1.2.1 Contact Angle
1.2.2 Sliding Angle
1.3 SuperhydrophobicPhenomena and Bionic Study
1.3.1 SuperhydrophobicPhenomena in Nature
1.3.2 Preparation Methods of SuperhydrophobicSurfaces
1.4 Underwater SurperoleophobicSurfaces
1.5 Main Research Contents
References
2 Key Technical Problems of Femtosecond Laser Bionic
Surfaces
2.1 Femtosecond Laser Micro/Nanofabrication Equipment
and Systems
2.2 Material and Their Parameters
2.3 Technological Process
2.4 The Influence of Laser Parameters and Environment on
the Morphology of the Micro/Nanostructures
References
3 Study on Femtosecond Laser Induced Structural Colors
3.1 Femtosecond Laser Induced Structural Colors on
Aluminum Surfaces
3.2 Diverse Displays for Multiple Color Patterns on Stainless
Steel Surfaces
3.3 The Preparation of Three-Dimensional (3D) Patterns
3.4 Coloring Metal Surface with Different Laser Wavelengths
References
4 Facile Fabrication of Functional PDMS Surfaces via
Femtosecond Laser Textured Templating
4.1 Optical and Morphology Properties of Aluminum
Templates
4.2 Polymer Replicas of Metal Masters and Their Wetting
Properties
4.3 Tunable Contact Angle and Strong Adhesion Force
Reference
5 Multifunctional Three-Dimensional Porous Metal Micro/
Nanocages by Ethanol-Assisted Femtosecond Laser Irradiation
5.1 Experimental Section
5.2 Formation of 3D Micro/Nanocage-like Structures
5.3 Precisely Controlling the Micro/Nanocages Size by
Adjusting the Laser Pulse Energy
5.4 Enhanced Antireflection of 3D Porous Metal Micro/
Nanocages
5.5 The Wetting Property of 3D Porous Metal Micro/
Nanocages
References
6 Microcone Arrays by Sucrose Solution Assisted Femtosecond
Laser Irradiation
6.1 Experimental Section
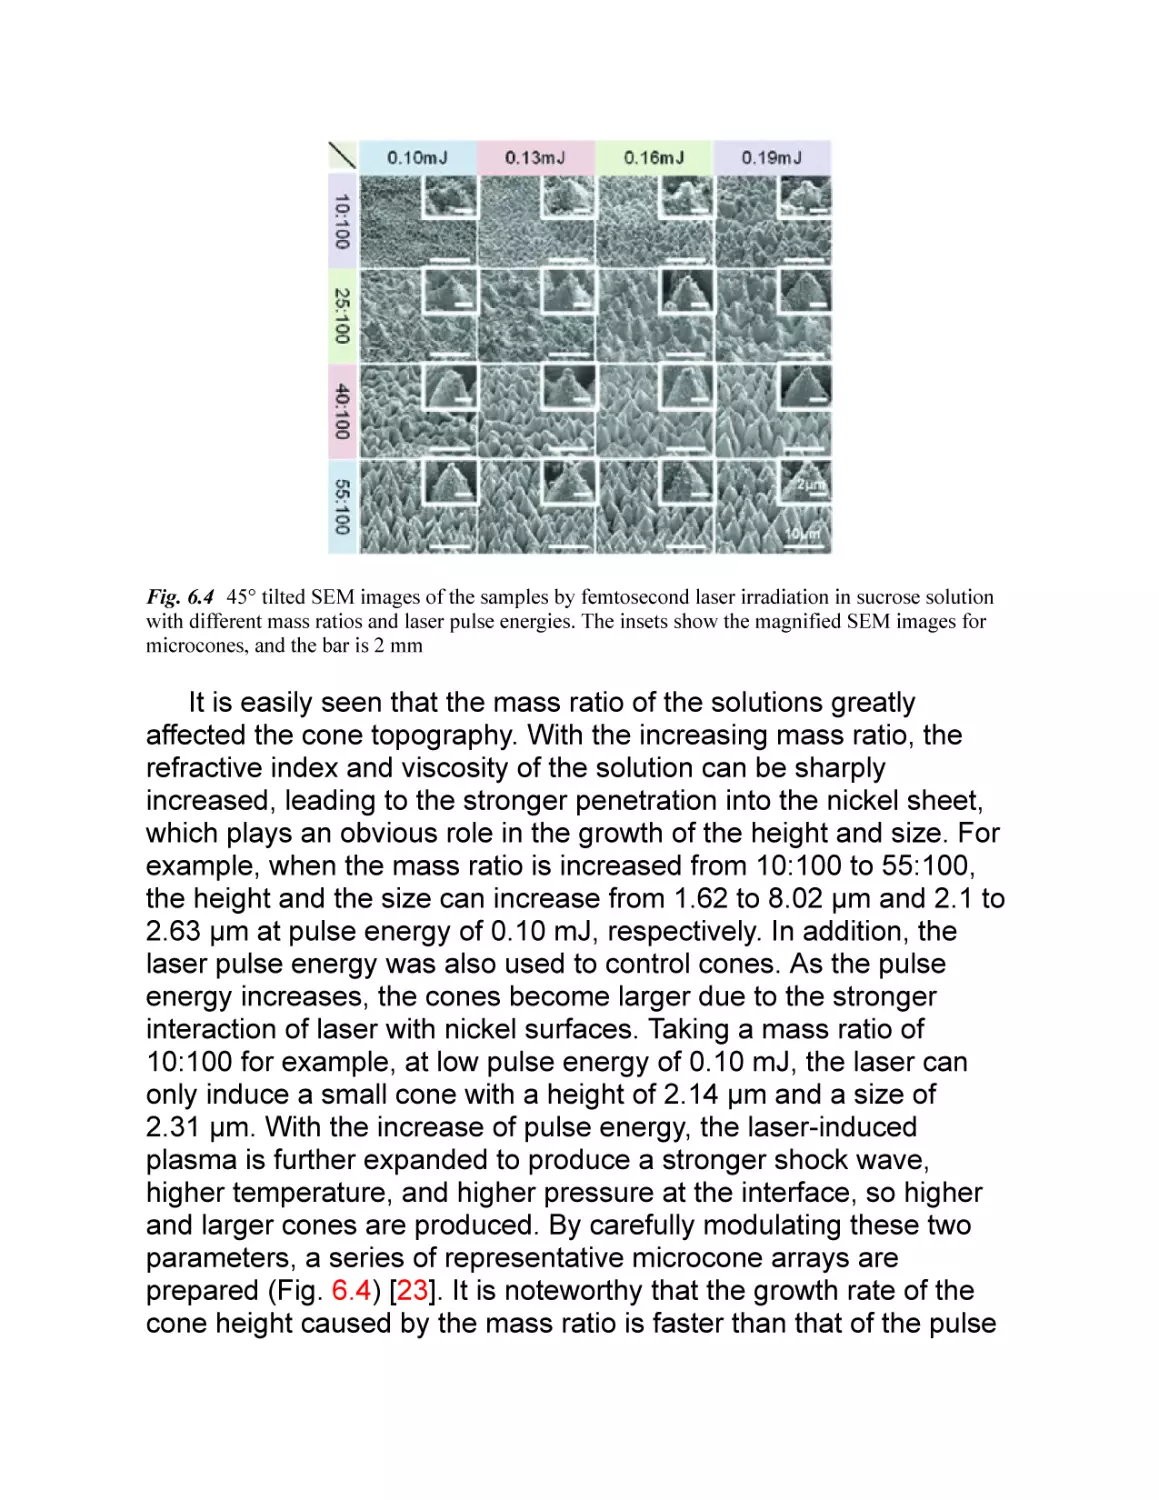
6.2 Preparation of Microcone Arrays
6.3 Precisely Controlling the Growth of the Cone by
Adjusting the Mass Ratio of the Sucrose Solution and the
Laser Pulse Energy
6.4 The Wettabilities of the Microcone Arrays
6.5 The Liquid Manipulation
6.5.1 Liquid Droplet Transferring
6.5.2 Liquid Storage
6.5.3 Liquid Transportation
6.5.4 Liquid Mixing
References
7 Fabrication of Controllable Microcone and Micromolar Silicon
Arrays with Tunable Wettability by Liquid-Assisted
Femtosecond Laser Irradiation
7.1 Experimental Section
7.2 Formation of Microcone and Micromolar Arrays in
Ethanol and Sucrose Solutions
7.3 Precisely Controlling the Growth of the Microcones and
Micromolars Arrays by the Laser Pulse Energy
7.4 The Wettability of the Microcones and Micromolars
Arrays
7.4.1 The Superhydrophilicity/Superoleophilicity
7.4.2 Underwater Superoleophobicity and Oil Droplet
Manipulation
7.4.3 The Anisotropic Wetting and Sliding Behavior
References
8 Micropore-Arrayed Ultrathin Aluminum Foil for Oil/Water
Separation and Particle Filtration
8.1 The Preparation of the Micropore-Arrayed Aluminum
Foils
8.2 The Wettability of the Micropore-Arrayed Aluminum Foils
8.3 The Oil/Water Separation by the Micropore-Arrayed
Aluminum Foils
8.4 The Filtration of Particles with Different Diameters
References
9 Conclusions and Outlook
© Springer Nature Singapore Pte Ltd. 2018
Guoqiang Li, Bionic Functional Structures by Femtosecond Laser Micro/nanofabrication
Technologies, Springer Theses: Recognizing Outstanding Ph.D. Research,
https://doi.org/10.1007/978-981-13-0359-3_1
1. Introduction
Guoqiang Li1
(1) Department of Precision Instrument and Machinery, University of
Science and Technology of China, Hefei, China
Guoqiang Li
Email: guoqli@ustc.edu.cn
Experienced the long period of stringent evolution, the living
organisms develop their unique structures and materials through
natural selection, and thus adapt to the nature. Inspired by the living
organisms, a new, interdisciplinary, and cutting-edge bionics which
permeates and combines not just biology, computer science, but
also nanotechnology, materials science, chemistry, physics has
grown considerably in recent years [1–3]. Bionics refers to the
application of biological methods, structures, functions, and systems
found in nature to the study and design of engineering systems and
modern technology for the purpose of solving complex problems
which have troubled human beings for decades [1–3]. A
crystallization of mankind’s intelligence, bionics is a significant
symbol of scientific and technological progress, which may find a
wide range of applications in communications, mechanical
engineering, biomedicine, artificial intelligence and so on.
1.1 Structural Colors
1.1.1 Common Structural Colors in Nature
An important branch of bionics is the study of why the living
organisms produce colors and how to implement them manually. As
far as the color principle is concerned, the colors can be divided into
chemical color [4, 5] and physical color [6–8]. Chemical color usually
refers to the color produced by the absorption of light through the
pigment. The physical color is from the micro/nanostructures, namely
the structural colors, and it can be explained as the interference [9–
11], diffraction [12–14], and scattering [15–18] of the incident light.
Using modern testing methods, scientists have obtained the
understanding of the formation mechanism of the structural colors.
For example, E. Shevtsova [19] reported the striking and stable
structural color patterns in the transparent wings of small
hymenoptera and diptera, which is caused by thin film interference.
Zi [20] reported the mechanism of color production in peacock
feathers, and found that the cortex in differently colored barbules,
which contains 2D photonic-crystal structures are responsible for
coloration of the peacock feathers. The simulated results indicate
that the coloration strategies in peacock feathers are very ingenious
and simple: controlling the lattice constant and the number of periods
in the photonic-crystal structures.
1.1.2 Research Progress of Bionic Structural Colors
With the development of micro and nano-fabrication technology, the
preparation of structural colors with artificial methods has appeared.
At present, the methods mainly contain self-assembly [21], plate
printing [22], and laser direct writing [21, 23–27].
For example, Chun [21] created a large, flexible reflector that
actually provides better angle-independent color characteristics than
Morpho butterflies and which can be bent and folded freely without
losing its Morpho-mimetic photonic properties by using a
combination of directional deposition, silica microspheres with a wide
size distribution, and a PDMS encasing.
Kim [22] demonstrated the high-resolution patterning of multiple
structural colors within seconds, based on successive tuning and
fixing of color using a single material along with a maskless
lithography system. They invented a material called ‘M-Ink’, the color
of which is tunable by magnetically changing the periodicity of the
nanostructure and fixable by photochemically immobilizing those
structures in a polymer network. This simple, controllable, and
scalable structural color printing scheme presented may have a
significant impact on color production for general consumer goods.
Femtosecond (fs) laser micromachining has emerged as a new
technique for micro/nano structure fabrication in recent years due to
the ultra-short time scale, ultra-high peak power density
characteristics of the femtosecond lasers, and its applicability to
virtually all kinds of materials in an easy one-step process with very
high resolution and accuracy. Vorobyev and Guo [23–27]
demonstrated the preparing of structural colors on metal surfaces
with femtosecond laser processing technique to provide a
controllable modification of optical properties of metals from UV to
terahertz via surface structuring on the nano-, micro-, and
submillimeter-length scales (Fig. 1.1) Giving the additional
advantages of laser processing such as low contamination and
capability to process complicated shapes, the color metals have
tremendous potential in various technological applications [23].
Fig. 1.1 Color aluminum due to femtosecond laser-induced LIPSSs
It is indicated that the focused laser beam can induce periodic
structures with size typically in the order of the wavelength when the
laser power is close to the damage threshold [28–31]. This periodic
structure is called laser-induced periodic surface structures (LIPSS)
[28–31]. In addition, it is indicated that the ripples (LIPSSs)
orientation usually is perpendicular to the polarization of laser pulse
[32–35]. Dusse [36] considered these LIPSSs as a kind of grating
structures, which could play important roles in modifying the optical
properties of metal surfaces in a very versatile way. By using
nanostructures with controlled orientations, specific color patterns
can be generated (Fig. 1.2).
Fig. 1.2 Color effects by controlled nanostructures with femtosecond laser on stainless steel surface
The laser induced periodic surface structures have attracted
great interest due to their wide applications in color display, anticounterfeiting, decoration, sensing, and optical data storage etc. [36,
37]. It is found that in most cases the periods of LIPSSs are slightly
smaller than laser wavelength. For color display, LIPSS are usually
employed because their periods fabricated by femtosecond laser
lasers with central wavelength of 800 nm can effectively diffract white
light and exhibit vivid structural colors [37]. From the viewpoint of
practical application, it is essential to produce deep and uniform
ripples that can be extended to a large area. It is indicated that the
quality of the formed ripples depends strongly on the irradiation
fluence of the laser pulses and the scanning speed of the laser beam
[37]. Yao [37] decorated the same or different regions of the
stainless steel surface with two or more types of high quality ripples
with different orientations by skillfully choose the fluence, scanning
speed, and the polarization of the laser beam (Fig. 1.3). In this way,
different patterns with different spatial overlapping can be selectively
displayed with structural colors when illuminating with white light
[37].
Fig. 1.3 Selective display of the two patterns by irradiating white light
In addition to this, scientists have explored many other artificial
methods for preparing kinds of structural colors. Moreover, the rapid
development of modern manufacturing industry and the precise
machining technique makes the preparation technology of structural
colors more mature [37–47].
1.2 Basic Concept of Wettability
1.2.1 Contact Angle
Wettability is a fundamental property of a solid surface, which refers
the ability of a liquid to maintain contact with a solid surface resulting
from intermolecular interactions when the two are brought together
[48–50]. Contact Angle θ is an important index of the wettability of
the material surface by a liquid via the Young equation [51–57]. The
contact angle is related to the surface tension of the liquid and to the
interfacial tension between the liquid and the solid [58–64]. When the
surface tension of the liquid is less than that of the solid, the liquid
will spread on the solid surface as much as possible [58–64]. On the
contrary, the liquid will sit on the solid surface in a shape of sphere
[58–64].
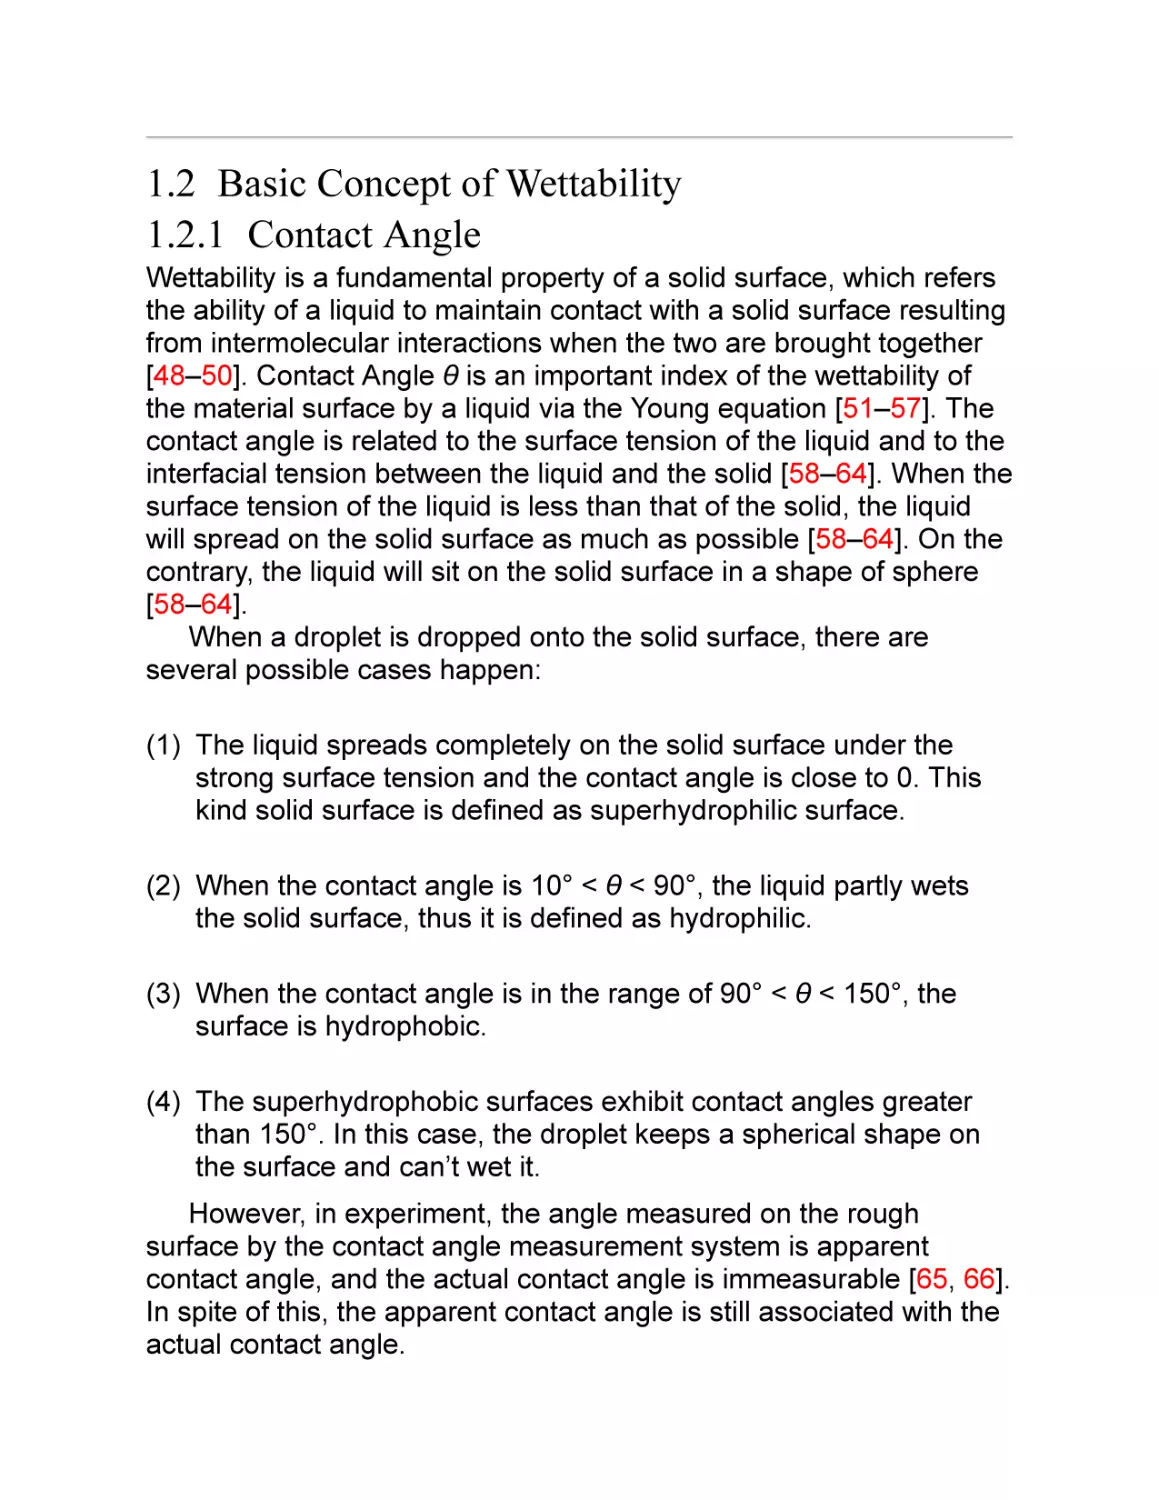
When a droplet is dropped onto the solid surface, there are
several possible cases happen:
(1) The liquid spreads completely on the solid surface under the
strong surface tension and the contact angle is close to 0. This
kind solid surface is defined as superhydrophilic surface.
(2) When the contact angle is 10° < θ < 90°, the liquid partly wets
the solid surface, thus it is defined as hydrophilic.
(3) When the contact angle is in the range of 90° < θ < 150°, the
surface is hydrophobic.
(4) The superhydrophobic surfaces exhibit contact angles greater
than 150°. In this case, the droplet keeps a spherical shape on
the surface and can’t wet it.
However, in experiment, the angle measured on the rough
surface by the contact angle measurement system is apparent
contact angle, and the actual contact angle is immeasurable [65, 66].
In spite of this, the apparent contact angle is still associated with the
actual contact angle.
According to this situation, Wenzel [65], Cassie, and Baxter [66]
proposed theoretical model for the contact angle of the rough
structure on the basis of Yang’s equation [67].
The Wenzel [65] model describes the homogeneous wetting
regime, and is defined by the following equation for the contact angle
on a rough surface:
(1.1)
where θ w , and θ o are the water contact angle on the structured
surface and flat surface, respectively. r is the roughness factor, which
is defined as the ratio of the actual apparent surface area to
geometric projected area. γ sv , γ sl , and γ lv are the surface tensions
of the solid/vapor, solid/liquid, and liquid/vapor interfaces [65]. In
Wenzel state, the water droplet is in full contact with the surface, as
shown in Fig. 1.4a. For the actual apparent surface area of the liquid
or the solid is always greater than the geometric projected area, the
value of r is greater than 1 [65]. Superhydrophobic properties can be
reached only if θ o > 90o, but with high hysteresis and sliding angle
due to the increase in the solid/liquid interface [65, 66]. Thus the
Cassie-Baxter model was proposed as shown in Fig. 1.4b. In this
model, the droplet can suspend on the composite interface made of
solid and air trapped between the droplet and the surface. This
model can be explained as Cassie-Baxter equation [66]:
Fig. 1.4 Schematic illustration of droplet on rough substrate either in Wenzel state (a) or CassieBaxter state (b)
(1.2)
where θc is the apparent contact angle of the solid/liquid/gas
interfaces, r f is the roughness coefficient, f is the area fraction of the
liquid to the solid, and θ is the water contact angle on the flat
surface. It is seen from Eq. 1.2, when f = 1, and r f = r, CassieBaxter equation is equivalent to Wenzel equation.
It is found that both of Wenzel state and Cassie state involve the
influence of surface roughness on hydrophobic properties. The
fundamental difference between the two models is the different
contact state of the droplets on the rough structures of the surface,
which induces the different dynamic performances of the liquid, such
as sliding angle and so on. Nevertheless, these two models reveal
the relationship between the rough structure and the hydrophobicity,
which provides a basis for the study of hydrophobic phenomena and
its function.
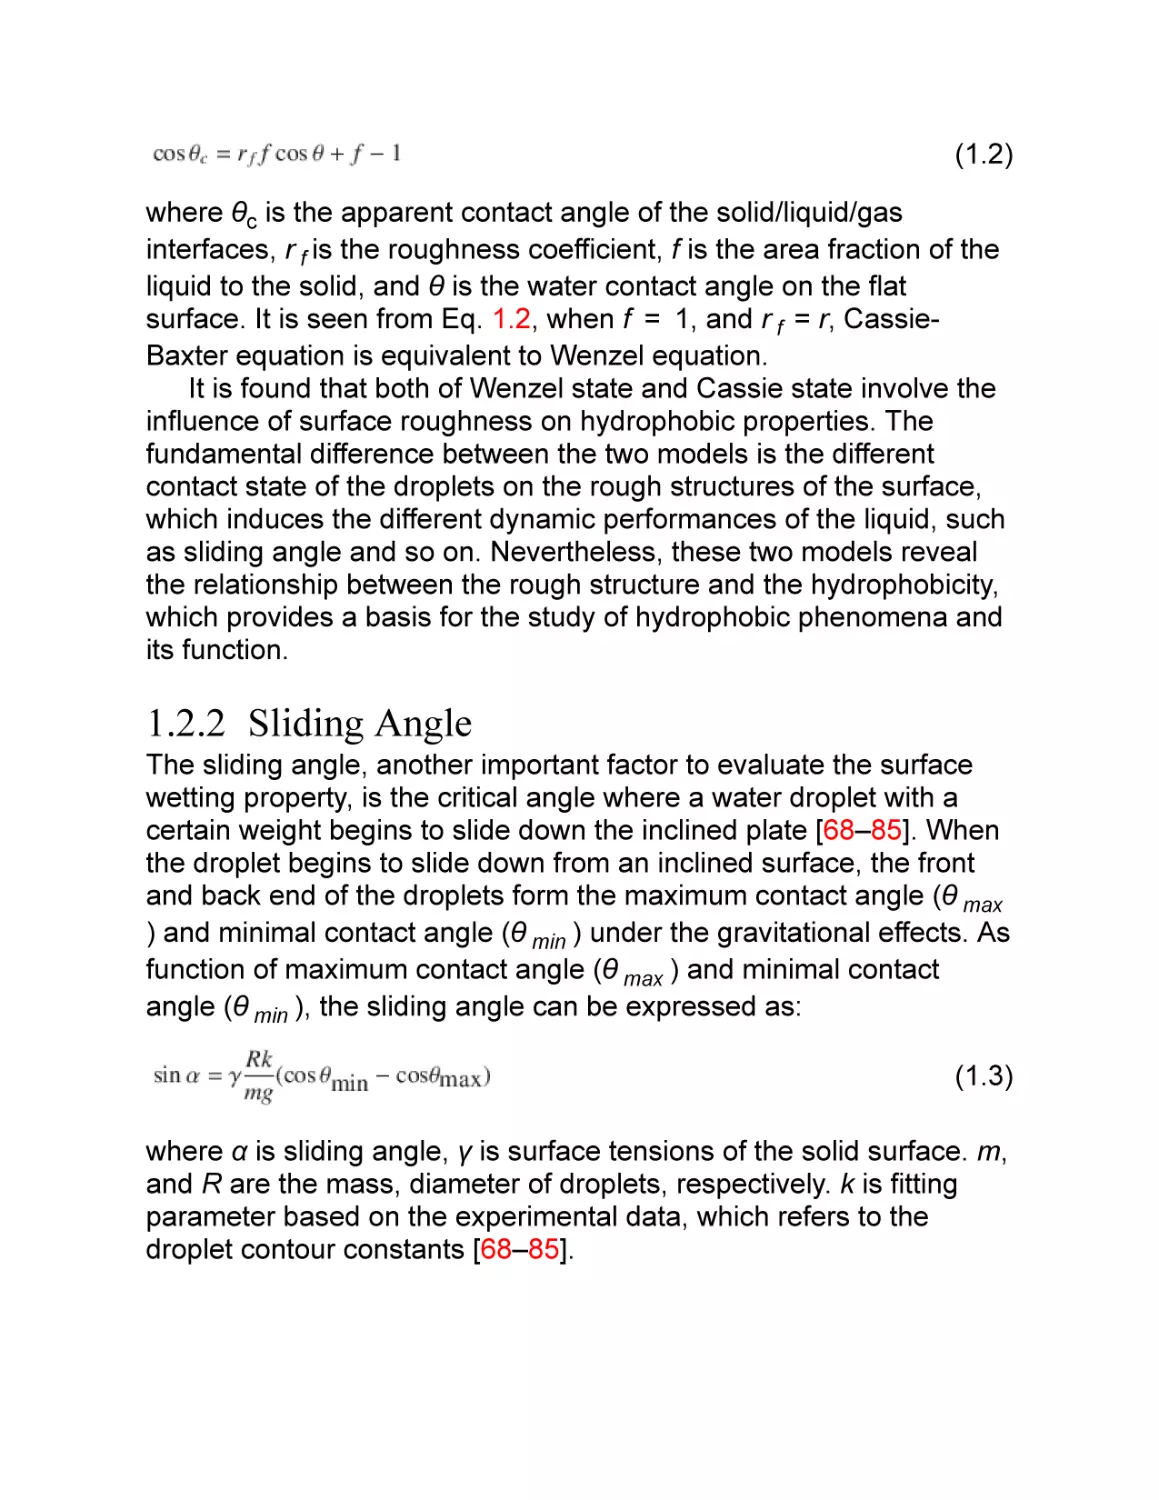
1.2.2 Sliding Angle
The sliding angle, another important factor to evaluate the surface
wetting property, is the critical angle where a water droplet with a
certain weight begins to slide down the inclined plate [68–85]. When
the droplet begins to slide down from an inclined surface, the front
and back end of the droplets form the maximum contact angle (θ max
) and minimal contact angle (θ min ) under the gravitational effects. As
function of maximum contact angle (θ max ) and minimal contact
angle (θ min ), the sliding angle can be expressed as:
(1.3)
where α is sliding angle, γ is surface tensions of the solid surface. m,
and R are the mass, diameter of droplets, respectively. k is fitting
parameter based on the experimental data, which refers to the
droplet contour constants [68–85].
1.3 Superhydrophobic Phenomena and Bionic Study
1.3.1 Superhydrophobic Phenomena in Nature
The superhydrophobic surface is defined as the contact angle
greater than 150° and the sliding angle less than 10°. Many living
organisms have superhydrophobic surfaces which exhibit special
functions [86–94], such as the lotus leaves [101–105] and the water
striders [106–119] (Fig. 1.5). Water droplets from the rain and fog
can roll freely on lotus leaves surfaces and remove dirt, keeping the
leaves clean although many of these plants tend to grow in muddy
waters [106–119]. This self-cleaning property, also known as the
lotus effect, plays a critical role in the survival of the plant by keeping
the surface clean and free of contamination and microoragnisms.
Fig. 1.5 The non-wetting leg of a water strider
Barthlott [95–97], Neinhuis [95–100], and Jiang [101–105]
thought that the hydrophobicity is closely related to the surface
morphology. It is indicated that the surface structures can be divided
into 3D structures of varying morphologies and an underlying two
dimensional wax film. 3D epicuticular wax structures occur in sizes
from 0.5 to 100 µm, whereas 2D wax films range from a few
molecular layers up to 0.5 µm. The structures can be illustrated that
branch-like nanostructures are inlayed on the top of the
micropapillae. These hierarchical surface structures endow the lotus
leaves with high contact angle and low adhesive force, and
demonstrate self-cleaning ability [95–105].
In addition to the lotus leaves, water striders are typical animal
that possesses superhydrophobicity (Fig. 1.5a). SEM images
(Fig. 1.5b and c) reveal that there are numerous oriented needleshaped setae on the legs with diameters ranging from 3 µm down to
several hundred nanometres, most length of 50 µm, and arranged at
an inclined angle of about 20° from the surface of leg. In addition,
many elaborate, nanoscale grooves are evident on each microseta,
and these form a unique hierarchical structure [106–119]. These
special hierarchical structures enable them to stand effortlessly and
move quickly on torrential water. It is indicated that the maximal
supporting force of a single leg is 152 dynes, which is roughly 300
times of the leg itself, indicating that its surface is strikingly water
repellent [106–119].
1.3.2 Preparation Methods of Superhydrophobic
Surfaces
Inspired by the lotus leaves and water spiders, people have been
exploring how to imitate these surface superhydrophobic structures
and studying their applications in practice. The key to the preparation
of superhydrophobic surface is to obtain the micro/nano structure
with high roughness. Although there are many methods of preparing
superhydrophobic surface, they mainly can be summarized as
template method [116–121], electrochemical method [124–130], and
lithography method [131, 132]. Template method is a copying
method which is mainly used to mold polymers, such as
Polydimethylsiloxane (PDMS), and is more suitable for copying the
structure of biological surfaces [116–121]. Sun [122] transferred the
complex surface patterns of the lotus leaf onto the surface of solid-
state PDMS with high fidelity by nanocasting. It is shown that both
the natural and artificial lotus leaves remain superhydrophobic after
being immersed in water for more than a week or being exposed to
the high-humidity ambient atmosphere for several months.
Lee [123] successfully fabricated biomimetic superhydrophobic
surfaces on high-density polyethylene surfaces by heat- and
pressure-driven imprinting methods using patterned AAOs as
replication templates. It is indicated that both nanostructures and
microstructures cooperatively affect the superhydrophobicity of the
polymer surface. This simple and reproducible method of producing
a hierarchical superhydrophobic surface can be applied to all
thermoplastic polymers [123].
The common chemical methods include electrostatic spinning
[124], self-assembly [125–130], and electrochemical deposition
[125]. Jiang [124] reported the preparation of core/shell ultrathin
fibers with a novel nanowire-in-microtube structure by a multifluidic
coaxial electrospinning approach. The advantage of this approach is
that it introduces an extra middle fluid between the core and shell
fluids of traditional coaxial electrospinning, which can work as an
effective spacer to decrease the interaction of the other two fluids.
Layer-by-layer assembly method [125–130] is a common selfassembly method of assembling the different layers of polyanions
and polycation by static electricity. The advantage of this method is
that the thickness of the generated film can be precisely controlled
by adjusting the number of assembly times. This method combined
with electrochemical deposition is commonly used to prepare
superhydrophobic surfaces because it can improve the surface
roughness by introducing the nanoparticles [125–130].
Electrochemical deposition [125] refers to the process of depositing
metal alloys or metal compounds from the solution or molten salt into
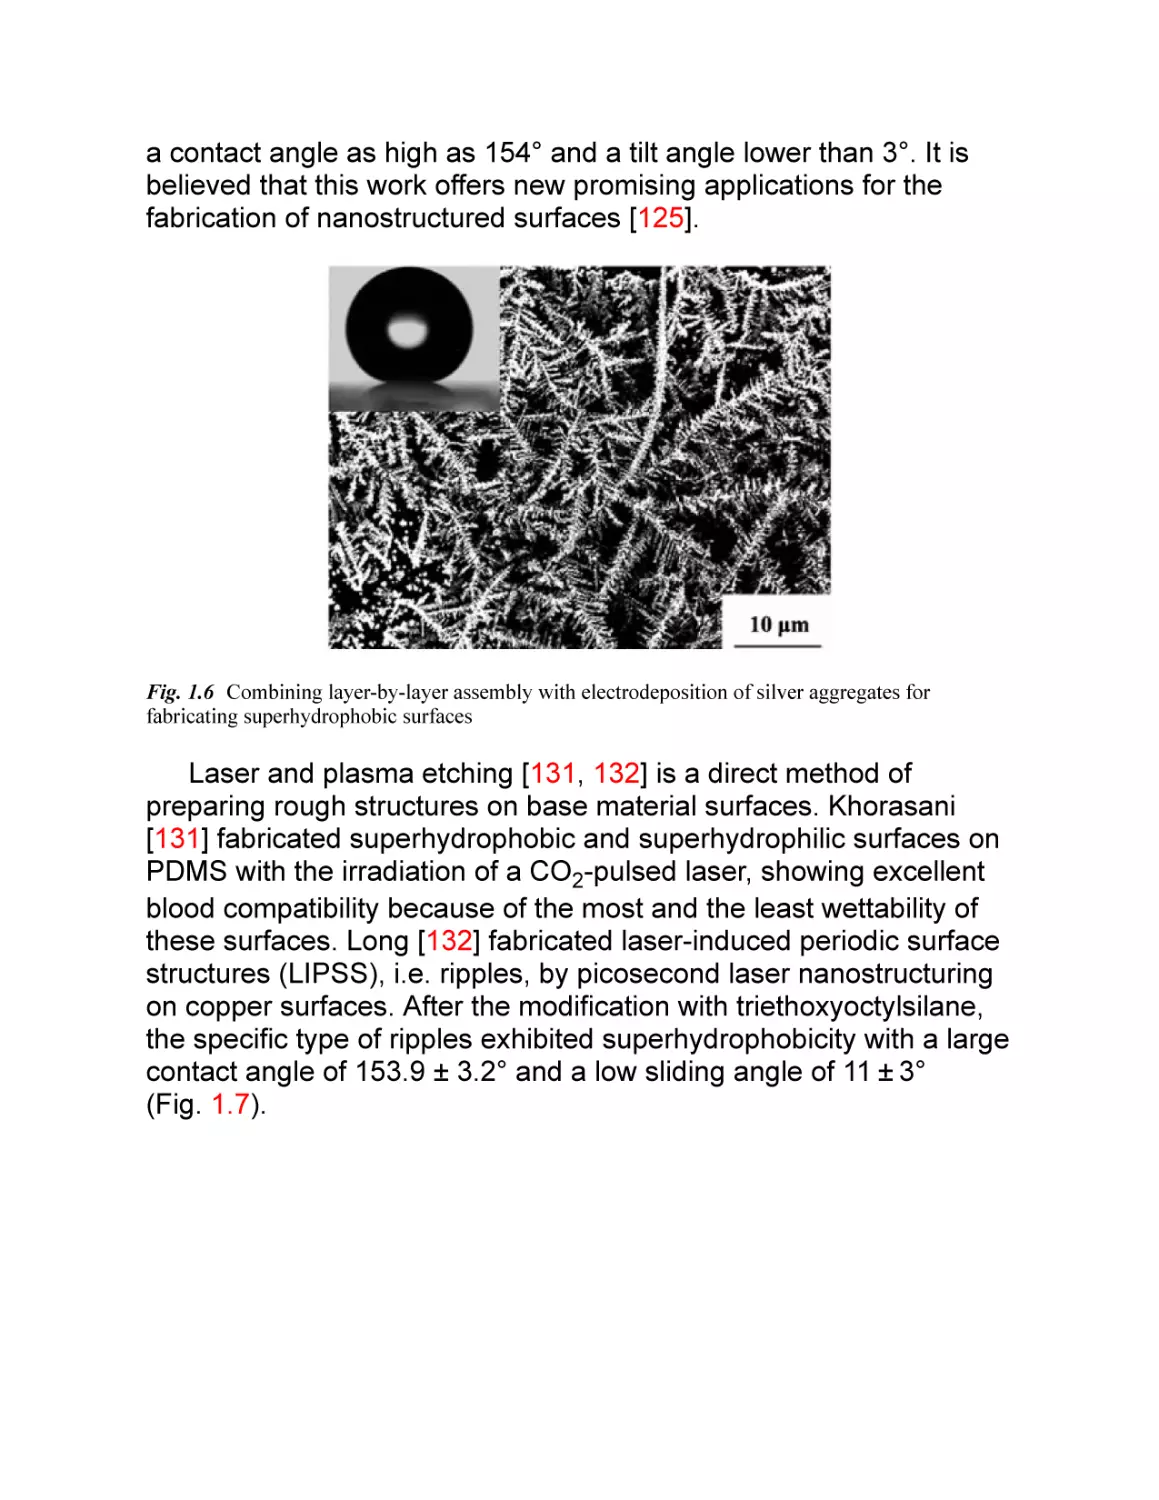
electrode surfaces under the action of electric field. Zhao [125]
developed a novel method to fabricate a branchlike Ag
micro-/nanostructure with the combination of the layer-by-layer
assembly technique with electrodeposition by taking advantage of
the stability and penetrability of layer-by-layer films (Fig. 1.6). After
further simple surface modification, this surface with the branchlike
Ag aggregate film has showed remarkable superhydrophobicity with
a contact angle as high as 154° and a tilt angle lower than 3°. It is
believed that this work offers new promising applications for the
fabrication of nanostructured surfaces [125].
Fig. 1.6 Combining layer-by-layer assembly with electrodeposition of silver aggregates for
fabricating superhydrophobic surfaces
Laser and plasma etching [131, 132] is a direct method of
preparing rough structures on base material surfaces. Khorasani
[131] fabricated superhydrophobic and superhydrophilic surfaces on
PDMS with the irradiation of a CO2-pulsed laser, showing excellent
blood compatibility because of the most and the least wettability of
these surfaces. Long [132] fabricated laser-induced periodic surface
structures (LIPSS), i.e. ripples, by picosecond laser nanostructuring
on copper surfaces. After the modification with triethoxyoctylsilane,
the specific type of ripples exhibited superhydrophobicity with a large
contact angle of 153.9 ± 3.2° and a low sliding angle of 11 ± 3°
(Fig. 1.7).
Fig. 1.7 Superhydrophobic and colorful copper surfaces fabricated by picosecond laser
With the development of femtosecond laser technology, people
began to explore the preparation of superhydrophobic surface by
using femtosecond laser on various material surfaces [133–137]. For
example, Chen [133–137] of Xi’an Jiaotong University produced the
controllable adhesion, anisotropic superhydrophobic surfaces on
PDMS by femtosecond laser scanning line by line (Fig. 1.8). This
preparation method is simple and without other auxiliary steps, which
can meet the demand of large area processing.
Fig. 1.8 Controllable adhesive superhydrophobic surfaces based on PDMS microwell arrays
Researchers have also proposed the using of plasma etching
[138, 139] of preparation of superhydrophobic surface. Although
100 nm resolution can be got through this method, it has
disadvantages such as high-cost equipment, time-consuming
process, and small processing area, which is difficult to meet the
demand of scientific research and production.
1.4 Underwater Surperoleophobic Surfaces
In rivers and lakes which are polluted by oil spills, many water birds
lose their ability to fly for their feathers are covered with oil [140,
141]. However, fish can keep their body clean in the same water.
The wetting/antiwetting behavior of oil droplets on the surface of fish
in water was studied and it is found that the superoleophobic fish
surface originates from the water-phase micro/nanohierarchical
structures and the hydrophilic chemical components of calcium
phosphate, protein [140–143] (Fig. 1.9).
Fig. 1.9 Surface structures of fish scales and the wettability-reversion phenomena
Inspired by the fish scales, a variety of methods have been
developed to prepare underwater surperoleophobic surfaces,
including template method [144–148], self-assembly [149–152],
electrochemical polymerization [153–155]. For example, Li achieved
robust underwater superoleophobic macromolecule-nanoclay
hydrogels by replicating the hierarchical topography of fish scales on
C-hydrogel surface and followed by a photo-initiated in situ radical
polymerization [148]. Huang [152] presented a controllable
underwater oil-adhesion-interface based on colloidal crystals
assembled from nonspherical latex particles. The underwater oiladhesive force of the as-prepared film can be effectively controlled
from high to low adhesion by varying the latex structures from
spherical or cauliflower-like to single cavity, which effectively adjusts
the solid/liquid contact mode/wetting state of oil droplets on the films.
Liu [155] synthesized superoleophobic aligned PANI nanowire films
by the electrochemical polymerization on the aucoated silicon wafer.
The aligned PANI can be switched from a superoleophobicity with
low adhesion state to a superoleophobicity with high adhesion state
by tuning an electrochemical potential. In addition, many other
methods such as photolithography [156, 157], vacuum-based
deposition [158, 159], sol-gel method [146], electrospinning [142,
157] have also been used to prepare various underwater
superoleophobic surfaces, which have wide applications in fields of
oil droplet manipulation, biomedicine, and oil/water separation.
1.5 Main Research Contents
Although various biomimetic surfaces with different functions have
been successfully fabricated by taking the advantage of the
advanced manufacturing equipment and methods, there are still
some problems to be solved from the perspective of the scientific
research and practical applications. At present, the main methods for
producing biomimetic micro/nanostructures include template method,
photolithography, electron beam lithography, and chemosynthesis,
etc. Template method need to prepare micro/nanostructured
template beforehand, and then transferred the micro/nanostructured
to the target materials [116–121]. It usually takes a lot of complicated
processes and a large number of templates, which is timeconsuming and expensive. Photolithography and electron beam
lithography need expensive instrument and apparatus [131, 132].
Chemical synthesis methods [124–130] require harsh processing
environments and the chemicals may cause harm to the
environment. From the view of practical applications, large area
micro/nanostructures surfaces cannot be prepared by the present
methods, which greatly limit the practical applications. Therefore,
new routes to rapidly, effectively and economically produce such
functional surfaces with large area are still highly desirable.
In this work, we proposed the preparation of bionic functional
micro- and nano- structures by combining the advanced
femtosecond laser micro/nanofabrication technology with bionic
design. The conditions of formation of the femtosecond laser
induced structures factors controlling the dimensions were in detail
explored. Especially, the relevant functions were thoroughly
researched.
References
1.
Dickinson MH. Bionics: Biological insight into mechanical design. Proc Natl Acad Sci.
1999;96(25):14208–9.
2.
Johnson EAC, Bonser RHC, Jeronimidis G. Recent advances in biomimetic sensing
technologies. Philosophical transactions of the royal society of London A: Mathematical,
physical and engineering sciences. 1893;2009(367):1559–69.
3.
Kirchner A, Schadschneider A. Simulation of evacuation processes using a bionics-inspired
cellular automaton model for pedestrian dynamics. Physica A. 2002;312(1):260–76.
4.
Bjorklund B. Qualitative analysis of gel precipitates with the aid of chemical color reactions.
Proc Soc Exp Biol Med. 1954;85(3):438–41.
5.
Barton G M. Chemical color tests for Canadian woods. Can For Ind. 1973.
6.
Takeoka Y, Watanabe M. Tuning structural color changes of porous thermosensitive gels
through quantitative adjustment of the cross-linker in pre-gel solutions. Langmuir.
2003;19(22):9104–6.
7.
Zhao Y, Xie Z, Gu H, et al. Bio-inspired variable structural color materials. Chem Soc Rev.
2012;41(8):3297–317.
8.
Lee RT, Smith GS. Detailed electromagnetic simulation for the structural color of butterfly
wings. Appl Opt. 2009;48(21):4177–90.
9.
Kinoshita S, Yoshioka S. Structural colors in nature: the role of regularity and irregularity in the
structure. ChemPhysChem. 2005;6(8):1442–59.
10.
Greenewalt CH, Brandt W, Friel DD. Iridescent colors of hummingbird feathers. JOSA.
1960;50(10):1005–13.
11.
Cong H, Cao W. Thin film interference of colloidal thin films. Langmuir. 2004;20(19):8049–
53.
12.
Gralak B, Tayeb G, Enoch S. Morpho butterflies wings color modeled with lamellar grating
theory. Opt Express. 2001;9(11):567–78.
13.
Knop K. Color pictures using the zero diffraction order of phase grating structures. Opt
Commun. 1976;18(3):298–303.
14.
Lochbihler H. Colored images generated by metallic sub-wavelength gratings. Opt Express.
2009;17(14):12189–96.
15.
Pursiainen OLJ, Baumberg JJ, Winkler H, et al. Nanoparticle-tuned structural color from
polymer opals. Opt Express. 2007;15(15):9553–61.
16.
Arsenault AC, Puzzo DP, Manners I, et al. Photonic-crystal full-color displays. Nat Photonics.
2007;1(8):468–72.
17.
Reeves WH, Skryabin DV, Biancalana F, et al. Transformation and control of ultra-short pulses
in dispersion-engineered photonic crystal fibres. Nature. 2003;424(6948):511–5.
18.
Parker AR, Townley HE. Biomimetics of photonic nanostructures. Nanosc Technol: A Collect
Rev Nat J. 2010:230–6.
19.
Shevtsova E, Hansson C, Janzen DH, et al. Stable structural color patterns displayed on
transparent insect wings. Proc Natl Acad Sci. 2011;108(2):668–73.
20.
Zi J, Yu X, Li Y, et al. Coloration strategies in peacock feathers. Proc Natl Acad Sci.
2003;100(22):12576–8.
21.
Chung K, Yu S, Heo CJ, et al. Flexible, angle-independent, structural color reflectors inspired
by morpho butterfly wings. Adv Mater. 2012;24(18):2375–9.
22.
Kim H, Ge J, Kim J, et al. Structural color printing using a magnetically tunable and
lithographically fixable photonic crystal. Nat Photonics. 2009;3(9):534–40.
23.
Vorobyev AY, Guo C. Colorizing metals with femtosecond laser pulses. Appl Phys Lett.
2008;92(4):041914.
24.
Vorobyev AY, Makin VS, Guo C. Brighter light sources from black metal: significant increase
in emission efficiency of incandescent light sources. Phys Rev Lett. 2009;102(23):234301.
25.
Vorobyev AY, Guo C. Femtosecond laser blackening of platinum. J Appl Phys.
2008;104(5):053516.
26.
Vorobyev AY, Guo C. Direct creation of black silicon using femtosecond laser pulses. Appl
Surf Sci. 2011;257(16):7291–4.
27.
Vorobyev AY, Guo C. Reflection of femtosecond laser light in multipulse ablation of metals. J
Appl Phys. 2011;110(4):043102.
28.
Wu Q, Ma Y, Fang R, et al. Femtosecond laser-induced periodic surface structure on diamond
film. Appl Phys Lett. 2003;82(11):1703–5.
29.
Borowiec A, Haugen HK. Subwavelength ripple formation on the surfaces of compound
semiconductors irradiated with femtosecond laser pulses. Appl Phys Lett. 2003;82(25):4462–4.
30.
Vorobyev AY, Makin VS, Guo C. Periodic ordering of random surface nanostructures induced
by femtosecond laser pulses on metals. J Appl Phys. 2007;101(3):034903.
31.
Wagner R, Gottmann J, Horn A, et al. Subwavelength ripple formation induced by tightly
focused femtosecond laser radiation. Appl Surf Sci. 2006;252(24):8576–9.
32.
Varlamova O, Costache F, Reif J, et al. Self-organized pattern formation upon femtosecond
laser ablation by circularly polarized light. Appl Surf Sci. 2006;252(13):4702–6.
33.
Sano T, Yanai M, Ohmura E, et al. Femtosecond laser fabrication of microspike-arrays on
tungsten surface. Appl Surf Sci. 2005;247(1):340–6.
34.
Tsutsumi N, Fujihara A. Pulsed laser induced spontaneous gratings on a surface of azobenzene
polymer. Appl Phys Lett. 2004;85(20):4582–4.
35.
Qi L, Nishii K, Namba Y. Regular subwavelength surface structures induced by femtosecond
laser pulses on stainless steel. Opt Lett. 2009;34(12):1846–8.
36.
Dusser B, Sagan Z, Soder H, et al. Controlled nanostructrures formation by ultra fast laser
pulses for color marking. Opt Express. 2010;18(3):2913–24.
37.
Yao J, Zhang C, Liu H, et al. Selective appearance of several laser-induced periodic surface
structure patterns on a metal surface using structural colors produced by femtosecond laser
pulses. Appl Surf Sci. 2012;258(19):7625–32.
38.
Canning J. Fibre gratings and devices for sensors and lasers. Laser Photonics Rev.
2008;2(4):275–89.
39.
Li L, Hong M, Schmidt M, et al. Laser nano-manufacturing-state of the art and challenges.
CIRP Ann Manuf Technol. 2011;60(2):735–55.
40.
Ahsan MS, Ahmed F, Kim YG, et al. Colorizing stainless steel surface by femtosecond laser
induced micro/nano-structures. Appl Surf Sci. 2011;257(17):7771–7.
41.
Zhakhovskii VV, Inogamov NA, Nishihara K. New mechanism of the formation of the
nanorelief on a surface irradiated by a femtosecond laser pulse. JETP Lett. 2008;87(8):423–7.
42.
Ionin AA, Kudryashov SI, Makarov SV, et al. Femtosecond laser color marking of metal and
semiconductor surfaces. Appl Phys A. 2012;107(2):301–5.
43.
Wang X, Zhang D, Zhang H, et al. Tuning color by pore depth of metal-coated porous alumina.
Nanotechnology. 2011;22(30):305306.
44.
Lehmuskero A, Kontturi V, Hiltunen J, et al. Modeling of laser-colored stainless steel surfaces
by color pixels. Appl Phys B: Lasers Opt. 2010;98(2):497–500.
45.
Tang G, Hourd AC, Abdolvand A. Nanosecond pulsed laser blackening of copper. Appl Phys
Lett. 2012;101(23):231902.
46.
Li G, Li J, Yang L, et al. Evolution of aluminum surface irradiated by femtosecond laser pulses
with different pulse overlaps. Appl Surf Sci. 2013;276:203–9.
47.
Antończak AJ, Kocoń D, Nowak M, et al. Laser-induced colour marking-sensitivity scaling for
a stainless steel. Appl Surf Sci. 2013;264:229–36.
48.
Cassie ABD, Baxter S. Wettability of porous surfaces. Trans Faraday Soc. 1944;40:546–51.
49.
Öner D, McCarthy TJ. Ultrahydrophobic surfaces. Effects of topography length scales on
wettability. Langmuir. 2000;16(20):7777–82.
50.
Sun T, Feng L, Gao X, et al. Bioinspired surfaces with special wettability. Acc Chem Res.
2005;38(8):644–52.
51.
Fowkes, Frederick M, ed. Contact angle, wettability, and adhesion. Am Chem Soc. 1964.
52.
Wenzel RN. Surface roughness and contact angle. J Phys Chem. 1949;53(9):1466–7.
53.
Joanny JF, De Gennes PG. A model for contact angle hysteresis. Simple views on condensed
matter. 2003:457–67.
54.
De Gennes PG. Wetting: statics and dynamics. Rev Mod Phys. 1985;57(3):827.
55.
Johnson RE Jr, Dettre RH. Contact angle hysteresis. III. Study of an idealized heterogeneous
surface. J Phys Chem. 1964;68(7):1744–50.
56.
Good RJ, Girifalco LA. A theory for estimation of surface and interfacial energies. III.
Estimation of surface energies of solids from contact angle data. J Phys Chem.
1960;64(5):561–5.
57.
Dettre RH, Johnson RE Jr. Contact Angle Hysteresis. IV. Contact angle measurements on
heterogeneous surfaces. J Phys Chem. 1965;69(5):1507–15.
58.
Brackbill JU, Kothe DB, Zemach C. A continuum method for modeling surface tension. J
Comput Phys. 1992;100(2):335–54.
59.
Tyson WR, Miller WA. Surface free energies of solid metals: Estimation from liquid surface
tension measurements. Surf Sci. 1977;62(1):267–76.
60.
Tolman RC. The effect of droplet size on surface tension. J Chem Phys. 1949;17(3):333–7.
61.
Rotenberg Y, Boruvka L, Neumann AW. Determination of surface tension and contact angle
from the shapes of axisymmetric fluid interfaces. J Colloid Interface Sci. 1983;93(1):169–83.
62.
Kirkwood JG, Buff FP. The statistical mechanical theory of surface tension. J Chem Phys.
1949;17(3):338–43.
63.
Van Oss CJ, Good RJ, Chaudhury MK. Additive and nonadditive surface tension components
and the interpretation of contact angles. Langmuir. 1988;4(4):884–91.
64.
Jasper JJ. The surface tension of pure liquid compounds. J Phys Chem Ref Data.
1972;1(4):841–1010.
65.
Wenzel RN. Resistance of solid surfaces to wetting by water. Ind Eng Chem. 1936;28(8):988–
94.
66.
Zhu X, Zhu L, Chen H, et al. Micro-ball lens structure fabrication based on drop on demand
printing the liquid mold. Appl Surf Sci. 2016;361:80–9.
67.
Good RJ. A thermodynamic derivation of wenzel’s modification of young’s equation for
contact angles; together with a theory of hysteresis. J Am Chem Soc. 1952;74(20):5041–2.
68.
Pierce E, Carmona FJ, Amirfazli A. Understanding of sliding and contact angle results in tilted
plate experiments. Colloids Surf, A. 2008;323(1):73–82.
69.
Nakajima A, Abe K, Hashimoto K, et al. Preparation of hard super-hydrophobic films with
visible light transmission. Thin Solid Films. 2000;376(1):140–3.
70.
Yoshimitsu Z, Nakajima A, Watanabe T, et al. Effects of surface structure on the
hydrophobicity and sliding behavior of water droplets. Langmuir. 2002;18(15):5818–22.
71.
Miwa M, Nakajima A, Fujishima A, et al. Effects of the surface roughness on sliding angles of
water droplets on superhydrophobic surfaces. Langmuir. 2000;16(13):5754–60.
72.
Kawasaki K. Study of wettability of polymers by sliding of water drop. J Colloid Sci.
1960;15(5):402–7.
73.
Fürstner R, Barthlott W, Neinhuis C, et al. Wetting and self-cleaning properties of artificial
superhydrophobic surfaces. Langmuir. 2005;21(3):956–61.
74.
Xie Q, Xu J, Feng L, et al. Facile Creation of a super-amphiphobic coating surface with bionic
microstructure. Adv Mater. 2004;16(4):302–5.
75.
Wang S, Feng L, Jiang L. One-step solution-immersion process for the fabrication of stable
bionic superhydrophobic surfaces. Adv Mater. 2006;18(6):767–70.
76.
Artus GRJ, Jung S, Zimmermann J, et al. Silicone nanofilaments and their application as
superhydrophobic coatings. Adv Mater. 2006;18(20):2758–62.
77.
Choi SJ, Suh KY, Lee HH. A geometry controllable approach for the fabrication of biomimetic
hierarchical structure and its superhydrophobicity with near-zero sliding angle.
Nanotechnology. 2008;19(27):275305.
78.
Guo Z, Zhou F, Hao J, et al. Stable biomimetic super-hydrophobic engineering materials. J Am
Chem Soc. 2005;127(45):15670–1.
79.
Kiuru M, Alakoski E. Low sliding angles in hydrophobic and oleophobic coatings prepared
with plasma discharge method. Mater Lett. 2004;58(16):2213–6.
80.
Acatay K, Simsek E, Ow-Yang C, et al. Tunable, superhydrophobically stable polymeric
surfaces by electrospinning. Angew Chem Int Ed. 2004;43(39):5210–3.
81.
White AM, Truesdale MC, Bae JG, et al. Differential effects of ethanol on motor coordination
in adolescent and adult rats. Pharmacol Biochem Behav. 2002;73(3):673–7.
82.
Langmuir I. The mechanism of the surface phenomena of flotation. Trans Faraday Soc.
1920;15(June):62–74.
83.
Suzuki S, Nakajima A, Kameshima Y, et al. Elongation and contraction of water droplet during
sliding on the silicon surface treated by fluoroalkylsilane. Surf Sci. 2004;557(1):L163–8.
84.
Kamitani K, Teranishi T. Development of water-repellent glass improved water-sliding
property and durability. J Sol-Gel Sci Technol. 2003;26(1):823–5.
85.
Sakai M, Song JH, Yoshida N, et al. Direct observation of internal fluidity in a water droplet
during sliding on hydrophobic surfaces. Langmuir. 2006;22(11):4906–9.
86.
Erbil HY, Demirel AL, Avcı Y, et al. Transformation of a simple plastic into a
superhydrophobic surface. Science. 2003;299(5611):1377–80.
87.
Jiang L, Zhao Y, Zhai J. A lotus-leaf-like superhydrophobic surface: a porous
microsphere/nanofiber composite film prepared by electrohydrodynamics. Angew Chem.
2004;116(33):4438–41.
88.
Roach P, Shirtcliffe NJ, Newton MI. Progess in superhydrophobic surface development. Soft
Matter. 2008;4(2):224–40.
89.
Li XM, Reinhoudt D, Crego-Calama M. What do we need for a superhydrophobic surface? A
review on the recent progress in the preparation of superhydrophobic surfaces. Chem Soc Rev.
2007;36(8):1350–68.
90.
Feng L, Song Y, Zhai J, et al. Creation of a superhydrophobic surface from an amphiphilic
polymer. Angew Chem. 2003;115(7):824–6.
91.
Choi CH, Kim CJ. Large slip of aqueous liquid flow over a nanoengineered superhydrophobic
surface. Phys Rev Lett. 2006;96(6):066001.
92.
Huang L, Lau SP, Yang HY, et al. Stable superhydrophobic surface via carbon nanotubes
coated with a ZnO thin film. J Phys Chem B. 2005;109(16):7746–8.
93.
Hong X, Gao X, Jiang L. Application of superhydrophobic surface with high adhesive force in
no lost transport of superparamagnetic microdroplet. J Am Chem Soc. 2007;129(6):1478–9.
94.
Han JT, Lee DH, Ryu CY, et al. Fabrication of superhydrophobic surface from a
supramolecular organosilane with quadruple hydrogen bonding. J Am Chem Soc.
2004;126(15):4796–7.
95.
Barthlott W, Neinhuis C. Purity of the sacred lotus, or escape from contamination in biological
surfaces. Planta. 1997;202(1):1–8.
96.
Neinhuis C, Barthlott W. Characterization and distribution of water-repellent, self-cleaning
plant surfaces. Ann Bot. 1997;79(6):667–77.
97.
Fürstner R, Barthlott W, Neinhuis C, et al. Wetting and self-cleaning properties of artificial
superhydrophobic surfaces. Langmuir. 2005;21(3):956–61.
98.
Wagner T, Neinhuis C, Barthlott W. Wettability and contaminability of insect wings as a
function of their surface sculptures. Acta Zoologica. 1996;77(3):213–25.
99.
Wagner P, Fürstner R, Barthlott W, et al. Quantitative assessment to the structural basis of water
repellency in natural and technical surfaces. J Exp Bot. 2003;54(385):1295–303.
100. Neinhuis C, Barthlott W. Seasonal changes of leaf surface contamination in beech, oak, and
ginkgo in relation to leaf micromorphology and wettability. New Phytol. 1998;138(1):91–8.
101. Zheng Y, Han D, Zhai J, et al. In situ investigation on dynamic suspending of microdroplet on
lotus leaf and gradient of wettable micro-and nanostructure from water condensation. Appl
Phys Lett. 2008;92(8):084106.
102.
Zhang J, Sheng X, Jiang L. The dewetting properties of lotus leaves. Langmuir.
2008;25(3):1371–6.
103. Cheng Q, Li M, Zheng Y, et al. Janus interface materials: superhydrophobic air/solid interface
and superoleophobic water/solid interface inspired by a lotus leaf. Soft Matter.
2011;7(13):5948–51.
104. Liu K, Zhang M, Zhai J, et al. Bioinspired construction of Mg-Li alloys surfaces with stable
superhydrophobicity and improved corrosion resistance. Appl Phys Lett. 2008;92(18):183103.
105. Sun T, Feng L, Gao X, et al. Bioinspired surfaces with special wettability. Acc Chem Res.
2005;38(8):644–52.
106. Feng XQ, Gao X, Wu Z, et al. Superior water repellency of water strider legs with hierarchical
structures: experiments and analysis. Langmuir. 2007;23(9):4892–6.
107. Jiang L, Yao X, Li H, et al. “Water strider” legs with a self-assembled coating of singlecrystalline nanowires of an organic semiconductor. Adv Mater. 2010;22(3):376–9.
108. Ding Y, Xu S, Zhang Y, et al. Modifying the anti-wetting property of butterfly wings and water
strider legs by atomic layer deposition coating: surface materials versus geometry.
Nanotechnology. 2008;19(35):355708.
109. Shi F, Niu J, Liu J, et al. Towards understanding why a superhydrophobic coating is needed by
water striders. Adv Mater. 2007;19(17):2257–61.
110. Shi F, Wang Z, Zhang X. Combining a layer-by-layer assembling technique with
electrochemical deposition of gold aggregates to mimic the legs of water striders. Adv Mater.
2005;17(8):1005–9.
111. Wei PJ, Chen SC, Lin JF. Adhesion forces and contact angles of water strider legs. Langmuir.
2008;25(3):1526–8.
112. Ji XY, Wang JW, Feng XQ. Role of flexibility in the water repellency of water strider legs:
theory and experiment. Phys Rev E. 2012;85(2):021607.
113. Watson GS, Cribb BW, Watson JA. Experimental determination of the efficiency of
nanostructuring on non-wetting legs of the water strider. Acta Biomater. 2010;6(10):4060–4.
114. Zheng QS, Yu Y, Feng XQ. The role of adaptive-deformation of water strider leg in its walking
on water. J Adhes Sci Technol. 2009;23(3):493–501.
115. Pan Q, Liu J, Zhu Q. A water strider-like model with large and stable loading capacity
fabricated from superhydrophobic copper foils. ACS Appl Mater Interfaces. 2010;2(7):2026–
30.
116. Li Y, Cai W, Duan G, et al. Superhydrophobicity of 2D ZnO ordered pore arrays formed by
solution-dipping template method. J Colloid Interface Sci. 2005;287(2):634–9.
117. Zhu Y, Hu D, Wan MX, et al. Conducting and superhydrophobic rambutan-like hollow spheres
of polyaniline. Adv Mater. 2007;19(16):2092–6.
118.
Wan M. A template-free method towards conducting polymer nanostructures. Adv Mater.
2008;20(15):2926–32.
119. Bormashenko E, Stein T, Whyman G, et al. Wetting properties of the multiscaled
nanostructured polymer and metallic superhydrophobic surfaces. Langmuir. 2006;22(24):9982–
5.
120. Feng XJ, Jiang L. Design and creation of superwetting/antiwetting surfaces. Adv Mater.
2006;18(23):3063–78.
121. Li Y, Jia WZ, Song YY, et al. Superhydrophobicity of 3D porous copper films prepared using
the hydrogen bubble dynamic template. Chem Mater. 2007;19(23):5758–64.
122. Sun M, Luo C, Xu L, et al. Artificial lotus leaf by nanocasting. Langmuir. 2005;21(19):8978–
81.
123. Lee Y, Park SH, Kim KB, et al. Fabrication of hierarchical structures on a polymer surface to
mimic natural superhydrophobic surfaces. Adv Mater. 2007;19(17):2330–5.
124. Chen H, Wang N, Di J, et al. Nanowire-in-microtube structured core/shell fibers via
multifluidic coaxial electrospinning. Langmuir. 2010;26(13):11291–6.
125. Zhao N, Shi F, Wang Z, et al. Combining layer-by-layer assembly with electrodeposition of
silver aggregates for fabricating superhydrophobic surfaces. Langmuir. 2005;21(10):4713–6.
126. Tang Z, Wang Y, Podsiadlo P, et al. Biomedical applications of layer-by-layer assembly: from
biomimetics to tissue engineering. Adv Mater. 2006;18(24):3203–24.
127. Kotov NA. Layer-by-layer self-assembly: the contribution of hydrophobic interactions.
Nanostruct Mater. 1999;12(5):789–96.
128. Zhao Y, Li M, Lu Q, et al. Superhydrophobic polyimide films with a hierarchical topography:
combined replica molding and layer-by-layer assembly. Langmuir. 2008;24(21):12651–7.
129. Serizawa T, Kamimura S, Kawanishi N, et al. Layer-by-layer assembly of poly (vinyl alcohol)
and hydrophobic polymers based on their physical adsorption on surfaces. Langmuir.
2002;18(22):8381–5.
130. Amigoni S, Taffin de Givenchy E, Dufay M, et al. Covalent layer-by-layer assembled
superhydrophobic organic-inorganic hybrid films. Langmuir. 2009;25(18):11073–7.
131. Khorasani MT, Mirzadeh H. In vitro blood compatibility of modified PDMS surfaces as
superhydrophobic and superhydrophilic materials. J Appl Polym Sci. 2004;91(3):2042–7.
132. Long J, Fan P, Zhong M, et al. Superhydrophobic and colorful copper surfaces fabricated by
picosecond laser induced periodic nanostructures. Appl Surf Sci. 2014;311:461–7.
133. Yong J, Chen F, Yang Q, et al. Controllable adhesive superhydrophobic surfaces based on
PDMS microwell arrays. Langmuir. 2013;29(10):3274–9.
134. Yong J, Chen F, Yang Q, et al. Femtosecond laser weaving superhydrophobic patterned PDMS
surfaces with tunable adhesion. J Phys Chem C. 2013;117(47):24907–12.
135. Yong J, Yang Q, Chen F, et al. Superhydrophobic PDMS surfaces with three-dimensional (3D)
pattern-dependent controllable adhesion. Appl Surf Sci. 2014;288:579–83.
136. Yong J, Yang Q, Chen F, et al. A simple way to achieve superhydrophobicity, controllable
water adhesion, anisotropic sliding, and anisotropic wetting based on femtosecond-laserinduced line-patterned surfaces. J Mater Chem A. 2014;2(15):5499–507.
137. Yong J, Yang Q, Chen F, et al. Bioinspired superhydrophobic surfaces with directional
adhesion. RSC Adv. 2014;4(16):8138–43.
138. Balu B, Breedveld V, Hess DW. Fabrication of “roll-off” and “sticky” superhydrophobic
cellulose surfaces via plasma processing. Langmuir. 2008;24(9):4785–90.
139. Balu B, Kim JS, Breedveld V, et al. Tunability of the adhesion of water drops on a
superhydrophobic paper surface via selective plasma etching. J Adhes Sci Technol.
2009;23(2):361–80.
140. Liu M, Wang S, Wei Z, et al. Bioinspired design of a superoleophobic and low adhesive
water/solid interface. Adv Mater. 2009;21(6):665–9.
141. Liu K, Tian Y, Jiang L. Bio-inspired superoleophobic and smart materials: design, fabrication,
and application. Prog Mater Sci. 2013;58(4):503–64.
142. Xue Z, Jiang L. Bioinspired underwater superoleophobic surfaces. Acta Polym Sin.
2012;10:1091–101.
143. Liu X, Gao J, Xue Z, et al. Bioinspired oil strider floating at the oil/water interface supported
by huge superoleophobic force. ACS Nano. 2012;6(6):5614–20.
144. Cheng Q, Li M, Zheng Y, et al. Janus interface materials: superhydrophobic air/solid interface
and superoleophobic water/solid interface inspired by a lotus leaf. Soft Matter.
2011;7(13):5948–51.
145. Yao X, Song Y, Jiang L. Applications of bioinspired special wettable surfaces. Adv Mater.
2011;23(6):719–34.
146. Sawai Y, Nishimoto S, Kameshima Y, et al. Photoinduced underwater superoleophobicity of
TiO2 thin films. Langmuir. 2013;29(23):6784–9.
147. Tian Y, Jiang L. Design of bioinspired, smart, multiscale interfacial materials with
superwettability. MRS Bull. 2015;40(2):155–65.
148. Lin L, Liu M, Chen L, et al. Bio-inspired hierarchical macromolecule-nanoclay hydrogels for
robust underwater superoleophobicity. Adv Mater. 2010;22(43):4826–30.
149. Cao Y, Zhang X, Tao L, et al. Mussel-inspired chemistry and michael addition reaction for
efficient oil/water separation. ACS Appl Mater Interfaces. 2013;5(10):4438–42.
150. Zhou X, Zhang Z, Xu X, et al. Robust and durable superhydrophobic cotton fabrics for
oil/water separation. ACS Appl Mater Interfaces. 2013;5(15):7208–14.
151.
Song J, Liu H, Wan M, et al. Bio-inspired isotropic and anisotropic wettability on a Janus free-
standing polypyrrole film fabricated by interfacial electro-polymerization. J Mater Chem A.
2013;1(5):1740–4.
152. Huang Y, Liu M, Wang J, et al. Controllable underwater oil-adhesion-interface films assembled
from nonspherical particles. Adv Func Mater. 2011;21(23):4436–41.
153. Cheng Q, Li M, Yang F, et al. An underwater pH-responsive superoleophobic surface with
reversibly switchable oil-adhesion. Soft Matter. 2012;8(25):6740–3.
154. Taleb S, Darmanin T, Guittard F. Elaboration of voltage and ion exchange stimuli-responsive
conducting polymers with selective switchable liquid-repellency. ACS Appl Mater Interfaces.
2014;6(10):7953–60.
155. Ding C, Zhu Y, Liu M, et al. PANI nanowire film with underwater superoleophobicity and
potential-modulated tunable adhesion for no loss oil droplet transport. Soft Matter.
2012;8(35):9064–8.
156. Wu D, Wu S, Chen QD, et al. Facile creation of hierarchical PDMS microstructures with
extreme underwater superoleophobicity for anti-oil application in microfluidic channels. Lab
Chip. 2011;11(22):3873–9.
157. Jiang T, Guo Z, Liu W. Biomimetic superoleophobic surfaces: focusing on their fabrication and
applications. J Mater Chem A. 2015;3(5):1811–27.
158. Jin H, Kettunen M, Laiho A, et al. Superhydrophobic and superoleophobic nanocellulose
aerogel membranes as bioinspired cargo carriers on water and oil. Langmuir. 2011;27(5):1930–
4.
159. Liu K, Jiang L. Bio-inspired self-cleaning surfaces. Annu Rev Mater Res. 2012;42:231–63.
© Springer Nature Singapore Pte Ltd. 2018
Guoqiang Li, Bionic Functional Structures by Femtosecond Laser Micro/nanofabrication
Technologies, Springer Theses: Recognizing Outstanding Ph.D. Research,
https://doi.org/10.1007/978-981-13-0359-3_2
2. Key Technical Problems of
Femtosecond Laser Bionic Surfaces
Guoqiang Li1
(1) Department of Precision Instrument and Machinery, University of
Science and Technology of China, Hefei, China
Guoqiang Li
Email: guoqli@ustc.edu.cn
2.1 Femtosecond Laser Micro/Nanofabrication
Equipment and Systems
Researchers of micro/nano engineering laboratory of University of
Science and Technology of China have established the femtosecond
laser micro/nanofabrication system since 2001, as shown in Fig. 2.1.
This micro/nanofabrication system is composed of femtosecond
laser system, precision processing system, and control system.
Fig. 2.1 Photograph of femtosecond laser micro/nanofabrication equipment and systems in our
laboratory
Basic components and parameters:
(1) Femtosecond laser system: This system consists of seed laser
(Chameleon VISION-S, coherent), titanium sapphire
regeneration amplification system (Legend Elite-1 K-HE,
coherent), and optical parametric amplifier (coherent). The
output laser is linearly polarized with the pulse repetition
frequency of 1 kHz, the pulse width of 104 fs, and center
wavelength of 800 nm. The laser pulse energy can be adjusted
from 0 to 4.5 mJ. The wavelength can be adjusted from 220 to
2600 nm by the transformation of the optical parametric
amplifier.
(2) Precision processing system: This part is composed of high
precision XY scanning galvanometer (SAMLight, Germany) and
Z-direction mobile platform. The focal length achromatic
focusing lens is 63 mm and the size of the focal point is about
22 µm. The laser beams can be scanned in the X and Y
directions, and form a circular region with diameter of 45 mm.
With the help of Z-direction mobile platform whose work
distance is 10 mm, the sample can be precisely moved to the
location of the focal point [1].
(3) Control system: The function of this system is to realize the
recognition and communication between equipment.
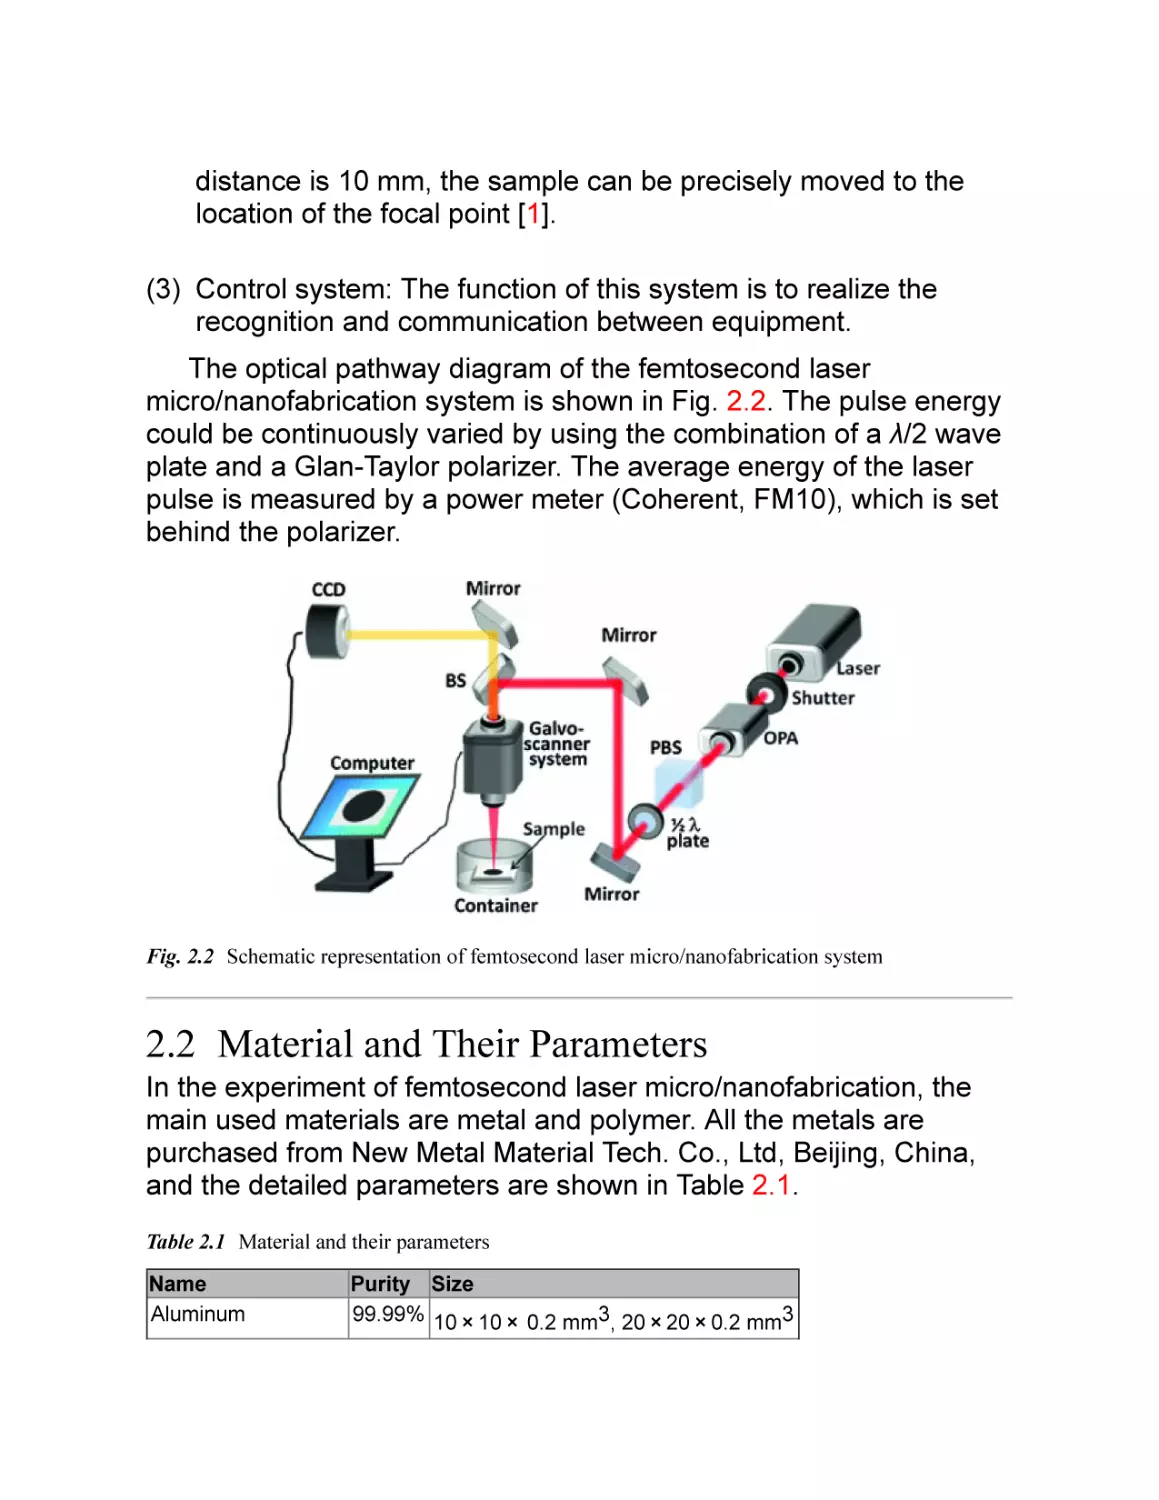
The optical pathway diagram of the femtosecond laser
micro/nanofabrication system is shown in Fig. 2.2. The pulse energy
could be continuously varied by using the combination of a λ/2 wave
plate and a Glan-Taylor polarizer. The average energy of the laser
pulse is measured by a power meter (Coherent, FM10), which is set
behind the polarizer.
Fig. 2.2 Schematic representation of femtosecond laser micro/nanofabrication system
2.2 Material and Their Parameters
In the experiment of femtosecond laser micro/nanofabrication, the
main used materials are metal and polymer. All the metals are
purchased from New Metal Material Tech. Co., Ltd, Beijing, China,
and the detailed parameters are shown in Table 2.1.
Table 2.1 Material and their parameters
Name
Aluminum
Purity Size
99.99% 10 × 10 × 0.2 mm3, 20 × 20 × 0.2 mm3
Name
Purity Size
Stainless steel (316)
30 × 20 × 0.2 mm3
Nickel
Silicon
99.99% 20 × 20 × 0.2 mm3
20 × 20 × 0.2 mm3, 20 × 40 × 0.2 mm3
The polymer is the Polydimethylsiloxane (PDMS), which is
optically clear, and, in general, inert, non-toxic, non-flammable, and
is widely used in soft lithography, microfluidics, etc. The liquid
environment where femtosecond laser beam irradiates the sample is
water, ethanol, and sucrose solution. The water is homemade
distilled water. The ethanol whose purity is 99.3%, is purchased from
Sinopharm chemical reagent Co., Ltd. The sucrose solution was
made by dissolving a certain amount of sucrose into 100 g distilled
water. In wettability test, the oil is CH2ClCH2Cl, and the molecular
weight is 98.96, which is also purchased from Sinopharm chemical
reagent Co., Ltd. The red ink, and the milk are purchased from
nearby store.
2.3 Technological Process
The steps for preparing the bionic surfaces can be summarized as
follows:
(1) The sample surface was cleaned with acetone, ethanol, and
distilled water for 10 min and then dried in nitrogen.
(2) Placing the sample onto the Z-direction mobile platform and
then focusing the laser beam onto the surface.
(3) Load the pre-processing target such as the word, figure,
pattern to the control system.
(4) Setting the appropriate pulse energy, scanning speed,
scanning interval etc. according to the experimental
requirements.
(5) Writing the target objects onto the sample surface by scanning
the focused laser beam line by line.
If the experiment is to be conducted with the assist of liquid
environment, the sample is beforehand fixed at the bottom of the
container followed by adding liquid.
2.4 The Influence of Laser Parameters and
Environment on the Morphology of the
Micro/Nanostructures
In the experiment of femtosecond laser micro/nanofabrication, the
laser processing parameters have a decisive influence on the
morphology of the structures. These parameters include laser
scanning speed [1–3], pulse energy [3], scanning interval,
polarization direction, and processing environment [4–11] and so on.
Firstly, the influence of laser scanning speed and pulse energy on
the morphology on stainless steel surface in air is studied.
It is indicated that at scanning speed of 12 mm/s, the
femtosecond laser can induce subwavelength periodic ripples in
large energy range. Here the energy range from 0.05 to 0.20 mJ is
chosen to study the influence of pulse energy on the morphology of
the periodic ripples, and the results is shown in Fig. 2.3. At pulse
energy of 0.05 mJ, the periodic ripples with period of 520 nm can be
induced (Fig. 2.3a). However, the ripples are uneven, and even
some place of the stainless steel surface is not covered with ripples.
When the pulse energy is increased to 0.10 mJ, it is found that
smooth, a small amount of granular structure covered ripples with
period of 560 nm are formed (Fig. 2.3b). Compared to the results in
Fig. 2.3a, the ripples formed at pulse energy of 0.10 mJ are long and
straight, and there is no evident fragmentation. With the pulse
energy increased to 0.15 mJ, the previous long and straight ripples
become bent, and there are a large number of spherical structures
with size from 50 to 300 nm formed on or between the ripples
Fig. 2.3c). Although the period of the ripples can be further increased
to 630 nm with the pulse energy increased to 0.20 mJ, many long
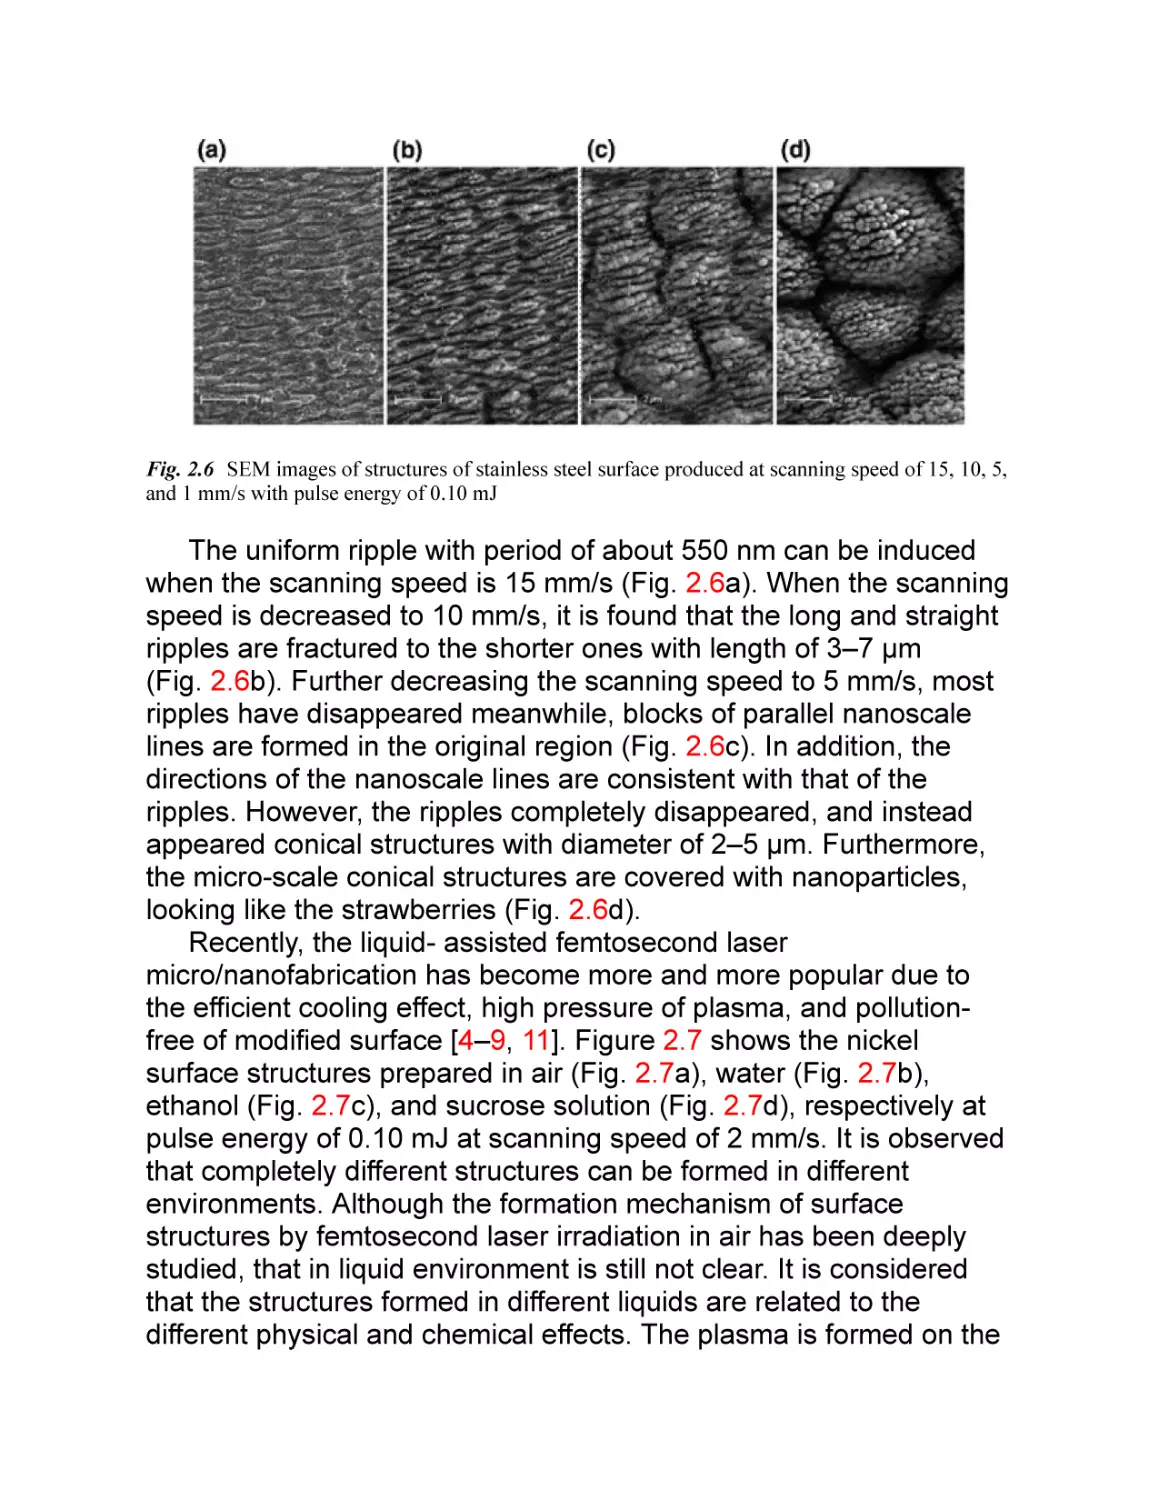
cracks appears Fig. 2.3d). From the amplified SEM images in
Fig. 2.4, it is clear that the cracks tear the original whole ripples into
two small ripples with period of about 350 nm. In addition, the
intervals between the adjacent ripples formed at 0.20 mJ are about
160–200 nm, which are evidently larger than that of the small pulse
energy. Furthermore, many dozens of nanoscale filaments form on
the ripples surfaces or bridge the adjacent ripples with the orientation
perpendicular to the ripples. It is considered that the formation
mechanism is attributed to the gaussian spatial distribution of pulse
energy [12–16].
Fig. 2.3 The influence of laser pulse energy on the morphology
Fig. 2.4 Amplified SEM images of lacerated ripples
Sakabe [17, 18] proposed that the ripples is formed due to the
superposition of the multipulse energy on the metal surface, and the
overall process can be summarized as follows: (1) plasma waves are
induced on metal surface by the femtosecond laser pulse; (2)
spatially localized ion clouds Coulomb-explode to vacuum, and
consequently the thin layer is ablated, and the interspacing of the
gratings is printed at the stage of the first several pulses; (3) for the
subsequent pulses, the electric field is enhanced near the initially
printed structures, and the near field ablates the surface, thus
deepening the structures. In addition, it is thought that the period (d)
of the ripples is approximately equal to the wavelength of laser
induced plasma waves (λ SP ). Hence, the formula for the period can
be summarized as [17, 18]:
(2.1)
where λ L is the incident laser wavelength, nes is the surface electron
density induced by the incident laser, c is the speed of light in
vacuum, e is the electron charge, and m is the electron mass,
respectively. nes in our case is influenced by the laser fluence and
the incident laser wavelength. From Eq. 2.1, an obvious and direct
correspondence can be obtained between ripple periods d and
incident laser wavelength λ L . In addition, according to the literature,
the period of ripples changes from 0.5 λ L to 0.85 λ L when the
incident laser wavelength of 800 nm, which is agreed with the
experimental results.
Based on the above discussion, at pulse energy of 0.092 mJ and
scanning speed of 12 mm/s, high-quality long and straight ripples
with period of 540 nm are produced, and the SEM image is shown in
Fig. 2.5. Besides, the morphology of the structures is also really
relevant to the laser scanning speed [1]. Figure 2.6 shows the SEM
images of structures of stainless steel surface produced at scanning
speed of 15, 10, 5, and 1 mm/s with pulse energy of 0.10 mJ.
Fig. 2.5 High-quality long and straight ripples with period of 540 nm
Fig. 2.6 SEM images of structures of stainless steel surface produced at scanning speed of 15, 10, 5,
and 1 mm/s with pulse energy of 0.10 mJ
The uniform ripple with period of about 550 nm can be induced
when the scanning speed is 15 mm/s (Fig. 2.6a). When the scanning
speed is decreased to 10 mm/s, it is found that the long and straight
ripples are fractured to the shorter ones with length of 3–7 µm
(Fig. 2.6b). Further decreasing the scanning speed to 5 mm/s, most
ripples have disappeared meanwhile, blocks of parallel nanoscale
lines are formed in the original region (Fig. 2.6c). In addition, the
directions of the nanoscale lines are consistent with that of the
ripples. However, the ripples completely disappeared, and instead
appeared conical structures with diameter of 2–5 µm. Furthermore,
the micro-scale conical structures are covered with nanoparticles,
looking like the strawberries (Fig. 2.6d).
Recently, the liquid- assisted femtosecond laser
micro/nanofabrication has become more and more popular due to
the efficient cooling effect, high pressure of plasma, and pollutionfree of modified surface [4–9, 11]. Figure 2.7 shows the nickel
surface structures prepared in air (Fig. 2.7a), water (Fig. 2.7b),
ethanol (Fig. 2.7c), and sucrose solution (Fig. 2.7d), respectively at
pulse energy of 0.10 mJ at scanning speed of 2 mm/s. It is observed
that completely different structures can be formed in different
environments. Although the formation mechanism of surface
structures by femtosecond laser irradiation in air has been deeply
studied, that in liquid environment is still not clear. It is considered
that the structures formed in different liquids are related to the
different physical and chemical effects. The plasma is formed on the
liquid/solid interface when the laser beam transmitted through the
liquid layer to the material surface. The evolution and formation of
the structures involve complex laser-liquid-material mechanisms,
such as interference of incident laser and plasma waves, liquidinduced uniform distribution of pulse energy, prolonged melting and
resolidification process, and mechanical pressure remodeling
process [4–9, 11].
Fig. 2.7 The influence of liquid environment on the surface morphology
Although the formation mechanism of liquid-assisted
femtosecond laser induced micro/nanostructures is not clear, we
have understood the morphological characteristics of the structures
and the evolution, which provide the way to accurately control the
structures.
References
1.
Li G, Li J, Yang L, et al. Evolution of aluminum surface irradiated by femtosecond laser pulses
with different pulse overlaps. Appl Surf Sci. 2013;276:203–9.
[Crossref]
2.
Qi L, Nishii K, Namba Y. Regular subwavelength surface structures induced by femtosecond
laser pulses on stainless steel. Opt Lett. 2009;34(12):1846–8.
[Crossref]
3.
Yao J, Zhang C, Liu H, et al. Selective appearance of several laser-induced periodic surface
structure patterns on a metal surface using structural colors produced by femtosecond laser
pulses. Appl Surf Sci. 2012;258(19):7625–32.
[Crossref]
4.
Yang HD, Li XH, Li GQ, et al. Formation of colorized silicon by femtosecond laser pulses in
different background gases. Appl Phys A Mater Sci Process. 2011;104(2):749–53.
[Crossref]
5.
Amoruso S, Bruzzese R, Wang X, et al. Femtosecond laser ablation of nickel in vacuum. J Phys
D Appl Phys. 2007;40(2):331.
[Crossref]
6.
Ali N, Bashir S, Akram M, et al. Effect of dry and wet ambient environment on the pulsed laser
ablation of titanium. Appl Surf Sci. 2013;270:49–57.
[Crossref]
7.
Bian H, Yang Q, Liu H, et al. A facile preparation route for netlike microstructures on a stainless
steel using an ethanol-mediated femtosecond laser irradiation. Mater Sci Eng, C.
2013;33(2):663–7.
[Crossref]
8.
Barmina EV, Stratakis E, Fotakis K, et al. Generation of nanostructures on metals by laser
ablation in liquids: new results. Quantum Electron. 2010;40(11):1012.
[Crossref]
9.
Kumar B, Yadav D, Thareja RK. Growth dynamics of nanoparticles in laser produced plasma in
liquid ambient. J Appl Phys. 2011;110(7):074903.
[Crossref]
10. Amoruso S, Ausanio G, Barone AC, et al. Nanoparticles size modifications during femtosecond
laser ablation of nickel in vacuum. Appl Surf Sci. 2007;254(4):1012–6.
[Crossref]
11. Albu C, Dinescu A, Filipescu M, et al. Periodical structures induced by femtosecond laser on
metals in air and liquid environments. Appl Surf Sci. 2013;278:347–51.
[Crossref]
12. Bonse J, Rosenfeld A, Krüger J. Femtosecond laser-induced periodic surface structures: recent
approaches to explain their sub-wavelength periodicities. In: LAT 2010: International conference
on lasers, applications, and technologies. International society for optics and photonics; 2011,
7994, 79940M.
13.
Le Harzic R, Dörr D, Sauer D, et al. Generation of high spatial frequency ripples on silicon
under ultrashort laser pulses irradiation. Appl Phys Lett. 2011;98(21):211905.
[Crossref]
14. Varlamova O, Bounhalli M, Reif J. Influence of irradiation dose on laser-induced surface
nanostructures on silicon. Appl Surf Sci. 2013;278:62–6.
[Crossref]
15. Obona JV, Ocelík V, Skolski JZP, et al. On the surface topography of ultrashort laser pulse
treated steel surfaces. Appl Surf Sci. 2011;258(4):1555–60.
[Crossref]
16. Straub M, Afshar M, Feili D, et al. Surface plasmon polariton model of high-spatial frequency
laser-induced periodic surface structure generation in silicon. J Appl Phys.
2012;111(12):124315.
[Crossref]
17. Okamuro K, Hashida M, Miyasaka Y, et al. Laser fluence dependence of periodic grating
structures formed on metal surfaces under femtosecond laser pulse irradiation. Phys Rev B.
2010;82(16):165417.
[Crossref]
18. Sakabe S, Hashida M, Tokita S, et al. Mechanism for self-formation of periodic grating
structures on a metal surface by a femtosecond laser pulse. Phys Rev B. 2009;79(3):033409.
[Crossref]
© Springer Nature Singapore Pte Ltd. 2018
Guoqiang Li, Bionic Functional Structures by Femtosecond Laser Micro/nanofabrication
Technologies, Springer Theses: Recognizing Outstanding Ph.D. Research,
https://doi.org/10.1007/978-981-13-0359-3_3
3. Study on Femtosecond Laser Induced
Structural Colors
Guoqiang Li1
(1) Department of Precision Instrument and Machinery, University of
Science and Technology of China, Hefei, China
Guoqiang Li
Email: guoqli@ustc.edu.cn
In this chapter, we prepared various micro/nanostructures and
realized the colorizing the materials surface. By adopting different
laser pulse overlaps several kinds of structural colors were produced
on the aluminum surfaces. In addition, we not only discussed the
combined influence of incident light angle and the ripples orientation
on the diversity of structural colors, but also proposed the possibility
of producing multi-patterns constituted by ripples with different
orientations, and realized the diverse and exclusive display.
Furthermore, the preparation of three-dimensional effect patterns on
metal surface was proposed.
3.1 Femtosecond Laser Induced Structural Colors on
Aluminum Surfaces
Aluminum is a common energetic material, and it has the
characteristics of low melting point. It can be easily oxidized when
exposed to air. C. Guo has reported the preparation of golden, gray,
and black colors on aluminum surfaces [1]. However, the research
on the formation of different colors just by adjusting the scanning
speed is rare [2]. Here we modified the aluminum surfaces by
scanning the femtosecond laser beam over the surfaces. The
influence of the pulse overlap on processing result was studied in
detail through observing the induced micro/nanostructure, and
analyzing the composition of the modified surface. Results
demonstrated that various structural colors can be generated by
properly controlling the pulse overlap. Such an investigation is
supposed to be able to provide a promising method for producing
controllable structural colors.
Firstly, the possibility of producing structural colors on aluminum
surfaces by altering the pulse overlap is examined. In experiments,
the average laser fluence is 5.1 J/cm2. The pulse overlap in the Ydirection is chosen to be −233% (hatch distance = 50 μm). The
aluminum surfaces appear golden, white, gray and black when the
overlap is set as −7, 33, 93, and 99%, respectively. The
corresponding scan rate is 16, 10, 1, and 0.1 mm/s. The typical
results are demonstrated in Fig. 3.1.
Fig. 3.1 Photograph of modified aluminum: a golden; b white; c gray; d black
To identify how the surface structures are affected by the pulse
overlaps, a detailed SEM study is performed on the aluminum
sample surface. Figure 3.2 shows the SEM images of an unexposed
aluminum surface. Figures 3.2, 3.3, 3.4 and 3.5 reveal the SEM
images of irradiated targets at various pulse overlaps, which are −7,
33, 93 and 99%, respectively.
Fig. 3.2 SEM images of untreated aluminum surface: a 20,000 × magnification; b 100,000 ×
magnification
Fig. 3.3 SEM images of structures on golden aluminum surface
Fig. 3.4 SEM images of structures on white aluminum surface
Fig. 3.5 SEM images of structures on gray aluminum surface
It is clear from Fig. 3.3a that adopting the pulse overlap in x
direction of −7% endows the modified aluminum surface with a
smooth surface as compared to the untreated surface in Fig. 3.3.
The more detailed structures can be seen from Fig. 3.3b–d. Many
nanoparticles, whose diameters are in the order of hundreds of
nanometers, are embedded on the substrate surface. As shown in
Fig. 3.3c, these nanoparticles can be generally classified into two
shapes [2]. One is like a flower with diameter of approximately three
hundred nanometers in diameter, and the other is like a sphere with
diameter of approximately one hundred nanometers. Figure 3.3d
confirms that these nanoparticles contain many protrusions and
micro scale aggregates, which are formed by fusing nanoparticles
together on the surface.
When the pulse overlap increases to 33%, slight stripe structures
dispersed on the substrate surface appear as shown in Fig. 3.4a.
Nonuniform cracks of different scale are also formed, as evidently
displayed in Fig. 3.4b. When the surface morphology is magnified
20,000 times as shown in Fig. 3.4c, block-like structures and grainy
structures can be found clearly. This is the evidence that the liquid
phase exists in the laser ablation process. Higher pulse overlap
makes more surface materials vaporize, therefore both the quantity
and the size of spheres decrease and more fluffy structures are
generated as shown in Fig. 3.4d.
Figure 3.5a represents the surface topography of representative
groove structures generated by scanning a laser beam horizontally
across a sample surface at a 93% overlap. The period of the groove
is 50 μm, which is determined by the distance of adjacent horizontal
scanning lines. The width of groove is about 15 μm, which is
approximately equal to the diameter of the focused laser beam.
Compared with the case of 33% overlap, the scale formed spherical
and block-like nanoparticle aggregates much bigger as shown in
Fig. 3.5b. More fluffy porous can be generated, which can be found
in Fig. 3.5c and d.
When the overlap reaches 99%, the processing lines can
produce deeper grooves on the aluminum surface as shown in
Fig. 3.6a and b. From the cross-sectional SEM image, Fig. 3.6e, the
depth of the grooves is measured to be ranging from 89 to 125 μm.
Figure 3.6b–d demonstrate the black aluminum surface has a rich
variety of structures including types of nano- and micro-scale voids,
nanoprotrusions, microscale aggregates formed by coalescence of
nanoparticles [3].
Fig. 3.6 The front and side SEM images of structures on black aluminum surface
In order to further study the influence of the pulse overlap on
surface modifications, we also considered the case of the pulse
overlap of 12% (V = 13 mm/s). Under such a condition, another kind
of modified aluminum surfaces are fabricated, which exhibits
different colors from different viewing angles as shown in Fig. 3.7.
The SEM study shows that the entire surface of the aluminum is
covered with femtosecond laser-induced periodic structures (LIPSS),
and the spatial period of the LIPSS ranges from 500 to 550 nm. The
LIPSSs can be considered as a kind of grating structures, which
could play important roles in modifying the optical properties of metal
surfaces in a very versatile way.
Fig. 3.7 Color aluminum formed at pulse overlap in x-direction of 12%: a viewed at 80°; b viewed
at 60°; c SEM image of color aluminum
X-ray photoelectron spectroscopy (XPS) and X-ray diffraction
spectra measurements are performed to investigate the chemical
compositions and surface structures of irradiated aluminum sheets
[3]. From the XPS spectra as shown in Fig. 3.8 and peak table as
shown in Table 3.1, it is found that for untreated aluminum, both the
peaks at 71.7 eV BE and 74.27 eV BE can be detected, which are
from the pure aluminum and the oxidized aluminum respectively.
This result suggests the thickness of the natural oxide film should be
less than 10 nm [3], for the maximum penetration depth of
photoelectron is about 10 nm in XPS measurement. The peak at
74.27 eV is consistent with the Al2p binding energy.
Fig. 3.8 XPS spectra for aluminum
Table 3.1 XPS peaks for surface elements
O1s (ev) C1s (ev) N1s (ev) Al2p (ev)
Untreated aluminum 531.64 284.81 399.84 74.27
Golden aluminum
531.45
284.81
399.6
74.30
White aluminum
531.66
284.79
406.98
74.34
Gray aluminum
531.71
284.82
407.01
74.42
Black aluminum
531.77
284.79
407.18
74.45
When the aluminum surfaces are irradiated with the femtosecond
laser in air, only Al peak at 74.27 eV BE exists on the modified
aluminum surfaces. Results indicate that the thickness of the
oxidized film will increase more than 10 nm after the irradiation
process.
All the samples not only have the expected O and Al elements,
but also have a relatively high content of C1s and a small N1s. The
contents of the Al and O increase with the increasing pulse overlap,
which can be concluded from Table 3.2.
Table 3.2 Surface element contents calculated from XPS survey spectra
Oxygen (%) Carbon (%) Nitrogen (%) Aluminum (%)
Untreated aluminum 40.38
43.64
1.45
14.54
Golden aluminum
49.92
32.19
1.67
15.22
White aluminum
55.52
27.21
1.33
15.95
Gray aluminum
57.62
24.21
1.79
16.38
Black aluminum
57.65
22.75
1.52
18.08
The surface structure of irradiated aluminum is identified by X ray
diffraction spectra. The sharp and high intensity peaks from Al are
shown in Fig. 3.9. In addition, Al2O3 and anorthic Al(OH)3 are found
on golden aluminum and white aluminum, while only Al2O3 can be
found on the gray and black aluminum, which demonstrates that the
oxidation reaction for aluminum is enhanced with the increase of
pulse overlap [2, 3].
Fig. 3.9 XRD patterns of femtosecond laser treated aluminum surfaces: a golden aluminum; b white
aluminum; c gray aluminum; d black aluminum
The XPS peaks table shows that all the C1s peaks are located at
the same position (284.8 eV), which implicates that they have come
from the same contribution. Carbon is a kind of extremely sensitive
element therefore it is easy to detect by analyzing the XPS spectra.
The origin of the carbon on the aluminum surfaces may come from
the accumulated pollution during pre- and post-irradiation sample
handling. In addition, we noted that the carbon content decreases
significantly when the pulse overlap increases. This phenomenon
can be explained from the surface topography of modified
aluminums. The SEM images in Figs. 3.3, 3.4, 3.5 and 3.6 show that
the aluminum sheets after laser irradiation are covered by particles,
grooves and voids, which allow the carbon element to penetrate
deeply into the aluminum surfaces and meanwhile the content on the
surfaces decreases [2, 3].
As for the N1 s, we can see that its content in either the untreated
aluminum surface or the modified ones is very weak, and there is no
strong correlation between the N1s content and the pulse overlap.
According to the N1s peak positions in Table 3.1, the origin of N can
be attributed to two different contributions. The two peak positions
(399.84 and 399.6 eV) are very close to the peak position (400 eV)
for nitrogen in most organic materials, thus some part of N comes
from organic matters. The other peak positions (406.98, 407.01,
407.18 eV) indicate that the other part of N might exists in the form
of some nitrogen compound NO3.
Therefore, colorizing aluminum surfaces can be mainly
influenced by forming a variety of structures of different size,
width/diameter, and/or depth. The surface structures, such as the
microgratings, contribute for changing the optical properties of the
aluminum surfaces, which result in different colors at different
viewing angles because of the trapping of light inside the periodic
microstructures and the angular dependence of Fresnel reflections.
The random microstructures or nanostructures, play significant roles
in forming colorful aluminum exhibit one kind of color in different
angle of view [1, 2]. Many nanoparticles of hundreds of nanometer
scale in diameter embedded on the substrate surface result in yellow
color [2]. Block-like structures and grainy structures endow the
aluminum surface with white color [2]. Grooves covered with types of
nano- and microscale voids make the aluminum surface show gray
or black color, and so on [2]. The phenomena of color change shows
that the optical properties of the aluminum surface change with
control of laser treatment parameters. Aluminum oxide appears pure
white, which enhances the color of white, and weakens the other
colors on modified aluminum surfaces [2].
Based on above investigations, patterned colors on one surface
can be flexibly produced by altering the pulse overlap. For
verification, blue Olympic rings can be fabricated as shown in
Fig. 3.10a by using an overlap of −27%. A modified aluminum sheet
composed of white, black, golden and gray regions as shown in
Fig. 3.10b can also be controllably produced by adopting the pulse
overlaps as mentioned [2].
Fig. 3.10 a Olympic rings produced at the pulse overlap in x-direction of −27%, b combinatorial
picture controllably produced
3.2 Diverse Displays for Multiple Color Patterns on
Stainless Steel Surfaces
The creation of colorful metals produced by Laser Induced Periodic
Surface Structures (LIPSS) has drawn considerable attention in
recent years [4]. These LIPSSs can be considered as a kind of
grating structures, which could play important roles in modifying the
optical properties of metal surfaces in a very versatile way. The
widely accepted theory believed that the formation of LIPSSs was
the result of the interference between the incident laser beam and
the surface-scattered wave. In addition, it is indicated that the ripples
(LIPSSs) orientation usually is perpendicular to the polarization of
laser pulse [4–6]. The correlation of ripples orientation and laser
polarization offers us an opportunity to skillfully utilize the laser
polarization as a control parameter to write diverse displayed
patterns on metal surfaces. Specific color patterns can be generated
due to the diffraction of light by producing polarization dependent
structures. Color effects can be diversely displayed by altering the
incidence angle of white light, which is used to irradiate the patterns
constituted by ripples with different orientations [4–6] (Fig. 3.11).
Although many works have been reported to explore how to use the
laser polarization dependent ripples to obtain the needed optical
diffractive effects, there are still few researches on systematical
study of the combined influence of incident light angle and the
ripples orientation on the color effects. Also there are few reports on
the diverse displays for multi-patterns which are fabricated in the
adjacent locations on the metal surface and constituted by ripples
with different orientations. In this paper, we not only discussed the
combined influence of incident light angle and the ripples orientation
on the diversity of structural colors, but also proposed the possibility
of realizing the carry and diverse display of multi-patterns. Our
investigation may find applications in the fields of information
storage, identifying codes and anti-counterfeiting patterns and so on
[4–6].
Fig. 3.11 a femtosecond laser induced periodic ripples on stainless steel surface; b schematic
diagram of ripples diffraction; c photogragh of structural colors
In this experiment, mirror polished 316 L stainless steel surface is
used. Before the laser irradiation, the polarization direction of the
laser pulse was adjusted by a linear Glan-Taylor polarizer. The
scanning was realized by using a computer controlled high precision
XY galvo mirror. The beam diameter focused onto the sample
surface was about 20 μm. Schematic illustrations of measuring the
optical properties were shown in Fig. 3.12. A digital optical camera
(Cannon) was used to take the pictures of the structural colors.
During the process of taking pictures, the surface ripples were
irradiated by an unpolarized white light source from a LED lamp. For
an objective evaluation of color effect, a spectrometer (Ocean
Optics, USB2000) was used to measure the reflectance spectra
diffracted by the formed ripples, if necessary. All measurements were
carried out in dark to avoid stray lights from the surrounding
environment.
Fig. 3.12 Schematic illustration of color measuring system
Based on experimental investigation, a series of processing
parameters were optimized to satisfy the optimum condition for
generating ripple structures. In this experiment, the pulse overlap
was set to 32%, the line space was fixed at 20 μm, and the laser
fluence was chosen as 1.1 J/cm2. Under the processing parameters,
a circle pattern with diameter of 6 mm was fabricated on the
stainless steel surface. The SEM images indicate that periodic
ripples with period of d = 540 nm, and orientation to be perpendicular
to the polarization orientation of laser pulse were formed.
In order to systematically investigate the influence of the incident
angle of white light and the ripples orientation on the formation of
structural colors, a color measuring system was configured as
presented in Fig. 3.12. Figure 3.12 illustrates that the incident white
light and the optical camera were placed in the XZ plane, with α and
β orientation to the Z-direction on both sides, respectively. The
sample constituted by the ripples with φ orientation to the X-direction
was located in the XY plane. The range of α was from 0° to 90°, and
that of φ was from 0° to 180°. The optical properties of the ripples
can be considered to be close to those of reflective diffraction
gratings. When white light is shined on the sample surface,
diffraction gratings divide incident light into spectra with different
wavelengths. The spectra are reflected differently by virtue of its
wavelength-dependent refractive index. In this case, the lights with
certain wavelengths are deflected from reaching the optical camera
owing to the presence of structures. As a result, the reflected light
with particular wavelength captured by the digital camera becomes
sources of structural colors [4, 7, 8–11].
As the clarity of the taken colors depend on the observation angle
to some extent, many measurements were performed to find the
optimal location of the digital camera. It was found that the shadow
of the camera could be seen in the sample surface when the viewing
angle β was less than approximately 20° for the specular reflection
of the mirror polished stainless steel surface. On the other hand, if
the viewing angle was larger than approximately 60°, part of the
taken colors was dim, which was unsatisfactory. Hence, observation
of the clearest color on the basis of analyzing the optical images was
adopted as a criterion for the optimal viewing angle. On this basis,
an angle of about 25° was chosen, and this was kept constant for all
measurements [4].
Under different incident light angle α and ripples orientation angle
φ, the pictures of the diverse colors were taken. The pictures were
cropped and arranged in order, as shown in Fig. 3.13. It is revealed
that the colors are strongly dependent on the incident light angle α
and ripples orientation angle φ. In addition, it is noticed that the
colors mainly appear in the central zone, with “V” shaped pro-file,
nearly spanning the whole visible spectrum. On the contrary, in other
regions, the colors disappear, or display completely dark.
Fig. 3.13 Photograph of the structural colors observed at different incidence angles and ripples
orientations
To explain this phenomenon, the ripples are regarded as
rectangular reflection grating, and the theoretical analysis based on
the grating diffraction is performed. The diffracted light wavelengths λ
that match the different colors can be calculated with the following
diffraction Eq. 3.1 [5, 7]:
(3.1)
where n is the order of diffraction, which is an integer. λ is the
wavelength of white light wavelength, and the range is from
approximately 400–700 nm, to cover the visible color spectrum. d
indicates the period of the grating (540 nm). The range of the d(sin
α·sin φ + sin β) in our case is from 228 nm to 768 nm, hence only the
first-order diffraction from the grating can be selected, namely n = 1
(Fig. 3.14). Then the calculated wavelengths are transformed into
the corresponding colors, and the result is presented in Fig. 3.15.
Obviously, for each specific incident angle of white light, diverse
colors can be viewed at different angles.
Fig. 3.14 Schematic diagram of grating diffraction
Fig. 3.15 The simulation results of the structural colors
In detail, we take the incident angle of 90° for example. In this
case, the diffraction equation can be rewritten as
(3.2)
The diffraction condition is 0.3 ≤ sin φ ≤ 0.874. Therefore, the
corresponding range of φ is from 17.46° to 60.93°, and from 119.07°
to 162.54°. For other orientation angle ranges, there is no visible
wavelength found to fulfill the diffraction condition, hence no
structural color can be observed.
A systematic comparison between the experimental results and
the simulation ones reveals that some color differences can be
found. This can be attributed to the following reasons: (1) even
though the processing parameters were carefully chosen, LIPSS
itself is not a very uniform periodic structure which has its intrinsic
limitation in terms of grating uniformity. This nonuniformity can
causes the differences in the light modulation; (2) the irregular
nanoparticles formed on the top of the LIPSSs can absorb or reflect
certain wavelengths of light; (3) the discordance between
environmental conditions and the measurement system; (4) the
fluctuation and distortion of light source. Although the experimental
results are not very perfect compared to the model, this color
reported in this work demonstrate angle sensitive.
From the above discussion, it is evident that the colors can be
periodically displayed if ripples orientation angle φ is ranged from -∞
to +∞. Moreover, in this case, all the above-mentioned colors in
Fig. 3.13 can appear at different locations if another viewing angle β
is chosen.
The following section provides an example to illustrate a possible
application of this finding, which is done by introducing the diverse
display of multipattern. For this purpose, four numbered circle
patterns, arranged in two rows and two columns, were fabricated on
the stainless steel surface, as shown in Fig. 3.16a. The diameter of
each pattern is 6 mm. The surface structures are constituted by
ripples with orientations of 0°, 30°, 60°, 90°, respectively, which are
designed by controlling the laser polarization. The polarization
angles for samples 1–4 are 90°, 60°, 30°, and 0°, respectively, as
shown in the SEM images of Fig. 3.16b. In the initial position, the
ripples orientation of the No. 1 pattern is alignment with the Xdirection.
Fig. 3.16 a Schematic illustration of measuring the optical property; b SEM images of the ripples
with orientations of 90°, 30°, 60°, 90°, respectively
The change of the rotating sample angle θ can be realized by
rotating the platform anticlockwise around the Z-direction. In this
way, ripples orientations of all these patterns can be varied.
Correspondingly, the diffraction equation for each pattern can be
written in sequence as
(3.3)
(3.4)
(3.5)
(3.6)
It should be noted that enhanced colors can be observed on the
pattern when the corresponding diffraction equations meet
condition 400 ≤ nλ ≤ 700 nm, (n = 1). In this way, one or more
patterns can be distinguished selectively from all the patterns by the
corresponding colors. It is desirable to use a computer to perfectly
analyze this selectivity. In this analysis, four cases of “one out of four
pattern”, six “two out of four patterns”, four “three out of four
patterns”, a “none” and an “all” can be obtained.
For verification, the related experiments are conducted by
studying the structural colors of the patterns. The home-made setup
is illustrated in Fig. 3.16a. By conducting the experiment carefully, it
is found that the desired patterns can be observed with enhanced
colors by adjusting the incident light angle and the rotating sample
angle, as shown in Fig. 3.17. Meanwhile, the rest cannot be
observed for the colors disappeared.
Fig. 3.17 Multi-patterns displayed with different structural colors
In addition to the cases shown in Fig. 3.17, the sample can
present the same patterns with different enhanced colors at other
incident light angle and rotating sample angle. A typical experiment
shown in Fig. 3.18 analyzes the impact of the angle sensitivity on the
color effects for the same patterns. In Fig. 3.18, the No. 1 pattern
exhibits with blue, green, yellow and orange at the given angles.
Since the main reason for the colors is the diffracted light received
from the observed pattern by camera, the spectral properties for the
pattern are investigated with a spectral measurement system
(Fig. 3.16a). The reflectance spectrum of the pattern is made as a
function of the visible wavelengths, as shown in Fig. 3.18. The
measurements give the spectral information for the measured color.
This experiment reveals that the desired patterns can be displayed
with different enhanced colors, demonstrating strong angle
sensitivity. Assuming that enhanced colors represent different
information, multiple types of information stored with the mentioned
method can only be correctly identified in certain condition. Such an
investigation can provide a promising method to fabricate patterns
containing security information with various colors which are not only
readable but also difficult to be imitated. Hence, the technique may
find applications in meeting the urgent requirements for forgery
protection, information storage, and identifying codes and so on.
Fig. 3.18 Images and spectrum of No. 1 pattern measured at different angles
In addition to the applications mentioned above, this technique
can also be used in the preparation of artwares. As shown in
Fig. 3.19, “Eight Trigrams” and “Zodiac”, which are representative
figures in Chinese traditional culture, are inscribed on stainless steel
surface with different ripples directions. Under the irradiation of
illumination, the pattern can be selectly displayed with different
colors. Combining with the advanced computer control technology,
more complex color patterns, such as the butterfly (Fig. 3.19), can
also be fabricated.
Fig. 3.19 The application of structural color in artwares
3.3 The Preparation of Three-Dimensional (3D)
Patterns
In this section, we propose the preparation of three-dimensional (3D)
patterns with femtosend laser coloring technology. Because of the
opacity of the metal materials, it is impossible to prepare patterns at
different layers by focusing the laser beam to different depths [4, 8].
The key to prepare three-dimensional (3D) patterns on metal surface
is fixing the positions of the multiple patterns. For example, Chinese
characters “中国” in Fig. 3.20a is visually two-dimensional.
Amazedly, the two-dimensional pattern can be changed to threedimensional one if the same pattern is overlayed and then translated
repeatedly along the XY directions at certain scale, as shown in
Fig. 3.20b.
Fig. 3.20 Schematic diagram of designing three-dimensional patterns
Based on the above discussion, the three-dimensional color
patterns can be produced on stainless steel surface with
femtosecond laser coloring technology (Fig. 3.21). The advantage of
this technology lies in the preparing the three-dimensional and
complicated patterns on metal surfaces flexibly, which has wide
applications in the fields of the industrial arts.
Fig. 3.21 The preparation of three-dimensional color patterns with femtosecond laser on stainless
steel surface
3.4 Coloring Metal Surface with Different Laser
Wavelengths
We find that the ripple’s period is directly dependent on the laser
wavelength and the materials. To the best of our knowledge, most
papers indicate that the colors are produced with laser wavelength of
about 800 nm, and the corresponding ripples periods ranged from
480 to 580 nm. However, the structural colors formed by other laser
wavelength are less researched. In this section, a systematic study
is performed on the dependence of structural colors on the laser
wavelengths which ranged from 400 to 2200 nm. It is found that
completely different colors can be obtained by different types of
ripples induced with varying laser wavelengths. The discussion in
this paper suggests femtosecond laser wavelength as a potential
parameter to fabricate various colors and ultimately leads to
controlling the optical properties of the metals.
The experiments were conducted to study the colors which are
formed by a variety of subwavelength ripples induced with varying
laser wavelengths. The laser wavelength, a key processing
parameter, is modulated by the optical parametric amplifier (OPA,
TOPAS-800-fs), and the modulation range is from 240 to 2600 nm.
It indicates that ripples with various kinds of periods can be
induced by different laser wavelength under suitable laser fluence
and scanning speed. The exact calculation for spatial period Λ is still
difficult. However, the goal of our work was to obtain the needed
ripple periods by precisely controlling the laser wavelengths
experimentally. It is found that uniform ripples with different spatial
periods can be obtained at optimized laser fluence in the range of
0.96–1.02 J/cm2, scanning speed of 13 mm/s. The ripple spatial
periods (Λ) as a function of the incident laser wavelength (λ L ) are
illustrated in Fig. 3.22a. The partial SEM images of the ripples
formed on stainless steel surface are presented in Fig. 3.22b. The
results show that the spatial periods of LIPSS depend on the laser
fluence and the incident laser wavelength. The formation mechanism
has been studied by Sakabe et al. and Okamuro et al.
Fig. 3.22 a Ripple spatial periods as a function of the incident laser wavelength. b Partial SEM
images for the laser-induced periodic surface structures by different laser wavelengths
To study the formed colors, we regard the ripples as gratings. It is
known that the diffracted light by the ripples strongly depend on the
light source directions and the ripple directions. It indicates that the
horizontally mounted sample, rotated around Z-direction, is
illuminated by an unpolarized light source which is placed in the XZ
plane, with α orientation to the Z-direction, equivalent to the day-light
spectrum. φ is the ripple direction to X-direction. Both the ranges of α
and φ are from 0° to 90°. Then, the diffracted light is observed with a
β orientation to the Z-direction, at the contrary direction of light
source. In our study, the viewing angle is fixed at 20°.
The gratings with different spatial periods having a size of 5 mm
× 5 mm are examined under the color measuring system. The results
are shown in Fig. 3.23. It is indicated that the colors are different at
different coordinates for a given ripple period. In addition, the
observed colors are also different at the same coordinates for
different ripple periods.
Fig. 3.23 Photographs of the structural colors formed with different spatial periods
Based on the color measuring system, diffraction Eq. 3.1, and
schematic diagram of grating diffraction (Fig. 3.14), a related
theoretical simulation can be performed through the analysis of the
diffraction equations with different periods. The wavelength of
second-order diffraction light is <400 nm which cannot be observed
for most spatial periods. In addition, the intensity of the second-order
diffraction light or even higher orders is so weak that it can be
ignored. Hence, only the first-order diffraction from the grating can
be selected, namely n = 1. From the calculated spatial periods
matching the different diffracted wavelengths, it is observed that the
processed areas can exhibit structural colors when the period Λ is
>298 and <2047 nm. When the ripples period is beyond this scope,
there is no wavelength λ found to fulfill the diffraction conditions, thus
no color can be observed. In addition, the colors can cover the whole
visible spectrum if the spatial period is >522 and <1170 nm. As
described above, we can divide the periods into three scopes,
namely 298 to 522 nm, 522 to 1170 nm and 1170 to 2047 nm, to
separately study the influence of periods on the color effects.
Firstly, the spatial periods ranged from 298 to 522 nm is
discussed. By solving the diffraction equation, α and φ matching
different periods are calculated. Then, the calculated α and φ are set
to horizontal and vertical coordinates, respectively. The segmental
results are presented in Fig. 3.24. One can see that the silhouette
which is besieged by α and φ meeting the diffraction equation
(marked blue in figures, hereinafter referred to as “silhouette”)
present a completely symmetric about the angular bisector of the
coordinate system.
Fig. 3.24 Calculated coordinate meeting (a, b, c) and spectrum (d, e, f) for the structural colors
formed under the spatial periods of 300 and 522 nm. The bars on the right of a, b and c indicate the
spectrum range
By comparison, obviously, at low spatial period of 300 nm, the
diffracted light can cover only a few nanometers, namely from λ =
400 to 403 nm, as shown in Fig. 3.24a. As the periods increase, a
broader spectrum appears and the maximum value of the spectrum
increases (Fig. 3.24b–c). When the periods are increased to
521.6 nm, the whole visible spectrum can be covered (Fig. 3.24c).
Moreover, the locations of the silhouettes are getting closer to
coordinate axes.
In order to get a deep insight into the influence of the spatial
periods on the transfer of the spectrum, we calculate the locations of
spectrum λ = 400, 500, 600, and 700 nm in α, φ coordinate system,
which are presented in Fig. 3.24d–f. For Λ = 300 nm, it indicates that
only the spectrum of λ = 400 nm can be observed near (90°, 90°),
presenting an arc-shaped line, which is symmetric about the angular
bisector of the coordinate system. When Λ is increased to 400 nm,
the coordinate areas for the spectrum λ = 400 nm becomes broader.
In addition, the spectrum λ = 500 nm appears. However, it is noticed
that the two spectra are away from each other, which is
demonstrated in Fig. 3.24e. As Λ becomes 521.6 nm, it is the lower
limit of the Λ meeting the condition to cover the whole visible
spectrum. In this case, the four spectra lines appear together. In
contrast, the spectra lines are located very close to each other, and
they have the trend to get close to the origin of coordinates.
Secondly, the influence of spatial periods ranged from 522 to
1170 nm on the diffracted spectrum is discussed, and the results are
shown in Fig. 3.25. In this period scope, it is found that no matter
what the location of the silhouette is, diffracted light can cover the
whole spectrum (Fig. 3.25a–c). Similar to the previous, the locations
of λ = 400, 500, 600, and 700 nm are getting closer to the origin of
coordinates, and the spectral lines are closer to each other
(Fig. 3.25d–e).
Fig. 3.25 Calculated coordinate and spectrum for structural colors formed under spatial periods of
400 and 500 nm
In addition to the two period scopes discussed above, it is
indicated that the spatial periods ranged from 1170 to 2047 nm also
affect the diffracted spectrum greatly. The silhouette is becoming
narrower with the increasing periods, leading to the diffracted light
only covers a part of the visible spectrum, and the lower limit of the
spectrum rises and the red shifts occur. The partial results are
graphically expressed in Fig. 3.26.
Fig. 3.26 Calculated coordinate and spectrum for the structural colors formed under the spatial
periods ranged from 1200 to 2000 nm. The structural colors produced under spatial periods of 1200,
1300, 1500 and 1600 nm
As described above, the coordinate areas and the spectral
ranges of the colors are affected by the spatial periods of the ripples.
In order to demonstrate this effect, we have calculated the ratio of
silhouette area to total coordinate area and the extremum of the
spectrum formed under the whole spatial periods range. The results
are illustrated in Fig. 3.27. From Fig. 3.27a, it is worth noticed that
the ratio has two maximum values of 43.9 and 39.5%, which are
obtained at spatial periods of 522 and 1170 nm, respectively. As for
the spectrum range of the diffracted light, it can be found from
Fig. 3.27b that the spectrum range has a linear relation to the spatial
periods of ripples.
Fig. 3.27 a Ratio of silhouette area to total coordinate area; b Maximum value and the minimum
value of the spectrum of the structural colors formed with different spatial periods
Based on the above-mentioned discussion, it is not difficult to
understand why the surfaces composed of ripples with different
spatial periods exhibit very different colors. Furthermore, from
Fig. 3.23, it is found that the colors are gradually changed from blue
to red with the increase of periods under the same ripple orientation
angle and incident light angle. At the approximate symmetric
coordinate points, such as the points of (50°, 60°) and (70°, 50°) in
Fig. 3.26a (20°, 85°) and (80°, 20°) in Fig. 3.23b, the colors are
nearly identical. This can be attributed to the symmetry of the
spectral lines about the angle bisector for coordinate. In Fig. 3.26c, it
is obviously observed that the colors formed by the ripples with
spatial period of 1200 and 1300 nm can cover most of the visible
spectrum. While for the colors formed under spatial periods of 1500,
and 1600 nm, only the spectrum longer wavelength can be covered.
In addition, at many points, such as (10°, 40°), (10°, 50°), (10°, 90°)
and so on, there is no wavelength of white light found to fulfill the
diffraction conditions, thus no color can be observed. As for the
ripples with spatial periods longer than 1600 nm, the formed colors
are not experimentally discussed, because the power of the laser at
longer incident wavelength is reduced too rapidly to induce uniform
ripples. However, the results give the experimental evidence that
color effects depend on the ripple period strongly.
As described above, the theoretical and experimental analyses
demonstrate that the colors are affected greatly by the ripples with
different spatial periods. The study proposes the possibility of
marking the metal surfaces with various colors which are formed by
different laser wavelengths.
References
1.
Vorobyev AY, Guo C. Colorizing metals with femtosecond laser pulses. Appl Phys Lett.
2008;92(4):041914.
[Crossref]
2.
Li G, Li J, Yang L, et al. Evolution of aluminum surface irradiated by femtosecond laser pulses
with different pulse overlaps. Appl Surf Sci. 2013;276:203–9.
[Crossref]
3.
Li X, Yuan C, Yang H, et al. Morphology and composition on Al surface irradiated by
femtosecond laser pulses. Appl Surf Sci. 2010;256(13):4344–9.
[Crossref]
4.
Li G, Li J, Hu Y, et al. Realization of diverse displays for multiple color patterns on metal
surfaces. Appl Surf Sci. 2014;316:451–5.
[Crossref]
5.
Dusser B, Sagan Z, Soder H, et al. Controlled nanostructrures formation by ultra fast laser pulses
for color marking. Opt Express. 2010;18(3):2913–24.
[Crossref]
6.
Yao J, Zhang C, Liu H, et al. Selective appearance of several laser-induced periodic surface
structure patterns on a metal surface using structural colors produced by femtosecond laser
pulses. Appl Surf Sci. 2012;258(19):7625–32.
[Crossref]
7.
Li J, Li G, Hu Y, et al. Selective display of multiple patterns encoded with different oriented
ripples using femtosecond laser. Opt Laser Technol. 2015;71:85–8.
[Crossref]
8.
Li G, Li J, Hu Y, et al. Femtosecond laser color marking stainless steel surface with different
wavelengths. Appl Phys A. 2015;118(4):1189–96.
[Crossref]
9.
Huang J, Wang X, Wang ZL. Controlled replication of butterfly wings for achieving tunable
photonic properties. Nano Lett. 2006;6(10):2325–31.
[Crossref]
10. Ganbavle VV, Bangi UKH, Latthe SS, et al. Self-cleaning silica coatings on glass by single step
sol-gel route. Surf Coat Technol. 2011;205(23):5338–44.
[Crossref]
11.
Woodward I, Schofield WCE, Roucoules V, et al. Super-hydrophobic surfaces produced by
plasma fluorination of polybutadiene films. Langmuir. 2003;19(8):3432–8.
[Crossref]
© Springer Nature Singapore Pte Ltd. 2018
Guoqiang Li, Bionic Functional Structures by Femtosecond Laser Micro/nanofabrication
Technologies, Springer Theses: Recognizing Outstanding Ph.D. Research,
https://doi.org/10.1007/978-981-13-0359-3_4
4. Facile Fabrication of Functional
PDMS Surfaces via Femtosecond Laser
Textured Templating
Guoqiang Li1
(1) Department of Precision Instrument and Machinery, University of
Science and Technology of China, Hefei, China
Guoqiang Li
Email: guoqli@ustc.edu.cn
Laser structuring technique has been intensively studied because of
its advantageous properties of non-polluting, low-cost and high
materials utilization. Lasers can play a role of an alchemist on
coloring metals with diverse colors, as reported. Both individual and
iridescence colors can be obtained by lasers on metals surfaces.
Laser induced periodic surface structures (LIPSS) are regarded as
the main cause of the color. Furthermore, surfaces with different
wetting properties can be achieved by lasers in metals or polymers.
Roughness factor is the origin of the wetting behavior. However, the
major disadvantage of the laser structuring is its low efficiency
caused by direct-writing technique, in which a raster-scanning
strategy is commonly applied. High-throughput production of
functional surfaces is intensely desirable and remains as an ultimate
challenge. In this work, we functionalize the metal surfaces with
different colors by adopting femtosecond laser texturing technique,
and the treated metals are subsequently used as the master molds
for efficient production of hydrophobic surfaces of PDMS with an
extremely strong adhesion force. During the femtosecond laser
processing, the laser pulse overlap can be easily and precisely
controlled. We found that the laser pulse overlap not only affects the
color appearance of the metal templates, but also changes the
contact angle (CA) of the polymer surfaces in a relatively wide range.
The water adhesion properties of the replicated polymer surfaces are
demonstrated. Aluminum is chosen to be functionalized here as it is
widely utilized in product packages, machine shells and decorative
material. Firstly, the aluminum surfaces are treated by femtosecond
laser scanning. Secondly, a soft lithography process is carried out to
transfer the complementary micro/nano-structures onto
polydimethylsiloxane (PDMS) surfaces under ambient conditions [1].
4.1 Optical and Morphology Properties of
Aluminum Templates
Figure 4.1a, b are golden and black aluminum surfaces realized by
the extremely low (−10%) and high (99.5%) pulse overlap,
corresponding to the scanning velocity of 22 and 0.1 mm/s [1]. When
varying the pulse overlap to 35 and 95%, the treated aluminum
surfaces appear to be pure white (Fig. 4.1c) and gray (Fig. 4.1d).
The average laser fluence is set to be 5.1 J/cm2. The scanning hatch
in the longitudinal direction is 50 μm. Different from the iridescent
structural colors obtained by other approaches, all the surfaces
exhibit the same color under any view angles. The results are
consistent with that has been reported before.
Fig. 4.1 a–d Photographs of laser treated aluminum pieces with golden, black, white and gray
colors, respectively
Figure 4.2 is the surface morphology of the corresponding
golden, white, gray and black aluminum, examined by a scanning
electron microscope [1] (SEM). The insets of each image show the
magnified details. From the SEM study, we can see that the
mesoscale period remains unchanged at 50 μm, which is
corresponding to the Y-direction translation step. For the golden
aluminum, some smooth scaly aggregates appear along the center
of the laser beam scanning path, at the side of which a lot of
particles with the size scale of hundreds nanometers are induced by
the relatively low laser irradiation dose. The smooth aggregates
reveal that liquid phase exists during the laser processing and then
solidifies due to the low melting point of aluminum. Groove structures
appear on the white aluminum surface, produced by the laser
scanning over the surface. The groove width is around 20 μm,
consistent with the focus spot size. Besides the nanoparticles
identical to the golden aluminum, some fluffy structures are
generated, indicating some material vaporizes when the pulse
overlap increases. When the overlap ratio further increases, gray
surface is achieved and the grooves grow much deeper. More fluffy
pores can be seen when the magnification is further enlarged. Pure
black aluminum is obtained with an extremely high pulse overlap,
which surface shows deep rill-like folds and the grooves can be as
deep as 125 μm according to our measurement. Moreover, some
other types of structures appear, such as nano-voids, protrusions
and flower-like aggregates. Even though the spatial periods are
pronounced as we see from each SEM image, all the colors remain
the same when changing the viewing angle. The little angledependence suggests that the isotropic nano- or submicro-structures
play a dominant role in the coloring effect rather than the microscale
periodic structures. Iridescent colors can also be produced by the
femtosecond laser modification by slightly adjusting the processing
parameters to make sure the inscribed periodic structures to
predominate in light diffraction, analogous to a two-dimensional
grating. Our further studies reveal that not only the surface
topography but also the chemical compositions are changed by the
laser treating, which may also affect the color exhibition [1].
Fig. 4.2 SEM images of a golden, b white, c gray and d black aluminums. Scale bars: 100 μm.
Insets are zoom in images of corresponding surfaces. Scale bars: 10 μm
4.2 Polymer Replicas of Metal Masters and Their
Wetting Properties
Laser modifying metal can be used to produce the templates, much
more competitive than ultraviolet lithography or electron-beam
lithography due to its low cost and simply equipped. It is reasonable
to assume that the replicated surfaces possess the same function as
the main structure features can be precisely transferred. The
replicated PDMS film can be easily peeled off from the master and
the desired surface structure is obtained, as shown in Fig. 4.3.
Fig. 4.3 a The schematic illustration of the fabrication process of micro/nanostructured polymer; b
the solidified PDMS covered on the colorful aluminum templates; c the photograph of PDMS after
being peeled off
Figure 4.4 shows the SEM images of the PDMS surfaces replica
of the different color aluminum [1]. It can be seen that the structures
are successfully transferred, thus complementary structures are
obtained. For example, the peak lines in gray aluminum are narrower
than the valleys; correspondingly the peaks in PDMS replica become
very wide and relatively flat with narrow gaps between them. In our
experiment, when the pulse overlap is too high (>97%), the transfer
process become incompetent as the depths of grooves increase and
the liquid PDMS is difficult to penetrate into them. As shown in
Fig. 4.4d, some smooth regions exist among the replicated
structures caused by the residual polymers which should seep into
the grooves. Figure 4.4e, f show the magnified details of the gray
and black aluminum surface replicas, indicating that nano-voids and
protrusions are successfully formed on PDMS surfaces. It is worth to
be noted that the metal masters can be reused, giving the method
decided advantages of good repeatability and cost-efficient.
According to our experimental observation, no colors appear on the
replicated surfaces although the structures are successfully
transferred. It indicates that not only the hierarchical micro/nanostructures, but also other material surface properties, such as
refractive index and reflectivity affect the color exhibition. However,
besides structural colors, other surface functions, like water
repellent, can be exploited in the duplicated PDMS surfaces.
Fig. 4.4 a–d SEM images of replicated PDMS by color aluminums. Scale bars: 100 μm. The insets
are the micro-droplets on the corresponding surfaces; e and f are magnified images of c and d. Scale
bars: 10 μm
Insets of Fig. 4.4a–d show the sessile water droplets on the
structured PDMS surfaces [1]. For the surface replicated by golden
aluminum, the CA is 125° ± 2°, distinctly bigger than a flat PDMS,
which is measured to be 109° ± 1°. The CAs increase for the white,
gray and black aluminum transferred surfaces, which are measured
to be 127° ± 2°, 145° ± 2°, and 147° ± 3°, respectively. Hence the
CAs increase monotonically with the pulse overlap. Here, the contact
model can be explained by Wenzel and Cassie-Baxter states.
Wenzel model describes homogeneous wetting and represents a
wet-contact mode of water and rough surface, where water droplets
pin the surface to form high CA hysteresis. Cassie model describes
heterogeneous wetting and represents a non-wet-contact mode
where water droplets can roll off effortlessly because of the low CA
hysteresis. Generally speaking, Wenzel’s state can induce a high CA
hysteresis. We can see that the apparent CAs change with the
surface roughness not matter the droplets are in Wenzel or Cassie
cases. In fact, according to the studies on the natural hydrophobic
adhesive leaves and the biomimicking preparations, the structured
surfaces here are in Wenzel or meta-stable Wenzel/Cassie hybrid
states, which make them exhibiting a CA larger than the critical CA
(an angle above which the wetting type is thought to be a stable
Cassie type) and a high CA hysteresis. As the pulse overlap gets
higher, deeper grooves are directly fabricated and more secondary
structures, such as nano-particles, voids and other aggregates, are
induced, resulting in rougher surfaces of the aluminum templates.
For rough surfaces especially with two-scale micro/nano hierarchical
structures, water droplet will not invade into the microscopic
structures totally and some air exists between solid and liquid phase,
contributing to the phenomenon that the apparent CA of the
heterogeneous surface is obviously greater than the intrinsic CA of a
flat smooth surface. As mentioned above, when the pulse overlap is
too high, the replicated structures get some undesired defects,
where should be sharp crests. That makes more possible solid
fraction contact the water droplet, therefore the differences between
the CAs shown in the insets of Fig. 4.4c, d are not so
distinguishable.
4.3 Tunable Contact Angle and Strong Adhesion
Force
As the CA is associated with the laser pulse overlap, a facile
approach to produce surfaces with controllable wetting properties
can be derived. The involved laser texturing technique is much
simpler and more versatile than other micro/nano fabrication
methods and the pulse overlap adjustment is easy and proficient.
Furthermore, soft lithography facilities the mass production of largearea structured surfaces. In order to demonstrate the feasibility, a
series of PDMS surfaces are produced by the metal masters treated
with different femtosecond laser pulse overlaps, as shown in
Fig. 4.5. The inset shows the corresponding shape of water droplets
on the replicated surfaces. It can be seen that the CAs increase
monotonically with the pulse overlap, ranging from 126° to 147°. For
the case of pulse overlap is less than 60%, the increase of CAs is
almost linear and the values vary gently (the region left to the
dashed dotted line). When the pulse overlap is further increased, the
changes of CAs become rapid following an approximate exponential
law (the region between the dashed dotted line and the dashed line).
When the pulse overlap is larger than 95%, the increase of CAs
becomes slow as mentioned above. As we can see, the CAs are all
less than 150°, beyond which the surface is so-called
“superhydrophobic”. The surface roughness and CA can be further
enhanced by other means, like chemical coating (e.g.,
fluoroalkylsilane) to lower the surface free energy or electroless
plating to deposit nanoparticles on the primary structures, which is
widely conducted and requires minimal space here.
Fig. 4.5 The dependence of contact angle on the pulse overlap, changed from 0 to 99.5%. The inset
is the shape of the water droplets on different surfaces
Natural rose petal exhibits special hydrophobic and adhesion
property, different from the lotus self-cleaning surface on which a
droplet spontaneously rolls off with a slight tremble. Jiang et al. firstly
studied the mechanism of rose petal and imitated the “sticky”
surfaces by duplicating the real petal’s surface and fabricating
aligned polystyrene nanotubes. Since then, many researchers
devoted themselves to the field of artificial rose-petal-like surfaces
preparation. Compared to the lotus leaf, the size of the hierarchical
micro/nano-structures on the rose petal is relatively larger, and water
droplet can enter into larger grooves, thus giving rise to a higher
water penetration depth and a resultant higher adhesive force. High
adhesive force between solid surface and liquid causes visible great
CA hysteresis. The mesoscale period of the PDMS surface
structures is 50 μm and all the laser textured templating surfaces
show sticky properties due to the great CA hysteresis. Take the black
aluminum duplicated polymer film as an example, the water drop
stay pinned steadily to the vertical surface, as shown in Fig. 4.6a.
The water drop is also adsorbed and not rolling off from the surface
when we tilt the sample at different angles (135° and 150° as shown
in Fig. 4.6b, c) or even turn it upside down (Fig. 4.6d). This sticky
hydrophobic characteristic facilitates many potential applications like
tiny water droplets transportation without loss and analysis of small
volumes of liquid.
Fig. 4.6 Behavior of water droplets on the as-prepared PDMS surfaces at different tilt angles of a
90°, b 135°, c 150°, and d 180°
In summary, femtosecond laser textured templating method is
applied to fabricate functional hydrophobic surfaces with a high
adhesive force. Amplified femtosecond laser is employed to
functionalize aluminum with diverse colors including golden, white,
gray and pure black. It reveals that isotropic nano/submicrostructures dominate the color effect rather than microscale periodic
structures. Subsequently the color metals are used as templates for
soft lithography process, in which structured polymers are readily
prepared with controllable wetting properties. The contact angle can
be finely tuned from 125° to 147°. Furthermore, the as-prepared
surfaces exhibit a high adhesive force to water drops due to the
deep penetration depth and the resultant great CA hysteresis. This
approach features simplicity, rapidness, and easiness of large-area
fabrication, which can find extensive applications in various flexible
functional surfaces manufacturing [1].
Reference
1. Hu Y, Li G, Cai J, et al. Facile fabrication of functional PDMS surfaces with tunable wettablity
and high adhesive force via femtosecond laser textured templating. AIP Adv. 2014;4(12):127141.
[Crossref]
© Springer Nature Singapore Pte Ltd. 2018
Guoqiang Li, Bionic Functional Structures by Femtosecond Laser Micro/nanofabrication
Technologies, Springer Theses: Recognizing Outstanding Ph.D. Research,
https://doi.org/10.1007/978-981-13-0359-3_5
5. Multifunctional Three-Dimensional
Porous Metal Micro/Nanocages by
Ethanol-Assisted Femtosecond Laser
Irradiation
Guoqiang Li1
(1) Department of Precision Instrument and Machinery, University of
Science and Technology of China, Hefei, China
Guoqiang Li
Email: guoqli@ustc.edu.cn
Metallic micro/nanostructures with controllable 2D-3D geometries
have been attracting great attention due to their many promising
applications ranging from plasmonics [1, 2], electronics, [3] and
bioscience [4] to chemistry [5, 6]. Significant effort has been devoted
to the exploration of effective approaches for realizing various
controllable metallic micro/nanostructures, investigating their
performance, and exploring their novel applications. For example,
conventional top-down microfabrication methods containing electron
beam lithography [7], focused ion beam (FIB) [8], and X-ray
lithography [9] have been widely used in metal micro/nano structures
fabrication due to their high resolution, but how to effectively and
economically produce such nanostructures with large area is still a
big challenge. On the other hand, bottom-up methods [10–13] by
combining colloidal microsphere self-assembly, metal deposition and
lift-off processing were usually used for fabricating 2D period metal
microstructures. In addition, an advanced two-photon polymerization
(TPP) technique [14, 15] combined with a site-selective metal
deposition technique has been developed for fabricating more
complex structures with ~100 nm resolution, which are useful in
some specific applications. However, the process is complicated,
and the area is usually up to several hundred square micrometers.
Moreover, many of them are limited for general use such as
microelectronics, plamonics, and nanophotonics due to the
nonconducting polymeric structures. Thus, it is highly desirable to
develop a convenient technology that is able to rapidly fabricate
large-area 2D-3D micro/nanostructured metallic surfaces with
excellent performance.
Recent studies have shown that self-organized metallic
micro/nanostructures can be created on metal surfaces using
femtosecond laser direct irradiation. Among these structures, the
most common ones are the subwavelength ripples, [16–18]
nanotextured conical microstructures, [19] jet like structure, [20]
which can greatly improve the optical, biological, and chemical
properties of metallic material surface, such as color display, anticounterfeiting, and optical data storage. Nevertheless, these
structures are mostly limited to one-dimensional (1D) or twodimensional (2D) features, which seriously limit their
multifunctionality [16–20]. As a kind of important ferromagnetic
metal, nickel shows outstanding optical, catalytic, electrical, and
superior resistant characteristics to corrosion, which makes it widely
applicable in electronics, nickel-batteries, alloy, and chemical
catalyst [21–38]. Although some functional 1D-2D structures such as
ripples, mounds, and cones have been formed on nickel surfaces,
there are still few reports on the controllable fabrication of complex
2D-3D micro/nanostructures and systemic investigation of their
multifunctions.
Here, we report a facile and rapid method to fabricate large-area
(4 cm2 or more) (Fig. 5.1) three-dimensional (3D) porous metal
micro/nanocages arrays with 0.8 μm sizes by one-step ethanol-
assisted femtosecond laser irradiation on nickel surfaces [38]. The
underlying formation mechanism was investigated by a series of
femtosecond laser irradiation under exposure time from 5 to 30 ms.
By controlling the laser energy, micro/nanocage arrays with different
sizes from 0.8 to 2 μm were obtained. Furthermore, these porous
micro/nanocages arrays exhibit multiple functions, which can endow
the nickel surfaces with not only low reflectivity over a broad
wavelength range but also improved hydrophobic ability.
Fig. 5.1 Large-area fabrication of porous 3D micro/nanocage-like arrays on nickel surface by onestep ethanol-assisted femtosecond laser irradiation
5.1 Experimental Section
To fabricate micro/nanocage-like structures, the mechanically
polished nickel plates (Chinese New Metal Materials Technology
Co., Ltd., China) with purity of 99.99% and dimension of 0.5 × 20 ×
20 mm3 are chosen as targets. The nickel plate is stuck to the
bottom of a 20 mL container (Petri dish), which is filled with ethanol
(purity of 99.3%). The diameter of the focused spot is approximately
30 μm. The exposure time of the laser beam on the sample surfaces
is controlled by a computer-controlled high-speed shutter. To prepare
porous micro/nanocages, the experimental conditions were precisely
controlled and optimized. The incident laser pulse energies are set
from 0.05 to 0.20 mJ/pulse. The step size between the adjacent
scanning lines is 50 μm, and the total scanning time is ~10 min.
During the fabrication process, the CCD camera was connected to
computer for clear online observation in nickel pattern surface. In
contrast, the nickel plates are also stuck to the bottom of the empty
Petri dish, or it is filled with distilled water for laser irradiation with the
same parameters as in ethanol. To quantitatively characterize the
spectral responsivity, the wavelength dependence of total reflectance
in the UV, visible, and IR regions (250–2500 nm) was measured by a
spectrophotometer (SOLID3700, Shimadzu, Japan) with an
integrating sphere, which can effectively collect the stray lights by
the diffuse reflections. The wettability was investigated by dripping a
4 μL water droplet on the processed nickel surfaces to perform the
contact angle (CA) measurements with contact-angle goniometer
(CA100C, Innuo, Shanghai, China) by a sessile drop method. The
average CA values were obtained by measuring the same samples
in three different positions. The digital drop image taken by the digital
camera was processed by the software (CA100C, Innuo, Shanghai,
China) automatically, which can calculate the contact angles from
the drop shape.
5.2 Formation of 3D Micro/Nanocage-like
Structures
From Fig. 5.2a, b, it is clearly indicated that different microstructures
are formed on the femtosecond laser radiated surface of nickel
under different ambient environments [38]. The laser energy is the
same, ~0.05 mJ/pulse. We found that the formed structures in air
and in water are 2D with 0.02–0.3 μm and 0.03–0.4 μm size, while
the ones in ethanol look like 3D micro/nanocage with 0.8 μm size.
The comparison of air, distilled water, and ethanol ambient
environments clearly indicates the unique 3D micro/nanocage-like
structures can only be formed in ethanol (Fig. 5.2c). The formation of
the micro/nanocage arrays by ethanol-assisted femtosecond laser
irradiation raises a fundamental question: how are the structures
induced? Compared to the irradiation in gaseous environment, the
formation process in ethanol is more complex due to the effect by
laser-induced plasma of the ambient liquid, enhanced heat
conduction, intensified acoustic pressure, increased shock wave,
and explosive vaporization. The formation of unique structures may
be caused by the competition of several processes since the phase
transition occurs both in the solid and adjacent liquid. Femtosecond
laser may produce the superheated substance and a transient zone
of elevated pressure near the target, which brings the surrounding
liquid to a supercritical state. As a result, the pressure wave interacts
with the melt layer on the target surface, and its morphology is
perturbed. This surface profile is frozen upon cooling by the
subsequent liquid to prevent being smeared by the surface tension
of the melt [24–26].
Fig. 5.2 a SEM image of the nickel surface irradiated in air. The laser-induced microstructures are
irregular; b Spherical microstructures formed by laser irradiation in distilled water; c Unique 3D
micro/nanocage-like structures fabricated in ethanol solvent. The inset is 45° tilted SEM image of
single micro/nanocage-like microstructures. The size of micro/nanocage is ~0.8 μm, and the average
size of its surface nanohole is ~10–100 nm
The scanning of laser beam across the nickel surface ensures
the uniform distribution of laser irradiation along the scanning line.
The morphology of micro/nanocages depends strongly on the pulse
energy and the irradiation time. In our experiment, the
micro/nanocages arrays can be fabricated at scanning speed of
1 mm/s, even with the low pulse energy of 0.05 mJ/pulse. Therefore,
the average irradiation time on the excitation spot is 30 ms, as
shown in Fig. 5.3a. To study the formation and evolution of the
micro/nanocages, the scanning speed was set as 6 mm/s, and the
average irradiation time on the excitation spot is 5 ms, as shown in
Fig. 5.3b. Then, the processing area was scanned for different times
from 1 to 6, and the corresponding irradiation time on the excitation
spot was 5, 10, 15, 20, 25, and 30 ms, respectively. After each
radiation, the morphology was observed by SEM images, as shown
in Fig. 5.4. Through this method, the formation mechanism was
systemically investigated [38].
Fig. 5.3 In situ evolution process of 3D micro/nanocage-like structures
Fig. 5.4 45° tilted SEM images of nickel surface structures irradiated with different exposure time
from 5 to 30 ms
The evolution with increasing irradiation time reveals a clear
formation process for the micro/nanocage-like structures. First, the
laser induces plasma plume on the ethanol/nickel interface and
ablates the nickel surface to form initial roughness, as shown in
Fig. 5.4a. Then, with the increasing irradiation time from 10 to 30 ms,
the confined laser-induced plasma by ethanol can further interact
with the formed structures, which results in the growing structures
(Fig. 5.4b–f). Because of the confinement of the pure ethanol, the
laser-induced plasma can be pushed to a state of high temperature,
high pressure, and high density. Finally, the porous metal structures
are formed. Additionally, the cooling effect of the confined ethanol on
the laser-induced plasma also enhances the formation of the porous
microstructures [38].
5.3 Precisely Controlling the Micro/Nanocages Size
by Adjusting the Laser Pulse Energy
On the basis of the evolution results, we also demonstrate the
growth control of the micro/nanocage-like structures by adjusting the
pulse energy. Figure 5.5a–d indicates various porous
micro/nanocage-like structures prepared under pulse energy ranging
from 0.05 to 0.20 mJ/pulse at scanning speed of 1 mm/s. From the
magnified SEM images in Fig. 5.5e–h, it can be seen that the height,
size, and spacing of micro/nanocages depends on the pulse energy.
As the pulse energy increases, the micro/nanocages become larger
due to the stronger interaction of laser with nickel surfaces. At low
pulse energy of 0.05 mJ/pulse, the laser can only induce
micro/nanocage with size as small as 0.8 μm. With the increase of
pulse energy, the laser-induced plasma is further expanded to
produce a shock wave, higher temperature, and higher pressure at
the nickel surface, so the higher and larger size of micro/nanocages
are produced.
Fig. 5.5 Precisely controlling the micro/nanocages size by adjusting the laser pulse energy. a–d
SEM images of various 3D micro/nanocages arrays produced at pulse energy of 0.05, 0.10, 0.15, and
0.20 mJ/pulse, respectively. The scanning speed is 1 mm/s. e–h Magnified SEM images of
micro/nanocages arrays with various sizes (0.82, 1.12, 1.54, and 1.91 μm)
Judging from the SEM images, it is found that the distribution of
these micro/nanocages is uniform and exhibit periodic. To further
investigate the distribution of the micro/nanocages, the top-view
SEM images of Fig. 5.5a–d are subjected to a two-dimensional fast
Fourier transformation (2D-FFT), which can be expressed as Eq. 5.1
[27, 28].
(5.1)
where x, y represent the rectangular coordinates, g and f are the
time domain and frequency domain function, respectively. X, Y are
the subscript, and gX(x), gY(y) are the function factorized by g(x, y),
respectively. In our case, gX(x), gY(y) represent the distribution in x,
y directions.
The transformation results is shown in Fig. 5.6e–h, which reveals
that frequency spectrum is distributed into ring, and the radius of the
ring is diffuse within a small range. This demonstrates that the
micro/nanocages are formed with characteristic periodic distribution
in all directions. Furthermore, the radius of the ring can reflect the
denseness of the distribution. This can be confirmed from Fig. 5.6e–
h, from which we can see that the diameters of the rings are
becoming smaller and smaller. The larger the diameter, the more
intensive the micro/nanocages.
Fig. 5.6 Quantitative analysis of the size distribution of various micro/nanocages. a–d Top view
SEM images of the micro/nanocages produced at 0.05, 0.10, 0.15, and 0.20 mJ/pulse, respectively. e–
h The 2D fast Fourier transformation (2D-FFT) results for the SEM images
Figure 5.7 shows typical size distribution histograms of the
micro/nanocages, which are based on the statistical calculations of
all SEM analysis. From Fig. 5.7, we can see that the sizes from 0.79
to 0.84 μm and from 1.09 to 1.13 μm almost occupy 80% of the
micro/nanocages, respectively. Although the distributions are slightly
in disorder, the frequency of the sizes from 1.50 to 1.58 μm and from
1.86 to 1.97 μm is also more than 80% (Fig. 5.7c, d). Generally, the
sizes of the micro/nanocages are still uniform, and the average size
increases with the increased pulse energy.
Fig. 5.7 The size distribution histograms of the micro/nanocages based on the statistical calculations
of all the SEM images
Finally, from the statistical results in Fig. 5.8a, b, it is revealed
that the heights of the micro/nanocages increased, while the density
(the number of the micro/nanocages per square centimeter)
decreased with the increasing pulse energy [38]. What’s more,
plenty of tiny nanoholes with the size from tens to hundreds of
nanometers are formed over the entire micro/nanocage. To the best
of our knowledge, the 3D multiscale porous micro/nanostructures
prepared on nickel have not been reported. Our proposed method
also shows the ability to control the size of the micro/nanocages by
adjusting the laser energy.
Fig. 5.8 a The height and the size of the micro/nanocages as a function of the pulse energy; b The
density of the micro/nanocages with different pulse energy
In the experiment, the pulse energy employed for the control of
the growth of the micro/nanocage is chosen in the range from 0.05 to
0.20 mJ/pulse and the scanning speed is set as 1 mm/s. It is found
that the formed micro/nanocage is not perfect if the energy is too big
(>0.2 mJ) or too small (<0.05 mJ). Figure 5.9a SEM image of
micro/nanostructures produced on nickel surface with pulse energy
of 0.04 mJ/pulse. One can see that typical columnar microstructures
with spherical structures at the top are formed. The magnified SEM
image in Fig. 5.9b shows that columnar microstructures exhibit
porous, and look like “squid”. In this case, the holes are small and
the less. Figure 5.9c SEM image of the imperfect micro/nanocages
which are produced at the pulse energy of 0.25 mJ/pulse. It is seen
that the spindly micro/nanocages are no longer upright. Most of the
heads are hung. A careful observation from the magnified SEM
image Fig. 5.9d demonstrates that most of the round holes are
broken into long cracks. This kind of micro/nanocages look like 3D
skeletons [38].
Fig. 5.9 Irradiating nickel surface with pulse energy lower than 0.05 mJ or greater than 0.20 mJ
5.4 Enhanced Antireflection of 3D Porous Metal
Micro/Nanocages
From the digital photographs (Fig. 5.10) [38], it is seen that the
processed nickel surfaces show black color [38]. The nickel surfaces
reflectance before and after femtosecond laser irradiation is also
measured (Fig. 5.11) [38]. It is evident that the reflectance of the
black nickel surface is much lower than that of the polished one
(~80%) over the entire wavelength range (0.25–2.5 μm).
Furthermore, the reflection of structured nickel surfaces depends
upon the height and spacing of the micro/nanocages. The larger the
micro/nanocages, the lower the light reflection. Note that the black
nickel produced with the pulse energy of 0.20 mJ/pulse only has less
than 7% reflection in the entire wavelength range. This novel
phenomenon is presumed to be related to the tapered morphology of
the micro/nanocage and surface plasmon excitation. First, the
tapered micro/nanocages can form effective graded refractive index
layer at the air/solid interface and significantly reduce the reflection.
Second, the porous structures may form photonic traps and enable
the incident light to be confined [29–31]. Third, it was found that the
lateral of the micro/nanocages with larger sizes were covered with
many smaller-size nanoparticles and nanoholes. So, the incident
light was effectively absorbed and multiply reflected by these
nanoparticles and nanoholes due to surface-plasmon absorption.
Finally, successive multiple reflection may take place between/inside
the micro/nanocages, which further enhance the surface-plasmon
absorption effect. All these factors led to the lower reflection over a
wide wavelength of 250–2500 nm. The angle-dependent reflectance,
for example, the micro/nanocages with size of 1.91 μm, was also
investigated with incident angle of 6° and 12°. The measurements
demonstrate that the angle has little impact on the reflectance
(Fig. 5.12) [38]. Although the reflectance from 1250 nm is higher
than that of the normal-incidence reflection, it is still less than 10% in
the range from 250 to 1250 nm. Moreover, the micro/nanocages are
conductive due to the nickel substrate, so the electrical properties of
these structures are very useful in optoelectronics, electronics,
industry, and batteries [21, 23, 32].
Fig. 5.10 Photograph of the polished and black nickel
Fig. 5.11 Wavelength-dependent reflectance of polished and black nickel
Fig. 5.12 The angle-dependent reflectance measurements
5.5 The Wetting Property of 3D Porous Metal
Micro/Nanocages
It has been reported that the laser-machined micro/nanostructures
have the ability to tune surface wettability, making the metal surface
more hydrophilic or hydrophobic. To investigate the wettability, the
CA measurements on the processed nickel surfaces were performed
(Fig. 5.13) [38]. The wettability of the polished nickel is also
measured for comparison. The nickel with clean surfaces is initially
hydrophilic; however, the polished nickel in our case shows
hydrophobic due to the nickel oxidation in air. It is well-known that
the nickel is not stable in air and easily reacts with oxygen to form
nickel oxide [23, 33]. So, the CA is increased to 98°.
Fig. 5.13 The CA of the polished and black nickel without any low surface energy modification
The CA value was measured after the droplets were dripped onto
the samples for 5 s, and there was no scattering of contact angles
along the surfaces. The average CA values were obtained by
measuring the same samples at three different positions. From
Fig. 5.13, [38] one can see that the micro/nanocages can enhance
hydrophobic ability of the nickel surface. The contact angles are
105.36°, 109.61°, 127.32°, and 142.16° for pulse energy of 0.05,
0.10, 0.15, and 0.20 mJ, respectively. It is obvious that the
hydrophobicity greatly depends upon the heights and sizes of the
micro/nanocages. The larger the micro/nanocages, the more the
hydrophobicity. The schematic diagram for the hydrophobicity is
illustrated in Fig. 5.14 [38]. According to Wenzel’s model, the
enhancement of hydrophobicity can be attributed to the increase of
the roughness factor caused by the increasing heights of the
micro/nanocages.
Fig. 5.14 The analysis of the wetting state between the water droplet and the samples, which are
covered by various micro/nanocages under pulse energy of 0.05, 0.10, 0.15, and 0.20 mJ/pulse,
respectively
Here the roughness factor for a micro/nanocage is defined as the
ratio of the lateral area to the projected area. The micro/nanocage
model can be described by an equivalent cone, and the roughness
factor can be expressed as Eq. 5.2:
(5.2)
where R is the radius of micro/nanocage bottom, which is equal to
the size of the micro/nanocage. L is the generatrix of the
micro/nanocage. On account of
(5.3)
where H is the height of the micro/nanocage. The roughness factor
formula can be rewritten as Eq. 5.4
(5.4)
The error can be expressed as Eq. 5.5:
(5.5)
The measured R, H, ε(R) and ε(H) are shown in Table 5.1.
Table 5.1 The measured R, H, ε(R) and ε(H) for the micro/nanocage arrays
Pulse energy 0.05 0.075 0.10 0.125 0.15 0.175 0.20
R(μm)
0.82 0.97 1.12 1.37 1.54 1.72 1.91
ε(R)(μm)
±0.13 ±0.14 ±0.12 ±0.12 ±0.13 ±0.12 ±0.17
H(μm)
2.21 3.07 3.73 4.88 5.72 7.23 8.94
ε(H)(μm)
±0.11 ±0.13 ±0.15 ±0.19 ±0.17 ±0.14 ±0.19
We can obtain f and ε(f), as shown in Table 5.2.
Table 5.2 The calculated f and ε(f) for the micro/nanocage arrays
Pulse energy 0.05 0.075 0.10 0.125 0.15 0.175 0.20
f
2.87 3.32 3.48 3.70 3.85 4.32 4.77
ε
±0.53 ±0.56 ±0.47 ±0.43 ±0.41 ±0.36 ±0.51
The roughness factor based on the data in Fig. 5.8a is calculated,
as shown in Fig. 5.15 and, Tables 5.1 and 5.2 [38]. It is indicated that
the roughness factor increased with the increasing micro/nanocage
height. The biggest f can reach 4.77, which is much bigger than the
one of flat surface (f = 1). In addition, the nanoholes (~100 nm) on
the micro/nanocages also increase the superficial area of
micro/nanocages, which further enhance the roughness factor. The
maximum contact angle can reach as much as 142° without
additional chemical modification. The contact angle may be over
160° if the surface is modified with low surface-energy materials [34–
37]. The dust particles and any pollutants on the hydrophobic
surface can be clearly washed by the water droplets (Fig. 5.16) [38].
Fig. 5.15 The roughness factors calculated from the data in Fig. 5.8 a. The biggest roughness factor
can reach 4.77 for the microstructured nickel surfaces, which is much bigger than that of the flat
surface (f = 1)
Fig. 5.16 a The water droplet rolls down along the almost superhydrophobic surface; b The dust
particles and any pollutants on the superhydrophobic surface can be clearly washed out by the water
droplets
To investigate the durability of the micro/nanocages (Fig. 5.17)
[38], we load the structures surface by a weight of 200 g and then
scrub it slightly five times. The SEM results show that the
micro/nanocages structures are well-preserved. In addition, the
water CA is 141.01°, almost no change compared with the previous
one.
Fig. 5.17 The durability of the micro/nanocages with size of 1.91 μm in exploitation conditions
In summary, large-area 3D porous metal micro/nanocages arrays
are rapidly prepared on nickel surfaces by proposing a new method
of one-step ethanol-assisted femtosecond laser irradiation. The
formation process was in situ investigated by a series of
femtosecond laser irradiation under exposure time from 5 to 30 ms,
and its underlying mechanism is believed to be a combined process
of accumulating pulse and confined plasmons. In addition, by tuning
different laser energy from 0.05 to 0.2 mJ/pulse, the size of
micro/nanocage arrays can be controlled from 0.8 to 1.9 μm. The 3D
controllable cage-liked micro/nanostructures exhibit not only
enhanced antireflection from 80 to 7% but also hydrophobicity with
CA from 98° to 142° without surface modification. We believe that
this simple and rapid method for 3D large-area controllable metal
micro/nanostructures may find broader applications in
optoelectronics, industry, batteries, and chemical catalysis.
References
1.
Pile D. Photocatalysis: plasmonic enhancement. Nat Photonics. 2013;7(1):3.
2.
O’Brien K, Lanzillotti-Kimura ND, Rho J, et al. Ultrafast acousto-plasmonic control and sensing
in complex nanostructures. Nat Commun. 2014;5:4042.
3.
Piglosiewicz B, Schmidt S, Park DJ, et al. Carrier-envelope phase effects on the strong-field
photoemission of electrons from metallic nanostructures. Nat Photonics. 2014;8(1):37–42.
[Crossref]
4.
Shoji T, Saitoh J, Kitamura N, et al. Permanent fixing or reversible trapping and release of DNA
micropatterns on a gold nanostructure using continuous-wave or femtosecond-pulsed nearinfrared laser light. J Am Chem Soc. 2013;135(17):6643–8.
[Crossref]
5.
Linic S, Christopher P, Ingram DB. Plasmonic-metal nanostructures for efficient conversion of
solar to chemical energy. Nat Mater. 2011;10(12).
[Crossref]
6.
Valsecchi C, Brolo AG. Periodic metallic nanostructures as plasmonic chemical sensors.
Langmuir. 2013;29(19):5638–49.
[Crossref]
7.
Near R, Tabor C, Duan J, et al. Pronounced effects of anisotropy on plasmonic properties of
nanorings fabricated by electron beam lithography. Nano Lett. 2012;12(4):2158–64.
[Crossref]
8.
Lin YY, Liao JD, Ju YH, et al. Focused ion beam-fabricated Au micro/nanostructures used as a
surface enhanced Raman scattering-active substrate for trace detection of molecules and
influenza virus. Nanotechnol. 2011;22(18):185308.
[Crossref]
9.
Pilet N, Raabe J, Stevenson SE, et al. Nanostructure characterization by a combined x-ray
absorption/scanning force microscopy system. Nanotechnol. 2012;23(47):475708.
[Crossref]
10. Ye X, Qi L. Two-dimensionally patterned nanostructures based on monolayer colloidal crystals:
controllable fabrication, assembly, and applications. Nano Today. 2011;6(6):608–31.
[Crossref]
11. Chang CH, Tian L, Hesse WR, et al. From two-dimensional colloidal self-assembly to threedimensional nanolithography. Nano Lett. 2011;11(6):2533–7.
[Crossref]
12. Tsujioka T. Metal-vapor deposition modulation on polymer surfaces prepared by the coffee-ring
effect. Soft Matter. 2013;9(24):5681–5.
[Crossref]
13. Gecys P, Markauskas E, Gedvilas M, et al. Ultrashort pulsed laser induced material lift-off
processing of CZTSe thin-film solar cells. Sol Energy. 2014;102:82–90.
[Crossref]
14. Masui K, Shoji S, Asaba K, et al. Laser fabrication of Au nanorod aggregates microstructures
assisted by two-photon polymerization. Opt Express. 2011;19(23):22786–96.
[Crossref]
15. Vora K, Kang SY, Shukla S, et al. Fabrication of disconnected three-dimensional silver
nanostructures in a polymer matrix. Appl Phys Lett. 2012;100(6):063120.
[Crossref]
16.
Okamuro K, Hashida M, Miyasaka Y, et al. Laser fluence dependence of periodic grating
structures formed on metal surfaces under femtosecond laser pulse irradiation. Phys Rev B.
2010;82(16):165417.
[Crossref]
17. Sakabe S, Hashida M, Tokita S, et al. Mechanism for self-formation of periodic grating
structures on a metal surface by a femtosecond laser pulse. Phys Rev B. 2009;79(3):033409.
[Crossref]
18. Wang J, Guo C. Ultrafast dynamics of femtosecond laser-induced periodic surface pattern
formation on metals. Appl Phys Lett. 2005;87(25):251914.
[Crossref]
19. Oliveira V, Ausset S, Vilar R. Surface micro/nanostructuring of titanium under stationary and
non-stationary femtosecond laser irradiation. Appl Surf Sci. 2009;255(17):7556–60.
[Crossref]
20. Nayak BK, Gupta MC, Kolasinski KW. Formation of nano-textured conical microstructures in
titanium metal surface by femtosecond laser irradiation. Appl Phys A Mater Sci Process.
2008;90(3):399–402.
[Crossref]
21. Amoruso S, Bruzzese R, Wang X, et al. Femtosecond laser ablation of nickel in vacuum. J Phys
D: Appl Phys. 2007;40(2):331.
[Crossref]
22. Ali N, Bashir S, Akram M, et al. Effect of dry and wet ambient environment on the pulsed laser
ablation of titanium. Appl Surf Sci. 2013;270:49–57.
[Crossref]
23. Khorsand S, Raeissi K, Ashrafizadeh F. Corrosion resistance and long-term durability of superhydrophobic nickel film prepared by electrodeposition process. Appl Surf Sci. 2014;305:498–
505.
[Crossref]
24. Yang GW. Laser ablation in liquids: applications in the synthesis of nanocrystals. Prog Mater
Sci. 2007;52(4):648–98.
[Crossref]
25. Shaheen ME, Gagnon JE, Fryer BJ. Femtosecond laser ablation of brass in air and liquid media.
J Appl Phys. 2013;113(21):213106.
[Crossref]
26. Barmina EV, Stratakis E, Barberoglou M, et al. Laser-assisted nanostructuring of Tungsten in
liquid environment. Appl Surf Sci. 2012;258(15):5898–902.
[Crossref]
27. Lungu CP, Ticoş CM, Poroşnicu C, et al. Periodic striations on beryllium and tungsten surfaces
by indirect femtosecond laser irradiation. Appl Phys Lett. 2014;104(10):101604.
[Crossref]
28.
Le Harzic R, Dörr D, Sauer D, et al. Large-area, uniform, high-spatial-frequency ripples
generated on silicon using a nanojoule-femtosecond laser at high repetition rate. Opt Lett.
2011;36(2):229–31.
[Crossref]
29. Vorobyev AY, Makin VS, Guo C. Brighter light sources from black metal: significant increase in
emission efficiency of incandescent light sources. Phys Rev Lett. 2009;102(23):234301.
[Crossref]
30. Søndergaard T, Novikov SM, Holmgaard T, et al. Plasmonic black gold by adiabatic
nanofocusing and absorption of light in ultra-sharp convex grooves. Nat Commun. 2012;3:969.
[Crossref]
31. Vorobyev AY, Topkov AN, Gurin OV, et al. Enhanced absorption of metals over ultrabroad
electromagnetic spectrum. Appl Phys Lett. 2009;95(12):121106.
[Crossref]
32. Amoruso S, Ausanio G, Barone AC, et al. Nanoparticles size modifications during femtosecond
laser ablation of nickel in vacuum. Appl Surf Sci. 2007;254(4):1012–6.
[Crossref]
33. Boinovich LB, Emelyanenko AM, Pashinin AS, et al. Origins of thermodynamically stable
superhydrophobicity of boron nitride nanotubes coatings. Langmuir. 2011;28(2):1206–16.
[Crossref]
34. Yong J, Chen F, Yang Q, et al. Femtosecond laser weaving superhydrophobic patterned PDMS
surfaces with tunable adhesion. J Phys Chem C. 2013;117(47):24907–12.
[Crossref]
35. Yong J, Yang Q, Chen F, et al. Superhydrophobic PDMS surfaces with three-dimensional (3D)
pattern-dependent controllable adhesion. Appl Surf Sci. 2014;288:579–83.
[Crossref]
36. Yong J, Yang Q, Chen F, et al. A simple way to achieve superhydrophobicity, controllable water
adhesion, anisotropic sliding, and anisotropic wetting based on femtosecond-laser-induced linepatterned surfaces. J Mater Chem A. 2014;2(15):5499–507.
[Crossref]
37. Yong J, Yang Q, Chen F, et al. Bioinspired superhydrophobic surfaces with directional Adhesion.
RSC Adv. 2014;4(16):8138–43.
[Crossref]
38. Li G, Li J, Zhang C, et al. Large-area one-step assembly of three-dimensional porous metal
micro/nanocages by ethanol-assisted femtosecond laser irradiation for enhanced antireflection
and hydrophobicity[J]. ACS applied materials and interfaces. 2014;7(1):383–390.
[Crossref]
© Springer Nature Singapore Pte Ltd. 2018
Guoqiang Li, Bionic Functional Structures by Femtosecond Laser Micro/nanofabrication
Technologies, Springer Theses: Recognizing Outstanding Ph.D. Research,
https://doi.org/10.1007/978-981-13-0359-3_6
6. Microcone Arrays by Sucrose Solution
Assisted Femtosecond Laser Irradiation
Guoqiang Li1
(1) Department of Precision Instrument and Machinery, University of
Science and Technology of China, Hefei, China
Guoqiang Li
Email: guoqli@ustc.edu.cn
After billions of years of evolution, fishes have developed perfect
underwater superoleophobic ability, which makes their bodies well
protected from oil contamination in aqueous environments, exhibiting
appealing properties such as self-cleaning and anti-fouling [1, 2]. It is
reported that fish scales consist of superhydrophilic micropapillae
covered with nanostructures, exhibiting superhydrophilic in air.
Hence, water can be trapped in the hierarchical micro/nanostructure
to form an oil repellent layer, leading to underwater
superoleophobicity and ultralow oil-adhesion [1, 2]. Inspired by fish
scales, many kinds of underwater superoleophobic and low-adhesive
interfaces have been fabricated with diverse technologies to boost
their applications in self-cleaning coatings, fluidic devices, oil/water
separation, bioadhesion, oil-droplet manipulation and so on [1–16].
Here, we demonstrate a facile and rapid method to fabricate
large-area microcone arrays by one-step femtosecond laser
irradiation on nickel targets in sucrose solutions. The prepared
surfaces are superhydrophilic in air and superoleophobic in water. It
is indicated that the height and size are tunable by controlling the
ratio of sucrose to water in solution and the laser pulse energy,
leading to controllable wettabilities for water and oil. Furthermore,
these processed surfaces covered with microcone arrays exhibit
multiple functions, which can be used in microfluidic devices, fluid
microreactors, biomedicine, biomedical scaffolds, and chemical and
biological sensors [18–23].
6.1 Experimental Section
Nickel sheets with a purity of 99.99% were purchased from New
Metal Material Tech. Co., Ltd, Beijing, China. The oil used in our
experiment is 1, 2-dichloroethane, and its chemical formula is
C2H4Cl2. Sucrose (chemical formula is C12H22O11 and the relative
molecular mass is 342.3), milk (the color is white) and red ink are
purchased from a supermarket. The sucrose solution is prepared by
dissolving a certain mass of sucrose in 100 g distilled water, and the
mass ratio ranges from 10:100 to 70:100.
To structure the nickel surface, the incident laser pulse energies
are set from 0.10 to 0.20 mJ per pulse, the scanning speed is
1 mm/s, and the step size between the adjacent scanning lines is
50 µm.
6.2 Preparation of Microcone Arrays
Figure 6.1a shows that the nickel surface irradiated in the sucrose
solution with a mass ratio of 55:100 for sucrose and water and a
laser pulse of 0.19 mJ displays a gray color. It is found that the water
rapidly spreads out once it contacts with the structured surface. The
measured contact angle is less than 5°, exhibiting
superhydrophilicity. Furthermore, the oil droplet can spread out much
faster than water and forms a smaller contact angle due to the
smaller surface tension of oil than that of water, displaying
superoleophilicity in air. In contrast, the processed nickel surface
shows underwater superoleophobicity with an oil contact angle of
nearly 170°.
Fig. 6.1 The preparation of microcones by sucrose solution-assisted femtosecond laser irradiation
Previously, we have reported the assembly of self-organized 3D
porous nickel micro/nanocage arrays by ethanol assisted
femtosecond laser irradiation. In direct contrast to the irradiation in
sucrose solution, the processed nickel surfaces show a black color,
and the surface is hydrophobic and oleophilic in air (Fig. 6.1d). The
formation of the hydrophobic and oleophilic surface is related to the
laser induced surface rough porous micro/nanocage structures
(Fig. 6.1e) and the chemical composition [5–11]. The XRD analysis
verified NiO was formed after the ethanol-assisted femtosecond
laser irradiation (Fig. 6.1f), and the chemical formula can be
described as
(6.1)
The micro/nanostructures formed in the two liquids are very
different. In sucrose solution, hierarchical cone arrays with a size
(here, we define the size of the cone as the cone bottom radius,
which is labeled as “R”) of 3 µm covered by 10–30 nm nanovillus
structures are induced (Fig. 6.1b). In addition, it is almost difficult to
see the flame and there appear only a few bubbles during the course
of irradiation. The processing in sucrose solution is peaceful. These
distinct features promote the formation of hierarchical cone arrays
(Fig. 6.2) [23]. The nickel with a clean surface is initially hydrophilic.
In addition, the XRD study shows that there is no chemical change
on the irradiated nickel, so the produced pure nickel roughness
enhances the hydrophilicity in air (Fig. 6.3) [23]. Figure 6.3a, b
denote XRD curves of nickel processed in mass ratio of 10:100,
under pulse energy of 0.10 and 0.19 mJ, respectively. Figure 6.3c
indicates that the XRD results as a function of mass ratio of 55:100,
pulse energy of 0.10 mJ. It is observed that the peaks appear at
44.5°, 51.8°, and 76.4°, which mean the positions for Ni. From the
XRD curves, there is no other peak seen. Combined with the XRD
analysis, the measurement covers the minimal and maximal mass
ratio and pulse energy, which can certify powerfully that no chemical
changes happen in sucrose solution.
Fig. 6.2 Comparison of experimental phenomena for preparing porous microcages arrays in ethanol
and microcones arrays in sucrose solution
Fig. 6.3 XRD analysis of the chemical component of the nickel processed in sucrose solution
6.3 Precisely Controlling the Growth of the Cone by
Adjusting the Mass Ratio of the Sucrose Solution and
the Laser Pulse Energy
From the aspect of practical application, it is acceptable to fabricate
the controllable structures via a simple parameter. According to the
experimental observation, it is found that two critical parameters,
namely the mass ratio of sucrose to water in the solution and laser
pulse energy should be carefully controlled. In experiments, four
typical mass ratios ranging from 10:100 to 55:100 with pulse
energies ranging from 0.10 to 0.19 mJ were examined (Fig. 6.4) [23].
Fig. 6.4 45° tilted SEM images of the samples by femtosecond laser irradiation in sucrose solution
with different mass ratios and laser pulse energies. The insets show the magnified SEM images for
microcones, and the bar is 2 mm
It is easily seen that the mass ratio of the solutions greatly
affected the cone topography. With the increasing mass ratio, the
refractive index and viscosity of the solution can be sharply
increased, leading to the stronger penetration into the nickel sheet,
which plays an obvious role in the growth of the height and size. For
example, when the mass ratio is increased from 10:100 to 55:100,
the height and the size can increase from 1.62 to 8.02 µm and 2.1 to
2.63 µm at pulse energy of 0.10 mJ, respectively. In addition, the
laser pulse energy was also used to control cones. As the pulse
energy increases, the cones become larger due to the stronger
interaction of laser with nickel surfaces. Taking a mass ratio of
10:100 for example, at low pulse energy of 0.10 mJ, the laser can
only induce a small cone with a height of 2.14 µm and a size of
2.31 µm. With the increase of pulse energy, the laser-induced
plasma is further expanded to produce a stronger shock wave,
higher temperature, and higher pressure at the interface, so higher
and larger cones are produced. By carefully modulating these two
parameters, a series of representative microcone arrays are
prepared (Fig. 6.4) [23]. It is noteworthy that the growth rate of the
cone height caused by the mass ratio is faster than that of the pulse
energy. The possible reasons for the growth of the cones are the
higher boiling point and higher viscosity of the sucrose solutions with
greater mass ratio.
Particularly, the experiments of sucrose solution with mass ratio
of 5:100 and 75:100 are conducted, and the results are shown in
Figs. 6.5 and 6.6, respectively [23]. For mass ratio of 5:100, it can be
seen that the surface is covered by particles with size from tens to
hundreds nanometers, and no cone was formed at pulse energy of
0.10 mJ. However, at pulse energy of 0.19 mJ, there is still no cone
generated, but only uneven ravine-like structures covered by
nanoparticles formed on the processing area. This results show that
under the mass ratio of 10:100, there is no cone structures can be
prepared.
Fig. 6.5 SEM images of nickel surfaces processed in sucrose solution with mass ratio of 5:100. a
The surface treated under pulse energy of 0.10 mJ; b The surface prepared under 0.19 mJ
Fig. 6.6 SEM images of nickel surfaces processed in sucrose solution with mass ratio of 75:100. a
The surface morphology of nickel prepared under pulse energy of 0.10 mJ; b The cones formed
under the pulse energy of 0.19 mJ
In the case of mass ratio of 75:100, although few irregular cones
are formed at pulse energy of 0.10 mJ, there are plenty of various
nanoparticles generated around the formed cones, and covered
them completely. At pulse energy of 0.19 mJ, it is indicated that the
cones appear on the whole processing area. However, not only the
height and size are decreased compared with the good cones
mentioned in the paper, but also they are very heterogeneous,
showing weak controllability. In addition, the top of the cones are
covered with several to tens of nanoparticles. The formation
mechanism can be attributed to the weak laser penetration through
the high mass ratio sucrose solution.
The laser induced cone arrays are schematically illustrated in
Fig. 6.7a. The microcone consists of the standard cone and the
ambient villus nanostructures, which endows the microcones with
hierarchical structures. The height and size for a single cone can be
standardized as in Fig. 6.7b. In order to further investigate the
influence of the mass ratio and pulse energy on the growth of the
cones, the heights and the sizes as a function of pulse energy under
different mass ratios are indicated in the histogram statistics
(Figs. 6.7c, d), respectively. The statistical results demonstrated that
the height and the size can be effectively modulated in the ranges of
2.1–2.81 µm and 1.6–10.34 µm, respectively. Compared with other
methods reported before, our proposed method featured simplicity
and flexibility.
Fig. 6.7 a Schematic diagram for the prepared microcone arrays; b The schematic diagram of a
single magnified microcone. The height (H) and the size (R) of the microcone are marked in the
figure. c and d The statistical height and size of the microcones, which are obtained by calculating
the average value
6.4 The Wettabilities of the Microcone Arrays
The water contact angle of the flat nickel surface in our experiment is
θ WA = 58.26° (Fig. 6.8a), showing intrinsically weak hydrophilicity in
air. Its wetting property can be tuned to be more hydrophilic and
even superhydrophilic by the laser-induced rough hierarchical
micro/nanostructures.
Fig. 6.8 a The water contact state in air. b The oil contact state in air. c The oil contact model
underwater
The roughness factor based on the data in Fig. 6.7c, d is
calculated (Fig. 6.9) [23]. The roughness factor is defined as the ratio
of the actual apparent surface area (S 1 , the sector) to the geometric
area (S 2 , the circular). It is indicated that the roughness factor
increased with the increasing microcone height and size. In addition,
the nanoscale structures on the microcone also increase the
superficial area of micro/nanocages, which further enhances the
roughness factor. By introducing the roughness, the water contact
angle of the nickel surface is modified to less than 14° (Fig. 6.10)
[23]. Due to the hydrophilicity, the water can completely contact the
rough surface, as shown in the schematic diagram of Fig. 6.10 [23].
The contact model for this case is described by the Wenzel mode.
Fig. 6.9 The calculated roughness factor for the microcone arrays. The insets are the model of the
microcone and the calculation formula
Fig. 6.10 The water contact angles
According to Wenzel’s model, the hydrophilic surfaces will be
more hydrophilic with the increase of roughness. In addition, it can
be observed that most surfaces are modified to be superhydrophilic
with a contact angle less than 10°, and the minimum value is as
small as 4°. On the other hand, the contact angle for oil on flat nickel
is 26.04° (Fig. 6.8b), but all the contact angles on rough ones are
below 7.5° (Fig. 6.11), much less than that of water, demonstrating
superoleophilicity [12–18, 23]. This is because of the lower surface
tension of oil than that of water, which enables the oil droplet to be
more easily spread on the rough nickel surface. Similarly, the oil
contact angle is decreased with the increasing roughness, and the
minimum value reached 3.5°.
Fig. 6.11 The oil contact angles
It is indicated that the hydrophilic flat nickel surface is tuned to be
an oleophobic one when it is immersed in water. Deduced from
Young’s equation, the oil contact angle can be described as the
following equation:
(6.1)
where θ OW , θ OA , and θ WA are the contact angle of oil on a flat
surface in water, in air, and water contact angle on flat surface. γ OW ,
γ OA , and γ WA are the surface tensions of the oil/water, oil/air, and
water/air interfaces. For 1, 2-dichloroethane, the surface tension with
air and water are 24.15 and 28.1 mN m−1, respectively. The water
surface tension is 73 mN m−1 at room temperature. Calculated from
Eq. 6.4, the oil contact angle on the flat nickel surface in water is
126.47°, which is in good agreement with the measured value of
124.13° (Fig. 6.8c).
In Fig. 6.12, it is found that the underwater oleophobic flat nickel
surface is tuned to be more oleophobic (135.22° < θ OW < 150°) and
even superoleophobic (θ OW > 150°) by introducing the microcones.
When the nickel is immersed in water, the processed area can be
entirely wetted by water due to the superhydrophilicity. The water
molecules can be trapped in the micro/nanostructures when the oil
drop comes into contact with the processed surface, developing a
composite water/solid interface. For the incompatibility, the trapped
water acts as an insulation layer to prevent the oil droplet from
permeating into the micro/nanostructures. In this case, the oil droplet
can only contact the top of the induced micro/nanostructures,
displaying oleophobic or superoleophobic surfaces in water. The
state of the oil droplet can be described by the Cassie model, and
the contact angle can be expressed as:
Fig. 6.12 The surfaces are underwater superoleophobic and the oil contact angles increased with the
increasing roughness factor
(6.2)
where
is the contact angle of oil on the rough surface in water. f
is the area fraction of the solid, which is defined as the ratio of the
actual contact area by the oil droplet to the whole area of the cone.
Although the exact value of f is not readily available, it can be
theoretically deduced from Eq. 6.2, as shown in Fig. 6.13. In our
study, the area fraction f is below 0.66, and the value decreases
when the roughness increases. According to Eq. 6.2, for a rough
nickel surface, the contact angle for underwater oil droplet is
increased with decreasing area fraction.
Fig. 6.13 The calculated area fraction which is defined as the ratio of actual contact area (S 3 ) by
the oil droplet to the whole area of the cone (S 4 )
It is observed from Fig. 6.12 that the measured contact angles on
some surfaces with smaller roughness are below 150° [23].
According to the reported studies, these structured surfaces are in
metastable Wenzel/Cassie hybrid states as shown in the schematic
diagram of Fig. 6.14a. It is stated that some part of the oil droplet can
homogeneously wet the rough surface, while the other part shows
heterogeneous wetting, which can be more clearly observed from
the magnified illustration in Fig. 6.14b. When the contact angle is
above 150°, the contact is the Cassie model. In this case, the state
represents a non-wet-contact mode, where the oil contacts the upper
end of the microcones, leaving the lower end immersed in water, as
shown in Fig. 6.14c. Especially, as indicated in Fig. 6.14d, when the
area fraction f is about 0.066, the contact angle can nearly reach
170°, in which the oil droplet only contacts the peak of the cones,
demonstrating extreme underwater superoleophobicity. Based on the
above discussion, our prepared microcone arrays have the key
properties of superhydrophilicity, superoleophilicity, and underwater
superoleophobicity, which are very similar to the features of the fish
scales. Furthermore, it is indicated that all these wettabilities can be
easily tuned over a wide range by adjusting the mass ratio and pulse
energy.
Fig. 6.14 The detailed contact model for underwater oil
6.5 The Liquid Manipulation
6.5.1 Liquid Droplet Transferring
It is reported that the oil can easily roll off the fish scales, keeping the
fish body clean in contaminated water. The structured nickel
surfaces have similar self-cleaning effects to fishes, which can be
verified by measuring the oil sliding angle (SA) (Fig. 6.15). We found
that the surfaces with different roughnesses showed different oil
adhesions and SAs [19, 20]. The adhesion difference is ascribed to
the distinct contact models. In the metastable state (Fig. 6.14a, b),
the oil droplet partially wets the microcones and the oil sliding angle
is higher than 9°. According to our previous discussion, the
metastable states should appear in the region where the CA OW
< 150°, marked above the dashed line in Fig. 6.15 [23]. In contrast,
below the dashed line, the contact modes belong to Cassie’s state.
The oil droplet can slide on the surface at a smaller sliding angle with
lower adhesion. Especially, at a CA OW nearly 170°, there is hardly
any contact space between the oil droplet and the rough structures,
so that the adhesion is extremely low and the oil droplet easily rolls
off with the surface slightly tilted at only 2°. This study indicates the
adhesion force can be controllably tuned from the metastable state
with high adhesion to the Cassie state with ultralow adhesion.
Fig. 6.15 The sliding angle of the underwater oil
The sliding behaviors of three structured surfaces named “A”, “B”,
and “C” are studied in detail (Fig. 6.16) [23]. Figure 6.16 shows the
time sequences of snapshots of a 5 µl oil droplet rolling on the three
surfaces. It can be seen that the oil droplet can move easily when
the A surface is only slightly tilted 2.2°, and it rolls off the entire
surface in a very short time. On the contrary, the oil can only slide a
short distance on the B surface in the same time, and possesses a
SA of 5.1°. As for the C surface, the oil droplet slides with an
extremely slow speed even when the surface is tilted about 9.9°.
Fig. 6.16 The time sequences of snapshots of oil rolling on the three kinds of structured surfaces
Another experiment about their adhesive behavior is conducted
by controlling the oil droplet to contact and leave the A, B, and C
surface (Fig. 6.17) [23]. For the A surface, during the whole course
of contact and leave, the shape of the oil droplet remains spherical,
with almost no changes, showing a very small adhesive force. In this
case, the oil droplet can be transferred away without any loss. For
the B surface, it is found that the oil droplet is first elongated to
elliptical, and has a certain contact area with the B surface when it is
about to leave. This phenomenon indicates that the B surface has
larger adhesive force than that of the A surface. It is observed that
the oil droplet is seriously deformed into a long elliptical shape and
has a large contact area when it is pulled from the C surface,
revealing strong adhesion.
Fig. 6.17 Dynamical adhesive force behaviors on A, B, and C surfaces
These surfaces could be applied in the manipulation of oil
droplets by transferring them from a lower adhesive surface to a
higher one, which have key potential applications in biomedical
fields. Figure 6.18 shows an example of transferring a 5 µl oil
droplet. First, the oil droplet is placed at the low adhesive A surface.
Then, the medium adhesive B surface is used as a “mechanical
hand” to capture the oil droplet and release it onto the C surface [21,
23].
Fig. 6.18 Process of transferring the oil droplet from the A surface to the C surface via the B surface
6.5.2 Liquid Storage
Due to the superhydrophilicity and superoleophilicity, the asprepared nickel surfaces can be used for liquid storage. As shown in
Fig. 6.19, milk, red ink, and oil are dripped onto the processed ringshaped area with 5 mm diameter, forming 3 × 3 arrays [23]. It is
found that none of the droplets overflow from the designated circular
regions, displaying ultrahigh adhesion. In addition, the droplets still
firmly adhere to the surface even if it is tilted at a certain angle for
more than an hour. In addition, the static storage for different dosage
milk, red ink, and oil are illustrated in Fig. 6.20, where the diameters
of the designated area are 2, 3, 5, 8 and 10 mm, respectively [23].
With this method, a few microliters to several milliliters and an even
larger dosage of various liquids can be stored at the designated
area.
Fig. 6.19 The static storage for milk, ink and oil
Fig. 6.20 The static storage for a milk, b red ink and c oil with different dosage. The diameters of
the designated area are 2, 3, 5, 8 and 10 mm, respectively
In addition to the static storage, the surface can also serve as a
stable storage media for storing the flowing fluid. As shown in
Fig. 6.21, a 5 ml water droplet can be first fixed at the central circle.
Then the water will flow in all directions under wobbling. Finally, the
water can be captured by the surrounding arrayed circles. In this
way, the flowing liquid can be stored successfully. This novel liquid
storage technology may find applications in fixing reagent in gas
liquid reaction in sensing system, collecting water and fog in
hydropenic environment [22].
Fig. 6.21 The dynamic storage for water
6.5.3 Liquid Transportation
Figure 6.22 shows the transportation dynamics of 5 ml red ink
droplet pipetted on the processed surface. The track of the red ink is
marked with a red dotted line in each figure. It is found that the red
ink immediately flows along the set path once it contacts the starting
point, and rapidly travels over 50 mm in less than 6 s. It is thought
that the extremely strong driving force is derived from the wicking
force due to the surface superhydrophilicity. This experiment
indicates that a regular nickel surface can be readily transformed to
a superwicking one, which may find potential applications in microfluidics, lab-on-chip, and so on [22, 23].
Fig. 6.22 The capillary force driving property for red ink
6.5.4 Liquid Mixing
Previous discussion indicates that in water, the untreated nickel is
oleophobic, while the treated one is superoleophobic. By taking
advantage of this property, we have designed a path to form a hollow
“Y” shape, as shown in Fig. 6.23, composed of an untreated fine line
and treated thick lines on both sides. In this way, the fine line can
grasp the oil droplet and control it to move along the setting path,
and the ultralow adhesion force of the processed lines on both sides
ensures that the oil droplet moves without loss. As shown in
Fig. 6.23, by gently vibrating the sheet, oil droplets “1” and “2” can
travel along the “Y” shaped line and finally mix together [23].
Fig. 6.23 The mixing function for oil in water
In summary, inspired by the fish scales, hierarchical microcone
arrays are one-step assembled on a nickel surface by sucrose
solution-assisted femtosecond laser irradiation. The structured nickel
surface is superhydrophilic, superoleophilic, and superoleophobic
underwater, possessing similar properties to fish scales. In addition,
by tuning the solvent environment and the pulse energy, the height
and the size of the microcones can be controlled effectively. The
controllable microcones endow the processed nickel surface with
multifunctions, such as liquid transferring, storage, transportation
and mixing. The unique wetting properties of the structured nickel
open new applications in the fields of microfluidic devices, fluid
microreactors, biomedicine, biomedical scaffolds, and
chemical/biological sensors.
References
1.
Liu M, Wang S, Wei Z, et al. Bioinspired design of a superoleophobic and low adhesive
water/solid interface. Adv Mater. 2009;21(6):665–9.
[Crossref]
2.
Liu K, Tian Y, Jiang L. Bio-inspired superoleophobic and smart materials: design, fabrication,
and application. Prog Mater Sci. 2013;58(4):503–64.
[Crossref]
3.
Xue Z, Jiang L. Bioinspired underwater superoleophobic surfaces. Acta Polym Sin.
2012;10:1091–101.
4.
Liu X, Gao J, Xue Z, et al. Bioinspired oil strider floating at the oil/water interface supported by
huge superoleophobic force. ACS Nano. 2012;6(6):5614–20.
[Crossref]
5.
Yang HD, Li XH, Li GQ, et al. Formation of colorized silicon by femtosecond laser pulses in
different background gases. Appl Phys A: Mater Sci Process. 2011;104(2):749–53.
[Crossref]
6.
Amoruso S, Bruzzese R, Wang X, et al. Femtosecond laser ablation of nickel in vacuum. J Phys
D: Appl Phys. 2007;40(2):331.
[Crossref]
7.
Ali N, Bashir S, Akram M, et al. Effect of dry and wet ambient environment on the pulsed laser
ablation of titanium. Appl Surf Sci. 2013;270:49–57.
[Crossref]
8.
Bian H, Yang Q, Liu H, et al. A facile preparation route for netlike microstructures on a stainless
steel using an ethanol-mediated femtosecond laser irradiation. Mater Sci Eng: C.
2013;33(2):663–7.
[Crossref]
9.
Barmina EV, Stratakis E, Fotakis K, et al. Generation of nanostructures on metals by laser
ablation in liquids: new results. Quantum Electron. 2010;40(11):1012.
[Crossref]
10.
Kumar B, Yadav D, Thareja RK. Growth dynamics of nanoparticles in laser produced plasma in
liquid ambient. J Appl Phys. 2011;110(7):074903.
[Crossref]
11. Albu C, Dinescu A, Filipescu M, et al. Periodical structures induced by femtosecond laser on
metals in air and liquid environments. Appl Surf Sci. 2013;278:347–51.
[Crossref]
12. Brackbill JU, Kothe DB, Zemach C. A continuum method for modeling surface tension. J
Comput Phys. 1992;100(2):335–54.
[Crossref]
13. Tyson WR, Miller WA. Surface free energies of solid metals: Estimation from liquid surface
tension measurements. Surf Sci. 1977;62(1):267–76.
[Crossref]
14. Tolman RC. The effect of droplet size on surface tension. J Chem Phys. 1949;17(3):333–7.
[Crossref]
15. Rotenberg Y, Boruvka L, Neumann AW. Determination of surface tension and contact angle
from the shapes of axisymmetric fluid interfaces. J Colloid Interface Sci. 1983;93(1):169–83.
[Crossref]
16. Kirkwood JG, Buff FP. The statistical mechanical theory of surface tension. J Chem Phys.
1949;17(3):338–43.
[Crossref]
17. Van Oss CJ, Good RJ, Chaudhury MK. Additive and nonadditive surface tension components
and the interpretation of contact angles. Langmuir. 1988;4(4):884–91.
[Crossref]
18. Jasper JJ. The surface tension of pure liquid compounds. J Phys Chem Ref Data. 1972;1(4):841–
1010.
[Crossref]
19. Yong J, Chen F, Yang Q, et al. Femtosecond laser weaving superhydrophobic patterned PDMS
surfaces with tunable adhesion. J Phys Chem C. 2013;117(47):24907–12.
[Crossref]
20. Yong J, Yang Q, Chen F, et al. Reversible underwater lossless oil droplet transportation. Adv
Mater Interfaces. 2015;2(2).
21. Yong J, Yang Q, Chen F, et al. A simple way to achieve superhydrophobicity, controllable water
adhesion, anisotropic sliding, and anisotropic wetting based on femtosecond-laser-induced linepatterned surfaces. J Mater Chem A. 2014;2(15):5499–507.
[Crossref]
22. Huang JY, Lai YK, Pan F, et al. Multifunctional superamphiphobic TiO2 nanostructure surfaces
with facile wettability and adhesion engineering. Small. 2014;10(23):4865–73.
[Crossref]
23.
Li G, Lu Y, Wu P, et al. Fish scale inspired design of underwater superoleophobic microcone
arrays by sucrose solution assisted femtosecond laser irradiation for multifunctional liquid
manipulation [J]. J Mater Chem A. 2015;3(36):18675–18683.
[Crossref]
© Springer Nature Singapore Pte Ltd. 2018
Guoqiang Li, Bionic Functional Structures by Femtosecond Laser Micro/nanofabrication
Technologies, Springer Theses: Recognizing Outstanding Ph.D. Research,
https://doi.org/10.1007/978-981-13-0359-3_7
7. Fabrication of Controllable Microcone
and Micromolar Silicon Arrays with
Tunable Wettability by Liquid-Assisted
Femtosecond Laser Irradiation
Guoqiang Li1
(1) Department of Precision Instrument and Machinery, University of
Science and Technology of China, Hefei, China
Guoqiang Li
Email: guoqli@ustc.edu.cn
In this work, we use low-boiling, low viscosity ethanol, and for the
first time employ the high boiling point and high viscosity sucrose as
liquid environment for femtosecond laser irradiation on silicon. The
microcone and micromolar arrays were successfully prepared in
ethanol and sucrose, respectively. It is indicated that the heights are
tunable by simply controlling the laser pulse energy. Furthermore,
these processed surfaces exhibit multiple functions, such as
collecting fog, liquid storage, microdroplet manipulation and
directional transfer, which can be used in microfluidic devices, fluid
microreactors, biomedicine, biomedical scaffolds, and
chemical/biological sensors [1–5].
7.1 Experimental Section
In this experiment, single crystal p-type silicon (110) with dimension
of 0.5 × 20 × 20 mm3 and 0.5 × 20 × 40 mm3 were purchased from
New Metal Material Tech. Co., Ltd, Beijing, China. The oil used to
detect the contact/sliding angles is 1, 2-dichloroethane (C2H4Cl2).
The assisted solvents are ethanol (purity of 99.3%) and sucrose
which is prepared by dissolving 50 g sucrose in 50 g distilled water.
The details of the experimental setup and schematic fabrication
process are shown in Fig. 7.1a [5]. To induce micro/nanostructures
with different heights at large area, the pulse energies of the incident
laser are set from 0.05 to 0.25 mJ, and the scanning speed is
constant (1 mm/s). The step sizes between the adjacent scanning
lines are 20, 35, and 50 µm, respectively. For liquid experiments, the
silicon sheet was stuck to the bottom of a 20 ml glass container.
When the glass container was filled up with ethanol or sucrose, the
height of the liquid layer above the sample surface was about
12 mm. In this experiment, the focusing condition is an vitally
important parameter, which can greatly influence the energy
distribution and morphology of the formed micro/nanostructures. In
this experiment, the focusing condition is an vitally important
parameter, which can greatly influence the energy distribution and
morphology of the formed micro/nanostructures [5].
Fig. 7.1 The preparation of microcones and micromolars with ethanol and sucrose solution assisted
fs laser irradiation at pulse energy of 0.06 mJ. a Schematic representation of the experimental setup.
b Random structures in air under the same laser parameters. The structures consisted of cotton-like
structures covered with debris of silicon. c Microcones arrays with ethanol assisted fs laser
irradiation. The microcones height is about 3.3 μm. During the experiment, few but large bubbles
were produced at the ethanol/silicon interface, and nanoparticles were also formed. d Micromolars
arrays with sucrose solution assisted fs laser irradiation. The morphology of the microstuctures like
mammal molars and the height is about 5.9 μm. A lot of tiny bubbles and nanoparticles were
generated during the experiment
The glass container (vessel) containing the sample was mounted
on a computer controlled XYZ translation stage for precisely
positioning of the area to be machined. Considering the different
focal conditions in air and liquids due to refractive effects, we
adjusted the position of focal plane by moving the sample along the
optical axis (Z direction) in order to obtain the same focal positions.
During the adjustment process, a CCD camera was used for in situ
observation. The detailed description of the focusing conditions is
shown Fig. 7.2 [5].
Fig. 7.2 The focus conditions for the laser beam in liquid with different height. a height of h1, b
height of h2
Within the experimental setup of pulsed laser ablation in liquid,
the laser beam has to penetrate the liquid layer before reaching the
material surface. During this process, the focal length of the focusing
lens will change due to refraction by the liquid layer. Considering the
refraction of a focused linear beam, the focal length will increase [6,
7] for
(7.1)
where f is the focal length of the focusing lens in air, l is the liquid
thickness, n is the refractive index of the liquid, and r is the radius of
unfocused laser beam. For r ≪ f, the formula can be simplified to
(7.2)
Hence, the amount of energy deposited on the surface will vary
for the varying focused position. From Eq. (7.2), it can be calculated
that the focal length will increase 3.176 and 3.304 for ethanol
(n = 1.36) and sucrose (n = 1.38), respectively. In order to obtain the
same focusing condition, we move the sample surface away at
length of ∆f to achieve optimum focusing. Monitoring of the
adjustment was accomplished by a CCD camera with a video
monitor. It was indicated that the position of focal point was on the
silicon surface, with the error ±1 µm.
The focusing in different height of liquid layer can also be
illustrated in Fig. 7.2. With the liquid height of h1 (Fig. 7.2a) and h2
(Fig. 7.2b), the refractive index can be expressed as:
(7.3)
(7.4)
For a certain liquid, the value of n1 is equal to that of n2 and the
laser beam incident angle i1 is equal to i2, hence the refraction angle
is equal, namely j1 = j2. Combing the focal length of the lens of
63 mm and the diameter of the unfocused laser beam of 4 mm, j1
and j2 can be calculated, and the value is 5.5°. Based on this
discussion, the diameter of the focusing point is consistent at
different height of liquid layer.
Additionally, the focus is completed by a flat field lens with the
focal length of d = 63 mm. The diameter of the unfocused laser
beam is about r = 4 mm. Hence, the numerical aperture of the lens
is:
(7.5)
n is the refractive index, and n = 1.516. α is the half aperture angle,
and
(7.6)
The diameter of the laser beam do can be expressed as
(7.7)
here, k is a constant and the value is 1.22. λ is the laser wavelength
and the value is 800 nm. Combining Eqs. (7.1)–(7.3), it can be
calculated that d o = 13.5 µm. The focus point is so small that the
microstructures cannot be induced if the silicon is not at the focal
plane.
7.2 Formation of Microcone and Micromolar Arrays
in Ethanol and Sucrose Solutions
The ethanol has the high density of 99.3%, low boiling point of
78.4 °C and low viscosity. On the contrary, the sucrose solution has
the high boiling point (higher than 100 °C) and high viscosity. The
physical properties for the two solutions are very different. So, the
laser interaction mechanism between silicon and different solvent
may be different. Moreover, in our previous works, we have reported
the one-step assembly of 3D porous metal micro/nanocages by
ethanol-assisted femtosecond laser irradiation for enhanced
antireflection and hydrophobicity, and the preparation of underwater
superoleophobic microcones arrays by sucrose solution assisted
femtosecond laser irradiation. In this work, we also used ethanol and
sucrose solution as liquid environment to assist the femtosecond
laser fabrication on silicon surfaces.
SEM images in Fig. 7.1b indicate the silicon surface
micro/nanostructures prepared in air at pulse energy of 0.06 mJ,
scanning speed of 1 mm s−1, and scanning space of 50 μm. It is
observed that the structures are mainly nanoparticles covered cloudstructures with various sizes, displaying random, which can be
attributed to silicon vapor cloud formed on and above the surface
during its heating by the laser radiation, and the redeposition of the
multiscale nanoparticles produced by the laser impact effect.
Figure 7.1c exhibits that the formation of the microcones with the
ethanol-assisted fs laser irradiation. It is indicated that the
microcones are regularly distributed and the average height is about
3.3 μm. Different from the micro/nanostructures prepared in ethanol,
the formed micro/nanostructures in sucrose solution can be
described as micromolars (Fig. 7.1d) with the height of 5.9 μm. It is
seen that the microcones and micromolars are distributed into arrays
[5].
The mechanism for the formation of such structures can be
ascribed to the high temperature of plasma excited at the
silicon/liquid interface and the capillary wave excited in the molten
silicon thin layer during the localized cooling process. By contrast, it
is observed that during the machining process, there were more and
smaller bubbles produced than that in ethanol. In addition, the
processing in sucrose solution is more peaceful. The differences of
density, viscosity as well as boiling point of the ethanol and sucrose
also have great influence in inducing the diverse microstructures on
silicon surface. Therefore, the ambient conditions are critical for the
formation of different micro/nanostructures.
7.3 Precisely Controlling the Growth of the
Microcones and Micromolars Arrays by the Laser
Pulse Energy
From the aspect of practical application, it is acceptable to fabricate
controllable structures via a simple parameter. Based on the
experimental observation, the growth of both the microcones and
micromolars arrays can be effectively controlled by adjusting the
laser pulse energy. In order to illustrate this controllability, a series of
pulse energy ranged from 0.05 to 0.25 mJ is chosen to do the
irradiation experiments. With the increasing pulse energy, the laserinduced plasma is further expanded to produce a stronger shock
wave, higher temperature and higher pressure at the interface, so
higher and larger microcones and micromolars are produced. For
example, when the pulse energy is increased from 0.05 to 0.25 mJ,
the height can be increased from 3.3 to 17.6 μm for microcones
(Fig. 7.3a) and from 5.9 to 33.7 μm for micromolars (Fig. 7.3b),
respectively (Fig. 7.4). Additionally, it can be seen that the grooves
with the adjacent spaces of 50 μm are also formed between the
micro/nanostructures, with the period equal to the direction
translation step due to the scanning of the laser beam [5].
Fig. 7.3 Precisely controlling the growth of the microcone and micromolar arrays by adjusting the
laser pulse energy. a 45° tilted SEM images of the silicon surfaces by fs laser irradiation in ethanol
with D = 50 µm at pulse energy from 0.06 to 0.24 mJ. The microcones are uniformly distributed and
the height is increased from 3.3 to 17.6 µm with the increasing pulse energy. b 45° tilted SEM
images of the micromolars fabricated in sucrose solution. The corresponding height is ranged from
5.9 to 33.7 µm. c and d SEM images of the microcones and micromolars prepared at D = 20 µm,
pulse energy of 0.06~0.12 mJ, and the energy interval is 0.02 mJ. Under this processing condition, all
the microcones are still uniformly distributed on the whole processed surface, however for
micromolars there are always groove caused by the scanning lines
Fig. 7.4 The height of the microstructures as functions of pulse energy
In order to further investigate the evolution of the microcones and
micromolars, and the formation of the grooves, we conduct another
experiment with the pulse energy ranged from 0.06 to 0.12 mJ, and
the scanning spaces of 20 μm (Fig. 7.3c, d). In Fig. 7.3c, at pulse
energy of 0.06 mJ, it is seen that small microcones with height of 3–
3.5 μm are partly generated on the processed area. With the
increasing pulse energy, the microcones gradually grow larger, and
the height is 4.1–5.2 μm at 0.08 mJ, 5.5–6.3 μm at 0.10 mJ, and
6.5–7.1 μm at 0.12 mJ. In addition, the distributions become more
uniform with the increasing pulse energy. The SEM images in
Fig. 7.3d indicate that the micromolars also grow as a function of the
pulse energy, and the height can reach about 9.4 μm at 0.12 mJ. By
comparing the results in Fig. 7.3c, d, it is found that the micromolars
are always larger than the microcones produced at the same
parameter. Another distinct difference is that the grooves can be
always formed under the sucrose solution assisted fs laser
irradiation. The generation mechanism for these differences can be
attributed to the different boiling points, viscosity, and refractive index
of ethanol and sucrose solution. Mazur [8] has reported the
formation silicon spikes by liquid (water) assisted femtosecond laser
pulses irradiation, however, the size of the structures are 200 nm,
which are obviously smaller than laser wavelength of 800 nm. Chen
et al. [1, 2] has presented an effective method of producing
hierarchical conical spike structures femtosecond laser irradiation in
air through a line-by-line and serial scanning process. It is indicated
the formation of the conical spikes can be attributed to the
femtosecond laser holing, and the period of the structures is equal to
the spaces of the adjacent pulse, which is different from our strategy.
This experiment demonstrates that a simple and flexible method
have been proposed to fabricate controllable microcones and
micromolars on silicon surfaces [5].
7.4 The Wettability of the Microcones and
Micromolars Arrays
7.4.1 The Superhydrophilicity/Superoleophilicity
Mazur [9] has already investigated the wettability of the structured
silicon surface, however, they focused on the superhydrophobicity
which is obtained by modified the surface with a layer of
fluoroalkylsilane molecules. Here, different from the literature, we
mainly studied the superhydrophilicity or superoleophilicity of the
micro/nanostructured surface. In our experiment, the water and oil
contact angle of the flat silicon surface is about 36.2° and 24.7° in
air, demonstrating intrinsically weak hydrophilicity and oleophilicity,
respectively (Fig. 7.5) [5]. It is reported that the hydrophilic/oleophilic
flat surface can be tuned to be more hydrophilic or superhydrophilic,
or more oleophilic or superoleophilic one by introducing the rough
hierarchical micro/nanostructures. Figure 7.6a shows the contact
angles (CA) as functions of the pulse energy for inducing microcones
and micromolars with different roughness. It can be seen that the
water CA decreased with the increasing pulse energy, from 24.5° to
3.2° for microcones, 12.3° to 2.6° for micromolars. Due to the
hydrophilicity, the water can completely contact the rough surface, as
shown in the schematic diagram of Fig. 7.6a, forming the Wenzel
contact state.
Fig. 7.5 a the water contact state in air on flat silicon surface. b The oil contact state in air on flat
silocon surface. c The oil contact model underwater on flat silicon surface
Fig. 7.6 The superhydrophilicity/superoleophilicity of the microcones and micromolars. a The water
contact angle of microcones and micromolars. All contact angles decreased with the increasing pulse
energy. b The oil contact angles of microcones and micromolars. The processed silicon surfaces are
superoleophilic. The insert images in (a) and (b) were the illustration of the Wenzel contact model. c
Sequential optical images of fog collection on microcones-constituted three concentric rings. d The
volatilization process of the water collected by four 4 cm long lines consisting of micromolars arrays.
Both the start time was set as 0 for (c) and (d). e The static storage for oil, red ink, and milk. Due to
the superhydrophilicity and superoleophilicity, the liquid can be firmly fixed at the processed areas.
According to Wenzel’s model, the hydrophilic surfaces will be
more hydrophilic with the increase of roughness. The CA
measurement also shows that the structured silicon surfaces
fabricated in sucrose solution are more hydrophilic than that in
ethanol. Meanwhile, we find that scanning space also influence the
water CA to a small degree, namely the water droplet has smaller
CA at smaller scanning space. As seen from Fig. 7.6b, all the oil CAs
on the structured silicon surface are less than 10° due to the lower
surface tension, showing superoleophilicity. Similar to the case in
Fig. 7.6a, the oil contact angle is decreased with the increasing pulse
energy and the decreasing scanning space. It’s worth mentioning
that the water droplet can quickly spread on the micromolars induced
at pulse energy above 0.18 mJ in sucrose solution, and finally the
contact angle nearly reaches 0, showing extremely
superhydrophilicity.
The properties of superhydrophilicity and superoleophilicity are
crucial for preparing multi-functionalized surfaces. To this end, a fog
collector constituted by three concentric rings spaced by
unprocessed areas (Fig. 7.6c) is designed and placed into the
artificial fog flow condition to reveal the enhanced fog harvesting. As
time prolonged, the micro-droplets from fog are gathered to gradually
form larger droplets, randomly distributed on the unprocessed
locations. On the contrary, the fog droplet was prior to condense on
the processed areas, and then fog water gradually coalesced and
covered the concentric rings driven by the wettability difference
during the fogging process. The continually collected fog water
completely covered the three rings in the end, forming continuous
waters. The volatilization behavior of the water droplets, which is an
inverse process of the fog collection process, was also investigated
(Fig. 7.6d). It is observed that the tiny water drops on the
unprocessed areas is preferentially volatilized, while the water on the
processed ones can keep the morphology primly. This investigation
indicates that our fog collector can act as a potential fog harvesting
apparatus with an enhanced efficiency, which may find applications
at the arid regions with freshwater scarcity. Due to the
superhydrophilicity and superoleophilicity, the as-prepared silicon
surfaces can be used for liquid storage. As shown in Fig. 7.6e, oil,
red ink, and milk can be fixed at the processed three circular areas
with 6 mm diameter, orderly. None of the droplets overflow from the
designated circular regions, displaying ultrahigh adhesion.
7.4.2 Underwater Superoleophobicity and Oil
Droplet Manipulation
When the hydrophilic silicon surface is immersed in water, water
molecules can be trapped in the formed micro/nanostructures,
developing a composite water/solid interface. For the incompatibility,
the trapped water acts as an insulation layer to prevent the oil
droplet from permeating into the micro/nanostructures. In this case,
the oil droplet can only contact the top of the induced micro/nano
structures, hence the processed silicon surface forms an oleophobic
and even superoleophobic interface. Figure 7.7a, b indicate the oil
contact angles for microcones and micromolars as functions of pulse
energy, respectively. It is easy to see that the oil contact angles are
increased with the increasing pulse energy, and also they possesses
a larger contact angle at smaller scanning space. By comparison, it
is found that the micromolars endow the oil droplet with larger
contact angle than the microcones. Furthermore, the state of the oil
droplet can be described by the Cassie mode and the contact angle
can be expressed as Eq. 6.2.
Fig. 7.7 The underwater superoleophobicity and the oil droplet manipulation. a and b show that the
microcones and micromolars are underwater superoleophobic and the oil contact angles increased
with the increasing pulse energy. c The calculated area fractions defined as the ratio of actual contact
area by the oil droplet to the whole area of the microstructures. It is demonstrated that the area
fractions decreased with the increasing pulse energy. d The detailed contact model for underwater oil.
When the contact angle is smaller, the contact model is metastable Wenzel/Cassie hybrid states.
However, if the contact angle is larger, the contact model is Cassie state. e and f are the oil sliding
angles on microcones and micromolars as functions of pulse energy. g and h The directional transport
of oil along the set path. i Process of transferring oil droplet from the A surface to C surface via B
surface. Utilizing the differences of adhesive force, the structured surfaces can be used as
“mechanical hand” to transfer the oil droplet from lower adhesive surface to higher one
The calculated area fraction results are shown in Fig. 7.7c.
Obviously, the value of f is decreased with the increasing pulse
energy and decreasing scanning space. In addition, it is observed
from Fig. 7.7a, b that some measured contact angles are below
150°. In this case, the oil droplets are in metastable Wenzel/Cassie
hybrid states, as shown in the schematic diagram of Fig. 7.7d1, d3.
Conversely, when the contact angle is larger than 150°, the contact
is the Cassie model, which represents a non-wet-contact mode. The
oil contacts the upper end of the microstructures, leaving the lower
end immersed in water (Fig. 7.7d2, d4). Especially, the minimum
values for f are 0.206 and 0.081 for microcones and micromolars,
endowing the structured surface with oil CA of 157.76° and 169.21°.
The oil sliding behaviors are also studied (Fig. 7.7e, f). Similar to the
case discussed above, the sliding angles are also decreased with
the increasing pulse energy and decreased scanning space. The
microcones and micromolars can modulate the oil sliding angle from
0.91° to 12.88°, and 0.52° to 9.14°, respectively. Generally, the small
sliding angle signifies low adhesion [5].
The modification of the underwater wettability plays an important
role in the oil manipulation. Figure 7.7g, h indicate the controlling of
the moving behavior of the oil droplet. By utilizing the adhesion
contrast between the treated and untreated area, the oil droplet can
move along the setting path without loss via slightly tilting the sample
(Fig. 7.8). In addition, the structured surfaces with controllable
adhesion have important potential application in the transfer of oil
droplets. Figure 7.7i shows an example of transferring a 5 μl oil
droplet from the low adhesive A surface to the high adhesive C
surface via using medium adhesive B surface as a “mechanical
hand” [10].
Fig. 7.8 Schematic diagram of underwater oil along the set path. The untreated silicon is oleophobic,
while the treated areas a microcones and b micromolars are superoleophobic. By taking advantage of
this property, we have designed a path composed of untreated fine line and treated thick lines on both
sides. In this way, the fine line can grasp the oil droplet and control it to move along the setting path,
and the ultralow adhesion force of the processed lines on both sides ensure the oil droplet to move
without loss
7.4.3 The Anisotropic Wetting and Sliding Behavior
In the previous discussion, the scanning space (D) was set as 20,
35, and 50 μm, which can match up with the size of focused laser
beam, therefore, there is hardly any untreated space between the
scanning lines, making the induced microstructures overlap with
each other. In this case, the wetting and sliding of the oil in water are
isotropic. When increasing the scanning space, blank area appears
and gradually grows wider as shown in Fig. 7.10a, b, which are
prepared at pulse energy of 0.25 mJ. By contrasting the preparation
in ethanol and sucrose solution, it is indicated that laser can scan the
silicon surface to form the wider scanning lines with the assistance of
sucrose solution than ethanol (Fig. 7.9) [5]. The increase of the
scanning space results in the difference between the contact angles
measured parallel or perpendicular to the scanning lines.
Figure 7.10c, d reveal the shapes of a 5 μl oil droplet on the treated
silicon surface with D of 80 and 200 μm, along the directions
perpendicular and parallel the scanning lines, respectively. Seen
from Fig. 7.10c for microcones with D = 80 μm, the values for CA⊥
and CA∥ are 153.92° and 151.83°, declaring a small degree of
wetting anisotropy for the two directions. However, for D = 200 μm,
the measured CA⊥ and CA∥ are 138.08° and 124.36°, hence the
difference of the CA values for the two directions is 13.72°. Similarly,
for micromolars, at D = 80 μm, the CA⊥ and CA∥ are 166.29° and
162.72°, and at D = 200 μm the values are 143.81° and 131.52°,
respectively (Fig. 7.10d). We also systematically investigated the
influence of D on the values for CAs of oil in the perpendicular and
parallel directions on both microcones and micromolars (Fig. 7.10e).
It can be seen that although both the CA⊥ and CA∥ are decreased
with the increasing D, CA⊥ is consistently larger than CA∥.
Furthermore, CA∥ is initially approximate to CA⊥, however, with D
increasing, the CA∥ is decreased much faster for the more and more
obvious anisotropic structure.
Fig. 7.9 The line width of the scanning lines as functions of the pulse energy
Fig. 7.10 The anisotropic wetting and sliding behavior. a and b are the optical microscope images of
the silicon surfaces prepared by ethanol and sucrose solution assisted fs laser irradiation under pulse
energy of 0.25 mJ and scanning space of 80, 120, 160, and 200 μm, respectively. c and d The optical
images of the anisotropic contact state of 5 μl oil which were measured perpendicular and parallel to
the scanning lines composed by microcones and micromolars, respectively. e The statistical results of
the oil anisotropic contact angles with the increasing scanning spaces. f The schematic illustration of
oil droplet slides perpendicular and parallel to the scanning lines. g and h The snapshots of oil droplet
rolling on the microcones and micromolars surfaces with scanning spaces of 80 and 200 μm, along
the parallel and perpendicular directions, respectively. i The oil anisotropic sliding angles as a
function of the scanning space
To investigate the influence of D on the anisotropic sliding of the
oil droplets, the SAs perpendicular and parallel to the scanning lines
(Fig. 7.10f) were measured. Figure 7.10g, h indicate the snapshots
of an oil droplet rolling on tilted microcones and micromolars silicon
surface with D of 80 and 200 μm, respectively. At D of 80 μm, the
SA⊥ and SA∥ are 1.13° and 2.87° for microcones, 0.81° and 0.84° for
micromolars, showing small sliding anisotropy. However at D of
200 μm, the measured SA⊥ and SA∥ are 48.24° and 58.79° for
microcones, inducing sliding anisotropy is 10.55°. While for
micromolars, the SA⊥ is 21.45° and SA∥ is 44.29°, which indicates
that the sliding anisotropy reaches 22.84°. The relationship between
the anisotropic sliding and D for the microcones and micromolar was
systematically studied (Fig. 7.10i). From Fig. 7.10i, it is observed that
the SAs in the parallel direction were always smaller than those in
the perpendicular direction. This anisotropic sliding is caused by the
different three-phase contact line (TCL) [11]. By comparison, the
discontinuous and long TCL perpendicular to the scanning lines can
give rise to more pronounced hysteresis effects than the continuous
short ones along the parallel direction [5].
In this section, we have developed a facile approach of one-step
assembling microcones and micromolars on silicon surfaces by
ethanol and sucrose solution-assisted fs laser irradiation. By simply
changing the solutions and adjusting the pulse energy, the height of
the microcones and micromolars can be arbitrarily controlled, which
endow the silicon surfaces with tunable superhydrophilic,
superoleophilic, and underwater superoleophobic properties. In
addition, these micro/nanostructured surfaces also show many
useful multifunctions, such as fog collecting and volatilizing, liquid
storage and transportation, and directional transfer. The unique
wetting properties of the structured silicon surfaces by our proposed
method open new applications in fields of microfluidic devices, fluid
microreactors, biomedicine, and chemical/biological sensors [5].
References
1.
Yong J, Yang Q, Chen F, et al. Reversible underwater lossless oil droplet transportation. Adv
Mater Interfaces. 2015;2(2).
2.
Yong J, Chen F, Yang Q, et al. Bioinspired underwater superoleophobic surface with ultralow
oil-adhesion achieved by femtosecond laser microfabrication. J Mater Chem A.
2014;2(23):8790–5.
[Crossref]
3.
Li G, Li J, Zhang C, et al. Large-area one-step assembly of three-dimensional porous metal
micro/nanocages by ethanol-assisted femtosecond laser irradiation for enhanced antireflection
and hydrophobicity. ACS Appl Mater Interfaces. 2014;7(1):383–90.
[Crossref]
4.
Li G, Lu Y, Wu P, et al. Fish scale inspired design of underwater superoleophobic microcone
arrays by sucrose solution assisted femtosecond laser irradiation for multifunctional liquid
manipulation. J Mater Chem A. 2015;3(36):18675–83.
[Crossref]
5.
Li G, Zhang Z, Wu P, et al. One-step facile fabrication of controllable microcone and
micromolar silicon arrays with tunable wettability by liquid-assisted femtosecond laser
irradiation. RSC Adv. 2016;6(44):37463–71.
[Crossref]
6.
Liu H, Chen F, Wang X, et al. Influence of liquid environments on femtosecond laser ablation of
silicon. Thin Solid Films. 2010;518(18):5188–94.
[Crossref]
7.
Yan Z, Chrisey DB. Pulsed laser ablation in liquid for micro-/nanostructure generation. J
Photochem Photobiol C. 2012;13(3):204–23.
[Crossref]
8.
Shen MY, Crouch CH, Carey JE, et al. Femtosecond laser-induced formation of submicrometer
spikes on silicon in water. Appl Phys Lett. 2004;85(23):5694–6.
[Crossref]
9.
Baldacchini T, Carey JE, Zhou M, et al. Superhydrophobic surfaces prepared by
microstructuring of silicon using a femtosecond laser. Langmuir. 2006;22(11):4917–9.
[Crossref]
10. Bi H, Xie X, Yin K, et al. Spongy graphene as a highly efficient and recyclable sorbent for oils
and organic solvents. Adv Func Mater. 2012;22(21):4421–5.
[Crossref]
11. Yong J, Yang Q, Chen F, et al. A simple way to achieve superhydrophobicity, controllable water
adhesion, anisotropic sliding, and anisotropic wetting based on femtosecond-laser-induced linepatterned surfaces. J Mater Chem A. 2014;2(15):5499–507.
[Crossref]
© Springer Nature Singapore Pte Ltd. 2018
Guoqiang Li, Bionic Functional Structures by Femtosecond Laser Micro/nanofabrication
Technologies, Springer Theses: Recognizing Outstanding Ph.D. Research,
https://doi.org/10.1007/978-981-13-0359-3_8
8. Micropore-Arrayed Ultrathin
Aluminum Foil for Oil/Water Separation
and Particle Filtration
Guoqiang Li1
(1) Department of Precision Instrument and Machinery, University of
Science and Technology of China, Hefei, China
Guoqiang Li
Email: guoqli@ustc.edu.cn
The separation of oil/water mixtures has become a global concern
due to the serious oil pollution caused by discharging industrial oily
wastewater, offshore oil accidents and marine transportation [1–4].
Because oil/water separation is an interfacial issue which is
controlled by the chemical composition and geometrical structures,
designing and constructing functional interfacial materials
possessing different wettability to oil and water is proven to be an
effective strategy for wastewater treatment [4–9]. Among these
functional materials, porous sponges and foams [1, 3, 6, 9–14] have
been extensively used for oil/water separation. Although sponges
and foams are characterized by light weight, great porosity, good
elasticity, and high-efficiency in oil/water separation, these materials
are limited to the design and control the internal structures which are
mainly determined by the parent skeletons [15]. In addition, these
porous materials have limited adsorption capacity for absorption
saturation makes them can’t absorb more oil. Moreover, their
fabrication usually needs complex chemical processing, which bring
in serious pollution of the environment. Besides the adsorbent
sponges and foams, many meshes have been constructed as
alternative strategy and have been successfully applied in oil/water
separation [16–21]. For example, Chen et al. [22] first prepared
simultaneous superhydrophobic and superoleophilic Teflon (PTFE)
coated mesh film for separation of oil and water. Zhang et al. [19]
reported a nanowire-hair microstructures covered Cu(OH)2 copper
mesh which had a high separation capacity for both water-rich
immiscible mixtures and dispersed oil-water mixtures. However, their
preparation is also performed in chemical conditions which may
cause secondary pollution to the environment. Gao et al. [21]
developed a dual-scaled porous nitrocellulose membrane which had
high oil/water separation efficiency by a facile perforating method.
Although this process is scalable, fast, low-cost, and high separation
efficiency, the formed pores are nonuniform and uncontrollable,
which hinder their extensive use. Additionally, most of the literatures
do not concern the solution to the continuous separation for the
gravity-driven removal of heavy or light oils (compared to the density
of water). Furthermore, these meshes are restricted to the oil/water
separation, not refer to other functions. Hence, it is of great
significance to seek novel functional materials and prepare regular,
controllable structures with multifunctions in a simple, environmentfriendly, and scalable approach [23].
Here, for the first time, we report the one-step femtosecond laser
irradiation to induce large-area regular micropore arrays on ultrathin
aluminum foils, which have thin thickness (~25 μm), light weight, low
cost, good plasticity, and have been commonly applied to packaging,
cooking, geochemical sampling, art and decoration and so on. The
micropore-arrayed aluminum foils show underwater superoleophobic
ability which is responsible for oil/water separation function. By
skillfully designing the shape and structure of the aluminum foil
oil/water separator, the oil and water can be separated efficiently and
continuously. In addition, the uniform micropores were used to filtrate
the particles with different diameters, showing multifunctions. This
work provides a new pathway for controllable construction of
aluminum foil-based micropore arrays with high separation efficiency
and extends their applications to broader fields besides water
treatment [23].
8.1 The Preparation of the Micropore-Arrayed
Aluminum Foils
Ultrathin aluminum foil with regular micropore arrays were fabricated
by a femtosecond laser perforating method, and the schematic
fabrication process is shown in Fig. 8.1. By setting the laser pulse
energy of 50 μJ and perforating space of 20 μm, an area of
40 × 40 mm2 were obtained (Fig. 8.2). From the optical camera
photo taken under the inclined incidence of white light, it is seen that
the micropore-arrayed aluminum foils presents brilliant iridescence
due to the optical diffraction effect. In addition, bright iridescence can
also be formed by the irradiation of white LED from the behind
(Fig. 8.3) [23]. In Fig. 8.3a, the four iridescent patterns are taken by
distances of 0, 5, 10, 15 cm, from the foils to the camera,
respectively. While in Fig. 8.3b, the iridescent patterns are taken by
different angles to the optical axis, and the included angles are 0°,
5°, 10°, and 15°, respectively.
Fig. 8.1 The schematic diagram of fabricating regular micropore-arrayed aluminum foil
Fig. 8.2 Optical images of the as-prepared aluminum foil
Fig. 8.3 Bright iridescence formed by the regular micropore arrays due to the optical diffraction
effect. a The four iridescent patterns taken by different distance from the foils to the camera. The
distances are 0, 5, 10, 15 cm, respectively. b The iridescent patterns taken by different angles to the
optical axis, and the included angles are 0°, 5°, 10°, and 15°, respectively. All the samples are
irradiated by white LED from the behind
From the low-magnification SEM image and the transmission
microscope photographs (Fig. 8.4) [23], it is clearly seen that uniform
micropore arrays are neatly arranged on aluminum foil surface. The
magnified SEM image exhibited that the pore size is about 2.4 μm,
and the rim is covered with rough nanostructures. The uniformity of
the micropores is studied by systematically analyzing the pore
diameters and the eccentricity, and the results are shown in Fig. 8.5
[23].
Fig. 8.4 SEM images of the as-prepared aluminum foil
Fig. 8.5 Uniformity analysis of the micropores formed by femtosecond laser perforating. a is the
SEM image of the micropore arrays. The interval of the adjacent pores is 20 μm. b is the mean
diameter of the pores by averaging the X and Y directions in the blue area in (a). c is the analysis of
the eccentricity of the each pore in the blue area in (a). It can be seen that all the eccentricity is less
than 0.1, which means that the pores are very equivalent to roundness. From (b) and (c), it is
indicated that regular micropores are arrayed on the aluminum foil surface
The mean diameter of the pores (Fig. 8.5b) and the eccentricity
of the each pore (Fig. 8.5c) can be obtained by averaging the X and
Y directions in the blue area in Fig. 8.5a. It can be seen that all the
eccentricity is less than 0.1, which means that regular micropores
are arrayed on the aluminum foil surface.
Figure 8.6a expresses the representative SEM images for
micropore intervals of 40, 60, and 80 μm, which can be adjusted by
altering the perforating space of the laser beam. Additionally, three
pores with diameters of 8.2, 19.1, and 32.2 μm are demonstrated in
Fig. 8.6b, and the size distribution is analyzed in Figs. 8.6c and 8.7.
The results indicate that the pores are uniformly distributed. In
addition, the preparation of a series of micropores with diameters
ranged from 2.4 to 32 μm is also studied by changing the laser pulse
energy and pulse numbers, and the results are shown in Fig. 8.6d.
Fig. 8.6 The precise control of regular micropore arrayes with diverse intervals and diameters. a The
SEM and transmission optical microscope images of the micropores with intervals of 40, 60, and 80
µm, from top to bottom, respectively. b The representative SEM images of the micropores with
diameters of 8.2, 19.1, and 32.2 µm, respectively. c Distribution statistics of the three pore diameters
in (b), showing good uniformity. d The diameters as a function of laser pulse energy and pulse
number
Fig. 8.7 Optical microscope images of the micropores. From a to h, the diameters are 2.4, 4.1, 8.2,
12.2, 15.9, 19.1, 27.7, and 32.2 μm, respectively. The results indicate that not only the pores are
uniformly distributed, but also the micropores can be tuned by changing the laser pulse energy and
pulse numbers
From Figs. 8.2 and 8.7, it is clearly indicated that regular
micropore arrays with diverse diameters and intervals can be easily
prepared on aluminum foil surfaces just by simply adjusting the laser
processing parameters without other complex process. In addition,
this process is fast. For example, a 10 × 10 mm2 membrane with
micropore size of ~15 μm and interval of 60 µm can be processed in
less than 6 min.
8.2 The Wettability of the Micropore-Arrayed
Aluminum Foils
The unprocessed aluminum foil is hydrophilic and the water contact
angle is 53.9°. The microsized pores in combination with nanoscale
roughness endow a hierarchical composite structure to the aluminum
foil that possesses superwetting behaviors. For example, the
aluminum foil with pore diameter of 2.4 μm and interval of 20 µm
obtains a water contact angle of 7.8° (Fig. 8.8a) [23]. When the asprepared aluminum foil is immersed in water, its wetting property is
reverted to be superoleophobic. Typically, for C8H18 whose density is
less than water, and for C2H4Cl2 which is heavier than water, the
contact angles are 153.5° (Fig. 8.8b) and 153.1° (Fig. 8.8c),
respectively.
Fig. 8.8 The contact-angle images of the aluminum foil, demonstrating superhydrophilic (water
contact angle is about 7.8° (a)), underwater superoleophobic (contact angle of C8H18 and C2H4Cl2
are 153.5° (b), and 153.1° (c), respectively)
The hydrophilicity and underwater oleophobicity of the aluminum
foil prepared under different laser processing parameters are
systemically studied and the results are summarized in Fig. 8.9 [23].
Figure 8.9a is the water contact angle on micropores with different
diameters and intervals. It is indicated that most of the contact
angles are less than 10°, showing superhydrophilic nature. In
addition, the contact angles are decreased with the increasing
micropore diameters and decreasing intervals. Figure 8.9b, c are the
C8H18 and C2H4Cl2 contact angles on micropore arrays. It can be
seen that all the contact angles are larger than 150°, exhibiting
underwater superoleophobic property. From Fig. 8.9b, c, it is
observed that the oil contact angles are increased with the
increasing micropore diameters and decreasing intervals. This study
illustrates that the wettability can be accurately controlled by
changing the micropore diameters and intervals.
Fig. 8.9 Systematic study of the wettability of the micropore arrays. a is the water contact angle on
micropores with different diameters and intervals. It is indicated that most of the contact angles are
less than 10°, showing superhydrophilic nature. In addition, the contact angles are decreased with the
increasing micropore diameters and decreasing intervals. b and c are the C8H18 and C2H4Cl2
contact angles on micropore arrays. It can be seen that all the contact angles are larger than 150°,
exhibiting underwater superoleophobic property. From (b) and (c), it is observed that the oil contact
angles are increased with the increasing micropore diameters and decreasing intervals. This study
illustrates that the wettability can be accurately controlled by changing the micropore diameters and
intervals
8.3 The Oil/Water Separation by the MicroporeArrayed Aluminum Foils
The opposite wetting properties for water and oil are supposed to be
applied for controllable oil/water separation. Firstly, the oil/water
mixtures were prepared and the results are shown in Fig. 8.10. From
Fig. 8.10a–c, it can be seen that the undyed water, C8H18, and
C2H4Cl2 are colorless transparent. The water presents blue color
after it is dyed with methylene blue. Meanwhile, the C8H18 and
C2H4Cl2 show red color after dyed with Sudan IV. It is observed from
Fig. 8.10d–f that the layered oil and water is formed due to C8H18 is
lighter than water while C2H4Cl2 is heavier than water [23].
Fig. 8.10 Preparation of the oil/water mixtures. From (a) to (c), it can be seen that the undyed water,
C8H18, and C2H4Cl2 are colorless transparent. The water presents blue color after it is dyed with
methylene blue. Meanwhile, the C8H18 and C2H4Cl2 show red color after dyed with Sudan IV. It is
observed from (d) to (f) that the layered oil and water is formed due to C8H18 is lighter than water
while C2H4Cl2 is heavier than water
Several proof-of-concept studies were performed to test the
oil/water separation capacities of the as-prepared aluminum foil.
Here we choose the C8H18 and C2H4Cl2 as the target oils, and the
photographs of mixtures are shown in Fig. 8.11a. The C8H18/water
separation experiment is operated, and the schematic diagram is
displayed in Fig. 8.11b. As shown in Fig. 8.11c, a piece of aluminum
foil with pore diameter of 8.2 μm and interval of 60 μm was
horizontally fixed between a glass tube and conical flask to act as a
separating mesh, which is a common installation method reported in
previous literatures. A beaker of 20 ml C8H18/water mixture was
poured onto the aluminum foil, and then the separation was
proceeded by the force of gravity. Due to the superhydrophilicity, the
water (blue color) rapidly permeates the micropores and then in
pours the conical flask, whereas the C8H18 (red color) is blocked in
the upper tube for the superoleophobicity of the aluminum foil. The
C8H18/water separation is completed in less than 13 s and no
external force other than gravity is needed during the separation
process. In this way, 1.54 × 10⁵ L C8H18/water mixture can be
separated by using an aluminum foil with processing area of 1 m2 in
one hour. This kind of separator can be used to effectively separate
a mixture of light oil (whose density is less than water) and water.
However, this device is not suitable for the separation heavy oil
(heavier than water) and water mixtures for the heavy oil settling
below the water, forming an insulation layer between the water and
the aluminum foil which prevents the water from maintaining contact
with the aluminum foil. Although some works have mentioned the
separation heavy oil and water mixtures with this method, it is
speculated that the assistant external forces, such as stirring and
shaking are needed to churn the mixtures to let the water contact
with the aluminum foil [23].
Fig. 8.11 Oil/water separation of the micropore arrayed aluminum foil for C8H18/water mixtures
and C2H4Cl2/water mixtures. a The photographs of C8H18/water mixtures and C2H4Cl2/water
mixtures. b Schematic diagram of C8H18/water separation. c The time-lapse images of the
separation of C8H18/water mixtures. It is indicated that a 20 mL mixtures can be separated in less
than 13 s. d The equipment and schematic diagram of separating heavy oil of C2H4Cl2 and water
mixtures. e Time-lapse images of C8H18/water separation, and this process is completed in less than
31 s
For separating the heavy oil and water mixtures in the absence of
other external forces, a tube with a side opening which is covered
with micropore arrayed aluminum foil is designed (Fig. 8.11d). When
the mixture of heavy oil and water is poured into the upright tube, the
water in the oil/water mixture can pass through the side opening
although the oil settles below the water, thereby achieving oil/water
separation only with gravity effect. The results show that a 20 ml
heavy oil/water mixture can be separated in less than 31 s, which
means that the accomplishment of separation of 6.5 × 10⁴ L oil/water
mixture by per m2h (Fig. 8.11e) [23].
Furthermore, this separator can separate not only heavy oil/water
mixtures but also light oil/water mixtures. Besides, the aluminum foil
can maintain its superhydrophilicity and underwater
superoleophobicity after 10 separations and is easily cleaned using
water or ethanol for reuse (Fig. 8.12a). The separation efficiency of
the micropores with pore diameters from 2.4 to 32 μm was
quantitatively evaluated by calculating the ratio of the oil before and
after separation according to the following equation [18–23].
Fig. 8.12 a Cycling performance of micropore-arrayed aluminum foil for repeated use after
ultrasonic cleaning. b The calculated separation efficiency of the aluminum foil with pore diameters
ranging from 2.4 to 32 mm for both C8H18/water mixtures and C2H4Cl2/water mixtures
(8.1)
here, C o and C p refer to the oil concentration in the original oil/water
mixture and the collected water, respectively. It is indicated that the
separation efficiency of this series of micropores was calculated up
to 99% for both C8H18 and C2H4Cl2 (Fig. 8.12b). In addition, we
found that the aluminum foil can still be used for high-efficiency
oil/water separation after being placed for 35 days.
Oil resources are becoming more and more precious with their
rapidly running out. It is vital to develop a novel and simple technique
that can achieve the oil/water separation and oil collection
simultaneously and continuously. To obtain the effect, only one more
step was involved: installing a superhydrophilic aluminum foil and
superhydrophobic one on the openings on both sides of the tube.
This is because the superhydrophobic micropore-arrayed aluminum
foil is underwater superoleophilic, which allows the oil to pass
through the micropores and block off the water. For this purpose, the
aluminum foil is modified with low surface energy 1H, 1H, 2H, 2Hperfluorodecyltriethoxysilane (PFDTES), and the schematic diagram
is shown in (Fig. 8.13a). After the low surface energy modification,
the original superhydrophilic aluminum foil (CA = 5.1°) is tuned to
superhydrophobic (CA = 154.4°) and underwater superoleophobic
one (CA = 9.5°). Then the superhydrophilic and superhydrophobic
aluminum foils were installed on the openings on each side of the
tube. When the oil/water mixtures are poured into the upright tube,
the water can only penetrate the superhydrophilic aluminum foils
micropores while the oil only pass through the superhydrophobic
one, as shown in (Fig. 8.13b). The corresponding experimental
results are displayed in (Fig. 8.13c). Just as expected, it is seen from
(Fig. 8.13c), a 60 mL oil/water mixtures are rapidly separated in less
than 28 s and the oil is collected for recycling. After pouring the
oil/water mixtures, the oil and water are purified and guided to
collecting vessel. In the meantime, the separator can free up new
space for consecutively separating subsequent oil/water mixtures.
Such continuous separating behavior means that a small separator
can separate and purify a large amount oil/water mixtures easily and
quickly. This novel strategy not only overcomes the disadvantages of
traditional methods which can only separate light or heavy oil and
water mixtures in small amounts, but also provides a possibility of
recycling water and oil.
Fig. 8.13 The demonstration of the continuous separation of oil/water mixtures. a Schematic
illustrations of fabrication of superhydrophobic aluminum foil by modifying the superhydrophilic
one with low surface energy 1H, 1H, 2H, 2H-perfluorodecyltriethoxysilane (PFDTES). The modified
aluminum foil is superhydrophobic (water contact angle of 154.42°) and underwater superoleophilic
(C2H4Cl2 contact angle of 9.47°). b The home-made devices for continuously separating oil and
water mixtures. c Time-lapse images of continuous oil/water mixtures separation and the recycle for
oil. A 60 mL oil/water mixtures are rapidly separated with foil area of 0.3×3 cm2 in less than 28 s
and the oil is collected for recycling. In this way, 23.8 L oil/water mixtures can be separated with 1
m2 aluminum foil in less than 1 s
In addition, due to the fast and complete discharge of the water
and oil from the separator (Fig. 8.13c), the oil/water separation can
withstand the intrusion pressure of oils flowing through the Al foil,
which is determined by the oil layer height and can be expressed
experimentally and theoretically by Eq. (8.2) [18–21] and Eq. (8.3)
[18–21]
(8.2)
(8.3)
in Eq. (8.2), ρ, g, and h max are the density of the oil, the acceleration
of gravity, and the maximum height of oil layer that the aluminum foil
can support. In Eq. (8.3), d refers to the diameter of the micropores
(Fig. 8.14) [23]. Hence, this novel separator may open a new
channel for the fast, continuous, and high-efficiency oil/water
separation.
Fig. 8.14 Calculation of the maximum height of the oil layer which can be supported by the
aluminum foil
We also tested the maximum height of the water that the
membrane can sustain. A membrane with pore size of ~13.1 μm and
interval of 60 µm was fixed at the lower end of the glass tube. The
tested oil is C2H4Cl2 and the pressure is exerted by adding water
into the upright glass tube. A membrane with pore size of ~13.1 μm
and interval of 60 µm was fixed at the lower end of the glass tube.
Before the test, the membrane is pre-wetted by spraying water. Due
to the underwater superoleophobicity, the oil can’t pass through the
membrane. When the height of the water reaches ~110.6 cm, the oil
can penetrate the superoleophobic membrane and flows into the
beaker. This test is also conducted on the membrane with pore size
of ~24.5 μm, and the obtained maximum height of water is ~21 cm.
As for the membrane with the size of ~2.4 μm, the maximum water
height can’t be measured for the maximum length of the glass tube
is 150 cm. Even so, we believe the maximum water height is far
beyond 150 cm.
8.4 The Filtration of Particles with Different
Diameters
The regular and uniformly distributed micropore arrays endow the
as-prepared aluminum foil with a new function, namely the enhanced
particle filtration. In order to illustrate this function, aluminum foils
with pore diameters of 13.2 and 7.4 μm, interval of 60 μm
(Fig. 8.15a) are applied to filtrate the particles with different
diameters. The filtration of SiO2 particles with diameters of 20, 10,
and 5 μm is illustrated in Fig. 8.15b, c. When the aqueous solution of
particles is dropped onto the micropore arrayed aluminum foil, the
particles whose sizes is less than the pore diameters can pass
through the micropores under current. However, the particles which
are bigger than the micropores will be retained above the aluminum
foil. From experimental results exhibited in Fig. 8.15d, e, it can be
seen that the sorted particles sizes are all 10 and 5 μm, respectively,
indicating high sorting efficiency. We believe that the simplicity of this
approach makes it quite appealing for not only particle filtration with
various sizes, but also blood and cell separation, and even more labon-a-chip devices.
Fig. 8.15 Multifunctional filtration of different diameter SiO2 particles with micropore-arrayed
aluminum foil. a The SEM images of the aluminum foils with pore diameters of 13.2 and 7.4 µm,
which are used for filtrating particles with sizes of 20, 10, and 5 µm. b and c The front-view of the
schematic diagram for filtrating particles with different sizes. d and e The optical microscope images
of the particle filtration. By comparing the particles before and after filtration, it is well illustrated
that the micropore-arrayed aluminum foil has high sorting efficiency
It’s worth mentioning that due to the controllability and flexibility of
the femtosecond laser micro/nanofabrication, diverse patterns, such
as heart, TaiJi, and star-shaped patterns composed by micropore
arrays can be simply and rapidly fabricated (Fig. 8.16a). Moreover,
the good plasticity of the aluminum foil make it folded into diverse
three-dimensional geometric patterns (Fig. 8.16b). All these
advantages are not available to other traditional preparation methods
and materials.
Fig. 8.16 a The microscopic photographs of diverse patterns, such as heart, TaiJi, and star-shaped
patterns. b The assembly of diverse three-dimensional geometric patterns with the as-prepared
aluminum foil due to its good plasticity. All these patterns are irradiated by LED lights from the
inside
In summary, we have demonstrated a new oil/water separation
device based on micropore arrayed ultrathin aluminum foil fabricated
by femtosecond laser perforating. This device can continuously
separate not only the light oil and water mixtures, but also the heavy
oil/water mixtures with high speed and efficiency, as well as recycling
the oil resources for reuse. This novel separation strategy
overcomes the shortcoming of conventional methods: only
separating light oil and water mixtures or heavy oil and water
mixtures, cannot continuously separating for retaining oil or water on
the separation device, low oil recycling efficiency. The foil displays
bright iridescence under the white light irradiation due to the optical
diffraction effect of regular micropore arrays. The micropore arrayed
aluminum foil also shows robust filtrating performance for particles
with different sizes, exhibiting multifunctional applications. The
combination of the controllable and flexible femtosecond laser
micro/nanofabrication technology with the ultrathin, plastic aluminum
foil endow the micropore arrays with particular use in the design of
sewage treatment and particle filtration equipment, as well as other
multifunctional devices [23].
References
1.
Bi H, Xie X, Yin K, et al. Spongy graphene as a highly efficient and recyclable sorbent for oils
and organic solvents. Adv Func Mater. 2012;22(21):4421–5.
[Crossref]
2.
Zhang X, Li Z, Liu K, et al. Bioinspired multifunctional foam with self-cleaning and oil/water
separation. Adv Func Mater. 2013;23(22):2881–6.
[Crossref]
3.
Ge J, Ye YD, Yao HB, et al. Pumping through porous hydrophobic/oleophilic materials: an
alternative technology for oil spill remediation. Angew Chem. 2014;126(14):3686–90.
[Crossref]
4.
Liu N, Cao Y, Lin X, et al. A facile solvent-manipulated mesh for reversible oil/water separation.
ACS Appl Mater Interfaces. 2014;6(15):12821–6.
[Crossref]
5.
Xu Z, Zhao Y, Wang H, et al. A superamphiphobic coating with an ammonia-triggered transition
to superhydrophilic and superoleophobic for oil-water separation. Angew Chem.
2015;127(15):4610–3.
[Crossref]
6.
Shi L, Chen K, Du R, et al. Scalable seashell-based chemical vapor deposition growth of threedimensional graphene foams for oil-water separation. J Am Chem Soc. 2016;138(20):6360–3.
[Crossref]
7.
Zhang W, Lu X, Xin Z, et al. A self-cleaning polybenzoxazine/TiO2 surface with
superhydrophobicity and superoleophilicity for oil/water separation. Nanoscale.
2015;7(46):19476–83.
[Crossref]
8.
Wang B, Liang W, Guo Z, et al. Biomimetic superlyophobic and superlyophilic materials applied
for oil/water separation: a new strategy beyond nature. Chem Soc Rev. 2015;44(1):336–61.
[Crossref]
9.
Yong J, Chen F, Yang Q, et al. Oil-water separation: a gift from the desert. Adv Mater Interfaces.
2016;3(7).
10. Gao X, Zhou J, Du R, et al. Robust superhydrophobic foam: a graphdiyne-based hierarchical
architecture for oil/water separation. Adv Mater. 2016;28(1):168–73.
[Crossref]
11.
Ma Q, Cheng H, Fane AG, et al. Recent development of advanced materials with special
wettability for selective oil/water separation. Small. 2016;12(16):2186–202.
[Crossref]
12. Liu Y, Ma J, Wu T, et al. Cost-effective reduced graphene oxide-coated polyurethane sponge as a
highly efficient and reusable oil-absorbent. ACS Appl Mater Interfaces. 2013;5(20):10018–26.
[Crossref]
13. Ruan C, Ai K, Li X, et al. A superhydrophobic sponge with excellent absorbency and flame
retardancy. Angew Chem Int Ed. 2014;53(22):5556–60.
[Crossref]
14. Wu C, Huang X, Wu X, et al. Mechanically flexible and multifunctional polymer-based
graphene foams for elastic conductors and oil/water separators. Adv Mater. 2013;25(39):5658–
62.
[Crossref]
15. Greenewalt CH, Brandt W, Friel DD. Iridescent colors of hummingbird feathers. JOSA.
1960;50(10):1005–13.
[Crossref]
16. Wen Q, Di J, Jiang L, et al. Zeolite-coated mesh film for efficient oil-water separation. Chem
Sci. 2013;4(2):591–5.
[Crossref]
17. Wang CF, Tzeng FS, Chen HG, et al. Ultraviolet-durable superhydrophobic zinc oxide-coated
mesh films for surface and underwater-oil capture and transportation. Langmuir.
2012;28(26):10015–9.
[Crossref]
18. Yang J, Zhang Z, Xu X, et al. Superhydrophilic-superoleophobic coatings. J Mater Chem.
2012;22(7):2834–7.
[Crossref]
19. Zhang F, Zhang WB, Shi Z, et al. Nanowire-haired inorganic membranes with
superhydrophilicity and underwater ultralow adhesive superoleophobicity for high-efficiency
oil/water separation. Adv Mater. 2013;25(30):4192–8.
[Crossref]
20. Liu N, Chen Y, Lu F, et al. Straightforward oxidation of a copper substrate produces an
underwater superoleophobic mesh for oil/water separation. ChemPhysChem. 2013;14(15):3489–
94.
[Crossref]
21. Gao X, Xu LP, Xue Z, et al. Dual-scaled porous nitrocellulose membranes with underwater
superoleophobicity for highly efficient oil/water separation. Adv Mater. 2014;26(11):1771–5.
[Crossref]
22. Yong J, Fang Y, Chen F, et al. Femtosecond laser ablated durable superhydrophobic PTFE films
with micro-through-holes for oil/water separation: separating oil from water and corrosive
solutions. Appl Surf Sci. 2016;389:1148–55.
[Crossref]
23.
Li G, Fan H, Ren F, et al. Multifunctional ultrathin aluminum foil: oil/water separation and
particle filtration[J]. J Mat Chem A. 2016;4(48):18832–18840.
[Crossref]
© Springer Nature Singapore Pte Ltd. 2018
Guoqiang Li, Bionic Functional Structures by Femtosecond Laser Micro/nanofabrication
Technologies, Springer Theses: Recognizing Outstanding Ph.D. Research,
https://doi.org/10.1007/978-981-13-0359-3_9
9. Conclusions and Outlook
Guoqiang Li1
(1) Department of Precision Instrument and Machinery, University of
Science and Technology of China, Hefei, China
Guoqiang Li
Email: guoqli@ustc.edu.cn
In this work, we first outline the background of bionical technology
and its historical developments. Then we take an advanced
femtosecond laser micromachining approach to prepare diverse
bionic hierarchical structures on materials surfaces, and realize the
multifunctions such as bionic structural colors, superhydrophilicity,
superhydrophobicity, liquid manipulating, and oil/water separation,
and so on.
Based on the research of the relationship between the
micro/nanostructures and the laser parameters, a series of structural
colors and the diverse displays are studied. By altering the laser
pulse overlaps on aluminum surfaces, several single colors which
are insensitive to the viewing angle are produced for the formation of
nanostructure-covered microgrooves. By skillfully utilizing the
correlation of the orientation of periodic ripple and laser polarization,
multi-patterns constituted by ripples with different orientations were
designed and the diverse display for the desired ones were realized
by exquisitely varying the incident light angle and rotating sample
angle. Furthermore, we prepared diverse 3D hierarchical structures
on metal and silicon surface with liquid-assisted laser micro/nano
processing and changed the wettability, thus realizing the controlling
of the liquid’s motion. In addition, we present regular microporearrayed ultrathin aluminum foil fabricated by femtosecond laser
perforating. The micropore arrayed aluminum foil shows excellent
oil/water separation function and robust filtering performance for
particles with different sizes, exhibiting multifunctional applications.
The innovative points of this work can be summarized as: (1)
variety bionic functional structures are produced by combining the
advanced femtosecond laser micromachining approaches and the
frontier bionic science. Many kind special and regular
micro/nanostructures can be prepared by one-step femtosecond
laser irradiation, due to its high precision, excellent controllability,
one-step processing and compatible with various materials. (2) The
preparation of composite colorful patterns was developed and their
diverse displays were studied, which could provide theoretical and
experimental basis for the preparation and practical applications of
structural colors. (3) The liquid-assisted laser micro/nano processing
method was proposed to induce 3D hierarchical structures. Different
structures can be prepared by adjusting the laser parameters and
liquid environments. (4) Laser perforating was used for the first time
to form controllable micropore possessing multifunction.
However, in the scientific research aspect, there are still many
important scientific problems that need to be further studied. (1) The
exact formation mechanism of femtosecond laser induced
micro/nano structures has not been explored although many kinds
structures can be accurately controlled by controlling femtosecond
laser processing parameters. Hence, it is necessary to study the
microcosmic change rules of the structures during the laser
interaction with the material surfaces and hereby establish the
corresponding thermal dynamic model. (2) The quantitative
relationship between micro/nanostructures and the bionic function is
not clear. The physical model of the relation between the
micro/nanostructures and functions should be established which is
based on the analysis of the dynamic influence of the structures on
the functions.
In the applied research aspect, in spite of those beneficial
properties of the laser induced micro/nanostructures, there are still
several limitations in implementing these materials in engineering
settings. First, all the experiment and test are conducted in the
laboratory, which are not suitable for harsh environments. Real
applications require excellent chemical stability and mechanical
robustness. Moreover, the current preparing method is still inefficient
and expensive, which can’t meet the needs of practical applications.
Thus, cheaper, accessible materials and fabrication methods should
be sought to translate the lab demonstrations to the market.
Considering the compelling advantages inherent in femtosecond
laser micro/nanofabrication and the dramatic development in the
correlative science and engineering community, we are confident
that preparation of bionic functional structures by femtosecond laser
micro/nanofabrication technologies will embrace a bright future.