/


Теги: military affairs engineering design handbook
Год: 1967
Похожие


Текст
AMC PAMPHLET АМСР 706-185
.. .. . „ ... - —..i .. — ... -.
_D D C
< JUN 1 6 1967 ll
- Ll_ju U Lb.21
В
ENGINEERING DESIGN
HANDBOOK
MILITARY PYROTECHNICS SERIES
PART ONE
THEORY AND APPLICATION
HEADQUARTERS, U.S. ARMY MATERIEL COMMAND
APRA 867
HEADQUARTERS
UNITED STATES ARMY MATERIEL COMMAND
WASHINGTON, D. C. 20315
me PWHLET
N|. 704-185
28 April 1967
ENGINEERING DESIGN HANDBOOK
MILITARY PYROTECHNICS SERIES
PART ONE—THEORY AND APPLICATION
This pamphlet is published for the information and guidance
of all concerned.
(AMCRD-R)
FOR THE COMMANDER:
K. h. BAYER
Major General, USA
Acting Chief of Staff
OFFICIAL:
STANLEY J.
Colonel, №к1/
Chief, Administrative Office
DISTRIBUTION:
Special
АМСР 706-185
PREFACE
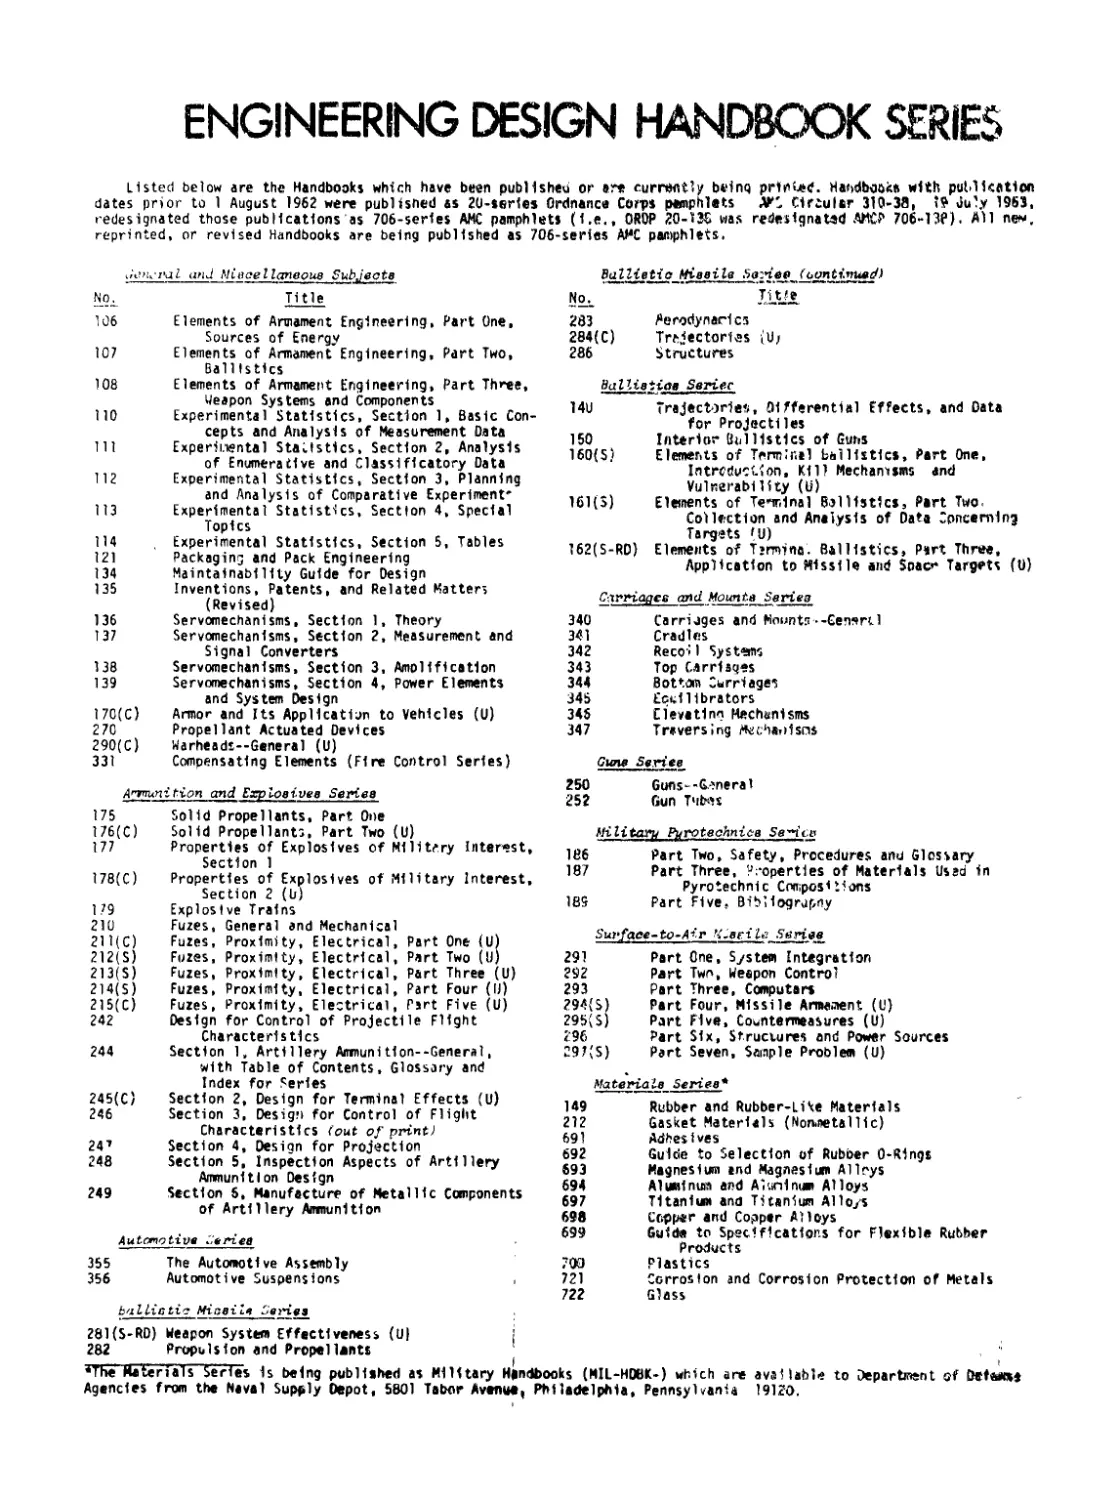
The Engineering Design Handbook Series of the Amy Materiel Command
is a coordinated series of handbooks containing basic information and funda-
mental data useful in the design and development of Army materiel and systems.
The handbooks are authoritative reference books of practical information and
quantitative faets helpful in the design and development of Army materiel so
that it will meet the tactical and the technical needs of the Armed Forces. The
present handbook is one of a series intended to fill a longfelt need for an au-
thoritative and comprehensive source of information on military pyrotechnics.
It is a common misconception to regard military pyrotechnics as being
synonymous with fireworks. Military pyrotechnics is rapidly developing into a
science which exploits all applicable scientific and engineering principles and
practices.
This handbook, Military Pyrotechnics, Part One, Theory and Application,
includes a chapter on the history of the pyrotechnic art, a chapter giving a
general introduction tp the application of pyrotechnic devices to military prob-
lems, and chapters on Physical-Chemical Relationships, Visibility, Production
of Heat, Production of Light, and Production of Smoke.
Material for this handbook, except for Chapter 1, was prepared by the
Denver Research Institute of the University of Denver, under the direction of
Dr. Robert W. Evans. Material for Chapter 1, History of Military Pyrotechnics,
was prepared by the McGraw-Hill Book Company Technical Writing Service.
All material was prepared for the Engineering Handbook Office of Duke Uni-
versity, prime contractor to the Army Research Offiee-Durham. The prepara-
tion of this handbook was under the technical guidance of an interservice com-
mittee with representation from the Army Chemical Center, Ballistic Research
Laboratories, Frankford Arsenal, Harry Diamond Laboratories and Picatinny
Arsenal of the Army Materiel Command; the Naval Ammunition Depot (Crane),
Naval Ordnance Laboratory and the Naval Ordnance Test Station. The chair-
man of this committee was Garry Weingarten of Picatinny Arsenal.
Elements of the U. S. Army Materiel Command hav;og need for handbooks
may submit requisitions or official requests directly to blieations and Repro-
duction Agency, Letterkenny Army Depot, Chambersburg, Pennsylvania 17201.
Contractors should submit such requisitions or requests to their contracting
officers.
Comments and suggestions on this handbook are welcome and should be ad-
dressed to Army Research Office-Durham, Box CM, Duke Station, Durham,
North Carolina 27706.
i
АМСР 706*185
TABLE OF CONTENTS
Paragraph Page
PREFACE ................................ i
LIST OF ILLUSTRATIONS .............. xii
LIST OF TABLES ....................... xvi
CHAPTER 1
HISTORY OF MILITARY PYROTECHNICS
1-1 Introduction........................................ 1-1
1-2 Early History ..................................... 1-1
1-2.1 Greek Fire ..................................... 1-1
1-2.2 Chinese Pyrotechnics ........................... 1-2
1-2.3 Gunpowder....................................... 1-2
1-2.4 Miscellaneous Uses ............................. 1-2
1-3 18th and 19th Centuries............................. 1-2
1-4 Early 20th Century ................................. 1-3
1-4.1 World War I .................................. 1-3
1-4.2 Between the Wars ............................... 1-4
1-4.3 World War II ................................... 1-4
1-5 Post World War II Period............................ 1-5
REFERENCES ......................................... 1-6
CHAPTER 2
INTRODUCTION TO MILITARY PYROTECHNICS
2-1 Introduction.......................................... 2-1
2-1.1 Pyrotechnic Devices and Uses....................... 2-1
2-1.2 Characteristics of Pyrotechnic Compositions ....... 2-3
2-1.2.1 Performance Characteristics ................... 2-3
2-1.2.2 Processing and Sensitivity Characteristics .... 2-3
2-1.2.3 General Functioning Characteristics ........... 2-3
2-1.3 Constituents in Pyrotechnic Compositions .......... 2-4
2-1.4 Comparison of Pyrotechnic Mixtures and Explosives 2-5
REFERENCES .......................................... 2-6
Preceding page blank ш
АМСР 706-185
TABLE OF CONTENTS (cont’d)
CHAPTER 3
PHYSICAL-CHEMICAL RELATIONSHIPS
Paragraph Page
3-1 State of a System ..................................... 3-1
3-1.1 The Gaseous State ................................. 3-1
3-1.1.1 Ideal Gases ................................... 3-1
3-1.1.2 The Universal Gas Constant and Standard Con-
ditions ............................................................ 3-2
3-1.1.3 Real Gases .................................... 3-2
3-1.1.4 Gas Mixtures .................................. 3-3
3-1.1.5 Sample Calculations............................ 3-4
3-1.2 The Liquid State .................................. 3-5
3-1.2.1 Vapor Pressure ................................ 3-5
3-1,2.2 Boiling Point ............................... 3-5
3-1.3 The Solid State.................................... 3-5
3-2 Thermodynamics ........................................ 3-7
3-2.1 Thermodynamic Relationships ....................... 3-7
3-2.1.1 First Law of Thermodynamics.................... 3-7
3-2,1.1.1 Heat Effects at Constant Volume and Constant
Pressure ............................. 3-7
3-2.1.1.2 Heat Capacity ............................. 3-8
3-2.1.1.2.1 Heat Capacity of Gases................. 3-9
3-2.1.1.2.2 Heat Capacity of Liquids and Solids .... 3-9
3-2.1.2 Second Law of Thermodynamics .................. 3-9
3-2.1.3 Third Law of Thermodynamics ............... 3-10
3-2.2 Thermochemistry .................................. 3-11
3-2,2.1 Heats of Reaction............................. 3-11
3-2.2.2 Effect of Temperature on the Heat of Reaction 3-12
3-2.2.3 Enthalpy Tables .............................. 3-13
3-2.2.4 Bond Energies ................................ 3-13
3-2.3 Free Energy and Equilibrium....................... 3-13
3-2.3.1 Chemical Equilibrium ......................... 3-14
3-2.3.2 The LeChatelier Principle .................... 3-16
3-2.3.3 Free Energy and the Equilibrium Constant ..... 3-16
3-2.3.4 Free Energy Calculations...................... 3-17
3-2.3.5 Tabulated Free Energy Values .............. 3-19
3-2.4 Adiabatic Flame Temperature ...................... 3-19
3-2.5 Sample Thermodynamic Calculations .......... 3-20
3-2.6 Summary of Thermochemical Calculations............ 3-23
3-3 Chemical Kinetics..................................... 3-23
3-3.1 Molecularity of Reactions ....................... 3-24
3-3.2 Order of Reaction................................. 3-25
3-3.3 Influence of Temperature on Reaction Rates ....... 3-26
3-3.4 Chain Reactions ................................. 3-27
3-3.5 Heterogeneous Reactions .......................... 3-27
3-3.6 Ignition and Propagative Burning ................. 3-27
iv
АМСР 706-185
TABLE OF CONTENTS (cont’d)
Paragraph Page
3-3.6.1 Ignition 3-28
3-3.6.2 Burning of Metal Particles............... 3-29
3-3.6.3 Burning of Solid Propellants ............. 3-29
3-3.6.4 Rate of Propagative Burning............... 3-30
3-4 Thermoanalytical Techniques...................... 3-32
REFERENCES ...................................... 3-36
CHAPTER 4
VISIBILITY
4-1 Introduction............................................. 4-1
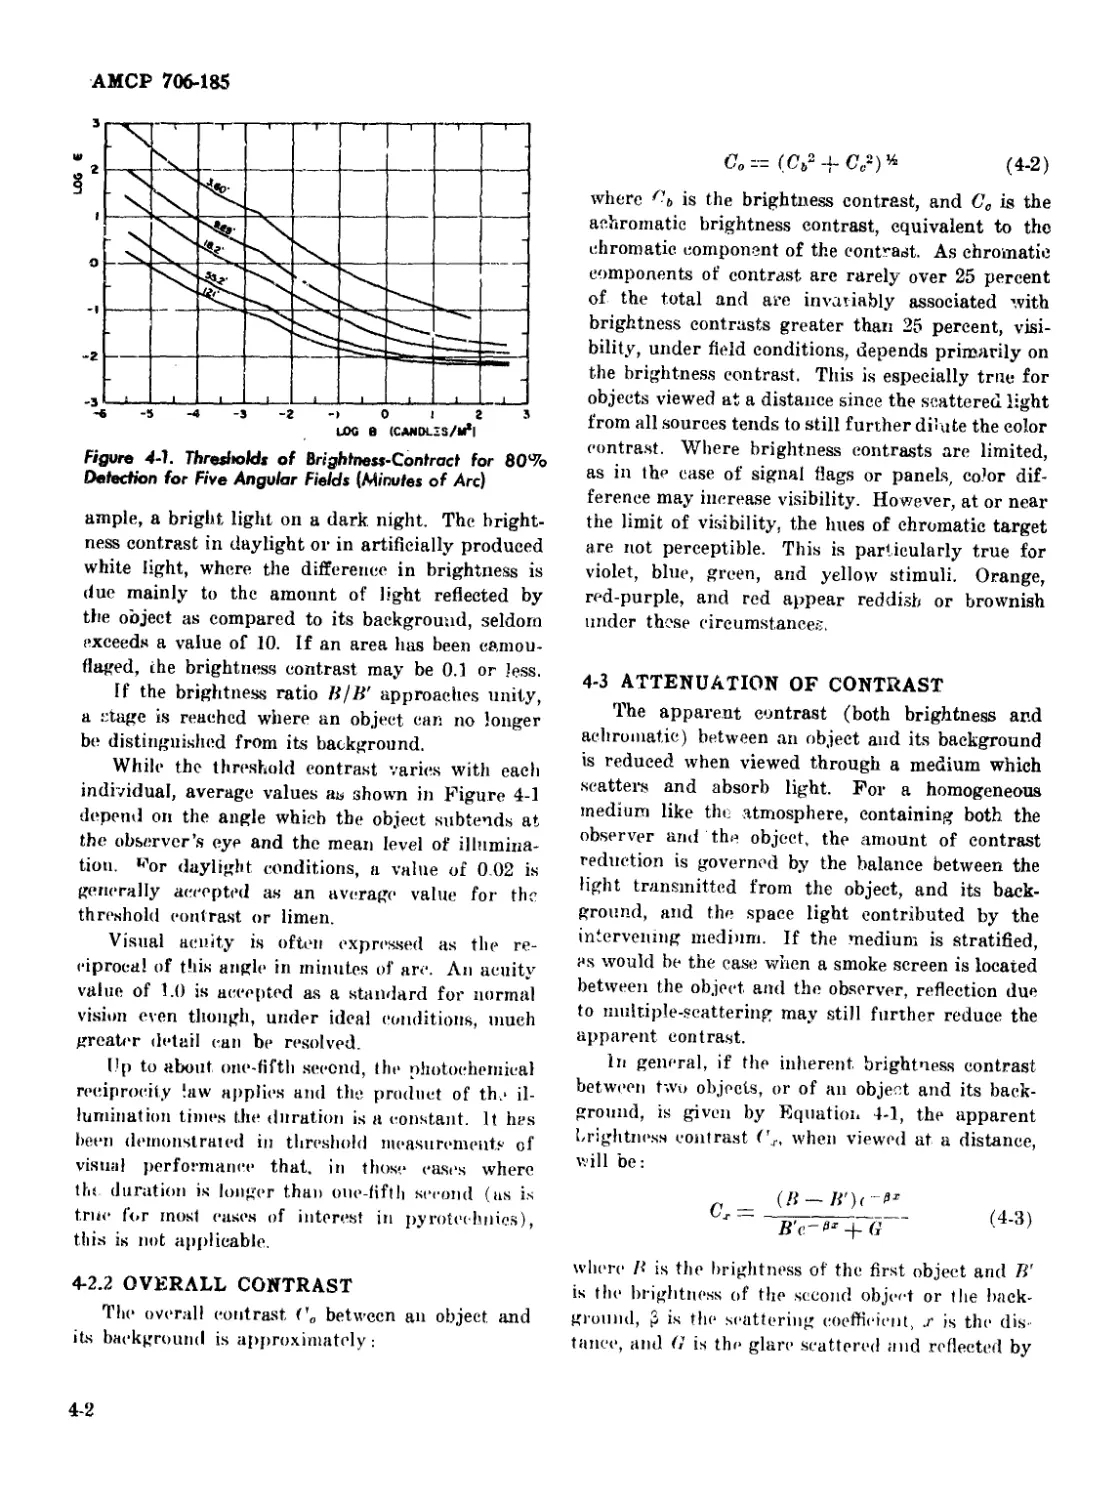
4-2 Vision .................................................. 4-1
4-2.1 Brightness Contrast ................................ 4-1
4-4.2 Overall Contrast ................................... 4-2
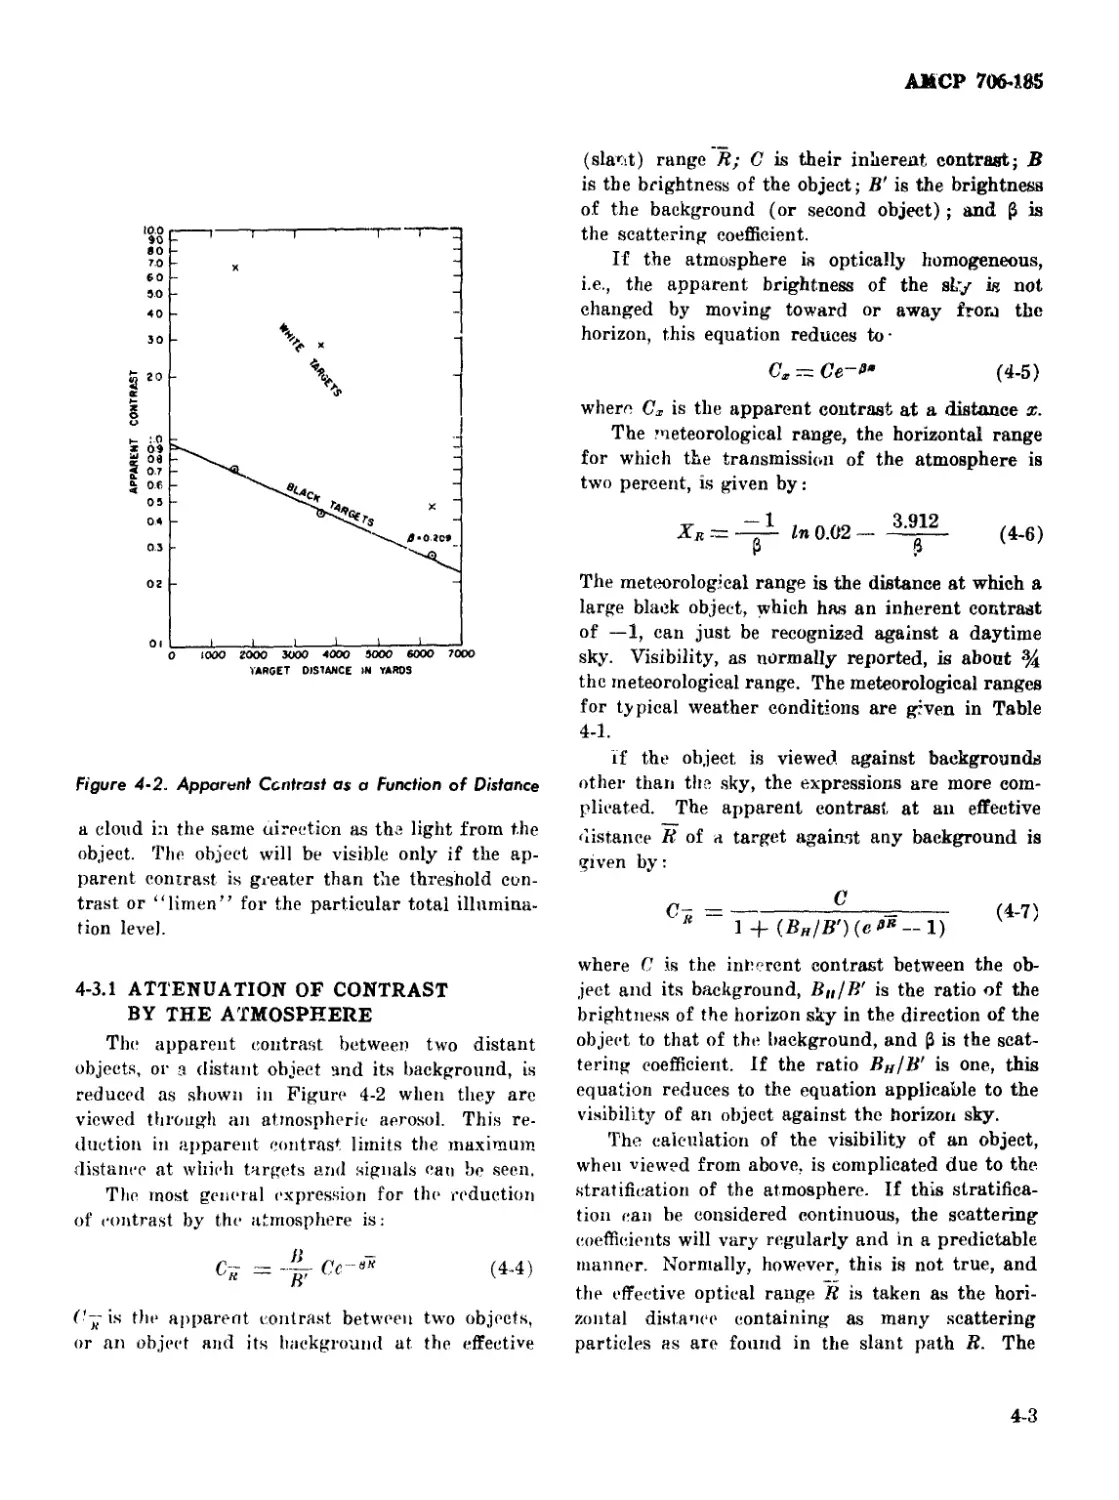
4-3 Attenuation of Contrast ............................... 4-2
4-3.1 Attenuation of Contrast by the Atmosphere........... 4-3
4-3.2 Obscuration of Vision by Artificial Smoke Clouds.... 4-4
4-4 Visibility of Targets and Signals ....................... 4-6
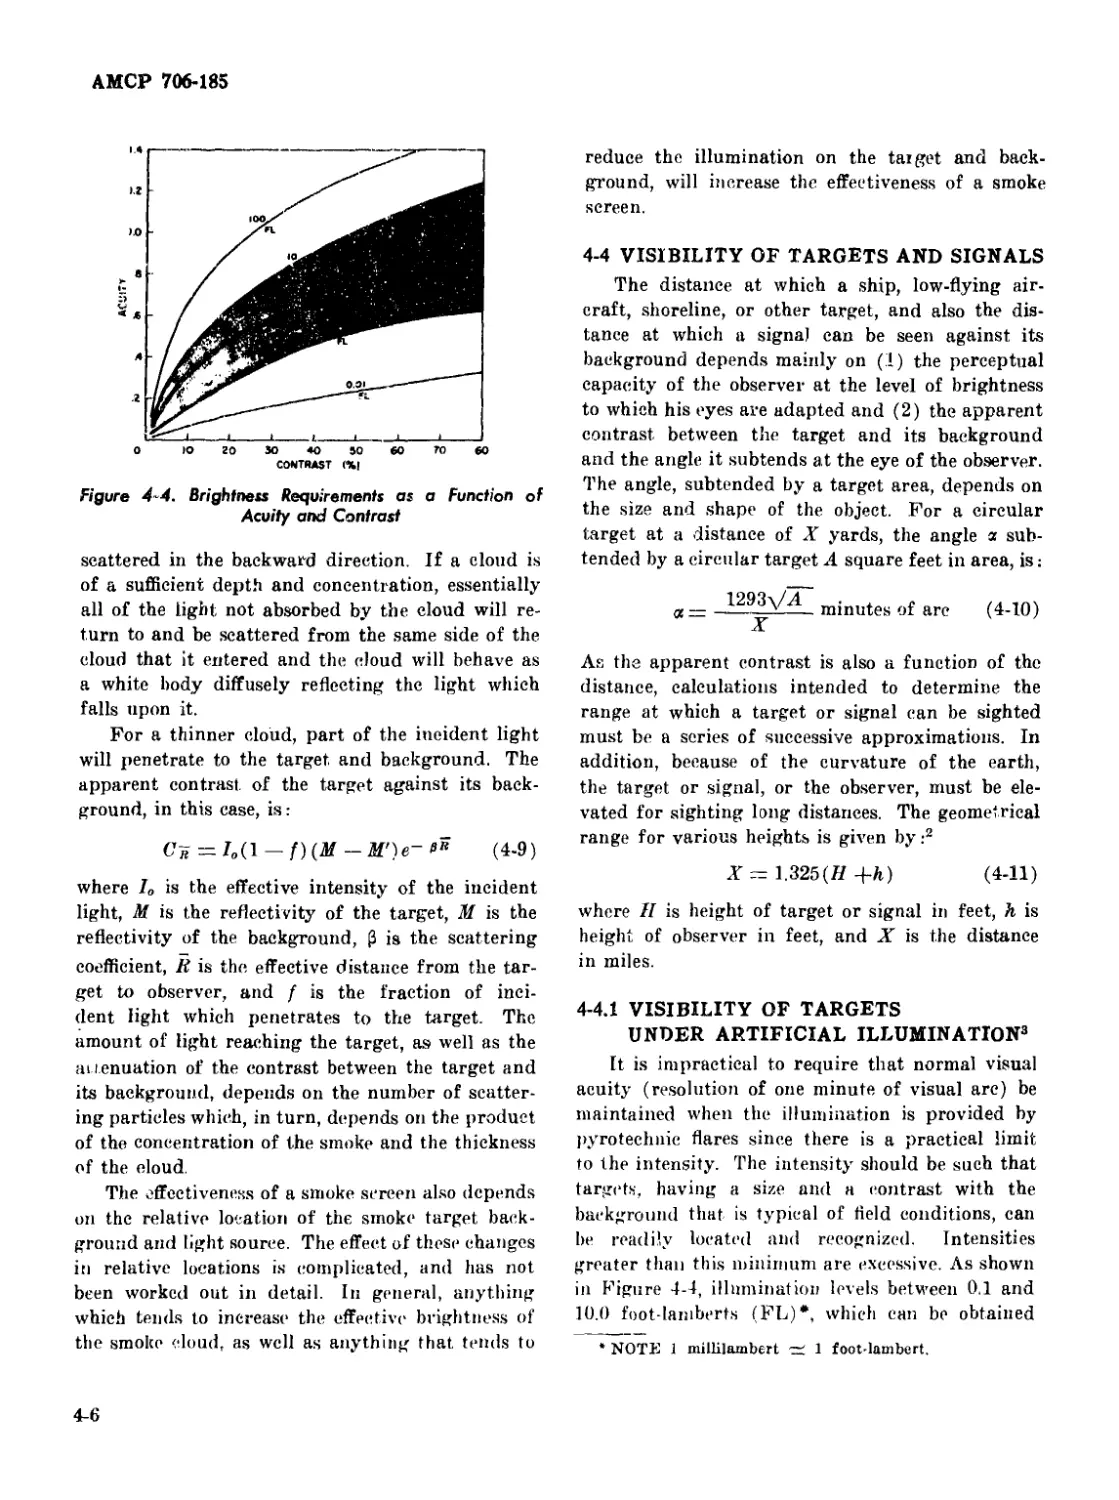
4-4.1 Visibility of Targets Under Artificial Illumination ... 4-6
4-4.2 Visibility of Signals .............................. 4-8
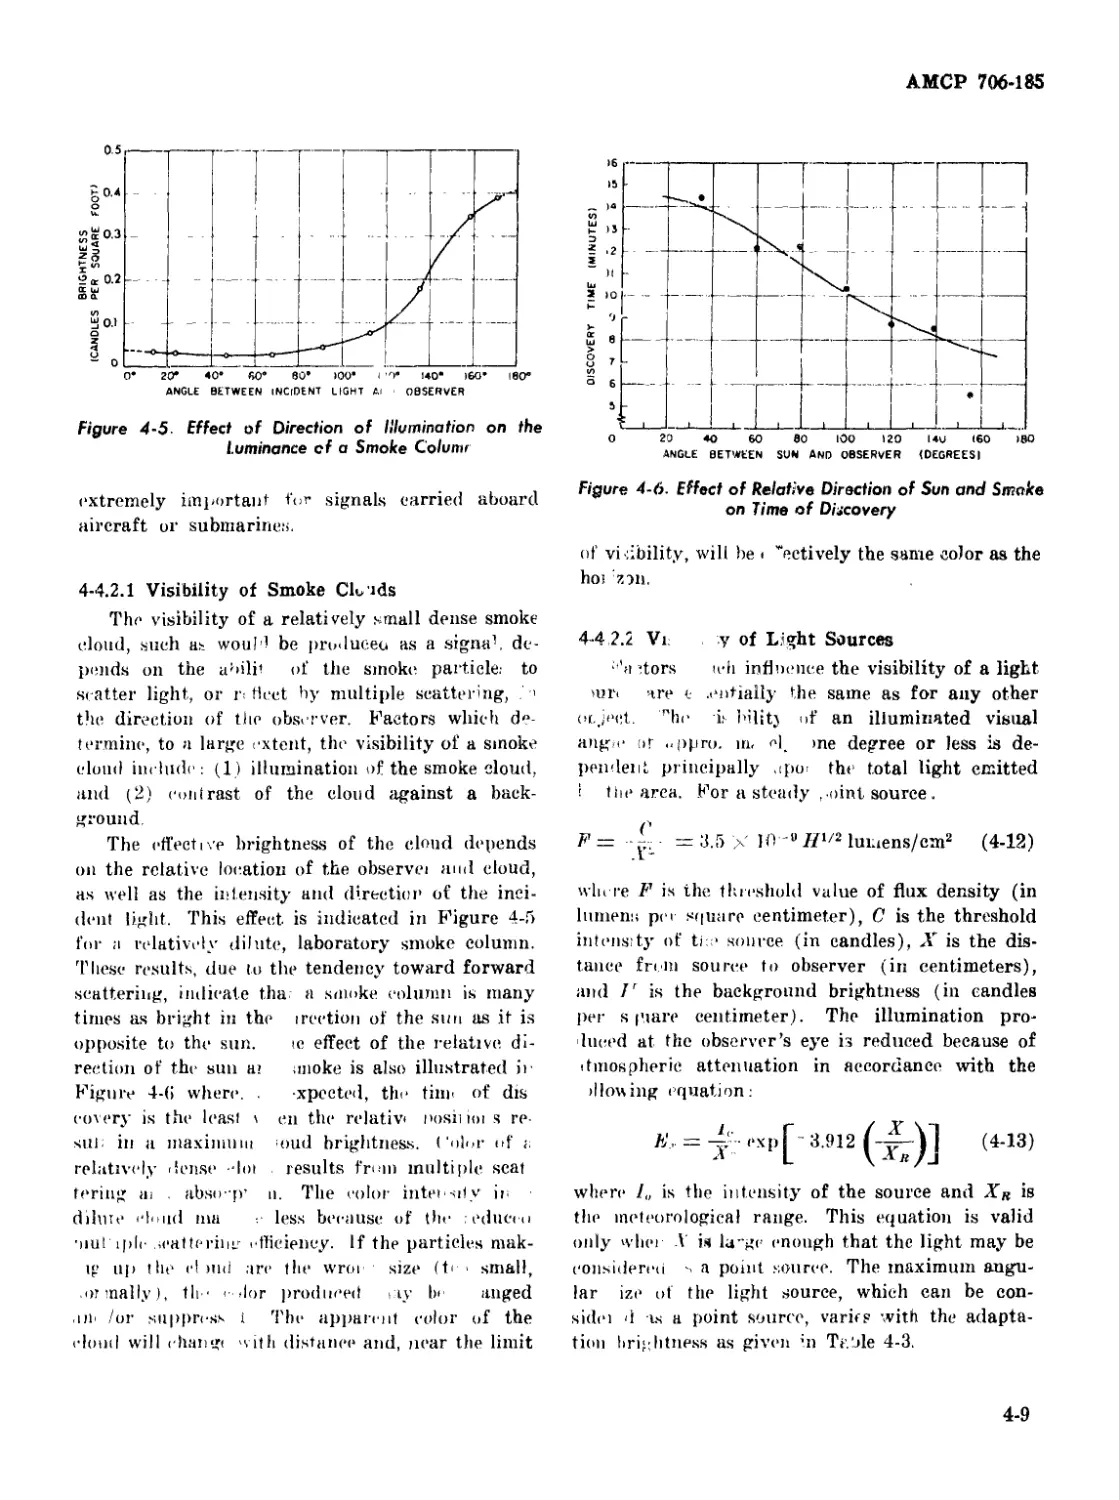
4-4.2.1 Visibility of Smoke Clouds ...................... 4-9
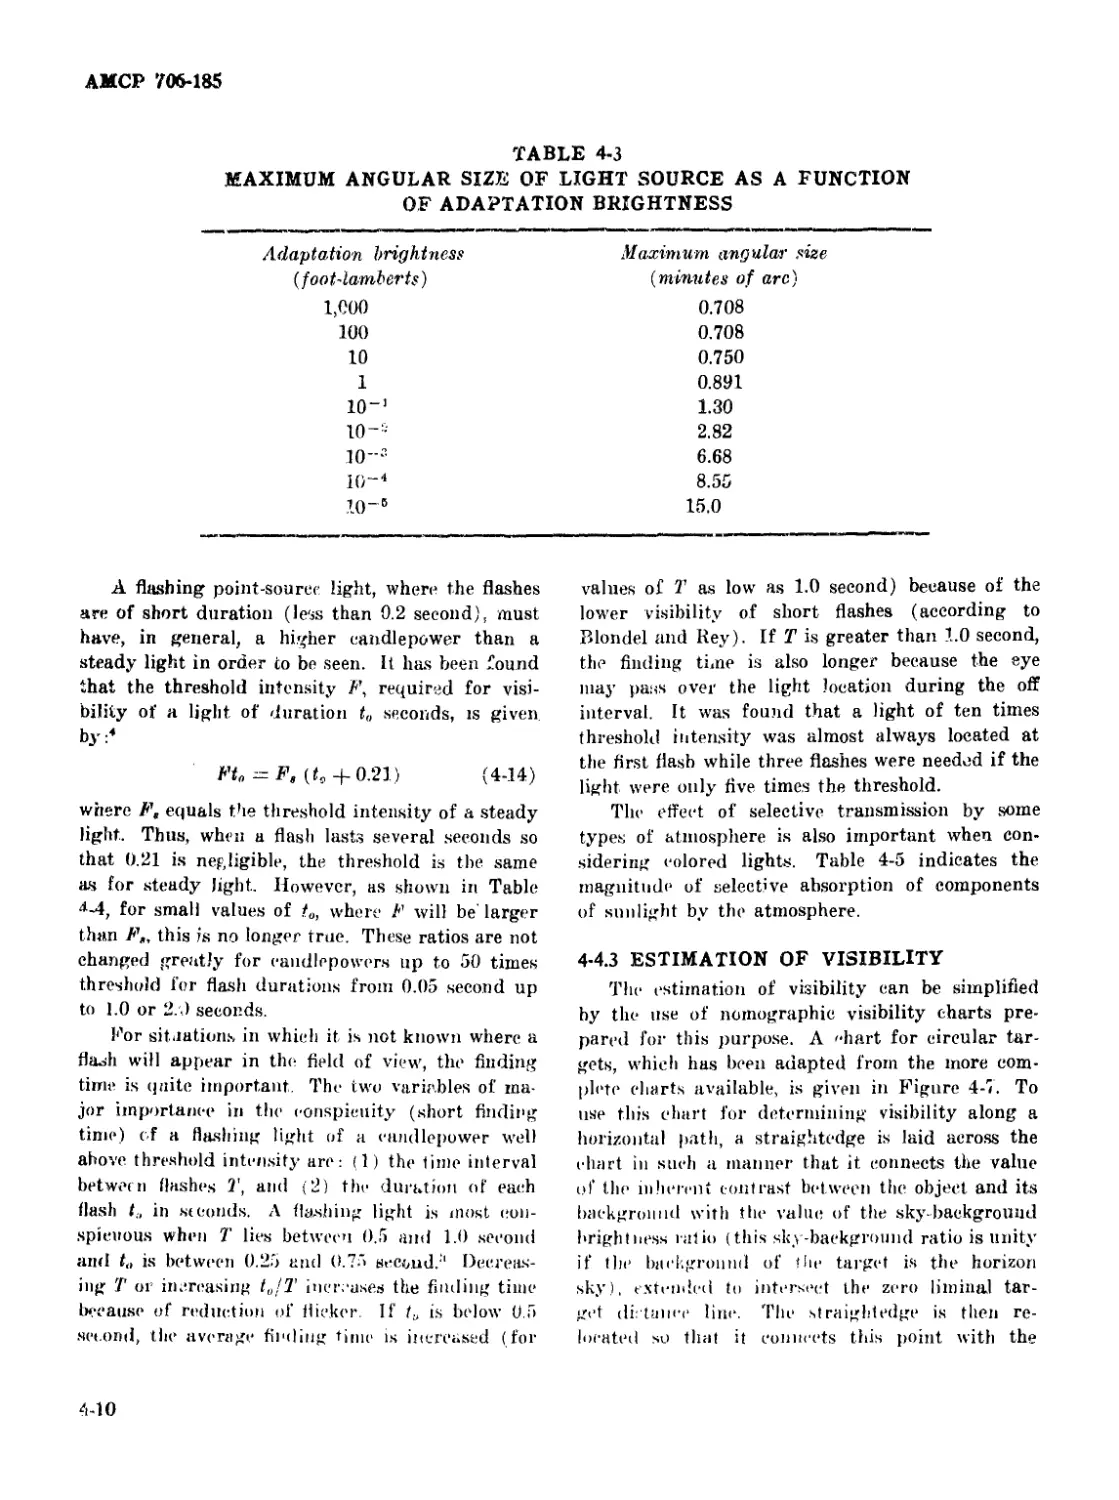
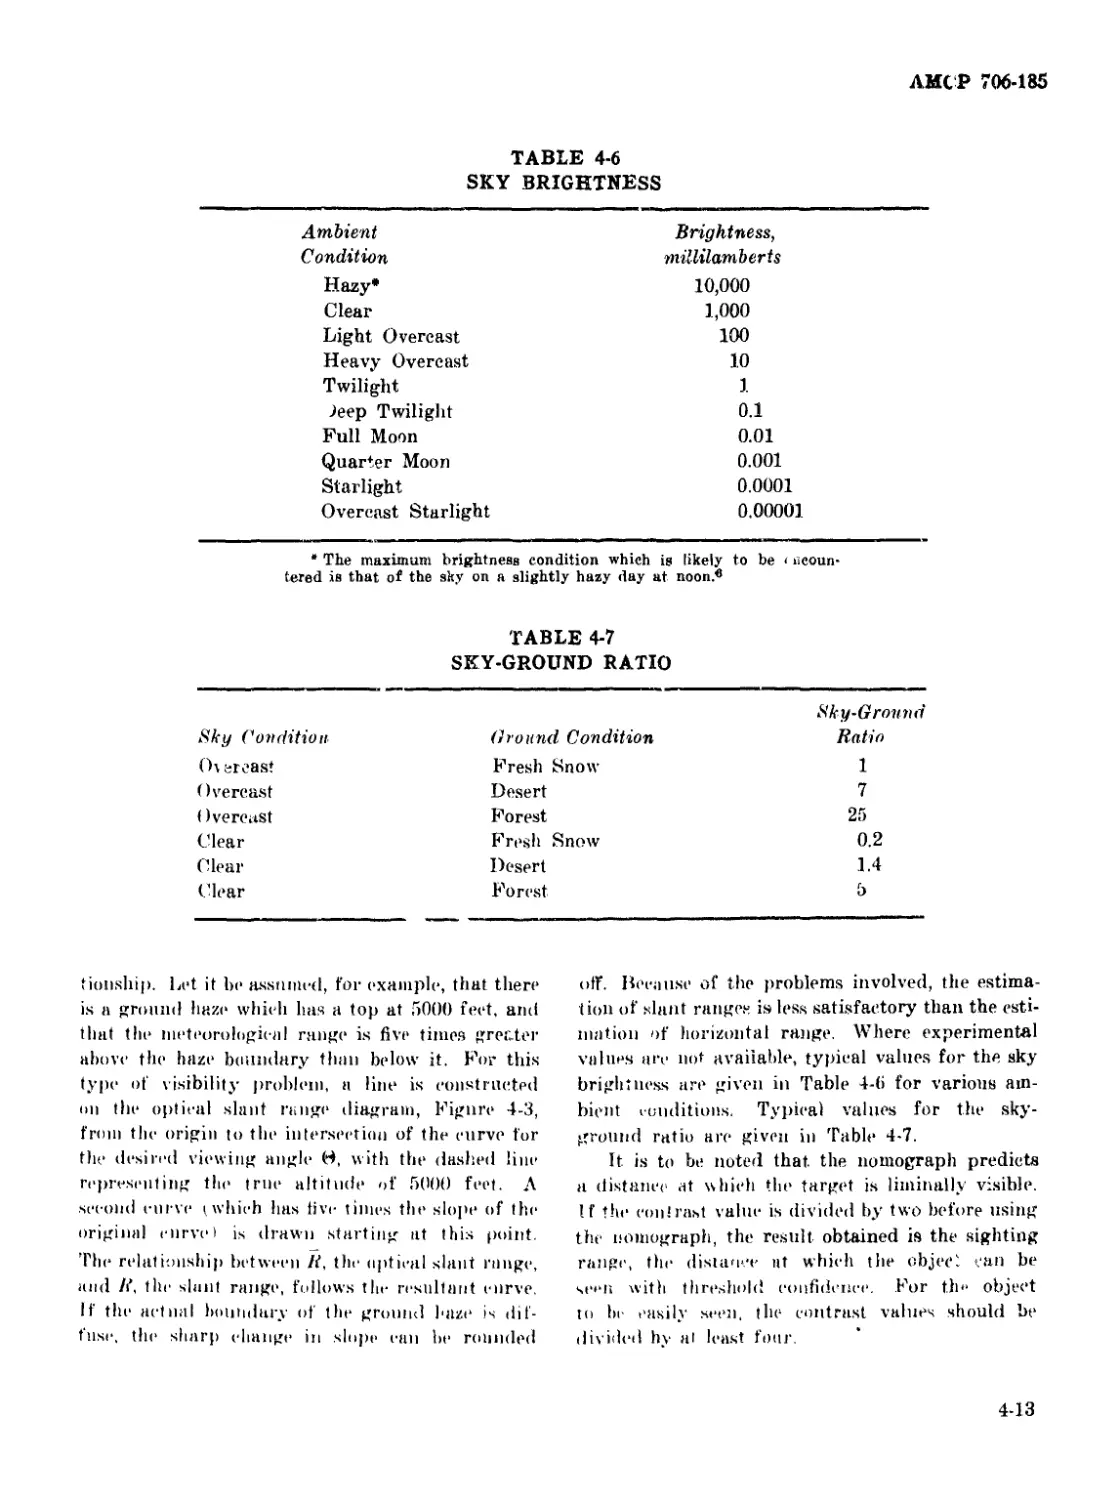
4-4.2.2 Visibility of Light Sources...................... 4-9
4-4.3 Estimation of Visibility ........................... 4-10
4-4.4 Illustrative Examples .............................. 4-15
REFERENCES ............................................ 4-18
CHAPTER 5
PRODUCTION OF HEAT
5-1 Historical Summary...................................... 5-1
5-2 Introduction ........................................... 5-5
5-3 Theory ................................................. 5-5
5-3.1 Amount of Energy Released........................... 5-6
5-3.2 Heat Transfer ...................................... 5-7
5-3.2.1 Conduction ..................................... 5-9
5-3.2.2 Convection and Radiation....................... 5-10
5-3.3 Heat Effects ...................................... 5-10
5-4 Incendiaries .......................................... 5-11
5-4.1 Small Arms Incendiary Ammunition .................. 5-11
5-4.1.1 Ignition and Combustion of Aircraft Fuels....... 5-13
v
АМСР 706-185
TABLE OF CONTENTS (cont’d)
Paragraph
5-4.1.2
5-4.1 3
5-4.1.3.1
5-4.1.3.2
5-4.1.3.3
5-4.1.3.4
5-4.1.4
5-4.2
5-4.2.1
5-4.2.2
5 4.2.2.1
5-4.2.2.2
5-4.2.2.2.1
5-4.2.2.2.2
5-4.2.2.2.2.1
5-4.2.2.2.2.2
5-4.2.2.2.2.3
5-4.2.2.3
5-4.2.3
5-5
5-5.1
5-5.1.1
5-5.1.1?
5-5.1.1.2
5-5.1.2
5-5.1.2.1
5-5.1.2.2
5-5.1.3
5-5.1.3.1
5-5.1.3.2
5-5.1.3.3
5-5.1.3.4
5-5.1.3.5
5-5.1.3.6
5-5.1.3.7
5-5.1.3.8
5-5.1.3.9
5-5.1.3.19
5-5.1.3.11
5-5.2
5-6
5-6.1
5-6.2
Page
Nature of a Small Arms Incendiary Burst....... 5-14
Small Arms Incendiary Fillers ................... 5-16
Fuels ....................................... 5-17
Oxidizers.................................... 5-17
Binders, Lubricants, and Other Incendiary
Mixture Additives............................ 5-19
Typical Compositions....................4 ... 5-20
Typical Small Arms Incendiary Bullets............ 5-20
Incendiaries for Ground Application .................. 5-21
Ignition and Combustion of Ground Targets........ 5-21
Incendiary Compositions ......................... 5-22
Metal-Based Ground Incendiaries ............. 5-22
Liquid Fuel-Based Incendiaries .............. 5-24
Liquid Incendiaries ..................... 5-25
Solidified Liquid Incendiaries .......... 5-25
Rubber Thickeners .................. 5-26
Napalm Thickeners .................. 5-26
Methacrylate Thickeners ............ 5-27
Other Incendiaries .......................... 5-28
Typical Incendiary Devices ...................... 5-28
Delay Compositions and Heat Powders ...................... 5-29
Pyrotechnic Delays ................................ 5-29
Delay Elements .................................. 5-29
Obturated Delay Elements .................... 5-30
Vented Delay Elements........................ 5-30
Delay Compositions .............................. 5-30
Black Powder Delays ......................... 5-31
Typical Gasless Compositions................. 5-32
Factors Affecting Performance ................... 5-32
Composition ................................. 5-33
External Pressure ........................... 5-34
External Temperature......................... 5-35
Terminal Charge, Anticipatory Effect......... 5-36
Particle Size................................ 5-36
Ignition Compositions ....................... 5-37
Column Diameter ............................. 5-37
Loading Pressure ............................ 5-38
Housing Material ............................ 5-39
Acceleration ................................ 5-43
Storage ................................... 5-43
Heat Powders ......................................., 5-45
Initiators, First Fires, and Starters..................... 5-45
Prime Ignition........................................ 5-45
Characteristics of Ideal Igniter, First Fire, and
Starter Compositions ................................ 5-46
vi
АМСР 706-185
TABLE OF CONTENTS (cont’d)
Paragraph Page
5-6.3 Typical Compositions............... 5-48
REFERENCES ............................... 548
CHAPTER 6
PRODUCTION OF LIGHT
6-1 Historical Summary......................................... 6-1
6-1.1 Consolidated Illuminants............................... 6-1
6-1.1.1 Flares and Signals ............................... 6-1
6-1.1.2 Tracers .......................................... 6-2
6-1.2 Nonconsolidated Illuminants ........................... 6-5
6-1.2.1 Photoflash Devices................................ 6-5
6-1.2.1.1 Photoflash Bombs.............................. 6-5
6-1.2.1.1.1 Composition Type.......................... 6-5
6-1.2.1.1.2 Dust Type................................. 6-6
6-1.2.1.1.3 Segregated Oxidant Type ............... 6-7
6-1.2.1.2 Photoflash Cartridges......................... 6-7
6-1.2.2 Spotting Charges ................................. 6-8
6-2 Theory of Light and Color.................................. 6-8
6-2.1 Behavior of Light...................................... 6-8
6-2.2 Spectral Distribution ................................. 6-9
6-2.2.1 Discrete Spectra ................................. 6-9
6-2.2.1.1 Line Spectra ................................. 6-9
6-2.2.1.2 Band Spectra ................................ 6-10
6-2.2.2 Continuous Spectra .............................. 6-11
6-2.3 Radiation Sources..................................... 6-11
6-2.3.1 Thermal Radiation Sources........................ 6-11
6 2.3.1.1 Blackbody ................................... 6-11
6-2.3.1.2 Graybody .................................... 6-12
6-2.3.1.3 Incandescent Sources ........................ 6-12
6-2.3.2 Luminescence .................................... 6-13
6-2.3.2.1 Chemiluminescence ........................... 6-14
6-2.3.2.2 Phosphorescence and Fluorescence ............ 6-14
6-2.3.3 Flame Sources .................................. 6-14
6-2.4 Photometry ........................................... 6-14
6-2.4.1 Instruments for Measuring Light Intensity .... 6-15
6-2.1.2 Measurement of the Light Output of Flares..... 6-15
6-2.4.3 Intensity ....................................... 6-16
6-2.4.4 Brightness ...................................... 6-16
6-2.4.5 Illumination .................................... 6-16
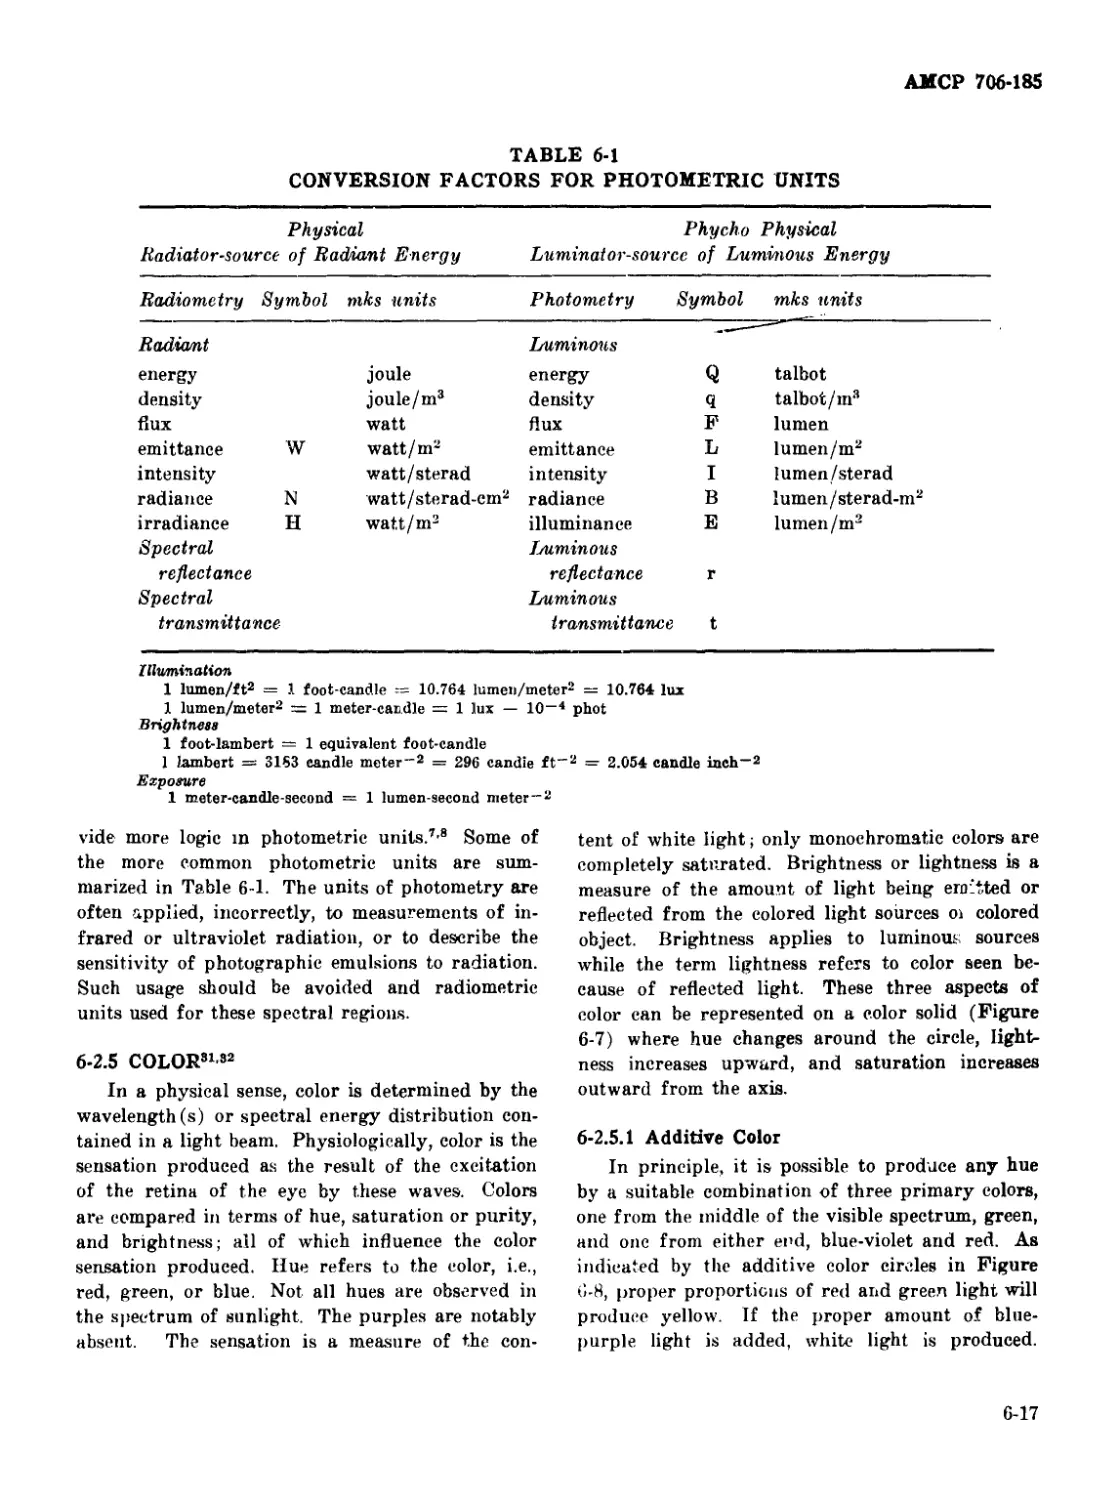
6-2.4.6 Photometric Units................................ 6-16
6-2.5 Color ................................................ 6-17
6-2.5.1 Additive Color................................... 6-17
vii
АМСР 706-135
TABLE OF CONTENTS (cont’d)
Paragraph Page
6-2.5.2 Subtractive Color ................................ 6-18
6-2.5.3 Chromaticity Coordinates ......................... 6-18
6-2.5.4 Munsell Color System ............................. 6-20
6-2.5.5 Color Value..................................... 6-20
6-2.6 Atmospheric Effects ............................... 6-20
6-3 Consolidated Illuminating Devices......................... 6-21
6-3.1 Illuminating Flares ................................ 6-21
6-3.1.1 Aircraft Flares ................................ 6-21
6-3.1.2 Surface Flares................................. 6-23
6-3.2 Illumination Signals................................ 6-23
6-3.2.1 Aircraft Illumination Signals .................. 6-23
6-3.2.2 Ground Illumination Signals .................. 6-24
6-3.3 Tracers .............................................. 6-24
6-3 4 Typical Compositions.................................. 6-27
6-3.5 Factors Affecting Performance......................... 6-27
6-3.5.1 Heat of Reaction.................................. 6-30
6-3.5.2 Composition ...................................... 6-33
6-3.5.3 Emitters ......................................... 6-33
6-3.5.4 Color Intensifiers ............................... 6-37
6-3.5.5 Binders .......................................... 6-38
6-3.5.6 Particle Size..................................... 6-39
6-3.5.7 Consolidation .................................... 6-41
6-3.5.8 Flare Diameter .................................... 6 43
6-3.5.9 Case Materials and Coating ....................... 6-43
6-3.5.10 Temperature and Pressure ......................... 6-45
6-3.5.11 Rotational Spin .................................. 6-47
6-3.5.12 Moisture and Stability ........................... 6-49
6-4 Noncousolidated Illnniinant Charges .................... 6-52
6-4.1 Aerial Photographic llluminants...................... 6-53
6-4,1.1 Photoflash Cartridges............................. 6-54
6-4.1.2 Photoflash Bombs ................................. 6-54
6-4,1.3 Other Photographic Ilhiminaiit Systems ........... 6-54
6-4.2 Spotting Charges...................................... 6-55
6-4.2.1 Small Arm Spotting Rounds ........................ 6-55
6-4.2.2 Tracking ........................................ 6-55
6-4.2 3 Indication of Functioning......................... 6-56
6-4.3 Typical Compositions.................................. 6-56
6-4.4 Light Production ..................................... 6-56
6-4 4.1 Light Output Characteristics...................... 6-57
6-4.4.1.1 Time Intensity................................ 6-57
6 1.4.1.2 Spectral Distribution ........................ 6-58
6.4.4.2 Nature of the Photoflash Burst ................. 6-58
6-4.5 Factors Affecting Performance ........................ 6-61
( -4.5.1 Charge Weight .................................... 6-61
6-4.5.2 Composition ...................................... 6-62
viii
АМСР 706-185
TABLE OF CONTENTS (cont’d)
Paragraph Page
6-4.5.3 Particle Size .......................... 6-64
6-4.5.4 Cloud Shape ............................. 6-65
6-4.5.5 Bursters and Igniters.................... 6-66
6-4.5.6 Confinement ............................. 6-67
6-4.5.7 Ambient Pressure ........................ 6-69
REFERENCES ...................................... 6-70
CHAPTER 7
PRODUCTION OF SMOKE
7-1 Historical Summary, General................................. 7-1
7-1.1 Screening Smokes....................................... 7-1
7-1.2 Signal Smokes.......................................... 7-3
7-1.3 Tracking and Acquisition Smokes....................... 7-4
7-2 Properties of Smoke......................................... 7-4
7-2.1 Properties of Particulate Clouds....................... 7-5
7-2.1.1 Optical Properties of Particulate Clouds........... 7-7
7-2.1.2 Properties of Particulate Clouds Affecting Their
Stability ...................................... 7-7
7-2.1.2.1 Motion of Smoke Particles ..................... 7-7
7-2.1.2.1.1 Sedimentation ............................. 7-7
7-2.1.2.1.2 Diffusion ................................. 7-8
7-2.1.2.2 Evaporation and Condensation .................. 7-8
7-2.1.2.3 Coagulation and Agglomeration ................. 7-8
7-2.2 Travel and Persistence of Particulate Clouds........... 7-9
7-2.2.1 Meteorological Factors............................. 7-9
7-2.2.1.1 Wind Speed and Direction ..................... 7-9
7-2.2.1.2 Turbulence ................................... 7-9
7-2.2.1.3 Thermal Gradient ............................. 7-10
7-2.2.2 Stability of Aerosol Clouds Under Various
Meteorological Conditions ..................... 7-10
7-2.2.2.1 Stable Conditions ............................ 7-10
7-2.2.2.2 Unstable Conditions .......................... 7-11
7-2.2.2.3 Estimation of Atmospheric Diffusion ....... 7-11
7-2.3 Specific Properties of Military Smokes ............... 7-12
7-2.3.1 Screening Smokes ................................. 7-12
7-2.3.2 Signal Smokes .................................... 7-13
7 2.3.3 Tracking and Acquisition Smokes................. 7-13
7-2.3.4 Smoke for Dissemination of Agents.............. 7-13
7-3 Dissemination Techniques .................................. 7-14
7-3.1 Formation of th > Dispersed Phase................... 7-14
7-3.1.1 Vapor Condensation Processes.................... 7-14
ix
АМСР 706-185
TABLE OF CONTENTS (cont’d)
Paragraph Page
7-3.1.2 Dispersion Processes............................... 7-14
7-3.1.3 Combined Processes .............................. 7-15
7-3.2 Military Production of Smoke ............................ 7-16
7-3.3 White Smokes ............................................ 7-16
7-3.3.1 Oil Smoke.......................................... 7-17
7-3.3.1.1 Venturi Thermal Generators ..................... 7-17
7-3.3.1.1.1 Operation of Venturi Thermal Generators 7-17
7-3.3.i.1.2 Fuel Blocks ............................... 7-18
7-3.3.1.1.3 Typical Venturi Thermal Generators .... 7-20
7-3.3.1.2 Other Methods for Producing Oil Smoke........... 7-20
7-3.3.2 Phosphorus Smokes .................................. 7-21
7-3.3.2.1 White Phosphorus................................ 7-21
7 3.3.2.2 Burning-Type Mixtures Containing Red
Phosphorus................................... 7-22
7-3.3.2.3 Metal Phosphides ............................... 7-22
7-3.3.2.4 Other Reactions for Producing Smokes
Containing Phosphorus ....................... 7-22
7-3.3.2.5 Typical Devices .............................. 7-23
7-3.3.3 Metal Chloride Smokes ............................. 7-23
7-3.3.3.1 Liquid Metal Chloride.0 ........................ 7-23
7-3.3.3.1.1 FM Smokes ................................. 7-23
7-3.3.3.1.2 Silicon Tetrachloride ..................... 7-24
7-3.3.3.1.3 Stannic Chloride........................... 7-25
7-3.3.3.2 Solid Metal Chlorides .......................... 7-25
7-3.3.3.2.1 HC Smokes ................................. 7-25
7-3.3.3.2.2 Chemistry of HC Smoke Mixtures............. 7-25
7-3.3.3.3 Modified HC Smokes ............................. 7-27
7-3.3.3.4 Zin<- Ilexaehlorobenzene-Potassium Perchlorate
System....................................... 7-27
7-3.3.3.5 Typical Devices ............................... 7-28
7-3.3.4 Sulfuric Acid Smokes ............................... 7-28
7-3.3.4.1 Sulfur Trioxide ............................... 7-29
7-3.3.4.2 Oleum ........................................ 7-29
7.3.3.4.3 Chlorosuifonic Acid ............................ 7-29
7.3.3.4.4 Sulfuryl Chloride .............................. 7-30
7.3.3,4.5 FS Smoke , ..................................... 7-30
7-3.3.5 Smoke-Producing Reactions Involving Ammonia
or Amines ....................................... 7-30
7-3.3.5.1 Ammonium and Amine Salts of Volatile Acids 7-30
7-3.3.5.2 Metal Chlorides and Ammonia..................... 7-30
7-3.3.5.2.1 Hydrogen Chloride and Ammonia ............. 7-30
7-3.3.5.2.2 Titanium Tetrachloride and Ammonia . . . 7-30
7-3.3.5.2.3 Silicon Tetrachloride, Ammonia, and
Water .................................. 7-31
7-3.3.5.3 Sulfur Coiupotinds and Ammonia.................. 7-31
x
АМСР 706-185
TABLE OF CONTENTS (cont’d)
Paragraph Page
7-3.3.5.3 1 Sulfur Trioxide and Ammonia or Amines 7-31
7 3.3.5.3.2 Chlorosulfonic Acid and Ammonia or
Amines ................................ 7-31
7-3.3.5.3.3 Sulfuryl Chloride and Ammonia or Amines 7-31
7-3.3.6 Sulfur Smokes...................................... 7-31
7-3.3.7 Organic Metallic Compounds ........................ 7-31
7-3.3.8 Comparison of White Smokes..................... 7-32
7-3.4 Colored Smokes......................................... 7-33
7-3.4.1 Dyes .............................................. 7-33
7-3.4.2 Fuels ............................................. 7-39
7-3.4.3 Oxidants .......................................... 7-39
7-3.4.4 Cooling Agents .................................... 7-40
7-3.4.5 Binders ........................................... 7-40
7-3.4.6 Evaluation of Colored Smokes....................... 7-40
7-3.4.7 Sensitivity of Colored Smoke Mixtures............ 7-40
7-3.4.8 Toxieity of Colored Smoke Mixture.................. 7-41
7-3.4.9 Typical Devices.................................... 7-41
7-3.4.10 Direct Volatilization of Dye....................... 7-41
7-3.4.11 Colored Smoke from Solution of Dyes................ 7-43
7-3.4.12 Black Smoke ....................................... 7-44
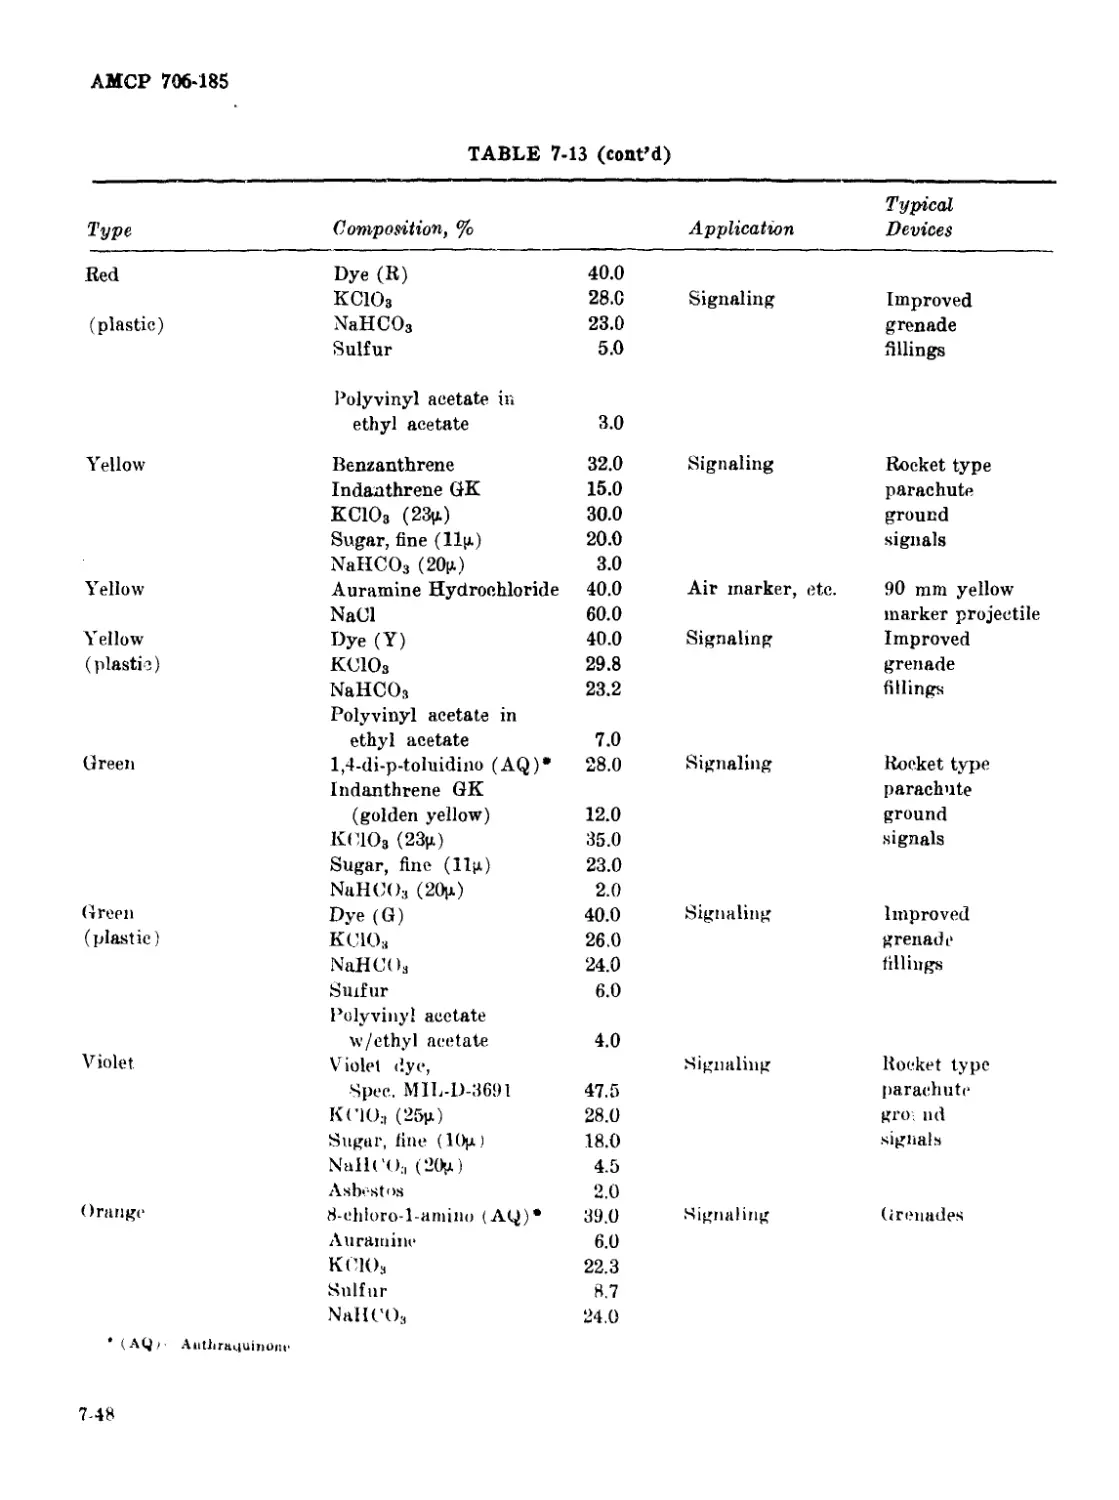
7-3.4.13 Explosive-Type Colored Smoke Bursts................ 7-45
7-3.4.13.1 Propellant Bursters .......................... 7-46
7-3.4.13.2 High Explosive Bursters....................... 7-46
7-3.4.14 Typical Mixtures .................................. 7-46
7-3.5 Agent Aerosols ........................................ 7-46
REFERENCES ................................................ 7-49
xi
АМСР 706-185
LIST OF ILLUSTRATIONS
Figure. No. Title Page
3-1 Compressibility Factors as a Function of Reduced Pressure .... 3-3
3-2 Cubic Lattices .....................................-............. 3-6
3-3 Effect of Temperature on Enthalpy Change for a Chemical
Reaction .................................................... 3-12
3-4 Enthalpy of Aluminum Oxide Versus Temperature ................... 3-20
3-5 Enthalpy of Products of Magnesium-Air Reaction .................. 3-21
3-6 Enthalpy of Products of Magnesium-Sodium Nitrate Flare
(Reaction 1) ................................................ 3-23
3-7 Enthalpy of Products of Magnesium-Sodium Nit ite Flare
(Reaction 2) ................................................ 3-23
3-8 Enthalpy of IM-11 Incendiary Mixture ........................... 3-26
3-9 The Relationship Between Heat of Reaction and Heat of
Activation .................................................. 3-26
3-10 Ignition .....-Temperature Plots for a Binary Pyrotechnic
Mixture ..................................................... 3-^8
3-11 Model for Burning of Aluminum Particles ........................ 3-29
3-12 Model for Steady State Progressive Burning ..................... 3-30
3-13 Differential Thermal Analysis Thermocouple Circuit............ 3-31
3-14.1 Thermogravimetrie Curve for the Ingredient Sodium Nitrate .... 3-32
3-14.2 Thermogravimetrie Curve for the Ingredient Magnesium ......... 3-32
3-14.3 Thermogravimetrie Curve for the Ingredient Laminac 4116....... 3-32
3-15.1 Differential Thermal Analysis Curve for the Ingredient Sodium
Nitrate ..................................................... 3-33
3-15.2 Differential Thermal Analysis Curve for the Ingredient Magnesium 3-33
3-15.3 Differential Thermal Analysis Curve for the Ingredient Laminac
1116 ........................................................ 3-33
3-16.1 Differential Thermal Analysis Curve for the Magnesium-Sodium
Nitrate Mixture (Curve I) .......................................... 3-34
3-16.2 Differential Thermal Analysis Curve for the Sodium Nitrate-
Carbon Mixture .............................................. 3-34
3-16.3 Differential Thermal Analysis Curve for the Magnesium-Sodium
Nitrate Mixture (Curve II) .................................. 3-34
3-16.4 Differentia) Thermal Analysis Curve for the Sodium Nitrate-
Laminac Mixture ............................................. 3-34
3-16.5 Differential Thermal Analysis Curve for the Magnesium-Laminac
Mixture .................................................... 3-35
3-17.1 Differential Thermal Analysis Curve for the Magnesium-Sodium
Nitrale-Carbon Composition ........................................... 3-35
3-17.2 Differential Thermal Analysis Curve for the Magnesium-Sodium
Nitrate-Lamin.ie Coniposit’on .................................... 3-35
XII
АМСР 706-185
LIST OF ILLUSTRATIONS (cont’d)
Figure No. Title Page
4-1 Thresholds of Brightness-Contrast for 80% Detection for Five
Angular Fields (Minutes of Are) ........................... 4-2
4-2 Apparent Contrast as a b'unetion of Distance.................... 4-2
4-3 Optical Slant Range Diagram for the Optical Standard Atmosphere 4-5
4-4 Brightness Requirements as a Function of Acuity and Contrast 4-6
4-5 Effect of Direction of Illumination on the Luminance of a
Smoke Column .............................................. 4-9
4-6 Effect of Relative Direction of Sun and Smoke on Time of
Discovery ................................................. 4-9
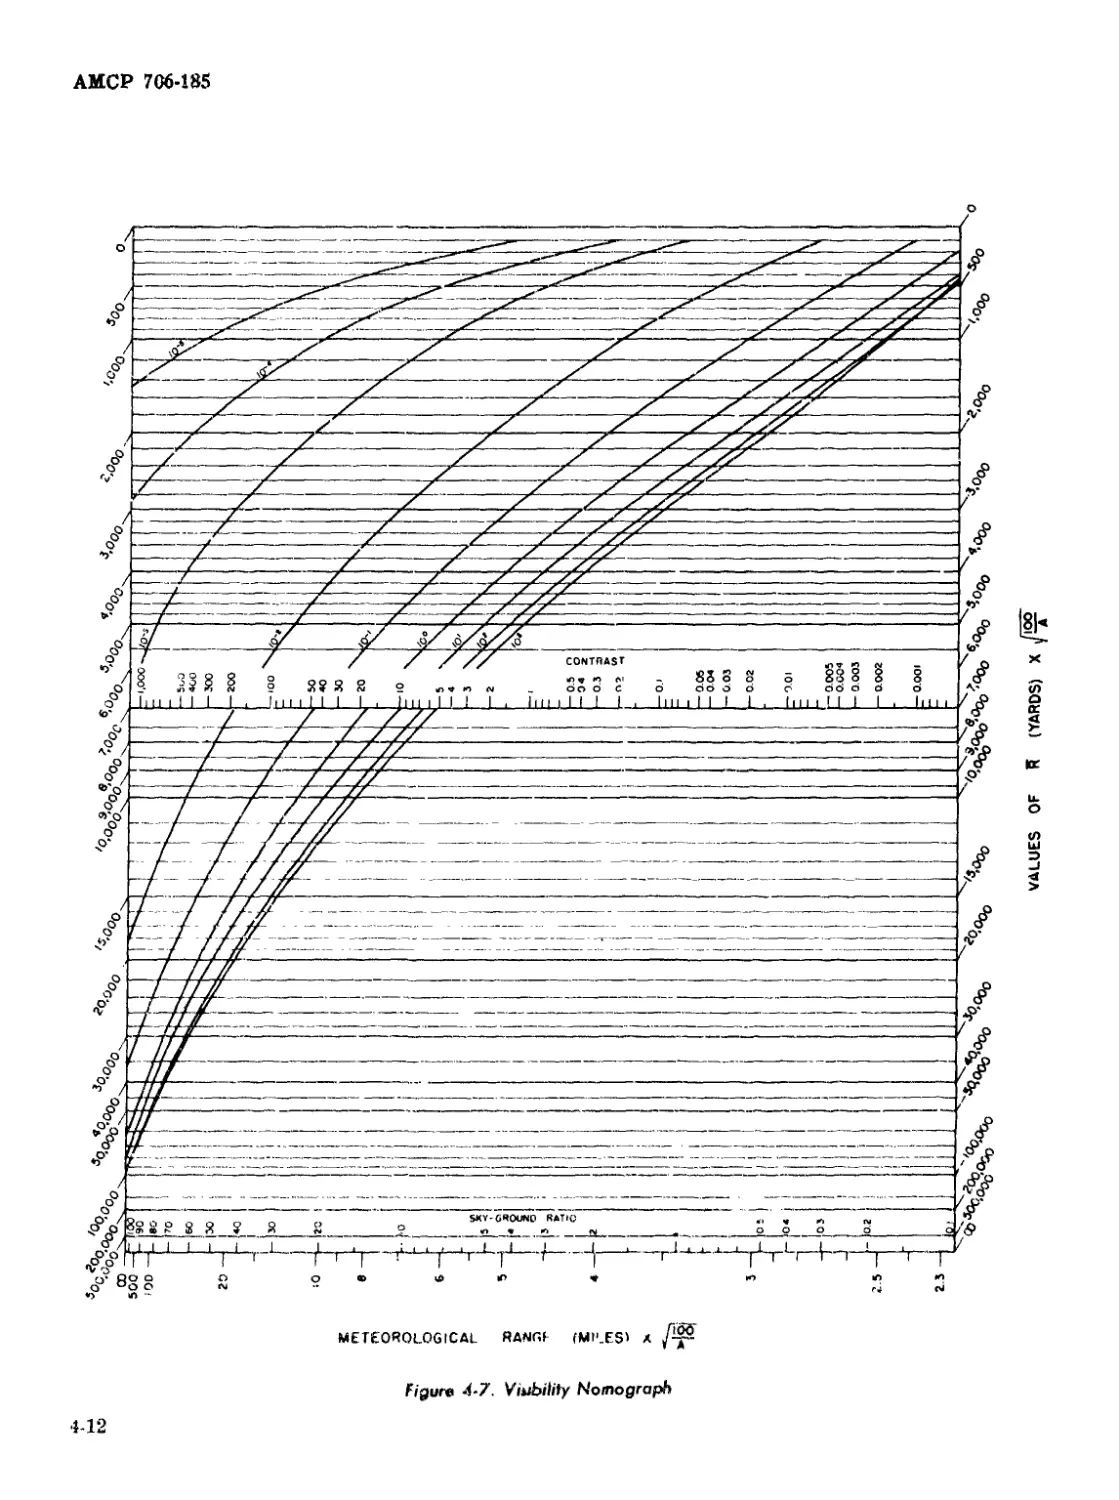
4-7 Visibility Nomograph ........................................ 4-12
4-8 Visibility Nomograph for Signal Lights....................... 4-14
4-9 Visibility Nomograph Showing Calculation .................... 4-16
4-10 Visibility Nomograph for Signal Lights Showing Calculation .... 4-17
5-1 Constant Ignition Probability Regions About a Fuel Jet of
Gasoline or Kerosene ..................................... 5-14
5-2 Maximum Temperature, T, as a Function of Heat of Reaction and
Average Specific Heat, C ......................................... 5-16
5-3 Cooling Time to 800°K as a Function of Temperature and Heat
Capacity, C .................................................... 5-16
5-4 Cooling Time to 800°K as a Function of Heat of Reaction and
Specific Heat, C .......................................... 5-17
5-5 Time-Temperature Histories for IM-11, IM-23, and IM-103........ 5-18
5-6 Cooling Curves for Mixtures Containing Various Particle Sizes
and Shapes of Magnesium-Aluminum 50/50 Alloy.............. 5-19
5-7 Typical Caliber .50 Incendiary Bullet ...................... 5-21
5-8 Typical Caliber .50 Armor-Piercing Incendiary Bullet........ 5-22
5-9 Typical 20 mm Armor-Piercing Incendiary Bullet............. 5-23
5-10 Typical 20 mm High Explosive Incendiary Projectile........ 5-24
5-11 Four-Pound Magnesium Alloy Incendiary Bomb................... 5-2Э
5-12 Four-Pound Thermite Incendiary Bomb ......................... 5-30
5-13 Typical Napalm Bomb ......................................... 5-31
5-14 Typical Incendiary Grenade .................................. 5-32
5-15 Obturated Delay Element ..................................... 5-32
5-16 Sealing of Vented Delay Element.............................. 5-33
5-17 Time Delay Ring or Train, Vented ............................ 5-38
5-18 Total Heat Evolved Versus Burning Time of Binary Barium
Chromate-Boron Compositions Loaded to a Height of 0.79 Inch in
M112 Fuze Housing at 36,000 psi ................................ 5-38
5-19 Burning Time of M112 Fuze Versus External Pressure ........... 5-39
5-20 Burning Time of M112 Fuze Containing 90%; Barium Chromate-
10% Boron Composition Versus Logarithm of Absolute
Temperature .............................................. 5-43
6-1 Emission Spectrum and Energy Levels of Hydrogen Atom .......... 6-10
6-2 Various Types of Spectra and Corresponding Electronic,
Vibrational and Rotational Motion ........................ 6-11
xiii
АМСР 706-185
LIST OF ILLUSTRATIONS (cont’d)
Figure No. Title Page
6-3 Planck’s Law: Radiance as a Function of Wavelength for Various
Temperatures .............................................. 6-12
6-4 Radiant Energy in Different Wavelength Bands as a Function
of Temperature ... ........................................ 6-12
6-5 Isothermal Efficiencies: Fraction of Energy Emitted by an
Isothermal Radiator in Various Wavelength Bands as a Function
of Temperature ........................................... 6-13
6-6 “Optical” Temperatures of a Tungsten Filament ................ 6-13
6-7 Dimensions of the Psychological Color Solid .................. 6-18
6-8 Additive Mixture of Primary Colors ........................... 6-18
6-9 Tristimulus Values of the Spectrum Colors According to the
1931 I.C.I. Standard Observer ............................. 6-19
6-10 C.I.E. Chromaticity Diagram .................................. 6-19
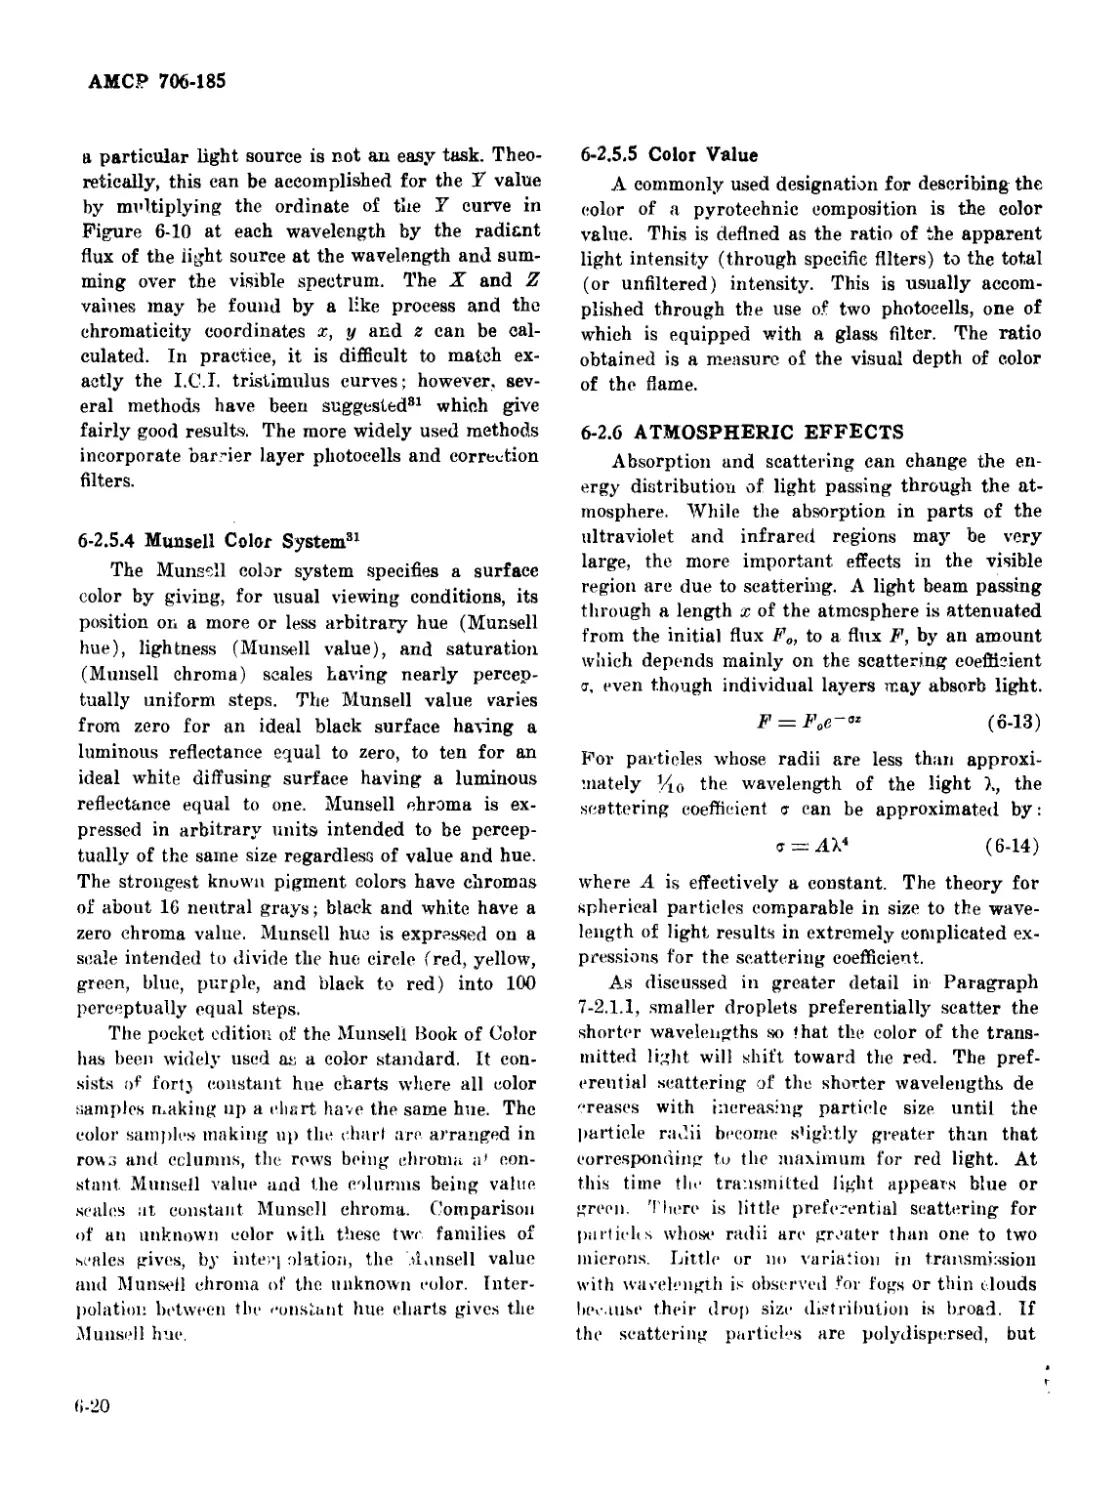
6-11 Illumination Diagram for Parachute Suspended Flare .......... 6-23
6-12 Intensity Curves for Various Parachute Flare Heights ......... 6-24
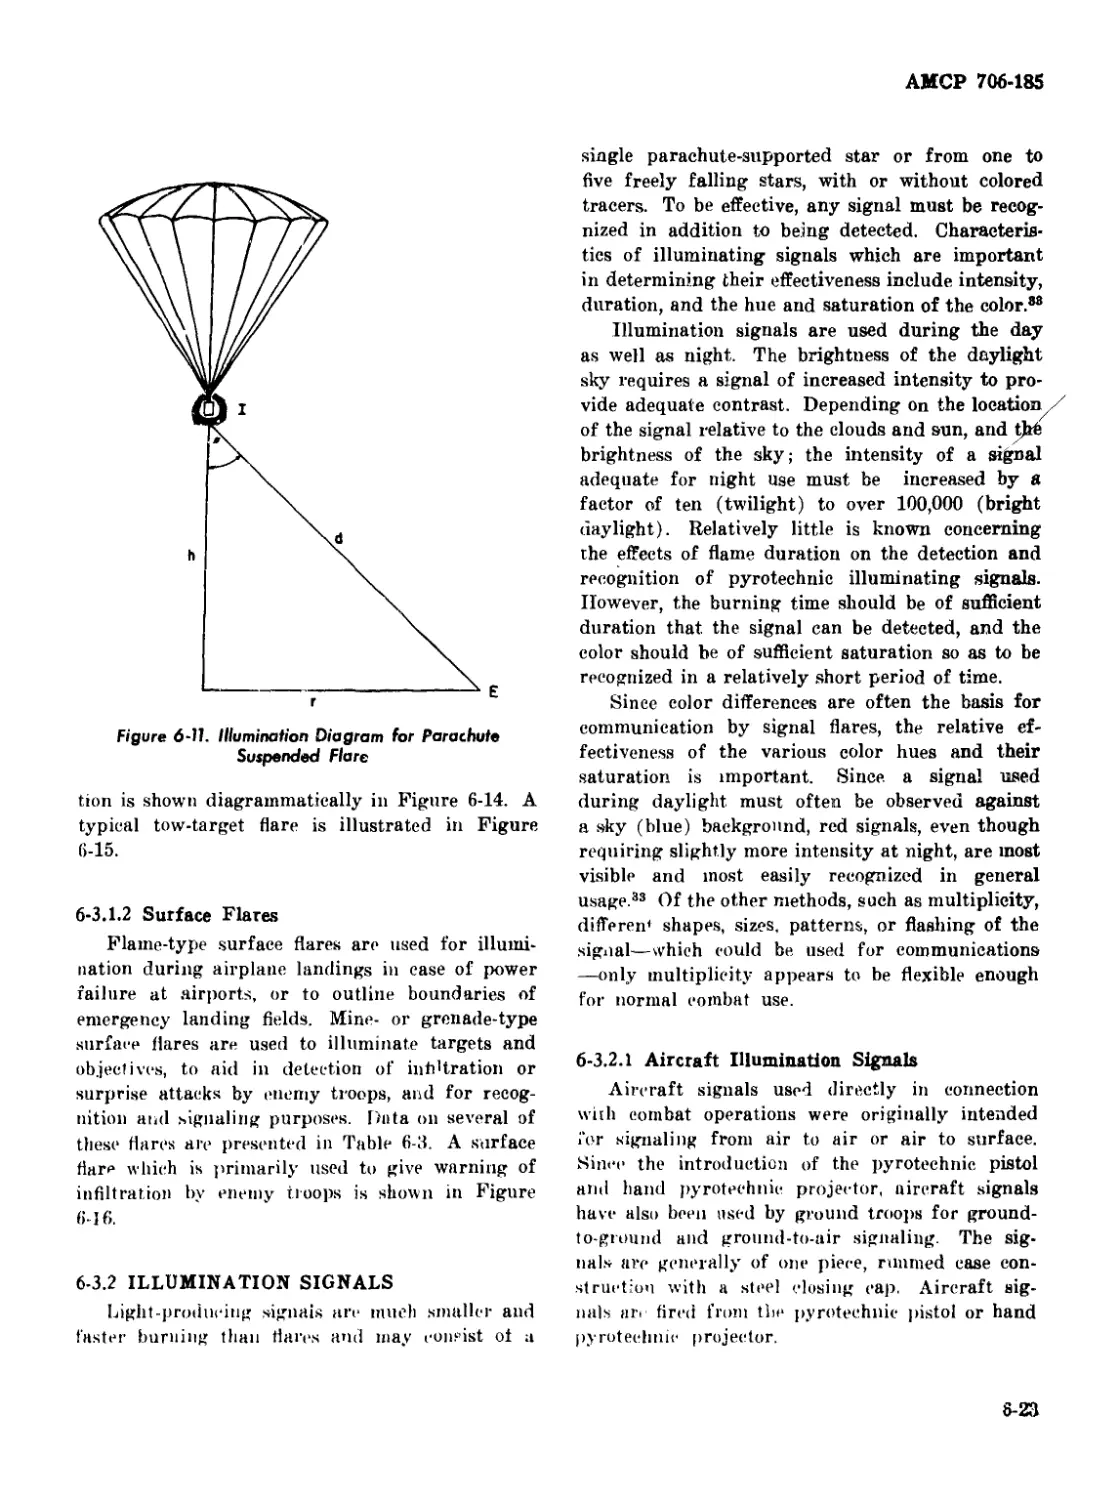
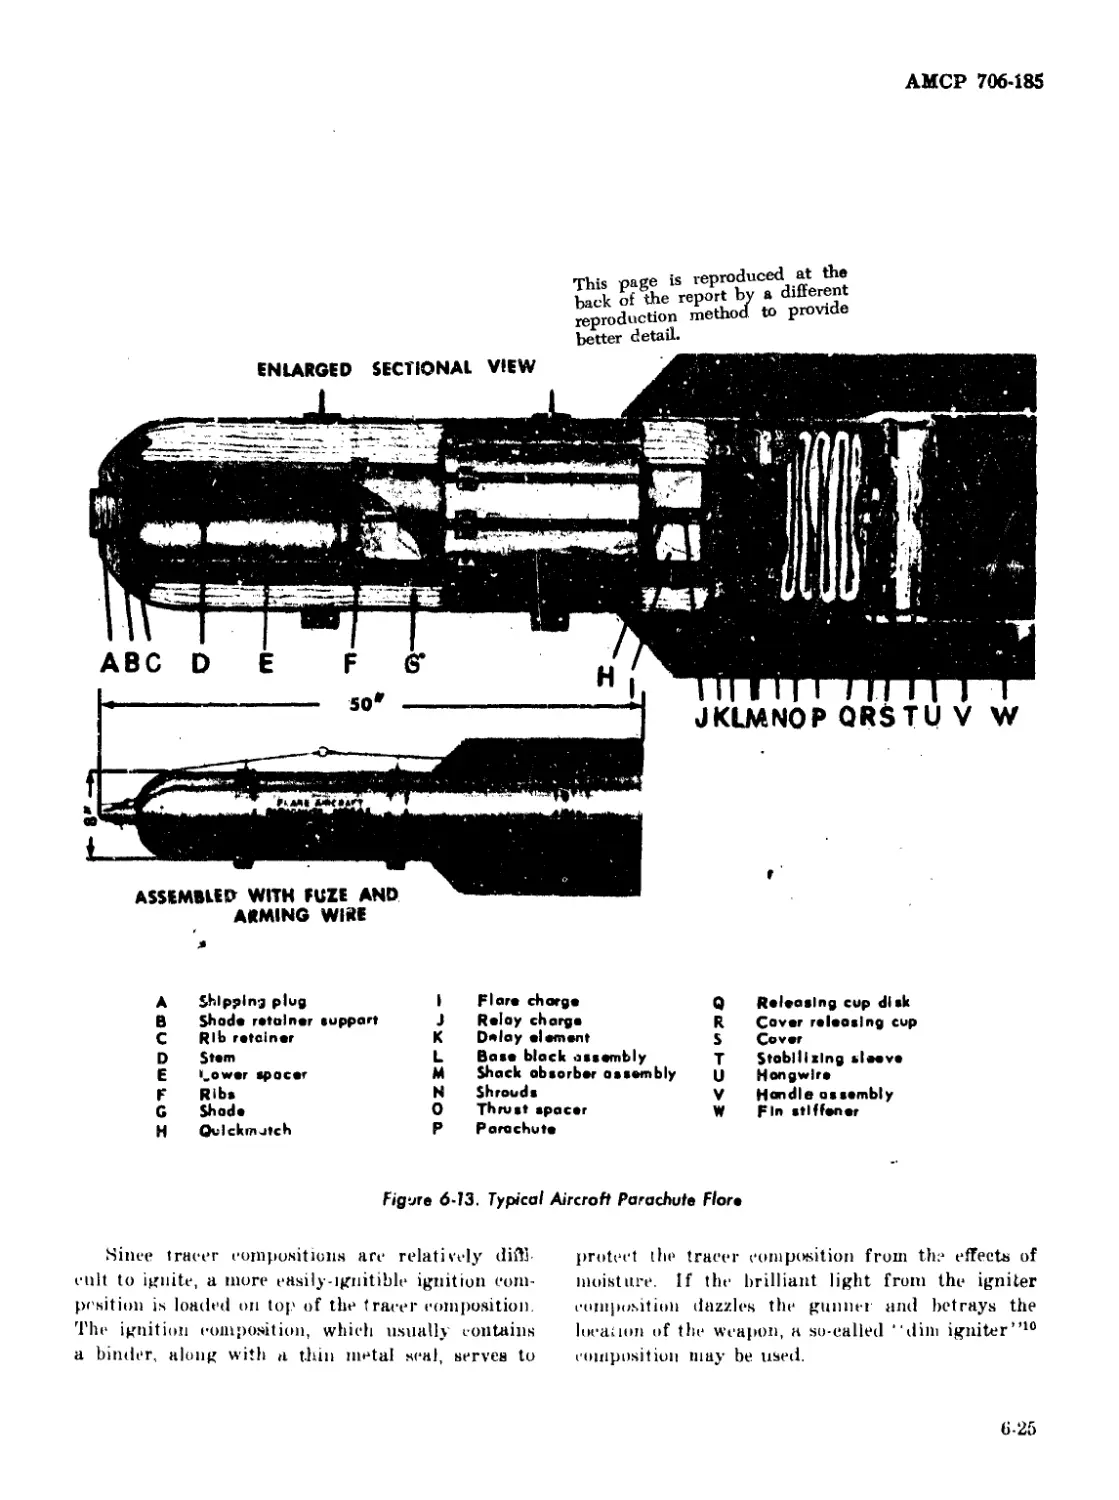
6-13 Typical Aircraft Parachute Flare ............................ 6-25
6-14 Operation of Typical Aircraft Parachute Flare ............... 6-26
6-15 Typical Aircraft Tow Target Flare .......................... 6-27
6-16 Typical Surface Trip Flare ................................ 6-31
6-17 Typical Hand-Held Illuminating Signal ...................... 6-32
6-18 Small Arms Tracer ............................................ 6-32
6-19 Armor-Piercing Tracer ........................................ 6-33
6-20 Artillery Tracer Element in Projectile........................ 6-34
6-21 Artillery Tracer ........................................... 6-35
6-22 Zones in Flame Propagation ................................... 6-39
6-23 Temperature Distribution in a Pyrotechnic Flame .............. 6-40
6-24 Luminous Intensity as a Function of Magnesium Content of
Binary Mixtures Containing Various Oxidizing Agents........ 6-41
6-25 Burning Rate as a Function of Magnesium Content of Binary
Mixtures Containing Various Oxidizing Agents .............. 6-42
6-26 Chromaticity Data for Red, Yellow, and Green Flares ........... 6-44
6-27 Typical Spectra of Signal Flares ............................ 6-45
6-28 Spectral Energy Distribution of Green Flare ................... 6-48
6-29 Magnesium Content Versus Excitation Purity for a Yellow Flare 6-49
6-30 Effect of Polyvinylchloride on the Candlepower of Mixtures
Containing Strontium Nitrate and Ground Magnesium, Grade A 6-49
6-31 Effect of Polyvinylchloride on the Color Value of Mixtures
Containing Strontium Nitrate and Ground Magnesium, Grade A 6-50
6-32.1 Burning Rate vs Particle Size of Magnesium .................. 6-52
6-32.2 Candlepower vs Particle Size of Magnesium.................... 6-52
6-33 Effect of Loading Pressure on Burning Rate of Pyrotechnic
Compositions .............................................. 6-53
6-34 Effect of Spin Upon Trace Duration of Various Standard Tracer
Compositions When Loaded into Caliber .50 Ml Jacket........ 6-53
6-35 Diagram of Bomb Burst and Trail Angle.......................... 6-&4
6-36 Typical Characteristics of Black and "White Negative Material .. . 6-56
xiz
АМСР 706-185
LIST OF ILLUSTRATIONS (cont’d)
Figure No. Title. Page
6-37 Typical Photoflash Cartridge ................................ 6-58
6-38 Typical Photcflash Bomb .................................... 6-61
6-39 Typical 20 mm Spotting Round................................. 6-63
6-40 Photoflash “Daisy1’ Cartridge .................................. 6-63
6-41 Typical Flash Charge for “Indication of Functioning’’........ 6-65
6-42 Typical Time-Intensity Curve ............................. 6-66
6-43 Synchronization of Shutter .................................. .. 6-67
6-44 Time-Intensity Curves for M120A1 Flash Powder and M122 Dust
Photoflash Bombs .................................................... 6-67
6-45 Spectral Energy Distribution Curve of M120 Photoflash Bomb ... 6-68
6-46 Effect of Particle Size of Potassium Perchlorate on Luminous
Efficiency of 60/40 Potassium Perehlorate-Aluminum
Compositions ............................................... 6-68
6-47 Size and Light Output of Flash Cloud vs Time ................. 6-68
7-1 Approximate Size Range of Airborne Particles .................. 7-5
7-2 Scattering by Spherical Particles With Indicated Refractive
Indexes............................................................... 7-6
7-3 Typical Venturi Thermal Generator........................... 7-18
7-4 Typical Oil Smoke Pot (Floating) ............................. 7-20
7-5 Typical Oil Smoke Pot (Training) ............................ 7-20
7-6 Typical WF-Filled Device (M15 WP Smoke Hand Grenade) .... 7-22
7-7 Typical Red Phosphorus-Filled Device ....................... 7-23
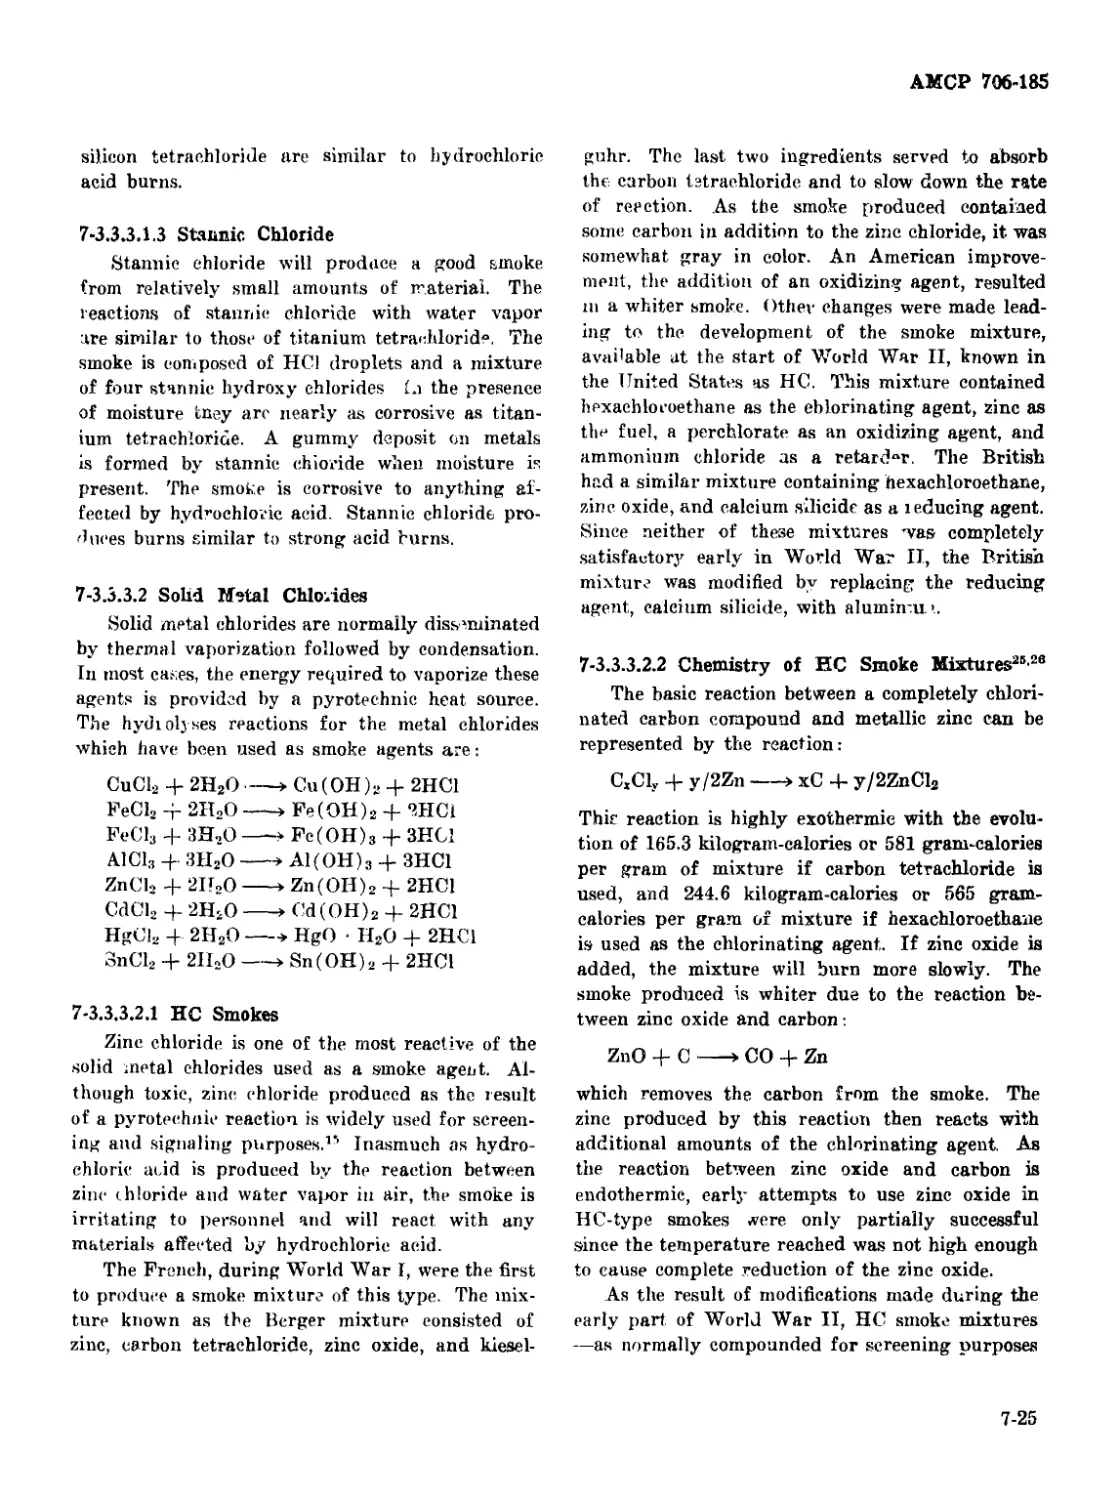
7-8 AN-M8 HC Smoke Hand Grenade ............................... 7-28
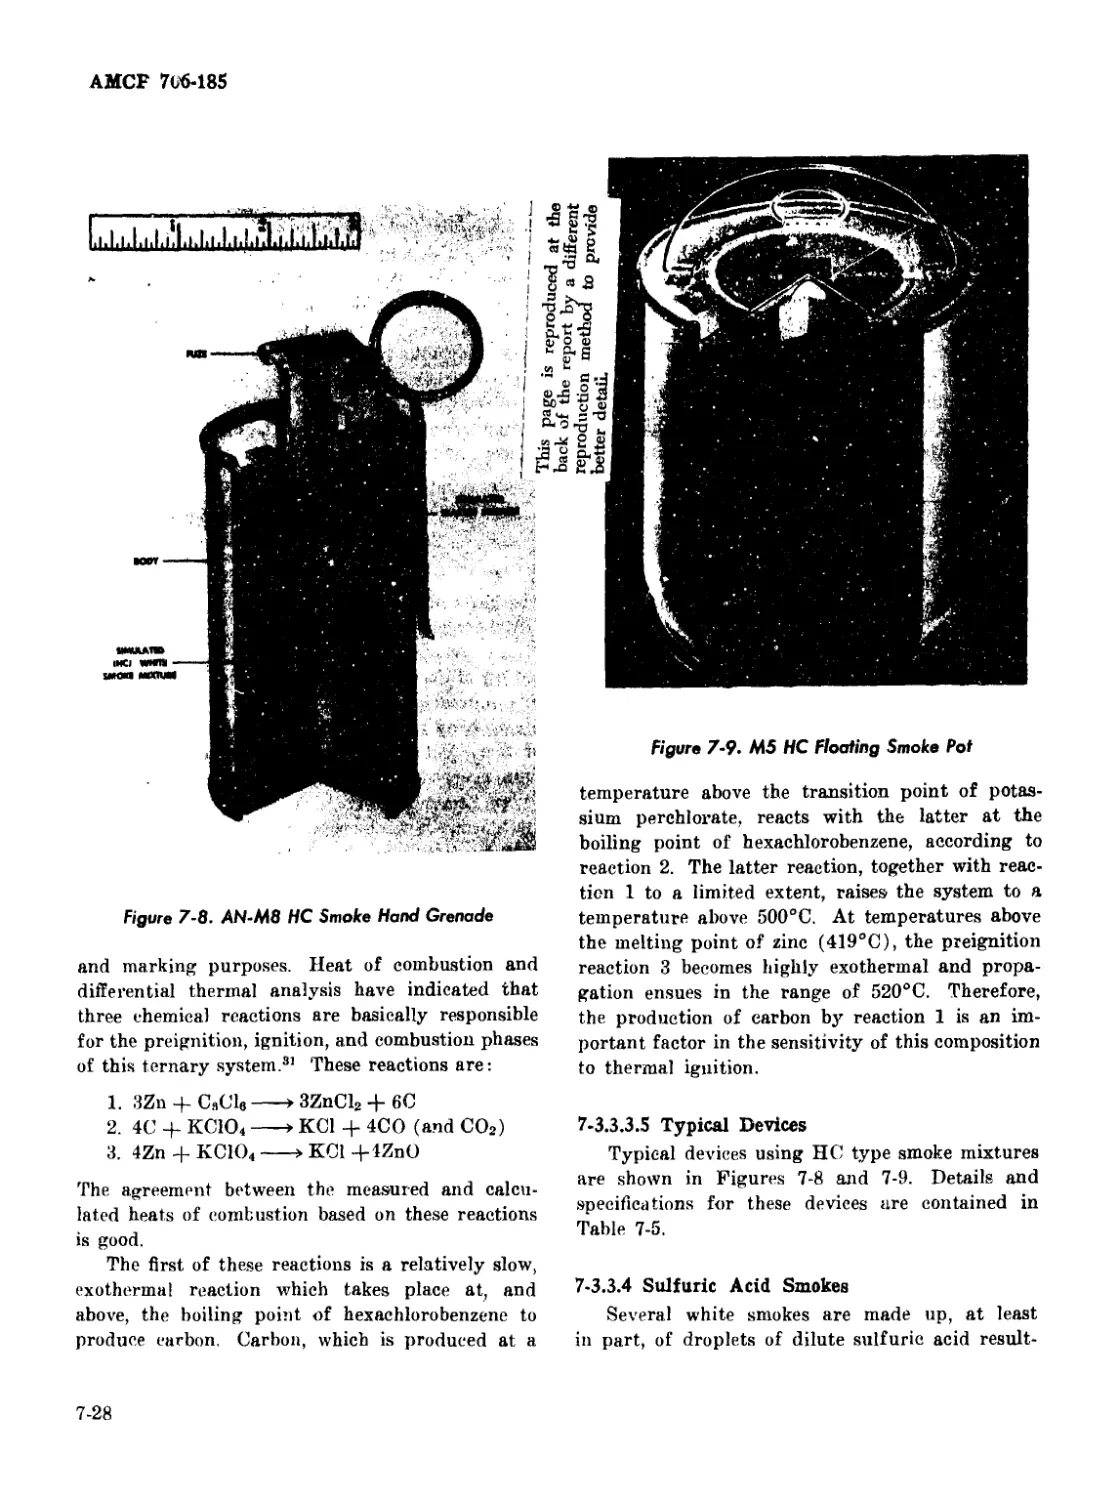
7-9 M5 HC Floating Smoke Pot ..................................... 7-28
7-10 Differential Thermal Analysis and Thermogravimetrie Analysis
Curve for 1,8-dihydroxyanthraquinone .................... 7-36
7-11 Differential Thermal Analysis and Thermogravimetrie Analysis
Curve for 1,4-di-p-toluidinoanthraquinone ............... 7-36
7-12 105 mm M84 Colored Smoke Projectile ...................... 7-41
7-13 M18 Colored. Smoke Hand Grenade ............................. 7-43
7-14 4.2-in. Colored Marker Projectile, Colored Smoke, E75 ....... 7-44
7-15 105 mm Ml Colored Marker Projectile .......................... 7-45
xv
АМСР 706-185
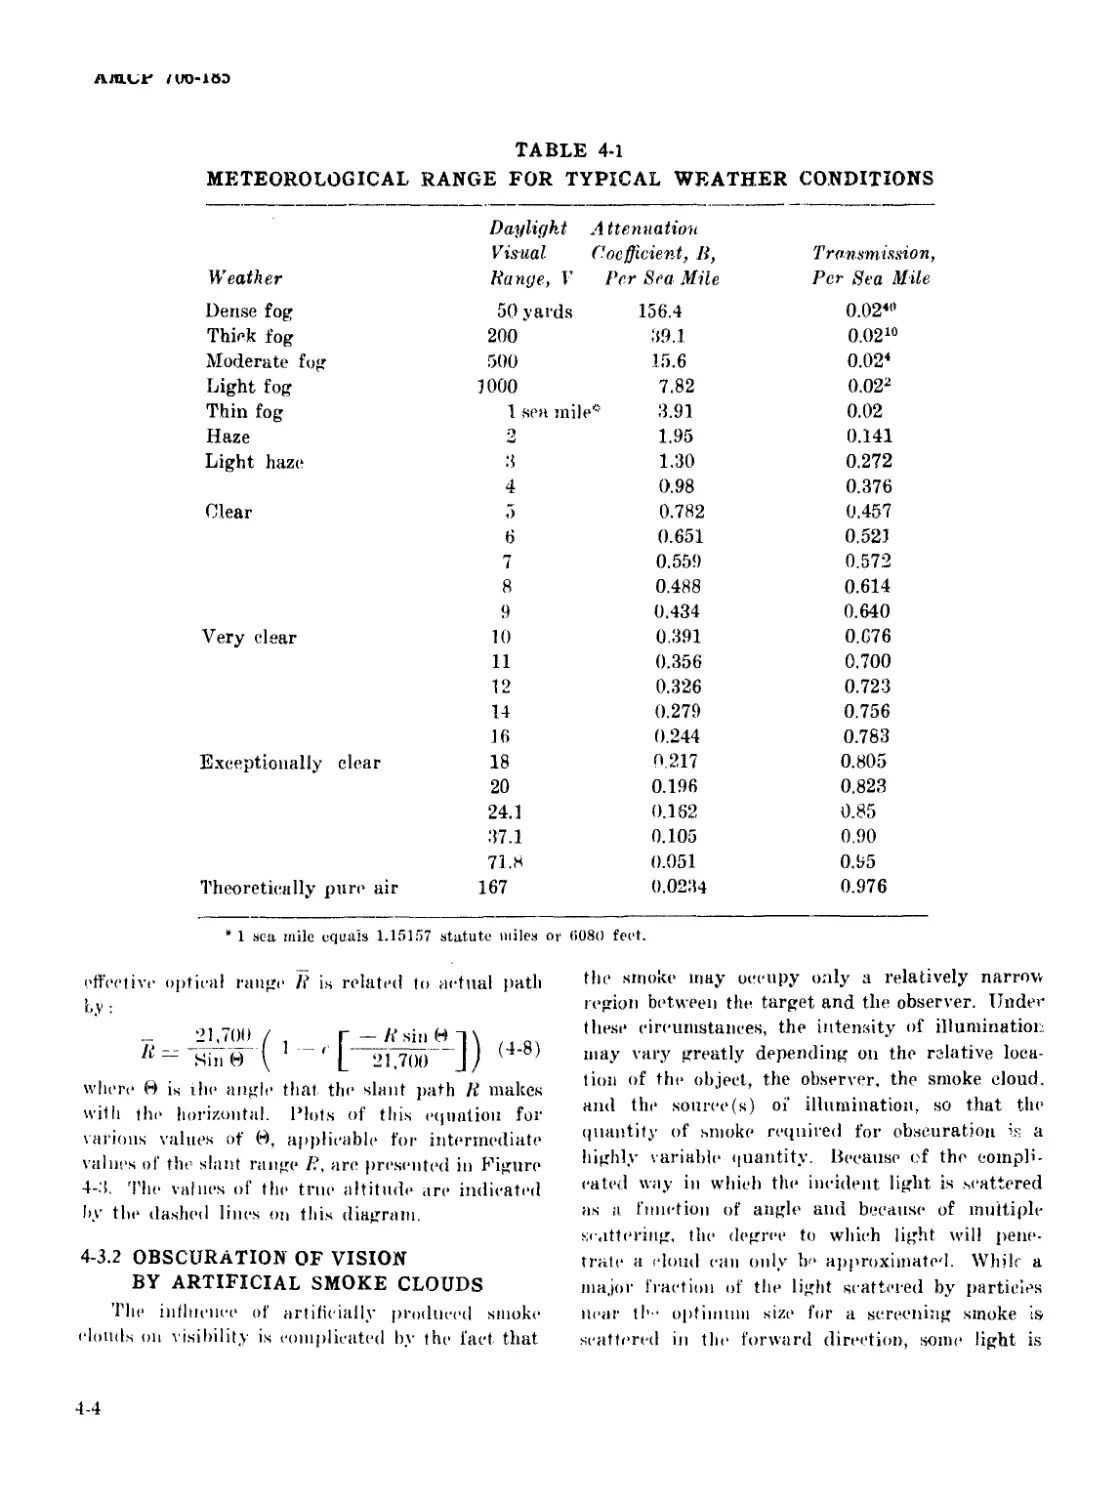
LIST OF TABLES
Table No. Title Page
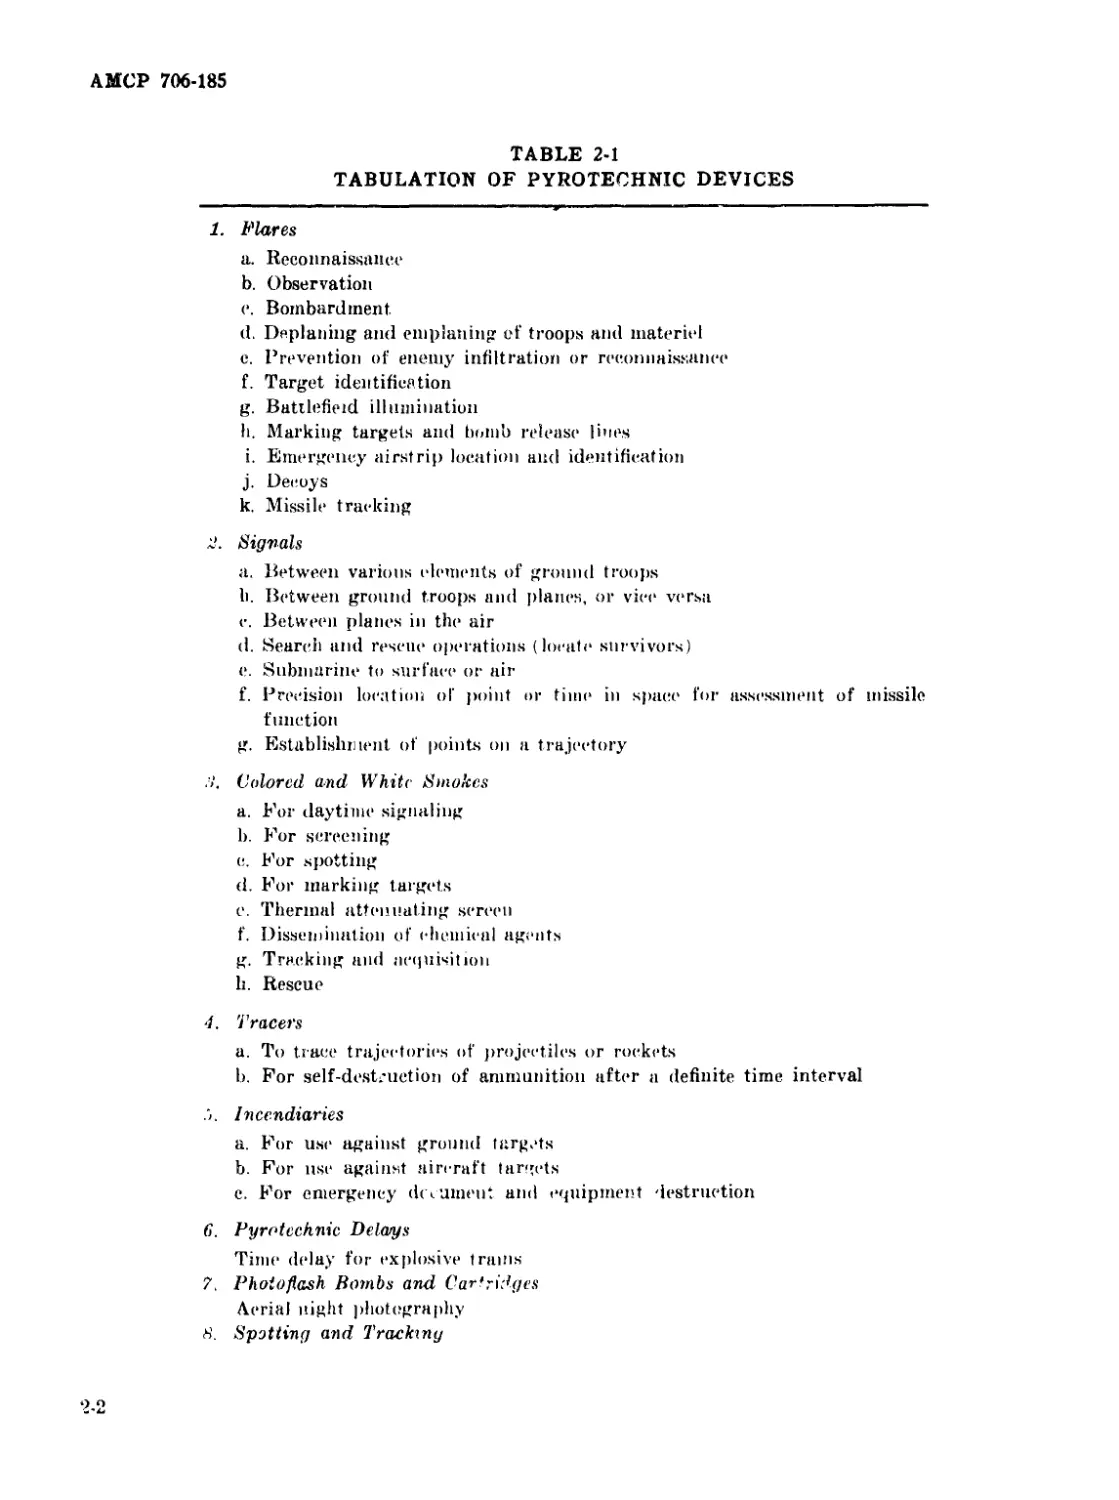
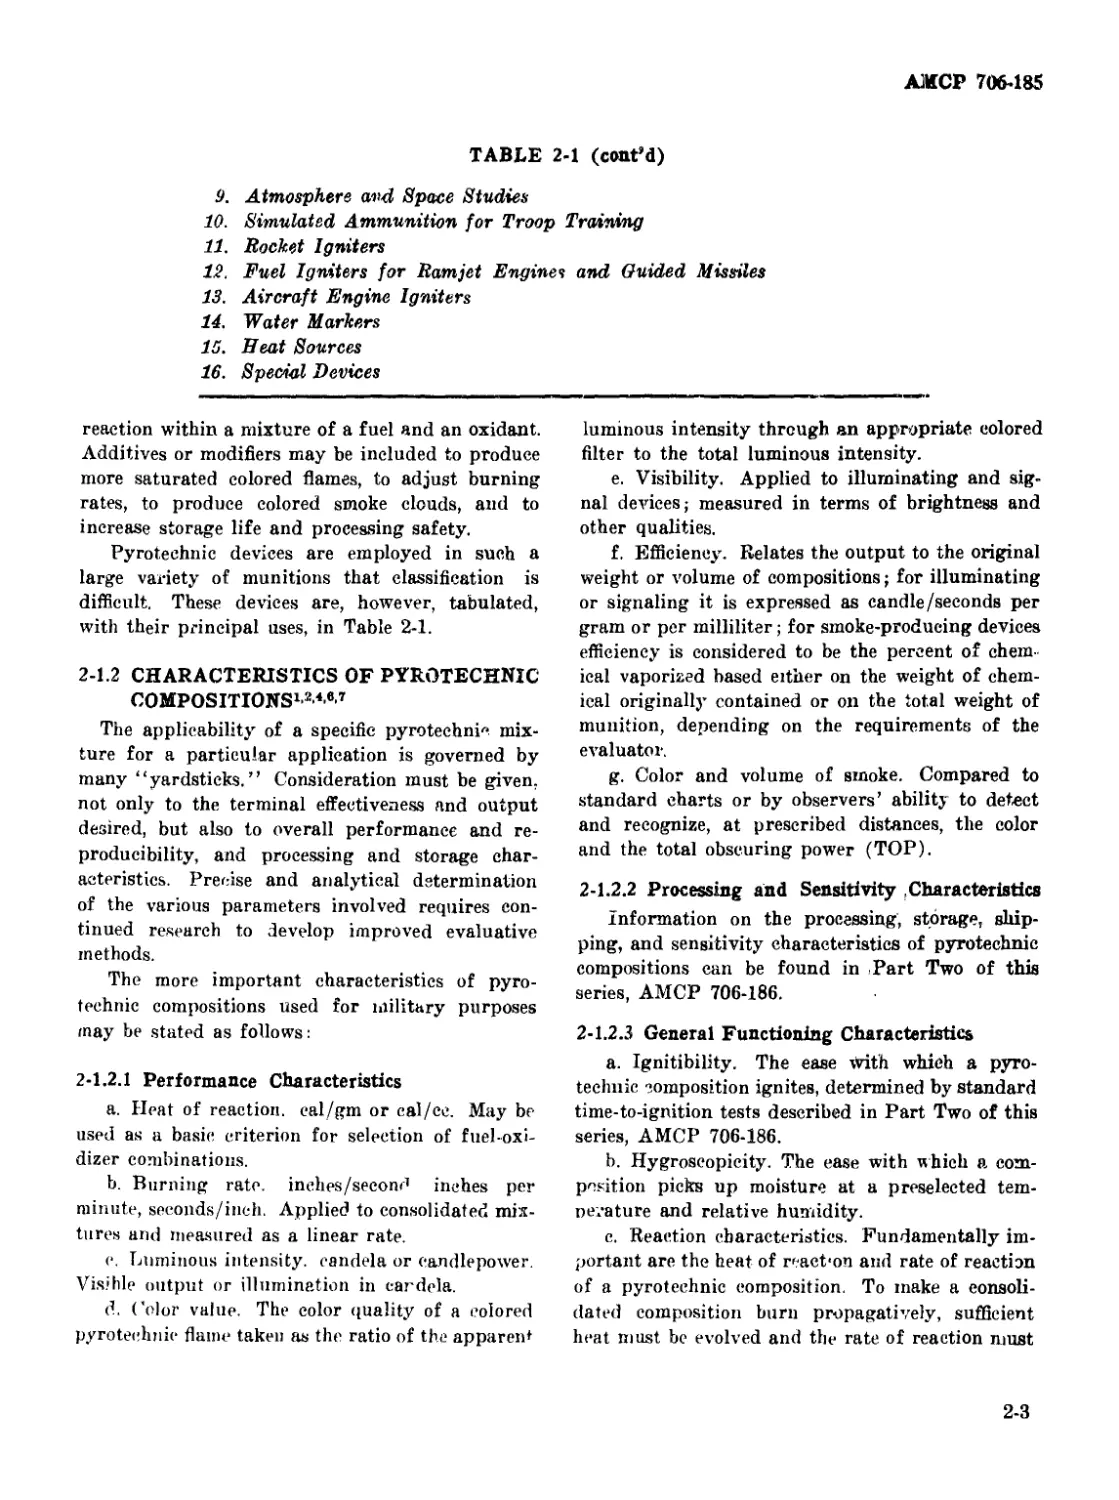
2-1 Tabulation of Pyrotechnic Devices .............................. 2-2
2-2 Comparison of Some Properties of Pyrotechnic Compositions
With Explosives................................................... 2-5
3-1 Criteria of Spontaneity ..................................... 3-11
3-2 Thermodynamic Properties of Solid Magnesium Oxide............ 3-14
3-3 Thermodynamic Properties of Solid Aluminum Oxide............. 3-15
3-4 Thermodynamic Properties of Solid Sodium Oxide .............. 3-16
3-5 Thermodynamic Properties of Liquid Sodium Oxide.............. 3-17
3-6 Thermodynamic Properties of Oxygen ............................ 3-18
3-7 Example of Thermochemical Calculations: Lanthanum-
Potassium Perchlorate Reaction ................................... 3-24
3-8 Example of Thermochemical Calculations: Zireonium-Oxygen
Reaction .......................................................... 3-25
4-1 Meteorological Range for Typical Weather Conditions............. 4-4
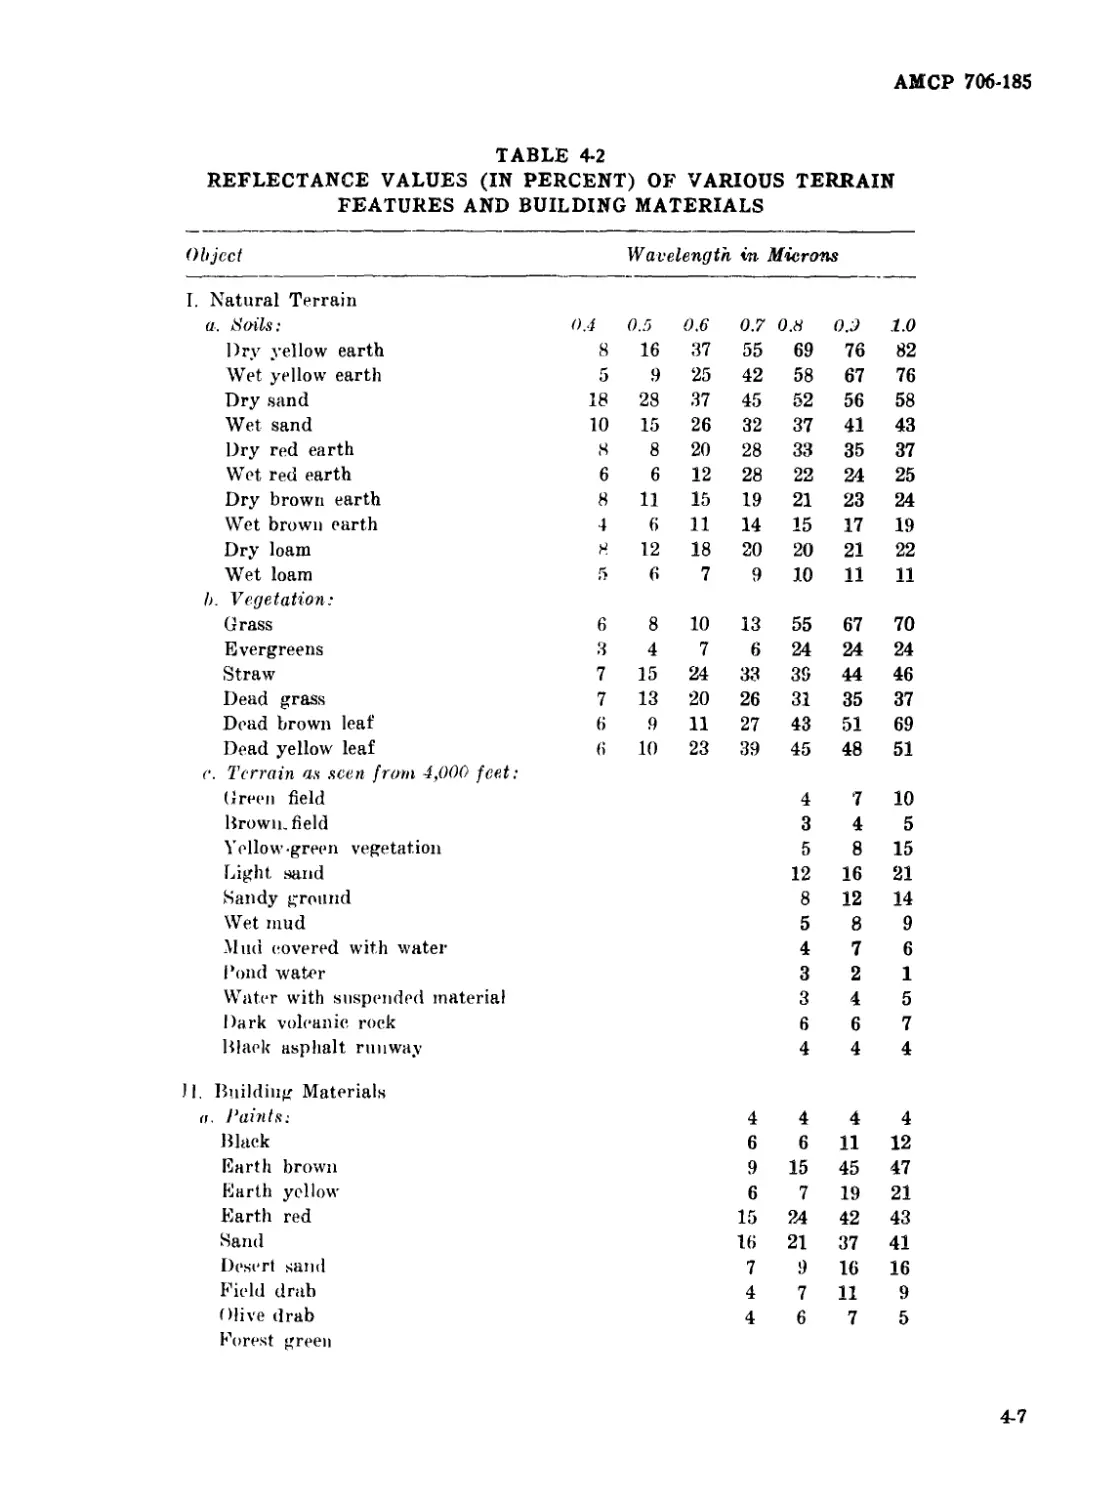
4-2 Reflectance Values (in percent) of Various Terrain Features
and Building Materials ................................... 4-7
4-3 Maximum Angular Size of Light Source as a Function of
Adaptation Brightness ... ........................................ 4-10
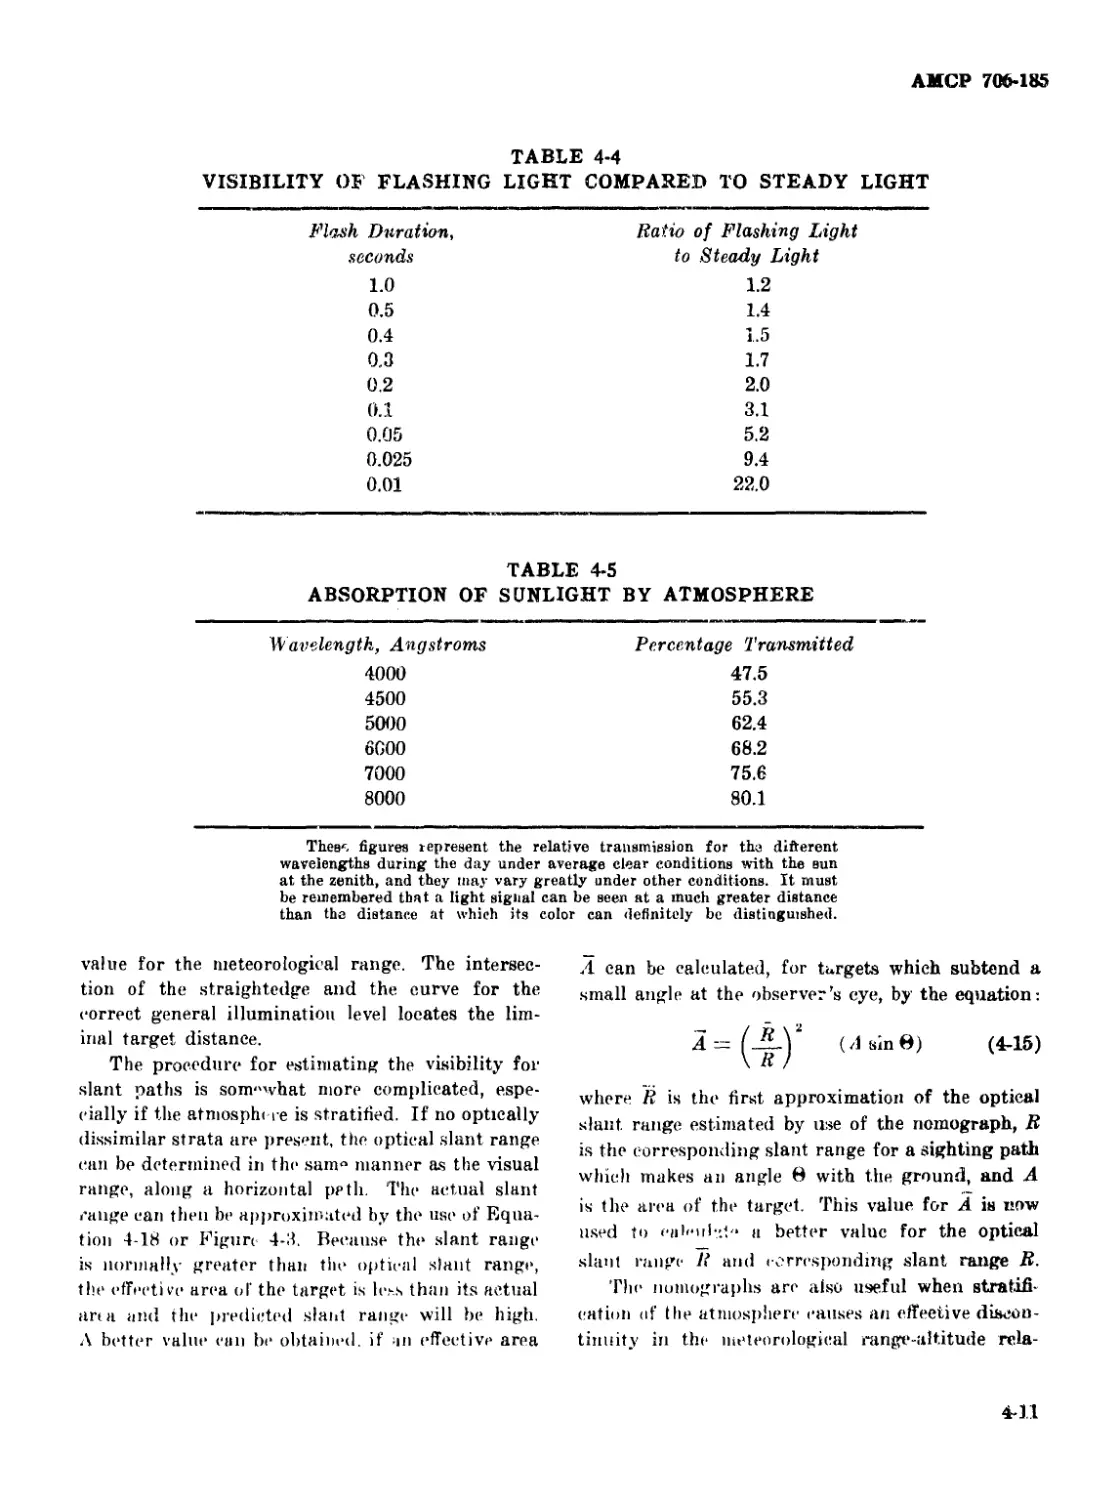
4 4 Visibility of Flashing Light Compared to Steady Light ....... 4-11
4-5 Absorption of Sunlight by Atmosphere ........................ 4-11
4-6 Sky Brightness .............................................. 4-13 -
4-7 Sky-Ground Ratio ............................................ 4-13
4-8 Increase in Illumination Required for Positive Recognition... 4-15
5-1 Heats Evolved from Reactions of Aluminum and Various
Oxidizing Agents ......................................... 5-6
5-2 Oxygen Content of Various Nitrates.......................... 5-7
5-3 Oxygen Content of Various Perchlorates..................... 5-8
5-4 Oxygen Content of Various Oxides and Peroxides.............. 5-8
5-5 Heat of Reaction of Reducing Agents With Barium Peroxide .... 5-9
5-6 Summary of Limits of Flammability of Various Gases and Vapors
in Air and in Oxygen ..................................... 5-12
5-7 Typical Small Arms Incendiary Mixtures......................... 5-20
5-8 Heat of Reaction of Thermite-Type Mixtures Containing
Magnesium............................................... 5-25
5-9 Modified Thermite Compositions................................ 5-25
5-10 Heats of Combustion and Hydrogen-Carbon Ratios of
Selected Fuels ........................................... 5-26
5-11 Composition of IM-Туре Incendiary Gels........................ 5-27
5-12 Composition of PT Incendiary Mixtures ........................ 5-28
5-13 Gasless Delay Compositions in Current Use ................... 5-34
xvi
АМСР 706-185
LIST OF TABLES (cont’d)
Table No. Title Page
5-14 Burning Rates of Gasless Delay Compositions ..................... 5-35
5-15 Heats of Reaction of Inorganic Mixtures Considered for Delays • - 5-36
5-16 Effect of Percent Composition on Burning Time, Heat of
Reaction, and Impact Values of the Barium Chromate-Boron
System ...................................................... 5-37
5-17 Extent of Anticipatory Effect as a Function of Burning Rate of
Various Barium Chromate-Boron Compositions .................. 5-38
5-18 Extent of Anticipatory Effect as a Function of Column Length of
55/35/10 TuDgsten-Barium Chromate-Potassium
Chromate Composition ...................................... 5-39
5-19 Effect of Specific Surface on Burning Time of Tungsten Delay
Compositions ................................................ 5-40
5-20 Ignition Powders for Gasless Delay Elements.................. 5-40
5-21 Effect of Fuze Housing Material and Dimensions on Burning Time
of Barium Chromate-Boron Compositions........................ 5-41
5-22 Effect of Loading Pressure on Barium Chromate-Boron
Compositions ................................................ 5-42
5-23 Effect of Storage on Fuzes Loaded With Barium Chromate-Boron
Compositions .............................................. 5-44
5-24 Burning Times of Fuzes Loaded With 93/7 Barium Chromate-
Boron Compositions Stored Loose Under Various Conditions ... 5-44
5-25 Commercial Safety Match Composition ............................ 5-46
5-26 Safety Match Striker Composition ............................... 5-47
5-27 SAW (“Strike-Any where”) Match Composition ..................... 5-47
5-28 Friction Primer Compositions ................................... 5-48
5-29 Some First Fire, Starter, and Igniter Compositions.............. 5-49
6-1 Conversion Factors for Photometric Units......... .............. 6-17
6-2 Candlepower Requirements Versus Height of Illuminating Source 6-21
6-3 Characteristics of Various Illuminating Flares ................. 6-22
6-4(A) Characteristics of Various Aircraft Signal Flares............. 6-28
6 4(B) Characteristics of Various Ground Signal Flares............... 6-30
6-5 Typical Illuminating, Signaling, and Tracer Compositions ....... 6-36
6-6 Heats of Reaction of Aluminum With Stoichiometric Quantities
of Various Oxidants ......................................... 6-37
6-7 Heats of Reaction of Magnesium With Stoichiometric Quantities
of Various Oxidants ......................................... 6-38
6-8(A) Physical Data and Burning Characteristics for Stoichiometric
Mixtures of Various Oxidants With Atomized Magnesium........ 6-43
6-8(B) Characteristics of Binary Mixtures Containing Oxidizing
Agents and Atomized Magnesium, Grade A....................... 6-46
6-9 Characteristics of Pyrotechnic Compositions Containing
Various Polyester Resin Binders ...........-................. 6-47
6-10 Effect of Particle Size on Burning Rate and Candlepower for
Magnesium-Sodium Nitrate-Polyvinylchloride-Laminae Mixture 6-49
6-11 Effects of Change in Specific Surface of Magnesium Particles . .. 6-50
xvii
АМСР 706-185
LIST OF TABLES (cont’d)
Table No. Title Page
6-12 Effect of Loading Pressure on Burning Characteristics of
Magnesium-Sodium Nitrate Flares ............................... 6-50
6-13 Effect of Simulated Altitude and Temperature on Illumination
Characteristics of Yellow Signals .............................. 6-51
6-14 Effect of Simulated Altitude and Temperature on Illumination
Characteristics of Red Signals ................................. 6-51
6-15 Effect of Simulated Altitude and Temperature on Illumination
Characteristics of Green Signals .............................. 6-52
6-16 Designation and Description of Photoflash Cartridges .............. 6-55
6-17 Characteristics of Type III Photoflash Composition ................ 6-57
6-18 Designations and Descriptions of Flash Powder Photoflash Bombs 6-59
6-19 Characteristics of Dust Photoflash Bombs .......................... 6-60
6-20 Segregated Oxidant Photoflash Bombs ............................... 6-61
6-21 Typical Compositions for Photoflash and Spotting Charges.......... 6-62
6-22 Luminosity Characteristics at Sea Level of Photoflash
Compositions Consisting of High-Energy Fuels in Stoichiometric
and Fuel-Rich Combinations With Potassium Perchlorate .... 6-64
6-23 Thermodynamic Data for Stoichiometric Mixtures of
Oxidizing Agents and Atomized Aluminum ........................ 6-65
6-24 Luminosity Values of Various Oxidants With Atomized
Aluminum and Atomized Magnesium Tested in M112 Photoflash
Cartridge ..................................................... 6-66
6-25 High Explosives Tried As Bursters in Flash Bombs................... 6-68
6-26 Luminosity Characteristics of Photoflash Compositions
Consisting of High-Energy Fuels in Stoichiometric Combination
With Potassium Perchlorate .................................... 6-69
7-1 Terminal Velocities and Diffusion Coefficients of Rigid Spheres
of Unit Density in Air at 760 mm Hg Pressure and 20°C.......... 7-8
7-2 Characteristics of Typical Oil Smoke Pots ........................ 7-19
7-3 Characteristics of Typical Devices Using Phosphorus Filling .... 7-24
7-4 Variation of Burning Time of Type-C HC Smoke Mixture With
Aluminum Content .............................................. 7-26
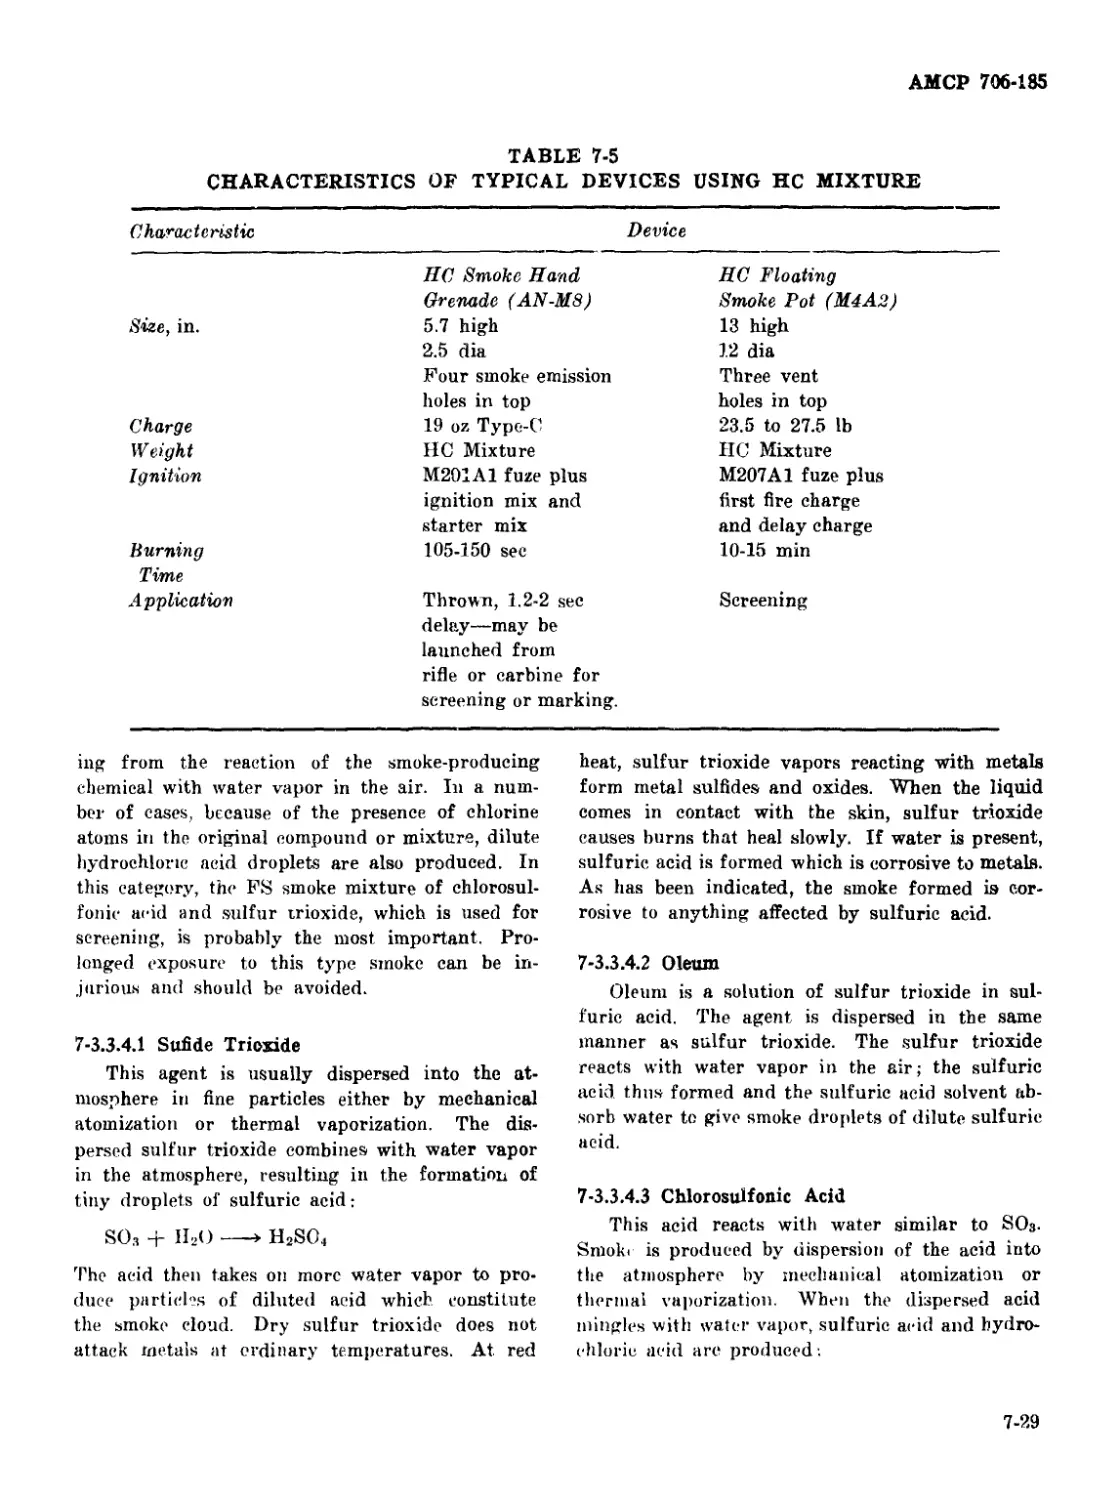
7-5 Characteristics of Typical Devices Using HC Mixture............... 7-29
7-6 Total Obscuring Power of White Smokes ............................ 7-32
7-7 Amount of Smoke Agents Required To Produce 1,000 Cubic Feet
of Standard Smoke ............................................. 7-32
7-8 Amount of Smoke Produced Per Unit Weight of Smoke Agent
at 75% Relative Humidity ....................................... 7-33
7-9 Some Dyes Which Have Been Used in Burning-Type Colored
Smoke Munitions ......................................................... 7-34
7-10 Some Dyes Which Have Been Used in Explosive-Type Colored
Smoke Munitions ......................................................... 7-35
7-11 Characteristics of Typical Ejection-Type Colored Smoke
Devices ................................................................. 7-42
7-12 Basie Differences Between the Colored Marker and Base-
Ejection Smoke Projectil e for 105 mm Gun....................... 7-45
7-13 Typical Smoke Compositions ......................................... 7-47
xviii
АМСР 706-185
CHAPTER 1
HISTORY OF MILITARY PYROTECHNICS
1-1 INTRODUCTION
Pyrotechnics is an old craft that has continued
to assume greater military importance. In their
simplest form, pyrotechnic devices consist of an
oxidizing agent and a fuel that produce an exo-
thermic self-sustaining reaction when heated to
ignition temperature. Man's earliest pyrotechnic
devices may have been the result of an accidental
mixing of saltpeter (KNO3) with charcoal; or
natural tars and resins, animal fats, volcanic dusts,
salts, sulfur, or other flammable materials.
In modern warfare, some of the important uses
for pyrotechnic devices are: as incendiaries; as
luminous sources for missile tracking; as acces-
sories in aircraft, missiles, and nuclear devices;
to produce sound signals; and to produce visible
luminous and smoke signals. Illuminating devices
are also used for photography.4 Recent adaptations
include devices designed for actuation by radio
signals directed to a missile thousands of miles
from earth.
1-2 EARLY HISTORY1-'51)7
Incendiary and colored smoke mixtures were
used for war, religious celebrations, and entertain-
ment in Arabia, China, Egypt, Greece, and India
in very ancient times. As early as 2000 B.C., tales
of war in India mention incendiaries, smoke
screens, and noxious fumes. Later, against Alex-
ander the Great (305-323 B.C.), defenders of an
Indian city were reported able to “shoot thunder
and lightning from the walls.” To this day, natural
deposits of saltpeter are abundant in India, and
probably served as a source of this material for
employment in the compositions making these dis-
plays possible.
Knowledge of pyrotechnics traveled from the
East to Europe tit the beginning of the Christian
era The earliest record of pyrotechnic exhibitions
in Europe mentions the Roman Circus during the
reign of Augustus (27 B.C. to 14 A.D.). Roman
use of pyrotechnics appears to have beeu largely
for display. Movable frameworks were fitted with
adjustable parts and designed to set in motion
various colored lights.
A military use of pyrotechnics that began early
and persisted for many centuries was the use of
fire ships in marine warfare. The earliest recorded
mention of fire ships is from the 4th century B.C.
when the Phoenician seamen of Tyra used them in
battle against Alexander the Great. Later records
show that the Greeks used them against the Turks,
the Crusaders used them at Acre, and the English,
in the 16th century, used them with success against
the Spanish Armada.
1-2.1 GREEK FIRE
One of the earliest and most successful means of
chemical warfare was the mixture known as Greek
fire, the use of which is first reported in the 7th
century, A.D. This mixture of sulfur, resin, cam-
phor, and ether unknown combustible substances,
melted with saltpeter, was a powerful incendiary
that also produced suffocating fumes. It was used
in many different ways. Sometimes woolen cords
were soaked in the mixture, dried, and rolled into
balls. The balls were then lighted and hurled by
large engines at enemy ships or tents. Defenders of
cities prepared it in liquid form; poured it into
jars; then ignited the mixture and poured it upon
those besieging the city walls. In open battles,
it was squirted by hand pumps and bellows through
pipes into enemy ranks, or against wooden barri-
cades. In 901 A.D. the Saracens were reported to
have blown it from pipes mounted on the decks of
their ships. Five centuries later, in Emperor Leo’s
attack on Constantinople in 1453 A.D., 2000 enemy
ships were reported destroyed by its use.
1-1
АМСР 706-185
1-2.2 CHINESE PYROTECHNICS
Records of Chinese pyrotechnic items go back
to the 10th century. Rockets and Roman candles
are mentioned in 969 A.D. and, by the 13th cen-
tury, colored smokes for signaling, incendiary-
carrying fire arrows, and rocket-propelled arrows
were employed. The rocket-propelled arrows, fired
in dusters from metal containers, were sometimes
fitted with poisoned razor-sharp heads for attacks
from ambush and the defense of defiles. Other
Chinese weapons of this time included “flying fire
spears” equipped with tubes that threw fire for-
ward for about 30 feet. Pyrotechnic devices were
also used in defending cities—the Kin Tarters
are known to have used fire powders and other
pyrotechnic devices against a Mongo] attack in
1232 A.D.
1-2.3 GUNPOWDER
The inventor of gunpowder is generally be-
lieved to have been the English philosopher, Friar
Roger Bacon. In 1242 A.D. he revealed the in-
gredients for black powder in defending himself
against an accusation of witchcraft. Although
Bacon knew of the explosive power of gunpowder,
he apparently did not recognize the possibility of
using it for projection of missiles.
The earliest recorded use of firearms or of gun-
powder as a propellant is in the beginning of the
14th century. Records of the University of Ghent
in Belgium indicate that the first gun was invented
by Berthold Schwarz in 1313, and commercial
records indicate that guns and powder were ex-
ported from Ghent to England in the following
year. Guns and gunpowder may have been used
in the English invasion of Scotland in 1327, but
the earliest undisputed record of the use of gun-
powder in war is in France at the battle of Crecy
in 1346. Gunpowder was also used as an explosive
to blast fortification walls, the first reported at-
tempts being at Pisa in 1403, and in land mines,
which were described in 1405,
When gunpowder began to be used as a pro-
pellant in the 14th to 15th century, the usefulness
of the incendiaries then available declined. Be-
cause of the use of gunpowder, armies began to
engage each otln r at such distances as to prohibit
the use of contact or short range incendiary de-
vices.
1-2.4 MISCELLANEOUS USES
The first recorded use of screening smoke in
more recent times occurred in 1701, when Charles
XII of Sweden burned damp straw to produce a
smoke screen to cover a river crossing. Elsewhere
in Europe at this time pyrotechnic devices were
being developed for their military value. The
French kings encouraged experiments and tests,
saw that proper records were kept, of which many
are still available, and collected information from
travelers returning from other countries. French
priests returning from China brought detailed
knowledge of the state of the art in that country.9
1-3 18TH AND 19TH CENTURIES23 50
Berthollet’s discovery of potassium chlorate in
1788 began the modern era in pyrotechnics. Po-
tassium chlorate made color effects in pyrotechnic
flames possible and the introduction of magnesium
in 1865 and aluminum in 1894 added greatly to the
variety of effects attainable.
In Europe there was also a great interest in
the nse of rockets. Several types were developed,
the most successful being the Congreve rocket,
which was 30 inches long, ID/G inches in diameter,
and carried an incendiary charge. The British
used rockets with pyrotechnic compositions in a
number of campaigns. A rocket corps was part
of the British Army during the Revolutionary War,
and again during the War of 1812. The 1805 ex-
pedition of Sir Sidney Smith against Boulogne
included boats fitted for salvo firing of rockets, and
rockets were used successfully in the British attack
on Copenhagen and by Wellington's army.
In the United States at this time, a number of
pyrotechnic devices were items of general am-
munition issue. An 1849 Ordnance manual de-
scribes signals, lights, torches, tarred links, pitched
fascines, incendiary matches, and other illumina-
tion devices. The manual also lists firestone,
Valenciennes composition, and fireballs—incendi-
aries, when projected from mortars, designed to
set fire to enemy property. Besides the Congreve
rocket, which eame in 21/!- and 3d4-i“eh sizes. The
1-2
АМСР 706-185
214-inch rocket had a maximum range of 1760
yards and the 3j4-inch rocket had a somewhat
greater range. The rockets were made of sheet or
east iron and fired from tubes mounted on portable
stands or light carriages. An 1861 Ordnance
manual lists most of the 1849 devices with more
detail and some improvements. Two new items
were also listed: an incendiary projectile filling
called roekfire, which burned slowly and was hard
to extinguish. It was employed to set fire to build-
ings, ships, and flammable stores. Another new
device was the petard, a powder-filled wooden box
that was used to demolish doors, gates, barriers,
and other obstacles.
A number of gunpowder improvements were
made in the United States and Europe during the
latter half of the 19th century. After General
Thomas J. Hodman, U.S. Army, discovered the
principle of the progressive burning of propellant
powder in 1860, powder grains were made in sizes
adapted to the caliber of gun, with larger and
perforated grains used in larger weapons. The
Swedish inventor, Nobel, made many of his im-
portant discoveries at this time. In 1863 he first
manufactured nitroglycerin commercially, and dur-
ing the next twenty years invented dynamite, the
fulminate blasting cap, blasting gelatin, gelatin
dynamite, and ballistite. Another improvement
came in 1886 when Vicille, a French chemist, dis-
covered the means to colloid nitrocellulose and thus
control the grain size of the propellant powder.
1-4 EARL If 20TH CENTURY 2
An important pyrotechnic development early
in this century was the tracer bullet. Tracers have
been used in all types of projectiles, but their de-
velopment has been most closely connected with
ammunition for automatic small arms. Tracers
were the best devices for directing automatic small
arms fire against fast moving ground targets. In
this country, re*ea"eh and development of small
arms tracers was carried out af Frankford Arsenal.
The U. S. Navy and Picatinny Arsenal also con-
ducted tracer development for 20 mm, 40 mm, and
larger gnus.
The German Na\y emidueted fleet maneuvers
using vhemie.'illy produced screening smoke for tin1
first time in 1906, and later used sue1 smoke
screens with success at the Battle of Jutland in
1916. As a result of this success, the Allies and
the Germans developed pyrotechnic screening smoke
for use on both 'and and sea during World War I.
1-4.1 WORLD WAR I
During World War I, opposing troops in
trenches sepai tted by short distances regularly
employed pyrotechnic devices. Illuminating pro-
jectiles were used as protection against surprise at-
tack, and signals were used to request, adjust, or
stop artillery fire; to mark enemy and friendly
troop locations; and for emergencies on land, sea,
and in the air.
The advent of the airplane overcame the diffi-
culties of using incendiaries against distant armies.
Forerunners of today's incendiary bombs were
first dropped on London in May 1915 from Ger-
man Zeppelins, and a prototype of the portable
flamethrower was used by the Germans against the
French in April and June of that year, although
with little success. Later in the war, bombs con-
taining white phosphorus, thermite, and thickened
liquid fuels were dropped from airplanes.
Before and during World War I most pyro-
technic development and manufacturing in the
United States was carried out by private contrac-
tors to the Army or Navy. The Star rifle light, the
Very pistol, position lights, and simple rockets
were the main items used. As the war continued,
the armed services began to test and develop pyro-
technic devices for special purposes.
The use of chemical agents during the war re-
sulted in the establishment of a Chemical Warfare
Service in 1918. This organization became a
permanent branch of the U.S. Army in 1920,
and in 1946 its name was changed to the U.S. Army
Chemical Corps. This technical service pursued
the development of incendiaries, screening and sig-
naling smokes, flame throwers, and toxic chemical
compounds.
Aberdeen Proving Ground in Maryland was
activated in October 1917, and by December of
that year was making acceptance tests of ammuni-
tion and other Ordnance materiel Aberdeen rec-
ords for 1918 list tests of illuminating parachute
projectiles for the Uioinni gun.
Frankford Arsenal, during the early days of
1-3
АМСР 706-185
the war, adapted foreign pyrotechnic compositions
to small arms ammunition. Later, it developed
tracer and igniter compositions and started a well-
integrated program for standardization. These
early tracer compositions were made by a small
batch process, wet mixed, dried, and ground to
produce a stable, uniform composition. These early
compositions were only moderately satisfactory in
that the calomel used as a flame brightener pro-
duced season cracking in brass, and also limited
the life of the composition.
During the war the Navy developed and used
3-, 4-, 5-, and 6-ineh illuminating projectiles with
a projection range up to 7 miles, a major advantage
because the Star rifle light was projected to a maxi-
mum range of only SOO yards. The Navy also de-
veloped water markers for use from submarines, as
well as for dropping from aircraft. These markers
consisted of surface burning smoke and flame-pro-
ducing items, colored aerial stars, and surface
marking dyes.
1-4.2 BETWEEN THE WARS
During the period between World War I
and World War 11, arsenals, such as Ficatiuny
and Frankford, and the Army Chemical Corps
carried on limited research on military applications
of pyrotechnics. Some universities also assisted
in this work.
Pieatinny Arsenal, which had been established
by the Ordnance Corps in 187!) as a small powder
depot to manufacture and load munitions, began
loading propellant charges in 189(i, projectiles in
1902, and propellant manufacture in 1907. In
1919, it began to develop and manufacture pyro-
technic signals, and continued the pyrotechnic
research ami development effort in the period be-
tween the wars. During this time, it made con-
siderable progress in developing new smoke, flare,
tracer, and delay compositions, and began to ac-
cumulate evidence regarding the necessity for
purer ingredients, more <-arefill control of particle
size, and improved processing methods. Other in-
vestigations produced techniques to measure lu-
minosity ami color of pyrotechnic flames, reeUnieal
requirements for specifying ingredients, and recog-
nition of the impoitanee of avoiding moisture in
pyrotechnic coinpositions. Although there had
betn little scientific testing of pyrotechnic de-
vices, the body of data that existed at Picatinny
Arsenal nt the outbreak of WW II was of con-
siderable value in developing improved pyro-
technic items needed for the highly mobile forces
of that war.
Aberdeen Proving Ground added development
testing to its proof testing in the 1920’s. In 1921
development tests were reported on green, yellow,
and white smokes, and two years later tests of long
burning white parachute signals were conducted.
About 1933, Frankford Arsenal refined the
process of making tracer compositions so that only
the calcium resinate and the hygroscopic strontium
peroxide were wet mixed. Since then, streamlining
of the process has continued and now all ingredi-
ents in the tracer mix are purchased in the required
granulation, blended dry, and charged into bullet
cavities under high pressures. In 1936 Frankford
began developing delay action and dim igniters,
some of which are now standard compositions. Just
before the United States entered World War II,
Frankford greatly improved incendiary mixture
IM-11. This standard incendiary mixture, which
was originally developed by Pieatinny Arsenal,
was quickly adopted by the British and was used
by American forces in all small arms incendiary
bullets during World War II.
The Navy pyrotechnic development between the
wars was centered at tne U.S. Navy Yard in
Washington, D. (’. Production was carried out at
the Naval Ordnance Plant at Baldwin, New York.
For a time its one product was illuminating pro-
jectiles, but in 1930 production of aircraft para-
chute flares was also added. Also, by 1933 the
Experimental Ammunition Unit of the Naval Gun
Factory had developed a number of pyrotechnic
items including emergency identification signals,
aircraft signal cartridges, and ammunition tracers.
1-4.3 WORLD WAR II
In 1940, and later with the entry of the United
States inti; World War II. pyrotechnic items such
as flares, illuminating projectiles, smoke signals,
spotting charges, many types of ground and air-
craft signals, and incendiaries were needed in
enormous quantities
Flares were widely used to illuminate landing
1-4
АМСР 706-185
fields at night, in rain, and in fog. They were
dropped from aircraft to illuminate enemy terri-
tory ; to silhouette ships for observation; and to
locate targets for bombing. Photoflash bombs il-
luminated large areas for night photography.
Smoke screens were used by land and sea forces
for a variety of purposes: aircraft and smoke boats
screened ships during air attacks and amphibious
landings, concealed underwater demolition teams
and tactical maneuvers of ground troops.
By the end of the war pyrotechnics provided
visual communication be,th day and night between
planes and tanks, tanks and artillery, infantry
and aircraft, and ships and the shore.
Incendiary bullets, bombs, projectiles, and
grenades were widely used in Europe. Allied tac-
tics in bombing German cities employed equal
quantities of incendiaries and high explosives. On
a weight basis, the incendiary bombs caused five
times more damage than high explosive bombs. The
central parts of more than 50 of Germany's largest
cities were leveled by fire. Before unclear weapons
were used fifty percent of 70 Japanese cities had
been burned. More than 99 percent of the total
bomb load dropped on Japanese eities was in-
cendiary, with less than 1 percent high explosive.
During the war, hundreds of millions of incendiary
bombs, projectiles, and grenades were provided by
the ('hemical Warfare Service—over 48 million
incendiary bombs alone were supplied to the U.S.
Army Air Force.
Flame throwers, which had been developed
during World War I, were improved and used with
success in the campaigns in the Pacific areas during
World War II.
Pieatinny Arsenal developed many improved
pyrotechnic items to inert the military change
from trench warfare, which had existed in World
War 1. to the highly specialized mobile forces
of World War ]i Pyrotechnic ammunition for
military maneuvers and means for providing visual
communication among the various elements in-
v,lived were essential. More efficient flares, flash
charges, and a variety of spotting charges, signals.
tracers, and troop warning devices were developed
to meet the new tactical requirements. New in-
gredients such as atomized magnesium, resins, color
intensifiers, and others were tested and adopted;
improved techniques to measure luminosity and
color, sueh as the harrier-layer cell photometer,
were introduced.
The Ballistic Research Laboratories had been
established in 1938 to centralize research activities
at Aberdeen Proving Ground and to undertake re-
search in fundamental Ordnance problems. With
completion of a new laboratory in 1941, basic
studies were begun in areas pertinent to pyrotech-
nics such as flame propagation, burning rates, sen-
sitivity of pyrotechnic compounds, and the physical
chemistry of gases.
Naval pyrotechnics development during World
War II was centered at the Naval Ordnance
Laboratory, then located at the Naval Gun Factory,
Washington, D. (’., and production was centered
at the Naval Ammunition Depot, Crane, Indiana.
The Navy improved existing items for greater re-
liability and storage characteristics, and developed
sueh items as chemical delay powders, self-releas-
ing buoyant submarine signals, rescue flares, depth
charge markers, aircraft signal cartridges, and
parachute flares.
1-5 POST WORLD WAR II PERIOD412
Funds for research and development of pyro-
technic items were limited in the period following
World War 11; however, significant advances were
accomplished which made available improved pyro-
technic devices, signals, smokes, incendiaries, and
battlefield illnniinants when the Korean Conflict
developed in the early 1950 s,
Most pyrotechnic research and development to-
day is carried out by the Government at Pieatinny
Arsenal, Aberdeen Proving Ground, Frankford
Arsenal, the Army Chemical R&l) Laboratories,
the Naval Ordmuice Laboratory, the Naval Ord-
name Test Station, the Naval Ammunition Depot,
and by Government-sponsored agencies.
1-5
АМСР 706-185
REFERENCES
1. а. Т. L. Davis, “Early Pyrotechnics. I. Fire
for the Wars of China; II. Evolution of the
Gun; III. Chemical Warfare in Ancient
China,” Ordnance 33, 52, 180, 396 (1948-49).
b. L. Katz, “Pyrotechnics in Missile Design,”
Ordnance 44, 334 (1959).
e. H. Ellern, “Military Pyrotechnics,” Ord-
nance '14, 662 (1960).
2. T. L. Davis, Chemistry of Powder and Ex-
plosives, John Wiley & Sons, Inc., New York,
1943.
3. H. B. Faber, Vol. 1, 1 History and Develop-
ment of Military Pyrotechnics, 1Г. S. Govern-
ment Printing Off ce, Washington, D. C., 1919.
4. S. Sage and R. W. Evans, “Pyrotechnic Re-
search Comes of Age,” Ordnance 48, 262
(1964).
5. Alan St. II. Brock, A History of Fireworks,
George C. Hanap and Co., Ltd,, London.
6. A. M. Prentiss, Chemicals in War, McGraw-
Hill Book Co., New York, 1937.
7. K. F. Sawyer, “Screening Smokes,” Thorpe’s
Dictionary of Applied Chemistry, Vol. X, p.
781, Logmans Green, London, 1950.
8. History of Research and Development of the
Chemical Warfare Service in World War II,
published for The Chemical Corps Association,
Washington, D. Reinhold, N. Y., 1948.
9. L. P. Brophy, D. M. Syndam, R. C. Cockrane,
The Chemical Warfare Service from Labora-
tory to Field, Office of the Chief of Military
History, Department of the Army, Washing-
ton, 1). C., 1959.
10. С. II. Custard, G. Francis, W. Schnaekenberg,
Small Arms Incendiary Ammunition, A Re-
view of the History and Development, Frank-
ford Arsenal Report R-1407-3, December 1956.
11. L. Finkelstein, A. E. Gaul, Incendiaries, Vol.
18, History of Research and Develops ent of
Chemical Warfare Service in World War II,
published for The Chemical Corps Association,
Washington, D. C., Reinhold, N. Y., 1948.
12. D. Hart, Research and Development of Mili-
tary Pyrotechnics, Picatinny Arsenal, Dover,
N. J., 1955.
1-6
АМСР 706-185
CHAPTER 2
INTRODUCTION TO MILITARY PYROTECHNICS
2-1 INTRODUCTION
Modern military pyrotechnics as an outgrowth
of “Greek Fire" and the “art of making fire-
works” has progressed to the extent where pyro-
technic devices and systems in both offensive and
defensive military operations have become indis-
pensable. It has developed into a science requir-
ing extensive and intensive basic and applied re-
search to meet new conventional and unique mili-
tary and space requirements.
The early modest state of progress was changed
considerably, however, when military operations
became mechanized with the development of the
tank, the bombing plane, the submarine, long-range
artillery, the aircraft carrier, other vehicles, and
weapons; and the introduction of combined opera-
tions. To coordinate all these forces and to pro-
tide for visual coirnmnieations between plane and
tank, tank and artillery, infantry and air force,
both day and night, the development of pyrotechnic
uinmunition lor these purposes was absolutely
essential. Increased use of aircraft for bombing
and observation purposes required the use of flares
and photoflash bombs which could be released from
rapidly moving planes to illuminate enemy terri-
tory for night photography and observation and to
locate targets for bombing.
Л variety of smoke signals, spotting charges,
bombardment tlares, illuminating shells, ground and
aircraft signals had to be developed to satisfy new
tactical reqnircineiit.s New demands for signaling
capability required the development of improved
colored smokes and signals.
For submarine identification and air-sea rescue
operations, sea water activati i, battery-operated,
flouting marking signals were developed with good
life and stability. Many types of simulators for
land nnd sea troop training were also developed
amt became an indispensable aid in these opera-
t ions.
With the advent of the space age, pyrotechnic
devices have become increasingly important. They
are used extensively for spotting and tracking
rockets and missiles, for recovery operations, and
for special purpose countermeasures. To meet the
requirements for these applications, it has been
necessary to inve “’gate pyrotechnic reactions un-
der conditions of iow pressure, low temperature,
greatly reduced quantities of atmospheric oxygen,
varied degrees of confinement, and with different
types of initiating systems.
Basie studies have been undertaken to attain
a fundamental understanding of the preignition,
ignition, and self-propagative reactions of pyro-
technic ingredients. Theories have been developed
which are used as a guide for formulating flame
compositions burning cigarette-fashion, with spe-
cific burning rate requirements. Theoretical and
empirical relationships have been developed to
predict the rates of propagative burning of slow-
burning pyrotechnics as a function of particle size
and composition. Instrumentation has been de-
veloped to evaluate luminous intensity and colors
of pyrotechnic flames, luminous intensity and dura-
tion of flashes, color of smoke clouds, and improved
output of pyrotechnic flares. Laboratory studies
include use of thermal analytical techniques, spec-
trophotometric and chromatographic analyses.
To continue to meet new challenges, principles
and theories of engineering and science must be ex-
ploited and put to practice. Only when this is done
will it be possible to elucidate reaction mechanisms,
performance of pyrotechnic devices and to de-
velop superior compositions and items.1--”1
2-1.1 PYROTECHNIC DEVICES
AND USES' -’-'* "’
The terminal effect of military pyrotechnic
items such its light, heat, smoke or sound results
from an exothermic oxidation- reduced chemical
2-1
АМСР 706-185
TABLE 2-1
TABULATION OF PYROTECHNIC DEVICES
1. Flares
a. Reconnaissance
b. Observation
<“. Bombardment
d. Deplaning and emplaning of troops and materiel
e. Prevention of enemy infiltration or reconnaissance
f. Target identification
g. Battlefield illumination
h. Marking targets and bomb release lines
i. Emergency airstrip location and identification
j. Decoys
k. Missile tracking
2. Signals
a. Between various elements of ground troops
li. Between ground troops and planes, or viee versa
c. Between planes in the air
d. Search and rescue operations (locate survivors)
e. Submarine to surface or air
f. Precision location of point or time in space for assessment of missile
function
g. Establishment of points on a trajectory
Colored and White Smokes
a. For daytime signaling
b. For screening
c. For spotting
d. For marking targets
e. Thermal attenuating screen
f. Dissemination of chemical agents
g. Tracking and acquisition
h. Rescue
4. Tracers
a. To trace trajectories of projectiles or rockets
b. For self-destruction of ammunition after a definite time interval
.1. Incendiaries
a. For use against ground targets
b. For use against aircraft targets
e. For emergency document and equipment destruction
6. Pyrotechnic Delays
Time delay for explosive trains
7. Photoflash Bombs and. Cartridges
Aerial night photography
S. Spotting and Tracking
2-2
AMCP 706-185
TABLE 2-1 (cont’d)
9. Atmosphere and Space Studies
10. Simulated Ammunition for Troop Training
11. Rocket Igniters
IS. Fuel Igniters for Ramjet Engines and Guided Missiles
13. Aircraft Engine Igniters
14. Water Markers
13. Beat Sources
16. Special Devices
reaction within a mixture of a fuel and an oxidant.
Additives or modifiers may be included to produce
more saturated colored flames, to adjust burning
rates, to produce colored smoke clouds, and to
increase storage life and processing safety.
Pyrotechnic devices are employed in such a
large variety of munitions that classification is
difficult. These devices are, however, tabulated,
with their principal uses, in Table 2-1.
2-1.2 CHARACTERISTICS OF PYROTECHNIC
COMPOSITIONS12 4e'7
The applicability of a specific pyrotechnic mix-
ture for a particular application is governed by
many “yardsticks.” Consideration must be given,
not only to the terminal effectiveness and output
desired, but also to overall performance and re-
producibility, and processing and storage char-
acteristics. Precise and analytical determination
of the various parameters involved requires con-
tinued research to develop improved evaluative
methods.
The more important characteristics of pyro-
technic compositions used for military purposes
may be stated as follows:
2-1.2.1 Performance Characteristics
a. Heat of reaction, cal/gm or cal/ее. May be
used as a basic criterion for selection of fuel-oxi-
dizer combinations.
b. Burning rate, inches/seeond inches per
minute, seconds/inch. Applied to consolidated mix-
tures and measured as a linear rate.
e. Luminous intensity, candela or candlepower.
Visible output or illumination in cardela.
d. Color value. The color quality of a colored
pyrotechnic flame taken as the ratio of the apparent
luminous intensity through an appropriate colored
filter to the total luminous intensity.
e. Visibility. Applied to illuminating and sig-
nal devices; measured in terms of brightness and
other qualities.
f. Efficiency. Relates the output to the original
weight or volume of compositions; for illuminating
or signaling it is expressed as candle/seconds per
gram or per milliliter; for smoke-producing devices
efficiency is considered to be the percent of chem-
ical vaporized based either on the weight of chem-
ical originally contained or on the total weight of
munition, depending on the requirements of the
evaluator.
g. Color and volume of smoke. Compared to
standard charts or by observers’ ability to detect
and recognize, at prescribed distances, the color
and the total obscuring power (TOP).
2-1.2.2 Processing and Sensitivity .Characteristics
Information on the processing, storage, ship-
ping, and sensitivity characteristics of pyrotechnic
compositions can be found in Part Two of this
series, AMCP 706-186.
2-1.2.3 General Functioning Characteristics
a. Ignitibility. The ease With whieh a pyro-
technic composition ignites, determined by standard
time-to-ignition tests described in Part Two of this
series, AMCP 706-186.
b. Hygroscopicity. The ease with which a com-
position picks up moisture at a preselected tem-
perature and relative humidity.
c. Reaction characteristics. Fundamentally im-
portant are the heat of reaet'on and rate of reaction
of a pyrotechnic composition. To make a consoli-
dated composition burn propagatively, sufficient
heat must be evolved and the rate of reaction must
2-3
АМСР 706-185
be of sufficient magnitude to more than compen-
sate for heat losses.
In addition to the heat of reaction and the rate
of reaction, display characteristics are influenced
by many other factors. Some of the more impor-
tant include:
1. Granulation or particle size of ingredients
2. Composition of ingredients
3. Purity of ingredients
4. Burning surface area
5. Heat transfer characteristics
6. Flare ease material and configuration
7. Loading pressure
8. Presence of moisture
9. Degree of confinement
10. Ambient temperature and pressure
11. Method of ignition
12. Lengtb-to-diameter ratio
13. Method and energy of dissemination
14. Bomb burster geometry
15. Velocity, acceleration and aerodynamics of
device
The importance of a particular influential fac-
tor may vary considerably with the application.
Factors such as the average particle diameter, spe-
cific surface, shape, and distribution will affect, the
burning rate of consolidated pyrotechnic mixtures.
Changes in the general characteristics of the flare
case and the area of the burning surface combine
to influence the output of flame producing items
With pyrotechnic delay compositions, the burning
rati1 is of primary significance and may be varied
by changes in the percentages and particle size of
the ingredients in the composition, incorporating
additives, varying the compaction, and by other
means. Nbncousolidated pyrotechnic photoflash
mixtures used in flash items are influenced by the
method of ignition, ratio of length to diameter,
burster geometry, and degree of confinement.
In addition, there are many other factors pe-
culiar to the specific item under consideration that
may exert varying influences on performance. In
the design and development of new pyrotechnic
munitions, a' fresh approach should always be con-
sidered, using the data available on existing de-
vices only as a guideline.
2-1.3 Constituents in Pyrotechnic
Compositions1’2146'7
The constituents upon which the performance
of pyrotechnic compositions and devices is depen-
dent include a basic fuel and oxidizer combination
with other ingredients. These may consist of
dyes, color intensifiers, retardants, binding agents,
water-proofing agents, and substances to create a
specific effect.
Typical ingredients in each of these categories
are:
1. Oxidizing Agents. Nitrates, perchlorates, per-
oxides, oxides, ehromates and chlorates. These are
all substances in which oxygen is available at the
high temperatures of the chemical reaction in-
volved. In addition, fluorinating agents such as
Teflon and Kel-F are finding use as oxidizing
agents.
2. Fuels. Metal powders, metal hydrides, red
phosphorus, sulfur, charcoal, boron, silicon, sili-
cides. When these substances are finely powdered,
they readily undergo an exothermal oxidation with
the formation of corresponding oxides and the evo-
lution of heat and radiant energy.
3. Color Intensifiers. Highly chlorinated or-
ganic compounds, such as hexachloroethane
(CjClo), hexachlorobenzene (CnCl(1), polyvinyl-
chloride, and dechlorane (CioClli:). These com-
pounds are utilized to produce specific spectral
emitters in pyrotechnic flames.
4. Retardants. Inorganic salts, plasties, resins,
waxes, oils. These are used to slow down the reac-
tions between the oxidizing agent and the powdered
metal to produce the desired burning rate. Some
behave merely as inert diluents while others par-
ticipate in the reaction at a much slower rate than
the main constituents.
5. Binding Agents. R .ins, ..axes, plastics, oils.
These an added . > prevent segregation and to ob-
tain more uniformly blended compositions. In ad-
dition, they serve to make finely-divided particles
adhere to tach other when compressed into pyro-
technic items and help to obtain maximum density
and burning efficiency. Binders also frequently
desensitize mixtures which are otherwise sensitive
to impact, friction and static electricity.
6. Waterproofing Agents. Resins, waxes, plas-
ties. oils, dicbroinating solutions. These are used
2-4
AMCP 706-185
TABLE 2-2
COMPARISON OF SOME PROPERTIES OF PYROTECHNIC
COMPOSITIONS WITH EXPLOSIVES
Composition Cal/gram Noncon- densable Gas Volume, cc/gram о и Й И 0J « fi s x о л о 6 •5 ft "й 2 EM**, Cm 'в p о PA***, ~ in.
PYROTECHNIC: Delay Barium chromate Boron 90 10 480 13 0 650 12
Delay Barium chromate Zirconium-niekel alloy Potassium perchlorate 60 26 14 497 12 0 485 56 23
Flare Sodium nitrate Magnesium Laminac 38 50 5 1456 74 8 640 60 19
Smoke Zinc Potassium perchlorate Hexaehlorobenzene 69 19 12 616 62 8 475 23 15
Photoflash Barium nitrate Aluminum Potassium perchlorate 30 40 30 2147 15 7 700 100 26
HIGH EXPLOSIVE: TNT RDX 1060 1240 1000 600 48 60 475 260 100 13 14 5
BLACK POWDER 684 272 8 288 32 16
* 5-seeond value Bureau of Mines “• Pieatinny Arsenal
as protective coatings on metals such as magnesium,
aluminum ami zirconium-nickel alloys to reduce
their reaction to atmospheric moisture.
7. Dyes for Smokes. Azo and anthraquinone
dyes. These dyes provide the color for smokes used
for signaling, marking, and spotting.
Many of the above substances perform more
than one function, thus simplifying the composition
of some pyrotechnic mixtures.
2-1.4 Comparison of Pyrotechnic Mixtures
and Explosives1" 610
Pyrotechnic mixtures can be devised to produce
as little as 200 calories per gram of mixture or iu
2-5
АМСР 706485
excess of 2000 calories per gram. Reaction tem-
peratures exceed 3000°K in some eases.
Such amounts of energy and the high tempera-
tures attained can be extremely dangerous. In gen-
eral, because the quantity of gas produced is less,
and the release of energy is at a lower rate, the
terminal effects produced by pyrotechnic composi-
tion are less severe than those produced by high
explosives.
A comparison of some of the more important
properties of pyrotechnic compositions and ex-
plosives is given in Table 2-2. As indicated in this
table, pyrotechnic compositions, in general, are not
as sensitive to heat as explosives. Impact values
listed indicate that some pyrotechnic compositions
are at least as sensitive to shock as explosives.
REFERENCES
1. G. Weingarten, Chemistry of Pyrotechnics,
oral presentation at Picatinny Arsenal, Dover,
N. J., 1955.
2. D. Hart, Research and Development of Mili-
tary Pyrotechnics, Picatinny Arsenal, Dover,
N. J., 1955.
.3 . S. Sage and R. W. Evans, “Pyrotechnic Re-
search Comes of Age,” Ordnance 48, 262
(1964).
4. H. Ellern, Modern Pyrotechnics, Chemical
Publishing Co.. 1961.
5. L. Katz, “Pyrotechnics in Missile Design,”
Ordnance 44, 334 (1959).
6. TM 9-1910, Military Explosives.
7. TM 9-1370-200, Military Pyrotechnics.
8. H. Ellern, “Military PjTOtechnics,” Ord-
nance 44, 662 (1960).
9. T. С. О’Hart, Elements of Ammunition, John
Wiley & Sons, N. Y., 1946.
10. T. L. Davis, Chemistry of Powder and Ex-
plosives, John Wiley & Sons., N. Y., 1943.
2-6
АМСР 706-185
CHAPTER 3
PHYSICAL-CHEMICAL RELATIONSHIPS
The output characteristics of a pyrotechnic
munition are determined, to a large extent, by the
temperatures to which the reaction products are
heated as a result of the chemical reaction between
the fuel and oxidizer. The maximum temperature
of the reaction products depends on: (1) the state
of the products at the reaction temperature, (2)
the heat evolved by the exothermal chemical reac-
tion, and (3) the rate of heat production and heat
loss. Physical-chemical relationships allow the
state of the products, the energy released, and the
maximum reaction temperature to be calculated.
The rate of heat production and heat loss, which
are influenced by the ambient temperature and
pressure, confinement, arid many other inter-re-
lated factors, can also be calculated for certain
simple oases. However, for mosi reactions, these
quantities must be determined experimentally.
The physical-chemical relationships which are
applicable to pyrotechnics are summarized in this
chapter, and pertinent examples are given to il-
lustrate their application.
3-1 STATE OF A SYSTEM
The state of any system (gas, liquid, or solid)
can he described by specifying a sufficient number
of its properties such as mass, volume, temperature,
and pressure. These properties are classified as:
(1) extensive properties which depend on the size
of the system, and (2) intensive properties which
are independent of the size of the system. It is
unnecessary to specify all the properties of a sys-
tem in order to characterize its state; two indepen-
dent variables, commonly the intensive variables of
pressure and temperature, are sufficient for a given
amount of pure substance. A mathematical expres-
sion for this relationship is an equation of state
which, for one mole of a pure substance with vol-
ume as th dependent variable, has the form:
V = f(T,p) (3-1)
Similar expressions can be written with T and p as
the dependent variable. If a system has n com-
ponents, n-1 composition variables must be speci-
fied.
3-1.1 THE GASEOUS STATE
The gaseous state is characterized by changes
in volume with changes in temperature and pres-
sure. Gases normally have no bounding surface
and, therefore, tend to completely fill any avail-
able space. A knowledge of the behavior of gases
with changes in temperature and pressure is es-
sential because of the importance of the gaseous
state at the high temperatures involved in pyro-
chemieal reactions.
Gaseous products formed in the combustion of
many pyrotechnic mixtures may range from es-
sentially zero, for most thermites and some types
of delay mixtures, to 15 to 20 percent for light-
producing compositions, to 50 percent for some
smoke-produeing mixtures. At the high tempera-
tures produced by the burning of pyrotechnic
compositions, many substances not usually con-
sidered gaseous will exist in the gaseous state.
Tbe formation of gas, both as a permanent product
and as an intermediate product which exists only
during the reaction, is indicated in light-produc-
ing mixtures by the presence of a flame. Gaseous
combustion products are necessary in smoke-pro-
ducing mixtures to aid in the formation of dis-
persed, particulate matter and to carry this matter
into the atmosphere.
3-1.1.1 Ideal Gases
The behavior of gases at low pressures and
high temperatures is often approximated by an
equation of state known as the ideal gas law:
W
pv = nRT (3'2)
where p is the pressure, г is the volume, n is the
3-1
АМСР 706-185
number of moles, R is the universal gas constant,
T is the absolute temperature, IV is the weight of
gas, and M is the molecular weight of the gas, us-
ing any set of consistent units. The density d of
an ideal gas at various temperatures and pressures
is:
IV pM
v ' ~ RT
(3-3)
The ideal gas law applies, strictly, to a hypo-
thetical gas, which is composed of mass points be-
tween which no forces are acting. At the high
temperatures and relatively low pressures pro-
duced by burning unconfined pyrotechnic com-
positions, the ideal gas law is fairly accurate. At
the higher pressures which may be produced when
a confined pyrotechnic composition is burned, the
behavior may deviate appreciably from that of an
ideal gas.
3-1.1.2 The Un'versal Gas Constant and Standard
Conditions
It has been determined that one mole of an
ideal gas occupies 22.414 liters at 273.16°K and
one atmosphere. Then, from Equation 3-2:
be given in weight units of a particular gas in-
stead of in moles. In this case:
«' = 4 (3-5)
where M is the molecular weight of the gas, and R
is the universal gas constant.
3-1.1.3 Real Gases
In a real gas, the forces acting between the
molecules as well as the volume of the molecules
cause deviations from ideal behavior. Several equa-
tions of state have been proposed to more closely
approximate the behavior of real gases. Some of
these equations of state include:
Von der Waal’s Equation:
p 4- («' — “И — ”^7' (3-6)
where a is a correction for the forces between mole-
cules of a real gas, and b, termed the co-volume,
is a correction for the volume of the molecule.
The units used for a and b must be consistent with
those used for the other variables.
(W^dU) Jiter-a^
(273.16) “Kmole
Abel’s Equation:
(P) (’’ — nb) — nRT (3-7)
(3-4)
The universal gas constant R has the units of
energy per degree-per mole. It may be calculated
from Equation 3-4 for one mole of gas at standard
conditions. The value of R must be consistent with
th;' units of pressure, temperature, and volume
Used in the ideal gas law. Some values of R in-
clude :
where b is the correction for the vo’ume of the
molecules. This equation, which is a modification
of Van der Waal’s Equation, applicable where the
pressure is high, has been quite widely used for
calculations involving explosives and propellants.
Virial Equation :
pv = >iRT(l ++---) (3-8)
Value Units
0.08205 liter atmospheres
gram mole degree Kelvin
10.73 psia cubic feet
pound mole degree Rankine
1.987 calories
gram mole degree Kelvin
1 '187 BTIJ
pound mole degree Rankine
In some references, including many of those deal-
ing with rocket propulsion, a gas constant R' may
where the coefficients В, C, etc., vary with tem-
perature and are called the second, third, etc.,
virial coefficients. This particular equation is a
very general equation of state for real gases. By
using enough terms, the values calculated from
the above equation can he made to agree with ex-
perimental data as closely as desired.
Comprcssibilitу Factor
The deviation of a gas from ideal behavior can also
be expressed by the use of a compressibility factor
К where:
3-2
AMCP 706-185
Raducad Pnaaure
Figure 3-1. Compressibility Factors as a Function of Reduced Pressure
pv
it liT
(3-9)
of. ill terms of reduced variables:
К = (Constant)
(3-10)
ill which a reduced variable is the variable divided
by its value at the critical point, i.e. :
V> ~ P T, -- ( 7’/T, ), and Г, Г/I’,, (3-11)
1 he critical point is defined when the proper-
ties ot a liquid and gas phase which are in equi-
librium become identical. The p. r. and 7’ quan-
tities, associated with this critical point, are de-
fined as p,. a., and T,. Therefore, as predicted by
the Jaw of eorrespomlill>r states, if К is plotted
against />, at a giv n 7',. <1 single curve will result
tor all oases as shown in Figure 3 1. The com-
pressibility factor estimated from these curves
allows a value for any one of the three variables
p, f, and 7’ to be calculated in terms of the other
variables with a fair degree of aeeuraey. The com-
pressibility factor can be determined, experi-
mentally or by calculation using a suitable equa-
tion of state.
3-1.1.4 Gas Mixtures
(las mixtures are normally treated by Dalton’s
Law, i.e..
-- Pt d- Ре 4-----1 p, (3-12)
where the partial pressure p, of each of the com-
ponents is defined as the pressure which would be
exerted if it ore 1111 ied the total volume at the same
temperature, (Jas mixtures can also he treated by
the Am.igat additive volume law:
3-3
АМСР 706-185
Vtotal — v 1 + 4-------— X (3-13)
« = 1
where the volumes of the individual components
i>i. etc., are the volume each would occupy at
the (total) pressure and temperature of the mix-
ture. For ideal gas mixtures, the results obtained
with this equation will be the same as those ob-
tained by use of the additive pressure law. The
application of both of these laws to real gas mix-
tures is somewhat more difficult.1
3-1.1.5 Sample Calculations
Example One: Analysis of the product gases
produced by a burning fuel block composition,
containing ammonium nitrate and charcoal, indi-
cates that the reaction taking place could be repre-
sented by the overall reaction:
6NH4NO3(s) 4- 4C(fr) -> HH20(g) 4-CO(g) 4- 3CO»(g) 4- 6N2(g) 4- H2(g)
(a) The volume of gas produced per gram of mix-
ture burned at standard temperature and pressure
can be calculated from the above reaction and the
ideal gas law. The reaction produces 22 moles of
product gases from 6 moles of NH4NO3 (480
grams) plus 4 moles of charcoal (48 grains) or a
total of 528 grams of fuel block.
Moles of gas per gram of fuel block burned:
22
-r—- = 0.041 moles per gram
Volume of gas produced (STP) per gram of
fuel block burned is:
V — nRT — (0-082) (273)
“ P ~ 1
= 0.918 liters per gram
(b) Since the actual temperature of the product
gases is 1000°C, the calculated volume at this tem-
perature and one atmosphere would be considerably
greater:
1273
Fi«о»“c~ ——=— (0.918) = 4.28 liters per gram
Л 11)
(c) The partial pressure of one of the gaseous
products may be found by using the ideal gas law
and moles of the component desired and the total
volume for n and У. The partial pressure of carbon
dioxide would be calculated as follows:
nCOiHT (3/528) (0.082)(2731
= 0.14 atmosphere
Since the partial pressure is proportional to the
mole fraction of each gaseous component, a simpler
method would be:
Рсог
Molesi-o2
Molest(,tal
\P Ictal)
= 3/22 (1) =0.14 atmosphere
Example Two -. A cylinder having a volume of
one liter is pressurized to 200 atmospheres with
carbon dioxide at a temperature of 40°C. The
amount of carbon dioxide can be calculated by:
(a) Assuming carbon dioxide behaves as an ideal
gas:
p I'M
Hr'
v =
(200) (1) (44-)
(0.082) (313)
= 343 grams
(b) Assuming that carbon dioxide behaves as a
Van der Waal’s gas:
/ w \ 2 "I Г / w \ *1 w_
I~M ) a v - (IF) L = If ftT
u+^—JL
For C(\, a — 3.59 liters2 atm mole-2; b = 0,0427
liter mole 1
200 4-
w \
44/ (0.0427)
= (0.082) (313)
44
Solving cubic conation in w: ie = 625 grams
(e) Vse of the generalized compressibility chart,
Figure 3-1 :
Critical pressure carbon dioxide = 72.9 atmospheres
Critical temperature carbon dioxide = 304.2°K
3-4
АМСР 706-185
Tr
313
304.2
= 1.03
From Figure 3-1, К ~ 0.42
w —
pvM _ (200)(1)(44)
KRT ~ (0.42) (0.082) (313)
=: 608 grams
The experimentally determined value is 835 grams.
3-1.2 THE LIQUID STATE
A liquid, like a gas, has no definite shape and,
hence, takes the shape of the vessel in which it is
placed. The surface of a liquid, in the absence of
other forces, will tend to contract to a minimum
area and is responsible for many of its characteris-
tic properties. The molecules of a liquid are less
mobile than those in gases but more mobile than
those in solids.
In pyrotechnic reactions, liquids are formed
by the melting of solids and condensation of vapors.
Liquid fuels must be vaporized before sustained
combustion will take place. The burning of many
solid fuels, including most of the metal fuels, in-
volves the formation and vaporization of a liquid
phase as a step in the combustion process.
3-1.2.1 Vapor Pressure
The pressure exerted by a vapor, in equilibrium
with a liquid, is the vapor pressure of the liquid.
The vapor pressure increases with temperature
until the critical temperature is reached above
which the liquid cannot exist. The vapor pressure
at the critical temperature is termed the critical
pressure. The* increase in vapor pressure with tem-
perature can be approximated by the empirical
equation
- 0 0,*223(;
log p —• ------------ + ’> (3-14)
where p is the vapor pressure in inilimeters of mer-
cury, T is the absolute temperature CK, and a and
b are empirically determined constants for each
liquid. For example, tiluuiinuin oxide in the tem-
perature range 184'J°C to 22()0°C has constants of
540,000 and 14.22 for a and b. respectively. At
2100°C, the vapor pressure of the liquid would be:
. - 0.05223 (540,000) , . .
10gp= ----------2371 ~ +14-22
log p = 2.32
p -- 210 mm mercury
The vapor pressure of small droplets, such as
mist droplets, is higher than the bulk vapor pres-
sure. If p0 is the bulk vapor pressure of the liquid,
the vapor pressure of a droplet p is given by:
P = P«^l + rrf RT ) (3-15)
where ? is the surface tension, M is the molecular
weight, d is the density of the liquid, r is the radius
of the drop, R is the universal gas constant, and
T is the absolute temperature.
3-1.2.2 Boiling Point
The temperature at which the equilibrium
vapor pressure of a liquid equals the ambient pres-
sure on the surface of the liquid is known as the
boiling point. If the ambient pressure is one at-
mosphere, the temperature at which the liquid boils
is termed the normal boiling point. For many
liquids, the normal boiling point is approximately
two-thirds of the critical temperature. According
to Trouton ’s Rule, the number of calories required
to vaporize one mole of many liquids, including
some of the laetals, is about twenty-one times its
normal boiling temperature (degrees Kelvin). By
use of Trouton’s Rule, the heat of vaporization of
some of the metal fuels can be approximated if the
boiling temperature is known.3
Lithium has a boiling point of 1331°C (lf>04°K)
and its reported heat of vaporization is 32,190
calorics per mole. Applying Trouton’s Rule:
— 1604(21) — 33,700 calories per mole
3-1.3 THE SOLID STATE
Solids have a fixed shape and volume with the
individual units (atoms, molecules or ions) so
firmly bound together that, there is little freedom
Гог translational motion. Crystalline solids exhibit
orderly internal arrangements and exhibit a sharp
melting point. Crystals whose properties are lif-
ferent along different axes of the crystal are called
anisotropic; if tin* properties are the same, they
are called isotropic. Amorphous solids (such as
3-5
AMCP 706-185
glass) may be regarded as super-cooled liquids of
high viscosity. They have indefinite melting points
and undefined internal arrangements.
The properties of solids are important to the
study of pyroehemical reactions, which involve
solid ingredients reacting to produce mainly solid
products. Intermediate steps in the reaction in-
volve liquid and gaseous phases; however, some
pyroehemical reactions may proceed by a solid-
solid reaction mechanism.
There are 230 possible crystal forms which can
be grouped into 32 classes which, in turn, can be
referred to one of the following six crystal systems :
1. Cubic. Three axes of equal length inter-
secting each other at right angles.
2. Tetragonal. Three axes intersecting each
other at right angles with only two of the
axes equal in length.
3. Hexagonal. Three axes of equal length in a
single plane intersecting at 60° angles, and
a fourth axis of different length and per-
pendicular to the plane of rhe other three.
4. Rhombic. Three axes of unequal length in-
tersecting at right angles.
5. Monoclinic. Three axes of unequal length,
two of which intersect at right angles.
6. Triclinic. Three axes of unequal length,
none of which intersect at right angles.
The macroscopic symmetry of crystals is dm'
to the regularity of the arrangements of the ele-
mental particles (atoms, ions, or molecules) in a
lattice consisting of a three-dimensional repetition
of some structural unit of fixed dimensions. The
unit cel/ is the smallest unit of the crystal lattice
which retains all the symmetry of tin* macroscopic
crystal. In general, there are several possible ar-
rangements of elementary particles which will
hare the symmetry associated with a given crystal
system, sm-h as the enliie system.
There are three possible arrangements of space
lattices for the cubic system. As illustrated m
b'iglire 3-2 they arc:
1. Simple cubic lattice. < >iie structural unit
at each corner of (he cube.
2. b'aee-ceutered cubic lattiie. One niiit at
each corner of the cube ami one unit iu the
center of each face of the cube.
(1) 12) (3)
Simple
cubic
lattice
Face-centered Body-centered
cubic lattice cubic lattice
Figure 3-2. Cubic Lattices
3. Body-eentered cubic lattice. One unit at
each corner of the cube and one unit in the
center of the cube.
X-rays may be used to determine the internal
structure of crystalline materials, which can be
calculated by Bragg’s Haw-.
nk — 2d sin 0 (3-16)
where n is the order of refirctioii, X is the wave-
length of the X-rays, d is the distance between two
planes, and 0 is the angle oi reflection.
X-ray techniques are employed to identify
many solid products of combustion from pyro-
technic reactions.'1 2 This is especially useful when
analysis of a particular product’s mixture would
not bo practical by wet, chemical methods and
where retention of the sample is desired.
Solids can be divided into three classes based
upon their thermal and electrical conductivities:
1. Conductors or metals which have high con-
ductivities which decrease with an increase
in temperature.
2. Insulators which have low conductivities.
3. Semi-eonduetors which have intermediate
conductivities which increase w'ith rising
temperature, usually as c 1/1 where A is
a constant and T is the absolute temperature.
The thermal and electrical conductivity of pyro-
technic ingredients may be contributing factors
affecting the performance of a particular item.
The thermal conductivity, which is of greater
sigiiitieance, intumm-es the conductive heat trans-
fer characteristics. These properties become very
important in devices dependent mi a functional
transfer of heat sm-h as a " pyro-swileh. " Sm-h
de\ ices may be normally closed or normally open
3-6
АМСР 706-185
and will either be conducting or nonconducting fol-
lowing the pyrotechnic reaction.
The properties of solids are markedly affected
by defects5 in crystal structure. Small amounts of
impurities in an insulating material may make the
material a semi-conductor. Such doped materials
may also exhibit enhanced chemical activities. De-
parture of a crystalline compound from chemical
stoichiometry, due to incorporation of extra atoms
into the crystal at interstitial sites or to vacancies
caused by the absence of atoms from normal sites,
also results in semi-conductivity.
Point defects, including those in which an ion
moves from its lattice site to an interstitial posi-
tion (Frenkel defect), or those in which a pair of
ions of opposite charge are ini.ising from their lat-
tice site (Schottky defect), do not alter the exact
stoichiometry of the solid but do provide a means
by which atoms can move in the solid phase. Linear
defects, dislocations, provide am т means for
atoms to move with respect to each < ,-r in the solid
phase1. These defects provide mechanisms for many
of the processes which occur in the solid state.
They provide sites at which chemical reactions
and physical changes can take place readily. The
point of emergence of a dislocation at the surface
is a site of increased chemical reactivity.
Tin1 presence of crystal defects in pyrotechnic
ingredients can have a marked udluence on the
course of the reaction and, therefore, influence the
characteristic behavior (including stability and out-
put 1 of pyrotechnic compositions.
3-2 THERMODYNAMICS
Thermodynamics is the study of tire quantita-
tive relationships between heat and other forms (if
energy, in all east's, energy can be (‘..pressed as
the product of two factors, an in tensity factor (i.e.,
temperature diflerenee), and a capacity factor ' i.e.,
heat capacity’. In the reaction of a pyrotechnic
composition, the elleiniral energy is converted info
other I'orins of energy, primarily heat and work.
The products (if combnstiim are heated to the reae-
lion temperature, and, if nncoidined, work can be
done against the atmosphere.
In the following paragraphs, certain basic laws
of ihermodynainies, thermochemistry, chemical
ci।Пilibriain. 'he eoneepl of free energy, etc,, are
discussed showing their application in the field of
pyrotechnics. Selected calculations, including those
for adiabatic flame temperatures, which are im-
portant to the overall analysis of chemical reac-
tions, are also presented.
3-2.1 THERMODYNAMIC RELATIONSHIPS
Thermodynamics is based on three laws and the
implications derived from these laws. The applica-
tion of certain thermodynamic relationships de-
rived from the three laws is a useful tool for use
in predicting the performance and outcome of
many physico-chemical systems.
3-2.1.1 First Law of Thermodynamics
The first law of thermodynamics is a statement
of the law of conservation of energy, i.e., that
energy1 can be neither created nor destroyed.
The first law of thermodynamics can h’1 ex-
piessed mathematically:
AL’-</ --»• (3 17)
where </ is the energy in the form of heat, trans-
ferred into or out of the system: w is the energy,
in the form of work transferred to or from the
system ; and AL' is the change in internal energy.
If the system absorbs heat, </ has a positive value;
if the system does work, w has a positive value.
The value of AL’ depends oidy on the initial and
final state of the system. The quantities i/ and w
depend on the path taken from the initial to the
final state. For a cyclic process, i.e., a process
which has the same initial and final stage, ДЕ = 0
so that <i = w.
3-2.1.1.1 Heat Effects at Constant Volume and
Constant Pressure
The heat released by a pyroteehnie reaction can
raise tin1 temperature of the reaction products,
cause phase changes, and cause other chemical re-
actions ( aieh as dissociation) to take place, If a
ehetnicid reaction or physical change takes place at
constant volume, and only pressure-volmne work
is considered, the amount of work done is zero and
the beat effect accompanying the reaction is equal
to the change in internal energy.
</, AL’ (3-18'.
3-7
АМСР 706-185
Chemical reactions, including many pyrotechnic
reactions, and physical changes may also take place
nt constant pressure where only pressure-volume
work is considered and the heat effect is equal to
the internal energy change plus the work done in
expansion.
q,= ЬЕ + pM> (3-19)
In this case, it is convenient to use another thermo-
dynamic property, the enthalpy II, defined by.
H — E + pV (3-20)
Then, for a chemical reaction or phase change oc-
curring at constant pressure, when only pressure-
volume work is considered:
Ml = AE -I- pAt- (3-21)
and the heat effect at constant pressure is equal to
the change in enthalpy :
(/„ = Лй (3-22)
If gaseous products are assumed to behave ideally :
MI = MJ + MiKT (3-23)
where An = — n (products) — L'n (reactants) for
the gaseous materials involved in the reaction.
Therefore, pyrotechnic reactions involving solid
reactants and the formation of gaseous products
where heat is evolved (exothermic) will have a
higher heat of reaction at constant volume, A£(qv),
than at constant pressure, Ml(.qp). In the latter
ease, </p is reduced by tin* heat equivalent of the
increased gaseous products, MiKT. These relation-
ships can be used Io obtain values equivalent to the
standard heat of reaction from bomb calorimetric
measurements made at constant volume.
Pyrotechnic reactions take place under condi-
tions of either constant volume, constant pressure,
or combinations of both. Constant volume condi-
tions occur for delay systems that are obturated,
and constant pressure systems occur for flares, sig-
nals, smokes, and the like. In photoflash items, such
as cartridges or bombs, the confined composition
functions under constant volume conditions when
initiated ami it then continues to react at constant
pressure when dispersed as the case ruptures.
3-2.1.1.2 Heat Capacity
The heat capacity of a system is defined as the
quantity of heat required to raise the temperature
1°C or, expressed mathematically:
C = (3-24)
Under conditions of constant volume, dq — dE,
Equation 3-18, and the heat capacity at constant
volume is equal to the change in internal energy
with temperature, or;
c-=(>). (3-25>
While the internal energy E is a function of the
three variables T. P, and -i>; only two are required
to define the system. A derivative, therefore, with
respect to only one variable T is expressed as a par-
/ЭЕ\
tial derivative ( j with the subscript v denoting
the variable to be held constant.
At constant pressure, the he&t capacity includes
both the heat absorbed to increase the internal
energy plus the heat equivalent of the work term
p dr. Since, under these conditions, dq — dH,
Equation 3-22, the heat capacity at constant pres-
sure is equal to the change in enthalpy with tem-
perature, or :
/ dH\
(',,^('ът')р (3’26)
The heat capacity at constant pressure can be
calculated by equation of the form (either one) :
Up — и -f- bl -|- cT~
Cp^ « + l,T + c7’ (3-27)
where u, b. and e are constants. This type equa-
tion applies over a more or less limited range of
temperatures and for many thermochemical cal-
culations it is more convenient to use an average
heat capacity defined by:
CT,
J
f'- Ттг-т; <3*28)
When necessary. can be obtained by subtracting
If (the universal gas eonstunt) from the value for
Up.
3-8
AMCP 706-185
Heat capacity values are essential for many
thermochemical calculations involving pyrotech-
nics. The temperature attained by the products of
a pyrotechnic reaction will depend, in part, on the
heat capacity of these products. Calculations of
the heat balance for a given system utilize the
heat capacity to obtain the enthalpy change in
going from one temperature and/or state to an-
other, The latest tables, however, provide enthalpy
changes directly, making it unnecessary to calcu-
late heat capacities independently.
3-2.1.1.2.1 Heat Capacity of Gases
According to the kinetic theory of gases, the
heat capacity of ideal gases, and of monotomie real
gases such as helium and argon, to relatively high
temperatures is:
C\. — 3/2 R = 3 eal/gmole °K (3-29)
-= Cv R = 5 eal/gmole °K (3-30)
Diatomic real gases, including gases such as oxygen
and nitrogen, and linear polytomie molecules have
two degrees of rotational freedom in addition to
the three degrees of freedom associated with trans-
lational motion. At normal temperatures the heat
capacities of these gases are approximately:
C„ = 5/2 R — 5 cal/gmole °K (3-31)
Cf = + R = 7 eal/gmole aK f3-32)
3-2.1.1.2.2 Heat Capacity of Liquids and Solids
According to the law of Dulong and Petit, the
molar heat capacities of solid elements (especially
the metals) (', and Cp are approximately 6 calories
per gram-atom per degree-Kelvin. This is in agree-
ment with the values of 3R, i.e., 5.96 calories per
gram-atom per degree-Kelvin, suggested by kinetic
theory.
The molar heat capacities of solid compounds
can be estimated by using Kopp’s Pule which states
that the heat capacity of a solid compound is ap-
proximately equal to the sum of the heat capacities
of the constituent elements. In using this rule, the
following atomic heat capacities are assigned to
the elements: l.h; 11. 2..'I ; Jt, 2.7; Si, З.Ь; O,
•I t); F, 5.1); P. .>.4 ; S, a.-l; and all others, 6.2.
Other methods are available for estimating heat
capacities of solids at higher temperatures.® Where
these values are not available, the room tempera-
ture value may be used in conjunction with a value
of 7.25 calories per gram-atom per degree-Kelvin
for the next transition point, assuming a linear in-
crease of Cp with temperature.
The heat capacities of molten inorganic sub-
stances do not differ greatly from those of solid
materials. When handbook values are unavailable,
Kopp's Rule may also be applied to compounds by
assigning the following values of atomic heat
capacities to the atoms of the liquid: C, 2.8; H,
4.3; B, 4.7: Si, 5.8; O, 6.0; F, 7.0; P, 7.4; S, 7.4,
and to most other elements a value of 8.0.
Other methods for estimating heat capacities
of liquids and solids are available.0 In most cases,
calculations are unnecessary, as the values have
been experimentally determined and may be ob-
tained from handbook tabulations.
The heat capacity of liquids and solids decreases
considerably with a decrease in temperature and
is zero at absolute zero. For temperatures below
50°K, the Debye Equation applies and:
— 4(54 ->__________7’:l calorie________
1 — - qs degree-Kelvin gram-atom
(3-33)
where T is the absolute temperature in degrees-
Kelvin, and H is termed the characteristic tempera-
ture and is defined by:
H - (3-34)
к
where h is the Planck constant, к is the Boltzmann
constant and v„, is the maximum vibration fre-
quency. These values may be found in a suitable
handbook.
3-2.1.2 Second Law of Thermodynamics
The second law of thermodynamics may be ex-
pressed in many ways. A very gem ral statement
is that any spontaneous change will render a sys-
tem and ils surroundings closer to an ultimate state
of equilibrium from which no further change can
spontanemisly occur. That is, any isolated system
left mmltended will change toward a condition of
maximum probability. In order to obtain a quan-
titative measure of the probability or randomness
3-9
АМСР 706 185
of a system, the concept of entropy has been estab-
lished.
The absolute entropy N of a substance in a par-
ticular state—under specified conditions of tem-
perature, volume and pressure and in a known state
of aggregation; solid, liquid, or gas—is propor-
tional to the logarithm of the probability of finding
the substance in that state.
8~klnW (3-35)
where к is Boltzmann’s constant, and W is the
probability.
Entropy, like internal energy, depends only on
the initial and final states of a system and, for an
infinitesimal reversible process, is defined by the
equation:
M = (3.36)
where dq(rev) is the heat absorbed from the sur-
roundings in a reversible process, i.e., a process
carried out in sneh a manner that d. could be re-
versed by an infinitesimal change in external con-
ditions. Entropy has the same units as heat ca-
pacity, i.e.. calories per gram atom per degree-Kel-
vin.
By using entropy, the second law can be ex-
pressed mathematically:
A.S' system AN sur-mndings () (3-37)
Every spontaneous change in a system, therefore,
is in a direction such I hat its entropy, phis that of
its surroundings, increases. However, if the sys-
tem alone is considered, spontaneity of chemical
reactions may be treated by taking two driving
forces into account ; a tendency tn adopt the lowest
energy and a tendency to adopt the highest, en-
tropy If the two changes are opposed, the system
will proceed in the direction of the larger change.
If the two quantities are exactly equal, no change
will occur and the system is said to be at equi-
librium, 'I'hi' net driving force is te'med the Work
Function or Helmholtz tree energy .1. and at con-
st aul temper,it lire :1
Al A/,’ TAN (3-38)
l-’or a spontaneous pr<"-ess at constant volume and
constant temperature, A. J is always negative:
(AA)r.r <0 (3-39)
For pyrotechnic reactions, many of which proceed
at constant pressure and temperature, the Gibbs
free energy F is a more useful function. The driv-
ing force or change in free energy is important and
is expressed by:
AF = Д7/— TAN (3-40)
In this ease, the criterion of spontaneity is:
(AF)r.r <0 (3-41)
As a consequence of Equations 3-38 and 3-40, addi-
tional statements may be made regarding the spon-
taneity of chemical reactions. These are summa-
rized in Table 3-1.
At ordinary temperatures, entropy effects are
small so they have little effect on the direction of a
chemical reaction unless the difference in energy
AE or А7/ between reactants and products is rela-
tively small. At. higher temperatures, such as those
resulting from pyrotechnic reactions, the relative
importance of the change in entropy increases until
it becomes a dominant factor. Hence, all chemical
reactions which involve an increase in entropy will
occur spontaneously if the temperature is high
enough. A discussion of free energy and the equi-
librium constant is presented in Paragraph 3-2.3
3-2.1.3 Third Law of Thermodynamics
According to the third law of thermodynamics,
the entropy of a perfect crystalline substance at
()°K is zero. Although it is impossible theoretically
to attai’i absolute zero, the validity of tne third law
1ms been checked by experimentation. It can also
be shown that the '•>)troj>i<*s of all pure chemical
compounds in their stable states at ()°K are zero
beeanse their formation from the elements is:
AN,, I). This law states that absolute entropies
or so-called third law entropns can be determined
from heat capacity data extrapolated to 0nl< which
can be used in equilibrium calculations:
the increase in entropy, is ob-
7’,,
3-1(1
AMCP 706-185
TABLE 3-1
CRITERIA OF SPONTANEITY
Conditions Ту <e of Reaction Criteria
General . Reversible Spontaneous AS (total) — 0 AS (total) > 0
E, v constant Reversible Spontaneous AS (isolated system) =0 AS (isolated system) > 0
T, v constant Reversible Spontaneous ДА = 0 ДА < 0
7’, p constant Reversible Spontaneous AF - 0 AF < 0
S, v constant Reversible Spontaneous AE = 0 A£ < 0
S, p constant P wersible Spontaneous ah = e AH < 0
tained for each phase by graphical integration and
Affpc
— , the entropy increase due to a phase change,
is determined for each of the phase changes. The
Debye Equation (Paragraph 3-2.1.1.2.2) is used
for the temperature range 0°K to approximately
50°K as experimental data are difficult, to obtain
in this temperature lange. Absolute entropies can
also be calculated by the method of statistical
mechanics.5
3-2.2 THERMOCHEMISTRY
Thermochemistry is the study of the heat effects
accompanying chemical reactions, the formation of
solutions, and changes in state such as fusion and
vaporization. Since the amount of heat liberated
from a pyroteeiinic reaction strongly influences the
characteristic output, an understanding of the
principles and application of thermochemistry is
of vital importance.
The heat evolved (or absorbed) in a chemical
reaction depends upon:
1. The properties of the products and reac-
tants, and the amount of these substances in-
volved.
2. The physical state of the substances in-
volved.
3. The temperature and pressure at which the
reaction takes place.
4. Whether or not the reaction is at constant
volume or coi stant pressure.
The specific influence of these conditions is de-
scribed in the paragraphs whieh follow.
3-2.2.1 Heats of Reaction
The heat effect associated with a pyrotechnic
or other chemical reaction is the heat of reaction.
The heat of formation is the heat of the reaction
associated with the formation of a compound from
its elements. The heat of combustion is the heat of
the reaction associated with the complete com-
bustion of a substance in oxygen. The heat of ex-
plosion is the heat of reaction associated w;th the
rapid explosive decomposition of a material in an
inert atmosphere.
For pyrotechnic reactions at constant pressure,
if only pressure-volume work is considered, the
heat effect qf can be obtained from the enthalpy
change for the reaction as follows:
qp — AH (reaction) — S£f (products)
— SH (reactants) (3-40)
If the reaction is a standard state reaction,
where the reactants in their standard states react
to give the products in their standard states and
the standard heats of formation AHT° (f) of the
elements is assumed to be zero at any given tem-
3-11
АМСР 706-185
Figure 3-3. Effect of Temperature on Enthalpy Change for Chemical Reaction
Сро + ДНрс
perature, then the standard heat of reaction &Ht°
(reaction) is:
&HT° (reaction) = ДЯ(/)r° (products)
— Д#(/)г° (reactants) (3-41)
The actual choice of standard states is somewhat
arbitrary. Normally, the standard state is the most
stable state at one atmosphere pressure and at the
given temperature. (Most tabular data are given
at 0°K or 298°K.)
Most thermochemical calculations are based on
tabulated standard heats of formation. The heat
ffect ut constant pressure (qp) can be calculated
by:
(Qp)t’ (reaction) ~ (reaction) =
(reaction) (3-45)
Unless the actual pressure is high, no appreciable
error is introduced.
Similarly, the heat effect at constant volume
(<7„) can be obtained by:
(q„)t (reaction) = SE (reaction)
es &ET° (reaction) = 2ДЕ(/)Т° (products)
— 2ДЬ"(/)г° (reactants) (3-46)
3-2.2.2 Effect of Temperature on the Heat of
Reaction
As illustrated schematically in Figure 3-3, the
heat of reaction at ar>v temperature T and constant
pressure is:
Mir1 — &HT°R -f-- CpdT (reactants)
T
T
4- 2 CpdT 4- ДЯ„,.^ (products) (3-47)
Th
where SHT° is the heat of reaction at temperature
T, MTn is the heat of reaction at a reference tem-
i \
perature Th, 2 ( | CpdT 4- Дйр< ) (reactants) is
T
the heat evolved or absorbed in cooling or heating
the reactants from T to Tlt, including that evolved
or absorbed as a result of phase changes Д1Тр(!.
Similarly, ( f 'cpdT 4- Д77РЛ (products) is the
3-12
AMCP 705*185
heat absorbed or evolved in heating or cooling
the products from TK to T. According to Equation
3-47, if the heat evolved by cooling the reactants
from the higher to the lower temperature is greater
than the amount absorbed in heating the products
from the lower to the higher temperature, the heat
of reaction at the higher temperature will be great-
er than that at the lower temperature.
In cases where reactions begin and end at the
same temperature and where no changes in phase
are involved, the standard heat of reaction at
temperature T is defined by:
rT
^Нг° = ^Нт°к + | A(>Z7' (3-48)
TK
where Д6'р _ SC’P (products) —l’Cp (reactants),
and Hr°R is the standard heat of reaction at the
reference temperature TR. This is known as Kirch-
hoff’s Equation and, for small temperature
ranges, heat capacities may be treated as constant
and the equation reduces to:
Mir ° - „ + A C’p (T-TR) (3-49)
For other eases, experimental heat capacity data
expressed in the form shown in Paragraph 3-2.1.1.2
must be used; however, if enthalpy tables are avail-
able, heat capacity data need not be considered as
sueh.
Where data are required at temperatures above
those listed, it may be necessary to extrapolate the
data to the desired temperature.
3-2.2.3 Enthalpy Tables
Calculations of heat of reaction at different
temperatures are simplified if tabular enthalpy data
are available. Tables 3-2 for solid magnesium ox-
ide, 3-3 for solid aluminum oxide, 3-4 and 3-5 for
solid and liquid sodium oxide, and 3-6 for gaseous7
oxygen, contain these data. In these tables, stan-
dard heats of formation &IIf°, at different tempera-
tures, are tabulated. In other tables only values
for the enthalpy iunetion, H° — along with
the heat of formation at some reference tempera-
ture, usually ()°K or 298.93°K are tabulated. The
heat of reaction at any temperature becomes.-
ДЯ/ MITr ° 4- S(7/° - Hrf. °) (products)
— l!(ff” — HTr °) (reactants) (3-50)
These tables can also be used for calculations
of free energy changes for chemical reactions. This
is shown in Paragraph 3-2.3.5
3-2.2.4 Bond Energies7
Bond energy (B.E.) is defined as the average
amount of energy per mole required to break a
particular type of bond in a molecule. Bond ener-
gies may be calculated when heat of combustion
data are available. However, of greater utility is
the estimation of the heat of reaction from bond
energy data for compounds for which no enthalpy
data are available. In this ease:
Д// = B.E. (bonds broken) — B.E. (bonds formed)
(3-51)
Bond strengths or bond dissociation energies may
differ from mean bond energies derived solely
from thermochemical data on molecules and atoms.
3-2,3 FREE ENERGY AND EQUILIBRIUM
A state of chemical equilibrium exists in any
chemically reacting system when no further change
in composition with time can be detected provided
the temperature and pressure are not altered. The
criterion of equilibrium is that the change in free
energy of any possible reaction under these condi-
tions shall be zero.
(AF)r,e = 0 (3-52)
In order to estimate maximum flame temperatures
from pyrotechnic reactions, a knowledge of the
equilibrium concentrations of the combustion prod-
ucts is required in addition to information on the
heat released. If a state of equilibrium exists among
the product species, the equilibrium composition
for the combustion products is fixed at a given
temperature and pressure (or volume) when the
atomic composition is specified.
Pyrotechnic reactions often involve the oxida-
tion of a metal to form a refractory oxide. This
reaction limits the maximum temperature attain-
able to the vaporization temperature of the metal
oxide whether this oxide decomposes on vaporiza-
tion, or not. The metals commonly used as fuels
in pyrotechnics decompose on vaporization. In
most eases, the metal decomposes to yield metal
atoms; however, a few metal oxides, sueh as alum-
3-13
АМСР 706 185
TABLE 3-2
THERMODYNAMIC PROPERTIES OF SOLID MAGNESIUM OXIDE
Magnesium Oxide (MgO) (Solid) Mol. Wt. — 28,32
T, °K. cal. mole’1 c°p s° deg.-1 . tto U C И -n 29S kcal, mole'1 дн°( AF°< ' Log KP
000 000 INFINITE - 1.235 -142.702 -142.702 infinite
100 200 298 1 865 6.380 8.906 .608 3.369 6.439 12.488 7.184 6 439 - 1.188 - .763 .000 -143.156 -143.559 -143.700 -140.918 -138.501 -135.981 307.961 151.340 99.672
300 400 500 8.939 10.148 10.854 6.494 9.252 11.598 8.439 6.807 7.537 .017 .978 2.031 -143.701 -143.705 -143.654 -135.933 -133.340 -130.755 99.022 72.850 57.150
600 760 800 900 1000 11.323 11.656 11.905 12.098 12.251 13.621 15.393 16.966 18.3W 19.663 8.386 9.263 10.130 10.969 11.775 3.141 4.291 5.469 6.670 7.888 -143,583 -143.513 -143.457 -143.425 -145.541 -128.181 -125.619 -123.067 -120.521 -117.799 46.688 39.218 33.619 29.265 25.744
1100 1200 1300 1400 1500 12.375 12.478 12.565 12.638 12.701 20.837 21.918 22.920 23.854 24.728 12.546 13.283 13.986 14.658 15.301 9.119 10.362 11.614 12.874 14.141 -145.529 -145.538 -145 567 -176.047 -175.712 -115.025 -112.252 -109.478 -106.235 -101.261 22.852 20.443 18.404 16.583 14.753
1600 1700 1800 1900 2000 12.756 12.804 12.845 12.882 12.915 25.550 26.325 27.058 27.753 28.415 15.916 16.505 17.071 17.616 18.139 15.414 16.692 17.975 19.261 20.551 -175.375 -175.034 -174.693 -174.351 -174.008 - 96.309 - 91.378 - 86.467 - 81.574 - 76.699 13.155 11.747 10.498 9.383 8.381
2100 2200 2300 2400 2500 12.945 12.971 12.994 13.016 13.035 29.046 29.648 30.225 30.779 31.311 18.644 19.130 19.600 20.054 20.494 21.844 23.140 24.438 25.739 27.041 -173.665 -173.321 -172,979 -172.636 -172.295 - 71.844 - 67.004 - 62.178 - 57.368 - 52.572 7.477 6.656 5.908 5.224 4.596
2600 2700 2800 2900 3000 13.052 13.068 13.082 13.095 13.107 31.822 32.315 32.791 33.250 33.694 20.920 21.333 21.734 22.123 22.501 28.346 29.652 30.959 32.268 33.578 -171.955 -171.616 -171.280 -170.945 -170.613 - 47.790 - 43.018 - 38.264 - 33.518 - 28.785 4.017 3.482 2.986 0.526 2.097
(JANAF Thermodynamic Table», Interim Table Issued December 31, 1960)
ininn oxide, decompose to yield a mixture of other
oxide molecules. Typical of the decomposition re-
action is the following general reaction:8
MxOy (1) +?//2 O2(n) (3-53)
where represents a metal element. Since the
reactions are reversible, the degree of decomposi-
tion will depend on the oxygen partial pressure as
well as the temperature. At the high temperatures
produced by pyrotechnic reactions, many other
equilibria, such as the dissociations of gaseous
products, relatively unimportant at lower tempera-
tures, must be considered.
3-2.3.1 Chemical Equilibrium
According to the law of mass action as stated
by С. M. Guldberg and P. Waage,” the rate of a
chemical reaction is directly proportional to the
“active masses’’ of the reacting materials. For
any chemical reaction:
aA 4- ЪВ 4- . . . gG 4- Hh . , .
where the capital letter indicates a chemical species
and the small letter indicates the number of moles
of each species.
An equilibrium constant for this reaction, desig-
nated K, can be. written in terms of concentrations:
k(r) ~ [A]“ [B]6
(3-54)
where the open brackets [ ] indicate a concentra-
tion term, fc(f) is the specific rate constant for the
forward reaction, k(r) is the specific rate constant
3-14
АМСР 706-1&5
TABLE 3-3
THERMODYNAMIC PROPERTIES OF SOLID ALUMINUM OXIDE
Aluminum Oxide (alpha A12O3) (Crystal) Mol. Wt. = 101.960
T, K. C°₽ - kcal, mole4 ДН°( AF°f ' Log Kp
8° -(Е°-Н°1И)/Т '
0 .000 .000 INFINITE - 2.394 -397.494 -397.494 INFINITE
100 3.069 1.024 24.184 - 2.316 -398.697 -392.241 857.201
200 12.223 5.946 13.711 - 1.553 -399.838 -385.329 421.047
298 18.889 12.174 12.174 .000 -400.400 -378.078 277.125
300 18.979 12.291 12.174 .035 -400.406 -377.940 275.316
400 22.986 18.339 12.972 2.147 -400.555 -370.418 202.378
500 25.345 23.752 14.598 4,577 -400.475 -362.891 158.612
600 26.889 28.517 16.529 7.193 -400.304 -355.389 129.444
700 27.969 32.749 18.549 9.940 -400.098 -347.920 108.620
800 28.758 36.537 20.565 12.778 -399.889 -340.481 93.011
900 29.354 39.961 22.533 15.685 -399.697 -333.066 80.875
1000 29.814 43.078 24.434 18.644 -404.522 -325.301 71.091
1100 30.176 45.938 26.261 21.644 -404.181 -317.396 63.058
1200 30.464 48.574 28.012 24.674 -403.823 -309.522 56.369
1300 30.995 51.032 29.689 27.745 -403.437 -301.680 50.715
1400 31.290 53.339 31.297 30.859 -403.019 -293.868 45.873
1500 31.620 55.509 32.839 34.004 -402.581 -286.086 41.681
1600 31.920 57.559 34.321 37.181 -402,119 -278.334 38.017
1700 32.220 59.503 35.745 40.388 -401.635 -270.612 34.788
1800 32.490 61.353 37.117 43.624 -401.133 -262.920 31.921
1900 32.760 63.116 38.439 46.886 -400.613 -255.254 29.359
2000 33.000 64.803 39.716 50.175 -400.075 -247.619 27.057
2100 33.220 66.419 40.949 53.486 -399.521 -240.011 24.977
2200 33.450 67.969 42.142 56.819 -398.956 -232.427 23.088
2300 33.670 69.461 43.298 60.175 -398.374 -224.872 21.367
2400 33.880 70.898 44.418 63.553 -397.779 -217.339 19.790
2500 34.100 72.286 45.505 66.952 -397.172 -209.834 18.343
2600 34.310 73.627 46.561 70.372 -396.550 -202.354 17.009
2700 34.520 74.926 47.588 73.814 -395.915 -194.898 15.775
2800 34.735 76.186 48.587 77.277 -536.375 -184.157 14.373
2900 34.940 77.408 49.560 80.760 -535.307 -171.598 12.931
3000 35.140 78.596 50.508 84.264 -534.227 -159.072 11.588
3100 35.340 79.751 51.433 87.788 -533.132 -146.584 10.334
3200 35.530 80.876 52.335 91.332 -532.028 -134.135 9.161
3300 35.720 81.973 53.217 94.894 -530.908 -121.718 8.061
3400 35.906 83.042 54.078 98.476 -529.777 -109.338 7.028
3500 36.095 84.085 54.921 102.076 -528.634 - 96.992 6.056
(JANAF Thermodynamic Tablee, Interim Table Issued March 31. 1964)
for the reverse reaction, and К is the equilibrium
constant. The concentration can be expressed as
a partial pressure or as a mole fraction in addition
to the more common concentration units. For actual
systems, activities or fugacities should be used in-
stead of concentrations.511
When more than one phase is present, as is true
for most pyrotechnic reactions, the equilibrium is
heterogeneous. Since the partial pressures of the
gas phases in equilibrium with the solid phases are
constant at a given temperature, they can be as-
sumed to be incorporated into the equilibrium con-
stant. The expression in terms of partial pressures
for the equilibrium constant, therefore, will in-
clude only terms for the gaseous materials.
The equilibrium between phases is an important
type of heterogeneous equilibrium. The free ener-
gies of the vapor and liquid phases arc the same
which leads to the derivation of the important
('la'isias-Clapeyron Equation :u
dp pMI
~dT = liT-1
(3-55)
In this equation, p is the vapor pressure in milli-
3-15
AMCP 706-185
TABLE 3-4
THERMODYNAMIC PROPERTIES OF SOLID SODIUM OXIDE
Sodium Oxide (Na2O) (Crystal) Mol. Wt. = 61.982
T, °K. 0 100 200 298 cal. mole"1 dee.’1 kc&L mole"1
c; 17.436 8° 17.1*90 17.990 IT о TT° И. —n 298 .000 ДН"( - 99.400 AF°( -90.125 Log KP 66.060
300 17.454 18.098 17.990 .032 - 99.398 -90.067 65.610
400 18.442 23.254 18.687 1.827 -100.647 -86.862 47.457
500 19.430 27.475 20.034 3.720 -100.601 -83.417 36.460
600 20.418 31.105 21.584 5.713 -100.428 -79.995 29.137
700 21.406 34.327 23.178 7.804 -100.138 -76.612 23.918
800 22.394 37.249 24.757 9.994 - 99.737 -73.277 20.017
900 23.382 39.944 26.297 12.283 - 99.235 -69.998 16.997
1000 24.370 42.459 27.788 14.670 - 98.641 -66.780 14.594
1100 25.358 44.828 29.231 17.157 - 97.966 -63.629 12.641
1200 26.346 47.077 30.625 19.742 -143.685 -59.625 10.859
1300 27.334 49.224 31.974 22.426 -142.423 -52.670 8.854
1400 28.322 51.286 33.280 25.209 -141.067 -45.817 7.152
1500 29.310 53.274 34.547 28.090 -139.615 -39.064 5.691
1600 30.298 55.197 35.778 31.071 -138.067 -32.409 4.427
1700 31.286 57.064 36.975 34.150 -136.420 -25.854 3.324
1800 32.274 58.880 38.142 37.328 -134.681 -19.401 2.355
1900 33.262 60.651 39.280 40.605 -132.846 -13.044 1.500
2000 34.250 62.382 40.392 43.980 -130.916 -6.791 .742
(JANAF Thermodynamic Tables, Interim Table Issued June 30.1062)
meters of mercury, T is the absolute temperature,
R is the universal gas constant, and A// is the heat
of vaporization in calories per gram-mole. If A//
ean be considered constant over the temperature
range, of interest, then:
I —MI \ / 1 \
logp— (~9зд~) (у) + Constant (3-56)
This equation is of the same form as the empirical
equation given in paragraph 3-1.2.1 relating change
in vapor pressure and temperature. An equation
of similar form relates the sublimation pressure
and temperature.
The heterogeneous metal oxide decomposition
equilibrium illustrated by Equation 3-53 is im-
portant to the study of pyrotechnic reactions. The
expansion for the equilibrium constant for this
reaction in terms of partial pressures Kp can be
written:
3-2.3.2 The LeChatelier Principle
The LeChatelier principle states that if a stress
is brought to bear on a system in equilibrium the
system will adjust itself to diminish th~ applied
stress. For example, in the decomposition of a
metal oxide in a confined system, the partial pres-
sures will increase and the reaction shifts to the
left. A higher temperature is required to decom-
pose the oxide.
When heat is absorbed by a chemical reaction,
an increase in temperature favors the reaction; on
the other hand, if heat is evolved by the reaction,
an increase in temperature will favor the reverse
reaction.
3-2.3.3 Free Energy and the Equilibrium Constant
For any chemical reaction the change in free
energy is given by
Kt ~ (po2 )v/t (Pm)
(3-57)
M'= RT In ~ (3-58)
К
where po2 is the partial pressure of the oxygen and
Pm is the partial pressure of the metal vapor.
where К is the equilibrium constant. Q is a con-
tinuous function similar in form to К (Equation
3-16
АМСР 706-185
TABLE 3-5
THERMODYNAMIC PROPERTIES OF LIQUID SODIUM OXIDE
Sodium. Oxide (Na^O) (Liquid) Mol. Wt. = 61.982
T, °K. cal. mole'1 dee.'1 TTO TTO n —XL 208 kcal, mole-1— ДН°( AF’r Log Kp
c₽ S°
0 100 200 298 27.000 17.889 17.889 .000 - 93.996 -84.691 62.077
300 27.000 18.056 17.890 .050 - 93.977 -84.632 61.652
400 27.000 25.823 18.949 2.750 - 94.320 -81.562 44.561
500 27.000 31.848 20.948 5.450 - 93.468 -78.470 34.298
600 27.000 36.771 23.188 8.150 - 92.587 -75.553 27.519
700 27.000 40.933 25.433 10.850 - 91.688 -72.787 22.724
800 27.000 44.538 27.601 13.550 - 90.777 -70.148 19.163
900 27.000 47.719 29.663 16.250 - 89.864 -67.624 16.421
1000 27.000 50.563 31.613 18.950 - 88.958 -65.201 14.249
1100 27.000 53.137 33.455 21.650 - 88.069 -62.872 12.491
1200 27.000 55.486 35.194 24.350 -133.673 -59.704 10.873
1300 27.000 57.647 36.839 27.050 -132.396 -53.592 9.009
1400 27.000 59.648 38.398 29.750 -131.122 -47579 7.427
1500 27.000 61.511 39.878 32.450 -129.851 -41.655 6.069
1600 27.000 63.253 41.285 35.150 -128.584 -35.816 4.892
1700 27.000 64.890 42.626 37.850 -127.317 -30.056 3.864
1800 27.000 66.433 43.906 40.550 -126.055 -24.371 2.959
1900 27.000 67.893 45.130 43.250 -124.797 -18.755 2.157
2000 27.000 69.278 46.303 45.950 -123.543 -13.209 1.443
2100 27.000 70.596 47.429 48.650 -122.289 - 7.725 .804
2200 27.000 71.852 48.511 51.350 -121.041 - 2.297 .228
2300 27.000 73.052 49.552 54.050 -119.795 3.070 - .292
2400 27.000 74.201 50.555 56.750 -118.554 8.390 - .764
2500 27.000 75.303 51.523 59.450 -117.316 13.649 - 1.193
2600 27.000 76.362 52.458 62.150 -116.084 18.866 - 1.586
2700 27.000 77.381 53.362 64.850 -114.857 24.031 - 1.945
2800 27.000 78.363 54.238 67.550 -113.637 29.151 - 2.275
2900 27.000 79.310 55.086 70.250 -112.421 34.234 - 2.580
3000 27.000 80.226 55.909 72.950 -111.213 39.269 - 2.861
(JANAF Thermodynamic Tables, Interim Table Issued June 30, 1962)
3-54) but which applies to the “concentrations”
or partial pressures of the products and reactants
at any time during a particular reaction. For real
gases and other substances, the К and Q should be
terms of activities or fugacities. If the reaction is
a standard state reaction, the hypothetical reac-
tion in which the reactants in their standard states
at one atmosphere react to give products in their
standard states at one atmosphere, Q becomes unity
and
AF° = - RTlnK (3-59)
For a gaseous reaction involving gases which ean
be considered ideal:
~ - RT lnKv (3-60)
where Kp is the equilibrium constant, in terms of
partial pressures. For example, the equilibrium
constant for the decomposition of a metal oxide,
Equation 3-57 is related to the standard free energy
change for the reaction, Equation 3-59, as follows:
AF° = _ RT In K„ = - RT In (p02(J)
(3-61)
where р<>г is the partial pressure of the oxygen and
p.w is the partial pressure of the metal vapor.
Hence, the stability of the oxide can be calculated
from frequency data.
3-2.3.4 Free Energy Calculations
Standard free energy changes for chemical reac-
3-17
АМСР 706-185
TABLE 3-6
THERMODYNAMIC PROPERTIES OF OXYGEN
Oxygen, Diatomic (O2) (Reference State—Ideal Gas) Mol. Wt. = 32.00
cal. mole-1 der .L —kcal, mole-*—
T, °K. Cp° S° -(F’-H’ml/T u О TTO H “H 298 ДН’( AF°( Log Кр
0 .000 .000 INFINITE - 2.075 .000 .000 .000
100 6.741 41.522 55.142 - 1.362 .000 .000 .000
200 6.871 46.233 49.641 - .682 ООО .000 .000
298 7.020 49.004 49.004 .000 ООО .000 ООО
300 7.023 49.047 49.004 .013 .000 .000 .000
400 7.196 51.091 49.282 .724 .000 .000 .000
500 7.431 52.722 49.812 1.455 ООО .000 ООО
600 7.670 54.098 50.414 2.210 ООО ООО .000
700 7.883 55.297 51.028 2.988 .000 .000 .000
800 8 063 56.361 51.629 3.786 .000 .000 .000
900 8.212 57.320 52.209 4.600 .000 .000 .000
1000 8.336 58.192 52.765 5.427 .000 .000 .000
1100 8.439 58.991 53.295 6.266 .000 .ООО ООО
1200 8.527 59.729 53.801 7.114 ООО .000 ООО
1300 8.604 60.415 54.283 7.971 .000 .000 ООО
1400 8.674 61.055 54.744 8.835 .000 .000 .ООО
1500 8.738 61.656 55.185 9.706 .000 .000 ООО
1600 8.800 62.222 55.608 10.583 ООО ООО .ООО
1700 8.858 62.757 56.013 11.465 .000 .000 .ООО
1800 8.916 63.265 56.401 12.354 .000 .000 .ООО
1900 8.973 63.749 56.776 13.249 .000 ООО .ООО
2000 9.029 64.210 57.136 14.149 .000 .000 .ООО
2100 9.084 64.652 57.483 15.054 .000 .000 .ООО
2200 9.139 65.076 57.819 15.966 .000 .000 ООО
2360 9.194 65.483 58.143 16.882 ООО .000 ООО
2400 9.248 65.876 58.457 17.804 .000 .000 ООО
2500 9.301 66.254 58.762 18.732 ООО .000 .ООО
2600 9.354 66.620 59.057 19.664 .900 .000 .ООО
2700 9.405 66.974 59.344 20.602 .000 .000 .ООО
2800 9.455 67.317 59.622 21.545 ООО .000 ООО
2900 9.503 67.650 59.893 22.493 ООО ООО .090
3000 9.551 67.973 60.157 23.446 .000 .000 .ООО
3100 9.596 68.287 60.415 24.403 .000 .000 .ООО
3200 9.640 68.592 60.665 25.365 .000 .000 ООО
3300 9.682 68.889 60.910 26.331 ООО .000 ООО
3400 9.723 69.179 61.149 27.302 .000 .000 .ООО
3500 9.762 69.461 61.383 28.276 ООО .000 .ООО
3600 9.799 69.737 61.611 29.254 .000 .000 ООО
3700 9.835 70.006 61.834 30.236 .000 ООО ООО
3800 9.869 70.269 62.053 31.221 ООО ООО ООО
3900 9.901 70.525 62.267 32.209 .000 .000 ООО
4000 9.932 70.776 62.476 33.201 ООО ООО .ООО
4100 9.961 71.022 62.682 34.196 .000 .000 .ООО
4200 9.988 71.262 62.883 35.193 .000 ООО ООО
4300 10.015 71.498 63.081 36.193 ООО .000 .ООО
4400 10.039 71.728 63.275 37.196 ООО ООО ООО
4500 10.062 71.954 63.465 38.201 .000 ООО .ООО
4600 10.084 72.176 63.652 39.208 ООО .000 .ООО
4700 10.104 72.393 63.836 40.218 .000 ООО ОСО
4800 10.123 72.606 64.016 41.229 .ООО ООО .ООО
4900 10.140 72.814 64.194 42.242 .000 ООО .ООО
5000 10.156 73.019 64.368 43.257 ООО ООО .ООО
5100 10.172 73.221 64.540 44.274 .000 ООО .ООО
5200 10.187 73.418 64.708 45.292 .000 .000 ООО
5300 10.200 73.613 64.875 46.311 .000 .000 .ООО
5400 10.213 73.803 65.038 47.332 ООО ООО .ООО
5500 10.225 73.991 65.199 48.353 .000 ООО ООО
5600 10.237 74.175 65.358 49.377 ООО ООО .ООО
5700 10.447 74.356 65.514 50.401 .ООО .ООО ООО
5800 10.258 74.535 65.668 51.426 ООО ООО ООО
5900 10.267 74.710 65.820 52.452 .000 ООО .ООО
6000 10.276 74.883 65.970 53.479 .000 .ООО .ООО
(JANAF ЗЪегтобупжпйс '"'-xbL». IdUthd Table Iwued March 31, 1961)
3-18
AMCP 706485
tions SFT° can be calculated from the standard
free energies of formation, AFr° (f):
№T° = 32xFr°(/‘) products = ЗДРГ°(/) reactants
(3-62)
Standard free energy of formation of the elements
in their standard state at one atmosphere pressure
and at the given temperature is taken as zero.
The standard free energy change and the associ-
ated equilibrium constant (Equation 3-58) are
functions of temperature. The change in free
energy, the enthalpy change AH, and the tempera-
ture are related by the Gibbs Helmholz equation
which, for a standard state reaction, is:
ДН0 -AF° -db.F° d(RTlnK)
T dT dT k
If AH° can be considered constant over the range
of temperature, or is an average valm-:
&F°
— — log =+
AH°
2.3HT
4- Constant
(3-64)
If AH° cannot be treated as a constant over the
temperature range, the calculation of the change in
the equilibrium constant with temperature is more
complicated,
3-2.3.5 Tabulated Free Energy Values
Calculations involving free energy changes at
any temperature are made easier if tabulated values
are available for the standard free energy of for-
mation at various temperatures. Tables 3-2, 3-3,
3-4, 3-5, and 3-6 contain this information in ad-
dition to the information on standard enthalpies of
formation. In these particular tables, the stan-
dard free energies of formation of the compound
from the elements in their standard states, along
with the equilibrium constant for the formation
reaction, are tabulated for various temperatures.
In other tabulations the free energy function
Ft° — Ft It
------у---- *s tabulated for various temperatures
along with the standard free energies of formation
at some reference temperature, where T is the reac-
tion temperature and TR is the reference tempera-
ture.
Then:
ATrrc — (f) products — 3AFtr °(/) reactants (3-65)
4- ST products — ST f reactants
\ T / \ T }
The reference temperatures normally used are two temperatures is related by:
298 °K or 0°K. The free energy change at these
AF208° = 3AH°(f) products—3AH°(f) reactants
(3-66)
3298 (—~'->H products — 3298 (—reactants
\ 298 / \ 298 /
3-2.4 ADIABATIC FLAME TEMPERATURE
The heat produced by an exothermic reaction
raises the temperature of the products formed to
the reaction temperature. This maximum tempera-
ture can be calculated from a knowledge of the
equilibrium composition of the combustion products
and of the energy released by the reaction. The
calculations assume adiabatic conditions, i.e., no
heat is lost to or gained from the surroundings,
and all the heat released is utilized in raising the
temperature of the products and unreacted reac-
tants to the flame temperature. At constant pres-
sure, where the heat effect associated with a given
reaction is equal to its enthalpy change:
u ° (reaction') ЗА7/ (diss) 4- SAHP( 4~ 3
(3-67)
TR
3-19
АМСР 706 185
(°RODUCTSJ, KCAL/MOL
Figwe 3-4. Enthalpy of Aluminum Oxide Versus
temperature
where SHTlt° is the enthalpy change for the reac-
tion at a reference temperature Tff; ЕДЯ (diss) is
the summation of the enthalpy changes associated
with the dissociation of gaseous products and with
ionization if the flame temperatures are sufficiently
high: ЕДЯ,,. is the summation of the enthalpy
changes associated with phase changes in the reae-
p'l'r
tion products; and E I (\ (products) <IT is the
TK
amount of heat necessary to raise the reaction
products to the flame temperature.
Before calculating the enthalpy change for the
reaction, equations must be obtained for the molar
composition of the combustion products allowing
for all elements and equilibrium relationships.1*
The calculation of the adiabatic flame temperatun
is an iterative process for which use of a high
speed computer is recommended.
For simpler cases, where the number of product
species is small, the flame temperature can be cal
eulated by a trial and error process until a tern
perature is found at which all the energy releasee
by the chemical reaction will be absorbed.
The calculation of the adiabatic temperatun
for some chemical reactions, including those involv
ing the oxidation of metals, can be simplified bj
preparing an enthalpy or heat-content graph. This
graph consists of a plot of the heat content (above
the selected reference temperature for the reaction
products) as a function of temperature, using
tabulated values for Ht° — H°coi
heat capacity; heat of fusion; heat of vaporization
and heat of dissociation. The heat of reaction is
located on the ordinate of the plot and the hori-
zontal line is drawn from this value until it inter-
sects the heat content curve.11 The adiabatic flame
temperature is read from the abscissa.
3-2.5 SAMPLE THERMODYNAMIC
CALCULATIONS
The following sample calculations have been
selected to illustrate the application of thermo-
dynamics to pyrotechnic reactions.
Example 1. The adiabatic flame temperature
for aluminum burning in a stoichiometric amount
of oxygen can be calculated as follows. The overall
stoichiometric reaction is.
2A1 (s) fl- 1.5O2 (g) A12O3 (s)
The heat of reaction at 298°K is the same as the
heat of formation of A12O2 (s) ~ 400 kilocalories
per mole. (See paragraph 3-2.2.) The heat con-
tent plot for this reaction is given in Figure 3-4
where the reference temperature is taken as 298 °K.
Approximately 400 kilocalories are released in
the formation of solid aluminum oxide at the
reference temperature of 298°K, As shown in
Figure 3-4, approximately 140 kilocalories of this
energy are required to raise one mole of aluminum
oxide to its boiling point. The difference (400 to
140 kilocalories) is consumed in vaporization of the
3-20
АМСР 706-185
140 -
(PRODUCTS), KCAL
TEMPERATURE. *K
Figure 3-5. Enthalpy of Products or Magnesium-Air
Reaction
liquid aluminum oxide. The vaporization of
A12Ob (1) at approximately 3800°K may take place
as follows:
Al20s(l)-*2A10(g) + 0(g)'
For this reaction, the standard enthalpy change is:
ff°298°x — d5f> kilocalories per mole
As there is not enough energy available to vaporize
all the aluminum oxide, the maximum temperature
is limited to the boiling point of aluminum oxide, or
approximately 3800°K.
Example 2. The adiabatic flame temperature
for magnesium burning in air (20% oxygen, 80%
nitrogen) can be calculated in a similar manner.
The reaction, in this case is:
Mg(s) + ,5O2(g) + 2N2(g) -» MgO(s) + 2N2(g)
The heat, of reaction at the reference temperature
of 298°K is the heat of formation of MgO(s), or
144 kilocalories per mole. Figure 3-5 is a heat con-
tent plot for the products of this reaction where
it is assumed that magnesium oxide vaporizes by
dissociation into atoms. It must be noted that the
nitrogen in the air must be heated to the flame
temperature. The adiabatic flame temperature is
limited to the boiling point of magnesium oxide,
about 3400°K. If the magnesium were burned in
pure oxygen, the calculated adiabatic flame tem-
perature would still be limited to about 3400°K.
Example 3. Compositions containing magne-
sium and sodium nitrate are used in many illu-
minating flares. There are several possible ways
for this reaction to proceed which, in turn, deter-
mine relative amounts of magnesium and sodium
nitrate required for the stoichiometric (balanced)
chemical reaction. Two of the possible stoichio-
metric reactions are:
1. 5Mg(s) 4- 2NaNO3(s) -* 5MgO(s)
4- Na2O(s) 4- N2(g)
and:
2. 6Mg(s) 4- 2NaNOs(s) -> 6MgO(s)
4- 2Na(s) 4- N2(g)
For the first reaction, the ratio of the weight of
sodium nitrate required to weight of magnesium is:
and for the second reaction is:
2(85)
6(24.3)
= 1.166
The heat of reaction for the first reaction at 2!)8°B
is:
1ZZ°2M -~ [5( — 143.8) 4- —99.4] - [5(0) 2( - 115.0) | ~ - 588.4 kilocalories
and for the second reaction is:
AH°208 — [6( —143.8) 4- 2(0)] — [6(0) 4- 2( — 115.01 | = --- 632.8 kilocalories
3-21
AMCP 706-185
From the heat content plots for the two reactions,
Figures 3-6 and 3-7, the adiabatic flame tempera-
ture is nearly the same for both reactions: approxi-
mately 3280°K for the first reaction, and 3400°K
(the boiling point of magnesium oxide) for the sec-
ond reaction.
The reaction equation which best represents
the reaction to produce the products which exist
in the hot (over 2500°K) portions of the flame
plume can be selected from thermodynamic con-
siderations in the following manner.
At 2500 °K, the free energy change associated
with the reaction:
Na20(l) 2Na(g) .5O2(g)
is given by Equation 3-62 (Paragraph 3-2.3.4).
Д^°2боо»л- = [2(0) 4- .5(0)] — [1( -I- 13.649)] = - 13.649 kilocalories
and by Equation 3-64 (Paragraph 3-2.3.4)
,0^,0 - (2) (2.3) (2500) logAp
ld.b49 - шоо
K„ = 15.4
Also: Kr = (P^)* (РОг)* = (4F„2)« • (Po2)*
and: (Po2) ~ -746 atm
Since the calculated (Po2) is greater than the
partial pressure of oxygen in the air, 0.2 atmo-
sphere, the compound Na20 (1) is not thermo-
dynamically stable at 2500°K. Therefore, these
calculations indicate that the second reaction better
represents the stoichiometry of the overall reac-
tion leading to the formation of the product species
present at a flame temperature of 2500°K.
However, the first reaction better represents the
overall reaction to form the products which are
stable at room temperature since similar calcula-
tions indicate that Na2O(s) is the more stable
sodium-containing species at room temperature.
Example 4. IM-11 is a widely used incendiary
mixture. It consists of 50 percent magnesium-
aluminum alloy (50/50) and 50 percent barium
nitrate by weight. This mixture is fuel rich and
if all the fuel is to burn, extra oxygen must be
obtained from the air. If it is assumed that suffi-
cient oxygen is available to oxidize the metal fuels,
a balanced reaction can be written.
On a basis of 200 grams of IM-11, the moles of
each constituent are: Ba(NO3)2, 100/261.4 — 0.38;
Mg, 50/24.32 - 2.06; Al, 50/26.97 = 1.86. Ac-
cordingly, the reaction is:
2.06Mg + 1.86A1 4- ,38Ba(NO3)2 4- 1-480.. 4- 5.92N» -» .38BaO 4- 6.30N2 4- 2.06Mg() 4- .93A12O:1
The heat of reaction at 298°K is:
ДЯ°2»н - [.38 ( - 133.5) 4- 6.3(0) 4- 2.06( - 143.7) 4- .93( —400.4)]
— 12.06(0) 4- 1.86(0) 4- ,38( - 237.06) 4- 1.48(0) 4- 5.92(0) ] = 628.6 kilocalories
The heat content diagram for this system is shown
in Figure 3-8. As indicated on this diagram, the
adiabatic flame temperature is approximately
3400°K,
Less heat is evolved if it is assumed that oxygen
from the air is not available for the reaction.
Example The optimum composition for a
magnesium-sodium nitrate illuminating composi-
6Mg(s) 4- 2NaNO3(s) ->
tion, to be burned at low altitudes where oxygen
is available from the atmosphere, can be estimated
by assuming that the amount of magnesium in
excess of the stoichiometric amount which can be
vaporized by the stoichiometric reaction, based on
the amount of sodium nitrate, can burn in the air.
For the magnesium-sodium nitrate system the
stoichiometric reaction is (see Example 3) :
i>Mg()(s) 4 2Na(s) + N2(g)
tor which the heat of reaction A//°2U() is 632.8 kilo- which could be vaporized by this amount of energy
calories. The number of moles of magnesium a is :
:»-22
АМСР 706-185
900 -
(PRODUCTS,. KCAL
TEMPERATURE, *K
Figure 3-6. Enthalpy of Products of Magnesium-Sodium
Nitrate Flare (Reaction J)
Figure 3-7. Enthalpy of Products of Magnesium-Sodium
Nitrate Flare (Reaction 2)
AW°2e8
All I Mg( v j 13<)6°К - Mg(s)298oK |
632.8 1ГГО ,
40/75 = 15"J“lnoles
so that the weight percentage of magnesium for
the optimum composition would be;
(JiJ t'H-VH’ Mg) __
(77 p 7’7j" (M lb Mg ) “2( M IV N a N t)8)
where V IV stands for the molecular weight.
3-2.6 SUMMARY OF THERMOCHEMICAL
CALCULATIONS
Results ot thermochemical calenlatioiis such as
those illustrated in the foregoing examples, can be
summarized as shown in Tables 3-7 and 3-8. All cal-
(^5^M;i(BOi)X 100 = 75-5%
dilations on these sheets are fur a reference tem-
perature 298.15°K and one atmosphere pressure.
3-3 CHEMICAL KINETICS
Chemical kinetics is concerned with the veloc-
ity of relictions and the intermediate steps (mech-
anisms) by which the reactants are ultimately
3-23
АМСР 706-185
TABLE 3-7
EXAMPLE OF THERMOCHEMICAL CALCULATIONS:
LANTHANUM-POTASSIUM PERCHLORATE REACTION
THERMOCHEMICAL CALCULATIONS*
% Mol Wt MIf Density, g/ml
REACTANTS
Lanthanum (s) 72.6 138.92 0. 6.15
Potassium Perchlorate(s) 27.4 138.55 103.6 2.52
PRODUCTS
Lanthanum Oxide (s) 85.5 325.84 458 6.51
Potassium Chloride(s) 14.5 74.56 104.2 1.99
REACTION CALCULATIONS
8La + 3KC1O4 - —> 4ЕагОз + 3KC1
Stoichiometric: 8(138.92) -b 3(138.6) - 4(325.84) + 3( 74.56)
Thermal: 8(0) 3(103.6) — Wt Reactants, g 1521.2 Theoretical Density (eale.), g/ml 4.41 Heat of Reaction (calc.), Keal 1834 eal/g 1205 eal/ml 5330 Adiabatic Temp (ealc.), °K App. 4750 Gas Volume (calc.), liters 0 4(458) + 3(104.2)
EQUIVALENTS
lOgLa = 0.445 g KCK)4 = 1742 cal
1.0gKC104 = 2.650 g La = 4400 cal
THEORETICAL OPTIMUM COMPOSITION
Lanthanum, % 85
Potassium Perchlorate, % 15
* AU calculations refer to 2!I8.15°K.
converted into the products. As most pyrotechnic
reactions involve heterogeneous systems, the rela-
tively simple kinetic equations developed for
homogeneous systems art* useful but not adequate.
These equations do, however, provide background
for tinderstanding of the chemical kinetics involved
in a heterogeneous reaction. It is to be noted that
the rate of a pyrotechnic n action, which is affected
by external temperature, pressure confinement,
composition, particle size, consolidation, and other
interrelated factors, is usually best determined ex-
perimentally.
3-3.1 MOLECULARITY OF REACTIONS
The simple, intermediate reactions by which
the reactants are ultimately converted into products
can be classified as:
i. Unimoleenlar. A reaction in which only one
molecule reacts to yield the product(s).
2. Bimoleeular. A reaction in which two mole-
cules (of the same or of different kinds)
react to yield the produet(s).
3. TennoJeeiilar. A reaction in which three
molecules react to form the produet(s).
3-24
AMCP 706-185
TABLE 3-8
EXAMPLE OF THERMOCHEMICAL CALCULATIONS:
ZIRCONIUM-OXYGEN REACTION
THERMOCHEMICAL CALCULATIONS*
% Mol Wi Density, g/ml
REACTANTS
Zirconium (s) 74.3 91.22 0 6.49
Oxygen (g) 25.7 32.0 0
PRODUCTS
Zirconium Oxide (s) 100 123.22 261.5 5.6
REACTION CALCULATIONS
Zr(s) + o2(g) — -> ZrO2(s)
Stoichiometric: 91.22 + 32 — - 123.22
Thermal: AHr 0 + o — 261.5
Wt Reactants, gs 123.22
Theoretical Density (calc.), g/ml —
Heat of reaction (calc.), Kcal 261.5
eal/g 2120
Adiabatic Temp (calc.), °K App. 4500
Gas Volume, liters/g 0
EQUIVALENTS
One g Zr — 0.346 g O2 — 2860 cal
OnegO2 = 2.89 gZr = 8250 eal
* All calculations refer to 298.15°K.
(There are few, if any, tennoleeular reac-
tions.)
The over.ill reactions occurring in the burning of a
pyrotechnic composition consist of a sequence
of many simple intermediate unimoleeular, bi-
moleeular and termulecular reactions.
3-3.2 ORDER OF REACTION
The instantaneous rate of a chemical reaction,
as measured by the rate of disappearance of one of
its reactants, ean be written .-
~~t!~ k\A\m \B\n [C]a. . . (3-68)
(I V
where the minus sign indicates the disappearance
of reactant Л, the symbol ( ] indicates concentra-
tions, к is the specific rate constant, and the ex-
ponents m, n, and o, are empirically determined.
For gaseous reactions, concentrations are often ex-
pressed in terms of partial pressures Similar
expressions could be written for the disappearance
of other reactants or for the appearance of any of
the products.
The overall order of the reaction is the sum of
the exponents of the “concentration” terms. The
order of a reaction, with respect to one reactant, is
the exponent of the concentration term for that
reactant. Examples are:
Zero Order.~k (3-69)
dt
The reaction rate is a constant and is independent
of the concentration of the reaetants.
3-25
АМСР 706-185
Figure 3-8. Enthalpy of IM-11 Incendiary Mixture
—«----ENDOTHERMIC
«-EXOTHERMIC
Figure 3-9. The Relationship Between Meat of Reaction and
Heat of Activation
The reaction rate is proportional to the product
of the concentrations of two reactants or to the
concentration of one reactant squared.
Only a very few reactions follow zero, first,
second, or third order reactions. Most chemical
reactions, especially at the high temperatures in-
volved in most pyrotechnic reactions experimentally
determined, are complicated combinations of many
simpler reactions. These complications include
consecutive reactions, reverse reactions, and side
reactions. Hence, it is possible for the order of a
reaction to be fractional.12
First Order:
(3-70)
The reaction rate is proportional to the concentra-
tion of a reactant. In this case, half-life (the time
required for one-half of the reactant present at any
given time to disappear) is independent of the
initial concentration.
Second Order:
(3-71.)
or:
(3-72)
3-3.3 influence cf temperature
ON REACTION RATES
The reaction rate is strongly dependent on tem-
perature. A quantitative relationship proposed by
Arrhenius relating the specific rate constant and
the absolute temperature is:
К = s exp L RT J
(3-73)
where к is the specific rate constant, s is a constant,
A'a is the activation energy, R is the gas constant,
and T is the absolute temperature. Another some-
what more complicated relationship, based on the
theory of absolute reactions rates, is:18
3-26
АМСР 706-185
(3-74)
where к is the specific rate constant, li is the gas
constant, Л' is the Avogadro’s number, h is Planck’s
constant, Л'я is the entropy of activation, Ha is the
enthalpy of activation, and T is the absolute tem-
perature. The relationship between the heat of
activation for the forward and reverse reactions
and the heat of reaction :
Д/7 (reaction) — &Ha (forward) - Д7/а (reverse)
is illustrated in Figure 3-9 for an exothermic
reaction.
3-3.4 CHAIN REACTIONS
Theoretical and experimental results indicate
that atom-molecule and radical-molecule reactions
normally require much smaller activation energies
than reactions between two molecular species. A
variety of chemical processes proceed by mech-
anisms which involve free radicals or atoms
in a .sequence of reactions forming a chain. These
processes include thermal and photo-chemical de-
composition processes, polymerization and depoly-
merization processes under the influence of heat
and light, as well as a variety of oxidations and
halogenations involving hydrocarbons which can
give rise to the production of flames and ex-
plosions.
In a straight chain reaction, a chain carrier—
which may be a free radical, free atom, or an ex-
cited molecule or atom—is proc' .eed by some
suitable primary reaction. This chain carrier reacts
with a molecule to produce1 another molecule and
another chain carrier which, in turn, reacts with
another inoleenl'* to produce anothei chain carrier.
As Ling as the chain remains unbroken, the disap-
pearance of one chain carrier is accompanied by the
formation of another chain carrier. The chain
can he broken by the removal of the chain carriers,
as the result of reactions between chain carriers
or between the chain carrier and other reactive
materials, or by the collision of a chain carrier
with th»* wall of the containing vessel.
In some cases, the reaction of a chain carrier
with a molecule may produce more than one chain
carrier. This multiplication of the number of chain
carriers, or chain branching, can lead to an in-
finitely rapid rate for the reaction. Explosions
resulting from chain branching are definitely dif-
ferent from thermal explosions. In a thermal ex-
plosion, because of the exothermal nature of the
reaction and the difficulties attending heat removal,
the temperature of the system rises rapidly and
an extremely rapid reaction or explosion may re-
sult. A branched chain explosion can take place
even though isothermal conditions are maintained.
3-3.5 HETEROGENEOUS REACTIONS
In heterogeneous systems, reactions take place
at phase boundaries. While the kinetics of chem-
ical reactions involving more than one phase is less
developed than that for homogeneous systems, the
overall process includes at least three steps:
1. Transport of reactants to the phase bound-
ary.
2. Reaction at the phase boundary.
3. Transport of products away from the phase
boundary.
As indicated ear'ier, a series of reactions will have
relatively simple kinetics if the rate of one step is
much slower than any of the others. Heterogeneous
reactions, therefore, are divided into two general
types: (a) transport rate controlled, and (b) phase
boundary reaction rate controlled.
Reactions involving a gas as one of the reactants
arc frequently phase boundary reaction rate con-
trolled at low temperatures and pressures; how-
ever, many of these reactions become transport
rate controlled at higher temperatures. For con-
densed phase reactions, the transport rates will be
even slower so that reactions are often transport
rate controlled even at low temperatures.
3-3.6 IGNITION AND PROPAGATIVE
BURNING
Tiie burning of solid propellants and consoli-
dated pyrotechnic mixtures are similar in many
respects. When raised to their ignition tempera-
ture. they undergo preignition reactions followed
by an ignition reaction. If conditions arc favorable,
3-27
АМСР 706-185
the reaction front moves at a nominally constant
velocity. Propagative burning involves recurring
ignition as the reaction front progresses, therefore,
ignition and propagative burning processes must
be considered together.
3-3.6.1 Ignition
The overall process of ignition involves heating
a portion of the combustible—such as a propellant,
pyrotechnic mixture, or a combustible material in
air—to its ignition temperature, the minimum tem-
perature required for the initiation of a self-sus-
taining reaction. While the overall ignition process
can be stated simply, the mechanism of ignition
is not known in detail. An ignition stimulus, which
can be reduced to the effect of heat absorption,
starts a. sequence of preignition reactions involving
crystalline transitions, phase changes, or thermal
decomposition of one or more of the ingredients.
In many eases involving propellants and pyro-
technic mixtures, a gaseous phase is formed and
combustion starts in the gaseous phase. This is
true for wood and similar materials where combus-
tion starts in the gaseous phase after the formation
of gaseous combustible intermediates by thermal
decomposition of the fuel. Combustion of liquid
fuels also starts and takes place in the gaseous
phase.
The preignition period begins with the appli-
cation of the ignition stimulus and ends with the
start of self-sustaining combustion. During this
period, the rate of heat transfer to, the rate of
heat production in, and the rate of heat loss from
that portion of the material being ignited, are
important. As the temperature rises, the rate of
the heat producing reactions will increase as pre-
dicted by the Arrhenius equation (Equation 3-73).
The rate of heat loss will also increase with tem-
perature but, because of the exponential form of the
Arraenius equation, a temperature may be attained
at which the rate of heat generation is greater than
the rate of heat loss and ignition will result.
The time to ignition can be expressed by an
equation similar in form to the Arrhenius equa-
tion.13’14
. л E°
t A exp --^r
l/T x 10’ °K-'
Figure 3-10. Ignition Time-Temperature Plots for a Binary
Pyrotechnic Mixture
where t is the time to ignition at the temperature T
in degrees absolute; Ea, the activation energy, is a
constant; R is the universal gas constant; and A
is a constant, depending upon the material. A
large number of propagatively reacting systems,
such as explosives, propellants, and pyrotechnic
compositions follow this type of equation. The
value obtained for activation energy for the igni-
tion process can be considered a measure of the
sensitivity of the composition to beat. It will de-
pend, partly, on the specific experimental condi-
tions.
Time to ignition is often measured18’’*’ by
quickly immersing the sample in a suitable con-
tainer into a liquid such as molten lead maintained
at a constant temperature and observing the time
io ignition. As shown in Figure 3-1017 the results
obtained are presented in an Arrhenius type plot
in which the natural logarithm of the time to ig-
nition is plotted against the reciprocal of the abso-
lute temperature. An average value for the activa-
tion energy for ignition can be obtained by:
[2.3(slope)]7?
3-28
AMCP 706-185
Figure 3-11. Model for Burning of Aluminum Particles
where the factor 2.3 is the conversion factor for
natural logarithms into common logarithms and R
is the gas constant expressed in cal per degree
mole.
By using the data plotted in Figure 3-10, the
activation energy Ea for ignition of the magnesium-
sodium nitrate system can be calculated in the fol-
lowing manner:
Slope of line:
m = y- ~ yi - 2-3<log6 — log2)
^2-z/ 10-»(1.118 — 1.064)
0.7782 — 0.3010
0.054
/ О 4772 \
= 23 x 103 = 20.S5 x 10-
Aetivation energy:
Ea= (20.35 X 10s) 2
= 40.7 X 10s cal/mole
1= 40.7 Kcal/moie
2.3 X Ю3
3-3.6.2 Burning of Metal Particles8
A primary characteristic of the burning of a
metal is the limitation of the temperature attained
by the boiling point of the resultant oxide. Al-
though the heats of combustion of metals are rela-
tively high, most of the heat energy obtained from
this reaction is used up by the heat of vaporization
and dissociation of the oxide. Two models for metal
particle combustion which have been proposed based
on studies of the burning of aluminum differ mainly
in the treatment of the condensed oxide formed by
the combustion reaction.18
As hollow oxide spheres are formed in the com-
bustion of aluminum, one of the models for self-
sustained combustion consists of a vaporizing drop-
let of aluminum which is surrounded by a bubble
of molten aluminum oxide. The reaction rate is
determined by diffusion through the alumina
shell.19
The other model consists of a vaporizing drop-
let of aluminum surrounded by a detached reaction
zone where the condensed alumina product ap-
pears as fine droplets. The reaction rate is con-
trolled by the vapor-phase diffusion of aluminum
and atmospheric oxidant to the reaction zone.20
This model, which appears to be most in agree-
ment with the experimental data obtained for burn-
ing aluminum particles,18 is illustrated schemat-
ically in Figure 3-11.
Within the limitation of this model, it is pos-
sible to predict conditions favoring vapor-phase
flames, surface combustion, or no combustion. For
those conditions resulting in vapor-phase combus-
tion, the burning rate of spherical droplets W can
be expressed as:21
W — k^ (3-77)
where r is the radius of the droplet, к is a constant
involving, among other factors, the latent heat of
vaporization, and n is a constant normally having
a value near 1.
3-3.6.3 Burning of Solid Propellants
The burning of solid propellants has been exten-
sively studied and, in some eases, the mechanism
of burning is reasonably well established. Solid
propellants can be classified into two general
types, homogeneous propellants and composite pro-
pellants. Homogeneous propellants are commonly
called double base, or colloidal propellants, be-
cause they consist of a colloidal mixture of nitro-
cellulose and an explosive plasticizer, usually nitro-
3-29
АМСР 706-185
glycerin. Relatively small amounts of other ma-
terials are added to improve the properties of the
propellant. A composite propellant resembles a
pyrotechnic mixture in that it is an intimate mix-
ture of a fuel (reductant) and an oxidizer. It
consists of a finely divided, solid oxidizing agent
in a plastic, resinous, or elastomeric matrix which
normally provides the fuel for the combustion reac-
tion. Solid reducing materials are sometimes in-
cluded and other minor constituents may be added
to modify the properties of the binder or to change
the burning characteristics.
Combustion processes in solid propellants, as
in pyrotechnic mixtures, are complicated because
of the several processes involved in the transforma-
tion of the solid material, at ambient temperatures,
into gaseous, liquid, and solid combustion products
at the flame temperature. In general, for all solid
propellants, the temperature of the propellant a
short distance below the burning surface is not
affected by the combustion of the propellant. In
propagative burning as the burning surface ad-
vances, the unburned propellant is heated, and the
temperature of the material increases to the point
where the propellant decomposes into volatile frag-
ments. In some cases, liquefaction may occur prior
to the chemical reactions which comprise the com-
bustion process.
The solid phase processes for double base pro-
pellants, which take place in a 10~s to 10~2 centi-
meter thick layer, are completed at relatively low
temperatures, near 600°C. The gas phase reactions
can be considered as taking place in three zones.
The first zone exists adjacent to the burning sur-
face, and is called the fizz zone, where some exo-
thermic reactions may take place. In the second
zone, called the preparation or dark zone, activated
intermediates are formed without heat production.
When a sufficient concentration of activated inter-
mediates is developed, the final reaction occurs
in the flame zone; this reaction produces the con-
stant pressure combustion temperature. The thick-
ness of each of the zones increases with a decrease
in ambient pressure.
The burning of composite propellants, as well as
pyrotechnic mixtures involving intimate mixtures
of fuel and oxidizer, is more complicated than the
burning of a double base propellant. In general,
Tm « MAXIMUM reaction temperature
T) - MINIMUM IGNITION TEMPERATURE
T, * FUSION TEMPERATURE
Tu - TRANSITION TEMPERATURE
Te - AMBIENT TEMPERATURE
ди', дг", дг", дг“" - length of zones
I - REACTION ZONE
2 « ZONE OF FUSION
3 ZONE OF CRYSTALLINE TRANSITION
4 - HEAT CONDUCTION ZONE
2 - DIRECTION
V - VELOCITY OF BURNING
Figure 3-12. Model for Steady State Progressive Burning
as for a double base propellant, the burning of a
composite propellant involves the formation of ac-
tive gaseous intermediates from the fuel and oxi-
dant, which then react.
3-3.6.4 Rate of Propagative Burning22
The steady state burning rate of a propagative
burning system is determined, basically, by the
temperature produced by the reaction and by the
amount of heat transferred, mainly by conduction,
to the nnburned composition. These quantities, in
turn, are influenced by the ratio of ingredients, ex-
ternal pressure and temperature, rate of chemical
reaction, thermal conductivity, particle size dis-
tribution, and the porosity of the consolidated com-
position.
If it is assumed that heat transfer by radiation
and diffusion of material can be neglected—and if
iieat losses from the side are insignificant—the
3-30
АМСР 706-185
model for steady state propagative burning illus-
trated in Figure 3-12 is applicable. It is further
assumed that the burning composition can be sep-
arated into reaction and preignition zones defined
by the limits of the maximum reaction temperature,
the minimum ignition temperature, and the am-
bient temperature, respectively.
Heat, produced as a result of chemical reactions
in the reaction zone, is transferred to the adjacent,
unreaeted composition in the preignition zones,
thus affecting physical transitions and initiating
preignition reactions. It is assumed that the tem-
perature gradient across the reaction and preigni-
tion zones is constant with time, and that the posi-
tion of these zones changes linearly with time.
Other assumptions are that the specific heat,
thermal conductivity, and density of the composi-
tion remain essentially constant over the tempera-
ture ranges involved.
For this model, the following equation can be
obtained for the linear rate of burning V:
2 s exp
V =
t
where Q is the heat of reaction; s is the Arrhenius
frequency factor; Nt is the number of fuel particles
per unit volume; n4 is the number of molecules of
ith species, which has an activity A(; and x< is the
order of the reaction. Ea is the energy of activa-
tion, R is the universal gas constant, T the abso-
lute temperature, D the density, Cm the mean spe-
cific heat, and V T the temperature gradient. Ac-
cording to this equation, the rate of propagative
burning is directly proportional to the net heat of
reaction, specific rate, concentration of reactants,
and specific surface, and is inversely proportional
to the density of the composition, mean specific
heat, and temperature gradient across the reaction
and preignition zones. The rate of burning is also
proportional to the thermal conductivity.
The effect of particle size on the rate of propa-
gative burning can be estimated by assuming that
the rate of the chemical reaction is proportional
to the rate of change in volume of the spherical
particles and that the rate of change in the radius
of a reacting partii'b' can be expressed as an ex-
ponential function of the particle mass. Under
Figure 3-73. Differential Thermal Analysis Thermocouple
Circuit
these conditions, At in Equation 3-78 is equal to
the mass of a metal particle m, and Xt is equal to
0.67 (as the surface area of a particle is propor-
tional to its volume to the 0.67th power) plus a
constant h, defined by the equation.
drjdt = k{m')h
Other reaction parameters will remain essentially
constant when the particle size of the metal fuel
is changed, and:
Nu /ти\ <* + й в7>
“ ' N« {mJ
(3-79)
The subscript и refers to the mixture with an un-
known burning rate, and the subscript s refers to
standard. The constant h in the above equation
often has a value of about 0.18. More accurate re-
sults are obtained if h is determined experimen-
tally for each mixture.
'(’hi* derived equation does not include a pres-
sure term; however, several of the parameters
whiin influence the burning rate are affected by
3-31
AMCP 706-185
changes in ambient pressure. The pressure depen-
dence of the burning rate v, for many similar
propagative burning reactions at higher pressures,
is sometimes given as:
v = bp" (3-80)
or by :
t> — a bp"
where a, b and n are constants, and p is the pres-
sure. At the lower pressure normally encountered
in burning of pyrotechnic items, the relationships
between the linear burning rate and the pressure
may be more complicated.
3-4 THERMOANALYTICAL TECHNIQUES23
The thermoanalytical techniques of different al
thermal analysis (DTA) and thermogravimetry
analysis (TGA) are versatile experimental tools
which are finding increased application in chemical
research. Differential thermal analysis involves the
heating of either the ingredient or the mixture
under study and a thermally inert reference ma-
terial to elevated temperatures at a constant rate,
while continuously measuring the temperature dif-
ferences between them as a function of sampled
temperature and time.
Although the techniques of DTA have been
widely used in the study of clays, minerals, and
soils, relatively little work has been reported uti-
lizing this method to investigate and characterize
the thermal decomposition of inorganic com-
pounds. In Figure 3-13, a schematic diagram
illustrates the basic measurements required in
DTA. The temperature differential between an
inert reference compound—e.g., ignited A12O3—and
the material under study is measured and re-
corded as they are both heated to elevated tempera-
tures at a constant rate. The differential tempera-
ture is measured at T ,> and the sample temperature
at Ts.
The reference material chosen should be therm-
ally inert aiid undergo no endothermal or exo-
thermal reactions over the temperature range under
consideration. Consequently, the inert sample heats
at a rate equal to that of the furnace. When the
sample being analyzed undergoes an endothermal
reaction, its temperature remains relatively con-
stant or increases very slowly. Therefore, since the
Figure 3-14.1. Thermogravimetric Curve for the Ingredient
Sodium Nitrate
Figure 3-14.2. Thermogravimetric Curve for the Ingredient
Magnesium
TCMKRATURf <*c>
Figure 3-14.3. Thermogravimetric Curve for the Ingredient
Laminac 4116
temperature of the inert sample is constantly in-
creasing, an endotheruial differential temperature
results. Conversely, an exothermal reaction causes
the sample temperature to increase more rapidly
than the reference temperature, and the result is an
exothermal differential. When there is no thermal
reaction, the sample and reference compounds heat
3-32
АМСР 706-185
TEMPERATURE СС1
Figure 3-15.1. Differential Thermal Analysis Curve for the
Ingredient Sodium Nitrate
Figure 3-15.2. Differential Thermal Analysis Curve for the
Ingredient Magnesium
Figure 3-15.3. Differential Thermal Analysis Curve for the
Ingredient Laminac 4116
at tlie same rate and no differential temperature is
observed. Dehydration of a hydrated or hygroscopic
substance is an endothermic process as are those
of fusion boiling. Transitions involving trans-
formations from one crystal lattice to another, or
the free rotation of ions in a lattice are, most often,
endothermal processes; however, there are several
isolated exceptions to this general rule. Decomposi-
tion reactions may be either endothermal or exo-
thermal depending upon the system and tempera-
ture under consideration. Oxidation of a material
such as a metal powder by a gas, e.g., oxygen or
nitrogen, involves the evolution of heat and is,
therefore, an exothermal reaction. Oxidation-re-
duetion reactions normally are exothermal proces-
ses, particularly when considering reactants such
as metal fuels and solid oxidants. Since these types
of phenomena are indicated by the DTA curves
obtained, these curves may be used to characterize
the system under study in terms of its thermal re-
actions, both physical and chemical. Integration of
areas under endothermal bands also has been used
to obtain a semi-quantitative estimate of the
amount of one or more of the ingredients present.
Thermogravimetry consists of continuously
weighing a sample as it is heated, either at a con-
stant temperature or to elevated temperatures at
a constant rate. Curves are obtained as a function
of temperature or time. Since thermogravimetrie
curves are quantitative representations of weight
changes, they can be related to the chemical and
physical changes taking place in the sample as it
is heated, and can often be used to determine the
nature of the intermediate and final reaction prod-
ucts.
Typical results obtained by thermogravimetrie
and differential thermal analyses techniques are il-
lustrated by the results obtained in a study of the
pyrotechnic illuminating mixture composed of 54
percent magnesium, 36 percent sodium nitrate, and
1G percent Laminae.24 The thermogravimetrie stud-
ies under normal atmospheric conditions indicate
thai all three ingredients undergo thermal reac-
tions involving weight change as a function of
furnace temperature, as illustrated in Figures 3-
14.1 through 3-14.3. Sodium nitrate exhibits a
weight loss at temperatures from 700°C to 1000°C
which corresponds to a complete conversion to
sodium oxide. The curve also shows a point of in-
flection at about 850°C due to the concurrent de-
composition of the intermediate product, sodium
nitrite. Magnesium shows a continuous gain in
weight which begins at about 625°C and continues
on past the maximum temperature. The curve
varies in slope, becoming perceptibly steeper at
650°C, ami markedly less steep at 680°C. This
weight gain is attributed to the successive forma-
tion of magnesium nitride and magnesium oxide.
3-33
AMCP 706-185
DIFFERENTIAL TEMPERATURE (°C) DIFFERENTIAL TEMPERATURE fC)
। 3-16.1. Differential Thermal Analysis Curve for the
Magnesium-Sodium Nitrate Mixture (Curve I)
Figure 3-16.2. Differential Thermal Analysis Curve for the
Sadium Nitrate-Carbon Mixture
Polymerized Laminac first shows a continuous
weight loss, extending from about 1(W)°C to 500°C,
which markedly changes in slope at 350°C. This
loss is followed by another loss, ending at 625°C,
which represents a loss in weight equivalent to the
initial weight of the sample. This loss is due to
chemical degradation of the polymer to carbon,
which is then completely oxidized.
The DT.A curves for the* ingredients are illus-
trated in Figures 3-15.1 through 3-15.3. The only
thermal effect exhibited bj sodium nitrate is en-
Figure 3-16.3. Differential Thermal Analysis Curve for the
Magnesium-Sodium Nitrate Mixture (Curve II)
TEMPERATURE ("Cl
Figure 3-16.4. Differential Thermal Analysis Curve for the
Sodium Nitrate-Laminac Mixture
dothermie crystalline transition at 270°C, imme-
diately followed by endothermic fusion at 306°C.
The differential thermogram of magnesium shows a
double exothermic peak beginning at about 565°C,
which may be due to the formation of magnesium
nitride or magnesium oxide on the surface of the
metal, or to reaction with the glass tube. The
double peak culminates in the endothermic fusion
of magnesium. The DT.A curve of polymerized
Laminae displays only one broad, endothermic
band, beginning at about 25l)°C, with a peak tem-
perature of 371°(*. However, it appears as though
several overlapping reactions are responsible for
the heat absorption. At 305°C, a colorless liquid
condenses on the upper part of the sample tube. At
332°C, there are dense, white fumes escaping from
the tube. At 47!)°C, after the endotherm is over,
the sample gives off dense, yellow fumes and some
charring is observed in the tube.
As shown in 'Figures 3-16.1 through 3-16.5, the
binary fuel mixture, magnesiuin-Laminae, gives
3 34
AMCP 706-185
Figure 3-16.5. Differential Thermal Analysis Curve for the
Magnesium-Laminac Mixture
TEMPERATURE fC)
Figure 3-17.2. Differential Thermal Analysis Curve for the
Magnesium-Sodium Nitrate-laminac Composition
Figure 3-17.1. Differential Thermal Analysis Curve for the
Magnesium-Sodium Nitrate-Carbon Composition
DTA evidence of the thermal decomposition of the
Laminae present by several shallow endotherms
prior to the sharply endothermic fusion of mag-
nesium. The magnesium fusion endotherm is fol-
lowed by an exothermal reaction, probably the
oxidation of molten magnesium. The absence of any
exothermal peak prior to magnesium fusion sug-
gests that, alt hough the Laminae does not react
with the bulk of the metal, it protects the solid
magnesium from reaction with air. The four
binary fuel-oxidant mixtures did ignite. ]i\n- all
the ignitible sodium nitrate compositions run on
the time-base apparatus, the endotherms corre-
sponding Io the crystalline transition of sodium
nitrate are very small because only very small sam-
ples were used. The fuel-rich system 60-40 mag-
nesiiim-sodium nitrate, Curve TI, used in the test,
ignited at 560°C. The DTA curve shows the endo-
thermic crystalline transition of sodium nitrate at
265°C, and its fusion at 305°C, in addition to the
sharply exothermic ignition. The stoichiometric
mixture, Curve I, for the reaction:
Mg + NaN()3 —» MgO NaNOa
containing only 22 percent magnesium, ignited at
613°C and displayed endotherms at 270° and 310°C
which were caused, respectively, by the crystalline
transition and fusion of sodium nitrate. Sodium
nitrate-Laminae ignited with an apparently small
evolution ot heat at 417°C that may have been due
to a combination of small sample size and forma-
tion of gaseous products. The differential thermo-
grant exhibits the crystalline transition of sodium
nitrate at 2t>8°(' and its fusion at 297°C. A broad,
shallow endotherm, during which a colorless and
then a yellow liquid condenses on the sample tube,
culminates in ignition. The sodium nitrate-carbon
system exhibits the crystalline transition of sodium
nitrate, successfully followed by sodium nitrate
fusion, and then ignition at 467°C.
DTA curves for the two ternary compositions
an* shown in Figures 3-17.1 and 3-17.2. The mix-
ture containing magnesium, sodium nitrate, and
carbon is very similar to the sodium nitrate-carbon
binary mixture; i.e., it ignited at 455°(1 immedi-
ately following the crystalline transition and fusion
of the sodium nitrate. The mixture containing mag-
nesium-sodiuin nitrate-Laminae ignited at 489°G.
The first thermal phenon—na observed were the
3-35
АМСР 706-185
crystalline transition and fusion of sodium nitrate
at 270°C and 299°C, respectively. There was a
small, sharp exothermal reaction beginning at
373°C, and another beginning at 450°C, with peak
temperatures of 405°C and 485°C, respectively.
Ignition occurred as the system was recovering
from the second exothermal reaction. These and
related results indicate that it is not feasible to
write preignition or combustion reactions for the
systems containing Laminac due to the complexity
of the polymer and the uncertainty of its com-
bustion products.
REFERENCES
1. M T. Howerton, Engineering Thermodynam-
ic, Van Nostrand Co., Inc., Princeton, N. J.,
1962.
2. Handbook o' Chemistry and Physics, 45th
Ed., The Chemical Rubber Co., 1964-65.
3 G. Custard, G. Francis, W. Schnackenberg,
Small Arms Incendiaries, A Review of the
History and Development, 4 Vols, Frankford
Arsenal Report R1407, 1956.
f. Reilly ai d Rae, Physicc Htemical Method ,
2nd EL, Van N;i.,rand to., Inc., Princeton,
N. J., I%'2.
5. V’a1 Moore, Physical Chemistry, 3rd h'd.,
Pre1 .tail. N. Y., 1962.
6. 0. Kuhasel.ewski and E. Evans, Meta urt/cal
Thermochemistry, John Wiley & Sor , N. Y.,
1956.
7. Irving ' Klotz, Chemical Therm'yna -.ics,
Prentiee-llall, N. Y., 1950.
8. Irving Glassman, Metal Combustion ’rocesses,
Pa;- presented at 14th Annual Meeting,
American Rocket Society, Nov. 16 2i‘, 1959.
9. S. Glasstone and I). Lewis, Ehnii i of Phys-
.cal Chemistry, Van Nostrand Co.. > nr., Prince-
ton, N. J., 1960.
10. ЛМСР 706-282, Engineering 1 esign Hand-
book, Propulsion and Propiilan s.
11. J. B. Conway, A. V Grosse, unlcrcd Metal
Flames, Office of Naval Lose . h, Contract
N9-ONR-87301, Washington, D C.
12. Keith J. Laidler, Chemical Kim ics, McGraw-
Hill Book Co., Ine., N. Y.. 1950.
13. S. Glasstone, K. J. Laidler, and II. Eyring,
The Theory of Rah Proctsscs, McGraw-Hill
Book Co., Im-., N. Y., 1941.
14. E. S. Freeman and S. Gordon, ’’ТЬе Appli-
cation of the Absolute Reaction Rate Theory
to the Ignition of Propagative Reaction Sys-
tems. The Thermal Ignition of the Systems
Lithium Nitrate-Magnesium^ Sodium Nitrate-
Magnesium,” Journal of Physical Chemistry
60. 867-71 (1956).
es.
16.
17.
18.
S. Gordon and C. Campbell, “ Pre-ignition
and Ignition Reactions of Pyrotechnic Sys-
tems, Proceedings of the Fifth Symposium
on Combustion, Reinhold Publishing Corp.,
N. Y, 1955.
II. Ilenkin and R. MeGill, “Rates Explosive
Decomposition of Explosives, ’ ’ Industrial and
Engineering Chemistry 44, 1391-5 (1952).
M. Gilford, S. Gordon, G. Weingarten, Ther-
mal Caramel rs Associated With the Igniti >n
of the Magnisiitm-Sodium Nitrate Systems,
Pieatinny Arsenal Technical Note 27, Doa ir,
New Jersey.
II. ('. Christensen, R. II. Knipe, A. S. Gordon,
Survey of Aluminum Particle Combustion,
Paper presented at et.ing of the W‘Stern
Stall's Section of Ihe Combustion Institute,
I’niversity of I tali. Salt Lake City. Oct. 26-27,
1964.
19. W. M. Fassell, C. A. Papp, D. L. llilenbrand,
and P. 1’. Sernka, The Experimental Nature
of the Combust ton of Metallic Powders, Solid
Propellant Rocket Research, Academic Press,
N. Y., 1960.
20. T. A. Brzust >wski, Vapor-Phase Diffusion
Flanus in tin Combustion of Magmsi'im and
Aluminum, Ph D. Thesis. Priueeton Univer-
sity. Iffiffi.
21. I). K. Kneh1 The Ignition and i"ombustion
of Small Ihmiiir Aluminum Wirrs. Paper
3-36
АМСР 706-185
REFERENCES (cont’d)
presented at Western States Section of the
Combustion Institute, University of Utah, Salt
Lake City, Get. 26-27, 1964.
22. Eli Freeman and Garry Weingarten, A Ther-
mal Theory for Rates of Propagative Burning,
Picatinny Arsenal Technical Report 2596,
Dover, New Jersey, 1956 (DDC AD 218 171).
23. S. Gordon and C. Campbell, Differential Ther-
mal Analysis of Inorganic Compounds, Pica-
tinny Arsenal, Dover, New Jersey.
24. V. D. Hogan and S. Gordon, Pre-ignition and
Ignition Reactions of the System Magnesium-
Sodium Nit rate-Laminac, Picatinny Arsenal
Technical Note 23, Dover, New Jersey, 1958.
3-37
АМСР 706-185
CHAPTER 4
VISIBILITY
4-1 INTRODUCTION
In the design and development of m’litary
pyrotechnic devices for ill ominating a selected
area, and for visual signaling when other methods
of communication are impra-tiea! or impossible,
an understanding of human visual performance
is important. The complex 'asks performed in
modern military operations require sufficient lighi
in order that unfamiliar objects can be located
and recognized against their backgrounds
Signaling by methods which depend on sight are
commonly used in military tactics, in training ex-
ercises, and in evaluation of performance of mili-
tary items during development programs. These
signals derive from packaged units designed to
ei.iit smoke, flame, or light, or otherwise to give
visual indication of some event, e.g., the marking of
a particular spot on the ocean, or to trace the tra-
jectory of missiles or other moving devices. They
hi.iv be coded by color to convey information re-
lating to different types of everts or a sequence of
events For example, a red signal might be used
to indicate the arming of a fuze and a green signal
to indicate when functioning oemirs. Signals for
nmiking purposes ear he used to aid in tracking
enemy submarines, to allow submerged submarines
to make their positions known, to locate tow tar-
gets, and to i all attention to survivors of air crashes
or sinkings.
4-2 VISION
Inasmuch as vision is a sensation recorded by
the eye, it is important, to consider some of the
propel ties ami characteristics of the eye. The
functioning of the eye involves a complex of
physical, physiological, and psychological factors.
Light failing upon the eye acts as stimulus to
produce a sensation whi-li, in the simplest case, is a
sensation of brightness
The eye ci.ntains two types of receptor*, the ••oils
and the cones. The central portion of the retina,
the fovea, is populated exclusively by cones, and is
the area of color perception. The region immedi-
ately surrounding the fovea is known as the para-
fovea and contains the rods, which do not recog-
nize colors. The eye has two distinct states—the
light-adapted state and the dark-adapted state.
The eye is in the light-adapted state when the field
luminance is about eandella per square foot,
and is dark-adapted at luminances below this. How-
ever, the eye is not fully dark-adapted until it has
been exposed to the low level of luminance for
about 30 minutes. Only two to three minutes are
required for the transition for the dark-adapted to
the light-adapted state.
In the light-adapted state both the rods and
«‘ones nr? receptive to light. In the dark-adapted
state only the parafovea, composed of rods, is ac-
tive, with the results that color differences are not
recognized and that faint signals are best seen when
off to a side (looked at “out of the corner of the
eye’') rather than when looked at directly.
4-2.1 BRIGHTNESS CONTRAST
An object can be distinguished from its back-
ground (or from another object) because it has a
different color or brightness. It has been shown
experimentally that differences in biightness are
usually much more important than differences in
color. The brightness contrast f is defined by the
equation :
where It is the brightness of the object and H' is
the brightness of the background. If an object is
not as bright as its background, the brightness con-
trast is negative and approaches a value of —1 as
.i limit. When the object is brighter ihau its back-
ground. .....outcast may be very large, for ex-
4-1
AMCP 706-185
Figure 4-1. Thresholds of Brightness-Contract for 80%
Detection for Five Angular Fields (Minutes of Arc}
ample, a bright light on a dark night. The bright-
ness contrast in daylight or in artificially produced
white light, where the difference in brightness is
due mainly to the amount of light reflected by
the object as compared to its background, seldom
exceeds a value of 10. If an area has been camou-
flaged, the brightness contrast may be 0.1 or less.
If the brightness ratio B/B' approaches unity,
a stage is reached where an object can no longer
be distinguished from its background.
While the threshold contrast varies with each
individual, average values as shown in Figure 4-1
depend on the angle which the object subtends at
the observer’s eye and the mean level of illumina-
tion. ’for daylight conditions, a value of 0.02 is
generally accepted as an average value for the
threshold contrast or limen.
Visual acuity is often expressed as the re-
ciprocal of this angle in minutes of are. An acuity
value of 1.0 is accepted as a standard for normal
vision even though, under ideal conditions, much
greater detail can be resolved.
Up to about one-fifth second, the photochemical
reciprocity law applies and the product of th? il-
lumination times the duration is a constant. It has
been demonstrated in threshold measurements of
visual performance that, in those eases where
tin duration is longer than one-fifth second (as is
true for most cases of interest in pyrotechnics),
this is not applicable.
4-2.2 OVERALL CONTRAST
The overall contrast between an object, and
its background is approximately:
Co-= (Cb" + Cc‘)U (4-2)
where is the brightness contrast, and Co is the
achromatic brightness contrast, equivalent to the
chromatic component of the contrast. As ehromatie
components of contrast are rarely over 25 percent
of the total and are invariably associated with
brightness contrasts greater than 25 percent, visi-
bility, under field conditions, depends primarily on
the brightness contrast. This is especially true for
objects viewed at a distance since the scattered light
from all sources tends to still further dilute the color
contrast. Where brightness contrasts are limited,
as in the ease, of signal flags or panels, color dif-
ference may increase visibility. However, at or near
the limit of visibility, the hues of chromatic target
are not perceptible. This is particularly true for
violet, blue, green, and yellow stimuli. Orange,
red-purple, and red appear reddish or brownish
under those circumstances.
4-3 ATTENUATION OF CONTRAST
The apparent contrast (both brightness and
achromatic) between an object and its background
is reduced when viewed through a medium which
scatters and absorb light. For a homogeneous
medium like the atmosphere, containing both the
observer and the object, the amount of contrast
reduction is governed by the balance between the
light transmitted from the object, and its back-
ground, and the space light contributed by the
intervening medium. If the medium is stratified,
as would be the case when a smoke screen is located
between the object and the observer, reflection due
to multiple-scattering may still further reduce the
apparent contrast.
In general, if the inherent brightness contrast
between two objects, or of an object and its back-
ground, is given by Equation 4-1, the apparent
brightness contrast <’.r, when viewed at a distance,
will be:
C,
(B — B')( ~f>x
(4-3)
where В is the brightness of the first object and B'
is the brightness of the second object or the back-
ground, 3 >s the scattering coefficient, .r is the dis-
tance, and (i is the glare scattered and reflected by
4-2
АМСР 706-185
Figure 4-2. Apparent Contrast as a Function of Distance
a cloud in the same aireetion as the light from the
object. The object will be visible only if the ap-
parent contrast is greater than the threshold con-
trast or “limen” for the particular total illumina-
tion level.
4-3.1 ATTENUATION OF CONTRAST
BY THE ATMOSPHERE
The apparent contrast between two distant
objects, or a distant object and its background, is
reduced as shown in Figure 4-2 when they are
viewed through an atmospheric aerosol. This re-
duction in apparent contrast limits the maximum
distance at which targets and signals can be seen.
The most general expression for the reduction
of contrast by the atmosphere is:
C« = -^7 (4-4)
(~ is the apparent contrast between two objects,
or an object and its background at the effective
(slant) range R; C is their inherent contrast; В
is the brightness of the object; B’ is the brightness
of the background (or second object); and P is
the scattering coefficient.
If the atmosphere is optically homogeneous,
i.e., the apparent brightness of the shy is not
changed by moving toward or away from the
horizon, this equation reduces to-
Cx — Се~1>* (4-5)
where Cx is the apparent contrast at a distance x.
The meteorological range, the horizontal range
for which the transmission of the atmosphere is
two percent, is given by:
ТГ -! > A no 3.912 ..c.
Xr ~ —7— In 0.02 — ——-— (4-6)
P z
The meteorological range is the distance at which a
large black object, which has an inherent contrast
of —1, can just be recognized against a daytime
sky. Visibility, as normally reported, is about %
the meteorological range. The meteorological ranges
for typical weather conditions are given in Table
4-1.
if the object is viewed against backgrounds
other than the sky, the expressions are more com-
plicated. The apparent contrast at an effective
distance R of a target against any background is
given by:
1 + (Вя/В')(сД«-1)
where C is the inherent contrast between the ob-
ject and its background, Bu/B' is the ratio of the
brightness of the horizon sky in the direction of the
object to that of the background, and P is the scat-
tering coefficient. If the ratio Bh/B' is one, this
equation reduces to the equation applicable to the
visibility of an object against the horizon sky.
The calculation of the visibility of an object,
when viewed from above, is complicated due to the
stratification of the atmosphere. If this stratifica-
tion can be considered continuous, the scattering
coefficients will vary regularly and in a predictable
manner. Normally, however, this is not true, and
the effective optical range R is taken as the hori-
zontal distance containing as many scattering
particles as are found in the slant path R. The
4-3
л ла с г /ио-ню
TABLE 4-1
METEOROLOGICAL RANGE FOR TYPICAL WEATHER CONDITIONS
Daylight Attenuation
Visual Coefficient, li, Transmission,
Weather Range, V Per Sea Mile Per Sea Mile
Dense fog 50 yards 156.4 0.0241’
Thick fog 200 39.1 0.0210
Moderate fog 500 15.6 0.024
Light fog 1000 7.82 0.022
Thin fog 1 sen mil C'- 3.91 0.02
Haze 2 1.95 0.141
Light haze 3 1.30 0.272
4 0.98 0.376
Clear 5 0.782 0.457
6 0.651 0.521
7 0.559 0.572
8 0.488 0.614
9 0.434 0.640
Very clear 10 0.391 0.G76
11 0.356 0.700
12 0.326 0.723
14 0.279 0.756
16 0.244 0.783
Exceptionally clear 18 0.217 0.805
20 0.196 0,823
24.1 0.162 0.85
37.1 0.105 0.90
71.8 0.051 0.95
Theoretically pure air 167 0.0234 0.976
* 1 sea mile equals 1.15157 statute miles or 6080 feet.
effective optical range R is related to actual path
by :
21,70(1 / Г — /? sin (M> “l\ /1
Sint") ( ' [ 21,700 J) (4’8)
where (") is the angle that the slant path R makes
with the horizontal. Plots of this equation for
various values of ("), applicable for intermediate
values of the slant range /?, are presented in Figure
4-3. The values of the true altitude are indicated
by the dashed lines on this diagram.
4-3.2 OBSCURATION OF VISION
BY ARTIFICIAL SMOKE CLOUDS
The influence of artificially produced smoke
clouds on visibility is complicated by the fact that
the smoke may occupy only a relatively narrow
region between the target and the observer. Under
these circumstances, the intensity of illumination,
may vary greatly depending on the relative loca-
tion of the object, the observer, the smoke cloud,
and the souree(s) of illumination, so that the
quantity of smoke required for obscuration is a
highly variable quantity. Because of the compli-
cated way in which the incident light is scattered
as a function of angle and because of inuttiplc
scattering, the degree to which light will pene-
trate a cloud can only bo approximated. While a
major fraction of the light scattered by particles
near th" optimum size for a screening smoke is
scattered in the forward direction, some light is
4-4
AMCP 706-185
SLANT RANGE (YAHDS)
SLANT RANGE (FEET)
Figure 4-3. Optical Slant Range Diagram for the Optical Standard Atmocphere
4 5
АМСР 706-185
CONTRAST <Х1
Figure 4 4. Brightness Requirements as a Function of
Acuity and Contrast
scattered in the backward direction. If a cloud is
of a sufficient depth and concentration, essentially
all of the light not absorbed by the cloud will re-
turn to and be scattered from the same side of the
cloud that it entered and the cloud will behave as
a white body diffusely reflecting the light which
falls upon it.
For a thinner cloud, part of the incident light
will penetrate to the target and background. The
apparent contrast of the target against its back-
ground, in this case, is:
6’я — Z0(l_ f)(M (4-9)
where Io is the effective intensity of the incident
light, M is the reflectivity of the target, M is the
reflectivity of the background, (3 is the scattering
coefficient, R is the effective distance from the tar-
get to observer, and f is the fraction of inci-
dent light which penetrates to the target. The
amount of light reaching the target, as well as the
attenuation of the contrast between the target and
its background, depends on the number of scatter-
ing particles which, in turn, depends on the product
of the concentration of the smoke and the thickness
of the eloud.
The effectiveness of a smoke screen also depends
on the relative location of the smoke target back-
ground and light source. The effect of these changes
in relative locations is complicated, and has not
been worked out in detail. In general, anything
which tends to increase the effective brightness of
the smoko cloud, as well as anything that tends to
reduce the illumination on the tai get and back-
ground, will increase the effectiveness of a smoke
screen.
4-4 VISIBILITY OF TARGETS AND SIGNALS
The distance at which a ship, low-flying air-
craft, shoreline, or other target, and also the dis-
tance at which a signa) can be seen against its
background depends mainly on (!) the perceptual
capacity of the observer at the level of brightness
to which his eyes are adapted and (2) the apparent
contrast between the target and its background
and the angle it subtends at the eye of the observer.
The angle, subtended by a target area, depends on
the size and shape of the object. For a circular
target at a distance of X yards, the angle a sub-
tended by a circular target A square feet in area, is:
a = minutes of arc (4-10)
As the apparent contrast is also a function of the
distance, calculations intended to determine the
range at which a target or signal can be sighted
must be a series of successive approximations. In
addition, because of the curvature of the earth,
the target or signal, or the observer, must be ele-
vated for sighting long distances. The geometrical
range for various heights is given by :2
X~ 1.325(77 +A) (4-11)
where H is height of target or signal in feet, h is
height of observer in feet, and X is the distance
in miles.
4-4.1 VISIBILITY OF TARGETS
UNDER ARTIFICIAL ILLUMINATION3
It is impractical to require that normal visual
acuity (resolution of one minute of visual are) be
maintained when the illumination is provided by
pyrotechnic flares since there is a practical limit
to the intensity. The intensity should be such that
targets, having a size and a contrast with the
background that is typical of field conditions, can
be readily located and recognized. Intensities
greater than this minimum are excessive. As shown
in Figure 4-4, illumination levels between 0.1 and
10.0 foot lamberts (FL)*, which can be obtained
* NOTE 1 millijambert 1 foot-lambert.
4-6
AMCP 706-185
TABLE 4-2
REFLECTANCE VALUES (IN PERCENT) OF VARIOUS TERRAIN
FEATURES AND BUILDING MATERIALS
Object Wavelength in Microns
I. Natural Terrain
a. Soils: 0.4 0.5 0.6 0.7 0.8 0.0 1.0
Dry yellow earth 8 16 37 55 69 76 82
Wet yellow earth 5 9 25 42 58 67 76
Dry sand 18 28 37 45 52 56 58
Wet sand 10 15 26 32 37 41 43
Dry red earth 8 8 20 28 33 35 37
Wet red earth 6 6 12 28 22 24 25
Dry brown earth 8 11 15 19 21 23 24
Wet brown earth 4 6 11 14 15 17 19
Dry loam 8 12 18 20 20 21 22
Wet loam 5 6 7 9 10 11 11
b. Vegetation:
Grass 6 8 10 13 55 67 70
Evergreens 3 4 7 6 24 24 24
Straw 7 15 24 33 39 44 46
Dead grass 7 13 20 26 31 35 37
Dead brown leaf 6 9 11 27 43 51 69
Dead yellow leaf (i 10 23 39 45 48 51
c. Terrain as seen from 4,000 feet:
Green field 4 7 10
Brown, field 3 4 5
Yellow-green vegetation 5 8 15
Light sand 12 16 21
Sandy ground 8 12 14
Wet mud 5 8 9
Mud covered with water 4 7 6
Pond water 3 2 1
Water with suspended material 3 4 5
Dark volcanic, rock 6 6 7
Black asphalt runway 4 4 4
JI. Building Materials
<i. Paints: 4 4 4 4
Black 6 6 11 12
Earth brown 9 15 45 47
Earth yellow 6 7 19 21
Earth red 15 24 42 43
Sand 16 21 37 41
Desert sand 7 9 16 16
Field drab 4 7 11 9
Olive drab 4 6 7 5
Forest green
4-7
АМСР 706-185
TABLE 4-2 (cont’d)
Object Wavelength in Microns
11. Building Materials (Continued)
a. Paints (Continued): 0.1 0.5 0.6 0.7 0.8 0.9 1.0
Dark green 5 7 6 6
Sky gray 33 40 48 45
Haze gray 35 33 24 24
Blue gray 25 27 25 23
Ocean gray 22 20 13 13
Sea gray 14 13 12 10
Slate gray 9 10 9 7
Sea blue 7 6 5 4
Red 5 5 25 75
b. Materials:
Concrete tiles (uncolored) 28 35 37 37 37 37
Concrete tiles (black) 9 9 9 9 9 9
Slates (silver gray) 19 20 21 21 21 21
Slates (blue gray) 12 13 14 14 15 16
Slates (dark gray) 10 12 12 12 11 10
Clay tiles (Dutch light red) 23 51 64 66 66 65
Clay tiles (red) 11 28 35 37 40 40
Clay tiles (red-brown) 13 25 30 33 40 41
Dark concrete 13 16 20 17
Light concrete 25 32 37 38
Galvanized iron 23 26 27 25
Dirty galvanized iron 9 9 9 9 9 9
Aluminum 45 49 52 53
Steel 29 31 34 35
Granite 10 15 20 22
Asbestos cement 35 43 45 44 41 37
Weathered wood 9 11 8 10
Weathered asphalt 9 10 11 11 11 11
Basalt 5 6 7 6
quite readily with pyrotechnic illurninants, should
be adequate to detect and identify objects sub-
tending approximately 5 minutes of visual are
against a terrain background, provided the con-
trast is greater than 0.1. When the target, and its
background are illuminated by the same light
source, this contrast will (as is true for daylight
illumination) depend on the reflectance values for
the target and background. Values for typical
materials which might be found in the field are
given in Table 4-2.
4-4.2 VISIBILITY OF SIGNALS
The requirements for visibility of a signal vary
considerably from one application to another. It
is not always possible, nor necessary, to provide
a signal which is visible at extreme ranges. How-
ever, it is desired that a signal produce the maxi-
mum visual effect over as long a distance as pos-
sible and, in some cases, for as long a period as
possible. In addition, it is often necessary to
modify signal performance to meet practical size
and weight restrictions. These restrictions are
4-8
АМСР 706-185
Figure 4-5- Effect of Direction of Illumination on the
Luminance of a Smoke Columr
Figure 4-6. Effect of Relative Direction of Sun and Smoke
on Time of Discovery
extremely important for signals carried aboard
aircraft or submarines.
4-4.2.1 Visibility of Smoke Civ ads
The visibility of a relatively small dense smoke
cloud, such as would be produceo as a signa1, de-
pends on the aoili’ of the smoke particle.- to
scatter light, or r fleet by multiple scattering, ।
the direction of the observer. Factors which de-
termine, to a large extent, the visibility of a smoke
cloud include: (1) illumination of the smoke cloud,
and (2) contrast of the cloud against a back-
ground.
The effective brightness of the cloud depends
on the relative location of the observei and cloud,
as well as the intensity and direction of the inci-
dent light. This effect is indicated in Figure 4-5
for a relatively dilute, laboratory smoke column.
These results, due to the tendency toward forward
scattering, indicate tha: a smoke column is many
times as bright in the
opposite to the sun.
reetion
Figure
covery
sun in
relatively
taring ai
dilure cloud ma
of the sun a>
4-6 where.
the leasi \
maxinin hi
dense -Im
, abso-p’
ls
ireetion of the sun as it is
le effect of the relative di-
mioke is also illustrated ii-
•xpeeted, the tinn of dis
en the relativi nosiiioi
umd brightness. Color
results from multiple
u. The color intensity
•. less because of the educeo
s re-
ef <;
scat
-nut ijili- watteriiii1 efficiency. If the particles mak-
ig up the el mil are the wroi size (t< - small,
.ormally), th - । ,lor produced >ay be anged
am /or suppress 1 The apparent color of the
cloud will cliangi with distance and, near the limit
of viability, will be < '"eetively the same color as the
hoi 'zmi.
4-4 2.2 Vr у of Light Sources
;,’a dors ich influence the visibility of a light
mr< ire e .entially the same as for any other
oejeet. nhe i.- bilitj of an illuminated visual
angie or ..ppro. in. el. me degree or less is de-
pendent principally ,tpor the total light emitted
1 the area. For a steady , oint source .
F = ~ = 3.5 X 10 «//1/2lumens/cm2 (4-12)
win re F is the threshold value of flux density (in
lumens per square centimeter), C is the threshold
intensity of ti e source (in candles), X is the dis-
tance fri.-m source to observer (in centimeters),
and Ir is the background brightness (in candles
per s glare centimeter). The illumination pro-
duced at the observer’s eye is reduced because of
itinospherie attenuation in accordance with the
>1 lowing equation:
«!>[-3.912 (-X)] (4.13)
where /„ is the intensity of the source and XK is
the meteorological range. This equation is valid
only when V is la-gv enough that the light may be
considered a point source. The maximum angu-
lar ize of the light source, which can be con-
sidei d is a point source, varif? with the adapta-
tion brightness as given in Ti.Ule 4-3.
4-9
АМСР 706-185
TABLE 4-3
MAXIMUM ANGULAR SIZE OF LIGHT SOURCE AS A FUNCTION
OF ADAPTATION BRIGHTNESS
Adaptation brightness
(foot-lamberts)
1,000
100
10
1
io-1
10 —
io—-
IO-4
10-B
Maximum angular size
(minutes of arc)
0.708
0.708
0.750
0.891
1.30
2.82
6.68
8.55
15.0
A flashing point-source light, where the flashes
are of short duration (less than 0.2 second), must
have, in general, a higher candlepower than a
steady light in order io be seen. It has been found
that the threshold intensity F, required for visi-
bility of a light of duration t0 seconds, is given
by:4
Ft„ = F, (t, 4-0.21) (4-14)
where F, equals the threshold intensity of a steady
light. Thus, when a flash lasts several seconds so
that 0.21 is negligible, the threshold is the same
as for steady light. However, as shown in Table
4-4, for small values of t0, where F will be larger
than F„ this is no longer true. These ratios are not
changed greatly for candlepowers up to 50 times
threshold for flash durations from 0.05 second up
to 1.0 or 2.0 seconds.
For situations in which it is not known where a
flash will appear in the field of view, the finding
time is quite important. The two variables of ma-
jor importance in the eonspieuity (short finding
time) of a flashing light of a candlepower well
above threshold intensity are: (1) the time interval
between flashes 2', and (2) the duration of each
flash t„ in steonds. A flashing light is most con-
spicuous when T lies between 0.5 and 1.0 .second
and t„ is between 0.25 and 0.75 second.'1 Decreas-
ing T or increasing t0!T increases the finding time
because of reduction of flicker. If t., is below 0.5
second, the average finding time is increased (for
values of T as low as 1.0 second) because of the
lower visibility of short flashes (according to
Blondel and Key). If T is greater than 1.0 second,
the finding time is also longer because the eye
may pass over the light location during the off
interval. It was found that a light of ten times
threshold intensity was almost always located at
the first flash while three flashes were needed if the
light were only five times the threshold.
The effect of selective transmission by some
types of atmosphere is also important when con-
sidering colored lights. Table 4-5 indicates the
magnitude of selective absorption of components
of sunlight by the atmosphere.
4-4.3 ESTIMATION OF VISIBILITY
The estimation of visibility can be simplified
by the use of nomographic visibility charts pre-
pared for this purpose. A '-hart for circular tar-
gets, which has been adapted from the more com-
plete charts available, is given in Figure 4-7. To
use this chart for determining visibility along a
horizontal path, a straightedge is laid across the
chart in such a manner that it connects the value
of the inherent contrast between the object and its
background with the value of the sky-background
brightness ratio (this sky-baekground ratio is unity
if tin* background of the target is the horizon
sky), extended to intersect the zero liminal tar-
get distance line. The straightedge is then re-
located so that it connects this point with the
4-10
AMCP 706-185
TABLE 4-4
VISIBILITY OF FLASHING LIGHT COMPARED TO STEADY LIGHT
Flash Duration, Ratio of Flashing Light
seconds to Steady Light
1.0 1.2
0.5 1.4
0.4 1.5
0.3 1.7
0.2 2.0
0.1 3.1
0.05 5.2
0.025 9.4
0.01 22.0
ABSORPTION OF TABLE 4-5 SUNLIGHT BY ATMOSPHERE
Wavelength, Angstroms 4000 4500 5000 6G00 7000 8000 Percentage Transmitted 47.5 55.3 62.4 68.2 75.6 80.1
These figures represent the relative transmission for the different
wavelengths during the day under average clear conditions with the sun
at the zenith, and they inay vary greatly under other conditions. It must
be remembered that a light signal can be seen at a much greater distance
than the distance at which its color can definitely be distinguished.
value for the meteorological range. The intersec-
tion of the straightedge and the curve for the
correct general illumination level locates the lim-
inal target distance.
The procedure for estimating the visibility for
slant paths is somewhat more complicated, espe-
cially if the atmosphere is stratified. If no optically
dissimilar strata are present, the optical slant range
can be determined in the samn manner as the visual
range, along a horizontal path. The actual slant
range can then be approximated by the use of Equa-
tion 4-18 or Figure 4-3. Because the slant range
is normally greater than the optical slant range,
the effective area of the target is less than its actual
art a and the predicted slant range will be high.
Л better value can be obtained, if in effective area
A can be calculated, for targets which subtend a
small angle at the observer’s eye, by the equation:
(/lain 6) (4-15)
where R is the first approximation of the optical
slant range estimated by use of the nomograph, R
is the corresponding slant range for a sighting path
which makes an angle в with the ground, and A
is the area of the target. This value for A is now
used to c'lileiil?/,- a better value for the optical
slant range R and corresponding slant range R.
The nomographs are also useful when stratifi-
cation of the atmosphere causes an effective discon-
tinuity in the meteorological range-altitude rela-
4-11
AMCP 706-185
VALUES OF R (YARDS)
Figure 4-7. ViubiiHy Nomograph
4-12
АМС Р 706-185
TABLE 4-6
SKY BRIGHTNESS
Ambient Condition Hazy* Clear Light Overcast Heavy Overcast Twilight Jeep Twilight Full Moon Quarter Moon Starlight Overcast Starlight Brightness, millilamberts 10,000 1,000 100 10 1 0.1 0.01 0.001 0.0001 0.00001
* The maximum brightness condition which is likely to be < ncoun-
tered is that of the sky on a slightly hazy day at noon.®
TABLE 4-7
SKY-GROUND RATIO
Sky-Ground
Sky Condition Ground Condition Ratio
Ch ereast Fresh Snow 1
Overcast Desert 7
(Ivercast Forest 25
Clear Fresh Snow 0.2
Clear Desert 1.4
(dear Forest 5
tionship. Let it lx* assumed, for example, that there
is a "round haze which has a top at 5000 feet, and
that the meteorological range is five times greater
above the haze boundary than below it. For this
type of visibility problem, a line is constructed
on the optical slant range diagram, Figure 4-3,
from the origin to the intersection of the curve for
the desired viewing angle W, with the dashed line
representing th<> true altitude of 5000 feet. Д
second curve i, which has five times the slope of the
original curvet is drawn starting nt this point.
The relationship between H, the optical slant rouge,
nod if, the slant range, follows the resultant curve.
If the actual boundary of the ground haze is dif-
fuse, the sharp change in slope can be rounded
otf. Because of the problems involved, the estima-
tion of slant ranges is less satisfactory than the esti-
mation of horizontal range. Where experimental
values are not available, typical values for the sky
brightness are given in Table 4-(i for various am-
bient conditions. Typical values for the sky-
ground ratio are given in Table 4-7.
It. is to be noted that the nomograph predicts
a distance at which the target is liminally visible.
If the contrast value is divided by two before using
the nomograph, the result obtained is the sighting
range, the distance nt which the object can be
seen with threshold confidence. For th“ object
to be easily seen, the contrast values should be
divided hy al least four.
4-13
AMCP 706-185
INTENSITY (CANDLES)
LIMJNAL TARGET DISTANCE (YARDS)
LIMIHAL TARGET DISTANCE (YARDS)
METEOROLOGICAL
RANGE (YARDS)
114
Figure 4-8. Visibility Nomograph for Signal Lights
АМСР 706-185
TABLE 4-8
INCREASE IN ILLUMINATION REQUIRED FOR
POSITIVE RECOGNITION
Field Factor Applied Threshold Candlepower 1 Detectibility of Light Source Light source difficult to find even if loca- tion is known.
2.5-5 Light source moderately difficult to find if location is approximately known and ob- server is on steady platform and has long time for search.
5-10 Light source easy to find under circum- stances above.
20-30 Light sourer easy to find under reasonable circumstances at night, for example, search field no greater than 100 degrees, observer can give his full attention. Diffi cult to find in daytime unless observer knows where to look.
100-150 Light source can be found under strenu- ous circumstances at night, and under most circumstances in the daytime if the search field is not too large.
Square objects are as visible as circular objects
of the same area. Objects of other shapes are, in
general, less visible.
Figure 4-8 is a visibility chart for predicting
thi range at which signal lamps and other point
sources of lighi will be 1'minally visible. To list*
this chart, a straightedge is placed across the chart
lb-и it connects ihe meteorological range with
tic i,।tensity of the light source. The intersection
of this straight line with the nine for the proper
sky brightness level is tl:<- liminal target distance.
For signaling purposes .it this distance where posi-
tive recognition is required, the illumination value
should he increased as indicated in Table 4-8.
foot-lamberts will be liminal ly visib’e on a clear
day, when the meteorological range is 20,000
yards, can be estimated in the following manner:
As sky brightness on dear day is approxi-
mately 1000 foot-lamberts, the contrast of target
against sky as background is:
W-1000 = _
1000
4-4.4 ILLUSTRATIVE EXAMPLES
l.a. The distance at which a uniform circular
target of 100 square feet with a brightness of 10
The sky-ground ratio is 1.0 since the object is being
viewed against sky. To obtain liminal target dis-
tance from nomograph, connect (as shown in Fig-
ure 4-fl i with a straightedge a sky-ground ratio
of 1.0 with a contrast of 0.99 and mark intersec-
tion of straightedge with the zero liminal dis-
tanee line Connect this point with the meteoro-
logical range of 20,000 yards. The liminal targ-t
distance is read where this straight line intersects
4-15
АМСР 706-185
METEOROLOGICAL RANGE (MILES) X
VALUES OF R (YARDS)
Figure 4-9. Viability Nomograph Showing Calculation
4-16
AMCP 706-185
LIMINAL TARGET DISTANCE (YARDS)
METEOROLOGICAL RANGE I YARDS)
LIMINAL TARGET DISTANCE (YARDS)
Ftgu-* 4-JO. Visibility Nomograph for Signal Light» Showing Calculation
4-17
АМСР 706-185
with the curve for the ambient illumination, 103
foot-lamberts. The liminal target distance, in this
ease, is approximately 11,000 yards.
l.b. Th- sighting range is calculated in the
same way >t that the effective contrast is:
0.99
2
= 0.495
The sighting range is approximately 9,000 yards.
l. e. distance at which this target could
be seen easily under field conditions:
In order for a target to be seen easily, the
contrast values must be divided by at least 4.0.
Under difficult field conditions, the contrast value
might have to be divided by a number as large as
100. The effective contrast range, therefore, is
0 99 0 99
from-^- = 0.25, to-^r = 0.01
4 100
and the distance at which the target could be seen
easily might be as low as 2,000 yards (2,000 to
7,500 yards).
2. The distance at which the same target would
He liminally visible under the same conditions, if
it were to be observed against a background having
a brightness of 200 foot-lamberts can be calcu-
lated. (Since the target and background are both
illuminated hy the same light source, the reflectance
of the background is approximately 20 times that
of the target.) In this ease, the sky-ground ratio
is 1 (MX)/200 — 5.0, and the contrast is:
1()2(W = -0.95
200
As indicated in Figure
the liminal range is the
ample l.a. The liminal
4-9, the determination of
same as outlined for Ex-
distanee under these con-
ditions is approximately 6,900 yards. The sight-
ing distance and the distance at which the target
could ba seen easily would also be calculated in
the same manner as illustrated for Example l.b.
and l.e.
3. The distance at which a signal having an
intensity of 2,500 candles would be liminally vis-
ible on a foggy night when the meteorological
range is 5,000 yards, can be estimated using the
signal light nomograph. A straightedge is placed
across the nomograph for signal lights so that it
connects tiie meteorological range, 5,000 yards, with
the candlepower, 2,500 candles, as shown in Figure
4-10. The liminal distance is given by the inter-
section of this line with the curve for the illumina-
tion level 10~;l foot-lamberts.
4. The intensity required for a spotting charge
to be seen at 2,000 yards over water and toward a
rising sun on a clear day, can be estimated by
use of the sigmil light visibility nomograph. Un-
der these conditions, the illumination level would
approach 104 feet Imnbci The meteorological
range is assumed to be approximately 30,000 yards,
a clear day. The intensity required for a light
source to be liminally visible under these condi-
tions is obtained from the signal light nomogiaph
by connecting the meteorological range, 20 miles,
with the point of intersection of a liminal target
distance of 2,000 yards, and the curve for the gen-
eral illumination level (approximated by dotted
curve on Figure 4-10). The intersection of this
line with the zero liminal distance line gives the
candlepower required, about 4,000 candles. In
order to be seen readily under these field condi-
tions, the intensity values should be multiplied (see
Table 4-3) by 100 to 150, yielding a required in-
tensity of 4 X Ю4 to 6 X 10⁴ candles.6
REFERENCES
1. Visibility Studies and Some Applications in
th< Field of Camouflage, Summary Technical
Report of Division 16, National Defense Re-
search Committee, Vol. 2.
2. F. E. Cady and II. B. Dates, Illuminating En-
gineering, 2i.d Ed., John Wiley & Sons, M. Y.,
1928.
3. R. C. Casperson, 11. P benz.yek, В. C. Channel,
Visibility Data as i.‘ Applies to Pyrotechnics,
Contract DAI-28-017-501-ORD-(Р1-Г294, Dun-
lap and Associates, Stmnford, Connecticut,
1955.
4. A. Blonde! and J Key, Jour de Physique,
Radium, 1911.
4-18
AMCP 706-185
5. В. D. Dwiggins. Factors Affecting Signalling
by Visual Methods, NAVORD 603*, Bureau
of Navtil Weapons, Washington, D. C., 1957
(DDC-AD 162 G3j).
6, R. T. Eckenrode, The Spotting Technique. II.
Effect of Ambient Illutninahon Spot Intensity
and Color; Memory Screen Informatian, TS4-
4020, Frankford Arsenal, Philadelphia, Pa.,
1955.
7. R. M. Bionnt, G. Francis, Study of Light
Sources for Night Aerial Reconnaissance Pho-
tography, Final Report, Contract DA-36-039-
SC-78333, Denver Research Institute, Univer-
sity of Denver, 1960.
8. Aerosol and War Cases, Summary Technical
Report of Division 10, National Defense Re-
search Committee.
9. H. L. Greene, W. R. Lane, Particulate Clouds,
Smokes, and Mists, Van Nostrand Co., Lon-
don, 1957.
Л '9
АМСР 706-185
CHAPTER 5
PRODUCTION OF HEAT
5-1 HISTORICAL SUMMARY188'7’8
The systematic use of incendiaries extends back
into ancient times when practically any readily
combustible material was used for both offensive
and defensive operations. Ineendiary-type com-
positions were used in fireballs, pots, or crude
bombs and hurled against the enemy by means of
a catapult, or as headings for slings and bow ar-
rows, and other purposes. Some of the earlier
combustible materials used included oil, pitch,
sulfur, resinous woods, and straw. “Greek fire,’’
an incendiary mixture which probably contained
readily flammable substances such as pitch, resin
and petroleum, along with quicklime and sulfur,
was used in the 17th century against ships, tents,
barricades, cities, and personnel. It was espe-
cially valuable as an incendiary because it was
difficult to extinguish since as water reacted with
the quicklime and also spread the petroleum.
These types of incendiaries were of definite value
in all of the wars fought during the Middle Ages
and their importance was not diminished until
gunpowder was introduced in the 15th century.
During the 16th, 17th, and 18th centuries,
the basic ingredients in incendiary mixtures con-
tinued to be sulfur and saltpeter to whieh were
added a number of flammable materials sueh as
resin, pitch, ta’low, beeswax, linseed oil, and tur-
pentine. For many years the recognized incendiary
projectiles were known as “carcasses.’’ In their
earliest form they consisted of cylindrical bags
or containers of canvas coated with pitch and
bound with iron hoops. The name was suggested
because of the likeness of these iron hoops to the
ribs of a corpse. Later, their shape became spher-
ical ; however, their filling remained the same—
a mixture of saltpeter, sulfur, resin, antimony
sulphide, and tallow—until carcasses became obso-
lete toward the end ot the 18th century.
Rockets with incendiary charges were em-
ployed by the British in the American Revolu-
tion as well as by the armies involved in the many
European conflicts of the 19th century. The
United States Army had incendiary items of
ordnance issue in the early part of the 19th cen-
tury. During the American Civil War, the in-
cendiary projectiles developed by the Union Army
and fired against Vicksburg, Charleston, and
Petersburg were of limited value. A flammable
liquid was also developed whieh could be used
with a flame thrower. These flame throwers
reached Bermuda Hundred, Virginia, early in
1S65, and may have been used in later battles of
the Civil War.*
In general, however, from the beginning of
modern times down to World War I, incendiaries
were not extensively used due to the increase in
battle distances, resulting from the introduction of
firearms. In addition, the defensive use of armor
and earthworks left little material that would burn
on the battlefields. These problems were not solved
until the advent of the World War I.
While both the French and German Armies
had developed incendiary artillery projectiles be-
fore World War I, these projectiles were not used
to any extent in the early days of the war, prob-
ably because they were ineffective against military
targets. The first incendiary munitions used in
this war evidently were incendiary bullets and
antiaircraft artillery projectiles directed against
observation balloons, and flame projectors against
ground troops. These devices, along with in-
cendiary bombing from aircraft, were first used
by the Germans in 1915.
Intensive research and development programs
were established by all the principal belligerents
in order to obtain improved incendiary muni-
tions. White phosphorus was effective against
• W. D. Miles, “The Civil War,” Part I, Chemistry and
Engineering News, Vol. 39, No. 14, April 3, 1961.
5-1
AMCP 706-185
readily combustible material sueh as balloons. It
was also very effective against personnel as it pro
duced painful burns and hence caused a de-
moralizing effect far in excess of the casualties
produced. Thermite and modified thermite mix-
tures were widely employed, especially in con-
nection with an additional incendiary material
such as “solidified oil.’’ Other mixtures contain-
ing an inorganic oxidizer sueh as potassium or
barium nitrate, barium or lead oxide, or potas-
sium chlorate, and a fuel such as carbon, sulfur,
magnesium, aluminum, or organic combustibles,
were used in small arms incendiary bullets and
with less success in drop bombs.
Solid oil (oil mixtures solidified with colloidal
additives) and flame projector liquids consisting
of a heavy viscous oil or tar and a more fluid and
flammable liquid were also developed but saw only
limited use during the war.
In spite of the tactical and strategic possibili-
ties associated with the use of aerial incendiary
bombs, only a limited amount of the development
work on incendiary munitions was directed to-
ward design of improved munitions of this type.
Two general types of aerial incendiary bombs
were developed. The first was the relatively large
bomb filled with an incendiary mixture, often
thermite and solid oil, designed to penetrate and
set fire to buildings and heavy construction. The
second was the scatter type* of incendiary bomb
which consisted of incendiary units in a large
bomb, or a cluster of small bombs (the latter being
the more sneees.sful of the two techniques), to
start, fires over a relatively large area.
The increasing use of military aircraft resulted
an increased interest, in small arms incendiary
ammunition since the employment of incendiary
ammunition was considered to be one of th" better
ways for destroying aircraft. The first small arms
round designed for air-to-air combat was probably
the British Pomeroy projectile with a kieselguhr
dynamite filler which had both high explosive
and incendiary functions, and was wry effective
against German airships. The earliest incendiary
small arms projectile used by the United States,
adapted from a British design, employed phos-
phorus as the incendiary material.
In the period between the two World Wars, only
a limited amount of research and development
was performed on incendiary munitions in the
United States. The white phosphorus filling for
caliber .30 incendiary ammunition was replaced
with a tracer composition. Development work on
incendiary compositions was actively resumed in
the United States in 1936.
General interest in small arms incendiary am-
munition was renewed during tin early years of
World War II. The DeWilde-Kaufman bullet,
designed in Switzerland ;.>y 1939, represented a
major step forward in the development, of small
arms incendiary ammunition in that it would func-
tion as desired against realistic targets. To elim-
inate the serious manufacturing and han ’Eng
problems, associated with this design, it was modi-
fied by British scientists to use the U.S.-developed
IM-11 incendiary mix. Modifications of the British
design were made later by the United Stales Ord-
nance Department to improve functioning char-
acteristics and to adapt the design to manufacture
by mass production techniques. These modifier-
tions, including some changes in the incendiary
composition, resulted in the U.S. Ml Incendiary
1’rojeetile which played an important role in win-
ning the Battle of Britain by defeating the Ger-
man air attacks. The development of modified in-
cendiary ammunition, ineluding armor-piercing
incendiary ammunition, was started in 1943; how-
ever, only a small quantity of these items had
been produced by tlm end of the war.
In the Battle of Britain, the Germans used a
1 kilo magnesium bomb against British cities with
great effectiveness. Л vers effective 4-pound mag-
nesium bomb had been developed by the British;
however, the United States did not as yet have a
satisfactory incendiary bomb. As a consequence,
the* British MK-lll magnesium bomb was re-
designed for mass product ion. A 4-pound thermite
bomb was developed as a siibsti’ate for the some-
what superior magnesium bomb and was used in
Gem-nd Doolittle's historic raid on Japan in April
194'..!. A s/nall t’-poum! magnesium bomb was also
developed and when used in (-lusters was considered
to be more effective against urban German targets
than the heavier .nweiio'iaries which had been de-
veloped lor industrial targets. Th >y were also
successful against Japanese industrial targets but
5-2
АМСР 706-185
penetrated too far to be highly effective against
Japanese dwellings.
The development of a small petroleum in-
cendiary bomb was started and led to the develop-
ment of the 6-pound napalm bomb whieh was used
with spectacular success in the strategic bombing
of Japan. Other petroleum incendiary mixtures
were developed, including the IM mixture whieh
contained finely divided magnesium. Against both
Europe and Japan, incendiary bombs proved to
be very effective weapons, especially when ap-
proximately one-fifth of them contained explosive
charges to discourage fire fighters.
Flame throwers were first used in the Pacifr
theater on Corregidor by the Japanese against
American troops who were not equipped with the
weapon. Due to its proven effectiveness and the
development of napalm, it was soon used by the
United States for combat operations in all theaters
of operation, cither as a portable nr it or mounted
on vehicles.
After World War II, research and develop-
ment directed toward the improvement of small
arms incendiary ammunition were continued. Em-
phasis was directed toward developing improved
ammunition with an increased effectiveness per
round against jet plain's at higher altitudi •-. This
work proved valuable during the Ko’-ean Conflict
when small arm incendiaries were used in the air
conflict, against enemy jet aircraft. Other in-
cendiary weapons, including incendiary bombs and
flame throwers, also were used windy and effec-
tively in this conflict by the United Nations forces.
The effort applied in the development of in-
cendiary weapons has resulted in peace-time uses
for these weapons. I’yvogel < or goop), which con-
tains fniei\ divided magnesium, and which was
used in the IM petroleum incendiary mixture, has
bee,, found io aid in th" burning out of forest
e nt' 1 ugs Tiie flame thrower is of value in fighting
fori st fires and in destroying unwanted vegeta-
tion. Studies into the causes of death by flame
। allied out during World Wai- 11 have direeti-d
attention of chilian firemen m unsuspected hazards
in fightfires of various kinds. Also, research
on the еГГе'Р iciness of imemiiary maninnition
ugaim-l HP era ft lias been of cable in connection
with aircraft fires
Starters, igniters and first fires, as adjuncts to
other pyrotechnic devices, have had a history
closely associated with such devices. Information
describing the development of early Chinese fire-
crackers includes descriptions of fuses containing
potassium nitrate (saltpeter), charcoal and sulfur.
In the 18th century mixtures of potassium nitrate,
sulfur, charcoal, and iron filings were widely used
for pyrotechnic purposes. They were readily ig-
nited and for this purpose a type of quickmatch
was employed.
The quickmatch was made from cotton thread
or string, moistened with vinegar or brandy and
eoaten with a mixture consisting of 16 parts po-
tassium nitrate, 3 parts charcoal and 1 part sulfur.
The mixture was worked into the thread by hand,
after whieh it was dried and cut into suitable
lengths. It was then connected to the pyrotechnic
device and used as its igniter
At the beginning of the 19th century phos-
pdiorus-tipped sticks, that could he readily ignited
by friction, were made available and were the fore-
runner of present day .matches.
Friction starters were developed later in the
19th century. These employed as a bead a mixture
of potassium chlorate and sugar with gum arabic
as a binder. In the form of matehc-s, these were
ignited by drawing them through a folded piece
of sandpaper.
Typical pyrotechnic munitions in the 19th cen-
tury consisted of rockets, flares, and fireballs which
could be ignited by a mixture of potassium nitrate,
sulfur, and arsenic sulfide, whieh. in turn, was ig-
nited by a quickmatch.
During World War 1, pyrotew nie munitions
were (o'veloped which used compositions more
difficult to ignite than cm iier compositions. In
the period between World War 1 and World War
11, limited effort was made to produce more satis-
factory ignition mixtures for pyrotechnic muni
tions. A considerable part of this effort was
directed toward the development of satisfactory
starter mixtures for lit’ smoke mixtures and for
theri-iite-tу)? inveiidinrics. During World War 11,
emphasis was again directed mainly, toward de-
veloping compositions which would meet the im-
mediate needs of the troops A relatively small
amount of vffort has been expended since World
5-3
АМСР 706-185
War II, particularly in connection with the de-
velopment of new illuminants.
In addition to their value as a source of heat,
the utility of combustion processes as a means for
measuring and controlling time intervals was
recognized early in history. The ancient Chinese,
Greeks, and others used open vessels of oil, erude
candles, and similar devices, to ignite either ex-
plosives or flammable material at a distance or
at some delayed time. In addition to their mili-
tary applications, such delayed reactions—cul-
minating in the sudden production of fire, smoke,
or a minor explosive phenomenon—were an im-
portant part of many early religious ceremonies.
The introduction of gunpowder stimulated the
development of somewhat more sophisticated delay
devices. A string or paper impregnated with an
oxidizer and elongated trails of powder were some
of the earliest pyrotechnic delay trains. Present
quickmatch and firecracker fuses are of this type,
however, they are normally used as transfer media
rather than timers. Fuses consisting of an in-
gredient such as black powder, contained in a
tubular cover, will burn reliably and at reason-
ably reproducible burning rate Safety fuse is of
this type. It is a lightly crapped train of potas-
sium nitrate and black powder burning at a rate
of 40 to 120 seconds per yard. Thi tubular cover
now is often impregnated fabric. An effort is
usually made to seal against moisture by the use
of wax and plastic coatings. The development of
these fuses made possible lavish firework displays
by crudely timing the sequence of events starting
with the propagation of the display into the air
followed by a sequence of bursts making up the
firework display. In addition, their use provided
the necessary time required for safety of the per-
sonnel igniting extensive ground displays. Fuses
of essentially the suine type uei- also used in con
uection with the early eoniHHTeial explosives used
in uiining and eons!ruction.
The i: ,v of projectiles containing explosives
was started sometime after 1 he introduction ul
artillery in military operatic Marly projectiles
w.-rc tilled with gunpowder auc losed with a
wooden plug containing a small laimtcr hole,
also tilled with oowder This erm fuse was ig.
niied by the pro:adling charge ami burned slowly
until the projectile arrived at or close to the tar-
get. Similar erude delay trains were developed
for incendiary and other projectiles used in early
naval warfare when ships were made of wood.
Their purpose was not only to delay functioning
until a projectile reached its target, but also
to further delay functioning so as to maximize its
effectiveness in damaging the enemy ship.
With the development of improved ammuni-
tion, more complicated fuse systems with improved
reliability and timing accuracy were required.
The earliest pyrotechnic delays which were rela-
tively accurate consisted of carefully produced
black powder trains or black powder rings. The
delay train was used in fuses requiring a set
delay while the ring delay was most often used in
those items requiring setting immediately before
use. In spite of the many problems associated with
the use of black powder delay compositions, due
mainly io their hygroscopic “nd corrosive nature,
they served as the basis of most, pyrotechnic delay
trains throughout World War 11,
Burning black powder liberates large amounts
of gaseous products which, in most fuse designs,
are vented to the atmosphere. In the development
of ammunition, especially antiaircraft ammunition
during World War I, it was found that the burn-
ing rate of black powder was affected considerably
by the rotational speeds of the projectile as well
as the varying ambient, pressures. Therefore, the
development of a more satisfactory fuse powder
composition was started with a low priority after
World War 1.
The first nongaseous delay powder—consist-
ing of red lead, silicon, and glycerin (84/15/1)—
' as developed in 1931. Since this composition
b irned too fast, slower burning powders contain-
ing lead chromate, silicon, and linseed oil (89/10/1)
were developed. Lack of personnel and funds, how-
ever, prevented a comprehensive, systematic study
of the many possible inorganic exothermic reactions
before the start of World War II. As a result,
black powder was again widely used in delay ele-
ments during World War II.
In 1942, a comprehensive study of possible
gasless delay mixtures was started?- While this
study was in progress, an urgent need developed
for delay powders to be used in the bombs used
АМСР 706-185
in “skip bombing.” A composition—containing
manganese, barium chromate, and sulfur—which
had been prepared on a laboratory scale, proved
satisfactory in spite of the many difficulties en-
countered in proceeding from a laboratory to a
production scale.23 The Navy developed, under
contract, a delay mixture containing nickel, zir-
conium, potassium perchlorate, and barium
chromate which was used satisfactorily in hand
grenades. While these delay powders—developed
under wartime conditions-—were used operation-
ally, they were far from optimum.24
Work after the end of World War IT was di-
rected toward the development of more satisfactory
gasless delay compositions. The availability of
certain powdered metal fuels—e.g., zirconium-
nickel alloys and boron—not available earlier,
helped in the development of the presently used
more satisfactory delay powders.
The development and use of thermal bat-
teries25'2'1 required a controlable heat source to
melt the electrolyte which is solid at normal tem-
peratures and to activate the battery. Early
thermal batteries were activated by weighed quan-
tities of loose heat powder, similar to delay compo-
sitions. introduced directly mto the battery eases.
Slightly improved results were obtained when the
battery was divided into compartments and the
loose heat powder added to each compartment.
Better results were obtained when the heat jtowder
was mixed with inorganic fibers and made into
heat paper by conventional paper making tech-
niques.2e 27
5-2 INTRODUCTION
Pyrotechnic mixtures, when burned, release
chemical energy in the form of heat. The heat
energy released is used for the production of light,
smoke, gas. and sound. Although the heat effects
produced in the surroundings by these items are
usually incidental anil may be undesirable, there
are a number of pyrotechnic items in which the
production of heat is the primary function.
Pyrotechnic heat producing mixtures can be
divided into two general categories, namely:
I. (‘ompo-.it ions which produce heat at a high
ra I e
a I zii11 inii mixtures which can be initiated
by mechanical, chemical, electrical, or other stimuli
of low energy and produce sufficient heat to cause
the ignition of other, less sensitive mixtures.
b. First fires, starters, igniters, and similar
less sensitive, but relatively easy-to-ignite mixtures,
'.ormaliy activated by the heat produced by an-
other thermal source. The sensitivity level of these
mixtures is such that sufficient quantities can be
used to supply the heat necessary for ignition of a
third mixture or main charge consisting of a pro-
pellant or pyrotechnic composition. A similar se-
quence of ignitions is also common to explosive
items.
c. Incendiary mixtures which are used for
dentrnet've ignition of combustible materials.
2. Compositions which produce heat at a low
rate:
a. Heat powders which produce a controlled
amount of heat for applications such as the activa-
tion of heat batteries or a controlled evolution of
gas, and for other purposes.
b. Delay mixtures which are used to ac-
curately control the time interval between initia-
tion and final functioning.
The rate and control of the heat output from a
pyrotechnic mixture, as well as the heat transfer
mechanisms involved, are very important in the
performance of its function. In this chapter, these
characteristics are emphasized as regards existing
heat producing pyrotechnic devices.
5-3 THEORY
The two important means by which energy can
be transferred are heat and work. Both of these
energy forms are transient in nature since they
exist only when there is an exchange of energy
between two systems or a system and its surround-
ings. If this transfer takes place without a trans-
fer of mass, and not as a result of a temperature
difference, the energy is said to have been trans-
ferred through the performance of work. If the
exchange is due to a temperature difference, the
energy is said to have been transferred in the form
of heat.
The amount of energy transferred as heat from
a burning pyrotechnic mixtures depends on : (1)
the amount and rate of energy released, (2) the
products formed. <। tin temperature reached by
AMCP 706-135
the products, (4) the method by which the energy
is transferred, and (5) the characteristics of the
material being heated, whether unhurned pyro-
technic mixture or other combustible.
5-3.1 AMOUNT OF ENERGY RELEASED1
The energy released by the reaction of a pyro-
technic mixture can be calculated by the methods
outlined in Chapter 3 (Paragraph 3-2.2.1) of this
handbook or can be determined experimentally by
bomb calorimetric measurements.
Certain generalizations can be made from the
results of these calculations involving metals and
oxidizers which might be considered for heat pro-
ducing mixtures. For a given fuel, the heat evolved
per unit-volume of the mixture (calculated from
the theoretical density for the mixture) depends
on the oxidixer used, as is indicated in Table 5-1
which is a summary of the heat evolved when alum-
inum reacts with various oxidizing agents. In
general, for a given oxidizer action the heat evolved
depends on the oxidizer anion in the following de-
creasing order:
CIO., > CIO, > NO;1 > A'nO4 > > Cr2O7 >
CrO4
As also shown in Table 5-1 for a given oxidizer
anion, copper salts yield more heat than lead eom-
|H>unds and either of these yields more than so-
dium, potassium, calcium, or barium compounds
when reacted with the same fuel. While copper
salts appear best, they are not commonly used
because of the difficulty involved in their ignition.
The reactions are listed in order of the 'neat evolved
i.«lories per cubic centimeter of mixture; the
heat evolved per gram of mixture is also given, for
comparison. In each ca.se, the calculated heat of re-
action is based on a particular (most common)
stoichiometry for the reaction; the indicated val
ues would vary when1 different stoichiometries are
possible. Sime lhe oxidizer exerts the greatest
influence on the heat of reaction, the replacement
of aluminum with other reducing agents would
result in an arrangement similar to that shown
in Tnble 5-1
The amount of oxygen available from a given
amount of oxidizer is the basic criterion upon
which oxidizers are judged. Three classes of oxi-
dizers which have Deen widely used in incendiary
compositions are the inorganic nitrates, perchlo-
rates, and peroxides. The total and available oxy-
gen for some of these oxidizers are given in Tables
5-2,2 5-3, and 5-4, Many of the potentially good
oxidizers listed in these tables contain large quan-
tities of water in their normally occurring crystal-
line forms. This reduces the available oxygen from
a given quantity of oxidizer and can affect burn-
ing (as an inert) as well as stability in storage.
Approximate decomposition temperatures are also
TABLE 5-1
HEATS EVOLVED FROM REACTIONS OF
ALUMINUM AND VARIOUS
OXIDIZING AGENTS
Reaction Callee Cal/ff
Al 4~ NaCiG4 7,000 2,600
Al 4- NaClOs 6,300 2,500
Al + KC1O4 6,100 2,400
Al + Pb(NOs)2 5,800 1,500
Al + KC1O3 5,400 2,200
Al -{• PbO2 4,900 700
Al 4- CuSO4 4,700 1,400
Al 4- CuO 4,600 900
Al 4- NaNO3 4,100 1,800
Al 4- Ba(NOa)2 4,200 1,400
Al 4- PbSO4 4,200 800
A' 4- KNo3 4,000 1,800
Al 4- CaSO4 3,800 1,300
Al 4- KMnO4 3,600 1,300
Al РедОз 3,500 900
Al 4- MnO2 3,400 1,100
Al 4- BaSO4 3,400 900
Al 4- Fe3O4 3,400 800
Al 4- Na2SO4 3,3(4) 1,200
Al 4- Pb3O4 3,300 400
Al 4- Na2O2 3,100 1,600
Al 4- K2SO4 3,100 1,200
Al 4- NH4NOs 3,000 1,600
Al 4- Na2('rO4 2,800 1,000
A) J- K2Cr2()7 2,800 1,000
Al -I- BaO2 2,600 600
Al 4- PbO 2,500 300
Al 4- BaCrO, 2,400 600
Al 4- K2CrO4 2,200 800
5-d
АМСР 706-185
TABLE 5-2
OXYGEN CONTENT OF VARIOUS NITRATES
Nitrate Density g/cc Approx. Decomp. Temp, °C Oxygen Contained Oxygen Available
g/g 0/cc g/g g /СС
Liquid O2 1.14 —- 1.00 1.14 1.00 1.14
Liquid Оз 1.71 — 1.00 1.71 1.00 1.71
Aluminum (d-HaO)1 — 130 .77 —— .32 —
Ammonium 1.73 210 .60 1.04 .20 .35
Barium 3.24 600 .37 1.19 .31 .99
Beryllium (-j-HaO)1 — 100 .78 — .39 —
Calcium (-f-1 IjO)1 2.36 560 .59 1.38 .48 1.14
Chromium НцО)1 — 100 .71 — .32 —
Cobalt (+ НИО)’ — 100 .59 .44 —
Copper f-f-HoO)1 — 150 .51 — .42 —
Iron (Ferric) ( -|- H2O)’ — 100 .47 — .39 —
Lead 4.53 470 .29 1.31 .24 1.10
Lithium (-f-UzO)1 2.38 260 .69 1.65 .58 1.38
Magnesium (+ НгО)‘ — 100 .75 — .62 —
Manganese — 130 .54 — .40 —
Potassium 2.11 400 .47 1.00 .40 .84
Sodium 2.26 350 .56 1.28 .47 1.06
Strontium 2.99 600 .45 1.38 .38 1.13
' (H2O) indicates that a hydrate of the nitrate । is a common form of the salt. All data
presented in the table, however, are for the anhydrous salt.
given in these tables. The thermal decomposition
of many of the possible oxidizers has been studied
in detail?
In Table 5-5, reactions are shown between var-
ious metallic and iionnietallic reducing agents, and
barium peroxide. Tin1 heats evolved from reactions
id' these materials with other oxidizing agents
wonld generally rank in the same order.
Some of the combinations included in Table
5-5, such as barium peroxide with tin, chromium,
and zine, arc’ so insensitive that the peroxide would
decompose before ignition oeerrred. Conversely,
red phosphorus and sulfur with peroxides can be
sensitive to the* point of spontaneous deeoinposition
and constitute a hazard. The equivalent heat value
given in th s table is the heat evolved for the re-
action':, as | iven in the equations, divided by the
number of quivalent weights of reducing agent
in the equation. The equivalent heat has been
used as a measure of the reducing power of these
compounds.
It should be noted that combustion of liquid
hydrocarbon fuels such as gasoline and kerosene,
whieh were widely used as incendiaries during
both World War II and the Korean Conflict, re-
sults in the evolution of about 10 kilocalories per
gram. This is considerably better on a weight
basis than for the metal incendiary materials:
thermite, 0.8 kilocalories per gram, and magne-
sium, 0.0 kilocalories per gram. However, the
temperature reached by the hydroearbon-oxygen
reac tion is less than that reached by incendiaries
incorporating metal fuels.
5-3.2 HEAT TRANSFER
The efficiency and performance of pyrotechnic
devices are considerably influenced by the various
modes and rates of heat transfer present through-
5-7
АМСР 706-185
TABLE 5-3
OXYGEN CONTENT OF VARIOUS PERCHLORATES
Perchlorate Density g/cc Approx. Decomp. Temp, °C Oxygen Contained Oxygen Available
g/g <7/cc g/g S'/се
Liquid Oa 1.14 — 1.00 1.14 1.00 1.14
Liquid O3 1.71 — 1.00 1.71 1.00 1.71
Ammonium 1.95 — 0.54 1.06 0.27 0.53
Barium (H2O)1 — 500 .38 — .33 —
Cobalt (H2O)1 3.33 — .50 1.65 .40 1.34
Copper — 110 .27 — .16 —
Iron (H2O)1 — — .62 — .29 —
Lead (H2O)' 2.6 100 .31 .99 .24 .63
Lithium (Н2О)1 2.43 410 .60 1.47 .53 1.28
Magnesium (H^O)1 2.60 — .57 1.48 .50 1.30
Potassium 2.52 400 .46 1.16 .40 1.02
Sodium (H0O)1 2.49 480 .52 1.29 .46 1.15
1 (H2O) indicates that a hydrate of the perchlorate is a common form of the salt. All data
presented in the table, however, are for the anhydrous salt.
TABLE 5-4
OXYGEN CONTENT OF VARIOUS OXIDES AND PEROXIDES
Oxid< or Peroxide Density, g/ee Approx. Decamp Temp, °C Oxygen Contained Oxygen A nailable
g/g S/cc gig glee
Liquid <>0 1.14 1.00 1.14 1.00 1.14
Liquid CL 1.71 --- 1.00 1.71 1.00 1.71
Barium Peroxide (Ibd))1 4.96 - .19 .94 .09 .47
Calcium Peroxide (H2O)‘ 280 44 *22
Chromium Trioxide (ИЗ))1 2.7 190 .48 1.30 .24 .65
Iodine Pentoxide 4.80 300 .24 1.15 .24 1.15
Iron ( Pe2< )3 1 5.12 .30 1.54
Lead Dioxide 9.38 29(1 .13 1 26 .07 .63
Manganese Trioxide .47 .23 —
Potassium Peroxide 2.74 .29 .61 .14 .30
Sodium Peroxide (IL..O)1 2 81 .41 1.15 .20 .58
Strontium Peroxide (H2O)‘ .27 14
1 (HnO) indicates (hat a hydrate of the peri‘\i le r; a common f(iril! ‘if this material. All
data presented in this table however, are lor ibv inbydruus term uf thv^v pci oxides.
AMCP 706-185
TABLE 5-5
HEAT OF REACTION OF REDUCING AGENTS
WITH BARIUM PEROXIDE
Equation He,at of Reaction (Kg-cal) E quivalent Heat (Kg-cal)
BaO2 4- Mg -* Bat) 4- MgO 126.7 63.4
2BaO2 4- Zr -> 2Ba() -|- ZrO2 2.19.3 54.8
3BaO2 + 2A1 -> ЗВаО 4- A12O3 321.8 53.6
5BaO2 4- 2red P —» 2BaO Ba <(PO4)2 487.6 48.8
2BaO2 4- Ti 2BaO 4- Ti02 186.2 46.6
2BaO2 4- Si -> 2BaO 4- Si02 162.6 40.7
Ba()2 4- Mn -» BaO 4- M11O 77.1 38.6
3BaO2 4- 2Cr -» ЗВаО 4- Cr2O3 214.8 35.8
BaO2 4- Zu -♦ BaO 4- ZnO 64.1 32.1
2BaO2 4- S11 —» 2BaO 4- Sn()2 99.3 24.8
5BaO2 4- CaSi2 —♦ 5BaO 4- (fat) 4- 2Si()2 236.7 23.7
3BaO2 4- 2Fe —» 3BaO 4- Fe2O3 140.3 23.4
BaO2 4- Cd-» BaO 4- Cd() 45.8 22.9
3Ba()2 4- W -> ЗВаО 4- WO, 137.5 22.9
3Ba()2 4~ Mo—» ЗВаО 4~ M0O3 118.3 19.7
2BaO2 4- 2S -> BaS 4- BaS()4 155.8 19.5
BaO2 4- Ni -» BaO 4- NiO 39.0 19.5
BaO2 4- Co —> BaO 4- Co() 38.1 19.1
3Ba()2 + 2Sb—> ЗВаО 4- ,"ib2O;1 i()7.8 18.0
3BaO2 4- 2Bi -» ЗВаО 4- Bi2O:, 78.9 13.2
BaO2 4-C11—► BaO 4- Cut) 16.4 8.2
2BaO2 4 2Se—» BaSe 4’ BaSeO4 54.3 6.8
unt the system. Although extremely eoniplb mted
nice ha 11 isms exist in some cases, a knowledge of the
problems involved is important to the improve-
ment of pj roteehnie compositions and hardware
design.
Heat is transferred by one or by a combination
if the three basic mechanisms: conduction, eon-
vi"‘timi, and radiation. During propagative hurn-
nig. only one of these modes is controlling.
5-3.2.1 Conduction
lii <’•!<Inetion. the heat energy is transferred
by molecular motion and frt.....lectrons. Materials
like the metals, which are good conductors of heat,
have a well-ordered crystalline structure and are
rich in free electrons. All materials conduct heat
to some extent. In liquids and gases, the amount
transferred by this method i.- usually small when
compared with the amount transferred by other
means. The rate of heat transfer </, at which heat
flows across an area .1, is given by:
<1^ kA (5-1)
where к is the thermal conductivity, and dt/dx
is the temperature gradient at the point of in-
terest. The rate expressions for a general three-
dimensiomil case are more complex.
The thermal conductivity of tlie pyrotechnic
mixture has been shown to influence the burning
rate due to a preheating of the nnburned eomjxi-
sition (Paragraph 6-3.5). The amount of preheat-
ing is usually a function of the metal content of
the mixture due to its higher thermal conductivity.
5-9
АМСР 706Л85
The degree of consolidation also affects the rate of
heat transfer. The heat conduction along solid
flares has been measured3 by imbedding thermo-
couples in the composition at the time of compac-
tion. From these data it was possible to construct
a model for relating the instantaneous tempera-
ture at. a point in the flare to that of the reaction
zone.
Conduction heat transfer as well as radiation
influence the on-target combustion efficiency of
certain types of incendiary mixtures. The rate of
energy release of the fuel-oxidant reaction, inti-
macy of contact, and ehemieal-jfliysieal properties
of the target influence the heat transfer rate.
Heat is transferred by conduction as well as
by the other modes in ignition trains, delays and
heat powders, and should be taken into considera-
tion in establishing design criteria.
5-3.2.2 C‘ nvection and Radiation
Convective and radiative inodes of heat trans-
fer in pyrotechnics are more closely associated
with post-combustion phenomena. Convective heat
transfer effects are less important and will only
be mentioned briefly. Transfer of heat energy by
convection results from the gross movement of the
fluid transfer medium. The amount </ of heat
transferred by convection can be expressed by the
general equation :
</ = /<A(AT) (5-2)
where h is the heat transfer coefficient, which may
be a complex function of a large number of prop-
erties including those relating to the fluid motion:
A is the cross-sectional area; and AT is the tem-
perature difference. Convective heat transfer ef-
fects may exert an influence on the luminous out-
put and efficiency of flame plumes by moving oxy-
gen into the combustion area and/or by cooling.
These effects are usually slight and their measure-
ment extremely complicated.
Heat transfer by radiation does not icqnire a
transfer medium. The amount of energy emitted
from a heated surface whieh has blackbody char-
acteristics is:
q = sAT4 (5-3)
where t is the Stefan-Boltzmann constant, A is
the area of the emitting surface, and T the absolute
temperature. A graybody, or mmselective radiator,
is one in which its emissivity is independent of the
wavelength. At a given temperature, the amount
of energy emitted per unit area at any wavelength
is less than that from a blackbody. The net heat
exchange between two bodies in whieh both the
hot and cold body are graybodies is:
</nrr = 4h — <1,- (5-4)
where the net heat exchange is the difference be-
tween the amount of heat q transferred by radia-
tion to the cooler body, less the amount q trans-
ferred from the cooler to the hotter body. Tais may
be written also as:
<ln<t = #ла,.7'\_>,.Алсг7'л4 - - E. ^F^nA^TA (5-5)
or by application of th? reciprocity theorem:
qnct = Г4^гт (7’y1 — TA)
- EcahF^A,.c(TA- TA) (5-6)
where E is the emissivity, a is the absorptivity, F
is the fraction of the energy emitted by a radiating
body that is absorbed by the absorbing body, A is
the area of th»* emitting surface, a is the Stefan-
Boltzmann constant, and T is the absolute tem-
perature. The subscripts It refer to the hotter body,
and the subscripts c refer tc the cooler body.
Radiation heat transfer is important in post-
combustion phenomena of pyrotechnic flares since
it is the primary mechanism by whieh heat is re-
turned to the reaction zone. This feedback is im-
portant to the maintaining of propagative burning
and maximum possible efficiencies in these type
reactions. As already indicated, rad'ative heat,
transfer mechanisms also influence the efficiency
of certain types incendiary mixtures. In this case,
it is expedient to produce radiating species whieh
will be readily absorbed by the target.
5-3.3 HEAT EFFECTS
If heat is transferred to or from a system, the
temperature of the system usually changes. The
magnitude of the temperature change depends on
the mass of a system and its heat capacity. These
quantities are discussed in Paragraph 3-2.1. Trans-
fer of heat may also cause phase changes such as
crystalline transition, melting (or freezing), vap-
АМСР 706-185
arization (or sublimation), and dissociation. The
energy involved in these changes in state may be
large in comparison with those involved in th»
raising or lowering of the temperature of the
system. Changes in state brought about by the
absorption of heat may be extremely important in
initiating combustion since the fuel and oxidizer
must in some eases be converted into the gaseous
state for the combustion process to proceed.
5-4 INCENDIARIES
Incendiary devices art1 used to initiate destruc-
tive fires in a large variety of targets While air-
craft. buildings, industrial installations, ammuni-
tion, and fuel dumps are among the principal tar-
gets for incendiary attack, incendiaries have proved
to be effective against personnel, armored vehicles,
and tanks. In many eases, the psychological fear
of tiro increases the effectiveness of ;m incendiary
attack as personnel may abandon relatively safe
positions and vehicles thus exposing themselves
to the action of other weapons.
Incendiary compositions and incendiary de-
vices can be classified in many ways depending on
their composition and use. In this handbook, in-
cendiaries are grouped into three large classes
based on their use:
1. Small arms incendiary ammunition used pri-
marily against aircraft and fuel dumps.
2. Other incendiary munitions including bombs,
grenades. mortar and artillery projectiles; to
initiate fires in buildings, industrial installa-
tions, ammunition, fuel dumps and other targets
in the combat zone, in areas behind the combat
area, and in the zone of interior of the enemy.
3. Special incendiary devices used for covert
purposes, in connection with guerrilla opera-
tions, and for the destruction of material and
documents.
5-4.1 SMALL ARMS INCENDIARY
AMMUNITION8
Small arms incendiaries are used primarily for
starting destructive fires in aircraft fuels. The
burst produced serves, basically, as an ignition
source for the fuel carried by the aircraft since it
is unlikely that a small arms incendiary burst of
sufficient intensity or duration would weaken air-
craft structures, li is important that the bullet or
projectile provide a hole in a self-sealing fuel tank
so that some fuel is spilled and ignited by the
burning incendiary material. This emphasizes the
importance of widespread distribution of burning
particles and long burst duration. Most small arms
incendiary compositions are mixtures of metal, or
metal alloys, and an. oxidizing compound. These
mixtures when initiated, in contrast to some other
incendiaries, usually burn rapidly; often with ex-
plosive violence. Unfuzed incendiary rounds up to
20 mm sizes are usually initiated by the heat pro-
duced from the crushing of the metal nose by im-
pact while 20 mm and larger sizes are provided
with fuzes which are initiated by impact.
The functioning of a thin meta! nose, nonfuzed,
small arms incendiary bullet can be divided into
three separate stages:
1. Initiation of incendiary compositions by bul-
let impact on target.
2. Rapid burning and heating of the composi-
tion and its combustion products until a maxi-
mum temperature is reached and the burning
contents burst from the bullet jacket.
3. Cooling of the products from their maximum
temperature to the minimum effective tempera-
ture, i.e., the minimum temperature necessary
for fuel ignition.
The chain of reaction with fuzed incendiary
rounds, such as 20 mm. is similar to that described
except that the sensitive fuze starts ignition upon
impact.
The degree of penetrat.’on before initiation of
the burst is determined, primarily, by the sensi-
tivity of the bullet and its ability to carry through
target areas to the interior of the aircraft. The
physical size of the incendiary burst produced also
affeets its burst location in the aircraft. This has
been found to be especially important in the case
of sparking-type incendiary compositions since they
spread throughout a target area and produce a
very large and effective burst volume.
For many incendiary compositions, for which
the burning time is very short, the effective burst
duration is the time required for the products to
cool to the minimum temperature required for fuel
ignition. In other mixtures which contain relatively
5-11
AMCP 706-185
TABLE 5-6
SUMMARY OF LIMITS OF FLAMMABILITY OF VARIOUS GASES
AND VAPORS IN AIR AND IN OXYGEN
Gas or Vapor Limits i >1 Air, f'c Lit nils in Эхудеп, % Oxygen Percentage Below Which No Mixture is Flammable
Lower Higher Low er Higher Nitrogen ns Diluent of Air Carbon dioxide as Diluent of Air
HYDROCARBONS Methane 5.3 3 0 (5.0) 14 12 5 15 15 5.1 3.0 61 66 12.1 11 0 14.6 13.4
1_4 Llittlic .... Pvr\n.art»> 2.2 1.9 1.8 1.5 1.4 1.4 1.2 1.2 1.2 1.2 1.1 1.0 1.1 P4 9.5 8.5 8.4 7.8 7.6 7.5 7.5 7.0 7.0 6.7 6.7 2.3 1.8 1.8 55 49 48 11.1 12.1 12.0 12.1 14.3 14.5 14.8 14.4
DUtaHt! TertViiiianA
Pentane
Isopentane 2-2 Dimethyl propane
11.0 14.5
nexaiic Dimethyl butane
л-ivieinyi pcunuc 1.1
Heptane
UllllC Lily 1 pCallrttLAC
1.0 .8 У' 6.0
Iso-octane Nonane
.8 4.9
tetrameinyi peuuniu 5.7 5.4 34 11
Diethyl pentane Decane .8 3.1 2.4 2.0 1.6 1.8 1.8 1.5 2.0 2.5 1.4 1.4 L0
2.7 2.0 32 10.3 9.6 9.3 9.7 8.8 8.7 11.5 3.0 2.1 80 53 10.0 11.5 14.7 14.1
£jI>UjScDC ..... Propylene
Butylene 1.8 1.7 58 55 11.6 14.0
О.Ллпл 0
Hutene-z Isobutylene b-n-Atnylene 1.4 ' (2.3)
10.4 13.1
81
Acetylene 7.1 11.2 13.9
1.3 1.6 6.7 6.0
Toluene o-Xylene
£>tnyi oenAtfuc Styrene 1.1 .8 .9 6.1 5.8 5.9
Butyl benzene
N aphthalene Cyclopropane 2.4 1.2 1.1 1.3 1.2 .9 7.0 5.5 4.8 3.8-6.5 1 j 10.4 7.7 6.7 8 2.5 60 11.7 13.0
Ethyl cyclopentane Cyclohexane
Methyl cyclohexane. Ethyl cyclohexane MIXTURES 6.6 72 36 13.5 13-17
Water gas
Carbureted water gas 12.0 14.4
г 1 l.vSOUTgU Ha I HI «1
Other natural gases
Benzine 1.4 0^8 ' .7 7.6 11.6 14.4
5 5
5.3 4.4 35 17 4.7 32 34 74 70 33 7 70 11.5 14.4
Coke-oven gas Blast furnace gas
11-35 70-80
Producer gaa
Oil gaa
5-12
АМСР 706-185
slow-burnhig metal fuels, the burning time is an
appreciable part of the total burst duration.
5-4.1.1 Ignition and Combustion of Aircraft Fuels
It is generally accepted9 '0 that the combustion
of a hydrocarbon: (1) occurs in the gas phase,
(2) involves a chain-reaction mechanism which in-
cludes the formation of unstable species such as
free atoms and free radicals, and (3) can occur
only when the concentration of the hydrocarbon
vapor in the air falls within certain well-defined
limits, as illustrated in Table 5-6.“ Normal varia-
tions in atmospheric pressure do not appreciably
affect the limits of flammability; and, for most mix-
tures, there is a straight line relationship between
the limit of flammability and the initial tempera-
ture of the mixture.12
For fuel concentrations within the flammability
zones, a fire or explosion can result from contact
with an incendiary source when the temperature of
this source is sufficiently high. Various methods
have been tried to determine the minimum igni-
tion temperatures for various liquid fuels. A popu-
lar experimental procedure for such determina-
tions involves confinement of the fuel vapor and
air mixture in a suitable container and application
of external heat until the mixture ignites. In gen-
eral, the hydrocarbons of a higher molecular weight
tend to ignite at lower temperatures. There ex-
ists, however, an ignition lag13 (Paragraph 3-3.6.1)
whieh is dependent upon several variables.
Grades JP-1 and JP-3 aviation fuel have mini-
mum ignition temperatures between 400°F and
500°F, with an associated ignition lag from 100 to
200 seconds. Aviation gasolines have minimum
ignition temperatures of 800°F to 950°F with an ig-
nition lag of 2.0 to 2.5 seconds.14 The ignition lag
for all hydrocarbon fuels becomes less with increas-
ing temperatures. At the minimum ignition tem-
perature of gasoline, about 900°F, the ignition lag
for kerosene is in the range of 2 to 10 seconds.18
Fires, therefore, can be initiated and propagated
in a flammable kerosene vapor and air mixture as
readily as in a gasoline vapor and air mixture if
both mixtures are within the flammability zone.
Consequently, factors whieh control the formation
of fuel vapor are of primary importance in de-
termining ignition characteristics.
The energy required to vaporize a given quantity
of kerosene is somewhat less than that for gaso-
line. The energy must be available, however, at
somewhat higher temperatures because of the lower
volatility of kerosene. The energy made available
for evaporation of fuel by the flame of a self-
propagating fire is roughly the same for gasoline
and kerosene inasmuch as heat of combustion for
both fuels lies in the range of 20.000 to 22,000
BTI' per pound.
It is well established18 that fires can be initiated
by an incendiary bullet penetrating self-sealing
aviation fuel cells above the liquid level, if the free
space contains air, perhaps because of a previous
puncture or air leaking into the tank. Rarely, if
ever, has a fire been started inside the tank by an
incendiary bullet striking below the liquid level.
In fact, during developmental tests of incendiary
ammunition, care was always taken to strike the
tank below the liquid level with a second shot if
the first shot failed to ignite. All effort was toward
developing an incendiary bullet with one shot ig-
nition capability below liquid level as this was
most difficult to achieve. Success was achieved
when incendiaries of long burst duration and long
particle burning time were developed. These long
burning particles ignite the small spurt of fuel
which is forced through the bullet hole after 30 to
50 milliseconds by the pressure wave set up inside
the tank by the bullet.
Flame will propagate in kerosene mist-air mix-
tures for a wider range of concentrations than in
kerosene vapor-air mixtures. It is impossible to
obtain a concentration of kerosene mist in air
too rich to be ignited if the temperature is be-
low the flash point of kerosene. However, at
temperatures high enough to produce a vapor
concentration in air near the upper limit of
flammability, the mixture may be so rich that it
fails to propagate. The initiation of a mist ex-
plosion takes place after the evaporation of mist
droplets near the ignition source from a local vapor
concentration within the explosive limits. This
vapor ignites to form the initial flame front. Propa-
gation of the flame proceeds by evaporation of
droplets whieh form an inflammable gas mixture
in the preheating zone in advance of the flame
front.
5-13
АМСР 706-185
INCHES
Figure 54. Constant Ignition Probability Regions About a
Fuel Jet of Gasoline or Kerosene
Studies of phenomena associated with the pene-
tration of liquid fuel tanks show that hydro-
dynamic forces resulting from the impact of a
projectile on an aircraft fuel cell produce a pres-
sure wave in the stored liquid. A high, positive
pressure is near the point of tank penetration a
few milliseconds after impact by the projectile.
The fuel spray emerging from the hole made by
the projectile has the normal characteristics of
filament jets with droplets forming at the leading
edge of the filament.
The basic factors which account for the differ-
ences in flammability characteristics of aircraft
fuels are the relative volatility and viscosity of the
fuels. The relatively low volatility and high vis-
cosity of kerosene make it considerably more diffi-
cult to ignite than gasoline. Results of tests (with
fuel jets designed to simulate the fuel spray made
as a projectile penetrates a fuel tank) presented
in Figure 5-1 indicate that the probability of a
positive ignition is greater for gasoline than for
kerosene at any point in the volume surrounding
the axis of the jet. The type of fire occurring with
the gasoline jet is usually different than that oc-
curring with kerosene. Most gasoline fires propa-
gate n”i(lly through the fuel spray. Little, if any,
unbtirned fuel is left in the area. In contrast,
nearly all kerosene ignitions are localized, seldom
propagating more than a few inches from the point
of ignition so that most of the fuel is left un-
burned.
The effectiveness of incendiary ammunition also
depends strongly on the ambient pressure and the
supply of oxygen from the atmosphere since these
factors are important if a seif-sustaining fire is to
result from the action of incendiary bullets. In-
formation obtained from tests in partially inert
atmospheres, both in altitude chambers and in actual
flight tests, indicates that damaging fuel fires can-
not be started at very high altitude. Studies with
several pure fuels indicate that the relationship be-
tween spark minimum ignition energy H and
pressure for a fuel-air mixture can be represented
by :,я
Я = ~ (5-7)
p
where p is the pressure, A: is a constant which de-
pends on the nature of the fuel, and n is another
constant having a value of about 1.S2. Even if
fires are initiated at high altitude, the nature
of the fires, especially at the higher airflows, might
be diffused and low in temperature, thus limiting
the damage produced.
5-4.1.2 Nature of a Small Arms Incendiary Burst
As already indicated, the burst produced by
the functioning of small arms incendiaries is funda-
mentally an ignition source for starting a destruc-
tive fuel fire in an aircraft. The amount of
energy transferred to the fuel depends on the
nature of the combustion process (the temperature
reached and the characteristics of the products of
combustion), thi* mode of energy transfer process,
and the efficiency with which the energy is ab-
sorbed by the fuel.
The maximum temperature reached in an in-
cendiary burst is a measure of both its relative
intensity and duration, as a result of chemical
reactions which occur within the burst to the end
of its cooling cycle. A consideration of the burst
temperature, and the effects of the physical and
thermodynamic properties of incendiary mixture
ingredients and their reaction products, comprise
an important area of study concerning an incendi-
ary burst. The temperature produced by an
incendiary burst can be estimated by calculations
using the methods outlined in Paragraph 3-2.5. It
is necessary to assume, arbitrarily, the amount of
atmospheric oxygen available for combustion of the
5-14
АМСР 706-185
incendiary mixture. The extreme conditions are
either: (1) that the only oxygen available for
combustion is that contained in the mixture com-
ponents due to insufficient time for the diffusion of
atmospheric oxygen into the flame; or (2) that
the surrounding air supplies the additional oxygen
required for complete combustion of the reactants.
The actual condition is probably somewhere be-
tween. Limited experimental data obtained for
bursts in controlled atmospheres indicate that the
surrounding atmosphere does not enter appreciably
into the incendiary reaction so that condition
(1) is the better assumption. The difference in the
results is small, however, because of the necessity
for heating the nitrogen of the air under assump-
tion (2). (See also Example 4, Paragraph 3-2.5.)
The rate of heat transfer from the burst cloud
to its surroundings depends also upon the method
by which the heat is transferred. Heat can be
transferred by combustion, convection, and radia-
tion ; however, at temperatures above the ignition
temperature of aircraft fuels, hear transfer by
radiation is probably the dominant method. Radi-
ant energy emitted by the liquid, solid, and gaseous
species in an incendiary burst is a complicated
function of wavelength, pressure, geometry, and
chemical composition of the emitting molecular
aggregate, as well as of temperature. However,
based on experimental results, it can be assumed
that the incendiary burst cloud radiates as a gray-
body with a relatively high emissivity.
The rate of heat transfer from an incendiary
burst cloud, radiating as a graybody may be ex-
pressed by:
dQ/dd=
ЕцЕрх) Tn1 — Ts*)A
Eи -j- Eg — EiiEg
(5-8)
where Л is the total radiating area of the com-
ponents in the burst i loud, dQ is quantity of heat
radiated by the incendiary burst cloud during time
interval d'B, a is the Stefan-Boltzmann constant,
E is the emissivity, and T is the absolute tempera-
ture. The subscript R refers to the burst and the
subscript X refers to the surroundings. By com-
bining this equation with the equation dQ = mCdT
where f’ is the overall average specific heat—i.e.,
equals the heat evolved per gram, including that
from phase changes, in the cooling of the reaction
products from the maximum temperature reached
by the incendiary hurst to the minimum effective
temperature divided by the temperature differ-
ence—and neglecting T g* since it is very much
smaller than 7'/d, integration yields:
Q2__ / 1 _ 1 \ m. (EH -|- Eg — EBEB)C
\ Td' ' 7’,3 ) 3 sEsEBA
(5-9)
If it is assumed that the radiating area A and
emissivities Ец and Eg have average values which
may be assumed constants for the various bursts,
the terms outside of the parentheses may be con-
sidered a constant К and:
= (5Л0)
If к is assumed to be 10® (A 2 X 104cm2, Ев ~
0.9, Es = 0.1 and m -- 1), the curves in Figure
5-2 result where it is assumed that the minimum
effective temperature is 800bK.
If the adiabatic* flame temperature can be cal-
culated or experimentally obtained and if the heat
of reaction is known, Figure 5-3 can be used to
estimate an average specific heat. If Figures 5 2
and 5-3 are combined, Figure 5-4 results. As can
be seen, the cooling time varies directly with the
average specific heat. The curves also indicate that
any increase in the burst temperature above 2000°K
results in only a small increase in the cooling time.
Change in cooling times resulting from transfor-
mations is difficult to determine because the details
of the cooling mechanism are not known.
Experimental cooling curves for incendiary
mixtures are given in Figure 5-5.19 IM-11, 50
percent barium nitrate and 50 percent magnesium-
aluminum alloy, is one of the standard mixtures
used in incendiary bullets. IM-23, 50 percen
potassium perchlorate and 50 percent magnesiun
alloy, contains no barium nitrate and its calcu-
lated temperature is higher than that for IM-11.
IM-63—50 percent calcium peroxide, 45 percent
red phosphorus, and 5 percent aluminum hy-
droxide—does not contain either barium nitrate or
alloy, and has a considerably lower theoretical
maximum temperature than IM-11. It is to be
noted that 1M-I03, 50 percent red phosphorus and
50 percent niagnesium-aluminum alloy, does not
contain an oxidizer.
5-15
АМСР 706-185
Figure 5-2. Maximum Temperature, T, as a Function of
Heat af Reaction and Average Specific Heat, C
5-4.1.3 Small Arms Incendiary Fillers
Small arms incendiary ammunition, which now
includes ammunition through 40 mm, has been
developed, like other ammunition, to meet the par-
ticular needs of the using Services. Important
modifications and improvements were made through
the years in response to changes in Service needs
or anticipated changes in Service requirements.
Early developments in small arms incendiary am-
munition fillers have been discussed in the his-
torical review of incendiaries (Paragraph 5-1).
Sensitive explosives—ineluding mercury ful-
minate, lead azide, and PETN—were employed in
some early incendiary fillers. Other explosives—
including tetryl, MOX, TNT, Haleite, and EDNA
—also have been tried in smaller nonfuzed in-
ce idiary ammunition but have not proved satis-
factory. High explosive incendiary ammunition
i; 20 mm and larger sizes contains a purely ex-
Figure 5-3. Cooling Time to 800°K a* a Function of
Temperature and Heat Capacity, C
plosive material in addition to its incendiary filler
material
Magnesium-aluminum alloys have been an es-
sentia! ingredient in most of the successful incendi-
ary mixtures, and have replaced both white phos-
phorus incendiaries and tracer compositions.
Tracers, first used as incendiaries, employed a
filler consisting of two parts magnesium and seven-
teen parts barium peroxide for incendiary pur-
poses. I'ntil the development of the highly satis-
factory incendiary filler based on a magnesium-
aluminum alloy (50/50) fuel, with barium nitrate
as the oxidizer, changes in tracer mixtures used
as incendiaries were limited to those which would
improve the performance of metal-oxidant com-
positions. Numerous incendiary mixtures have been
tested for use in small arms ammunition in the
period since the beginning of World War II. A
detailed card file listing of the incendiary mixtures
which have been given an IM number (approxi-
mately 1000) is maintained at Frankford Arsenal.
5-16
АМСР 706-185
Figure 5-4. Cooling Time to 800°K a* a Function of Heat
of Reaction and Specific Heat, C
5-4.1.3.1 Fuels
Incendiary compositions containing magnesium-
aluminum alloy have been the basis of most of the
standard incendiary compositions investigated un-
til recent years. Studies have indicated that an
alloy of 50/50 proportions, prepared by grinding
with a particle size range from 60 to 325 mesh,
is optimum for a wide variety of applications.
The effects of variation in the granulation of the
magnesium-aluminum alloy were evaluated early
in the program, leading to the development of
IM-11 (composed of 50 percent magnesium-alum-
inum alloy 50/50, and 50 percent barium nitrate)
which was the basic incendiary mixture used in
World War II. Figure 5-6 show's the cooling
curves and burst duration (the time from ignition
until burst cloud cooled to 1540°K) curves for
mixtures w'hich contain either the ground or
atomized alloy in a variety of mesh sizes with
some barium nitrate. The results presented in this
figure indicate that an increase in burst duration
and cooling time results with coarser and with
atomized or spherical particles. Firing tests con-
firm these results. Evaluations of magnesium-
aluminum alloys other than 50/50 show that the
50/50 alloy is superior for a variety of applica-
tions whether ground or atomized.
In an attempt to develop improved small arms
incendiary mixtures, a large number of metals and
alloys were evaluated for their effectiveness as in-
cendiary fuels with several oxidizing agents, as
reported in detail in Reference 6. Some of these
mixtures produced incendiary bursts which have a
longer duration than those produced by IM-11.
These mixtures also have proved to be more effec-
tive than IM-11 in comparative tests against air-
craft targets.
5-4.1.3.2 Oxidizers
A wide variety of materials have been used
as oxidizers in incendiary mixtures. An oxidizer,
for use in mass-produced items which are loaded
by automatic machines, must meet a variety of
requirements in addition to being able to supply
the necessary quantity of oxygen.
The effects of oxidizer particle size on in-
cendiary bursts have been studied. Incendiary
mixtures containing oxidizer particles of compara-
tively large size (100 to 200 mesh) could not be
ignited unless the mixture contained finely divided
(less than 325 mesh) alloy fuel particles. Mix-
tures containing fine or medium-sized barium
nitrate particles would not burn except when
mixed with coarse alloy. Alloy particle sizes in
the range specified fur IM-11 reacted erratically
w’ith either a narrow range coarse or a fine barium
nitrate powder. Specification grade alloy reacted
best with barium nitrate which consisted of both
fine and eoarse particle sizes. The cooling dura-
tions of the incendiary burst for the few mixtures
which could be ignited increased as the particle
size of the barium nitrate was increased, but these
changes were relatively small.
Some of the alkali metal and alkaline earth
nitrates have been more widely employed than
ether types of oxidizers because they are available
at low cost, contain large quantities of available
oxygen, are safe, and can be handled easily.
5-17
АМСР 706-185
2600
2500
2400
2300
с
„ 2200
2 100
Э 2000
< 1900
ш 1800
О- 1700
Ш 1600
I- 1500
1400
1300
1200
250 300
TIME, MILLISECONDS
Figure 5-5. Time-Temperature Histories for IM-П, IM-23 and IM-103
Barium nitrate has been incorporated in over 200
incendiary mixtures, including the widely used
IM-11 filler, and has been utilized in proportions
ranging from one percent to 65 percent of the
total mix. This oxidizer is stable to approximately
600°C, has a high critical humidity, is easily
handled, and is available at moderate cost. Some
compositions in which barium nitrate is used as
the primary oxidizer are improved, from the stand-
point of incendiary functioning, by the addition
of a small quantity of a more reactive oxidizer
such as ammonium nitrate or potassium per-
chlorate. Ammonium nitrate has been used in
several incendiary mixtures, as an oxidizer, how-
ever, it has a relatively low decomposition tempera-
ture and tends to sensitize incendiary mixtures
in which it is used. Other nitrates are potentially
good oxidizers, but are not widely used because of
some undesirable characteristic, such as being rela-
tively hygroscopic or uneconomical.
The alkali metal perchlorates are the second
most widely used group of oxidizers for incendiary
mixtures.2 Potassium perchlorate has been used in
many incendiary fillers in proportions varying
from 2.5 percent to 75 percent of the total mixture.
Potassium perchlorate has essentially the same
total and available oxygen content as barium ni-
trate but exhibits a lower decomposition tempera-
ture. Mixtures containing potassium perchlorate
tend to be more sensitive and to burn faster than
mixtures whieh contain only barium nitrate as the
oxidizer. Ammonium perchlorate has also been
used as an oxidizer. This material is considered
to be an explosive since the hydrogen contained
in the compound can be oxidized rapidly as the
decomposition of ammonium perchlorate takes
place. This oxidizer-explosive has been used ex-
tensively in the MGX series of metalized ex-
plosives and probably contributes to the explosive
energy of these compositions, as well as providing
oxygen for the burning of the metallic fuel which
provides the major incendiary effect of MOX-
loaded ammunition. Ammonium perchlorate is a
rather sensitive oxidizer and, therefore, is some-
what hazardous to handle. Other perchlorates have
been used: but, in general, they are hygroscopic
and, therefore, are difficult to handle in production
loading equipment.
Some peroxides and less stable oxides can be
used as oxidizers in incendiary mixtures. Lead
dioxide is probably the most important member
of this group, and it has been used in several
incendiary fillers. It tends to sensitize mixtures
in whieh it is used, although by itself it is safe
5-18
АМСР 706-185
2SOO
2400
• 2200
Ld
(K
50% Ground Alloy -100*200
2000 -
50% Atomlxod Alloy
-JOO *200’ 93,3%
-200*325’ 6 7%
100
100
50
50% Ground Alloy
(Slondord)
‘50% Ground Alloy
-200* 325
or
Ш
2
Ld
i BOO -50% Ground
Alloy ' 325
1600
1400
I200l
0
200
TIME , MILLISECONDS
Figure 5-6. Cooling Curves for Mixtures Containing
Various Particle Size» and Shapes of Magnesium Alumi-
num 50/50 Alloy
and easy to handle. Less oxygen is available from
lead dioxide than from many of the nitrate and
perchlorate oxidizers. Its high density has made
lead dioxide useful for applications where an in-
crease in bullet weight is desirable.
A few additional oxidizers that have been eval-
uated in incendiary mixtures are worthy of men-
tion. These include potassium chlorate, which is
a relatively good oxidizer except for its sensitivity
and incompatibility with certain fuels, notably red
phosphorus; strontium chromate, potassium di-
ehromate, and potassium permanganate have also
been used. None of these has been found to be
fully satisfactory as oxidizers for incendiary mix
applications.
One of the most intriguing applications of
oxidizing materials to the destruction or damaging
of aircraft structures is the direct reaction of an
oxodizing agent with the fuel contained in the
aircraft. The idea is appealing because of the
potential chemical energy release since only oxygen
or an oxidizing agent is placed in the projectile
and no space is required for fuel. Many rather
difficult practical problems are involved in adapt-
ing this principle to realistic target conditions
using standard projettile components and fuzing
mechanisms. Some <>f the oxidizing chemicals
which might be useful :n this connection inelude
(F.-„ (’IF;,. BrFs, 11CKL, OF.. O.F... O:tF,., N(\,F,
('KLF, and NF;i.
5-4.1.3.3 Binders, Lubricants, and Other
Incendiary Mixture Additives
The first metal-fuel incendiary compositions
used in small arms ammunition contained only the
metal-fuel and a suitable oxidizer. The mass pro-
duction of small arms incendiary ammunition dur-
ing World War II created problems concerning
pelleting of incendiary mixtures, sticking of com-
pression punches, lumping of mixtures during
handling, and failure of mixtures to flow properly
in the automatic loading equipment. These prob-
lems were met by adding binders, lubricants and
flow promoters to the then standard compositions.
The amount of additive present in the composi-
tions was small and did not impair the incendiary
functioning of the ammunition, and they were es-
sential to the successful mass production of in-
cendiary ammunition. Without these additives
it would have been impossible to achieve the high
level of ammunition quality that was maintained
during World War II. Since then, the require-
ments for mass produced ammunition have become
even more stringent.
The two most frequently used binders in small
arms incendiary mixtures are calcium resinate and
asphaltum. In incendiary filler compositions, cal-
cium resinate is used in amounts varying between
one and two percent, and asphaltum is used in
amounts varying between one and five percent. A
number of other binders have been tested in sev-
eral compositions from time to time. These include
Acrawax, dextrin, stareh, nitrocellulose, gum
arabie, polyvinyl alcohol, red gum, vistanex (a
rubber preparation), and AP-2 (a jellied gasoline
and aluminum mixture).
Graphite, in a range of particle sizes, has been
used successfully as a lubricant to prevent the
sticking of pelleting and compression punches dur-
ing the loading of incendiary ammunition. This
lubricant is normally added in amounts ranging
from 0.25 percent to 2.0 percent. Stearates of zinc
and aluminum have been employed in a number of
small arms incendiary compositions to prevent
lumps fro’!' forming in the mixtures and to im-
prove the fh.w characteristics during the automatic
loading processes. These ingredients are of some
assistance in forming pellets of the mix in addition
to their flow-inducing characteristics. Zinc stearate
5-19
АМСР 706-185
TABLE 5-7
TYPICAL SMALL ARMS INCENDIARY MIXTURES
IM-11
50% Maguesium-Aluminum Alloy (50/50)
50'/ Barium Nitrate
IM-21 A
48'/ Magnesiimi-Alnminum Alloy (50/50)
48%. Barium Nitrate
3% Calcium Resinate
1 % Asphaltum
4!)'/ Potassium Perchlorate
2% Calcium Resinate
IM-139
10% Magnesinm-Aluminum Alloy (50/50)
40% Red Phosphorus
47% Barium Nitrate
3% Aluminum Stearate
IM-142
IM-23
50% Maguesium-Aluminum Alloy (50/50)
50'/ Potassium Perchlorate
IM-28
50% Magnesinm-Aluminum Alloy (50/50)
40% Barium Nitrate
10% Potassium Perchlorate
IM-68
50% Magtiesinm-Ahiminum Alloy (50/50)
25% Ammonium Nitrate
24% Barium Nitrate
1 %' Zine Stearate
46% Maguesium-Aluminum Alloy (50/50)
48% Barium Nitrate
5% Asphaltum
1% Graphite
IM-214
50% Zirconium (60/80) (lot 6)
25% Magnesium-Alnminuin Alloy
25% Potassium Perchlorate (—250)
IM-241
50% Zirconium (20/65)
25% Magnesinm-Aluminum Alloy
25'/ Potassium Perchlorate (—250)
IM-69
50%, Magnesinm-Aluminum Alloy (50/50)
40% Barium Nitrate
10% Iron Oxide (Pe^Oj)
IM-112
45% Magnesinm-Aluminum Alloy (50/50)
5% Tungsten Powder
50% Barium Nitrate
IM-136
49% Magnesinm-Aluminum Alloy (50/50)
IM-385
49% Magnesium-Aluminum Alloy (50/50)
49% Ammonium Perchlorate
2'/ Calcium Resinate
MOX-2B (High Explosive Incendiary Pillers)
52% Aluminum Powder
35% Ammonium Perchlorate
6% RDN/Wax (97/3)
4% TNT (Coated on the Ammonium Perchlorate)
2% Calcium Stearaie
1% Graphite
in the amounts of l%-2% has been most widely
used for this purpose. Aluminum steurate has also
been employed for this purpose.
5-4.1.3.4 Typical Compositions
The compositions of 14 small arms incendiary
mixtures, considered to be typical, are given in
Tabb- 5-7.
5-4.1.4 Typical Small Arms Incendiary Bullets
Typical incendiary rounds are shown in Figures
5-7 through 5-10. Illustrated are a ealiber .50
incendiary bullet, Figure 5-7, and a caliber .50
armor-piercing incendiary. Figure 5-8. A 20 mm
ainior-piereing incendiary bullet is shown in Fig-
ure 5-9 and n 20 inm high explosive incendiary
projectile is shown in Figure 5-10.
АМСР 706-185
TOTAL WEIGHT: 512 GRAINS
Figure 5-7. Typical Caliber .50 Incendiary Bullet
5-4.2 INCENDIARIES FOR GROUND
APPLICATION
Ground incendiaries inelude that class of muni-
tions used for damage, mainly by combustion, to
ground targetsand are considerably larger than the
small arms incendiaries previously discussed. In-
cendiary bombs, for example, are more effective
against cities than high explosives, (‘specially when
antipersonnel features are included to delay fire
tighting operations. The delay in fire fighting opera-
tions allows the smaller fires to grow and unite to
form a conflagration which is almost iinjmssible to
control. In many cases, toxic effects resulting from
the use of incendiaries or flame wea|«»ns (high car-
bon monoxide content-low oxymm content) cause
many casualties. In some cases, the psychological
fear prevents effective fire fighting operations and
may result in the loss id’ equipment through aban-
donment.
Because progress in the development of incendi-
ary ami flame Weapons for use against ground tar-
gets has been made mainly during times of stress,
emphasis has been directed toward tin- development
of weapons which eiinld he rapidly put into the
hands of combat troops. Little, if any, effort was
directed toward studying those factors eoncerned
with the initiation of destructive fires in various
targets. As a consequence, less is known about
the factors which might increase the effectiveness
of incendiary munitions against ground targets
than is known about the effectiveness of incendi-
aries against aircraft targets.
5-4.2.1 Ignition and Combustion of Ground Targets
Incendiary and other flame-producing weapons,
like most weapons used against ground targets, are
a source of energy which, when absorbed by' the
target, will cause damage. The amount of energy
absorbed from file incendiary source by the target
is not usually sufficient to produce appreciable
damage but serves only to initiate combustion of
the ta/get in the oxygen id’ the air. Small fires
starte</ in this , mniier serve as ignition sources
for the remainder of the target material, resulting
in the spread of the tire Th, ignition process and
early growth of the fire are the critical stages in
the development of a damage-prodneitig tire.
To initiate burning of a target in air, three
5-21
AMCP 706-185
TOTAL WEIGHT: 662 GRAINS
Figure 5-8. Typical Caliber .50 Armor-Piercing Incendiary Bullet
essentials must be provided, namely: (1) a source of
heat to initiate the fire, (2) combustible material
which serves as kindling, and (3) the fuel. All
incendiary munitions, except those which are spon-
taneously combustible, must contain an initiator.
The major part of an incendiary filling serves as
the kindling and the target supplies the fuel. The
efficiency of an incendiary depends on the total
heat output and the rate of transfer of the energy
to the target so as to initiate a sequence of events
which will result in the burning of the target.
Solid materials, sueh as wood, must be heated to a
sufficiently high temperature in order to form the
gaseous intermediates to react with the oxygen of
the air. Liquid fuels, as discussed in detail in
Paragraph 5-4.2.2.2.1, also must be vaporized be-
fore combustion is initiated.
5-4.2.2 Incendiary Compositions
Most of the research on in< <ndiaries has been
concerned with quantity and ty .e of combustible
used as an incendiary filler. Ineendiaiy fillers can
be basically classified into three categories: metal-
based incendiaries, liquid fuel-based incendiaries,
and a combination of these two. Fillings can also
be classified into those which owe their incendiary
effect to a self-supporting exothermic reaction and
those which depend on atmospheric oxygen for
their combustion.
5-4.2.2.1 Metal-Based Ground Incendiaries
Incendiaries containing metallic components are
of two types: those which utilize the oxygen of the
air in their combustion, and those in which ал
oxidizing agent furnishes the oxygen.
Magnesiuin-aluminum alloy used both as the
case and in the composition of a four-pound in-
cendiary bomb is an effective incendiary and was
widely used in World War II in raids against
German and Japanese cities. Reaction with oxygen
of the air produces more heat with an incendiary
metal than with solid oxidizing compounds. The
use of these compounds, therefore, must be justi-
fied by an increase in effectiveness due to the high-
er rate of heat release.
Thermite-type incendiary mixtures are com-
posed of approximate oxygen-balanced mixtures
of reducing and oxidizing agents. While there are
5-22
АМСР 706-185
ROTATING BAND, COPPER OR GILDING METAL
BASE MIXTURE
IM-21
TOTAL WEIGHT: 1700 GRAINS
Figure 5-9. Typical 20 mm Armor-Piercing Incendiary Bullet
a large number of possible combinations which
contain one or more reducing agents with one or
more oxidizing agents; aluminum (Table 5-1) and,
to a lesser extent, magnesium (Table 5-8) have
been the only reducing agents used in thermite-
type incendiary mixtures.
Military thermite for incendiary purposes is
composed of *2.75 parts of iron oxide scale and one
part of granular aluminum.20 The reaction:
8A1 + 3Fe3O4 -+ 4A12()3 + 9Fe 4- AH
gives the stoichiometrical ratio of one part of alu-
minum to 3.2 parts of iron oxide, Fe3O4. Ferric
oxide, Fe2<)3, reacts as follows:
2AI + Fe2O3 -+ AI2O3 + 2Fe -f- AH
and gives the stoichiometrical ratio of one part of
aluminum to 2.96 parts of ferric oxide. Ferrous
oxide, Fed, reacts as follows:
2A1 4- 3FeO -+ A12O3 + 3Fe + AH
and gives the stoichiometrical ratio of one part of
aluminum to four parts of ferrous oxide. Since
iron oxide scale (hammer scale) is a mixture of
ferrous and ferric oxide in various proportions, the
stoichiometric amount of aluminum required to
react with the available oxygen present will also
vary.
The ferrous oxide, FeO, content of the hammer
scale has little effect on either the burning time or
the penetration of the molten iron produced by the
thermite reaction. A lower ferrous oxide content
produces a considerably better flame and better
propagation of burning; however, for values below
22 percent ferrous oxide, the improvement is slight.
Thinner flake scales, such nc pipe scale and rod
scale, have been found to be more satisfactory than
Coarser scales; however, the use of a slight excess
5-23
AMCP 706-185
(IM-II)
(IM-142)
TOTAL WEIGHT- 1600 GRAINS (APPROX.)
Figure 5-10. Typical 20mm High Explosive Incendiary Projectile
of aluminum minimizes the effect of particle shape
of the hammer scale.
The use of low-purity aluminum (92 5 per-
cent) requires a higher ratio of aluminum to ham-
mer scale (1 to 2.7-2.8) to obtain optimum burning
characteristics. The use of fine-mesh granular
aluminum results in decreased burning times ap-
proaching a minimum limit with decrease in par-
ticle size. If the aluminum is too eoarse, poor
propagation, poor flame, and a longer burning time
result.
During World War 1, binders such as sodium
silicate, sulfur or celluloid were added in order to
reduce segregation of the thermite after loading;
however, these techniques were only partially suc-
cessful. Thermite has not been used since World
War 1 for incendiary applications. While the heat
released by a thermite mixture is sufficient to heat
the products of reaction to around 3000°C, the
incendiary action is confined to a relatively small
area. In order to improve the incendiary effective-
ness, several other incendiary compositions, in-
cluding several modified thermite compositions,
have been tried without appreciable success. The
compositions of some of the incendiary mixtures
tried are given in Table 5-9.
5-4.2.2.2 l iquid Fuel-Based Incendiaries
Liquid fuel incendiaries depend entirely upon
the oxygen of the air for their combustion. The
organic substance with the highest heat of com-
bustion on a volume basis is anthracene with 11,900
calories per milliliter. A wide variety of natUiJ
oils and waxes fall in the range of 8,500 to 9,200
calories per milliliter. For hydrocarbons, there is
a definite relationship between the heats of combus-
tion and the hydrogen-carbon ratio as shown in
Table 5-10. The order of heat on a unit-volume
basis is the inverse of th? order of the hydrogen-
carbon ratios, while the position is reversed on a
unit-weight basis. While the heat evolution per
unit-volume of n-octane is comparatively low, its
heat evolution per unit-weight is very high (11,-
500 calories per gram), being exceeded only by
boron and beryllium on this basis.
5-24
АМСР 706-185
TABLE 5-8
НЕлТ OF REACTION OF THERMITE-TYPE
MIXTURES CONTAINING MAGNESIUM
Mixture Heat of reaction,
cal/g
Mg 4- Sb2S3 ..................... 507
5Mg 4- Ba(NO3)2 ............... 1,636
4Mg + BaSO4 ................... 1,046
4Mg + CaSO4 ................... 1,529
3Mg + Fe2O3.................... 1,030
4Mg 4- Fe3O.,.................... 956
2Mg + FeSo....................... 764
Mg + PbO ........................ 378
2Mg 4- PbO2 ..................... 789
4Mg 4- Pb3O4..................... 736
5Mg + PbSO.i .................. 1,054
4Mg -I- MgSO4.................. 1,661
2Mg 4- MnO:!................... 1,248
5Mg + 2KNO3...................... 793
4Mg 4- KC1O4 .................. 2,442
9Mg -p K2S2O8.................. 1,870
4Mg 4- K2SO4 .................. 1,916
4Mg + Na2SO4 .................. 1,060
5-4.2.2.2.1 Liquid Incendiaries
Liquid incendiaries such as petroleum oils,
carbon disulfide, wood-distillation products, and
other flammable liquids, wem tested during World
War I. These materials all had the drawback of
excessive dispersion ; to overcome this, the liquids
were absorbed in some material such as cotton
waste, but this method was only fairly satisfactory.
During World War 11 this idea was revived and,
based on development work, 14 percent cotton
waste saturated with 86 percent of a 50/50 mixture
of gasoline and fuel oil was tried as a possible fill-
ing for incendiary bombs, but was discontinued as
more effective fillers Keame available.
5-4.2.2.2.2 Solidified Liquid Incendiaries
Because of the high degree of dispersion and
consequent flash burning of liquid incendiaries,
many substances have* been proposed for solidify-
ing liquid incendiaries. 'These include;-’1
a. Fatty acid derivatives
(1) Aluminum, sodium, zine, and ammo-
nium salts
(2) Lead salts of hydroxy acids
(3) Sulfonated products
(4) Amides
(5) Fatty acids per se
(6) Natural waxes
(a) Nitrated
(b) Sulfonated
(c) Per sc.
(7) Anilides
b. Pclyhydroxy derivatives
(1) Glycol compounds: Esters of fatty acids
(2) Ethanolamine compounds
(a) Esters of fatty acids
(b) Compounds of mono-, di-, and tri-
ethanolamine
(3) Glycerol compounds
TABLE 5-9
MODIFIED THERMITE COMPOSITIONS
Constituents Composition, Percent
Therni-8 Therm 8-2 Therm 6i-c Barytes Thermite Calcium Sulfate Thermite
Iron Oxide Seale 61 55.2 44 59.2 —
Aluminum 22.8 25 25 25.3 40.9
Barium Nitrate 15 19.5 29 — —
Sulfur 0.90 — 2 — 1.0
Castor Oil 0.30 0.30 — — 0.3
Barium Sulfate — — — 15.3
Calcium Sulfate — — — — 57.8
5-25
АМСР 706-185
TABLE 5-10
HEATS OF COMBUSTION AND HYDROGEN-CAFBON
RATIOS OF SELECTED FUELS
Hydrocarbon Hydrogen- Carbon Ratio Calories per ml Calories per g Density, g/u
Anthracene O.T> 11,900 9,500 1.25
Naphthalene 0.80 11,000 9,600 1.15
Toluene 1.14 8,800 10,200 0.866
Methyleyelohexane 2.00 8,600 11,100 0.769
u-Octane 2.25 8,100 11,500 0.706
(a) Saponified vegetable oil mixes
(b) Nitrated vegetable oils
(e) Vegetable oils per se
(4) Polysaccharide compounds
(a) Lactose anhydride
(b) Dextrins
(<•) Pectins
(5) Cellulose esters
(я) Ethyl cellulose (7 to 10 percent)
(b) Pulp
c. Resinous derivatives
(1) Natural
(a) Alkali-treated resin
(b) Shellac
(e) Damar
(d) East India fossil
(e) African fossil
(f) New Zealand fossil
(2) Synthetic: Saponified polyaerylates
d. Hydrocarbon derivatives
(1) Paraffin
(2) Synthetic rubber
(3) Natural rubber
(4) Salts of sulfonated petroleum fractions
(5) Salts of naphthenic aeid
e. Inorganic derivatives
(1) Organo-silicon compounds; Esters
(2) Bentonite
(3) Oil shale
Of these, only a few were ever found practical for
use in thickening incendiary liquids. The most suc-
cessful substances were :
a. Rubber (natural and synthetic)
b. Aluminum salts of mixed fatty acids and
naphthenic acid
c. Polyacrylates
5-4.2.2.2.2.1 Rubber Thickeners
The addition of thickners—e.g., smoked rub-
ber, crepe rubber, and latex—to gasoline produces
an incendiary filling resembling stieky rubber ce-
ment. Fillings of this type are reasonably satis-
factory ; the material sticks to the target and
burns slowly enough to allow an effective transfer
of heat to the target. During World War II, how-
ever, rubber was in critically short supply and
other thickeners had to be developed. Satisfactory
thickeners can also be made with some synthetic
rubbers.
5-4.2.2.2.2.2 Napalm Thickeners
The napalm thickener finally adopted consisted
of a granular base aluminum soap of naphthenic,
oleic, and coconut fatty acids. The sodium soap
used for the precipitation of the aluminum soap
contained 0.10 to 0.15 percent alpha-naphthol. The
recommended formula of the organic acids used in
making the napalm thickener was:
Parts by weight
Coconut fatty acids 50
Naphthenic acid 25
Oleic aeid 25
The aluminum content of the finished thickener
5-26
AMCP 706-185
TABLE 5-11
COMPOSITION OF IM-TYPE INCENDIARY GELS
Code IM Type 1 Ш Type 2 Ш Type 3 F-1416 F-1429 F-1431 F-1457
Constituent Composition, Percent
Isobutyl methacrylate
polymer AE (IM) 5.0 5.0 2.0 3.0 3.0 3.0 3.0
Stearic acid 3.0 — — 1.0 4.0 3.0 4.5
(Fatty acids) — 2.5 3.0 — — — —
Naphthenic acid — 2.5 3.0 3.0 — 1.0 0.5
Calcium oxide 2.0 — — 3.1 4.0 3.5
Caustic soda (40% solution) — 3.0 4.5 — — — —•
Ammonium hydroxide (27% solution) — — — — — — 2.3
Gasoline 88.75 87.0 87.5 87.6 86.5 87.3 89.3
Water 1.25 — — 2.3 2.5 2.2 —
ranges from 5.4 to 5.8 percent and the moisture
content from 0.4 to 0.8 percent. Varying the com-
position of napalm from the standard to 2 :1:1 ratio
of coconut to oleic to naphthenic acid indicated that
the viscosity of the gel increased primarily with
increased oleic acids and, to a lesser extent, with
increased coconut acid above normal composition.
The acid number of the coconut acid was found im-
portant. Iron was an undesirable impurity when
found in the alum but not in the acid. Impurities in
napalm thickener which may cause partial or com-
plete breakdown of gels formed with gasoline or
oxidation of the thickener, include excess water,
lime, caustic soda; soaps of sodium, copper, lead,
iron, manganese, and cobalt; powdered or sheet zinc
and lead; lead nitrate; rust preventatives contain-
ing amines, alcohols, and all acids. Tetraethyl lead,
on the other hand, has no injurious effects.
The fundamental reactions may be expressed
as follows (HR denotes the mixture of fatty and
naphthenic acid) :
The soaps may hydrolyze:
A1(OH)R2 + H2O -> A1(OH)2R 4- HR
A1(OH)..R + H2O-* A1(OH)3 4- HR
6NaOH + 4HR + Al2(SO4)3-> 2A1(OH) R2 + 3Na2SO4 + 4H2O
6NaOH + 21IR.4- A12(SO4)3-* 2A1(OII)2R + 3Na2SO4 + 2H2O
Because of hydrolysis, A1R3 does not form, and
fatty acid in excess of that required remains as
sueh ;
6NaOH 4- 6IIR 4- Амвона-» |2A1(OI1)R2 4- 2HRJ 4- 3Na2SO4 4- 4H2O
Three processes have been used successfully for
the manufacture of napalm. All are based on the
above equations, but the mechanical details for
combining the materials differ.
Napalm, while a satisfactory thickener, is sus-
ceptible to oxidation by the atmosphere and is
hygroscopic, resulting in a thickened gasoline with
poor characteristics.
5-4.2.2.2.2.3 Methacrylate Thickeners
Satisfactory thickened gasoline could be made
when 15-20 percent isobutyl methacrylate polymer
(IM) was added. Some satisfactory IM gels are
summarized in Table 5-11.
Low temperature stability is favored by a low
polymer content, the use of polymer of low meth-
5-27
АМСР 706-185
TABLE 5-12
COMPOSITION OF PT INCENDIARY MIXTURES
Code. PT-1 PT-2 PT-3
Constituent Composition, Percent
Goop 49.0 30.0 —
Isobutyl methacrylate
polymer AE 3.0 — —
Magnesium (coarse) 10.0 10.0 30.0
(50/50 Mg-Al alloy) 10.0
Sodium Nitrate 5.0 8.0 6.5
Gasoline 30.0 44.0 37.5
Petroleum Oil Extract 3.0 — —
(Bright stock) 10.0
GR-S (Buna-S
synthetic rubber) — 8.0 6.0
Sulfur monochloride (S2C12) — 0.2 (add) 0.2 (add)
acrylic aeid content, a high soap content, a high
concentration of gelling agent, a low water con-
tent, and the use of gasoline which has a low
aniline point. With a reasonably stable basic
formula, the most important factors appear to be
the nature of the gasoline and the strength and con-
centration of the gelling agent. High temperature
stability is favored by a high polymer content, a
high stearic acid content, and the use of con-
centrated solutions of the gelling agent, i.e , a low
water content. The presence of oxygenated solvents
destroys high temperature stability.
In order to increase the effectiveness of the in-
cendiary filling in starting fires in targets more
difficult to ignite, a complex filling was developed
having as its main constituent “goop”, a mixture
of magnesium particles and asphalt. To this was
added gasoline, thickened with IM oxidizing agents
and magnesium scraps. PT-1 composition, and the
substitutes PT-2 and PT-3, used synthetic rubber
instead of IM and an aluminum-magnesium alloy
in place of “goop”. (See Table 5-12.)
5-4.2.2.3 Other Incendiaries
Phosphorus and its compounds have been used
as an incendiary against personnel and readily-
ignitible materials. Burning phosphorus produces
serious skin burns and tends to demoralize attacked
troops. Because white phosphorus has a low com-
bustion temperature, it is relatively ineffective
against any but the most easily ignitible targets.
The alkali metals, especially sodium, have been
used as incendiaries but the results have not been
satisfactory.
5-4.2.3 Typical Incendiary Devices
The principal military characteristic of an in-
cendiary device is its ability to initiate combustion
of material with which it comes in contact, and to
provide the energy to maintain the combustion
process and assist in enlarging the area over which
combustion takes place. This characteristic is
called fire raising power. Other military character-
istics covering tactical use, provision of fire-fight-
ing deterrents, and design details are also speci-
fied.
The four-pound magnesium alloy bomb, shown
in Figure 5-11, was used during World War II in
tremendous quantities. Its hexagonal shape adapted
it to assembly i clusters for shipping and loading
on planes. Alter dropping from the planes the
bombs were separated from the clusters and widely
dispersed in random manner. The explosive charge
in the base was exploded by the heat, providing a
deterrent to fighting the fire. Only a portion of
5-28
АМСР 706-185
/ the bombs had the high explosive charge; the others
were constructed as shown in Figure 5-12.
A “fire bomb’’ using napalm-thickened gaso-
line as the incendiary filling is illustrated in Figure
5-13. An incendiary grenade, suitable either for
combat use or for destruction of materiel, is
illustrated in Figure 5-14. It is loaded with a
thermate, and is provided with an igniting charge,
specified as first fire mixture.
5-5 DELAY COMPOSITIONS AND HEAT
POWDERS
Gasless pyrotechnic mixtures are used for pro-
ducing a controlled amount of heat and for time
delays in a number of military applications. These
compositions, whieh arc physical mixtures of cer-
tain metals with one or more powdered oxidizing
agents, react at a predetermined rate when ignited
by the application of heat or flame. Their com-
bustion is characterized by high reaction tempera-
tures and the formation of mainly solid products.
Both the burning rate and calorific output can be
varied over fairly wide ranges by controlling the
^.properties and proportions of the ingredients.
‘Since little gas is produced by the combustion of
these mixtures, atmospheric oxygen is not required
for combustion, and the reaction rate is not greatly
influenced by pressure; “gasless” compositions
are particularly valuable for use in armament,
e.g., in short delay bomb fuzes.
5-5.1 PYROTECHNIC DELAYS
Some ordnance items are more effective if
functioning is delayed for an interval of ume after
the initiating stimulus. While a variety of me-
chanical and electrical devices29 have been em-
ployed for this purpose, a time delay can be
obtained by incorporating a pyrotechnic delay
element into an explosive train. The time delay,
in this ease, depends on the length and rate of
burning of the delay composition. Time delays
can also be obtained by controlling the rate of heat
flow through a thermal barrier,30 or by the rupture
of a barrier by the build-up of gas pressure.31
5-5.1.1 Delay Elements
A delay element is a self-eontained pyrotechnic
9
Figure 5-11. Four-Pound Magnesium Alloy Incendiary
Bomb
device consisting of an initiator, delay column,
and an output terminal charge or relay; all as-
sembled into a specially designed inert housing.
In some designs, one or mere of these components
may be omitted. In some cases, depending on the
application and delay composition, the delay ele-
ment may also include baffles, a housing, and pro-
vision for an internal free volume. Based on their
construction, pyrotechnic delays can be subdivided
into two general types, obturated or vented.29
5-29
AMCP 706*185
Figure 5-12. Four-Pound Thermite Incendiary Bomb
5-5.1.1.1 Obturated Delay Elements
An obturated delay element, as shown in Figure
5-15, is constructed to contain all of the gases pro-
duced by the functioning of the initiator and delay
composition before the functioning of the terminal
charge. Delays in which the gases produced are
internally vented into a closed chamber in the ex-
plosive device are considered to be obturated.
Because they are sealed, obturated delays are not
influenced by the effects of the ambient pressure
or humidity. The combustion products are con-
tained which prevents possible harm to other com-
porcnts of the device. Short time delays are o,ten
obturated as obturation tends to increase the aver-
age burning rate of the delay composition.
5-5.1.1.2 Vented Delay Elements5®-82
Vented delay elements have openings through
which the gases produced by the functioning may
escape. Vented delays are used when large quan-
tities of gas are produced by the burning of the
delay powder and may even be necessary for ‘ ‘ gas-
less” mixtures when long delay times are required
in order to eliminate pressure buildup within the
delay element. Venting exposes the burning delay
composition to ambient pressure. As a conse-
quence, the burning rate cf the delay mixture is sen-
sitive to changes in altitude. In addition, these
vents require sealing up to the time cf functioning
in order to protect the delay composition from
humidity. Two methods for sealing vented delays
are illustrated in Figure 5-16.
Another vented delay is the time ring which
consists, as shown in Figure 5-17, of a column of
fuze powder which is pressed into the fuze cavity.
Because of its construction, the ring delay occu-
pies a large part of the total fuze volume. With a
ring delay the delay time can be set to any desired
value within its time range by rotating a calibrated
ring which varies the length of the delay train that
must be burned before the terminal charge func-
tions.
5-5.1.2 Delay Compositions
The delay compositions, being a critical part
of the delay element, should ideally have certain
characteristics whieh may be summarized as fol-
lows:
a. The ingredients should be stable and non-
hygroscopic; should have the highest purity con-
sistent with requirements; should be readily avail-
able and inexpensive; and should be compatible
with each other.
b. The compositions should be capable of being
blended, loaded, and assembled into an item with
minimum risk from impact, friction, moisture, heat,
and electrical discharge.
c. They should be readily ignitible, and should
change little in performance characteristics with
small changes in percentages of ingredients. Their
burning rates should be reproducible within each
batch and from batch to batch with a minimum
of variation.
5-30
АМСР 706-185
back of the report by a different
reproduction method to provide
better detail.
Figure 5-13. Typical Napalm Bomb
d. They should be compatible with their con-
tainer as well as with other contacting composi-
tions. Performance characteristics should not
change appreciably with long tern; storage.
e. They should be relatively insensitive to
changes in pressure and temperature.
f. They should be capable of withstanding the
vibration and shock of transportation, setback, ro-
tation, and impact, and should be resistant to
physical abuse inherent in the loading, amd firing
of ammunition.
5-5.1.2.1 Black Powder Delays
Black powder has been long and widely used
as a delay material in spite of the fact that it does
not meet many of the ideal characteristics for a
delay composition. This popularity may be attrib-
uted largely to its good dry surveillance character-
istics, its ease of ignition, its wide availability in
reproducible quality and granulation, its ease of
loading, and its versatility from the standpoint of
delay times obtainable.
As already indicated, black powder produces
gases on burning, and the burning rate is affected
by pressure. Hence, the disposition of the gases is
a primary consideration in design; delay elements
using black powder are generally vented. The
burning rate of black powder is affected by the ro-
tational speed of the projectile and by the ambient
pressure. A major shortcoming of blaek powder
has been and still is its marked hygroscopicity.
As has been indicated earlier, because of these un-
desirables, gasless delay compositions were de-
veloped.
5-31
АМСР 706-185
Figure 5-14. Typical Incendiary Grenade
5-5.1.2.2 Typical Gasless Compositions
The gasless pyrotechnic mixtures which have
been reasonably satisfactory for delays are given
in Table 5-13. Different burning rates ean be ob-
tained by selecting a specific composition or by
varying the proportions of ingredients in a com-
position.
The burning rates obtained with these com-
positions are given in Table 5-14. Under controlled
laboratory conditions, the coefficient of variation
of most of the compositions listed is three percent
or less. Lot-to-lot variability may be compensated
by adjusting the length of the delay column for
eaeh new lot of delay сопцюкйюп or by adding
appropriate ingredients and remixing to speed up
or slow down the mixture. Variation may be con-
trolled by use of standardized raw materials and
preparation procedures.
Figure 5-15. Obturated Delay Element
5-5.1.3 Factors Affecting Performance88
The propagative burning of a pressed column
of a gasless delay composition is a combustion re-
action in which the fuel and oxidizer react to give
essentially solid products. The gases formed con-
sist mainly of hydrogen, water, nitrogen, carbon
monoxide, carbon dioxide, and traces of organic
materials.37 These gaseous products are produced
as a result of the presence of impurities or for
other reasons not directly related to the primary
reaction. The observed velocities of the reaction
have been justified; however, quantitative agree-
ment was purely on the basis of thermal flow.88,9’
Questions have been raised concerning tbe de-
tails of burning of gasless delay compositions.
For some compositions, there is evidence that the
formation of a gaseous phase plays an important
part in the overall reaction mechanism while con-
densed phase reactions are important in the pre-
5-32
АМСР 706-185
METHOD А
METHOD В
Figure 5-16. Sealing of Vented Delay Element
ignition reactions.31'-40-41-42-43 DTA and TGA
studies of the ingredients in barium ehromate-
boron delay compositions do not, however, indicate
the formation of a gaseous phase before ignition
of the composition,44 and that a gaseous phase may
not be important, at least in this particular reac-
tion.
In some eases the effectiveness of an explosive
train depends greatly on the accuracy of the time
delay produced by the burning of a delay column.
While it is possible under controlled laboratory
conditions to obtain coefficients of variation (Para-
graph 5-5.1.2.21, less than three percent for many
delay mixtures, the effect of ambient conditions
and manufacturing variation in many eases is
somewhat less than desirable. Factors which may
influence the accuracy of a gasless pyrotechnic
include :
a. Composition and Quantity of Charge
b. External Pressure
e. External Temperature
d. Terminal Charge
e. Particle Size
f. Ignition
g. Column Diameter
h. Loading Pressure
i. Housing Material
,j. Acceleration
к Storage
1. Processing
5-5.1.3.1 Composition
There are a large number of exothermal reac-
tions between inorganic solids which yield little or
no gaseous products. However, most of the reac-
tions are not satisfactory for one or more of the
following reasons:
a. Erratic burning rates
b. Large column diameter required for reliable
propagation
e. Large temperature coefficient of burning rate
d. Failure at low temperatures
e. Hygroscopicity
f. Rapid deterioration
g. Unavailability of reproducible supply of raw
materials
h. Large pressure coefficient of burning rate
i. Failure at low pressure
Reactions whieh were studied are summarized
in Table 5-15.24 Under the standardized conditions
for these tests, it was found that for each oxidiz-
ing agent used, very fast burning times were ob-
tained with magnesium, aluminum, zirconium, and
titanium. Slower burning times were obtained with
silicon, manganese, and chromium; while still slow-
er ones occurred with iron, tungsten, and others.
Metals whieh gave fas! burning times with silver
oxide, silver chromate, barium peroxide, and lead
chromate gave slower burning times with cuprous
oxide, barium chromate, and iron oxide.
The variation in burning rate for the barium
5-33
AMCP 706-185
TABLE 5-13
GASLESS DELAY COMPOSITIONS IN CURRENT USE33 34 38 80 ei
Fuel, % Oxidants, % Inert, %
Manganese Barium Chromate Lead Chromate None
30 to 45 0 to 40 26 to 55
Boron Barium Chromate Chromic Oxide None
4 to 11 89 to 96 —
13 to 15 40 to 44 41 to 46
Niekel-Zireonin Barium Chromate Potassium Perehlorate None
Alloy 26 60 14
Nickel-Zirconium Barium Chromate Potassium Perchlorate None
Mix
5/31 22 42
5/17 70 8
Tungsten Barium Chromate Potassium Perehlorate Diatomaceous earth
27 to 39 59 to 46 9.6 5 to 12
39 to 87 46 to 5 4.8 3 to 10
20 to 50 70 to 40 10
Molybdenum Barium Chromate Potassium Perehlorate
20 to 30 70 to 60 10
Silicon Red Lead Diatomaceous earth
20 80 Max 8 parts
by weight
Zirconium Lead Dioxide
28 72
chromate-boron system as the percentage of boron
in the composition was increased to 50 percent is
summarized in Table 5-16.33 As indicated by the
data presented in this table, a sharp drop in burn-
ing time is obtained initially as the percentage of
boron is increased. At approximately 10 percent
boron, the burning rate levels off and remains near-
ly constant to approximately 25 percent boron,
when it begins to decrease quite rapidly. The
heat of reaction reaches a maximum at approxi-
mately 13 percent boron, which is a somewhat lower
percentage than that composition (19 percent 1
producing the maximum, burning rate. A plot of
total heat evolved against burning times, Figure
5-18,33 indicates that compositions with less than
11 percent boron burn slower than those contain-
ing more than 13 percent boron when the amount
of heat evolved is the same,
5-5.1.3.2 External Pressure
As shown in Figure 5-19 for a 95.4% barium
ehromate-4.6‘/< boron composition, an increase in
the external pressure resulted in a decrease in
burning times (an increase in burning rate). The
relationship is hyperbolic and can be represented
by an equation of the form:
t ар" (5-11)
5-34
АМСР 706'185
TABLE 5-14
BURNING RATES OF GASLESS DELAY COMPOSITIONS33 33 61 82
Composition Inverse Burning Rate, sec/in.
BaCrO4/B (amorphous) 0.5-3.5
95/5 1.5
90/10 0.6
BaCrO4/B (crystalline) 9-12.5
BaCr04/KC104/Zr-Ni (70-30) /Zr-Ni (30-70) 3-11
60/14/9(70-30)/17(30-70) 6
60/14/3(70-30)/23(30-70) 11
BaCrO4/PbCrO4/Mn 2.5-12.5
30/37/33 9,45
35/33/42 12.5
Red Lead/Si/Celite 4-11
80/20/3 to 7 added
Zr/Ni/BaCr04/KC104
5/31/42/22 6.5
5/17/70/8 17.5
BaOo/Se/Talc
84/16/0.5 added 2.3 (approx)
PbOo/Zr
28/72 < 0.5
BaCrO2/Cr2O3/B 4.5-8.5
44/41/15 4.5 (approx)
44/42/14 6.5 (approx)
BaCr04/KC104/W
40/10/50 12.5 (approx)
60/10/30 31 (approx)
32/5/58 1
41/5/49 10
58/10/27 40
where t is tlii‘ burning time in seconds, p is pres-
sure in pounds per square ineh, and a and a are
constants. Ti.e nnniei-ieid values of the constants
are i, 0.13 and a 2.52 for the 95.1 -1,6 barium
eh roll late-boron ennl posit inn.
No significant change as found, see Figure
5-19, in the burning times tor a 90/10 and 81/19
barium ehromate-boron coinpus.itinn for pressures
l‘>ss than atmospheric.
Results obtained with other delay mixtures also
indicated that the burning rate would increase
* 2 round» not ignited.
slightly with inerensitig pressure above atmospher-
ic. Results with mixtures which contained man-
ganese, cobalt and a nirkel-zirconiuni mixture as
the fuel indicated that a change in composition
of the atmosphere did not have a significant effect
on the burning rate.45
5-5,1.3.3 External Temperature
As shown in Figut-i 5-20, the burning times for
delay compositions were folllld to decrease with
increasing temperature. For 90/10 barium eliro
imite-boroii, a plot of burning rate against the
5-35
АМСР 706-185
TABLE 5-15
HEATS OF REACTION OF INORGANIC MIXTURES
CONSIDERED FOR DELAYS
Metal» St 1кг Oxide Sitter Chromate Barium Peroxide Lead Chromate Cuprou» Oxide Barium Chromate Iron -A//° Oxide -&Ha/n
-Д/Г/П -&H° -ДЯ/п -Д/Г/П —AH’ -ДИ7» -ДН’Л
MAGNESIUM 139.1 69.6(1) 688.5 68.9(1) 126.7 03.4(1) 660.7 56.1(1) 103.6 51.8(5) 292.9 Soo i cr>*ao 1 5s I 239.8 40.0
ALUMINUM 378.0 63.0 1869.0 62.3 340.8 56.8(1) 1485.6 49.5 271.5 45.3 253.6 200.5 33.4
ZIRCONIUM 244.1 61.0 1206.5 60.3 219.7 54.911) 950.9 47.5 173.1 43.3 483.5 40.3 377.3 31.4
TITANIUM 211.0 52.8 1041.0 52.1 186.2 46.6(1) 785.4 39.3(5) 140.0 35.0 384.2 32.0 278.0 23 2
SILCON 187.0 46.8 921 46.1(N) 164.8 41.2(1) 665.4 33.3 116.0 29.0(N) 312.2 26.0(12) 206.0 17.2(N)
MANGANESE 89.5 44.8 440.5 44.1 77.1 38.6(4) 312.7 31.3 54.0 27.0(10) 144.1 24.0(23) 91.0 15.2(N)
CHROMIUM 252 42.0(N) 1239 41.3(N) 214.8 35.8(5) 855.6 28.5 145.5 24.3 63.8 21,3 74.5 12.4
ZINC 76.5 38 3 374.5 37.5 63.9 32.0 247.7 24.8 41.0 20.5 104.6 17.4 52.0 8.7
TIN 124.1 31.0 606.5 30.3 99.3 24.8 350.9 17.5 53.1 13.3 123.5 10.3 17.3 1.4
IRON 177.5 29.6(8) 866.5 28.9(8) 140.3 23.4 483.1 16.1(11) 71.0 ll.S(N) 53.1 8.9(N) 0 0
CADMIUM 58.2 29.1 284 28.4 45.8 22.9 156.2 15.6 22.7 11.4 50.2 8.4 -2.9 -0.5
TUNGSTEN 174.7 29.1 852.5 z8.4 137.5 22.9 469.1 15.6 68.2 11.4 50.3 8.4
MOLYBDENUM 155.5 25.9 759 25.2 118.3 19.7 373.1 12.4(17) 49.0 8.2 31.1 5.2
NICKEL 50.5 25.3 250.0 25.0 39.0 19.5 122.2 12.2 15.9 8.0 29.8 5.0
COBALT 51.4 25.7 245.5 24.6 38.1 19.1 117.7 11.8 15.0 7.5 27.1 4.5
ANTIMONY 145 24.2 704.0 23.5(10) 107.8 18.0(6) 320.6 10.7 38.5 6.4 20.6 3.4
BISMUTH 116.1 19.4 544.0 18.1 78.9 13.2 176.1 5.9 9.6 1.6 -8.3 -1.4
COPPER 31.5 15.8 150.5 15.1 16.4 8.2 22.7 2.3 -29.9 -5.0
NON METALS PHOSPHORUS 195 39(1) 192.4 38.5(1) 487 3 48.8(1) 128.4 25.7(2) 213 21.3 552.8 18.4(6) 35.3 7.1(15)
SULFUR 142.1 23.7 082.5 22.8(4) 158.2 26.4(4) 101.2 16.9(9) 95.9 4.8 28.8 4.8 -15.1 -0.5
SELENIUM 67.9 11.3 311.5 10.4 86.6 14.4 31.3 5.2 -6.2 -0.3
— AH’ HEAT OF REACTION.
-ЛН’/п EQUIVALENT HEAT OF REACTION (HEAT OF REACTION PER ELECTRON CHARGE).
(N) NO REACTION OBSERVED.
(I) VERY FAST BURNING RATE.
() BURNING TIME, SECONDS
logarithm of the absolute temperature results in a
straight line. For the 95.4/4.6 compositions, this
is also true for most of the temperature range;
however, for some 95.4/4.6 compositions, there is
a departure from this type of relationship at the
lower temperatures. Over the narrower tempera-
ture range (—60°F to 160°F), the burning rate is
essentially a linear function of the login tempera-
ture.
5-5.1.3.4 Terminal Charge, Anticipatory Effect4®
The burning characteristics of pressed delay
compositions are different when loaded above a
tliermally-sensitive terminal charge. The overall
burning time and the reproducibility are both de-
creased under these conditions. This anticipatory
effect has been observed with a variety of thermal-
ly-sensitive terminal charges for both gaseous and
nongaseous delay compositions. The effect has also
been observed for typical end item delay' elements
having a lead styphnate-lead azide relay.
The extent of the reduction in burning time
that occurs with delay elements having tliermally-
sensitive terminal charges, compared with similarly
pressed delay columns without a terminal charge,
approaches a constant value as the length of the
delay column above the terminal charge increases.
The magnitude of this reduction in burning time
for several barium chromate-boron compositions
is a function of the burning rate of the composi-
tion. (See Table 5-17.) As shown in Table 5-18 the
reduction in burning rate is less for tbe more
rapid burning compositions. Obturation of the
delay column substantially increases the magni-
tude of the anticipatory effect. The anticipatory
effect is reduced by barriers, between the delay
column and the thermally-sensitive terminal
charge, which would reduce the flow of gases. The
importance of gas permeation in the burning of
pressed delay compositions is indicated.
5-5.1.3.5 Particle Size
The effect of particle size on the inverse burn-
ing rates of delay compositions follow a nearly
direct proportionality. In addition to increasing
the burning rate, reduction of the particle size
tends to reduce the effects of temperature and
pressure. This effect is shown to a marked degree
by tungsten delay compositions, as is shown in
Table 5-19. Although the percentage compositions
are not identical, they are close enough that little
difference in burning time would be observed if the
tungsten fuel had the same surface area. The
weight, average diameter, and the surface area
5-36
AMCP 706-185
TABLE 5-16
EFFECT OF PERCENT COMPOSITION ON BURNING TIME,
HEAT OF REACTION, AND IMPACT VALUES
OF THE BARIUM CHROMATE-BORON SYSTEM
%, Boron Charge Wt, mg No. Results Aug and Range Based on Avg Burning Time, sec Range, sec Range, sec/sec B.T. Heal vj Reaction Total Cal in Loaded Fuze Cal/sec Impact Test PA, inches
Cal/g Volume gas ml/g
з.о% 2130 5 7.56 0.469 0.620 Incomplete reaction 40+
3.5% 2150 4 3.54 0.070 0.020 278 5.0 597 169 40+
4.0% 2140 4 1.72 0.031 0.018 354 5.0 768 446 40+
4.5% 2125 5 1.44 0.040 0.028 400 4.0 850 590 39
5.0% 2130 5 1.09 0.035 0.032 420 8.0 895 821 40+
6.0% 2110 5 0.767 0.021 0.027 231 8.4 909 1186 37
7.0% 2000 4 0.653 0.010 0.015 453 6.4 906 1387 38
8.0% 2000 4 0.560 0.001 0.002 462 7.9 924 1650 28
9.0% 2000 4 0.539 0.002 0.004 474 7.5 948 1758 29
10.0% 1975 4 0.465 0.015 0.032 515 7.3 1017 2187 21
11.0% 1925 4 0.432 0.020 0.046 536 6.9 1032 2388 18
13.0% 1900 4 0.397 0.006 0.015 556 8.9 1056 2661 20
15.0% 1875 4 0.382 0.027 0.071 551 7.0 1033 2704 16
17.0% 1800 4 0.375 0.027 0.072 э43 11.6 977 2606 13
19.0% 1750 4 0.366 0.021 0.057 535 8.8 936 2558 16
21.0% 1685 4 0.375 0.007 0.019 526 8.6 886 2363 34
23.0% 1650 4 0.407 0.023 0.057 503 4.2 830 2703 40
25.0% 1625 4 0.433 0.025 0.058 497 10.2 808 1865 40+
30.0% 1611 4 0.574 0.025 0.044 473 10.4 762 1328 40+
35.0% 1500 4 0.965 0.115 0.119 446 12.7 669 693 40+
40.0% 1430 4 2 19 0.110 0.050 399 14.1 571 261 40+
45.0% 50.0% 1360 1290 3 2 5.25* 14.5* 0.210 1.000 0.040 0.069 364 15.0 Incompl 495 3te reactio 94 n 40+ 40+
*2 rouade not ignited
were determined on the micromerograph. Under
these experimental conditions, a fuel with about
twice the surface area will have a linear burning
time of about one-fifth of the former.
For the 1)0/10 barium chromate-boron composi-
tion, the use of boron of 1, 13.5, and 53 micron
average particle size resulted in an increase in the
inverse burning rate of 0.45, 0.61 and 9.53 seconds
per inch, respectively. Similar results were ob-
served for manganese delays.38
In addition to the average particle size, the
particle size distribution and blending of delay
mixtures is important if reproducible burning
rates are to be obtained.*7 For the barium cbro-
mate-boron composition, the-e apnears to be little
difference between delay mixtures produced by
wet and dry blending methods. Wet blending is
preferred for safety reasons.
5-5.1.3.6 Ignition Compositions
Some gasless delay compositions are difficult
to ign.te. It is the usual practice t< press a small
charge of an igniter composition on top of the
delay column, which is easy to ignite and is cap-
able, in minimum quantities, of igniting the delay
column. The complex interactions between initiat-
ing source and igniter and, in turn, igniter and
main charge are yet to be determined. For the
most part, igniters have been and still are selected
on an arbitrary basis. Compositions of some of
the ignition powders which have proved relatively
satisfactory are given in Table 5-20. These mix-
tures are also gasless
5-5.1.3.7 Column Diameter
Radial losses of heat can retard or extinguish
the reaction in a delay column. Such losses be-
come more serious as the column diameter, burn-
ing rate, and ambient temperature are reduced.
These effects combine to result in a failure diam-
eter associated with a given delay mix for a given
ambient condition. For manganese delay compo-
sitions at —-C5°F tin- failure diameter for a three-
sccond per inch composition is less than 0.109 inch;
5-37
АМСР 706-185
TABLE 5-17
EXTENT OF ANTICIPATORY EFFECT AS A FUNCTION OF
BURNING RATE OF VARIOUS BARIUM CHROMATE-BORON
Average Burning Time, msec
95/5 90/10 86/14
Delay composition alone 464 167 132
Delay composition above terminally pressed 10()-mg increment of SI-98 " 158 124 116
Burning time reduction, msec 306 IF "16"
SI-98 squibs were empolycd for initiation of columns. Composition loaded in M112 fuze
housings at 36,000 psi.
SI-98 Composition:
MoO<(—26%
KC1O4—21%
Zr—53%
Figure 5-78. Total Heat Evolved Versus Burning Time of
Binary Barium Chromate-Boron Compositions Loaded to a
Height of 0.79 Inch in Ml _ Fuze dousing at 36,000 psi
De I о у or Tram; Vented, Without Baffle.
Time: Selective, 1 to 21 Second».
Loading
UpfMf Ring— 3.105 Giomt
Lower Ring - 3 6^0 Groms.
A-7 Black pQvrdt’, Loaded m Platt m Single Increment at 60,000 pti.
Figure 5-17. Time Delay Ring or Train, Vented
that of a ten-second per inch mix is between 0.125
and 0.156 inch, while for a 12.5-second per inch
composition, the failure diameter is between 0.156
and (1.203 inch. As shown in Table 5-21, the effect
of column diameter was found to be significant for
all 95/5 barium chromate-boron delay systems and
for obturated 90/10 barium chromate-boron de-
lays.48
5-5.1.3.8 Loading Pressure
Burning rates of delay mixtures will decrease
as the consolidation pressure increases. The rather
small and systematic changes with loading pres-
sure for barium chromate-boron composition are
5-38
AMCP 706-185
TABLE 5-18
EXTENT OF ANTICIPATORY EFFECT AS A FUNCTION OF
COLUMN LENGTH 55/35/10 TUNGSTEN-BARIUM CHROMATE-
POTASSIUM CHROMATE COMPOSITION*
Average Burning Time*** msec Burning Time Length of Range, Percent Д Burning % Column Column msec Range Time By-passed By-passed, in.
One 1000-mg increment
Without terminal charge With terminal charge** 2348 1473 411 462 18 31 875 37 0.07
Two 1000-mg increments Without terminal charge With terminal charge 4291 3404 259 583 6 17 887 21 0.09
Three 1000-mg increments Without terminal charge With terminal charge 6082 5192 328 1042 5 20 890 15 0.09
Four 860-mg increments Without terminal charge With terminal charge 6914 6173 337 990 5 16 741 11 0.08
* SI-98 squibs were employed for initiation of columns. The composition? was leaded in
M112 fuze housings at 36,000 psi.
** SI-98 terminal charges were used.
*’• Average burning time values have been reduced by 6 msec in order to take into ac-
count the burning time of the terminal charge itself.
BURNING TIME, SECONDS
Figure 5-19. Burning Time uf М112 Fuze Versus External
Pressure
summarized in Table 5-22.40 These effects might
be used to compensate for the differences in burn-
ing rate from lot to lot. However, this methodhas
not been used due to the established practice of
loading delays at pressures between 30,000 and
40,000 psi in order to withstand the forces to
which it is subjected in use. Yielding of the delay
element while pressing the delay composition will
cause erratic delay times.
5-5.1.3.9 Housing Material
The body into which a delay composition is
loaded serves as a heat sink, as metals in general
are mucli better conductors of heat than delay
compositions. Delay columns close to their low-
temperature failure diameters tend to have larger
temperature coefficients as the surrounding wall
thickness is iucreascd. For materials well above
5-39
АМСР 706-185
TABLE 5-19
EFFECT OF SPECIFIC SURFACE ON BURNING
TIME OF TUNGSTEN DELAY COMPOSITIONS
Type of Tn ngstcn Composition MIO ND 34!)9
Fuel Characteristics Surface Area cni2/g 1377 709
Weight Average Diameter, microns 2.3 4.9
Delay Tungsten 40 38.0
Composition, % BaCrO4 51.8 52.0
KC1O4 4.8 4.8
Diatomaceous Earth 3.4 5.2
Burning Time, see/inch 4.17 21.5
TABLE 5-20
IGNITION POWDERS FOR GASLESS DELAY ELEMENTS
Fad, % Oxidants, % Inert, %
Zirconium Ferri? Oxide Diatomaceous Earth
65 25 10
Boron Barium Chrouiate
10 90
Zirconium Ferric Oxide
33 50
Titanium
17
Zirconium Ferric Oxide Diatomaceous Earth
51 39 10
Boron Lead Peroxide
30 70
5-40
TABLE 5-21
EFFECT OF FUZE HOUSING MATERIAL AND DIMENSIONS ON BURNING TIME
OF BARIUM CHROMATE-BORON COMPOSITIONS
Parameters Effect
1. Metal Housings
a. Aluminum, Brass and Stainless Steel 2. Internal Diameter, inch a. No effect on burning times over test temperatures, internal diameter, wall thickness and for either vented or obturated columns. b. No interaction between metal and composition.
a. 0.250 95/5 vented vs obturated a. Results for vented columns significantly different at 95% con- fidence level.
b. 0.375 95/5 vented vs obturated b. Results for obturated columns significantly different at 95% confidence level.
e. 0.250 90/10 vented vs obturated e. No significant difference for either column at this diameter.
d. 0.375 90/10 vented vs obturated 3. Temperature, °C d. Results for obturated column significantly different at 95% confidence level.
a. — 54, Room Temperature, and 76 4. Wall Thickness, inch (0.05, 0.15, 0.30, 0.50, 0.75, and 1.00) a. The effect of temperature was significantly different at the 95% confidence level for all metals, internal diameters, wall thickness and for vented and obturated columns.
a. 95/5 vented and obturated columns a. Results for different wall thickness were significantly different, although no apparent trend was observed.
b. 90/10 vented and obturated columns b. No significant differences or trends in results due to wail thick- ness for either type of column.
AMCP 706-185
5-42
AMCP 706-185
TABLE 5-22
EFFECT OF LOADING PRESSURE ON BARIUM CHROMATE-BORON COMPOSITIONS
95/5 BaCrO4-B
Loading Pressure (103 psi) 36 18 9 3.6 1.3 0.5
Mean BR, sec/ineh* 1.69 1.60 1.49 1.39 1.29 1.21
Mean BR, see/gram 0.648 0.655 0.645 0.642 0.646 0.693
% Coefficient of Variation 1.2 0.6 0.7 0.7 0.8 0.8
90/10 BaCrO4-B
Mean BR, sec/inch 0.670 0.653 0.619 0 586 0.558
Mean BR, sec/gram 0.272 0.276 0.280 0.287 0.297 2.309
% Coefficient of Variation 1.5 0.9 1.1 1.6 2.0 1.8
BB — burning rate.
AMCP 706-185
LOGloT, -К
Figure 5-20. Burning Time of M112 Fuze Containing 90%
Barium fhromate-10% Boron Composition Versus Log-
arithm of Absolute Temperature
their failure diameters, the effect of wall thick-
ness becomes less important.32 As shown in Table
5-21 for the 95/5 barium chromate-boron composi-
tion, the wall thickness had a significant effect for
both vented and obturated items; however, the
differences observed were small and had no ap-
parent trend. No significant difference due to
wall thickness was noted for the 90/10 barium
chromate-boron compositions.48
As also shown in Table 5-21, the material used
for the housing did not appreciably affect the
burning rate of barium chromate-boron composi-
tions.48
Delay compositions have been loaded and con-
solidated into lead tubing by a swaging technique.
The accuracy of delays prepared by the lead-tube
method depends on many factors associated with
the composition, application, ete. However, it
may be said that in some applications it is more
accurate and in others less accurate than the
conventional method of filling.49
5-5.1.3.10 Acceleration
Delay elements are often subjected to very high
accelerations while the delay composition is burn-
ing, as in skip bombing. If the structure of the
niaterial at or behind the reaction front is too
weak, the accelerations may cause the hot products
to lose contact with the unbnrned delay composi-
tion or a subsequent charge and extinguish the
reaction. Quantitative data regarding the resis-
tance of delay compositions to this type of failure
are not available. “Slag retention,” i.e., the
fraction of the weight of the original charge re-
maining in an open 'ended delay column after
functioning, has been used as a possible qualitative
indication of the resistance of a delay element
to acceleration forces.’ Slag retention for some
delay compositions is as follows: manganese,
> 95%; red lead, 90%-95%; tungsten, > 95%;
niekel-zirconium, 80%-90% ; boron, 59%-90%.34
Introduction of a binder will improve perfor-
mance under high acceleration conditions; how-
ever, binders tend to produce sufficiently large
amounts of gaseous products so that the system
could no longer be considered gaseless. Mechanical
support of the delay column at both ends tends
to reduce variation in burning times by minimizing
slag flow.
5-5.1.3.11 Storage
The effectiveness of an item of ammunition
may depend greatly on accuracy of the delay. Be-
cause it is necessary to store ammunition for a
long time, it is important to know the effect of
storage on the burning times of delay compositions.
In general, dry storage for relatively long periods
of time results in little change in burning time.
For example, barium chromate-boron composi-
tions loaded and stored over a desiccant show little
change after time intervals up to two years, as il-
lustrated in Table 5-23. For loose powders stored
up to two years in unheated magazines and then
loaded, a slight increase in burning time has been
observed. Storage under dry conditions prevents
further increase in burning time and may reverse
the trend as shown in Table 5-24.
When manganese delay mixtures are kept dry,
their burning times will not increase more than five
percent during eight weeks’ storage at -|-165OF.
Some mixtures containing manganese did not
change their burning times when stored without
sealing at 100 percent relative humidity and
+ 165°F. Other manganese mixtures deteriorate
rapidly under the same conditions. This wide
variation in storage stability is due to differences
in the manganese powder used in preparing them,
5-43
АМСР 706-185
TABLE 5-23
EFFECT OF STORAGE ON FUZES LOADED WITH
BARIUM CHROMATE-BORON COMPOSITIONS
Comp., % В Zero Time % Coef. Var. Stored 19 months
Mean B. T.,* Sec. Std. Dev. Mean B. T.,* Sec. Std. Dev. % Coef. Var.
10.0 0.514 0.013 2.5 0.515 0.025 4.9
10.0 0.590 0.012 2.0 0.579 0.012 2.2
10.0 0.519 0.015 3.0 0.476 0.010 2.2
10.0 0.574 0.004 0.8 0.522 0.012 2.2
5.0 1.590 0.015 0.9 1.587 0.020 1.3
5.0 1.075 0.016 1.5 1.059 0.015 1.4
5.0 1.294 0.026 2.0 1.264 0.019 1.5
5.0 0.818 0.016 2.0 0.785 0.016 2.0
5.0 1.192 0.036 3.0 1.277 0.016 1.3
5.0 0.986 0.033 3.4 0.955 0.014 1.4
M112 Fuzes loaded at 36,000 psi, stored over desiccant
*E.T. = burning time.
TABLE 5-24
BURNING TIMES OF FUZES LOADED WITH 93/7 BARIUM
CHROMATE-BORON COMPOSITIONS STORED LOOSE
UNDER VARIOUS CONDITIONS
Initial Conditions Storage Conditions Mean В. T.,* Sec. % Coef. Var.
Mean В. T.,* Sec. % Coef. Var. Temp. Time
150°C 4 hours 0.707 1.1
8 hours 0.722 1.0
0.694 2.7 105°C 1 week 0.723 1.8
50% RH 1 week 0.720 1.5
Desiccated 1 week 0.685 1.7
0.647 2.3 150°C 4 houra 0.685 2.5
Compositions loaded in M112 Гиге Housings at 36,000 psi.
* B. T. = burning time.
and, apparently, is associated with the manganese
crystallite size and surface oxidation. Protective
treatment of the manganese fuel against corrosion
—oxidation of surface by diehromation and coat-
ing wi*h a thin film of stearic acid—did not im-
prove the dry surveillance properties of manganese
delay powders but did improve the wet surveil-
lance characteristics.
For zirc.onium-niekel delays, four weeks’ dry
surveillance increases burning times up to 16 per-
cent. Wet surveillance for four weeks results in
unreliable performance. Delay compositions of
ilieon and red lead exhibited increased burning
tiim-s of up to 10 percent, after four weeks’ dry
surveillance and were unreliable after four weeks’
wet surveillance.
544
АМСР 706-185
In general, results of tests indicate that gasless
delays will exhibit changes of up to 15 percent in
burning times after four weeks of dry surveillance.
Wet surveillance appreciably affects performance
of most delay mixtures, in some cases sufficiently to
make the mixture unreliable.
5-5.2 HEAT POWDERS30
The majority of pyrotechnic heat powders have
been developed for thermal battery applications
to melt the solid electrolyte and activate the electro-
chemical system. In general, the heat powder—
whieh generates between 350 and 500 calories per
gram—is mixed with inorganic fibers and made
into heat paper using conventional paper making
techniques. The heat paper can be stamped into
required shapes and easily assembled with the other
battery components. Other uses include warming
of battery electrolytes, melting of soldered joints
to activate spring loaded mechanisms, and furnish-
ing heat for thermal delays. Many gasless heat
powders and gasless delay compositions can be
used interchangeably; however, the electrical con-
ductivity of the products formed during burning
is important in the ability of heat powders to satis-
factorily perform their function.
The heat output of a he.it powder is of prime
significance and the burning rate is important only
to the extent of its influence on the heat output of
the mixture. Other important characteristics in-
clude :
a. Heat of reaction. Basically determines the
heat output per unit weight of heat powder.
b. Gas evolution. The gases evolved must be
controlled because if is possible they will affect
the behavior of the heat battery.
e. Burning rate. Basically determines the rate
of heat release by the heat mixture powder. (The
burning rate of heat paper has been suggested as
a means of obtaining a controlled delay time.)
5-6 INITIATORS, FIRST FIRES, AND
STARTERS
The initiation of combustion of a pyrotechnic
composition requires that a portion of the composi-
tion be raised to its ignition temperature, (Bee
also Paragraph 3-3.6.1. > Since some pyrotechnic
compositions are relatively difficult to ignite, an
explosive train similar to that used in other ex-
plosively loaded items is used to produce the ig-
nition stimulus required to initiate the main pyro-
technic composition. Such a train can be con-
sidered as divided into three parts. The first
part contains a sensitive initiating composition
that can be initiated by a relatively small, me-
chanical, electrical, or chemical stimulus. This
initiating composition, on burning, produces suffi-
cient heat to initiate intermediate explosive or
pyrotechnic composition(s) in the second part
of the explosive train. The output of this second
part will initiate the main charge in the third part
of the explosive train.29’31'32 In many eases, a de-
lay train (see Paragraph 5-5.1) can be included
in the second part of an explosive train. Emphasis
in the following paragraphs will be on initiator,
first fire, and starter compositions used in pyro-
technic items.
Work on the development of initiators, first
fires and starters for military pyrotechnics has in-
dicat’d that ignition is a complex phenomenon.
Ignition failures of pyrotechnic items emphasized
the need for more research and the need for more
understanding of the ignition and combustion
processes. The available compositions, with de-
scriptions of their applications, are discussed in the
paragraphs whieh follow.
5-6.1 PRIME IGNITION60
Prime ignition is the starting of a fire without
the use of another fire and includes methods based
on friction, percussion, concentration of the sun’s
rays by mirrors or lenses, and an electric impulse.
Many materials and mixtures of materials
have been found which produce heat as a result
of chemical reaction and which require relatively
little physical effort for initiation. Chemicals, such
as white phosphorus and phosphorus-eontaining
compounds, burst into flame on exposure to air.
Other materials, including many metals which com-
monly will not ignite in air, become pyrophoric
when finely ground; while other materials are acti-
vated by exposure to water or acid, to a spark
with a small energy content, or to very slight im-
pact. Still other mixtures require only a small and
predictable amount of energy to be initiated. This
5-45
AMCP 706-185
last group, which includes matches, is of im-
portance as initiators for ordnance items.
Development of modern matches made fire-
making a commonplace act. A safety match head is,
essentially, potassium chlorate in a matrix of
animal glue. The striking strip is composed of red
phosphorus in a similar binder. Use of additives
and adjustments in the manufacturing process
results in a safety match which ignites easily when
rubbed on the striking surface. The friction and
contact of potassium chlorate crystals with red
phosphorus results in the ignition of the match
head which, in turn, causes the ignition of paraffin
impregnated in the match ..plint. A typical match
head formula, and that, for the striker, are given
in Tables 5-25 and 5-26.50
TABLE 5-25
COMMERCIAL
SAFETY MATCH COMPOSITION
Ingredient
Percent*
Animal (Hide) Glue...................... 9-11
Extender (Starch. Dextrin)................ 2-3
Sulfur (Rosin)............................ 3-5
Potassium Chlorate....................... 45-55
Neutralizer (Zine Oxide,
Calcium Carbonate)................... 45-55
Infusorial (Diatomaceous) Earth......... 5-6
Other Siliceous Filler................... 15-32
* fractional percentages of a soluble burning rate
catalyst, such as potassium dichromate, are added, also
soluble dye stuffs. Lead thiosulfate or zinc ferrocyanide
can be used if tbe match head is to be white.
Present “strike-anywhere” (SAW) matches
have a small, easily ignitible tip composed of
tetraphosphorns trisulfide (phosphorus sesquisul-
fide) affixed to a larger bulb composed of a rather
insensitive modified, safety match head composi-
tion. Table 5-27 gives the formulation for two such
compositions.''0
The match mixtures used in munitions are gen-
erally much less complicated in composition and
mantifactnre than the commercial match mixtures
whi< h require a special striking surface. Com-
positions which have been widely used in friction
primers for artillery are given in Table 5-28. A
composition used in the friction prime: for an
airplane flare contains 14 parts potassium chlorate
and 1.6 parts charcoal hardened with 0.3 part
dextrin. Ignition is effected by pulling a loop of
braided wire coated with red phosphorus and
shellac through a pellet of the composition.61 Modi-
fied scratch sensitive mixtures containing some
thermite produces very high temperatures and can
ignite some smoke mixtures without an intermedi-
ate starter.8
In addition to matches and other scratch sensi-
tive materials, prime ignition of pyrotechnic muni-
tions, like other munitions, is accomplished with:
a. Percussion (or stab) primer which contains
a mixture that is relatively sensitive to impact and
friction, or
b. Electrically ignited primer (or squib) in
which the heat produced by the flow of electric
current in a bridgewire ignites a heat sensitive
explosive. For certain applications, especially
those involving initiatioi of high explosives, a
bridgewire may be exploded by application of a
high current pulse causing direct initiation of some
less-sensitive explosives.29'31,32,62
Certain chemical reactions have been used for
ignition of explosive trains. As has been indicated
earlier, some materials burn when exposed to air.
An example is white phosphorus. It has been used
in bursters for jelled gasoline incendiaries where
it serves the dual purpose of igniting the incendi-
ary. and the reigniting jelled gasoline which has
been extinguished. Diethyl zinc, or triethyl alu-
minum, contained in a glass vial, has been used
to ignite a match mix in a silent igniter. Some
materials, notably the alkali metals, react very
vigorously with water, liberating hydrogen which
is ignited by the heat of reaction. Bursters filled
with sodium have been considered for igniting oil
slicks on water.8 The vigorous chemical reaction
resulting from bringing iron powder, potassium
permanganate, and sulfuric acid together is an-
other method of prime ignition.
5-6.2 CHARACTERISTICS OF IDEAL
IGNITER, FIRST FIRE, AND
STARTER COMPOSITIONS
The compositions used to ignite any burning-
type pyrotechnic should have the following char-
acteristics :53
5-46‘
АМСР 706-185
TABLE 5-26
SAFETY MATCH STRIKER COMPOSITION
Ingredient Formula l,f % Formula % Formula 5,t %
Binder « 20 16
Red Phosphorus 53 50 50
Antimony Sulfide 42 — —
Charcoal 5 — —
Carbon Black — — 4
Neutralizer (ZnO, CaCO3) — — —5
Sand — 30 —
Powdered Glass — — 25
* In NC laquer, Dextrin, Casein, Animal Glue, plus hardener of U.S. Pat. 2,722,434 129.
t Formulas 1 and 2 are “one-strike” military or firework strikers. Formula 3 is a
commercial formula. Antimony sulfide and charcoal act as extenders to the phosphorus.
Antimony sulfide also seems to fulfill the role of n neutralizer and preservative for red
phospho-us.
TABLE 5-27
SAW (“STRIKE-ANYWHERE”) MATCH COMPOSITION
Ingredient Formula 1* % Formula 2* %
Animal Glue 11 12
Extender 4 5
Paraffin 2
Potassium Chlorate 32 37
Phosphorus Sesquisulfide (I\S3) 10 3
Sulfur — 6
Rosin 4 6
Dammar Gum — 3
Infusorial Earth — 3
Powdered Glass and Other Filler 33 2iy2
Potassium Dichromate — 1%
Zinc Oxide 6 1
• Formula 1 reprejents the tip formula which ignites on any hard surface. Formula 2 is
the match composition’s base, loaded with combustibles for strong billowing flame but of low
friction sensitivity.
a. Be ignited by the primer, fuze, or match
employed i:i the munition.
b. Ignite the main pyrotechnic composition.
e. Be sufficiently insensitive for safe handling
in manufacturing and loading operations.
d. Be resistant to the effect of moisture.
The specific nature of the ignition composition
is primarily determined by the particular ignition
problem since it involves the nature of the filling
to be ignited and the method by which the ignition
composition is ignited. The wide variety of fillings
used in burning-type munitions makes it impossible
5-47
АМСР 706-185
TABLE 5-28
FPICTION PRIMER COMPOSITIONS
Ingredient
Parts by Weight
Potassium Chlorate............. 56.2 44.6
Antimony Sulfide............... 24.6 44.6
Sulfur ........................ 9.0 3.6
Meal Powder............................ 3.6
Ground Glass................... 10.2 3.6
to develop one composition for all purposes. A
composition proi ueing a slag and a high tempera-
ture would be desirable for ignition of a thermite-
type incendiary or most illuminating compositions,
but would be unsatisfactory for ignition of a
colored smoke since the high temperature would
cause flaming of the dye.
Requirements for ignition compositions, there-
fore, must be varied depending on their use. Ig-
nition mixtures can be classified as slag-produeing
or gas-prodncing mixtures. As some compositions
produce both slag and gas, the type of filling to
be ignited appears to be the most practical basis
for differentiation of the various compositions.
Ignition compositions may be classified as those:
a. For munitions containing thermite-type fill-
ings or illuminating compositions, the reaction
should be very hot yet evolve little gas.
b. For munitions containing HC smoke fillings,
the reaction should be hot. and preferably produce
some slag; some evolution of gas is acceptable,
e. For munitions containing colored smoke mix-
tures and toxic smoke mixtures, the reaction prod-
uct may vary from gaseous slag to highly gaseous
with no slag.
Ignition compositions which are used as rocket
motor igniters are usually ignited by the output
of a black powder which was commonly used for
this purpose, has been replaced by igniter com-
positions composed of a powdered metal and in-
organic oxidizer.
5-6.3 TYPICAL COMPOSITIONS
The compositions of typical igniter, first fire,
and starter mixtures are given in Table 5-29.
REFERENCES
1. The Thermochemistry of Incendiaries, NDRC
Unnumbered, 2 Aug. 1943, Available at Tech-
nical Library, Edgewood Arsenal, as NDRC
Alise, Pub. 308, Report of Division 11, Na-
tional Defense Research Committee, Office of
Scientific Research and Development, Wash-
ington, D. C.
2. A. T. Wilson, Development of MOX Explo-
sivis: Various .Oxidants in MOX, NFOC-6,
National Northern Corporation, West Han-
over, Mass., December 1952.
3. R, W. Evans, Experimi ntnl Investigation of
Infrared Radiating Sources. TN-9, Denver Re-
search Institute, Denver, Colorado, July 1961
(DDU-AD 324 807).
4. S. Gordon, C. Campbell, ‘‘Differential Ther-
mal Analysis of Inorganic Compounds,” An-
alytical Chemistry 27, 1102 (1955).
5. A. M. Prentiss, Chemicals in War, McGraw-
Hill Houk Co., Inc., N. Y„ 1937
6. G. H. Custard, G. Francis, W. Schnackenberg,
Small .4rni.s Incendiary Ammunition, A Re-
rieiv of the History and Development, Frank-
ford Arsenal Report R-1407-3, December 1956.
7. L. Finkelstein, A. E. Gaul, Incendiaries, Vol.
IS, Part II of History of Research and Devel-
opment of the ('hemical Warfare Service in
Wortd War II, Edgewood Arsenal, Maryland.
8. S. J. Magram, Starters, Vol. 16 of History of
Research and Development of the ('hemical
Warfare Service in World War II, Edgewood
Arsenal, Maryland.
9. W. Jost, Explosion and Combustion Processes
in (rases, McGraw-Hill Book Co., Inc., N. Y.,
1946.
10. B. Lewis and G. Von Elbe, Combustion Plames
and Explosions of Gases, 2nd Ed., Academic
Press, Im-., N Y., 1961.
11, H. F. Coward and G. W. Jones, Limits of
Flammability of Gases and Vapors, Bulletin
5-48
АМСР 706-185
TABLE 5-29
SOME FIRST FIRE, STARTER, AND IGNITER COMPOSITIONS
Composition (Percent by weight)
Aluminum 13
Boron 10
Charcoal 4
Magnesium 25
Silicon 20 25 26
Titanium 25
Zirconium 20
Zirconium Hydride 15
Barium Chromate
Barium Nitrate 50 90 75
Iron Oxide (FesO<) 25
Iron Oxide (Ь’егОз) 25
Iron Oxide (Scale) 22
Lead Oxide (РЬОг) 80
Lead Oxide (PbsO4) 35
Potassium Nitrate
Tetranitraearbizole 5
Laminac Binder 5* ft* ft* ft* ft* «ft
• Laminac binder: Laminac 99’/< ; Lupersol 1%.
" Most of these compositions can be used as a loose powder mixture or with binders such
ns celluloid, nitrocellulose or NC lacquer.
REFERENCES (cont’d)
503, Bureau of Mines, Washington, D. C.,
195'2.
Г2. A. (J. White, “Limits for the Propagation of
Finnic in Inflammable Limits,’’ Journal of
the American Chemical Society 127 (1925).
13. (i. Von Elbe, B. Lewis, Papers presented at
Third Symposium on Combustion and Flame
and Explosion Phenomena, held at University
of Wisconsin, Sept. 7-11, 1947, with Bureau of
Mines, Pittsburgh, Pa.
14. G W Jones, lit st arch он Flammability Char-
acteristics of Aircraft Fuels, Progress Report
No. 5, Bureau of Mines, Pittsburgh, Pu,
Mnreh 1951.
15. Ni'i< net of Pttrolcum, IV, Oxford Unviersity
Press, 1938,
16. Gunfire Tests to Determine the Vulnerability
of Jet-Propelled Aircraft Fuels, Report F-27-1,
Naval Proving Ground, Bureau of Naval
Weapons, Washington, I). December 1945.
17. A. Stein, M. J. Torseh, Effectiveness of In-
cendiary Ammunition Against Aircraft Fuel
Tanks, BRL Memorandum Report 484, Aber-
deen Proving Ground, Md., 1948 (DDl'-ATI
42 383).
18. A. J. Metzler, .Viburnum Spark Ignition Ener-
gies of /9 Pure Fuels at Atmospheric and Re-
duced Pressurt, NACA-RME53H31, National
Advisory Committee for Aeronautics, Wash-
ington, 1). C„ 1953.
19. G. W. Banserman, .In Instrument for De-
termina.'.on of Transient Flame Temperatures,
5-49
AMCP 706-185
REFERENCES (cont’d)
Phase Report No. 4, Denver Research Insti-
tute, Denver, Colorado, 1952.
20. Thermite, Plain, Incendiary, CWS Formula
No, D-l-1, 19 August 1944 (CWS Formulary,
Technical Command, Edgewood Arsenai, 1
September 1945), Edgewood Arsenal, Mary-
land.
21. A Solidified Oil Incendiary, ETF-182-1, Massa-
chusetts Institute of Technology, Cambridge,
Massachusetts.
22. D. Hart, Oaslcss Powders for Delay Elements
of Fuzes, Pieatinny Arsenal Technical Report
1239, Pieatinny Arsenal, Dover, N. J., 1943.
23. S. Sage, Manufacture of Barium Chromate
Delay Powder on a Semi-Plant Scale, Pica-
tinny Arsenal Technical Report 1432, Pica-
tinny Arsenal, Dover, N. -I., 1944.
24. D. Hart, Delay Compositions, Research and
Development Lecture 27, Pieatinny Arsenal,
Dover, N. J., 1956.
25. C. A. Poppendieek, Research on Heat-Pro-
ducing Compositions, First Quarterly Report,
Contract DA-3G-039-SC-75071, Catalyst Re-
search Corporation, Baltimore, Md., 1958.
26. L. Apostolos, Powder Plate Development, Cat-
alyst Research Corporation, Baltimore, Md.,
1953.
27. Apparatus for Testing Pulp and Paper, Bulle-
tin VII, Williams Apparatus Company, Wa-
tertown, N. Y.
28. R. II. Cornyn, Pyrotechnic Research at DOFL.
Part I. Heat Source Materials, Technical Re-
port 884, Harry Diamond Laboratories, Wash-
ington, D. C., 1960 (DDC-AD 321 045).
29. AMCP 706-210, Engineering Design Hand-
book, Fuzes, General and Mechanical.
20. К. H. Cornyn, The IIse of Gasless Mixtures for
Producing Controlled Time Delays in Ord-
nance Device-, DOFL Report 22-576, Harry
Diamond Laboratories, Washington, D. C..
1957.
31. Ordnance Explosive Train Designers Hand-
book, R-llll, Naval Ordnance Laboratory,
Bureau of Naval Weapons. Washington, I). C.,
1952.
32. AMCP 706 179, Engineering Design Hand
book, Explosive Trains.
33. B. Werbel, S. Lopatin, Development of Delay
Powders, Pieatinny Arsenal Technical Report
2477, Pieatinny Arsenal, Dover, N. J., 1958.
34. M. F. Murphy, A Comparative Study of Five
Pyrotechnic Delay Compositions, NAVORD-
5671, Naval Ordnance Laboratory, Bureau of
Naval Weapons, Washington, D. C., 1958,
35. M. F. Murphy, Current Topics in Gasless Heat
Powder Work at NOL, Speech before NOL
Pyrotechnic Symposium, Naval Ordnance Lab-
oratory, Bureau of Naval Weapons, Washing-
ton, D. C., 1959.
36. R. H. Cornyn, Pyrotechnic Research at DOFL.
Part II. Pyrotechnic Delays, TR-1015, Harry
Diamond Laboratories, Washington, D. C.
37. P. Roehlin, Mass Spectrometric. Analysis of
Gaseous Combustion Products from Delay
Powders, Pieatinny Arsenal Technical Report
2006, Pieatinny Arsenal, Dover, N. J., 1954.
38. R. A W. Hill, T. L. Cottrell, “Studies of
Combustion Waves in Solids,” Fourth Sym-
posium (International) on Combustion, The
Williams and Wilkins Company, Baltimore,
Md., 1963.
39. J. E. Spice, L. A. K. Staveley, “The Propaga-
tion of Exothermic Reactions in Solid Systems,
Part 1. Pr< ’gnition Reactions. Part II. Heats
of Reaction and Rates of Burning,” Journal
of the Society of Chemical Industry 68. 313-
19, 348-55 (1949).
40. S. Nakahara, “Studies on Delay Powders, I.
Measurement of Temperature of Combustion
of Delay Powders,” Industrial Explosives So-
ciety Journal, 1958.
41. S. Nakahara, T. ILkita, “Studies on Delay
Powdtrs, II. The Combustion Pressure of De-
lay Powders,” Industrial Explosives Society
Journal, 1958.
42. S. Nakahara, T. Hikita, “Studies on Delay
powders, ill. On Mechanism of Delay Pow-
ders,” Industrial Explosives Society Journal,
1958.
43. S. Nakahara, “Studi“s on Delay Powders,
IV. Theory of Combustion Propagation Ve
loeity of Delay Powders,” Industrial Explo-
sives Society Journal, 1958.
44. S. Goidon, E. D. Crane, Compilation and
5-50
АМСР 706-185
REFERENCES (cont’d)
Evaluation of the Ignition Temperature Pa-
rameters and Differential Thermal Analysis
for Pyrotechnic Systems. 1. Barium Chromate-
Boron, Pieatinny Arsenal Technical Nute 24,
Pieatinny Arsenal, Dover, N. J.
45. R. Cornyn, R. Skelton, Effect of Pressure on
the Burning Rate of Gasless Delays, NAVORD-
1787, Naval Ordnance Laboratory, Bureau of
Naval Weapons, Washington D. C.
46. Al. Gilford, B. Werbel, G. Weingarten, L. Key,
The Anticipating Effect. A Study of the Burn
ing Mechanism of Delay-Relay Columns, Pica-
tinny Arsenal Technical Report 3047 Wea-
tinuy Arsenal, Dover, N. J., 1964.
47. R. E. McIntyre, Factors Affecting the Blend-
ing of Gasless Mixtures, TP-648, Harry Dia-
mond Laboratories, Washington, D. C., 1959.
48. B. Werbel, Recent Advances in Pyrotechnic
Delay Compositions, Speech presented at White
Sands ’’roving Ground, November 17, 1959,
Picatinny Arsenal, Dover, N. J.
49. Th? Application of Lead, Tubing to the Filling
of Pyrotechnic Delays, Branch Memo X4/3/58,
Armament Research and Development Estab-
lishment, Ministry of Sunply, Great Britain.
50. H. Eliern. Modern Pyrotechnics, Chemical
Publishing Co,, 1961.
51. K. Ii, Davis, Chemistry of Powde" and Ex-
plosives, John Wiley C Sons, N. Y., 1943.
52. R. 1'. Maninger, Background of Exploding
Bridgeware and Conventional Systems, Pre-
sented at American Ordnance Association
Joint Technical Meeting on Exploding Bridge-
wire Systems, Los Angeles, California, Febru-
ary 10-11, 1964.
53. S. J. Magram, A Survey of Starters for Burn-
ing Type Munitions, TDMR-655, Edgewood
Arsenal, Maryland.
5-51
АМСР 706-185
CHAPTER 6
PRODUCTION OF LIGHT
6-1 HISTORICAL SUMMARY
Military pyrotechnic items used for illumina-
tion and signaling by the military share a com-
mon origin with the spectacular white and colored
flames produced by fireworks. Tracing the de-
velopment of these compositions is relatively easy
since there was little progress made in the develop-
ment of flame producing compositions until the
introduction o( potassium chlorate pyrotechnic
mixtures near the end of the 18th century.1
6-1.1 CONSOLIDATED ILLUMINANTS
6-1.1.1 Flares and Signals
Modern fireworks, with a few exceptions, can
be divided into two types, those designed to pro-
duce force and sparks, and those producing a
flame.12 Early efforts were directed toward the
development of spark and force producing com-
positions. At that time, there was no known way
of imparting color to a flame. As a result, rhere
was little difference to the eye between a flame
produced by a pyrotechnic mixture and one result-
ing from the burning of pitch, petroleum, (r
resinous wood. Sparks could be varied in form and
brightness, although not in color, so that spark
compositions became, and remained for centuries,
the main consideration of the fireworks maker,
The few flame compositions available in the
17th century usually included a flammable liquid
in order to ensure combustion of the rest of the
mixture consisting of gunpowder, antimony sul-
fide, and arsenic sulfide, zippier1'2 was far in
advance of his time when he suggested the use of
acetate of copper to give a green tint to a flame.
By the early part of the 19th century, a pyro-
technist, Claude-Fortune Ruggieri,3'4 5 suggested
the use of metal salts and ammonium chloride in
the production of a colored flame.
The modern era in pyrotechnics began with the
introduction of potassium chlorate which was first
prepared in 1786 and first mentioned as an in-
gredient in a pyrotechnic composition in 1823.8
By 1830 several formulas containing potassium
chlorate had been developed for firework display,
military signaling and signaling at sea. "While
most colors could be produced in a more or less
satisfactory manner by 1850, it was several years
later before a satisfactory blue flame was pro-
duced. This was accomplished by adding copper
salts to compositions containing potassium chlorate.
The color was enriched by the use of calomel,
Hg2Cl2. During this period colored flames pro-
duced by adding color-emitting salts to potas-
sium chlorate and sulfur compositions were found
to be very satisfactory. In spite of their good color
quality, these compositions were abandoned be-
cause of their sensitivity to impact and friction.
Sulfur was replaced first by powdered shellac and
later by other gums and resins.
Magnesium was first produced on a commercial
scale in 1860 ar.d was used by European pyrotech-
nieians several years later. In the United States,
possibly because of its cost, magnesium was not
used in military pyrotechnic mixtures until around
1926. Aluminum was not used appreciably in pyro-
technic compositions until near the end of the 19th
century when it became commercially available.
Illuminating compositions for military appli-
cations were, basically, the same as those used in
firework displays over two hundred years earlier.
A primitive type of light producing item—whose
composition consisted of saltpeter, sulfur, resin,
and linseed oil—was included in British military
stores until at least 1870. Most important of the
few inventions ir military pyrotechnics during the
latter part of the 19lh century was the parachute
light which appears to have originated about 182G
in Denmark much in advance of its widespread use
in the World Wars of the 20th century. Another
invention, the Veiy Pistol which was patented in
1878, originated as a civil signaling device. Ini-
6-1
AMCP 706-185
tially, the pistol had a one-inch bore; this was
later increased to one and one-half inches during
World War I. Improved illuminating and sig-
naling devices were developed in the 1914-1918
period because they weie required it- the trench
warfare of World War I to a much greater extent
than in prior wars. The growing importance of
air warfare opened a whole new field for the use
of illuminants and signals. Simulators and decoys
were developed for the purpose of misleading enemy
observers.
Most of the illuminating and signaling devices
produced in the period between World Wars were
developed by empirical methods. The limited
amount of work performed in this period necessi-
tated a hurried attempt to put the pyrotechnic
field on a scientific basis at the start of World War
II. This attempt vas hampered by the necessity
or producing items for immediate use on the battle-
field. Most of the research and development con-
tinued to rely ирит empiricism. However, a lim-
ited amount of basic and applied research, much
of it directed toward the development of better
light producing compositions, was started at sev-
eral of the Government installations and continued
after the war. Results of the work done after the
war were extremely rewarding. At the end of
World War II some opinion was expressed that
little improvement could be made in flare and
photoflash compositions.7 Contrary to this opinion,
major improvements were made, some of them in
time to be of great service in the Korean Conflict.8
Current research and development effort is
being directed toward the development of advanced
flare compositions, for both illuminating and sig-
naling purposes, to function at altitudes where
little or no atmospheric oxygen is available.
6-1.1.2 Tracers
Before the invention of gunpowder and the use
of bullets, there was no need for tracers. The
projectiles used, namely spears and arrows, were
large in size, and traveled at a low velocity, so that
their line of flight could be readily followed. Ar-
rows tipped with burning grass might be con-
sidered the first tracers. Thoiign the prim? ieason
for using these burning arrows was io start fires,
the course of }he arrow could be followed at night.
The range of the crude guns introduced after
the invention of gunpowder was so short that the
point of impact of the projectile could be noted
by the eye. However, this was no longer possible
after the introduction of weapons which fired
small-caliber, high-velocity bullets over ranges of
more than a thousand yards. During World War I,
the need for tracers was intensified by the wide use
of machine guns. The need for tracers became
acute, coincident with the enormous expenditure
of ammunition by infantry and air service. At
long range, in the air and on the ground, it was
almost impossible to estimate range and correct
aim by observing the point of impact of bullets
which did not incorporate tracers.
During World War I, the air services of both
the Allied and Central Powers urgently demanded
an efficient, accurate tracer bullet and, as the re-
sult, tracer ammunition was soon developed by all
of the belligerents. A German tracer composition
—containing a mixture of magnesium, strontium
nitrete, calcium hydroxide and rosin--was not
very satisfactory because it was difficult to ignite
and produced a very dim and ?. distinct trace.
The French tried several tracer mixtures which
contained a small amount of linseed oil as a
binder. These tracers were ouite brilliant and de-
pendable but were unstable in storage and became
practically useless soon after manufacture. As a
result, bVeneh tracers were made immediately be-
hind the lines so that the ammunition could be
placed in the hands of the troops as promptly as
possible. If the ammunition could not be used
within two or three weeks, it was scrapped and
replaced.
After the United States entered the War, a pro-
gram of developing better tracer ammunition for
the American Expeditionary Forces was activated.
The result of this work was the development of
M1917 tracer ammunition, which consisted of a
jacket of cupronickel surrounding a container of
gilding metal and a lead shot. The tracer composi-
tion was a mixture of barium peroxide and mag-
nesium in grain alcohol, which was dried and
pressed into the container at 48,000 pounds per
square inch. This tracer was quite satisfactory
and produced a trace—which was not especially
brilliant—for about 500 yards. Another tracer
6-2
АМСР 706-185
was developed in cooperation with the British,
using a mixture of barium nitrate, barium perox-
ide, and magnesium loaded in a hollow brass bul-
let. An igniter mix of barium peroxide and mag-
nesium was required with this tracer mixture.
The using services were not satisfied with the
status of tracer ammunition at the end of the War,
and again studies directed toward the production
of a better tracer bullet were resumed. Many
mixtures were tried during this period and it was
found that calomel would increase the brilliance
and luminosity of che trace produced; this resulted
in the introduction of the M1923 tracer bullet,
caliber .30, and the design of an M1924 prototype.
During this period, tracers were developed for
caliber .50 and also for caliber .45 weapons; these
were used primarily as red, green, and white sig-
nal rounds. It is also interesting to note, that the
M1923 tracer was evaluated as a small arms in-
cendiary bullet and found to be superior to the
then-available small arms incendiary ammunition;
for some time thereafter this tracer also served as
a small arms incendiary. By December 1926, mili-
tary requirements brought about standardization
of the red tracer as the only one approved for
general military use. The designation was “Bul-
let, Tracer, Caliber .30, ЛИ.” The tracer composi-
tion contained strontium peroxide made by the
dry process and a higher-density calomel.
The igniter composition contained barium per-
oxide and fine magnesium. Tracer Ml was glso
loaded with a snbigniter consisting of three parts
igniter and one part traeei composition to insure
ignition of the tracer composition. These changes
resulted in an increased length of trace to 1300
yards for caliber .30 tracers, and to 2200 yards
for caliber .50 tracers. Research and development
concerned with small arms ammunition continued
at a very limited rate resulting in changes such as
the development of a gilding metal bullet jacket
to replace the cupronickel jacket. The bullet de-
sign of the caliber .30 Ml tracer ww: standardized
in 1929, based upon the M1924 prototype round;
however, the pyrotechnic compositions were
changed significantly during the period between
World War I and 1929. For example, many
strontium compounds such as strontium peroxide,
strontium oxelate. and strontium nitrate were in-
vestigated as a means of improving color of the
flame and boring. During this period, calcium
resinate was introduced as an improved composi-
tion binder. By 1929, there was concern as to the
effects of incorporating mercury compounds such
as calomel in tracer bullets because, under certain
conditions, it was observed that the jackets split
in storage, probably due to the liberation of the
mercury from the calomel. Investigation proved
that the cracking of the jacket was due to the pres-
ence of free mercury, and elimination of tracer
compositions followed.
Ln addition to this work, a limited amount of
research and development effort directed toward
the development of red tracer compositions for
ammunition larger than caliber .50 was initiated.
During this same period, the Navy had developed
and adopted satisfactory compositions for red,
white, green, and orange tracers.
About 1934, study of test records showed that
Army tracers became unsatisfactory after five
years’ storage. The tracer composition had been
wet-processed to obtain good storage stability; i.e.,
the calcium resinate was dissolved in carbon tetra-
chloride, mixed to a paste with the other ingred-
ients, baked dry, and pulverized to a powder to
render all ingredients moisture-repellent. Poor
storage stability was apparently due, not to the
tracer composition, but rather to the dry-blended
barium peroxide-magnesium-red lead igniter com-
position. Red lead, although aiding bonding and
identification of the igniter composition, was found
to be chemically incompatible with barium per-
oxide and. therefore, was removed from tne formu-
la. The magnesium was pre-treated with water to
form a protective oxide coating and one percent
zinc stearate was added as a water repellent. This
igniter blend proved to be more stable under high-
hnmidity testing and was adopted for use in 1937.
During the period from 1935 to 1941, develop-
ment work on delay action and dim igniters for
small arms tracers was active.9-10 Two composi-
tions were developed which were standardized.
These compositions form the basis for all delay
action and dim igniters used in small arms am-
munition. The basic composition is designated I-
136 Delay Action and is composed of 90 percent
strontium peroxide and 10 percent calcium resi-
6-3
АМСР 706-185
nate. Dim initial trace is controlled by the quan-
tity of magnesium added to 1-136 composition.
Standard T-194 Dim Igniter contains 6 percent
magnesium. Compositions incorporating “delay
action’’ function so as to produce no visible trace
up to some prescribed distance along the trajec-
tory; then the tracer composition is ignited. This
action is desirable to avoid revealing gun positions.
Dim ignition provides a dim trace and has the
advantage of providing fire control directly from
the gun muzzle for some prescribed distance, at
which distance the bright tracer composition is
ignited. This type of ignition is particularly de-
sirable for firing at planes and other fast-moving
objects at night since the dark-adapted eyes of the
gunner would be seriously affected by the stand-
ard, bright igniter composition used for daylight
conditions. To insure proper functioning and
storage stability of delay and dim igniters, it was
necessary to develop a high assay, wet-processed
(or precipitated) strontium peroxide. Unconverted
strontium hydroxide (always present in this com-
pound) had to be reacted with the free abietic
acid of the calcium resinate which had previously
been dissolved in carbon tetrachloride. This wet-
processing technique provided a composition more
sensitive to ignition and less affected by moisture.
During the 1935-1941 period, the Navy again
became interested in the development of dim and
dark types of tracers for use with the 40 mm gun
because of the self-destruct requirements for its
ammunition.
Immediately prior t and during World War
11, demands were suddenly made on U.S. industry
to supply huge quantities of pyrotechnic chemicals
which had previously been supplied in very lim-
ited quantities by only a few manufacturers. These
demands resulted in large production of such
chemicals as the alkaline earth peroxides, per-
chlorates, nitrates, and magnesium powder by es-
tablishments with relatively litile experience in
their manufacture. Because of the urgency of
maintaining peak production schedules, specifica-
tions defining the quality of raw materials were
often waived to the detriment of overall ammuni-
tion function and stability during storage. A not-
able example was magnesium powder, which had
been produced during peacetime as clean, bright
metal particles of 98 percent metal content. Dur-
ing the war, magnesium powder was used which
ranged from dark gray to almost black with a
metal content as low as 80 percent.
Another example was the immediate change
from wet-processing of tracer compositions to dry-
processing, or simple blending of the dry in-
gredients. This was a faster and less hazardous
method but it produced compositions that were
more difficult to load, less uniform in ignition and
burning, and more susceptible to attack by mois-
ture. F’or several years the technical effort ex-
pended in both the Government and industry—
when conducting chemical, engineering, and func-
tional tests—had the purpose of assuring a con-
tinuous supply of ammunition which was intended
for almost immediate expenditure by the troops.
As the war proceeded, it became apparent that
much of this war production would not be used
immediately and would probably remain for rela-
tively long periods in storage depots.
A review of the overall situation aimed at
improving quality of pyrotechnic ammunition was
then initiated, and research programs for this
purpose resulted. In addition, the continuous de-
velopment of many new types of tracer ammuni-
tion continued. These developments included col-
ored smoke tracers, tracers for caliber .30 Ml;
caliber .30 carbine; caliber .45; caliber .50; caliber
.60; 20 mm; and the larger artillery rounds (most
of which included the combination types, i.e., arm-
or-piercing tracer, and armor-piercing incendiary
tracer).
The surge of effort for improved tracer pyro-
technics, begun during World War II, included
research and development programs to investigate
higher purity chemicals, effect of chemical im-
purities on functioning and stability, critical mois-
ture content permissible for long term storage, de-
velopment of metal and plastic types of base
closure seals to prevent moisture entry, and water
pre-oxidation and diehromate treatment of mag-
nesium powder for improved stability. In addi-
tion. many new kinds of materials were developed
for use in pyrotechnic compositions. These include
new grades of alkaline-earth peroxides, atomized
(consisting of spherical particles) magnesium,
6-4
AMCP 706-185
magnesium-aluminum alloys, and titanium and
boron powders.
More basic studies have included investiga-
tions of threshold visibility and its relationship to
background, distance, candlepower, and color val-
ues; the relationship between impact sensitivity
of the composition and reliability of tracer igni-
tion, and the effect of cavity geometry and high
speed bullet rotation on the candlepower and burn-
ing time; and particle-size measurement and the
effect of particle size on burning characteristics.
Recent studies have been concerned with the de-
termination of the reaction kinetics of pyrotechnic
compositions by such methods as differential
thermal analysis and differential gravimetric anal-
ysis. Use of pyrotechnics at very high altitudes
presents new problems. These problems have re-
sulted in studies of the mechanisms of reaction at
low pressure and/or in the absence of an oxygen
atmosphere and the development of pyrotechnic
compositions designed from the data thus obtained.
6-1.2 NONCONSOLIDATED ILLUMINANTS
Nonconsolidated illuminants are comprised
mainly of various types of photoflash devices in-
cluding photoflash bombs and cartridges, and spot-
ting devices. They consist of loose-loaded pyro-
technic compositions which react rapidly to pro-
duce a brilliant flash of light, when confined,
similar to that produced by the common photoflash
bulb.
6-1.2.1 Photoflash Devices
The use of photoflash powder to provide arti-
ficial illumination for photographic purposes was
fairly common long before the military use of air-
craft for reconnaissance purposes. Toward the end
of World War I, when the importance of aerial
photographic reconnaissance during the day had
been widely recognized, the military advantages
of night aerial photography also became apparent
and attempts to provide devices for this purpose
were made by both Allied and Central Powers.
6-1.2.1.1 Photoflash Bombs
6-1.2,1.1,1 Composition Type
The study of artificial light sources for night
aerial photography was continued in the United
States after World War I, when commercial flash-
light powder was exploded in 25-, 60- and 100-
pound containers with only partially satisfactory
results. In 1925, the Air Corps tested commercial
photoflash powder, carried in towed gliders, as a
light source. About this time, attempts to pro-
duce a suitable photoflash powder followed two
general lines of investigation. The first was to
develop a fast burning flashlight composition and
the second involved the development of illuminat-
ing materials which could be detonated. Essen-
tially, all photoflash mixtures used during the
period through World War II were of the first
type. Development of an illuminating mixture
which could be detonated was not completed until
after World War II.
The hazardous and unsatisfactory system using
the towed glider, whieh limited a mission to one
photograph, was abandoned in favor of a para-
chute-suspended cylindrical bomb. While other
shapes were tried later, this shape, in general,
proved to be most efficient. An important require-
ment was for a flash powder that would produce
peak light output during the time the camera
shutter was open. This resulted in the develop-
ment, by 1930, of a photoflash mixture consisting
of 34 percent magnesium, 26 percent aluminum,
and 40 percent potassium perchlorate. This was
established as the Standard Type I photoflash
powder.
In the early part of the 1930’s, two photoflash
bomb designs were in use: one, a rectangular ply-
wood box designed to be carried on external racks;
the other, a paper tube seven inches in diameter
and 32 inches long, which contained about 25
pounds of flash powder. This latter type became
the first standard photoflash bomb and was later
known as the T1 or M12 Photoflash Bomb.11 It
was carried within the fuselage of the airplane;
used a parachute to retard its drop; and was satis-
factory for use with aircraft operating at 200
miles per hour at altitudes up to 5000 feet. The
final modification of this bomb produced a peak
intensity of 325 million candlepower and an aver-
age total radiation of 22 million candlepower-
seconds. The M12 Photoflash Bomb was used for
training purposes only.
The M23 Photoflash Bomb’2 was developed in
6-5
АМСР 706-185
order to increase the number of photographs ob-
tainable on a mission. It contained about seven
pounds of flash powder in a cylindrical paper-
board case. Later it was placed in a streamlined
steel outer ease to improve its operational char-
acteristics. Development of the M46 Photoflash
Bomb was started just before the United States
entered World War II. This bomb contained up
to 25 pounds of photoflash mixture in a stream-
lined metal ease and was widely used in World
War 11 for photography from intermediate alti-
tudes.
In an attempt to increase the intensity of the
light from pyrotechnics, scientists under National
Defense Research Committee auspices at Wesleyan
University and at the California Institute of Tech-
nology conducted a more fundamental study of
photoflash powder. Both groups reached the con-
clusion that no real improvement in flash output
could be gained by changing the standard mag-
iiesium-aluminum-potassium perchlorate mixture
then in use. Consideration was then given to pos-
sible methods of obtaining a more efficient dis-
tribution of the light from the flash. Further
study, however, indicated that a larger bomb was
an easier way to obtain higher levels of illumina-
tion. Because of lortages of aluminum and mag-
nesium powders at the start of World War II, a
mixture using a magnesium-aluminum alloy as a
fuel instead of a mixture of magnesium and
aluminum, known as Type II, Class A, photoflash
powder was developed. Later, barium nitrate was
adopteil as the oxidizer. This mixture was known
as 'Гуре II, Class B, photoflash powder. Later,
a new standard photoflash powder, Type III, Class
A, consisting of 40 percent aluminum, 30 percent
barium nitrate, and 30 percent potassium per-
chlorate was adopted.1'1 It was found that the lat-
ter mixture, when confined in a heavy-walled eas-
ing, would produce more light output from a
smaller and safer photoflash bomb. These results
led to the cancellation of further work on thin-
walled photoflash bombs for high altitude, night
aerial photography, and led to the development
of the safer heavy-walled bombs. These bombs
were in production in late 1951 and were usi d in
the Korean Conflict in 1952. While much safer
than the M46, this type of bomb still did not meet
the requirement that it should be no more sensitive
to projectile fragments and bullet impact than a
general purpose bomb.
Work on photoflash compositions continued
with considerable emphasis directed toward the
development of flash mixtures containing calcium,
which were more effective at higher altitudes than
other photoflash mixtures.
6-1.2.1.1.2 Dust Type14
The need for night illuminant safer than the
standard flash powder bomb (which was easily
detonated by bullet impact) led to a requirement,
for a less-sensitive powder composition. This ap-
proach was considered to be preferable to armor-
ing the bomb. By 1943, British reports of the de-
velopment of a safe metal dust bomb, using either
aluminum or magnesium powder detonated by a
tetryl burster, had been received. Initial tests
made in this country of the metal dust type were
not encouraging. It was found that the “safe”
powder produced only about 20 percent as much
light as the standard photoflash bomb. Further
work resulted in the T8 bomb, whieh was a com-
plete failure. Instead of dispersing as a dust to
explode1 in a short bright flash, the milled mag-
nesium powder used in the bomb apparently com-
pacted into large adhering masses which burned
progressively.
The T8E1 bomb, containing 70 pounds of flake
aluminum and weighing over 200 pounds, reached
a peak intensity of one billion candlepower in
about 12 milliseconds. This was little more than
the peak candlepower of the 50-pound M46 bomb.
A ring-shaped flash with a characteristic non-
luminoiis core was produced, presumably caused
by gaseous decomposition of the high explosive
burster. The same dark center was also noted in
the British dust bombs, Mark Ill and Mark IV.
By the end of the War, small scale tests of a
variety of metal dusts, bursteis. and casings showed
that a conieal burster eliminated the dark core.
Continuing research on metal dust bombs
showed that a satisfactory bomb was unattainable
with magnesium dust. The smaller the burster, in
proportion to weight of dust, the greater the effi-
ciency in terms of eaudlepower-seeonds per grain,
but the slower the flash. No satisfactory point of
6-6
AMCP 706-185
compromise could be found. The use of atomized
magnesium-aluminum alloy was then suggested
because of its nonhygroseopic nature. It provided
twice the peak candlepower of magnesium dust
accompanied by relatively little change in total
light output.
A separate development project was started in
1948 and led to the standardization of the M122
oust bomb in 1952.15 The M122 was eight inches
in diameter by 54 inches in length, with a total
weight of 110 pounds. The bomb achieved a peak
of 0.82 billion candlepower, although the average
of several tests was abou* 0.70, and in the best 40
millisecond period it produced 31.9 million candle-
power-seconds. It was slow to peak, requiring
about 42 milliseconds. The flash was so long in
duration that on one occasion two photographs
were taken with a single camera using the light
of a single bomb. Under ideal conditions of clear
atmosphere and nigh reflectance terrain, it was
possible to obtain usable photographs at altitudes
of 16,000 to 20,000 feet. Good photos under normal
conditions were possible at altitudes of 5000 to
12,00 feet. The bomb was stable from an airspeed
of 185 to 400 miles per hour. The RB-26 aircraft
carried a load of ten M122 bombs; the RB-45C
carried twenty-five; and the RB-50 carried fifty-
two. Procurement was initiated too late for use
in the Korean action.
6-1.2.1.1.3 Segregated Oxidant Type
In 1950, the development of a segregated oxi-
dant type photoflash bomb was begun in an at-
tempt to obtain both the safety from impact
initiation associated with the dust type bomb and
the high peak light intensity associated with the
photoflash powder type bomb. In addition, this
type bomb—in which the burster, oxidant, and
metal dust are loaded separately in coaxial cylin-
ders—also should be relatively insensitiv to alti-
tude as compared to the dust which depend en-
tirely on atmospheric oxygen. Considerable effort
was directed toward the development of a bomb
of this type; however, the results obtained did not
prove to be markedly superior to those obtained
with the newer nonsegregated types. As a result,
the segregated oxidant photoflash bomb was not
developed into a standardized item.
6-1.1.2.2 Photoflash Cartridges19
While most of the night aerial photographs
during the early phases of World War II were
obtained at relatively high altitudes, the need
for low level night aerial photographs during the
latter phases of the war was anticipated. There-
fore, development of suitable photoflash mixtures,
as well as cartridges and ejectors for this purpose,
was started but the work progressed slowly because
of low priority.
In 194Л when the need became acute, the
United States’ designs were not complete and a
photoflash cartridge designed and developed by the
British was used. This cartridge was based on
the ease used for the Very parachute flare. By
1945, the first low altitude photoflash cartridge
developed in the United States was based on a
standard signal flare ease and contained about
five ounces of Type II, Class В flash powder.
Its light output characteristics were poor and,
hence, it was not standardized or used during
World War II.
The first United States standardized photoflash
cartridge was developed by 1949. It contained the
then new Type III photoflash powder and could be
used to obtain satisfactory aerial photographs up
to an altitude of 4000 feet. These cartridges were
used extensively in the Korean Condict for low
altitude night reconnaissance photography. As the
tactical situation in Korea often required night
photographs at higher altitudes, the M46 bomb
was also widely used. However, due to the greater
weight of the M46 bomb, fewer units could be
carried, resulting in a demand for smaller units
having adequate candlepower. This requirement
had been anticipated and tests using the Type III,
30/40/30 formula (potassium perehlorate 30%,
aluminum 40%, and barium nitrate 30%) had been
made as early as 1947, using charges ranging in
size from 1.7 to 7 pounds. The 1.7-pound charge
was found to be entirely adequate up to 8000 feet
and was loaded as the M123 cartridge with an ob-
turated delay fuze of two, four, or six seconds.
Work on photoflash cartridges continued after
the Korean Conflict.
In 1951 an atempt was made to obtain an in-
creased light output together with safe charac-
teristics for use in photoflash cartridges. A high
6-7
АМСР 706-185
inetal content mixture (70 percent aluminum
and 30 percent potassium perchlorate) was used
with massive bursters of RDX. This mixture gave
twice the total light of the Type III 30/40/30
formula and was lelatively insensitive to both fric-
tion and flame initiation. Since that time, a limited
amount of work has been continued on photoflash
cartridges and associated high rate ejection systems
for night aerial photography and other purposes.
6-1.2.2 Spotting Charges
For many years, the flash and smoke produced
by the functioning of a small explosive charge,
usually black powder, was used as an aid in spot-
ting the point of impact of practice ammunition.
Occasionally, these charges were also used in con-
nection with certain items of service ammunition.
During and after World War II, the develop-
ment of large caliber weapons for use in tanks
created a need for simple and reliable target ac-
quisition for these weapons. One of the more satis-
factory systems developed employed a subcaliber
spotting rifle aligned with the major weapon. This
rifle fired a projectile having a trajectory closely
matching in the critical range, that of the major
weapon so the location of the flash and smoke pro-
duced by the pyrotechnic charge in the subcaliber
round indicated where the major round would hit.
High precision tracking data is necessary in
the development of intermediate- and long-range
missile systems. 'Го obtain this data, brilliant light
flashes must be produced of sufficient intensity to
be recorded by a tracking camera and also be of
a short enough duration to provide accurate posi-
tion information. Early sources of light used
for this purpose were of the gas discharge type.
'Го obtain sufficient light intensity without the
weight penalty associated with electronic flash
systems, pyrotechnic light sources were developed
for this purpose. While the first pyrotechnic sys-
tem developed, the Daisy Photoflash Cartridge, was
a satisfactory light source for a tracking aid, it
created other problems, the most serious of which
was the production of metal fragments and at-
tenuation of radio signals, which resulted from the
functioning of the flash signal.
In addition to minimizing these problems,
further development. resulted in a series of flash
signals of differing intensities which allowed more
flexibility in programing of flashes along the tra-
jectory of the missile. Flash signals also have been
developed to evaluate the functioning of the mis-
sile warhead frequency system.
Further information and references on non-
eonsolidated illuminants may be found in compre-
hensive reports available.17,18'19
6-2 THEORY OF LIGHT AND COLOR
6-2.1 BEHAVIOR OF LIGHT
In a strict physical sense, light is that electro-
magnetic radiation which affects the eye and pro-
duces vision. The wavelength range of visible
radiation extends from approximately 3800A to
7000A; the angstrom unit, A, is equal to 10"8 centi-
meters. Other units used for indicating the wave-
length of electromagnetic radiation include the
micron, g, which is equal to 104 angstrom units.
In a less strict sense, the term light is also applied
to electromagnetic radiation whose wavelengths
are longer (infrared) or shorter (ultraviolet)
than those for visible light.
All forms of electromagnetic radiation, in-
cluding light, are absorbed and emitted as integral
numbers of energy quanta and are transmitted by
particles known as photons. The amount of energy,
F, associated with each photon is:
E — hv (6-1)
where v is the frequency of the radiation, and h
is Planck’s constant. This equation is often ex-
pressed in other ways, such as:
Ztr
E=~=:hCV (6-2)
where c is the velocity of light in centimeters per
second; X is the wavelength in centimeters; v is
the wave number, the reciprocal of the wavelength
in centimeters; and h is Planck’s constant.
AH electromagnetic radiations, including light,
have both particle and wave properties. This
dualistic nature is also applicable to matter. Ac-
cording (o the deBroglie equation, the wavelength
associated with a particle of mass ni moving at a
velocity c is given by:
6-8
AMCP 706-185
Many of the effects of light may be simply
explained by assuming that light, in a uniform
medium, will travel in straight lines at measurable
velocity. This assumption, which is the basis for
geometric optics, is very nearly true in most cases
of interest in pyrotechnics. The direction, or path
of light, is often represented by a straight line
called a ray. Other effects, which cannot be ex-
plained by geometric optics, must be discussed in
terms of the wave nature of light, while still others
must be explained in terms of the particular nature
of light.
A knowledge of the properties of light is im-
portant in pyrotechnics due to the need for mea-
surements and instrumentation required for eval-
uation, and to carry out the necessary research
aimed at improving light and color sources. Some
of these properties include reflection, transmission,
absorption, refraction, and the optical character-
istics associated with mirrors and lenses. These
subjects will not be discussed in detail as standard
physics texts cover them and may be consulted
when required.20 One of the most important char-
acteristics associated with the electromagnetic spec-
trum of radiation is spectral distribution; analysis
of this distribution provides an excellent tool for
determining the emitting species in flames and
other light sources. For this reason, several of
the subsequent paragraphs are devoted to this area.
6-2.2 SPECTRAL DISTRIBUTION
If a narrow beam of white light is passed
through a prism, each wavelength is deviated in
direction by a different amount and the light beam
is spread out into an array of colors. The array
of colors is called the visible spectrum, and extends
from about 0.4-inieron to about 0.7-micron. This
visible portion of the spectrum represents a very
small fraction of the electromagnetic radiation
commonly emitted by radiation sources, and lies
between the longer wavelength (infrared) and the
shorter wavelength (ultraviolet) portions of the
electromagnetic radiation spectrum to which the
eye is insensitive.
Spectra of two geneial types are observed,
emission spectra and absorption spectra. Emission
spectra are produced by light which is emitted
from luminous and incandescent bodies and con-
sist, 'n the optical region, of colored lines, colored
bands, and colored regions on a dark background.
Absorption spectra are produced by white light
which has been passed through gases, liquids, or
other light-absorbing materials on ч brightly col-
ored background. Both types of spectra can be
observed in wavelength regions outside the visible
by special techniques.
Depending on the appearance of the spectra
produced in a given wavelength interval, both
emission and absorption spectra can be further
classified 4s discrete or continuous spsetra. The
spectral distribution of the light produced by
pyrotechnic light sources for both illumination
and signaling is important; therefore emphasis in
the following paragraphs will be on emission
spectra.
6-2.2.1 Discrete Spectra
Luminous gases and vapors under moderate or
low pressures yield emission spectra which consist
of d<finitely placed bright lines or closely placed
groups of bright lines called bands. The energy,
E, associated with a quantum of light having the
same frequency, v—i.e., a spectral line—is:
E = h^ = E2—Ei (6-4)
where h is Planck’s constant. This energy is the
difference between two quantized energy levels in
the atom or molecule, designated above as Ei and
E->, so that the wavelengths of the spectral lines
are characteristic of the radiating source. The
number of lines and their relative intensities in
an emission spectra also depend on the method of
excitation.
A line observed in an emission spectrum re-
sults from the transition of the atom or molecule
from a higher, Л'г, to lower, Ei, energy level ;21 i.e.,
the transfer of quanta of energy is evolved. If
the line is observed in an aborption spectrum, the
atom or molecule is raised from a lower to higher
quantized energy level by the absorption of a light
quantum of the proper frequency.
6-2.2.1.1 Line Spectra22
Line spectra —consisting of a series of sharp,
brightly colored lines on a dark background—are
produced by single or chemically uncombined
6-9
АМСР 706-185
Figure 6-1. Emission Spectrum and Energy Levels of
Hydrogen Atom
atomr <-nd, therefore, are often called atomic spec-
tra to distinguish them from the band spectra char-
acteristic of molecules (Paragraph 6-2.2.1.2). The
complexity of the line spectra produced by emis-
sion depends on the particular atom involved and
the method of excitatior. Normally, more lines
appear in a spark spectrum than in an are spec-
trum and both exhibit more lines than a spectrum
produced by thermal excitation in a flame.
The term “lint, spectra’’ can also be con-
sidered a collective term including both atomic and
ionic spectra. In *bis context, atomic spectra are
produced only by neutral atoms while ionic spec-
tra refers to spectra produced by ionized atoms.
Less energy is required to exeite an atomic line than
is required to ionize an atom and exeite an ionic
line. In general, therefore, only atomic lines are
found in the spectra excited by arcs and flames.
Lines due to ionized atoms are found in spark-
excited spectra where excitation is due to high
velocity electrons and the energy is sufficient to
exeite spectra corresponding to large differences
in energy.
Because the energy levels in an atom are re-
lated to the configuration of the extra-nuclear
electrons, the simplest line spectra are produced
by atomic, hydrogen (note that the spectra for
ionized helium will be similar) where the observed
spectra (Figure 6-1) ean be represented by:
*=*(*? -T??) <6-5)
where v is the wave number, the reciprocal of
the wavelength in centimeters; R is the Rydberg
constant; and ki and k2 are integers. The Lyman
series found in the ultraviolet, and for which
k; = 1 and k2 =-. 2, 3, 4, —, is caused by transi-
tions from excited atomic states to the ground state
or lowest atomic energy state, as is also illustrated
in Figure 6-1. The Balmer series found in the vis-
ible spectra for which ki = 2 and k2 — 3, 4, 5, —, is
caused by transitions from excited atomic states
to the first excited state. Other series—includ-
ing the Pasehen series, Brackett series, and
Pfund series—are found in the infrared. The
spectral lines for materials of higher atomic num-
ber rapidly become so complex that they cannot
be represented by a single simple equation.
6-2.2.1.2 Band Spectra23
The emission spectra in the visible or ultra-
violet region, due to molecules, consist of a rela-
tively large number of regularly arranged, hut
complicated, groups of lines called bands. These
line sequences are called bands because they ap-
pear as structureless bands in low dispersion
spectrographs. Each band spectrum shows, in gen-
eral, a threefold structure. It consists of a num-
ber of similar but separated groups of bands mak-
ing up the band systems. Each band system is
made up of ;» number of bands, sometimes ar-
ranged in sequence, consisting of a number of
regularly arranged lines.
This threefold structure is due to the partition-
ing of the total internal energy of the molecule into
three parts resulting from: the electron configura-
tion, the vibration of the atoms in the molecule
with respect to each other, and the rotation of the
molecule. Therefore, the location of the band sys-
tem in the visible or ultraviolet region of the spec-
trum is determined by the magnitude of the energy
changes associated with these transitions. All
bands of a band system are associated with the
change in electron configuration. The position of
band in a band system is associated with a change
in vibrational energy; changes in the rotational
energy determine the location of the different lines.
Changes in energy of a molecule due to a
change in rotational energy are an order of mag-
nitude smaller than those due to vibrational
changes which, in turn, are tm order of magni-
tude smaller than the energy changes due to a
6-10
АМСР 706-185
Wovotength А «ооо 4ооо оооо аэо.ооо (20р|
Х-гау« Ultroviolat Visible Near Infrarad For Infrared Kinetic
Cfjo O2o
figure 6-2. Various Types of Spectra and Corresponding
Electronic, Vibrational and Rotational Motion
change in electronic configuration of the molecule
(Figure 6-2). The relatively small amounts of
energy corresponding to emission or absorption in
the far infrared and microwave regions are due
to changes in rotational energy of the molecule.
The spectrum associated with these changes is
called the rotation spectrum. The energy changes
corresponding to the spectrum found in the near
infrared are associated with changes in vibra-
tional energy. The superimposition of the effects
due to rotation, on those due to changes in vibra-
tional level, result in the more complex vibiation-
rotation spectrum. As already indicated, the band
system found in the visible and ultraviolet is due
to the superimposition of energy changes due to
changes in electron and configuration in vibration
and rotation.
6-2.2.2 Continuous Spectra21,24,28
A continuous emission spectrum in the visible
region is a continuous brightly colored band ex-
tending from color to color. Incandescent solids,
liquids, and gases, under high pressures, produce
a more or less continuous spectrum which may
extend without interruption from the extreme
ultraviolet through the extreme infrared. The
energy in any range, X to (X dX), of wavelengths
of a continuous spectrum is a continuous function
of the wavelength so that the radiation is char-
acterized by a continuum of wavelengths.
While continuous spectra are generally pro-
duced by incandescent solids, liquids, and gases;
regions of continuous emission or absorption may
result in gases at low pressure when at least one
of the energy states involved in the transition is
imqmmtized, possessing free kinetic energy. These
continua, therefore, correspond to processes such as
ionization, recombination and association.28,2®
6-2.3 RADIATION SOURCES
Radiation sources can be classified in terms of
the spectral distributions of their radiation and
in terms of the manner in which this radiation is
excited. Continuous radiation is generally pro-
duced by hot solids (Paragraph 6-2.2.2). Although
light produced by certain lasers is very nearly
monochromatic, there is no source of strictly mono-
chromatic radiation. A narrow range of wave-
lengths ean be obtained by isolating, with a
monochromator or filters, one of the bright lines
produced in emission by certain elements. A wider
range of wavelengths (however manifest in the
visible spectrum to give the sensation of a color)
ean be isolated by similar methods from sources
producing band or continuous spectra.27
6-2.3.1 Thermal Radiation Sources
Many radiation sources are based, at least in
part, on the emission from a material heated to a
high temperature. The radiation produced is con-
tinuous in nature, resembling that of a blackbody.
6-2.3.1.1 Blackbody
A “blackbody” is an idealized body which will
absorb all the radiant energy falling upon it. A
blackbody ean be approximated experimentally by
an enclosure having a very small opening in one
wall through which radiation may enter or leave.
According to the Stefan-Boltzmann Law, the total
radiation E emitted by a blackbody at an abso-
lute temperature T is:
E = <sT* (6-6)
where a is a constant equal to 7.56 X 10~8 erg
<'ni~:i deg-4. The intensity of radiation from a
blackbody nt a given temperature varies with the
wavelength according to Planck’s Equation:
E -__________2r'C‘h_____ (6-7x
x - XB(c',r/l’‘r — 11 '
where A’x is the radiance of wavelength X, c is the
velocity of light, к is Boltzmann's constant, and h
is Planck’s constant. This equation; which is
plotted at various constant temperatures in Figure
gives ealenlnted values which are in extremely
good agreement with the intensity values deter-
6-11
AMCP 706 185
WAVELENGTH,MICRONS
Figure 6-3. Planck's Law: Radiance as a Function of
Wavelength for Various Temperatures
Figure 6-4. Radiant Energy in Different Wavelength
Bands as a Function of Temperature
mined experimentally. The function has a single-
valued maximum, for each temperature, which
varies with temperature along curve AB in Figure
6-3. The wavelength of the maximum is given by
the equation.-
-. - 2897
-- y, ( b-C? )
and the radiance at Amaj. is given by:
K, - 1.ИН X Ю-’Г (6-9)
As shown in Figure 6-4, the amount of energy
radiated in any given wavelength region by a con-
stant temperature blackbody radiator increases
continuously but at different rales relative to the
increase in the total amount of radiation, with
temperature. Therefore, as shown in Figure 6-5,
the efficiency of conversion of thermal energy into
radiation in a particular bund varies with the
temperature and exhibits a maximum. As the
wavelength of the hand increases, the temperature
for maximum efficiency decreases as does the value
for th<‘ maximum efficiency.28
6-2.3.1.2 Graybody
A graybody, or nonselective radietor, radiates
at ever}' wavelength an amount of energy bearing
i! constant ratio to the amount radiated by a black-
body at the same absolute temperature. This ratio
is called the emissivity and is less than one for all
solid radiators, but may closely approach unity in
some cases for an extended wavelength region.
Thus, the spectra] distribution is exactly the same
us that for a blackbody but the total energy radi-
ated is less. Si coral <o)id materials, including
platinum, iron, tungsten, and carbon, are very
marly nonselective radiators over a fairly wide
range of wavelengths.
6-2,3.1.3 Incandescent Sources
Actual snli'l radiators are rut “black” and
their total emission is less than that of a blaek-
6-12
АМСР 706-185
EFFICIENCY, %
Figure 6-5. Isothermal Efficiencies. Fraction of Energy
Emitted by an Isothe'mal Radiator in Various Wavelength
Bands as a Function of Temperature
body. hi addition, their emissivity varies with the
wavelength and actual radiators are not gray-
bodies. The radiation is thermal if Kirchoff’s Law
applies, and the ratio of emissive to absorptive
flowers is a constant for each wavelength and tem-
perature. Application of this law distinguishes
between incandescence oY thermal radiation, and
luminescence or radiation excited by other
methods.23
While there are materials, such as carbon,
whose emissivity is nearly constant with wave-
length, the emissivity of certain other materials
is strongly wavelength-dependent. If the emis-
sivity is high in the visible region and relatively
low in other spectral regions (especia'ly infrared),
a larger portion of the total radiation will be in
the visible and the heat-to-light conversion effi-
ciency is improved. As an example, Welsbaeh
mantles, whieh are impregnated with thorium and
Figure 6-6. "Optical" Temperatures of a Tungsten Filament
cerium oxides, have a low emissivity in the infrared.
When heated by a relatively nonluminous flame,
a larger proportion of energy is radiated in the
visible region. The efficiency of a Welsbaeh
mantle as a light source is also due, in part, to
the catalytic activity of the oxides so that the
chemical reaction is faster and, therefore, the heat
production greater near the mantle.
Temperatures of incandescent sources can be
estimated from their total radiation by use of
Stefan’s Law, according to which the total radia-
tion — 5.67 X 10~6 T4 ergs per second per square
centimeter. Tempei attires determined in this way
are called radiation temperatures. If temperatures
are estimated from the visible brightness at a par-
ticular wavelength, they are called brightness tem-
peratures. If temperatures pre estimated on the
basis of the best fit of their emission curve to a
blackbody in the visible region, they are culled
color temperatures. While it is possible that tem-
peratures determined by these methods may differ
widely, in extreme cases, from the true tempera-
ture, the difference is usually les? than a hundred
degrees for incandescent solids sueh as furnaces
and lamp filaments (Figure 6-6).
6 2.3.2 Luminescence
Luminescence results when a process leads
directly to an atom or molecule in an excited state,
from whieh it can return to a lower energy state
6-13
АМСР 706-185
a particular light source is not an easy task. Theo-
retically, this can be accomplished for the Y value
by multiplying the ordinate of the Y curve in
Figure 8-10 at each wavelength by the radiant
flux of the light source at the wavelength and sum-
ming over the visible spectrum. The Y and Z
values may be found by a like process and the
chromaticity coordinates x, у and z can be cal-
culated. In practice, it is difficult to match ex-
actly the I.C.L tristimulus curves; however, sev-
eral methods have been suggested31 which give
fairly good res ilts. The more widely used methods
in corp 'rate barrier layer photocells and correction
filters.
6-2.5.4 Munsell Color System31
The Munsell color system specifies a surface
color by giving, for usual viewing conditions, its
position on a more or less arbitrary hue (Munsell
hue), lightness (Munsell value), and saturation
^Munsell chroma) scales having nearly percep-
iu.il’y uniform steps. The Munsell value varies
from zero for an ideal black surface having a
buninous reflectance equal to zero, to ten for an
ideal white diffusing surface having a luminous
reflectance equal to one. Munsell chroma is ex-
presned in arbitrary units intended to be percep-
tual!/ of the san e size regardless of value and hue.
The strongest known pigment colors have chromas
of about 16 neutral grays; black and white have a
zero chroma value. Munsell hue is expressed on a
scale intended to divide the hue circle (red, yellow,
green, blue, purple, and black to red) into 100
perceptually equal steps.
The pocket edition of the Munsell Book of Color
has been widely used as a color standard. It con-
sists of forty constant hue charts where all color
samples making up a chart have the same hue. The
color samples making up the chart are arranged in
rows and columns, the rows being chroma at con-
stant Munsell value and the columns being value
scales at constant Munsell chroma. Comparison
of an unknown color with these two families of
scales gives, by interpolation, the Munsell value
and Munsell chroma of the unknown color. Inter-
polation between the constant hue charts gives the
Munsell hue.
6-2.5.5 Color Value
A commonly used designation for describing the
color of a pyrotechnic composition is the color
value. This is defined as the ratio of the apparent
light intensity (through specific filters) to the total
(or unflltered) intensity. This is usually accom-
plished through the use of two photocells, cue of
which is equipped with a glass filter. The ratio
obtained is a measure of the visual depth of color
of the flame.
6-2.6 ATMOSPHERIC EFFECTS
Absorption and scattering can change the en-
ergy distribution of light passing through the at-
mosphere. While the absorption in parts of the
ultraviolet and infrared regions may be very
large, the more important effects in the visible
region are due to scattering. A light beam passing
through a length x of the atmosphere is attenuated
from the initial flux Fo, to a flux F, by an amount
which depends mainly on the scattering coefficient
t;, even though individual layers may absorb light.
F = Foe~ax (6-13)
For particles whose radii are less than approxi-
mately y10 the wavelength of the light X, the
scattering coefficient a can be approximated by:
a = AX4 (6-14)
where A is effectively a constant. The theory for
spherical particles comparable in size to the wave-
length of light results in extremely complicated ex-
pressions for the scattering coefficient.
As discussed in greater detail in Paragraph
7-2.1.1, smaller droplets preferentially scatter the
shorter wavelengths so that the color of the trans-
mitted light will shift toward the red. The pref-
erential scattering of the shorter wavelengths de-
creases with increasing particle size until the
particle radii become slightly greater than that
corresponding to the maximum for red light. At
this time the transmitted light appears blue or
green. There is little preferential scattering for
particles whose radii are greater than one to two
microns. Little or no variation in transmission
with wavelength is observed for fogs or thin clouds
because their drop size distribution is broad. If
the scattering particles are polydispersed, but
6-14
AMCP 706-185, Cl
by the emission of radiation. Und;r these circumstances,
the radiation produced at certain wavelengths may be
much greater than the amount expected due to thermal
radiaiion. Broadly speaking, luminescence refers to the
errussion of light for : ny reuson other than high
temperature.
6-2.3.2.1 Chemiluminescence
If the excited atom or molecule :s formed dtt ictly as
the result of a chemical reaction, the phenomenon is
known as chemiluminescence. The emission of
formaldehyde bands from the “coo! flames” of ether
aldehy des and certain hydrocarbons, at temperatures
between 200° and 400°C, are due to
chemiluminescence. Radiaflon from >he reaction zone of
a Bunsen burner, the inner cone, is stronger than can be
accounted for thermally, and is due to
chemiluminescence. The amount of radiation produced
by a pyrotechnic flame which is due to
chemiluminescence is difficult to determine and, under
certain ciicumstances, the amount may be significant.
6-2.3.2.2 Phosphorescence and Fluorescence
Certain substances, including the sulfides of calcium
and haiiiuii. when exposed to radiation, will continue to
glow after the radiation source is removed. This
pin. iKunenon is known as phosphorescence. In other
mid dials, the glow persists only for a fraction of a
second. In the latter case, the phenomenon is known as
fluorescence. In general, the radiation emitted by a
phosphorescent ot fluorescent material is of a longer
wavelength titan the exciting iadiotion. In all these cases,
absorption of the exciting ladiation causes the formation
of an esuited molecule or atom. The longer wavelength
of the emitted light is attributed to the -eturn of the
excited panicle to the original nonexcited state in two
or more steps, rather than by a single transition.
6-2.3.3 Flame Sources2^76
Die chief distinction between combustion and other
chemical reactions is the appearan.ee of flame and the
emission of ligirt. Most flames produce an emission
spectra of discrete bands which may, especially for
luminous flames containing solid particles, be
superimposed on a continuous background.
The radiation from any system in complete
thermodynamic equilibrium will be continuous and =he
same as a blackbody at that temperature;however, flame
systems do not fit in this category due to their
nonequilibrium nature. In most small flames, the
emission of radiation by the emitting molecules and
particles is not balanced by the absorption of radiaiion
resulting in a steady deactivation of excited molecules
and radiation cooling of solid particles. This energy loss
must be made up by collision processes in the flame and,
if not efficient enough, the distribution of enirgy
between the exceed molecules or solid particles may
differ from equilibrium conditions, in addition, chemical
equilibrium may not be ob'ained.
The small particles that are formed in many flames,
including most pyrotechnic flames, definitely influence
the radiation produced by these flames. The continuous
background is emphasized and, in many cases, most of
the radiation produced is continuous. This continuum
produced by particles in a flame differs from that
produced by a graybody or blackbody because:
(1) The emissivity of the material which makes up
the panicles varies with the wavelength.
(2) The scattering of light by the particles changes
with wavelength even if the material making up the
particle is black or gray.
While most cf the radiation produced by flames is
therrr.il in origin, some of the radiation is due to
chemiluminescence where the amount of light emission
is much greater than that expected from aiennal
emission. For premixed flames of the ‘Bunsen” type,
the emission from intercanal gases is thermal in origin.
For the reaction zone (the inner cone) there more
radiation than can be accounted for thermally.
The characteristics of the radiation produced by all
flames, whether they contain small particles or not, will
change as the flame size increases. Self-absorption
becomes more important and the radiation will approach
more nearly that of a blackbody.
6t2.4 PHOTOMETRY
Photometry is the science of measuring light. Since
the eye is very sensitive and nonlinear in its response to
radiation, an arbitrary unit, the lumen, is used to
evaluate radiant electromagnetic flux in
6-14 -
i
АМСР 706-185
terms of its visual effect. The lumen has the
same dimensions as power. It has been found by
experiment that, for the so-called normal observer,
one lumen is equivalent to 0.00161 watt of mono-
chromatic green light of a wavelength correspond-
ing to the maximum in the visibility curve, 555
millimicrons. The number of lumens produced
by one watt of radiant power is called the luminous
efficiency of the source. For a monochromatic
source, the luminous efficiency is obtained by mul-
tiplying the relative visibility for the wavelength in
question by 680 lumens/watt.2,1
6-2.4.1 Instruments for Measuring Light Intensity
Instruments: used for the measurement of light
intensity can be divided into two general cate-
gories: (1) those whieh use the heating effect of
the radiation, and (2) those which make use of
quantum effects of the radiation.
In the first category, the radiation absorbed by
the receiver raises its temperature whieh is sensed
by some appropriate means. The thermocouple
uses Hie thermoelectric effect while the bolometer
uses the change in resistance of a resistance ele-
ment, which may be a semiconductor, to sense this
temperature rise. Generally, both of these de-
tectors are spectrally nonselective in their response
to radiation, i.e., they absorb like graybodies. In
another type of thermal detector, whicii may be
selective in its response, tl i radiation is absorbed
by a gas. The temperature change produced in the
gas, whieh is confined to a very small volume, is
sensed as a pressure rise.
The second category of detectors are the photo-
detectors which, in principle, count the number of
quanta of radiation. An example of a common
detector in rhe second category is the photocell
whieh is a photoemissive detector. It depends for
its operation cn the ejection of electrons from a
specially prepared surface by the incident quanta
of radiation. In a vacuum photocell the response
to incident radiation is a linear function of the
light intensity. The electrons emitted are drawn
to the anode from die sensitized cathode by a rela-
tive)}’ .small voltage applied to the electrodes. Gas-
filled photocells are nonlinear in their response
to incident light intensity, but are more sensitive
than the vacuum type because ionization of the gas
by collision cun be utilized to increase the number
of electrons reaching the anode for a given amount
of incident light. Still more sensitive photocells,
known as photomultipliers, use the phenomenon of
secondary electron emission to produce an internal
amplification of the order of one million. In all
cases, the response of the photoeathode surface is
spectrally selective and is determined by the basic
material and its preparation. Another type of
light-sensitive cells is the photocooductive cell, in
which the action of light causes an increase in the
electrical conductivity of the device. The selenium
cell is an example. A third type of detection uti-
lizes the photovoltaic effect in whieh a voltage is
produced across the interface separating a semi-
conductor from a conductor by light incident on
the interface. A common example of this type of
detector is the copper-cuprous oxide cell. All of
these detectors—photoemissive, photoconducffve, or
photovoltaic—have a selective spectral response, as
do photochemical reactions, including photography.
The spectral response of photochemical reactions is
selective because only the light whieh is absorbed
will produce a photochemical effect. Actiometers
use photochemical reactions in which the quantum
yield, whieh is equal to the number of induced re-
actions divided by che number of quanta absorbed,
has been accurately determined.
6-2.4,2 Measurement of the Light Output of Flares
Flare output measurements are usually made
in a photometric tunnel. This tunnel is a light-
tight structure wifh a fan to remove smoke and
with instruments to measure tLe brightness, color,
and burning time of a flare. The inside of the
tunnel is usually flat blaek and baffled to eliminate
reflections. The tunnel is usually built in three
parts: a burning room, whieh contains the burning
table, ignition apparatus, and exhaust fan: a long
tube section from 50 to 100 feet long which houses
the photometric transducers; and an instrument
room, which houses the recording instruments and
provides a place for the personnel to work. More
complete measurement eapabiliry for a tunnel
would include the ability to determine the visible
spectral output of flares, ultraviolet and infrared
outputs, and flam? temperatures. The tunnel must
have calibrating lights and color filters for ealibra-
6-15
АМСР 706-185
tion of the instruments. Luminous intensity mea-
surements in terms of candlepower are often de-
termined by an instrument which consists of a
harrier layer photocell, filters, and a microammeter.
This illuminometer is placed at an accurately
known distance from the point at which the candle
or assembly is to be burned and is then calibrated
by means of a, standard incandescent white light
source. During the, burning of the item, illumi-
nometer readings are taken at predetermined time
intervals throughout the burning period and the
average of these readings is calculated. In many
cases the output of the detector is displayed on a
graphic recorder. In this case, the output of the
photocell is fed into the recorder which has been
calibrated so that the anticipated light output will
produce a nearly full scale reading. A graphic
record is superior to readings taken with an illumi-
nometer because all variations during burnings are
recorded and thus are available for future study.
The area under the curve thus obtained represents
the candleeecond value of the tested item. An Inte-
gra io”, which gives the candlesecond value of the
composition directly, is coupled with the photo-
cell, thus avoiding the time consuming and less
accurate method of estimating or planimetering
the graphic record.
The state of the science in photometry is not
yet precise, and measurement errors within ± 10%
on flares are as good as can now be attained. Speci-
fication MIL-C-18762 covers general requirements
although later refinements have been made at each
military installation. Representative facilities for
these measurements are to be found at Picatinny
Arcchai, Dover, New Jersey; Naval Ammunition
Pe(-ot, Crane, Indiana; Naval Ordnance Test Sta-
tion, China Lake, California; and Naval Ord-
nance Laboratory, White Oak, Silver Spring,
Maryland.
6-2.4.3 Intensity
Tie intensity of a point source, in any direc-
tion, is defined as the light flux in lumens per unit
solid angle (per steradian) in that direction, or
dr
(6-10)
«ы
where I is the intensity in candela and dF is the
lumens of flux within a small solid angle of dw
steradians. A unit point source, emitting light uni-
formly in all directions, radiates 4тг lumens. The
unit of luminous intensity—adopted by the Inter-
national Commission on Illumination in 1948—is
the candela. It is of such a magnitude that a black-
body radiator at the temperature at which pure
platinum solidifies has a luminance of 60 candela
per square centimeter.30 An earlier unit of lumi-
nous intensity, the candle, is equal to 1.02 candela.
Another unit, candlepower, also has been widely
used to express the luminous intensity of a light
source. While the use of these units should be
discouraged, they have been widely used by many
pyrotechnic investigators. Therefore, the terms
candela (preferred), candle, and candlepower will
be used interchangeably in this handbook.
6-2.4.4 Brightness
The concept of brightness is required because
most sources are not points and the concept of in-
tensity is not readily applicable to extended
sources. The brightness of an extended source is
expressed in candela per square centimeter of
emitting surface.
6-2.4.S Illumination
The illumination of a surface is the amount of
light flux (lumens) incident upon a unit area of
surface. An illumination of a lumen per square
foot is called a foot-candela. The illumination E
of a spherical surface of radius r, enveloping a
point source of intensity I, is given by:
я=4=-^=4- ‘т™ («и
A w- r11 unit area
for a plane surface at a distance x from a point
source of intensity I:
E = -~ cos 6 (6-12)
where 6 is the angle between the source vector and
th? normal to the surface.
6-2.4.6 Photometric Units
The units employed in photometry are a con-
tinuing source of difficulty, especially for the
novice. A strong effort is being made to secure
greater uniformity, reduce the number, and pro-
6-16
АМСР 706-185
TABLE 6-1
CONVERSION FACTORS FOR PHOTOMETRIC UNITS
Physical Radiator-source of Radiant Energy Phycho Physical Luminator-sourcc of Luminous Energy
Radiometry Symbol mks units Photometry Symbol mks units
Radiant Luminous
energy joule energy Q talbot
density joule/m3 density q talbot/m3
flux watt flux F lumen
emittance W watt/m2 emittance L lumen/m2
intensity watt/sterad intensity i lumen/sterad
radiance N watt/sterad-cm2 radiance в lumen/sterad-m2
irradiance H watt/m2 illuminance E lumen/m2
Spectral I/uminous
reflectance reflectance Г
Spectral Luminous
transmittance transmittance t
Illumination
1 lumen/ft2 = 1 foot-candle = 10.764 lumen/meter2 — 10.764 lux
1 lumen/meter2 = 1 meter-candle = 1 lux — 10—4 phot
Brightness
1 foot-lambert = 1 equivalent foot-candle
1 lambert = 3183 candle meter-2 = 296 candle ft-2 = 2.054 candle inch-2
Exposure
1 meter-candle-second = 1 lumen-second meter-2
vide more logic m photometric units.7 8 Some of
the more common photometric units are sum-
marized in Table 6-1. The units of photometry are
often applied, incorrectly, to measurements of in-
frared or ultraviolet radiation, or to describe the
sensitivity of photographic emulsions to radiation.
Such usage should be avoided and radiometric
units used for these spectral regions.
6-2.5 COLOR3132
In a physical sense, color is determined by the
wavelength (s) or spectral energy distribution con-
tained in a light beam. Physiologically, color is the
sensation produced as the result of the excitation
of the retina of the eye by these waves. Colors
are compared in terms of hue, saturation or purity,
and brightness; ail of which influence the color
sensation produced. Hue refers to the color, i.e.,
red, green, or blue. Not all hues are observed in
the spectrum of sunlight. The purples are notably
absent. The sensation is a measure of the con-
tent of white light; only monochromatic colors are
completely saturated. Brightness or lightness is a
measure of the amount of light being emitted or
reflected from the colored light sources oi colored
object. Brightness applies to luminou! sources
while the term lightness refers to color seen be-
cause of reflected light. These three aspects of
color can be represented on a color solid (Figure
6-7) where hue changes around the circle, light-
ness increases upward, and saturation increases
outward from the axis.
6-2.5.1 Additive Color
In principle, it is possible to produce any hue
by a suitable combination of three primary colors,
one from the middle of the visible spectrum, green,
and one from either end, blue-violet and red. As
indicated by the additive color circles in Figure
G-8, proper proportions of red and green light will
produce yellow. If the proper amount of blue-
purple light is added, white light is produced.
6-17
AMCP 706-185
Figure 6-7. Dimensions of the Psychological Color Solid
Colors such as yellow and blue-purple, that pro-
duce white light when added together, are called
complementary colors. The complementary color
for red is a blue-green (cyan), for green is a red-
purple (magenta), and for blue-purple is, as indi-
cated earlier, yellow.7
6-2.5.2 Subtractive Color
The light incident on a nonluminous object may
be partly reflected, partly absorbed, and partly
transmitted. If the incident light is white, the
transmitted light will be the color which is com-
plementary to the color which is selectively ab-
sorbed. For example, the light transmitted will be
red if blue-green is selectively absorbed. Opaque
bodies, which are seen because light is diffusely
reflected from them, also appear colored because of
selective absorption of light which penetrates a
short distance beneath the surface before it is re-
flected.
6-2.53 Chromaticity Coordinates
The tridimensional color stimulus required by
the eye has been studied in detail and has led to a
precise method for expressing a particular light
Figure 6-8. Additive Mixture of Primary Colors
type. It was found that only the mutual ratios
of three primary colors are of importance in de-
termining the “color according to the eye” of a
given light type. These ratios may be described by
expressing each primary as a part of the total
impression of the light type obtained by the eye.
Thus, for red, green, and blue, respectively, the
ratios are:
r g . b
r + g + Ь ’ r + g + b ’ r-f-p + b
which necessarily total one, and, as a result, only
two need be designated to determine the light
type. A particular color or dor point, therefore,
may be displayed on an x-y plane, and, due to the
mutuality of the components, will fall within an
area bounded by a 45-degree triangle. However,
the actual area containing color points varies with
the particular set of color sensitivities used to
determine the color points of the various light
types. Each set produces a “color triangle” with
its own shape.
In order to effect a standardization, the Inter-
national Commission on Illumination (I.C.I.),* in
1931, recommended that all subsequent color data
* Now known as C.I.E., Commission Internationale de
1 ’Eclairage.
6-18
АМСР 706-185
Figure 6-9- Tristimulus Values of the Spectrum Colors
According to the 1931 l.C.I. Standard Observer
be expressed in terms of the same tristimulus sys-
tem so that the results would be immediately com-
parable. The Standard Colorimetric Coordinate
System (X, Y, Z color triangle) was introduced
which is based on the color sensitivity curves shown
in Figure 6-9. These curves are the result of color
eompa’’ison tests conducted on many observers and
compiled to produce those for the “standard ob-
server.’’ The primary colors were selected so as to
produce no tristimulus value less than zero (avoid-
ing the use of negative values in computations).
Further, the curve for the F-factor is identified
with the eye-sensitivity curve for light, which forms
the basis of photometry. The values of X, 1, Z are
the amounts of the three l.C.I. primaries required
to color match a unit amount of energy Having
the indicated wavelength. The chromaticity co-
ordinates for each wavelength are obtained from
the values of X, Y, and Z by means of the ratios:
x —
X | У z
X + У + Z\ 7 ’ x + У + Z ’ x + У -I- z
Figure 6-10. C.I.E. Chromaticity Diagram
Since, as indicated earlier, only two coordinates
are required to describe the light type, the values
of X and F are plotted on a chromaticity diagram
(Figure 6-10) and form a loei of monochromatic
spectrum colors. The line drawn between 380
millimicrons and 700 millimicrons forming the
“base” of the triangle is called the “purple line”
along which no perceptible colors exist. The
center of the triangle (C) is the equal energy or
“white point” and has been designated by the
l.C.I. (or C.I.E.; used interchangeably) as the
light produced by “Illuminant C” which corre-
sponds very closely to average daylight. Comple-
mentary colors will fall on a straight line passing
through Illuminant C. Also, any color can be con-
sidered as a mixture of Illuminant C and spec-
trum light having a wavelength given by the in-
tersection of a straight line through Illuminant
C and the given color G, with the Chromaticity
Curve I) (Figure 6-10). This wavelength D is
called the dominant wavelength In addition, a
mixture of two color points anywhere on the
diagram will produce a eolor which is located on a
line between the two initial colors. Other useful
aspects of the Chromaticity Diagram can be found
in the references?2
The assignment of chromaticity coordinates to
6-19
AMCP 706-185
a particular light source is not an easy task. Theo-
retically, this can be accomplished for the Y value
by multiplying the ordinate of the Y curve in
Figure 6-10 at each wavelength by the radiant
flux of the light source at the wavelength and sum-
ming over the visible spectrum. The X and Z
vaines may be found by a like process and the
chromaticity coordinates x, у and z can be cal-
culated. In practice, it is difficult to match ex-
actly the I.C.I. tristimulus curves; however, sev-
eral methods have been suggested81 which give
fairly good results. The more widely used methods
incorporate barrier layer photocells and correction
filters.
6-2.5.4 Munsell Color System31
The Munsell color system specifies a surface
color by giving, for usual viewing conditions, its
position on a more or less arbitrary hue (Munsell
hue), lightness (Munsell value), and saturation
(Munsell chroma) scales having nearly percep-
tually uniform steps. The Munsell value varies
from zero for an ideal black surface having a
luminous reflectance equal to zero, to ten for an
ideal white diffusing surface having a luminous
reflectance equal to one. Munsell chroma is ex-
pressed in arbitrary units intended to be percep-
tually of the same size regardless of value and hue.
The strongest known pigment colors have chromas
of about 16 neutral grays; black and white have a
zero chroma value. Munsell hue is expressed on a
scale intended to divide the hue circle (red, yellow,
green, blue, purple, and black to red) into 100
perceptually equal steps.
The poeket edition of the Munsell Book of Color
has been widely used as a color standard. It con-
sists of fortj constant hue charts where all color
samples making up a chart have the same hue. The
color samples making up the chart are arranged in
rows and columns, the rows being chroma a' con-
stant Munsell value and the columns being value
scales at constant Munsell chroma. Comparison
of an unknown color with these two families of
scales gives, by inter] olation, the Mansell value
and Munsell chroma of the unknown color. Inter-
polation between the constant hue charts gives the
Munsell hue.
6-2,5.5 Color Value
A commonly used designation for describing the
color of a pyrotechnic composition is the color
value. This is defined as the ratio of the apparent
light intensity (through specific Alters) to the total
(or unfiltered) intensity. This is usually accom-
plished through the use of two photocells, one of
which is equipped with a glass filter. The ratio
obtained is a measure of the visual depth of color
of the flame.
6-2.6 ATMOSPHERIC EFFECTS
Absorption and scattering can change the en-
ergy distribution of light passing through the at-
mosphere. While the absorption in parts of the
ultraviolet and infrared regions may be very
large, the more important effects in the visible
region are due to scattering. A light beam passing
through a length x of the atmosphere is attenuated
from the initial flux Fo, to a flux F, by an amount
which depends mainly on the scattering coefficient
a, even though individual layers may absorb light.
F = Foe~°x (6-13)
For particles whose radii are less than approxi-
mately ]4o the wavelength of the light the
scattering coefficient a can be approximated by:
a = 4X4 (6-14)
where A is effectively a constant. The theory for
spherical particles comparable in size to the wave-
length of light results in extremely complicated ex-
pressions for the scattering coefficient.
As discussed in greater detail in Paragraph
7-2.1.1, smaller droplets preferentially scatter the
shorter wavelengths so that the color of the trans-
mitted light will shift toward the red. The pref-
erential scattering of the shorter wavelengths de
'•reases with increasing particle size until the
particle radii become s’ightly greater than that
corresponding to the maximum for red light. At
this time the transmitted light appears blue or
green. There is little preferential scattering for
purtielis whose radii are greater than one to two
microns. Little or no variation in transmission
with wavelength is observed for fogs or thin clouds
because their drop size distribution is broad. If
the scattering particles are polydispersed, but
6-20
АМСР 706-185
smaller than optimum size, the transmitted light
will be more red than the incident light, account-
ing for the deep red of the transmitted light from
the setting sun,
6-3 CONSOLIDATED ILLUMINATING
DEVICES
A consolidated ’lluminating composition is
formed by mechanically pressing, extruding, or
casting finely divided illuminating composition
into some solid shape which often has a candle-like
form. When such an item burns in a propagative
fashion, the flame radiates energy in the ultraviolet,
visible, and infrared region of the spectrum. In
most cases, less than 10 percent of the radiant
energy is in the visible region. The distribution
and relative intensity characteristics of the radia-
tion produced, in any given region of the spee-
ti um, are determined basically by the products of
the burning reaction which emit in that region and
the temperature reached by the emitting species.
Light-producing pyrotechnic devices are char-
acterized for military purposes by luminous in-
tensity, color value (hue and saturation) of the
flame, and burning rate. Sensitivity of the com-
position to impact, static electricity, and friction
should be a minimum for safety. The ignition tem-
perature, ignitibility, stability, and hygroscopicity
are important in determuiing the certainty of
functioning.
6-3.1 ILLUMINATING FLARES
An illuminating flare produces a single source
of illumination which is generally of high candle
power and substantial duration. Flares may be
parachute-supported, towed, or stationary. While
their primary function is illumination, they may be
used for identification, ignition, location of posi-
tion, or warning.
In general, a pyrotechnic illuminating flare
should:33 (1) produce essentially white light, (2)
have an intensity in foot candles adequate to pro-
duce a brightness level from 0.1 to 1.0 foot-lambert
on areas or 'urgets v>ith minimum reflectivity, and
(3) burn at peak intensity for a minimum of thirty
seconds and, preferably, in excess of one ininure.
(These values are desirable; however, where neces-
sary, lower levels may be adequate. Illumination
TABLE 6-2
CANDLEPOWER REQUIREMENTS VERSUS
HEIGHT OF ILLUMINATING SOURCE
Ground Brightness,
Height Above Ground 0.1 1.0
100 ft 1.000* 10,000*
500 ft 25,000 250,000
1000 ft 100,000 1,000,000
* Candlepower requirements necessary to provide speci-
fied illumination (0.1 and 1.0 fl) on the ground from given
heights above the ground.
above 1.0 foot lambert will generally require an
unreasonable amount of illuminant.) Although it
is often difficult to produce, white light provides
the best illumination for the greatest range of pos-
sible conditions in the field. Since illuminating
flares am used under field conditions where the
location and recognition of unfamiliar objects are
important, sufficient duration and intensity are
required to complete the visual observation and to
distinguish objects in the field from their back-
ground. Candlepower requirements necessary for
adequate illumination, 0.1 to 1.0 foot-lambert, fl,
when the flare is suspended above the ground, are
given in Table 6-2.33
A diagram of a parachute suspended flare is
shown in Figure 6 11 indicating the manner in
which ground illumination E may be approximated
from values of Л, the height of the source; r, the
radius of the desired illumination; and I, the
intensity of the source*. Intensity curves for
various heights to produce a minimum value for
E of .025 foot-candle are shown in Figure 6-12.
6-3.1.1 Aircraft Flares
Flares for aircraft provide illumination for
reconnaissance, observation, bombardment, land-
ing. and also targets for practice firing of anti-
aircraft guns. While details of flares vary with
their purpose, flares for illumination have cer-
tain characteristics in common in that they all
produce high-intensity white or colored light for
an appreciable length of time. Most aircraft flares
are parachute-supported to retard their speed of
fall and thus provide illumination over a given
6-21
АМСР 706-185
TABLE 6-3
CHARACTERISTICS OF VARIOUS ILLUMINATING FLARES
Item Method of actuation Time lapse from actuation to full function, sec Burning time, sec Candle- power, 10’ Fall, fps Max L, in. Max dia, in. Weight, lb Max speed of airplane at time of release, mph
FLARE, AIRCRAFT: guide, 1 min T6E1 (white) T7E1 (red) T8E1 (green) Electricity 6 to 7 45 to 60 650 700 90 5.4 5.46
FLARE, AIRCRAFT: parachute M8A1 (w/o suspension bands) (emergency night landing) M8A1 (training) (w/o suspension bands) Release from airplane 3.0 to 5.0 165 to 195 350 8.0 25.42 4.25 17.6 200
M9A1 Fired from PIS- TOL, pyro- technic, AN-M8 2.5 60 to 70 60 7.0 15.05 2.0 2.11 200
M26A1 (AN-M26) or M26 M26A1 (AN-M26) or M26 (w/blue band) Released from airplane 5 to 92 195 ±15 800 575 11.6 50.0 (fuzed) 8.0 52.5 150 (M26) 350 (M26A1)
M138 (T10E4) M139 (T10E6) 5 to 92 360 180 1,500 3,000 10 45.6 6.25 62 440
Mk 5 and Mods variable 180 600 27.0 4.75 18.0
Mk 6 Mod 5 Mk 6 Mod 6 AN-Mk 8 Mod 1 AN-Mk 8 Mod 2 variable 90 120 180 180 1,000 500 8.0 35.75 25.12 5.37 4.75 30.0 18 250
3 minute, electrically operated 3 minute, Wiley SA 8 1И 180 200 9.1 28 4.5 22
FLARE, AIRCRAFT: tow-target, M50 0 360 65 22.8 2.62 7.13 120
FLARE, AIRCRAFT: towed Red, M77 (T18- Amber, M78 (T19) Green, M79 (T20) Tow cable attached to air- plane 0 360 ±30 225 70 90 23.34 4.55 21 200
FLARE, SURFACE: Airport, M76 ’Hand or electric squib 0 100 to 420 500 to 850 31.33 4.26 27.6
Parachute, trip, M48 Pressure or trip wire 3 20 110 3 9.75 5.5 5.0
Trip, M49 Trip wire 0 55 40 6.75 3.0 1.5
area for a greater time interval. Aircraft flares
also have some form of delayed ignition so that
they will clear the aircraft and function at a de-
sired altitude below it. Certain flares designed
for use below the aircraft, sueh as those intended
for bombing purposes, are provided with shades
to shield air-crew members from glare. Data for
several aircraft flares are presented in Table 6-3.
A lypical aircraft parachute flare for night bom-
bardment is shown in Figure 6-13, and its opera-
6-22
AMCP 706-185
Figure 6-11. Illumination Diagram for Parachute
Suspended Flare
tion is shown diagrammatically in Figure 6-14. A
typical tow-target flare is illustrated in Figure
6-15.
6-3.1.2 Surface Flares
Flame-type surface flares are used for illumi-
nation during airplane landings in case of power
failure at airports, or to outline boundaries of
emergency landing fields. Mine- or grenade-type
surface flares are used to illuminate targets and
objectives, to aid in detection of inh'tration or
surprise attacks by enemy troops, and for recog-
nition and signaling purposes. Data on several of
these flares are presented in Table 6-3. A surface
flare which is primarily used to give warning of
infiltration by enemy troops is shown in Figure
6-16.
6-3.2 ILLUMINATION SIGNALS
Light-producing signals are much smaller and
faster burning than flares and may consist of a
single parachute-supported star or from one to
five freely falling stars, with or without colored
tracers. To be effective, any signal must be recog-
nized in addition to being detected. Characteris-
tics of illuminating signals which are important
in determining their effectiveness include intensity,
duration, and the hue and saturation of the color.88
Illumination signals are used during the day
as well as night. The brightness of the daylight
sky requires a signal of increased intensity to pro-
vide adequate contrast. Depending on the location
of the signal relative to the clouds and sun, and tjrh
brightness of the sky; the intensity of a signal
adequate for night use must be increased by a
factor of ten (twilight) to over 100,000 (bright
daylight). Relatively little is known concerning
the effects of flame duration on the detection and
recognition of pyrotechnic illuminating signals.
However, the burning time should be of sufficient
duration that, the signal can be detected, and the
color should be of sufficient saturation so as to be
recognized in a relatively short period of time.
Since color differences are often the basis for
communication by signal flares, the relative ef-
fectiveness of the various color hues and their
saturation is important. Since, a signal used
during daylight must often be observed against
a sky (blue) background, red signals, even though
requiring slightly more intensity at night, are most
visible and most easily recognized in general
usage.33 Of the other methods, such as multiplicity,
differen* shapes, sizes, patterns, or flashing of the
signal—which could be used for communications
—only multiplicity appears to be flexible enough
for normal combat use.
6-3.2.1 Aircraft Illumination Signals
Aircraft signals used directly in connection
with combat operations were originally intended
Гог signaling from air to air or air to surface.
Since the introduction of the pyrotechnic pistol
and band pyrotechnic projector, aircraft signals
have also been used by ground troops for ground-
to-ground and ground-to-air signaling. The sig-
nals are generally of one piece, runmed ease con-
struction with a steel elosing cap. Aircraft sig-
nals ar, fired front the pyrotechnic pistol or hand
pyrotechnic projector.
8-23
АМСР 706-185
Figure 6- . Intansit,- Curves for Various Parachute Flare Heights
Single-star aircraft signals, u>nb’,-sta.' signals,
and tracer double-star signals contain red, green,
. • yellow light-producing candies of pyrotechnic
composition. Stars can be distinguished at dis-
tances up to five miles at nigh and two to three
miles in daylight.
Data on aircraft signals i re presented in Table
6-4(A).
6-3.2.2 Ground Illumination Signals
These signals consist of devices which produce
a signal when fired vertic,- ly into the air. The
height of projection is froir G(M) to 700 feet. Data
for some ground ilInmmati. n signals are given in
Table t>-! (B). A typical hand-held device is shown
in Figure 6-17.
6-3.3 TRACERS
Tracer ammunition for both small ifins and
artillery is used for determining range and direct-
ing fire. In some small arms tracers the gilding
metal or steel bullet jacket has, as r.hov n in Figure
6-18, a cavity into which the tracer md its asso-
ciated igniter compositions are loaded and com-
pressed at 80,000 *o 125,000 psi. Armor-piercing
tracer ammunition contains a steel core whieh is
inserted into the bullet jacket, as shown in Figure
6-19. The steel core has a cavity into which the
tracer compositions are loaded. Some artillery
projectiles have a cavity in the base into which
the traeer and igniter compositions are pressed,
as shown n: Figure 6-20, at a pressure of over
100,000 psi. Other artillery projectiles use a sepa-
rately-loaded traeer assembly whieh is fitted into
the base of the projectile its illustrated in Figure
6-21. In some ammunition, the traeer composition
initiates u charge whieh destroys the projectile
after a definite time interval. In specific cases,
this ma he the only function performed by the
eoinpusnion loaded in the tracer cavity.
6-24
AMCP 706-185
This page is reproduced at the
back of the report by a different
reproduction method to provide
better detail.
ARMING WIRE
A Shipping plug
В Shod* retainer support
C Rib retainer
D Stem
E Lower spacer
F Riba
G Shade
H Qulckmutah
I Flare charge
J Relay charge
К Delay element
L Bate black assembly
M Shack absorber assembly
N Shrouds
0 Thrust spacer
P Parachute
Q Releasing cup disk
R Cover releasing cup
S Cover
T Stablllsing sleeve
U Hongwire
V Handle assembly
W Fin stiffener
Figure 6-13. Typical Aircroft Parachute Flore
Since tracer eonipositions are relatively diffi
cult to ignite, a more easily-ignitible ignition com-
position is loaded on top of the tracer composition.
The ignition composition, which usually contains
a binder, along with a thin metal seal, serves to
protect the tracer composition from th? effects of
moisture. If the brilliant light from the igniter
composition dazzles the gunner and betrays the
location of the weapon, a so-called "dim igniter”10
composition may be used.
6-25
АМСР 706-185
A—ARMING WIRE
В—HANGWIRE
C—COVER
D—TEAR WIRE
I—SLEEVE
F—DETACHABLE COVER LOCK
G—COVER RELEASING CUP
H—DETACHABLE COVER
J—PULL-OUT CORD
K—RELEASING CUP DISK
L—THRUST SPACER
M—SHADE RETAINER SUPPORT
N—SAFETY DISK
P—SHOCK ABSORBER
Q—FRICTION WIRES OF IGNITER
R—-LOWER SPACER AND RIB RETAINER
Figure 6-14. Operation of Typical Aircraft Parachute Flare
The pyrotechnic behavior of tracer composi-
tions is similar to ihat exhibited by other con-
solidated compositions and the same characteris-
tics are important. Tracer pyrotechnic composi-
tions should, in general: (1) produce maximum
light output and saturated color for maximum
visibility, (2) burn long enough to permit the
projectile to be followed to the target, and (3)
6-26
AMCP 706-185
A- CA3LE RING
B- PULL COVER
C- SLEEVE
D- SAFETY DISK
E- SHOCK ABSORBERS
F- FRICTION WIRE PULL WIRES
G- RETAINER
H- BASE BLOCK
J- QUICKMATCH
K- ILLUMINANT CHARGE
L- FIRST-FIRE CHARGE
M- PRIMING COMPOSITION
IGNITERS
FIRE CLAY TOP SEAL
FLARE CASE
CLOSING COVER (TOP)
SEALING STRIP
CLOSING COVER (BOTTOM)
N-
P-
Q-
R-
S-
Figure 6-15. Typical Aircraft Tow Target Flare
ignite easily from the igniter composition but re-
sist ignition by any propellant gas which may
penetrate to the tracer composition. Most tracers
are made to produce red light because red light
is the most visible color under daylight conditions;
however, wide use of white tracers had also been
made1 by the Germans and Japanese. At times
there may be requirements for several different
colors to indicate origin of the projectiles.
Smoke tracers (Paragiaph 7-1.3) have been
proposed and developed to provide a more visible
trace in daylight; however, the advantages do not
justify providing two types of ammunition with
different tracers.
6-3.4 TYPICAL COMPOSITIONS
Pyrotechnic illuminating compositions, like
other pyrotechnic compositions, are basically a
mixture of an oxidizing agent and a metal fuel.
Other materials are added to this mixture to
modify the burning rate, color, and radiant out-
put, as well as to increase handling safety. Im-
portant additives include:
<1) Color intensifiers which are mainly highly
chlorinated organic compounds, e.g., hexachloro-
ethane (U2C1«), iiexaehlorobenzene (СяС1в), De-
chlorane (C1(lCli;..). and polyvinylchloride (CH2-
(’II(’l).
(2) Binders which include resins, waxes, elas-
tomers, plasties, and oils.
(3) Waterproofing agents which usually are
resins, waxes, plastics, oils, and diehromating solu-
tions. (They are used as protective coatings on
metals sueh as magnesium to reduce the amount of
reaction with atmospheric moisture.)
(4) Retardants which are usually inorganic
salts, plastics, resins, waxes, and oils. (They are
used to decrease the rate of the reaction between
the fuel and the oxidant so as to obtain the desired
overall burning rate.) Some retardants behave
merely as inert diluents while others participate
in the reaction at much slower rates than the main
constituents.
Typical illuminating, signaling, and tracer
compositions are given in Tables 6-5(A) and
6-5 (B).
6-3.5 FACTORS AFFECTING PERFORMANCE
As indicated in Figure 6-22, three zones are
established when a consolidated illuminating com-
position is ignited and burns propagatively. In
Zone A, essentially the burning surface both exo-
thermal and endothermal reactions take place re-
sulting in the formation of gaseous fuel and oxi-
dizer intermediates. These intermediates react exo-
thennally in the flame zone. Usually, the pyrc-
6-27
АМСР 706-185
TABLE 6-4(А)
CHARACTERISTICS OF VARIOUS AIRCRAFT SIGNAL FLARES
Item 1 Method of actuation I Timo laps from actuation to full function, sec Burning time, sec Candlepower 103 Pill, fps i Max L, in. Max dia in. Weight lb
SIGNAL ILLUMINATION, AIRCRAFT: Double star: Red-red, AN-M37 Red-red, AN-M37A1 Fired from PISTOL, pyrotechnic. AN-M8 5 10 ±3 25 (ea star) Flee 3.85 1.54 1.57 0.35
Red-red,' AN-M37A2 5 1.57
Yellow-yellow, AN-M38 Yellow-yellow, AN-M38A1 Yellcw-.vellcw, AN-M38A2 PROJECTOR, pyrotechnic, hand, M9 12 (ea star) 20 (ea star) 20 (ea star) 1.54 0.42
10±3 Free 3.85 1.57 0.35
5 1.57 0.35
Gre^a-green, AN-MCC Green-green, AN-I.139A1 Green-green, AN-M39A2 1.54 0 35
10±3 20 (ea Rtb ) Free 3.85 1.57 0.39
5 1.57 0.39
Red-yellow, AN-M40 Red-yellow, ANM40AI Red-yellow, AN-M40A2 25 (R star) 12 (Y star) 25 (R star) 20 (Y star) 25 (R star) 20 (Y star) 1.54 0 39
Fired from PISTOL, pyrotechnic, AN-M8 5 10 ±3 Free 3.85 1.57 1.57 0.35 0.35
Red-green, AN-M41 Red-green, AN-M41A1 Red-green, AN-M41A2 25 (R star) 20 (G star) 1 54 0 35
PROJECTOR, pyrotechnic, hand, M9 10±3 Free 3.85 1.57 0.39
5 1.57 0.39
Single star: Red, AN-M43 Red, AN-M43A1 Red, AN-M43A2 1 54
10±3 25 Free 3.85 1.57 0.27
5 1.57
Yellow, AN-M44 Yellow, AN-M44A1 Yellow, AN-M44A2 0 10±3 15 25 Free 3.85 1.54 1.57 0.26
5 25 1.57
Green, AN-M45 Green, AN-M45A1 Green, AN-M45A2 10 + 3 30 25 Free 3.85 1.54 1.57 0.32
5 25 1.57
Tracer, double star: Yellow tracer, red-yellow star, AN-M53 Yellow tracer, red-yellow star, AN-M53A1 Yellow tracer, red-yellow star, AN-M53A2 Green tracer, red-red star, AN-M54 Greer, tracer, red-red star, AN-M54A1 Green tracer, red-red star, AN-M54A2
0 5 T, 2.5 to 4 Star, 3 to 4.5 3 to 4.5 T, 30 R star, 48 Y star, 36 R star, 48 Y star, 36 Free 3.85 1.57 0.40
0 5 5 T, 2.5 to 4 Star, 3 to 4.5 3 to 3 to 4.5 T, 25 Star, ea 48 Star, ea 48 Free 3.85 1.57 0.38
Green tracer, green-red star, AN-M55 Green tracer, green-red star. AN-M55A1 Green tracer, green-red star, AN-M55A2
0 5 T, 2.5 to 4 Star, 3 to 4.5 3 to 4.5 T, 25 G star, 20 R star, 48 G star, 20 R star, 48 Free | 1 3.85 1.57 0.38
6-28
АМСР 70&-18S
TABLE 6-4(А) (cont’d:
Item Method of actuation Time lapse from actuation to fuil function, sec Burning time, tec 1 Candlepower, 103 Fall, ipi Max Lt in. Mai dia, in. 1 Weight, lb
Red tracer, green-green etar, AN-M56 Red tracer, green-green star, AN-M56A1 Red tracer, green-green star, AN-M56A2 Fired from PISTOL, pyrotechnic, AN-M8 or PROJECTOR, pyrotechnic, hand, M9 F-еэ 3.85 1.5/ 0.38
0 5 T, 2.5 to 4 Star, 3 to 4.5 3 to 4.5 T, 30 Star, за 20 Star, ea 2C
Red tracer, red-red star, AN-M57 Red tracer, red-red star, AN-M57A1 Red tracer, red-red star, AN-M57A2 Free 3.85 1.57 0.39
0 6
3 to4.5 Star, ea 48
Red tracer, green-red star, AN-M58 Red tracer, green-red star, AN-M58A1 Red tracer, green-red star, AN-M58A2 ihce 3.85 1.57 0.39
0 5
3 to 4.5 G star, 23 R ata., 48
technic composition is fuel rich and the excess
fuel* reacts with oxygen from the atmosphere.
Some of the energy required to form tl’ose gaseous
intermediates results from the energy rebased in
exothermic reactions on the turning surface (Zone
A) and some from the dame zone. Energy from
Zone A is also transferred to Zone В which may
be considered the pre-ignition zone. D’.rccily below
Zone E is the remainder of the unreacted pyro-
technic coirposition, or Zone C
Figure 6-23 shows a typical isothermal dia-
gram of the temperature distribution of a pyro-
technic flame.8 The temperature is not constant
throughout the flame, the hottest portion occurring
approxii lately two inches above tde burning sur-
face in the middle of the flame.
The flame produced by most pyrotechnic com-
positions is heterogeneous in nature, containing
solid, liquid, and gaseous products of combustion.
As most of the radiation produced is of thermal
origin,8 the distribution of radiation in any spec-
tral region is determined, basically, oy the chemical
nature and physical state of th? products which
emit in that region and the temperature reached
* See example Paragraph 3 2.5.
by these emitting species. The rate at which a
pyrotechnic mixture burns depends on the amount
.Hid rate at which heat is evolved. Sufficient heat
must ’? produced to raise the temperature of the
ingredients tc a point at which an exothermal
reaction will be initiated, and the reaction rate
must be sufficient to more than compensate for heat
losses in order for the composition to burn propa-
gatively. As are common to all combustion pro-
cesses, the rate of burning, the products formed,
and the flame temperature are affected markedly
by the composition of the mixture, as well as by
the physical condition of the materials and the
ambient conditions under which it is burned. Some
of the more important factors which affect the per-
formance of light-producing pyrotechnic items
include; (1) heat of reaction, (2) composition,
(3) emitters, (4) color intensifiers, (5) binders,
(1 ) particle size and distribution, (7) consolida-
tion, (8) flare diameter, (9) ease materials and
coating, (10) temperature and pressure, (11) ro-
tational spin, and (12) moisture. In addition to
the above factors, the igniter or first fire used may
also influence the output of a pyrotechnic device.
Any changes in the pyrotechnic composition, the
6-29
AMCP 706-185
TABLE 6-4(B)
CHARACTERISTICS OF VARIOUS GROUND SIGNAL FLARES
Item Method of actuation Time lapse from actuation to full function, sec Burning time, sec Candlepower, 103 Fall, fps Max Lf in. Max dia lb Weight, in.
SIGNAL, ILLUMINATION, GROUND: White star, cluster, М18л>.1 White star, cluster, M18A2 5.5 4 to 10 18 (for ea of 5 stars) Free 10.14 1.88 1.09
Green star, cluster, M20A1 Green star, cluster, M20A2 Fired from LAUNCHER, grenade, M7 series 5.5 4 to 10 7 (for ea of 5 stars) Free 10.14 1.88 1.09
Amber star, cluster, M22A1 Amber star, cluster, M22A2 5.5 4 to 10 2 (for ea of 5 stars) Free 10.14 1.88 1.06
Red star, cluster, M52A1 Red star, cluster, M52A2 5.5 4 to 10 35 (for ea of 5 stars) Free 10.14 1.88 1.09
Green star, cluster, M125 (T71) Hand-held rocket- propelled launching mechanism 5.0 4 M 8 9 (for ea of 5 stars) 4.5 10.14 1.64 1.3
White star, parachute, M17A1 White star, parachute, M17A2 .Fired from LAUNCHER, grenade, M7 series 5.5 20 to 30 20 7 10.40 1.88 1.04
Green star, parachute, М1ЭА1 Green star, parachute, M19A2 5.5 20 to 30 20 7 10.40 1.88 1.02
Amber star, parachute, M21A1 Amber star, parachute, M21A2 5.5 20 to 30 4 7 10.40 1.88 1.00
Red star, parachute, M51A1 Red star, parachute, M51A2 5.5 20 to 30 20 7 10.40 1.88 1.02
Red etar, parachute, Ml26 (T72) White star, parachute, M127 (T73) Red star, parachute, M131 (T66E1) Hand-heid rocket- propelled type launching mechanism 5.0 50 25 30 1 5 53 10 8 10-15 9.64 9.64 10.0 1.64 1.64 1.63 L 1.3 J.21
igniter, the container, etc.—-which might be caused
by storage conditions—may also markedly affect
the output of light-producing pyrotechnics.
6-3.5.1 Heat of Reaction
One of the important factors in determining
the luminous intensity of a. light-producing pyro-
technic device is the temperature reached by the
emitting species in the flame and produced by the
burning of ihe pyrotechnic mixture. The tempera-
ture reached depends, in turn, on the amount and
rate at which energy is released by the reaction,
in genera1, therefore, the energy released during
combustion should be high and products formed
must be stable at the high temperatures necessary
to produce the luminous intensity required for il-
luminating and signaling purposes.
The heats of reaction for the stoichiometric
reaction between several oxidizers, and aluminum
or magnesium as the fuel, are summarized in Tables
6-6 and 6-7. In genera], for both fuels, the per-
ehlorate oxidizers are the best solid energy pro-
ducers on either a weight or volume basis; how-
ever, some of the nitrates are almost as good.
Physical data and burning characteristics of
stoichiometric mixtures of the alkali and alkaline-
6-30
АМСР 706-185
PRESSURE CAP
PARACHUTE
FELT PAD
FEIT PV>
PROP I Ll 'NG
DELAY FUZF
IL< UMINANT
COMPOUND
LAMINATE D
PAPER CASE
SUSPENSION
CABLE
PULL RING
IGNITER
' PROPELLING CHARGE
This page is reproduced at the
back of the report by a different
reproduction method to provide
better detail.
Figure 6-16. Typical Surface Trip Flare
IGNITION
СИЛRGE
STRIKER
\PERCUSStON
CAP
6-31
АМСР 706-185
елсткм Charge
Figure 6-17. Typical Hand-Held Illuminating Signal
TRACER COMPOSITION
WORLD WAR I WORLD WAR I PRESENT DEV.
Figure 6-18. Small Arms Tracer
earth nitrates anti potassium perchlorate are sum-
marized in Table 6-H(A). The nitrates have been
arranged in accordance with their molecular
weight and the periodic group of the metallic
clement. It is evident from this arrangement that,
in each group, ns the molecular weight of the oxi-
dant increases, the proportion of fuel in the
stoichiometric mixture decreases. Consequently,
the heat of reaction decreases. This is reflected in
a decreasing luminous intensity, Inirnng rate, and
eflieieiicy, (hi this basis, it would appear that the
lower molecular weight oxidants in each group
should be preferred over those of higher molecular
weight. Unfortunately, the lower weight oxidants
tend to be extremely hygroscopic, which complicates
their use in pyrotechnic compositions, and the
shelf-lift' or the stability of mixtures containing
them is markedly reduced in the presence of traces
id’ atmospheric moisture. Greater care is therefore
required in sealing the container and a higher
probability exists for inadequate performance after
long storage.
AMCP 706-185
Figure 6-19. Armor-Piercing Tracer
6-3.5.2 Composition
The luminous intensities of flares containing
binary mixtures of magnesium and the oxidizers
listed in Table 6 8(B), change with increasing
magnesium as shown in Figure 6-24. For a given
oxidizer, the luminous intensity increases with the
amount of magnesium until a maximum is reached
at 70 to 80 percent magnesium. A further increase
in the amount of magnesium results in a reduction
in luminous intensity. The burning rate also is
a maxim uni at 70 to 80 percent magnesium, as is
illustrated in Figure 6-25.
As seen in Example 5, Paragraph 3-2.5, the
amount i f magnesium which will produce the maxi-
mum luminous intensity can be estimated if it is
assume.! that only that amount of magnesium, in
excess of the stoichiometric amount, which can be
vaporized by the stoichiometric reaeti' n will react
with tin* oxygen in the air. It requires about 1.5
kilocalories to vaporize one gram of magnesium;
therefore, the amount of energy released by one
gram of a stoichiometric mixture of magnesium
ami sodium nitrate will vaporize about 1.3 grams
of magnesium. 'Phis corresponds to a mixture con-
taining about 75 percent magnesium.
6-3.5.3 Emitters
As shown in Figure (i-24, the light, intensity at
the optimum magnesium content varies wi’h the
oxidizer used, ranging from about 10,000 candles
per square inch for potassium nitrate to around
800,000 candles per square inch with sodium ni-
trate as the oxidizer. The difference is due to
several factors, one of the more important of
which is the metal in the oxidant. Sodium is a
strong emitter in the visible region while, potas-
sium is not.
The elements used to color pyrotechnic flames
for military uses are strontium, producing red;
barium, producing green; and sodium, producing
yellow. Copper (blue or green) has also been
used.22 Lithium (red), boron (green), thallium
(green), rubidium (red), and cesium (blue), are
also strong color producers, but their use is not
practical because of cost, toxicity, or nature of
their compounds.30
The chromaticity coordinates for a large num-
ber of yellow (sodium containing), green (barium
containing), and red (strontium containing)
flares, when plotted on a chromaticity diagram,
form three straight lines which converge toward a
common point, as shown in Figure 6-26.37
The dominant wavelength for the yellow flares
(indicated by rli.-- intersection cf the straight line
with the perimeter of the chromaticity diagram)
is ar.nnul 590 millimicrons. Results of some yel-
low flares did nut, as indicated in Figure 6-26,
fall on the straight lint1. This is believed to be due
6-33
АМСР 706-185
This page is reproduced at the
back of the report by a different
reproduction method to provide
better detail.
Figure 6-20 Artillery ' ac<
Element in Projectile
to measurement, err as later measurements o =
flares with essentia' > the same composition fel
close to ' strut; ' line. For the w tlare an.’
grei n flare, hot.i i which contain a source 01
filo inc, the doi.i lant wavelengths are approxi-
.;aely (40 n.illi: ;icroii:. and . .proximately 524
oil iniieriuis, ics[, etively. Typie. pectrn ained
lor a ml, yellr >w an 1 green signal Hare arc given
in Figure li-27
Spectroscopic tiidies оипеаГе’" that most of
the light produced I у illumination and sigrud
Hares is due t limited number of mor.atomie,
diatomic, and possibly triatoinic emitters whieh
ean exisi at tin high temperatures in a pyro-
technic flame.:,s Secondary emitters, including
particulate matter, will influence the dominant
wavelength, the colorimetric purity, the saturation,
and the r alive intensity of the light produced.
The c specti oseopie studies indicated that the red
light produced by flares containing strontium and
a source of chlorine is due to the diatomic mole-
rule Srt'l whieh emits strongly near 640 milli-
on-runs. For flares whieh did not contain chlorine,
but proiiin- a red light, it vis concluded that
6-34
АМСР 706485
Figure 6-21. Artillery Tracer
the red light was, most likely, due to strontium
oxide (SrC).
Green flames are produced by the band system
of barium chloride (BaCl) in the 505- to 535-
millimicron region of the spectrum. Most green
flames show, in addition to the band emission from
barium chloride, emission in the orange and red
region, band emission from calcium chloride (CaCl)
and strontium chloride (SrCl) formed from stron-
tium and calcium impurities in the barium. In
addition, there are contributions from an 'xtensxve
barium oxide (BaO) band system (400 to 800
millimicrons).
Other studies indicate that the triatoinie mole-
cule Sr (OH) (strong emission near 640 milli-
microns) may contribute to the production of red
light and that barium hydroxide Ba(OH) (strong
emission from 487 to 527 millimicrons) may con-
tribute to the production of green light. There is
some evidence that part of the radiation from the
emiiter may be due to ehemilinnineseenee.22
Blue flames are normally pj’odueed by the
emission of cuprous chloride (CuCl), much of
which is radiated in the 420- to 460-millimicron
region of the spectrum. The blue-green and green
systems which are also produced are usually much
weaker.
Yellow light is primarily due to the D lines of
sodium and associated continuum. At high sodium
concentrations, there is strong continuous emission
in a region which extends from 500 to 700 milli-
microns.
As shown hi Figure 6-28, which is the spectral
distribution of energy from a green flare,8* the
specific emission, approximately 525 millimicrons,
is superimposed on a continuous background.*0
This results in a less saturated green. An increase
in magnesium content, as shown in Figure 6-29 for
a yellow flare,” results in a decreased saturation
of the colored light produced. The continuous
background may be due, in part, to incandescent
earbon (from binder) as a binary mixture ef mag-
nesium and an oxidizer show somewhat less con-
tinuous background. It is also due, in part, in
6-35
AMCP 706-185
TABLE 6-5
TYPICAL ILLUMINATING, SIGNALING, AND TRACER COMPOSITIONS
FUEL OXIDIZERS Binder
SOURCE COLOR Mag- nesium Alumi- num Misc. Barium Nitrate Sodium Oxalate Sodium Nitrate Stron- tium Nitrate Misc. Oil Linseed /Castor Wax Paraffin Misc.
A A A A C c c c White White White White Yellow Yellow Green Red 26.9 28.5 36 48 52 58 23 40 6.5 4 38.3 57.0 43 21 53 12.5 5 21 35 37 18 25.2(d) 22(e) 2.9 1 1 1 1 6.7 8.0 2.5 3 13(j) 5(k) 0.5(1) 2(m) 20(n) 2o) 6n) 7(o)
c D 58.0 21 68 5 37.5 2 (29) (k)
A. Naval Ammunition Depot, Crane, Indiana
B. Frankfc.d Arsenal
C. Pieatinny Arsonai
D. NOL White Oak, Maryland
a. Pyrotechnic compositions
j. Manganese
c. Silicon
d. Potassium Nitrate
e. Potassium Perchlorate
f. Strontium Peroxide
g. Strontium Oxalate
h. Barium Chromate
i. Lead Chromate
j. Thiokol
k. Laminac
I. Pluronic
m. Copper Powder
n. llexachlorobemsene
o. Asphaltum
p. Sulphur
q. Calcium Resinate
r. Polyvinyl Chloride
s. Binder Composition
t. Zirconium Hydride
ti. Tetrnnilrocarbazole
Note: Details of preparation and material specifications should be obtained (torn source installations.
(i-3ti
АМСР 706-185
TABLE 6-6
HEATS OF REACTION OF ALUMINUM WITH
STOICHIOMETRIC QUANTITIES OF VARIOUS OXIDANTS
Oxidant Composition Density, g/cc* Heat of Reaction Products Assumed
Kcal, Toted, Calfg Comp Calfcc Comp*
А1(С1О4)з 2.70 est 1,603 est 2,960 est 7,990 est А120з-А1С13
Mg(C104)2 2.64 3,230 2,930 7,750 Al2O3-MgCl2
LiC104 2.53 1,590 2,970 7,520 Al2O3-LiCl
Be(C104)2 2.38 est 3,200 est 3,030 est 7,220 est Al2O3-BeCl2
KC1O4 2.58 1,598 2,530 6,540 ai2o3-kci
Be(N0s)2 2.51 est 1,880 est 2,810 est 7,070 est А^Оз-ВеО-Мг
Pb(NO3)2 3.90 691 1,585 6,190 А^Оз-РЬ-Ыг
NaNO3 2.39 1,624 2,080 4,980 Al2O3-Na2O-N2
F2O(liq) 1.95 1,038 3,850 7,510 AI2O3-AIF 3
O2(liq) 1.64 798 3,910 6,430 А120з
F2(liq) 1.37 622 3,700 5,070 A1F3
CuO 5.11 288 984 5,030 Al203-Cu
MeO» 3.81 219 1,105 4,210 AI2O3 Me
Ре?Оз 4.18 203 948 3,960 Al2O3-Fe
wo3 5.46 198 693 3,780 Als03-W
v20B 3.19 876 1,075 3,340 A12O3-V
H2O(liq) 1.46 194 1,800 2,620 A1.2O3-H2
* Based on calculated true density.
the visible, to the volume emission resulting from
scattering by the solid particles of MgO which are
essentially transparent in that environment.
White light ean be produced by: (1) developing
an extensive eontinuuni, (2) exciting an extensive
discrete band system, and (3) exciting two nearly
complementary band systems. The light produced
by incandescent carbon particles, or the extensive
sodium continuum produced by the magnesium-
sodinni nitrate illuminating flare, are good ex-
amples of method (1). The extensive band system
of barium oxide (BaO) (400 to 800 millimicrons)
is an example of method (2). Suitable blending of
the emission from strontium chloride (Sr('l) (red),
.alcinm chloride (('aCl._. 1 (yellow), and barium
chloride (BaCl..) (green) is an example of method
(3).
6-3.5.4 Color Intensifiers
Highly chlorinated organic compounds such as
hexaehloroet ham1, liexavhlorobenzeue, polyvinyl-
chloride, or Dechlorane are generally used as color
intensifiers because they are a ready source of
chlorine. As shown in Figure 6-30, the addition
of increasing amounts of polyvinylchloride reduces
the candlepower of a magnesium-strontium nitrate
flare; however, its color value (see Paragraph
6-2.5.5) as a red flare increases as shown in Figure
6-31. Red color values of greater than 0.40 are
impossible to obtain unless the color intensifier or
binder is a chlorine, containing compound. As al-
ready indicated, in the absence of a chlorine com-
pound, the red color may be due to strontium oxide
whil- i the presence of chlorine, strontium chlo-
ride appears to be the emitting species,ss
The production of a saturated green light by
pyrotechnic means is more difficult than produc-
tion of a red light of relatively high saturation.
In most pyrotcc hiiie items, the production of green
light appears to depend on the green emitter,
barium chloride, formed from the deeomimsition
6-37
АМСР 706-185
TABLE 6-7
HEATS OF REACTION OF MAGNESIUM WITH
STOICHIOMETRIC QUANTITIES OF VARIOUS OXIDANTS
Oxidant Heat of Reaction — Products Assumed
Density, fj/cc* Leal, Total Cal/g Comp Cal/c'' Comp*
A1(C1O4)s 2.14 est 1,732 est 2,810 est i 010 est MgO-AlCls
Mg(C104)2 2.11 1,163 2,785 5.880 MgO-MgCl2
LiClO< 2.04 573 2,810 о 740 MgO-LiCl
NaC10< 2.10 est 581 2,650 5,560 est MgO-NaCl
KC1O4 2.13 576 2,440 5,200 MgO-KCl
Be(NO3)2 2.04 est 681 est 2,675 est 5,420 est MgO-BeO-N2
AgNO3 3.00 804 1,656 4,970 MgO-Ag-N2
LiNO3 2.03 631 2,430 4 «40 MgO-Li2O-N2
Pb(NO8)2 3.03 756 1,584 4,800 MgO-Pb-N2
Ca(NO3)2 2.04 647 2,265 4,620 MgO-CaO-N2
Sr(NO3)2 2.38 627 1,880 4,480 MgO-SrO-N2
NaN03 2.00 594 2,035 4,070 MgO-Na2O-N2
Ba(NO3)2 2.54 616 1,610 4,080 MgO-BaO-N2
KN03 1.95 570 1,760 3,430 MgO-K2O-N2
F2(liq) 1.29 264 4,230 5,460 MgF2
O2(liq) 1.44 288 3,570 5,140 MgO
PbO2 5.37 222 770 4,140 MgO-Pb
BaO2 3.53 137 630 2,220 MgO-Ba
* Based on calculated true density.
products of barium nitrate and an organic chlorine
containing compound.
Magnesium also combines readily with chlorine
and, therefore, will compete with the barium for
the available chlorine. There is also competition
between chlorine and oxygen for the barium. To
select the best chlorine donor (('la is ideal but too
difficult to handle), several compositions were
tested whieh contained organic chlorides having
different percentage:» of chlorine. These, compounds
lowered the candlepower, with generally improved
color, and increased the amount of barium chloride
formed. The best results were obtained with a
composition containing 40 percent magnesium, 45
percent barium chlorate, 10 percent poly vinylidine-
vhloride, and 5 percent Laminac The chlorine to-
barium ratio was 3.45 tn 1.0; tin- magnesium-to
barium ratio was 11.8 to 1.0, ami the chlorine-
(available to barium)-to-barium ratio was 0.272 to
1.0. All other chlorine continuing additives im-
proved the green color, but to a lesser degree.
Ethyleellulose, the one nonchlorinated organic ad-
ditive tested, improved the color of the flare slight-
ly as a larger percentage of it was used. This
slight improvement in color is believed to be due
to the decrease in luminous intensity. The im-
provement in color of the compositions containing
chlorinated organic additives resulted from an
increase in the amount of barium chloride formed
as well us from decreased luminous output.
It has also been suggested that the addition of
a chlorine containing compound to a flare mix-
ture may, by shift of equilibrium, result in the
formation of barium hydroxide which emits strong-
ly in the green.22
6-3.5.5 Binders
Binding agents- including certain resins,
waxes, plastics, and oils -serve multiple purposes
in pyrotechnic compositions They are added to
6-38
AMCP 706-185
Figure 6-22. Zones in Flame Propagation
prevent segregation and to obtain more uniformly
biended compositions. In addition, they serve to
make tiie finely divided particles of metal and
oxidizer adhere to each other and help to obtain
maximum density and, therefore, efficiency in
burning. Binders also frequently desensitize mix-
tures which would otherwise be very sensitive to
impact, friction, and static electricity and, as
binder content is increased, burning rate is de-
creased and candlepower reduced.
Materials such as linseed oil, used earlier in
most standard pyrotechnic compositions as binders,
oxidized and hardened during; storage causing a
change in the burning characteristics, The re-
plaeeinenl of linseed oil by Laminae, a polyester
resin,11 greatly reduced this problem.K It was
found that self-hardening polyester resins tended
to minimize the need for high consolidation pres-
sures. Most of the polyester resins used are es-
sentially esters mininfiictured from glycols and nn-
satnraled acids -nnl nionmnerie cross-linking addi-
tives such as styrene ami diallyl phthalate which
are utilized to elire the resin. Win'll the resins are
catalyzed, they undergo a transition from liquid
gel tc solid as they cure.42
The results of a series of tests involving poly-
ester resins, presented in Table 6-9, led to the
conclusion that the majority of these resins would
be satisfactory and that mixtures containing these
materials would be as stable and have the same
burning characteristics as mixtures containing
Laminac as a binding agent.
The luminous intensity for all mixtures tested,
including a binary mixture not containing a binder
of any kind, varied greatly during the first month
of storage. This strongly indicates that the binder
is not the cause of this variation. There is, how-
ever, little, if any, enange in burning rate asso-
ciated with this change in luminous intensity.
6-3.5.6 Particle Size
The rate of reaction of a pyrotechnic composi-
tion is related to the specific surface of the in-
gredients. Factors sueh as size, shape, distribu-
tion, and surface of the particles affect the proper-
ties of the particulate material and must be ac-
curately7 controlled. These factors affect the pack-
ing properties of the ingredients which, in turn,
affect the weight-volume relationship of the par-
ticles.
As has been indicated in the discussion of prop-
agative burning (Paragraph 3-3.6), the burning
rate and candlepower of a pyrotechnic composi-
tion depend on the particle size of the metal pow-
der fuel. This effect is shown in Figures 6-32(A)
and 6-32(B), and Table 6-10 for an illuminant
mixture containing magnesium, sodium nitrate,
polyvinylchloride, and Laminae. A decrease in
particle size for the spherical particles results in
an increase in the specific surface—the surface area
associated with one gram of powder—an increase
m tin candlepower, and an increase in the burn-
ing rate. This is in agreement with the theory pre-
sented in Paragraph 3-3.6.
flic above lesidts were obtained for composi-
tions in which the magnesium was essentially a
sphere; any other particle shape will result ill U
larger specific sin fa ее than that of a comparable
sphere. III Table ti II, the burning I'huriieteristieS
of similar compositions prepared with ground and
with atomized magnesium having the same sieve
6-39
АМСР 706-185
J22 1 Т
29 S 11 * ?
25 к >1 Гй It 1 14 1' Ito 1
24 я FTT S г 1S1 и lb 11 O0 n 01
23 n 3» > lob fl ЕПТ И 1 In- и И 11 36 1 Ol
22 и 91 VI е» 11 it- н ?гт JX и A ab i' 01
21 lb R~rJ И n lb и W. 11 и и 13
20 if »</ n * <1 и н Я 1 IX и iiy4 09 11 Ol
19 lb JF7 lofl И и и 11 /1 ЙГ 1- ’ * (г 01
18 re 0/ii W и И г га 91 1 ;л X IMS
17 л mV л H (1 |р га п га 40 <1 >9fc Н I» ST-
16 I'wi frf 10 sffTii It W -<Ь К Ю1 n &> It ВУ
15 lb и r lb и IS 10 ю In ю И «о 11 » П 01
14 14 re^ii JR (4 isJ м 1О <1 5Г 1 U к as
13 1* IO/H »j/h is и •я лЬх У rw 11 ibj ra 13
12 -I*c "И W w • 11 n fl ” У ня н М »e i* 13
11 |4J /18 ЙП5 bJ h н и га н и мн» tt
/ *41 Tie йТн in £ i\i Г га и- и АГ» Л
— "1 № lb io / me L Й-ii BM11 fill jj/ll *i к »х И ran
8 и <4М>9 ля
J. u It m ж и иг*' B4 к 1b u fx ИП р 3s“
6 / Г fl » V Ии a|
5 n> 1^1 o| u 1 14 0Я D И l*U
4 KT TRI 7 ~3 J 4 n
3 “ТРИ in> 3fell 13 » * гли ггй/г 01
2 ~1м в Ищ г\н тгям 1МЭ
i —нН > ** * M
14 J П 3 u о МИ I „
1 2 3 4 5 6 7 8 9 10 11 12
1.51'
Figure 6-23. temperature Distribution in a Pyrotechnic Flume
6-40
АМСР 706-185
Figure 6-24. Luminous Intensity as a Function of Magnesium Content of Binary Mixtures Containing Various Oxidizing
Agents
sizes are compared.4:1 The ground magnesium
(whieh for some sieve sizes will have the greater
specific surface) gives a higher luminous intensity
and a faster burning rate. An increase in burning
rate and luminous intensity generally follows the
increase of specific surface of the ingredients. It
is to be noted, however, that an increase in burning
rate and luminous intensity may be accompanied
by a reduction in the overall efficiency.
The burning characteristics of pyntechnic
compositions are also affected by the specific sur-
face of the oxidizers and other ingredients. While
relatively little data are uvailab<e on the specific
effect produced in a particular system, it is im-
portant that they be considered.
6-3.5.7 Consolidation44
The degree of consolidation (loading pressure)
has a varying effect on the burning rate and lum-
inous intensity of a pyrotechnic mixture, depend-
ing on the physical characteristics of the com-
ponents. Increased consolidation pressure results
in an increased pellet density which approaches a
maximum, whieh is usually five to ten percent less
than the theoretical value. In Figure 6-33 and
Table 6-12 are shown the effects of loading pres-
sure on burning rate, luminous intensity, and
other characteristics, between 2000 psi and 25,000
psi for magnesinm-sodium nitrate flares. The lin-
ear burning rate shows a slight decrease with load-
ing pressure whne the mass burning rate and jum-
6-41
AMCP 706-185
BURNING RATE, INCHES PER MINUTE
Figura 6-25. Burning Rafa os a Function of Magnesium Content of Binary Mixturet Containing Various Oxidizing Agantt
6-42
AMCP 706-185
TABLE 6-8(A)
PHYSICAL DATA AND BURNING CHARACTERISTICS FOR STOICHIOMETRIC
MIXTURES OF VARIOUS OXIDANTS WITH ATOMIZED MAGNESIUM
Oxidant Stoichio- metric Ratio Calculated Heat of Reaction Luminous Intensity Candle/sq in. Burning Rate, in./min Efficiency, candle-sec lg
Kcal Cal/g
LiNO3 53.2/46.8 631.0 2430 109,000 13.9 17,500
NaNO3 58.3/41.7 595.4 2060 102,000 13.1 15,500
KN33 62.5/37.5 569.8 1760 27,500 6.9 8,000
Ca(NO3)2 57.5/425 647.1 2260 64,000 6.8 18,000
3r(NOs)2 63.5/36.5 626.8 1881 50,500 7.7 12,500
Ba(NOs)2 68.8/31.8 615.5 1606 45,000 5.1 14,000
KC1O4 58.8/41.2 515.8 2441 37,000 5.2 15,000
inous intensity show an increasing trend. These
data have been found consistent with the trends
observed in most pyrotechnic compositions con-
taining magnesium although they are not as con-
sistent for compositions containing aluminum.
Insufficient consolidation of tracer composition
in the tracer cavity may result in the tracer mal-
function known as “blow out,” where the pyro-
technic composition is ejected from its cavity. This
usually happens shortly after the projectile leaves
the gun. In ammunition depending on tracer func-
tioning for self-destruction, this usually results
in a premature projectile functioning.
The required loading pressure or extent of
consolidation depends on the setback forces and
amount of rough handling to which the item is
to be subjected. Generally, the greater the setback
forces, the greater the required loading pressure.
6-3.5.8 Flare Diameter
The influence of dare diameter on the linear
anil mass burning rate, luminous intensity, tem-
perature distr’bution, color value, luminous effi-
<йяпеу, and Наше geometry may vary considerably
depending on general eonfigurutioii of the system
and the pyrotechnic composition. A basic end-
induing flare, free from the influences of case
geometry and composition and associated mate-
rials, should possess a linear burning rate essen-
t ally independent of the Hare diameter. This has
b -eu the case in many investigations conducted
over rather limited diameter ranges; however, in
otner cases the results have varied considerably.
With certain compositions, investigators have ob-
served an apparent maximum in linear burning
rate associated with a particular flare diameter.48
Investigations of typical yellow, green, and red
flare compositions with diameters varying between
0.6 inch to 1.1 inches indicated that the luminous
intensity eould be expressed mathematically by an
equation of the form :4*
у = ax" (6-15)
(for diameters less than approximately 4 in.)
where у is the luminous intensity (candela), a
is a constant, x is the flare diameter in inches, and
n is a constant. The value of n, which was ob-
tained when the results were plotted on log-log
paper, indicated that n is slightly greater than 2.0
which may be due to some change in the flame
geometry, or to an increase in the flame tempera-
ture The flame area tended to exhibit a direct
proportionality with the square of the flare diam-
eter. Yellow and green flares showed an increase
in luminous efficiency with increased luminous in-
tensity ; however, their flames appeared to become
less saturated with increasing flare diameter. Red
Hares exhibited maximum luminous efficiencies for
intermediate values of luminous intensity and the
color characteristics did not appear to change with
an increase in flare diameter.
6-3.5.9 Case Materials and Coating
Both the physical and chemical characteristics
of pyrotechnic ease material and associated coat-
6-43
АМСР 706-185
X
Figure 6-26. Chrome fidty Data for Red, Yellow, and Green Flare»
6-44
АМСР 706-185
4500 А 5000 5500 6000 «000
_J_________I____—Д.--------L-------—1_
BoNO3 EMISSION (GREEN FLARE)
SrCI2 EMISSION (IN CARBON ARC)
Figure 6-27 Typical Spectra of Signal Flare*
ing may affect the burning characteristics and
, luminous output of fiares. Steel cases with high
thermal conductivities, as compared to those con-
structed of paper or other materials, may preheat
the composition and thus tend to decrease the time
to ignition and increase the burning rate. In addi-
tion, the increased wall temperature may affect
the coating material and promote side burning.
Both of these conditions tend to increase the lumi-
nous intensity; however, they can cause unpredict-
able performance.
In studies of colored flare illuminating compo-
sitions,47 it was found that red and yellow flares
had higher burning rates and luminous intensities
when using steel cases as opposed to paper cases.
When paper-lined steel cases were used, luminous
intensity values were midway between those for
steel and those for paper, although burning rates
were comparable to those obtained for paper cases.
In contrast, the relatively cooler-burning green
composition gave lower luminous intensity values
in the steel ease than in the paper ease (for which
intermediate values were obtained) even though
the burning rates remained essentially the same.
In this ease, the heat loss to the surroundings from
the steel ease may more than compensate for the
increase observed with red and yellow flare com-
positions. Some compositions also have been ob-
served to burn more rapidly and produce a greater
luminous intensity in laminated plastic cases than
when loaded into paper eases. In this case, the
character of the adherence of the composition to
the wail may be important; however, a completely
satisfactory explanation is difficult.
6-3.5.10 Temperature and Pressure
Ambient pressure and temperature have been
found to have varying effects on the operating
characteristics of illuminating flares, depending
on the composition. In a study48 made on yellow,
red, and green compositions it was found that at
a reduced temperature, — 65°F, the candlepower
and burning time of the flares, except for green,
decreased. The color value was found to be affected
differently, depending on the eomposit'on at this
temperature. (See Tables 6-13, 6-14, and 6-15.)
At high simulated altitudes, the burning time in-
creased while the candlepower decreased for most
flares tested in this study. Color values were in-
creased at the higher simulated altitudes with the
6-45
AMCP 706-185
TABLE 6-8(B)
CHARACTERISTICS OF BINARY MIXTURES CONTAINING OXIDIZING AGENTS
AND ATOMIZED MAGNESIUM, GRADE A
Cmntwdwn* Parte oy Weight Horizontal Luminous Intensity, Candlu/er Square inch Burniog Rate, in./min Vdtow Cdor Value ZtfrtOion Temperature ’N lyriiiibility At Black Powder, g Impact Tut B.W. App.J cm — — Pendulum Frirtion Tr.xt Reaction with 1Я0°С Hacuum Stability Teri, ec, №/‘40 hre. [/entity gat/cc Efficiency, Candle- Se'ond» per gram
Sodium Nitrate Alom.Gr. A (MW maynetium Sled S*\ne — Piter Shoe.
80 20 4,500 2.4 635 >5 85 None 0.30 1.91 3,000
70 33 38'500 7.7 630 >ti 95 None 0.35 1.87 9.700
58 42 1О2;СЭО 13.1 0.025 630 0.5 100.1- None — 0.32 1.82 18,500
54 46 155,000 15.6 0.024 635 0.5 100+ None — 0.31 1.79 20,000
50 50 180.0C0 16.5 0.029 635 1,25 100 None —- 0.36 1.74 20,000
40 60 386,000 26.7 0.029 07» 1.25 100 Note- — 0.32 1.71 31,000
30 70 685,000 39 0.036 020 1.76 100 None —- 0.32 1.65 38,000
25 75 785.000 43 0.033 —- >5 100-I- None — .— 1 62 41,000
20 80 570,000 43 0.038 670 2.75 100+ None -— 0.33 1. A9 30,000
IS 85 445,000 32 0.041 570 >5 100+ None — C.23 :.6i 33,000
Barium A/cm.Gr.A
NitaUe 80 Maanenum 20 6,500 2.9 pcde green 680 >5 100-1- None — 0.25 2.48 3,300
68 32 45.000 < 5.1 pale green 070 >5 100+ None — 6.25 2.1)4 14,000
54 86 53,000 6.7 pale green M0 >C 100+ None 0.15 2.21 13,000
60 40 f9.500 10.7 pale green 635 >5 100+ None — 0.18 2.08 9,800
50 50 186,000 16.8 pale green 615 1.25 100+ None — (i .2i 0.16 1.96 13,600
40 60 348 000 38.1 pale groen 625 1.25 None — l.hS 17,500
30 70 360.000 40.3 pale green 615 >5 11Ю+ Nwie —• 0,20 A. 84 11, ЫЯ1
20 80 t+ratic Burning — 625 >5 1ДО+ None — 0 22 1.83 —
Zftronfium Atem.Gr.A Red Color
Nitrate 80 Magnenum 20 10,500 2.7 Vatec 0.20 615 >5 .IOC>+ Non — 0.13 -,l 12 6,600
70 30 34,000 6.0 0.19 600 >5 1003: None 0.16 2.:i!i 1(1,000
63.5 36.5 50,500 7.7 0.18 600 >5 1004 None — 0.15 1.(5 12,800
60 40 68,500 8.0 0.16 600 >5 100+ Nc.ie None —- 0.14 1.112 12,000
50 50 152,000 21.1 0.22 610 >Й pn — 0.14 1.79 14,500
40 60 260,500 24.8 0.24 610 >5 КЮ None — 0.19 1.72 22,000
30 70 307,000 28.0 0.26 615 >6 io»+ None .... 0.27 1.63 24,000
25 75 286,000 24.0 0.31 620 >5 K»+- None 0.1ft 1.67 27,500
20 80 250,000 20.4 0.27 610 >6 100+ None — — 1.52 33,030
Lithium Atom.Gr.A Red Color
NUme Magnetium Burning Value
80 20 Erratic
70 30 21,000 6.01 0.17 1.77 7,200
60 40 78,SOO 13.3 0.16 1.68 10,500
53 47 100.000 13.9 0.18 1.62 ll, 6ЦО
40 60 236,000 27.9 0.20 1.54 20,000
30 70 360.000 41.6 0.21 1.49 20,000
20 80 370,000 45.1 0.20 1.43 22,000
Calcium Alom.(/r.A Red Color
Niinh 80 70 Magnesium 20 30 3,500 25,000 1.8 4.0 Val^ 0.2?. 0.16 1.99 1.96 3,500 11,600
57 52 43 46 64,000 86,000 6.8 8.4 O.lfl 0,18 1.86 1.81 18,500 20,000
40 30 50 70 188,000 382,000 12.5 22.0 0.2& 0.28 1.73 1.55 32,000 40,000
25 75 400,000 23.3 0.29 1.51 41,000
20 80 362,000 21.5 0.30 1.50 41,000
Potarmum Atom.G'r.A
Nitrate 80 Magnetium 20 000 2.3 White 660 >6 80 None — 0 It) 1.81 60C
70 30 1.100 4.7 650 2.75 80 Nont .— 0ЛЗ 3.75 600
62 38 27*500 6.0 White 660 1.5 90 None 0.15 1.7» 8,400
68 42 36,000 8.5 White 655 2 75 None — (hit 1.72 9,000
50 60 55^000 13.3 White 650 1.75 00 Non» — 0.16 1.88 9,000
40 60 86,000 21.8 White M5 1.75 90 None — 0.11 1.02 9 (№0
30 70 116,000 29.3 White 635 1.5 100 None 0.V1 1.56 9.600
25 75 116,000 31.1 White 4 100't Nons 0.1S 1.6» 9,000
20 80 70,000 26.4 White 630 >5 100+ None 0.П 1.53 6,300
Potauium Atom.»?r.A
Perchlorate 80 Magnetium 20 2.500 2.2 White 700 >5 1Ш+ None 0 30 1.91 2.100
70 30 17,500 3.8 White 710 >5 100 + Now© - 0.24 1.78 9,600
50 41 37’000 5.2 White 706 >5 100-h 0.28 1.72 16,900
60 50 45,000 7,0 White 716 >5 1004- None —• 0.36 1 л 66 14,00!)
40 60 54 000 10.3 White 700 >5 ►09+ Nae.e • — (I. M 1.ЗД 12,030
30 70 171'000 26.6 White 700 100+ Nrta* — 0.35 1.54 14, 600
20 80 240,000 46 White — 100»+ None — 0.22 1.61 12,600
IS 85 167,000 47 White i«H 1.50 8, SvO
•idling PrcMiure 10,000 pair in 1.4 Square Ineb Ceudk Com.
fBureau of Mines Apparatus.
6-46
АМСР 706-185
TABLE 6-9
CHARACTERISTICS OF PYROTECHNIC COMPOSITIONS
CONTAINING VARIOUS POLYESTER RESIN BINDERS
Polyester Resins Candlepower, 1000 Candles Burning Rate, inch/minule Total Integral Light, 10* Candle-eecoi.de CIE Coordinates
X V
Hetron-92 84.0 4.4 3.7 0.52 0.35
Paraplex-43 70.3 3.5 4.0 0.54 0.35
Paraplex-444 65.0 4.2 3.2 0.50 0.35
Laminac 4116 64.5 3.8 3.3 0.5 л 0.36
Paraplex-13 62.5 3.3 3.7 0.53 0.35
Paraplex-47 52.0 3.4 3.5 0.52 0.36
Glidpol-1001-А 31.2 3.5 3.4 0.52 0.35
Interchemieal-401 60.5 3.9 3.5 0.57 0.32
PIeogen-1150 60.3 4.0 3.2 0.54 0.34
Aropol-7120 60.0 3.8 3.5 0.56 0.33
Polylite-8001 59.3 4.1 3.3 0.5C 0.33
In terchemical-937 58.0 4.0 3.3 0.57 0.33
Polylite-8007 56.8 3.8 3.2 0.55 0.34
4116-85%:4134-15% 56.6 4.1 3.2 0.55 0.33
Aropol-7300 56.4 4.3 3.0 0.5л. 0.33
Pleogen-1006 56.4 4.1 3.0 0.55 0.34
ED-199 56.2 4.1 3.2 0.57 0.32
PLL-1262 56.0 4.1 3.1 0.58 0.32
Vibrin-1088-В 54.5 3.4 3.4 0.56 0.33
Paraplex-49 54.4 3.4 3.1 0.52 0.35
Laminac-4134 53.7 3.9 3.0 O.tT 0.34
Vibrin-117 52.9 3.9 3.0 0.55 0.33
In terchemical- 312 51.7 4.1 2.9 0.56 0.32
Celanese-MX-314 51.4 4.0 2.8 0.55 0.34
In terchemical • 1191 51.4 4.0 2.9 0.56 0.33
Interchemical-730 51.4 3.7 3.1 0.57 0.32
lnterchemical-1154 50.2 4.0 2.9 0.56 0.33
Stypol-4051 49.5 3.8 2.8 0.55 0.33
Stypol-405 49.1 4.0 2.7 0.55 0.34
Aropol-7110 43.0 4.2 2.7 0.56 0.33
Selcctron-5027 48.4 3.7 2.9 0.55 0.34
Celanese MR 28-C 46.0 4.0 2.6 0.55 0.34
Epoxy Resi~i Bakelite ERL-2795 81.2 5.1 3.8 0.59 O.t’O
exception of green whieh remained essentially con-
stant.
The range of altitudes at whieh pyrotechnic
items may be used is from zero to approximately
•250,01)0 feet. '1'he effects produced under reduced
pressures can hr attributed to both the reduction
in oxygen and a.uibicit pressure. The effects of
oxygen reduction may be greater when fuel-rich
mixtures are burned For .stoichiometric ar near-
deiehiometrie eiunp.ositions, the effect is mainly
that of pressure. It has been shown that by main-
taining a pressure over the flare surface through
partial eoiifipeinent by nse of a nozzle, the burning
i'<;ti' at high simul.i*altitude mold be raised to
tlm same level as ihat at sea leve..40
Larger dame plumes lire produced as the am-
bient pressure is reduced due to the decrease in
resistance offered by the air molecules. Inter-
mediate reactions occur further away from tbe
flare surface and, in many eases, a “dark zone”
can be observed just above the flare surface and
initiil reaction zones. If the pressure becomes low
enough, a point will be reached where the reaction
will not. be self-sustaining.
The inverse relationship between candlepower
and eulor value is attributed to the increasing im-
portance of the color line and band emission from
excited atoms and molecules at the higher altitudes
€ 3.5.11 Rotational Spin
The effee* of rotational spin on the burning
characteristics of compositions has been investi-
gated. It has been found that the rotational spin
6-47
АМСР 706-185
Figure 6-28. Spectral Energy Distribution of Green Flare
of a 105 mm illuminating projectile canister con-
siderably shortened the burning time of the il-
luminant. The effect of rotational spin on flares
loaded in l.u-meh 0.1), steel flare cases was also
studied. Examination <>f burned out flare cases
indicated that the resulting centrifugal forces pre-
vents the expulsion ot mien of the slag. The slag
bull Is up and effect) ely decreases tl ₽ internal
diameter of the ease. This decrease in ini тпа! ease
diameter pre-cuts the efficient expulsion of gates
formed and thus causes an incrc se in the internal
pressure As a result of the pressure increase, the
illnininants burn more rapidly. This is substanti-
ated by the faet that flares which are rotated at
the slowest speeds (which have the longest burning
times) show much less slag residue than those ro-
tated at higher speeds. Flares tested at speeds
of 3,000 to 5,000 rpm, however, all contain ap-
proximately the same amount of slag.
In another study, the trace duration of a tracer
was found to be shortened, as shown in Figure
(i-.34,b0 by rotational spin. Burring rates for tracer
compositions increased with an increase in diam-
eter, or length of tracer column and this increase
was more pronounced as angular speed was in-
creased. In general, for each composition the per-
6-48
АМСР 706-185
TABLE 6-10
EFFECT OF PARTICLE SIZE ON BURNING RATE
AND CANDLEPOWER FOR MAGNESIUM-SODIUM NITRATE-
POLYVINYLCHLORIDE-LAMINAC MIXTURE
Ingredients Average Particle Size, microns Percentages
Magnesium, At., 20/50 437 48
Magnesium, At., 30/50 322 48
Magnesium, At., 50/100 168 48
Magnesium, At., 100/200 110 48
Sodium Nitrate, DR, TJLP 34 42 42 42 42
Polyvinylchloride 27 2 2 2 2
Laminac Resin 4116 — 8 8 8 8
Time-Intensity Data
Candlepower, 103 candles 130 154 293 285
Burning Rate, in./min 2.62 3,ul 5.66 5.84
*°Г
S3 -
so -
25 -
20 -
-I------1----1------1_______I____I______I_______I—
88 70 72 74 76 76 80 82
PERCENT PURITY
Figure 6-29. Magnesium Content Versus Excitation Purity
for a Yellow Flare
eentage loss of slag decreased for each diameter
with an increase in rotational speed. Total light
output expressed in candlepower seconds decreased
with an increase in rotational speed.60
6-3.5.12 Moisture and Stability
One <>f the important factors in determining
the stability and shelf life of a pyrotechnic item
is the sensitivity of the pyrotechnic composition
to atmospheric moisture. In the presence of
moisture, the oxidant will react with the metal
particles to form a layer of metal oxide, metal
MASNESIUM, PARTS
Figure 6-30. Effect of Polyvinylchloride on the Candle-
power of Mixtures Containing Strontium Nitrate and
Ground Magnesium, Groda A
hydroxide, or both. This nonreactive layer changes
the ignition and propagative characteristics of the
6-49
АМСР 706-185
TABLE 6-11
EFFECTS OF CHANGE IN SPECIFIC
SURFACE OF MAGNESIUM PARTICLES
Ground Atomized
Magnesium Magnesium
COMPOSITION, %
Ground magnesium 66.6 —
Atomized magnesium — 66.6
Sodium nitrate 28.6 28.6
Resin 4.8 4.8
CHARACTERISTICS (100.0) (100.0)
Candles per sq in. 200,000 178,000
Burning rate, in./min 9.4 .57 ,
Density 1.56 1.65
Candle-seeonds/gram 50,000 69,200
! .
pyrotechnic mixture so that reduced luminous
intensity or nonignition may result.
The critical relative humidity is a measure of
the sensitivity of >xidants to moisture. It is deter-
mined by exposing samples of the oxidizers to at-
mospheres of known relative humidities and deter-
mining the change in weight of the oxidizer. The
critical relative humidity is that at which, with re-
spect to moisture content, the oxidizer is in equi-
librium with its surroundings. Roughly, the higher
the critical relative humidity, the less soluble the
oxidant. Small traces of impurities may lowei the
eritiei.l relative humidity of a compound.
Figure 6-31. Effect of Polyvinylchloride on the Color Value
of Mixtures Containing Strontium Nitrate and Ground
Magnesium, Grade A
In some cases, it has been found expedient to
“''mpromise due to an oxidizer’s excellent oxidizing
ability. This has been the case with sodium nitrate
that formerly had a critical humidity of 50 percent
for the specification grade. The use of U.S.P.
double-refined sodium nitrate with a critical
TABLE 6-12
EFFECTS OF LOADING PRESSURE ON BURNING CHARACTERISTICS
OF MAGNESIUM-SODIUM NITRATE FLARES
Loading Pressure, Psi Luminous Intensity, 100U Candles Total Light, IX 10я Candle- Seconds Burning Rate, Inches Per Minute Burning Rate, G Per Second Color Ratio Chromaticity Cordmates, ® s' Лк пая оил Efficiency, l~)C0 C-Sec Per Gram Composition Density, Greets Per CG
2,000 278 7.2 6.20 6.54 0.036 0.48 0.46 42.6 1.54
4,000 292 7.0 6.33 7.20 0.036 0.48 0.46 40.7 1.64
7,000 262 7.1 5.62 6.75 0.037 0.48 0.46 38.7 1.74
10,000 270 7.3 5.47 7.12 0.035 0.48 0.46 37.9 1.90
15,000 286 7.4 5.63 7.69 0.035 0.48 0.45 37.2 2.03
20,000 291 7.6 5.67 7.55 0.035 0.48 0.46 38.6 1.95
25,000 290 75 5.92 7.69 0.037 0.48 0.45 37.8 1.88
6-50
АМСР 706-185
TABLE 613
EFFECT OF SIMULATED ALTITUDE AND TEMPERATURE
ON ILLUMINATION CHARACTERISTICS OF YELLOW SIGNALS
LOT Y-l LOT Y-2
Average Average
Simulated Luminous Burning Yellow** Luminous Burning Yellow**
Altitude* T emperature, Intensity,- Time, Color Intensity, Time, Color
Feet op Candles Seconds Value Candles Seconds Value
0 70 53,300 19 .038 124,000 9.3 .052
10,000 70 39,200 21 .047 113,000 11 .062
20,000 70 19,200 24 .058 91,000 9.5 .062
40,000 70 6,650 49 .064 55,000 12 .072
0 —65 44,500 16.5 .055 78,000 9.5 .074
* Pressure reduced to simulate condition at altitudes shown.
•'The color value was determined using the procedure given in PA Tech Report No. 1385.
TABLE 6-14
EFFECT OF SIMULATED ALTITUDE AND TEMPERATURE
ON ILLUMINATION CHARACTERISTICS OF RED SIGNALS
LOT R-l
LOT R-2
Average Average Luminous Intensity, Candles Burning Time, Seconds Red** Color Value
Simulated Altitude* Feet Luminous Temperature, Intensity, Burning Time, Seconds Red** Color Value
°F Candles
0 70 26,400 18.3 .44 48,000 14 .56
10,000 70 17,200 22.5 .47 30,000 19 .59
20,000 70 14,500 27 .53 25,700 22 .60
40,000 70 9,300 41 .62 15,500 35 .69
0 —65 25,400 16.5 .40 38,000 14.5 .60
' Pressure •• The color reduced to simulate condition al value wits de1 rmined using the altitudes shown. procedure given in PA Tech Report No. 1385.
humidity of 75 percent partly alleviated this
problem.43
The effc'd of moisture on a finely powdered
metal can be determined by placing a sample in
distilled water and maintaining the system at a
specified constant temperature. By collecting the
gas evolved at constant pressure, the rati of cor-
rosion of the metal can be established. For
atomized magnesium,1'1 it was found that the rate
of corrosion increased with time but only slightly
between the temperatures of 30°C and 65°C. At-
mospheres of nitrogen and oxygen exerted only a
slight influence on the corrosion rate whereas hy-
drogen and carbon dioxide were observed to have
retarding and accelerating effects, respectively.
Further, the rate of corrosion increased with an
increase in specific surface.
One way that the deleterious effect of moisture
on magnesium or other metal ean be avoided is
to coat the metal with a thin chromate film. Pro-
tection of the atomized magnesium in consolidated
illuminating and signal compositions may also be
6-51
АМСР 706-185
TABLE 6-15
EFFECT OF SIMULATED ALTITUDE AND TEMPERATURE
ON ILLUMINATION CHARACTERISTICS OF GREEN SIGNALS
LOT 0-1 LOT G-2
Simulated Average Luminous Burning Green** Average Luminous Burning Green**
Altitude* Temperature, Intensity, Time, Color Intensity, Time, Color
Feet °F Candles Seconds Value Candles Seconds Value
0 70 14,300 16.5 .36 38,700 16 .35
10,000 70 14,300 21.5 .39 20,500 15 .36
20,000 70 11,500 26.5 .37 20,500 17 .36
40,000 70 11,000 30 .41 19,500 26 .35
0 —65 27,800 20 .36 35,700 15 .35
‘Pressure reduced to simulate condition at altitudes shown.
Figure 6-32.1. Burning Rate vs Particle Size of Magnesium
Figure 6-32.2. Candlepower vs Particle Size of Magnesium
accomplished by the use of binders and water-
proofing agents, usually an oil, wax, or plastic
resin. Containers and noimygroscopie tirst-fire
compositions are n»ed to keep moisture from the
main ilhnniiiating compositions.
6-4 NONCONSOLIDATED ILLUMINANT
CHARGES
As pyrotechnic reactions, in general, are based
on the chemical reaction of a fuel with an oxidizer,
(be manner in which these two basic ingredients
are incorporated into a pyrotechnic device will
greatly influence its performance. Nonvoiisoli-
dated dhimimints differ from consolidated illu-
miimnts because they do not contain binders and
are loose-loaded which changes the manner in
which they react to produce light. Consolidated
compositions burn comparatively slowly while ncn-
consolidated mixtures, under confinement, react
rapidlv producing a bright flush of light.
'Г11с major ns* ч for nonconsolidated illuminant
charges are in photoflash bombs and cartridges for
night aerial photography, and in spotting charges
for tracking and acquisition purposes. Noneonsoli-
dati'il fillers include: (!' intimate mixture of a
powdered metal and powder oxidant, (2' u pow-
d*r**l metal, such as aluminum, magnesium, or
their alloys, and (3) a powdered metat and a
АМСР 706-185
LOADING PRESSURE, PSI
Figure 6-33. Effect of Loading Pressure on Burning Rate of
Pyrotechnic Compositions
powdered oxidant segregated from each other
in concentric cylinders.
6-4.1 AERIAL PHOTOGRAPHIC
ILLUMINANTS
The mission of aerial photography is to obtain
information regarding the static content of an area
(buildings, roads, etc.), and the movement of per-
sonnel and equipment. At night, this requires a
light source that will produce sufficient illumina-
tion to obtain usable negatives. High intensity
light sources for night aerial photography may
be broadly divided into two classes, pyrotechnic
light sources, and the electronic flash tube.62 As
flash rubes are unable to produce as much light as
pyrotechnic light sources, their use is limited to
low altitudes. At higher altitudes, photoflash car-
tridges and photolhuh bombs are the only practical
sources of intense illumination tor night aerial
photography using conventional aerial cameras
and photographic film.
The him speed, basically, determines the amount
of light which must fall on the film in order to
obtain a satisfactory negative. The amount of light
which reaches the photographic film depends on:
a. Amount of light reflected from the area to be
photographed, whieh depends on the illumination
.nd the terrain reflectance of the area,
b. Relative aperture of the camera lens whieh is
normally expressed by f values on a lens barrel are
the diameter of the lens aperture divided by the
focal length of the lenses. The transmission char-
acteristics of the atmosphere determine the por-
10,000 R PM
Figure 6-34. Effect of Spin Upon Tr ace Duration c2 Various
Standord Tracer Compositions When Loaded Into Caliber
.50 Ml Jacket
tion of the light reflected from the area to be
photographed whieh reaches the photographic film,
and
e. Exposure time which, for night aerial pho-
tography, may be the duration of illumination and
not the shutter speed.
The intensity of the light source and its rela-
tive location determine the illumination received
by the area to be photographed as well as the uni-
formity of the illuminatioii produced. As shown
in Figure 6-35, the location of a pyrotechnic light
source can be specified by giving the trail angle
and the burst altitude. The trail angle must be
sufficiently greater thnn the camera half-angle to
iissure that only the reflected light from the area
being photographed will reach the camera lens.
For a normal trail angle value, the optimum
burst altitude has been determined to be about 0.6
of the flight altitude, when the required intensity
of the light source is a minimum.M At the opti-
mum burst height the amount of light required for
и satisfactory negative is approximately:62
6.41л)./)2
/ _------------- (6-16)
where / is the candlepower of the light source, T
is the exposure time, / is the effective / value for
the lens, A is the slant distance from the camera
6-53
АМСР 706-185
в » TRAIL ANCLE H ' FLIGHT ALTITUDE
a > CAMERA HALF-ANGLE h « BOMB BURST ALTITUDE
Figure 6-35. Diagram of Bomb Burst and Trail Angle
lens to area being photographed, and U{ is a fac-
tor best determined experimentally. However, as
shown in Figure 6-36 (which is a typical charac-
teristic curve for black and white negative ma-
terial), it is impossible to estimate the exposure Ut
required to produce a negative of satisfactory
photographic density. Military specification for
film is based on the reciprocal of twice the ex-
posure of a point on the curve at which the slope
of the longest is one-half gamma; for this film
the military speed is 300 ASA. A satisfactory ex-
posure would correspond to about one-half way
up the linear part of the characteristic curve, i.e.,
for this material an exposure of approximately
0.05 log E units.
6-4.1.1 Photoflash Cartridges
Illumination for relatively low altitude night
aerial photography is furnished by photoflash car-
tridges. As shewn in Figure 6-37, these cartridges
contain a photofiash charge and a delay fuze assem-
bled into a charge ease. This subassembly is put
into an electrically primed outer cartridge case
along with a small expelling charge. The cartridges
are loaded into specially designed ejectors. Ejec-
tion and functioning of the cartridge are initiated
by an electric pulse which causes the electric
primer to function which, in turn, ignites the ex-
polling charge which ejects the inner charge. At
the same time, the delay fuze is initiated and, at
the end of the delay time, a relay explosive charge
is initiated and, in turn, initiates the photoflash
mixture. As the delay time determines the location
of the burst behind (and below) the aircraft, the
proper delay time will depend on the speed of the
aircraft during the photographic mission. For this
reason, photoflash cartridges are furnished with the
different delays indicated in Table 6-16 which sum-
marizes the characteristics of some photoflash car-
tridges. Characteristics of a typical photoflash
composition are shown in Table 6-17.
6-4.1.2 Photoflash Bombs
Illumination for high altitude night photog-
raphy is provided by photoflash bombs which are
released from the aircraft during the photographic
run. A typical pho'oflash bomb is shown in Figure
6-38. Descriptive data and characteristics of photo-
flash bombs containing photoflash powder are sum-
marized in Table 6-18.
Photoflash bombs containing a relatively large
amount of flash powder can be very dangerous
since they ean be exploded by impact. Because of
this danger, dust-type photoflash bombs were de-
veloped. The characteristics of dust-type photo-
flash bombs are summarized in Table 6-19.
In 1950, the development of a segregated oxi-
dant bomb in which the burster oxidant and metal
dust were loaded separately in coaxial cylinders
was started. Such a configuration appeared to
offer the possibility of safety from impact initia-
tion, and also of producing the high peak 'candle-
power of the flashpowder bomb, along with the
broad peak associated with the metal dust-type
photoflash bomb. No photoflash bombs of this'type
were standardized. Results obtained with some
experimental segregated oxidant bombs are sum-
marized in Table 6-20. \
6-4.1.3 Other Photographic Illuminant Systems \
Attempts have been made to increase the output
of the standard flash bulb by a factor of 100 so that
it could be used as a night aerial photographic il-
luminant. Unfortunately, it was found that this
increase could not be obtained without incurring
6-54
АМСР 706-185
TABLE 6-16
DESIGNATION AND DESCRIPTION OF PHOTOFLASH CATRIDGES
Cartridge Designation Site, tin. L X Dia Total Weight, lb Powder Peak fntsnsitv, 10е Canales Time to Pzak, msec integral Light, 10е Candlesecs. Duration of Flash, msec Casing Puts
QZ Formula
CPS Total Sesl CPSeo
Twt I lass
T10 7.71X1.56 - 5.25 n В 24 5 0.77 — — Standard Ml! Signal caes Tima delay 1 to 5 вес
TI2 7.73X1.57 0.72 5.75 11 В 50 5 1 — 30 Modified Ml! Time delby 1,2, or 4 sec
M112 7.73X1.67 1 7 111 A no 3 1.4 — 30 Modified Mil Time delay 1,2, or 4 sec
M123 (T89) 8.37X2.9 7 27.2 Ш Л 240 4 5 4.8 40 Al Obturated delay luxe, 2,4, or 6 вес
T90 About same as M1I2 About same as M112 — Each star: (b) NaNOs/alom- iied Mg bind- er, 30/70/2 8.6 2 5 690 Outer case similar to Ml 12; con- tains Serf ars Obturated delay fuse. 1 or 2 sec
T102 8X1.75 1.25 12 Ill Л 169 4 2.4 - 31(a) Al, 0.051 in. wall Obturated delay fuse similar to Ml23
ТЮЗ 11X2.375 5.5 27,2 III A 325 4 7.2 6.5 47(a) Al, 0.051 in. wall Similar to M123
(a) to 0.1. max.
(b) Contains a high intensity illuminating coinpouition. not photoflaah powder.
disadvantages whieh essentially nullified any gain
in output.
Other pyrotechnic light sources have been tried
whieh were designed to produce illumination on a
continuous basis rather than in short bursts for
use with .strip-type cameras whieh do not contain
a shutter. The film is moved continuously across a
slit at a speed whieh matches that of the image
motion. One of the early attempts was the use of
the T90 photoflan1 (‘artridge. This consisted of the
same easing as the Ml 12 with a charge of five stars
which were made of a high intensity consolidated
illuminating composition. The light output was
not adequate as no visible image was obtained on
the negatives exposed in flight test at 1000 feet..54
Another attempt was a burner for magnesium dust
whieh was developed for use on aircraft.55Ml
6-4.2 SPOTTING CHARGES
Spotting charges are used for locating point of
impact, for target acquisition, for tracking, and for
indication of item or component functioning. For
many years, spotting charges of black powder were
nsed in practice bombs and projectiles to locate
point of impact. Because the observation distances
were relatively short ami because a relatively
large volume was available for the spotting charge,
an adequate flash could be produced with black
powder. The development of long range missiles,
as well as the use of small am projectiles as spot-
ting rounds for major caliber weapons, led to a
requirement for more effective spotting charges.
64.2.1 Small Arm Spotting Rounds ‘
Small caliber spotting rounds can be used to
aim a major caliber weapon. In operation, the
smail caliber spotting rifle, whieh is rigidly at-
tached to the main weapon, is fixed and the point
of impact is indicated by a flash of light and a puff
of smoke1 formed by the functioning of the small
caliber spotting projectile. As the trajectory of
the small arm spotting projectile and that of the
main round are nearly identical at the critical
range, the burst provides information for adjust-
ment of aim. A hit with the spotting round means
that the main projectile will u’so strike close to the
target.57,58
A typical 20 mm spotting round is shown in
Figure 6-119. This round contains about 6.5 cubic
centimeters of a flash mixture and can produce a
flash of 1.5 million candlepowder with a duration of
700 milliseconds.
6-4.2.2 Tracking
Highly accurate trajectory information is re-
quired in the development of a missile system.
One method of obtaining this information for a
missile at high altitudes is to photograph the flash
6-55
АМСР 706-185
LOG EXPOSURE METER CANDLE - SECONDS
Figure 6-36. Typical Characteristics of Black and White Negative Material
produced by a photoflash cartridge ejected a dis-
tance sufficient to preven* damage to the missile
in flight. Flash cartridges of the type shown in
Figure 6-10 (which are of the same general type
discussed in Paragraph 6-4.1.1) were developed
for this purpose. Modifications to reduce weight
and simplify mounting problems resulted in a flash
device which produces a series of flashes with a
known time interval between them.®9
6-4.2.3 Indication of Functioning
Flash charges are used also to provide a visible
indication of the functioning of an item or com-
ponent such as a warhead fuze. The flesh signal
provides a brilliant light flash and ean be photo-
graphically recorded by remote cameras, providing
data so that the time and location of functioning
ean be accurately determined.®061 A typical flash
charge for thi» purpose is shown in Figure 6-41.
6-4.3 TYPICAL COMPOSITIONS
Typical noneonsolidated illuminating composi-
tions used as photoflash and spotting charges are
summa' I in Table 6-21.
5-4.4 Light Production
As has been indicated, nonconsolidated illu-
niinants differ from consolidated illuminants in
the manner in whieh they react to produce light.
Consolidated compositions propagatively burn in
a relatively slow manner while nonconsolidated
compositions react rapidly producing a bright
flash of light. Because of the rapidity of the reac-
tion, functioning of devices containing noneon-
6-56
AMCP 706-185
TABLE n-17
CHARACTERISTICS OF TYPE Ш PHOTOFLASH COMPOSITION
Ingredients: Specification M‘crons Percent
Aluminum, atomized JAN-A-289 15 40
Potassium Perchlorate PA-PD 234 24 30
Barium Nitrate PA-PD-253 147 30
Physico-Chemical Data:
Heat of Reaction, cal/g—2774 (calc)
Reaction Temperature, CC—approx. 3500
Gas Volume, cc/g—24 (calc)
Tapped—1.67
Vac. Stab. 12O°C, ce gas/4Ohrs—0.16
Sensitivity Data:
Impact: PA, inches—40+
Friction Pend: Steel —Crackles; Fiber—No Action
Ignition Temp, °C: 5 sec value—61G; DTA—No Ignition
Hygroscopicity: Electrostatic 57% RII, room temp; Hrs 24; % Wi Gain < 0.1
Sensitivity: Joule, Mir 2.14; 50% Pt—3.5; 100% Pt—4.5 Temp—65°F; % RH—40; Unconfined—Yes
solidated illuminants can cause disruptive effects
in their surroundings similar to the effects pro-
duced by high explosives.
6-4.4.1 Light Output Characteristics
The light produced by the functioning of a
device containing a non^oncolidated illuminant is
characterized by its relative high peak intensity
and the relatively short flash duration.
6-4.4.1.1 Time Intensity62 63
A typical time-intensity curve for the light
produced by the functioning of a photoflash device
containing a flash powder (intimate mixture of
powdered metal and oxidant) charge is shown
in Figure 6-42. The curve for most spotting
charges would be similar. As indicated in this
figure, the important characteristics of the light
output of a photoflash device are: (1) total amount
of light produced (candleseconds), (2) amount of
light prod 'ed in the best 40 milliseconds, CPS4()
(candleseconds), (3) peak intensity (candles), (4)
time to peak intensity (milliseconds), and (5) du-
ration of the flash (milliseconds). The total amount
of light produced determines the maximum ex-
posure which can be obtained at any altitude,
using open shutter techniques where the duration
of the flash determines the exposure time. Unless
image movement compensation techniques are used,
the speed of the aircraft must be low enough that
image relative movement wiil not result in unac-
ceptable photographic definition. Until the develop-
ment of image motion compensation techniques,
many night aerial photographs were made with
an exposure time of second (40 milliseconds).
In this case, the exposure obtained depended on the
amount of light produced in 40 milliseconds, and
the maximum photographic exposure was obtained
with the shutter open for the best 40 milliseconds.
(See Figure 6-43.) Peak candlepower is important
as it greatly influences the amount of light pro-
duced in the best 40 milliseconds. The time-to-peak,
and the variation in the time-to-peak are important
for synchronization of the shutter open time and
the best 40 milliseconds of the light flash.
Dust-type photoflash devices produce flashes
o-57
АМСР 706-185
Figure 6-37. Typicol Photoflash Cartridge
which have lower peak intensities and longer dura-
tions than those produced by devices containing
flash powders, as shown in Figure 6-44. Image
compensation techniques are normally required
when dust-type photoflash bombs are used in order
to efficiently utilize the light produced.
6-4.4.1.2 Spectral Distribution
As shown in Figure 6-45, the spectral distri-
bution curve of tin* light produced by a photoflash
device consists of an intense continuous back-
ground on which a discrete spectra is superim-
posed.04 The spectral distribution of the radiation
produced by a dust-type photoflash bomb is similar.
While the more efficient photoflash compositions
at low altitudes produce light which is mainly
continuous, the more efficient compositions at high
altitudes (100,000 feet) are those which produce
an extensive discrete spectra in the visible.6563 (See
also Paragraph 6-4.5.)
6-4.4.2 Nature of the Photoflash Burst®768
The light-producing characteristics of a flash
item depend principally (as discussed in greater
detail in Paragraph 6-4.5) on the composition, the
amount and shape of the explosive which is used
to initiate the composition, and the ease. Flash
radiographic studies show that when a relatively
small amount of high explosive—centrally located
in a ease containing photoflash powder or metal
dust—functions, a bubble of explosion products
is formed in the first few microseconds of the
initiation of the explosive. The shape of this
bubble and the rate at which it expands are de-
pendent on the properties of the material sur-
rounding it, as well as that of the explosive initi-
ator. For example, the shape of the bubble pro-
duced by a small quantity of explosive in flake
aluminum which has a low density tends to be in-
fluenced more by the nature of the explosive and
its confinement than the bubble produced in an-
6-58
АМСР 706485
TABLE 648
DESIGNATIONS AND DESCRIPTIONS OF FLASH POWDER PHOTOFLASH BOMBS
Bomb Desig- nation Sire, in, L X Buj. Total H’l, lb Powder Peak Intensity, i0° Candta Time to Peak, msec Integral Light 104 Candleseconds Duration of Flash, msec to 0.1 mar, Caring
wt. lb I Formula
CPS Total Best CPSio
Type Class
M12 (Tl) 32X7.25 32 25 t 325 10 - - — 250 Paper tube divided into 2 compartments; powder filled 4/5 of volume; plywood partition; 2 grenade fusee ana parachute ш 1/5
M23 (T2) 25X4.25 10 7 I — 100 10 300 - 13.5 — — Fiber cylinder; later fitted with steel outer cue for improved ballistics
M48 (T3) 48X8 50 25 11 A.E 770 18 50 26 140 Inner fiber charge container; outer steel сам 0.03 in. will
T4 Enlarged M46 — 50 11 В 970 20 65 38.4(c) — Light weight sheet metal сам, powder in fiber container
T5 Enlarged M46 — 100 II A 1670 20 132 71.5(c) — Light weight sheet metal case, powder in fiber container
Тб (M60) 31.72X4.92 25 10 II В 300 n 15.4 8W — 0.0239-in. wall. Thin metal саде
T6E1 — — — — — 0.025-in. wall
T6E2 500 — — — — 0.048-in. wall
NDRC Types 1-8 58X10.75 200 80 to 88 Various Best 1700(bl 151Ы Г 18<ъ> Best 60.5<b.o) - 250-lb Tl casing
T9 145 70 11 В 850 2 99 30 270
Tdei 36X8 115 35 11 В — — — — — 125-lb demolition bomb, оме, 0.19 in.
T9E4-6 — — Various — — — — — wall
T9E8 35X8 163 70 III A 2100 5 140 65 153 M70; 0.19-in. wall
M120 52.25X8 150 70 III A 3490 6 166 75.6 153 Modified M70 chemical bomb body, bos type fin, 0,188-in. wall
M120 111 В 52.25X8 165 85 111 A 4490 6 223 95.9 188 Same ал M120
T92 39ХИ 280 138 Ill В 5840 5 290 140.5 226 Optimum design to fit in RIM aircraft; shallow, wide fin
T93 59.16X14.18 496 224 Ill A 4000 5 373 108 255 500-1 b G.P. bomb casing, AN-M46; M109 fin assembly
T94 69.5X18.8 926 450 111 A 5600 65 556 163 299 1000-tb G.P. bomb casing AN-M65
T99 4.25 or 13 95 to 160 70 — — — — — 42 — Thin copper casing, or steel, 0.0625 to 0.5-in. wall
TI04 64 or 104 (thin cue) Ill В (End on) 2900 3570 (thin case) 4 6 189 284 82 88 183 228(.) Modified МЗОА1 100-lb G.P. bomb body; or thin case model, modified M47A3 chemical bomb body
(a) Total duration
(b) With Type II, Class В powder
(e) During 0-60 msec
odized aluminum. The subsequent shape of the
bubble tn the metal dust depends on the resistance
encountered in different directions. If the con-
fining ease deforms slowly without rupture, the
shape of the explosion products will tend toward
the shape of the deformed case. If the case rup-
tures quickly at one point, the dust may be forced
through this opening while some of the dust will
remain in the ease. For small quantities of ex-
plosive, the shape of the explosive is of little im-
portance. For larger quantities of explosive, the
shape and its method of initiation must be con-
sidered. An extreme example is an end-initiated
line charge axially located in a surrounding cyl-
inder of metal dust. In all eases initiation ace
burning of the dust takes place in the air after ca
breakup.
If the surrounding material can react ropid\
gases resulting from the vaporization of the iva*-
tive material at the outer surface of th?
bubble of explosive products will i
rate at which the bubble expands. Tin f
this contribution depends on the reactiv
mixture. The piston action of the expanding bub-
ble forms a spherical shell of compressed flash
composition. Rapid chemical reaction starts at
the shock front when it reaches the case and the
increase in pressure results in case rupture. After
6-59
6-60
TABLE 6-19
CHARACTERISTICS OE DUST PHOTOFLASH BOMBS
Bomb Designation Size. in. LX Du — Powder Peak Intensity, 10е Candles Time lo Peak, msec Integral Light 106 Candletecs AUdude Flown, fl Burst Altitude and Position, ft duration of Flash, msec to 0.1 max Casing Burster
Wt 15 Wt. 16 Formula CPS Total Best CPSso
T7 46.72X8 65(T) 3S Mg. Grade В — — — — — Modified M46 case with dust charge
T8 T8EI 40X10.76 36X8 200 70 Flake .Mg, Grade В 41 44 9 1.9'*) — Modified ?50-lb AN-M57 G. P. Bomb case, 0.3-in. wall Tetryl; conical; tinplate container
150 35 Flake Al, Grade A 1100 10 49.4 35.1
T9E2 103 17 Flake Al 42 — 311 — - 125-lb demolition bomb case, 0.19-in. wall Tritonal 5 lb
T9E3 36X8 125 40 Pigment A|/S, 75/25 38 — 45 - — Same as T9E2
T9E7 Type 1 2 3 4 5 6 35X8 52 52 60 60 2i 21 Atomized Mg Atomized Mg Atomized Mg-Al alloy Atomized Mg-A| alloy Flake Al Hake Al 650 600 1300 1200 750 550 14 13 13 15 13 14 20 20 30 25 20 — — 1 1 ! 1 1 1 Sheet steel, 0.0G in. aall; casing/burster diam. ratio: 4:1 2 in. diameter each*. Tritcial, 5.8-lb Sodatol 6.1-lb Tritonal 5.8-lb Sodatol 6.1-lb Tritonal 5.8-lb Sodatol 6.L-lb
T86 (Ballistic Design) T86E1-4 66X8 100(T) 55 — — 0.2-in. case thickness —
35X8 35X10 29X11 24X12 85 70 Various metal dusts Varied: 1400- 2450 Varied: 34- 121 Varied: 164.5- 660 Varied' 50-94 25,000- 35,000 5,DOO- 15,000 119- 812 M47 chemical bomb case; 0.06 in. wall Various
M122 (Т86Ч2. 54X8 110 75 Atomized 65/35 Mg-AI alloy <20± 5 microns) 820 50 — 31.9 5.000- 20,000 8,000; 30° trail angle best — — M26, L-in.diant cylindrical; 2-lb cast 70/30 tritonal; ML47E1 fuze
T86E5 1 3 diam. — — Atomized AL — — — — — Thin A] or steel TN T and booster
09 27.5X4 18 9-5 AJ dust and KCIO< segregated 672 28 20.2 82 Concentric burster, ozi- dant, metal dust tubes Hand packed TNT; Tetryl booster; M146 fuze
0-70 48.6X8 96 70 Same as 0-69 Beet, 3490 42 Best, 130 To 30,000 At least 13,000; 30q trail M16 case adapted to concentric loading Hand packed TNT; Tetryl booster; .M146 fuze
T115 54X8 HO 84 Same as 0-69 Best, 1470 28 Best, 48,9 To 30,000 At least 13.000 30’ trail angle bett — Modified M47A3 chem. bomb case Larger than 0-70 burster
X52 39X10 175 114.2 Same as 0-69 Best, 4890 — — 160 ——— - Concentric casing, specially designed Hand tamped crys- talline 2-in. TNT, 4-lb; Tail fuze
X53 22X8 50 34.3 Al with 39c SiOz gel, KCIO4 — — -- — Concentric casing, specially designed 1.7-lb hand tamped TNT, Tetryl booster; Tail fuze
^Duricg 0-60 maee
AMCP 706-185
AMCP 706-185
TABLE 6-20
SEGREGATED OXIDANT PHOTOFLASH BOMBS
Bomb Designation Size in. LXDia. Total Weight, lb Powder Central Burster Peak Intensity, 10* Candles Integral Light l0*Candlesecs, Best 1ft ms. Period
Outer Shell Inner Shell
0-69 4X27.5 18 8.41b Al duet 3.1 lb KC1O, TNT burster 672 20.2
0-70 M46 casing 95 Al dust 70 lb total chg. KCICh TNT 3490 130
T115 X52 M47A3 Chemical bomb case 110 Al dust 84 lb total chg. KCICh TNT 1470 48.9
10X30 175 Atomized Al 78 lb 361b KC1O, TNT 4890 130
X53 8x22 50 Atomized Al 25 lb-3% silica gel 121b КСКЛ TNT 2200 (expected) 74 (expected)
ARMING
WIRE
WITH MI25FIN WEIGHT 160LB APPROX
Figure 6-38. Typical Photoflash Bomb
ease rupture the cloud expands against the at-
mospheric pressure, resulting in cooling of the
cloud. The cloud must contain fairly large sized
particle aggregates (approximately 250 microns)18
so as to reach the size observed experimentally.
The light output reaches a peak value and then
slowly decreases.
6-4.5 FACTORS AFFECTING PERFORMANCE
The light output of bright flash-producing de-
vices is dependent upon many interrelated factors.
Some of the more important of these factors are:
(1) charge weight, (2) composition, (3) particle
size, (4) burst diameter and shape, (5) igniters
and bursters, (6) confinement, and (7) ambient
pressure.
6-4.5.1 Charge Weight
Generally, flash powder in items which produce
a burst approaching a spherical shape (see also
Paragraph 6-4.5.4) develop a total light output
which is proportional to the charge weight (as is
6-61
AMCP 706-185
TABLE 6-21 TYPICAL COMPOSITIONS FOR PHOTOFLASH AND SPOTTING CHARGES
Type Class Nominal Composition Remarks
PHOTOFLASH POWDERS
I — 34% Magnesium 26% Aluminum 40% Potassium Perehlorate Used at start of World War IT in M46 Photoflash Bomb
II A 60% 50/50 Magnesium- Aluminum Alloy 10% Potassium Perchlorate Developed because of shortages at start of World War II of Aluminum and Magnesium Powder
В 45.5% 50/50 Magnesium- Aluminum Alloy 54.5% Barium Nitrate Later development led to substitution of Barium Nitrate for Potassium Perchlorate
III A 40% Aluminum, Class C 30% Potassium Perchlorate 30% Barium Nitrate
В Same as III-A except that the Potassium Perchlorate is coarser
IV — H0% Calcium 20^ Sodium Perchlorate Experimental Efficiency at 100,000 feet is 45.7 X 10³ candlesee/g
SPOTTING CHARGES 30% Atomized Aluminum 10% Flake Aluminum 60% Barium Nitrate Developed to give short time to peak but with less brisance than photoflash powders
the light produced in the best 40 milliseconds,
(>PS«o)- The duration of the flash increases as the
cube root of the charge weight, while the peak in-
tensity increases as the two-thirds power of the
charge weight.ee'7,, n The efficiency and light out-
put for a given weight of charge, therefore, decrease
with charge weight.
6-4.S.2 Composition
As indicated in Table 6-22,69 aluminum and
magnesium are the best fuels for use in photoflash
mixtures at low altitudes.18 72 While atomized mag-
nesium gives higher luminous intensities than
other fuels in consolidated illuminating composi-
tions, it has been found that atomized aluminum
gives better results in nonconsolidated illuminat-
ing compositions.
Thermodynamic data for stoichiometric mix-
tures of aluminum and various oxidizing agents
are given in Table 6-23.73 The trend is similar to
that for consolidated illuminants. (See Paragraph
6-3.5.1.) As the molecular weight of the oxidant
increases, the aluminum content of the stoichio-
metric mixture decreases so that the heat of reac-
tion also decreases. Of the oxidizers listed in this
table, potassium perehlorate produces the highest
heat of reaction with atomized aluminum. Lumi-
nosity values for various nitrates with atomized
aluminum and atomized magnesium are given in
Table 6-24. As indicated by this table, whieh is
6-62
AMCP 706-185
XM1O1 Spotting Projectile
Figure 6-39. Typical 20 mm Spotting Round
Figure 6-40. Photoflash "Daisy” Cartridge
for fuel-rich compositions, the light output of
stoichiometric mixtures are relatively low; and
alkaline earth metal nitrates are much more satis-
factory than alkali metal nitrates in nonconsoli-
dated illuminating compositions.
For dust-type bombs, there are marked differ-
ences in behavior of flake aluminum, atomized mag-
nesium. and atomized magnesium-aluminum al-
loys. Atomized aluminum is difficult to ignite and
has not been used efficiently in metal dust photo-
flash bombs. Flake aluminum, which requires a
weight cf burster approximately equal to that of
the dust, produces a flash of relatively short dura-
tion and a rapid time to peak. Atomized mag-
6-63
АМСР 706-185
TABLE 6-22
LUMINOSITY CHARACTERISTICS AT SEA LEVEL OF PHOTOFLASH COMPOSITIONS
CONSISTING OF HIGH-ENERGY FUELS IN STOICHIOMETRIC AND FUEL-RICH
COMBINATIONS WITH POTASSIUM PERCHLORATE
Time to Integral Light, Duration, Efficiency, Increase
Type of Peak, Peak, 103 candlesec, msec 103 candlesec/g in
Fuel Composition^' 10е candles msec (Йотах) Ио max Total Fuel Efficiency, %
Aluminum S 41 1.2 147 9 14 10.3
X 41 1.7 226 11 16 13.8 35
Magnesium s 18 1.2 142 16 24 10.0
20 2.3 189 17 25 11.5 15
Zirconium s 38 0.7 92 7 14 2.8 147
X 55 0.9 278 11 23 6.9
Titanium s 18 0.4 65 9 15 4.9 4
16 1.3 80 12 21 5.1
Calcium s 12 13 1.2 75 13 16 5.7 30
1.7 115 15 19 7.4
Boron s 0.5 23.0 18 «8 89 3.5 85
X 14.3 51 55 92 8.5
Silicon s Did not ignite
Did not ignite
•*> S = Stoicliiomelric, X — 14'/< excess fuel.
ntsiutn, which requires a much smaller burster,
gives a Hash of much longer duration and has a
longer time to peak. The magnesium alloys are
intermediate in their behavior. The difference in
the metal dust-to-burster ratio may be due to the
relative ignitihility of the metal fuels. Powdered
magnesium is easier to ignite than powdered alu-
minum; as a consequence, atomized aluminum has
not been used efficiently in a metal dust bomb.
The longer time to peak and flash duration of
magnesium ean be explained by the reaction be-
tween magnesium and nitrogen which precedes the
reaction with oxygen.
Small amounts of additives, principally metals
and silica gels, have been tried to increase the light
output from photoflash devices. Results, in gen-
mad, indicate that these additives do not increase
the output of those photoflash items which are near
optimum. Conflicting results have been obtained.
Some earlier investigators obtained results which
indicated improvement with some additives.18
6-4.5.3 Particle Size
-Much of the research and development concern-
ing photoflash compositions has centered around
the determination of the optimum particle size
and shape. While it has long been known that
the average particle size and particle size range
are important parameters in determining the lumi
nosity characteristics of pyrotechnic flash mix-
tures,18 detailed relationships were difficult to es-
tablish until methods became available to classify
6-64
AMCP 706-185
Figure 6-41. Typical Plath Charge for "Indication of
Functioning"
TABLE 6-23
THERMODYNAMIC DATA FOR STOICHIO-
METRIC MIXTURES OF OXIDIZING AGENTS
AND ATOMIZED ALUMINUM
Calculated
Stoichiometric Heat of
Ratio Reaction, Cc.l/g
Sodium nitrate
Potassium nitrate
Strontium nitrate
Barium nitrate
Potassium perehlorate
65.4/34.6 1955
69.2/30.8 1766
70.2/29.8 1899
74.4/25.6 1598
65.8/34.2 2529
the fuel ami oxidant powders into narrow partiele
size ranges.
For potassium perehlorate-aluminnni (60/40 by
weight) flash eompositions, it was found that only
systems in which the aluminum was in the 22 ± 8
micron partiele size range would produce enough
light for pyrotechnic applications.74 Regardless
of the oxidizer size, system containing coarser alu-
minum -8.4-40 microns and 24-62 microns—did
not produce a usable amount of light. When the
aluminum particle size was held constant, de-
creasing the oxidant particle size resulted in an
increased efficiency (candle seconds per gram)
at both sea level and at 80,000 feet simulated alti-
tude. (See Figure 6-46.) At high altitude, the
peak and integral light intensity vary similarly.
At sea level, however, the composition with the
coarse oxidizer produced the highest peak and in-
tegral light intensity, due to the greater tapped
density with the coarse oxidizer fraction, so that a
greater sample weight could be loaded into the
test cartridge.
The marked differences in the behavior of the
dusts used in dust-type photoflash bombs (Para-
graph 6-4.5.2) result in the existence of an opti-
mum partiele size for each metal or a’loy and each
method of dispersion.73 Excessively large particles
will not ignite after dispersal. Efficiency tends
to decrease, in the case of magnesium and mag-
nesium-aluminum alloys, if there is too large a
percentage of fines in the dust. As a consequence,
the use of “run of the mill,’’ less than 100 mesh,
atomized magnesium is preferable to the use of
mixtures containing a large amount of 325 mesh
fine particles.13
In order for the diameter of the burst produced
by dust-type photoflash bombs to be as large as
observed experimentally, calculations indicate that
(he metal dust particles must “clump’’ together
(possibly due to the pressure produced by the ex-
plosive burster) in fairly large particles, at least
250 microns in diameter. These “chimps,’’ due to
air-drug breakup as they move through the air,
leave small particles (particles having the initial
size distribution of the metal dust) which burn in
the air.13
6-4.5.4 Cloud Sb.ne
Since most photoflash bursts are essentially
spherical in shape and essentially opaque to visible
radiation, the amount of light radiated is propor-
tional to the square of the hurst radius, provided,
6-65
АМСР 706-185
TABLE 6-24
5 UMINOSITY VALUES OF VARIOUS OXIDANTS WITH ATOMIZED
ALUMINUM AND ATOMIZED MAGNESIUM TESTED
IN M112 PHOTOFLASH CARTRIDGE
Oxidant Time Peak to Intensity, Peak, 10е Candles mses Total Integral Light, 10° Candle-Seconds
Aluminum Compositions
Sodium uitrate Potassium nitrate Strontium nitrate Barium nitrate Burned without detonation Burned without detonation 124 3 1.61 139 3 1.64
Magnesium Compositions
Sodium nitrate 4 — —
Potassium nitrate F"'led to ignite
Strontium nitrate 21 5 0.33
Barium nitrate 42 5 0.65
Figure 6-42. Typical Time-Intensity Curve
the temperature of the surface of the burst re-
mains constant. Since the volume of the sphere is
proportional to the charge weight, and the maxi-
mum temperature is limited to about 3000°C, the
peak intensity should, as has been verified experi-
mentally (Paragraph 6-4.5.1), vry as the charge
weight to the two-thirds powt r. The efficiency of
the larger charges is, therefore, less than that of
the smaller charges but could be increased con-
siderably by enlarging the effective surface area of
the burst. Theoretically, an optimum system, as
long as the temperature remains high, consists of
an infinite number of infinitesimally small point
sources.76
Line photoflash charges, as well as a large
number of small photoflash charges have been at-
tempted with some success. Both methods, which
effectively increase the amount of radiating area
for a given charge weight, are difficult to use
practically.18 As a result of recent improvements
in aerial photographic techniques and equipment,
which permit the utilization of light over longer
periods of time (up to 250 milliseconds), pellets of
pressed illuminating composition have been used in
place of short duration photoflash charges. Results
indicate that efficiencies are much greater than
those obtained with photoflash compositions.76
6-4.5.5 Bursters and Igniters
A great many explosives have been tried (Table
6-25) as bursters in dust-type photoflash bombs.
In general, the most powerful or brisance buster
seems to perform best. RDX is better than tetryl
which, in turn, is better than TNT, other conditions
being equal. Aluminized explosives at optimum
6-66
АМСР 706*185
Figure 6-43. Synchronization of Shutter
Figure 6-44. Time-Intensity Curves for Ml 20Al Flash
Powder and Ml22 Dust Photoflash Bombs
concentrations have greater power than the pure
explosive and, therefore, perform better as
bursters.18
As has been indicated, there are marked dif-
ferences in the behavior of flake aluminum,
atomized magnesium, and atomized magnesium-
aluminum alloys when dispersed and ignited as a
dust cloud. Flake aluminum requires a weight of
burster approximately equal to the weight of the
metal dust. Atomized magnesium requires much
less weight, approximately 1/100 of the weight of
the metal dust.73 The maximum radius of a mag-
nesium dust flash depends, approximately, on the
cube root of the dust-to-burster ratio for the lower
ratios and on a somewhat lower power at the higher
dust-to-burster ratios. At a constant dust-to-burster
ratio, the radii of magnesium dust flashes increase,
roughly, as the cube root of the quantity of dust.
In general, for magnesium and magnesium-alu-
minum alloys, an increase in the dust-to-burster
ratio results in an increase in time to peak, an in-
crease in flash duration, along with an increase in
integrated light values, and, to a lesser extent, an
increase in light intensity. Because of the large
amounts of burster required for flake aluminum,
variations in the dnst-to-burster ratio within the
useful ranges seem to have little effect.
Other factors—including shape of the burster,
loading techniques, and confinement—have been
studied. Most dust-type bombs that have been
studied use a cylindrical burster or a truncated
cone. The method used to load a burster did not
appreciably influence the output of the dust bomb.
Centrally located bursters, all factors considered,
gave results comparable to those for any other lo-
cation. The shape of a relatively small amount of
explosive in an essentially nonreacting metal dust
should have little influence except to change the
eenter of the gas bubble formed. (See Paragraph
6-4.4.2.)M
For a reactive photoflash mixture where the
reaction contributes to the growth of the gas bub-
ble, the effect of location, shape, and amount of
initiator are important. The use of an initiator
too powerful for a particular case and composition
might cause too rapid expansion of the gas bubble,
resulting in case rupture before a desirable initia-
tion of the photoflash mixture. For a Jong column
of flash composition with an initiator in one end,
a stage can be reached where reaction in the
photoflash mix will propagate through the mixture
resulting in some measure of independence, from the
mode of ignition.1888 During this process, the case
must continue to maintain confinement in order to
have adequate ignition of the balance of the photo-
flash mixture.
6-4.5.6 Confinement
The characteristics of the case surrounding a
reactive photoflash mixture affect the amount of
time available for ignition of the mixture as well as
the way the mixture is released and disseminated.
A case of excessive strength, requiring an ap-
preciable amount of energy to rupture, may divert
6-67
AMCP 706-185
Figure 6-45. Spectral Energy Distribution Curve of MI20
Photoflash Bomb
TIME. MKLlSECONOt
Figure 6-47. Size and Light Output of Flash Cloud vs Time
•ЭП0ИЮ
sufficient energy to reduce the light output. Too
thin a case may allow the mixture to be released
before adequate ignition has taken place, thus
reducing the effectiveness of the flash. This effect,
which would be emphasized at low ambient pres-
sures, was illustrated in tests conducted with metal
and plastic cases. With the metal case, the ex-
pected light output was obtained at ambient con-
ditions and 80,000 feet and with the plastic case
at ambient conditions; however, a sharp drop oc-
curred for plastic cases at 80,000 feet. Variations
in thickness within narrow limits for metal cases
were found to cause negligible changes in light
output.®8
AVERAGE PARTICLE SIZE POTASSIUM PERCHLORATE, MICRONS
Figure 6-46. Effect of Particle Size of Potassium Perchlo-
rate on Luminous Efficiency of 60/40 Potassium Perchlo-
rate-Aluminum Compositions
TABLE 6-25
HIGH EXPLOSIVES TRIED AS BURSTERS
IN FLASH BOMBS
Nonmetallized Comp. A-3 Comp. C Gunpowder Photoflash Powder Type III, Class C Primacord Pyrotechnic Compn. RDX RDX/TNT RDX/TNT, 60/40 Sodatol Tetryl Tetryl/TNT, 30/70 TNT Metallized Al/КСЮ</cellulose nitrate, 49/49/2 Comp. A-3/A1,80/20 Comp. B/Al,80/20 HBX-3 HBX-6 Minol 2 RDX/А1/wax RDX TNT/Al, 42 ЧЯ (Torpex 2) 20, k, RDX/TN. /Al/Carbon, 20/55/25/2.5 RDX/A1/PIB, 78.5/20/1.5 Tetryl/Al TNT/A1 Tritonal: TNT/Al 70/30 75/25 80/20
For dust-type photoflash bombs, the casing ma-
terial has a relatively unimportant influence on
the light output. The thickness of the case has a
limited but not critical effect on the output, espe-
cially with large bursters.78 77
6-68
АМСР 706-185
TABLE 6-26
LUMINOSITY CHARACTER! f 03 OF PHOTO FLASH COMPOSITIONS CONSISTING OF
HIGH-ENERGY FUELS IN STOICHIOMETRIC COMBINATION WITH
POTASSIUM PERCHLORATE*
Fuel Composition Weight, g Peak, 10е candles Time to Peak, msec Integral Light, 103 candlesec, (Йотах) Dnration, msec Efficiency, IO3 candlesec/g
Ио max Total Composition Fuel
Sea Level
34% Aluminum 42 41 1.2 147 9 14 3.5 10.3
41% Magnesium 35 18 1.2 142 16 24 4.1 10.0
57 % Zirconium 58 38 0.7 92 7 14 1.6 2.8
41% Titanium 33 18 0.4 65 9 15 2.0 4.9
58% Calcium 23 12 1.2 75 13 16 3.3 5.7
17% Boron 31 0.5 23.0 18 68 89 0.6 3.5
29% Silicon 35 Did not ignite
100,000 Feet
34% Aluminum 42 49 1.3 103 7 14 2.5 7.3
41% Magnesium 35 16 0.5 10 1.2 33 0.3 0.7
57% Zirconium 58 65 0.7 92 3 11 1.6 2.8
41% Titanium 33 29 0.6 49 4 13 1.5 3.7
58% Calcium 23 26 0.5 176 21 29 7.7 13.3
17% Boron 31 No deflection
29% Silicon 35 Did not ignite
* Test vehicle, M112 charge case reduced to 1.72-inch length.
6-4.S.7 Ambient Pressure
As indicated by the data in Table S-26 the
light output of most possible photoflash mixtures
is less at an altitude of 80,000 feet than at sea
level. Of th? high energy fuels evaluated, alu-
minum and magnesi, ,n were most efficient at sea
level and calcium was most efficient up to 100,000
feet.ee As the bciling point, and extent of dissocia-
tion of the reaction products depend on the am-
bient pressure, the final flash temperature will
decrease with increasing altitude. The radiation
produced by most photoflash items is continuous
(see Paragraph 6-4.4.1.2) approaching that of a
graybody with a high emissivity and lower light
values obtained. Some compensation for this loss
of light results because the flash diameter at alti-
tude (Figure 6-47) is greater than at sea level.68
The effectiveness of photoflash mixtures con-
taining calcium depends on the formation and
energy content of discrete bands.78 The phenome-
non of increasing light output observed with com-
positions containing calcium metal, calcium alloys,
calcium perehlorate, and calcium nitrate also re-
sults when adding an inert calcium salt such as
calcium oxide or calcium fluoride to a composition
producing a high temperature sueh as aluminum-
potassium perchlorate. The magnitude of the in-
crease in light output, however, is considerably
less than for other calcium-containing composi-
tiotis.86
6-69
АМСР 706-185
REFERENCES
1. Alan St. H. Brock, A History of Fireworks,
George G. Harrap and Co., Ltd., London.
2. Jean Appier (alias Hanzelet), La Pyrotechnie,
Pont a Mousson, 1630 (quoted in Brock, A
History of Fireworks).
3. Claude Ruggieri, “Elemens de Pyrotechnie,”
Fortune, Paris, 1801 and 1821 (quoted in
Brock, A History of Fireworks).
4. Claude Ruggieri and Thomas Morel, “Die
Pyrotechnie,” Nach der Vorschriften, Leipzig,
1807 (quoted in Brock, A History of Fire-
works).
5. Claude Ruggieri, “Pyrotechnie Militaire,”
Fortune, Paris, 1812 (quoted in Brock, A
History of Fireworks).
6. James Cutbush, “Chinese Fire,” American
Journal of Science, VII, 1823 (quoted in
Brock, A History of Fireworks).
7. Summary Technical Report, Vol. 2, Chapter
4, NDRC Division 11, National Defense Re-
search Committee, Office of Scientific Research
and Development, Washington, D. C.
8. D. Hart, Research and Development Progress
in Military Pyrotechnics, Research and De-
velopment Lecture No. 24, Picatinny Arsenal,
Dover, N. J., 1955 (DDC-AD 82 678).
9. T. Stevenson, E. R. Rechel, Delay Action
Tracer Ammunition, Frankford Arsenal Re-
port R-44, Frankford Arsenal, Philadelphia,
Pa., 1940.
10. T. Stevenson, Delay Action and Dim Igniters
for Small Arms Tracer Bullets, Frankford
Arsenal Report 708, Frankford Arsenal, Phila-
delphia, Pa., 1946.
11. Develop, Manufacture and Test Flashlight
Bombs, Picatinny Arsenal Technical Report
803, Picatinny Arsenal, Dover, N. J., March
1937.
12. J. H. Robinson, Investigation of Failures of
M2.3 Photoflash Bombs, Picatinny Arsenal
Technical Report 1068, Picatinny Arsenal,
Dover, N. J., January 1941.
13. H. J. Eppig, D. Hart, Bomb, Photoflash, T9
Series: Development of Improved Photoflash
Composition, Picatinny Arsenal Technical Re-
port 1758, Picatinny Arsenal, Dover, N. J.,
January 1950.
14. S. A. Richer, The Photoflash Bomb, Picatinny
Arsenal, Dover, N. J., April 1955.
15. H. J. Eppig, D. Hart, Bomb, Photoflash, T9
Series: A Study of Light Emission Character-
istics of Safe, Dust Type Photoflash Bombs,
Picatinny Arsenal Technical Report, 1757,
Picatinny Arsenal, Dover, N. J., February
1950.
16. S. A. Richer, The Photoflash Cartridge, Pica-
tinny Arsenal, Dover, N. J., April 1955.
17. M. G. M. Clarke, Development of the Photo-
flash Bomb, ORDWES Report 1949-5, Wes-
leyan University, Middletown, Connecticut,
April 1949.
18. The Compilation of Flame and Shockwave In-
formation Applicable to Photoflashes, Final
Summary Report, Contract DAI-28-017-501-
ORD(P)-1096, Arthur D. ^ittle, Inc., Cam-
bridge, Mass., September 1955.
19. R. M. Blount, G. Francis, R. W. Evans, Study
of Light Sources for Night Aerial Reconnais-
sance Photography, Contract DA-36-039-SC-
78333, Denver Research Institute, Denver,
Colorado, August 1960.
20, George Shortley and Dudley Williams, Ele-
ments of Physics, 3rd Ed., Prentice-Hall, Inc.,
Englewood Cliffs, N. J., 1961.
21. S. Gladstone and B. Lewis, Elements of Phys-
ical, Chemistry, Van Nostrand Co., Inc., Prince-
ton, N. J., April 1960.
22. B. Douda, The Theory of Colored Flame Pro-
duction, RDTN-71, Naval Ammunition Depot,
Crane, Indiana; Bureau of Naval Weapons,
Washington, D. C.
23. E. J. Bowen, The Chemical Aspects of Light,
2nd Ed., Clarendon Press, Oxford, 1946.
24. International Encyclopedia of Chemical Sci-
ence, Van Nostrand Co., Inc., Princeton, N. J.
25. A. C. Gaydon, The Spectroscopy of Flame,
Chapman and Hall, Ltd., London, 1957.
26. A. (’. Gaydon and H. C. Wolfhard, Flames,
Their Stricture, Radiation and Temperature,
2nd Ed., Chapman and Hall, Ltd., London,
1960.
6-70
AMCP 706-185
REFERENCES
27. Wallace R. Brode, Chemical Spectroscopy,
John Wiley & Sons, N. Y., 1943.
28. A. Franson, S. К vtz, and E. Raisen, “Radia-
tion Characteristics of Black Body Sources,”
Symposium on Temperature, Its Measurement
and Control, Reinhold Publishing Co., N. Y., 47
1962.
29. K. Kinglake, Ed., Applied Optics and Optical
Engineering, Vol. I, Academic Press, .1965,
p. 8.
30. J. Thcwlis, Ed., Encyclopedia Dictionary
Physics, Pergamon Press, Ltd., London, 1961.
31, M. G. Mellon, Ed., Analytical Absorption Spec-
troscopy, John Wiley & Sons, Inc., N. Y.,
1950.
32. R. I>. Weber, M. W. White, К. V. Manning, 43'
Pnysics for Science and Engineering, McGraw-
Hill Book Co., Inc., N. Y., 1957.
33. R. C. Casperson, H. P. Lenzyek, R. C. Chan- 44’
nei, Visibility Data as It Applies to Pyrotech-
nics, Contract DAI-28-017-501-C»RD(P)-1294,
Dunlap and Associates, Stamford, Connecti-
cut, April 25, 1955.
34. E. Freeman, G. Weingarten. A Thermal
Theory for Hates of Propagative Burning,
Pieatinny Arsenal Technical Report 2596, 4"*'
Pieatinny Arsenal, Dover, N. J., June 1959.
35. D. Hart, H. J. Eppig, Long Range Research
on Pyrotechnics: Burning Characteristics cf
Binary Mixtures, Pieatinny Arsenal Technical
Report 1669, Pieatinny Arsenal, Dover, N. J.,
October 1947 (DDC-ATI 66 289). 46’
36. Herbert Ellern, Modern Pyrotechnics, Chem-
ical Publishing Co., N. Y., 1961.
37. В. E. Douda, Relationships Observed in Col-
ored Flares, RDTR-45. Naval Ammunition
Depot, Crane, Indiana; Bureau of Naval ^7.
Weapons, Washington, D. ('., September 1964.
38. R. F. Barrow and E. E. Caldin, “Some Spec-
troscopic Observations of Pyrotechnic Flames,”
Proceedings of Physical Society of London,
62 (1949'1 48.
39. В. E. Douda, Emission Studies of Selected Py-
rotechnic Flames, RDTN-77, Naval Ammuni-
tion Depot, Crane, Indiana; Bureau of Naval
Weapons, Washington, D. C., August 1964. 49.
40. R. C. Folweiler, W. J. Mallio, Thermal Radia-
(cont’d)
tion Characteristics of Transparent and, Trans-
lucent Material Under Nonisothermal Condi-
tions, ASDTDR 62-719, Air Force Systems
Command, Wright-Patterson Air Force Base,
Ohio, June 1964.
B. Jackson, S. M. Kaye, G. Weingarten, Resins
Other Than Laminac 1116 as Binders in Pyro-
technic Compositions, Pieatinny Arsenal Tech-
nical Note 40, Pieatinny Arsenal, Dover, N. J.,
January 1960.
II. J. Eppig. J. D. Straeham, Self-Hardening
Pyrotechnic Compositions, Pieatinny Arsenal
Technical Report 1801, Pieatinny Arsenal,
Dover, N. J., December 1950.
D. Hart, Research, and Development in Mili-
tary Pyrotechnics, Pieatinny Arsenal, Dover,
N. J., February 1955 (DDC-TIP U10769).
B. Jackson, An Investigation of the Effects
of Loading Pressure, Flare Case Coating, and
Magnesium Particle Size on the Burning Time,
Luminous Intensity, and Color Characteris-
tics of Pyrotechnic Flare Compositions, Pica-
tinny Arsenal Technical Note 14, Pieatinny
Arsenal, Dover, N. J.
R. M. Blount, R. W. Evans, Experimental In-
vestigation of Infrared Radiating Sources,
Denver Research Institute, Denver, Colorado,
July 1961 (DDC-AD 324 807), March 1962
(DDC-AD 328 630), November 1962 DDC-
AD 332 848).
B. Jackson, The Effect of Cross-Sectional Area
and Case Material on Burning Characteristics
of Pyrotechnic Compositions, Pieatinny Ar-
senal Technical Note 7, Pieatinny Arsenal,
Dover, N. J., September 1957.
A. F. Taschler, S. M. Kaye, Effects of Mag-
nesium Content Case Material and Case Coat-
ing on Burning Characteristics of a Flare
System, Pieatinny Arsenal Technical Note 42,
Pieatinny Arsenal, Dover, N. J., April I960.
S. Resnick, Simulated High Altitude Tests of
Illumination Compositions, Pieatinny Arsenal
Report 2166, Pieatinny Arsenal, Dover, N. J.,
April 1955.
W. A. Sehnieling, Applied Research for Threat
Signature (J< iteration Techniques, Final Re-
6-71
АМСР 706-185
REFERENCES (coat’d)
port, Denver Research Institute, Denver, Col-
orado, August 1963 (DDC-AD 340 411).
50. R. Shulman, Effects of Variation of Cavity
Geometry Upon Small Arms Tracer Burn-
ing, Frankford Arsenal Report 1421, Frank-
ford Arsenal, Philadelphia, Pa.
51. E. S. Freeman, “The Kinetics of the Under-
water Corrosion of Powdered Magnesium,”
Journal of Physical Chemistry 59, 1009
(1955).
52. R. M. Blount, G. Francis, Study of Light
Sources for Night Aerial Reconnaissance Pho-
tography, Contract DA-36-039-SC-78333, Den-
ver Research Institute, Denver, Colorado, Au-
gust 1960.
53. J. R. Quick, R. T. Johnson, Simplified Method
of Determining Optimum Burst Altitudes for
Aerial Photoflash Bombs Under Various Con-
ditions of Light Output and Flight Altitude
for Fixed Camera Trail-Angle Combination,
WCLR-55-5, Wright Air Development Center,
Air Technical Service Command, Wright-Pat-
terson Air Force Ease, Ohio, November 1956
(DDC-AD 110 518).
54. Night Aerial Photography, A Technical His-
tory, Wesleyan University, Middletown, Con-
necticut, July 1954 (DDC-AD 46 595).
55. The Magnesium Burner; Uses Other Than
Photographic, Wesleyan University, Middle-
town, Connecticut, May 1951 (DDC-ATI 168
202).
56. The Magnesium Burner, II. Fuels, Wesleyan
University, Middletown, Connecticut, October
1952 (DDC-ATi 171 350).
57. R. T. Eckenrode and F. L. Marian, The Spot-
ting Technique: The Question of Spot vs
Smoke and Spot Duration, Memo for Record,
Project TS 4-4020, Frankford Arsenal, Phila-
delphia, Pa., November 1964.
58. R. T. Eckenrode, The Spotting Technique: Ef-
fect of Ambient Illumination, Spot Intensity
and Color, Memory Screen Information, Memo
for Record, Project 754, Frankford Arsenal,
Philadelphia, Pa., October 1955.
59. D. D. Collins, Pyrotechnic Flashes and. Flares
in Guided Missile Tracking, Redstone Arsenal,
Huntsville, Alabama, December 1959.
60. R. G. Weidon, Development of the Signal,
Flash, Guided Missile MK 37 Mod О far the
Sparrow III Missile, NAVORD 5860, Bureau
of Naval Weapons, Washington, D. C., May
1958,
61. J. W. Haldeman, Development of the Signal,
Flash, MK 49 Mod О for the Terrier BT-3 Mis-
sile and the Signal, Flask, MK 56 Mod О for
the Corvus Missile, NAVORD 7055, Bureau
of Naval Weapons, Washington, D. C., Sep-
tember 1960.
62. Air Force Manual 55-6, Department of Air
Force, Washington, D. C.
63. Air Force Manual 95-3, Department of Air
Force, Washington, D. C.
64. S. Haffner, A Survey of Available Literature
on the Rapid Combustion of Metals in Air,
Picatinny Report 2061, Picatinny Arsenal,
Dover, N. J., September 1954 (DDC-AD 44
543).
65. A. A. Shidlovsky, Fundamentals of Pyrotech-
nic, Government Publication of the Defense
Industry, 1st Ed., Moscow, 1943 (Library of
Congress Call No. UF 860.85), 2nd Ed., Mos-
cow, 1954 (Library of the University of Cali-
fornia, Berkeley, Calif.).
66. S. Lopatin, Sea Level and High Altitude Per-
formance of Experimental Photo flash Composi-
tions, Picatinny Arsenal Technical Report 29,
Picatinny Arsenal, Dover, N. J., October 1961.
67. J. Hershkowitz, The Action of an Explosive
on Surrounding Nonreacting Metal Dust, Pica-
tinny Arsenal, Dover, N. J., December 1957
(DDC-AD-150 486).
68. J. Hershkowitz, The Mechanism of Ignition and
Propagation of Oxidant-Metal Flashes, Pica-
tinny Arsenal, Dover, N. J., April 1958 (DDC-
AD 156 424).
69. R. M. Badger, A. L. Wahrhaftig, Further
Studies of the Effect of Composition on the
Properties of Flash Powders, Contract W-535-
AC-24521, California Institute of Technology,
Pasadena, California, July 1942.
70. R. G. Clarke, W. C. Nelson, R. W. Stallbaum,
Photoflash Bomb. IV. The Effects of Cast and
Hand Packed Bursters, ORD 1951-2, Wes-
6-72
6-41
REFERENCES (cont’d)
leyan University, Middletown, Connecticut,
June 1951 (DDC-AD 51 317).
71. Further Investigation of Photoflash Powders,
Memo Report ENG-M-59-676-15-26, AAF Ma-
teriel Center, Photographic Laboratory Sec-
tion, Air Technical Service Command, Wright-
Patterson Air Force Base, Ohio, February
1943.
72. P. Tavernier, Contribution to the Study of
Flash Powders, Translation by U. S. Joint
Publication Research Service of report from
Liberateire de la Commission des Substances
Explosive, 17 May 1944, Picatinny Arsenal
Technical Memorandum 1072, Picatinny Ar-
senal, Dover, N. J., October 1963.
73. G. Weingarten, Chemistry of Pyrotechnics,
Presentation at Picatinny Arsenal, Dover,
N. J.
74. S. M. Kaye, J. Harris, Effect of Fuel and Oxi-
dant Particle Size on the Performance Char-
acteristics of 60/04 Potassium Perchlorate/
Aluminum Flash Composition, Feltman Re-
search Laboratory Technical Report 44, Pica-
tinny Arsenal, Dover, N. J., November 1961
(DDC-AD 266 486).
75. S. Lopatin, C. A Knapp, Pelletization of П-
luminants to Improve Photoflash Efficiency,
Picatinny Arsenal Technical Note 24, Pica-
tinny Arsenal, Dover, N. J., August 1959
(DDC-AD 207 077).
76. R. G. Clarke, The Photoflash Bomb. III. The
Casing and the Dust Charge, ORDWES Re-
port ORD 1950-4, Wesleyan University, Mid-
dletown, Connecticut, June 1950.
77. R. G. Clarke, С. B. Ford, The Photoflash
Bomb. II. Technical Developments in 1947-9,
ORDWES Report 1949-11, Wesleyan Univer-
sity, Middletown, Connecticut, May 1949.
78. S. Lopatin, High Altitude Flash Characteris-
tics of Calcium/Potassium Perchlorate and
Standard Photoflash Compositions, Picatinny
Arsenal Technical Report 2646, Picatinny Ar-
senal, Dover, N. J., October 1959 (DDC-AD
313 204).
6-73
АМСР 706-185
CHAPTER 7
PRODUCTION OF SMOKE
7-1 HISTORICAL SUMMARY, GENERAL
The military use of smoke for screening and/or
signaling is probably as old as warfare itself.1,2
Before gunpowder and other pyrotechnic mixtures
were available, smoke was made by the burning
of natural materials such as grass. The wide-
spread, planned use of smoke in military opera-
tions may, however, be considered to be a develop-
ment of World War I. During this period, smoke
was used extensively for signaling, screening troop
movements, and as a fear mechanism due to the
resemblance of screening smokes to certain toxic
chemical agents.1,3
The research and development concerned with
the military use of particulate clouds started dur-
ing World War I and was continued at a limited
rate in the period between the two World Wars.
The tactical significance of the planned use of
smoke, which was not fully realized until the close
of World War I, was strongly considered early in
World War II where the requirements for smoke-
producing devices were much greater. Consequent-
ly, extensive research and development programs
were established early during World War II to
obtain the information necessary to develop the
tactically required smoke-producing items.
After World War II, research and development
programs on particulate clouds of military interest
were continued again at a reduced rate. In spite
of this limited effort, information obtained from
these programs proved valuable during the Korean
Conflict. Since that time, work has progressed
in the development of improved smokes and in
fulfilling new requirements for aids in the tracking
and acquisition of missiles and aircraft.
The research and development in exploiting the
usefulness of particulate clouds for military pur-
poses have also proved to be of great value for
civilian applications. These include the physics
of atomization, the production of high efficiency
filters for industrial purposes, dispersion methods
for chemicals used in the control of insects,3 and
cloud travel and contamination behavior for use
in the solution of industrial pollution problems.
7-1.1 SCREENING SMOKES
The tactical possibilities of using smoke to
screen friendly troops and terrain from enemy
observation, were comparatively late in being ap-
preciated. Isolated tactical uses are recorded, such
as the screening of a river crossing with the smoke
produced by the burning of damp straw by Charles
XII of Sweden in 1700.1 However, for the century
prior to World War I, the dense clouds of smoke
incidental to the use of black powder had been a
growing nuisance; and methods for the artificial
generation of smoke for military purposes were
neglected until just before World War I when the
first experiments of this type were made in con-
nection with naval operations.
The German Navy performed with ship-borne
generators using sulfur trioxide and chlorosulfonic
acid from 1906 to 1909 and used these methods for
producing smoke in exercises carried out in 1914.
At about the same time, the British and American
Navies investigated the use of “funnel smoke”
produced by restricting the air supply to the fur-
naces. The naval use of screening smoke developed
rapidly enough so that the German Navy employed
it with great success in the Battle of Jutland.
Screening smokes played an increasingly impor-
tant role in later naval engagements.
During World War I, the dense elouds pro-
duced in damp weather from chlorine gas also
served to mask other activities and clearly demon-
strated the tactical value of smoke in land war-
fare. The British, in 1915, were the first to make
use of smoke on land to simulate gas attacks and
to screen advancing troops. The material used to
generate this smoke was the British type-S smoke
7-1
АМСР 706-185
mixt re of pitch, tallow, black powder, and salt-
peter. The obscuring power of the smoke was due
to incomplete combustion of the solid particles in
rhe pitch. Screening smoke was used on a large
«•ale by the Canadians in their attack on Messines
Ridge in September 1915. During the following
year, the use of smoke continued to increase as its
raluc became apparent to all of the major bellig-
“rents.1
Both red and white phosphorus were soon intro-
iuced as smoke-producing materials. White phos-
ihorus proved to be the more efficient of the two and
.vas by far the most efficient smoke-produeing ma-
rerial introduced during World War I. Sulfur
rrioxide was the next most efficient smoke-produc-
ng material used, in spite of the fact that humid
rir was required to form the sulfuric acid fumes.
)ther materials which produce sulfuric acid fumes
>n contact with humid air, such as oleum, chloro-
inlfonie acid, and sulfuryl chloride, were also
videly used. The two latter materials also pro-
luced hydrochloric acid fumes. Metallic chlorides,
ncluding tin tetrachloride (British K.J., French
Opacite), titanium tetrachloride (German F-Stoff;
Jnited States FM), and silicon tetrachloride, were
dso used.
Another group of materials, producing the so-
alled zine smokes, were basically mixtures of zinc
lust and an organic chlorine-containing compound.
The Berger mixture, used by the French during
Уогк! War T, was composed of zine dust, carbon
etrachloride, ziuc oxide, and kieselguhr. An im-
iroved mixture was developed in 1917 by the U. S.
bureau of Mines and was known as the BM Mix-
ure. This mixture consisted of zinc dust, carbon
etrachloride, sodium chloride, ammonium chloride,
nd magnesium carbonate.
The introduction of military aircraft, especially
lumbers whieh could attack important rear-area
argets, created a definite need for large-area
moke screens for protection. Consequently, much
f the effort between the two World Wars was di-
luted toward developing techniques for producing
he.se large-area smoke screens, including the use
•f aircraft for this purpose? ’' At thi beginning
f World War II, however, neither the United
Itates nor Great Britain had a satisfactory mate-
rial or a suitable method for producing large-area
screens.
The smoke munitions available in 1940 included
projectiles, bombs, smoke pots, grenades, and air-
plane spray tanks, which were sufficient to enable
ground tactical units to conceal their movements
by laying curtains of smoke across the battlefront.
The tactical employment of small, smoke-produc-
ing munitions was established as a result of actual
experience in field maneuvers and demonstrations.
The principal screening materials available in-
cluded sulfur trioxide-chlorosulfonic acid (FS),
a liquid solution for use in projectiles and airplane
spray tanks; hexachloroethane-metallic zinc mix-
ture (HC), a solid mixture used in burning-type
munitions sneh as grenades and smoke pots; and
white phosphorus (WP), used in grenades, pro-
jectiles and bombs. These materials were superior
to similar materials developed and used during
World War I.
The effectiveness of German air operations
against British cities during 1940-41 was consider-
ably reduced through the use of large-area smoke
screens whieh prevented accurate aiming. The
British protected important industrial centers with
smoke pots of an oil-burning type similar to the
smudge pots used in United States orange groves.
Lines of smoke pots were laid out in such a manner
that the vital area was screened under any wind
direction. The operation of this type of stationary
smoke pot line required an extensive supply system
since all important areas needed protection. As a
result, the British developed truck-mounted mo-
bile generators, the most suitable of which was
known as the “Haslar” which produced a gray-
brown smoke by burning and vaporizing crude
Oil.4'6
In the United States, the Defense Department
and the National Defense Research Committee,
along with several universities and industrial con-
cerns, cooperatively embarked on a research pro-
gram to produce large-area smoke screens. Farly
in 194'2, the optimum particle size for a hydro-
carbon smoke was determined and mechanical
smoke generators were developed to produce this
type of screen.6 Work on smoke pots based on the
venturi principle was started at this time using
fuel blocks to vaporize volatile materials; however,
2
АМСР 706-135
these devices were not fully ready for production
during World War IT.
The smoke-producing materials such as WP,
FS, and HC had disadvantages which at times,
limited their usefulness in World War 11. All of
the smokes produced from these materials were
irritating. FS smoke was corrosive in the presence
of moisture. WP smoke tended to rise rapidly, or
to pillar, due to the heat given off by the burning
phosphorus. HC, and similar smoke compositions,
produced zine chloride which was toxic. In spite
of the disadvantages, these items were used, along
with th<> newly developed, mechanical smoke-pro-
ducing devices, in advancing the strategic and
tactical use of smoke during World War II. For
the first time, large areas, including whole cities,
could be screened from aerial observation for rela-
tively long periods of time.4,5
Screening smoke again proved to be of value
in the Korean action in which the United Nations’
Forces operated without the benefit of air superi-
ority for much of the time. Hence, large-area
screens were employed to protect vital port areas
as well as forward combat areas.7 In addition,
much of the Korean action was a st-uggle for dom-
inating terrain, and smoke was constantly used in
relatively small-scale operations. Colored smoke
was also used for screening personnel withdrawal
operations because it persisted longer than the
white phosphorus smoke normally used for this
purpose.1'®'8
7-1.2 SIGNAL SMOKES
The need for methods of signaling when neither
hand signal nor flag is visible, nor the sound of
voice or horn is audible, has long been recognized.
Smoke signals have been used for this purpose since
ancient times. However, the thick haze of black
powder smoke which enveloped battlefields vir-
tually eliminated smoke as a signaling agent for a
time. The introduction of smokeless powder again
made smoke signals a valuable method of com-
munication in military operations. In spite of the
many improvements in communications methods,
signal smoke continues to have an important place
in modern warfare.
Prior to World War 1, a limited number of
pyrotechnie items, mainly colored flares, were used
by the Services. Little information on the manu-
facture and application of colored smoke signals
was available in the United States at the beginning
of World War 1 due, mainly, to the curtailment in
fireworks manufacture. Investigations were started
by various civilian and military agencies. Various
types of smoke signals—including both parachute
and nonparachute rockets, rifle grenades, Very
pistol cartridges, hand grenade signals for avi-
ators, submarine recognition signals, and smoke
pots for ground use—were developed in a variety
of colors. Inasmuch as the American Expedition-
ary Forces were to operate in a sector held by the
French Army, it was found expedient to adopt the
entire French Army system ef pyrotechnics.
The French used colored smoke signals which
consisted of red and yellow smokes in signal para-
chute rockets, rifle grenades, 25 mm and 35 mm
Very pistol cartridges, and a messenger signal.
The only French smoke manufactured in the
United States was yellow smoke, since this item
could be produced from available ingredients; the
other colored smokes, such as red, could not be
manufactured because necessary dyestuffs were in
short supply at that time. The United States did
not develop mortar or artillery projectiles produc-
ing colored smoke during World War I.
The British Army also recognized the need for
colored smoke signals and developed a number of
such munitions early in World War I. Red, yel-
low, blue, and violet smokes were developed for
use in rifle grenades (with or without parachutes),
in Very pistol cartridges, and in 3-inch mortar
projectiles. A red and blue smoke filling for the
4.5-ineh projectile was developed for artillery spot-
ting and aviation signaling. Dummy drop bombs
or subcaliber bombs containing colored smoke All-
ings were developed for training purposes. By the
close of World War I, the Allies succeeded in de-
veloping experimental colored smoke rifle grenades
as well as rockets and Very cartridges in a variety
of colors. They also made some use of colored
smoke for artillery spotting. Virtually no informa-
tion is available concerning the use of eolored
smoke by the Germans and Italians during World
War I.
Although the research and development effort
in the United States proceeded at a reduced rate
7-3
AMCP 706485
in the period between World Wars I and II, a
considerable number of unuiitions for producing
colored smoke were developed. Included among
these items were colored sinoke hand and rifle gre-
nades, canisters containing colored smoke fillings
for various calibers of projectiles, colored streamer
smoke bombs, colored smoke markers for aerial
delivery containers, and colored bursts for the 4.2-
ineh chemical mortar projectile. All of these were
produced in a variety of colors. The British Army
also developed colored smoke rifle and hand gre-
nades, and colored smoke fillings for most of their
artillery projectiles. The German Army limited
their colored smoke signals to various small hand
signals.
Extensive use of signal smoke in World War II
and the Korean Conflict proved that the use of'
colored smoke for signaling purposes has an im-
portant place in the communications system of
modern warfare. Four colors—red, green, yellow,
and violet—were found to be the most suitable.
Smokes were also of value in marking a specific
operations area or target They also played an
important part in antisubmarine warfare and in
air-sea rescue operations. In many instances, espe-
cially in the Korean Conflict, the use of pyrotech,
nie signals, including smoke, was much faster and
more effective than more modern communications
methods when the tactical situation was degen-
erating.”
7-1.3 TRACKING AND ACQUISITION
SMOKES
Smoke has been found to definitely complement
the observance of tracer projectiles and, more
recently, has been used as a space vehicle tracking
aid. Tracer bullets, while developed as a light-
producing device for improved aim and fire con-
trol for automatic weapons, emit, distinct amounts
of white smoke which is composed essentially of
metal oxide particles. Under certain atmospheric
conditions, such as firing into bright sunlight, the
smoke traii is easier for a gunner to follow than a
red flame tracer, although the flame tracer is the
best under most other conditions. In 1923, studies
were undertaken to develop a smoke tracer. It
was soon apparent that attempts to increase the
volume of the smoke trail along the trajectory re-
sulted in a decrease in the flame color and intensity.
Since the wame tracer was considered most im-
portant., the work was not pursued. After World
War II, a requirement for smoke tracers was re-
established, and improved smoke tracers were de-
veloped based on the use of organic dyes,10 the
best of which were of the anthraquinone series
producing orange-red smoke. These smoke tracers
were developed primarily for training pilots to
improve their gunnery7 score with wing-mounted
guns. Due to the pilot’s extreme forward position
in the aircraft, flame tracers coming from the whig
guns in the rear were difficult to pick up and fol-
low visually as they passed. Smoke tracers, on the
other hand, left a lingering trail which was easier
to sight and point at the target. However, since
they could not be seen readily at night they were
not considered all-purpose tracers and, consequent-
ly, did not become standardized.
In 1950, development of spotting bullets as an
additional aid for fire control and target acquisi-
tion was undertaken.11 A smaller caliber spotting
bullet was designed to match the trajectory of the
major round at the critical range. Upon impact
with the target or nearby, the spotting bullet ex-
ploded to give flash and smoke. Since the flash was
of extremely short duration (30 to 50 millisec-
onds), the srnoke puff became of greater impor-
tance because it rose and lingered over the point
of impact for a longer period so that the gunner
could readily correct his aim. This development
resulted in the standardization of the caliber .50
M48 combination spotter-tracer round and the de-
velopment of a new family of spotting rounds.
Another use for the smoke-producing devices
resulted from the increasing speed of air or space
vehicles which were developed after World War
IL In order to assist test personnel in the optical
tracking of these vehicles, it was necessary to de-
velop smoke-producing tracking aids, some of which
were required to function at extremely high alti-
tudes.
7-2 PROPERTIES OF SMOKE
The value of a military smoke, whatever its use,
is related to the scattering, reflection, and absorp-
tion of incident radiation by small suspended par-
ticles. These properties are associated with the
7-4
АМСР 706-185
Figure 7-1. Approximate Size Range of Airborne Particles
number, size, and nature of the suspended par-
ticles. The number of particles, their size, and
initial behavior depend upon the smoke agent, the
particular munition, and the method of release.
The density, persistency, and subsequent behavior
of the smoke cloud also depend on meteorological
conditions, such as humidity, wind speed, wind di-
rection, and air stability.
7-2.1 PROPERTIES OF PARTICULATE
CLOUDS312
The classification of types of suspensions in
terms of their nature, origin, and particle size has
not been completely successful due to their indefi-
nite characteristics and because of the differences,
not always clear-ent, between descriptive terms in
scientific and common usage. A gaseous suspension
of liquid or solid particles the diameter of which
is less than 100 microns is commonly called a par-
ticulate cloud. There are three broad classes of
particulate clouds: (1) dusts, (2) mists, and (3)
smokes. If the particles in any particulate cloud
are less than approximately 10 microns in di-
ameter, they are called aerosols. The term aerosol
was introduced to cover only fine, aerial suspen-
sions. It has, however, been applied in recent years
to almost any' aerial suspension of particles. In
some eases, especially in the I’nited States, the
term aerosol is used instead of particulate cloud.
Dusts are particulate clouds made up of solid
particles formed by the mechanical disintegration
of matter. The diameter of the particles in a
dust range from about 0.1 micron to greater than
100 microns.
Mists are gaseous suspensions of liquid droplets
produced by the condensation of a vapor or atom-
ization of a liquid. Mists, especially those occur-
ring naturally, consist of relatively large particles
ranging in size from around 5 microns to larger
than 10 microns. If the concentration of droplets
is great enough to interfere with vision, it is called
a fog.
Л smoke is a suspension in a gaseous medium,
such as the atmosphere, of small particles which
have h relatively low vapor pressure and which
settle slowly under the influence of gravity. Al-
though smokes are often characterized by their
mode of formation, the main criterion is one of
particle size. While, at one time, only clouds
formed by combustion and destructive distillation
were classified as smokes, at present any gaseoun
suspension of particles ranging in size from ap-
proximately (1.01 to perhaps 5,0 microns in diam-
eter, and whieh cannot be classified as a dust or
mist, is considered to be a smoke. In many cases
the smoke particles are aggregates of many ex-
tremely sniiill, primary particles. Carbon smokes,
for example, are composed of extremely small,
7-5
AMCP 706-185
effective area
TRUE AREA
1 5T 0 705 0524 0 393 0 514 0 202 0 224 0 196 0 174 0 157 0.143
x in microns (r-оз microns)
7-6
AMCP 706-185
primary particles of approximately 0.02 micron in
diameter which coagulate into irregular filaments
that inay reach a length of several microns. In
Figure 7-1 is shown ttie approximate particle
size ranges for typical airborne particles.
7-2.1.1 Optical Properties of Particulate Clouds
Particles suspended in a gaseous medium scat-
ter, reflect, and absorb radiation in a manner which
depends on the nature, size and shape of the
particle, and the wavelength of the incident radia-
tion. These factors, in turn, determine the effec-
tiveness of a smoke for screening and its visibility
when used for signaling or similar purposes.
The scattering of light by a particle can be
treated as the interaction between the electro-
magnetic waves and the particle. When light
strikes a particle which is comparable in size to, or
smaller than, its wavelength; reflection and re-
fraction, in their normal sense, no .longer occur.
Interaction between the radiation and particle
results in energy being removed from the wave
front. Some of this energy is degraded to heat but
much is re-radiated as scattered radiation. Each
partiele becomes, in effect, a self-luminous source.
The theory of scattering by spherical particles
was developed from Maxwell’s equations by Gus-
tave Mie.13 For spherical particles which are small
compared to the wavelength of light, this theory
gives results which are in complete agreement with
the results obtained from the less-general Rayleigh
theory which states that the amount of radiation
scattered is inversely proportional to the fourth
power of the wavelength. As the particle radius
increases in size to approximately the wavelength
of the light, the scattering becomes a complex func-
tion of the partiele radius, the refractive index of
the particle, and the wavelength of the incident
light. The scattering coefficient, i.e., the scattering
index, is an extremely complex function of the
parameter r/X, where r is the radius cf the particle
and к is the wavelength of the incident light, and
exhibits one or more peaks before approaching the
limiting value of 2.0 as is shown in Figure 7-2. As
the refractive index of the particle increases, the
peak in these curves moves toward smaller radii
particles. For screening smoke made from fog oil
which has a retractive index of 1.50, the maximum
scattering of vehicle light will occur when the
droplets are about 0.3 micron in diameter.
The angular distribution of the scattered light
is also a function of r/X. For Rayleigh scattering
by small particles, the forward and backward scat-
tering is the same. With an increase in the particle
radius, the forward scattering becomes much
greater. For a particle whose radius is equal to or
greater than the wavelength of light, this factor
may be 1000 or more in favor of the forward scat-
tering.
Smoke clouds, which have a distribution of
partiele sizes, exhibit the scattering which would
be observed for a mixture of a large number of
different uniformly sized smokes mixed in varying
proportions. No completely satisfactory analysis
of the amount of scattering that may be expected
from such a polydispersed smoke cloud has been
made.
The theoretical treatment of the scattering of
light by particles which also absorb is a difficult
problem, especially when absorption is selective.
When the incident light is white, the scattering
by each of the particles will remove some of the
light, selectively absorbed so that the light finally
scattered by the cloud will be colored.
7-2.1.2 Properties of Particulate Clouds Affecting
Their Stability
Smoke clouds and other particulate clouds are
essentially unstable and will eventually disappear
with time due to: (a) motion of the particles, (b)
evaporation and/or condensation, and (c) coagu-
lation and agglomeration.
7-2.1.2.1 Motion of Smoke Particles
Movement of smoke particles under the in-
fluence of gravity and as a result of random bom-
bardment by gas molecules (Brownian motion)
may cause particles to disappear by sedimentation
or diffusion. Sedimentation effects are important
for particles one micron and larger, while diffusion
effects are important only for much smaller par-
ticles.
7 2.1.2.1.1. Sedimentation
An individual particle settling under the in-
fluence of gravity w’ill reach a terminal velocity
7-7
АМСР 706-185
when the aerodynamic drag on the particle is equal
to the effective weight of the particle. If the par-
ticle is a rigid sphere which is large with respect
to the mean free path of the gas, but not so large
that inertia effects are important, Stokes’ Law is
applicable, and the terminal velocity v is given
by:
(7-D
<jdg(? — P')
— 18q
where d is the diameter of the particle, p is the
density of the dispersed phase, p' is the density of
the gas, y] is the viscosity of the gas, and д is the ac-
celeration due to gravity. Particles which are small
with respect to the mean free path of the gas fall
somewhat more rapidly than this equation indi-
eales, while large particles settle somewhat more
slowly.
The rate of sedimentation for some particles is
given in Table 7-1. It is to be noted that the sedi-
TABLE 7-1
TERMINAL VELOCITIES AND DIFFUSION
COEFFICIENTS OF RIGID SPHERES OF
UNIT DENSITY IN AIR AT 760 mm Hg
PRESSURE AND 20°C
Diameter, microns Velocity, cm / sec Diffusion Coefficient, cm2/sec
0.1 8.71 X IO-6 6.84 X Ю-®
0.2 2.27 X 10⁻⁴ 2.02 X Ю-®
0.4 6.85 X IO’'4 8.42 X 10⁻⁷
1.0 3.49 X 10 s 2.76” X 10-T
2 1.19 X 10⁻² 1.28 X IO"7
4 5.00 X 10⁻² 6.16 x ic-°
10 3.06 x io-1 2.41 X 10-R
20 1.2 - - - -
40 5
100 25
mentation rate of a screening smoke which has a
particle radius of 0.3 micron is about one mile per
year.
Nonspherical particles generally attain a lower
terminal velocity; however, this effect is not com-
pletely predictable. If the smoke is heterogeneous,
the particles will settle at different rates causing
collisions between particles and resulting in coagu-
lation or agglomeration of the particles.
7-2.1.2.1.2 Diffusion.
Diffusion of particles due to Brownian motion
results because the particles arc impacted by the
gas molecules of the suspension medium. The mo-
tion imparted to the smaller particles is greater
than that imparted to the larger particles so that
the amount of diffusion is inversely proportional
to the diameter of the particles.3 Diffusion effects
are relatively unimportant for most particulate
clouds of military interest.
7-2.1.2.2. Evaporation and Condensation
The evaporation rate for a given material de-
pends on the difference between the vapor pres-
sure of the dispersed material and the actual
partial pressure of its vapor present in the air.
At a given temperature, the vapor pressure of a
liquid increases with the degree of curvature of
its surface; this increase becomes marked as the
droplet size decreases. Hence, a critical droplet
exists for any temperature and vapor concentra-
tion. Droplets smaller than the critical size will
evaporate because their < apor pressure is higher
than the partial pressure in the vapor phase, while
those larger than ti e critical size will grow as a
result of condensation. The same considerations
apply to the sublimation pressure of a small, solid
particle.
7-2.1.2.3 Coagulation and Agglomeration
The process of continuous and spontaneous for-
mation of larger particles is one of the striking
characteristics of any particulate cloud and can
be a major factor in the diminution of a smoke
cloud; liquid particles coalesce while solid par-
ticles agglomerate when they collide. As this
process continues, the smoke becomes coarser and
finally settles ont. It has been found experi-
mentally that the rate of decrease of the number of
,. . ( dn\ . ...
particles. —I -r- 1. is proportional to the square of
\ du J
the concentration n, or:
-(1г)='7»г <’-2>
7-8
АМСР 706-185
where С is the coagulation constant. In integrated
form :
=Ct (7-3)
\ П ) \ 'no /
where n0 is the number of particles at t = 0.
While it is difficult to calculate the exact de-
gree of polydisperity, it can be shown that the
probability of collision between particles of un-
equal size is greater than that between particles of
equal size. Hence, polydisperse smokes coagulate
faster than those which are monodisperse. More-
over, differential settling also increases the prob-
ability of collisions between particles of different
sizes. The coagulation rate of smoke is increased by
stirring, since eddies and swirls result in particles
having a higher relative velocity which increase
chances of collisions resulting in an increased co-
agulation rate.
7-2.2 TRAVEL AND PERSISTENCE OF
PARTICULATE CLOUDS312
The behavior of a particulate cloud is strongly
influenced by the diffusive properties of the at-
mosphere. For example, the persistence of screen-
ing smokes, which are composed of particles too
small to fall out appreciably by Stokes’ Law and
which have too low a vapor pressure to evaporate,
is almost completely dependent on meteorological
factors whieh tend to dilute the cloud. The form
of a particulate cloud in the atmosphere depends
upon the location, type, and configuration of its
source. When a cloud is emitted from a jet at a
considerable velocity, mechanical turbulence and
rapid mixing with the air results. This initial con-
dition of turbulence disappears by the time the
cloud has traveled a short distance from the gen-
erator. Also, the formation of particulate clouds
of military interest is accompanied by sufficient
heat so that the cloud as a whole will rise. As
the cloud becomes more and more diluted with
cooler air this effect will be less observable unless
there is a very great initial rise in temperature, as.
is the ease when smoke is produced hy the burning
of white phosphorus. (See Paragraph 7-3.3.2.1.)
The process by which smoke is diluted and mixed
with air is called “atmospheric diffusion,’’ This
process is also termed “eddy diffusion’’ to distin-
guish it from molecular diffusion since eddy-like
motions of from one to many feet, in diameter are
observed. The amount of atmospheric diffusion
is indicated by the angle of rise and angle of spread
of the cloud as it travels downwind from the source.
The initial angles of rise and spread usually will
be different than those measured farther away
from the point of generation.
7-2.2.1 Meteorological Factors
While the initial behavior of a particulate cloud
normally is due to the transient effect of the heat
and turbulence resulting from the process by
which the particulate cloud is generated, the be-
havior of the cloud at a distance from the gen-
erator depends on the meteorological conditions
prevailing. The principal meteorological factors
affecting travel of this type of cloud are wind speed,
direction, turbulence in the lower atmosphere, and
thermal gradients.
7-2.2.1.1 Wind Speed and Direction
To obtain a cloud concentration in an area
from a limited number of stationary sources, a
wind velocity of fixed speed and direction is de-
sirable. Too high a wind speed requires an ex-
orbitant rate of production in order to maintain
proper coverage, while too low a wind speed re-
quires excessive time to develop the cloud. If there
is no wind, good results can only be obtained by
producing the cloud from a moving vehicle such as
a plane or boat, or by the projection of smoke
generating munitions into the area. The latter
method is feasible only in offensive operations.
Conditions of very low wind speed are likely to
be accompanied by sudden variations in the wind,
carrying the particulate cloud into areas where it
is not desired.
When a particulate cloud is emitted by a sta-
tionary generator in a steady wind, the plume
travels downw’ d wi... the speed of the wind and
the ax.’ of the plume is parallel to the wind di-
rection. The density of the cloud at any point
downwind will be, in general, approximately i •
tersely proportional to the wind speed.
7-2.2.1.2 Turbulence
Wind speed and direction are subject to rapid
and violent fluctuation. This unsteadiness in wind
7-9
AMCP 706-185
velocity and direction can be considcied to be due
to pulsations taking place in three directions;
namely, in the general direction of the wind, and
in horizontal and vertical directions at right angles
thereto. The total of these pulsations in the dif-
ferent directions is a measure of the gustiness or
turbulence of the atmosphere.
One obvious eause of turbulence is mechanical.
The higher the wind velocity, the greater the tur-
bulence, particularly over rough terrain. Over a
smooth surface of water there will be no turbu-
lence produced by mechanical causes at low wind
speeds. Wind speeds greater than 10 to 11 knots,
however, will produce waves which, in turn, pro-
duce mechanical turbulence in the lower air layers.
Another important factor in producing turbu-
lence is thermal instability in the lower atmosphere.
During the day in bright sunshine, the ground
surface receives a great deal of heat from the sun
and, since the earth is a poor conductor, the tem-
perature of the surface will rise many degrees.
The layer of air in contact with the ground is
Heated and, since it becomes lighter by expansion,
the layer rises. Since the warm lower layer of air
cannot rise everywhere uniformly, it must break
through the upper cooler layers somewhat as bub-
bles burst upward through a liquid. The actual
driving force is the weight of the cooler air, which
settles toward the ground displacing the warmer,
lighter air. These upward, convective currents
eause the bumpiness of the air which is noticeable
in an airplane The passage of a warm or cold
front may completely alter the temperature rela-
tion between the ground surface and air and pro-
duce stability or instability regardless of time of
day or sky conditions.
7-2.2.1.3 Thermal Gradient
Stability conditions in the atmosphere are de-
termined by the temperature gradient therein. If
the temperature decrease with height is more than
1°C per 100 meters, the air will be unstable; i.e.,
the lower layer of air will tend to rise and con-
tinue to rise as long as this condition prevails. This
is caused by the rising mass of air, expanding and
cooling as it rises, becoming warmer and lighter
than the surrounding air. If the decrease in tem-
perature with altitude is between zero and 1QC
per 100 meters, there will be no tendency for the
air to rise because the air mass carried upward
will become colder and heavier than the surround-
ing air. This decrease of temperature with alti-
tude of 1°C per 100 meters is termed by the meteor-
ologist the adiabatic lapse rate for dry air, and the
degree of stability or instability of the atmosphere
will depend upon the extent to which the tempera-
ture gradient departs in one direction or the other
from this critical value. An extreme condition,
when the temperature increases with altitude, is
known» as inversion, which causes extreme sta-
bility in the lower atmosphere. The meteorological
factors described contribute to the degree of sta-
bility of the atmosphere which exerts a consider-
able influence on the performance of a smoke cloud.
Extreme conditions of stability or instability will
influence the effectiveness of the smoke cloud in a
particular tactical situation.
7-2.2.2 Stability of Aerosol Clouds Under Various
Meteorological Conditions
7-2.2.2.1 Stable Conditions
Under inversion conditions over smooth ter-
rain such as calm water, the only tendency shown
by a smoke cloud to rise and spiead is due to the
initial transient effect caused by the heat and
turbulence produced by the smoke generator. The
turbulence is quickly damped out but the heat
produced may be sufficient to eause a very’- pro-
nounced rise, as is the case with white phosphorus
smoke munitions. In the ease of oil smoke, where
the amount of heat produced is small, the tempera-
ture of the smoke at any dilution is only slightly
greater than the temperature required to produce
a buoyancy sufficient to offset the increase in
density caused by the presence of the sinoite ma-
terial. As the smoke rises, the temperature falls
because of two effects; namely, further dilution
with cool air, and adiabatic expansion due to a de-
crease in barometric pressure. Since, in an in-
version, the temperature of the surrounding air
increases with increasing altitude, an elevation is
soon reached at which the smoke is stable, possess-
ing a density identical with that of the surround-
ing air.
Oil vapor sinokt is often observed to level off
7-10
АМСР 706-185
at an elevation of approximately 100 feet under
stable air conditions. Certain types of smoke ex-
hibit an erratic behavior because of abnormal den-
sity. Examples of these are: (a) the smoke pro-
duced by burning oil in an orchard heater in which
carbon particles and carbon dioxide gas are pres-
ent, and (b) HC smoke in which large particles of
zine chloride and other heavy materials ar** formed.
While a substantial amount of heat is produced
in the formation of these smokes, much of it is
quickly lost by radiation, particularly at night.
Since the heat produced in the generation of the
smoke will usually cause the smoke cloud to rise
even under the most stable conditions, it may be
anticipatei. that the cloud will lift entirely off the
ground after a short distance of travel. If, how-
ever, a wind of considerable velocity is blowing,
this lifting from the ground will not occur.
Although the heat produced in the smoke gen-
erator promotes a rise, it has little effect upon the
spread of the smoke cloud. The spread that oc-
curs is due to initial turbulence and this soon
damps out. Consequently, if it is desired to pro-
duce continuous clouds of smoke from a series of
individual generators, it is necessary to place,
the generators very close together; otherwise, the
individual plumes may not merge for a long way
downwind. The situation holds for smooth ter-
rain. However, if the terrain is covered with
shrubbery, for example, the lateral spread of the
cloud is greatly increased as a result of the me-
chanical turbulence produced by the wind flowing
through the shrubbery.
7-2.2.2.2 Unstable Conditions
When the air current is turbulent because of
thermal instability, atmospheric diffusion takes
place to such an extent that the initial, transient
behavior of the cloud, due to the heat and turbu-
lence from the generator, is of little significance.
The aerosol cloud continues to rise and spread as
it travois downwind until the cloud becomes so
thin that its boundaries are no longer distinguish-
able to the eye. If a time exposure were to be
taken of the cloud, it would appear as a cone with
its apex at the generator and its axis rising at an
angle from the horizontal, the angle of rise de-
pending upon the degree of instability and the
wind velocity. An instantaneous view of the cloud
would show that it is furrowed and broken by
variations in the wind direction and sudden up-
ward convective currents.
The lower air is: thermally unstable when the
negative temperature decrease with altitude is
more than 1°C per 100 meters of elevation near
ground level. This negative gradient may con-
tinue indefinitely upward. Thus, in thunderstorms,
cumulus clouds often rise to a height of several
miles; a smoke eloud would be carried to the same
height.
Under other circumstances, a current of warm-
er air may be blowing at an elevation of a few
hundred feet so that the temperature gradient
may become zero, or even positive, giving an in-
version at this elevation. There is no tendency
for the lower air to rise through this warmer light-
er layer, and a definite ceiling will be established
for the convective turbulence. Within this layer
the atmosphere turns over and over, and the smoke
may become diffused throughout the layer before
it has traveled very far. However, eddy diffusion
always occurs at the boundaries of the upward
convective currents, causing some smoke to diffuse
throughout the settling layer of cooler air oven
with a high convective ceiling.
The rate of rise of the convective current in-
creases with thermal instability. The angle of rise
of the smoke eloud fas a statistical average) is in-
versely proportional to the wind velocity. With
zero wind, the convective currents rise directly
upward. As the wind increases, the direction of
the convective current is inclined increasingly
away from the vertical.
7-2.2.2.3 Estimation of Atmospheric Diffusion3
Two expressions were derived which enable the
concentration z (grams per cubic centimeter) at.
a given point in a smoke eloud to be predicted from
knowledge of the rate of emission of particulate
matter and of certain meteorological properties of
the atmosphere. These equations for predicting the
concentration from continuous point and line
sennes at giound level are:
Continuous point source emitting Q grams per
second :
7-11
АМСР 706-185
х„(л-,у,г) —
-------'!!; I (£+-£г)1
•ncvcsv?-n L V» /J
(7-4)
Continuous crosswind infinite line source emit-
ting Q grams per second per centimeter:
M;r,z) =------?£------Г (7.5)
where the space coordinates .r, )/ and z (origin at
the source) refer to the downwind, crosswind, and
vertical directions, respectively; V is the mean
wind velocity; Cy and U. are generalized eddy
diffusion coefficients; and n is a parameter refer-
ring to the stability of the atmosphere, the nu-
merical value of which varies between zero and
unity. These equations indicate that the concentra-
tion varies directly with the source strength Q and
approximately inversely with the mean wind ve-
locity U. The distribution of concentration in the
crosswind direction and in the vertical direction is
approximately Gaussian; however, due to ground
reflection, the vertical distribution corresponds to
only one-half of the Gaiis. ian curve. If the terrain
is level and there is only a small temperature
gradient, n is approximately 0.25. Under these
conditions, the peak concentration downwind from
a point source will decrease as j?"1-76, and for a
line source as .r~0-88.
7-2.3 SPECIFIC PROPERTIES OF MILITARY
SMOKES
Smokes are used for four basic military pur-
poses.- (1) for screening, (2) for signaling, (3) for
tracking and acquisition, and (4) for disseminat-
ing (see Paragraph 7-3) of agents in riot control
and other applications. While smoke may be pro-
duced from a large number of chemicals in a
variety of ways, only a few of these meet the spe-
cific requirements for a military smoke. The ideal
military smoke material will:
a. Be available in sufficient quantities for large-
scale production of the mixture at a rela-
tively low cost.
b. Be easily and efficiently disseminated with-
out the nst? of elaborate equipment.
e. Be persistent when disseminated, i.e., it will
not evaporate, fall out or coagulate rapidly.
d. Be effective at a low concentration of ma-
terial.
c. Be substantially nontoxie; noncorrosive to
equipment, and, except for control agents,
nonirritating to the eyes, throat and skin.
f. Be suitable for large-scale manufacture,
storage, and transportation, without hazard
or deterioration.
7-2.3.1 Screening Smokes
Screening smokes are usually white and can
be used to:
a. Conceal movements, intentions, equipment,
and installations of friendly forces from
ground observation.
b. Blanket friendly positions and installations
in order to conceal them from air observa-
tion and attack.
e. Prevent aimed fire on approaching friendly
aircraft, i.e., to screen the landing of air-
borne troops by parachute and glider.
d. Provide an extensive, thin haze for conceal-
ment of friendly areas without seriously
impeding close-range vision.
e. Establish dummy screens to deceive observ-
ers.
f. Communicate.
g. Form a thermal radiation attenuation screen.
There are three types of smoke screens. A
smoke screen laid over friendly areas to hinder
enemy aerial observation and visual precision bomb-
ing is called a blanket screen. This type screen is
formed by the gradual merging, downwind from
the source of generation, of individual smoke
streams. A smoke haze is normally established in
a battle area to conceal friendly activities from
observation and ground fire. It is formed iu much
the same manner as a blanket screen. Usually,
however, a smoke haze is less uniformly dense than
a smoke blanket. A smoke curtain is a dense,
vertical development to conceal objects at ground
level from observers at ground level.
Under many circumstances these distinctions
disappear. For example, a smoke curtain may in-
7-12
AMCP 706-185
terfere with aerial observation or a blanket screen
may settle to the ground and become a smoke
curtain. These distinctions are important for de-
fensive screening only, inasmuch as offensive use
of smoke has the primary objective of blinding
unfriendly forces by enveloping them in a dense
blanket of smoke at ground level. Due to the re-
quired subsistence of smoke screens, large quanti-
ties of near optimum materials must be used.
Of the large number of available smoke-producing
chemicals, only a few have been found suitable for
use in the production of military smoke screens.
7-2.3.2 Signal Smokes
It is a prerequisite that smokes used for sig-
naling and communications be clearly distinguish-
able from other smokes (and other clouds) pro-
duced for different purposes. Thus, the use of
white, gray, and blanket smokes for signaling is
ve.y limited and colored smokes are normally used
for this purpose. In addition, the use of several
different colors allows more information to be
transmitted and also results in a clearer distinc-
tion between the smoke signals and a varying back-
ground. Effective methods for the production of
colored smoke, including explosive dissemination,
involve the vaporization and condensation of a
dye; therefore, the dye must be heat-stable so
that it can he rapidly vaporized at a relatively
high temperature without appreciable thermal
degradation. In addition to its color, important
characteristics of a colored smoke include:
a. Visibility (the conditions under which the
eloud can be seen and its color recognized).
b. Duration (the time period during which
smoke is evolved from a munition).
c. Persistence (the total period of time during
which a cloud is visible).
d. Volume (the quantity of smoke emitted ; for
colored smokes, volume has also been de-
fined as the cross-sectional area of a cloud
presented to an observer).
Although not as important as in the ease of
screening smoke, the smoke eloud should be as
nontoxie, nonirritating, and noneorrosive as pos-
sible. Information on the composition, method of
dissemination, measurement, etc., of colored smokes
is contained in Paragraph 7-3.4.
7-2.3.3 Tracking and Acquistion Smokes
Smoke-producing devices such as generators or
tracers are used as an aid in the optical tracking
of projectiles, high speed aircraft, and missiles
both at sea level and high altitudes. These devices
optimize the <fbility to locate and track vehicles
along the flight path and minimize the possibility
of losing significant data. Requirements for optical
tracking aids vary considerably because of the
wide range of conditions encountered in the track-
ing of test vehicles operating over a wide range
of altitudes and speeds. No single smoke agent or
generating system will satisfy all requirements
and numerous smoke-producing methods are neces-
sary. Each is designed for a particular applica-
tion, emphasizing certain ideal characteristics.
While the value of a screening smoke is due
to its absorbing and light-scattering power, the
visibility of a smoke tracking aid is due, chiefly,
to its light-scatiering power. The ideal tracking
and acquisition smoke should have the following
characteristics:
a. Be efficient on a weight and volume basis.
b. Have the ability to function and perform
at altitudes where pressure is low, and water
vapor and oxygen concentrations are small.
e. Have the ability to function through the
range of temperatures encountered from
ground temperature to the minimum high
altitude temperature.
d. Require little power for generation and dis-
persion.
e. Be as nontoxic, nonexplosive, and noncor-
rosive as possible with regard to both smoke
chemicals and products.
7-2.3.4 Smoke for Dissemination of Agents
Agent smokes for riot control and other pur-
poses are produced in much the. same way as col-
ored signal smokes. In many cases, a vaporization
process is followed by a condensation process in
which the agent condenses to form the disperse
phase of the smoke. Agent smokes may be dis-
seminated by explosive means as well as by some
7-13
АМСР 706-185
of the other methods discussed in Paragraph 7-3.
The physiological effectiveness of materials dis-
seminated in this way depends strongly on the
particle size. While visibility of the smoke may or
may not be important, the volume of smoke and its
duration is important. Tt is also necessary that the
vaporization and condensation process be efficient
and produce a minimum of nndesired changes in
the agent being dispersed.
7-3 DISSEMINATION TECHNIQUES
Dissemination refers to the process by which a
chemical agent is converted into a eloud consisting
either of vapor or fine particles, suspended in the
air. For agents such as smoke, which are dis-
seminated as a particulate eloud, the process
usually involves the formation of small particles
of the dispersed phase and the distribution of these
particles in the air.
7-3.1 FORMATION OF THE DISPERSED
PHASE
The dispersed phase ean be formed in two
ways: (a) by condensation processes in which
molecules of a vapor unite to form the particles
of the dispersed phase, and (b) by dispersion
processes in which the particles are formed by
the breaking up of a solid or liquid material. In
the first ease, the specific surface (the total surface
per nnit-vohime of the material) decreases; while
in the second ease, the specific surface increases.
7-3.1.1 Vapor Condensation Processes
The dispersed phase of most particulate clouds
is produced by condensation from the vapor phase
and invok es the uniting of vapor molecules to form
larger particles. The formation of a dispersed
phase by this method involves two steps; (a) pro-
ducing the vapor in a supersaturated state, and
(b) condensing the supersaturated vapor The
supersaturated vapor is usually obtained by: (a)
the cooling of a warm vapor, or (b) a chemical
reaction which results in the formation of a super-
saturated vapor. In either ease, the excess vapor
will condense to form tin* particles of the dispersed
phase. The condensation of a supersaturated vapor
is accompanied by the liberation of heat so that this
process will continue once initiated, until equi-
librium is reached. The production of a super-
saturated vapor and formation of a dispersed phase
by condensation art1 complex processes and pro-
ceed essentially simultaneously. Consequently,
little direct information has been obtained on the
early stages of particle formation.
Condensation of a vapor is facilitated by the
presence of foreign particles. Insoluble foreign
particles can absorb a thin film of vapor on their
surfaces and behave as liquid droplets of equal size.
If the foreign particle is soluble in the condensed
liquid, the vapor pressure of the liquid is decreased
and, consequently, the supersaturation required for
rapid condensation is reduced. Charged droplets,
which are formed due to the presence of ions, tend
to have a larger surface and, hence, a lower vapor
pressure which result in condensation at a lower
supersaturation. If condensation, in the absence
of foreign particles, were to start from a single
molecule, the theory indicates that a much higher
supersaturatiou would be required than that ob-
served experimentally. Therefore, it is postulated
that small aggregates of molecules, of approxi-
mately the critical size, are continually produced
by random fluctuation in the vapor. Molecular ag-
gregates smaller than the critical size will disap-
pear, while those larger than the critical size will
continue to grow.
In many cases of military interest, the super-
saturated vapor is produced by the evaporation of
a substance, followed by the mixing with cooler
air of the relatively warm vapors produced. Con-
densation then follows, resulting in the formation
of the dispersed phase. The particles in a smoke
produced as the result of combustion are also due
to vapor condensation. In this case, due to the
higher temperatures involved, it is impossible to
analyze the process in detail. Chemical reactions,
including several for producing smokes of mili-
tary interest, often involve a component of the at-
mosphere (such as water vapor) as one of the
reactants.
7-3.1.2 Dispersion Processes
The formation of a dispersed phase by disper-
sion methods invokes the subdivision of a solid or
liquid into fine particles. The actual mechanisms
by which the fine particles are produced and dis-
7-14
AMCP 706-185
persed in the suspending medium are intimately
related ami not always completely understood.
In the ease of a liquid, energy applied to it causes
the liquid to assume an unstable configuration
which then breaks up into small droplets. A solid
substance may be disrupted and dispersed into fine
particles by application of energy, or the solid
can be preground to the desired size and then dis-
persed into the suspending medium.
In the atomization of liquids, the energy is ex-
panded mainly in: (a) forming new surfaces,
(b) overcoming viscous forces in changing the
shape of the liquid, and (e) meeting losses due to
inefficient application of the energy to the liquid.
Devices commonly used to disperse liquids are of
three main types.
One type employs a high velocity gas or air
jet to break up a liquid emerging from a nozzle.
Atomizers of this type produce a very wide range
of droplet sizes which can be somewhat reduced
by trapping the larger droplets within the atomizer.
The degree of atomization obtained by this method
is influenced by the following factors;:
a. The relative velocity of the air past the
droplets.
b. The physical properties of the liquid, in-
cluding surface tension, viscosity, and den-
sity.
e. The relative quantity of air expressed as the
ratio of volume of air to volume of liquid.
Within a limited range, the Vukiyama Tanasawa
equation applies, even though it is dimensionally
incorrect.0
585\/? / g V'4 ’ / КМКИЛ.Х 1 5
f/o = + 597 -4= -—-------I (7-6)
r\/p \ '
where </,. is the diameter in microns of a single drop
with tile same ratio of surfm-e-to-volinne as a repre-
sentative sample of the atomized droplets; r is
the velocity of the air in centimeters per second
relative to that of the liquid: ()t,'Q.t is tin1 volume-
flow-rate of liquid to the volume-flow-rate of air;
5 is the density of the liquid in grains per ruble
centimeter: y. is the velocity of the liquid in poises;
and 7 is the surface tension in dynes per centi-
meter. This equation is used in estimating the per-
formance of particulate cloud generators such as
the venturi nozzle type, where the smoke-produc-
ing material is atomized prior to evaporation.
There are two other important types of atom-
izers which are of somewhat lesser military im-
portance. The first of those types is the centrifugal
atomizer in which the liquid is fed onto the ce’’ ?r
of a rotating disc, cone, or top and centrifuged
off the edge, producing droplets of relatively uni-
form size. In the second type, the hydraulic
atomizer, liquid is forced through a nozzle and is
broken up into droplets. In this latter case, the
atomization depends more on the physical proper-
ties cf the liquid and the conditions of ejection
from the nozzle than on the interactions between
the liquid and the surrounding gas.
Dusts can be formed by the disruption of solid
material or by the dispersion of a material, finely
preground to a desired size.
The forces required to disrupt the solid ma-
terial may be applied rather slowly by milling,
crushing, or grinding, or rapidly through ex-
plosion or impact. In either case, the applied forces
cause disintegration by splitting or cracking along
planes of weakness in the material. The result is
the formation of small fragments and fine particles
released from the freshly formed surfaces by
cracking on a microscale as the material is torn
apart.
7-3.1.3 Combined Processes
Since mist dispersion methods will not pro-
duce particles of the correct size, in many cases the
dispersed phase for smokes of military interest is
obtained by condensation from a vapor phase which
is formed by evaporation of the smoke-producing
agent. However, in order to facilitate the trans-
fer of heat to and the removal of the vapor from
the surface of the agent, it is often, atomized be-
fore it is evaporated. Particulate clouds can be
developed by the atomization of a solution con-
taining a nonvolatile or slightly volatile solute in
a volatile solvent. The solvent, evaporates and leaves
the solute which condenses to form the dispersed
phase of a particulate cloud. The explosive dis-
persion of volatile materials, such ns the dyes used
for colored smoke, is also a combined process. The
explosion mechanically disperses, vaporizes, and
7-15
АМСР 706-185
mixes the material with cooler air, resulting in the
formation of a particulate cloud.
7-3.2 MILITARY PRODUCTION OF SMOKE
Pyrotechnic munitions for producing smoke,
whether for screening, signaling, or other purposes,
are usually one of the following general types:
a. Venturi Thermal Generator Type. The
smoke-producing material and the pyro-
technic fuel block required to volatilize the
smoke material are in separate compart-
ments. The smoke-producing material is
atomized and vaporized in the venturi noz-
zle by the hot gases formed by the burning
of the fuel block.
b Burning Type. Burning-type smoke com-
positions are intimate mixtures of chemicals.
Smoke is produced from these mixtures by
either of two methods. Tn the first method,
a product of combustion forms the smoke or
the product reacts with constituents of the
atmosphere to form a smoke. In the second
method, the heat of combustion of the pyro-
technic serves to volatilize a component of
the mixture which then condenses to form
the smoke.
c. Explosive Dissemination Type. The smoke-
producing material is pulverized or atomized
and then vaporized, or a pregroimd solid is
dispersed by the explosion of a bursting
charge.
It is to be noted that smoke is also produced for
military purposes by other than pyrotechnic means.
For example, certain screening-smoke materials
<an be disseminated by mechanical smoke genera-
tors and others by the use of airplane spray tanks.
Signals and tracking aids can be generated by
using hot exhaust gases from aircraft or tank en-
gines to vaporize the smoke-producing materials.
The ingredients n icd in siiioke-producing chem-
icals ami combustion products, and/or the con-
densed vapor particles produced in a smoke, should
he considered to be irritating and/or toxic. Care
should be exerted in working with smoke-producing
materials am! the resulting smokes, especially re-
garding the inhalation of high convent rations and
long exposures thereto. When investigating new
materials the proper references should be con-
stiltcd1'* ’5 '0'1’ and if little or no information is
available, extreme caution should be exerted.
The remaining sections of this chapter em-
phasize production of smoke by pyrotechnic means;
however, the same principles are applicable to
other methods for producing smoke, some of which
are briefly discussed.
7-3.3 WHITE SMOKES
White smokes are widely used for screening, ac-
quisition and tracking, fire control, and signaling
purposes. They can be produced from many chem-
icals in a variety of ways and, in general, are more
efficient on a weight basis than colored smokes.
Relatively few of the methods for producing
white smoke are of value for production of the
large amount of smoke required for screening
purposes- which is one of the important uses for
white smoke. Because of the large amount of
smoke required, it is important that the maximum
effect be obtained per unit-weight of smoke-pro-
ducing material. This will depend on: (a) the
weight of the material available to form smoke
particles, whether this was originally present in
the mixture or is contributed from the atmosphere,
and (b i the efficiency of conversion of the smoke-
prodm-ing materia) into smoke particles having the
opt iin inn light-scattering and obscuring capability.
Formation of smoke particles by condensation
from the vapor phase is the only practical way to
produce the large amount of white smoke required
for military screening purposes The hot vapor is
usually produced by volatilization or by chemical
reactions ip which one reactant is normally a com-
ponent of the i.unosphere. Examples of the three
most widely used screening smokes are:
a. Oil smoke, which is produced by the volatili-
zation .and condensation of oil.
b. White phosphorus smoke, whieh is produced
by chemical reaction with the atmosphere.
v. Zinc chloride smoke, which is produced
by a combination of volatilization and chem-
ical reaction.
Oil .smokes arc normally produced by venturi-
type thermal generators, although intimate mix-
lure burning types of munitions have been de-
7-16
АМСР 706-185
veloped for dissemination of oil smoke. Zine
chloride smoke is produced by a burning-type
munition. White phosphorus smoke for screening
is normally produced by a bursting-type munition.
7-3.3.1 Oil Smoke
A very satisfactory white screening smoke can
be produced by the vaporization and condensation
of an oil that has a high boiling point and a low
volatility. The first successful generator for pro-
ducing oil smoke was the Ml mechanical smoke
generator. In this generator the smoke oil was
flash evaporated at a relatively high temperature,
with water added to prevent coking. The equip-
ment was heavy and complicated, including gaso-
line engines to operate the necessary pumps and
blowers, coils for the evaporation of oil and
water, and burners using fuel oil to heat the coils.
In spite of their many disadvantages, these gen-
erators, along with similar types, were widely used
during World War II.
7-3.3.1.1 Venturi Thermal Generators
Toward the end of World War II another
smoke generator, the Hessien, was developed for
the Г. S. Navy in which the fog oil was atomized,
mixed with the hot gases produced by the com-
bustion of a fuel, and vaporized in a venturi
throat. The development of venturi-type thermal-
generator munitions using pyrotechnic fuel blocks
was also accomplished during World War II; how-
ever, these items were not fully ready for produc-
tion until after the War.
7-3.3.1.1.1 Operation of Venturi Thermal
Generators
The operation of a venturi-type thermal gen-
erator to produce a smoke involves the atomization
of the liquid, the vaporization of the droplets
produced, and the dispersion of the vapor in a
stream of hot gases. A typical unit, shown sche-
matically in Eigure 7-3, consists of:
a. a fuel block which, on burning, produces
the 1 ot gases,
b a chamber containing the liquid to be
va lorized and dispersed, and
c. a high velocity vaporizer tube in the form ot
a venturi.
A pressure tube connects the agent compartment
and the fuel compartment and permits the pres-
sure developed by the fuel block to aid in forcing
oil through an orifice into the venturi throat.
Here the oil is mixed with the hot gas stream
flowing through the venturi. The high velocity
of the gases promotes atomization of the incoming
oil stream and the droplets arc quickly vaporized.
The rate of feeding is governed by the pressure
differential between the agent compartment and
the throat, the size of the feed orifice, and, to a
minor extent, the resistance to the flow through
the feed tube. Little decomposition of the agent is
caused by the relatively high temperatures required
for rapid evaporation due to the short period of ex-
posure. The efficiency of this type of generator is
highest when the agent is heated to a rather high
temperature for the shortest possible time rather
than a lower temperature for a longer period. The
particle size of a smoke produced in a venturi
thermal-generator type of munition ean be defined
in terms of: (a) the Nukiyama Tanasawa equation
(Equation 7-(>), modified to include the effect of
system heat upon tin? aerosol, and (b) the thermo-
dynamic properties of borh the liquid and the
pyrotechnie combustion products at the point of
mixing, which controls the amount of liquid
vaporized. Thus, the smoke formed can be con-
sidered to be made up of two parts • the larger
particles produced predominantly by the atomisa-
tion process, ana smaller particles produced by
vaporization and condensation.
The portion of the liquid vaporized depends
on the heat transferred from the hot gases. The
amount vaporized is significantly affected by mass
flow rates, mean specific heat, and initial gas tem-
perature. With proper design of the venturi,
there is sufficient time for the heat to be trans-
ferred from the gases Io the liquid. The overall
process in the venturi can be considered to be
essentially adiabatic.
Generators of this type regulate particle size
through rapid dilution of the vapor with cool air.
As mixing and cooling occurs, the saturated vapor
condenses, b'or oil smokes, a very rapid coagula-
tion occurs for a very short period of time causing
the parti des to grow. Ihlntion, however, occurs so
rapidly that the coagulation is cheeked after a few
7-17
AMCP 706-185
Figure 7-3. Typical Venturi Thermal Generator
d. Supply the carrier gas to remove the oil
vapor.
Ammonium nitrate-charcoal compositions have
proved to be a satisfactory fuel block for the
volatilization of fog oil.
The reaction between ammonium nitrate and
carbon can be written:
NH4NOs + C--------> CO -I- 2H2O + N2
if it is assumed that all the carbon is oxidized to
carbon monoxide. If all the carbon is assumed to
he oxidized to carbon dioxide the. reaction is:
2NH4NO3 4- C------> CO2 + 4H2O 4- 2N2
The volume of gas, measured at 0°C and 760 mm
11g, is about 0.97 liter per gram of mixture for the
first reaction and 0.92 liter per gram for the second
reaction.
Analysis of the gases produced by the burning
of a typical ammonium nitrate fuel block (11
parts charcoal, 3 parts linseed oil, and 83 parts
ammonium nitrate) gave the following:
thousandths of a second, and a remarkably nar-
row range of partiele sizes results. If the generator
is working well, it is possible to obtain a reugh
ehet к on the particle-size range by a simple color
test. If the sun’s disc or any other bright light
source, when almost obscured, appears red, the
particle size is somewhat smaller than desired; if
it appears magenta, the partiele size is satisfac-
tory; if it appears blue, the particle size is
larger than desired for maximum screening effec-
tiveness. If the smoke produced is not of a uniform
particle size, the sun's disc will appear white and
no conclusion can be drawn as to partiele size be-
ing produced by the generators.
7-3.3.1.1.2 Fuel Blocks418
The heat and product, gases produced by the
burning of a pyrotechnic fuel block must:
a. Haise the temperature of the oil to the
vaporization temperature.
b. Supply the latent heat of evaporation to the
oil,
e. Supply the heat lost as sensible heat in the
hot gases and hot container.
H20 48.8% CO2 13.5%
NH3 0.6% CO 5.2%
n2 26.1% H2 5.8%
which corresponds, approximately, to the reaction:
6NII4NO3 4- 4C ------->11H2O 4- co 4- 3CO2
4- 6N2 4- II2
As illustrated in Chapter 3, this reaction should
yield nearly one liter of gas, measured at 0°C and
760 nim 11g, per gram of mixture burned. Ap-
proximately 0.6X5 kealories per gram of mixture is
evolved when the mixture is burned.
Fuel blocks can be pressed using a binder, or
they can be cast. In either ease, the burning rate,
which determines the heat and gas evolution rates,
is roughly proportional to the area of the burning
surface. For a fixed burning aiea, the rate of
burning can be changed by ;
a. Varying the size of the charcoal,
h. Modifying the surface of the charcoal, and/
or
e. (’hanging the composition of the fuel block.
Carbon is normally tin' least-uniform ingred-
ient and, therefore, causes most of the variation
7 IS
АМСР 706-185
TABLE 7-2
CHARACTERISTICS OF TYPICAL OIL SMOKE POTS
Characteristic Type Device
Floating {Fig. 7-3) Training (Fig. 7-4)
Size, iu. Venturi Orifice 13 high, by 13 dia. 5.7 high (including fuze) by 2.5 dia.
Diameter, in. 0.0890 0.076
Weight, lb 14.5 (oil) 12.0 (fuel) 0.24 (oil) 0.22 (fuel)
Oil Agent Duel Block Composition SGF No. 1 or 2 Fast-Burning Top Mixture 86% NH4NO3 11% Charcoal 3% Linseed Oil Slow-Burning Base Mixture 82% NH4NO3 8% NIi4Cl 7% Charcoal 3%> Linseed Oil SGF No. 1 or 2 82% NH4NO3 11% Charcoal 4% KNO3 3% Linseed Oil
Ignition Botiehon fuze (74208) “spits” through venturi igniting quickmatch & starter Bourbon fuze (M201A1) (similar to floating type)
Burning Time, min 12 ± 1.5 1.2 ± 0.25
.1 pplieation Screening, used singly or in multiple on land or water Grenade type, used for training purposes
Obscuring Dower Singh- pot fills a 13,000 ett ft room and totally obscures objects 1-ti feet away
in burning for supposedly idt'tifieul furl blocks.
Treatmeni of the carbon with chemicals (such as
potassium carbonate or similar alkali chenitcals)
increases the burning rati' while treatment with
an acid will decrease the burning rate. The sub-
stitution of potassium nitrate, sodium nitrate, or
annuo' ini;i chlorate fur part of the ammonium
nitrate will cause an iiu-rea.se in burning rate. A
reasonable explanation for the increase is that
these compounds form eurbunates uIjcii burned
with eharcoa). Ott the other hand, adding ant
nnmiinn chloride or substituting naphthalene (or
starch in a cast fuel block I for charcoal will re-
duce the burning rate.
An increase in either the initial temperature
or the pressure in the fuel hloek chamber will also
increase the burning rule Surging la rapid burn-
ing with a high rale of gas «-volution followed by
slower burning with a low rate of gas evolution.) is
sometimes observed. '1'bis objectionable cyclic- bc-
7-19
АМСР 706-185
Figure 7-4. Typical Oil Smoke Pot (Floating}
havior is probably due to variations in the charcoal
used inasmuch as surgin'? is favored when a blend
of slow- and fast-burning charcoal is used to
make the fuel block.
Because charcoal may cause undesirable varia-
tions in the burning characteristics of a fuel block,
attempts have, been made to develop a fuel block
which does not contain charcoal. A mixture of
guanidine nitrate, ammonium nitrate, linseed oil,
anti ammounium dichromate was found to be only
partially satisfactory. Reasonable success was ob-
tained using polysuifide ammonium perchlorate
as a binder and a substitute for all or part of the
carbon in a castable fuel block. This reduced or
eliminated the swelling and cracking observed in
standard amnioninin nitrate carbon fuel blocks.
7-3.3.1.1.3 Typical Venturi Thermal Generators
Characteristics of typical venturi-type thermal
generators are given in Table 7 '2. Figures 7-4 and
7-5 illustrate schematically two types of oil fed
smoke pots.
7-3.3.1.2 Other Methods for Producing Oil Smoke
Before the development of the Ml smoke gen-
erator, common methods for producing oil based
smoke screens included the reduction of air supply
to the boilers of naval ships, the use of smudge
Figure 7-5. Typical Oil Smoke Pot (Training)
pots similar t</ those used in orange groves in the
United States, and the Hasler generator developed
and used by the British in the Battle of Britain.
In all cases, the smoke produced was brownish-
gray to black in color because the oil was partially
decomposed thus yielding free carbon. In general,
the smoke produced had poor screening properties
and limited persistence.
Two oil smoke generator mixes which were
reasonably satisfactory were develop'd during
World War 11. The first was a mixture of saw-
dust and charcoal impregnated w ith a solution of
potassium chlorate and a 1 igh boiling point oil
i. Diol 1 whieh had been jelled by the addition of
7-20
AMCP 706-185
a small percentage of soap. The other mixture
consisted of jellied oil and black powder. Tn each
ease, the ideal mixture was one in which all of the
fuel but none of the oil was oxidized, and in which
the amount of heat produced was sufficient to
vaporize all of the oil. The smoke exit orifice was
important in controlling the flaming tendency of
tue mixture, the particle size cf the smoke pro-
duced, and the pressure within the smoke pot.
Considerable effort was directed toward the
development of smoke generators, using the sen-
sible heat in exhaust gases from vehicle and air-
craft engines for the evaporation of oil to form
screening smoke. Results indicated that the
amount of smoke produced was not adequate for
screening purposes but was adequate for signal-
ing. Tn an attempt to increase the amount of
smoke produced, the exhaust gases were burned in
an afterburner, thereby increasing their tempera-
tures and heat content. With this modification,
satisfactory smoke screens were produced by air-
craft using internal combustion engines.
7-3.3.2 Phosphorus Smokes
White smoke consisting of small droplets of
phosphoric acid have been widely used for mili-
tary purposes. These droplets result from the
reaction of phosphorus pentoxide, formed by the
burning of phosphorus or phosphorus-eontaining
compounds in the air, and the water vapor in the
air, or:
P4 + 502-----> 2P3O5
P2O5 + 3H2O------> 2H3PO4
H3PO4 -f- nHjO-----» H3PO4 (dilute)
The concentration of phosphoric acid in the drop-
lets is determined by the relative humidity. Meth-
ods which have been used to form phosphorus pent-
oxide for military smokes utili.ing phosphorus in-
clude :
a. burning in air of white phosphorus (which
is spontaneously flammable),
b. burning in air of the phosphorus vapor (pro-
duced by the evaporation of red phosphorus
in a fuel-oxidant mixture), and
c. burning in air of phosphine (produced by
the action of a metal phosphide with water).
Phosphorus vapor is extremely toxic and causes
bone deca./; however, it is not present after the
smoke is formed. Phosphorus pentoxide and phos-
phoric acid arc not toxic in small concentrations,
although they may be irritating to the eyes, res-
piratory tract, and skin. Phosphorus smokes have
relatively little effect on metals.
7-3.3.2.1 White Phosphorus
White phosphorus is widely used in bursting-
type munitions to produce smoke screens for
ground-combat operations, and for signaling and
spotting purposes. Slow-burning fragments of
white phosphorus, produced and spread by an
explosive burster, are incendiary while burning.
Since burning white phosphorus produces flesh
burns which are slow to heal, it is an excellent
harassing agent.
White phosphorus is the most efficient smoke
producer on a weight basis; however, the screen-
ing effectiveness of white phosphorus in bursting-
type munitions is slight. Most of the charge burns
within seconds following the burst, resulting in a
smoke concentration many times that required for
effective screening. In addition, the temperature
rise m the eloud immediately surrounding the
burst is sufficient to produce a strong thermal up-
draft which rapidly lifts the eloud from the ground
so that the smoke cloud pillars. This may be help-
ful for signaling purposes but generally reduces
the effectiveness of white phosphorus as a screen-
ing smoke.
Two general ways to improve smoke-produeing
efficiency are possible. The first involves reduction
of the heat of combustion, which can be accom-
plished only by using different phosphorus com-
pounds. The second method, which is more attrac-
tive, involves controlling the. rate of combustion
by reducing the fragmentation of the phosphorus.
Several methods for controlling the fragmentation
of phosphorus have been tried, including the addi-
tion of mechanical reinforcement such as steel
wool,10 asbestos, plastic tubes, wire screens, and
other devices, causing ejection of the phosphorus
in pieces of predetermined size. Other methods
attempted involve the alteration of the physical
properties of phosphorus so as to produce a plas-
tic mass with low shattering characteristics.
Plasticized white phosphorus,20 PWP, was
found to be the most promising development for
7-21
АМСР 706-185
This page is reproduced at the
back of the report by ll different
reproduction method to provide
better detail.
Figure 7-6. Typical WP-Filled Device (M15 WP Smoke
Hand Grenade)
control of the fragmentation of phosphorus and
pillaring of the smoke. This consists of an intimate
mixture of granulated white phosphorus in a vis-
cous rubber solution. The material burns more
slowly and the particles do not disintegrate by
melting. As a result, pillaring is reduced and the
effective screening time is greatly prolonged. Test
results have indicated that plasticized white phos-
phorus produces distinctly better smoke screens
than similar phosphorus-filled rounds. The anti-
personnel incendiary action of PWP is as good as
that of WP.
7-3.3.2.2 Burning-Type Mixtures Containing Red
Phosphorus
Red phosphorus, the comparatively inert allo-
tropic form of phosphorus, is used in burning-type
munitions mainly for signaling purposes. Compo-
sitions consisting of red phosphorus and certain
oxidants or fuels are relatively slow-burning and
are sometimes used in sea markers. The chemical
reactions may be quite involved. For example, the
main reaction for a burning mixture of calcium
sulfate and red phosphorus appears to be:
.30CaSO4 4- 19P« -----> 6Са(РОз)2 4- 12Ca2P2O7
-f- 10P4Ss
The h“at vodueed by this reaction vaporizes the
vmainiug red phosphorus contained in the smoke
mixture. The phosphorus vapor burns on contact
with air. Some sulphur dioxide is formed when
the P4S3, produced in the above reaction, burns
along with the phosphorus vapor:
P4S3 4- 8O2 —* 3SO2 4~ 2P20g
In the presence of moisture, there is a tendency
for red phosphorus to slowly oxidize due to the
presence of small quantities of copper and iron.
This may result in ignition difficulty and an over-
all decreased performance of the smoke item.
Stable red phosphorus has been produced by de-
creasing or eliminating these impurities.21,22'23
7-3.3.2.3 Metal Phosphides
Metal phosphides, especially calcium phosphide,
which was first produced commercially in 1920,
have been used in sea markers. In these markers
the metal phosphide reacts with water to form
phosphine, which then burns in air to produce
phosphorus pentoxide and water. For calcium
phosphide:
Ca3P2 4- 6H2O —> 3Ca(OH)2 4- 2PH3
2PH3 4- 40.2----> P2O5 4- 3H2O
The rate of reaction is governed by the access of
the water and by the back pressure of the gas
produced. Calcium phosphide has been the most
satisfactory for this purpose. Aluminum phos-
phide is difficult to react and is slow-burning,
whereas magnesium phosphide reacts too rapidly.
7-33.2.4 Other Reactions for Producing Smokes
Containing Phosphorus
Other methods for producing phosphorus-con-
taining smokes include:
a. The dispersion of phosphorus in a solvent
such as carbon tetrachloride or carbon di-
sulfide. The solvent evaporates and the fine-
ly divided phosphorus burns in the available
oxygen and produces a dense white smoke.
b. The reaction of phosphorus trichloride with
bases such as ammonia and amines. The
7-22
АМСР 706-185
CONTAINERS. TOTAL SMOKE CHARGE : 0 66 LB.
Figuie 7-7. Typical Red Phosphorus-Filled Device
reactions are complex as illustrated in the
following example:
PCI. + Nll3----> PC12NH2 + IICl
PCC NH,. + NH3 —> PCI(N.H2)2 4- IICl
PCl(\ll2)a 4- NH3—>P(NHa)3 4- HC1
IICl 4- NH3---->NH4C1
The smoke is composed of a mixture of
aminopho sphoriis chlorides and NH4C1; the
smoke produced is considered irritating but
not toxic; phosphorus trichloride is not ex-
cessively corrosive to any metal affected by
hydrochloric acid; either wet or dry it is
quite corrosive to flesh.
e. The dispersion of phosphorus sulfides in
carbon bisulfide. The solvent evaporates and
the finely divided particles of phosphorus
sulfide burn readily in air; total combustion
of these sulfides yields phosphorus pentoxide
and sulphur dioxide:
P4S;, + 8O2----> 2P2()r, 4- 3SO2
2P2Sr. 4- 150o---> 2P..O.-, 4- 10S02
Both products react with water to produce
snlf'.irons aeid and phosphoric aeid; the
sulfides of phosphorus are harmless to both
metals and flesh. The smoke produced is also
relatively harmless to metals and personnel
under normal conditions; however, pro-
longed exposure to high concentrations
should be avoided.
7-3.3.2.5 Typical Devices
The characteristics of typical smoke-producing
devices containing phosphorus are summarized in
Table 7-3. Illustrations of such devices are shown
in Figures 7-6 and 7-7.
7-3.3.3 Metal Chloride Smokes
A large number of metal chlorides have been
used to produce white smoke. All of the metal
chlorides react with water to varying degrees and
this characteristic determines, to a large extent,
their efficiency as smoke agents. While the methods
by which they are disseminated depend on the
particular meta) chloride, onee disseminated the
metal chloride reacts with the water vapor in air
resulting in rhe formation of hydrated oxides, or
hydroxides and hydrochloric acid.
7-3.3 3.1 Liquid Metal Chlorides
The liquid metal chlorides ean be disseminated
by thermal vaporization followed by condensation,
or by atomization. FM, a commercial form of
titanium tetrachloride, has probably been the most
widely used liquid metal chloride smoke agent.
7-3.3.3.1.1 FM Smokes
FM smoke agent, TiCl(, is extremely reactive
resulting in the formation of hydrated oxides, cr
with atmospheric moisture and, when used for
screening, is often disseminated from aircraft
7-23
AMCP 706-185
TABLE 7-3
CHARACTERISTICS OF TYPICAL DEVICES USING
PHOSPHORUS FILLING
Characteristic Device
WP Smoke Hand Grenade (M15) Projectile (T91 HE Water Marker)
Size, in. high 2% dia. 12% long 1% dia.
Charge Weight 15 oz PWP 2.6 lb Comp B. 0.66 lb Stabilized Red Phosphorus
Ignition M206A1 fuze HE burster M500A1 fuze Comp. В
Screening Scatters WP Explodes on
Capability over a 20 yd radius impact—50 ft high; 50 ft dia; cloud duration 3 min—25 mph wind
Application Thrown, bursting charge explodes, 4-5 sec delay. Used in 90 mm munition (white marker)
spray tanks.24 Its reaction with water vapor is
relatively complex. First, the titanium tetrachlo-
ride is hydrated. This reaction is followed by
further hydrolysis yielding, finally, titanium hy-
droxide and hydrochloric acid. The smoke consists
of a mixture of fin? particles of solid titanium hy-
droxide, Ti(OII),; the hydrated oxide, TiO2-
H2O; intermediate hydroxychlorides of titanium;
and dilute HC1 droplets. The sequence of reaction
is :
Tit1!, 4- 5H2O---> TiCl, • 5H2O
TiCl, 5IL.0----> TiC];t(OH) • 4H2O + HC1
TiCl3(OII) • 4II2O— *TiCl2(OH)2 • 3H2O
+ HC1
TiCl2(()H)2 • 3II2()---> Ti(OH), • H2O
+ 2HC1
Liquid FM is excessively corrosive to metal if
moisture is present. With moisture, FM forms a
solid, gummy deposit that clogs equipment, л 0.2
percent phosphorus solution in CS2 and CCl,,
added to the FM, alleviates this problem.
Titanium tetrachloride can also be disseminated
when dissolved in dichloroethane and similar ma-
terials. The solvent evaporates and the titanium
tetrachloride reacts with the water vapor in the
air to produce smoke.
7-3.3.3.1.2 Silicon Tetrachloride
Silicon tetrachloride is another liquid metal
chloride which has been used to produce smoke.
Silicon tetrachloride is, however, less reactive than
titanium tetrachloride and, unless considerable
moisture is present, little smoke is produced. The
smoke particles produced from the reaction of sili-
con tetrachloride with water vapor are dilute hy-
drochloride acid droplets and hydrated silicon
oxide. The reaction between silicon tetrachloride
and water vapor is similar to that for titanium
tetrachloride.
Silicon tetrachloride is less corrosive to metals
than titanium tetrachloride. If dry, it can be
stored in aluminum or steel containers. With
moisture, silicon tetrachloride forms a gummy
deposit which clogs equipment. Flesh burns from
7-24
АМСР 706-185
silicon tetrachloride are similar to hydrochloric
acid burns.
7-3.3.3.1.3 Stannic Chloride
Stannic ehloride will produce a good smoke
from relatively small amounts of material. The
reactions of stannic; chloride with water vapor
are similar to those of titanium tetrachloride. The
smoke is composed of HC1 droplets and a mixture
of four stannic hydroxy chlorides Li the presence
of moisture tney arc nearly as corrosive as titan-
ium tetrachloride. A gummy deposit on metals
is formed by stannic chloride when moisture is
present. The smoke is corrosive to anything af-
fected by hydrochloric acid. Stannic chloride pro-
duces burns similar to strong acid burns.
7-3.3.3.2 Solid Metal Chlorides
Solid metal chlorides are normally disseminated
by thermal vaporization followed by condensation.
In most cases, the energy required to vaporize these
agents is provided by a pyrotechnic heat source.
The hydrolyses reactions for the metal chlorides
whieh have been used as smoke agents are:
CuCl2 + 2H2O------> Cu (OH)2 + 2HC1
FeCl2 4- 2H2O-----> Fe(OH)2 + 2HC1
FeCl3 + 3H2O-------> Fe(OH)3 4- 3HC1
A1C1.3 + 3H2O------А1(ОН)з + 3HC1
ZnCl2 + 2H2O-------» Zn(0H)2 4- 2HC1
CdCl2 4- 2HbO------> Cd (OH)2 4- 2HC1
HgCl2 + 2H2O-------> HgO • H2O 4- 2HC1
3nCl2 4- 2H2O------> Sn(OH)2 4- 2HC1
7-3.3.3.2.1 HC Smokes
Zinc chloride is one of the most reactive of the
solid metal chlorides used as a smoke agent. Al-
though toxic, zinc ehloride produced as the result
of a pyrotechnic reaction is widely used for screen-
ing and signaling purposes.1'’ Inasmuch as hydro-
chloric acid is produced by the reaction between
zinc chloride and water vapor in air, the smoke is
irritating to personnel and will react with any
materials affected by hydrochloric acid.
The French, during World War I, were the first
to produce a smoke mixture of this type. The mix-
ture known as the Berger mixture consisted of
zinc, carbon tetrachloride, zinc oxide, and kiesel-
guhr. The last two ingredients served to absorb
the carbon tetrachloride and to slow down the rate
of reaction. As the smoke produced contained
some carbon in addition to the zine ehloride, it was
somewhat gray in color. An American improve-
ment, the addition of an oxidizing agent, resulted
111 a whiter smoke. Other changes were made lead-
ing to the development of the smoke mixture,
available at the start of World War II, known in
the United States as HC. This mixture contained
hexaehlocoethane as the chlorinating agent, zinc as
the fuel, a perchlorate as an oxidizing agent, and
ammonium chloride as a retard“r. The British
had a similar mixture containing hexachloroethane,
zine oxide, and calcium silicide as a 1 educing agent.
Since neither of these mixtures was completely
satisfactory early in World War II, the British
mixture was modified by replacing the reducing
agent, calcium silicide, with alumin:u>.
7-3.3.3.2.2 Chemistry of HC Smoke Mixtures2® 28
The basic reaction between a completely chlori-
nated carbon compound and metallic zinc can be
represented by the reaction:
CxCly 4- y/2Zn-----> xC 4- y/2ZnCl2
Thir reaction is highly exothermic with the evolu-
tion of 165.3 kilogram-calories or 581 gram-calories
per gram of mixture if carbon tetrachloride is
used, and 244.6 kilogram-calories or 565 gram-
calories per gram of mixture if hexachloroethane
is used as the chlorinating agent. If zinc oxide is
added, the mixture will burn more slowly. The
smoke produced is whiter due to the reaction be-
tween zinc oxide and carbon:
ZnO 4- C-----> CO 4- Zn
which removes the carbon from the smoke. The
zine produced by this reaction then reacts with
additional amounts of the chlorinating agent. As
tiie reaction between zinc oxide and carbon is
endothermic, early attempts to use zinc oxide in
НС-type smokes лесе only partially successful
since the temperature reached was not high enough
to cause complete reduction of the zinc oxide.
As the result of modifications made during the
early part of World War II, HC smoke mixtures
—as normally compounded for screening purposes
7-25
AMCP 706-185
- -now consist of approximately equal amounts by
weight of zinc oxide and a chlorinating agent such
as hexachloroethane or carbon tetrachloride, and a
few percent of aluminum. The reaction might pro-
ceed through the following steps, when hexachloro-
ethane is the chlorinating agent;
2A1 -r C2Cle----> 2A1C13 + 2C
This reaction is exothermic, liberating around 280
kilogram-calories of energy. The aluminum chloride
formed then reacts with the zine oxide:
2А1С1з + 3ZnO------> 3ZnCl2 + A12O3
This reaction is also exothermic, liberating 103 0
kilogram-calories. The overall reaction obtained
by combining the above reactions is:
2AI+ C2Cle 4- 3ZnO------> 3ZnCl2 4- A12O3 + 2C
This reaction is highly exothermic, liberating 383.5
kilogram-calories or 717 gram-calories per gram
of smoke mixture. A second reaction sequence
leading to the same overall reaction is possible.
This sequence, which to some investigators better
represents the actual course of the reaction, is:
2Л1 4- 3ZnO-----> 3Zn 4- Al2()3
3Z11 4- O2C1G---> 3ZnCl2 4- 2C
Both of these reactions are exothermic, the first
to the extent of 136.6 kilogram-calories, and the
second to the extent of 219.8 kilogram-calories.
The overall reaction with aluminum is similar to
the reaction:
3CaSi2 4- 15ZnO 5C2C1O ----------> 15ZnCl2
4- 3CaO
4- 6SiO2
4- 100
for the earlier smoke mixture containing calcium
silicide as ♦he reducing agent.
The extent of the reaction between zine oxide
and carbon can be varied by changing the propor-
tion of aluminum in the smoke mixture. If the
aluminum content in the smoke mixture is re-
duced, while the proportions of hexachloroethane
ami zine oxide are kept constant, the amount of
free carbon in the smoke is reduced. This results
in a whiter smoke and also reduces (he burning
rate. The overall reaction where no carbon is pro-
duced is:
2A! 4 9ZnO 4- 3C2C1«--------> А12О3 4. 9ZnCL
4- 6CO
The amount of aluminum in the foregoing reac-
tion can vary from 3.6 to 10.1 percent by weight.
With the lowci aluminum content, only carbon
monoxide is formed; and, as the aluminum con-
tent is increased, free carbon begins to appear
along with the carbon monoxide until at the
upper limit all the carbon is in the form of smoke.
If less than 3.6 percent of aluminum is used, both
carbon dioxide and carbon monoxide are produced;
and, as the percentage of aluminum is still further
reduced, the ratio of carbon dioxide to carbon
monoxide increases The heat evolved varies from
356 gram-calories per gram of a smoke mixture
containing 3.6 percent of aluminum to 717 gram-
calorie.s per gram of mixture containing 10.1 per-
cent aluminum content. If carbon tetrachloride is
used (Type-E HC mixture) instead of the hexa-
chloroethane, the amount of aluminum for similar
reactions to take place ranges from 5,37 percent
to 10.2 percent. The variation in burning time
with aluminum content, for mixture containing
hexachloroethane (Type-C ИС mixture), is illus-
trated by the data presented in Table 7-4.
TABLE 7-4
VARIATION OF BURNING TIME OF TYPE-C
HC SMOKE MIXTURE WITH
ALUMINUM CONTENT
(AN-M8, HC SMOKE GRENADE)
Aluminum Content, Burning Time,
% sec
9.0 55
8.4 64
8.0 65
7.5 71
7.0 84
6.5 96
6.0 107
5.5 147
5.5 200
The character of the zine oxide also has an in-
fluence on the burning rate of the smoke mixture.
HC smoke grenades which were loaded with a
smoke mixture containing 6.25 percent aluminum,
46.9 percent hexachloroethane, and 46.9 percent
7-26
АМСР 706-185
zinc oxide were found to have a wide range of
burning times depending on the moisture, car-
bonate and sulfate content, and the particle size
of the zinc oxide used. Very fine and very coarse
zinc oxides form slower-burning mixtures than
those of intermediate size. Fast-burning smoke
mixtures result when moderately large-sized par-
ticles of zinc oxide with a low moisture and car-
bonate content are used, while slow-burning mix-
tures are produced when very small-sized particles
of zinc oxide, or those having a high carbonate
content, are used. A blend of a coarse and a fine
zinc oxide results in a faster-burning mixture than
would be predicted from the burning time of the
individual oxides.
The apparent density of the zine oxide has no
direct effect on the burning time of the Type-C HC
smoke mixture containing zinc oxide. For Type-E
IIC smoke mixtures, the consistency of the filling
varies from wet-and-doughlike to dry-and-powdery
as the relative density of the zinc oxide decreases.
The rate of burning of the mixture also decreases
as the relative density of the zinc oxide decreases.
If the aluminum content is reduced below five
percent, the burning time becomes erratic. As a
result, other means must be employed to further
retard the burning rate. The substitution of basic
zinc carbonate for zinc oxide, in a quantity not
exceeding seven percent of the zinc oxide, is one
method. The stoichiometric ratio of zinc to hexa-
ehloroethane, however, must be maintained. Other
retarders whieh lengthen the burning time of
the HC smoke mixture include urea and Monostral
blue dye. Naphthalene was found to have a re-
tarding action on the fast-burning mixtures but
no definite effect on the slow-burning mixtures.
Sucrose, Vinsol resin, and anthracene were tried
but were not satisfactory.
IIC smoke mixtures are relatively stable ex-
cept when there are soluble chlorides in the zinc
oxide or when water contacts the hexachloroethane.
Although the sequence of events when water gains
access to an HC smoke mixture containing hexa-
ehioroethane has not been established conclusively,
it is reported27 that in the presence of zinc dust
and moisture C’2Cle is reduced and tetrachloro-
ethylene is one of the reaction products. Zinc
dust is oxidized to zine oxide and zine chloride.
Impurities such as chlorides, sulfates and nitrates
accelerate the reaction.
7-3.3.3.3 Modified HC Smokes28
When a shortage of chlorine appeared imminent
during World War II, attention was focused on
the possibility of developing inorganic chlorine
earners derived from hydrochloric acid. It was
found that anhydrous ferric chloride could be used
in place of hexachloroethane in zinc chloride smoke
mixtures. The following reactions involving alu-
minum, ferric chloride, and zinc oxide are thought
to occur at high temperatures:
2A1 4- 6FeCl3 + 9ZnO--------> A12OS + 6FeO
d- 9ZnCl2
2A1 + 2FeC!3 + 3ZnO---------> A12O3 + 2Fe
-4- 3ZnCl2
The heats of reaction per gram of smoke mixture
for the above reactions are 186 and 378 gram-
calories, respectively. Because of the hygroscopic
nature of ferric chloride, compositions containing
this ingredient are difficult to prepare in moist
atmospheres. To obviate this difficulty, the use
of ferric chloride complexes such as KFeCl4 has
been proposed.
In recent work,20 hexachlorobenzene and
Dechlorane (perchloropentacyclodecane, C10CI12)
have been used instead of the more volatile hexa-
chloroethane. The smoke volume and burning
time are comparable to the normal HC composi-
tions; its stability during storage is better. No
significant difference in relative toxicity was found ;
both smokes are toxic and produce degeneration of
tissues in the respiratory system on long exposure.
Plastic bonding agents30 were also successfully
tried allowing the smoke compositions to be loaded
into unusual-shaped containers. The filling and
blending operations have been improved with im-
provement in uniformity of the mixtures. Storage
characteristics of plastic bonded white smoke muni-
tions were also better, although corrosion has not
been completely eliminated.
7-3.3.3.4 Zinc Hexachlorobenzene-Potassium
Perchlorate System
Zinc hexaehlorobenzene-potassiuin perchlorate
systems have been used in some eases for signaling
7-27
АМСР 706-185
ililiLlihliiililililililJiluililililihfiLJ ' i
Figure 7-8. AN-M8 HC Smoke Hand Grenade
and marking purposes. Heat of combustion and
differential thermal analysis have indicated that
three chemical reactions are basically responsible
for the preignition, ignition, and combustion phases
of this ternary system.31 These reactions are:
1. 3Zn + CsCle---> 3ZnCl2 + 6C
2. 4C + KClOi----> KOI + 4CO (and CO2)
3. 4Zn 4- KC104-->KCl+4ZnO
The agreement between the measured and calcu-
lated heats of combustion based on these reactions
is good.
The first of these reactions is a relatively slow,
exothermal reaction which takes place at, and
above, the boiling point of hexachlorobenzene to
produce earbon. Carbon, which is produced at a
Figure 7-9. M5 HC Floating Smoke Pot
temperature above the transition point of potas-
sium perchlorate, reacts with the latter at the
boiling point of hexachlorobenzene, according to
reaction 2. The latter reaction, together with reac-
tion 1 to a limited extent, raises the system to a
temperature above 500°C. At temperatures above
the melting point of zinc (419°C), the preignition
reaction 3 becomes highly exothermal and propa-
gation ensues in the range of 520°C. Therefore,
the production of carbon by reaction 1 is an im-
portant factor in the sensitivity of this composition
to thermal ignition.
7-3.3.3.5 Typical Devices
Typical devices using HC type smoke mixtures
are shown in Figures 7-8 and 7-9. Details and
specifications for these devices are contained in
Table 7-5.
7-3.3.4 Sulfuric Acid Smokes
Several white smokes are made up, at least
in part, of droplets of dilute sulfuric acid result-
7-28
АМСР 706-185
TABLE 7-5
CHARACTERISTICS OF TYPICAL DEVICES USING HC MIXTURE
Characteristic Device
HC Smoke Hand Grenade (AN-M8) HC Floating Smoke Pot (M4A3)
Size, in. 5Л high 2.5 dia Four smoke emission holes in top 13 high 12 dia Three vent holes in top
Charge 19 oz Type-C 23.5 to 27.5 lb
Weight HC Mixture HC Mixture
Ignition M201A1 fuze plus ignition mix and starter mix M207A1 fuze plus first fire charge and delay charge
Burning Time 105-150 sec 10-15 min
Application Thrown, 1.2-2 sec delay—may be launched from rifle or carbine for screening or marking. Screening
ing from the reaction of the smoke-producing
chemical with water vapor in the air. In a num-
ber of cases, because of the presence of chlorine
atoms in the original compound or mixture, dilute
hydrochloric acid droplets are also produced. In
this category, the FS smoke mixture of chlorosul-
fonic acid and sulfur trioxide, which is used for
screening, is probably the most important. Pro-
longed exposure to this type smoke can be in-
jurious and should be avoided.
7-3.3.4.1 Sufide Trioxide
This agent is usually dispersed into the at-
mosphere in fine particles either by mechanical
atomization or thermal vaporization. The dis-
persed sulfur trioxide combines with water vapor
in the atmosphere, resulting in the formation of
tiny droplets of sulfuric acid;
SO3 4- Hat)-----* H2SO4
The acid then takes on more water vapor to pro-
duce particles of diluted aeid which constitute
the smoke cloud. Dry sulfur trioxide does not
attack rnetals at ordinary temperatures. At red
heat, sulfur trioxide vapors reacting with metals
form metal sulfides and oxides. When the liquid
comes in contact with the skin, sulfur trioxide
causes burns that heal slowly. If water is present,
sulfuric acid is formed which is corrosive to metals.
As has been indicated, the smoke formed is cor-
rosive to anything affected by sulfuric acid.
7-3.3.4.2 Oleum
Oleum is a solution of sulfur trioxide in sul-
furic acid. The agent is dispersed in the same
manner as sulfur trioxide. The sulfur trioxide
reacts with water vapor in the air; the sulfuric
aeid thus formed and the sulfuric acid solvent ab-
sorb water to give smoke droplets of dilute sulfuric
acid.
7-3.3.4.3 Chlorosulfonic Acid
This acid reacts with water similar to SOs-
Smokr is produced by dispersion of the acid into
the atmosphere by mechanical atomization or
thermal vaporization. When the dispersed acid
mingles with water vapor, sulfuric acid and hydro-
chloric acid are produced •.
7-29
AMCP 706-185
HCISO3 + И2О —» H2SO4 + HC1
Both acid products take on further water to give
droplets of dilute sulfuric and dilute hydrochloric
acid. The smoke produced, therefore, is corrosive
to anything affected by sulfuric acid or hydro-
chloric acid and is irritating to the respiratory
system, eyes, and skin of exposed personnel.
7-3.3A4 Sulfuryl Chloride
Sulfuryl chloride is dispersed in the same man-
ner as sulfur trioxide by mechanical atomization
or thermal vaporization. It reacts with water
vapor from the atmosphere to give a smoke com-
posed of dilute sulfuric acid and dilute hydro-
chloric acid droplets. In the presence of moisture,
sulfuryl chloride is as corrosive to metal and flesh
as is sulfuric acid. Dry sulfuryl chloride is cor-
rosive to those materials affected by sulfuric or
hydrochloric acid and will cause burns to the flesh
similar to those of sulfuric acid.
7-3.3.4.5 FS Smoke
FS smoke agent consists of a mixture of 45 per-
cent chlorosnlfonie acid and 55 percent sulfur
trioxide, and is slightly more reactive with water
than FM smoke agent (Paragraph 7-3.3.3.1.1).
The material can he dispersed by mechanical
atomization or thermal vaporization. For produc-
ing smoke screens, it is often disseminated from
spray tanks carried by aircraft. As the smoke
consists of droplets of dilute sulfuric and hydro-
chloric acid, the smoke is corrosive to anything
affected by these compounds. The smoke is very
irritating to the nose and lungs and exposure
should be avoided. If moisture is present, FS
smoke agent is excessively corrosive, and it will
eause skin burns.
7-3.3.5 Smoke-Producing Reactions Involving
Ammonia or Amines
Most of the reactions described in this sub-
paragraph were at one time used to produce
screening smoke. For many reasons they are not
presently so used. Some of these systems do not
require atmosphere -oustituents (such as water
vapor) to be effective smoke producers and, theie-
fore, may be useful at high altitudes.
7-3.3.5.1 Ammonium and Amine Salts of
Volatile Acids
Ammonium and amine salts of a volatile acid
sueh as IIC1 can be vaporized by heating. For
ammonium chloride the reaction is:
NH4CI —NH3 И- HC1
On cooling, recombination occurs. Amine salts,
such as aniline hydrochloride, may be used sim-
ilarly. Ammonium or amine salts have no effect on
metals when dry; however, the presence of water
may result in some corrosion. These salts can be
handled without danger to personnel.
7-3.3.5.2 Metal Chlorides and Ammcnia
Metal chlorides may also be reacted with am-
monia or amines to produce smoke. The base must
combine with the metal chloride just after disper-
sion. Other bases such as hydrazine may be used
in place of ammonia.
7-3.3.5.2.1 Hydrogen Chloride and Ammonia
The reaction of hydrogen chloride with ammonia
is similar to the reaction of a metal chloride with
ammonia. This two-gas system produces fine par-
ticles of solid ammonium chloride. The smoke
formed is considered very visible. Gaseous hydro-
gen chloride is not very corrosive to metal con-
tainers when dry ; however, when moisture is pres-
ent, it is quite corrosive. Ammonium chloride
smoke is not corrosive to metals. Hydrogen chlo-
ride gas is very irritating and, in moderate quanti-
ties, it is toxic. Ammonia gas is also toxic in mod-
erate quantities; however, ammonium chloride
smoke is harmless.
7-3.3.5.2.2 Titanium Tetrachloride and Ammonia
The reaction between titanium tetrachloride
and ammcnia is somewhat complex. First, an am-
moniate is formed. This ammoniate is hydrolyzed
by water vapor from the atmosphere. Ammonia
reacts with the hydrochloric aeid gas released dur-
ing hydrolysis of T1CI4 to give NH4CI. Therefore,
the system withe at water vapor is less effective.
The reactions for this process are as follows:
TiClt + 4NH3------> TiCl4 •’ 4NH3
TiCl4 • 4NH3 )- 5H2O-------> Ti(OH)4 • H20
+ 4NH4CI
7-30
АМСР 706-185
The smoke is a mixture of Ti(OH)4 • H2O, inter-
mediate hydroxy chlorides of titanium, and am-
monium chloride particles.
7-3.3.5.2.3 Silicon Tetrachloride, Ammonia,
and Water
The best proportions are two parts silicon tetra-
chloride, one part ammonia, and one part water,
by weight. The reactions are quite complex; first,
an ammoniated silicon tetrachloride is formed
while at the same time hydrolysis of the silicon
tetrachloride occurs to give SiO2, 2II2O, and HC1;
and finally, NH3 combines with the HC1 to give
NII4CI. The reaction sequence is:
SiCU + 4NH3------> SiCl4 • 4NH3
SiCh 4- 4H2O-----> SiO2 -2H2O + 4HC1
SiCU • 4NH.3 + 4H2O-----> Si02 • 2H2O
+ 4NH4C1
HC1 + NH3------> NH4CI
7-3.3.5.3 Sulfur Compounds and Ammonia
Sulfur compounds will also react with bases in-
cluding ammonia and amines. These smoke-pro-
ducing systems do not require atmospheric con-
stituents to form the smoke particles and, there-
fore, may be useful at high altitudes.
7-3.3.5.3.1 Sulfur Trioxide and Ammonia
or Amines
The smoke is formed by supplying a reactive
gas to sulfur trioxide at the time of dispersion.
Ammonia and amines have proved successful, and
other basic substances, such as hydrazine, hy-
droxylamine, etc., might be satisfactory. In the
ease of sulfur trioxide and ammonia, the reactions
are:
S()3 4- 2N11----> SOa(NH2)2 4- H20
SO3 4- NII:t----> HSO3NH2
SO3 {- 2NI1.4---> NH,SO:1NH4
All three reactions occur more or less simulta-
neously. As fin' as can be determined, the smoke
consists of particles- of these products.
7-3.3.5.3.2 Chlorosulfonic Acid and Ammonia
or Amines
Ammonia and the amines react readily with
liCISOj in much the same manner as with sulfur
trioxide; other bases such as hydrazine, hydrox-
ylamine, etc., probably could be substituted. The
basic reaction is as follows:
HC1SO3 4- 3NH3------> S02(NH2)2 • NH4CI
4- H2O
Other reaction products might be formed in addi-
tion to the products indicated by this reaction.
7-3.3.5.3.3 Sulfuryl Chloride and Ammonia
or Amines
Sulfuryl chloride will react with bases such as
ammonia and amines to give a better smoke than is
formed with water vapor. The following reactions
are for sulfuryl chloride and ammonia:
SO2C12 4- 4N.II3---> SO2(NH2)2 4- 2NH4CI
2SO2C12 7NH3-------> 4NH*C1
4- NH(SO2NH2)2
3SO2C12 4- 9NH3-----> 6NH4CI 4- (NH)a(SO2)8
The first reaction gives sulfamide; the second,
aminosulfamide; and the third, trisulfamide.
Whether the smoke particles are those products
or further reaction products is not known.
7-3.3.6 Sulfur Smokes
Sulfur smokes consist of small particles of ele-
mental sulfur suspended in the air. Sulfur smokes
ean be produced by methods similar to those used
for the production of oil smokes. In addition,
sulfur smokes ean be made by intimately mixing
sulfur and a suitable fuel. Mixtures which have
been used include sulfur, sodium nitrate, and char-
coal; sulfur, potassium nitrate and charcoal; and
sulfur, ammonium nitrate, and charcoal. The sul-
fur is present in mneh larger quantities than in
black powder; the latent heat of vaporization and
fusion of the sulfur absorbs the heat produced by
the reaction and, hence, slows the burning rate.
The burning rate for this type of mixture depends
on the percentage of sulfur.
7-3.3.7 Organic Metallic Compounds
Certain organic metallic compounds ean be used
for the production of smoke. These compounds are
reactive and will burn spontaneously in moist air.
The sequence of reaction between an organic metal-
7-31
АМСР 706-185
lie compound, water, and oxygen is a highly exo-
thermic reaction between the organic metallic com-
pound and water vapor, yielding a hydrocarbon
and metal hydroxide; the heat of this reaction re-
sults in the hydrocarbon’s burning to form carbon
dioxide and water. This reaction for dimethyl
zinc is:
(CH3)2Zn + 2H2O------->2CH4 + Zn(0H)2
CH4 -|- 20г----* CO2 -I" 2H2O
In this case the white particles consist of solid
zinc hydroxide particles.
7-3.3.8 Comparison of White Smokes
The total obscuring power, TOP,32 of a smoke
is obtained by multiplying the product of volume,
in cubic feet of smoke produced per pound of ma-
terial, and the reciprocal of the smoke layer, in
feet, necessary to obscure the filament of a 40-watt
Mazda lamp. The TOP for some white smoke
agents, at low altitudes where atmospheric con-
stituents are plentifiul, is given in Table 7-6.
The so-called “standard smoke” is a smoke of
such a density that a 25-candlepower light is just
invisible when observed through a layer 100 feet
thick. A comparison of some white smoke agents at
low altitude, where atmospheric constituents are
plentiful, in terms of the amount of smoke agent
required to produce 1000 cubic feet of standard
smoke, is given in Table 7-7.
All of the TOP and standard smoke measure-
ments were made at low altitude, where atmo-
spheric constituents available for reaction with the
primary smoke particles were plentiful. The im-
portance of atmospheric constituents is illustrated
in Table 7-8 where the number of grams of smoke
formed per gram of smoke agent used is tabulated.
It is evident, for the agents compared, that WP
yields the greatest weight of aqueous solution in
equilibrium with air at 75 percent relative humidity
per unit-weight of the smoke agent. The ratio for
fog oil is unity (1.0) since the fog oil is not hygro-
scopic and only the agent is available to form the
smoke particles. The values do not take into ac-
count ingredients which reinai'i > Aizid"as residues
or otherwise contribute little ,>ЛЬе obscuring
power. The absolute values will vary with the
relative humidity, but change very little with air
TABLE 7-6
TOTAL OBSCURING POWER OF
WHITE SMOKES
Chemical TOP, ft2/lb
White Phosphorus 4600
TiCl4 + NH3 3030
so3 3000
FS 2550
HC1 + NHS 2500
HC Mixture 2100
SiCl4 + NH3 1960
FM 1900
Oleum 1890
SnCl4 1860
PC13 + NH3 1600
PC1S + NH3 1800
HCISOs + NH3 1600
SiCl4 1500
HClSOn 1400
BM Mixture 1400
Berger Mixture 1250
FM -j- 1,2-Dichiv7oetliane 1235
SOaCl2 1200
Cl2 + NH3 750
AsCl3 460
Type-S Mixture 460
Crude Oil 200
TABLE 7-7
AMOUNT OF SMOKE AGENTS REQUIRED TO
PRODUCE 1,000 CUBIC FEET OF
STANDARD SMOKE
Compound Amount Required, oz
Phosphorus 0.060
FM f- NH3 0.090
so3 0.094
FS 0.110
HC, Mixture 0.120
FM 0.150
Oleum 0.151
Crude Oil 2.000
7-32
AMCP 706-185
AMCP 706-185
TABLE 7-8
AMOUNT OF SMOKE PRODUCED PER UNIT
WEIGHT OF SMOKE AGENT AT
75% RELATIVE HUMIDITY
Agent Amount
Fog Oil 1.0 (does not produce
aqueous solution)
Zinc Chloride 2.5 (water vapor absorbed)
Ferric Chloride 3.1 (water vapor absorbed)
Aluminum Chloride 5.0 (water-vapor absorbed)
Phosphorus 7.11
temperature at any one value of the relative
humidity. Also, the relative results are not
changed. It is important to note that these measure-
ments chiefly concern the obscuring or screening
power of the smoke and no consideration is given
to other factors which might be important for a
signal smoke, tracking aid, or tracking and ac-
quisition smoke.
7-3.4 COLORED SMOKES33
Colored smokes, like other smokes, can be pro-
duced by four basic methods:
a. Dispersion of finely powdered, colored ma-
terials
b, Chemical reactions resulting in the forma-
tion of colored particles
c. Detonation of an explosive, thereby scat-
tering colored material, or
d. Volatization and condensation of a colored
material.
The first two methods have been found to give,
smokes of only small volume and dull color. The
last two methods, both of which involve the vapori-
zation and condensation of a colored material, have
been found feasible only when volatile organic
dyes are used as the coloring material. As a result,
all colored smoke signals (except black) are based,
at present, upon the use of an organic dje.
7-3.4.1 Dyes34
Since colored smokes involve vaporization and
condensation, constituent dyes are required to be
thermally stable and fairly volatile, and to possess
the requisite purity of color when disseminated
as a smoke. These properties are closely related
to the chemical constitution of the dye. No dye
was ever specifically developed for smoke appli-
cation ; only those available were considered and
tested. In an early investigation of the thermal
stability and volatility of dyes, it was concluded
that dyer containing amino or substituted amino
groups, but not sulfonic groups, were suitable for
the production of colored smokes. These conclu-
sions were confirmed and amplified by British in-
vestigators in a systematic survey of common dye-
stuffs. The constitutional characteristics which
render a dyestuff suitable for the production of
colored smoke were found to be as follows:
a. The molecular weight of the dye should pre-
ferably' be less than 400, but in no case
greater than 450.
b. The dye should be a member of one of the
following series: anthraquinone, azine, azo,
quinoline, xanthene, or anthrone.
e. The following groups must be absent: sul-
fonic, hydrochloride, nitro, nitrose, quar-
ternary ammonium, and oxonium.
d. The following groups may be present:
amino and substituted amino, alkyl, aryl,
chloro, bromo, hydroxy, and alkoxy.
e. The dye must not tend to undergo auto-con-
densation.
Not all dyes which have the above characteristics
will produce satisfactory colored smokes, but some
of the many dyes which have been evaluated will
produce “excellent’’ colored smoke clouds. Some
of the more satisfactory dyes are listed in Tables
7-9 and 7-10.
In general, the anthraquinone dyes have proved
to be superior to all others in producing colored
smoke clouds. The azo derivatives have furnished
only a few suitable dyes, despite the fact that
they constitute the largest class investigated. In
no ease have the azo dyes been superior to the
anthraquinone dyes The undesirable qualities of
the azo dyes are their tendency to flame and their
transparency. Among the azine dyes, rosindone and
its derivatives give excellent, bright smoke clouds
without flaming. Their color range, however, is
limited to red am) oriuige. This class of dyes offers
7-33
АМСР 706-185
TABLE 7-9
SOME DYES WHICH HAVE BEEN USED IN BURNING-TYPE
COLORED SMOKE MUNITIONS
Red Smoke:
Dye(s)
9-diethylamino-7-phenyl-5-benzo (a) phenazinone.
Also known as 9-diethylamino rosindone
1-methylaminoanthraqninone
1- (2-methoxypheaylazo) -2-naphthol
2-quinolyi-2-indandione-l,3 (Rhodamine B) plus
1- (4-phenylazo) -2-naphthol
2-aminoanthraqtiinone plus 1-inethylaminoanthraquinone
O-tolylazo-o-tolylazo-(3-naphthol (Sudan IV) ; plus
2-quinolyl-2-indandione-l,3 (Rhodamine B) ;
plus auramine hydrochloride
1- (tolylazoxylylazo) -2-naphthol
Green Smoke:
1,8-di-p-toiuidinoanthraquinone
1,4-di-p-toluidinoanthraquinone
l-methylamino-4-p-toluidinoanthraquinone plus
auraminc hydrochloride
1,4-di-p-toluidinoanthraquinone plus
dimethylaininoazobenzene
1,4-di-p-toluidinoanthraquinone plus
auramine hydrochloride
1,4-di-p-toluidinoanthraqninone with quinophthalone
(quinoline yellow)
Orange Smoke:
1-aniinoanthraquinone
l-aniino-8-ehloroanthraqiiinone plus qtiinizarin
l-(4-phenylazo) -2-naphthol
9,10-dianilinoanthraeenc phis phthaloperinone
1 (4 p!:enylazo)-2-iiaphtho) phis 9,l()-dinnilinoanthraecne
Orange-Red Smokt :
l-(4-nitrophenylazo)-2-naphthol
Yellow Smoke:
Anrainine hydrochloride
1- (4-dimcthylaniinophenylr.zo)-2-naphthol
l-( l-phenylazo)-2-nnphthol (Sudan 1) plus either anrainine
hydrochloride or qninophtbalone (quinoline yellow)
N.N'-dimethy I p plieuylnzoainliiie
7-34
АМСР 706-185
TABLE 7-9 (coned)
Hluc Smoke: Dye(s)
l-hydroxy-4-p-tohiidinoanthraquinone
Indigo
l-amino-2-bronio-4 p-toluidinoanthraquinone
l-amino-2-methyl-4-p-toluidinoanthraquinone
(Alizarin Sapphire, Blue R. Base)
1,4-dimethylaminoanthraquinone
l-hydroxy-4-p-t<,luidinoanthraquinone
l-methylamino-4-p-toluidinoanthraquinone
N-(p-dimethylaminopheiiyl)-l,4-naphtholquinonimme
Violet Smoke:
1,4-diaminoanthraquinone
l,4-diamino-2,3 dihydroanthraquinone
1,5-di-p-toluidinoanthraquinone
I-meth.viamino-4-p-toluidinoanthraquinone plus
2-quinolyl-2-indandione-l,3 (Rhodamine B)
l-methylamino-4-p-tohiidinoanthraquinone plus
1,5-di-p-toluidinoanthraquinone
TABLE 7-10
SOME DYES WHICH HAVE BEEN USED IN EXPLOSIVE-TYPE
COLORED SMOKE MUNITIONS
Red Smoke: Dye(s)
1 - ( 2-methoxyphenylazo) -2-naphthol
1-methylaminoanthraquinone (Celanthrene Red)
I cllow Smoke;
2,4-dif ninoazobenzene (Chrysoidine G, base)
Auramine Hydrochloride
Green Smoke:
1,4-di-p-toluidinoanthraquiiione (Quinizarin Green)
plus quinophthaione (Quinoline Yellow, base)
in the ratio of 65/35
1-4-di-p-toluidinoauthraquinone plus auramine hydrochloride
7-35
AMCP 706-185
Figure 7-10. Differential Thermal Analysis and Thermo-
gravimetric Analysis Curve for 1,8-dihydroxyanthra-
quinone
the most promir. for future investigation. Several
dyes 'ontaining 'lulfonie groups have been tested
and, vith only one exception, found to be non-
volatile this exception is the ammonium salt
of 2- (2-hydroxy-l-naphthylazo) -1-naphthalenesul-
fonie acid which gives a fair red smoke. Lakes and
other pigments have been found to give no smoke
when used in pyrotechnic mixtures. For satisfac-
tory results, the purity of dyes used must be high,
since organic impurities are usually volatile and
tend to give a muddy-colored smoke. Inorganic
impurities are generally either sodium chloride
or sodium sulfate and, while they in themselves
do u-.-t change the color of the smoke, large quanti-
ties slow down the burning rate of the smoke mix-
NOTE: X-AXIS TEMPERATURE REPRESENTS SAMPLE
Figure 7-11. Differential Thermal Analysis and Thermo-
gravimetric Analysis Curve for 1,4-di-p-toluidinoanthra-
quinone
ture and decrease the quantity of smoke available.
Although organic dyes have been widely used
in burning- and burst-type colored smoke markers
and signals, very little is known about their ehem-
ical, physical, and thermodynamic properties at
elevated temperatures. In making a choice of
dyes, the thermodynamic properties of the com-
pounds—such as heats of fusion, vaporization or
sublimation, decomposition, equilibrium vapor pres-
sures, rates of vaporization, and the temperatures
at which these phenomena occur—are important.
For example, if the compound is thermally stable
but has a relatively low vapor pressure so that
relatively high temperatures are required for its
vaporization, the fuel-oxidant to dye ratio required
for optimum vaporization of the dye will not allow
the munition to contain the amount of dye neces-
sary to produce an acceptable volume of colored
smoke. If the dye can be vaporized at a low tem-
7-36
АМСР 706-185
perature but the differential between the tempera-
ture for vaporization and the temperature for
decomposition is not large, the dye to fuel ratio
increases but the possibility of decomposition of
the dye is also greatly increased. In general, there-
fore, the dyes utilized must be thermally stable and
vaporize without decomposition at intermediate
temperatures.
The volatilization properties of organic dyes
proposed for use in pyrotechnic smoke mixtures
were studied by differential thermal analysis
(DTA) and thermogavimetrie techniques.s5'se The
dyes evaluated by these techniques can be classi-
fied into three groups.
The materials in Group 1 exhibit an initial
weight loss, the rate of which increases as a func-
tion of temperature. They do not have an inflec-
tion in their thermogravimetrie curves until they
have undergone a weight loss of 65 to 100 percent.
An examination of the DTA curves for these ma-
terials generally indicates an endothermal reac-
tion followed by an exothermal trend, and, finally,
an endothermal region. Over these temperature
ranges the following phenomena were observed;
fusion, the evolution of small quantities of vapor,
and boiling.
Compounds in Group 2 show an initial weight
loss of from 30 to 50 percent, followed by a sharp
break in the th erm-, gravimetric curve, after which
the rate of weight loss is generally slower. The
thermogravimetrie curves for Group 3 materials
indicate an initial weight loss of only 2 to 20 per-
cent prior to an inflection.
In general, the materials in Group 1 possess
the thermal properties of stability and volatility
required for satisfactory functioning in pyrotech-
nic smoke items. For most of these materials, as
shown in Figure 7-10 for 1,8-dihydroxyanthra-
quinone, no weight loss occurs before fusion; once
the boiling point is approached the rate of weight
loss increases uniformly with temperature The
absence of a break or point of inflection in the
thermogravimetrie curves for the Group 1 ma-
terials, is indicative in this ease, of vaporization.
Group 2 materials do not vaporize appreciably.
As shewn in Figure 7-11, 1,4-di-p-toluidinoan-
thraquinone, a standard dye used for the pro-
duction of blue smoke, exhibits approximately a
30 percent initial weight loss during which a point
of inflection occurs. It is postulated that this ma-
terial reacts to form an effective color product in
the temperature region of 350°C to 440°C. If,
however, the temperature of the dye is not care-
fully controlled, it decomposes further to form a
volatile red product. In general, the dyes in
Groups 2 and 3 do not perform satisfactorily.
They fail to vaporize appreciably and the irregu-
larities in the differential thermal analysis curves
indicate the occurrence of reactions and/or de-
composition. The temperature produced by the
reaction must be sufficiently high to rapidly
vaporize the dye but not excessive so as to cause
decomposition of the dye, or flaming. A cooling
agent such as sodium or potaseium bicarbonate
may be added to the fuel mix to regulate the burn-
ing rate. Binders are sometimes used to produce
a composition that is easier to handle and process.
The properties and structures of certain se-
lected dyes are as follows:
Dyes Selected by the British as the Best Agents
Available for the Production of Colored Smokes
by Explosion, Using PETN (pentraerythritol
tetranitrate) for the Explosive:
Red: o-methoxybenzene-azo-0-naphthol (Brilliant
Fat Scarlet)
Molecular Weight: 278
Components: o-Anisidine —» ^-naphthol
C17H14N2O2
Properties, Description; Red paste; separates from
glacial acetic acid in red crystalline powder,
m.p. 180°C. H2O—insoluble. Alcohol—red so-
lution on boiling. H2SO4—bluish-red solution,
red precipitate on dilution.
Commercial Names: Oil Vermilion (W), Sudan R
(A). Brilliant Fat Scarlet В ' SCI), Pigmen1
Purple (MLB).
7-37
AMCP 706-185
Yellow: 2,4-Diaminoazobenzene (Chrysoidine G,
base)
Molecular Weight: 212
Components; Aniline—m-Phenylenediamine
Ci2H13N4Cl
Properties, Description; Reddish-brown crystalline
powder or large black shining crystals with a
green luster (latter contain the homologs from
o- and р-toluidine). H2O—orange-brown solu-
tion. Alcohol—orange-brown solution. Ether—
insoluble. HC1 to aqueous solution: brown-yel-
low gelatinous precipitate consisting of hair-like
needles. NaOH—red-brown precipitate of chrys-
oide base, m.p. 117°C, sparingly soluble in ЩО,
soluble in ether, alcohol, or benzene. H2SO4—
brown-yellow solution, cherry-red to orange so-
lution on dilution.
Commercial Kames; Chrysoidine G (CAC), (DuP),
(Gy), (SCI), (MLy), (By), (GrE), Chrys-
oidine Base (C3C), (CV), (JWL), (LBH),
(W), (NAC).
Green: Mixture of 1,4 di-pi-toluidinoamino-an-
thraquinone (Oumzarin Green) and quin-
ophthalone (Quinoline Yellow, base) in the
ratio of 65/35.
Molecular Weight: 418 (Quinzarin Green)
Components: leuco-Quinzarin (or 1,4-Dichloroan-
thraquinone) and p-Toluidine.
C28H2oN202Na2
Properties, Description: Bluish-green powder.
II2O—bluish-green solution. HC1—dark soluble
precipitate. NaOH—dark soluble precipitate.
H2SO4 -dull reddish-blue solution, bluish-green
solution on dilution.
Commercial. Names: Alizurol Cyanine Green E, G
extra, К (ВАС), Alizarin Cyanine Green F
paste and powder, EF, G extra, 3G, К powder
and paste (By), Alizarin Brilliant Green EF,
G cone. (LBH), Solway Green E, EF, GM
(SDC), formerly Kymrie Green E, G extra
(SDC).
A mixture of 55% 1,4-dimethylaminoan-
thraquinone (Brilliant Blue G, M.W. 266) and
45% Quinophthalone (Quinoline Yellow Base)
is also used to produce green smokes of an emer-
ald green color. The mixture of Quinzarin
Green and Quinoline Yellow (base) produces a
color approaching the green of the spectrum.
Quinoline Yellow.- Mixture of symmetrical quin-
ophthalone or 2-quinolylindandione, with small
quantities of iso-quinophthalonc, or unsym-
metrieal quinophthalone or 2-quinaldyleneph-
thalide.
Molecular Weight: 273
Components: Quinaldine and phthalic anhydride.
C18HnN02
Quinophthalone iso-Quinaphthalone
Properties, Description: Yellow powder, crystal-
lizes from boiling alcohol in thin golden-yellow
needles, m.p. 240°C; iso-quinophthalone is more
soluble in alcohol and crystallizes in orange-
yellow prisms, m.p. 187°C. H2O—insoluble.
Alcohol—sparingly soluble with a yellow eolor.
Н28(>4—yellowish-red solution, yellow flocculent
precipitate on dilution.
Commercial Names: Quinoline Yellow spirit-soluble
(II), (S), (RF), (A), (B), (By), (K), Bril-
liant Fat Yellow C (SCI). Quinophthalone
Dyes Selected by the U.S. as Satisfactory Agents
for Producing Burning Type Smokes:
Yellow: Auramine—Hydrochloride of tetramethyl-
diamino-diphenyl-ketonimine.
Molecular Weight: 267
Components; Tetramethyldiamino-diphenyl meth-
ane, ammonium chloride, and sulfur.
C1TH22N8C1 + H2O
7-38
АМСР 706-185
Properties, Description: Sulfur-yellow powder.
H^O—bright yellow solution, readily decom-
posed on boiling. Alcohol—yellow solution.
NaOH—white precipitate of Auramine base,
m.p. 130°C, soluble in ether. H2SO4—colorless
solution, pale yellow color on dilution.
Commercial Names; Auramine (H), (Gy), (S),
(SCI), (StD), (A), (B), (By), (C), (L),
(MLB), (tM) ;
Auramine О (BDC), (DuP), (Gy), (S),
(SCI), (StD), (B)
О cone. (LBH), DuP) NO(CN)
II (BDC), (LBH), (S),
(A), (B) 2 (StD)
NAC (NAC) OE (B)
CO extra cone. (SCI), (StD) extra cone.
(MLB)
Fat Yellow A (SCI)
Canary Yellow (Gr E)
Green: 1,4-di-p-toluidinoanthraquinone with aura-
mine hydrochloride
Red: l-.Methylanrnoanthraquinone (Celanthrcne
Red)
Molecular Weight: 237
Commercial. Name: Duranol Red В(BDC)
Products Currently Used for Colored Smoke Com-
positions :
Green.- 1-4-di p-toluidinoanthraquinone and Aura-
mine
Red: 1-Methylamino anthraquinone
yellow: Beta-naphthalene-azo-dimethylaniline and
Auramine CieH,TN3
Molecular Weight: 275
7-3A2 Fuels38,87
The number of combustibles that are satisfac-
tory in colored smoke mixtures is very limited and
Includes sulfur, thiourea, and sugars such as
lactose, sucrose, and dextrose. Dextrin, starch, and
lampblack ean be used, in part, to replace the
above materials but results have not always been
satisfactory. Among the sugars, lactose has been
found to be the most desirable. Sucrose and dex-
trose (corn sugar) have the disadvantage of being
somewhat hygroscopic, and a small percentage of
starch is usually added to enable their handling
under conditions of high humidity. Potassium
chlorate and sugar are usually mixed in about
equal parts. Although such a fuel mixture con-
tains an excess of sugar, the excess has been found
necessary to secure proper action of the smoke
ingredients. For slow-burning colored smoke mix-
tures, a fuel composed of sulfur and potassium
chlorate, in stoichiometric proportions, has been
found to be highly satisfactory.
With either sucrose or lactose as fuel, the
gaseous products formed are carbon dioxide and
water vapor:
CI3H22On + 8КСЮ3-----------> 8KC1 + 12CO2
-|- J.IH2O
Lactose would yield an additional mole of water
when oxidized by potassium chlorate.
7-3.4.3 Oxidants33,87
A large number of fuel-oxidant mixtures have
been investigated. The oxidizing agents studied in-
clude chlorates, perchlorates, permanganates, ni-
trates, nitrites peroxides, and oxides. However,
the only satisfactory oxidizing agent found thus
far, despite its friction-sensitivity, hes beer, po-
tassium chlorate. Potassium nitrate might be used
to replace potassium chlorate in colored smoke
mixtures if a very stable dye such as 1-methyl-
aminoantbraquinone is used. Even with this dye,
only slow-burning grenades have been produced
using potassium nitrate. With most dyes, a ni-
trate is always less desirable than a chlorate, and
7-39
АМСР 706-185
nitrates have been found unsatisfactory with aura-
mine hydrochloride and indigo. Nitrates, there-
fore, should not be substituted for the chlorates
in colored smoke munitions unless a special condi-
tion, such as a shortage of chlorate, makes it neces-
sary.
7-3.4.4 Cooling Agents33,87
Cooling agents may be added to regulate the
burning rate of the fuel and to lower the tempera-
ture sufficiently to prevent excessive decomposition
of the dye with resultant decolorization or strong
flaming. The best cooling agents have been found
to be sodium bicarbonate or potassium bicarbonate.
Potassium bicarbonate decomposes at a higher tem-
perature than sodium bicarbonate and is, therefore,
more suitable for fast-burning types of colored
smoke mixtures. Sodium bicarbonate has been
found better for the slower-burning mixtures.
Other cooling agents which have been investigated
are the ammonium salts such as the chloride,
bromide, oxalate, carbonate, sulfate, sulfite, thio-
cyanate, and tartrate. These have been found to
work with varying degrees of success but most of
them have the disadvantage that, upon condensa-
tion, they form white smokes which dilute the
color of the dye smoke. Inert diluents—such as
Fuller’s earth, calcium carbonate, and kaolin—
have often been added to smoke mixtures to retard
the burning rate and reduce flaming.
7-3.4.5 Binders
Graphite, zinc oxide, and linseed oil have been
used for some applications but in most cases no
binder has been used and the composition has been
consolidated under pressure. Because of the prob-
lems associated with the loading of smoke mix-
tures, some work has been directed toward the de-
velopment of a plastic-bonded smoke mixture.88
None of the plastic-bonded smokes have been stan-
dardized. The use of a binder such as polyvinyl
acetate30 would be advantageous because: (1) it
contributes few undesirable qualities to the smoke,
(2) it binds smoke mixtures into a hard, tough,
nonbrittle mass having excellent water and shock
resistance, (3) it produces a formulation which
withstands high and low temperature surveillance
with negligible change, (4) it is safe, nontoxic, and
easily handled, (5) it is available at low cost and
in quantity, and (6) it eliminates the necessity for
consolidation under pressure. Other plastics which
have been considered include various monomers
and polymers of acrylic and vinyl plastics, poly-
amines, and epoxy-type resins.
7-3.4.6 Evaluation of Colored Smokes
Of the original colored smokes used ; red, green,
yellow, and violet were found to be the most suit-
able. These colors were most perceptible against
the various backgrounds and displayed optimum
visibility at a considerable distance. Further, they
were least affected by the light-scattering proper-
ties of the atmosphere. Blue was found unsuitable
for signaling purposes because of excessive effect
of light scatter.
A number of different methods have been used
to measure the quality of a colored smoke. In
many cases, they were merely observed at various
distances. More quantitative methods involve the
use of Munsell color charts40 and colorimeters. Ex-
tended chroma Munsell color charts developed by
the National Bureau of Standards were success-
fully used in measuring the color of colored smoke
clouds.41 Munsell color cards were designed and
used in field measurements. The Munsell color
data were converted to the internationally accepted
C.I.E. system of color representation for evalua-
tion.
7-3.4.7 Sensitivity of Colored Smoke Mixtures42
Most of the colored smoke mixtures which have
been used, with the exception of the yellr w smoke
mixture containing auramine, may be considered
satisfactorily insensitive to friction and impact
under the conditions encountered in normal load-
ing operations. Yellow smoke mixtures containing
auramine are impact-sensitive, and require more
care in handling and loading. Smoke mixtures con-
taining 1- (4-dimethylaminoplienylazo)-2-naphthol
are markedly less sensitive to impact and friction
than mixtures containing auramine. Ignition test
results show that colored smoke compositions ean
be ignited by hot surfaces—and no doubt by open
flames and other direct heat sources—of compara-
tively low temperature. Following ignition, dust
7-40
AMCP 706-185
Figure 7-12. 105 mm M84 Colored Smoke Projectile
clouds or dispersions of these powders are capable
of producing dust explosions.
7-3.4.8 Toxicity of Colored Smoke Mixture
As standardized, the colored smoke clouds are
nontoxie in ordinary field concentrations. In gen-
eral, toxic materials should not be employed as
ingredients in signaling and screening munitions.
It has been reported43 that certain dyes exhibit
carcinogenic characteristics which should be
guarded against when they are used. The prob-
lem in determining whether or not a dye is a
carcinogenic hazard is complex because the products
of metabolism of the dye must also be considered
for carcinogenic activity even though the original
dye may be harmless. The hazards involved in
handling carcinogenic materials are not in the
quantities involved but in the frequency of ex-
posure no matter how small the dosage.
One of the smoke dyes of great interest to the
Army, Indanthrene Golden Yellow GK, has been
tested and fornd to be not carcinogenic but it is
closely related to 3,4,8,9-dibenzpyrene (Idanthrene
Golden Yellow without the two oxygens) which is
known to be a very potent carcinogen. If this com-
pound should he present or formed by a process of
reduction as an impurity in even as small a quantity
as .01% it would present a considerable hazard.
Red dye, 1-metbylaminoanthraquinone, has not
been tested for carcinogenicity but has the possi-
bility of being a pot ntial liver carcinogen. Two
other smoke dyes, Sudan Grange R (1-phenylazo-
2-naphthol) and l-(2-methoxyphenylazo )-2-naph-
thol arc reported as carcinogenic. Blue dye, 1,4-dia-
mino-2,3-dihydroanthraquinone, has not been tested
but is expected to be relatively safe by its structure.
Diethylamino Rosindone might undergo metabolic
reduction in the body to yield carcinogenic (5-
naphthylamine. Green smoke dye 1,4-di-p-toluidino-
anthraquinone is on the current approved list for
drugs and cosmetics (Food and Drug Administra-
tion).
Before experimentation with a particular dye is
undertaken, it is important to gain all available
information pertaining to the potential hazards in-
volved in its use.
7-3.4.9 Typical Devices
Colored smoke mixtures have been used in hand
and rifle grenades, mortar and artillery projec-
tiles, float signals, rockets, smoke bombs, and similar
munitions. As shown in Figure 7-12, a smoke com-
position is often contained in a canister which is
ejected from the projectile when the fuze func-
tions. The ejection charge ignites the starter mix-
ture which, in turn, ignites the smoke mixture.
This device contains three canisters which are
ejected from the base of the projectile on air burst.
Each canister contains from 380 to 410 grams of
either yellow, red, green, or violet smoke mixture.
Many other smoke-producing items, such as gre-
nades, etc., are also based on the canister as shown
in Figures 7-13 and 7-14. Characteristics of these
devices are given in Tables 7-11 and 7-12.
7-3.4.10 Direct Volatilization of Dye
Colored smoke clouds are also produced by
direct volatilization of dye in the thermal genera-
tor-type munitions (separate dye and fuel com-
partments). The dye should preferably be a
crystalline compound and have a melting point
7-41
АМСР 706-185
TABLE 7-11
CHARACTERISTICS OF TYPICAL EJECTION-TYPE COLORED SMOKE DEVICES
Characteristic 4.2-in. Colored Smoke Projectile №18 Colored Smoke Hand Grenade
Dimensions, in. Overall—4.2 dia by 20 long (approx.) Canister—3.7 dia by 9.3 long (approx.) 2.5 dia by 4.5 high Six smoke emission holes
Weight Projectile—23 to 24.5 lb Ejection charge—25 g Grade A black powder 35 g infallible powder 11.5 oz make mixture
Fuze Propellant Loading Pressure Smoke Duration M54 Time and SQ M6 18000 lb/in.2 M201A1 1.2 to 2 sec delay 50-90 sec
Applications Time-fuzed for air-burst sig- naling and/or base-ejected for marking ground positions. Uses red, yellow, green or violet colored smoke for sig- naling, spotting, or outlining a position Grenade is thrown or launched from a rifle or car- bine by using a M2A1 gre- nade projection adapter. Uses red, yellow, green, or violet colored smoke for sig- naling
Visibility Very good Easily identified at altitude of 10,000 feet against back- ground of green and brown; clearly seen at a distance of three miles.
under 150°C, or a melting point of 100°C, when
mixed with a small proportion of a melting-point
depressant such as diphenylamine (less than 25
percent is necessary). The dye should be stable
for three to four minutes at temperatures of 50°C
to 100°C above its melting point. The dye l-(4-
phenylazo)-2-naphthol—called commercially by a
variety of names, i.e., duPont Oil Orange, Sudan
Orange, Federal Smoke Orange-E, and 1-(O-
tolylazo)-2-naphthol (Calco Oil Orange Y-293) —
produces good orange smoke clouds but varies in
quality depending upon the commercial source.
The dye l-xylylazo-2-naphthol (Calco Oil Scarlet
II, National Oil Scarlet 6-G) gives a much redder
eloud but the addition of 20 percent duPont Oil
Yellow N (N, N-dimethyl-p-phenylazoaniline) gives
a satisfactory color. The dye duPont Oil Yellow
N produces a brilliant yellow colored smoke. Mix-
tures of blue and orange dyes, such as Calco Oil
Orange Y-293 and Calco Oil Blue NA (1,4-di-
amylaminoanthraquinone), give a brown-orange or
brown-rose cloud. Blue smoke results from using
only 25 percent Calco Oil Orange Y-293. With a
75 percent mixture of National Oil Scarlet 6-G
and Calco Oil Blue NA, the color has the appear-
ance of a mixture of orange and violet or tan and
violet. Larger percentages of scarlet result in a
rose-colored cloud and smaller percentages result
in blue smoke. A mixture of the dye l-(2-methoxy-
phenylazo)-2-naphthol (Federal Signal Red A)
7-42
АМСР 706-185
Figure 7-13. Ml 8 Colored Smoke Hand Grenade
with Calco Oil Blue NA gives a blue-gray cloud
for all proportions tried. The dye Monoazo Red
(duPont) gives much the same result.
7-3.4.11 Colored Smoke from Solution of Dyes82
A third method of producing colored smoke
clouds is by volatilization of the dyestuff from
solution, usually by means of the hot exhaust of a
motor. Early attempts to use colored smoke trails
from the exhaust of an airplane engine employed
a mixture of SAE-10 oil (flushing oil) and dye.
Carbon tetrachloride has also been used in place
of the oil, but is not recommended. Ten pounds
of dye are mixed with two gallons of the oil to a
smooth, pasty solution and then diluted with an
additional five gallons of flushing oil. The dyes
recommended are Oil Purple AB, Oil Blue-Green
0, Oil Red EGN, and Oil Orange 2311 [l-(4-
phenylazo)-2-naphthol].
The principal difficulty is the low solubility of
the dyes in oil. A solvent composed of one part
of carbon tetrachloride to four par ts of SAE-10
oil is not satisfactory due to congealing of the so-
lution. The use of hexachlorobutadiene as solvent,
however, is considered succes iful in that the result-
ing mixture of dyestuff and solvent is extremely
fluid and has no tendency to congeal. Azo dyes are
found to be the most satisfactory. These are Oil
Yellow (4-(0-tolylazo)-2-methylaniline), Oil Scanet
6-G (l-xylylazo-2-naphthol), Oil Red 0, and Oil
Green Q-261.
Further tests indicate that solutions of dye in
hexachlorobutadiene, diluted with SAE-10 oil, are
unsatisfactory due to the gelling of the mixture
within a few hours after mixing. Solutions pre-
pared with fifteen to eighteen pounds of dye, two
to three gallons of triehlorobenzene, and three gal-
lons of SAE-10 oil are found to be satisfactory.
No gelling of the solution is noted after six to eight
days.
Oil smoke is also produced in a wide variety of
colors and shades using the following oil-soluble
dyes either as such or in admixture:
Oil Blue NA (1,4-diamylaminoanthraquinone)
Oil Blue RA IN-(p-dimethylaminophenyl)-l,4-
naphthoquinonimine]
Oil Red N-1700 [1-(tolylazoxylylazo )-2-naph-
thol]
7-43
AMCP 706-185
SMOKE MIX
Figure 7-14. 4.2-in. Colored Marker Projectile, Colored Smoke, E75
Oil Orange Y-293 [l-(o-tolylazo-2-naphthol]
Oil Yellow 7463 |N, N-dimethyl-p-phenylazo-
aniline]
Gaa Green CG (1,4-di-p-toluidinoanthraquin-
one)
The maximum effect with the minimum quantity
of dye is obtained by adding about five percent
of the dye dissolved and/or suspended in oil
dispersed through a point-type spray nozzle. The
dye is added at a point in the oil smoke exhaust
where the temperature can be varied between 400°C
and 800°C. By controlling the temperature within
approximately 50°C . nits, я fairly constant shade
is obtained with each dye. By using different tem-
perature bands, variations are obtained in the
shade of smcke produced from a given dye. The
efficiency of color production, however, appears to
be equivalent in all cases. The shade changes
which result from variations of temperature are
due, at least in part, to the changes in color of the
basic smoke. All the dyes, with the exception of
Oil Blue RA and Oil Red N-1700, are found to
produce the best results between 450°C and 700°C.
Oil Blue RA is used successfully at 400°C to
550°C but shows a complete loss <>£ color at 560°C.
Oil Red N-1700 produces the best results between
550°C and 625°C. Water solutions cf Auramine
and Red Y Supra Cone. (Safranine) are used effec-
tively to produce colored oil smokes. Water spray
added to the oil cloud does not appear to hsve ₽ny
injurious effect. Water eolations of Blue FFB,
New Blue N (Metbyiene Blue), and Magenta XX
fail to produce color under the conditions of these
experiments.
satisfactorily
dense Waclr iimokes. Stlc& striiifltes are generally
produced by burning of hydrocarbons such as
phenanthrene or anthracene. The addition of an-
7-44
АМСР 706-185
Figure 7-15. 105 mm Ml Colored Marker Projectile
TABLE 7-12
BASIC DIFFERENCES BETWEEN THE COLORED MARKER AND
BASE-EJECTION SMOKE PROJECTILES FOR 105 mm GUN
HE Colored Marker Base-Ejection Colored Smoke
Bnild-up period of Effective instantaneous Over a period of from 1-2 min
colored eloud Density of cloud Highly saturated Wispy
Duration of cloud Average 65-85 sec 75-120 sec
Size of cloud Approx. 40 X 60 ft Streamer approx. 4 ft across
Lethality of round May be lethal (fragments) Nonlethal
Fuzing of round MTSQ & VT fuzing MTSQ fuzing cnly
Weight of round Equal to 105 mm HE round Lighter than 105 nun HE round
Ranging of round Similar to 105 mm HE round Canister impacts up to 150 ft away from impact point of projectile body
threcene or naphthalene to HC smoke mixtures also
pioihiees black smoke. The oxidizing agent gen-
erally used is potassium perchlorate.
7-3X.13 Explosive-Type Colored
Smoke Bursts46,48
In addition to the colored smoke dissemination
methods discussed •« the previous pat я graphs,
there I.'' the method that produces its effect through
the action of an explosive burster. Both propellants
and high explosives are used for this purpose. For
example, a colored smoke burst can be obtained by
using a mixture of approximately equal parts of
dye and EC powder. This mixture is detonated
with an appropriate detonator or booster charge,
the resuiting explosion giving a large puff of
colored smoke. Colored smoke clouds are also ob-
tained from a mixture of a salt and a dye dis-
seminated by a central high-explosive burster of
baiatol, amatol, 60 mm ignition powder, Composi-
tion B, or others. T he use of a salt dilutent is one
procedur e for producing controlled nuclei on which
the dye may condense. Cast or pressed dye, along
with a central burster, is also used to produce col-
ored clouds. The basic performance differences
between dissemination of colored smoke by an
item using an explosive burster and by a munition
using burning-type smoke mixtures are tabulated
7-45
АМСР 706-185
in Table 7-12. The 105 mm Colored Marker Pro-
jectile, referred to in the table, is shown in Figure
7-15.
The dyes that are satisfactory for dissemination
by an explosive charge include the same dyes as
those used in the burning-type colored smoke
munitions. Also, many azo-type dyes whieh do not
perform well in burning smoke munitions give very
good smoke clouds when disseminated by EC pow-
der. Among the best dyes for explosive munitions
are l-(2-ineth oxyphenylazo )-2-naphthol for red,
l-(4-nitrophenylazo)-2-naphthol and l-(4-phenyl-
azo)-2-naphthol for orange, and 4-phenylazo-m-
phenylenediamine for yellow.
7-3.4.13.1 Propellant Bursters47
Several propellants have been studied for use
as bursters, the EC powder mentioned above show-
ing the greatest promise. Various methods of load-
ing EC powder and dye in a projectile have been
tried as follows:
a. Mixing the dye and EC propellant powder
intimately before loading the projectile,
b. Coating the projectile wall with melted dye
and placing the EC powder in the central
cavity,
e. Filling the projectile with melted dye and
then drilling out a core for EC powder, and
a. Loading the projectile with approximately
equal increments of dye, and EC powder in
alternate layers.
The last method, in which alternate layers of dye
and EC powder are used, was found to be the best.
The alternate-layer method of loading with EC
powder was found to be superior to bursters of
either TNT or tetryl. The burster explosive used
is a mixture similar to amatol loadings, consisting
of 27.8 percent ammonium picrate and 72.2 percent
ammonium nitrate.
7-3.4.13.2 High Explosive Bursters
Sufficient explosive must be included in the
burster charge so that when it is detonated, it will
break the projectile apart without causing exces-
sive dispersion and/or burning of the filler. The
products of explosion must be compatible with the
dye used. The color of many dyes is influenced by
acidity. For many dyes baratol has proved to be
satisfactory. The method for determining the
weight of a burster used in colored marker pro-
jectiles was derived by assuming that the energy
of the explosive charge is proportional to the strain
energy required to burst the projectile. In order to
simplify calculations, conversion factors and con-
stants are included in a dimensionless factor K. The
weight of burster required is given by the empirical
formula:
wc=-.KW(Y+U)eK' (7-7)
where
wc = weight of explosive required (including
initiator), g
К = a constant, 11.4 X 10~e to 11.4 X 10~®,
depending on caliber and explosive used
(the exact К can be found by empirical
evaluation only)
W = weight of steel components of projectile
(excluding fuze and base), lb
F — yield stress of projectile steel, psi
e = strain elongation at fracture, %
V = ultimate strength of projectile steel, psi
K! — ratio of caloric value of a standard ex-
plosive to explosive to be used. For in-
stance, if value of tetryl is 1,100 cal/g
and baratol is 900 cal/g the formula
would be:
wc = KW(Y + 17 )e (11/9)
Burster charges designed by this method have
functioned favorably. The quantity (Y -f- U)e is
roughly equal to twice the strain energy absorbed
by one cubic inch of steel.
7-3.4.14 Typical Mixtures
Typical colored smoke mixtures, including a
few white and black smokes, are shown in Table
7-13.
7-3.5 AGENT AEROSOLS
Because of their nature, a detailed discussion
of the dissemination of agent aerosols is beyond the
scope of this handbook. In general, the principles
and methods applicable to the dissemination of a
colored smoke agent are applicable to the dis-
semination of an agent aerosol
7-46
AMCP 706-185
TABLE 7-13
TYPICAL SMOKE COMPOSITIONS
Type Composition, % Application Typical Devices
WHITE: НС-Туре C Hexachloroethane 45.5 Screening Smoke pots
Modified HC Zinz Oxide 47.5 Aluminum (grained) 7.0 Hexachlorobenzene 34.4 and Signaling Screening Smoke bombs Grenades Smoke
Modified HC Zinc Oxide 27.6 NH4CIO4 24.0 Zine Dus< 6.2 Laminac v/catalyst 7.8 Dechlorai e 33.9 and Signaling Screening projectiles Smoke
Plasticized White Zine Ox'de 37.4 NH4CIO4 20.5 Lamina w/ettalyst 8.2 White J'hosr rorus 65.0 and Signaling Screening projectiles Chemical
Phosphorus (PWP) Plasticizer 35.0 (antipersonnel) mortar projectiles
(Necprei lOOparts) (Carbon 75 parts) (Z-lene 44 parts) (litharge 15 parts)
BLACK:
KO' )3 (200 mesh) 52.0 Screening Irenades, etc.
Anthracene (40 mesh) 48.0
COLORED:
lied Dye-MIL D-3718 40.0 Signaling Navy floating
KC1O3 24.0 drift signal
NaKCOs 17.0
Sulfur 5.0
Polyester resin 14.0
lied 1-methylamino (AQ)* 45,0 Signaling Rocket type
1,4-di-p-toluidino (AQ)# 3.0 parachute
КC1OS (23ц) 35.0 ground
Sugar, fine (11ц) 17.0 signals
Red 1 - (methoxyphenylazo) Air marker 90 inm Red
2- naphthol 80.0 Marking marker
NaCI 20 0 ground targets projectile
* (AQ)- -Anthraquinone
7-47
АМСР 706-185
TABLE 7-13 (cont’d)
Typical
Type Composition, % Application Devices
Red Dye (R) 40.0
КСЮз 28.6 Signaling Improved
(plastic) NaHCO3 23.0 grenade
Sulfur 5.0 fillings
Polyvinyl acetate in
ethyl acetate 3.0
Yellow Benzanthrene 32.0 Signaling Rocket type
Indaathrene GK 15.0 parachute
КСЮз (23ц) 30.0 ground
Sugar, fine (lip.) 20.0 signals
NaHCO3 (20р.) 3.0
Yellow Auramine Hydrochloride 40.0 Air marker, etc. 90 mm yellow
NaCl 60.0 marker projectile
Yellow Dye (Y) 40.0 Signaling Improved
(plastic) КСЮз 29.8 grenade
NaHCO3 23.2 fillings
Polyvinyl acetate in
ethyl acetate 7.0
Green 1,4-di-p-toluidino (AQ)# 28.0 Signaling Roeket type
Indanthrene GK parachute
(golden yellow) 12.0 ground
КСЮз (23р.) 35.0 signals
Sugar, fine (11ц) 23.0
NaHCO3 (20ц) 2.0
Green Dye (G) 40.0 Signaling Improved
(plastic) КСЮз 26.0 grenade
NaHCO3 24.0 fillings
Suifur 6.0
Polyvinyl acetate
w/ethyl acetate 4.0
V iolet Violet dye, Signaling Rocket type
Spec. MIL-D-3691 47.5 parachute
КСЮ;| (25р.) 28.0 gro; nd
Sugar, fine (10р.) 18.0 signals
NallCO., (20ц.) 4.5
Asbestos 2.0
Orange 8-ehloro-l-amino (AQ)* 39.0 Signaling Grenades
Anrainine 6.0
КСЮз 22.3
Sulfur 8.7
NaHCOs 24.0
* (AQe Anthraquinone
7-48
AMCF 706*185
REFERENCES
1. A. M. Prentiss, Chemicals in War, McGraw-
Hill Book Co., Inc., N. Y., 1937.
2. K. F. Sawyer, “Screening Smokes,’’ Thorpe’s
Dictionary of Applied Chemistry, Vol. X, 4th
Ed., Longmans, Green, London, 1950, p. 781.
3. H. L. Green and W. R. Lane, Partvwlate
Clouds: Dusts, Smokes and Mists, D. Van Nos-
trand Co., London, 1957.
4. History of Res-arch and Development of the
Chemical Warfare Service in World, War II,
Reinhold, N. Y., 1948.
5. L. P. Brophy, D. M. Syndham, R. C. Cochrane,
The Chemical Warfare Set vice: From Labora-
tory to Field, Department of Army, Wash-
ington, D. C., 1959.
6. W. A. Noyes, Jr., Ed., Chemistry, Science in
World War II Series, Little, Brown and Co.,
1948.
7. John A. Martin, “Combat Smoke in Korea,”
Armed forces Chemical Journal, 7 October
1953
8. В. E. Klebtr and E. I. Byrnes, “Make
Smoke,” Armed Forces Chemical Journal, 6
April 1943.
9. S. L. A. Marshall, Infantry Operations and
Weapons Usage in Korea During the Winter
of 1950-51, Report ORO-R-13, Department of
Army, Washington, D. C., 27 October 1953.
10. W. W. Cevell, T. Stevenson, Smoke Tracers,
Caliber .50, Frankford Arsenal, Philadelphia,
Fa., November 1951.
11. BAT Antitank Weapon and Ammunition,
Frankford Arsenal Report 1080, Frankford
Arsenal, Philadelphia, Pa.
12. W. Л. Noyes. Jr., Military Problems with Aero-
sols and Non-Persistent Gases, Summary Tech-
nical Report of Division 10, Department of
Army , Washington, D. C., 1946.
13. G. Mie, Ann der Phys. 25, 377 (1908).
14. M. H. P. P. Ycvick, The Toxicity o' Combus-
tion Products of Pyrotechnics, CWL-TM-26-
12, Army Chemical Warfare Laboratories,
Edgewood Arsenal, Maryland, May 1960.
15. Toxtc Hazards Associated with Pyrotechnic
Items. OP 2793, Naval Ordnance Ijaboratory,
Bureau of Naval Weapons, Washington, D. C.,
May 1959.
16. N. Irving Sax, Dangerous Properties of In-
dustrial Materials. 2nd Ed., Reinhold, 1963,
Library of Congress Catalog Card No. 63-
20370,
17. David W. Fassett, Don D. Irish, Eds., In-
dustrial Hygiene and Toxicology, Vol, II,
Interscience Publications, 1963.
IB. AN-M7 Fuel Block Program, Report O-2148U,
Glin Mathiescn Chemical Corporation, New
Haven, Connecticut, April 15, 1961 (DDC-
AD 271 (878).
19. L. F. Young, W. M. Conway, The T36E1 SteeL
Wool White Phosphorus (8WP) Smoke Gre-
nade, Picatinny Arsenal Technical Report
2618, Picatinny Arsenal, Dover, N. J., Novem-
ber 1959.
20 R. D. Kracke, Improved Phosphorus Smoke,
TCR-13, Technical Command, Army Chemical
Center, Edgewood Arsenal, Maryland, March
1949.
21. H. Zislin, Stabilization of Red Phosphorus,
Frankford Arsenal Report 660, Frankford
Arsenal, Philadelphia, Pa., October 1945.
22. M. S. Silverstein, G. Nordblom, Stabilisation
of Commercial Red Phosphorus, Frankford
Arsenal Report 206, Frankford Arsenal, Phila-
delphia, Pa., April 1943.
23. M. S. Silverstein, G. F. Nordblom, C. W. Dit-
trich, and J. J. Jackabein, * ‘ Stable Red Phos-
phorus,” Industrial and Engineering Chem-
istry 40, 301 (1948).
24. D. L. Elkstedt, Laboratory and Flight Tests
of Chemical Tracking Aids, AFMDC-TR-58-2,
Air Force Missile Development Center, Hollo-
mon Air Force Base, New Mexico, July 1958
(DDC-AD 23 736).
25. Я. B. Elkins, HC Smoke: Properties of Zinc
Oxide Affecting the Burning Characteristics
of HC Smoke Mixtures, TDMR-729, Edgewood
Arsenal, Md.
26. L Finkelstein, The Chemistry of HC Smoke
Mixtures, Army Chemical Laboratories, Edge-
wood Arsenal, Md.
7-49
AMCP 706-185
REFERENCES (cont’d)
27. 0. Weingarten, Long Range Research on Py-
rotechnics Development of an Improved Smoke
Composition for Activator, Practice, Ml, Pica-
tinny Arsenal Technical Report 1799, Pica-
tinny Arsenal, Dover, N. J., November 1950.
28. Jack DeMent, Composition for Smoke Produc-
tion, U.S. Patent 2,995,526, August 1961.
29. J. E. Andrews, Jr., B. Werbel, Smokes, Pica-
tinny Arsenal, Dover, N. J., May 1962.
30. J. E. Andrews, Jr., K. G. Carlon, W. W.
Reaves, Evaluation cf a Plastic-Bonded EC
Smoke Composition for the M8 Grenade,
CRDLR-3065, Army Chemical Laboratories,
Edgewood Arsenal, Maryland, April 1961.
31. S. Gordon and C. Campbell, “Preignition and
Ignition Reactions of the Pyrotechnic System
Zn-CeCle-KClOt,’’ Fiftn Symposium on Com-
bustion, Reinhold Publishing Co., N. Y.,
1955.
32. S. Grundemeier, Survey of Literature of
Chemical Tracking Aids, HADC-TR-57-7, Air
Force Missile Development Center, Holloman
Air Force Base, New Mexico, August 1957
(DDC-AD 135 001).
33. L. Finkelstein, Colored Smokes, Vol. 12 of His-
tory of Research and- Development of the
Chemical Warfare Service in World War II,
Army Chemical Center, Edgewood Arsenal,
Maryland, 31 December 1945 (DDC-ATI 207
451).
34. G. D. Heath, Formation of Coloured Smoke
Clouds, Part J of Review of Suitable Organic
Dye Stuff, PR 2547, Great Britain, April 1943.
35. D. Anderson, S. Gordon, D. Edelman, Thermo-
gravimetric Determination of the Energies of
Activation Volatilization, Pieatinny Arsenal
Technical Note 16, Pieatinny Arsenal, Dover,
N. J., 1948.
36. D. Anderson, S. Gordon, D. Edelman, Dif-
ferential Thermal Analysis and Thermogravi-
metric Analysis of Organic Dyes, Pieatinny
Arsenal Technical Note 25, Pieatinny Arsenal,
Dover, N. J., 1958.
37. ORDWES Quarterly Report 1948-8, Wes-
leyan University, Middletown, Connecticut,
May 1948.
38. W. W. Reaves, J. H. Hassmann, Investiga-
tion of a Long Burning Plastic-Bonded, Col-
ored Smoke Mixture, CWLR 2339, Army
Chemical Laboratories, Englewood Arsenal,
Maryland, January 1960 (DDC-AD 233 750).
39. N. J. Wilkaitis, Research and Development of
Flammable Plastic for Colored Smoke Use,
Army Chemical Laboratories, Edgewood Ar-
senal, Maryland, October 1956 (DDC-AD 137
748).
40. Munsell Book of Color, Munsell Color Co., 10
East Franklin St., Baltimore, Maryland.
41. Chemical and Radiation Laboratories Report
610, Edgewood Arsenal, Maryland.
42. S. J. Magram, Sensitivity of Colored Smoke
Mixtures. TDMR-547, Edgewood Arsenal,
Maryland.
43. A. F. Taiyrek, The Toxicity of Certain Dyes in
Current Use, Pieatinny Arsenal, Dover, N. J.,
May 1964.
44. Development of a Black Smoke Candle for
Signal Purposes, EACD-376, Edgewood Ar-
senal, Maryland, March 1926.
45. T. Advokat, Colored Marker Shell M107 (155
mm), Pieatinny Arsenal Technical Note 140,
Pieatinny Arsenal, Dover, N. J., September
1956 (DDC-AD 108 297).
46. T. Advokat, HE Colored Marker Shell for
M29 and T72 Mortars (81 mm M362), Pica-
tinny Arsenal Technical Report 2664, Pica-
tinny Arsenal, Dover, N. J., January 1960
(DDC-AD 314 621).
47. G. D. Heath, Production of Colored Smokes
by Explosive Dispersion, PTP-147, Great
Britain, January 1950.
ЙЦ S GOVERNMENT I’RINTIM OFMC E I и,7 <) - 2эЬ-(М 1 (7782AI
7-50
ENGINEERING DESIGN HANDBOOK SERIES
Listed below are the Handbooks which have been published or art currently being printed. Handbook» with publication
dates prior to 1 August 1962 were published as 20-serfes Ordnance Corps pamphlets AMS Circular 310-38, 1? July 3963,
redesignated those publications as 706-serles AMC pamphlets (l.e., DROP 20-136 was redesignated АМСР 706-13P). All new,
reprinted, or revised Handbooks are being published as 706-series AHC pamphlets.
rimeral and Miscellaneous Subjects
Nor Title
106 Elements of Armament Engineering, Part One,
Sources of Energy
107 Elements of Armament Engineering, Part Two,
Ballt s tics
108 Elements of Armament Engineering, Part Three,
Weapon Systems and Components
110 Experimental Statistics, Section 1, Basic Con-
cepts and Analysis of Measurement Data
111 Experimental Statistics, Section 2, Analysis
of Enumerailve and Classiflcatory Data
112 Experimental Statistics, Section 3, Planning
and Analysis of Comparative Experiment'
113 Experimental Statistics, Section 4, Special
Topics
114 Experimental Statistics, Section 5, Tables
121 Packaging and Pack Engineering
134 Maintainability Guide for Design
135 Inventions, Patents, and Related Matters
(Revised)
136 Servomechanisms, Section 1, Theory
137 Servomechanisms, Section 2, Measurement and
Signal Converters
138 Servomechanisms, Section 3, Amplification
139 Servomechanisms, Section 4, Power Elements
and System Design
170(C) Armor and Its Application to Vehicles (U)
270 Propellant Actuated Devices
290(C) Warheads--General (U)
331 Compensating Elements (Fire Control Series)
Ballistic Missile 5o:t‘ee ( uontinusd)
No. 1Ш*
283 Aerodynarf cs
204(C) Trajectories (U;
286 Structures
Ballistics Series
14U Trajectories, Differential Effects, and Data
for Projectiles
150 Interior UulHstlcs of Guns
160(S) Elements of Terminal ballistic*, Part One,
Introduction, Kill Mechanisms and
Vulnerabillty (0)
161(3) Elements of Te*ir.1nal Ballistics, Part Two.
Collection and Analysis of Data Concerning
Targets (U)
162(S-RD) Elements of Tjmino. Ballistics, Part Three,
Application to Missile and Soacr Targets (0)
Carriages and Mounts Series
340 Carriages and Mounts--Generil
341 Cradles
342 RecoiI Systems
343 Top Carriages
344 Bottom Carriages
345 Ecullibrators
345 Elevating Mechanisms
347 Traversing Mechai>1sns
Сипе Series
A'nsunition and Explosivee Series
175 Solid Propellants, Part One
176(C) Solid Propellants, Part Two (U)
177 Properties of Explosives of Military Interest,
Section 1
178(C) Properties of Explosives of Military Interest,
Section 2 (b)
179 ExplosIve Trains
210 Fuzes, General and Mechanical
211(C) Fuzes, Proximity, Electrical, Part One (U)
212(Sj Fuzes, Proximity, Electrical, Part Two (U)
213(5) Fuzes, Proximity, Electrical, Part Three (U)
214(5) Fuzes, Proximity, Electrical, Part Four (IJ)
215(C) Fuzes, Proximity, Electrical, Part Five (U)
242 Design for Control of Projectile Flight
Characteristics
244 Section 1, Artillery Aimuni tl on--Genera 1,
with Table of Contents, Glossary and
Index for Series
245(C) Section 2, Design for Terminal Effects (U)
246 Section 3, Design for Control of Flight
Characteristics (out of print)
247 Section 4, Design for Projection
248 Section 5, Inspection Aspects of Artillery
Ammunition Design
249 Section 5, Manufacture of Metallic Components
of Artillery Amunltlon
Autemotive
355 The Automotive Assembly
356 Automotive Suspensions ,
ballistic Missile Series
250 Guns--G.ineral
252 Gun Tnbss
Military Pyrotechnics Series
186 Part Two, Safety, Procedures and Glossary
187 Part Three, Properties of Materials Used in
Pyrotechnic Compositions
189 Part Five, Bibliography
Surface-to-Air M-seile Series
291 Part One, System Integration
292 Part Two, Weapon Control
293 Part Three, Computers
294(5) Part Four, Missile Armament (U)
295(S) Part Five, Countermeasures (U)
296 Part Six, Structures and Power Sources
297(S) Part Seven, Sample Problem (U)
Materials Series*
149 Rubber and Rubber-Like Materials
212 Gasket Materials (Nonmetallic)
691 Adhesives
692 Guide to Selection of Rubber 0-R1ngs
693 Magnesium and Magnesium Alleys
694 Aluminum and Aluminum Alloys
697 Titanium and Titanium Alloys
698 Copper and Coppar Alloys
699 Guide to Specifications for Flexible Rubber
Products
70D Plastics
721 Corrosion and Corrosion Protection of Metals
722 Glass
281(S-RD) Weapon System Effectiveness (U| j
282 Propulsion and Propellants
‘The Materials Series Is being published as Military Handbooks (MIL-HDBK-) which are available to Department of Defeat»»
Agencies from the Naval Supply Depot, 5801 Tabor Avenue, Philadelphia, Pennsylvania 19120.