/


Автор: Doremus R. H.
Теги: physics mathematical physics john willey and sons inc glass production glass science applied physics
ISBN: 0-471-89174-6
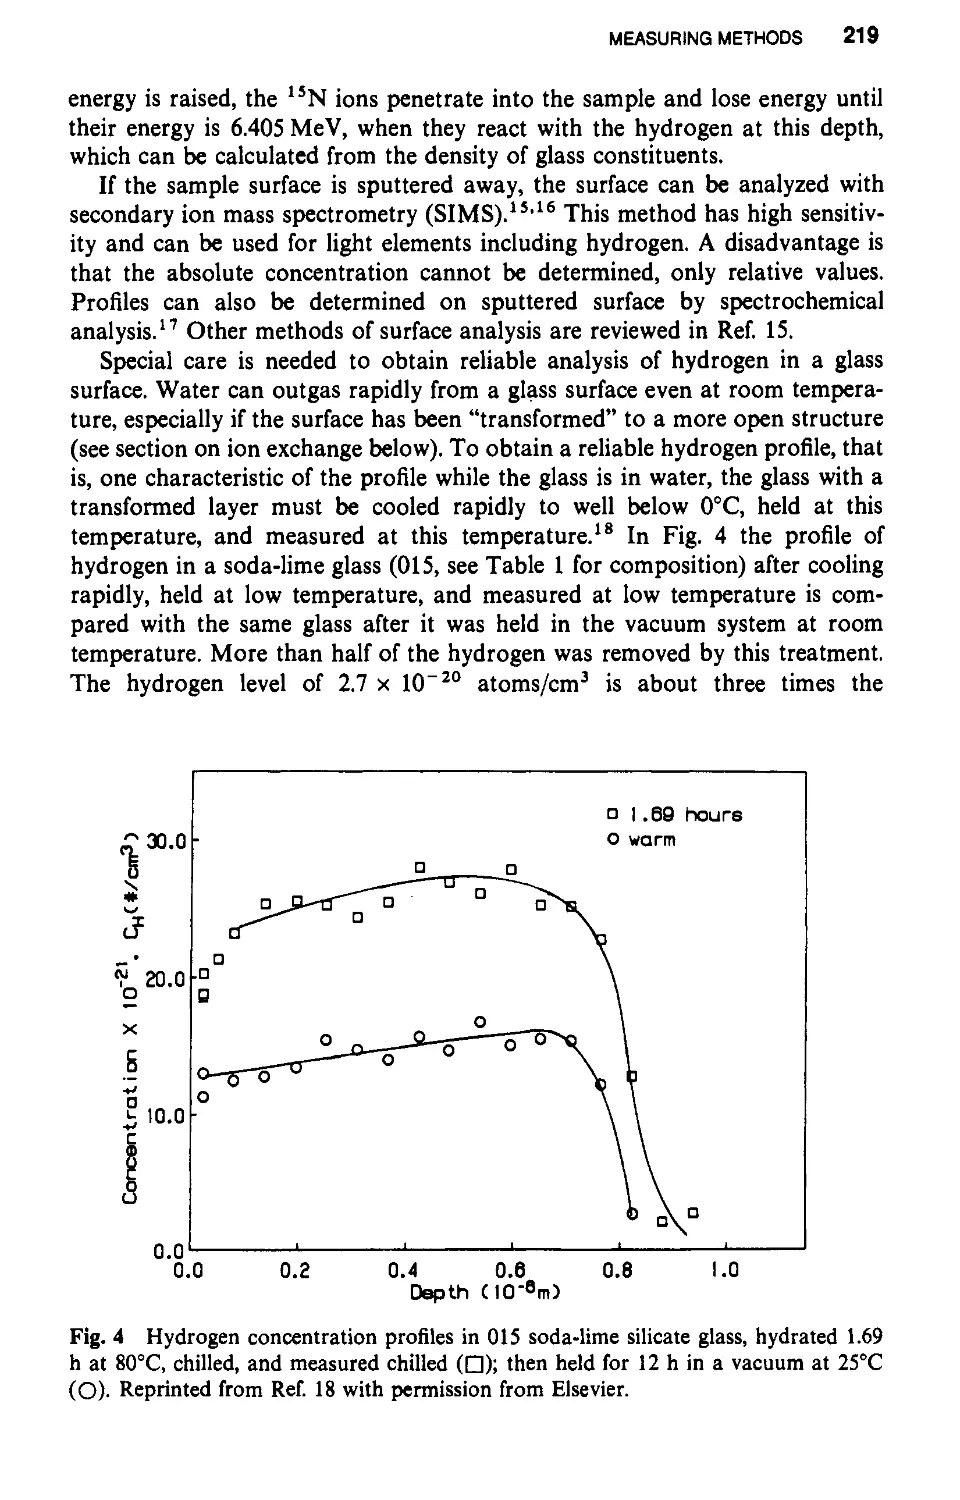
Год: 1994


Текст
GLASS SCIENCE
Second Edition
ROBERT H. DOREMUS
Rensselaer Polytechnic Institute
@
A Wiley-fnterscience Publication
John Wiley & Sons Inc.
New York / Chichester / Brisbane / Toronto / Singapore
This text is printed on acid-free paper.
Copyright @ 1994 by John Wiley & Sons, Inc.
All rights reserved. Published simultaneously in Canada.
Reproduction or translation of any part of this work beyond
that permitted by Section 107 or 108 of the 1976 United
States Copyright Act without the permission of the copyright
owner is unlawful. Requests for permission or further
information should be addressed to the Permissions Department,
John Wiley & Sons, Inc., 605 Third Avenue, New York, NY
10158-0012.
Librar)' of Congress Cataloging in Publication Data:
Doremus, R. H.
Glass science / by R. H. Doremus. -- 2nd ed.
p. em.
Includes bibliographical references.
ISBN 0-471-89174-6
1. Glass. 2. Glass manufacture. 1. Title.
TP857.D67 1994
666' . I--dc20 93-6343
10 9 8 7 6 5 4
Preface
Twenty years ago the first edition of Glass Science summarized the recent
advances in the highly active field of amorphous solids, as well as the basics
on the structure and properties of these materials. In the intervening years
there has been much active research on glasses; perhaps this research can be
considered as a consolidation of the rapid increases in knowledge reported in
the first edition.
The purpose of this revision of Glass Science is to incorporate this expand-
ing body of understanding into the base subject matter of the first edition.
Certain areas have been particularly active recently, and are emphasized in the
revision; among them are structure, chemical durability, and new processing
methods.
As for the first edition, this volume is designed for several different
audiences: as a reference source for students and glass technologists; as a
stimulus to research workers in glass science; and as a textbook for advanced
undergraduate and graduate students.
The advice of Professor Minoru Tomozawa, who has taught a course in
Glass for many years with this book, is gratefully acknowledged, as well as his
stimulating discussions on research on glass. I have also benefitted from
interactions with numerous colleagues, especially members of the Glass Re-
search Center at Rensselaer, Professors MacCrone, Moynihan, Schroeder, and
Watson.
Mrs. Kathleen Curtice has dedicated much time and effort to preparing this
manuscript for the printer, and her help is most appreciated.
Troy, New York
ROBERT H. DoREMUS
v
CONTENTS
1 INTRODUCTION 1
History of Glass Science I 2
Uses of Glass and Important Commercial Compositions I 4
Melting and Processing I 5
Books, Reviews and Journals I 10
Outline of the Book I 10
References I 11
2 GLASS FORMATION 13
Crystallization and Glass Formation I 16
Formation of Glasses from Simple Organic Liquids I 20
Glass Formation in Oxides I 20
Glass Formation and Material Properties I 22
References I 22
3 STRUCTURE 25
Ranges of Structural Order I 25
Experimental Methods I 28
Computer Simulation I 29
Specific Systems I 30
References I 44
vii
vIII CONTENTS
4 PHASE SEPARATION
Phase Diagrams I 50
Theories of Immiscibility I 56
Nucleation I 60
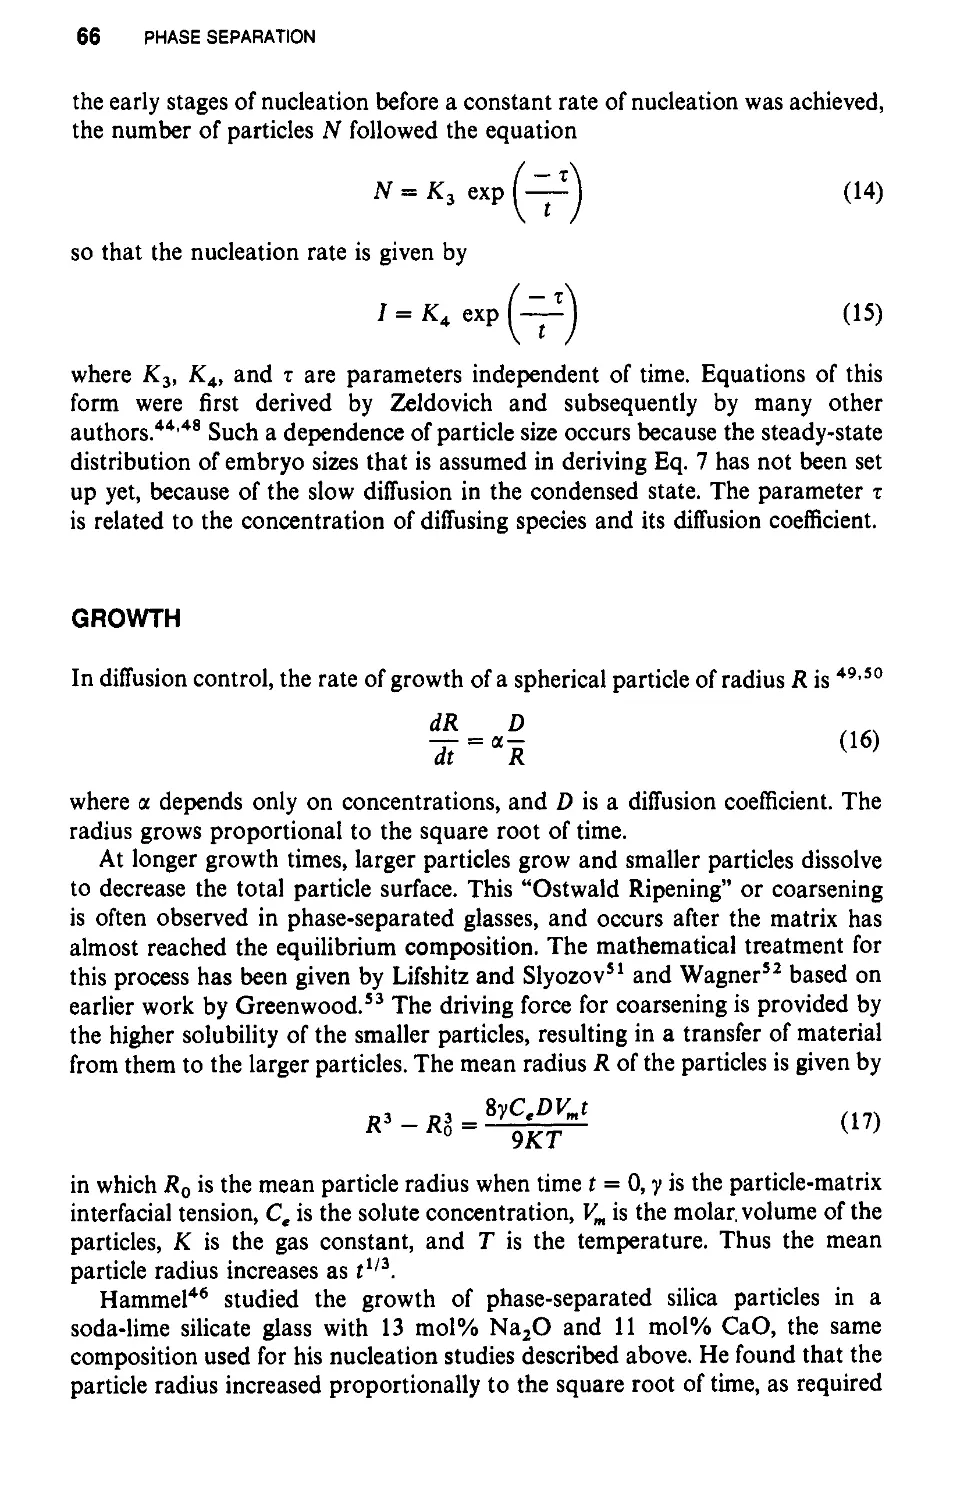
Growth I 66
Morphology and Spinodal Decomposition I 67
Property Changes and Applications Related to
Phase Separation I 69
References I 70
48
5 CRYSTALLIZATION
73
Nucleation I 75
Experimental Measurements of Nucleation
and Growth Rates I 78
Nucleating Agents I 85
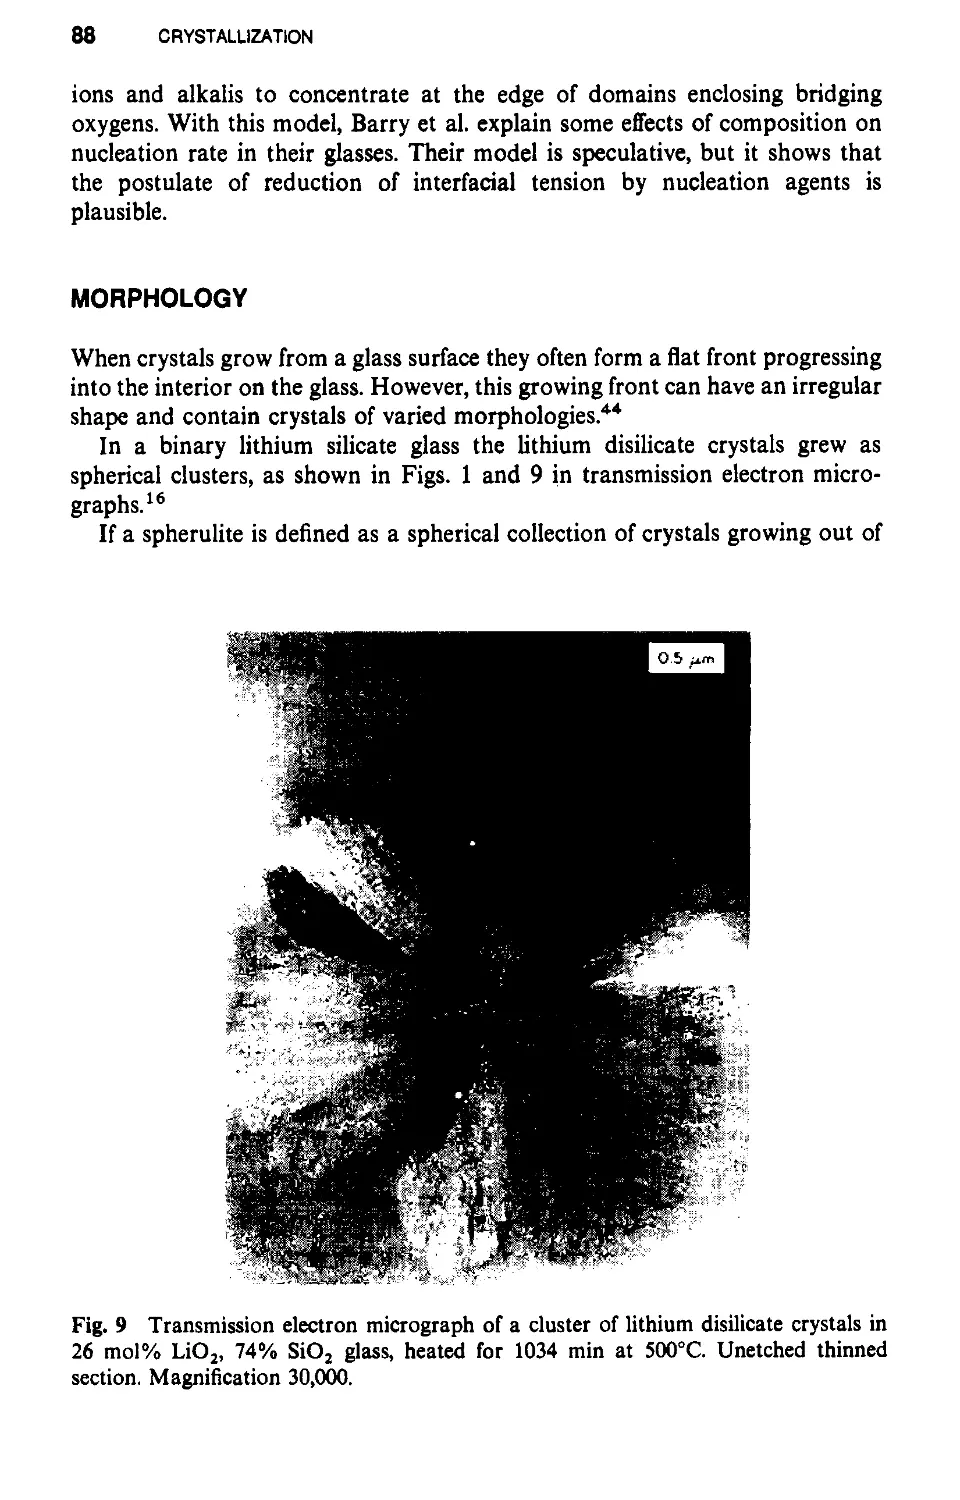
Morphology I 88
Growth I 89
Fluoride Glasses I 94
References I 96
6 VISCOSITY 99
Measurement I 101
Simple Glass-forming Oxides I 102
Multicomponent Oxides I 105
Nonoxide Glasses I 106
Temperature Dependence I 106
Theories I 109
References I 111
7 GLASS TRANSITION 113
Structural and Strain Relaxation I 116
References I 120
8 MOLECULAR SOLUTION AND DIFFUSION IN GLASS 122
Molecular Solubility of Gases I 122
Measurement of Molecular Permeation and Diffusion
in Glass I 130
Effect of Temperature, Pressure, and Molecular Size on
Molecular Diffusion in Glass I 132
CONTENTS Ix
Molecular Diffusion and Chemical Reaction I 135
Effect of Glass Composition on Molecular Diffusion I 139
Diffusion from Contracting Bubbles I 142
Oxidation of Silicon I 144
Theories for Molecular Diffusion I 145
References I 147
9 FRACTURE 150
Experimental Results I 150
Fracture Criteria, Models, and Explanations I 160
References I 169
10 FATIGUE IN GLASS
Methods of Testing I 172
Results of Static Fatigue Tests on Glass I 173
Statistics of Fatigue I 177
Life Prediction I 178
Theories of Fatigue I 180
References I 183
172
11 SURFACES
Surface Energy I 184
Surface Structure I 185
Experimental Techniques I 189
Physical Adsorption I 190
Chemisorption and Surface Chemical Reactions I 192
Surface Conductivity I 194
Grinding and Polishing of Glass Surfaces I 194
References I 195
184
12 REACTIONS WITH GASES
Water I 198
Hydrogen I 201
Oxygen I 202
Carbon Dioxide I 208
Sulfur Dioxide I 208
Fining I 209
References I 212
198
X CONTENTS
13 CHEMICAL DURABILITY: REACTION OF WATER
WITH GLASS 215
Introduction I 215
Measuring Methods I 216
Experimental Results I 220
Interpretations I 232
Dissolution I 234
Influence of Reaction Layers on Kinetics I 235
Radioactive Waste Disposal I 236
Zirconium Fluoride Glass I 237
References I 237
14 ION EXCHANGE AND POTENTIALS OF
GLASS ELECTRODES 241
Measurement of Ionic Distribution I 241
Experimental Results on Distribution Coefficients I 244
Selectivity Theories I 249
Potentials of Glass Electrodes I 252
Experimental Measurements of Potentials of
Glass Electrodes I 256
Experimental Confirmation of Potential Equations I 257
References I 260
15 ELECTRICAL CONDUCTIVITY AND IONIC DIFFUSION 263
Measurement of Electrical Conductivity
and Ionic Diffusion I 256
Relation Between Electrical Conductivity and
Ionic Diffusion I 269
Dependence of Ionic Transport on Temperature
and Pressure (Stress) I 271
Effect of Glass Composition on Ionic Transport I 277
Interionic Diffusion and Ion Size Effects I 279
Glasses with High Electrical Conductivity
("Fast Ion Conductors") I 283
Theories of Ionic Transport I 284
Conduction in High Fields I 285
References I 287
16 DIELECTRIC AND MECHANICAL LOSS 291
Experimental Measurement of Dielectric Loss I 291
CONTENTS xl
Effect of Frequency on Dielectric Loss I 293
Effect of Temperature on Dielectric Loss I 295
Effect of Composition on Dielectric Loss I 296
Measurement of Mechanical Loss I 297
Effect of Frequency and Temperature on
Mechanical Loss I 298
Effect of Glass Composition on Mechanical Loss I 300
Theories of Dielectric and Mechanical Loss in Glass I 301
References I 303
17 OPTICAL ABSORPTION IN GLASSES
Fused Silica I 307
Other Network-Forming Oxides I 310
Glasses Containing Alkali Oxide I 311
Transition Metal Ions I 313
Other Glasses and Ions I 314
Metallic Particles I 314
New Application of Glass in Optics I 315
References I 317
306
AUTHOR INDEX
321
SUBJECT INDEX
335
CHAPTER 1
INTRODUCTION
Glass is an amorphous solid. A material is amorphous when it has no
long-range order, that is, when there is no regularity in the arrangement of its
molecular constituents on a scale larger than a few times the size of these
groups. For example, the average distance between silicon atoms in vitreous
silica (SiO 2) is about 3.6A, and there is no order between these atoms at
distances above about 10A. A solid is a rigid material; it does not flow when
it is subjected to moderate forces. More quantitatively, a solid can be defined
as a material with a viscosity of more than about 10 15 p (poises).
Many glass technologists object to the above definition of a glass. These
workers prepare a glass by cooling a liquid in such a way that it does not
crystallize, and feel that this process is an essential characteristic of a glass.
Many earlier writers insist on this criterion: "A glass. . . is a material, formed
by cooling from the normal liquid state, which has shown no discontinuous
change. . . at any temperature, but has become more or less rigid through a
progressive increase in its viscosity," according to Jones (Ref. 1, p. 1), or, more
succinctly, "glass is an inorganic product of fusion which has been cooled to a
rigid condition without crystallization" as taken from the ASTM Standards for
Glass. The difficulty with this view is that glasses can be prepared without
cooling from the liquid state. Glass coatings are deposited from the vapor or
liquid solution, sometimes with chemical reactions. Thus sodium silicate glass
can be made by evaporating an aqueous solution of sodium silicate (water
glass) and baking the deposit to remove water. The product of this process is
indistinguishable from sodium silicate glass of the same composition made by
cooling from the liquid. It seems wise to use the same name for materials with
the same molecular structure and properties no matter how they are made;
1
2 INTRODUCTION
consequently, the broader definition given here is preferred. Hutchins and
Harrington 2 and Prins 21 use a similar definition.
Traditional glasses have been made of inorganic materials such as silica
sand, sodium and calcium carbonates, feldspars, borates, and phosphates that
react to form metallic oxides in the final glass. In recent years "glassy"
polymers have been widely used and they are often called glasses in the
technical literature, but there is little use of this term in everyday language. The
ASTM definition of glass given above limits it to inorganic constituents,
whereas Jones' definition does not. The present definition includes newer and
more exotic materials such as "splat-cooled" metallic glasses, the electronically
conducting glasses of the arsenic, sulfur, selenium, and tellurium halide families,
and glasses of ionic salts and aqueous solutions, as well as oxide glasses and
glassy organic polymers.
The word "glass" is derived from an Indo-European root meaning "shiny,"
which has also given us the words glare, glow, and glaze. The word "vitreous"
comes from the Latin word for glass. No distinction is made here between the
words glassy and vitreous.
The structure and properties of silicate glasses are emphasized in this book
because these glasses are the most important commercially and have been
studied more extensively than other types. In Chapters 2 and 3 an attempt is
made to include information on the formation and structure of many types of
glasses known at the time of writing. In the succeeding chapters, data on
non oxide glasses are included when this information is available and helps in
understanding, or is of particular interest.
HISTORY OF GLASS SCIENCE
The history of glass is summarized in articles in the Encyclopedia Britannica
and by Morey (Ref. 3, pp. 1 ff.). Natural glasses have been used by man from
the earliest times for which there is archeological evidence. Glass and glazes
were manufactured far back in human history. According to Sir W. M. Flinders
Petrie, as quoted by Morey (Ref. 3, p. 4), the earliest known glaze dates from
about 12,000 B.C. and the earliest pure glass from about 7000 B.C.; both were
found in Egypt, and were probably brought there from Asia. At first glass was
used only for decorative objects, but later it was molded or pressed into vessels.
The invention of glass blowing in about the first century B.C. greatly increased
the use of glass for practical purposes in Roman times, mainly for vessels but
later for windows. In the West, glass manufacturing was dispersed to isolated
sites after the fall of the Roman Empire, but was continued in Byzantium and
later in the Middle East by the Arabs. Venice became the center of a resurgent
glass industry in the West from about 1300 on. The art of glass making was
summarized in 1612 by Neri in I.:Arte Vetraria. Progress in techniques of glass
manufacture and in the application of glass was subsequently rapid, in parallel
HISTORY OF GLASS SCIENCE 3
with many other areas of technology. Until the twentieth century most of these
advances were made empirically, using common sense to guide experimenta-
tion. The application of basic scientific understanding to the improvement of
manufacture and to new applications of glass has occurred only in the last few
decades
Among the first to study glass in a more basic way was Michael Faraday.
He described glass "rather as a solution of different substances one in another
than as a strong chemical compound"4 which can still stand today as a
characterization of a multicomponent glass. Faraday studied the electrolysis
and conductivity of melts of various glasses,5 and found that some "decom-
posed" under the effect of a field and others did not. Apparently the glasses
with higher conductivity or with easily reduced components were the ones that
decomposed. Faraday was also the first to conclude correctly that the red color
of a gold ruby glass was caused by very small gold particles in the glass, 6 as
described in Chapter 17. Also in the midnineteenth century, Buff studied the
conductivity and electrolysis of glass,7 and later Warburg and Tegetmeier 8 . 9
showed that the electrolysis of glass followed Faraday's law. About this time,
Tammann initiated work on the viscosity of glass, the glass transition, the
relationship of crystallization rate and viscosity, and the reasons for glass
formation. 10 Schulz 11 made a detailed study of exchange and diffusion of silver
ions for sodium ions in a commerical glass that was unsurpassed until the last
few years.
The understanding of glass strength received its greatest impetus from the
theory of Griffith,12 in which the fracture of a brittle solid results from the
propagation of a surface flaw. At first this theory was considered by some to
be a mathematical curiosity without application to real materials, but more
recently it has provided the basis for much work and improved understanding
of the strength of glass, as discussed in Chapter 9.
The Department of Glass Technology at Sheffield, England, under Professor
W. E. S. Turner, was very active during the 1920s in measuring such properties
as density, electric conductivity, chemical durability, viscosity, and thermal
expansion of a wide variety of commercial and laboratory glasses.
In the 1930s the understanding of the reasons why certain molecules are
glass formers, and of the structure of glass, was enlarged by the papers of
Zachariasen t3 and Warren. 14 Since World War II the activity in glass science
has grown sharply, along with all science and technology. The 1950s might be
characterized as the "golden age" of metallurgical science. At that time physics
and chemistry were intensively applied to the understanding of metallic
behavior that had been found empirically and was previously understood only
in terms of macroscopic phenomena. In a similar way, the 1960s could be
described as a "golden age" of glass science because of the profitable applica-
tion during this period of the basic science to understanding glass in terms of
its structure and composition. It is curious that glass, which was in common
use long before many other metals, polymers, colloids, solutions, solvents, and
so on, should be one of the last to yield some of its mysteries to scientific
4 INTRODUCTION
exploration. Perhaps the large variation in compositions and properties in
glasses, coupled with the lack of long-range structure in a rigid material, has
deterred systematic and broad characterization of glasses.
Some of the areas of glass science that have been most active in the last few
years are sol-gel fabrication, zirconium fluoride glasses, optical wave guides,
reactions of water with glass, nonlinear optical properties, and laser glass.
This brief survey of the history of glass science is not intended to be
exhaustive, and many deserving names and studies have undoubtedly been
omitted. The next decades should see a continued expansion of knowledge
about glass and its useful application.
USES OF GLASS AND IMPORTANT COMMERCIAL COMPOSITIONS
The original use of glass was for decorative purposes. Next glass was used for
containers, and this use is still the most important today. The production of
flat glass, chiefly for windows in buildings and vehicles, is now the second
largest item of glass manufacture. Lamp envelopes are another major area of
use. There are many special applications of glass, some in small quantity, most
of which have been developed over the past few decades. Some of these special
applications are glass ceramics and surface-strengthened glass for higher
strength, fiber glass, mirror blanks of fused silica, glass electrodes for alkali
ions, and glass lasers. A good summary of uses of glass is given by Hutchins
and Harrington. 2
The most important commercial glasses .are based on sodium calcium
silicates. These glasses are cheap and weather well; they are easily melted and
formed. Minor additions to the base compositions are made to improve certain
properties: alumina for improved weathering and less devitrification (crystalli-
zation), borates for easier working and lower thermal expansion, and arsenic
or antimony oxide for fining (removal of bubbles). Another important class of
compositions is the borosilicates. They have lower thermal expansion and thus
better thermal shock resistance, as well as improved chemical durability, for
such applications as automobile headlamps, cookingware, and laboratory
apparatus. Aluminosilicate glasses are used for chemical durability, resistance
to devitrification, higher temperatures, and greater strength in cookingware,
glass ceramics, fiber glass, and seals. Lead glasses are used for their high
refractive index, easier working, and greater density as lamp envelopes, seals,
optical glass, and "crystal" glass for art and tableware. Fused silica is especially
valuable for its high-temperature stability, low thermal expansion and conse-
quent high thermal-shock resistance, excellent chemical durability, purity, and
good optical transmission in the ultraviolet. It is used for lamp envelopes,
crucibles for melting silicon and germanium, optical components, and many
special applications requiring its unique properties.
A vast number of other compositions, including nonsilicate glasses, has been
MELTING AND PROCESSING 5
made for all sorts of applications. The infinite variability of glass compositions
leads to a great variety of possible properties and consequent uses. Only a
beginning has been made in exploiting this advantage of glass.
The compositions and properties of some of the most commonly used
commercial silicate glasses are given in Table 1. Impurity concentrations and
methods of making different types of vitreous silica (SiO 2) are given in Table
2. Tables of compositions and properties of commercial glasses, as well as
binary and ternary silicate glasses, are given in Ref. 15.
MELTING AND PROCESSING
Melting
Raw materials for making silicate glasses are quartz sand, sodium carbonate
or nitrate, calcium and magnesium carbonate, and oxides such as alumina, lead
oxide, sodium borate, zinc oxide, and arsenic and antimony oxides. These
materials have traditionally been mined directly, with little or no purification,
so were cheap but of variable impurity content. Some deposits of quartz crystal
and quartz sand are probably the purest of naturally occurring materials,
having total impurity content less than about 100 parts per million by weight.
Glass has traditionally been melted in a "batch" in a pot or crucible of
refractory ceramic mate ial. Raw materials are mixed to the desired composi-
tion and either heated in the crucible or added to already molten glass. The
low melting constituents (alkali oxides) melt and dissolve the higher melting
constituents such as quartz and alumina.
Quantity production of glass, especially soda-lime and borosilicate compo-
sitions, is continuous in a large "tank" or furnace made of special refractory
brick; a characteristic tank is 15 x 25 m in size, with glass 1.5 m deep, giving
a daily production of as much as 700 metric tons of glass. The tank is heated
by combustion of oil or natural gas across the glass surface. Melting tempera-
tures are about 1200-1300°C. The furnace is separated into two positions by
a refractory "wall" over which glass flows. The mixed raw materials are fed
onto the top of the molten glass in the melting chamber; the molten glas flows
across the wall into the refining chamber, in which the glass becomes more
homogeneous and bubbles are removed.
In the refining chamber, the glass is "fined" by the removal of bubbles. The
bubbles contain trapped air (oxygen and nitrogen) and decomposition prod-
ucts of the raw materials, mainly carbon dioxide. Large bubbles rise to the top
of the melt, but most bubbles are too small to be removed in this way; the gases
in them must dissolve in the melt to collapse the bubbles. This dissolution is
aided by fining agents added to the glass batch. Arsenic and antimony oxides
are common fining agents. They have two oxidation states, and increase
dissolution rates of gases by changing the oxidation state of the melt. Sulfates
0)
TABLE 1 Properties, Compositions, and uses of Important Commercial Silicate Glasses
Approximate Relative
Composition (wt. %) thermal
Corning Kimble Expansion Density Refractive
Glass Type Number Number Si0 2 B 2 0 J Al 2 0 J Cao MgO PbO Na 2 0 K 2 0 1O- 1 rC (gms/cm J ) index Uses
Soda lime 0080 R-6 72.6 0.8 1.7 4.6 3.6 15.2 92 2.47 1.51 Windows,
lamps
qPyrex" 7740 KG-33 81.0 13.0 20 4.0 33 2.23 1.47 Headlamps,
boro- cooking, and
silicate labware
Soda bora- 7050 K-705 68.0 24.0 1.0 7.0 46 224 1.48 Sealing
silicate
Alkali 0010 KG-l 77.0 1.0 8 9.0 5.0 93 2.86 1.54 Lamp tubing,
lead sealing
Alkaline 1720 EZ-l 64.0 4.5 10.4 8.9 10.2 1.3 0.7 42 252 1.53 High
earth temperatures
Alumino-
silicate
qE" Fiber- 55.0 7.0 15.0 21.0 1.0 1.0 60 2.61 1.55 Fiberglass
glass
TABLE 2 Different Types of Fused Silica
Manufacturers Designations
Maximum Impurity Conc. (ppm)
Method of General Thermal Quartz
Type Manufacture Al Fe Ca Mg K Na Li Cl OH Electric Syndicate Heraeus Corning et Silice
Electrical 150 7 12 7 4 12 12 50 4 101 IR Vitreosil Infrasil Pursil
fusion of 204
quartz crystal 125
II Flame uncertain 400 OG Vitreosil Herosil
fusion of Homosil
quartz crystal Vitrasil
III Flame 10 6 4 3 2 2 60 1200- 151 Spectrosil Suprasil I 7940 Tetrasil
hydrolysis
of SiCI 4
IV Vapor phase similar to III 500 low Spectrosil Suprasil W 7943
oxidation of WF
SiCl 4
'Lower values of impurity concentrations are frequently quoted, but are questionable. For alkalis, see Ref. 32.
.....
8 INTRODUCTION
are also common fining agents; they also function by changing the oxidation
state of the melt. The mechanism of fining is discussed in more detail in
Chapter 12.
There is an article on glass melting in Ref. 16, p. 1986, by A. R. Cooper.
The rate of dissolution of silica in molten alkali silicate probably controls
the overall rate of melting of silicate glasses. See p. 240 in the first edition of
this book and Ref. 17 for discussions and additional references. The dissolution
of other oxides in oxide melts is also usually controlled by transport in the
melt, although there can also be a surface reaction that forms a new phase on
the solid surface. 1 7
Forming
Glass containers are formed from glass that flows out of the continuous
furnace. A "gob" or portion of glass is placed in a mold where a first shape is
formed by pressing or blowing. This initial shape is removed from the mold,
reheated, and then placed in a second mold in which the final shape is blown.
The continuous machine (IS or Individual S ction machine) on which these
steps are done rapidly produces a very large number of units; a usual cycle time
for one container is 1O-15s.
Lamp bulbs are made by blowing into a ribbon of glass emitting from the
furnace on a "ribbon machine". Again a high rate of units is produced, up to
2000/min. A special nozzle blows glass in the ribbon into a mold.
Glass objects such as plates, tumblers and vases can be made by pressing
molten glass in a mold with a metallic plunger. Patterns on the mold surface
are imprinted into the glass and make it look more expensive than it is.
More than 100 years ago, window glass was made by hand by either the
crown or cylinder processes. In the crown process, a glob of glass was blown
into a sphere and one side flattened by pressing it against a plate. An iron rod
was attached to the flat part and the blow pipe removed. The globe was then
spun into a flat disc from which panes could be cut. In the cylinder process,
the glass was formed into a large cylinder, which was split open and flattened.
Later, sheet glass was drawn directly from the melting surface, flowed
through rollers, and then ground and polished. These processes are expensive.
A new method of making more inexpensive flat glass of high quality was
developed by Alistair Pilkington of the Pilkington Glass Company in England.
In this float process, a continuous strip of glass from the melting furnace floats
onto the surface of a molten metal, usually tin, at a carefully controlled
temperature. The flat surface of the molten metal gives a smooth, un distorted
surface to the glass as it cools. This process is continuous, and high production
speeds are possible. Today most flat glass is made by this method.
There is an article on forming of glass in Ref. 16, p. 1818, by R. J. Ryder.
MELTING AND PROCESSING 9
Fiber Glass
Glass fibers are finding increasing application in reinforcing polymer-matrix
composites ("fiber glass"), which are used in automobile and boat bodies,
aircraft, electronic circuit boards, and a variety of other ways. Fiber glass
fabrics serve as protective apparel, industrial and decorative fabrics and tire
cord. Short fibers are used in thermal insulation. A typical fiber glass compo-
sition is given in Table 1.
In making continuous fiber glass, molten glass from a melting furnace is fed
to a drawing apparatus that consists of clusters of many holes called bushings.
Each bushing has hundreds of holes or nozzles through which the glass is
drawn into fibers of diameter about 10-100llm. The fibers are cooled by a water
spray, and a polymeric coating or "sizing" is applied to protect and lubricate
the fibers. Instead of drawing glass directly from the furnace, glass can be cast
into spherical "marbles" one or a few centimeters in diameter, which are then
melted and fed into the heated bushings.
Short fibers can be formed either directly from glass from the melting
furnace or from marbles. The molten glass is fed into a rotating cylinder
through a large number of small holes in the walls of the cylinder, and inside
the cylinder the glass streams are broken up by an axial high-velocity flow of
gas. The short fibers formed in this way are sprayed with binder as they fall
onto a collecting belt which carries them through an oven that polymerizes the
binder.
There is an article on uses and manufacture of glass fibers in Ref. 16, p. 1974,
by S. L. Mikesell and W. W. Wolf.
Sintering and Sol-Gel Methods
Several methods of melting and forming glass have been developed for special
applications or properties. Glass powder can be pressed and sintered similar
to powders of crystalline ceramics. This is expensive compared to more
traditional methods of melting, but can be useful for making high-melting
glasses and adding small amounts of desired impurities to them.
Sol-gel methods of glass making are finding increasing application in
making highly pure and . homogenous glasses or special shapes such as
microshells. In one method, a mixture of liquid metal alkoxides is hydrolyzed,
polymerized and then dehydrated to form a homogeneous glass at tempera-
tures much below those ordinarily used for glass melting. The hydration and
polymerization are carried out in acidic alcohol/water solution at temperatures
up to 60°C; then the mixture can be formed or made to bulk gel by heating to
somewhat higher temperatures; finally the gel is pyrolyzed and dehydrated by
heating at temperatures from 500°C to l000°C to form glass. Some superior
products of this method are: homogeneous multicomponent glasses; composi-
10 INTRODUCTION
tions hard to form into glasses by direct melting because of incomplete melting
and crystallization on cooling; very pure glasses; and composites of glasses with
other materials. Low forming temperatures save energy, allow less corrosion-
resistant container materials, and allow formation of composites with materials
not resistant to higher temperatures.
Special shapes such as fibers and thin films can be made by the sol-gel
method. Glass micros hells for laser targets have been made by dropping gel
particles through a temperture gradient in a furnace tower; the organic
compounds and water help to blow the glass into thin-walled shells.
A book by Brinker and Scherer 18 and review article by Sakka 19 give
detailed discussions of sol-gel processing of oxides. Proceedings from a sympo-
sium are in Ref. 20.
BOOKS, REVIEWS AND JOURNALS
The Handbook of Glass Properties 15 has chapters on vitreous silica and
commercial glasses, with extensive lists of properties and compositions of
commercial and optical glasses. There are short chapters on a wide variety of
glass properties, with extensive tables of these properties for binary and ternary
oxide glasses. The emphasis in the present volume is a more basic understand-
ing of phenomena, rather than detailed listing and discussion of properties. A
series of volumes contain data on properties of glasses taken directly from the
original publications. 21 Some other general books on various aspects of glasses
are in Refs. 22-28. Other more specialized monographs are referred to in the
appropriate chapters.
There is a series of short articles on many aspects of glass in Ref. 16.
Collections of review articles are in Refs. 29-31. Individual articles from
these volumes are referenced in pertinent places.
OUTLINE OF THE BOOK
The following chapters can be grouped into sections on structure and micro-
structure (Chpts. 2-5), viscosity and structural relaxation (6 and 7), strength
(9 and 10), chemical properties (8 and 11-14), electrical properties (15 and 16)
and optical properties (17). These sections are a rough guide to classifying the
subject matter; there is much overlapping. Areas of work that have been active
recently are emphasized. For information and data on properties of glasses that
are not discussed, such as density, surface tension, coefficient of thermal
expansion, heat capacity, thermal conductivity, elasticity, hardness and refrac-
tive index, see Ref. 15. This reference also has more information on experimen-
tal techniques to measure properties.
REFERENCES 11
REFERENCES
1. G. O. Jones, Glass, Methuen, London, 1956.
2.1. R. Hutchins and R. V. Harrington, in Encyclopedia of Chemical Technology, Vol.
1, 2nd edn., Wiley, New York, 1966, p. 533.
2a.1. A. Prins, in Proc. Int. Con! on Physics of Noncrystalline Solids, 1. A. Prins, Ed.,
North-HoIland, Amsterdam, 1965, p. 1.
3. G. W. Morey, The Properties of Glass, edn., Reinhold, New York, 1954.
4. M. Faraday, Phi/os. Trans. Roy. Soc., 49 (1830).
5. M. Faraday, Experimental Researches in Electricity, reprinted by 1. M. Dent,
London, 1914, pp. 38 and U5.
6. M. Faraday, Phi/os. Mag., 14, 401, 512 (1857).
7. H. Buff, Liepzig Ann., 90, 257 (1854).
8. E. Warburg, Ann. Phys., 21, 622 (1884).
9. E. Warburg and F. Tegetmeier, Ann. Phys., 35,455 (1888).
10. G. Tammann, Der Glaszustand, Voss, Leipzig, 1933.
11. F. Schulze, Ann. Phys. Liepzig, 40, 335 (1913).
12. A. A. Griffith, Phi/os. Trans. Roy. Soc., 221A, 163 (1921).
13. W. H. Zachariasen, J. Am. Chem. Soc., 54, 3841 (1932).
14. B. E. Warren and co-workers, J. Am. Ceram. Soc., 17, 249 (1934); 18, 239 (1935);
19,202 (1936); 21, 287 (1938).
15. N. P. Bansal and R. H. Doremus, Handbook of Glass Properties, Academic Press,
San Diego, 1986.
16. M. B. Bever, Ed., Encyclopedia of Materials Science and Engineering, Pergamon
Press, Oxford, 1986.
17. K. H. Sandhage and G. 1. Yurek, J. Am. Ceram. Soc., 73, 3633, 3643 (1990).
18. C. 1. Brinker and G. W. Scherer, Sol-Gel Science, Academic Press, San Diego, 1990.
19. S. Sakka, in Treatise on Materials Science and Technology, Vol. 22, M. Tomozawa
and R. H. Doremus, Eds., Academic Press, San Diego, 1982, p. 129.
20. M. A. Aegerter, Ed., Glasses and Ceramics from Gels, J. Non-Cryst. Solids, 121,
( 1989).
21. O. V. Mazurin, M. V. Strelsina and 1. P. Shvaiko-Shvaikovaskaya, Eds., Handbook
of Glass Data, Elsevier, Amsterdam. Part A: Vitreous Silica and Binary Silicate
Glasses, 1983; Part B: Single-Component and Binary Non-Silicate Oxide Glasses,
1985; Part C: Ternary Silicate Glasses, 1987.
22. C. L. Babcock, Si/icate Glass Technology Methods, Wiley, New York, 1977.
23. T. S. lzumitani, Optical Glass, Kyoritsu Shuppan, Tokyo, 1984.
24. R. W. Douglas and S. Frank, A History of Glass Making, Foulis, Henley-
on-Thames, 1972.
25. R. ZaIlen, The Physics of Amorphous Solids, Marcel Dekker, New York, 1983.
26. S. R. Elliot, Physics of Amorphous Materials, 2nd Edn., Longman, London, 1991.
27. J. Zarzycki, Les Verres et /'Etat Vitreux, Masson, Paris, 1982, see ref. 44, Chap. 3.
28. H. Scholze, Glass, Springer-Verlag, New York, 1990.
12 INTRODUCTION
29. 1. D. Mackenzie, Ed., Modern Aspects of the Vitreous State, Vols. 1-3, Butter-
worths, London, 1960, 1962, 1964.
30. M. Tomozawa and R. H. Doremus, Eds., Treatise on Materials Science and
Technology, Vols. 12, 17,22, and 26, Academic Press, San Diego, 1977, 1979, 1982,
1985.
31. D. R. Uhlmann and N. 1. Kreidl, Eds., Glass: Science and Technology, Vols. 1-5,
Academic Press, San Diego, 1980-1987.
32. R. H. Doremus, Phys. Chern. Glasses, 10,28 (1969).
CHAPTER 2
GLASS FORMATION
What materials can be glasses? In principle any substance can be made into a
glass by cooling it from the liquid state fast enough to prevent crystallization.
The final temperature must be so low that the molecules move too slowly to
rearrange to the more stable crystalline form. Alternatively one can imagine
building up the material onto a substrate, either by deposition or chemical
reaction from the vapor, the substrate being so cold that rearrangement cannot
take place. In actual practice, glass formation has been achieved with a
relatively limited number of substances. After substances that have been made
into glasses are listed, the question of why so few substances are amenable to
glass formation is considered in subsequent sections.
Materials that have been made into glasses are listed in Tables 1 and 2.
Undoubtedly these lists will be extended as new methods of more rapidly
cooling melts and of deposition from vapor or solution are devised. Thus the
lists show those materials most easily formed into glasses and are representa-
tive rather than exhaustive. Some of the glasses in the tables may contain fine
crystals of size looA or less. It is often difficult to be certain that small
crystalline regions are absent, even with X-ray or electron diffraction measure-
ments. A material containing crystallites of size from 20 to looA can be
mistaken for a glass even though it does not strictly fit the definition of a glass
given in Chapter 1. The abstracts section of the Journal of Physics and
Chemistry of Glasses under Glass Forming Systems and the Glass section of
Ceramic Abstracts, published by the American Ceramic Society, should be
consulted for additional information on new glass-forming systems.
The materials in Table 1 can be placed in several categories. The oxides are
by far the most important commercially, as mentioned in the last chapter.
Multicomponent oxide glass results from the mixing of other oxides with the
13
14 GLASS FORMATION
TABLE 1 Glasses Formed by Cooling from the Liquid
Refs.
Elements
S,Se
Te(?)
P
Oxides
B 2 0 3 , Si0 2 , Ge0 2 , P 2 0 S ' AS 2 0 3 , Sb 2 0 3
In 2 0 3 , T1 2 0 3 , Sn0 2 , Pb0 2 , Se0 2
"Conditional" Te0 2 , Si0 2 , Mo0 3 , W0 3 , Bi 2 0 3 ,
A1 2 0 3 , Ba 2 0 3 , V 205, Si0 3 , Nb 2 0 S
Sulfides
AS 2 S 3 , Sb 2 S 3
Various compounds of B, Ga, In, Te, Ge, Sn
N,P.Bi
CS 2
B 2 S 3 -Li 2 S, P 2 S s -Li 2 S
Selenides
Various compounds of Tl, Sn, Pb, As, Sb, Bi,
Si, P
Tellurides
Various compounds of Tl, Sn, Pb, As, Sb, Bi, Ge
Halides
ZnCI 2 , multicompound chlorides based on ZnCI 2 ,
CdCI 2 , BiCl 3 and ThCl.
BeF 2' AIF 3' ZrF 4' HfF 4' ScF 3' TiF. as glass-
formers and many other ions as intermediates
and modifiers
AgI-AgF-AIF 3
Sb 2 S 3 -Ag 2 S, Sb 2 S 3 -AgI, Sb 2 S 3 -Ag 2 S-AgI
Cu(CI, Br, I)
Acetates
Pb-K acetate, Ca-K acetate
Nitrates
KN0 3 -Ca(NO 3h and many other binary mixtures containing
alkali and alkaline earths nitrates
Sulfates
KHS0 4 and other binary and ternary mixtures
Carbonates
K 2 C0 3 -MgC0 3
1,2
1,3
4
1,5
6
4,7
9
8
4,10,11
1,4
1,4,14
14,16
17
14,17a
17b
1,15
1,18
CRYSTALLIZATION AND GLASS FORMATION 15
TABLE 1 (continued)
Refs.
Simple organic compounds
0- Terphenyl, toluene, 3-methyl hexane, 2,3-dimethyl ketone,
diethyl ether, isobutyl bromide, ethylene glycol, methyl 9,13
alcohol, ethyl alcohol, glycerol, glucose
As droplets only: m-xylene, cyc1opentane, n-heptane, methylene
chloride 9
Polymeric organic compounds
Example: polyethylene (-CH 2-).' and mant others 19
Aqueous solutions
Acids, bases, chlorides, nitrates, and others 20,21
Metallic alloys by "Splat Cooling"
Au 4 Si, Pd 4 Si 21a
Te,,-Cu 2s -Au s 22
TABLE 2 Glasses Formed by Deposition or Reaction from the Vapor, and not included
in Table 1
Refs.
Elements
Boron 24
Silicon, Germanium 23
Bismuth, Gallium 32
Oxides
Aluminum(?) 25
Tantalum 25
Niobium 25
Water(?) 27,28
Metals and alloys 26
Other compounds
Silicon carbide 23
Indium antimonide 29
Various combinations of silicon, or germanium, with oxygen,
sulfur, selenium, and tellurium 29
Magnesium with antimony or bismuth 30
Nickel, cobalt, or iron with phosphorous or sulfur 31
16 GLASS FORMATION
main "glass formers" SiO z , B z 03' Ge0 2 , and P 205' The "conditional" glass-
forming oxides in Table 1 do not form glasses alone, but can do so in binary
or multicomponent mixtures with other oxides.
A second category is the chalcogenide glasses based on sulfur, selenium, or
tellurium. In chemistry, the term chalcogenide refers to compounds containing
oxygen, sulfur, selenium, or tellurium; thus its use to describe glasses of these
elements, excluding oxides, is unfortunate. Many of these glasses of commercial
interest include halide elements. The root chalco- comes from a Greek word
for copper, and the chalcogenide elements have traditionally been those that
form strong compounds with copper. These glasses are primarily interesting
because some are electronic conductors (semiconductors). They also soften at
relatively low temperatures and transmit infrared radiation well.
Another category is the ionic glasses-halides, nitrates, sulfates, and carbon-
ates. The latter three are quite similar because they form glasses only as binary
or multicomponent mixtures. Angell has reviewed work on these glass for-
mers. 33
Other categories are the simple organic compounds, the organic polymers,
the aqueous solutions, and metallic alloys.
CRYSTALLIZATION AND GLASS FORMATION
Turnbu1l 34 has discussed the question of whether a glass is ever the most stable
state of a solid below its melting point. He concludes that there is no rigorous
proof that the most stable state of a substance at low temperature is crystalline
rather than glassy, but that, with the exception of helium, it is found
experimentally that the most stable forms of pure substances are crystalline.
Furthermore the viscosities of liquids at their freezing points are invariably
much lower than the 10 15 P characterizing a rigid glass, the highest being silica
with a viscosity of 10 7 P at the melting point of cristobalite.
Therefore, if a glass is formed from a liquid, it must be cooled below its
melting point so fast that the supercooled liquid does not crystallize. Thus the
rates of nucleation and growth of crystals in the liquid, together with the
cooling rate, determine whether a glass is formed. Uhlmann and co-workers 52
have treated the kinetics of glass formation in terms of the Avrami 53 equations
for the volume fraction V./V crystallized, where V. is the volume of crystalline
material in a total volume V, and their treatment is followed here. The general
transformation equation includes the possibility of time dependent rates of
nucleation and crystallization. A simplification is to assume that these rates are
functions of temperature only and not time. The result is
v.;v= l-;-exp(-nu 3 It 4 /3)
(1)
where I is the rate of nucleation of crystals per unit volume, u is the rate
of crystallization (m/s), and t the time. Equations for these rates are discussed
in Chapters 4 and 5. The exponential form in Eq. 1 allows for the possibility
CRYSTALLIZATION AND GLASS FORMATION 17
of impingement of growing crystals; at short times, y'/Vis proportional to the
term rr.u 3 /t 4 /3.
If the rate of nucleation and crystallization are known as a function of
temperature, the volume fraction of crystals at a particular temperature can be
calculated as a function of time. It is assumed that crystallization is detectable
at a certain fraction y'/V; then the time for detection as a function of
temperature can be found. The resulting temperature-log time plot is called a
time-temperature-transformation (T TT) curve, as shown in Fig. 1 for anor-
thite (CaO 'Alz03 '2SiO z ), with y'/V= 10- 3 , from Ref. 54. The position of the
curve is only weakly dependent on the value assumed for y'/V. The rates of
nucleation and growth are a maximum at a certain temperature (Chapters 4
and 5); the result is that the TTT curves have one or more minimum times, as
shown in Fig. 1. This minimum results because of two opposing factors. As the
temperature of the liquid is lowered below the melting temperature, the driving
force for both nucleation and growth increases, leading to increased rates.
Opposed to this increased is the decreased in transport rates (diffusion or
viscosity) as the temperature is lowered, which decreases the rates of nucleation
and growth. The result is a maximum in these rates and a minimum time for
appreciable crystallization, as shown in Fig. 1.
The cooling rate to avoid crystallization and thus form a glass must be high
enough to avoid the "nose" -in the TTT curve. A rough estimate of this critical
cooling rate Rc can be found by considering the temperature range over which
the crystallization rate is appreciable. For the curve in Fig. 1, this temperature
range is about 100°C at 2(10)3/ S , so Rc 100/2(10)3 = 0.05° Is. A cooling rate
faster than this in the fast crystallization temperature range should prevent a
crystallization volume fraction of more than 10- 3 from being formed. This
method of estimating Rc is somewhat different frQm that used by Uhlmann and
Yinnon 52 ; they describe other methods for estimating Re. For lunar sample
15286 Uhlmann et a1. 52 measured a critical cooling rate of 0.3°js; from their
1550 T MELT
1450
U 1350
1250
:;)
C
(1150
F 1050
950
850
10 2
Anorthite
(Isothermal)
.-------------
....
o ,,-'
: :.: :
. 0 .
o 0 0
o 0 0 0 j
o 0 0
o 0 0 0
o 0 0
10 3 10 4
Time ( seconds)
Fig. 1 Experimental isothermal time-temperature-transformation (T-T-T) diagram.
Reprinted from Ref. 54 with permission from Elsevier.
IO
18 GLASS FORMATION
TTT curve for this glass (MgO, FeO, Al 2 0 3 silicate), the present method gives
about 0.2°/s, in good agreement with the measured value.
Often measured nucleation and crystallization rates are not available. In
that circumstance, it would be useful to be able to estimate nucleation and
growth rates of crystals in a liquid to allow calculation of critical cooling rates
and the tendency to glass formation. Estimates of these rates are described in
Chapter 5; they are difficult. Problems are heterogeneous nucleation sites,
which can increase nucleation rates, uncertainties in theoretical equations for
nucleation and crystallization, and systems that do not follow equations.
Uhlmann nd Yinnon sz describe some estimation techniques; in some ma-
terials, estimation of critical cooling rates within an order of magnitude was
possible. Ruckenstein and Ihm ss have also calculated critical cooling rates for
glass formation from nucleation and crystallization equations.
Crystallization rates are easier to measure than nucleation rates, and have
been determined for many glass-forming systems. Maximum crystallization
velocities as listed in Table 3. The rates of crystallization are lowest for
substances easily cooled to glasses, such as silica and germania, whereas they
are higher for alkali and alkaline earth compounds, which must be cooled more
rapidly to avoid crystallization. From the table, one might guess that an upper
limit for the crystallization rate of a material easily formed as a glass by cooling
the liquid would be about 10- 4 em/s. With this rate, it is necessary to cool the
glass through the temperature range of maximum crystallization rate in less
than 0.01 s to prevent growth of crystals larger than 100 A in diameter. This
time is too short for most practical conditions, so the nucleation rates for
materials with maximum crystallization rates above 10- 4 cm/s must be low.
For glasses such as silica, this low rate is enough to ensure glass formation for
a wide range of cooling rates.
The velocity of crystallization of cristobalite from fused silica is shown as a
function of temperature in Fig. 2, from the work of Wagstaff. 3s As the silica is
cooled below the melting point of cristobalite, the rate of crystallization rises
12
z
"
Q
o
L l
-12
14 O I!liOO I !Ii!t 0 '100 "!to 1700 "$0 1.00
TEMPERATURE ('C)
Fig. 2 The rate of crystallization of cristobalite from fused silica as a function of
temperature. 3
CRYSTALLIZATION AND GLASS FORMATION 19
TABLE 3 Crystallization Velocities and Viscosities of Glass-Forming Liquids
Max Refs. Temp. Log Refs.
Melting Cryst. for of Viscosity for
Point Velocity Velocity Max. v at m.p. Viscosity
Material eC) (cm/s) eC) (P)
Vitreous 1734 2.2(10)-7 35 1674 7.36 36
silica,
Si0 2
Vitreous 1116 4.2(10)-6 37 1020 5.5 38
germania,
Ge02
Phosphorous 580 1.5(10) -7 39 561 6.7 40
pentoxide,
P 2 0 5
Sodium 878 1.5(10) -4 41,41a,42 762 3.8 42
disilica te,
Na 2 0' 2Si0 2
Potassium 1040 3.6(10)-4 41 930
disilica te,
K 2 O.2Si0 2
Barium 910 4.3(10)-3 43 849 1.7 44
diborate,
BaO.2B 2 0 3
Lead 774 1.9(10) - 4 45 705 1.0 45
diborate,
PbO. 2B 2 05
1,2-Diphenylbenzene 55.5 2.5(10) - 3 46 38 -0.46 46
1,3,5- Tri-IX-
naphthylbenzene 197 9.3( 10) - 5 47 175 -0.34 47
Glycerol 18.3 1.8(10) -4 48 -6.7 1.0
Salol 43 6.4(10)-3 49 20
Polyethylene
adipate 55 9.5(10) - 6 50 26
Toluene -95 >0.5 51
Ethyl ether -116 >0.13 51
Methyl alcohol -98 >0.09 51
to a maximum value and then decreases. At much lower temperatures (below
about 900°C for pure vitreous silica) the rate of crystallization is so slow that
even for long holding times, no appreciable amount of crystalline material is
formed.. Thus, if the silica is cooled rapidly enough from above the melting
point to below 900°C, no appreciable amount of crystalline cristobalite is
formed, and the silica becomes a stable glass.
20 GLASS FORMATION
FORMATION OF GLASSES FROM SIMPLE ORGANIC LIQUIDS
Several organic liquids listed in Table 1 can form glasses, even though they
show rapid crystallization rates near their melting points and are quite fluid
there. Different explanations have been proposed to account for this anomaly,
but none is entirely satisfactory. This problem is considered in the following
paragraphs.
The organic liquids that form glasses have relatively low melting points, and
most have asymmetric molecules. Turnbull and Cohen 56 have pointed out that
the ratio of the boiling temperature to the melting temperature (T"/T,,,) for
these liquids is greater than 1.8, whereas it is less than this value for organic
liquids that do not form glasses. They deduced that the temperature of glass
formation is related to the cohesive energy of the liquid, which is proportional
to the boiling point. Thus the closer the melting temperature is to the
temperature of glass formation (the larger is T,,/ T",), the greater is the tendency
to glass formation. Another qualitative way to view glass formation in these
liquids is that they have lower melting temperatures because of the greater
difficulty in rearranging their asymmetric molecules, and this difficulty, en-
hanced by the lower crystallization temperature, leads to reduced crystalline
nucleation and growth and therefore to glass formation. These considerations
explain the relative glass-forming tendency of the organic liquids with asym-.
metric molecules, but it is still difficult to account for glass formation in view
of their relatively low viscosity and high crystallization rate near the melting
points.
The. viscosity of these liquids increases sharply below their melting points,
and consequently the crystallization rate decreases. 46 . 47 ,57 Stavely et a1. 9
found that they had to cool droplets of organic liquids to temperatures from
0.7 to 0.8 of the melting temperature before they crystallized. At this fraction
of the melting temperature, the viscosity of the liquids with asymmetric
molecules is so high that the rate of crystallization is low, and as droplets they
form glasses. However, this reasoning does not explain why these liquids form
glasses in the bulk, since many nucleation catalysts are present, in contrast to
the droplets. It may be that these catalysts are ineffective because of the
complex shapes of the organic molecules. Further work is needed to establish
with certainty the reason for glass formation in these liquids.
GLASS FORMATION IN OXIDES
The most important commercial glasses are based on oxides, as described in
the preceding chapter and listed in Table 1. Zachariasen s8 considered the
relative glass-forming ability of oxides and concluded that the ultimate condi-
tion for glass formation is that a substance can form extended three-dimen-
sional networks lacking periodicity with an energy content comparable with
GLASS FORMATION IN OXIDES 21
that of the corresponding crystal network. From this condition, he derived four
rules for oxide structure that allow one to choose those oxides that tend to
form glasses. These rules were remarkably successful in predicting new glass-
forming oxides as well as including such oxides known at the time of their
formulation. The rules are the following:
1. An oxygen atom is linked to not more than two glass-forming atoms.
2. The coordination number of the glass-forming atoms is small.
3. The oxygen polyhedra share corners with each other, not edges or faces.
4. The polyhedra are linked in a three-dimensional network.
Oxides AzO or AO, where A is a metal atom, do not satisfy the rules. Oxides
A 2 03 satisfy rules 1, 3, and 4 if the oxygen atoms form triangles around each
A atom, and A0 2 or AzOs satisfy these rules if the oxygen atoms form
tetrahedra around each A. Higher coordination is apparently excluded by rule
2. From these considerations, Zachariasen concluded that the following oxides
should be glass formers: B 2 0 3 , Si0 2 , Ge0 2 , PzOs, As 2 0 s , P Z 0 3 , As 2 0 3 ,
Sb 2 0 3 , V zOs, SbzOs, Nb 2 0 s , and Ta 2 0 s ' At the time of Zachariasen's
research, only B 2 0 3 , Si0 2 , GeO z , PiOs, AszOs, and As z 0 3 had been made
into glasses, but since then glasses of several other oxides in his list have been
prepared, as shown in Table 1. Oxides not listed either have not been made
into glasses, or in a few cases are made as glasses only with difficulty.
Thus Zachariasen's rules are quite accurate in predicting glass formation,
and it is interesting to question their relationship to the criteria for glass
formation involving crystallization rates. The requirement that the oxide form
a three-dimensional network means that viscous flow is relatively difficult
because it requires breaking-of primary chemical bonds. In fact, Sun S9 has
shown that the glass-forming tendency of an oxide is directly related to the
strength of the bonds between its oxygen and metal atoms. Glass formers have
bond strengths above about 80 kcal/mole, and modifying ions that are not part
of the oxide network have oxygen-metal bond strengths below tliis value. The
requirement that the energy of the glass and crystal be close means that the
heat of fusion for a glass former is less than that for other chemically similar
materials. A lower heat of fusion in Eqs. 1 and 2 leads to lower rates of
nucleation and crystallization; therefore for similar materials this factor may be
of some significance in predicting the tendency to glass formation. However, it
is much less important than factors influencing the viscosity of the liquid.
Other correlations of glass-forming tendency of oxides have been made.
Stanworth 60 has suggested the following criteria:
1. the cation valence must be three or greater.
2. The tendency to glass formation increases with decreasing cation size.
3. The electronegativity should be between about 1.5 and 2.1 on Pauling's
scale
22 GLASS FORMATION
Using these criteria Stanworth finds four groups of oxides: the strong glass
formers, Si, Ge, As, P, and B; "intermediate" glass formers which form glasses
only with "splat" cooling, 61 Sb, V, W, Mo, and Te; other oxides that do not
form glasses on rapid cooling, but do form them on oxidized surfaces of their
metals or in binary combination with nonglass-forming oxides, AI, Ga, Ti, Ta,
Nb, and Bi; and other oxides that do not form glasses. The second category
includes most of the "conditional" glass-forming oxides in Table 1. Some
oxides do not fit into this scheme, such as tin and chromium.
Poulain 62 has suggested that glass formation in ionic systems occurs when
a cation stabilizes the anion lattice, even if the field strength of the cation is
not high. Thus in the zirconium fluoride glasses, zirconium ions stabilize the
fluoride lattice.
GLASS FORMATION AND MATERIAL PROPERTIES
Uhlmann and Yinnon 52 have summarized the relationship between liquid
properties and the tendency to glass formation. The factors that favor glass
formation are:
1. High viscosity at the nose of the TTT curve, since low transport rates
lead to low rates of nucleation and crystallization;
2. Absence of heterogeneous nucleation sites;
3. A large crystal-liquid interfacial energy, which reduces the nucleation
rate; .
4. In multicomponent systems, a large concentration change between liquid
and crystal.
In these multicomponent systems, it is often found that glass formation is
favored by a "deep eutectic", because liquid compositions in low-temperature
eutectics have higher viscosities and therefore lower nucleation and crystalliza-
tion rates than at higher temperatures.
A low entropy of fusion also favors glass formation, as described above for
oxides.
REFERENCES
1. H. Rawson, Inorganic Glass-Forming Systems, Academic Press, London, 1967.
2. R. Frerichs, J. Opt. Soc. Am., 43, 1153 (1953).
3. R. C. Ellis, Inorg. Chem., 2, 22 (1963).
4. A. Winter, J. Am. Ceram. Soc., 40, 54 (1957).
5. T. Sato Y. Koike, T. Endo and M. Shimada., J. Mater. Sci., 26, 510 (1991).
6. G. Tammann, The States of Aggregation, Van Nostrand, New York, 1925, p. 233.
REFERENCES 23
7. A. Stock and K. Thiel, Research, 38, 2719 (1905).
8. Z. Zhang and 1. H. Kennedy, Solid State Ionics, 38, 218 (1990).
9. H. 1. deNordwall and L. A. K. Stavely, J. Chern. Soc., 224 (1954).
10. A. Weiss and A. Weiss, Z. Naturforsch., 8b, 104 (1953).
11. P. L. Robinson and W. E. Scott, Z. Anorg. AUg. Chem., 210, 57 (1933).
12. K. H. Sun, Glass Ind., 27, 522, 580 (1946).
13. D. Turnbull and M. H. Cohen, in Modern Aspects of the Vitreous State, Vol. 1,1.
D. Mackenzie, Ed., Butterworths, London, 1960, p. 54.
14. Gan Fuxi, J. Noncryst. Solids, 123, 385 (1990).
15. E. Thile, C. Wiecker, and W. Wi ecker, Silikattech, 15, 109 (1964).
16. M. G. Drexhage, in Treatise on Materials Science and Technology., Vol. 26, M.
Tomozawa and R. H. Doremus, Eds., Academic Press, San Diego, 1985, p. 151.
17. T. Komatsu, H. Ur, and R. H. Doremus, J. Noncryst. Solids, 69, 309 (1985).
17a. H. W. Sun, B. Tanguy, 1.-M. Reau, 1. 1. Videau, and 1. Portier, J. Noncryst. Solids,
99,222 (1988).
17b. M. D. Ingram, G. G. Lewis, and J. A. Duffy, J. Phys. Chem., 76, 1035 (1972).
18. R. K. Datta, D. M. Roy, S. P. Faile, and O. F. Tuttle, J. Am. Ceram. Soc., 47, 153
(1964).
19. P. C. Hiemenz, Polymer Chemistry, Marcel Dekker, New York, 1984, Ch. 4.
20. G. E. Vuilland, Ann. Chim., 2, 233 (1957).
21. C. A. Angell and E. 1. Sayre, J. Chem. Phys., 52, 1058 (1970).
21a. P. Duwez, Trans. ASM, 60,605 (1970).
22. P. Duwez and C. C. Tsuei, J. Noncryst. Solids, 2, 82 (1970).
23. M. H. Brodsky, J. Vac. Sci. Technol., 8, 125 (1971).
24. C. Feldman and K. Moorjanim, J. Noncryst. Solids, 2, 82 (1970).
25. L. Young, Anodic Oxide Fi/ms, Academic Press, New York, 1961, p. 171,212.
26. H. Endo, Ed., J. Noncryst. Solids, 117-118 (1990).
27. A. Hallbrucker, E. Mayer, and G. P. Johari, Phi/os. Mag., 6OB, 179 (1989).
28.1. Yannas, Science, 160, 298 (1968).
29. R. S. Allgaier, J. Vac. Sci. Technol., 8, 113 (1971).
30. R. P. Ferrier and D. 1. Herrell, J. Noncryst. Solids, 4, 338 (1970).
31. A. S. Nowich and S. R. Mader, IBM J. Res. Dev., 9, 358 (1965).
32. R. Hilsch, in Noncrystalline Solids, V. D. Frechette, Ed., Wiley, New York, 1960, p.
348.
33. C. A. Angell, J. Phys. Chem., 70, 2793 (1966).
34. D. Turnbull, Contemp. Phys., 10,473 (1969).
35. F. E. Wagstaff, J. Am. Ceram. Soc., 52, 650 (1969).
36. G. Urbain, Y. Bottinga, and P. Richet, Geochem. Cosmochim. Acta, 46, 1061 (1982).
37. P. 1. Verga no and D. R. Uhlmann, Phys. Chem. Glasses, 11, 30 (1970).
38. E. J. Fontana and W. A. Plummer, Phys. Chem. Glasses, 7, 139 (1966).
39. R. L. Cormia, 1. D. Mackenzie, and D. Turnbull, J. Appl. Phys., 34, 2239 (1963).
40. Ibid., p. 2245.
41. A. Leontewa, Acta Physicochem., USSR, 16, 97 (1942).
24 GLASS FORMATION
41a. W. D. Scott and 1. A. Pask, J. Am. Ceram. Soc., 44, 181 (1961).
42. G. S. Meiling and D. R. Uhlmann, Phys. Chem. Glasses, 8, 62 (1967).
43. 1. A. Laird and C. G. Bergeron, J. Am. Ceram. Soc., 53, 482 (1970).
44. P. Li, A. C. Shore, and G. Su, J. Am. Ceram. Soc., 45, 86 (1962).
45.1. P. DeLuca, R. 1. Eagan, and C. G. Bergeron, J. Am. Ceram. Soc., 52, 322 (1969).
46. R. 1. Greet, J. Crystal Growth, 1, 195 (1967).
47.1. D. Magi! and D. 1. Plazek, J. Chem. Phys., 46, 3757 (1967); 45, 3038 (1966).
48. M. Volmer and A. Maider, Z. Phys. Chem., 154A, 97 (1931).
49. K. Neumann and G. Micus, Z. Phys. Chem., 2, 25 (1954).
50. M. Takayangi, Mem. Fac. Eng., Kyushu Univ., 16,111 (1957).
51. A. Van Hook, Crystallization, Reinhold, New York, 1961, p. 168.
52. D. R. Uhlmann and H. Yinnon, in Glass: Science and Technology, vol. 1, Academic
Press, San Diego, 1983, p. 1.
53. M. Avrami, J. Chem. Phys., 7,1103 (1939); 8,212 (1940); 9, 177 (1941).
54. D. Cramer, R. Salomau, H. Yinnon, and D. R. Uhlmann, J. Noncryst. Solids, 45,
127 (1981).
55. E. Ruckenstein and S. K. Ihm, J. Chem. Soc., Faraday. Trans. 1,73,764 (1976).
56. D. Turnbull and M. H. Cohen, J. Chem. Phys., 29, 1049 (1958).
57. D. 1. Denney, J. Chem. Phys., 30, 159 (1959).
58. W. H. Zachariasen, J. Am. Ceram. Soc., 54, 3841 (1932).
59. K. H. Sun, J. Am. Ceram. Soc., 30, 277 (1947).
60. J. E. Stanworth, J. Am. Ceram. Soc., 54, 61 (1971).
61. P. T. Sarjeant and R. Roy, J. Am. Ceram. Soc., SO, 500, 503 (1967).
62. M. Poulain, Nature, 293, 279 (1981).
CHAPTER 3
STRUCTURE
The first section of this chapter is a discussion of the variation of glass structure
as one goes from a central atom to successive ranges of surrounding atoms.
Then some of the experimental techniques for probing glass structure are
described, and finally a number of specific systems are discussed. Emphasis is
on the silicate systems because of their practical importance.
RANGES OF STRUCTURAL ORDER
In Chapter 1, a glass was defined as an amorphous solid, an amorphous
material being one with no long-range order but possibly with short range
order. Some authors prefer to define a glass more narrowly as an amorphous
solid that shows a glass transition. 1 The glass transition and the latter
definition are discussed in Chapter 7. Here glass and amorphous solid are used
synonymously. .
In recent structural work on glasses, at least four ranges of structural
arrangement are recognized, 2 as shown in Table 1. This scheme has been taken
mainly from Ref. 2.
The first range is a central atom and its immediate neighboring atoms; for
example, in silicates, silicon is the central atom and four oxygen atoms are its
nearest neighbors, forming the corners of a tetrahedron. These tetrahedra have
uniform bond angles and distances, and are the universal building blocks of
silicates, both crystalline and amorphous. The first task in understanding the
structure of a glass is to determine the coordination of the predominant
glass-forming elements in the glass. In many glasses there is still debate about
25
26 STRUCTURE
TABLE 1 Ranges of Order for Amorphous Solids
Range Name Features
Basic building block Central atom and its nearest
Short range order neighbors
II Interconnections of adjacent Packing of I units around central
units unit
III Intermediate Ordered arrangements several
atom distances from a
central atom
IV Long range Density and composition
fluctuations
Examples Characterization Parameters
SiO. tetrahedron Coordination number
ZrFs coordination polyhedron Bond length
Bond angles
II Packing of SiO. tetrahedra, Connection mode
rings of atoms Connectivity
Angles between structural units
Ring constituents and
dimensions
III Ordered arrangements of Small clusters of structural units
modifier ions (alkalis, Planes and chains and their
alkaline earths) in silicates dimensions
IV Incipient phase separation Size and composition of
and crystalIization fluctuations
these coordination numbers; for example, proposed structures of zirconium
fluoride glasses include six, seven, eight and mixtures of fluoride ions around
a central zirconium ion. Coordination of modifying ions such as alkalis and
alkaline earths in silicate glasses is beginning to be explored 3 - 6.
The next range of structural order is the organization of structural groups
around the central one, in the silicates the bonding and packing of tetrahedral
units around a central one, as shown in Fig. 1. This structural range also
includes formation of units such as rings of atoms formed by linking adjacent
tetrahedra, as shown in Fig. 2. This range includes the method of connecting
or sharing bonds in structural units, such as corner sharing or single atom.
links, edge sharing (two linking atoms between units) and more (arely face
sharing. In molecular glasses such as organics (glycerol, salol and toluene) and
p 4SeS' 7 there are no strong atomic bonds between molecules. There can be
considerable disorder in this range, for example in a distribution of Si-Q-Si
RANGES OF STRUCTURAL ORDER 27
Fig. 1 The crystal structure of high cristobalite, showing the organization of tetrahed-
ral units of silicon (black dots) and oxygen (0). Reprinted from Ref. 6a with permission
from Elsevier.
angles in a three-dimensional silicate network and between structural units of
different size, shape and composition in multicomponent glasses. Long-range
order, meaning order over many (for example 20 or more) atoms apart, does
not exist in glasses except in the form of density and composition fluctuations.
However, there is evidence for some order in between long and short range,
called intermediate range order. This type of order is exemplified by short
Fig. 2 A schematic diagram of vitreous silica, showing silica tetrahedra linked at
comers to form a random network with rings and cages. Reprinted from Ref. 6a with
permission from Elsevier.
28 STRUCTURE
planes or chains of modifying atoms such as alkali or alkaline earth ions in a
multicomponent silicate glass. 3 ,4,8
EXPERIMENTAL METHODS
A wide variety of experimental methods have been used to explore glass
structure, but only a few have proved to be of dominating importance. These
are described briefly, and other methods are Jisted with references. In my view
the most important methods are X-ray and neutron diffraction 16 and infrared
and Raman spectroscopy; more specialized and of increasing significance are
nuclear magnetic resonance (NMR) and soft X-ray spectroscopy (EXAFS) or
extended X-ray absorption fine structure.
X-Ray diffraction was the first technique that produced detailed insight into
glass structure, as pioneered by Warren,9 and remains a highly valuable tool.
The usual X-ray diffraction pattern from a glass is a broad peak with
undulations at high angles. Detailed mathematical analysis of this pattern in
terms of pair distribution functions leads to information on distances between
atom pairs, both like and unlike, as shown in Fig. 3. The measured pair
distribution function can be compared to distribution functions calculated
from models of the glass structure, and the best fit adopted. In all methods of
exploring glass structure, this procedure of choosing a model and comparing
it to experimental results is followed. The obvious pitfall is that more than one
model can be consistent with the measurements; then additional measurements
4000
c
.2 3000
U
C
6
.,
8
2000
:E
III
i5
...
'0 1000
!l.
o
:5 4
o
Interotomic Distances, A
Fig. 3 The pair distribution function for fused silica, measured by Mozzi and
Warren. 30 A is the measured curve, B is the sum of the calculated curves for the first
six contributions: Si-O, 0-0, Si-Si, Si-2nd 0, G-2nd 0, and Si-2nd, C is the difference
between A and B.
COMPUTER SIMULATION 29
must be invoked. This ambiguity is one reason for past and continuing debates
about glass structure.
Neutron diffraction gives the same information on a pair distribution
function as X-ray diffraction, and it has several advantages. The intensity of
neutron diffraction varies irregularly with atomic number, so atoms close in the
periodic table can have quite different intensities, allowing for better definition
of atom-atom distances. Neutrons are also highly penetrating. The disadvan-
tage of neutron diffraction is that a suitable source of neutrons requires a
nuclear reactor, and only a few such sources are available.
Infrared and Raman spectroscopies give absorption spectra characteristic of
motions of atom-atom bonds, as described more fully in Chapter 17. The
resulting absorption bands are like fingerprints of particular structural ar-
rangements. If the structures of crystalline solids close to the glass composition
are known, their spectra can be compared to that of a glass, and the best fit
helps to elucidate range I structure and sometimes range II structure.
In nuclear magnetic resonance (NMR), a sample is placed in a magnetic
field and radio-frequency electromagnetic radiation is applied. Particular nuclei
absorb this radiation at resonance frequencies, which are modified by neigh-
boring atoms. The boron-II atomic nucleus shows strong quadropole coupling
with a broad resonance line when it is in triangular coordination, whereas in
tetrahedral coordination, the coupling is weak with a narrow resonance. These
differences allowed Bray and co-workers to determine the fraction of three-and
four-coordinated boron atoms in borate glasses. 10 ,ll More recently, pulsed
NMR spectrometers that use "magic angle spinning" have allowed exploration
of coordination numbers and angular distributions in a variety of glasses. 12 -14
Improvements in soft X-ray spectrometers have led to availability of a wide
range of X-ray wavelengths, up to 20 A, that allow studies of the light atoms
in silicate glasses. 8 ,19 Pair distribution functions of like atoms of low atomic
number can be isolated and studied without the interference of scattering from
other like and unlike atom pairs. Synchrotron radiation provides an intense
and versatile source of soft X-rays, but requires special facilities available only
at a few sites. Laboratory-scale sources are also possible.B These EXAFS
techniques should prove to be particularly valuable for studies of modifying
ions in oxides and amorphous alloys. 5
Other techniques that are being applied to studies of glass structure are
fluorescence line narrowing, 1 7 - 19e1ectron spin resonance,20.21 and Mossbauer
spectroscopy.22,221
COMPUTER SIMULATION
Computer calculations provide a useful complement to experimental measure-
ments of glass structureP These simulations provide positions of all atomic
species in three dimensions directly from the calculations, exposing the assump-
tions involved in the modeling. The models can be modified with respect to
30 STRUCTURE
factors such as bond lengths and angles and compositions to see the influence
of these factors on structure. The most critical assumption in the calculation is
the form of the interatomic potential; good agreement between calculations
and experimental measurements suggest that realistic potentials have been
used. More realistic directional potentials have been explored,24,25 as well as
potentials derived from quantum mechanics. 26
These simulations assume that the glass structure can be approximated with
a number of atoms small (hundreds to a few thousand) compared to bulk
samples. Interatomic potentials are imposed along with periodic boundary
conditions. The atomic configurations are determined by thermodynamic
sampling (Monte Carlo Techniques) or numerically integrating the classical
equations of motion (molecular dynamics techniques).
In spite of the usefulness of these simulations, they contain a number of
hidden assumptions about atomic bonding and organization. The simulations
assume quite local atomic interactions, which may be only partially correct. In
the simulation, the glasses are usually rapidly "quenched" from a very high
temperature to a rigid state. Soules discusses other assumptions. 23 Simulations
can be helpful, but must always be compared to experiment; they are not a
substitute for real materials.
SPECIFIC SYSTEMS
In the remainder of this chapter, the results of structural studies on a variety
of special glass systems are summarized. Again emphasis is on silicates.
Vitreous Silica
The simplest of the silicate glasses is vitreous silica (SiO 2)' and the study of its
molecular structure has been fundamental to understanding the structure of
other silicates. This understanding began with Goldschmidt's recognition of the
importance of the tetrahedral arrangement of oxygen ions around silicon ions
in silicates,27 and Zachariasen's postulate of a three-dimensional network
without periodicity, formed by the union of these tetrahedra at their corners. 28
In all crystalline silicates, the coordination number of silicon-to-oxygen ions
is four; therefore the silicon-oxygen tetrahedron is the basic building block for
silicate structures. These tetrahedra can be attached to none, one, two, three,
or four other tetrahedra by silcon-oxygen bonds at their corners, depending on
the concentration of other oxides present. In vitreous silica, each tetrahedron
is attached to four others, giving a three-dimensional network. Zachariasen 28
proposed that this network lacked any symmetry or periodicity, and this
random-network model is generally accepted as the best description of the
structure of fused silica.
The initial X-ray diffraction study of Warren et al. 29 was consistent with the
random-network model, and later work of Mozzi and Warren 30 has confirmed
SPECIFIC SYSTEMS 31
this agreement. There were theoretical and experimental limitations in the early
studies that have been removed in the later work. The strong Compton
scattering at large values of sin 0/)" where 0 is the scattering angle and), the
wavelength of the X-radiation, limited the accuracy of the diffraction results at
these values. The method of fluorescence excitation has largely eliminated this
background scattering, and a new treatment in terms of "pair-distribution"
functions allows the interatomic distances to be calculated directly from the
peak positions on a distribution curve, and the areas under the peaks give the
number of neighboring atoms.
The "pair-function distribution" curve measured by Mozzi and Warren is
shown in Fig. 3. The first peak corresponds to the silicon-oxygen distance of
1.62 A, and the second peak corresponds to an oxygen-oxygen distance of 2.65
A. These distances are close to those found in crystalline silicates. The widths
of these peaks are consistent with a tetrahedral distribution of oxygen atoms
around each silicon atom, as shown by the calculated peaks in the figure. The
third peak corresponds to the silicon-silicon distance of 3.12 A, and is
much broader than the other two peaks because of the distribution in silicon-
oxygen-silicon bond angle. The fourth peak, at 4.15 A, is the silicon-second
oxygen contribution, and the fifth peak, at about 5.1 A, is a combination of the
oxygen-second oxygen and silicon-second silicon peaks. A sixth peak, at about
6.4 A, could result from the silicon-third oxygen contribution. No more peaks
would be expected from a random network, and none were found experimen-
tally.
The shapes of the third, fourth, and fifth peaks were fitted by assuming a
distribution in the silicon-oxygen-silicon bond angle, as shown in Fig. 4. The
maximum of the distribution curve is at 144°, with a maximum angle of 180°
and a minimum angle of 120°. Almost all the angles are within ::t 10% of the.
maximum. Although this distribution of bond angles is wide enough to
distinguish the structure clearly from a crystalline arrangement, it is rather
narrow compared to a completely random distribution of bond angles from 90
to 180°. Thus the structure of vitreous silica is quite uniform at a short range,
although there is no order beyond several layers of tetrahedra.
Histograms calculated from physical models of the structure of vitreous
silica, based on a random network and constructed in various ways, 31 - 34 agree
well with the experimental results of Warren et al. and Mozzi and Warren. 30
Various properties of vitreous silica calculated from the random-network
model are also in accord with experimental results. For example, the spectrum
of atomic vibrations as measured 35 ,36 by infrared absorption, Raman emission,
and inelastic neutron scattering is consistent with the random-network
model 37 and shows that, at most, only a small amount of crystalline material
could be present in completely melted vitreous silica.
Some alternate models for the structure of vitreous silica have been
advocated in which there are regions of order alternating with connecting
regions of disorder. These crystallite models,38,39 where very small crystalline
regions are connected by disordered material, were examined by Warren and
32 STRUCTURE
1.0
2 0 . 6
>
0.8
0.4
130 140 ISO 160 170
Ol
Fig. 4 The distribution ,of silicon-oxygen-silicon angles in fused silica assumed by
Mozzi and Warren. 30 The function V(x) is the fraction of bonds with angles IX
normalized to the most probable angle.
Briscoe. 4o They showed that the breadth of the first diffraction peak in vitreous
silica required a crystallite size of no larger than 8 A. At this size, the term
crystal loses any meaning. Furthermore, vitreous silica showed little low-angle
scattering of X-rays; any appreciable amount of fine nonuniformities would
lead to such scattering.
More recent and highly refined neutron diffraction studies of vitreous silica
are consistent with the random network model of Warren. 41 There is perhaps
some question about the exact distribution of silicon-oxygen-silicon angles
(Fig. 4) because the experimental results are not sensitively dependent on this
distribution. Nevertheless the random network model has withstood the test of
intensive scrutiny, and in my opinion is still the best description of silica
structure.
A careful study of thin slivers of different vitreous silicas by transmission in
the electron microscope reveals no structure down to a resolution of about 20
A.42 In dark-field electron microscopy coherently scattering regions 10-20 A
in size were revealed in thin films of silica, silicon, germanium, and germanium-
tellurium alloys.43 The authors concluded that their results were in better
agreement with the random network model than with a microcrystalline
model.
In a discussion of high resolution electron micrographs by Zarzycki,44 he
concludes that, for a variety of glasses, these micrographs are consistent with
"completely disordered" structures.
SPECIFIC SYSTEMS 33
The distribution of impurity ions in vitreous silica is not necessarily uniform.
Optical non uniformities are sometimes visible along the boundaries between
regions that were crystalline grains. 45 . 46 Because of the high viscosity of silica
at its melting temperature, these regions are not mixed, even though fusion is
complete. Impurities on the surface of the quartz starting material lead to a
different refractive index. There is also evidence for a nonuniform distribution
of sodium ions in synthetic silica"7 and for chains or open cages of aluminum
ions in vitreous silica. 48
Multlcomponent Silicate Glass
Some ions can substitute for silicon in the silicon-oxygen network, either with
charge-compensating ions (aluminum and phosporous) or without them (ger-
manium). The substitution of boron into the silicon-oxygen network with low
alkali concentrations is difficult or impossible because of the three-coordinated
planar structure of boron-oxygen (described below). Some evidence for this
difficulty is given by the finding of Hair and Chapman that borate groups are
not found in the silica phase of a phase-separated sodium borosilicate glass. 49
When an alkali or alkaline earth oxide reacts with silica to form a glass, the
silicon-oxygen network is broken up by the alkali or alkaline earth ions, as
evidenced by the much lower viscosity of these glasses compared to fus.ed silica.
As long as the number of A 2 0 or AO units, A being the metallic ion, is in
less than a one-to-one ratio to the number of Si0 2 units, the silicon-oxygen
network is preserved because each silicon-oxygen tetrahedron is linked to at
least three other tetrahedra, and the glass-forming tendency of the mixture is
retained. The backbone network of the glass is preserved, and probably is
similar to the random network of fused silica. Thus the results of Warren and
Biscoe 50 in an X-ray diffraction study of five different sodium silicate glasses
were consistent with a random network of silicon-oxygen tetrahedra in which
some oxygen ions were bonded to one silicon ion and some to two. They also
were able to rule out the existence of discrete molecules such as Si0 2 . Na 2 0,
Na 2 0 . 2Si0 2 , and Na 2 0 . Si0 2 .
However, the distribution of alkali or alkaline earth ions in these glasses is
uncertain. There is convincing evidence from X-ray diffraction studies that
these ions are not uniformly distributed throughout the glass, but that their
a verage separation is considerably less than for a uniform distribution. 51 - 54
Whereas there is a possibility of phase separation in some of these glasses, the
nonuniform distribution seems to exist even when phase separation is not
present. 54 This "clustering" of ions is. perhaps not so surprising in view of the
structure of the alkali disilicates, for example, lithium disilicate as shown in Fig.
5, after Liebau. 55 In these crystals there are layers of silicon-oxygen tetrahedra
bonded together by the alkali ions, and the alkali ion distances in the layers
are considerably less than if the ions had been uniformly distributed through-
out the crystal. Thus in the alkali silicate glasses, one might expect a tendency
for sheets of Si-O-A layers to form with a shorter than uniform A-A ion
34 STRUCTURE
.
.
.
'
I
I
I
. I .
I
I
I
. I .
I
I
I
...,
Fig. 5 Structure of crystalline lithium disilicate. ss Small black triangles are lithium
ions, and tetrahedra represent silicon oxygen groups. The projections of two unit cells
are shown.
distance. Milberg and Peters 54 proposed a somewhat similar model of clusters
of Si-O- TI groups to explain their results on thallium silicate glasses, and
Domenici and Pozza 56 suggested that lithium silicate glasses have short range
order similar to that in crystalline lithium disilicate. These models still retain
the random-network structure at longer distances.
The above discussion of the structure of multicomponent silicate glasses was
taken verbatim from the first edition of this book. It shows that intermediate
range structure in these glasses was recognized and examined many years ago.
From some recent publicity about the "discovery" of intermediate structure in
silicate glasses, one might conclude that it had not been recognized before.
A detailed neutron diffraction stud y 3 of the glass 48 mol% CaO, 49%Si0 2 ,
3% Al 2 0 3 led to a model of planar units at the intermediate structural range
(up to 1 nm or more). The structural units in planes were considered to be
close-packed oxygen atoms with calcium ions in octahedral interstices. In
crystalline CaSi0 3 , the calcium ions are six-coordinated to oxygen, and these
octahedra are arranged in planar arrays. A number of other studies of calcium
aluminosilicates were summarized by Himmel et al. 57 These authors studied
glasses of composition CaO' Al 2 0 3 . 4SiO z and CaO' Al 2 0 3 . Si0 3 with X-ray
diffraction and computer simulation, and compared the results with various
crystalline phases of anorthite, CaO' A1 2 0 3 .2Si0 3 . Alternating silicon-oxygen
and aluminum-oxygen tetrahedra-are the building blocks of anorthite, and are
also found in the glasses, with calcium associated with the alumina groups for
charge balancing. In the glasses, the regular alteration of tetrahedra is inter-
SPECIFIC SYSTEMS 35
rupted, and four- and six-membered rings exist. In small regions, there may be
planar layers of tetrahedra. All of these intermediate range structures must be
considered as tentative. Tetrahedral coordination of aluminum in calcium and
magnesium aluminosilicates is confirmed with NMR 58 and infrared and
Raman spectroscopy. 59 Aluminum in aluminosilicate 591 and fluorophos-
phate 59b glasses was found to have three different coordination numbers of
four, five and six by NMR.
The coordination numbers of modifying ions in glasses can often be deduced
from EXAFS studies. In a variety of sodium silicate glasses, the coordination
number of sodium with oxygen was found to be about five. 8 In crystalline
alkali disilicates, the coordination number of the alkali ions with oxygen is
four,55 although the alkali ion is closely associated with one negatively charged
oxygen ion. For many purposes, it may be best to consider the alkali ion
coordinated with the one oxygen ion, for example when examining models for
ionic transport and exchange, as discussed in Chapters 14 and 15. Further-
more, the infrared spectra of silcate glasses containing hydroxyl groups show
the typical-OH absorption band, indicating that the hydrogen ions are closely
bound to one oxygen ion.
As more alkali or alkaline earth oxide is added beyond the one-to-two ratio,
the network becomes more and more disrupted as some tetrahedra are bonded
to only two other tetrahedra. Glass formation becomes progressively more
difficult because the rates of nucleation and crystallization in the glass become
much more rapid as alkali or alkaline earth oxide is added. In the com-
position range between disilicate (A 20' 2Si0 2 or AO' 2Si0 2 ) and metasilicate
(A 20' Si0 2 or AO' Si0 2 ) chainlike structures should exist, although direct
evidence for them is lacking. At alkali concentrations above the metasilicate,
isolated islands and rings, as well as chains, of silicon-oxygen tetrahedra should
be the major structural features, although the evidence for them is indirect,
coming from the studies of the melt. 60
Optical absorption spectra are valuable in determining the coordination
number and configuration of higher valent ions such as those of the transition
metals, which is discussed in detail in Chapter 17. In general these studies show
that the immediate surroundings of these ions in a silicate glass are much like
the surroundings in a corresponding crystal, or even in a solution with
complexed ions. This finding is consistent with the picture of glass structure in
which the short-range environment is quite regular, and the random charac-
teristic of the glassy state occurs only over dimensions of several structural
units.
Borate Glasses
Borate glasses are of little commercial importance because they react with
atmospheric water and degrade. These glasses are of interest, however, because
their structure and properties are quite different from the silicates, and boric
oxide is used extensively in borosilicate glasses.
36 STRUCTURE
In crystalline oxides, boron occurs either in triangular coordination with
three oxygen atoms or in tetrahedral coordination. Goubeau and Keller 61
suggested that boroxol groups in B 2 0 3 glass explain the sharp Raman line at
808 em -1. Krogh-Moe 62 deduced from nuclear magnetic resonance, infrared
and Raman spectra, and other physical properties that the boroxyl group is an
important element in the structure of vitreous B 2 0 3 . This group is a planar
ring containing six members, alternatively boron and oxygen atoms. These
rings are linked together in a three-dimensional network by boron-oxygen-
boron bonds, as shown in Fig. 6.
The importance of the boroxol groups was confirmed by Mozzi and
Warren 63 in an X-ray diffraction study, using the same fluorescence excitation
method as for vitreous silica. In this study, the experimental "pair-distribution"
curve showed peaks that could be assigned to different atom-atom distances.
The first indicated a boron-oxygen distance of 1.37 A, which is the same as for
triangular coordination in crystalline borates and less than the value of 1.48 A
for tetrahedral coordination. The second peak gave an oxygen-oxygen distance
of 2.40 A, close to the expected value of 2.37 A. A model of randomly oriented
B0 3 triangular groups was inconsistent with the remaining peaks. The pres-
ence of definite peaks out to a distance of about 6 A required structural units
larger than the B0 3 triangles. A model built up of boroxyl groups, as shown
in Fig. 6, was capable of explaining the data. Within the six-membered rings,
the boron-oxygen-boron bond angle was 120°. The boron-oxygen-boron
bond between rings was assumed to have an angle of 130°, with a random
orientation of the linked rings about this bond. This model of linked rings gave
good agreement with the experimental X-ray curve; somewhat better agree-
ment was possible by assuming that a small part of the B0 3 groups was linked
randomly to the boroxyl groups and was not in rings.
This structure of linked rings is very different from the random network of
Fig. 6 Two boroxyl groups linked by a shared oxygen ., boron; 0, oxygen.
SPECIFIC SYSTEMS 37
silicon-oxygen tetrahedra in vitreous silica. The space around any boroxyl
group is not completely filled by linked neighbouring groups, and there is a
low probability that two atoms near one another, for example, at to-A
separation, are linked by a direct and unbroken path of B-O and.O-B bonds.
Mozzi and Warren suggest that this structural feature may be the reason for
the low viscosity of glassy B 2 0 3 compared to other glass-forming oxides, such
as silica and germania. This structure is also very different from that of any
crystalline form of B 2 0 3 , which may be the reason for the difficulty in
preparing crystalline B 2 0 3 from the glass.
More recent results on the structure of glassy B 2 0 3 are summarized in Refs.
64 and 65; see also Ref. 2. These authors concluded that vitreous B 2 0 3 consists
of a random network of equal numbers of B 3 0 6 boroxyl groups and indepen-
dent B0 3 triangles. A NMR study found a higher proportion of boroxyl
rings. 66 Many multicomponent borates show wide ranges of glass formation.
The changes in the properties of alkali borates as more alkali is added are
quite different from the changes in corresponding alkali silicates; this difference
in borate properties is called the "boron oxide anomaly." The viscosity at
certain temperatures can increase as alkali is added in some composition
ranges, and the activation energy for viscous flow increases as alkali is added.
In sodium borate, the coefficient of thermal expansion decreases as alkali is
added to about 16% Na 2 0. In contrast, the viscosity of the silicates decreases
and the coefficient of thermal expansion increases as alkali is added, as one
would expect from the simple picture of additional alkali breaking up the
silicate network.
It seems likely that these anomalies are at least partially related to the
change of coordination number of the boron with oxygen as alkali is added.
This coordination number can be studied by nuclear magnetic resonance. 67 ,68
The B 11 nucleus shows strong quadruple coupling with a broad resonance line
when it is in triangular coordination, whereas in tetrahedral coordination, the
quadruple coupling is weak, with a narrow resonance. These differences
allowed Bray and O'Keefe to determine the fraction of three- and four-
coordinated boron in these alkali borates, as shown in Fig. 7.
Phosphate Glasses
As with the borate glasses, the phosphate glasses are of little commercial
importance because of their reaction with atmospheric water. However, aque-
ous solutions of these glasses are important because of the com pie xing ability
of the long phosphate chains, and P205 is an important constituent in a
limited number of silicate glasses.
The basic building block in phosphate glasses and crystals is the phosphor-
ous-oxygen tetrahedron. However, in contrast to the four-valent glass formers,
the phosphorous has a double bond to one of its surrounding oxygen atoms
Thus the structure of glassy P 205 is a three-dimensional network of these
phosphorous-oxygen tetrahedra, each tetrahedron being bonded to three
38 STRUCTURE
o,
i O 0
0,4 0
0,3
. 0 0
Z
0,2 0
0,1 0
10 20 30 40 50 60
Mole % alkali modifier
Fig.7 The fraction N 4 of four coordinated boron atoms in alkali borate glasses. 67 .,
Na 2 0; 0, K 2 0; ,Li20; +, Rb 2 0;, Cs 2 0.
rather than four other tetrahedra as in vitreous silica, as confirmed by neutron
diffraction. 2
In metaphosphate glasses with a one-to-one molar ratio of alkali or alkaline
earth oxide to P205 each phosphorous-oxygen tetrahedron is linked to two
other tetrahedra, and one oxygen ion per tetrahedron is associated with a
metal ion. This structure leads to long chains of tetrahedra,69 which are
probably entwined in much the same way as long thin organic molecules are
in polymers.
Other Oxide Glasses
Germania glass is built up of germanium-oxygen tetrahedra in a random
network very much like that of silica glass, according to X-ray and neutron
diffraction studies. 2, 70 This result is expected because of the similarity between
the structure of many germanates and silicates.
Arsenous oxide (As 203) glass has a three-dimensional network structure
made up of corner-sharing As0 3 pyramids. 2 Gallate, aluminate and titanate
glasses were studied with X-ray diffraction, and four-coordinated network
structures for them were deduced. 71 Infrared and Raman spectra of a variety
of simple oxide glasses are discussed in Ref. 72.
Chalcogenlde Glasses
In Chapter 2, chalcogenide glasses were defined as those with any substantial
amount of sulfur, selenium or tellurium. The structure of glasses of elemental
SPECIFIC SYSTEMS 39
sulfur and selenium are discussed first, followed by consideration of a few select
compound and multicomponent glasses.
The many forms of solid and liquid sulfur have been the subject of much
study.73,74 From the melting point of about 114° to 160°C, liquid sulfur is
made up of S8 ring molecules. Above 160°C, the rings break up and form long
chains of average length 10 5 -10 6 sulfur atoms. 75 This structural change leads
to a sharp rise in the viscosity by a factor of about 10 5 . At higher temperatures,
the chains break down, causing a decrease in the viscosity. Glasses can be
formed by quenching the liquid sulfur from above 160°C to below about
- 30°C. These glasses contain the entwined chains of the liquid, with chain
lengths depending on the temperature from which they were quenched. Some
S8 rings also are present in the liquid and glass. Thus the structure of glassy
sulfur is much like that of the metaphosphate glasses and the organic polymers,
except for the presence of the rings. 76
Selenium forms a glass by cooling from above its melting point of 217°C to
room temperature. Again the structure consists of long chains of selenium
atoms. 76 Near the melting point, the average chain length in the liquid is about
10 4 atoms, and decreases as the temperature increases. Thus the structure is
very similar to that of glassy sulfur, the chain length being determined by the
quenching temperature. Some Se 8 rings are also present in the glass and liquid,
but less than in sulfur. Sulfur-selenium glasses are also known, with chains of
randomly arranged sulfur or selenium atoms, similar to organic copolymers,
mixed with S8 and Se 8 rings. 77
Zallen 78 suggested that the structure of vapor deposited arsenic trisulfide
resembles the random packing of nearly spherical molecules (As 2S3); as this
material is heated, it transforms to a continuous random network. The
intermediate structure of this glass presumably contains small regions of
layer-like structure, similar to crystalline As 2 S 3 . Arsenic selenide is similar.
In a detailed discussion of neutron diffraction and Raman spectra of SiSe 2 ,
GeSe 7 , and GeS 2 glasses, Elliott described structural models for these ma-
terials. 79 These glasses have tetrahedral bonding, with rings at intermediate
ranges. Elliott divides the intermediate or medium-range order in the distance
range of 0.5-2 nm from the central atom into three sub-ranges: (1) connections
between coordination polyhedra (corner, edge or face sharing); (2) aggregates
of polyhedra to form rings or clusters; (3) local dimensionality of bonding:
three-dimensional network, two-dimensional layers, chains, and isolated is-
lands. GeSe 2 and SiSe2 glasses are proposed to contain mainly edge-shared
tetrahedra, with some corner sharing and "chain clusters".
Silicon and Germanium
Amorphous silicon and germanium retain the tetrahedral coordination of the
crystalline phases. There is much interest in the structure and properties of
hydrided compounds of these elements; results are collected in Ref. 80.
40 STRUCTURE
Halides
Glasses based on zirconium or hafnium fluorides as glass formers with
additional fluorides as glass modifiers are of special interest because of their
good optical absorption in the infrared to 8 J,lm wavelength. These compounds
are not expected to form glasses from Zacharias en's rules (Chapter 2) because
the zirconium ions are coordinated to many (six to eight) fluoride ions.
Almeida and Mackenzie studied the structure of binary BaZr fluoride glasses
with infrared and Raman spectroscopy81 and concluded that zirconium was
six-coordinated to fluorine. They proposed a glass structure of zigzag chains of
ZrF 6 octahedra, cross-linked with barium ions. Lucas et al. 82 calculated the
radial distribution from X-ray scattering from BaF 2' 2ZrF 4 glass and deduced
a coordination number of 7.5 fluorines to each zirconium, which was confirmed
by a molecular dyamics simulation of the structure. They proposed a bi-
polyhedral structure, with one zirconium ion coordinate to eight fluorines and
the other to seven. Inoue et al. 83 concluded that the best fit to radial
distribution functions of 2BaF 2' 3ZrF 4 and BaF 2' 3ZrF 4 glasses required eight
coordination of fluorine to zirconium. Kawamoto et al. 84 used Raman spec-
troscopy, X-ray scattering and computer simulation to study barium, lead and
strontium zirconium fluoride glasses, and proposed eight-fold coordination of
fluorine to zirconium and a structure of ZrF8 chains. More details of these
models and structures of various barium zirconium fluoride crystals are given
in Ref. 85.
The infrared absorption and Raman spectra of blown and crystallized thin
films of various multicomponent barium-zirconium-fluoride glasses were me as-
ured. 85 From these measurements and the previous ones, we proposed a glass
structure of eight-coordinated zirconium to fluorine units, bonded to other
such units with corner sharing into a three-dimensional network. This structure
is similar to that of p-ZrF 4; the infrared absorption of the glasses and this
crystal were closely similar, whereas the spectra of other crystals, having
structures similar to the others proposed for glasses, were quite different. The
building block of this network structure is an Archimedean-antiprism of a
zirconium ion surrounded by eight fluorine ions, as shown in Fig. 8. Four
fluorines above and below the central zirconium ions are in squares; the
bottom square is rotated 45° with respect to the top one.
The structures of crystalline modifications of beryllium fluoride, BeF 2' are
particularly curious in that they closely resemble those of silica. The structural
unit of these crystals is a beryllium-fluorine tetrahedron with each beryllium
ion coordinated to four fluorine atoms and each fluorine bonded to two
beryllium ions. There are two crystalline forms of BeF 2: a quartz form and a
cristobalite form. The ionic sizes of the beryllium and fluoride ions are almost
the same as those of the silicon and oxygen ions in silica, and the strength of
the beryllium-fluorine bond is high. The four coordination of the beryllium ion
and the bonding of the fluorides to two beryllium ions are quite unusual, in
view of the strongly ionic character of these ions.
SPECIFIC SYSTEMS 41
Fig. 8 Archimedean antiprism structure of zirconium coor-
dinated with eight fluoride ions. Reprinted with kind permission
of the Society of Glass Technology, from ref. 85.
The structure of glassy beryllium fluoride as derived from X-ray diffraction
studies is built up of beryllium-fluoride tetrahedra, 86 - 89 Presumably the
tetrahedra are linked at their corners in the same random-network structure
as vitreous silica.
There is a series of binary glasses of alkali or alkaline earth fluorides mixed
with BeF 2' and by analogy with binary silicates these glasses are expected to
be based on a beryllium-fluoride network, broken up by the modifying metal
cations. The viscosity of BeF 2 above its melting point is quite high and is
reduced by addition of the alkali and alkaline earth fluorides, in analogy with
the silicates.
Zinc chloride also forms a glass, although it is much less stable than the
beryllium chloride glass. Apparently the zinc ions are surrounded by four
chloride ions in tetrahedral coordination, giving a network structure like that
of beryllium fluoride and the silicates,90 although the zinc-chlorine bond is not
as strong as that of beryllium and fluorine. The reason for this structure in zinc
chloride is not clear.
Silicon Oxycarblde Glass
Silicone polymers pyrolyze to amorphous silicon oxycarbides that contain only
silicon, oxygen and carbon. 91 ,92 This glass is stable at very high temperatures;
its viscosity is much higher than that of vitreous silica, and it remains
amorphous to X-rays and transmission electron microscopy (TEM) at
1400°C. 92 ,93 At higher temperatures (1500--1650°C), silicon carbide lines
develop in X-ray diffraction and fine crystalline regions of silicon carbide and
graphite appeared in TEM and electron diffraction,93 as shown in Fig. 9.
X-Ray photoelectron spectroscopy showed that silicon-oxygen bonds in the
glass were similar to those in amorphous and crystalline silicates, and some
silicons were bonded to both oxygen and carbon. 93 Carbon was bonded to
either silicon or carbon; there were no carbon-oxygen bonds in the glass. Thus
infrared spectra showed silicon-oxygen and silicon-carbon vibrations, but
none from carbon-oxygen bonds. Solid-state nuclear magnetic resonance with
"magic angle spinning" showed evidence for four different bonding groups
around silicon.
The structure of silicon oxycarbide glass deduced from these results 93 is a
random network of silicon-oxygen tetrahedra, with some silicons bonded to
42 STRUCTURE
Fig. 9 Transmission electron micrograph of silicon oxycarbide glass hot pressed at
1650°C. The arrows point to SiC grains with 0.25 nm interplanar spacing; the diffraction
pattern shows a corresponding ring. 91 ,93
one or two carbons substituted for oxygen; these carbons are in turn tetrahed-
rally bonded to other silicon atoms. Part of this structure is shown schemati-
cally in Fig. 10. There are very small regions of carbon-carbon bonds only,
which are not bonded to the network. This "free" carbon colors the glass black.
Multicomponent silicon oxycarbide glasses containing magnesium and alumi-
num have been reported. 931 ,b
Organic Polymers
A great variety of organic polymers are known, based on carbon-carbon
bonding. These simplest polymers are linear chains, such as polyethylene:
(i-)
SPECIFIC SYSTEMS 43
Fig. 10 Schematic representation of the
structure of silicon oxycarbide gJass. 91 . 93
The length of the carbon-carbon chain depends on the conditions of prepara-
tion. Many different side groups and branches can be attached to the backbone
chain. Other atoms than carbon, such as oxygen or nitrogen, can also be linked
in the chain, and copolymers with blocks of different molecules in the chain are
possible.
In the melt, the chains are so entangled with one another that translational
motion of the entire molecule is impossible, and thermal energy is manifested
as Brownian motion of free segments of the chain. Different chains can be held
together by Van der Waals forces at points or limited regions. If the melt is
cooled rapidly the chains do not orient with respect to one another even
partially, and a rigid glass results. However,. with slower cooling small
crystalline regions form, consisting of several chains precisely oriented. Thus
most solid polymers consist of a mixture of very small crystalline regions in a
matrix of entangled chains.
The chains can be tied together into a three-dimensional network if
substituents on the side chains react and form covalent bonds. This
cross-linking leads to substantial changes in the properties of the polymer, such
as increasing the viscosity and softening temperature. A simple chain-like
polymer is called thermoplastic because it softens as it is heated. A thermoset-
ting polymer becomes more rigid as it is heated because of the formation of
cross-links resulting from chemical reactions at the higher temperature.
Rubbers are cross-linked polymers that can be deformed elastically by large
amounts. When a rubber is cooled sufficiently, it becomes a glass.
For those readers who wish more information on organic polymers than is
contained in this brief sketch, a short bibliography is provided as a starting
point. 94 . 95 There are also many glassy polymers composed of combinations of
carbon atoms with inorganic atoms. 96
44 STRUCTURE
Organic Liquids
A number of simple organic liquids form glasses, as listed in Chapter 2. Most
of these liquids have asymmetric molecules. The bonding between these
molecules should be weak, so the structure of the glasses probably consists of
a random arrangement of these molecules, essentially a frozen liquid without
much interaction between them. It is possible that some of the molecules have
preferred orientations with respect to one another, giving rise to small
crystal-like regions separated by disordered molecules. These conclusions are
speculative because there has apparently been no direct study of the structure
of these glasses.
Metallic Alloys
A variety of metallic alloys have been prepared as glasses by deposition
techniques,97.98 or rapid cooling of the liquid. 99 Cargill 1 00 examined the X-ray
scattering from electodeposited nickel-phosphorous in the composition range
Ni 3 P to Ni 4 P. He found that the results were inconsistent with the structures
of crystalline Ni 3 P. The radial distribution functions indicated more short-
range order than in liquid noble metals. The results did agree well with the
radial distribution function calculated for Bernal's dense random packing of
hard spheres 101 by Finney,102 and Cargilll00 proposed this packing as a model
for the structure of glassy alloys. Polk 103 extended this model by proposing
that the nonmetallic atoms fill holes in the dense random packing of metallic
atoms. The structure is stabilized by the nonmetallic atoms, which interact
strongly with the metal atoms.
Amorphous films of copper, nickel, gold and silver have been formed by
vapor deposition on a substrate cooled to liquid nitrogen temperature. 104 The
authors concluded that these films also had the structure of dense random
packing of hard spheres, stabilized by gaseous impurities. Other results are
discussed in ref. 105.
REFERENCES
1. S. R. Elliott, Physics of Amorphous Materials, 2nd Edn., Longman, London, 1990.
2. A. C. Wright, R. A. Hulme, D. 1. Grimley, R. N. Sinclair, S. W. Martin, D. L.
Prince, and F. L. Galeener, J. Noncryst. Solids, 129, 213 (1991).
3. P. H. Gaskell, M. C. Eckersly, A. C. Barnes, and P. Chieux, Nature, 350,675 (1991).
4. R. Jeanloz and Q. Williams, Nature, 350, 659 (1991).
5. P. H. Gaskell, 1. M. Parker, and E. A. Davis, Eds., The Structure of Noncrystalline
Materials, Taylor & Francis, London, 1983.
6. 1. Colmenero and A. Alegna, Eds., Basic Features of the Glassy State, World
Scientific, Singapore, 1990.
6a. T. F. Soules, J. Noncryst. Solids, 73, 315 (1985).
REFERENCES 45
7. D. 1. Verrall, L. F. Gladden, and S. R. Elliott, J. Noncryst. Solids, 106, 47 (1988).
8. G. N. Greaves and D. Raoux, in P. H. Gaskell, 1. M. Parker, and E. A. Davis, Eds.,
The Structure of Noncrystalline Materials, Taylor & Francis, London, 1983, p. 55.
9. B. E. Warren, X-Ray Diffraction, Dover, 1969, p. 190.
10. P. 1. Bray and J. G. O'Keefe, Phys. Chem. Glasses, 4, 37 (1963).
11. H. M. Kriz, M. 1. Park, and P. 1. Bray, Phys. Chem. Glasses, 66, 45 (1971).
12. R. F. Pettifer, R. Dupress, 1. Farman, and U. Steinberg, J. Noncryst. Solids, 106,
408 (1988).
13. C. M. Schramm, B. H. W. S. Dejong, and V. E. Parziale, J. Am. Ceram. Soc., 106,
4396 (1984).
14. R. Dupree, D. Holland, M. G. Mortuza, 1. A. Collins, and M. W. G. Lockyer, J.
Noncryst. Solids, 106, 291 (1990).
15. K. Kadone, H. Kageyama, N. Kamijo, and H. Tanaka, J. Noncryst. Solids, 123,
291 (1990).
16. A. C. Wright, J. Noncryst. Solids, 123, 129 (1990).
17. M. Y. Weber and S. A. Brawer, J. Phys., C9, 43, 291 (1982).
18.1. L. Adam, V. Pon on, 1. Lucas, and G. Boulon, J. Noncryst. Solids, 91,191 (1987).
19. S. R. Elliott, J. Noncryst. Solids, 123, 149 (1990).
20. M. Nofz, R. Stosser, and F. G. Wihsmann, J. Noncryst. Solids, 129, 249 (1991).
21. S. R. Elliott, Physics of Amorphous Materials, 2nd Edn., Longman, London, 1990,
p. 284ff.
22. C. R. Kurkjian, J. Noncryst. Solids, 3, 157 (1970).
22a. 1. Jiang, 1. Dezsi, Y. Gonser, and X. Lin, J. Noncryst. Solids, 124, 139 (1990).
23. T. F. Soules, J. Noncryst. Solids, 123,48 (1990).
24. B. P. Feuston and S. H. Garofalini, J. Chem. Phys., 89,5818 (1988).
25. P. Vashista, R. K. Kalia, 1. P. Rino, and I. Ebbsjo, Phys. Rev., 841, 12197 (1990).
26. R. Car and M. Parrinello, Phys. Rev. Lett., 55, 2471 (1985).
27. V. M. Goldschmidt, Skrifter Norske Videnskaps Akad. (Oslo), Mat.-natur., 1(8), 7
(1926).
28. W. H. Zachariasen, J. Am. Chem. Soc., 54, 3841 (1932).
29. B. E. Warren, H. Krutter, and O. Morningstar, J. Am. Ceram, Soc., 19, 202 (1936).
30. R. L. Mozzi and B. E. Warren, J. Appl. Crystallogr., 2, 164 (1969).
31. P. H. Gaskell and 1. D. Tarrant, Phi/os. Mag., 842, 265 (1980).
32. F. Ordway, Science, 143, 800 (1964).
33. D. L. Evans and S. V. King, Nature, 212, 1353 (1966).
34. R. 1. Bell and P. Dean, Nature, 212m 1354 (1966); Phi/os. Mag., 25, 1381 (1972).
35. M. Hass, J. Phys. Chem. Solids, 31, 415 (1970).
36. A. 1. Leadbetter, J. Chem. Phys., 51, 779 (1969).
37. R. 1. Bell and P. Dean, Discuss. Faraday Soc., SO, 55 (1970).
38. E. A. Porai-Koshits, J. Noncryst. Solids, 123, 1 (1990).
39.1. C. Phillips, J. Noncryst. Solids, 34, 153 (1979); 43, 37 (1981).
40. B. E. Warren and 1. Biscoe, J. Am. Ceram. Soc., 21, 49 (1938).
46 STRUCTURE
41. D. 1. Grimley, A. C. Wright, and R. N. Sinclair, J. Noncryst. Solids, 119,49 (1990).
42. A. M. Turkalo, General Electric Research Laboratory, unpublished results.
43. P. Chaudhari, 1. F. Graczyk, and L. R. Herd, Phys. Stat. Sol., SIb, 801 (1972); Phys.
Rev. Lett., 29, 425 (1972).
44. 1. Zarzycki, Les Verres et L'Etat Vitreux, Masson, Paris, 1982, p. 15911'.
45. G. Hetherington and K. H. Jack, J. Am. Ceram. Soc., 49, 651 (1966).
46. R. Bruckner, J. Noncryst. Solids,S, 123 (1970).
47. R. H. Doremus, Phys. Chem. Glasses, 10, 28 (1969).
48. R. H. Doremus, J. Am. Ceram. Soc., 67, C-150 (1984).
49. M. L. Hair and 1. D. Chapman, J. Am. Ceram. Soc., 49, 651 (1966).
50. B. E. Warren and 1. Biscoe, J. Am. Ceram. Soc., 21, 259 (1938).
51. C. Brosset, 7rans. Soc. Glass Tech., 42, 125 (1958); Phys. Chem. Glasses, 4, 99 (1963).
52. S. M. Ohlberg and 1. M. Parsons, in Physics of Noncrystalline Solids, North-
Holland, Amsterdam, 1965, p. 31.
53. S. Urnes, Phys. Chem. Glasses, 10, 69 (1969).
54. M. E. Milberg and C. R. Peters, Phys. Chem. Glasses, 10,46 (1969).
55. F. Liebau, Acta Crystallogr., 14, 389, 395 (1961).
56. M. Domenici and F. Pozza, J. Mater. Set., 5, 746 (1970).
57. B. Himmel, J. Weigelt, T. Gerber, and M. Nofz, J. Noncryst. Solids, 136, 27 (1991).
58. C. 1. Merzbacher, B. L. Sherrill', 1. S. Hartman, and W. B. White, J. Noncryst.
Solids, 124, 27 (1991).
59. C. 1. Merzhacher and W. B. White, J. Noncryst. Solids, 124, 194 (1990).
59a. S. H. Risbud, R. 1. Kirkpatrick, A. P. Tagliavore, and B. Montez, J. Am. Ceram.
Soc., 70, CI0 (1987).
59b.1. P. Fletcher, S. Risbud, and R. 1. Kirkpatrick, J. Mater. Res., 5, 835 (1990).
60. B. O. Mysen, Structure and Properties of Silicate Melts, Elsevier, Amsterdam, 1988.
61. J. Goubeau and H. Keller, Z. Anorg. Allg. Chem., 272,303 (1953).
62.1. Krogh-Moe, Phys. Chem. Glasses, 3, 1 (1962).
63. B. L. Mozzi and B. E. Warren, J. Appl. Crystallogr., 3, 251 (1970).
64. P. A. V. Johnson, A. C. Wright, and R. N. Sinclair, J. Noncryst. Solids, SO, 281
(1982).
65. A. C. Wright, D. 1. Summer, and A. C. Clare, in The Structure of Noncrystalline
Materials, P. H. Gaskell, J. M. Parker, and E. A. Davis, Eds., Taylor & Francis
London, 1983, p. 395.
66. S. 1. Gravina, P. 1. Bray, and G. L. Petersen, J. Noncryst. Solids, 123, 165 (1990).
67. P. 1. Bray and 1. G. O'Keefe, Phys. Chem. Glasses, 4, 37 (1963).
68. H. M. Kriz, M. 1. Parki, and P. 1. Bray, Phys. Chem. Glasses, 12, 45 (1971).
69. G. W. Brady, J. Chem. Phys., 18, 48 (1958).
70. A. 1. Leadbetter and A. C. Wright, J. Noncryst. Solids, 7, 37 (1972).
71. S. Sakka, H. K. Kozuka, K. Fukumi, and F. Miyaji, J. Noncryst. Solids, 123, 176
(1990).
72. F. L. Galeener, J. Noncryst. Solids, 123, 182 (1990).
73. B. Meyer, Chem. Rev., 64, 429 (1964).
REFERENCES 47
74. A. F. Wells, Structural Inorganic Chemistry, Oxford, 1984, p. 700ft'.
75. G. Gee, 7rans. Faraday. Soc., 48, 515 (1952).
76. E. H. Henninger, R. C. Buchert, and L. Heaton, J. Chem. Phys., 46, 586 (1967).
77. A. V. Tobolski, G. D. T. Owen, and A. Eisenberg, J. Colloid Sci., 17, 717 (1962).
78. R. Zallen, The Physics of Amorphous Solids, Wiley, New York, 1983, p. 86ft'.
79. S. R. Elliott, Nature, 354, 445 (1991).
80. G. H. Bauer, W. Fuhs, and L. Ley, Eds., J. Noncryst. Solids, 137-138 (1991).
81. R. M. Almeida and 1. D. Mackenzie, J. Chem. Phys., 74, 5954 (1991).
82.1. Lucas, D. Louer, and C. A. Angell, Mater. Sci. Forum, 6, 449 (1985).
83. H. Inoue, H. Aseqawa, and I. Yasui, Phys. Chem. Glasses, 26, 74 (1985).
84. Y. Kawamoto, F. Sakaguchi, and T. Horisaka, J. Chem. Phys., 83, 2398 (1985).
85. S. -H. Ko and R. H. Doremus, Phys. Chem. Glasses, 32, 196 (1991).
86. B. E. Warren and C. F. Hill, Z. Kristallogr., A89, 481 (1941).
87. 1. Zarzycki, Phys. Chem. Glasses, 12, 97 (1971).
88. A. 1. Leadbetter and A. C. Wright, J. Noncryst. Solids, 7, 156 (1972).
89. A. C. Wright, J. Noncryst. Solids, 123, 129 (1990).
90. B. Brehler, Naturwissenschaften, 46, 554 (1959).
91. G. M. Renlund, Ph. D. Thesis, Rensselaer Polytechnic Institute, 1989.
91a. A. F. Babonneau, K. Thorne, and 1. D. Mackenzie, Chem. Mater., 1, 554 (1989).
91b. H. Zhang and C. G. Patano, J. Am. Ceram. Soc., 73, 958 (1990).
92. G. M. Renlund, S. Prochazka, and R. H. Doremus, J. Mater. Res., 6, 2716 (1991).
93. G. M. Renlund, S. Prochazka, and R. H. Doremus, J. Mater. Res., 6, 2723 (1991).
93a.1. Homeny and S. H. Risbud, Mater. Lett., 3, 432 (1985).
93b. 1. Homeny, G. G. Nelson, and S. H. Risbud, J. Am. Ceram. Soc., 71m 386 (1988).
94. A. Bondi, in Glass: Science and Technology, D. R. Uhlmann and N. 1. Kreidl, Eds.,
Academic Press, San Diego, CA, 1983, p. 339.
95. P. C. Hiemenz, Polymer Chemistry, Marcel Dekker, New York, 1984.
96. F. G. A. Stone and W. A. G. Graham, Inorganic Polymers, Academic Press, New
York, 1962.
97. A. S. Nowick and S. Mader, IBM J. Res. Dev., 9, 358 (1965).
98. B. G. Bagley and D. Turnbull, J. Appl. Phys., 39, 5681 (1968); Acta Met., 18, 857
(1970).
99. P. Duwez, Trans. ASM., 60, 605 (1970).
100. G. S. Cargill, J. Appl. Phys. 41, 2248 (1970).
101. 1. D. Bernal, Proc. Roy. Soc., 280A, 299 (1964).
102. J. L. Finney, Proc. Roy. Soc., 319A, 479, 495 (1970).
103. D. E. Polk. J. Noncryst. Solids, S, 365 (1971).
104. L. B. Davies and P. 1. Grundy, Phys. Stat. Sol., 8a, 189 (1971); J. Noncryst. Solids,
11, 179 (1972).
105. 1. B. VanderSande and R. L. Freed, in Glass: Science and Technology, D. R.
Uhlmann and N. 1. Kreidl, Eds., Academic Press, San Diego, CA, 1983, p. 365.
CHAPTER 4
PHASE SEPARATION
The separation of borosilicate glasses into two liquid pha.ses has long been
recognized 1 and is the basis of the Vycor process for the manufacture of 96%
silica. 2 In this process, a sodium borosilicate glass is heat treated to separate
the two liquid phases. Then the borate-rich phase is leached out with acid,
leaving a honeycomb matrix of 96% silica. The channels in this matrix, which
is sometimes called "thirsty glass". are a few hundred Angstroms or so in
diameter, as shown in the electron micrograph in Fig. 1. This matrix sinters to
a clear glass when it is heated to about l000°C. Thus a glass similar to fused
silica is produced without going to the high temperatures (above 1800°C)
required to prepare fused silica.
Phase separation occurs in other commercially important glasses. For
example, certain soda-lime silicate glasses can separate into two liquid phases
after proper heat treatment, 3 as shown in Fig. 2, and Pyrex borosilicate glass
is phase separated on a very fine scale,4 as shown in Fig. 3. Phase separation
can influence properties of glasses. Therefore a glass technologist must be
aware of the possibility of phase separation; it can enhance the properties of
his glasses, changing them adversely. Phase separation in a glass can sometimes
bring about uniform crystallization in glass ceramics, as described in the next
chapter.
Variations in glass composition often affect properties because of enhance-
ment or elimination 'Of phase separation. The addition of alumina to commer-
cial soda-lime glass reduces the t,endency,to phase separation, thus reducing in
turn weathering and devitrification (gross crystallization and consequent lower
strength) of these glasses caused by a matrix phase high in soda.
Phase separation has been studied most intensively in the alkali silicates and
borosilicates, and therefore the discussion deals mostly with these glasses.
48
PHASE SEPARATION 49
\{?:*:
Fig. 1 Phase separation in a sodium borosilicate glass. The sodium borate phase was
etched out with HC!. Transmission electron micrograph. Courtesy of Miss A. Turkalo.
Magnification 26,000.
Fig. 2 Fracture surface of phase-separated glass (13% Na 2 0, 11 % CaO, and 76%
Si0 2 ) after heating for different times at different temperatures. 3
50 PHASE SEPARATION
Fig. 3 Electron transmission photograph
of Pyrex borosilicate glass in which silver
ions have been exchanged for sodium ions
to enhance contrast between the phases. 4
Magnification 240.000.
Phase separation is also important in other glasses, such as the chalcogenides
and beryllium fluorides.
In this chapter, experimental miscibility boundaries (phase diagrams) for
phase separation in important glass systems are discussed first. Then some
theories to explain these equilibrium properties are considered. Kinetic prop-
erties are treated next, with emphasis on nucleation and spinodal decomposi-
tion. An experimental test of nucleation theory for phase separation in a
soda-lime silicate shows the validity of this theory. Finally the influence of
phase separation on glass properties and some practical applications of phase
separation in glasses are described. Reviews of phase separation in glasses are
given in Refs. 5-8.
PHASE DIAGRAMS
Immiscibility in liquid solution is common. Many single-phase mixtures of
organic liquids separate into two liquid phases as they are cooled. Certain
liquid silicate mixtures also separate into two phases; examples of phase
separation in alkaline earth silicates are shown in Fig. 4. The figure shows that
the tendency to separate into two phases becomes greater as the cation
becomes smaller; barium silicate mixtures do not show stable immiscibility.
This correlation with ionic size has been the basis of certain explanations of
phase separation in silicates and is discussed in the next section. In these
explanations, the ratio of ionic charge Z to onic radius r, called the "ionic
potential," is used as a measure of the tendency to phase separation of silicates.
The ratio Z/r is plotted as a function of the width of the equilibrium
immiscibility gap at its base for various binary silicate melts in Fig. 5. The
temperature at the base is close to 1700 c C for all the melts plotted, as shown
in Fig. 4, so the base width should be an approximate measure of the tendency
2200
Liquid
u
0
2000
CI)
...
:J
-
0
...
CI)
a.
E
1800
10
1800
Si0 2
20
Mol. % RO
Fig. 4 Phase diagrams for binary alkaline-earth oxide-silica systems showing miscibil-
ity gaps.9
5 I ,. I I
""Go ""Cr
""Fe
4-- -
""Sc
3- RARE / oM; oNI -
EARTHS/ Zn 0 oFe oCO
... /
.... o Mn
N
2 oCo oCu
-
oSr
1-
I I
40 60
MOLE °/. OXIDE
Fig. S Width of miscibility gap at its base for various binary silicate mixtures as a
function of the charge over ionic radius (Z/r). 0, two-valent ions; !!., three valent ions;
data on phase diagrams from Ref. 9.
00
I
20
eo
100
51
52 PHASE SEPARATION
to phase separation, as suggested by Glasser et al,l° The base widths were
taken from phase diagrams in Ref. 9. If the tendency towards phase separation
were determined by the Z/r ratio, all the points in Fig. 4 would fall on the same
straight line. One could draw a line through the data for the divalent ions of
Ca, Sr, Mn, Co and Ni, and a line from the Sr point to those for trivalent Fe
and Cr does not deviate too much from the points for divalent Ca, Mn, Fe,
Co, and Ni. However, the data for divalent ions Zn, Mg, and Cu do not fit
with those already mentioned, and the trivalent rare earths together with
scandium and gallium appear to form a separate group. Beryllium and lead
silicates apparently show no stable separation possibly because these ions are
tetrahedrally coordinated and act as glass formers at least in some concentra-
tion ranges. Several silicates of four-valent ions show stable two-liquid regions,
but the extent of separation is less than would be expected from the Z/r ratio,
especially for thorium, uranium, and zirconium silicates. Germanium and
phosphorous silicates show no stable phase separation because they substitute
for silicon in the silicon-oxygen network. Vanadium silicate with a high Z/r
ratio shows no phase separation, although the similar niobium silicate separ-
ates into two liquids at 1695°C over most of the binary composition range.
Therefore factors other than the charge and ion size can be quite important in
determining the tendency of a binary silicate to separate into two liquid phases.
In binary alkali silicates there is no stable separation into two liquid phases.
However, these silicates are easily cooled to glasses without crystallization, and
some of them show liquid-liquid phase separation or immiscibility at tempera-
tures below the liquidus temperature of crystallization. This type of phase
separation is often called metastable, because crystalline phases are more stable
than liquid ones at the temperatures of phase separation. The immiscibility
curves for lithium and sodium silicates are shown in Fig. 6. There is some
indication of phase separation in binary potassium silicates,l1,12 bl1t the
immiscibility boundary has apparently not been determined. There is as yet
no evidence for phase separation in binary rubidium and cesium silicates.
The metastable immiscibility boundary for binary barium silicates is shown in
Fig. 4.
Most of the data for these curves were found from the "clearing" tempera-
ture of the glasses, or the temperture above which the opalescent phase-
separated glass becomes optically clear. This method is not entirely reliable,
because the amount of light scattering depends on the size of the particles and
the refractive index difference between the two phases. The light scattering per
unit volume of particles is a maximum at an intermediate particle size. For
particles very much larger or smaller than the wavelength of the incident light,
the scattering is less. Thus if the size of the particles changes, or the refractive
index difference changes as the composition difference between the particles
and matrix changes, the clearing temperature may not always be at the phase
boundary. The phase boundary can be determined most reliably from electron
micrographs of quenched samples, if the quenching is fast enough to preserve
the structure at the quenching temperature. If the composition of one phase is
\100
PHASE DIAGRAMS 53
1000
900
E
L&.i 800
a::
:::I
!ii
a::
700
a
LLI
600
500
400 0 15 20 25 35
',4 ALKALI OXIDE
Fig.6 Phase separation diagrams for lithium7.13.2o and sodium 7 silicates.
known, the volume fractions of the separated phases as measured from the
micrographs 13 can also be used to calculate the phase bbuntlary.
The metastable immiscibility boundaries of some alkali borates 5 . 14 and
borate-rich borate-silicates have been determined; however, there is evidence
that only lithium borate among the binary alkali borates has an observable
metastable miscibility boundary.16 The miscibility boundary of PbO-B 2 0 3 has
been determined. I 7
Burnett and Douglas have made a detailed study of phase separation in the
commercially important ternary system of sodium calcium silicates, 18 which
form the soda-lime glasses. The addition of small amounts of soda to binary
calcium silicates drops the immiscibility region below the liquidus temperature.
No phase separation is observed below about 580°C because diffusional
processes are too slow below this temperature. The maximum temperature of
phase separation (consolute temperature) occurs at about 90mol% Si0 2 for
all ratios of the other components; in fact the consolute temperature in all
alkaline earth and alkali silicates seems to occur at about 90% Si0 2 . The
composition of the silica-rich phase in these glasses becomes almost 100%
silica at temperatures not much below the consolute temperature. t 9
In both the soda-lime-silica 18 and the soda-lithia-silica 20 systems, Douglas
and his co-workers found that the reciprocal of the absolute immiscibility
54 PHASE SEPARATION
temperature was linear with changing composition ratio of the nonsilicate ions,
at constant silica composition. This relationship is probably valid for most
multicomponent silicates. It provides a convenient means for finding immisci-
bility temperatures in complicated systems in which these temperatures for
binary or ternary mixtures are known.
Burnett and Douglas also found that the composition c of the immiscibility
curves for several binary and pseudobinary (ternaries with constant silica)
silicate mixtures was related to the temperature Tby the relation
ICe - C 1cx:(1; - T)"
(1)
where Cc and 1; are the composition and temperature at the critical consolute
point, and n is a number usually between 1/4 and 1/2. Burnett and Douglas
found n about equal to 1/2; theoretical estimates of n are given below.
Burnett and Douglas have also measured the immiscibility curves for the
soda-baria-silica system;21 they are similar to the soda-lime-silica system
except for the lower consolute temperature of the binary baria-silica system.
Another important commercial ternary system is that of sodium borosili-
cates. Results of several studies in this system have been summarized by Haller
et al. 22 ,23 and are shown in Fig. 7. There is some question about results in the
silica-rich corner, and the positions of tielines. 24 As mentioned above, there is
good evidence that silica-rich phases are nearly 100% silica in alkali and
alkaline earth glasses. The results of Hair and Chapman 25 indicate that much
of the boron that remains after leaching phase-separated borosilicate glass is
on the internal surface of the leached glass and not in solution in the silica.
Thus it seems likely that there is little solubility of borate in silicate, as would
be expected from the different structures of these amorphous oxides described
in the last chapter. Therefore, the silica-rich phases in sodium borosilicate
glasses are also probably close to 100% silica.
The effect of small additions of "nucleating agents" such as Ti0 2 and P 205'
on phase separation in sodium and lithium silicates has been studied because
these agents enhance nucleation of crystals in these glasses. James and
McMillan concluded that P 205 had only a small effect on the solubility of
silica in the lithium-rich phase in lithium silicate glasses. Tomozawa 26 found
that the "clearing temperature" of phase-separated sodium silicate glasses was
increased by the addition of P 2 0 5 , decreased slightly by the addition of Ti0 2 ,
and remained unchanged when AIP0 4 was added. He explained the greater
tendency to phase separation of P 2 0 5 over Ti0 2 as a result of the higher ionic
potential (Z/r) of phosphorous than titanium ions, and the lack of an effect
with AIP0 4 by the substitution of AIP0 4 for Si0 2 in the glass network.
Aluminum ion is known to have a strong tendency to reduce phase
separation in silicates. For example, addition of 1.8 mol% Al 2 0 3 to a sodium
borosilicate glass of the consolute composition (in mol%, 70.5 Si0 2 , 27.7 B 2 0 3 ,
6.8 Na 2 0) lowered the consolute temperature 111 °C from 754°C. 27 The reason
for this effect is uncertain.
PHASE DIAGRAMS 55
50
40
30
20
10
Fig. 7 Phase separation in the sodium borosilicate
8 2 0 3 system. 22 Dashed lines are uncertain.
The immiscibility range in alkaline earth silicates and borates is sharply
reduced by the addition of alkali oxides. Shartiss et al. 28 made a detailed study
of this reduction in borates. They showed that the effectiveness of alkali oxides
in reducing phase separation was in the order Cs> K > Na > Li, which is the
same order of decreased tendency to phase separation in the binary alkali
silicates, and corresponds to a reduction in ionic size and increase in ionic field
strength.
Phase separation has been found in several other of the glass-forming
systems discussed in the last two chapters. Various alkali and alkaline earth
fluoride-beryllium fluoride glasses show phase separation. 5 . 29 A variety of
chalcogenide glasses have regions of liquid-liquid immiscibility.30 Some heavy-
metal fluoride glasses show phase separation. 31 . 32
56 PHASE SEPARATION
THEORIES OF IMMISCIBIL TY
Various microscopic theories have been put forward to explain oxide miscibil-
ities for different systems and compositions. In order to understand these
theories, it is first useful to describe some thermodynamic parameters involved
in the development of phase separation. This discussion is also important for
an understanding of the proposed mechanism of spinodal decomposition for
phase separation in glasses described in a later section.
The phase boundary between two liquid phases is related to the Gibbs free
energies of the various possible phases. The free energy of two miscible
components A and B as a function of composition is shown in Fig. 8a. The free
energy of a single-phase mixture is always lower than the sum of the free
energies of any two other phases. As the temperature is lowered, the single
phase separates into two phases, and the free energy diagram has two branches,
as shown in Fig. 8b. The compositions of the two phases in equilibrium
correspond to the tangent points of the common tangent line. The shape of the
free energy curve between the compositions of the equilibrium phases is
uncertain because it is difficult to conduct experiments on the individual phases
in the unstable region; they very quickly transform to the stable state. Two
possible shapes of the free energy curves in the unstable region are shown in
Figs. 8b and c.
Various theories can be used to derive free energy curves of the types shown
in Fig. 8. The simplest is often called the regular solution or nearest neighbor
modep3.34 In this model, each component is assumed to be randomly
distributed and coordinated with a certain fixed number Z of neighbors. In
metallic alloys or mixtures of simple molecules such as organic liquids, the
elementary mixing units are clearly the metal atoms or small molecules.
However, in a network compound such as a silicate, it is often difficult to
identify the mixing units that should be used for theoretical calculations, and
this uncertainty leads to weakness in theoretical descriptions of miscibility in
silicates, as described below.
The molar free energy of mixing, AG"" is the free energy change when pure
components are mixed to the desired composition, per mole of final mixture.
In terms of the enthalpy and entropies of mixing,
AG", = AH", - TAS", (2)
In this model it is assumed that the entropy change is the ideal entropy of
mixing, or
AS", = - R(X A In X A + X B In X B ) (3)
where X A is the mole fraction of component A and X B is the mole fraction of
component" B.
The enthalpy change AH", is assumed to equal the energy change AE"" The
total energy of the mixture is calculated from bond energies of nearest
neighbors. It is also assumed that the bond energies are not a function of
THEORIES OF IMMISCIBILITY 57
a
>-
CoD
It:
\oJ
Z
\oJ
\oJ
\oJ
It:
10..
--
./ ......
/ "
/ .....
b
/"
/ \
/ \
/
/
/
c
A
COMPOSITION
B
Fig. 8 Schematic diagrams of Gibbs free energy as a function of composition. (a)
Complete miscibility; (b) separation into two phases; (c) separation into two phases,
another possible functional dependence.
composition or temperature. In a mixture with A and B molecules, each with
Z nearest neighbors, there are on average ZX... molecules of A and ZX B
molecules of B around any given molecule in the mixture. Then if the total
concentration of molecules in the mixture is c, the number of A-A pairs per
unit volume is ZX c/2, the number of B-B pairs is ZXjc/2, and the number
of A-B pairs is ZX...XBc. If the energy of A-A bonds is - E...,B-B bonds is
58 PHASE SEPARATION
- Es, and A-B bonds is - E AS ' where the Es are positive quantities, then the
total energy E per unit volume of the mixtures is
E - _ ( ZX CEA ZXjcEb ZX E )
- 2 + 2 + AXS C AS
(4)
or
Zc [ ( EA + Es )]
E = -"2 XAE A + XsEB + 2X A X S E AS - 2
The first two terms in the brackets give the energies of pure A and B, so the
energy of mixing is
( EA+Es )
fJ.E", = - ZCXAX B E AS - 2 (5)
If the energy of A-B bonds is greater (more negative) than the energy of
A-A and B-B bonds, then E AS> (E A + E s)/2, and fJ.E", is negative at all
compositions. Under these conditions, the free energy function is as shown in
Fig. 8a for all temperatures, and the two components are completely miscible
at the temperatures where the equations apply. If, however, E AS < (E A + E s )/2,
then there is a tendency for like atoms to segregate, and below a certain
temperature, the mixture separates into two different phases. The free energy
as a function of composition is then given by Fig. 8b.
In applying these simple considerations to immiscibility in silicates there is
uncertainty about the basic units for entropy considerations and about
coordination numbers and bond strengths for energies. Warren and Pincus 35
made the following argument to explain the greater tendency of binary silicates
to show immiscibility as the field strength (Z/r) of the cation increases. There
are two tendencies for bonding in a binary silicate melt: one for the silicon ions
to coordinate four oxygen ions tetrahedrally and the other for the other cation
to surround itself with nonbridging (negatively charged) oxygen ions of the
network. If the field strength of the cation is low its coordination is incomplete,
and a single phase dominated by the silicon-oxygen network results. On the
other hand, if the field strength of a cation is high, it is better able to coordinate
nonbridging oxygens, and these groups then form a separate phase, the other
phase being predominantly silica. Similar arguments were made by Levin and
Block in their extension 36 of the work of Warren and Pincus. In terms of the
nearest-neighbor theory, this point of view allows the coordination numbers of
the different bond types to be different. Thus as the coordination number of
the ion becomes larger in the mixture Z AS can be considered to be larger, and
the energy of mixing becomes positive, leading to phase separation. One can
also consider the larger field strength of the modifier ion as leading to a larger
bond strength E AS ' again favoring phase separation, as suggested by Rawson. 37
Thus the structural arguments of these authors involve the energetic contribu-
tion to the free energy of mixing. Understanding of the lack of phase separation
THEORIES OF IMMISCIBILITY 59
for ions that substitute for the network ions and more detailed calculations of
energies are hampered by the uncertainty about just what units are mixing and
bonding.
Charles 38 rejected the Warren-Pincus explanation of silicate immiscibility,
at least in alkali and alkaline earth silicates, and substituted a description based
on the deformation of the silica chains in the network. He argues that a more
positive value of the energy of mixing fJ.E", as the cation concentration
increases, required for immiscibility, results because of the distortion of the
bridging silicon-oxygen bonds caused by the coulombic forces of the metal
cations and negatively charged oxygen ions. The maximum energy occurs at
some intermediate composition of cation determined by its field strength.
Support for this view depends critically on the choice of the expression for the
entropy of mixing. Charles asserts that the simple use of R 2 0 or RO and Si0 2
groups as the mixing entities is structurally unrealistic. He considered that the
important mixing units are bridging and nonbridging oxygen ions, following a
suggestion of Forland. The expression derived for fJ.S", from this model is
[ X.. 2X b - X.. ]
fJ.S", = - R X.. In 2X s + (2X s - X..) In 2X s
(6)
Whereas this equation seems more reasonable than Eq. 3 for a binary silicate,
there is no direct experimental support for it, so that one must reserve
judgement about Charles' approach until more experimental data on ther-
modynamic properties of silicate mixtures are available.
Charles also calculated the metastable immiscibility boundaries of the
lithium and sodium silicate systems, shown in Fig. 5, from a subregular
solution model. 39 In this model a more complicated equation for fJ.E", is used
than Eq. 5, and the consolute temperature does not necessarily occur at 'the
50% composition (Ref. 34, pp. 196 ff.). Charles derived the activities of the
components from the stable liquidus phase boundary. The consolute tempera-
ture of the immiscibility curve for sodium silicates was accurately predicted by
Charles' treatment, but the predicted width was too small. The consolute
temperature predicted for the lithium silicate system was 200°C too high, and
the width was again too narrow. It seems likely that these discrepancies derive
from the many simplifications implicit in the subregular solution model and
also the uncertainties of deriving thermodynamic data at much lower tempera-
tures from the liquidus phase boundary. McGahay and Tomozawa 4o have
calculated the critical temperatures of a variety of "ionic" systems, including
silicate glasses, organic polyelectrolytes, and exitonic silicon and germanium at
temperatures near absolute zero, from an electrostatic model. They use the
Debye-Hilckel theory, which is valid for dilute aqueous solutions, to determine
the thermodynamic properties of these systems. Their calculated critical
temperatures were in good agreement with all of these systems. They assumed
partial ionization of about 3%.lt is surprising that the Debye-Hilckel theory,
which breaks down for concentrated aqueous solutions, can be used for these
60 PHASE SEPARATION
dense solids. Perhaps the charges in them are highly screened from one
another.
The exponent n of the miscibility line equation (Eq. 1) has been derived from
quite general statistical considerations. 41 One theory results from a three-
dimensional Ising model as deduced from high temperature series, and the
other from renormalization group methods. The former gives n = 0.312, the
latter n = 0.325, and experiments 41 seem to be closer to at 0.325. The value of
0.5 found for a soda-lime glass by Douglas and Burnett was a rough estimate
based on few data. The results on lead borate glasses 17 give a value of n of
about t. The relationship between these statistical theories and the structural
ones described above needs to be explored.
NUCLEATION
The rates of phase separation are important to the development of the
morphologies of the phases and thus in some properties of phase-separated
glasses such as electrical conductivity and chemical durability. In this and the
next two sections various aspects of the kinetics of phase separation in glasses
are considered and related to the morphology of the phase-separated struc-
tures. Also considered are the fundamentals of "classical" nucleation and
growth for understanding kinetics of both phase separation and crystallization.
In the following section, an alternative mechanism for phase separation, that
of spinodal decomposition, is treated. In this discussion nucleation of a crystal
from a pure liquid is first considered and then extended to nucleation of a
second liquid phase or a crystal from a two-component liquid.
When a liquid is cooled below its melting point, small crystalline regions
form by molecular fluctuations. However, the formation of these embryos is
retarded because of the interfacial energy between them and the liquid. As the
size of an embryo increases, its chemical potential decreases until it is less than
that of the liquid, as shown in Fig. 9; then the embryo becomes a growing
crystalline nucleus. The size at which the chemical potential of the embryo
equals that of the liquid is called the critical size. The probability p of formation
of an embryo of radius r is proportional to the exponential of the reversible
work J.v, done on the surroundings by the fluctuation to form the embryo:
p oc exp ( )
where k is Boltzmann's constant and T the absolute temperature. The rate of
formation I of growing crystalline nuclei is proportional to the probability of
forming a critical nucleus, or
1= K ex p (:; )
(7)
:2
&
c
.!.I
E
.! 1J-y
u
NUCLEATION 61
/"\
I \
I \
I \
,
I
,
I
,
,
,
I
W M
Embryo
Fig.9 Schematic drawing of the chemical potential of an embryo of phase B forming
in phase A as a function of embryo size. From Ref. 44.
where W* is the work done in forming the critical nucleus. A variety of
methods of calculating the coefficient K have been suggested;42 -44 the ex-
ponential term is usually predominant, especially in condensed systems. In this
discussion, the dependence of K on composition and temperature is assumed
to be negligible.
The work done in forming a spherical isotropic critical nucleus with
isotropic surface energy')' is 45
4n r* 3 f"p
W* = - 4nr*2')' +
3
_ _ 16n')'3
- 3(f"p)2
(8)
where f"P is the pressure difference between the inside of the nucleus and the
surrounding phase, and the radius of the critical nucleus r* is given by
2')'
r*=-
f"P
For a crystalline nucleus formed from a liquid of the same composition, the
(9)
62 PHASE SEPARATION
pressure difference is equal to the free energy of fusion per unit volume at the
temperature T of nucleation, and is approximately eq ual to
L
p II:; -(T. -T)
vT", '"
(10)
where T", is melting temperature, L is the heat of fusion, and v is the molar
volume of the liquid.
Equation 8 is valid for the homogeneous nucleation of a phase. In actual
practice, nucleation is almost never homogeneous, but takes place on impurity
particles, vessel walls, defects, or some oth r heterogeneity. These heterogenei-
ties effectively lower the interfacial tension y by a factor f < 1, so that
W. = _ 16n(yf) 3 v 2 T;, = _ K 1
3L2(T", - T)2 (T", - T)2
(11)
where K 1 is a coefficient approximately independent of temperature.
In condensed systems, the rate of formation of fluctuations can be limited
by diffusion or viscous flow in the liquid. This transport limitation is particu-
larly important in viscous systems such as glasses. It can be taken into account
by adding a transport factor to Eq. 7 for the rate of nucleus formation. Then
( W. - Q )
1= K 2 exp R T
(12)
where Q is the activation energy for the transport process and K 2 is assumed
independent of temperature. Without the transport limitation there is a very
sharp increase in nucleation rate at some critical temperature below the
melting temperature because of the (T", - T)2 factor in the exponential.
However, with the transport factor there is a maximum in nucleation rate with
decreasing temperature that can be quite broad, depending on the relative size
of the two exponential terms.
Very similar considerations apply to nucleation of a liquid phase from a
homogeneous liquid solution of two components. It is assumed that the
nucleus forms with the equilibrium composition of one liquid phase and grows
by accretion of material from the remaining matrix liquid. The composition of
the nucleation phase, that is, the one forming discrete particles, is the equilib-
rium phase of composition furthest from the overall composition of the liquid.
As an example, consider nucleation in lithium silicate glasses whose equilib-
rium phase-separation diagram is shown in Fig. 6. In a homogeneous glass
containing 26 mol% Li0 2 and 74 mol% Si0 2 the silica-rich phase nucleates in
the lithium-rich matrix below about 800°C because the equilibrium amount of
the silica-rich phase is less than that of the lithium-rich phase. An electron
micrograph of phase separation in this glass after heat treatment at 500°C (Fig.
10) shows silica-rich particles as raised circles because they etch more slowly
in hydrofluoric acid than the lithium-rich matrix.
NUCLEATION 63
Fig. 10 Electron micrograph of phase separation in a 26 mol % Li 2 0, 76% Si0 2 glass
after 16 h at 500°C. Replica of fracture surface etched 5 s in 2% HF. Magnification
22,400.
In nucleation in a two-component system, the driving force AP for nu-
cleation is a function of composition and is not given simply by Eq. 9. The
expression for the driving force is (Ref. 42, p. 250)
AP = G 1 - G m - (c l - c m ) (: )cm (13)
where G 1 is the free energy of the nucleating phase of composition c!, and G m
is the free energy of the matrix of composition C m (normally the bulk composi-
tion). The interfacial energy y can also be a function of composition.
Hammel studied nucleation rates of silica-rich particles in a 13 mol% Na 2 0,
11 mol% CaO, 76 mol% Si0 2 glass in detai1. 46 The number of particles he
measured as a function of time is shown in Fig. 11 for several different
nucleation temperatures. The particles were measured from electron micro-
graphs down to a radius of about 30 A; since the radii of critical nuclei were
in this size range, he apparently measured virtually all of the nucleated
64 PHASE SEPARATION
300
"..- 200
'e
100
..
-Q
)(
(jj
..J 30
U
::>
Z 20
LL
0 10
a:
lJJ
CD
::>
z I.e
1,0
o.eo
particles. Figure 11 shows that a constant rate of nucleation was achieved only
after a period of time; this transient is discussed in more detai1 below. These
constant rates are plotted as a function of nucleation temperature in Fig. 12.
In order to compare his results with the theory for homogeneous nucleation,
Hammel measured the radius r* of the critical nucleus at temperatures just
below the miscibility gap. He made this measurement by holding a sample
containing particles of a certain size in a temperature gradient and observing
the temperature at which they neither grew nor dissolved, this then being the
temperature at which the size was the critical size. If AP is proportional to the
undercooling below the miscibility gap AT, a plot of l/r* against temperature
should be straight line; Hammel found this relationship. Then r* at lower
temperatures can be found by extrapolating the data at higher temperatures.
To calculate the work W* from Eq. 8 and r*, it is necessary to known AP.
Hammel calculated AP from the miscibility curve and various equations; the
equation of Lumsden 47 seemed to give the best fit. As discussed in the last
section, such calculations are rather uncertain. Hammel used the resulting
value of W* and Q = 395 kj/mol as estimated from growth experiments
'1)'3
Id 2
u-
bi
...
.
g 10"
u
;::
'"
!
z
o
5
....
..J
i 10 10
I!>
....
!c
'"
10'
NUCLEATION 65
.
10 590 610 620 630 650
TEMPERATURE, ('C)
Fig. 12 Temperature dependence of the rate of nucleation of amorphous silica-rich
particles in a 13 mol% Na 2 0, 11 % CaO, 76% Si0 2 glass. 0, measured; .1, calculated
by Hamme1. 46
described in the next section, together with a value of K z calculated from an
equation of Turnbu1l 42 , to compute the nucleation rates shown in Fig. 12. The
absolute values of calculated and measured rates are surprisingly close. This
agreement between experimental and calculated nucleation rates, which is
exceptional for nucleation experiments, provides evidence that the nucleation
is homogeneous and supports the theory of nucleation outlined above.
The transient shown in Fig. 11 before reaching constant nucleation rate was
also found by Burnett and Douglas 18 in a study of nucleation in a glass
containing 12.5 mol% NazO, 12.5 mol% CaO, and 75 mol% Si0 2 . These
authors found that nucleation did not occur in their glass until it was at least
27°C below the miscibility temperature of 687°C. They studied nucleation by
holding their glass at some lower temperature and then growing the nucleated
particles at a temperature of 680°C where no more nucleation should occur. In
66 PHASE SEPARATION
the early stages of nucleation before a constant rate of nucleation was achieved,
the number of particles N followed the equation
N = K3 exp ( t ) (14)
so that the nucleation rate is given by
I = K4 exp ( t )
(15)
where K 3 , K 4 , and t are parameters independent of time. Equations of this
form were first derived by Zeldovich and subsequently by many other
authors. 44 ,48 Such a dependence of particle size occurs because the steady-state
distribution of embryo sizes that is assumed in deriving Eq. 7 has not been set
up yet, because of the slow diffusion in the condensed state. The parameter t
is related to the concentration of diffusing species and its diffusion coefficient.
GROWTH
In diffusion control, the rate of growth of a spherical particle of radius R is 49,50
dR D
- = IX-
dt R
(16)
where IX depends only on concentrations, and D is a diffusion coefficient. The
radius grows proportional to the square root of time.
At longer growth times, larger particles grow and smaller particles dissolve
to decrease the total particle surface. This "Ostwald Ripening" or coarsening
is often observed in phase-separated glasses, and occurs after the matrix has
almost reached the equilibrium composition. The mathematical treatment for
this process has been given by Lifshitz and Slyozov 51 and Wagner 52 based on
earlier work by Greenwood. 53 The driving force for coarsening is provided by
the higher solubility of the smaller particles, resulting in a transfer of material
from them to the larger particles. The mean radius R of the particles is given by
R3 _ R 3 = 8yC e DV",t
o 9KT
(17)
in which Ro is the mean particle radius when time t = 0, y is the particle-matrix
interfacial tension, C e is the solute concentration, V", is the molar, volume of the
particles, K is the gas constant, and T is the temperature. Thus the mean
particle radius increases as t 1/3 .
Hammel 46 studied the growth of phase-separated silica particles in a
soda-lime silicate glass with 13 mol% NazO and 11 mol% CaO, the same
composition used for his nucleation studies described above. He found that the
particle radius increased proportionally to the square root of time, as required
MORPHOLOGY AND SPINODAL DECOMPOSITION 67
for diffusion-controlled growth. He found an activation energy of growth of
395 kj/mol, close to the activation energy of about 460 kj/mol for viscous
flow in glasses close to this composition, from diffusion coefficients calculated
from Eq. 16. The solution was not dilute, so IX was a function of composition
as tabulated by Frank. 50 Hammel assumed that silica was the diffusing species.
Burnett and Douglas 18 also found that the particle size was proportional to
the square root of time in the early stages of growth of silica particles in
soda-lime glass.
In the later stages of growth, after the glass matrix is close to the equilibrium
composition, the particles in phase-separated glasses grow by the coarsening
mechanism of Eq. 17, as shown by proportionality of the particle radius to the
cube root of time. From such measurements, Burnett and Douglas calculated
an activation energy for diffusion of 247 kj/mol for their glass containing 10
mol% Na 2 0, 10% CaO, and 80% Si0 2 , which is considerably smaller than the
activation energy found by Hammel 46 for diffusion in a similar glass. The
absolute values of the diffusion coefficients in the two studies were similar at
640°C: Hammel found 2.7(10)- 15 cm 2 /s for growth, and Burnett and Douglas
0.6(10)-15 cm 2 /s for coarsening and 1.5(10)15 cm 2 /s for growth.
This diffusion coefficient can be compared with that calculated from the
viscosity" and the Stokes-Einstein equation
D=
61tt] R
(18)
where R is the particle radius and k is the Boltzman's constant. For a D of
2.7(10)- 15 at 640°C where the viscosity is about 2(10)11 P, the radius of the
diffusing entity is 10- 11 cm. Thus diffusion is apparently not directly related to
viscous flow, in spite of the similarity between Hammel's diffusive activation
energy and that for viscous flow.
Activation energies for diffusion have been calculated for other glasses from
coarsening studies (composition in mol%): 10 Na 2 0, 10 Li 2 0, 80 Si0 2 ,
197 kj/mol;20 1 K 2 0, 26 Li 2 0, 73 Si0 2 , 297 kj/mol. 54 3 PbO, 97 B 2 0 3 , 343 kj/
mol;55 19 PbO, 76 B 2 0 3 , 5 A1 2 0 3 , 305 kj/mol. 56 In all of these studies, as well
as that of James and McMillan,13 the particle radius was proportional to the
cube root of aging time, as required by Eq. 17.
MORPHOLOGY AND SPINODAL DECOMPOSITION
In the above studies, the volume fraction of particles was small and they grew
as individual spheres. When the volume fractions of the two separating phases
are not much different, the phases often separate into an interconnected
structure, as shown in Fig. 1 (see also Ref. 57). Two explanations of this
morphology have been advanced. The first explanation is that phase separation
occurs by the mechanism of spinodal decomposition 58 . 59 described below. The
second is that particles nucleate and grow by the classical process described in
68 PHASE SEPARATION
the last two sections, but then agglomerate to the connected structure because
of their high volume fraction. 60
The theory of spinodal decomposition is based on the free energy diagram
for a two-phase system shown in Fig. 8b. Vital to the theory is a region in
which 8 2 G/8C z is negative, where G is the free energy of the system and C is
its composition. In such a region there is no barrier to phase growth, since any
small fluctuation leads to a reduction in free energy. From this condition, Cahn
derived the mechanism of spinodal decomposition. 58 In this mechanism, the
transformation proceeds by a continuous change in the compositions of
growing phases, whereas their extent remains constant. The composition
changes take place in a regular three-dimensional array with a characteristic
wavelength and grow until the compositions of the two phases reach the
equilibrium values. This mechanism contrasts with the usual nucleation and
growth process described above in which regions of constant composition (the
equilibrium composition) nucleate and grow in size until the matrix also
reaches the equilibrium value.
Cahn showed that the spinodal mechanism leads to an interconnected
structure in an isotropic system such as one containing two liquid phases. 61
Cahn and Charles 59 suggested that this mechanism was therefore the reason
for the interconnected structure in glasses, since a computer solution of the
spinodal equations gives a cross-section very similar to that found in glasses,
such as shown in Fig. 1. The region of spinodal decomposition as estimated
from various models agrees qualitatively with the compositions at which an
interconnected structure is observed in glasses, except that this structure is
usually not observed at temperatures just below the consolute temperature
even for the consolute composition. This result may be caused by rapid
agglomeration of the interconnected structure.
Several studies of the earliest stages of phase separation in the interconnec-
ted region have been made with small-angle X-ray scattering and compared to
the spinodal equations. 62 - 66 The height of the peak of scattered intensity as a
function of angle is related to the composition difference between phases,
whereas the angle at which the intensity is a maximum is related to the scale
of the separation. Zarzycki and Naudin found that the angle of maximum
intensity remained about constant with increase in aging time and height of the
peak, as required by the spinodal mechanism, but this behavior was found only
at the earliest aging times, as shown in Fig. 13. Stephenson 65 suggested that
the influence of internal stress must be included to interpret small-angle
scattering, and Yokota and Nakajima 66 concluded that relaxation of the glass
changed the material transport as a function of time. It would be very desirable
to have electron microscopic evidence to confirm these deductions from the
small-angle X-ray work; until they become available, the evidence for the
spinodal mechanism from this experimental technique remains tentative.
In support of the agglomeration mechanism of Haller, some electron
micrographs have shown discrete particles agglomerating to an interconnected
structure as they were aged. 67 - 69 Thus it is possible for an interconnected
PROPERTY CHANGES AND APPLICATIONS RELATED TO PHASE SEPARATION 69
>.
-
'(jj
c:
II)
-
c:
....
10 3
cj
II)
en
-
c:
o
CJ
--
hCA- 1 )
10 O,o!5 0,1
Angle
Fig.13 Small angle X-ray diffraction spectra of a glass containing 76 wt% B 2 0 3 , 19%
PbO, and 5% A1 2 0 3 , quenched from 1150°C and then heated to 450°C. From Ref. 55.
structure to develop from one with discrete particles; however, it is not proven
that this is the way all interconnected structures in phase-separated glasses are
formed.
The presence of a region in which a 2 G/ac 2 is negative for phase-separating
glasses has not been established experimentally. Various theories of binary
solutions, such as the one described above, lead to a free energy function with
a continuous derivative, but this may be merely a mathematical convenience.
PROPERTY CHANGES AND APPLICATIONS RELATED TO PHASE
SEPARATION
The viscosity of a phase-separated silicate glass is usually greater than that of
a homogeneous glass of the same composition, because the separated silica-rich
phase has high viscosity and dominates the flow behavior. The chemical
durability of a glass can be increased by phase separation if the less durable
phase is isolated from the corroding solution; if this phase is exposed to the
solution, as in spinodal decomposition (see Fig. 1), the glass becomes less
durable than if it were not separated. As Pyrex borosilicate glass is heated at
600°C, the scale of phase separation becomes larger, and the glass becomes less
resistant to corrosion. 70
The electrical conductivity of a phase-separated silicate glass usually in-
creases when the glass separates, if the higher conductivity phase is continuous.
70 PHASE SEPARATION
Other properties, such as strength, density, and refractive index also change
with separation, although not as much a viscosity and chemical durability.
The most important application of phase separation in glass has been the
process of making high-silica Vycor glass, as described at the beginning of this
chapter. The porous silica glass that is an intermediate step in this process can
have pore sizes from 2 to 200 nm, and also has valuable applications, such as
separation of biological substances of different sizes (viruses, proteins, cell
component) by filtration. 71 A porous surface layer produced by phase separ-
ation and partial leaching on a borosilicate glass provides an antireflection
coating 7 2 on the glass and can strengthen it with a compressive stressY
However, if too much stress is produced, the glass can fracture. 74
The size of pores in this glass can be changed by adding components to the
original glass composition to alter the scale of the initial phase separation.
Addition of molybdenum oxide to sodium borosilicate glass increases the scale
of phase separation and thus of the resulting glass. 75 Molybdenum oxide also
changes the scale of phase separation in other glass compositions. 76
REFERENCES
1. W. E. S. Turner and F. Winks, J. Soc. Glass Tech., 10, 102 (1926).
2. M. E. Nordberg and H. P. Hood, U. S. Patent 2, 106, 744 (1934).
3. S. M. Ohlberg, H. B. Golub, 1. 1. Hammel, and R. R. Lewchuk, J. Am. Ceram. Soc., .
48,' 178 (1965).
4. R. H. Doremus and A. M. Turkalo, Science, 164,418 (1969).
5. W. Vogel, Glaschemie, Translated into English, Am. Ceram. Soc., Columbus, OH,
1985.
6. M. Tomozawa, in Treatise on Materials Science and Technology, Vol. 17, Academic
Press, San Diego, CA 1979, p. 71.
7. O. V. Mazurin and E. A. Porai-Koshits, Eds., Phase Separation in Glass, North-
Holland, Amsterdam, 1984.
8. N. Kreidl, J. Noncryst. Solids, 129, 1 (1991).
9. E. M. Levin, C. R. Robbins, and H. F. McMurdie, Phase Diagrams for Ceramists,
American Ceramics Society, Columbus, OH, 1964; Supplement, 1969.
to. F. P. Glasser, 1. Warshaw, and R. Roy, Phys. Chem. Glasses, 1, 39 (1960).
11. Y. Kawamoto and M. Tomozawa, J. Am. Ceram. Soc., 64, 289 (1981).
12.1. M. Hyde and M. Tomozawa, J. Noncryst. Solids, 109, 18 (1989).
13. P. F. James and P. W. McMillan, Phys. Chem. Glasses, 11, 59, 64 (1970).
14. R. R. Shaw and D. R. Uhlmann, J. Am. Ceram. Soc., 51, 377 (1968).
15. R. J. Charles and F. E. Wagstaff, J. Am. Cera,m. Soc., 51, 16 (1968).
16. E. A. Porai-Koshits, V. V. Golubhov, and A. P. Titov, in Borate Glasses, L. D. Pye,
V. Frechette and N. 1. Kreidl, Eds., Plenum Press, New York, 1977, p. 183.
17. 1. H. Simmons, J. Am. Ceram. Soc., 56, 284 (1973).
18. D. G. Burnett and R. W. Douglas, Phys. Chem. Glasses, 11, 125 (1970).
REFERENCES 71
19. M. Yamane and T. Sakaino, J. Am. Ceram. Soc., 51, 178 (1968).
20. Y. Moriya, D. Warrington, and R. W. Douglas, Phys. Chem. Glasses, 8, 19 (1960).
21. D. G. Burnett and R. W. Douglas, Discuss. Faraday Soc., SO, 200 (1970); Phys. Chem.
Glasses, 12, 117 (1971).
22. W. Haller, D. H. Blackburn, F. E. w.agstall', and R. 1. Charles, J. Am. Ceram. Soc.,
53, 34 (1970).
23. G. Srinivasan, I. Tweer, P. B. Macedo, A. Sarkar, and W. Haller, J. Noncryst. Solids,
6,221 (1971).
24. O. V. Mazarin, M. V. Streltsina, and A. S. Totesh, Phys. Chem. Glasses, 10,63 (1969).
25. M. L. Hair and D. Chapman, J. Am. Ceram. Soc., 49, 651 (1966).
26. M. Tomozawa, in Advances in Crystallization and Nucleation in Glasses, American
Ceramic Society, 1971, p. 41.
27. J. H. Simmons, P. B. Macedo, A. Napolitano, and W. K. Haller, Discuss. Faraday
Soc., 50, 155 (1971).
28. L. Shartsis, H. F. Shermer, and A. G. Bestul, J. Am. Ceram. Soc., 41, 507 (1958).
29. W. Vogel and K. Gerth, Glastech. Ber., 31, 15' (1958); Silikattech., 9, 353 (1958).
30. E. Plumat. J. Am Ceram. Soc., 51, 499 (1968).
31. M. 1. Suscavage and O. H. el-Bayoumi, J. Am. Ceram. Soc., 68, C-259 (1985).
32. L. Boehm, K.-H. Chung, and C. T. Moynihan, J. Noncryst. Solids, 102, 159 (1988).
35. A. H. Cottrell, Theoretical Structural Metallurgy, Edward Arnold, London, 1948, pp.
153 If.
34. J. W. Christian, The Theory of Transformations in Metals and Alloys, Pergamon,
London 1965, pp. 172 If.
35. B. E. Warren and A. G. Pincus, J. Am. Ceram. Soc., 23, 301 (1940).
36. E. M. Levin and S. Block, J. Am. Ceram. Soc., 40, 95, 113 (1957); 41, 49 (1958).
37. H. Rawson, Inorganic Glass-Forming Systems, Academic Press, New York, 1967, p.
123.
38. R. 1. Charles, Phys. Chem. Glasses, 10, 169 (1969).
39. R. 1. Charles, J. Am. Ceram. Soc., SO, 631 (1967).
40. V. McGahay and M. Tomozawa, J. Noncryst. Solids, 109, 27 (1989).
41. M. Levy, J-e. Le Guillou, and 1. Zinn-Justin, Phase Transformations, Plenum Press,
New York, 1982 (see especially articles by D. Beyrens, p. 25 and 1. V. Sengers, p. 95).
42. D. Turnbull, in Solid State Physics, Vol. 3, Academic Press, New York, 1956, p. 22511'.
43. 1. W. Christian, The Theory of Transformations in Metals and Alloys Pergamon,
Oxford, 1965, p. 37711'.
44. R. H. Doremus, Rates of Phase Transformations, Academic Press, San Diego, 1985,
Ch.5.
45. J. W. Gibbs, Scientific Papers, Dover, New York, 1961, p. 254.
46. J. 1. Hammel, J. Chem. Phys, 46,2234 (1967).
47.1. Lumsden, Thermodynamics of Alloys, Institute of Metals, London, 1952, p. 335.
48. D. Kashchiev, Surf Sci., 14, 209 (1969).
49. C. Zener, J. Appl. Phys., 20, 950 (1949).
50. F. C. Frank, Proc. Roy. Soc., 201A, 586 (1950).
72 PHASE SEPARATION
51. E. M. Lifshitz and V. V. Slyozov, J. Phys. Chem. Solids, 19, 35 (1961).
52. C. Wagner, Z. Electrochem., 65, 581 (1961).
53. G. W. Greenwood, Acta Met., 4, 243 (1956).
54. R. A. McCurrie and R. W. Douglas, Phys. Chem. Glasses, 8, 132 (1967).
55.1. Zarzycki and F. Naudin, Phys. Chem. Glasses, 8, 11 (1967).
56. F. Naudin and 1. Zarzycki, Comptes Rendus., 266, 729 (1968).
57. R. 1. Charles, J. Am. Ceram. Soc., 47, 559 (1964).
58. 1. W. Cahn, Acta Met., 9, 745 (1961).
59. 1. W. Cahn and R. 1. Charles, Phys. Chem. Glasses. 6, 181 (1965).
60. W. Haller, J. Chem. Phys., 42, 686 (1965).
61. 1. W. Cahn, J. Chem. Phys., 42, 93 (1965).
62.1. Zarzycki and F. Naudin, Comptes Rendus., 265., 1456 (1967); J. Noncryst. Solids,
1,215 (1969); 5, 415 (1971).
63. G. F. Neilson, Phys. Chem. Glasses, 10, 54 (1969).
64. M. Tomozawa, R. K. MacCrone, and H. Herman, Phys. Chem. Glasses, 11, 136
(1970).
65. G. B. Stephenson, J. Noncryst. Solids, 66, 393 (1984).
66. R. Yokota and H. Nakajima, J. Noncryst. Solids, 70,343 (1985).
67. T. P. Seward, D. R. Ulhmann, and D. Turnbull, J. Am. Ceram. Soc., 51, 634 (1968).
68. 1. F. MacDowell and G. H. Beall, J. Am. Ceram. Soc., 52, 17 (1969).
69. R. H. Doremus, Glass Science, 1st Edn., Wiley, New York, 1973, p. 69ft'.
70. M. Tomozawa and T. Takamori J. Am. Ceram. Soc., 62, 370 (1979).
71. W. Haller, Nature, 206, 693 (1965).
72. T. H. Elmer, Am. Ceram. Soc. Bull., 58, 1093 (1979).
73. M. G. Drexhage and P. K. Gupta, J. Am. Ceram. Soc., 63, 72 (i980).
74. G. W. Scherer and M. G. Drexhage, J. Am. Ceram. Soc., 68, 419 (1985).
75. H. Tanaka, T. Yazawa, and K. Equchi, Yogyo-Kyokai-Shi,93, 137, 700 (1985).
76. Y. Kawamoto, K. Clemens, M. Tomozawa, and J. T. Warden, Phys. Chem. Glasses,
22, 110 (1981).
CHAPTER 5
CRYSTALLIZATION
Glass is metastable with respect to the crystalline phase at temperatures below
its equilibrium liquidus temperature. The liquidus temperatures for commercial
soda-lime glasses are usually between 900°C and 1000°C for crystallization of
the compound "divitrite", or Na 2 0' 3CaO' 6Si0 2 . In a zirconium fluoride
glass, the liquidus temperature can be as low as 500°C. Glasses can form
because the rate of crystallization is low, as discussed in Chapter 2.
Crystallization or "devitrification" of glass can lead to serious problems in
glass manufacture because of the resultant changes in glass properties, such as
viscosity and coefficient of thermal expansion. High stresses resulting from
nonuniform contraction on cooling can cause fracture of the piece. Thus glass
technologists have always been careful to avoid crystallization by not holding
their glasses at temperatures where crystals grow rapidly. The proper condi-
tions to avoid crystallization were found empirically, with the help of limited
knowledge from phase diagrams. Recent experimental and theoretical studies
on the crystallization of glass should be helpful in predicting crystallization
rates in new compositions, and also in defining the limiting times and
temperatures to which a glass piece can be subjected.
If crystals grow in the interior of a glass, its optical properties are changed
because of light scattered by the crystals. This scattering can degrade desirable
optical properties such as transparency; in an optical fiber for long distance
transmission, even a small amount of crystals seriously degrades the trans-
mission capability.
Opal glasses were among the first to be used for decoration, and have
continued in this use to the present time. Their translucency derives from light
scattered from internal crystals, resulting either from incomplete melting or
from crystals that grew in the glass as it cooled. These glasses are often used
73
74 CRYSTALLIZATION
as glazes on decorative or practical objects; however, their low strength has
limited wider application.
Some of the few really new materials developed recently are uniformly
crystallized glasses or "glass-ceramics". These materials were first developed at
the Corning Glass Works, 1,2 and are made by special heat treatment of
particular glass compositions to give a fine, uniform dispersion of crystals in
the glass. These partially crystallized glasses can have many superior proper-
ties, such as high strength and impact resistance, low bulk and surface electrical
conductivity, low dielectric loss, low chemical reactivity, low coefficient of
thermal expansion, and a range of optical properties from clear to completely
opaque or white resulting from light scattering from the crystals. Such glasses
have been studied intensively since the original Corning discovery, and many
companies now market them. Table 1 lists a few commercially available
products with their enhanced properties and uses. Among other important uses
not listed in the table are bearings, heat exchangers, reactor control rods,
sealing, vacuum tube envelopes, substrates for electronic circuits, and capaci-
tors. McMillan discusses these and other uses in his book entitled Glass
Ceramics, 3 as well as many other aspects of these materials. Beall 4 has
described new types of strong glass ceramics based on chain silicates such as
enstatite; the microstructure of the enstatite glass ceramic is similar to that of
natural jade (NaAISi 2 0 6 ).
Crystals usually form in glass by a nucleation and growth mechanism; a
small region of the equilibrium crystal composition forms by nucleation and
then grows. Sometimes metastable (nonequilibrium) phases nucleate. In this
chapter, nucleation is discussed first, and then methods of measuring nu-
cleation and growth rates along with results of these measurements and tests
of nucleation theories are described. Then special agents added to the glass to
form crystalline nuclei are considered and some morphologies of crystals in
TABLE 1 Properties and Uses of Some Commercial Glass-Ceramics
Glass Type and
Company Crystals Properties
Corning 9606 2MgO' 2Alz03 . 5SiO z Low expansion,
(Cordierite) transport to
radar
Corning 9608 p-Spodumene Low expansion,
chemical reactivity
Owens- Illinois p-Quartz Very low expansion
Cer-vit
General Electric Li 2 O-2Si0 2 Low electrical conduction
Re-X high strength
Uses
Radomes
Cookware
Telescope
mirrors
Insulators
NUCLEATION 75
glass are shown. Finally rates of crystal growth in glasses are discussed in both
silicate and fluoride glasses.
NUCLEATION
The theory of nucleation was first derived for formation of liquid drops from
the vapor. Experiments in cloud chambers confirm the theory, with respect to
temperature dependence, calculated values of surface energy, and absolute
nucleation rates. 5 Thus one has confidence in the ideas involved in the theory.
To extend the theory to condensed phases, as described in the last chapter,
uncertain assumptions are made about the mechanism of rearrangement of
molecules in the matrix (liquid or glassy phase in the present case) to become
part of the nucleating (crystalline) phase. The usual method is to assume that
the rate of transferring molecules from one phase to another is proportional to
the rate of diffusional jumping of molecules in the liquid. This assumption and
the proportionality (geometric) factors in the pre-exponential are probably the
most uncertain parts of nucleation equations for condensed phases.
Equations for the nucleation rate I of a phase were derived in the last
chapter (see also refs. 5 and 6). For nucleation in a condensed phase, the rate
I is
1= B exp( -Q + W*)/kT
(1)
where B is a constant not much dependent on temperature T, Q is the
activation energy for molecular transport (or viscous flow) in the matrix phase,
k is Boltzmann's constant, and W* is the work to form a critical nucleus. For
a spherical, isotropic nucleus
W* = -16'7T'Y 3 j3( AGJ2 (2)
where y is the interfacial energy between the nucleus and the matrix, and L1G.
is the free energy change per unit volume for the transformation from matrix
to critical nucleus. An approximate equation for L1G. for condensed phases is
L1G. = L(T", - T)/VT",
(3)
where L is the heat of fusion, T", is the melting temperature, and Vis the molar
volume of the matrix phase. Equation 3 assumes that the heat of fusion is not
a function of temperature; a correction for its temperature dependence may be
necessary for large undercoolings (T", - 1). The radius r * of the critical nucleus
IS
r. = 2y/L1G v
(4)
The above discussion is for homogeneous nucleation, in which a second
phase forms in a matrix directly without interference of foreign particles,
impurities, or defects. In liquids and solids, homogeneous nucleation is un-
usual, because it is difficult to remove nucleation catalysts. In glasses, these
76 CRYSTALLIZATION
catalysts for heterogeneous nucleation can be foreign particles, second phases,
bubbles, surfaces, or defects. Segregation of dissolved impurities to interfaces
can lower the interfacial energy, leading to a higher nucleation rate. An effective
interfacial energy
Ye=L};Y
i
where}; is a correction factor for nucleation catalysts of a certain class i, can
account for heterogeneous nucleation. In most situations, there are several
different kinds of nucleation catalysts (values of};) that cause rapid nucleation
at different undercoolings.
Figure 1 shows schematically the relative rates of nucleation and crystal
growth as a function of temperature (undercooling). There is no barrier to
growth, so it occurs at any undercooling. The barrier to nucleation results in
very low nucleation rates until the undercooling is large enough; then the
L.
(5)
GROWTH
NUCLEATION
RATE
Fig. 1 Schematic representation of nucleation and growth rates of crystals in glasses.
NUCLEATION 77
nucleation rate increases rapidly with undercooling. The nucleation rates
decrease at lower temperatures because molecular transport becomes slower.
In surface crystallization, impurities are the most important source of
nucleation. On cooling from the melting temperature, dust particles adhere to
the glass surface, giving preferred nucleation. Other impurities such as alkalis
can corrode the surface, leading to lower glass-air surface tension and
enhanced nucleation. The centers of cristobalite crystals growing on a vitreous
silica surface when analyzed with the electron microprobe show impurities such
as calcium or sodium. Thus the glass surface should be protected from dust
and other impurities to prevent surface nucleation of crystals.
Impurity particles can nucleate uniform crystallization in glass. Fine metal
particles grown in the glass can act as a center for crystallization. The platinum
metals in concentrations of 0.001 to 0.1 % catalyze crystallization in lithium
silicate, 7 lithium aluminum silicate, and alkali barium silicate glasses, 8 and
soda-lime glasses. 9 The metal is added as a compound; it decomposes during
glass melting and forms a very fine dispersion of metal particles, typically about
50A in diameter. 6 The noble metals copper, silver, and gold, also act as
nucleating agents in various lithium and barium silicate glasses, especially
lithium aluminum silicates. 2 The noble metal can be added to the glass batch
either as finely divided metal or as a compound. It dissolves in the glass in the
ionic form during glass melting, and remains in this form if the glass is cooled
quickly.10 If the glass contains some antimony or arsenic oxide, the noble
metal precipitates on reheating. The particles nucleate continuously at a
constant rate;ll the efficacy of antimony and arsenic as nucleation agents
apparently is related to their having two oxidation states in the glass, but the
exact mechanism of nucleation of the metal is uncertain.
The noble metal particles can also be nucleated by ultraviolet light or
X_rays.12 Cerium oxide in the glass improves the photosensitive nucleation of
noble metals. 13 Again the efficacy of cerium as a nucleating agent is apparently
related to its two oxidation states in the glass, and to its absorption band at
0.314 J.l.m. 14 One mechanism pr posed was that the radiation caused electrons
to be ejected from Ce 3 + ions, and the electrons then reacted with the noble
metal ions to form atoms, which agglomerated to a nucleus of a growing metal
particle. 10 ,l1 However, it is possible to reduce gold ions to atoms wjth
hydrogen in a photosensitive glass, and yet these atoms do not form particles
without irradiation. 15 Thus the nucleation mechanism is more subtle than a
simple reduction process, and apparently involves an activated cerium ion 14 as
a nucleation agent. The noble metal ions must be reduced at some stage of the
growth process, but this reduction can occur either before or during growth. 15
Lithium metasilicate crystals formed in different configurations on metal
particles in photosensitive glasses can be etched out to make useful shapes.
This "chemical machining" is possible because the lithium metasilicate is much
more soluble in hydrochloric acid than is the base glass. Tolerances of :t 50
J.l.m are possible in Corning's "Fotoform" glass by this method. After machin-
ing, the remaining glass can also be crystallized to give better strength and
78 CRYSTALLIZATION
stability at high temperatures. These glasses have been used in printed circuit
boards, dielectrics, and fluid amplifiers.
Lithium disilicate crystals in a 26 mol% LizO, 74% Si0 2 glass containing
no added nucleating agent are shown in Fig. 2. The crystals are growing from
an impurity particle, whose composition was not identified; it has flattened
faces, implying that it is crystalline; perhaps it is platinum from the platinum
melting crucible. Such a particle was found at the center of every cluster
observed in this glass. 16
Phase separation has been suggested as a precursor to uniform crystalliza-
tion in glass. Often phase separation gives one amorphous phase that is more
easily crystallized than tl1e bulk glass. For example, in a sodium borosilicate
glass, phase separation leads to one silica-rich phase and another sodium
borosilicate phase containing less silica than the glass as a whole. This sodium
borosilicated phase crystallizes during heat-treatment at relatively low tem-
peratures, as shown in Fig. 3.
EXPERIMENTAL MEASUREMENTS OF NUCLEATION AND
GROWTH RATES
The best way to measure nucleation rates is to observe the nucleated particles
in a microscope after they have grown above the critical size (Eq. 4). However,
Fig. 2 Transmission electron micrograph of a cluster of lithium disilicate crystals
growing in a 26 mol% LizO, 74% SiOz glass, heated for 243 min at 500°C. Unetched
thinned section. Magnification 34,000.
EXPERIMENTAL MEASUREMENTS OF NUCLEATION AND GROWTH RATES 79
............
,'''''
.
.
')
( ...
,
", " ,-
( "i
t "/.'.,;,
> ./li
V',:{i,i
,L,d'
"Ii;;.
::1
\' ,
to(
.
Fig. 3 Replica electron micrograph of a phase-separated sodium borosilicate glass
(49.7 wt% Si0 2 , 45.5% B 2 0 3 , and 4.9% Na 2 0) showing crystals growing in the
borate-rich phase.
the critical sizes are extremely small, usually only a few tens of nanometers or
less, so the crystals must be grown to a much larger size to be observed in the
light microscope. Crystals near the critical size should be observable in thinned
sections in the electron microscope, but this method has apparently not been
used. Growth to larger sizes has been accomplished in two different ways. After
nucleation at a particular temperature, the glass is held at the same tempera-
ture for a long time to grow the particles. This method gives reliable results,
but often is not possible because growth rates are very slow at nucleating
temperatures (see Fig. 1).
To overcome this difficulty, the second method is used: after nucleation at
a particular temperature, the glass is heated to a higher temperature at which
further nucleation is negligible and growth rapid (Fig. 1). If the difference
between nucleating and growth temperatures is not too great, this method can
give reliable counts of nucleated particle. 17 . 18 However, for larger undercool-
ings, it is possibl that some nucleated particles become subcritical at the
h.igher temperature and dissolve. Equations 3 and 4 show that the size of a
80 CRYSTALLIZATION
critical nucleus, that is, a nucleus that is stable, decreases with greater
undercooling. Thus a nucleus that forms at a low temperature is smaller than
the critical size at a higher temperature, and can dissolve.
Experimental nucleation rates in a lithium disiJicate glass as measured 18,17
by the two-step process are plotted in Fig. 4. From Eqs. 1, 2 and 3 the
temperature dependence of the nucleation rate / can be expressed as
log /'1 = K/T(!!' T)2
(6)
in which '1 is the viscosity of the glass matrix, K is a temperature independent
parameter, and!!. Tis the undercooling T",- T. In Fig. 4, log /'1/Tis plotted as a
function of I/T(!!' T)2; the factor of T in the logarithmic term results from a
factor of T assumed to be in the pre-exponential coefficient B. A straight line
on this plot agrees with Eq. 6; above about 440°C, such a line was found, 18 but
at lower temperatures, lower values of the nucleation rates were found than
expected. It seems likely that these low rates resulted from dissolution of
subcritical nuclei at the growth temperature of 560°C. Similar results were
found in another study.19 From the slope of the line in Fig. 4 and Eqs. 1, 2
and 3 and the known heat of fusion and activation energy Q for viscous flow,
one can calculate an interfacial energy of about 0.2 J/m 2 between lithium
disilicate crystals and the melt of the same composition. There is no indepen-
dent measurement of the interfacial energy.
The value of the pre-exponential factor B in Eq. 1 as calculated from these
experiments on lithium disilicate glass is about twenty orders of magitude
:'5
?'5
2€
40 0
0 0
;:- 0
g
£
35
3
2.3 2-/.
(,/6G2Tj.,0 12
Fig. 4 Nucleation rates I in a Li 2 0 . 2Si0 2 glass of Li 2 0 . 2Si0 2 crystals. In(I'I} IT)
is plotted as a function IIT6T,,2; see Eq. 6: Reprinted from Ref. 18 with permission
from Elsevier.
22
EXPERIMENTAL MEASUREMENTS OF NUCLEATION AND GROWTH RATES 81
higher18.20.21 than expected from the theoretical value from Eq. 12, Ch. 4.
James,18 showed that this discrepancy could be explained by a temperature
dependence of the interfacial free energy resulting from small negative inter-
facial entropy: y = 0.029 + 0.16(10)-3 T in J/m 2 , T in OK. Greer and Kelton
analyzed the measured nucleation rates and time lags in lithium silicate glasses
from refs. 17 and 19 with classical nucleation theory, and also found reasonable
agreement if the interfacial free energy was temperature dependent. 22 How-
ever, they found y=0.094+7(10)-5 TJ/m 2 , which is quite different from that of
James. Greer and Kelton also found that 'their calculated interfacial energies
increased sharply from this relation below about 440°C, confirming the
conclusion drawn above from Fig. 4 that nucleation measured rates at these
lower temperatures were probably low. In metals the solid-vapor interfacial
energy decreases as the temperature increases as expected from a positive
interfacial entropy (Ref. 5, p. 38). It is also possible that the simple geometrical
factors for interfacial rearrangement are not valid for this system.
Nucleation rates of BaO' 2Si0 2 and Na 2 0' 2CaO' 3Si0 2 crystals in glasses
of the same composition by two-step development and direct counting also
gave the temperature dependence expected from Eqs. 1, 2 and 3 and values of
interfacial energy of 0.13 and 0.18 J/m 2 , respectively.18,21 The pre-exponential
factors calculated from these rates were again much higher than calculated
theoretically. Again this discrepancy can be removed by postulating a tempera-
ture-dependent interfacial energy.
Another method of calculating nucleation rates is from measurements of the
crystallized volume of a glass as a function of time and independent measure-
ments of the rate of crystal growth G, assumed to be constant with time. The
radius of a spherical particle that has grown for a time t is then Gt, and the
volume of the particle V = 4nG 3 t 3 /3. If the rate of nucleation I per unit volume
per unit time is constant (steady state), then the volume fraction W x of the glass
crystallized is (Ref. 5, p. 25)
I I 4nG3 I I t nG3 It'
W x = VI dt =- (t-t) dt =-
o 3 0 3
Equation 7 is valid before the individual crystals grow into one another; after
collision, the volume fraction is 23
(7)
w = l-exp(-w x )
(8)
If the nucleation rate I is not constant but is a function of time, the time
dependence of the volume fraction w is approximately
w = l-exp( -Kt)"
(9)
where K is a constant. If nucleation is rapid compared to growth and takes
place on a fixed number of sites, the number of particles is constant with time
and n = 3, because
w = NV= 4nNG 3 t 3 /3
(10)
82 CRYSTALLIZATION
where N is the constant number of particles per unit volume. If the nucleation
rate I decreases with time, 3<n<4; if it increases with time, n>4. Equations
8 and 9 are often called the Avrami equations.
If the growth of the particles involves diffusion in the melt, for example when
the glass compostion is different from that of the crystals, then lower exponents
n are expected. 5
Equation 7 has been used to calaculate nucleation rates in sodium disili-
cate 24 and anorthite 25 (CaO' Al 2 0 3 . 2Si0 2 ). The temperature dependence was
that expected from the theory, and interfacial energies of 0.055 and 0.19 J/m 2
were calculated. The pre-exponential factor was found to be close to that
expected theoretically. However, in later work, the bulk (homogeneously
nucleated) phase in the anorthite work was found to be metastable. 26 It is not
clear why the pre-exponential in these studies was that expected, whereas in
the other systems a temperature-dependent interfacial energy was required to
give agreement
The kinetics of crystallization can be followed in a differential scanning
calorimeter (DSC), which measures the temperature difference between a
standard and a sample. In an isothermal measurement in the DSC, a phase
transformation gives a peak in the output, which is a measure of the rate of
transformation dJf7dt as a function of time, as shown in Fig. 5. Integration of
the area under the curve for different times, gives the fraction of transformation
Was a function of time, and a plot of In [In(1- W)] versus In time, as shown
0 )
::I 0
>,Z
...
o
:.c
.g
II..
aj
TIME (min.)
Fig. 5 DSC curve for isothermal crystallization of ZBL fluoride glass at 362 0 C (see
Table 2 for glass composition). Reprinted from Ref. 30 with permission from the
American Ceramic Society.
EXPERIMENTAL MEASUREMENTS OF NUCLEATION AND GROWTH RATES 83
0,5
0,0
)( -0,5
..!..
c:
.....
I -1.0
..........
-1.5
-2.0
-25
1n t (see)
Fig. 6 Isothermal crystallization of ZBL fluoride glass, plots from Eq. 8 at tempera-
tures °C: (a) 397; (b) 387; (c) 382, (d) 377; (e) 372; (() 367; (g) 362; (h) 357. Reprinted
from Ref. 30 with permission from the American Ceramic Society.
in Fig. 6, gives a straight line with slope n. The value of K for each temperature
can be plotted as a function of temperature to find the activation energy Q:
K = v exp( -Q/RT)
(11)
where v is a constant, R is the gas constant, and Tthe absolute temperature.
The DSC can also be used to measure Q and n from nonisothermal
(constant heating or cooling rate oc) experiments. 27 - 31 A series of crystalliza-
tion peaks at different heating rates are shown in Fig. 7. The temperature at
the peak maximum Tp and the activation energy Q are related in the equation 30
In (7;,z/IX) = In(Q/R)-ln v + Q/RTp (12)
Thus the activation energy Q can be found from a plot of In(1;, 2/ 1X ) versus l/Tp
for different heating rates. The expon'ent n can be found from the width of the
DSC Curve (j at half the maximum temperature 28
_ 2.5 R 1;, 2
n - (jQ
(13)
The above treatment of nonisothermal DSC measurements is valid both for
diffusion and interface controlled crystallization rates, as long as the tempera-
84 CRYSTALLIZATION
b
!!
'2
::I
>-
...
D
... w
0 8
-
z
w
u...
W
J:
700 660 620
4-T(K)
Fig.7 DSC crystallization for ZBL fluoride glass at constant heating rates of (a) 1.25;
(b) 2.5; (c) 5.0; (d) 10.0; (e) 20.0 K/min. Reprinted from Ref. 30 with permission from
the American Ceramic Society.
ture dependence of K is given by an Arrhenius relation (Eq. 1). Effectively one
assumes that the transformation is a function of Wand temperature only; this
assumption is sometimes called the "concept of additivity".32,33 In addition,
Eq. 11 implies that growth is controlled by the transport-related interface
process that is dominant at large undercoolings (see section on growth). At
small undercooling, the growth rate increases as the temperature decreases
(factor of !J. T), reaches a maximum and then decreases at larger undercooling,
because of the influence of the reduction in transport (viscosity or diffusion in
liquid) (see Fig. 1). It is only in this lower temperature range that Eq. 11, and
consequently the above treatment of nonisothermal growth, are valid. If the
DSC crystallization peak occurs close to the melting temperature, a more
complicated temperature dependence must be used.
If the number of particles is not constant, but increases because of continued
nucleation (n values > 3 for interface control), the temperature dependence
must also include that of nucleation. If the experiment is being conducted on
the low temperature side of the nucleation maximum (see Fig. 1), the tempera-
ture dependence of the nucleation rate is probably the same as for crystalliza-
tion (see nucleation section), so Eq. 11 with a single activation energy can be
used. However, if the crystallization temperature is near or above the tempera-
ture of maximum nucleation rate, the temperature dependence of the total
NUCLEATING AGENTS 85
crystallization process becomes more complicated than given by Eq. 11, and
the above treatment cannot be used for nonisothermal DSC measurements.
DSC measurements have been used to study crystallization in zirconium
fluoride glasses, as described in the section on growth. They have also been
used for crystallization studies in binary lithium silicate and lithium silicate
glass ceramics, as described in the next section.
NUCLEATING AGENTS
The addition of "nucleating agents", such as titanium dioxide, phosphorous
pentoxide, zirconium dioxide, and fluorides, to certain glasses leads to en-
hanced rates of uniform crystalline nucleation. The mechanism of nucleation
by these agents is uncertain in most cases, although much work has been done
on them and many mechanisms proposed.
The most widely used nucleating agent is titanium dioxide, Ti0 2 . This agent
was used in much of the early work on glass-ceramics in such glasses as lithium
aluminum silicates and magnesium aluminum silicates. 2 Ti0 2 is quite soluble
in silicate glasses and lowers their viscosity considerably. In yttrium aluminum
silicate, no nucleating agent is needed. 34
Phosphorous pentoxide, P 20S' has been used successfully as a nucleating
agent in various lithium silicate and magnesium aluminum silicate glasses by
McMillan and his co-workers. 3 Small amounts of P 2 0 S can influence crystal-
line nucleation rates strongly.
A number of other oxides have been used as nucleation agents. 3 . 3S Among
these are zirconium, chromium, vanadium, tungsten, molybdenum, iron,36 zinc,
and nickel. All the other nucleating agents except the last two have metallic
ions with a high valence and field strength. This correlation may have some
connection with the importance of field strength in bringing about phase
separation, as described in the preceding chapter.
Fluorides have been used as nucleating agents in alkaline earth and alkali
aluminosilicate glasses 3 ,37 and soda lime glasses. 38 This use follows from the
traditional application of fluorides in opal glasses and glazes.
Mixed cadmium sulfide and selenide acts as a nucleation catalyst in various
glasses;3 the glass must be melted under reducing conditions to prevent
oxidation of the sulfur or selenium, and the resulting glass ceramic is yellow or
orange.
The heat-treatment of glasses containing nucleation agents is often carried
out in two stages. First the glass is given a "nucleation treatment" at a
temperature just above the annealing temperature; it is then crystallized at a
higher temperature. The separation between these two processes is not sharp
since some crystallization probably occurs during the nucleating treatment.
At least three different mechanisms have been proposed for the action of
nucleating agents. They can be classified as agent crystallization, catalysts of
86 CRYSTALLIZATION
phase separation, and reduction of interfacial tension. Each is discussed in turn.
As discussed above, metal particles can act as nuclei for uniform crystalliza-
tion, so the first idea was that nucleating agents act by precipitating from the
glass as fine crystals during' the nucleation heat treatment; they then serve as
sites for crystallization of the main crystalline phase at the higher "growth"
temperature. However, for most nucleation agents there is little or no evidence
supporting this mechanism. Cadmium sulfide or selenide probably crystallizes
as a uniform colloidal dispersion in glass that could catalyze nucleation. A
fluorosilicate phase crystallizes first in alkaline earth alumino silicate glasses,37
but it is not certain that this phase nucleates the major phase. For the common
nucleating agents such as Ti0 2 and P 2 0 S ' there is not much evidence that a
crystalline phase containing them is the first phase to precipitate during
heat-treatment to form a glass ceramic. Crystals containing these agents
usually grow at temperatures much higher than the nucleating temperature in
glasses containing them as nucleation catalysts
The sequence of phase separation an.d subsequent crystallization in a
magnesium alumino silicate glass containing titania has been found in one of
the few definitive studies of the mechanism of a nucleation agent. 39 The
sequence of events was followed with light scattered from inhomogeneities in
the glass, which indicated that the glass separated into two phases upon
cooling from its melting temperature. Treatment at about 750°C increased the
anisotropy of the separated particles, which was interpreted as resulting from
crystallization in them. X-Ray diffraction showed the presence of magnesium
titanate, MgO' Ti0 2 . Subsequent treatment at higher temperatures leads to the
major crystalline phases of cordierite (2MgO' 2Al 2 0 3 . 5Si0 2 ) and cristobalite.
Thus in this glass, the sequence is phase separation, then crystallization in the
titania-rich phase, whose crystals then act as nuclei for the major crystalline
phases. Apparently the titania does not act as a catalyst for phase separation,
but rather concentrates in one of the separated phases in which it crystallizes
uniformly to very fine crystals, which then catalyze further growth.
In some uniformly crystallized glasses there is good evidence that phase
separation does not precede crystallization of the major phases, even if
nucleating agents are present. Barry et al. found that p-eucryptite and
Li 2 0' Al 2 0 3 crystals formed in various lithium aluminum silicate glasses
containing Ti0 2 before any crystalline titanate phases were present. 40 Figure.
8 shows lithium dililicate crystals that grew in a multicomponent lithium
disilicate glass which showed no phase separation either just after quenching
or after various nucleating and crystallizing treatments. Thus in many, if not
most, glass-ceramics, the nucleation agent does not enhance phase separation.
The crystallization of the lithium silicate glass shown in Fig. 8 was studied
by nonisothermal DSC, using Eq. 12 to calculate the activation energy for
crystallization. 41 The crystals of lithium mono silicate (Li 2 0' Si0 2 ) were nu-
cleated by Li 3 P0 4 crystals at about 650°C; at higher temperatures of about
850°C, the Li 2 0' Si0 2 crystals transformed to lithium disilicate (Li 2 0' 2Si0 2 )
by reaction with silica from the glass.
NUCLEATING AGENTS 87
Fig. 8 Replica electron micrograph of lithium disilicate crystals growing in a multi-
component lithium silicate glass, heated 1 h at 654°C and 4 h at 850°C. Magnification
26,000.
In many glasses with nucleating agents, neither phase separated regions nor
crystals seem to be the nucleating sites. What is the mechanism of nucleation?
After rejecting other possibilities. Hillig 42 suggested that these agents lower the
interfacial tension v between the crystal and the glass, thus increasing the rate
of nucleation by Eqs. 1 and 2. This idea has been confirmed by measurements
of crystal numbers as a function of time in lithium aluminosilicate glasses
containing different amounts of titania as a nucleating agent. 43 The change in
numbers of nuclei could be explained only by a reduction in the work w * of
Eq. 2. The activation energy Q for viscous flow was independent of titania
concentration. The change in titania concentration was too small to change the
heat of fusion appreciably, so the increase in nucleation rates must result from
a reduction in the interfacial energy y. Ions of high field strength can possibly
act as "surface active agents" to lower the interfacial energy. Barry et a1. 40 have
extended this idea in developing a detailed model for the enhancement of
crystalline nucleation by titania in lithium aluminum silicate glasses. They
argue that the Ti 4 + ions associate with nonbridging oxygen ions, causing these
88 CRYSTALLIZATION
ions and alkalis to concentrate at the edge of domains enclosing bridging
oxygens. With this model, Barry et al. explain some effects of composition on
nucleation rate in their glasses. Their model is speculative, but it shows that
the postulate of reduction of interfacial tension by nucleation agents is
plausible.
MORPHOLOGY
When crystals grow from a glass surface they often form a flat front progressing
into the interior on the glass. However, this growing front can have an irregular
shape and contain crystals of varied morphologies. 44
In a binary lithium silicate glass the lithium disilicate crystals grew as
spherical clusters, as shown in Figs. 1 and 9 in transmission electron micro-
graphs. 16
If a spherulite is defined as a spherical collection of crystals growing out of
Fig. 9 Transmission electron micrograph of a cluster of lithium disilicate crystals in
26 mol% Li0 2 , 74% Si0 2 glass, heated for 1034 min at 500°C. Unetched thinned
section. Magnification 30,000.
GROWTH 89
a common center, then these clusters of lithium disilicate crystals could be
called spherulites. However, many so-called crystalline spherulites in polymers,
liquid crystals, and minerals have a complex structure. 4S ,46 One characteristic
feature of these complex spherulites is a cross-like figure in the polarizing
microscope. These spherulites are often composed of helical, twisted strands of
crystallites emanating from their center. In the early stages of growth, the
morphology is sometimes similar to a sheaf.
Barry et a1. 40 found some polarization figures somewhat like those in
polymers in composite crystals of lithium metasilicate, Li 2 0' Si0 2 , and {3-
eucryptite in lithium aluminosilicate glasses. However, most of these figures are
not cross-like, but show some radial bands and other irregularities. Their
complexity is undoubtedly related to the filamentary interwoven structure of
the composite crystals, which may be similar to that of other complex
spherulites, but probably also has unique features. Dendritic composite crystals
also grow in these glasses.
When about 5 mol% alumina is added to a lithium silicate glass, the
morphology of the lithium silicate crystals growing in it is sharply changed
from spherical clusters to a laminar or micaceous structure, as shown by
comparing Figs. 8 and 9. The reason for this change is not clear because the
crystals apparently have the same composition in the two glasses.
In the sodium barium silicate system, barium disilicate crystals grow as
spherulites at undercoolings of greater than 100°C according to Burnett and
Douglas. 47 At smaller undercoolings, a platelet form of crystal grew either from
the crucible wall or the glass-air surface. At an undercooling of about 100°C,
the platelets developed perturbations that grew into fibrils at a size of about 1
mm. When the barium disilicate spherulites were aged for long periods, the
spherulites broke up into a lath-like structure. The reason for this change in
morphology is not clear; it could simply result from a reduction in surface
energy from the spherulitic to lathlike form.
In a magnesium aluminosilicate glass with 7% zirconia, IX-cordierite
(2MgO' 2Al 2 0 3 . 5Si0 2 ) crystallized at the glass surface as well as rods of
tetragonal zirconia. 48 These crystals grew into the glass with the zirconia rods
oriented perpendicular to the cordierite-glass interface, somewhat similar to
"cellular" precipitation in metals. At longer times, the zirconia rods broke into
particles. With 15% zirconia in the glass, the zirconia crystals grew as
dendrites.
GROWTH
The rate of growth of a crystal from a melt of the same composition, also called
freezing or solidification, is controlled both by heat flow and rearrangement
process at the melt rystal interface. It is difficult to be certain that heat flow
is not a factor in experimentally observed crystallization rates. Here is a rough
90 CRYSTALLIZATION
estimate of the crystallization velocities above which heat flow can be import-
ant. The heat flux J generated during freezing is
J = u Apf:t.H/ (14)
where A is the area of the growing crystal-liquid interface, p is the density of
the crystal, u is the rate of crystal growth, and f:t.H / is the heat of fusion per
unit mass of crystal. The heat flux also is proportional to the temperature
gradient dT/dX;
dT
J = AK -
dX
(15)
where again A is the area of heat generation and K is the thermal conductivity.
Equating Eqs. 14 and 15 gives a relation for the temperature gradient in terms
of known quantities. For a binary alkali silicate glass, using the parameters
K = 3(1O)-2W/em K, Lp = 10 3 J/cm3, u = 10- 4 cm/s, then dT/dX 3°/cm.
Thus in a bulk sample with dimensions in centimeters, the crystal-glass
interface can be 3° higher than the temperature of the external face when the
crystallization rate is 10- 4 em/s. Therefore one might expect to find heat-flow
effects in crystallization in glasses with growth rates higher than about 10- 4
cm/s.
Maximum crystallization rates for a number of glasses are listed in Table 3
of Chapter 2. Those rates for silica, germ ani a, phosphorous pentoxide, and the
organic polymer polyethylene adipate are well below 10- 4 cm/s, so it is
probable that heat-flow effects are not important in crstallization in these
materials. For the alkali disilicate and the borate glasses in the table, the rates
are above 10- 4 cm/s, so heat flow can be important in these glasses, depending
on sample geometry.
If the rate of crystal growth is determined by the rate of incorporation of
molecules into the crystal (interface control), then these rates should be
influenced by interface structure. Some theories of solid-liquid interface struc-
ture are reviewed in Ref. 50, and computer simulations of the interface
described in Refs. 51 and 52. Interface instabilities are reviewed in Ref. 53.
These studies support the importance of the entropy of fusion in determining
the interface structure and its influence on crystal growth. Jackson s4 first
emphasized the importance of the entropy of fusion in his factor IX:
p = A.Hf/RTm (16)
When IX < 2, Jackson found a "rough" interface in which liquid molecules can
transform to solid ones throughout the layer. For IX> 2, the interface is
"smooth", so that molecules from the liquid can only be incorporated into the
solid at steps in the solid surface.
Empirically the factor IX is valuable in distinguishing between types of crystal
growth from the melt. For IX> 2, growth is found to be anisotropic and faceted,
whereas for IX < 2, growth is isotropic without facets. Furthermore, the simple
GROWTH 91
kinetic model to be described below fits crystallization rates for 0( < 2 but not
for IX> 2.
As the temperature of a liquid is lowered under its freezing point its rate of
crystallization first rises to a maximum and then decreases, as shown in Fig. 1
of Chapter 2 for fused silica. This maximum can be understood qualitatively
as follows. As the temperature difference from the freezing temperature be-
comes greater, the driving force for crystallization is increased, increasing the
rate. However, the rate of motion of the molecules becomes slower as the
temperature is lowered, decreasing their rate of incorporation into the crystals.
The net effect of these two competing processes is a maximum in the growth
rate.
Theories of varying complexity have been proposed to explain growth of
crystals from the melt. 5S - S7 However, their validity is still a matter of
considerable controversy. In this discussion a simple equation is first compared
to the experimental results of glasses, and then some of the more esoteric ideas
that have been invoked for crystallization from the melt are discussed.
Consider a crystal growing into a melt of the same composition. The rate
of crystallization should be proportional to two factors: a gradient of a driving
force and a coefficient that is the unit force needed to bring about the
rearrangement of liquid to solid. Fluxes in kinetic processes are usually linearly
related to two such factors; H. A. Wilson. suggested such a relation for
crystallization velocity many years ago. S8 The driving force for crystallization
from the melt at a temperature Tis the difference in Gibbs free energy between
the liquid and crystal,
6G = 6H f (T m - T)/Tm
(17)
where 6H f is the heat of fusion at the melting point Tm. Equation 17 is valid
when the heat capacities of the liquid and crystal are about equal. The velocity
of crystallization u is the gradient in 6G divided by a force f,
u = 6Hf(Tm- T)
fA Tm
fis the force required to rearrange the amount of material from liquid to crystal
needed to give unit velocity, and A is the thickness of the transition layer
between liquid and crystal. The force to move a particle of diameter d through
a medium of viscosity,., at unit velocity is 31t ,.,d. If this force is the same as the
forcefin Eq. 18, and d is about the same size as A, then
(18)
6Hf(Tm- T)
u=
31tA 2,., Tm
Equation 19 has frequently been used to compare with solidification data.
Equation 17 for the driving force should be reliable, and one would expect the
rearrangement of molecules from liquid to crystal to be related to the viscosity.
(19)
92 CRYSTALLIZATION
Thus the temperature dependence of crystallization velocity and the depend-
ence on !J.H / and '1 should be given by Eq. 19. A convenient way to test the
validity of the temperature dependence of Eq. 19 is to plot the product U'1 as
a function of temperature. Such a plot for crystallization and melting of
germania 59 shows the linear dependence of U'1 on !J. T and the continuity
between crystallization and melting rates. Similar plots result for silica 60
and P 2 0 5 glasses. 61 See also Fig. 1, Ch. 2. Values of u'1/!J.T calculated
from Eq. 19 and measured are compared in Table 2, using A.= 0.3 nm. The
calculated values are ten to twenty times lower for Si0 2 and Ge0 2 and about
equal to that measured for P Z 05' The discrepancies result from uncertainties
in geometrical factors in Eq. 19, in the use of the force-velocity equation
(sometimes called the Stokes-Einstein equation), and in values of ,\ and d.
Nevertheless these comparisons suggest that the most important factors
determining the crystallization rates in these oxides have been identified,
especially for the temperature dependence.
Values of IX in Table 2 are below two for Si0 2 and Ge02 (rough interface)
and above two for P Z05' Consistent with the above discussion, growth of Si0 2
and Ge0 2 crystals is isotropic, whereas P 2 0 5 is faceted.
For many other glass-forming systems with large values of IX (four or
greater), the temperature dependence does not fit Eq. 19,57 nor are melting and
crystallization rates similar. The reason for these deviations from the simple
theory are not clear.
Impurities and defects can markedly modify crystallization rates in glasses.
These effects are usually related to changes in viscosity of the glass. For
TABLE 2 Comparison of Measured and Calculated Rates of Crystallization of Glasses
Reduced
Entropy
ul'//6 Tin cm P/sec OK of Fusion
Measured Calculated L/RT..
Glass
Crystal
Si0 2
GeO
P 2 0 S
Constant ul'//6 T at all undercoolings
Cristobalite 0.14 0.008
Hexagonal Ge0 2 0.21 0.02
Tetragonal 0.035 0.036
P 2 0 S
Divitrite
Na 2 0'3CaO'6Si0 2 0.008
Constant ul'//6 T at larger undercoolings only
K 2 0 . 2Si0 2 0.06
Na 2 0 . 2Si0 2 0.05
Salol 1.2(10)-4
17Na 2 0,12CaO
2A1 2 0 3 , 69Si0 2
K 2 0.2Si0 2
Na 2 0 . 2Si0 2
Salol
0.46
1.3
3.1
3.7
>3.0
GROWTH 93
example, fused silica crystallized much more rapidly in the presence of water
or oxygen than without them. 62 These gases are known to lower the viscosity
of fused silica. Crystal growth in slightly reduced germania is faster than in
stoichiometric material,59 again paralleling a reduction in viscosity: Sodium
impurity in germania also increases the growth rate; the effect may be
intensified by concentration of the sodium ahead of the growing interface.
Various transition metal ions, such as iron, zinc, and vanadium, at concentra-
tions of a few percent were found to increase crystallization rates in alkaline
earth aluminosilicate glass, whereas chromium ions decreased the rate of
crystal growth. 63
The crystallization of organic polymers 64 - 67 is a specialized subject not
treated in depth here. The rate of growth of polymer crystals is often modeled
by a "secondary" nucleation process at the growing crystal-liquid interface.
The crystallization velocity for this kind of process fits an equation of the form
u = C exp ( : ) (20)
where Band C are coefficients constant with temperature. Such an equation
was found by Hillig to be valid for growth in the c-direction of ice. 68 Hillig
interpreted this functionality to result from the continued nucleation of new ice
layers on the growing crystal.
An alternative model of polymer crystallization involves attachment of short
polymer segments to the edge of a flat crystal. bb,b7 Sites on the top and bottom
of the crystal are pinned by hooks and folding chains, so these surfaces do not
grow. This model also seems to fit the temperature dependence of polymer
growth rates.
In growth of crystals from the vapor phase, steps on the crystal surface
sweep across it to add material. This "layer spreading" mechanism was
confirmed by experiments on the growth of filamentary crystals or
"whiskers".69 This mechanism also can be important in crystal growth from
the melt on "smooth" interfaces ( > 2),56 as shown by the elegant experiments
of Sears on the melting and freezing of p-toluidine. 70 How widespread this
mechanism is in crystal growth from the melt is not certain.
A suspension of colloidal particles about 0.2 m in diameter serves as a hard
sphere model of crystallization in simple liquids and glasses; and of the glass
transition. 71 Such a suspension was studied as a function of volume fraction of
the particles. Up to a volume fraction of 0.574, the simulated "crystallization"
of these particles was analogous to classical nucleation and growth. Above this
volume fraction, the "mechanism" of crystallization changed, and large asym-
metric crystals formed. The authors identified the range of volume fractions
from 0.574 to 0.581 with the glass transition. These particles with minimal
interaction forces may be a reasonable model for molecular glasses such as
glycerol, but it is not clear that they are valid models for network glasses such
as silicates.
94 CRYSTALLIZATION
FLUORIDE GLASSES
Crystals in fluoride glasses can degrade the optical properties of these glasses
and reduce their value for many applications in fiber optics and as optical
components. Crystallization in these glasses has been described in reports from
conferences on halide glasses. 72 - 74 In this section, results of some studies at
Rensselaer are discussed as an example of crystallization of these glasses.
Compositions of some of the glasses studied are given in Table 3.
In zirconium barium based fluoride glasses, the main crystallizing phases are
BaF 2 . ZrF 4 and BaF 2' 2ZrF 4' both of which have and P structural modifi-
cations. The heat of fusion of p-BaZr 2F 10 is estimated to be about 7800 j/mol
from crystallization experiments with the DSC glass. 7 5 The melting tempera-
ture of this crystal is about 570°C, so = 1.1. This result agrees with the
nonfaceted morphologies of surface crystals,76 although spherulites were ob-
served by Neilson et al. 77
The crystallization of a ZBL glass isothermally and at different heating rates
was studied in the DSC by Bansal et al. 30 They found values of the activation
energy Q and exponent n, calculated as described in the experimental section,
within experimental error in the two methods. Thus one can use the
nonisothermal method of calculating the kinetics parameters with confidence,
with the condition that Eq. 11 gives the correct temperature dependence. In
these experiments, the coefficient n was within experimental error of three,
suggesting that the particles are all of the same size (rapid initial nucleation)
and grow at a constant rate. Bansal et apo found a final crystallite size of
about 60 nm by X-ray line broadening, corresponding to a crystallite density
of about 5(10)15/ cm 3. Nucleation was probably homogeneous to give such a
high, uniform density.
Measurements of kinetic parameters from DSC experiments for a variety of
TABLE 3 Acronyms and Batch Compositions of the Heavy Metal Fluoride Glasses
Glass Composition (mol%)
Glass ZrF4 BaF 2 LaF 3 AIF3 LiF NaF PbF 2
ZB 65.0 35.0
ZBL 62.0 33.0 5.0
ZBLA 58.0 33.0 5.0 4.0
ZBLLi 58.0 15.0 6.0 21.0
ZBLN 58.0 15.0 6.0 21.0
ZBLPb 58.8 31.4 4.8 5.0
ZBLAN 55.8 14.4 5.8 3.8 20.2
ZBLALi 50.7 20.7 5.2 3.2 20.2
ZBLALiPb 49.83 16.96 5.06 3.16 20.09 4.09
FLUORIDE GLASSES 95
fluoride glasses are summarized in Table 4 (from Ref. 72, p. 434). These results
show agreement between isothermal and constant heating rate measurements.
For the ZB, ZBL, ZBLPb, and ZBLALi glasses, the exponent n is within
experimental error of three, suggesting a constant number of particles growing
at a constant rate (interface control). The ZBLA, ZBLLi, ZBLALiPb and
ASYM fluoride glasses have n values significantly below three, suggesting some
contribution of diffusion control in these glasses. Neilson et al. 77 measured the
growth of crystals in ZBLA glass directly, and found that the radius of the
particles grew proportional to the square root of time, as expected for diffusion
control.
The activation energies for crystal growth in Table 4 are consistent with the
activation energies for viscous flow in these glasses. The activation energy for
viscous flow at the low temperatures is in the range from 1000 to 1500 kj/mol,
whereas at the higher temperatures, it is about 100 kj/mol. The activation
energies for crystallization are between these two values, and are about what
one would expect for viscous flow at the crystallization temperature if a smooth
curve is drawn between viscosity data at the two temperature extremes.
At 390°C, surface crystals on a ZBL glass grew at a rate of about 7( 10) - 7
cm/s. The bulk crystallization velocity v as calculated from DSC measurements
and X-ray measurements of R/, was about 4(10)-8 cm/s, or more than an order
of magnitude lower. These results can be compared with a crystallization rate
of 390°C calculated from Eq. 19. Estimates of the required parameters are:
A.H / = 7.8 kJ/mol, Till = 560°, A.T= 170°C,,, = 2000 Pa-s, A._3(1O)-10 m. Then
u is about 1.5(10)-8 cm/s, which is in surprisingly good agreement with the
measured value.
Crystallization in the system of BaZn YbTh fluoride glasses shows a
complex series of crystalline phases, including a Ba YbTh fluoride phase that
decomposes to BaThF 6 and YbF 3 phases as the temperature increases, and
partial dissolution of a zinc fluoride phase. 78
TABLE 4 Crystallization Parameters in F)noride Glasses from
Isothermal and Constant Heating Rate Measurements in the DSC
n
Constant Heating
Glass Isothermal Rate Q(kJjmol)
ZB 3.1 374
ZBL 3.2 3.4 315
ZBLA 1.8
ZBLALi 3.3 3.2 182
ZBLPb 2.9 2.8 320
ZBLLi 2.5 2.3 236
ZBLALiPb 2.2 2.3 190
96 CRYSTALLIZATION
REFERENCES
1. S. D. Stookey, U. S. Patents 2, 920,971 and 2, 933,857, 1960.
2. S. D. Stookey and R. D. Maurer, in Progress in Ceramic Science, 1. J!. Burke, Ed.,
Pergamon, New York, 1962, p. 77.
3. P. W. McMillan, Glass-Ceramics, 2nd edn., Academic Press, London, 1979.
4. G. H. Beall, J. Noncryst. Solids, 129, 163 (1991).
5. R. H. Doremus, Rates of Phase 7ransformations, Academic Press, Orlando, FL,
1985, Ch. 4 and 5.
6. 1. H. Simmons, D. R. Uhlmann, and G. H. Beall, Eds., Nucleation and Crystalliza-
tion in Glasses, American Ceramic Society, Columbus, OH, 1982.
7. G. E. Rindone, J. Am. Ceram. Soc., 45, 7 (1962).
8. British Patent No. 863,569, 1961; see Ref. 3, p. 65.
9. C. J. R. Gonzalez-Oliver and P. F. James, in 1. H. Simmons, D. R. Uhlmann, and
G. H. Beall, Eds., Nucleation and Crystallization in Glases, American Ceramic
Society, Columbus, OH, 1982, p. 49.
10. S. D. Stookey, J. Am. Ceram. Soc., 32, 246 (1949).
11. R. D. Maurer, J. Appl. Phys., 29, 1 (1958).
12. R. N. Dalton, U.S. Patent, 2, 422,472, 1947.
13. S. D. Stookey, U.S. Patent 2, 515,275, 1940.
14. 1. S. Stroud, J. Chem. Phys., 35, 844 (1961); 37, 836 (1962).
15. R. H. Doremus, in Symp. on Nucleation and Crystallization in Glasses, American
Ceramic Society, Columbus, OH, 1962, p. 119.
16. R. H. Doremus and A. M. Turkalo, Phys. Chem. Glasses, 13, 14 (1972).
17. P. F. James, Phys. Chem. Glasses, 15, 95 (1974).
18. P. F. James, J. Noncryst. Solids, 73,517 (1985).
19. K. Matusita and M. Tashiro, J. Noncryst. Solids, 11,471 (1973).
20. G. F. Neilson and M. C. Weinburg, J. Noncryst. Solids, 34, 137 (1979).
21. P. F. James, in 1. H. Simmons, D. R. Uhlmann, and G. H. Beall, Eds., Nucleation
and Crystallization in Glasses, American Ceramic Society, Columbus, OH, 1982,
p. 1.
22. A. L. Greer and K. F. Kelton, J. Amr. Ceram. Soc., 74, 1015 (1991).
23. M. Avrami, J. Chem. Phys. 1,7, 1103 (1939); 8,212 (1940); 9, 177 (1941).
24. L. C. Klein, C. A. Handwerker, and D. R. Uhlmann, J. Cryst. Growth, 42,47 (1977).
25. D. Cranmer, R. Salomaa, H. Yinnon, and D. R. Uhlmann, J. Noncryst. Solids, 45,
127 (1981).
26. A. Hishinuma and D. R. Uhlmann, J. Noncryst. Solids, 94&96, 449 (1987).
27. H. E. Kissinger, J. Res. Natl. Bur. Stand., 57, 217 (1956).
28. J. A. Augis and 1. E. Bennett, J. Thermal Anal., 13,283 (1978).
29. K. Matusita and S. Sakka, J. Noncryst. Solids, 33-39, 741, (1980).
30. N. P. Bansal, R. H. Doremus, A. 1. Bruce, and C. T. Moynihan, J. Am. Ceram. Soc.,
66, 233 (1983).
31. X. J. Xu, C. S. Ray, and D. E. Day, J. Am. Ceram. Soc., 74, 909 (1991).
32. 1. W. Christian, The Theory of Transformation in Metals and Alloys, Pergamon
Press, Oxford, 1965, p. 492/1'.
33. D. R. Macfarlene, M. Matecki, and M. Poulain, J. Noncryst. Solids, 64, 351 (1984).
34. 1. H. Arita, D. L. Williamson, and G. R. Purdy, J. Am. Ceram. Soc., 75,3315 (1992).
35. I. Sawai, Glass Technol., 2, 243 (1961).
36. P. S. Rogers and J. Williamson, Glass Technol., 10, 128 (1969).
REFERENCES 97
37. S. Lyng, 1. Markali, 1. Krogh-Moe, and N. H. Lundberg, Phys. Chem. Glasses, 11,
6 (1970).
38, S. P. Mukherjee and P. S. Rogers, Phys. Chem. Glasses, 8, 81 (1967).
39. R. D. Maurer, J. Appl. Phys. 33, 2132 (1962).
40. T.1. Barry, D. Clinton, L. A. Lay, R. A. Mercer, and R. P. Miller, J. Mater. Sci., 4,
496 (1969); 5, 117 (1970).
41. W. F. Hammetter and R. E. Loehman, J. Am. Ceram. Soc., 70, 577 (1987).
42. W. B. Hillig, in Symp. on Nucleation and Crystallization in Glasses and Melts,
American Ceramic Society, Columbus, OH, 1962, pp. 77.
43. U. Schiffner and W. Panhorst, Glastech. Ber., 60, 239 (1987).
44. H. R. Swift, J. Am. <;eram. Soc., 30, 165 (1947).
45. A. Keller, in Growth and Perfection of Crystals, R. H. Doremus, B. W. Roberts, and
D. Turnbull, Eds. Wiley, New York, 1958, p. 499.
46. H. D. Kieth and F. 1. Padden, J. Appl. Phys., 34, 2409 (1963).
47. D. G. Burnett and R. W. Douglas, Phys. Chem. Glasses, 12, 117 (1971).
48. M. McCoy, W. E. Lee, and A. H. Heuer, J. Am. Ceram. Soc., 69, 2921 (1986).
49. W. Vogel, Glas-chemie, VEB/Deuscher Verlag fur Grundstoffindustrie, Leipzig,
Germany, 1979.
50. D. W. Oxtoby and A. D. Haymet, J. Chem. Phys., 76,6262 (1982).
51. G. H. Gilmer, Science, 208, 355 (1980).
52. D. Frenkel and 1. P. McTague, Annu. Rev. Phys. Chem., 31, 491 (1980).
53. J. S. Langer, Rev. Mod. Phys., 52, 1 (1980).
54. K. W. Jackson, in Growth and Perfection of Crystals, R. H. Doremus, B. W. Roberts,
and D. Turnbull, Eds., Wiley, New York, 1958, p. 319.
55. 1. W. Cahn, W. B. Hillig, and G. W. Sears, Acta Met., 12, 1421 (1964).
56. K. A. Jackson, D. R. Uhlmann, and 1. D. Hunt, J. Cryst. Growth, 1, 1 (1967).
57. D. R. Uhlmann, in 1. H. Simmons, D. R. Uhlmann, and G. H. Bell, Eds., Nucleation
and Crystallization in Glasses, American Ceramic Society, Columbus, OH, 1982,
p.80.
58. H. A. Wilson, Phi/os. Mag., SO, 238 (1900).
59. P. 1. Vergano and D. R. Uhlmann, Phys. Chem. Glasses, 11, 30, 39 (1970).
60. F. E. Wagstaff, J. Am. Ceram. Soc., 52, 650 (1969).
61. R. L. Cormia,1. D. Mackenzie, and D. Turnbull, J. Appl. Phys., 34, 2239 (1963).
62. N. G. Ainslie, C. R. Morelock and D. Turnbull, in Symp. on Nucleation and
Crystallization of Glasses, American Ceramic Society, Columbus, OH, 1962, p. 97.
63. 1. Williamson, Mineral Mag., 37, 759 (1970).
64. L. Mandelkern, Crystallization of Polymers, McGraw-Hill, New York, 1964.
65. A. Kellar, Rep. Prog. Phys., 31, Pt. 2, 623 (1968).
66. D. M. Sadler and G. H. Gilmer, Polymer, 25, 1446 (1984); Phys. Rev., B38, 5684
(1988).
67. G. Goldbeck-Wood, J. Polym. Sci., Polym. Phys., B31, 61 (1993).
68. W. B. Hillig, in Growth and Perfection of Crystals, R. H. Doremus, B. W. Roberts
and D. Turnbull, Eds., Wiley, New York, 1958, p. 350.
69. G. W. Sears, Acta Met., 1,457 (1957).
70. G. W. Sears, J. Chem. Phys., 23, 1630 (1955).
71. W. Van Megan and S. M. Underwood, Nature, 362, 616 (1993).
72. M. G. Drexage, C. T. Moynihan, and M. Robinson, Eds. Mater. Sci. Forum, 19-20,
429 (1987).
73. M. Y. Yamane and C. T. Moynihan, Eds., Mater. Sci. Forum 32-33, 185 (1988).
98 CRYSTALLIZATION
74. G. H. Frischat and C. T. Moynihan, Eds., Mater. Sci. Forum 67-68, 187 (1991).
75. N. P. Bansal and A. 1. Bruce, R. H. Doremus, and C. T. Moynihan, SPIE, 484,51
(1984).
76. N. P. Bansal and R. H. Doremus, J. Am. Ceram. Soc., 66, C-132 (1983).
77. G. F. Neilson, G. L. Smith, and M. C. Weinberg, Mater. Res. Bull., 19, 577 (1984).
78. R. Garcia, R. H. Doremus, N. P. Bansal, S. H. Ko, and T. Margraf, J. Matis. Res.,
3, 989 (1988).
CHAPTER 6
VISCOSITY
The viscosity of a glass is one of its most important technological properties.
It determines the melting conditions, the temperatures of working and anneal-
ing, fining behavior (removal of bubbles from the melt), upper temperature of
use, and devitrification rate. The viscosities of different glasses vary enormously
with composition and are strong functions of temperature.
When a shearing force is applied to a liquid, it flows and the viscosity is a
measure of the ratio between the force and rate of flow. If two parallel planes
of area A, a distance d apart, are subjected to a tangential force difference F,
the viscosity 11 is defined as
Fd
11 =-
Av
where v is the relative velocity of the two planes. The most common viscosity
unit is the poise (P), which is a dyne-second per square centimeter or a gram
per centimeter per second. In most literature, viscosity is reported in poises.
The SI unit of viscosity is the pascal-second or Pa-s; 1 Pa-s = 10 P. The
viscosity of most common fluids such as water and organic liquids is about one
hundredth of a poise at room temperature.
The viscosity can also be defined in terms of a strain rate corresponding to
an applied stress. For example, if a rod or fiber is pulled by a stress S, and it
deforms at a rate dL/dt, where L is the length of the rod and t is the time, then
(1)
SL o S
11 = dL/dt = de/dt
(2)
where Lo is the initial length of the rod, and de/dt is the strain rate. This
99
100 VISCOSITY
relation is strictly valid only for the limiting deformation rate at the beginning
of deformation. See Ref. 1 for a more complete discussion of the definition of
viscosity, and Refs. 1 and 2 for consideration of viscoelasticity, the combination
of elastic deformations and viscous flow.
The working point of a glass is defined as the temperature at which it has
a viscosity of 104 P. At this temperature, the glass can be readily formed or
sealed. The softening point of a glass is the temperature at which it has a
viscosity of 107.6 P. At this viscosity, a rod about 24 cm long and 0.7 mm in
diameter elongates 1 mm/min under its own weight. The annealing point is the
temperature at which the viscosity is 10 13 . 4 P, and the strain point, the
temperature at which the viscosity is 10 1406 P. The thermal expansion curve of
an annealed glass begins to deviate considerably from linearity at a viscosity
of about 10 14 or 10 15 P. At the annealing temperature, a rapidly cooled silicate
glass becomes reasonably strain-free ih about 15 min.
The viscosities of several commercially important silicate glasses are com-
pared in Fig. 1, a.s a function of temperature. The working, softening, and
16
12
\
\
\
\
\
\
KG-I
ALKALI- \
LEAD
--
\
______ ANNEALlNL
POINT
Ii: 10
>-
...
in
8
U)
;;: 8
S!
_ _ _SOFTENIN L
POINT
6
4
WORKING
-POINT-----
800 1000
TEMPERATURE toC)
Fig. 1 Viscosity of some commercial silicate glasses listed in Chapter 1 Table 1.
2400
600
1200
MEASUREMENT 101
annealing points are marked on the plot. Some other properties of these glasses
and their approximate compositions are given in Chapter 1, Table 1.
MEASUREMENT
Two methods are most frequently used to measure viscosity in glass: one at
low viscosity and the other at high viscosity. At low viscosity (up to 10 8 P),
the rotating cylinder or crucible method appears to be the most reliable. In this
method, the relative rate of rotation of two concentric cylinders is measured at
a constant torque, and the viscosity is inversely proportional to the rate of
rotation. Usually the viscometer is calibrated with liquids of known viscosity,
but with care, absolute measurements can be made. Higher viscosities are
measured by the rate at which a glass rod elongates under a fixed force. The
viscosity is then given by the formula
Lmgf
" = 31tR 2 v
where L is the length of the glass rod, R is its radius, m is the mass hanging on
it, g is the gravitational constant, v is an instrumental reading proportional to
the rate of elongation, and f is a calibration factor for the instrument.
Two problems arise in measuring the viscosity of viscous materials: one is
the variation of viscosity with time, and the other is its variation with the force
applied. Many investigators have found that the measured viscosity is not a
function of applied force or velocity of flow, 3 implying that glass is a
Newtonian liquid in which the flow rate is directly proportional to the shearing
stress. At high'stresses, roughly above 50-100 MPa for silicate glasses, the
apparent viscosity becomes smaller than at lower stresses at temperatures of
50-100°C above the glass transition temperature. 4 . 5 At low stresses and high
viscosities, elastic and anelastic (delayed but recoverable) deformations can
interfere with viscosity measurements. 2 ,6
The deviations from Newtonian flow at high stresses possibly result because
the glass melt develops a flattened or layered structure at these stresses, 7 as also
suggested by computer simulations of flow. 8
Lillie studied the change of viscosity of glasses with time at the measuring
temperature. 9 He found that above a viscosity of about 10 16 P, the viscosity
of samples cooled quickly from a higher temperature initially appeared to be
low, and asymptotically approached some higher value with time of holding at
the measuring temperature. The same asymptotic "equilibrium" viscosity was
found when a sample was held at a lower temperature for a long time and then
raised to the measuring temperature. The deviation of the initially measured
viscosity from the equilibrium viscosity became progressively greater at higher
viscosities until, above about 10 16 P, it was not possible to measure the
equilibrium viscosity even after very long times at the measurement tempera-
ture. Thus this viscosity of 10 16 P should be considered as the upper limit of
(3)
102 VISCOSITY
measurable values, and any viscosity measured higher than this cannot be
considered an equilibrium value. These results and conclusions of Lillie have
been confirmed in a more recent study of commercial soda-lime silicate glass
rods and tubes in bending. 10
The variation of viscosity with time of a quenched sample involves a
structural change from a state characteristic of a higher temperature to that of
a lower temperature. The change is slow because the structural elements of the
glass rearrange slowly, as reflected in the high viscosity. The exact structural
nature of this rearrangement is uncertain. As a rough model one can think of
the glass network as being progressively broken up as the temperature
increases. When a glass sample is cooled quickly from a higher temperature,
the network flows more easily because it has more broken bonds than at
equilibrium at the lower temperature. As these bonds heal with holding at the
lower temperature the viscosity increases to the equilibrium value. This model,
as well as stress relaxation and viscoelasticity, is discussed further in the next
chapter on glass transition.
SIMPLE GLASS-FORMING OXIDES
As with many transport properties, the viscosity 11 fits an Arrhenius-type
equation over some ranges of temperature:
11 = 110 exp (iT )
(4)
where Q and 110 are temperature-independent coefficients called the activation
energy and the pre-exponential factor, respectively.
Figure 2 shows the logarithm of viscosities of various simple glass-forming
oxides as a function of reciprocal temperature. The activation energies for
viscous flow of these glasses are given in Table 1.
The data for silica and germania were carefully selected from those of many
workers as being the most reliable. The viscosity is decreased by the presence
of small amounts of impurities, as discussed below; this is one of the main
reasons for errors. Hetherington et ai. 11 showed that at lower temperatures
silica must be held for long times at the measuring temperature before a
reproducible value of viscosity can be measured. Hofmaier and Urbain 12
suggested that the higher activation energies found by many investigators at
lower temperatures resulted from mixtures of liquid and crystals. However,
Hetherington et ai. took their samples from the center of a silica block, and
since only surface crystallization occurs in a pure sample, they should have
avoided crystallization. Hofmaier and Urbain claimed that the measurements
of Fontana and Plummer 18 at low temperatures gave activation energies close
to their high temperature values, but the absolute values of Fontana and
Plummer agree closely with those of Hetherington et aI., still implying a low
activation energy at higher temperature. Some authors have stated that the
SIMPLE GLASS-FORMING OXIDES 103
17 800 600 500
15
w
f/j 13 /
0 ro' + 0.2% H,O
Q.
"
11 "
"
"
u 9 Si0 2 " Ge02 "
f/j , "
:> , ,
0 /
8 7
-I
5
3
3 13
Fig. 2 Viscosities of various glass-forming oxides as a function of reciprocal tempera-
ture. Dashed lines show interpolations where data were not taken.
activation energy for flow of vitreous silica is constant, but this discussion and
the data in Fig. 2 and Table 1 show that for pure water-free silica, the
activation energy changes substantially over the temperature range from
ll00°C to 2500°C.
The data of Kurkjian and Douglas 13 on vitreous germania show a constant
activation energy over a factor of 10 10 change in viscosity. However, the data
on vitreous silica definitely show a change in activation energy with tempera-
ture, and the results for B 2 0 3 show a large change in activation energy with
temperature. Also, multicomponent silicate glasses for which viscosity data are
plotted in Fig. 1, and the organic glasses shown in Fig. 4, have changing
TABLE 1 Activation Energies for Viscous Flow of Various Glasses
Glass
Activation
energy
(kcal/mol)
Temperature
range
("C)
Refs.
Vitreous silica
170
123
75
41.5
83-12
Vitreous germania
Vitreous P20S
Vitreous B 2 03
1100-1400
160():..2500
540-1500
545-655
26-1300
11
12
13
14
15,16.17
104 VISCOSITY
activation energies for viscous flow as a function of temperature. From
calorimetric measurments of the glass transition temperature of P 2 0 3 , Martin
and Angell 19 concluded that the activation energy for its viscous flow from
317°C to 636°C at least was constant.
The strengths of oxygen-<:entral atom bonds in the simple oxides such as
Si0 2 , Ge02' P 2 0 5 , and B 2 0 3 are about 100 kcal/mol. The very great difference
in viscosity of these oxides shown in Fig. 2 is. therefore, quite surprising, since
the mechanism of flow undoubtedly involves breaking of oxide bonds. The
melting points of the crystalline oxides parallel the variations in viscosity: Si0 2
(cristobalite) 1710°C; Ge02 (hexagonal), 1116°C; P Z 05' 580°C; B 2 0 3 , 450°C.
The differences indicate that the detailed structure of the oxide network is also
important in determining the ease of viscous flow. The linked-ring structure of
B 2 0 3 , described in Chapter 3, is the probable reason for the low viscosity of
this oxide, since the bonds between rings should be weaker than those in the
rings. This structure also provides an explanation for the strong temperature
dependence of the activation energy. The bonds between the rings should have
a spectrum of strengths leading to a change in the effective activation energy
for flow as a function of temperature. The P 2 0 S network possibly contains
sheets of P0 4 tetrahedra, as mentioned in Chapter 3; each tetrahedron is
bonded to three others instead of four as for Si0 2 and Ge02' The lower
viscosity and melting point of P 2 0 5 may result from this structure.
Judged by their structure Ge0 2 and Si0 2 should have a similar viscosity
and melting point, since each apparently forms a random three-dimensional
network in the rigid state (see Chapter 3). The great difference between both
the absolute viscosity and its temperature dependence leads to doubt about the
structual similarity. The random-network structure for vitreous silica is well
established, as described in Chapter 3; thus there may be some subtle weakness
in the germania network. Gcrmania may also be more susceptible to impurity
effects than silica, although there is no direct evidence for this contention.
The viscosities of the simple oxides decrease sharply with the addition of
most impurity ions. Such impurities as water, in the form of -OH groups, and
alkali oxides are particularly effective in lowering viscosity. For example, the
addition of 0.1 wt% hydroxyl ion lowers the activation energy of flow for
vitreous silica at temperatures from 1000 to 1400°C from 170 to 122 kcal/mol.
The actual viscosity is lowered about three orders of magnitude at l000°C by
this addition, but is not too different from the value for water-free silica at
1400°C, as shown in Fig. 2. It is strange that the activation energy for silica
containing water at lower temperatures is about the same as for water-free
silica at higher temperatures. and extrapolates to about the same absolute
values for the water-free material. Is this correspondence a coincidence? The
answer is not clear. The addition of 0.165 mol% Na 2 0 to germania lowers the
viscosity by a factor of about 46 at l000°C, and also causes a decrease in the
activation energy of flow and a change in the activation energy with tempera-
ture. 13
The viscosity of germania (GeO 2) unexpectedly decreases with increasing
MUL TICOMPONENT OXIDES 105
pressure at 1425°C by a factor of about five for a pressure of 9.5 kbar,
compared to atmospheric pressure. 20
MUL TICOMPONENT OXIDES
The addition of other oxides to silica invariably lowers its viscosity. The
lowering is greatest with addition of alkali oxides and least with alkaline earth
oxides and alumina. At higher temperatures, the effect of alumina is less than
for other oxides. Zinc and boric oxides among the multivalent oxides are
particularly effective in lowering the viscosity of silicates. Morey3 has collected
data on the viscosity of many different silicate glasses and has given factors for
the calculation of viscosity in soda-lime and soda-lead silicate glasses when
other oxides are added to them. Additional viscosity data on commercial
silicate glasses and binary and ternary silicates have been collected in Refs. 21
and 22.
The activation energy for viscous flow in multicomponent silicate glasses
decreases as the temperature is increased.9.1o.23 At low temperatures where the
viscosity is above 10 12 P, the activiation energy for flow of sodium silicate
glasses is about 100 kcal/mol, and it decreases to 50 kcal/mol or less at high
temperatures where the viscosity is about 100 P. The value of 100 kcal/mol at
low temperatures is much less than the low-temperature activation energy for
flow in fused silica. The silicate lattice is broken up by the alkali oxide, making
flow easier. With increasing temperature, the activation energy decreases
relatively more rapidly in sodium silicates than in fused silica, apparently
because the lattice is already broken up by the alkali ions. A similar, more
rapid, decrease of activation energy with temperature occurs in B 2 0 3 , again
because of some weaker bonds.
The high-temperature activation energy of multicomponent silicates de-
pends on the amount of oxides other than silica in the glass. For binary alkali
silicates, this activation energy decreases from about 50 kcal/mol with 10%
alkali oxide to 20 kcal/mol with 50% alkali oxide. 24 For binary alkaline earth
silicate, the activation energy for viscous flow at high temperatures is about
40- 50 kcal/mol for 25- 50% alkaline earth oxide. 24
Bockris and co-workers 24 ,2s have proposed a model of liquid binary
silicates to explain these results and those of thermal expansion. At the
orthosilicate composition (2 mol of metal oxide per mol of Si0 2 ) the liquid
consists of metal cations and SiO:- anions. As more silica is added, the
anions polymerize to larger units, making flow more difficult. Among the larger
units in these anions are rings and chains of silica tetrahedra. "Islands" of
three-dimensional silica in the melt are proposed in a related model. 26 While
silicate melts must undoubtedly contain polymerized units of silica tetrahedra,
there is no direct evidence for any of the particular anions proposed, so these
models remain speculative.
The viscosity of B 2 0 3 also decreases when other oxides are added, but much
106 VISCOSITY
less than for Si0 2 . This result is expected because of the lower viscosity of
B 2 0 3 , resulting from some weaker bonds already present in the pure oxide. A
summary of viscosities and other properties of borate melts is given by
Mackenzie. 2 7
NONOXIDE GLASSES
Viscosities of heavy-metal (mainly zirconium) fluoride glasses have been
discussed by Drexhage,28 and there are data on nitrate, sulfate, chloride and
chalcogenide glasses. Especially curious is the viscosity of liquid sulfur, which
is low at the melting point, decreases with increasing temperature up to 160°C,
where it abruptly increases by a factor of about 10,000 over a temperature
range of 20°C, and then decreases again at higher temperatures. At the melting
point, the liquid contains S8 rings; at about 160°C, these rings break up and
polymerize to long chains, causing the rise in viscosity. At higher temperatures,
the chains decrease in length, again lowering the viscosity.3o.31
Miller 32 has discussed and given references to earlier work on viscosities of
glassy polymers.
Viscosity data on a number of organic glasses have been collected by Ling
and Willard. 33 The activation energy for flow is constant with temperature
above a viscosity of about 10 4 P. These activation energies are in the range
from 12 to 35 kcal/mol. Since these measurements are at low temperatures
(75 - 200 K), the viscosity drops very sharply as a function of temperature at
these viscosities. For example, the viscosity of 2.methylpentane increases eight
orders of magnitude in about 15°C. At higher temperatures where the v,iscosity
is above 10 4 P, the activation energy for flow decreases with increasing
temperature.
TEMPERATURE DEPENDENCE
The viscosities of four very different materials as measured over a wide
viscosity range are shown in Figs. 3 and 4. In each case, the Arrhenius relation
for the exponential dependence of viscosity on the reciprocal of temperature
(Eq. 4) is obeyed at the highest viscosities, and in some cases at the lowest,
with an activation energy changing with temperature in between.
The temperature dependences of viscosities of different glasses can be
compared by plotting 34 ,3S log viscosity as a function of 1',/T, where 1', is the
temperature at which the viscosity is 10 13 P.
From this plot, glasses' can 'be sorted into roughly four different types, as
listed in Table 2, which perhaps correspond to different structures: 3S
1. Strong network liquids show linear or nearly linear behavior (fit Eq. 3)
TEMPERATURE DEPENDENCE 107
16
14
12
w
If)
(510
Q.
8
:>
2 6
8
..J
4
2
0 19 5
Fig.3 Viscosity of boron trioxide 34 and a soda-lime glass 3 (70 wt% Si0 2 , 21 % Na 2 0,
and 9% CaO) as a function of reciprocal temperature.
in the plot. The network structure resists thermal degradation as the
temperature is raised above the glass transition temperature.
2. Partially broken three-dimensional networks, as typified by alkali sili-
cates, are less resistant to thermal degradation, but the silicon-oxygen
network is still strong. Arsenic trisulfide perhaps is in this category
because it has an ordered structure in two dimensions. It is possible that
alkali-rich regions in alkali silicate glasses have a planar structure.
3. Liquids in this category have a more severely distorted structure; calcium
in the aluminosilicate anorthite (CaO . A1 2 0 3 ' 2Si0 2 ) apparently distorts
the silicon-oxygen network, and zinc chloride and hydrogen-bonded
organic liquids are perhaps less ordered on a short range than the
network liquids of classes one and two.
4. Completely ionic and molecular glasses such as the zirconium fluorides,
alkali-alkaline nitrates, and nonhydrogen bonded organics, have bonds
that are more easily exchanged between the first and second coordination
shell, and therefore their viscosity decreases even more rapidly as a
function of increasing reduced reciprocal temperature /T.
108 VISCOSITY
3.2 2.0
16
50 100 T,oC 200
14
12
10
w
If)
(5 8
a..
jg 6
u
If)
:;
0
8 4
-J
2
0
-2
-140 -120 -100 o T,oC
-4 2
8 7 5 4
10001T
Fig. 4 Viscosities of glass-forming fused salt, 0.4 KN0 3 -O.6Ca(N0 3 h 48
N -butylbenze. 3 3
and
TABLE 2 Classification of Viscous Liquids by Temperature Dependence
2 3 4
Si0 2 Alkali silicates CaAl 2 Si0 8 Heavy metal fluorides
(anorthite)
Ge0 2 Soda-lime silicates Alkali phosphates Multi-anion chlorides
P 2 O, As 2 S 3 ZnCl 2 O.4KN 0 3 -O.6Ca(NO 3)2
NaAlSi 3 0 8 n-Propanol
BeF 2 Butylbenzene
THEORIES 109
Angell 35 suggests that these categories lead from "strong" glasses (one) with
rigid networks to "fragile" glasses with molecules or ions that easily change
their coordination numbers (four).
The viscosities of glycerol 36 at high pressure and of confined organic
liquids 37 have been measured.
THEORIES
Theories for the viscosity of monomolecular liquids have the form of Eq. 4,
where '10 is a complicated function of various parameters, but usually varies
much less with temperature than the exponential term, and to a first approxi-
mation Q is temperature-independent. 38 In a treatment based on the molecular
theory of liquids, Q is equal to the mutual potential energy of a pair of
molecules,38 and in the transition state theory it is the height of the potential
barrier to mutual rotation of neighboring molecules. 39 The mutual potential
energy of molecules is at least calculable in principle, but the factors controlling
the heights of potential barriers in all but the simplest cases are quite uncertain.
Extension of these concepts to more complicated liquids, with strongly bonded
molecules, is very difficult and has not been successfully accomplished. Thus
other simpler approaches to the viscosity of glasses have been tried.
The empirical equation
'1 = '10 eXP (T! To )
(5)
where '170 and B are temperature-independent, has been found to fit viscosity
data for glasses over certain temperature ranges. 40 - 42 This equation is the
basis for two therories of viscosity: one based on "free volume" and the other
on entropy.
In the simplest form of the free-volume treatment,43-4S the viscosity is given
by the equation
'1 = '10 ex p ( V 1 vJ (6)
where V is the specific volume of the liquid and V o is its close-packed specific
volume. If the expansion coefficient is independent of temperature, Eq. 6 is
equivalent to Eq. 5, since then V - V o is proportional to T - To. This free-
volume treatment can be thought of crudely as follows. At some temperature
To, the molecules are packed together with the specific volume V o , and in this
condition no molecular motion is possible. As the temperature increases, some
excess or free volume V - V o develops in the liquid, providing "space" for
molecular motion and ultimately for flow. More elegant descriptions of this
model are given by Bueche 46 and by Cohen and Grest 47 .
In the entropy approach,48 it is assumed that the liquid consists of regions
110 VISCOSITY
that rearrange as units when they experience a sufficient fluctuation in energy.
Thus there is a barrier in potential energy to the rearrangements of the units.
The sizes of the units are functions of temperature and are determined by the
configurational entropy of the liquid. As this entropy decreases, the sizes of the
units increase until at zero configuration entropy, the size is infinitely large and
the liquid can no longer rearrange itself.
Quantitatively
tl = tlo exp (:;) (7)
where Sc is the configurational entropy. This equation is equivalent to Eq. 4
when Sc = 6.C p (T - To)/T, and 6.C p , the relaxational part of the specific heat,
is constant with temperature.
In Eq. 5, a third parameter To is introduced to account for the changing of
activation energy with temperature. Thus to establish more than empirical
significance for the equation, one must find some significant correlation for
values of To. Williams et al. 44 and Adams and Gibbs 48 found that To was about
50°C lower than the glass transition temperature Tg for many glasses. The glass
transition temperature in these correlations was defined as the temperature at
which there was a discontinuity in the coefficient of thermal expansion (see the
following chapter for a discussion of transition temperature).
Goldstein compared the free-volume and entropy theories of viscosity and
concluded that the entropy theory was superior,49 chiefly because the free-
volume theory cannot explain the pressure dependence of the glass transition
temperature.
However, the most serious defect of any theory that results in Eq. 5 for the
viscosity is that this equation is inconsistent with experimental data on
glass-forming liquids at high viscosities. In a variety of different glasses, the
activation energy for viscous flow becomes temperature-independent at high
viscosities (see Refs. 17 arid 33, and Figs. 3 and 4) just where Eq. 5 would
predict it should vary most sharply. Equation 4 provides an empirical fit to
data at intermediate temperature with some correlation between To and the
temperature at which other properties change, but the theoretical significance
of To for viscous flow is unclear. In at least two glasses, P20S and Ge02' To is
zero, since Eq. 4 is valid over the whole viscosity range in which measurements
were made.
Two more recent theories emphasize the importance of defects in the melt
structure as they affect viscosity. MottS I suggested that the concentration of
broken Si-O bonds in vitreous silica increases as the temperature increases,
and provides for easier flow. Mott showed that motion of the broken bonds
around an Si-O ring would lead to flow; he discusses other possibilities such
as the breaking of two or four neighboring bonds, and concludes that the latter
may be the most likely mechanism.
Brawer 52 has proposed a change in coordination number of a glass
constituent as the defect likely to result in flow, or at least in structural
REFERENCES 111
relaxation. These defects were suggested by computer simulations of flow in
melts, for example of calcium fluoride. The distribution of coordination
numbers is a function of temperature, pressure and glass composition. The
changes in coordination number result in density fluctuations in the melt. Flow
under a stress takes place by changing the distribution of the low density
region, although the total density is not changed. A detailed calculation of
viscosity from this model remains to be worked out.
All these theories need more development and testing before the mechan-
isms of viscous flow in glasses are understood.
REFERENCES
1. G. W. Scherer, Relaxation in Glass and Composites, Wiley, New York, 1986.
2. J. D. Ferry, Viscoelastic Properties of Polymers, Wiley, New York, 1970.
3. G. W. Morey, The Properties of Glass, Reinhold, New York, 1954, pp. 140ff.
4. G. H. Li and D. R. Uhlmann, J. Noncryst. Solids, 3, 127 (1970).
5. 1. H. Simmons, R. K. Mohr, and C. J. Montrose, J. Appl. Phys., 53,4075 (1982).
6. G. B. Bartenev, in Physics and Noncrystalline Solids, 1. A. Prins, Ed., North-
JjolIand, Amsterdam, 1965, p. 461; The Structure and Mechanical Properties of
Inorganic Glasses, Wolters-Nordhoff, Groningen, 1970, pp. 141ff.
7. S. M. Rekhson, D. M. Heyes, C. 1. Montrose, and T. A. Litovitz., J. Noncryst.
Solids, 38-39, 403 (1980).
8. T. F. Soules and R. F. Busby, J. Chem. Phys., 78, 6307 (1983).
9. H. R. Lillie, J. Am. Ceram. Soc., 16,619 (1983).
10. F. R. Gauthier, M. S. Thesis, Rensselaer Polytechnic Institute, 1975.
11. G. Hetherington, K. H. Jack, and J. C. Kennedy, Phys. Chem. Glasses, 5, 130
(1964).
12. G. Hofmaier and G. Urbain, in Science of Ceramics, Vol. 4, British Ceramics
Society, 1968, p. 25.
13. C. R. Kurkjian and R. W. Douglas, Phys. Chem. Glasses, 1, 19 (1960).
14. R. L. Cormia, J. D. Mackenzie, and D. TurnbulI, J. Appl. Phys., 34, 2245 (1963).
15. G. A. Parks and M. E. Spaght, Physics, 6, 69 (1935).
16. J. D. Mackenzie, Trans. Faraday. Soc., 52,1564 (1956).
17. P. B. Macedo and A. Napolitani, J. Chem. Phys., 49, 1887 (1968).
18. E. H. Fontana and W. A. Plummer, Phys. Chem. Glasses, 1, 139 (1966).
19. S. W. Martin and C. A. Angell, J. Phys Chem., 90, 6736 (1986).
20. S. K. Sharma, D. Virgo, and J. Kushiro, J. Noncryst. Solids, 33, 235 (1979).
21. N. P. Bansal and R. H. Doremus, Handbook of Glass Properties, Academic Press,
Orlando, FL, 1986.
22. O. V. Mazurin, M. V. Streltsina, and T. P. Shvaiko-Shvaikovskaya, Handbook of
Glass Data, Parts A, Band C, Elsevier, Amsterdam, 1983, 1985, 1987.
23. G. S. Meiling and D. R. Uhlmann, Phys. Chem. Glasses, 8, 62 (1967).
112 VISCOSITY
24. 1. O. Bockris, J. D. Mackenzie, and 1. A. Kitchener, Trans. Faraday. Soc., 51, 1734
(1955).
25. 1. W. Tomlinson, M. S. R. Heynes, and 1. O. Bockris, Trans. Faraday. Soc., 54,
1833 (1958).
26. 1. O. Bockris, 1. W. Tomlinson, and J. T. White, Trans. Faraday. Soc., 52, 299
( 1956).
27. 1. D. Mackenzie, in Modern Aspects of the Vitreous State, Vol. 1,1. D. Mackenzie,
Ed., Butterworths, London, 1960, p. 188.
28. M. G. Drexhage, in Treatise on Materials Science and Technology. Vol. 26, M.
Tomozawa and R. H. Doremus, Eds., Academic Press, Orlando, FL, 1985, p. 189ff.
29. H. Rawson, Inorganic Glass Forming Systems, Academic Press, London, 1967.
30. R. E. Powell and H. Eyring, J. Am. Ceram. Soc., 65, 648 (1943).
31. G. Gee, Trans. Faraday. Soc., 48, 515 (1952).
32. A. A. Miller, J. Polym. Sci., A2, 1094 (1964); J. Chem. Phys., 49, 1393 (1968).
33. A. C. Ling and J. E. Willard, J. Phys. Chem., 72, 1918, 3349 (1968).
34. W. T. Laughlin and D. R. Uhlmann, J. Phys. Chem., 76.2317 (1972).
35. C. A. Angell, J. Noncryst. Solids, 73, 1 (1985).
36. C. A. Herbst, R. L. Cook, and H. E. King, Nature 361, 518 (1993).
37. S. Granick, Science 253, 1374 (1991).
38. A. Bondi, in Rheology, F. R. Eirich, Ed., Academic Press, New York, 1956, p. 321.
39. R. E. Ewell and H. Eyring, J. Chem. Phys., 5, 726 (1937).
40. H. Vogel, Phys. Z, 22, 645 (1921).
41. G. S. Fulcher, J. Am. Ceram. Soc., 77, 3701 (1925).
42. G. Tamman and W. Hesse, Z. Anorg. AI/g. Chem., 156, 245 (1926).
43. A. K. Doolittle, J. Appl. Phys., 22, 1031 (1951); 23, 236 (1952).
44. M. L. Williams, R. F. Landel, and 1. D. Ferry, J. Am. Ceram. Soc., 77, 3701 (1955).
45. M. H. Cohen and D. Turnbull, J. Chem. Phys., 31, 1164 (1954).
46. F. Bueche, J. Chem. Phys., 30, 748 (1959).
47. M. H. Cohen and G. S. Grest, J. Noncryst. Solids, 61 & 62, 749 (1984).
48. H. Tweer, N. Laberge, and P. B. Mocedo, J. Am. Cer. Soc., 54, 121 (1971).
49. G. Adam and 1. H. Gibbs, J. Chem. Phys., 43, 139 (1965).
SO. M. Goldstein, J. Chem. Phys., 39, 3369 (1963); 43, 1852 (1965); 51, 3728 (1968).
51. N. F. Mott, Phi/os. Mag., B56, 257 (1987).
52. S. Brawer, Relaxation in Viscous Liquids and Glasses, American Ceramic Society,
Columbus, OH, 1985.
CHAPTER 7
GLASS TRANSITION
As a glass-forming liquid is cooled, some of its properties change sharply in a
narrow temperature range. 1 In Fig. 1 the specific volumes of a soda-lime
silicate glass and glassy B 2 0 3 are shown as a function of a temperature; an
abrupt change in the slope of the curve, which is equal to the coefficient of
volume expansion, occurs at a certain temperature. Other properties, such as
the heat capacity (see Fig. 2 and Refs. 6-9) and electrical conductivity
(Chapter 15), also change abruptly at about the same temperature. This
temperature is called the glass transition or transformation temperature.
It is significant that the viscosity does not show an abrupt change at the
glass transition temperature. This result suggests that the viscosity determines
the rate at which a property relaxes to some equilibrium value, but may not
be related to the magnitude of property changes under different conditions.
Therefore a theory for the viscosity probably will not result from consideration
of changes in properties of the glass, but only from study of the details of the
flow mechanism itself; hence the failure of the viscosity theories described in
the last chapter that were based on the free volume or entropy of the glass.
Kauzmann 1 showed that glass transitions occur for many of the types of
glasses listed in Chapter 2. It has been suggested that some amorphous solids
do not show a glass transition temperature, but this result has not been
established with any certainty.
It is reasonable to associate the glass transition temperature with the
slowing down of rearrangements in the glass structure. When these rearrange-
ments occur rapidly during the time of experimental measurements, the glass
has the properties of a liquid; when the rearrangements are slow, the glass
structure is "frozen" and it behaves like a solid. In fact, the specific volumes
and their temperature dependencies of the glasses shown in Fig. 1 are quite
113
.7
,6
- ----
-
.... - 8 2 0 3
.;'
./
/
E
"5 ,5
0;
E .44
::J
c.> .43
;;:
a
.42
IJ)
,41
..-"-
..-"-
--
-
_..- ..- - Soda -lime
.40
.39 0
200
400
1000
1200
1400
600 eoo
Temperature, .C
Fig. 1 Specific volumes of a soda-lime silicate glass (74% Si0 2 , 16% NaO, and 10%
CaO) and glassy B 2 0 3 as a function of temperature. 2 - 4
600
o
500
400
o
I
:I
ci. 30
to)
A.
to) 200
o FIRST I£ATING
oSECOND I£ATING
100
o
300 400 500 600 700 800
TEMPERATURE (OK)
Fig. 1 Heat capacity of 0.15 Na 2 0, 0.85 B 2 0 3 glass as a function of t"mperature. S
114
GLASS TRANSITION 115
close to those of the corresponding crysiiilline solids below the glass transition
temperature. The rate of these molecular rearrangements should be closely
associated with viscous flow, and indeed the glass transition temperature
occurs at a viscosity of about 10 13 P.
Thus the presence of a glass transition results from the slowing down of
viscous relaxation in a liquid. Estimates of the relaxation time at a viscosity of
10 13 P are in the range of minutes to a few hours, in reasonable accord with
the usual times of experiments.
Since the transition temperatures determined from specific volume and heat
capacity are nearly the same,l the molecular motions involved in changing
these properties with temperature changes are probably similar. Alternatively,
the same apparent transition temperatures for these two properties may result
because the relaxation rate of glasses changes so rapidly with temperature. This
rapid change is shown in the high activation energies for viscous flow at high
viscosities, as described in the last chapter.
Other properties of glasses show changes at the glass transition temperature.
There is some evidence that the elastic modulus of glasses changes sharply at
the glass transition temperature,10,11 although it is difficult to measure a
meaningful value of the modulus much above the glass transition temperature.
As this temperature is approached from below, the delayed elasticity of glasses
increases rapidly, as shown in Chapter 16. This change is a manifestation of
the increasing ease of molecular motion and consequent change in elasticity
with time at a particular temperature. An increase in hydrostatic pressure
apparently increases the transition temperature. 1 This result might be expected
because of the reduction in relaxation rates with increasing pressure. Changes
in the absorption spectra of nitrate glasses occur at the glass transition.
Kauzmann 1 showed that the dielectric relaxation of several organic glasses
changes abruptly at the glass transition temperature. The dielectric relaxation
times are about 30 min at the transition temperature, consistent with the
estimates mentioned above. It is known that the molecular motions in
dielectric relaxation of liquids are related to their viscosities, so a correlation
of dielectric relaxation with transition temperature is expected. This sort of
dielectric relaxation should not be confused with other dielectric losses in ionic
glasses, including oxides. These losses are associated with ionic motion, as
. discussed in Chapter 16.
Kauzmann 1 extrapolated the entropy of a supercooled liquid of the "fragile"
type (strongly non-Arrhenius viscosity, large difference in heat capacity be-
tween crystal and liquid) and found that at some temperature below the glass
transition temperature, the entropy of the supercooled liquid becomes less that
of the crystal. Since the liquid is less ordered than the crystal, this result is
unexpected and has been called Kauzmann's paradox. Stillinger 1 10 examined
this paradox with a statistical model for a liquid of small molecules. He
concluded that the correct extrapolation of the entropy of the supercooled
liquid does not become less than that of the crystal, but only approaches it
asymptotically. Furthermore Stillinger concluded that the viscosity equations
116 GLASS TRANSITION
of the Tammann- V ogel- Fulcher type that predict infinite viscosity at some
temperature below 1', are unlikely to be correct.
STRUCTURAL AND STRAIN RELAXATIO
When a glass is cooled rapidly Crom a temperature above the transition region
into this region, it retains some properties of the higher temperature, and those
properties "relax" to those characteristic of the lower temperature as a function
of time. An example of this process was given in the last chapter in describing
the change of viscosity with time at high viscosity. The time to reach a stable
or equilibrium state is, of course, longer at lower holding te perat_ure.
If a piece of glass is cooled rapidly Crom a temperature above the transition
region, nonuniformities in its temperature during cooling lead to stresses in the
glass. For example, as a rod or plate is cooled, the outer layers of glass become
rigid first. Then as the inside cools, it tries to shrink, but is restrained by the
rigid outer layers. These stresses can weaken the piece, and change its
properties, so it is desirable to remove them by heating the piece at an
appropriate temperature in the transition region. At this "annealing" tempera-
ture, the stresses are removed as the glass relaxes. The rate at which annealing
goes on is important in preparing glasses for use and so has been much studied.
Good empirical relations for annealing have been devised, and in particular it
has been found that the rate of annealing is closely related to the viscosity of
the glass, hence the designation of the temperature where the viscosity is 10 13 . 4
P as the annealing point, since at this viscosity, most stresses are removed in
about 15 min.
The relaxation of the glass structure from one set of properties to another
after a rapid temperature change in the glass transition region is called
structural relaxation. When a glass is subjected to a stress (strain) in this
region, the deformation changes with time; this process is stress or strain
relaxation. The rates of these relaxations are of practical importance, and have
been studied intensively in the last few years. Two monographs by Scherer 11
and Brawer 12 provide extensive reviews of this work, and the proceedings of a
meeting include discussions of recent experimental and theoretical work. 13
When glass is stressed in the transition region, several different types of
deformation can occur (see also Chapter 9):
1. Elastic: instantaneous and reversible, strain proportional to stress;
2. Anelastic: reversible, takes time to reach final value or relax;
3. Viscous: permanent flow, rate proportional to stress.
The combination of these various kinds of deformation is often called
viscoelastic strain or relaxation. If the different types of strain are independent
and additive, the deformation is called linearly viscoelastic.
It is important to characterize the initial state of the glass carefully before
STRUCTURAL AND STRAIN RELAXATION 117
studying the kinetics of ;i1toperty changes in the transition region. One way to
start with a known state is to anneal the glass carefully at the temperature of
the experiment. Then, if some force is imposed on the glass, such as a shearing
stress, rates of changes under this force can be studied starting from a known
condition. This procedure was followed by Kurkjian 14 in studying stress
relaxation in a soda-lime silicate glass. Since relaxation of stress is the aim of
annealing, this type of experiment gives insight into the annealing process.
To study the stress relaxation, Kurkjian rapidly twisted an annealed glass
rod a certain amount with a known stress. The stress in the rod at this fixed
twist and at a constant temperature was then measured as a function of time.
The "instantaneous" initial stress So was used to normalize the stresses at
different temperatures. When this was done, the stress relaxation at different
temperatures in the transition range fitted on the same master curve, as shown
in Fig. 3, where the normalized stress S/So is plotted as a function of time. The
existence of such a master curve shows that a single mathematical function
describes the relaxation data at all temperatures. Kurkjian fitted his stress S as
a function of time to a sum of six exponential terms of the form
S = e,M j exp ( jt ) (1)
where Bj is the initial strain, and M j is the modulus for a process with relaxation
time t , . In these terms, one can say that the spectrum of relaxation times was
the same for the different temperatures of the experiment. A material that
10 2 103 10 4
TIME (SECONDS)
Fig. 3 Stress relaxation of a soda-lime silicate glass as a function of time. '4 Data at
different temperatures are normalized to 473°C using an activation energy of 150
kcal/mol.
1.0
0.9
0.8
0.7
II)
!3 0.6
II) 0.5
0°.4
w
0.3
.J
ct
20.2
a:
O.I
°
/0'
10 5
118 GLASS TRANSITION
exhibits this property of having the same relaxation spectrum at different
temperatures is called thermorheologically simple.
A simpler function often fits the relaxation spectra of glasses:
S = So exp [ _(t/t)bJ
(2)
in which So is the initial stress before relaxation and band tare time-
independent constants. Equation 2 has been given the names of various
research workers, but since it has been used for more than 150 years, Scherer 11
suggests calling it the "b" equation. In glasses, b is often between 0.5 and 0.7 for
structural and stress relaxation. For example, DeBast and Gilard found
b = 0.5435 for uniaxial stress relaxation in a soda-lime silicate glass. 15
TooP6 introduced the interesting idea of a fictive temperature as a par-
ameter for characterizing the state of a glass. The fictive temperature of the
glass is the temperature that corresponds to the state of the glass. For example,
if a glass is rapidly cooled from a temperature above the transition region, it
retains the properties characteristic of this temperature, which is therefore its
fictive temperature. The fictive temperature changes as a function of time
during annealing until it becomes the annealing temperature. The difficulty
with this approach is that the same value of properties, such as the specific
volume, can be attained in a glass by two quite different heat treatments,
implying that a single parameter is not sufficient to characterize the state of a
glass. Thus, whereas the idea of a fictive temperature has value in certain simple
types of experiments and perhaps as a technological characterization, it is not
sufficiently precise for a detailed description of the state of the glass sample (see
also Refs. 11 and 17).
Structural relaxation was defined above as the change of a property value
P as a function of time after a temperature change of the material. Because the
relaxation times in Eqs. 1 and 2 are functions of time during structural
relaxation, it can be nonlinear. If the temperature of the sample is chan'ged
from T 1 to T 2 , the relaxation function M at T 2 of a property P is
P-PI
M=
Po - PI
where P is the property at time t, PI is the final value of the property after it
has completely relaxed, and Po is its initial value at T 2 . Equation 2 does not
describe M for structural relaxation, because t is time dependent.
To account for the time dependence of t, Narayanaswamy18 introduced a
reduced time u (often given the symbol Greek ,) such that
u = I' dt'
Jo t
Then he derived the following equation:
P = PI - (1;. f M(u - u') :: du'
(3)
(4)
(5)
STRUCTURAL AND STRAIN RELAXATION 119
where c(. is the difference between the temperature dependence of the property
in the glassy (solid) phase well below the transition range and in the liquid
phase
C(s $ lliqUid - 111'"
The temperature dependence of the relaxation time was assumed to be
[ X I-X ] Q
't = 1'0 exp - + - -
T Tf R
where 'to and X are constants, T is the measurement temperature, Tf is the
(time dependent) fictive temperature, Q is the activation energy, and R the gas
constant. The fictive temperature Tf is given by
(6)
(7)
Tf = P-Pf + T
C(s
(8)
Since Tool introduced the idea of a fictive temperature, this treatment is often
called the Tool-Narayanaswamy model. It is discussed in more detail in Refs.
11-13.
This model has been fit to relaxation data on glasses in a variety of ways.
In one approach, the changes in a property after a small temperature jump
either up or down are measured to determine 't from the b function 19
M = exp [ - (u/tlJ
(9)
The fitting parameters from the model equations are b, 'to' X and Q. In another
approach, the relaxation of enthalpy (heat capacity) is measured with a
differential scanning calorimeter at different heating and cooling rates; the
analysis in terms of Eqs. 4-9 is described in Refs. 20 and 21.
A large amount of relaxation data have been successfully analyzed by this
model. 11 - 13, 19 - 25 In almost all glasses studied, the activation energy Q is
close to that for viscosity in the same temperature range. b values in Eq. 9
range from 0.5 to 0.85, and x from 0.25 to 0.70, although x is usually about
0.5. There are no independent theoretical estimates of band x.
In spite of these successes, there are a number of questions about this model,
and some failures of the model to fit data, especially at large excursions from
equilibrium. Questions involving the b relaxation function of Eq. 9 and the
form of Eq. 7 for the temperature dependence of the relaxation time are
explored in detail in many articles, for example in Ref. 13, p. 420. The
conclusion is that the Tool-Narayanaswamy model is a valuable first step in
describing relaxation in glasses, but has defis encies that require further study.
Moynihan and Schroeder 24 have analyzed time-dependent light scattering
results 25 ,26 from glasses in the glass transition region, and shown that they are
consistent with a model of relaxing regions in the glass of nanometer size. In
their model, the relaxation rates of these regions of about constant size depend
120 GLASS TRANSITION
on their density, with regions of higher density relaxing more slowly than those
of lower density. This distribution of relaxation times of the regions is then
correlated with the macroscopic distributions of relaxation times of various
properties.
Hansen 27 has reviewed application of theories of liquids, including "mode-
coupling" theory and molecular dynamics simulation, to the glass transition,
emphasizing glasses that have a sharp increase of viscosity near the glass
transition (type four from Chapter 6, or highly "fragile" glasses). He distin-
guishes between a kinetic and a calorimetric glass transition, and concludes
that the connection between them for these glasses is still an open problem.
REFERENCES
1. W. Kauzmann, Chem. Rev., 43, 219 (1948).
2. M. Coenen, Glastech. Ber., 39, 81 (1966).
3. P. B. Macedo, J. Chem. Phys., 44, 3357 (1966).
4. P. C. Li, A. C. Ghose and G. J. Su, Phys. Chem. Glasses, 1, 198 (1960).
5. D. R. Uhlmann, A. G. Kolbeck, and D. L. DeWitte, J. Noncryst. Solids, 5, 426
(1971).
6. C. T. Moynihan, A. J. Eastal, D. C. Tran, J. A. Wilder, and E. P. Donovan, J.
Am. Ceram. Soc., 59, 137 (1976).
7. C. T. Moynihan, P. B. Macedo, J. D. Aggarwal, and V. E. Schnaus, J. Noncryst.
Solids, 6, 322 (1972).
8. S. S. Chang and A. B. Bestal, J. Chem. Phys., 55, 933 (1971); 56, 503 (1972).
9. N. P. Bansal and R. H. Doremus, Handbook of Glass Properties, Academic Press,
San Diego 1986, Ch. 7.
10. G. S. Parks and J. D. Reugh, J. Chem. Phys., 5,364 (1937).
11. G. W. Scherer, Relaxation in Glass and Composites, Wiley, New York, 1986.
11a. F. Stillinger, J. Chem. Phys., 88, 7818 (1988).
12. S. Brawer, Relaxation in Viscous Liquids and Glasses, American Ceramic Society,
Columbus,OH, 1985.
13. K. L. Ngai and G. B. Wright, Eds., Relaxations in Complex Systems, J. Noncryst.
Solids, 131-133,1991.
14. C. K. Kurkjian, Phys. Chem. Glasses, 4, 128 (1963).
15. J. De Bast and P. GHani, Phys. Chem. Glasses, 4, 117 (1963).
16. A. Q. Tool, J. Am. Ceram. Soc., 19, 240 (1946).
17. H. N. Ritland, J. Am. Ceram. Soc., 39, 403 (1956).
18. O. S. Narayanaswamy, J. Am. Ceram. Soc., 54,491 (1971).
19. S. M. Rekkson and O. V. Mazurin, J. Am. Ceram. Soc., 57, 327 (1974).
20. C. T. Moynihan, A. J. Eastal, M. A. DeBolt and J. Tucker, J. Am. Ceram. Soc.,
59, 12, 16 (1976).
21. S. N. Crichton and C. T. Moynihan, J. Noncryst. Solids, 101, 222 (1988).
22. O. V. Mazurin, J. Noncryst. Solids, 15, 130 (1975).
REFERENCES 121
23. S. M. Rekkson, J. Noncryst. Solids, 95& 96,131 (1987).
24. C. T. Moynihan and J. Schroeder, J. Noncryst. Solids, 160, 52 (1993).
25. N. A. Bokov and N. S. Andreev, Fiz. Khim. Stekla, 15, 424 (1989).
26. 1. Schroeder L. G. Hwa, X. S. Zhao, L. Busse and I. Aggarwal, Mater. Sci. Forum,
67 & 68, 471 (1991).
27. J. -Po Hansen, Phys. World, 4, 32 (1991).
CHAPTER 8
MOLECULAR SOLUTION AND
DIFFUSION IN GLASS
Gases can dissolve molecularly in glass because of its open structure. If the gas
molecule is small, it can diffuse rapidly in a simple glass such as fused silica.
The permeability of fused silica and other glasses to helium has been known
for many years; Barrer 1 reviewed earlier work back to- 1900. The different
permeabilities of glass for different gases can be used to separate and purify gas
mixtures. Molecular diffusion is also important in "fining" or removal of
bubbles from glass melts, oxidation of silicon and the oxidation state of a glass.
Gases such as hydrogen, oxygen, and water, which dissolve molecularly in
glass, can also react with the glass network. These reactions affect certain
properties of the glass, for example, optical absorption, viscosity, and electrical
conductivity, and are important in fining glass. Such reactions are discussed
below and in Chapter 12 on reactions of gases in glass.
In this chapter experimental results and theories of molecular solubility in
glass are first discussed, followed by sections on the methods of measuring
molecular diffusion in glass, the effects of temperature and molecular size on
molecular diffusion, chemical reactions, the influence of glass composition on
molecular diffusion, and theories for this diffusion. Reviews on diffusion and
solubility of gases in glass are in Refs. 2 and 2a.
MOLECULAR SOLUBILITY OF GASES
Several different methods have been used to measure gas solubilities in glass.
The simplest technique involves saturating the glass, usually in the form of
fibers or powder, with gas at a certain temperature and then pumping out the
gas at a higher temperature and measuring the amount given off. 3 - 5 The
122
MOLECULAR SOLUBILITY OF GASES 123
pressure drop of a gas in a vessel containing glass samples also gives a measure
of the solubility.6 The most common method 7 - 12 employed is to combine
measurements of the permeation coefficient K and the diffusion coefficient D,
since the solubility is equal to the ratio K/D, as shown in the next section.
The solubility is defined here as the ratio Ci/C g , where C j is the concentra-
tion of gas dissolved in the glass, and C g is the concentration of molecules in
the gas phase. This solubility is unitless, and is sometimes called the "coefficient
of solubility," after Ostwald. Other definitions of solubility are S, the volume
of gas at standard temperature and pressure dissolved per unit volume of glass
per unit of external gas pressure, and the number of molecules of gas dissolved
per unit volume of glass per unit external pressure. These solubilities are
proportional to Cj;S = (273/T)(CdCg). The ratio CdCg is preferred to the
other definitions because it does not depend on external gas pressure, and
because its temperature dependence gives directly the energy of interaction
between the gas and the solvent (glass), as shown below, whereas the tempera-
ture dependence of S gives the enthalpy of interaction.
The solubilities of helium, neon, hydrogen, deuterium, and argon in fused
silica are shown in Figs. 1-3. There are some rather surprising discrepancies
between results of different investigators, particularly for helium and hydrogen.
The high values of hydrogen solubility found by Shackelford 6 may have
resulted because he used a fused silica container, which can contribute an
3.8
o
o
3.4
3.0
u
2.6 0
o
o
o
r3 0 0
g 2.2 CCBJ C
:3 8 C cC C 8
C 19 C
1.8 0 0 Cc C
o
o
o
l}
ro
1.4
1.0 0
400 500 600 700 800 900 1000
TEMPERATURE, .C
Fig. 1 Solubility ratio CdC, for helium in fused silica. ., Williams and Furguson;4 *,
Swets et al;' 0, Woods and Doremus;' 0, Shackelford;6-, Shelby.1I
2.8
2.4 NEON
6
at 2.0 6
6
c:s ..
6
0
2 1.6
....
d 1.2
m
::;)
0.8
0.4
0 ?J
c 0 0
0
c 0
0 0
c c c c 0
9 c c 0
D C
C C
ARGON
6 6
66 6 66 6 66
66 6
00 400 500 600 1000
TEMPERATURE. .C
Fig.:1 Solubility ratio C';C, for neon and argon in fused silica, 0, Frank et al;8 0,
Woods and Doremus;5 6., Perkins and Begeal;10 O. Shackelford. 6
5.5
5.0
c3' 4.5
....
c:s
84.0 c
6
6
S 3,5 ..
c
! c c c
3.0 c
6 C C
C
. I
.
2.5
2.0 0 1000
Fig. 3 Solubility ratio C1IC, for hydrogen and deuterium in fused silica. Hydrogen: .,
Wustner;3 ., Williams and Furguson;4 0, Shackelford. 6 Deuterium: 6., Perkins and
Begeal;IO ..., Beauchamp and Walters;19 -, Lee and Fry.23
124
MOLECULAR SOLUBILITY OF GASES 125
uncertain background. However, there are some striking generalities that can
be made. The first is the small temperature dependence of the solubility, which
is constant within experimental error from 80 to l000°C for neon and increases
only slightly, if at all, with temperatures over this range for helium. There
appears to be some increase in solubility of hydrogen at low temperatures, but
the results of different investigators differ widely in this region, so that this
increase may result from experimental problems. A second interesting finding
is the similarity of the solubility of different gases. The rough average values
for all investigators are 0.024 for helium, 0.019 for neon, and 0.03 for hydrogen.
Argon is appreciably lower at about 0.01; the data of Perkins and BegeaPO
were confirmed in a recent study by Nakayama and Shackelford 12 who found
little temperature dependence of the Ostwald solubility of argon, and slightly
higher solubilities. Norton 13 found a solubility of about 0.01 for oxygen in
vitreous silica; the molecular diameter of oxygen is about the same as for argon.
The solubilities of inert gases in different glasses at 300°C are compared in
Table 1. The solubilities in widely different glass types are remarkably similar;
particularly striking are the values for the zirconium fluoride glass, which has
a very different structure and anionic groups compared to the oxide glasses.
There was little or no temperature dependence of solubility for all the systems
in Table 1.
Shelby 11 found no appreciable difference in the solubilities of helium in
several different types of fused silica with different impurity levels, for example,
for a water concentration from a few parts per million up to 0.1 %. He also
found 17 little change of the solubility of helium in a series of Si0 2 - Ti0 2 glasses
containing up to 10% Ti0 2 .
The solubility of helium and neon in the tridymite crystalline form of silica
is about the same as in vitreous silica, but the solubility of these gases in the
cristobalite crystalline form is about a factor of four lower than in tridymite or
fused silica. 18
The solubility of helium in Pyrex borosilicate glass (81 % Si0 2 , 13% B 2 0 3 ,
4% Na 2 0, 2% A1 2 0 3 ) is about 0.017 at 200°C, and appears to increase
TABLE 1 Ostwald Solubilities of Inert Gases in Various Glasses at 300°C
Vitreous
Molecular Silica
Diameter (see Figs. 1 Vitreous Vitreous Zirconium Sodium
Gas (A) and 2) B 2 0 3 14 GeO/,16 Fluoride 15 Borosilicate'"
Helium 2.0 0.024 0.023 0.013 0.014 0.013
Neon 2.4 0.019 0.023 0.013 0.013 0.010
Argon 3.2 0.010 0.012 0.0054
Krypton 4.2 0.015
'60% Si0 2 , 30.5% B 2 03' 9.5% Na 2 O.
126 MOLECULAR SOLUTION AND DIFFUSION IN GLASS
somewhat with increasing temperature.4.20-22 Deuterium solubility is 0.033 at
l00-300°C, and decreases to 0.012 at 465°C;21.23 Shelby found somewhat
different values. 22
Shelb y 21 has summarized a number of measurements, mostly his own, of
helium solubility in binary and ternary oxide systems. He found substantial
decreases in solubilities as the amount of alkali oxide in the glasses increased.
The amount of decreases was about the same with lithium, sodium, and
potassium oxides.
Kohli and Shelb y 14 found that the solubilities of gases in boron oxide (see
Table 1) were about constant with temperature below 300°C, but increased
above this temperature, which is close to the glass transition temperature in
this glass. At 800°C solubilities were: He, 0.110; Ne, 0.095; Ar, 0.084; Kr, 0.048.
The solubility of nitrogen 24 in this glass at 550°C of about 0.03 is somewhat
less than that of Krypton 14 at this temperature.
Two different models have been proposed for the molecular solubility of
gases in glass. In one model, the gas is considered to dissolve in an inert
material with a certain amount of free volume that is available for solution of
gas. 25 This volume is constant with temperature and pressure as long as the
glass is not appreciably affected by these variables.
The free volume is given directly by the ratio C';C g . This relation can also
be derived from statistical equations, such as those of Fowler and Guggen-
heim 26 for the chemical potential of an ideal gas Il g and of this gas dissolved
in a condensed phase Ilj:
Il g = R T In 4> + R Tin C g (1)
Ilj= -E+PV+RTln 4>+RTln Cj-RTln vI (2)
where 4> is a function involving the translational and internal degrees of
freedom of the molecules, - E is a potential energy resulting from interactions
between the dissolved gas and the solvent liquid, P is the total pressure, R is
the gas constant, Tis the absolute temperature, Vis the partial molar volume
of the solute gas, and v I is the fractional free volume available to the dissolving
gas. At equilibrium these two chemical potentials must be equal in order to
give a relation for C';C g in terms of the free volume. In deriving this relation,
it is assumed that the function 4> is the same in the gaseous and dissolved states.
This is equivalent to assuming that the dissolved molecule preserves three
degrees of translational freedom. Then
C j + E - PV
In - = + In v I
C g RT
The total volume of the glass does not change appreciably as gas is dissolved
in it; therefore V = 0, and the small temperature dependence of C';C g shows
that E = O. Consequently, the free volume is equal to C';Cg> and is about 3%
for fused silica.
(3)
MOLECULAR SOLUBILITY OF GASES 127
This result can be compared with the free volume calculated by other
methods. The free volume is often given by
V o
V f =I--y
(4)
where V is the bulk molar volume of the material, and V o is the volume of a
mole of its molecules, these molecular volumes being calculated from the
dimensions of the individual molecules. It is difficult to calculate the molecular
volumes of the Si0 2 groups in fused silica. From the relative densities of fused
silica (2.2) and coesite (3.0), a dense crystalline form of silica, one would expect
a free volume of about 27%, far greater than the value calculated from the gas
solubilities. Even using the density of quartz to calculate the molecular volumes
gives a free volume of 13%. Therefore only a part of this kind of free volume
in fused silica is available for solution of gas.
The free volume can be considered in terms of the detailed molecular
structure of fused silica. It seems likely that the gas molecules dissolve in holes
or interstices in the fused silica. Such interstices exit in cristobalite, which has
a density close to that of fused silica. Molecular size, up to a molecular
diameter of about 3 A, appears to have a small effect on the gas solubility; then,
if the oxygen and argon values are reliable, solubility decreases. Therefore it
seems reasonable to assume that the average diameter of the interstices is about
3 A. The total number of interstices for a free-volume fraction of 0.03 is then
about 10 21 /cm 3 . The largest gas concentration measured experimentally (by
Wustner in hydrogen at 850 atm) is about 1.7(10)20 molecules/cm 3 , which is
still below the estimated number of interstices.
The discrepancy between the free volume calculated from the relative
densities of fused silica and coesite or quartz and that for gas solubility is
perhaps understandable in terms of the solution of gas molecules in interstices.
There can be free volume in the fused quartz structure that is not in the form
of interstices and thus is not available to the dissolving gas, either because it
is not connected to the main network of interstices or because each part of it
is too small to contain a gas molecule.
The number N. of interstices of radius greater than the minimum radius ro
can be estimated from the usual statistical equation
N ( - W )
; = exp R T
(5)
where N is the total number of interstices and Wis the energy of formation of
an interstice of radius r from one of radius roo An estimate for W comes from
the equation of Frenket2 7 for the elastic energy to enlarge a spherical cavity of
radius ro to a radius of r:
W= 8nGro(r - ro)2 (6)
The shear modulus is G, which is about 3(10)11 dyn/cm 2 for fused silica. Using
128 MOLECULAR SOLUTION AND DIFFUSION IN GLASS
ro = 1.5 A, about 3% of the interstices have a diameter of 3.4 A at 600°C. Thus
a certain distribution of hole sizes above the minimum size is expected. The
lower solubility of oxygen and argon may be caused by such a distribution,
resulting in a smaller free volume being available to the larger molecules. It is
possible that the distribution of hole sizes is fixed at higher temperatures where
the viscosity of the silica is lower and is frozen in at lower temperatures.
A second model for the molecular solubility of gas in glass has been
developed from statistical mechanics. 2I ,6,12,18,29.30 For a dissolved molecule
with three degrees of translational freedom, and localized in a site, the
following equation was derived,28 in the present notation:
C j ( E )
C g = N&V, exp RT - 1
(7)
where N& is the number and V, is the volume of solubility sites. Since N&V, is
equivalent to vI' Eq. 7 is the same as Eq. 3 except for a factor of e. However,
all of these authors preferred to consider the dissolved gas molecules as
harmonic oscillators. Then for three degrees of vibrational freedom in the
dissolved state, the following equation is found:
C j ( kT ) 3 N& ( E )
C g = V (2nmkT)3 / 2 exp RT
(8)
Here m is the mass of a molecule of the dissolving gas, k is the Boltzmann
constant, and v is th vibrational frequency of the dissolved gas molecules.
Equation 8 is an approximation valid when (hv/kT) < 1, where h is Planck's
constant, and is equivalent to Eq. 3 if the vibrational frequency is considered
to equal (k T/2nm) 1/ 2 (V I ) -1/ 3 . Thus the two models are formally very similar,
and present experimental results cannot readily distinguish between them.
Shackelford 6 found that his vibration frequency v was about inversely propor-
tional to the molecular mass, giving a constant v I for different atoms. Thus the
use of one model or the other is a matter of taste; I prefer the free-volume
model because of its simplicity and more direct physical interpretation.
Beauchamp and Walters 19 and Perkins and BegeaPO have also given reasons
for considering molecules dissolved in glass as having translational rather than
linear oscillator character. Theoreticians and statistical mechanics may prefer
the vibration model.
Shackelford 30 has extended the model of Eq. 8 by considering a log normal
distribution of solubility site sizes. Nakayama and Shackelford describe this
distribution in the following way.12: Of the approximately 2.2(10)28 interstitial
sites per m 3 in vitreous silica, 2.3(10)27 are accessible to helium atoms,
1.3(10)27 to neon atoms, and 1.1(10)27 to argon atoms, in line with the
increasing molecular size of these atoms (see Table 1).
In comparing results of the vibrational model with experimental data, v and
E were treated as adjustable parameters. For fused silica, v in the range from
MOLECULAR SOLUBILITY OF GASES 129
(10)12 to 7(10)12 vibrations/s was found, which is reasonable. Values of E of
about 1-3 kcal/mol were computed; Barrer and Vaughan 14 calculated similar
values from a model of helium-oxygen interactions. In the free-volume model,
the gas-glass interaction is considered to be small, and changes in CtlCg
resulting from different glass structures are attributed to changes in the volume
available for solution, rather than to changes in the vibration frequency of
dissolved molecules.
At low gas pressures (near atmospheric and below), the solubility CtlCg is
constant with pressure change, which states that the concentration of dissolved
gas is proportional to the gas pressure. At higher gas pressures, the fugacity of
the gas rather than its pressure (concentration) must be used to provide a
constant solubility. At pressures above about 100 atm, the number of dissolved
molecules is an appreciable fraction of the interstices available for them. The
solubility can then be described by a Langmuir adsorption isotherm to account
for competition for the sites. 18 ,29.31 In this model, the equilibrium constant K
for gaseous and adsorbed molecules is related to the fraction of adsorption sites
o by
K = O/F(1 - 0)
(9)
where F is the fugacity of the gas. This equation can be derived from statistical
mechanics (Ref. 26, p. 427). To apply this model to gas solubility, 0 is given by
CtlN, where N is the number of interstices per unit volume for gas dissolution.
Then
C j = KFN/(1 + KF)
(10)
Data on helium and neon solubilities in cristobalite and tridymite up to 5000
atm 18 and in vitreous silica,31 as well as hydrogen and deuterium in silica,32.33
fit Eq. 10. The number N of solubility sites in vitreous silica is found to be one
to two times (10)27 per m 3 in this model, close to the number accessible to
these gases in Shackelford's calculations, and those from the free volume
model.
The experimental findings of little temperature dependence of solubility, a
pressure dependence following Eq. 10, solubilities depending on molecular size,
and similar solubilities in glasses with similar free volume but very different
chemical composition and structure (Table 1) are all consistent with molecular
solubility and very little gas-glass interaction. The dissolving molecules lodge
individually in interstices of molecular size; the experiments of Hartwig 32 on
hydrogen and deuterium in vitreous silica with Raman spectroscopy show that
the dissolved molecules are isolated from one another at pressures up to several
hundred atmospheres. Even reactive gases such as oxygen, hydrogen, water,
and nitrogen dissolved molecularly in the interstices without much interaction
with the glass network, because their solubilities are about what is expected
from their molecular size. These gases can react with the network, as described
at the end of this chapter, but apparently unreacted molecules do not interact
much with the glass network. There is some indication of increased hydrogen
130 MOLECULAR SOLUTION AND DIFFUSION IN GLASS
and deuterium solubility at temperatures below 500°C, perhaps because of
some gas-glass interaction at these temperatures.
As the glass becomes more dense, as in alkali-silicates, or in certain crystal
forms, the solubility decreases because fewer interstices are available for
dissolution.
Solubilities, diffusion coefficients, and permeation constants of gases, es-
pecially heliu'm and water, in many different binary and ternary silicate glasses
are summarized in Refs. 34 and 35 and in nonsilicate oxide glasses in Ref. 35,
V 01. II.
MEASUREMENT OF MOLECULAR PERMEATION
AND DIFFUSION IN GLASS
The permeation and diffusion of a gas through glass have usually been
measured in two different ways: with a glass membrane (in the form of a tube
or a bulb) or in a powder. Thin membranes of many different glasses can be
made by blowing or polishing, but sometimes it is difficult to seal them into a
vacuum system, in which case the powder technique is useful.
Adsorption of a gas on the glass surface has been considered to be a
necessary prelude to its solution and diffusion in the glass; however, the
amount of gas dissolved in glass is proportional to the gas pressure at pressures
far above that required for saturation of surface adsorption sites. Thus it seems
likely that the gas molecules can dissolve directly in the glass without surface
adsorption. Equilibrium between the gas and gas dissolved at the glass surface
occurs rapidly for molecular solubility, and surface adsorption and reactions
are not involved.
A glass membrane is mounted in a vacuum system to measure permeation
and diffusion of a gas through it. First the spaces on both sides of the
membrane are pumped out, and then the permeating gas is introduced on one
side at the desired pressure. The amount of gas that appears on the other side
of the membrane is then measured with time. The amount of gas that
permeates the glass is kept so low that the drop in pressure on the inlet side is
negligible and the pressure on the outlet side is small. Under these conditions,
the concentrations of gas dissolved in the membrane at its two surfaces are
constant, being equal to some value C j on the inlet side and zero on the outlet
side. Since thin-walled tubes or bulbs of comparatively large diameter are used
in these experiments, the diffusion equation for a slab applies without appreci-
able error. The flux J of diffusing gas, which passes through unit surface area
of the membrane of thickness L in unit time under the boundary conditions
C = C j when x = 0, C = 0 when x = L, C = 0 when t = 0, is 36
DC [ CO ( - Dn 2 rt 2 t )]
J = -i 1 + 2 " O cos nrt exp L 2
(11)
MEASUREMENT OF MOLECULAR PERMEATION AND DIFFUSION IN GLASS 131
where t is the time after emission of the gas. Holstein 20 has shown that this
equation can be transformed to
( D ) 1/2 '" [ - U(2n + 1)2 J
J = 2C. - L exp
I nt 11=0 4Dt
where the series converges rapidly for small t. For long times (t»D/L 2 ), these
equations reduce to J = DCJL, which is the "steady-state" solution and
implies a constant gradient throuthout the membrane.
The measured pressure p of gas on the outlet side is related to J by the
equation
(12)
J = ( A; ) ( )
where V is the volume on the outlet side where p is measured, A is the surface
area of the glass membrane, R is the gas constant, and is the temperature
at which the pressure is measured. The results of permeation measurements in
the steady state are usually expressed in terms of a permeation velocity K,
which is defined as
K = ( VL ) ( dP ) = LRTpJ
pA dt P
where P is the pressure difference across the membrane. The units of K
generally used are cm 3 of gas at stp per cm 2 of glass area per s per atm of gas
pressure difference per cm of glass thickness. If the outlet pressure is negligible
!:J.p = CgRT, where C g is the concentration of gas on the inlet side in
moljcm 3 , and T is the temperature of the diffusion experiment. Then, since
J = DC;/L, K = DTpC;/CgT, where Tp is 273 K. The solubility S is defined
as the volume of gas (at stp) dissolved in unit volume of glass per atm of
external gas pressure:
S = CjT p
CgT
The units of K are also cm 2/ S , since S is dimensionless. A discussion of the units
of K and S is given by Rogers 'et al. 20 in an appendix to their article.
In the early stages of permeation, D can be calculated from the measured
change in pressure with time (dp/dt) in the outlet side. For this purpose, Eq.
12 is useful, since for short times only the first term of the series is needed, so
that a plot of log [t 1/2 dp/dt] against l/t is linear, because J is proportional to
dp/dt; the slope of the line is equal to L2/4D, from which D can be calculated
since L is known. This method was suggested by Rogers et al. 20 and gives the
most accurate values of D from permeation data. The intercept of this line with
the log [t 1/2 dp/dt] axis (l/t -+ 0) can also be used to calculate the solubility S
if D is known. When the outlet pressure Po is plotted against time, the curve
and
K=DS
(l3)
132 MOLECULAR SOLUTION AND DIFFUSION IN GLASS
becomes linear at long times (this is also the steady-state region), and the
diffusion coefficient can also be found from the intercept t c of this line with the
pressure axis from the relation D = L 2/6te> as shown by Barrer. 1
If the gas on the inlet side is pumped out rapidly after the steady state is
attained, the diffusion coefficient can be calculated from the rate at which the
dissolved gas diffuses out of the membrane. The initial concentration for this
desorption is given by C = C j (1 - x/L), and the boundary conditions are that
C = 0 at both surfaces. The flux at the outlet is then 36
2C D CXJ ( - Dn 2 1t 2 t )
J = - L j L cos n7t exp 2
"=0 L
Thus the diffusion coefficient and solubility can be calculated from permeability
data in a variety of ways, and comparisons between the various calculations
should give some idea of the reliability of the results.
In the powder method, the diffusion coefficient is calculated from the
amount of gas absorbed or desorbed from a powdered sample, and the
solubility is found from the total amount of gas absorbed or desorbed per unit
weight of glass. For desorption from spheres of radius R, the amount of gas
des orbed Q is 5.18
(14)
Jl = 6(Dt)1/2 3Dt
QCXJ 1tR R 2
where QCXJ is the total amount of gas desorbed. A comparison of the experimen-
tal curve with Eq. 15 gives a measure of D where t, R, and Qoo are known.
(15)
EFFECT OF TEMPERATURE, PRESSURE, AND MOLECULAR SIZE ON
MOLECULAR DIFFUSION IN GLASS
The most extensive measurements on diffusion of molecules in glass have been
made on fused silica, since this glass is one of the most permeable to gases. Few
measurements of permeation of gases other than helium or hydrogen have been
made in other glasses.
The diffusion coefficient of helium through thin fused silica tubes was
measured by the membrane technique from room temperature to l000 c C by
Swets, Lee, and Frank.' In a plot of log D versus liT, these authors found two
straight line portions; however, a plot of log D/T versus I/T gives a good
straight line,37 as in Fig. 4. These diffusion results are among the few taken
over a wide enough temperature range and are of sufficient accuracy to
determine whether a pre-exponential factor of temperature is needed in the
Arrhenius equation,
D = Do exp ( )
(16)
EFFECT OF TEMPERATURE, PRESSURE, AND MOLECULAR SIZE ON DIFFUSION 133
10" 7 1000' 600' 400'
200'
100'
5Q'C,
10"8
...
!
..
..
...
N
....
...
co
ler 9
6
18 22
1000/T
Fig. 4 Diffusion of helium in fused silica. 7
10"
1.0
1.4
26
3.0
Shelb y 21 and Shelby and Keaton 42 confirmed in more extensive measurements
that a pre-exponential factor of temperature T" with n = 1.06 :t 0.11 in this
equation gives the best fit for helium and neon diffusing in fused silica. The
data of Frank et al. 8 on neon diffusion in fused silica from 400 to 980°C are
combined with those of Perkins and BegeaPO in Fig. 5. Perkins and Begeal
used a thin film of silica formed on porous Vycor for their membrane. The
neon data also fit well on a log D/T versus I/T plot and show distinct
curvature on a log D versus 1/T. Therefore it seems likely that the pre-
exponential factor of temperature in Eq. 16 is valid for all molecular diffusion
in fused silica and perhaps in other glasses as well.
The size of the diffusing ion affects molecular diffusion in fused silica quite
strongly, in contrast to the small dependence of solubility on size. The diffusion
coefficients at 25 and l000°C and the activation energies for diffusion for a
134 MOLECULAR SOLUTION AND DIFFUSION IN GLASS
10- 8
10- 9
10- 10
.
1
u
I.a.I
CI)
N....
:2
U
...:
C; 10- 11
10- 12
10- 13
0.4 0.8 1.2 1.6 2.0 2.4 2.8 3.2
1000/T
Fig.5 Diffusion ofne.on in fused silica. 0, Frank et al;8 A Perkins and Begeal. 10
number of molecules in fused silica are given in Table 2. The activation energies
Q' have been calculated from an equation of the form
D = D' T exp ( ' ) (17)
where Q' and D' are temperature-independent. This equation agrees well with
experimental data and,leads to a simple activation energy over the whole range
of temperatures of the measurements, as mentioned previously. The molecular
diameters in the table were estimated from the gaseous viscosities at 700°C; the
water value was extrapolated. The diffusion coefficients and activation energies
for helium, neon, argon, and hydrogen have been measured by several different
workers and are considered quite reliable. The diffusion coefficient for oxygen
as measured by Norton should be dependable, but the activation energy was
determined from only two different measurements and therefore is less certain.
MOLECULAR DIFFUSION AND CHEMICAL REACTION 135
TABLE 2 Molecular Diffusion in Fused Silica
Diffusion coefficient
(cm 2 /s) Activation
Diameter energy Q'
Molecule (A) 25°C lOOO°C (kcal/mol) Refs.
Helium 2.0 2.4(10) - 8 5.5(10)-5 4.8 7
Neon 2.4 5(10)-12 2.5(10)-6 8.8 8, 10
Hydrogen 2.5 2.2(10) -11 7.3(10)-6 8.5 9,10
(deuterium)
Argon 3.2 1.4(10)-9 2.6 10, 12
Oxygen 3.2 6.6(10) - 9 25 13
Water 3.3 2(10)-7 17 38,39
Nitrogen 3.4 26? 1,40
Krypton 4.2 46 10
Xenon 4.9 72 41
The activation energies for nitrogen and krypton were estimated from per-
meation measurements since no diffusion measurements have been made on
these gases. The values for water are complicated by reaction with the silica
lattice, as discussed later. The strong dependence of activation energy on
molecular size is discussed further in the section on theories.
The diffusion coefficients of molecularly dissolved species show little depend-
ence on gas pressure up to pressures of at least 1000 atm. Shelb y 21 has
discussed some deviations from simple behavior at high pressures.
Annealing stressed glasses reduces the rate of helium permeation in them,
and increases the activation energy for diffusion. 2l ,43 Similar effects are found
in ionic diffusion, as described in Chapter 15; these changes probably result
from the decrease in density of the glasses with annealing.
MOLECULAR DIFFUSION AND CHEMICAL REACTION
Experiments on the diffusion of water, hydrogen and oxygen in silica are
complicated by reactions of these gases with the silica lattice. These reactions
will be considered again in the chapter on chemical reactions in glass; here only
their interference with diffusion is treated.
Water reacts with silica glass to form -OH group's in the following way:
I I I
H 2 0 + -Si-0-Si- = 2(-SiOH)
I I I
(18)
The rate at which these groups build up in fused silica in contact with water
vapor has been studied extensively by Roberts and co_workers. 38 ,44-46 They
136 MOLECULAR SOLUTION AND DIFFUSION IN GLASS
favored a mechanism for diffusion of water into silica in which a proton jumps
from an SiOH group to a neighboring Si-O-Si bridge, followed by a jump of
the hydroxyl group. This mechanism is unlikely39; it requires a much higher
activation energy than the 18 kcal/mol found by Moulson and Roberts 38
because the silicon-oxygen bonds that must be broken in this mechanism have
energies of over 100 kcal/mol. If a lattice diffusion mechanism were valid, one
would expect a similar diffusion coefficient of water in crystalline quartz, but
at l000°C, where water diffuses readily into fused silica, there is no indication
of its diffusion into quartz. 47
Therefore a more likely model of water diffusion in fused silica is one in
which the water molecules dissolve molecularly in the glass and subsequently
react with the silicon-oxygen lattice by Eq. 18. 39 Crank (Ref. 36, pp. 326 ff.)
has treated simultaneous diffusion and reaction. The one-dimensional equation
for diffusion plus reaction is
oC 02C as
-=D---
at ox 2 at
(19)
in which C is the concentration of dissolved material and S is the concentration
of reacted (immobilized) material. If the concentration of diffusing material is
much lower than the concentration of reaction product, diffusion takes place
with an effective diffusion coefficient
De = 4D (:2 )
(20)
where D is the diffusion coefficient of dissolved species (molecular water), and
K is an equilibrium constant. There is an extra factor of 2 in Eq. 20, because
each water molecule gives two SiOH groups. The relation between S, the
concentration of SiOH groups, and C 1 , the concentration of molecularly
dissolved water, is
S = K(Cfi2)
(21)
since each water molecule reacts to form two SiOH groups. This square-root
relationship between the amount of SiOH groups and C 1 , and consequently the
ambient water vapor pressure, was found by Moulson and Roberts. 38
The effective diffusion coefficient of Eq. 20 is directly proportional to the
concentration of S of SiOH groups; the solution of the diffusion equation for
this dependence was found by Wagner 48 (see also Ref. 36, p. 162). This solution
is compared with the profile of SiOH groups found by Roberts and Roberts 45
in Fig. 6. The fit is good, confirming the model of molecular diffusion and
reaction of water. The activation energy and diffusion coefficient of water given
in Table 2 were calculated from this comparison, assuming a solubility C1/C g
for water of about 0.01 and using the value of Kin Eqs. 19 and 20 calculated
from the data of Ref. 38.
MOLECULAR DIFFUSION AND CHEMICAL REACTION 137
1.0
0.9
0.8
z
o
0.7
c::
I-
ffi 0.6
(.)
z
8 0 . 5
..J
0.4
o
t
< 0.3
c::
0.2
0.1
o
o 10 20 30 40 50 60 70 80 90 100
DISTANCE, MICRONS
Fig. 6 Profile of water diffusing into fused silica at 1100°C. -, calculated from the
diffusion coefficient of Eq. 17; 0, smoothed data from Ref. 36.
There has been a great deal of confusion about the diffusion of oxygen in
vitreous silica. Two types of experiments have been done. In the first, the
permeation and diffusion of oxygen through a glass membrane was measured
by Norton, 13 as described above for other gases. Norton found the same
behavior for oxygen as found for molecular solubility of inert gases, as
described above and shown in Tables 1 and 2; the solubility was proportional
to the pressure, and was of comparable magnitude for a molecule with the
diameter of oxygen, and the diffusion coefficient and activation energy of
diffusion were those expected for a molecule the size of oxygen.
The second kind of experiment involves diffusion and exchange of isotopi-
cally labeled oxygen into the glass. 49 . 5o The 18 0 concentration in the gas phase
can be followed with a mass spectrometer 49 - 52 and the profile of 18 0 in the
network oxygen can be measured 53 - 59 with a nonresonant nuclear reaction or
secondary ion mass spectroscopy (SIMS). Much of the profiling work was
done on thin silica films growing on silicon. 53 ,54,56 This work was valuable for
demonstrating that molecular oxygen was the diffusing species during oxida-
tion of silicon (see below), because 18 0 accumulated at the silicon-oxide
interface.
The following processes probably contribute to the tracer depletion in the
gas phase and tracer profiles in the oxide:
138 MOLECULAR SOLUTION AND DIFFUSION IN GLASS
1. Molecular diffusion of oxygen;
2. Network diffusion of oxygen;
3. Exchange of isotopic tracer between the molecularly dissolved oxygen and
the oxygen in the silicon-oxygen network;
4. Traces of water;
5. A slow surface exchange reaction.
These mechanisms are listed in rough order of their experimental support.
Molecular diffusion in silica, as measured by Norton 13 and described above,
is clearly involved in all these isotopic tracer measurements. The ingenious
interdiffusion tracer experiments of Mikkelsen 55 demonstrate diffusion of
lattice oxygen at temperatures from 1200 to 1400°C with an activation energy
of 453 kJ/mol. The extrapolated lattice diffusion coefficient at 1000°C is
6.7(10) -19 cm 2 /s, or about ten orders of magnitude smaller than the diffusion
coefficient of 6.6(10)-9 cm 2 /s of molecular oxygen as measured by Norton at
1000°C. The high activation energy and low absolute value are good evidence
that Mikkelsen was measuring a lattice diffusion coefficient; he cautiously
claimed that his measured values were only an upper limit, and could possibly
have been influenced by traces of dissolved molecular water or oxygen,
although he took great care to remove them.
The tracer profiles 53 ,54,56-59 indicate that appreciable exchange between
dissolved and lattice oxygen takes place above 900-1000°C. There are con-
siderable differences between calulated exchange rates by different experimen-
ters, possibly because of different lattice defects in the silica or different trace
amounts of water that could act as a catalyst for the exchange. The exchange
reaction can be written as
16 0_ 18 0 + Si- 16 0-Si = 16 0_ 16 0 + Si- 18 0-Si (22)
and at equilibrium is governed by the relation
Kx = (Co - C)(S)/(So - S)(C)
(23)
where C is the concentration of dissolved molecular 16 0_ 18 0, Co is the total
concentration of dissolved oxygen, S is the concentration of lattice 18 0, and So
is the total concentration of lattice oxygen. If it is assumed that the isotopic
ratio at equilibrium is the same in the dissolved and lattice species, then
Kx = 1, and from Eq. 23,
dS dC
Co dt = So dt (24)
Then from Eq. 19, the diffusion is controlled by an effective diffusion coeffi-
cient D.
D. = D/(1 + So/Co) DCo/So
(25)
EFFECT OF GLASS COMPOSITION ON MOLECULAR DIFFUSION 139
where D is the diffusion coefficient of dissolved species. At l000°C, Co is
9.5(10)-8 mol/cm 3 , and So is 0.0733 mol/cm 3 , so D = 7.8(10)5 De' The
experimental diffusion coefficients measured in Refs. 49, 50 and 52 are all
about six orders of magnitude less than those measured by Norton, suggesting
that in these experiments there was dissolved to lattice exchange to equilib-
rium. Possibly the equilibrium was encouraged by traces of water in these
experiments; when great care was taken to exclude water, 53.54,56- 59 it appears
that the exchange did not go to equilibrium. More work is needed to
understand these exchange experiments better, and to determine the relative
importance of factors 1-5 above.
EFFECT OF GLASS COMPOSITION ON MOLECULAR DIFFUSION
Shelb y ll examined the diffusion of helium in a variety of types of fused silica
with different amounts of impurities. For example, the hydroxyl concentration
varied from 5 to 1300 parts per million, and one sample had 8 ppm of chlorine.
The silicas were made in different ways: electrical or flame fusion of quartz
powder, and oxidation of SiC1 4 in an oxyhydrogen or a water-free plasma.
Within the relatively small error of his measurements, Shelby found no
differences in the diffusion or solubility of helium in these glasses. Thus changes
in impurities and methods of manufacture normally encountered for fused
silica apparently do not affect molecular diffusion, in spite of some earlier
reports of such effects.
The diffusion of helium and neon were measured in vitreous germania by
Woods and Doremus,5 and of helium in this glass by Shelby.60 Woods and
Doremus found for helium and neon, respectively, activation energies of 4.9
and 8.9 kcal/mol and pre-exponential factors of6.1(10)-6 and 5.6(10)-6 cm 2 /s.
The activation energies were close to those for fused silica, without the
pre-exponential temperature term, but the actual values of the diffusion
coefficient at room temperature were 2(10)-9 for helium and 2(10)-12 for
neon, thus about an order of magnitude lower than the helium value in Table
2, but only a factor of about 2.5 lower than the neon value. Shelby found an
activation energy of 8.0 kcal/mol and a pre-exponential factor of about
1.5(10)-3 cm 2 /s for helium jn germania with somewhat higher diffusion
coefficients than Woods and Doremus. Apparently the larger germanium atom
leads to a more "filled up" lattice than silica, even though the specific volume
per mole of germania is somewhat larger than that of silica.
Shelby found that the diffusion coefficient of helium in vitreous B 2 0 3 was
about four times greater than for fused silica, although the activation energies
for the two glasses were about the same. 60
Norton 61 reported a slightly higher permeability of Vycor glass (96% Si0 2 ,
4% B 2 0 3 ) to helium than fused silica, and Lee and F ry 23 found a slightly
140 MOLECULAR SOLUTION AND DIFFUSION IN GLASS
higher diffusion coefficient for deuterium in Vycor than in fused silica. Appar-
ently the Vycor process (see Chapter 4) leads to a glass with a slightly more
open structure than that of fused silica.
In many studies Of the effect of composition on molecular transport in glass,
only the permeation rates, and not the diffusion coefficients, were measured.
The results of Norton 61 for the permeation of helium in different glasses are
shown in Fig. 7. The compositions of some of these glasses are given in Chapter
1, Table 1. As more network modifying ions are added, the permeation rate
decreases and the activation energy increases. Two later more extensive studies
of the permeation of helium through silicate glasses, particularly borates, gave
similar results. 62 ,63 Shelby (unpublished) analyzed the results of these latter
two authors by plotting the permeation rate at 300°C as a function of the sum
of concentrations of network formers (SiO 2' B 2 0 3 , and P 205) in these glasses,
as shown in Fig. 8. There is a good correlation between the amount of network
former, or alternatively the amount of network modifier ions, and the per-
meation rate. Shelb y 21 has summarized his experiments on helium permeation
in binary alkali silicate and borate glasses. As the amount of modifier increases
in the glass, the permeation rate decreases sharply. In binary, modifier-free
glasses such as B 2 0 3 -Ge0 2 , Ti0 2 -Si0 2 , and Al 2 0 3 -Si0 2 , Shelby found
that the compostional dependence of molar volume indicates the change of
permeation with composition. Shelb y 2a also summarized other results on
permeation of helium in multicomponent silicate glasses.
The data of Eschbach 64 on diffusion and solubility of helium in six different
silicate glasses indicate that a good part of the changes in permeation rates
shown in Fig. 8 are cause by changes in solubility. At 60% network former,
Eschbach found a diffusion coefficient about twenty times smaller than that of
fused silica, whereas the permeation rate was about 6000 times smaller.
Barton and Morain measured the permeation of hydrogen in various
silicate glasses from the rate of reduction of silver in the glass by hydrogen
penetrating into it. They found that in soda-lime glasses the calcium was more
effective in reducing hydrogen permeation than sodium in glasses with the
same silica content. Futhermore, the smaller the alkaline earth ion in glasses
with the same sodium-alkaline earth-silica compositions, the higher was the
permeation rate of hydrogen, except in barium and strontium glasses, which
showed about the same rate of hydrogen permeation. These results indicate
that hydrogen permeation would not show as good a correlation with only
network concentration as does helium, as shown in Fig. 8, perhaps because the
larger hydrogen molecule is more strongly influenced by changes in the size
and charge of network modifying ions.
The rate of growth of small gold particles in glass can be controlled by
diffusion of gold atoms in the glass to the growing particle. 65 . 66 The activation
energy for diffusion of gold atoms in a glass containing 72% Si0 2 , 23% Na 2 0,
4% A1 2 0 3 , and 1% ZnO changes in the glass transition region, but the
diffusion coefficient does not show as large a change as it does for ionic
diffusion, as shown in chapter 15.
-8
LEAD BORATE
SODA LIME
NO. 008
-9
I-
g -'0
.J
1&1
>
z
Q -II
I-
cf
1&1
::E
ffi x- RAy SHIELD
Q. GLASS
, -12
>C
o
<S
o
.J
-13
-14
-15
c"
-78" C
4.5 5
....
....
Fig. 7 Permeation rates for helium in various glasses as a function of temperature,
measured by Norton. 61 Permeation units are em 3 of gas at STP per s per cm 2 area per
mm thickness per cmHg pressure.
142 MOLECULAR SOLUTION AND DIFFUSION IN GLASS
10- 8
10-9
...
z:
:2
c.J
I
I
I
N
15 /0-10
I
....
s::
I-
...
:2
c.J
wlO- 1i
Ie
a::
!
!c
LoJ
:2
a::
10 12
10- 13
52
A
lA
/A
A / to
A O
/ 0
/ 0
/
AA/
A1
ft 0
/0
Ai
/
/0
o
108
Fig. 8 Permeation rates for helium in various glasses at 300°C as a function of the %
of network former (Si0 2 + B 2 03 + P 2 0 S ) in the glass. 6, Altemose;61 0, Vostrov
et a1. 62
DIFFUSION FROM CONTRACTING BUBBLES
The diffusion of gas out of a bubble can control its rate of contraction, and is
therefore important in removal of bubbles from glass melts (called "fining", see
Chapter 12). The rate of shrinkage of a bubble can also be used to calculate
the diffusion coefficient of gas in the glass melt.
A simple equation for the ditTusion flux J from an isolated bubble i s 67.68
J = (c e - cJD ( 1 + ) (26)
R .Jiiii
where C j is the concentration of gas in the glass melt at t = 0 and far from the
bubble, C e is the equilibrium concentration of gas in the glass at the bubble
surface, R is the bubble radius at time t, Ro is the radius when t = 0, and D is
DIFFUSION FROM CONTRACTING BUBBLES 143
0.6
0.1
80
240
320
i 0.5
:E
0::
W
I- 0.4
w
:E
<I:
00.3
w
...J
CD
gs 0.2
CD
160
TIME (MIN)
Fig. 9 Diameter of an air bubble in molten B 2 0 3 as a function of time at 550°C.
Points, experimental data, lime from eq. 27 with D=2.3 x 10- 7 cm 2 js and B=0.058.
Reprinted from Ref. 24 with permission from the American Ceramic Society.
the diffusion coefficient of gas in the melt, assumed independent of gas
concentration. Since J = (c p - ce)(dR/dt), where c p is the gas concentration in
the bubble,
2 R 2 2(ce - c;)dT (1 2Ro )
Ro- = +-
c p - c e fiDi
A comparison between Eq. 27 and the shrinkage of a bubble of air
(effectively nitrogen) in a boric oxide melt is shown in Fig. 9, from Ref. 24. The
(27)
TABLE 3 Diffusion Measurements from Contracting Bubbles in
Molten Glass
Diffusion
coefficient
at 100°C
Gas Glass (cm 2 js) Q Refs.
O 2 Ba-Al-alkali 8(10)-7 24 67-69
Silicate
Soda-lime silicate 1.4(10) -7 53 67-69
Borosilicate 2.8(10) - 6 32 67-69
He Soda-lime silicate 5(10) - s 13.4 70
Ne Soda-lime silicate 3(10) - 6 13.4 70
H 2 O Soda-lime silicate ? 36 71
144 MOLECULAR SOLUTION AND DIFFUSION IN GLASS
excellent agreement between Eq. 27 and the measurements shows that this
equation is valid for these measurements (see also ref. 69a).
Diffusion coefficients calculated 67 from Eq. 27 and the shrinkage measure-
ments of oxygen bubbles by Greene and co-workers 68 . 69 are shown in Table
3, along with results of other measurements on contracting bubbles in
glass. 70, 71
OXIDATION OF SILICON
The formation of insulating oxide layers on silicon is a critical element in the
processing of intergrated semiconductor circuits. The oxide formed on silicon
is pure vitreous silica, and experiments show that the oxide grows from the
silicon-oxide interface, so that the oxidant (oxygen or water) must diffuse
through the silica layer to reach the silicon. There is a vast literature on this
subject because of its great technological and scientific interest; there are
reviews in Refs. 72-74, and new papers appear frequently.
At high temperatures (above ll00°C) and for some silicides, the oxidation
kinetics follow a parabolic equation
L 2 = Bt
(28)
where L is the film thickness after time t. For diffusion control, the parabolic
rate coefficient B is given by
B = 2DC o /p
(29)
where D is the diffusion coefficient of molecular oxidant in the film, Co its
concentration dissolved in the glass at the oxide-gas surface, and p the
concentration of oxygen in the film. When Eq. 29 is followed, the product DC o
is just that measured by Norton 13 for molecular oxygen, or that deduced 39
from the measurements of Moulson and Roberts 38 for molecular water. 75, 76
At lower temperatures on pure silicon, the measured parabolic coefficient B
becomes lower than that calculated from the data of Norton. One possible
reason is strain in the oxide, which reduces the rate of oxidant diffusion
through the film. 77 At these temperatures, the growth kinetics become linear-
parabolic 79
L2 + AL = Bt
(30)
where A is an additional parameter. One possible reason for the change from
Eq. 29 to 30 is the strain of the silicon-oxide interface. 77 Other workers have
claimed that the linear term results from a slow interfacial oxidation reaction,
but this reaction is probably fast. 78
THEORIES FOR MOlECULAR DIFFUSION 145
THEORIES FOR MOLECULAR DIFFUSION
In a random-walk treatment of diffusion, the diffusion coefficient has the form
D = Y A. 2 r
(31)
where y is a geometrical constant, A. 2 is the average of the squares of step
lengths, and r is the average number of steps per unit time. An expression for
r is given by the transition state theory of kinetic precesses: 2
r = kT exp ( f:.S _ f:.H )
h R RT
(32)
where k, h, and R are Boltzmann's Planck's, and the gas constant, respectively,
and f:.S and f:.H are the entropy and enthalpy of activation. f:.H is thus equal
to the activation energy Q' of Eq. 17.
A method of calculating the activation energy for molecular diffusion was
proposed by Anderson and Stuart. 80 They assumed that this activation energy
is the energy required to deform the silica network enough to allow the atom
to pass from one interstice to another. The interstices were considered to be
connected by "doorways" of average radius rJi, the activation energy is then the
elastic energy required to enlarge the doorway to the radius r of the diffusing
molecule, assuming it to be incompressible. This energy was estimated from the
equation (Eq. 6)
Q' = 8nGr D (r - r D )2 (33)
derived by Frenkel 27 for the elastic energy to dilate a spherical cavity from the
radius r D to r. G is the elastic modulus on the glass. From Eq. 33 the square
root of the activation energy should be a linear function of the diameter of the
diffusing molecule. Figure 10 shows this functional dependence for the data on
molecular diffusion in fused silica recorded in Table 2. The doorway diameter
is equal to 1.1 A from the diameter extrapolated to zero activation energy. The
elastic modulus calculated from Eq. 33 and slope of the line in Fig. 9 is about
1.2(10)11 dyn/cm , which is less than the value of 3(10)11 dyn/cm 2 for fused
silica. This difference may result because the strain energy in the loose network
structure of silica is less than in a close-packed liquid, for which Eq. 33 was
derived. In any event, the functional dependence of activation energy on
molecular diameter, as given in Eq. 33, describes well the activation energies
for diffusion of molecules in fused silica, and the doorway diameter calculated
from the equation is reasonable.
The entropy of activation can be estimated from experimental D' values (Eq.
17) and Eqs. 32 and 33. If y = i and y 5.5 A for molecular diffusion in fused
silica the entropies of activation are negative and become more negative as the
size of the diffusing molecule increases. Perkins and BegeaPO found the same
result with a slightly different pre-exponential factor in Eq. 32.
146 MOLECULAR SOLUTION AND DIFFUSION IN GLASS
10
8
.
4
2
/
/
00 2 3 5
MOLECULAR DIAMETER, 1
Fig. 10 Square root of the activation energies for molecular diffusion in vitreous silica
as a function of molecular diameter. Data from Table 2.
Zener 81 has shown that the entropy change f:.S should be proportional to
the negative of the temperature coefficent of the elastic modulus of a substance
if diffusion in it involves only straining its lattice. The elastic moduli for fused
silica increase with temperature, in contrast to the decrease found for ordinary
silicate glasses and metals; this positive temperature coefficient is consistent
with the negative values of f:.S.
If it is assumed that y ::::! 5.5 A for other glasses, then f:.S IRis negative for
the diffusion of helium in Pyrex in the temperature range 25-350°C; in this
range, the elastic moduli of Pyrex increase with temperature. The values of
t1S I R are positive for the diffusion of gold in a soda-alumina glass and argon
in a potash-lime glass, and the elastic moduli of these glasses decrease with
increasing temperature. These correlations probably cannot be extended to
higher temperatures because, in the annealing range, the bulk elastic moduli
will not be directly related to molecular transport, since the glass structure is
changing with temperature. Thus there is the correct qualitative correlation
between t1S .and the temperature dependence of elastic moduli, which is in
agreement with the suggestion that the main contribution to the free energy of
REFERENCES 147
activation of molecular diffusion in these glasses involves the elastic strain of
the glass network.
Other theories have been proposed 82 - 84 but they do not seem to replace
Eq. 33. 21
REFERENCES
1. R. M. Barrer, Diffusion In and Through Solids, Cambridge University Press,
Cambridge, UK, 1941, pp. 117 If.
2. R. H. Doremus, in Modern Aspects of the Vitreous State, Vol. 2, 1. D. Mackenzie,
Ed., Butterworths, London, 1967, pp. 1 If.
2a. 1. E. Shelby, in Treatise on Materials Science and Technology, Vol. 17, Academic
Press, San Diego, 1979, p. 1.
3. H. W. Wiistner, Ann. Phys., 46, 1095 (1915).
4. G. A. Williams and 1. B. Ferguson, J. Am. Chem. Soc., 44, 2160 (1922).
5. K. N. Woods and R. H. Doremus, Phys. Chem. Glasses, 12,69 (1971).
6. 1. F. Shackelford, Ph. D. Thesis, University of California, 1971; see also 1. F.
Shackelford, P. L. Studt, and R. M. Fulrath, J. App/. Phys., 43, 1619 (1972).
7. D. E. Swets, R. W. Lee, and R. C. Frank, J. Chem. Phys., 34,17 (1961).
8. R. C. Frank, D. E. Swets, and R. W. Lee, J. Chem. Phys., 35, 1451 (1961).
9. R. W. Lee, J. Chem. Phys., 38, 448 (1963).
10. W. G. Perkins and D. R. Begeal, J. Chem. Phys., 54, 1683 (1971).
11. 1. E. Shelby, J. Am. Ceram. Soc., 55, 61 (1972).
12. G. S. Nakayama and J. F. Shackelford, J. Noncryst. Solids, 126,249 (1990).
13. F. 1. Norton, Nature, 191, 701 (1961).
14. 1. T. Kohli and 1. E. Shelby, Phys. Chem. Glasses, 31, 93 (1990).
15. 1. M. Jewell and 1. E. Shelby, Phys. Chem. Glasses, 29, 67 (1988).
16. 1. E. Shelby, J. Appl. Phys., 43, 3068 (1972).
17. 1. E. Shelby, J. Am. Ceram. Soc., 55, 195 (1972).
18. R. W. Barrer and D. E. W. Vaughn, Trans. Faraday Soc., 63, 2275 (1967).
19. E. K. Beauchamp and L. C. Walters, Glass Technol., 11, 139 (1970).
20. W. A. Rogers, R. S. Burlitz, and D. Alpert, J. Appl. Phys., 25, 86 (1954).
21. H. M. Laska, R. H. Doremus, and P. 1. Jorgensen, J. Chem. Phys., SO, 135 (1969).
22. 1. E. Shelby, J. Chem. Phys., 45, 2146 (1974).
23. R. W. Lee and D. L. Fry, Phys. Chem. Glasses, 7, 19 (1966).
24. R. B. Brown and R. H. Doremus, J. Am. Ceram. Soc., 59, 510 (1976).
25. R. H. Doremus, J. Am. Ceram. Soc., 49 461 (1966).
26. R. H. Fowler and E. A. Guggenheim, Statistical Thermodynamics, Cambridge
University Press, Cambridge, UK, 1939, pp.81, 373.
27. 1. Frenkel, Kinetic Theory of Liquids, Oxford University Press, London, 1946, pp.
10-11.
28. P. L. Studt, 1. F. Schackelford, and R. M. Fulrath, J. Appl. Phys., 41, 2777 (1970).
148 MOLECULAR SOLUTION AND DIFFUSION IN GLASS
29. 1. F. Shackelford and 1. S. Masaryk, J. Noncryst. Solids, 30, 127 (1978).
30. 1. F. Shackelford, J. Noncryst. Solids, 229 (1982).
31. 1. E. Shelby, J. Appl. Phys., 47, 135 (1976).
32. C. M. Hartwig, J. Appl. Phys., 47, 956 (1976).
33. 1. E. Shelby, J. Appl. Phys., 48, 338 (1977).
34. N. P. Bansal and R. H. Doremus, Handbook of Glass Properties, Academic Press,
San Diego, CA, 1986.
35. O. V. Mazurin, M. V. Streltsina, and T. P. Shvaiko-Shvaikovskaya, Handbook of
Glass Data, Vols. 1-3, Elsevier, Amsterdam, 1983, 1985, 1987.
36. 1. Crank, Mathematics of Diffusion, 2nd edn., Oxford University Press, London,
1975.
37. R. H. Doremus, J. Chem. Phys., 34, 2186 (1961).
38. 1. Moulson and J. P. Roberts, 7rans Faraday Soc., 57, 1208 (1961).
38a. J. E. Shelby, J. Am. Ceram. Soc., 54, 125 (1971).
39. R. H. Doremus, in Reactivity of Solids, 1. W. Mitchell, R. C. Devries, R. W.
Roberts, and P. Cannon, Eds., Wiley, New York, 1969, p. 667.
40. 1. Johnson and R. Burt, J. Opt. Soc. Am., 6, 734 (1922).
41. H. Matzke, Phys. Stat. Sol., 18, 285 (1966).
42. 1. E. Shelby and S. C. Keaton, J. Appl. Phys., 45, 1458 (1974).
43. L. C. Walters, J. Am. Ceram. Soc., 53, 288 (1970).
44. T. Drury and 1. P. Roberts, Phys. Chem. Glasses, 4, 79 (1963).
45. G. J. Roberts and J. P. Roberts, Phys. Chem. Glasses, 5,26 (1964); 7, 82 (1966).
46. I. Bum and 1. P. Roberts, Phys. Chem. Glasses, 11, 106 (1970).
47. A. Kats, Hydrogen in alpha-quartz, Thesis, Delft, 1961.
48. C. Wagner, J. Chem. Phys., 18, 1229 (1950).
49. R. Haul and G. Dumbgen, Z. Electrochem., 66,636 (1962).
50. E. W. Sucov, J. Am. Ceram. Soc., 46, 14 (1963).
51. W. C. Hagel and J. D. Mackenzie, Phys. Chem. Glasses,S, 113 (1964).
52. E. L. Williams, J. Am. Ceram. Soc., 48 191 (1965).
53. L. D. Major, M. S. Thesis, Case Western Reserve University, Cleveland, OH, 1977.
54. R. Rochet, B. Agius, and S. Rigo, J. Electrochem. Soc., 131, 914 (1984).
55. 1. C. Mikkelson, Appl. Phys. Lett., 45, 1187 (1984).
56. C. 1. Han and C. R. Helms, J. Appl. Phys., 59, 1767 (1986).
57. J. D. Cawley, J. W. HaIJoran, and A. R. Cooper, Oxid. Met., 28, 1 (1987).
58. 1. D. Cawley and R. S. Boyce, Phi/os. Mag., BS8, 589 (1988).
59. 1. D. Kalen, R. S. Boyce, and J. D. Cawley, J. Am. Ceram. Soc., 74, 203 (1991).
60. 1. E. Shelby, J. Appl. Phys., 43, 3068 (1972).
61. F. 1. Norton, J. Am. Ceram. Soc., 36, 90 (1953).
62. V. O. Altemose, J. Appl. Phys., 32, 1309 (1961).
63. G. A. Vostrov and O. J. Bolchakov, Prib. Tech. Eksp., 2, 112 (1966).
64. H. L. Eschbach, in Advances in Vacuum Science and Technology, E. Thomas., Ed.,
Pergamon, London, 1960, p. 373.
REFERENCES 149
65. R. D. Maurer, J. Appl. Phys., 29, 1 (1958).
66. R. H. Doremus, in Symp. on Nucleation and Crystallization in Glasses and Melts,
M. K. Reser. Ed., American Ceramic Soc., Columbus, Ohio, 1962, p. 119.
67. R. H. Doremus, J. Am. Ceram. Soc., 43, 655 (1960).
68. C. H. Greene and R. F. Gaffney, J. Am. Ceram. Soc., 42, 271 (1959).
69. C. H. Greene and J. Kitano, Glastech. Ber., 32K, V, 44 (1959).
69a. R. S. Subramanian and M. C. Weinberg, AIChE Jour., 27, 739 (1981).
70. G. H. Frischat and H. 1. Oel, Glastech Ber., 38, 156 (1965); Phys. Chem. Glasses,
8, 92 (1967).
71. L. N. Nemer, Glass Tech., 10 176 (1969).
72. C. R. Helms and B. E. Deal, Eds., The Physics and Chemistry of Si0 2 and the
Si.Si0 2 Interface, Plenum Press, New York, 1988; Vol 2, 1993.
73. E. A. Irene, Crit. Revs. in SoUd State and Materials Sci., 14, 175 (1988).
74. N. F. Mott, S. Rigo, F. Rochet, and A. M. Stoneham, Phil. Mag., B60, 189 (1989),
and other papers in this volume.
75. R. H. Doremus, J. Phys. Chem., SO, 1773 (1976).
76. R. H. Doremus, in Ref. 72, p. 17.
77. R. H. Doremus, Thin SoUd Films, 122, 191 (1984).
78. R. H. Doremus, J. Appl. Phys., 66, 4441 (1989).
79. S. C. Kao and R. H. Doremus in ref. 72, Vol. 2, p. 23 (1993).
80. O. L. Anderson and D. A. Stuart, J. Am. Chem. Soc., 37, 573 (1954).
81. C. Zener, in Imperfections in Nearly Perfect Crystals, Wiley, New York, 1952, p.
289.
82. 1. S. Masaryk and R. M. Fulrath, J. Chem. Phys., 59, 1198 (1973).
83. L. van Caugh, Silic. Ind., 295 (1975).
84. W. W. Brandt, Phys. Stat. Sol., 30, 263 (1975).
CHAPTER 9
FRACTURE
Mechanical failure of glass at temperatures below the glass transition is caused
by brittle fracture. In this chapter strength and fracture of glass are discussed
in two parts; first a discussion of experimental measurements and results, and
second their interpretation.
EXPERIMENTAL RESULTS
Testing Methods
In brittle materials, failure usually takes place at much lower tensile stresses
than compressive. In principle, the simplest test is to pull a rod, putting a
uniform tensile stress on it. In practice, there are difficulties in gripping the
sample, and except for fine fibers one must make the central length of the rod
smaller in diameter to be certain that failure does not occur at the grips.
Making such samples is difficult and expensive, so other tests are used in which
the stress distribution is not as simple as in a tensile test. For long fibers, the
direct tensile test is the simplest and most frequently used since gripping
problems can be overcome in a variety of ways.1-4
The most common tests are in bending (flexure), with either three or four
points of stress application. Rod samples are much better than bars because
chips at the corners of the bars can initiate fracture. In the bending of a rod
with four points, the tensile stress parallel to the sample axis is maximum on
a line on the sample surface opposite and between the inner points. The stress
S along this line for small strains is given by the simple bending formula
S = 8P /n.D3 (1)
150
EXPERIMENTAL RESULTS 151
where P is the force at each contact point and D is the sample diameter. The
stress on the sample surface decreases with the angle fJ with the midplane,
S. cos fJ S(l - 2fJ/1T.)1/2
(2)
and the stress decreases approximately linearly from the surface to the sample
axis. Thus the bend tests favor failure starting at the sample surface, where the
tensile stress is higher. The four-point bend test is preferable to the three-point
test because the former samples more of the specimen surface and is less prone
to failure at the contact points.
The diametral compression test provides an attractive alternative to bend
tests for some materials. 5 . 6 In this test, a right circular cylinder is compressed
along its diameter by two flat plates, giving a maximum tensile stress normal
to the loading direction across the loading diameter, and also from one face of
the cylinder to another, so that both surface and volume failures are possible.
A pad of material softer than the compressing plates must be inserted between
the sample and plates to prevent failure at the plates.
Compressive tests are sometimes used for glass, but failure usually takes
place at a corner contact of the sample with the compressing plates. Presum-
ably, failure is cause by a tensile stress that is difficuh to calculate, so these tests
give scattered and unreliable results.
Units of stress (strength) are particularly troublesome. Much older work is
reported in pounds per square inch (psi); the SI units are Pascals (Pa) or
Newtons per square meter. The conversion is
1.45 X 10- 4 psi = 1 Pa
or
6.70 X 10 3 Pa = 1 psi
Strength Distributions
When the failure stress of a number of glass samples is measured under
identical conditions of sample preparation and loading, the failure stresses vary
over a wide range of a factor of 2 or more, as shown in Fig. 1. It is desirable
to express this distribution of strengths in statistical terms. The strengths are
often distributed symmetrically, as is approximately so in Fig. 1, so they can be
described by a normal (Gaussian) distribution,
P = (l/d.,J21T.) exp[ - (S - Sm)2/2d 2 J
(3)
where P is the probability of finding a sample of strength (failure stress) S, S",
is the strength of greatest probability (P m = l/dJ21T.), and d is a measure of the
spread of the distribution (called the standard deviation) and is equal to the
root mean square of deviations from the mean strength. The integral of Eq. 3
gives the fraction F of samples that break below the stress S
F = HI + erf[(S - Sm)/.,JUJ}
152 FRACTURE
14
12
10
'0
.. .
u
f
u.
...
U
.D &
E
Z
4
2
Fracture Stress II 10 1 (psi)
Fig. 1 Distribution of fracture strengths of rods of Pyrex borosilicate glass 3 mm in
diameter in four-point bending at -196°C. Line from Eq. 3 with S",= 35.5 x 10 3 psi and
d=8.9 x 10³ ps i. Ref. 48.
where erf is the error function
2
erf x = 7t J exp( - A. 2 ) dA.
Recently, another distribution function called the Weibull distribution has
become quite popular in describing strength distributions
F == 1 - exp[ - S/So)m] (4)
where So is a scaling factor and m is a measure of the spread of the distribution;
smaller m, broader distribution. For m larger than about 3, the Weibull
distribution is nearly symmetrical and closely resembles the normal distribu-
tion.
A convenient way to examine the fit of strength data to a Weibull
distribution and to calculate m is to transform Eq. 4 to
logE - In(1 - F)] == m log S - m log So
(5)
A least-squares fit of the related equation gives values of m and So. If the
correlation coefficient R 2 of the fit is close to 1 ( 0.95), which means the data
EXPERIMENTAL RESULTS 153
fit the Weibull distribution well, these values are statistically acceptable;
however, if the fit is poorer, especially for R 2 <0.9, then a reasonable approxi-
mation to m and So can be found only with the maximum likelihood
procedure. 7 The data of Fig. 1 are plotted according to Eq. 5 in Fig. 2; the
Weibull parameters for the fit in Fig. 2 are m = 5.5 and So = 262 MPa
(3.8 x 10 4 psi). Weibull parameters and correlation coefficients calculated from
a regression analysis of Eq. 5 for different glass compositions, surface treat-
ments, and temperature are summarized in Table. 1. Compositions of the
glasses are given in Chapter 1.
Strengths of glass fibers carefully drawn are much higher than for ordinary
glass; E-glass has a strength of from (1-4) x 10 9 Pa at room temperature,2 and
silica fibers have even higher strengths. 1 . 3 . 4 The distributions of strengths of
these fibers in short lengths can be quite narrow,8,9 with a coefficient of
variation (standard deviation divided by mean strength) of 1-2%. On the other
hand, flame-polished or etched glass rods with high strengths can have very
b.road and nonuniform distributions,lO as shown in Fig. 3.
0.75
0,5
0.25
o
-0.25
,4; -0.5
c
T
1;:
sa -0.75
-1.0
-1.25
-1.5
o
o
-1.75 0
1.2 1.3 1,4 1.5 1.6 1.7 1.8
log(Load)
Fig. 2 Weibull plot (Eq. 3) of data in Fig. 1. Not all points are shown. Ref. 48.
...
TABLE 1 Mean Strength and Weibull Modulus for Strengths of Glasses
Cross head Mean Coefficient R 2 for
Number Temperature Speed Strength of Variation Weibull
Run Abraded of Samples CC) (em/miD) (MN/m 2 ) (%) m a Fit b
Soda-lime silicate
1 No 57 -196 0.13 245 25 4.5 0.98
2 Yes 49 -196 0.13 137 16 6.6 0.87
3 Yes 29 -196 0.13 236 17 6.5 0.86
4 Yes 104 23 0.13 135 20 6.4 0.96
5 Yes 58 23 0.025 132 18 5.9 0.96
6 Yes 90 23 0.013 112 18 6.7 0.94
7 Yes 123 23 0.00 13 103 20 6.2 0.94
8 No 37 23 0.13 166 28 4.2 0.95
Pyrex borosilicate
9 No 87 -196 0.05 246 21 5.5
10 No 21 23 0.25 134 17 6.4
11 No 21 23 0.051 123 15 6.0
12 No 21 23 0.013 118 20 6.4
13 Yes 85 23 0.127 117 14 7.8
F N borosilicate
14 Yes 100 -196 102 6.9 7.3
"Least-squares fit to Weibull distribution calculated from Eq. 5.
bCalculated from Eq. 5.
EXPERIMENTAL RESULTS 155
4
i
a:
'"
,
z
120 180 240 300
FRACTI.fiE STRESS . ,a' (pli)
Fig. 3 Distribution of fracture strengths of rods of soda-lime glass 3 mm in diameter
in four-point bending at -196°C after removing 9.4 J.tm by etching with dilute HF.
Ref. 48.
Effect of Surface Area on Strength
One of the most interesting experiments on the influence of sample diameter
on glass strength was carried out by Griffith. 11 He drew glass fibers of different
diameters and compared their strengths at the same stressed length in simple
tension; he had to age the fibers at ambient conditions and break short lengths
( '" 5 cm long) under tension to obtain reproducible results. Griffith fitted his
results with the equation
S = 154(110 + D)/(1.5 + D)
(7)
1000
"
s:.
0.
t:
v;
'
,So
"Q
30
o
I 3
Fiber diameter (mils)
Fig. 4 Fracture strengths of fibers of soda-lime glass 5 cm long, as a function of
diameter. Data from Griffith. 11
o
0.1
0.3
10
30 50
156 FRACTURE
where D is the fiber diameter in micrometers and S is the failure stress in
Pascals. Many other investigators have confirmed that as the stressed area of
glass surface increases, the strength decreases. 12 If Eq. 7 is extrapolated to very
small fiber sizes, a limiting strength of about 1.1 x 10 10 Pa is found, which is
about half the calculated theoretical strength of the glass (see below). Griffith's
data can also be plotted as log breaking strength against log diameter, as
shown in Fig. 4. Except for the one point at the largest diameter, the relation
is linear. Fused-silica fibers also showed a linear relation between log Sand
log D below 25 J.lm diameter, with higher expected strengths at larger diam-
eters. 13
Otto 14 reported no change in the strength of glass fibers from about 1 to 3
J.lm in diameter, and Thomas8.15 found no change in strength from a diameter
of 1 J.lm to about 30 J.lm.
Effects of Surface Treatment on Strength
When a glass surface is abraded or bombarded with particles, the strength of
the glass is reduced. Different treatments give quite different strengths. 16
If glass samples are carefully prepared and kept "pristine", they have very
high strengths. Many results up to 10 10 Pa have been reported 12 ,18, and
Hillig 12 . 18 measured strengths of up to 1.5 X 10 10 Pa at - 196°C for fused-
silica rods 1 mm in diameter. These samples were flame-drawn from larger rods
and carefully protected from contact with solids. It is spectacular to bend a
I-mm rod of glass into a closed loop (Ref. 18, Fig. 16). Bimodal strength
distributions were found for such fibers. If one so much as touched the fiber
lightly with a finger tip, it broke at much lower stress.
The strength of ordinary or abraded glass can be substantially increased by
etching with hydrofluoric acid. 19 . 21 The distribution of strength after etching
is shown in Fig. 3. Etching leads to some samples with very high strengths, but
samples etched in HF are highly sensitive to damage by handling, and many
samples have strengths lower than before etching. As the experimenter becomes
more skilled, fewer low-strength samples result.
A soda-lime glass held in water for a few hours after being abraded has up
to 1.5 times higher strength than if it is tested immediately after abrasion.21.221
Immersion in water for a short time increases the strength considerably. If
Vycor glass is tested in different organic liquids just after abrasion, it has
different strength depending upon the liquid; the more polar the liquid, the
greater the reduction in strength. All these results show that the strength of a
glass is almost always determined by the condition of its surface.
Influence of Temperature and Glass Composition on Strength
The strength of soda-lime glass as a function of temperature was determined
by Ernsberger 22 for failure at oblate bubbles inside the glass as shown in Fig.
5. The strengths of other high-strength glasses have a similar temperature
EXPERIMENTAl.. RESUlTS 157
1200
--
1000
-
.;;
Q.
-
.... 100
'Q
..
.c
C. eoo
c
u
.=
..
.!! 400
.;;
c
u
....
200
o 100 200 300 400 500 eoo
Absolute temperature (OK)
Fig. 5 Temperature dependence of the fracture strength of soda-lime glass at bubbles
inside the glass. 22
dependence. 1 . 2 However, abraded glasses of low strength often show little
temperature dependence of fracture strength. These temperature effects are
probably caused by the same mechanism as delayed failure, as discussed in the
next chapter. Hillig 18 found no difference in glass strength between -196°C
and 268°C; at these temperatures delayed failure is absent.
The glass composition can influence the strength indirectly through surface
chemical reactions, introduction of surface stresses, and other secondary effects.
However, there is no evidence that direct effects of glass composition on
strength, for example, as a result of changes in bonding in the silicon-oxygen
network, have been measured. Other results on the influence of surface damage,
temperature, and glass composition on strength were reviewed by LaCourse. 23
Observations of Fracture Surfaces and Origins
Markings on fracture surfaces can give information about the ongm and
direction of fracture propagation, as well as about material inhomogeneities
and local stress effects. The study of these markings is called fractology, and is
discussed on the scale of the optical microscope by Frechette. 24 The determi-
nation of the macroscopic origin of fracture, directions of fracture propagation,
and stress distributions is not discussed here.
A fracture surface on glass shows several characteristic regions: an origin
usually on the glass surface; a smooth region called the mirror; a misty region
outside the mirror; and finally a region of coarse surface roughness, called
hackle, as shown in Fig. 6. The distance R from the fracture origin to the
158 FRACTURE
Fig. 6 Fracture surface of soda-lime silicate glass, broken in bending at 25 0 C.
Ref. 48.
mirror-mist boundary (or the distance to the mist-hackle boun9ary) is related
to the fracture strength S by the empirical equation 25 - 28
S.jr = A
(8)
where A is a constant for a particular brittle material and temperature. Values
of about 2 x 10 6 N/m 312 were found for A for glass at room temperature.
Apparently, A is not significantly dependent on temperature or glass composi-
tion, although it can depend on sample history.281
Equation 8 is of considerable practical value because it allows one to make
an accurate estimate of fracture stress without having to measure it directly.
Thus for pieces with complex shapes where a stress analysis is difficult, or
where load measurements are not possible, Eq. 8 is invaluable.
Fracture origins in glass often look like that shown in Fig. 7, although quite
different shapes are also possible. 27 .29,30
A variety of special figures can develop on a fracture surface, depending
upon the initial state of stress. For example, lath-like regions of constant
thickness start at a particular distance on a fracture front in a tension-torsion
sample. 31 On the lines separating the laths, tiny "lances" separate from the
glass surface.
Observations of Surface Damage
Different chemical treatments, such as sodium vapor or a molten lithium
salt, give visible crack patterns on a glass surface; these cracks can result from
the treatment and do not represent prior damage to the surface. 32 Etching a
glass surface with hydrofluoric acid reveals elongated pits resulting from
surface cracks. 12
EXPERIMENTAL RESULTS 159
Fig. 7 Origin of fracture in soda-lime glass, scanning electron micrograph. Upper
surface is the original glass; fracture surface lower. 30
If a hard sphere is pressed against a glass surface, a crack around the contact
region first develops and then grows into the glass in a conical shape.33,34
These cracks are called Hertzian cracks because the elastic stressndistribution
for contact of a hard sphere on a plate was calculated by Hertz. 35 Other papers
on this subject are listed in Refs. 36 and 37.
If the indenter is sharp rather than spherical, the crack pattern is entirely
different. 37,38 A "median vent" crack propagates into the glass directly under
the indenter during loading. When the load is released, wing-like cracks
("lateral vents") propagate radially from the contact region. A region of the
glass directly under the indenter is deformed in a particular way that is
discussed in more detail in the section on plastic deformation in glass.
The impact of a hard spherical projectile gives damage with features of both
spherical and sharp indenters. 39 At low impact velocities, Hertzian cone cracks
are formed, but at higher velocities the cone cracks turn up at their ends and
finally resemble the radial wing-like cracks; at high velocities median cracks
also propagate down into the glass. Liquid impacts cause crack growth and
branching. 40
When a hard object such as a diamond indenter is dragged across a glass
surface, median and lateral cracks form along its track much as under an
indenter. 41 - 43 Abrasion of a hard su,face against the glass also gives this kind
of linear damage.
Velocity of Fracture Propagation
The velocity of fracture propagation in glass has been measured by a variety
of methods. 43 ,44 Velocity measurements from line markings on the mirror
surface known as Wallner lines were developed by Smekal 45 and Shand 25 . An
example of such experimental results is shown in Fig. 8. Fracture velocities can
also be measured from ripple marks on the fracture surface resulting from
160 FRACTURE
1800
1400
1200
.....
...
.... 1000
oS
>-
.. 800
'g
J 800
400
200
a
o
o
I.
diltonce L (em)
Fig.8 Velocity of a propagating crack in soda-lime glass versus crack length. Fracture
stress 6.7 x 10 6 Pa; points from Field (Ref. 44, Fig. ll), line from Eq. (33).
ultrasonic waves introduced perpendicular to the fracture face. Various tech-
niques of high-speed photography, such as rotation-mirror and multiple-spark
cam ras, can be used to measure crack velocity. Another method is to measure
the electrical conductivity of metal strips painted on the glass as they are
progressively broken by the fracture front.
FRACTURE CRITERIA, MODELS, AND EXPLANATIONS
Fracture Criteria
The experimental results described above provide strong evidence that the
surface condition of a glass determines its strength, and that flaws in the surface
reduce the strength. These results therefore led to a model of surface cracks as
the origin of brittle fracture. It is difficult to observe these cracks directly, and
there still is uncertainty about their size, depth, and shape. Inglis 461 solved
the elastic problem of an elliptical crack subjected to a tensile strength S. He
showed that the stress (J along the inside crack surface is given by
= 1 + 2c/a - (c + a)2x 2 /a 4 (9)
S 1 + (c 2 _a 2 )x 2 /a 4
where c is the depth of the crack (semimajor axis of the ellipse), a is the
half-width of the crack (semiminor axis of the ellipse), and x is the distance
FRACTURE CRITERIA, MODELS. AND EXPLANATIONS 161
from the crack tip parallel to the sample surface. Right at the tip (x = 0), the
s tress is
(l/S = 1 + 2c/a
(10)
In terms of the radius of curvature p = a 2 /c of the crack tip
(l/S = 1 + 2.jc/p 2.jc/p (11)
If the crack is not elliptical in shape, it can be shown that Eq. 11 is still the
proper form. Thus if the crack is deep and has a sharp tip, the stress at the tip
can be much higher than the applied stress. It seems reasonable that various
types of surface damage on glass could give rise to cracks with different depths
and tip radii, resulting in the influence of surface treatment on strength found
experimentally. Equation 9 shows that the stress drops off very sharply away
from the tip x = O. The complete elastic solution also shows that the stress
drops off sharply into the glass away from the crack tip. Thus the stress is near
the maximum value given by Eq. 11 in only a very small volume of the glass.
A term called the stress intensity factor K is often used; for a small, deep,
thin crack subjected to a tensile stress K = S.jnc. K is sometimes considered
to be a measure of the stress at the crack tip. The above discussion shows that
this use is incorrect because the maximum stress at the crack tip is given by
Eq. 11, and the crack tip radius must be included to determine this stress. The
use of K as a fracture criterion is often justified from energy considerations; the
discussion below on cracks and energy shows that this method is valid only in
a limiting case, again because the influence of the crack tip radius is neglected.
See ref. 48 for approximate stress functions.
One model of the crack tip is a cusp, giving a zero radius of curvature of
the crack tip. However, this model cannot correspond to physical reality. A
zero crack tip radius would give a high tip stress and crack propagation at any
finite applied stress; the experimental results of failure at various high stresses
show that the crack tip radius has a definite nonzero value. Even if the tip
radius is of atomic dimensions, the bonds holding the atoms together will
correspond to an effective nonzero tip radius. The discussion below, based on
thermodynamics, suggests that the minimum tip radius for fracture is about ten
atomic distances; if the tip radius is smaller than this value, the tip atoms
rearrange to form a larger tip radius when the crack is subjected to a tensile
stress.
Experiments show that glass samples with cracks of the same length but
with different treatment (e.g., freshly abraded or abraded and aged in water)
have different strengths, again showing the importance of the crack tip
radius. 46
Equations 9-11 are derived for linearly elastic conditions. It is sometimes
suggested that these equations must be modified for nonlinear elastic or plastic
behavior at high stresses. The discussions in subsequent sections on plastic
deformation show that such deformation probably does not take place in glass
in tension at room temperature, and nonlinear elastic effects are small.
162 FRACTURE
Theoretical Strength and Elasticity at High Strains
The results described above show that glass samples can have widely different
strengths; design strengths for glass parts are usually less than about 30 MPa
(4500 psi), but strengths up to 1.5 X 10 10 Pa have been measured for vitreous
silica at - 196°C. Thus the intrinsic strength of vitreous silica must be greater
than the latter value, and it is important to estimate how much greater. In this
section theoretical calculations of intrinsic strength are compared, and the
experimental behavior of glass at high stresses and strains discussed.
Glass is held together by a network of silicon-oxygen bonds. Therefore to
calculate the force needed to tear apart planes held together by these bonds,
some model of the forces between atoms is needed. A reasonable interatomic
potential for covalently bonded atoms is the Morse potential;47 the theoretical
cohesive strength a or ultimate strength of a material calculated from this
potential is 48
a 2 = Ey/4a
(13)
in which E is Young's modulus, y is the surface energy, and a is the interatomic
spacing in the glass. Equation 13 shows that the ultimate strength of a material
is related to its stiffness and to the potential energy per unit surface area at
equilibrium separation. Since each of these factors is proportional to the bond
strength, the ultimate strength is proportional to the bond strength.
The surface energy y can be approximately calculated from the bond free
energy G b and atomic density N of a solid,
y = !G b N 2 /3Z
(14)
where Z is the coordination number. For silicon-oxygen bonds,
Gb 6.6x 10- 19 J/bond, and y 5.2 J/m 2 for vitreous silica and 3.5 J/m 2 for
commercial soda-lime glass.
Young's modulus for vitreous silica is 7.2 x 10 10 Pa and a = 1.6 x 1O- 10 m,
so from Eq. 13, at;:;::: 2.4 x 10 10 Pa (3.5 x 10 6 psi); this estimate of ultimate'
strength is about 60% higher than the highest measured strength for silica. For
soda-lime glass, the ultimate strength is about 1.6 x 10 10 Pa (2.3 x 10 6 psi),
reflecting the lower bond density and somewhat lower bond strength 49 of
soda-lime glass. The estimate for fused silica is close to the value calculated by
Nardy-Szabo and Ladik 50 using the Morse potential function in quite a
different way.
At stresses above about 0.5 x 10 10 Pa (strains above 7%), Hillig 12 found.
that vitreous silica deviates from Hooke's law and becomes stiffer (has a higher
effective modulus) than at lower stresses. Krause et al. 51 confirmed this result
and found similar results for vitreous germania; vitreous B 2 0 2 and As 2 S 3 and
commercial soda-lime glass also showed deviations from Hooke's law but in
the opposite sense. These differences between glass compositions probably
correspond to the increase (silica and germania) and decrease (other glasses)
of modulus with temperature found for these glasses.
FRACTURE CRITERIA, MODELS, AND EXPLANATIONS 163
The tensile deformation of glasses at high stresses is entirely reversible and
instantaneous, so there is no evidence for any plastic deformation in these tests.
Plastic Deformation in Glass
In contrast to tensile and bend tests of glasses, indentation of glass with a sharp
point leads to regions of deformation under the indenter that do not recover
when the load is removed. 52 ,s) This deformation in fused silica is apparently
a "densification" that recovers completely on heating. In glasses with modifiers
(alkali and alkaline earth oxides), this deformation can be partly a densifica-
tion,54 but only a small part of the deformation recovers upon heating. 55-57
More detailed examination of this deformed region under a sharp indenter
showed that it is made up of flow or fault lines between which there are only
elastic strains. 58 - 61 Some concise definitions will perhaps help to clarify the
discussion of "plasticity" in glass and distinguish between the following
different kinds of deformation:
1. Elastic: instantaneous and completely recoverable upon removing the
load;
2. Anelastic: recoverable but requiring a measurable time for deformation
after application or removal of the load;
3. Viscous: the uniform noncoverable flow of a liquid or amorphous solid
subjected to a shearing stress; the rate of deformation is usually directly
proportional to the load;
4. Plastic: the nonrecoverable nonuniform deformation of a crystalline solid;
Occurs preferentially on certain lattice planes and in certain lattice
directions, and results from dislocation motion; can occur at low stresses;
5. Faulting: nonrecoverable nonuniform deformation along certain planes
in a solid that are determined by the applied loads; occurs only under a
compressive stress close to the ultimate strength of the solid.
It is also useful to define
6. Crack: a flaw or defect in a solid, usually planar, in which solid planes
are separated by a few or more lattice distances over a certain area.
With these definitions, the shear deformation of glass under a concentrated
compressive load is distinguished from other types of deformation and is called
faulting, in analogy to geological faulting. The excellent studies of Hagan 61
show that this deformation has the following additional characteristics:
1. The fault lines are extremely narrow, probably no more than a few atomic
distances thick.
164 FRACTURE
2. The fault lines meet at 110°, instead of the 90° required by the traditional
ideal elastic-plastic behavior.
3. Kinks at intersections of flow lines show that the fault planes are not
cracks (see definition above) with free surfaces.
4. The fault lines can act as nucleation sites for cracks.
In view of these characteristics, these fault lines resemble geological faults
and are quite different from slip in plastic deformation of crystals. Thus it seems
important to distinguish this faulting deformation from plastic deformation in
ductile crystals.
Viscous flow is much too slow in glass to cause appreciable deformation at
ambient temperatures. The viscosity of commercial soda-lime glass at 490°C is
about IOu P, with an effective activation energy of greater than 400 kJ /mol;
the activation energy increases with decreasing temperature. 62 . 63 Thus the
viscosity at room temperature is greater than 10 59 P.
It is perhaps of interest to try to invent some atomic models for some of the
deformations in glass. Densification is anelastic deformation by the definitions
above. It occurs by bending and twisting but not breaking of the silicon-
oxygen bonds in the glass network as they respond to a compressive stress.
Since the. bonds are only distorted but not broken, they return to their original
configuration when they are heated to a temperature at which they can
unwind. Densification is preferred in fused silica, in which the lattice is not
broken up by modifier ions.
In silicate glasses with modifier ions, shear displacements occur at high
compressive stresses because the silicon-oxygen lattice is partially broken up,
possibly by planes of modifier ions. The fault planes resulting from these
displacements can be modeled as being at most a few atoms thick and
consisting of distorted regions of broken modifier and lattice bonds. These
planes are not like regions over which dislocations have moved since the latter
re-form more or less into the original lattice.
Scanning electron micrographs of glass surfaces after scoring with diamond
points show shapes that resemble those from metalworking. 58 ,59 Nevertheless,
these deformations are very different from plastic deformation in metals and
other ductile materials, since they arise only from sharp points and do not
occur with large-scale stressing in tensile and bending modes. They probably
result from a combination of densification and shear faulting. Likewise, furrows
and pile-up after scribing 64 are probably combinations of these modes of
deformation; in none of these cases is there any viscous flow or plastic
deformation in the sense of the above definitions.
What is the significance of densification and faulting deformation in glass to
the elastic solutions around a crack? Since crack propagation under normal
conditions occurs as a result of applied tensile stress at the crack tip, there is
not reason to expect densification or faulting under these conditions, and the
elastic solutions should be valid.
FRACTURE CRITERIA, MODELS, AND EXPLANATIONS 165
Cracks and Energy
An applied tensile load is enhanced at a crack tip, as shown by the elastic
solution of Inglis and Eqs. 10 and 11. There has been no direct experimental
test of these relations; in some limited tests there is evidence for the dependence
of failure stress on the square root of crack length 11 and on tip radius. 46
Because it has not been possible to observe the crack tip directly, there have
arisen fracture criteria in which changes in its radius are ignored. 11 ,65 These
criteria are based on Griffith's calculation of the strain energy change in a
stressed material caused by a crack. Griffith derived the equation
S / = 2Ey /nc (15)
for the fracture stress Sf in a material with a crack depth c, surface energy y,
and Young's modulus E. This criterion is different form that oflnglis (Eqs. 10
and 11). In a treatment of crack energies and fracture criteria in terms of
thermodynamic laws,66 I concluded that the Griffith equation provides a
necessary but not sufficient condition for fracture, and that the Inglis equations
provide the correct criterion for fracture. The second law of thermodyamics
shows that the fracture stress cannot be less than that given by Eq. 15, but can
be greater.
If the applied stress is high enough to cause propagation by Eq. 11, but
propagation cannot occur because Sf is lower than calculated from Eq. (15),
what happens? The stress at the crack tip will be higher than the theoretical
ultimate strength at of the material, so it is reasonable to assume that the
material at the tip will fluctuate to a larger tip radius so that the tip stress is
reduced below at' This reasoning from the second law of thermodynamics,
therefore, predicts that fracture will occur only when the tip radius is larger
than some critical minimum value Pm' A measure of Pm can be gained by
comparing Eqs. 11 and 15 for the fracture stress. Then,
Pm = 8Ey/na/ (16)
is the tip radius for fracture. From Eqs. 13 and 16,
Pm = 32a/n
(17)
Thus the minimum tip radius for fracture is about ten times the interatomic
spacing and is independent of other parameters.
Surface energies of brittle solids have been calculated from fracture measure-
ments in several different ways. 67 - 69 In all of these methods, the Griffith
relation (Eq. 15) is assumed valid. In one method, the stress needed to fracture
a material with a crack of depth c is measured, and the surface energy y is
calculated from Eq. 15. In the present view, the stress needed to propagate a
crack of length c will be greater than or equal to the value calculated from Eq.
15. Thus one might expect values of y calculated by these methods to be larger
than the theoretical values and scattered. These are the results actually found
experimentally for a variety of brittle solids. 66 For example, for soda-lime glass
166 FRACTURE
the measured values of y vary fom 3.4 to 11 J /m 2 , the lowest value being close
to the value calculated from Eq. 14. This is just the result expected if Eq. 15 is
a necessary but not sufficient condition for fracture.
Quite different views of crack shape and fracture processes in glass are
held. 691
Nucleation of Cracks
The flaw model successfully explains most features of brittle fracture and is
generally accepted. This model assumes that fine cracks already exist in a
material. How do these cracks get into the material? As described above,
pressing a hard sphere against a glass surface causes a ring crack and then a
cone crack. In some cases the ring cracks appear to start at pre-existing flaws
and then propagate. 34 However, indenting a flaw-free surface of fused silica can
nucleate a ring if the load is high enough.61 In soda-lime glass, sharp indenters
and projectiles give median and radial cracks and scribing gives median and
lateral cracks, as described previously. These types of damage are probably
common in glass surfaces as a result of ordinary handling and contact with
other solids.
Hagan and Swain 70 proposed that these median, radial, and lateral cracks
are formed as a result of the fault lines described above. They suggested that
median cracks are formed by the need to accommodate strains at the
intersection of two flaw lines just like crack nucleation from dislocations on
two intersecting slip planes. The lateral and radial cracks start at the boundary
between the faulted region and the rest of the glass or along the fault lines and
nucleate by unloading residual compressive stresses. In fused silica, even under
a sharp indenter, there is only a densified region with no fault lines. Cone
cracks nucleate directly, and median cracks form during loading because of the
expansion of the boundary between compacted and elastic glass. 61 Lateral
cracks arise from mismatch of strain at the boundary.
This discussion shows that the nucleation of flaws in a pristine glass surface
can be understood qualitatively as resulting from the stress and deformation
caused by colliding projectiles, indentations, and scribing that are involved in
handling the glass surface.
Apparently, chemical reactions at the glass surface can cause crack nu-
cleation when a stress is applied. Just touching the surface of a pristine silica
rod lowers its strength drastically, and fracture origins in high-strength silica
show impurities, e.g., sodium chloride, by electron microprobe analysis. The
detailed mechanism by which these chemicals lead to cracks is uncertain.
Effect of Surface Treatment on Glass Strength
From the flaw model, the increase in strength of glass that results from etching
with hydrofluoric acid is explained by the removal of surface flaws. The
FRACTURE CRITERIA, MODELS, AND EXPLANATIONS 167
strength does not increase much when the etch depth is less than about 2 J.lm,
showing that the tip radius is not appreciably etched, probably because the
etching solution in the cracks becomes rapidly saturated with reaction prod-
ucts. 10 As the etch depth becomes greater, some samples show high strengths
of up to 3 X 10 9 Pa (see Fig. 3), presumably because some surface areas are
etched free of all but the shallowest defects. A simple model of the etching
process is that material is removed uniformly from the sample surface with no
etching at the tip. For a crack depth C perpendicular to the surface, the etch
depth is Co - c, where Co is the depth before etching. Then from Eq. 11, the
fracture strength S after etching to a depth Co - c is
S/So = Jco/c
(18)
where So is the strength before etching.
After etching with HF, the surface of glass shows pits resulting from the
cracks etched away. Thus a more accurate model of the etching process is that
there is still no etching at the tip, but some etchant penetrates into the top of
the crack, widening it.
Crack depths can be estimated from a comparison of Eq. 18 and strengths
of etched glass. As the etch depth approaches Co' the initial crack length, the
strength increases sharply. Samples of soda-lime glass were found to have a
crack depth of about 6 J.lm with a strength at -196°C before etching of about
130 MPa. Then from Eq 11 and the theoretical strength of about 1.6 x 10 10
Pa for soda-lime glass, the tip radius is calculated to be about 1.6 nm or about
ten lattice spacings, close to the estimate of Eq. 17 for minimum tip radius.
The increase in the strength of freshly abraded soda-lime glass after it is
treated in water for several hours can be understood as resulting from the
broadening of the tip radius by uniform corrosion of the glass at the tip. The
etching method described above can be used to show that the crack length is
not changed by soaking the glass in water. 46 This experiment also demon-
strates a situation where the Griffith criterion Eq. 15 fails, since it predicts that
the strength should be the same if the flaw depth is unaltered.
Fracture Origins and Velocity of Crack Propagation
The depths of surface features such as that in Fig. 7 have been taken as the
depths of the crack-initiating flaws.27.29 However, many of the depths of these
features are much greater than expected from other measurements of crack
depths for comparable fracture strengths. 10 ,16,71 It seems more likely that the
initiating flaw was not nearly as deep as the semicircle in Fig. 7, and that this
feature results from the early stages of crack propagation.
Figure 8 suggests a possible geometry for initiation of crack propagation in
a sample such as the one in Fig. 7. A long, straight crack DF penetrates into
the glass surface to a depth c much less than the crack length and is inclined
168 FRACTURE
Applied Tensile Stress
t t t t
..........
E
F
! ! !
Fig. 9 Schematic plan view of a crack DF in a glass surface and its propagation path
DE. EGF is the final fracture plane. 30
at an angle {3 to the applied stress. The highest tensile stress on the crack tip
will occur somewhere along its length, usually not at the end, but at the point
shown by a cross in Fig. 9.
After starting to grow at point X, the new crack front moves along the
bottom of the initial crack DF and into the glass. At point D the crack turns
along the line DF; a similar path was found for straight-through cracks in
glass. 72 A possible explanation for the circular trace of the initial propagation
path with the final plane of fracture is that this plane is perpendicular to the
applied stress and is defined by equal path lengths XE and XF on the glass
surface, as well as the curved path XG down into the glass. If the crack
propagates with the same velocity in all directions, the crack front will be
drcular when it reaches the final fracture plane EGF.
A simple equation for crack velocity v as a function of crack depth C is 73-75
v = v lII (1 - colc)
(19)
where Co is the initial crack length, VIII = mJElp is the maximum velocity, E is
Young's modulus, p is the density, and m is about 0.4-0.5. Equation 19 is
compared with experimental results on the velocity of a crack in a soda-lime
glass in Fig. 8, with VIII = 1500 m/s and Co = 1 mm. The fit is good for these
data; Congleton and Petch 76 and Kerkhof and Richter 77 found poorer
agreement between experiments and Eq. 19. Schardin 78 discussed the variation
of VIII with glass composition.
REFERENCES 169
REFERENCES
1. B. A. Proctor, I. Whitney, and 1. W. Johnson, Proc. Roy. Soc. London Ser. A, 297,
534 (1967).
2. N. M. Cameron, Glass Technol., 9, 14, 121 (1968).
3. R. D. Maurer, Appl. Phys. Lett., 27, 220 (1975).
4. C. R. Kurkjian, R. V. Albarino, J. T. Krause, H. N. Vazirani, F. V. DiMarcello, S.
Torza, and H. Schonhorn, Appl. Phys. Lett., 28, 588 (1976); 29, 712 (1976).
5. O. Vardar and I. Finnie, Int. J. Fracture, 11, 495 (1975).
6. M. B. Thomas, R. H. Doremus, M. Jarcho, and R. L. Salsbury J. Mater. Sci., IS,
891 (1980).
7. R. H. Doremus, J. Appl. Phys. 54, 193 (1983).
8. W. F. Thomas, Nature (London), 181, 1006 (1958).
9. R. E. Mould, J. Appl. Phys. 29, 1263 (1958).
10. E. K. Pavelchek and R. H. Doremus, J. Mater. Sci., 9, 1803 (1974).
11. A. A. Griffith, Phi/os. Trans Roy. Soc London Ser. A, 221, 163 (1921).
12. W. B. HilIig, in Modern Aspects of the Vitreous State, Vol. II, 1. D. Mackenzie,
Ed., Butterworths, London, 1962, p. 152.
13. F. O. Anderegg, Ind. Eng. Chem., 31, 290 (1939).
14. W. H. Otto, J. Am. Ceram. Soc., 38, 122 (1955).
15. W. F. Thomas, Phys. Chem. Glasses, 1, 4 (1960).
16. R. E. Mould and R. D. Southwick J. Am. Ceram. Soc., 42, 542, 582 (1959).
17. R. E. Mould, in Fundamental Phenomena in Materials Science, Vol. IV, 1. Bonis, J.
1. Diega, and J. 1. Gilman, Eds., Plenum, New York, 1964, p. 119.
18. W. B. HilIig, J. Appl. Phys. 32 741 (1961).
19. B. A. Proctor, Phys. Chem. Glasses, 3, 7 (1962).
20. C. Symmers,1. B. Ward and B. Sugarman, Phys. Chem. Glasses, 3, 76 (1962).
21. E. K. Pavelchek and R. H. Doremus, J. Noncryst. Solids, 20, 305 (1976).
22a. R. E. Mould, J. Am. Ceram. Soc., 43, 160 (1960).
22. F. M. Ernsberger, Phys. Chem. Glasses, 10, 240 (1969).
23. W. C. LaCourse, in Introduction to Glass Science, L. D. Pye, H. J. Stevens, and W.
C. LaCourse, Eds., Plenum, New York, 1972, p. 451.
24. V. D. Frechett, in Introduction to Glass Science, L. D. Pye, H. 1. Stevens, and W.
C. La Course, Eds., Plenum, New York, 1972, p. 433.
25. E. B. Shand, J. Am. Ceram. Soc., 37, 52, 559 (1954); 42, 474 (1959).
26. W. C. Levengood, J. Appl. Phys. 29, 820 (1958).
27. 1. J. Mecholsky, S. W. Freiman, and R. W. Rice, J. Am. Ceram. Soc., 57, 440 (1974).
28. H. P. Kirchner, R. M. Gruver, and W. A. Sotter, Phi/os Mag., 33, 775 (1976).
28a. W. T. Han and M. Tomozawa, J. Noncryst. Solids, 163, 309 (1993).
29. 1. R. Varner and 1. Oel, Glastech. Ber., 48 73 (1975).
30. R. H. Doremus and W. C. Johnson, J. Mater. Sci., 13, 855 (1978).
31. E. Sommer, Eng. Fracture Mech., 1, 539 (1969).
32. F. M. Ernsberger, Proc. Roy. Soc. London Ser. A, 257, 213 (1960).
33. F. C. Roesler, Proc. Phys. Roy. Soc. London Sect B, 64 55, 981 (1956).
170 FRACTURE
34. F. C. Frank and B. R. Lawn Proc. Roy. SoC'. London Ser. A, 299, 291 (1967).
35. H. Hertz, in Hertz's Miscellaneous Papers, MacMillan, New York, 1896, Ch. 5, 6.
36. B. A. Bilby, J. Mater. Sci., 15, 535 (1980).
37. B. R. Lawn and T. R. Wilshaw, J. Mater. Sci., 10, 1049 (1975).
38. K. Peter, Glastech Ber., 37, 333 (1964).
39. C. G. Knight, M. V. Swain, and M. M. Chaudhri, J. Mater. Sci., 12,1573 (1977).
40. M. V. Swain and 1. T. Hagan, J. Mater. Sci., 15, 387 (1980).
41. F. M. Ernsberger, Annu. Rev. Mater. Sci., 2, 529 (1972).
42. B. R. Lawn, Proc. Roy. Soc. London Ser. A, 229, 307 (1967).
43. F. Kerkhof, Bruchvorgange in Glasern, Verlag der Dt. Glastechn. Ges., Frankfurt,
1970.
44. 1. E. Field, Contemp. Phys., 12, 1 (1971).
45. A. Smekal, Glastech. Ges., 23, 57 (1950).
46. R. H. Doremus and E. K. Pavelchek, J. Appl. Phys. 46, 4096 (1975).
46a. C. E. Inglis, Trans lnst. Naval Arch. 55, 219 (1913).
47. J. J. Gilman, in The Physics and Chemistry of Ceramics, C. Klingsberg, Ed.,
Gordon and Breach, New York, 1963, p. 240.
48. R. H. Doremus, Fracture and Fatigue of Glass, in Treatise in Materials Science and
Engineering, Vol. 22, Academic Press, Orlando, FL, 1982, p. 170.
49. S. Sakka and H. Hotta, J. Mater. Sci., 14, 2335 (1979).
50. J. Nardy-Szabo and J. Ladik, Nature (London), 188,226 (1960).
51. J. T. Krause, L. R. Testardi, and R. N. Thurston, Phys. Chem. Glasses, 20, 135
(1979).
52. E. W. Taylor, Nature (London), 163, 323 (1949).
53. 1. E. Neely and 1. D. Mackenzie, J. Mater. Sci., 3, 603 (1968).
54. F. M. Ernsberger, J. Am. Ceram. Soc., 51, 545 (1968).
55. T. Izumitani and J. Suzuki, Glass Technol., 14, 35 (1973).
56. T. Izumitani, in Treatise on Materials Science and Technology, Vol 17, Glass II,
M. Tomozawa and R. H. Doremus, Eds., Academic Press, New York, 1979, p. 115.
57. M. Imaoka, and I. Yasui, J. Noncryst. Solids, 22, 315 (1976).
58. K. Peter, J. Noncryst. Solids, 5, 103 (1970).
59. E. Dick, Glastech. Ber., 43, 16 (1970).
60. F. M. Ernsberger, J. Noncryst. Solids, 25, 293 (1977).
61. J. T. Hagan, J. Mater. Sci., 14,462,2975 (1979); 15, 1417 (1980).
62. R. H. Lillie, J. Am. Ceram. Soc., 14, 502 (1931); 15,418 (1932); 16,619 (1933); 19,
45 (1936).
63. F. R. Gauthier, M. S. Thesis, Rensselaer Polytechnic Institute, Troy, New York,
1975.
64. D. M. Marsh, Proc. Roy. Soc. London Ser. A, 282, 33 (1964).
65. G. R. Irwin, J. Appl. Mech., 24, 361 (1957).
66. R. H. Doremus, J. Appl. Phys. 47, 1833 (1976).
67. 1. 1. Gilman, J. Appl. Phys. 31, 2208 (1960).
REFERENCES 171
68. 1. Nakayama, J. Am. Ceram. Soc., 48, 583 (1965).
69. R. W. Davidge and G. Tappin, J. Mater. Sci., 3, 165 (1968).
69a. B. R. Lawn, Fracture of Brittle Solids, Cambridge Univ. Press, Cambridge, (1993).
70. J. T. Hagan and M. V. Swain J. Phys. D., 11, 2091 (1978).
71. S. M. Ohlberg, L. L. Sperry, J. M. Parsons, and H. R. Golob in Advances in Glass
Technology, Part 2, Plenum, New York, 1962, p. 28.
72. F. Erdogan and G. S. Sih, J. Basic Eng., 85,519 (1963).
73. N. F. Mott, Engineering, 165, 16 (1948).
74. J. P. Berry, J. Mech. Phys. Solids, 8, 194 (1960).
75. E. N. Dulaney, and W. F. Brace, J. Appl. Phys., 31, 2233 (1960).
76. J. Congleton and N. J. Petch, Phi/os.' Mag., 16,749 (1967).
77. F. Kerkhof and H. Richter, in Fracture 1969, P. L. Pratt, Ed. Chapman and Hall,
London, 1969, p. 463.
78. H. Shardin, in Fracture, B. L. Averbach D. K. Felbeck, G. T. Hahn and D. A.
Thomas., Eds., The Technology Press and Wiley, New York, 1959, p. 297.
CHAPTER 10
FATIGUE IN GLASS
Fatigue in glass results when its strength deteriorates while it is stressed in an
atmosphere containing water. This fatigue requires design strengths three or
four times lower than if they retained their initial strength. In this chapter,
fatigue in glass is discussed in the following sections: testing methods, experi-
mental results, life prediction, and theories. A more extensive review is given in
Ref. 1.
METHODS OF TESTING
The simplest method of studying fatigue in glass is a static test in which a
constant load is imposed on a set of samples and the time of failure of each
sample is recorded. Such tests can be done in bending, simple tension, or
diametralloading; bending is easiest for rods and tubes and requires simple test
equipment. Although static tests are the closest to practical situations and the
least complicated in principle, they have some disadvantages. They require a
large number of samples for each of several stresses to define the stress-failure
time relationship, because of the large spread in failure times at a particular
stress. Often it is difficult or expensive to obtain the required number of
samples. Static tests must also be carried out over a large spread of times,
leading to long delays in obtaining results.
Fatigue can also be measured with samples tested at different loading rates;
the dependence of fracture strength on loading rate is relat.ed to the stress-
failure time relation in static loading. This method requires fewer samples and
less time, but a testing machine with a linear load application is needed.
172
RESULTS OF STATIC FATIGUE TESTS ON GLASS 173
Another method is to measure directly the velocity at which large ( '" 1 cm)
cracks propagate under different applied loads. This method has been widely
used, but experimental and theoretical treatments suggest that results from this
technique are not always directly comparable with the fatigue behavior of
practical materials with much smaller flaws (a few micrometers long).
RESULTS,pF STATIC FATIGUE TESTS ON GLASS
Failure times of Pyrex borosilicate glass rods in bending are shown in Fig. 1. 2
Each point represents the mean of many measurements, usually 40 or more.
The results are plotted as log reduced stress SISN vs. log fracture time, where
S is the maximum stress in four-point bending and SN is the mean fracture
stress in the same test at -196°C, where there is no fatigue. Similar fatigue
results 4 for a commercial soda-lime glass are shown in Fig. 2. Other results are
given in Tables 1 and 2. Compositions of glasses referred to in this chapter are
given in Chapter 1, Table 1, on viscosity. Other data are reviewed in Ref. 1.
Humidity strongly influences the failure time. Rods of soda-lime glass all
-.J
0
0
-.2
;;z
..... _ 3
'
CI
.2
o
-4
6
Fig. 1 Mean log failure times (in seconds) for Pyrex borosilicate glass rods held at
constant relative stress S/SN (static fatigue) at 60% relative humidity at 25°C, Line from
Eq. 2; data from Ref. 2.
174 FATIGUE IN GLASS
0.45
-0-
0.40 -- -a-
- ........
0.35 ---
SISN -0-
----
0.30 -
a a
0.25 a
a
a -
a
0.20
0 0.5 1.0 1.5 2.0 2.5 3.0 3.5 4.0 4.5 5.0
Mean lag'
Fig. 2 Mean log failure times (in seconds) in 100% humidity at 25°C for soda-lime
silicate (Kimble R-6) glass rods abraded and then aged 25 h in water before testing.
Lines show 95% confidence limits for log-t values. From Ref. 4.
treated in the same way and all having a mean SN of 86 MPa had mean failure
times of 8.7, 200, 3470 s in water, 43% r.h. and 0.5% r.h. respectively, all at a
stress S/SN = 0.5. 3 Log tt' is about linear with relative humidity over this range
of humidities.
Surface treatment and sample history strongly influence the failure times of
glass tested at the same relative humidity and relative stress S/SN' Values oft t ,
TABLE 1 Failure Times Measured for Soda-Lime Glass Rods
in Static Bend Tests
Test Conditions, 50% r.h. 4 t 1/2 (s) SN (MPa)
Tested immediately after abrasion 304.0 118
Abraded, aged 24 h in water 3.4 160
Abraded, heated to 400°C for 1 h,
held 24 h in water 37.0 187
Abrasion conditions, tested in water 3
Severe grit blast 2.9 86
Mild grit blast 8.8 93
Perpendicular to stress
600 grit paper 0.0043 134
320 0.149 95
150 0.56 70
Parallel to stress
150 grit paper 0.14 165
RESULTS OF STATIC FATIGUE TESTS ON GLASS 175
TABLE 2 Comparison of Correlation Coefficients for
Different Equations for Failure Times of Pyrex Glass at
60% Relative Humidity and 25°C
Equation Number
Correlation Coefficient R 2
1
2
3
0.805
0.869
0.917
the time of failure at S / S N = 0.5, are given in Table 1 for soda-lime glass after
different treatments. The failure times range over five orders of magnitude, and
there is no simple connection with inert strengths SN'
Fatigue in silica (Si0 2 ) glass has been of special interest because it
represents a pure silicate glass without alkali and alkaline earth ions. Further-
more, the development of fiber optic waveguides made of fine silica glass fibers
has emphasized the need for reliable information on the fatigue life of silica.
Static fatigue data on abraded silica rods 5 and pristine silica fibers 6 are shown
in Fig. 3. In both these studies, all samples were treated identically, and were
chemically "clean" because of abrasion 5 and fire drawing. 6
Experimental results on strength and fatigue of very strong silica seem to be
influenced by the chemical treatment of the silica surface. Just touching lightly
1.0
0.8
0.6
5/5.
c
0.4
c
--
c '"----
--"--"
-,,-
9.03
0.2
5
L09 time (see)
Fig. 3 Mean log failure times for silica glass held at constant reduced stress S/SN" 0,
rods, centerless ground, 50% relative humidity 23°C;' 6, fibers flame polished in room
air and temperature;6 0, etched with 8% HF.
o
I
2
3
4
6
7
8
176 FATIGUE IN GLASS
the surface of a pristine silica rod greatly lowers its strength. Fracture origins
in strong silica tubes, when micro analyzed, show alkali or alkaline earth
contaminants. Strong silica fibers, when stripped of their organic coatings,
show transitions or nonuniform functional dependencies of failure time on
stress. 7
Silica fibers for use as waveguides are usually coated with an organic
polymer to reduce their susceptibility to fatigue. 7 ,9 - 12 These coatings reduce
fatigue at short. times, for example, a day at 22°C, but at longer times, higher
temperatures,13 and in alkaline media 11 the coatings are attacked, and the
fatigue becomes more like that of uncoated silica. When the coated fibers were
treated in flowing distilled water at 90°C, the fatigue "drop" occurred at longer
times than in static solution. All these results show the strong influence of
chemical contamination on fatigue times of strong silica fibers.
The fatigue time decreases at higher temperatures. 7 ,13,14 The temperature
dependence of fatigue does not follow an Arrhenius relation; below about
-100°C in soda-lime silicate glass, fatigue becomes very slow compared to
experimental times.
Because of the large influence of sample history on fatigue, it is difficult to
compare the fatigue response of different glass compositions. Some results for
different glasses are listed in Table 3; unfortunately, the histories of the different
8
4
o
,.......,
......
IJ..
.!. -0.4
--
c:
"'j
........
-0.8
-1.2
-1.6
0.2 0.4
log (log t + J)
Fig. 4 Probability plot of log failure time as a function of fraction failing for Pyrex
borosilicate rods at 65% humidity and 25°C. 2
-2.0
-0.2
o
0.6
0.8
STATISTICS OF FATIGUE 177
TABLE 3 Standard Deviation of Log Failure Time as a function of SIS N
Standard Standard
S/SN Mean log t Deviation S/SN Mean log t Deviation
Fused silica, sets 100 samples s
0.70 0.22 0.76 0.531 1.1 02 0.902
0.65 3.06 0.74 0.504 0.924 0.863
0.60 3.57 0.63 0.489 1.182 1.239
0.55 4.04 0.97 0.471 1. 731 1.065
0.50 4.73 0.93 0.466 1.829 1.337
0.452 1.898 1.028
FN borosilicate, sets of 100 samples s 0.435 2.373 1.496
0.425 1.740 1.253
0.550 0.77 0.78 0.408 2.374 1.300
0.525 1.20 0.83 0.394 3.214 1.634
0.500 1.51 0.85 0.398 3.573 1.540
0.475 2.02 0.86 0.371 3.744 1.484
0.459 2.67 1.00 0.352 4.261 1.1 06
0.400 3.96 1.39 0.337 4.811 1.1 77
0.329 5.317 1.179
Pyrex borosilicate 2
Soda-lime silicateB
0.728 0.530 0.629
0.673 0.390 0.715 0.461 1.80 0.75
0.647 0.289 0.783 0.424 2.40 1.1
0.608 0.447 0.882 0.378 2.98 1.1
0.583 1.040 0.845 0.332 4.00 1.2
0.568 0.887 0.995 0.298 5.36 2.4
0.542 1.296 0.994
compositions were not all the same. Nevertheless, it appears that all the glasses
except for fused silica have roughly the same fatigue sensibility. Abraded silica
is less sensitive; however, pristine or etched silica has a lower log tt ( < 2.0), as
shown in Fig. 2.
STATISTICS OF FATIGUE
The failure times of glass samples that are tested under identical conditions and
that have identical treatments still show a large spread, as shown in Fig. 2 and
Table 4. This spread is related to the spread in fracture strengths discussed in
Chapter 9. These spreads can be treated in statistical terms, as discussed in
Chapter 9. A plot of the distribution of log failure times for Pyrex borosilicate
glass rods measured under identical conditions is shown in Fig. 4. In this
example, the failure times had a range of five orders of magnitude. The plot is
178 FATIGUE IN GLASS
TABLE 4 Comparison of gtTlS N Values from Eq. 11
Glass
Calc. from
g and (1 ISH
Derived from
(1 versus SHIS Plots
References
Soda-lime
FN borosilicate
Pyrex
Fused silica
Soda-lime
0.41
0.32
0.51
0.22
0.47
0.48
0.45
0.46
0.48
0.36
8
5
2
5
4
on probability paper; a straight line on this plot suggests that the distribution
of log failure times is a normal distribution, (Chapter 9, Eq. 3).
The mean of a sample of experimental measurements taken from a large
population (for example, the log failure times for a series of samples held at a
particular stress) is the "best" statistical measure of the "middle" of the
distribution. It is the expected value and is unbiased and consistent (see
statistical books such as Bhattacharya and Johnson 15 and B ury 16). The mean
of the sample is therefore the best statistical estimate of the mean of the
fictitious population of all log t values (the "true" mean). The distribution of
the sample means has a standard deviation u/.Jn, where u is the standard
deviation of the population and n is the number of measurements in the
sample. The standard deviation u of the sample is the best measure of the
standard deviation of the population, so that u/.Jn is a measure of the
reliability of the mean value calculated for the sample.
What the statistical jargon of the last paragraph means in plain language is
that the arithmetic mean of log failure times is the correct measure of the failure
times measured under identical conditions. Furthermore, the reliability of this
mean value increases as the square root of the number of measured times. Even
if there is a large spread in measured failure times, as in Fig. 4, it is possible to
obtain a reliable mean failure time by making enough measurements. It is also
possible to predict how likely it is for a given measurement of failure time to
be a certain amount away from the mean time from the distribution of
measured times.
LIFE PREDICTION
An important practical problem is to predict the useful life of a stressed piece
of glass. The mean value of failure time at a particular stress can be found if
the functional dependence of failure time on stress can be determined, and
mean failure times at some stresses are known. The likelihood of a particular
failure at a particular applied stress can be assessed in terms of the known
functional dependence, the known failure times, and a measure of the spread
or standard deviation of failure times. In most treatments of life prediction of
LIFE PREDICTION 179
glass, a particular functional dependence of failure time on stress is assumed,
usually a power low dependence (Eq. 2); in many situations this assumption
gives very inaccurate lifetime predictions; see Fig. 1.
Several different functional dependences of failure time on stress have been
suggested; some are
log t = 1 - bS / S N
log t = c - n log (S/SN)
log t = d + gS N / S
(1)
(2)
(3)
where the values of b, n, g, and p are positive. The theories discussed below
introduce some minor differences into these equations, but they are not
significant for choosing between the equations. Over the stress ranges studied
experimentally, it is often difficult to choose from among Eqs. 1-3; yet if they
are extrapolated to times of a few years, the sample lives predicted from each
of the equations are very different. Thus it is important to choose the best
equation if one wishes to extrapolate or to examine theories.
The simplest way to examine the equations is to calculate a regression
equation by the least-squares method in the form of Eqs. 1-3 and compare the
correlation coefficients from the regression. 1 7 The mean log t values for Pyrex
glass in Fig. 1 were examined in this way (see Table 2). There is a clear increase
in goodness of fit in the order Eq. 1, 2, and 3.
Often data are not extensive or reliable enough to find any differences
between correlation coefficients, and a more sensitive method is needed. If the
equation for the cumulative number F of failures in a normal distribution is
solved for the failure strength,
SN = SN +.J2 a erf- 1 (2F - 1)
(4)
where SN is the mean strength at -196°C, a is the standard deviation of
strengths at -196°C, and erf- l (u) is the number whose error function is u,
the value of SN from Eq. 4 can then be substituted into Eqs. 1-3 to show the
relation between the distributions of SN and of log t:
b S
log t = a - _
SN + .J2a erf- l (2F - 1)
S
log t = c - n log
SN + .J2a erf- l (2F - 1)
(5)
(6)
g-
log t = d + -{SN + .J2a erf(2F - I)}
s
(7)
Thus only if Eq. 3 is valid should the log t values have the same distribution
function as S N' Eqs. 5- 7 can all be written in the following approximate form:
log t = log t + .J2a, erf- 1 (2F - 1)
(8)
180 FATIGUE IN GLASS
where log t is the mean of log t values and a, is the standard deviation of the
distribution of log t values. The following values of a,are calculated for each
of Eqs. 1-3:
bSa (9)
a --
1 - S 2
N
a 2 = na/S N (10)
a 3 = galS (11)
where a is the standard deviation of failure strengths at -196°C. Pavelchek
and Doremus 4 derived these relations by a somewhat different method. These
equations show that the standard deviation of log failure times changes
differently with applied stress S depending upon which relation between log T
and stress is valid (Eqs. 1-3). For the direct dependence of Eq. 1, a decreases
with decreasing stress; for the power law of Eq. 2, a is not dependent on applied
stress; and for the inverse relation of Eq. 3, a increases with decreasing stress.
Standard deviations of distributions of log failure times for different glasses
are given in Table 3, and they all increase with decreasing stress, consistent
with Eq. 3, and not with Eqs. 1 and 2. Thus the better fit to Eq. 3 demonstrated
in Table 2 for Pyrex borosilicate glass is confirmed.
Long-time tests of Pyrex borosilicate glass 2 at S/SN = 0.253 fit Eq. 3; both
Eqs. 1 and 2 predict much too short mean failure, times at this applied stress.
In fibers, variations in fatigue times may be related to differences in fiber
diameter, as concluded by Matthewson and Kurkjian. ll The variations are still
a sensitive measure of the functional dependence of failure time on applied
stress whether the variations result from differences in diameters, a spread in
glass strength, or from some other cause.
This discussion shows that for prediction of fatigue lifetimes of glass beyond
experimental times, Eq. 3 is much superior to either Eq. 1 or 2, even though
Eq. 2 is widely used to analyze fatigue date. There is no evidence that glass
samples with chemically clean surfaces show a sharp change in functional
dependence of failure time on stress in different silicate glasses both strong and
weak (Figs. 1-3). Alternatively chemical contamination ora change in a
protective coating can cause more or less sharp changes in the functional
dependence of failure times on stress.
THEORIES OF FATIGUE
The stress-enhanced reaction of water with the silicate lattice is generally
agreed to be the reason for fatigue of silicate glasses. Hillig and Charles 19
considered the reaction front at the tip of a crack and derived a theoretical
relation between failure time and stress. The form of their results depends upon
the reaction rate equation assumed. Hillig and Charles assumed that the
reaction velocity v (rate of breaking of lattice structure) was
THEORIES OF FATIGUE 181
v = v o exp fJu (12)
where v o is the rate at zero tip stress, s is the tip stress, and fJ is a constant.
Over a broad stress range, Eq. 12 leads to a linear dependence of log failure
time on applied stress (Eq.1).
Since Eq.1 did not fit static fatigue data well, two other equations for v that
leads to Eqs. 2 and 3 were introduced into the Hillig-Charles derivation. 20
They are the power law
v = As"
(13)
and the exponential of reciprocal stress
v=v"" exp(-ex/s)
(14)
where A, n, v"" and ex are constants. With these relations the Hillig-Charles
method gives
dp (15)
- = v(1 - 2n)
dt
and
dp = {I - 2ex ] (16)
dt s
for Eqs. 13 and 14, respectively. These equations give the rate of change of the
crack tip radius p with time t, and show that the rate of tip sharpening dp / dt
is much greater than the rate of lengthening of the crack, which is equal to the
normal velocity v. For silicate glasses, n;;:: 15 and 2 ex/s;;:: 14, so that -dp/dt is
more than ten times greater than v. When integrated, Eq. 15 gives Eq. 2 and
Eq. 16 gives Eq. 3, over a wide intermediate range of applied stress S.
Additional evidence 21 that cracks sharpen rather than lengthen during
fatigue come from observations of crack initiation sites. These sites look the
same after failure at -196°C and 25°C and their sizes show no statistically
significant difference between these two temperatures. If fatigue at 25°C caused
crack lengthening, one would expect a changed appearance and larger sites at
this temperature. A theory of crack tip blunting has extended the Hillig-
Charles approach 22 (see also ref. 27).
An equation for the rate constant k of a chemical reaction is
k = ko exp( - !!.G*/ R T)
(17)
where !!.G* is the free energy of activation and ko is weakly dependent on
temperature or pressure. If the pressure P is a variable as well as the
temperature, Eq. 17 can be written
k = k 1 exp[(- !!.H* + V*P)/RT]
(18)
182 FATIGUE IN GLASS
where V. denotes the activation volume. Equation 17 or 18 fits the tempera-
ture dependence of many chemical reactions well, with G. or H. indepen-
dent of temperature. However, the activation volume V. is seldom independent
of pressure. 23,24 The application of Eq. 18 to solids has rarely been tested, and
is even more uncertain. Therefore, Eq. 18 with V. constant has no experimen-
tal basis for chemical reactions in solids.
Two different theories for the stress dependence of a chemical reaction give
the functional dependence of reaction rate on stress of Eq. 14. Taylor 25
suggested that delayed fracture results from a time-dependent rearrangement
of the structure of a material, and he derived an equation of the same form as
Eq. 14. His ideas can be modified somewhat to gain some possible insight into
the origin of Eq. 14 and parameters affecting iX. The reaction of water with the
silicate network leads to broken bonds and a change in the tip geometry
H 2 0 + Si-O-Si = SiOH + HOSi
If the activation energy of this reaction is inversely proportional to the change
in bond length a caused by a tensile stress u, then
iX B BE
= RT a = RTu
(19)
where B is a constant and E is Young's modulus. Thus iX should be propor-
tional to the activation energy of the rate of Eq. 19.
Gilman and Tong 26 derived an equation for the velocity of crack motion
with the same dependence on stress as Eq. 14 from a quantum tunneling model
of fracture. Their model does not explicitly include a chemical reaction, but
extension of their ideas to stress-accelerat d reactions should be possible.
There are striking differences between failure times of samples tested
immediately after abrasion (see Table 1) and those aged in water before testing
(a factor of 100 or more) even at the same relative humidity. The theory of
Hillig and Charles and other theories of fatigue of glass give no explanation
for this large difference in fatigue time.
In order to understand a possible origin of this difference, contributions of
the statistical distribution of flaws, g(S), must be considered. The stress at
which a particular crack propagates depends upon at least three separate
factors: its orientation (angle) 0 to the applied tensile stress, the crack depth c,
and the crack tip radius p. Each of these factors can be distributed over a range
of values, so g(S) is actually a product of at least three separate distributions
g(S) = T(O)R(P)K(c)
(20)
The distribution of each of these factors is strongly dependent on sample
history and surface abrasion.
REFERENCES 183
REFERENCES
1. R. H. Doremus, in Treatise on Materials Science and Technology, Vol. 22, Glass
III, M. Tomozawa and R. H. Doremus, Eds. Academic Press, New York, 1982.
2. G. S. Friedman, K. Cushman, and R. H. Doremus, J. Mater. Sci., 17,994 (1982).
3. R. E. Mould and R. D. Southwick, J. Am. Ceram. Soc., 42, 452 (1959).
4. E. K. Pavelchek and R. H. Doremus, J. Noncryst. Solids, 20,305 (1976).
5. J. E. Burke, R. H. Doremus, W. B. Hillig, and A. M. Turkalo, in Ceramics in Severe
Environments, W. W. Kriegel and H. Palm our, Eds., Plenum Press, New York, 1971.
6. B. A. Proctor, I. Whitney, and J. E. Johnson, Proc. Roy. Soc. London Ser. A, 297,
534 (1967).
7. J. T. Krause, J. Noncryst. Solids, 38& 39,497 (1980).
8. K. Jakus, D. C. Coyne, and J. E. Ritter, J. Mater. Sci., 13, 2071 (1978).
9. T. T. Wang and H. M. Zupko, J. Mater. Sci., 132241 (1978).
10. H. C. Chandan and K. Kalish, J. Am. Ceram. Soc., 65, 171 (1982).
11. M. J. Matthewson and C. R. Kurjian, J. Am. Ceram. Soc., 70, 662 (1987); 71, 177
( 1988).
12. J. E. Ritter, T. E. Service, and K. Jakus, J. Am. Ceram. Soc., 71, 988 (1988).
13. J. T. Krause and C. J. Shute, Adv. Ceram. Mater., 3, 118 (1988).
14. R. J. Charles, J. Appl. Phys., 29, 1549, 1554 (1958).
15. G. K. Bhattacharya and R. A, Johnson, Statistical Concepts and Methods, Wiley,
New York, 1977.
16. K. V. Bury, Statistical Models in Applied Science, Wiley, New York, 1975.
17. N. R. Draper and H. Smith, Applied Regression Analysis, Wiley, New York, 1966.
18. R. H. Doremus, J. Appl. Phys., 54, 193 (1983).
19. W. B. Hillig and R. J. Charles, in High Strength Materials, V. F. Jackey, Ed., Wiley,
New York, 1965, p. 682.
20. R. H. Doremus, Eng. Fracture Mech., 13, 945 (1980).
21. R. H. Doremus and W. C. Johnson, J. Mater. Sci., 13, 855 (1978).
22. T. Chuang and E. R. Fuller, JAm. Ceram. Soc., 75, 540 (1992).
23. G. Kohnstam, in Progress in Reaction Kinetics, G. Porter, Ed., Pergamon, Oxford,
1970, p. 335.
24. C. A. Eckert, Annu. Rev. Phys. Chern., 23, 239 (1972).
25. N. W. Taylor, J. Appl. Phys. Chern., 18, 943 (1947).
26. J. J. Gilman and H. C. Tong, J. Appl. Phys., 42, 3479 (1971).
27. W. T. Han and M. Tomozawa, J. Noncryst. Solids, 163,309 (1993).
CHAPTER 11
SURFACES
Glass surfaces control strength, chemical durability, optical quality, and
adhesion of glasses. These surfaces are the sites for a variety of chemical and
physical processes important in processing and properties of glasses. In this
chapter there is emphasis on surfaces of silicate glasses in the following
sections: structure, measurement techniques, physical adsorption, surface
chemical reactions, adsorption from solution, and surface conductivity. These
topics involve the outer few molecular layers of the glass. Chemical reactions
and ion exchange involving deeper penetration, and hence more of the bulk of
the glass, are discussed in Chapters 12-14.
Surface properties of glasses have been reviewed in Refs. 1-4a.
SURFACE ENERGY
The surface energy y at temperature T and pressure p can be defined as the
reversible work dJ.v. to form a surface of area dA,
y = - (dJ.v./dAh,p (1)
For a liquid, surface energy and tension are equal. The units of surface energy
are joules per square meter; 10 3 dyn/cm = 1 J/m 2 .
A number of measurements of surface energies of glass melts have been
made by a dipping cylinder method developed by Shartsis and co-workers. 5 In
this method, the force F required to pull a small thin-walled platinum cylinder
of radius R out of the melt is measured, and
y = F/4nR
(2)
184
SURFACE STRUCTURE 185
A correction factor is necessary for the most accurate work.
The surface energy decreases as the temperature increases; for most silicate
glass melts this change is quite small (less than 10%) from 1200 to 1500°C.
The influence of composition on surface energy of silicate glass melts is not
large. For most sodium silicate melts, the surface energy is about 0.3 J /m 2 at
1200°C, and this value is a reasonable approximation for the surface energy of
most sodium-containing silicate glasses at this temperature. 3 Measurements on
surface energies of many binary and ternary silicate glass melts are summarized
in Ref. 6. The surface energy of a molten zirconium-barium-Ianthanum fluoride
glass at 550°C was found to be 0.174 :t 0.005 J /m 2 by a solidified pendant drop
techniq ue. 61
Boric oxide (B 2 0 3 ) has the low surface tension of about 0.085 J /m 2 at
800°C, and addition of alkali oxides raises the surface tension sharply.
These measurements of surface energy of melts refer to surfaces that have
reacted with ambient water to form SiOH groups on the outer surface (see next
section). The energy of a freshly fractured glass surface is much higher;7,8 for
example, for a soda-lime glass it is about 3.4 J/m 2 . A fresh surface of this
energy reacts very rapidly with low concentrations of water vapor to form
SiOH groups and a much lower surface energy.9
Segregation of impurities to surfaces and interfaces is usually favored
because it lowers the surface energy. Segregation and other aspects of surface
thermodynamics are discussed in Ref. 10.
SURFACE STRUCTURE
The surface structure of oxides depends on the reactions of "dangling" oxide
bonds. Thus in a silicate glass, formation of a surface leads to Si-O- and Si-
bonds that are unsatisfied. These bonds react rapidly with atmospheric water
to form SiOH groups. Therefore the surface of an oxide glass is normally
composed of hydroxyl groups. The thickness and structural arrangement of the
hydrated surface layer depend on the composition of the glass, its thermal
history, humidity, and surface treatment after melting and cooling.
Extensive studies of silica (Si0 2 ) surfaces have been made because of the
widespread use of silica gel as a catalyst and adsorbent. Results of these studies
are discussed here because they help in the understanding of the surface
structure of silicate glasses.
Hydroxyl groups on silica surfaces have been examined in detail by infrared
spectroscopy. 11 - 15 In these studies, silica particles less than about 1 Jlm in
diameter were pressed into thin porous disks for observation in the spec-
trophotometer. Spectra of such disks after different heat treatments are shown
in Figs. 1 and 2. The broad band at about 3450 cm -1 and another at about
1250 cm -1 result from the OH vibrations in molecular water. Therefore the
presence of these bands indicates physically absorbed molecular water. Con-
sistent with this interpretation is the result that these bands disappear after
186 SURFACES
ILl
o
z
< O.
m
a::
o
CI)
m
<
o
A-O
ILl
...
<
-J
ILl
a::
3000 3200 3400
FREQUENCY I em l
Fig. 1 Infrared spectra of SiOH groups on a cabosil silica. Dotted line, in air at room
temperature; solid line, after 3 h in a vacuum at 30°C; dashed line, different between
solid and dotted line. From MacDonald."
o
3748
3000 3200 3400 3600 3800 4000
FREQUENCY, em I
Fig. 2 Infrared spectra of SiOH groups on a cabosil silica. Dotted line, after 30 min
in a vacuum at 500°C; solid line, after 8.5 h in a vacuum at 940°C. From MacDonald."
ILl
0
z
< 0,2
m
a::
0
CI)
m
<
ILl 0.4
>
0.6
ILl
a:: 0.8
1.0
1.5
2800
3750
SURFACE STRUCTURE 187
pumping at room temperature or heating to 150°C for a short time. These
treatments reveal another band at 3660 cm - I, in addition to the sharp band
at 3747 cm- l . As the temperature is raised above 150°C, the band at 3660
cm -1 slowly disappears, until at high temperatures only the sharp band at
3747 cm -I remains. The latter band is attributed to isolated SiOH groups,
whereas the one at 3660 cm - 1 is considered to result from surface hydroxyl
groups close enough together to be hydrogen-bonded. Schematic diagrams of
these and other surface hydroxyl groups are given in Fig. 3.
Another type of silanol group exists near a silica surface, namely, internal
SiOH groups.12,13.16,17 The presence of this group was originally inferred from
deuterium exchange reactions on glass surfaces. 13 At room temperature, only
part of the hydroxyl groups reacted with D 2 0 vapor to form SiOD; the other
groups were presumed to be somewhat beneath the surface and so inaccessible
to the D 2 0. This internal SiOH group results from the diffusion of water
molecules into silica and their subsequent reaction with the silica lattice to
form two SiOH groups, as described in Chapter 8. This process becomes
important above about l00°C. 17
The density of isolated SiOH groups on a silica surface has been calculated
as 1.4 groups/l00 A2 and that of hydrogen-bonded groups as 3.2 groups/l00
A 2 , or 1.6 pairs. 18 Armistead et al. 18 concluded that the surface corresponded
to an array of different crystal planes, some of which contain widely separated
hydroxyl groups and others with closer spacing that leads to hydrogen
bonding.
There is evidence 19 - 21 that some of the isolated surface hydroxyls groups
on silica occur as pairs on the same silicon atom (Fig. 3c). Hair and Hertl 20
and Bermudez 21 reached this conclusion from studies of reactions of chloro-
silanes and boron trichloride with surface hydroxyls. They claimed that groups
such as
0....... ,...0....... ......R
......Si....... ,...Si.......
o 0 R
o 0
.......S...... ....... B-CI
0"" .......0,...
/H
o
I
-Si-
I
H
.:o
H. Ji/
0/ "'0"""'-
I I
Si, .......-Si
o
H-O )'-ti
>
(0 )
(b)
(c)
Fig. 3 Schematic diagrams of hydroxyl groups on a silica surface. (a) Isolated group;
(b) hydrogen-bonded groups with an adsorbed water molecule; (c) two hydroxyls on
one silicon atom.
188 SURFACES
are formed in reactions of these compounds with two hydroxyl groups on one
silicon atom. However, such a four-membered ring is not often observed in
silicate or borosilicate structures, and should be highly strained. Furthermore,
Hair and Hertl found that all isolated hydroxyls were equally reactive; it would
be surprising if the paired hydroxy Is had the same reactivity as the single ones.
These authors concluded that the reaction order of 1.5 for multichlorosilanes,
as compared to 1.0 for monochlorosilane, showed the presence of paired
groups. However, this different order for multichlorosilanes could also be
caused by other reactions and mechanisms, such as the additional reaction of
a chlorine on the bound silane to form a SiCI group. It is also possible to
interpret the results of Bermudez without involving geminal hydroxl groups
(Ref. 21, footnote 41), so that more evidence for such groups is needed before
their existence on a silica surface can be accepted.
To summarize, the following types of hydroxyl groups exist on silica
surfaces: isolated SiOH groups, hydrogen-bonded SiOH groups, internal SiOH
groups, and molecularly adsorbed water. The relative amounts of these
different groups on silica depends on the thermal and atmospheric history of
the glass, and the temperature and humidity at which it is being observed.
The surfaces of silicate glasses with additional components probably have
the same types of groups as pure silica, modified by the following consider-
ations. If other glass formers are in the glass network, they will also provide
sites for hydroxyl groups. Thus AIOH, BOH, and POH groups are likely.
Monovalent cations R + in a silicate glass can exchange with water by the
following reaction:
2H 2 0 + SiO R + = SiOH' H 2 0 + ROH
This reaction gives rise to SiOH groups at the cation sites often with associated
water; this combination can be considered to be a hydronium (H 3 0+) ion
replacing the other cation. Reaction and exchange of silicate glasses with water
are discussed in Chapter 13.
The surface of a glass can become depleted of volatile components during
glass melting and cooling to room temperature. The alkali oxides are particu-
larly volatile. Optical measurements of the surface refractive index sometimes
show a lower index in a thin layer near the surface, indicating either a loss of
alkali by volatilization or a hydrated layer.
From these considerations, one can conclude that the surface of a silicate
glass containing only silicon as a glass former should be quite similar to that
of pure silica. Dangling surface Si- or SiO- groups are hydroxylated, and any
surface SiO alkali groups are also hydroxylated from ion exchange with water
in the atmosphere. SiO groups bonded to higher valent cations may not
exchange with hydrogen ions, but these cations are tightly bound to two or
more SiO- groups, and so should not playa major role in surface reactions
or adsorption. If other glass formers are present, different hydroxyl groups will
occur on the glass surface. It is possible that one glass former or another will
EXPERIMENTAL TECHNIQUES 189
appear preferentially at the surface, giving a distribution of surface hydroxyl
groups different from what would be expected from the bulk composition.
EXPERIMENTAL TECHNIQUES
In recent years, a number of new techniques have been developed for examin-
ing solid surfaces. A summary of some of these techniques used to examine
glasses is given in Table 1. There is not space to discuss these techniques in
detail; reviews are given in Refs. 3, 4 and 22. There are references in the table
to recent applications of these techniques on glasses; these references are
TABLE 1 Experimental Techniques for Examining Glass Surfaces
Acronym
Approximate
Depth of
Sensitivity References
Chemical Analysis
Rutherford back scattering
Resonant nuclear reaction
Secondary-ion mass spectrometry
Electron microprobe
Ion beam spectrochemical analysis
Electron energy dispersion
RBS
RNR
SIMS
IBSCA
EDS
Chemical and Bonding Analysis
Auger electron spectroscopy AES
Electron spectroscopy for chemical ESCA
analysis, also called
X-ray photoelectron spectroscopy XPS
Surface Observation
Scanning electron microscopy
Transmission electron microscopy
SEM
TEM
Small-angle X-ray diffraction
Low-angle electron diffraction
Diffraction Techniques
SAXS
LEED
Optical
Infrared absorption and reflection
Ellipsometry
Ill m
Ill m
Ill m
Ill m
Ill m
5nm
23
24
25
26
5nm
5nm
27
4a, 27, 34
l00nm
28
29
30
31
32,35
33
190 SURFACES
illustrative rather than comprehensive, and only serve as a starting point for
further information.
Nuclear reaction techniques (RBS and RNR) give both the outer surface
concentrations and the profile of concentration to a depth of about 1 JIm
without removing any of the sample. RBS can be used for atoms heavier than
nitrogen; RNR is especially useful for hydrogen analysis. See Chapter 13 for
more information on these techniques, which are nondestructive of the sample.
SIMS is the most sensitive technique, with a detection limit of 10- 16 gm, and
it can be used for all elements including hydrogen. Profiling with SIMS,
IBSCA, AES, and ESCA (XPS) requires sputtering off layers, because these
techniques are sensitive only to the outermost atomic layers. The electron
microprobe and EDS in the scanning electron microscope involve electron
penetration into the sample to a depth of 1 JIm or more, so they give an
integrated analysis to this depth. An absolute concentration of elements can be
calculated directly from the nuclear techniques (RBS and RNR); other tech-
niques require standards for absolute concentrations, which are often quite
unreliable.
AES and ESCA are quite difficult to use for quantitative surface analysis
because they are especially sensitive to contamination and the chemical state
of the elements being analyzed. The latter property can be used to advantage
to give information on chemical bonding, coordination numbers, and defects
in glass surfaces.
Diffraction techniques have not been used much to examine glass surfaces.
The value of infrared spectroscopy for examination of glass surfaces has
already been demonstrated. Reviews of infrared expeiments in glass surfaces
are given in Refs. 3,4, 4a, 14 and 15; optical absorption in the bulk of glass is
discussed in Chapter 17.
PHYSICAL ADSORPTION
A favorite material for adsorption studies is "thirsty glass," a porous glass
made by leaching a phase-separated borosilicate glass. 14 ,36 Thirsty glass is an
intermediate in the manufacture of 96% Vycor or silica glass, as described in
Chapter 4. The surface of thirsty glass is heterogeneous and contains a high
proportion of borate groups (B-OH), much more than would be expected
from the bulk composition of 4% B 2 0 3 . 36 Thus results of adsorption studies
with this material are not directly comparable with those on silica, although
there are many similarities in the surface behavior of the two materials. 14
The nature of physical or chemical adsorption on glass is strongly depend-
ent on the surface structure. The surface hydroxyl groups are the most
important sites for adsorption and reaction, so the thermal history of a glass
is important in its adsorption behavior.
Adsorption studies on pure silica can be related to the hydroxyl structure
as described in the section on surface structure. McDonald found that the
PHYSICAL ADSORPTION 191
3749-cm -1 band on Aerosil 2491 silica was shifted by physical adsorption of
a number of gases. 37 Since this band results from isolated SiOH groups on the
silica surface, these shifts indicate that the gases are adsorbed on or near
these hydroxyl groups. At low coverages at 83°K the shifts for argon, krypton,
xenon, nitrogen, oxygen, methane, and perfluoromethane were small, the
largest being 32 em - 1 for methane. There was no direct relation between the
band shifts and the polarizabilities of the adsorbed molecules. At higher gas
pressures, the bands shifted more, indicating interaction of more than one
adsorbed molecule with each group. In a detailed study of argon, oxygen, and
nitrogen adsorption, McDonald found that much more of the latter gas was
adsorbed at the same gas pressure than the other two gases. For nitrogen, the
original 3749-cm -1 hydroyl band disappeared at a pressure several times lower
than that for coverage with a "BET monolayer," indicating that the nitrogen
molecules were preferentially adsorbed at the free SiOH groups, and that a
monolayer on silica actually involves multiple adsorption at such a group.
Water, methanol, and benzene adsorbed on silica in appreciable amounts at
room temperature, causing much greater band shifts. 37 Adsorption of these
gases with hydrogen bonding is intermediate between physical and chemical
sorption. 38 Cyclohexane also adsorbed at room temperature, but caused a shift
about the same as for methane. Benzene adsorption on porous glass was
studied in detail by Cusumano and Low,39 who also reviewed earlier studies
of adsorption of aromatics on silica and porous glass.
Physically adsorbed molecules are apparently bonded to the hydrogen atom
on an SiOH group. Larger band shifts for water and methanol, indicating
stronger hydrogen bonds with these molecules, are expected from their hydro-
gen bonding in the liquid state. A study of diethylamine adsorption on silica
showed that it strongly preferred the isolated silanol groups to those groups
hydrogen-bonded in pairs,39 whereas water appears to prefer the adjacent
(hydrogen-bonded) silanol groups. 14,40
A theoretical calculation was made of the band shift expected from nitrogen
adsorption, considering the adsorbed molecule to be a quadrupole with its axis
lying along the direction of the OH group, and rotating about an axis
perpendicular to this group.41 Reasonable agreement with the experimental
shift was achieved.
The studies above show that physical adsorption on silica takes place on
particular sites, depending on the nature of the adsorbing molecule. The sites
are hydroxyl groups, either isolated or hydrogen-bonded in pairs. Since neither
of these types of sites fills the surface completely, the concept of a monolayer
of adsorbed molecules loses significance. Thus absolute surface areas deter-
mined by the BET method are suspect because the density of isolated hydroxyl
groups is about 1.4 grou{>s/l00 A2. If, for example, the area of an adsorbed
nitrogen molecule is 16.2 A 2,42 then when one molecule of nitrogen is adsorbed
per group, only about one-sixth of the surface is actually covered.
The variation of the amount of adsorbed gas as a function of the gas
pressure is called an adsorption isotherm. A number of equations have been
192 SURFACES
proposed for these isotherms, both on an empirical and theoretical basis, but
none is entirely satisfactory. Hydrated silica surfaces have been extensively
studied as adsorbants, and over narrow pressure ranges a variety of equations
fits the experimental isotherms. Thus such a fit is not conclusive evidence for
the validity of the assumptions from which the isotherm is derived. At low
pressures and therefore low surface coverage, the amount adsorbed should be
proportional to pressure P, as governed by Henry's law
Q =kP
(4)
However, agreement with this functionality for adsorption on silicate glasses is
found only at the lowest pressures,4 at which the amount absorbed is much less
than a monolayer,42,44 as shown in Fig: 4 for Pyrex borosilicate glass. Perhaps
the reason is different adsorption types on the glass surface. It is difficult to
ascribe any theoretical or structural significance to empirical adsorption
isotherms until the correspondence between adsorption and sites is resolved.
Reviews of physical adsorption studies on silicates are given in Refs. 3, 4, 14,
42,44,46 and 47, and in the first edition of Glass Science.
CHEMISORPTION AND SURFACE CHEMICAL REACTIONS
Various gases react with the SiOH groups on a glass surface. Ammonia
becomes hydrogen-bonded to the isolated SiOH groups, as shown by the
strong perturbations of the SiOH vibrations after treatment of silica with
N
:E
u
0:: 10Ie
W
0..
Q
W
II)
0::
o
en
Q
<I:
en
w
...I
:J
U
W
...I
o
:!:
monolayer coverage
-------------------------------------
10 15
10 14
10 12
ZN lOll
10'10 10- 11 10- 11 10- 7 10.' 10-e 10- 4 10- 3
PRESSURE ABOVE ADSORBED LAYER (mm Hq)
Fig.4 Adsorption of nitrogen on Pyrex borosilicate glass. From Hobson. 43
CHEMISORPTION AND SURFACE CHEMICAL REACTIONS 193
ammonia. 44 Other chemisorption reactions on silica surfaces are reviewed in
Refs. 3, 4, 14 and 15.
Surface hydroxyl groups can be replaced by halogen atoms, which change
some surface properties substantially. A partial substitution of fluoride for
hydroxyl groups is achieved by treatment with ammonium fluoride or hydro-
fluoric acid solutions. The latter, and probably the former, etch away the
hydrated surface and also substitute fluoride ions for some of the hydroxyls.
Heating this surface to 700°C causes complete removal of hydroxyl groups, and
the resultant surface is hydrophobic. 40 Gaseous hydrofluoric acid also reacts
with surface hydroxyls on silica, replacing all of them with fluoride ions at
about 700°C.
A silica surface can be chlorinated by reaction with sulfuryl chloride
(S02CI2) or silicon tetrachloride,45 or by heating in chlorine at 700-950°C or
carbon tetrachloride 44 at 350-600°C. Morrow and Devi have referred to many
other studies of chemisorption of metallic halides on silica. 48 Other reactions
are esterification, ammination, carboxylation, etherification, and reactions with
Grignard reagents, organosilicon compounds, diborane,14 and AI(CH 3 h- 49
Glass surfaces can act as catalysts for various biochemical reactions, 50 for
example, for rapid clotting of blood. They are also sometimes used as
substrates for culturing cell growth.
The acid ionization constants of various surface hydroxyl groups on silica
were found by Hair and Hertl from the frequency shifts of the OH band
maxima when different molecules were adsorbed on them. 51 BOH and POH
groups were formed on the silica surface by reaction with BCl 3 and PCI 3 ,
respectively. Acid ionization constants pKa for ionization reaction
XOH = XO- + H+
were found to be: SiOH, 7.1; BOH, 8.8; and POH, - 0.4. They can be
compared with values in aqueous solution of SiOH, 9.7 and POH, 2.0.
Reactions of carbon dioxide and oxygen with freshly formed silicate surfaces
were studied in ultrahigh vacuum by Antonini and Hochstrasser. 9 Fresh
surfaces were obtained by fracturing or abrading glass samples inside the
vacuum system. On a fresh silica surface, the energy of adsorption of carbon
dioxide was about 11 kcal/mol, compared to the more usual heats of physical
adsorption of about 1-2 kcal/mol. The desorption of gas was followed as the
surface was heated; the increase in temperature was linear with time. A single
desorption peak was found for fused silica and a calcium borosilicate glass,
whereas for an alkali borosilicate and a sodium silicate (75% Si0 2 , 25% Na 2 0)
glass, two desorption peaks were found. The two peaks were taken to be
evidence for two different types of adsorption sites, perhaps one being asso-
ciated with unperturbed silicon atoms and the other with silicon perturbed by
the presence of modifying ions, probably alkalis. This interpretation seems
reasonable, but needs confirmation with other techniques.
These reactions were reversible as long as the sample was kept in the
vacuum system at room temperature. Heating the samples to higher tempera-
194 SURFACES
tures progressively destroyed the active reaction sites, perhaps because of
diffusion and reaction of atoms from the interior of the glass.
Antonini et al. found that oxygen reacted with the unpaired electron
(dangling bonds) at silicon atoms on a fresh silica surface to form an Si+0 2 -
complex. 9 The oxygen gas did not dissociate but retained its molecular form,
although it was tightly bound with an adsorption energy of about 75 kcal/mol.
The surface mobility of the adsorbed oxygen was immeasurably low. For an
alkali borosilicate, a calcium borosilicate, and a sodium silicate glass the
surface coverage was about the same as for silica, indicating a similar density
of silicon dangling bonds for these glasses as for silica. The adsorption energy
for the alkali borosilicate was somewhat lower than for silica.
Adsorption in glasses from solution is reviewed in Refs. 4 and 52 and Glass
Science, first edition.
SURFACE CONDUCTIVITY
The surface resistivity of clean glass in dry air is very high: 10 14 ohm/square
or higher at room temperature. 53 Geddes found no appreciable surface leakage
of freshly broken glass surfaces in clean dry air. 54 Since these results are at the
limit of reliable resistivity measurements, the inherent resistivity of a dry glass
surface is uncertain.
The surface resistivities of most glasses decrease rapidly as the relative
humidity at room temperature increases above about 40%.53- 55 However, the
surface resistivity of fused silica, cleaned in chromic acid and then in distilled
water, remains high even at quite high relative humidity.
These experimental observations can be explained in the following way. The
inherent surface resistivity of a glass is very high. If there is any ionic
contamination on the surface, it can conduct current in humid air, since
physically adsorbed water reacts with these contaminants to provide mobile
ions. Glasses containing monovalent cations can react with water by ion
exchange forming metallic hydroxides on their surfaces. 56 These hydroxides
react further with water, forming mobile ions on the surface. In some cases, the
hydroxides absorb so much water that a liquid solution is formed on the glass
surface, giving a highly conductive surface film. This possiblity was first
recognized by Faraday in his remarkable study of the electrical properties of
glass. 57
GRINDING AND POLISHING OF GLASS SURFACES
Often the surface of glass must be smoothed, especially for optical applications.
The smoothing process can be separated into three di1ferent stages, grinding,
lapping, and polishing, in order of the rate of removal of material and the
REFERENCES 195
TABLE 2 Smoothing of Glass
Approximate Grain
Smoothing Size of Smoothing Abrading
Process Material Material (Jlm) Mechanism
Grinding Diamond 10-80 Cracking (fracture)
and scratching
Lapping Alumina and liquid 20 Cracking (fracture)
and scratching
Polishing Cerium oxide and 10-50 Scratching and
pitch polisher removal of
hydrated layer
height of the roughness remaining, as summarized in Table 2. A review of
grinding, lapping and polishing by Izumitani 58 is the basis for this discussion.
Grinding is the result of abrasion with a very hard substance such as
diamond, either loose or bonded in metal. The diamond fractures the glass
surface and chips away pieces of surface material. The rate of loss of glass by
grinding is inversely proportional to the indentation hardness of the glass
surface.
Lapping is the removal of material from the glass surface at a lower rate
than during grinding, and by removing smaller chips. The glass surface is
therefore partially smoothed by lapping. Water as a lapping medium increases
the rate of lapping. The main mechanism of glass removal is cracking, as in
grinding, and the rate of lapping is inversely proportional to the hardness. The
influence of water suggests that surface hydration also plays a role; glasses
more durable to water attack lap more slowly in water than less durable
glasses, Izumitani 58 considers somewhat different mechanisms.
In polishing of a glass surface, roughnesses of micrometers are reduced by
a factor of 100 or more. Softer solid grains, such as of Cerium oxide, are used
in a water slurry with a polisher made of an organic material such as pitch, or
felt. The grains remove the soft hydrated layer on the glass surface. The
polisher holds imbedded polishing grains and transmits an applied load to the
grains. The polisher must deform to fit to the glass surface, so it must be soft.
REFERENCES
1. L. Holland, The Properties of Glass Surfaces, Chapman and Hall, London, 1964.
2. F. M. Ernsberger, Annu. Rev. Mater. Sci., 2,529 (1972).
3. H. H. Dunken, in Treatise on Materials Science and Technology, Vol. 22, M.
Tomozawa and R. H. Doremus, Eds., Academic Press, Orlando, FL, 1982, pp.
1-74.
196 SURFACES
4. H. H. Dunken, Physikalische Chemie der Glasoberflache, VEB Deutscher Verlag fur
GrundstoWsindustrie, Leipzig, 1981.
4a. C. G. Patano, Ed., J. Noncryst. Solids, 120 (1990).
5. L. Shartis and S. Skinner, J. Res. Natl. Bur. Stand., 46, 385 (1951).
6. N. P. Bansal and R. H. Doremus, Handbook of Glass Properties, Academic Press,
Orlando, FL, 1986, p. 101.
6a. N. P. Bansal and R. H. Doremus, J. Am. Ceram. Soc., 67, C-197 (1984).
7. 1. 1. Gilman, J. Appl. Phys. 31, 2208 (1960).
8. R. H. Doremus, J. Appl. Phys. 47, 1833 (1976).
9. 1. F. Antonini, G. Hochstrasser and P. Acloque, Verres Refract., 23, 169 (1969).
10. R. H. 'Doremus, Rates of Phase Transformation, Academic Press, Orlando, FL,
1985, p. 33.
11. R. S. MacDonald, J. Phys. Chem., 62, 1168 (1958).
12. G. J. Young, J. Colloid Sci., 13, 67 (1958).
13. V. Ya. Davydov, A. V. Kiselev, and L. T. Zhuravlev, Trans. Faraday Soc., 60,2254
(1964), and earlier articles by these authors referred to in this paper.
14. M. L. Hair, Infrared Spectroscopy in Surface Chemistry, Marcel Dekker, New York,
1967.
15. L. H. Little, Infrared Spectra of Adsorbed Species, Academic Press, London, 1966.
16. A. 1. Tyler, F. H. Hambleton, and 1. A. Hockey, J. Catal., 13, 35 (1969).
17. R. H. Doremus, J. Phys. Chem., 75,3147 (1971).
18. C. G. Armistead, A. J. Tyler, F. H. Hambleton, S. A. Mitchell, and 1. A. Hockey,
J. Phys. Chem., 73, 3947 (1969).
19. 1. A. Hockey and B. A. Pethica, Trans. Faraday Soc., 57, 2247 (1961).
20. M. L. Hair and W. Hertl, J. Phys. Chem., 73, 2372 (1969).
21. V. M. Bermudez, J. Phys. Chem., 75, 3249 (1971).
22. W. A. Czanderna, Methods of Surface Analysis, Elsevier, Amsterdam, 1975.
23. W. A. Lanford, C. Burman, R. H. Doremus, Y. Mehrotra, and T. Wassick, in
Advances in Materials Characterization, D. R. Rossington, R. A. Condra and R. L.
Snyder, Eds., Plenum, New York, 1983, p. 549.
24. K. H. Schnatter, R. H. Doremus, and W. A. Lanford, J. Noncryst. Solids, 102, 11
(1988).
25. T. Richter, G. H. Frischat, G. Brehardt, and S. Scherrer, Phys. Chem. Glasses, 26,
208 (1985).
26. H. Bach, K. Grosskopf, P. March and F. Rauch, Glastech. Ber. 60, 21, 33 (1987).
27. S. Myhra, 1. C. Riviere, and A. M. Stewart J. Noncryst. Solids, 99,244,255 (1988).
28. R. Garcia, R. H. Doremus, N. P. Bansal, S.-H. Ko, and T. Margraf, J. Mater. Res.,
3, 989 (1988).
29. P. H. Gaskell and A. Saud, J. Noncryst. Solids, 106, 250 (1988).
30. P. Lamparter and S. Stub, J. Noncryst. Solids, 106, 137 (1988).
31. Y. Steinike, E. Mieller, 1. Richter-Mendou, and H. P. Hennig, Kristall' Tech., 29,
795 (1980).
32. F. Geotti-Bianchini, L. DeRiu, G. Gagliardi, M. Guglielmi, and C. G. Patano,
Glastech. Ber., 69, 205 (1991).
REFERENCES 197
33. T. S. Chao, C. L. Lee and T. F. Lee, J. Appl. Phys. 73, 1732 (1993).
34. N. Keshizaki, H. T. Akayanayi, and K. Kemmechi, J. Noncryst. Solids, 95&96,
1111 (1987).
35. K. F. Ferris and L. R. Pederson, Phys. Chem. Glasses, 29, 9 (1988).
36. M. 1. D. Low and N. Ramasubramanin, J. Phys. Chem., 70, 2740 (1966); 71, 730,
3077 (1967).
37. R. S. McDonald, J. Am. Ceram. So,c., 79, 850 (1957).
38. P. A. Sewell and A. M. Morgan, J. Am. Ceram. Soc., 52, 136 (1969).
39. 1. A. Cusumano and M. J. D. Low, J. Phys. Chem., 74, 792 1950 (1970).
39a. M. R. Basilo, J. Chem. Phys., 35, 1151 (1961).
40. T. H. Elmer, 1. D. Chapman, and M. E. Nordberg, J. Phys. Chem., 67,2219 (1963).
41. G. 1. C. Frohnsdorll' and G. L. Kinton, Trans. Faraday Soc., 55, 1173 (1959).
42. E. A. Flood, Ed., The Solid-Gas Interface, Marcel Dekker, New York, 1966.
43. 1. P. Hobson, Can. J. Phys., 37, 300, 1105 (1959); J. Chem. Phys., 34, 1850 (1961).
44. 1. B. Peri, J. Phys. Chem., 70, 2937 (1966).
45. M. Folman, Trans. Faraday Soc., 57, 2000 (1960).
46. A. Adamson, The Physical Chemistry of Surfaces, Wiley-Interscience, New York,
1990.
47. P. C. Hiemenz, Principles of Coloid and Surface Chemistry, Marcel Dekker, New
York, 1986.
48. B. A. Morrow and A. Devi, Trans. Faraday Soc. 1,68,403 (1972).
49. R. 1. Peglar, F. H. Hambleton, and J. A. Hockey, J. Catal., 20, 309 (1971).
50. P. B. Adams, New Sci., 41, 25 (1969).
51. M. L. Hair and W. HertI, J. Phys. Chem., 74, 91 (1970).
52. F. Kepak, Chem. Rev., 71, 357 (1971).
53. H. L. Curtis, Bull. Bur. Stand., 11, 359 (1915).
54. S. Geddes, J. Roy. Tech. Coli. (Glasgow), 3, 551 (1936).
55. A. Ya. Kouznetzov, J. Chem. Phys. USSR, 27, 657 (1953).
56. R. G. Pike and D. Hubbard, J. Res. Natl. Bur. Stand., 59, 127 (1957).
57. M. Faraday, Phi/os. Trans., Part I, 49 (1830); Experimental Researches in Elec-
tricity, 1. M. Dent, London, 1914, pp. 3811'.
58. T. Izumitani, in Treatise on Materials Science and Technology, Vol. 17, M.
Tomozawa and R. H. Doremus, Eds., Academic Press, Orlando, FL, 1979, p. 115.
CHAPTER 12
REACTIONS WITH GASES
Certain gases such as water and hydrogen can react with the silicon-oxygen
network of silicate glasses, breaking it up and consequently modifying such
properties as strength and viscosity. Reactive gases in glass determine its
oxidation state and can reduce or oxidize ions the glass. All these gases dissolve
and diffuse in silicate glasses as molecules, as described in Chapter 8, and the
rates of their reaction with the glass are determined by their diffusion
coefficents in it.
WATER
Water reacts with the silicon-oxygen bond as followS: 1 - 3 ,9
I I I I
-Si-O-Si- + H 2 0 = -Si-OH HO-Si-
I I I I
(1)
forming pairs of adjacent silanol groups. These groups and the hydroxyl ions
so formed are very immobile, even at temperatures as high as 1000°C (see
Chapter 8 and Refs. 4 and 5). Thus water molecules must diffuse in and out of
the silicate lattice to form or remove these hydroxyl groups.
The solubility of water in fused silica (Vitreosil and O.G. grades, Thermal
Syndicate, W&lland, England) was determined by Roberts and co-workers from
the height of the infrared absorption peak resulting from Si-OH groups6 and
from tracer diffusion studies. 7 This solubility is proportional to the number of
silanol groups formed by reaction per unit volume when the glass is in
198
WATER 199
equilibrium with water vapor of a fixed pressure. Below about 1000°C the
solubility depended on the thermal history of the glass. B For a sample heated
at ll00°C the solubility was nearly constant from 1200 to 700°C B at about
3 x (10) - 3 SiOH groups formed per Si0 2 group in the glass, with a water
pressure of 700 mm/Hg. The solubility is not a function of impurity content in
the fused silica, since Hetherington and Jack found the same solubility for a
very pure silica (Spectrosil) and one containing more impurities, for example,
about 60 ppm aluminum and 4 ppm sodium. 9 The solubility is proportional to
the square root of the water vapor pressure,3,6.9 as would be expected from
reaction 1.
Equilibrium between the SiOH groups and dissolved water molecules gives
the above solubilities. The insensitivity to impurities and the square root
dependence on pressure suggest that there are a number of equivalent sites for
reaction by reaction 1 in the silica; in fact, probably most of the Si-O-Si
bonds in the glass are about equally susceptible to reaction 1.
The solubility of water in molten alkali silicates increases linearly with the
alkali concentration,3 and also in the order Li<Na<K silicates. 10 There is a
slight increase in solubility with increasing temperature. l0 ,101 In molten B 2 0 3
there is a decrease in solubility of water with increasing temperature. 11
In fused silica, the infrared spectrum of the silanol groups formed by
reaction with water shows no indication of hydrogen bonding,l but in the
alkali silicates, the number of hydrogen-bonded OH groups increases as the
amount of alkali increases and also in the order Li<Na<K. 3 The number of
hydrogen-bonded hydroxyls decreases as aluminum oxide is added to the glass
melt. 3 Apparently the OH groups can form a hydrogen bond to nonbridging
oxygen anions that have an associated alkali cation. As the bonding of the
oxygen ion to the alkali ion becomes stronger (the smaller the alkali ion the
stronger the bond), the tendency to hydrogen bonding is reduced. Addition of
aluminum removes non bridging oxygen ions, since each aluminum oxide
tetrahedron has an associated alkali ion. The increased hydrogen bonding is
perhaps at least partly responsible for the increased solubility in alkali silicates,
and for the order of solubility among the various alkali silicates.
An additional factor in the water solubility is probably the reactivity of the
silicon-oxygen bond. As alkali oxide is added to the silica structure, this bond
is weakened, as shown by the greatly decreased viscosity resulting from such
addition., The activation energy for viscous flow in fused silica in the tempera-
ture range 1100-1400°C is about 170 kcal/mol, whereas for binary sodium
silicate glasses, it is about 100 kcal/mol in the transition region (450-600°C).
Thus the greater reactivity of the bond pushes reaction 1 to the right, giving
greater water solubility as the alkali ion concentration increases. Other
structural interpretations of these results on water solubility have been
given. 3 ,12
Water is always present in commercial silicate glasses in the range of about
0.Q1-0.1 wt%. It is possible to introduce water during melting by bubbling it
through the melt. 13 Changes in water content in these glasses has a strong
200 REACTIONS WITH GASES
influence on their properties. 14 - 17 Viscosity is strongly decreased by increasing
water content; there is disagreement about the influence of water on electrical
conductivity.l1,15
Substantial amounts (up to 20 wt% or more) of water can be introduced
into certain multicomponent alkali silicate glasses from water vapor in an
autoclave at temperatures above 100°C, The formation, analysis, and proper-
ties of these "hydrosilicates" were reviewed by Bartholomew. 14 These glasses
have "rubber-like" properties, and were first explored by Stookey.18 A typical
composition is 76.9mol% Si0 2 , 10.8% Na20, 3.9% K 2 0, 7.8% ZnO, and 1.3%
A1 2 0 3 , although a wide range of silicate compositions can be made to a
"hydrosilicate" state. Alkaline earth ions appear to inhibit the tendency to
formation of these hydrosilicates, and durable commercial compositions such
as soda lime silicates and Pyrex borosilicate do not form them under compar-
able conditions.
The water in these glasses is both in the form of SiOH and dissolved
molecular water. Ernsberger 19 showed the presence of molecular water in an
autoclaved thin film of sodium aluminum borosilicate glasses from the infrared
absorption band of molecular water at 6.21lm. The amount of SiOH in these
glasses saturates at about 2 or 3 wt%, and as more water is added, it enters
the glass as molecular water. The glass transition temperature and viscosity of
these glasses decrease dramatically as the amount of water in them increases. 14
It appears that the mechanism of formation of these hydrosilicates involves
diffusion of molecular water into the glass and its reaction with the silicon-
oxygen network by Eq. 1. As the network is progressively broken up by this
reaction, the glass transition temperature decreases and the glass becomes
more open, so the molecular water can diffuse into it more readily. At the same
time as this deep penetration of molecular water takes place, there must also
be ion exchange and interdiffusion between hydronium ions from the water
vapor and alkali ions in the glass (see the next chapter). The depth of this
exchanged layer is much less than the penetration distance of the molecular
water, because the alkali concentration in the bulk of the glass remains at its
initial value.
An intriguing question is why some silicate glass compositions form hy-
drosilicates and others do not. The diffusion of molecular water in the
unaltered glass should be lower than in pure silica or Pyrex borosilicate (see
Chapter 8), so faster diffusion cannot be the reason for hydrosilicate formation.
Possibly the reason is the ease of reaction of dissolved molecular water with
the silicon oxygen network. As mentioned above, the "solubility" of water,
which is effectively the extent of reaction 1, increases in binary alkali silicates
as the alkali concentration increases. Thus it appears that as the silicon-
oxygen network is progressively broken up by alkali, the reaction of the
network with water is more favorable, and the diffusion of molecular water
becomes more rapid. Perhaps the presence of alkaline earth ions reduces the
tendency to reaction or blocks the diffusion of molecular water, or both.
HYDROGEN 201
HYDROGEN
Hydrogen also reacts with silica to form hydroxyl groups.20,21 In fused silica
containing 50-100 ppm of aluminum, the reaction becomes perceptible above
about 700°C. In purer silica, it does not occur appreciably at these tempera-
tures, but at higher temperatures or pressures hydrogen forms hydroxyl groups
from Si-O-Si bonds. The reaction can be written as follows:
I I I I
-Si-O-Si- + H 2 = -SiOH + H-Si-
I I I I
(2)
The presence of the SiH groups has been established from the growth of the
SiH stretching band at 2250 cm -1 (4.45 Ilm) in vitreous silica containing
hydrogen,22.23 In this case the rate of introduction or removal of OH groups
is controlled by the diffusion of hydrogen molecules,20 which is much faster
than the diffusion of the larger water molcules (see Chapter 8).
The rate of exchange of deuterium with SiOH groups in glass was studied
by Lee. 21 He found a first-order reaction for silica with low impurities in which
all the hydroxyl groups were attached to silicon atoms. In a fused silica with
about 100 ppm of aluminum, he found that the first-order reaction coefficient
decreased with time, probably because both AIOH and SiOH groups were
present in this glass, and the exchange rate was different for these two groups.
These results show that there can be at least three different types of hydroxyl
groups in a silicate glass. 24
1. An aluminum hydroxyl group can be thought of as having the structure
O-R+
I
O-AI-OH
I
o
where R + is either an alkali ion or another hydrogen ion, more or less
associated with one of the oxygens bound to the aluminum. These groups
result from the reaction of hydrogen with the Al-O-Si bond and are
called "loosely bound" by Lee 21
2. Hydroxyl groups in pairs are formed during melting or annealing of the
glass by reaction with water:
I I
-SiOH HOSi-
I I
These groups are introduced or removed by diffusion of water, which is
slow compared to hydrogen diffusion.
3. Hydrogen ions are introduced by ion exchange with alkali ions, either by
202 REACTIONS WITH GASES
interion diffusion or by electrolysis. These groups cannot be removed by
gaseous diffusion because they are needed for electroneutrality.
Hydrogen can also reduce ions in various oxide glasses to the atomic state,
for example, gold, silver, lead, bismuth, and antimony. 25 - 31 At lower tempera-
tures, these reactions are often limited to layers of the glass near its surface
because of the slow diffusion of hydrogen in the glass at these temperatures. In
addition, hydrogen can reduce the valence of an ion in glass without reducing
it completely to the atomic state. In this way, dissolved hydrogen affects the
oxidation state of the glass. A study of fluorescence of terbium and europium
in glass demonstrated the reduction of these ions from 3 + to 2 + valence;31
the rate of the reduction was controlled by diffusion of molecular hydrogen.
Hydrogen can also form defect centers in glass; in silica-lO% germania, a
reduced center that absorbs ultraviolet light at a wave length of 0.19 km is
formed in hydrogen at 500°C. 32
OXYGEN
The oxidation state of a glass is important in a variety of properties, such as
optical absorption of coloring ions, chemical reactivity, and ease of fining
(bubble removal). The oxidation state is directly related to the concentration
of dissolved oxygen in the glass.
Oxidation-reduction reactions in glass can be examined by considering the
equilibrium between different oxidation states of ions in the glass. For example,
consider the equilibrium between solid phases of ferrous and ferric oxide:
4FeO + O 2 = 2 Fe 2 0 3 (3)
The equilibrium constant K for this reaction is related to the standard free
energy change for the reaction !!t.Go by
!:&Go=-RTlnK
(4)
and K is given by
K = [Fe 2 0 3 ]2
[FeO]4 P
(5)
where the brackets denote thermodynamic activities with the pure oxide as the
standard state, and P is the pressure of oxygen in equilibrium with the solid
phase. Oxygen fugacity must be used if the gas phase is nonideal.
The phase rule for this system is
P + F = C + 2 (6)
where P is the number of phases, F is the number of degrees of freedom in
specifying the system and C is the number of components. The number 2
results from two environmental variables, pressure and temperature. In com-
OXYGEN 203
plex systems, C is often difficult to determine. It can be defined 33 as "the
minimum number of pure chemical substances that are required for the
preparation of arbitrary amounts of all phases of the system". For the system
of Eq. 3, there are two components and three phases, two solids and the oxygen
gas. Thus from Eq. 6 there is one degree of freedom. This means that if the
temperature is fixed, then the oxygen pressure has a particular value. This
result can also be deduced from Eq. 5. In the pure form, the activities of the
solid oxides are unity, so
P =..!.. = ex p ( - GO )
K RT
(7)
If the oxides are dissolved in a glass melt, there are three components
because the glass adds an additional one, but only two phases, glass and gas.
The result is three degrees of freedom, for example, temperature, oxygen
pressure, and activity of one oxide in the glass; then the activity of the other
oxide is fixed. Equation 3 still is valid with the understanding that the oxides
are components dissolved in the glass, and Eq. 5 represents the reaction
equilibrium with the activities of the oxides in the glass. If the temperature and
oxygen pressure are fixed, the activity ratio (or the concentration ratio of an
ideal solution) of iron plus three to iron plus two is fixed, and the total amount
of iron in the glass is the third variable.
Oxygen molecules dissolve and diffuse in the relatively open structure of
glass, as described in Chapter 8. At 1300°C the diffusion coefficient D of
molecular oxygen in vitreous silica is about 5 x 10- 8 cm 2 /s as extrapolated
from the measurements of Norton;34 similar or smaller values are expected for
other silicate glasses. For a time t of 3 h, the mean diffusion distance (':i:::, /2 Dt)
is about 3 mm. Thus for usual melting times and temperature only a small
depth of the glass surface comes to equilibrium with the oxygen in the gaseous
phase. In this region, the thermodynamic activity of oxygen in the glass (P in
Eq. 5) is determined by the partial pressure of oxygen in the gas phase. Deeper
into the glass, however, the concentration of dissolved oxygen may not be in
equilibrium with the surrounding atmosphere. In this region the chemistry of
the glass batch influences the oxidation state of the glass. The following factors
may be important:
1. Trapped gas in the powders of the batch (usually air).
2. Gases from decomposition of batch chemicals; examples are carbon
dioxide from carbonates, nitrogen oxides from nitrates, and sulfur di- and
tri-oxides from sulfates.
3. Constituents of the batch that can react with oxygen, such as organic
substances either as impurities or purposely added.
The result is that the oxidation state of a silicate glass is usually nonuniform
and difficult to quantify. When the glass is cooled from the melting tempera-
204 REACTIONS WITH GASES
ture, the diffusion coefficient of oxygen in it is substantially reduced, so the
oxidation state in the melt is usually frozen in. It is possible to change this state
at intermediate temperatures (-600°) by treatment in hydrogen, which diffuses
much more rapidly than oxygen in silicate glasses (see Chapter 8).
Thermodynamic quantities for pure oxides are listed in standard references,
for example Ref. 35. Orten Eq. 4 for pure oxides is plotted as a function of
temperature; this plot is called an Ellingham diagram and is a convenient
source of data for pure oxides. There are Ellingham diagrams for oxides in
many textbooks. 36 ,37
From Eq. 5, the ratio of Fe + 3 to Fe + 2 ion in the glass is proportional to
the oxygen pressure to the 1/4 power, for ideal solutions; in general this power
in n/4, where n is the difference between valence states. 3S - 40
The oxidation-reduction reactions of an ion in a silicate glass can also be
written in terms of their lattice positions
+( -ii-O- ) F.'} -ii-O-ii- +10,
+( -ii-O}."} (8)
to emphasize the coordination of the ion with oxygen in the lattice.
Douglas and co-workers studied the Cr3+ -Cr 6 +, Fe2+ - Fe3+, and Ce3+-
Ce 4 + equilibria in binary lithium, sodium, and potassium silicate glasses and
reviewed earlier work on these systems in various glasses. 41 ,42 They found that
oxidation was more favorable as the alkali content of the glass increases, and
as the ionic size increases in the order of lithium, sodium, and potassium.
From reaction 8 these composition effects can be interpreted as resulting as
least in part from changes in the reactivity of the silicon-oxygen bonds, just
as for water solubility as described above. As alkali is added to the glass the
silicon-oxygen bonds are weakened, increasing the tendency to oxidation.
A more complicated situation arises if the ion has three oxidation states
possible. Copper can occur in glass in the + 2, + 1 and atomic state. Reaction
equations for the pure oxides are
4Cu + O 2 = 2Cu 2 0
Cu 2 0 + O 2 = 2CuO
Equilibrium constants K are
(9)
(10)
K = [CU 2 0]2 (11)
G [CU]4 P
[CUO]2
K IO = [Cu 2 0] P (12)
For Eq. 11 there are three phases (gas, copper metal, and Cu 2 0) and two
OXYGEN 205
components, so there is one degree of freedom, and the same is true for Eq. 12.
If all three pure solid phases are present there are four phases and three
components and still one degree of freedom. If these constituents are dissolved
in the glass as copper atoms, copper + 1 ions and copper + 2 ions, there are
two phases and four components, so there are four degrees of freedom. If the
copper atom concentration is greater than the solubility of bulk copper, copper
metal particles will form. Then there are three phases and four components,
giving three degrees of freedom; the concentration of dissolved copper atoms
is fixed by the solubility of copper metal in the glass. Thus, for example, if
temperature and oxygen pressure are fixed, there is one more degree of
freedom, the total concentration of copper in the glass.
Douglas 43 discussed the thermodynamics of oxidation-reduction reactions
in glass and their influence on ionic ratios and colors of ions (see Chapter 17).
For example, he showed how the amount of different oxidation states of copper
vary with the oxygen pressure, as shown in Fig. 1. At low oxygen pressure
(concentration in the glass), copper metal is present and its solubility deter-
mines the concentration of dissolved copper atoms, whcih is independent of the
oxygen concentration. Above a certain oxygen concentration, the concentra-
tion of dissolved copper atoms begins to decrease, and there is no copper metal
present; the amount of monovalent copper increases to a maximum and then
decreases. At high oxygen pressure, only divalent copper is present in appreci-
able amounts.
In discussing the oxidation state of a glass and other chemical properties,
the concept of acidic or basic constituents is often used.45.451 The glass-forming
oxides such as silica and boric oxide are considered to be acidic, and the alkali
and alkaline earth oxides basic. This designation can be justified in the "Lewis
acid" sense from the negative charge on the glass-forming groups (SiO-) that
results from the reaction with a metal oxide, making the silica an electron
.10 Amount of COPPQr
ions wt%
/
tu Zt
/-
I
I
.04
C\.f
.06 (..,:..........
'H.r. 1M -l....
j;"; : I I ....
with nd.
t r IQl I ..
is prKipll If'G' I ...
.02 / \ I ..
\ , ... ./'
\ I ...0""
o ...
10 10 10 10"6
p 0 2
1<r2
Fig. 1 The amount of copper in different oxidation states as a function of log oxygen
pressure at lOOO°C in a 0.3Na 2 ' 0.7B 2 0 3 glass with 0.124 wt% copper. From Ref. 43.
206 REACTIONS WITH GASES
acceptor and the metallic- cation an electron donor. Also when the glass-
forming oxides are dissolved in water they form very weak acids, whereas the
alkali and alkaline-earth oxides form strong bases. For oxides with higher
valent cations, such as those of transition and refractory metals (TiO z,
Ta z 0 5 , Nb 2 0 5 ) the acid-base designation is not so clear. In acid-base terms the
increase in ability to oxidize with increasing alkali concentration is considered
to result from the increased basicity of the glass. A reaction such as
2Na z O + Cr 2 0 3 + ;0 2 = 2Na z Cr0 4
can be considered to result in the formation of chromate ion in the glass, and
is enhanced by increasing the alkali concentration. It is not clear how a group
such as Na z Cr0 4 is incorporated into the network structure of the glass.
Let us now consider the situation in which there are two different ions in
the glass with two valence states. As an example consider iron (Eq. 3) and
cesium:
2Ce Z 0 3 + Oz = 4CeOz
(13)
For pure oxides there are now five phases present (FeO, Fe 2 0 3 , Ce Z 0 3 , CeO z
and oxygen gas) and three components, giving zero degrees of freedom. This
result means that there is only one temperature and oxygen pressure at which
both Eqs. 3 and 13 are at equilibrium; this condition is determined by the
intersection of the lines for these two reactions on the Ellingham diagram.
If these four ion species are dissolved in the glass, there are two phases and
four components, giving four degrees of freedom. Two of these are normally
the total amount of cesium and iron in the glass. If the temperature and oxygen
pressure are fixed, the ratios of the two valent states of the two ions are
independently determined by Eqs. 5 and 14:
[CeO z ]4
K 13 = [Ce 2 0 J ]Z P
(14)
This conclusion is only valid if there is equilibrium between the melt oxygen
concentration and the gas phase. As described above, this is rarely the case
even at glass melting temperatures. If the glass is cooled to some intermediate
temperature, for example 500°C, the oxygen concentration in the glass will be
fixed by the melt condition ("frozen in"), and will not be in equilibrium with
the gas phase. In this situation, the oxygen concentration in the glass will
change as the ions in it are oxidized and reduced. The final oxygen concentra-
tion will depend upon the initial conditions from the glass melt, such as the
amounts of the ions in different oxidation states, and cannot be predicted from
thermodynamics. The oxidation-reduction reactions can be combined into one
reaction by eliminating oxygen from Eqs. 3 and 13:
Ce 2 0 3 + Fe 2 0 3 = 2Ce0 2 + 2FeO
(15)
NITROGEN 207
or
Ce+ 3 + Fe+ 3 = Ce+4 + Fe+ 2
The equilibrium constant of the last equation is
[Ce+ 4 ] [Fe+ 2 ]
K 16 = [Ce+ 3 ] [Fe+ 3 ]
Thus the ratios of the different states are interrelated, but their absolute values
depend upon the actual oxygen concentration in the melt.
At lower temperatures still (for example, room temperature), the diffusion
of oxygen is too slow to achieve equilibrium even between neighboring ions,
and their oxidation states are determined by conditions at higher temperatures
and quenching rates.
The relative ability to oxidize various ions in glass was calculated by Tress
from thermodynamic data of the free oxides. 44 He found the order given in
Table 1. Thus, of the pairs shown, chromium is the most easily reduced, and
tin is the most easily oxidized.
Oxidation-reduction reactions in glass were discussed by Paul 45 and
Schrieber 451 in somewhat different ways.
(16)
(17)
NITROGEN
Nitrogen can react with glass melted under reducing conditions, forming three
Si-N bonds. 46 ,47 In the presence of water or ammonia, N-H bonds are
formed, as demonstrated by the 3-J-lm infrared absorption band. The solubility
of nitrogen increases with temperature, but decreases as the amount of alkali
in the glass increases. 48 ,49 From an oxidation-reduction point of view this
result is consistent with the finding of more reducing glasses as the silica
content increases, and perhaps weakens the above explanations in terms of
silicon-oxygen bond strengths.
Nitrogen can be incorporated in multicomponent silicate glasses, as re-
viewed in detail by Loehman. 50 The nitrogen increases the stiffness, viscosity,
and chemical durability of the glass. 50 - 52
TABLE 1 Oxidizing Tendency of Ions in Glass
Cr0 3 = Cr 2 0 3
Mn 2 0 3 = MnO
CeO z = Ce Z 03
AszO, = As z 0 3
SbzO, = Sb 2 0 3
Fe z 0 3 = FeO
Sn0 2 = SnO
208 REACTIONS WITH GASES
The incorporation of nitrogen in B 2 0 3 , B 2 0 3 -Si0 2 and B 2 0 3 -CaO glasses
was studied;53 the nitrogen substituted for oxygen in the borate-oxygen
network and also dissolved molecularly in these glasses.
CARBON DIOXIDE
The solubility of carbon dioxide in sodium silicate glasses was found to
increase rapidly below about 1100 or 1200°C, depending on the composi-
tion. 54 ,55 Above these temperatures, the solubility did not change as much with
temperature, and for several glasses was about 10- 4 wt%/atm, which is
roughly the amount of physical solubility expected. The logarithm of the
solubility in wt% was linear with reciprocal temperature; the enthalpy of
solution tJ.H in binary alkali silicates tJ.H was about -56 kcal/mol. 54
One possible way to write the reaction of carbon dioxide with a sodium
silicate glass is
-I I I
CO 2 + 2(Na+ OSi-) = -Si-O-Si- + Na 2 C0 3
I I I
(18)
The entity formed in the glass is probably not a simple sodium carbonate
molecule, but some more complex combination of these ions with the silicate
lattice. Strnad 56 found that the solubility of carbon dioxide in a 30.3 mol%
Na 2 0, 69.7% SiO z melt was proportional to pressure below atmospheric
pressure and at 1000° C was consistent with reaction 18. Both Pearce and
Strnad found a large increase in solubility of carbon dioxide as the amount of
Na 2 0 in the melt increased above 25%. The increase for melts above 35%
Na 2 0 was much greater than proportional to the square of the Na 2 0
composition, as would be expected from reaction 18. Apparently in melts of
higher NazO, the Na 2 0 activity increases sharply. This increase can also be
deduced from the sharp increase in the volatility of soda in these melts. 57
Pearce also measured the reaction of carbon dioxide with sodium borate
melts and found a similar increase in solubility as the temperature decreased;
however, the enthalpy of solution was considerably lower than for the silicates.
More recent studies of carbon dioxide in alkali borates are discussed in Ref. 59.
SULFUR DIOXIDE
Sulfur dioxide also dissolves in silicate melts. Its reaction to an alkali sulfate is
complicated by the need for oxygen to form the sulfate from sulfur dioxide.
Thus its solubility in alkali silicates increases as the alkali concentration
increases, 54,60 - 62 and decreases as the temperature increases; however, under
FINING 209
reducing conditions the solubility is much reduced. The reaction with alkali
silcate can be written as
I I I
S02 + -i02 + 2(Na+OSi-) = -Si-O-Si- + Na 2 S0 4 (19)
I I I
It has long been known that furnace gases are beneficial for the weathering
properties of glass. These effects arise from the reaction of sulfur dioxide in the
gases with the glass surface. Water and oxygen, as well as sulfur dioxide, must
be present and the overall reaction can be written as
2Na+ (glass) + S02 + 10 2 + H 2 0 = 2H+ (glass) + Na 2 S0 4
This "dealkalization" reaction is an ion exchange that is made possible by the
removal of the sodium ion as sodium sulfate, as confirmed by Douglas and
Isard. 63 They found that the rate of formation of sodium sulfate was propor-
tional to the square root of time, and was controlled by the interdiffusion of
hydrogen and sodium ions in the glass. The rate of weathering of a glass with
a deaikalized layer is less because weathering requires ion exchange with
sodium ions.
FINING
Fining, or the removal of bubbles from a glass melt, is one of the major
technological problems in glass melting. It is usually solved by holding the
glass for some time at a temperature somewhat below the highest melting
temperature, and by adding certain minor constituents to the original glass
batch. The mechanisms by which these additions aid bubble removal are
discussed below.
Bubbles can be removed from a melt by either of two ways. They can rise
to the surface or the gas in them can dissolve in the glass. The rate of rise is
given by the following equation:
dh _ 2pgR 2
dt - 911
(20)
where p is the density of the glass, g is the gravitational constant, R is the
bubble radius, and 11 is the viscosity of the glass. For a viscosity of 100 P,
typical for melting temperatures, the rate of rise of bubbles 0.1 mm in diameter
is about 10 cm/day, which is too small to eliminate them from a normal glass
furnace. Thus small bubbles can be removed from glass melts only by
dissolution of their gas into the glass melt, although larger bubbles can rise to
the surface.
Arsenic oxide is a common fining agent added to glass to help remove
bubbles. For many years it was thought that the arsenic released oxygen at
210 REACTIONS WITH GASES
glass melting temperatures, which "swept out" the bubbles in the glass.
However, the calculation above shows that such a mechanism would not
eliminate small bubbles, and the elegant experiments of Greene and co-workers
showed that arsenic enhances dissolution of oxygen bubbles in glass. 64- 66
Thus the importance of arsenic and antimony oxide additions to the glass is
to aid in removal of fine bubbles, rather than to generate more gas.
The mechanism by which these agents enhance dissolution of gas from fine
bubbles is still being debated. I suggested that the role of arsenic is to reduce
the oxygen concentration in the glass. 67 At low temperatures arsenic oxide
contains mostly pentavalent arsenic, but at higher temperature the As 2 0 5
decomposes to As 2 0 3 and oxygen. Thus a considerable portion of arsenic ion
in glass is in the trivalent state, as has been confirmed by chemical analy-
sis. 68 . 69 This trivalent arsenic can react with oxygen physically dissolved in the
glass, reducing its concentration and increasing the rate of oxygen diffusion
into the glass. This hypothesis is confirmed by an analysis of the results of
Greene and co-workers on the rate of shrinking of oxygen bubbles in different
glasses. As the amount of arsenic in the glass increased, the amount of oxygen
initially dissolved in the glass was reduced, and the rate of shrinking of the
bubbles increased. 67 Thus in the case of oxygen bubbles the role of arsenic and
antimony fining agents is to reduce the amount of oxygen dissolved in the
glass.
In actual glass-melting practice, carbonates are the usual source of sodium
and calcium oxides. Thus one would expect to find carbon dioxide in bubbles
in glass as well as oxygen and nitrogen from air. A number of analyses of
bubbles in glasses made from carbonates showed that these three are indeed
the main gases found in the bubbles. 70, 71 The value of arsenic for dissolving
oxygen from the bubbles is clear from the remarks above, but the elimination
of the other two gases requires further consideration.
Cable et al. showed that the addition of arsenic to a glass batch increases
the rate at which carbon dioxide diffuses out of bubbles at 1200°C in a
soda-lime (73.5 wt% Si0 2 , 16.5% Na 2 0, 10.0% CaO) glass. 72 The solubility
of carbon dioxide in this base glass is probably small, judging from results cited
in the preceding section that show a decrease in solubility as the soda
concentration decreases. Since it was shown by Greene's work that the arsenic
in the glass lowered the concentration of oxygen in the glass, it is reasonable
to relate this lowered oxidation state to the enhanced solubility of carbon
dioxide. The decomposition of carbon dioxide to oxygen and carbon monoxide
can be written as
CO 2 = 102 + co
(21)
A decrease in the oxygen concentration or oxidation state of the glass would
favor this decomposition. The smaller carbon monoxide molecule should
diffuse more rapidly in the glass than carbon dioxide, so decomposing
dissolved carbon dioxide should increase its rate of absorption from bubbles.
FINING 211
This hypothesis for the increase in rate of absorption of carbon dioxide by
arsenic is speculative and needs confirmation with further experiments.
Fining by arsenic and antimony is improved if some of the alkali carbonates
in the glass batch are replaced by nitrates. To explain this result it has been
assumed that trivalent arsenic or antimony oxides react with the nitrate to
form pentavalent oxides, which then release their oxygen at the glass-melting
temperature to form larger bubbles. As mentioned above this mechanism is
unlikely; furthermore, this reaction of these oxides with nitrates under the
conditions of glass manufacture is improbable. Potassium and sodium nitrates
decompose completely to the oxides between about 400 and 800°C, whereas in
this same temperature range the arsenic and antimony oxides are in the
pentavalent states as the result of reaction with oxygen. 73, 74 It is only above
900°C that the pentavalent compounds begin to decompose. Thus at no
temperature above 500°C are the nitrates and trivalent oxides in the glass
batch together.
The role of the added nitrates is probably to increase the amount of oxygen
in the bubbles at the expense of nitrogen. The nitrates decompose before the
glass becomes molten,
4NaN0 3 = 4NO + 30 2 + 2Na 2 0
increasing the proportion of oxygen in the mixed batch materials and conse-
quently in the bubbles of entrapped gas. Therefore it is suggested that arsenic
and antimony increase the rate of fining in glass by decreasing the concentra-
tion of oxygen dissolved in the glass, which leads to increased rates of
absorption of oxygen and carbon dioxide. Nitrates in the glass batch improve
fining rates by replacing nitrogen in entrapped gas by oxygen.
Sulfates are often used as fining agents. Lyle showed that in soda-lime
glasses, sulfate additions could either speed or retard fining, depending on the
composition of the glass. 75 He found that when the ratio of soda to silica was
greater than 0.45 + 0.20/W!, where is the weight fraction of silica, fining
was retarded, whereas for lower ratios it was enhanced, at least for silica
concentrations from 69 to 76%. A very similar effect of soda-to-silica ratio was
found on the color produced by carbon and sulfur in soda-lime silicate glasses.
For production of a stable amber color, the soda-to-silica ratio had to be less
than 0.5 + 0.22/ ; with a greater ratio the amber color was not stable and
the glasses became blue-green. 76 Furthermore, it was found that bubbles in
stable amber glasses were removed quickly, whereas the blue-green glasses
foamed for a long time at 1475°C. These effects of composition are mainly
related to the oxidation state of the glass.
Effects of composition on the oxidation state of glasses containing sulfur
have been studied in detail in connection with the stability of the amber
color. 77 This color is stable in equilibrium with a partial pressure of oxygen
between about 10- 10 and 10- 8 atm. 78 The coloring group is ferric iron in
tetrahedral coordination with one of the surrounding oxygen ions replaced by
212 REACTIONS WITH GASES
sulfur. 79 As the concentration of soda in a soda-lime glass was increased, the
glass became more oxidizing, and the optical absorption by the ferric sulfide
group decreased, indicating a decreased concentration of these groups.77
The presence of sulfide in the more reducing glasses means it can react with
oxygen and carbon dioxide from bubbles and therefore enhance their removal
from the bubbles. 80 Harding and Ryder found that an increase in the sulfate
level in a soda-lime glass reduced the retention of nitrogen. 81 However, when
the sulfate was replaced by sulfide (more reducing conditions) nitrogen
retention increased, again showing the effect of state of oxidation of the glass
on reaction of nitrogen with it, and indicating that sulfide also helps to remove
nitrogen from bubbles.
There are reviews of refining in glass in Refs. 82 and 83.
REFERENCES
1. R. V. Adams and R. W. Douglas, J. Soc. Glass Technol., 43, 147 (1959).
2. V. Garino-Canina, C. R., 239, 705 (1954).
3. H. Scholze, Glastech. Ber., 32, 81, 142, 278 (1959).
4. V. Garino-Canina and M. Priqueler, Phys. Chem. Glasses, 3, 43 (1962).
5. R. H. Doremus, in Reactivity of Solids, 1. W. Mitchell, R. C. DeVries, R. W.
Roberts, and P. Cannon, Eds., Wiley-Interscience, New York, 1969, p. 667.
6. A. 1. Moulson and J. P. Roberts, Trans. Faraday Soc., 57, 1208 (1961).
7. T. Drury and 1. P. Roberts, Phys. Chem. Glasses, 4, 79 (1963).
8. G. 1. Roberts and 1. P. Roberts, Phys. Chem. Glasses, 5, 26 (1964).
9. G. Hetherington and K. H. Jack, Phys. Chem. Glasses, 3, 129 (1962).
10. H. Franz and H. Scholze, Glastech. Ber., 36, 347 (1963).
lOa. 1. Gotz, Glastech. Ber., 45, 14 (1972).
11. H. Franz, Glastech. Ber., 38, 54 (1965).
12. R. Bruckner, Glastech. Ber., 37, 536 (1964).
13. P. W. McMillan and A. Chlebik, J. Noncryst. Solids, 38/39, 509 (1980).
14. R. F. Bartholomew, in Treatise on Materials Science and Technology, Vol. 22, M.
Tomozawa and R. H. Doremus, Eds., Academic Press, San Diego, CA, 1982, p. 75.
15. M. Tomozawa, J. Noncryst. Solids, 73. 197 (1985).
16. H. Scholze, Glass-Nature, Structure and Properties, Springer-Verlag, Berlin, 1991.
17. 1. M. Jewell, M. S. Shess, and 1. E. Shelby, J. Am. Ceram. Soc., 73, 132 (1990).
18. S: D. Stookey, U.S. Patent 3,915,720 (1970).
19. F. M. Ernsberger, J. Am. Ceram. Soc., 60, 91 (1977).
20. T. Bell, G. Hetherington, and K. H. Jack, Phys. Chem. Glasses, 3, 141 (1962).
21. R. W. Lee, J. Chem. Phys., 38, 448 (1963).
22. S. P. Faile and D. M. Roy, Mater. Res. Bull., 5, 385 (1970); J. Am. Ceram. Soc., 54,
533 (1971).
23. K. H. Beckman and N. J. Harrick, J. Electrochem. Soc., 118, 614 (1971).
REFERENCES 213
24. R. H. Doremus, J. Electrochem. Soc., 115, 181 (1968).
25. R. H. Doremus, in Symp. on Nucleation and Crystallization in Glasses and Melts,
American Ceramic Society, Columbus, OH, 1962, p. 119.
26. R. Zsigmandy, Dingler's Poly tech. J., 226, 364 (1887); 306, 68, 91 (1897); Sprech-
saal, 27, 123, 147, 175, 201, 227 (1894).
27. A. W. Bastress, J. Am. Ceram. Soc., 30, 52 (1947).
28. J. T. Randall and R. E. Leeds, J. Soc. Glass Technol., 13, 16T (1929).
29. R. L. Green and K. B. Blodgett, J. Am. Ceram. Soc., 31, 89 (1948).
30. J. L. Barton and M. Morain, J. Noncryst. Solids, 3, 115 (1970).
31. E. A. Weaver, K. W. Heckman, and E. L. Williams, J. Chem. Phys., 47, 4891 (1967).
32. K. Awaza, H. Kawazoe, and M. Yamane, J. Appl. Phys., 68, 2713 (1990).
33. F. T. Wall, Chemical Thermodynamics, San Francisco, CA, 1974, p. 219.
34. F. 1. Norton, Nature, 191, 701 (1961).
35. D. D. Wagman et aI., The NBS Tables of Chemical Thermodynamic Properties,
American Institute of Physics, New York, 1982.
36. R. A. Swalin, Thermodynamics of Solids, Wiley, New York, 1972, p. 116.
37. C. H. P. Lupis, Chemical Thermodynamics of Materials, North-Holland, Am-
sterdam, 1983, p. 134.
38. F. Irmann, J. Am. Chem. Soc., 74, 4767 (1952).
39. E. J. Michal and R. Schuhmann, J. Met, 4, 723 (1952).
40. W. D. Johnston, J. Am. Ceram. Soc., 48, 184 (1965).
41. P. North and R. W. Douglas, Phys. Chem. Glasses, 6, 197 (1965).
42. A. Paul and R. W. Douglas, Phys. Chem. Glasses, 6, 207, 212 (1965).
43. R. W. Douglas, 10th Int. Congress on Glass, The Ceramic Society of Japan, 1974,
pp. 1-45 to 1-70.
44. H. 1. Tress, Phys. Chem. Glasses, 1, 196 (1960).
45. A. Paul, Chemistry of Glasses, Chapman and Hall, London, 1982, p. 14811'; J.
Noncryst. Solids, 123, 354 (1990).
45a. H. D. Schrieber, J. Noncryst. Solids, 84, 129 (1986).
46. H. O. Mulfinger and H. Meyer, Glastech. Ber., 36, 481 (1963).
47. H. O. Mulfinger and H. Franz, Glastech. Ber., 38, 235 (1965).
48. J. Kelen and H. O. Mulfinger, Glastech. Ber., 41, 230 (1968).
49. E. L. Swarts, J. Can. Ceram. Soc., 38, 155 (1969).
50. R. E. Loehman, in Treatise on Materials Science and Technology, Vol 26, M.
Tomozawa and R. H. Doremus, Eds., Academic Press, San Diego, CA, 1985, p. 119.
51. D. R. Messier, Rev. Chem. Miner., 22, 518 (1985).
52. M. Rajaram and D. E. Day, J. Am. Ceram. Soc., 70, 203 (1987).
53. T. Wakasugi, F. Tsukihashi, and N. Sano, J. Am. Ceram. Soc., 74, 1650 (1991).
54. M. L. Pearce, J. Am. Ceram. Soc., 47, 342 (1964).
55. C. Kroger and D. Lummerzheim, Glastech. Ber., 38, 229 (1965).
56. Z. Strnad, Phys. Chem. Glasses, 12, 152 (1971).
57. E. Preston and W. E. S. Turner, J. Soc. Glass. Technol, 18, 143 (1934).
214 REACTIONS WITH GASES
58. M. L. Pearce, J. Am. Ceram. Soc., 48, 175 (1965).
59. H. Zhang, S. Koritaka, K. Farooqui, R. Boekenhauer, D. Bain, S. Kambeyanda,
and S. Feller, J. Phys. Chem. Glasses, 32, 185 (1991).
60. C. 1. B. Fincham and F. D. Richardson, Proc. Roy. Soc., A223, 40 (1954).
61. E. T. Turkdogan and M. L. Pearce, 7rans. AIM E, 227, 940 (1963).
62. H. Meier Zu Kocker and D. Chandra, Glastech. Ber., 45, 139 (1972).
63. R. W. Douglas and 1. O. Isard, J. Soc. Glass. Technol, 33, 289T (1949).
64. C. H. Greene and R. F. Gaffney, J. Am. Ceram. Soc., 42, 271 (1959).
65. C. H. Greene and 1. Kitano, Glastech. Ber., 32K, 44 (1959).
66. C. H. Greene and H. A. Lee, J. Am. Ceram. Soc., 48, 528 (1965).
67. R. H. Doremus, J. Am. Ceram. Soc., 43, 655 (1960).
68. E. M. Firth, F. W. Hodkin, and W. E. S. Turner, J. Soc. Glass. Technol, 10, 3T
(1926); 11, lOOT (1927).
69. C. Kuhl, H. Rudow, and W. Weyl, Glastech. Ber., 16, 37 (1938).
70. V. T. Slavyanskii, Gases in Glass, Moscow, 1957.
71. M. Cable and M. A. Haroon, Glass Technol., 11, 48 (1970).
72. M. Cable, A. R. Clarke, and M. A. Haroon, Glass Technol.,9, 101 (1968); 10, 15
(1969).
73. Gmelin Handbuch der Anorganischen Chemie: Antimon, System No. 18, Part B,
Gmelin- Verlag GmbH., Clausthal-Zellerfeld, 1949, pp. 360-378.
74. Gmelin Handbuch der Anorganischen Chemie: Arsen, System No, 17, Verlag Chemie
GmbH., Weinheim/Bergstrasse, 1952, pp. 258-276.
75. A. K. Lyle, in Travaux du IV Congres Int. du Verre, Imprimerie Chaix, 20, rue
Bergere, Paris, 1957, p. 93.
76. A. K. Lyle, J. Am. Ceram. Soc., 33, 300 (1950).
77. F. L. Harding, Glass Technol., 13,43 (1972); J. Am. Ceram. Soc., 55, 368 (1972).
78. D. Brown and R. W. Douglas, Glass Technol., 6, 190 (1965).
79. R. W. Douglas and M. S. Zaman, Phys. Chem. Glasses, 10, 125 (1969).
80. C. H. Greene and D. R. Platts, J. Am. Ceram. Soc., 52, 106 (1969).
81. F. L. Harding and R. 1. Ryder, Glass Technol., 11, 54 (1970).
82. Symp. sur L'Affinage du Verre, Union Scientifique Continentale du Verre,
Charleroi, Belgium, 1956.
83. E. L. Swartz, in Encyclopedia of Materials Science and Engineering, Vol. 3, M. B.
Bever, Ed., Pergamon, Oxford, 1986, p. 1768ff.
CHAPTER 13
CHEMICAL DURABILITY: REACTION
OF WATER WITH GLASS
INTRODUCTION
Silicate glasses are among the most chemically inert of commercial materials.
They react with almost no liquids or gases at low (below '" 300°C) tempera-
tures except hydrofluoric acid solutions and slightly with water. At high
temperatures, above about 1200°C, there is also some reaction with strong
reducing agents such as hydrogen or graphite. As a result of its durability, glass
is useful as a container for corrosive fluids, as a liner for chemical reactors, as
an electrical insulator, and in buildings and automobiles. In the last two
decades glass has been introduced for encapsulating radioactive waste in a
highly durable matrix. This use has led to a large number of studies of the
reaction of glass with water and aqueous solutions, which are its potential
corrosive agents in storage.
Because of its chemical inertness, the chemical durability of glasses is
concerned almost entirely with their reactivity with liquid water, aqueous
solutions, and water vapor, all of which are extremely slow. Thus this chapter
is concerned with the reaction of water with glass. Reviews of early literature,
especially from the viewpoint of practical applications of glass, are in Refs. 1-3.
More emphasis on interpretation and chemistry of the reaction of glass with
water are reviewed in Refs. 4-6.
A series of different processes can take place when liquid water reacts with
glass. Among those well established experimentally are:
1. Dissolution of the glass into the water with the concentration ratios in
the dry glass (congruent dissolution).
215
216 REACTION OF WATER WITH GLASS
2. Ion exchange between alkali, and to some extent alkaline earth, ions in
the glass with hydrogen-bearing ions from the water.
3. Diffusion of molecular water into the glass.
4. Formation of layers of reaction products on the glass surface. Included
are preferential adsorption or precipitation of glass or solution constitu-
ents onto the glass surface or into a surface layer.
5. Reaction of water with the silicon-oxygen network (see Chapters 8
and 12).
In contact with water vapor processes 2-5 are possible.
The relative importance of these processes depends upon factors such as
temperature, solution composition, especially pH, and glass composition. One
goal of this discussion is to clarify conditions under which these various
processes are significant.
The reaction of water with glass has been studied in a variety of ways. Many
new techniques for probing the composition and structure of the glass surface
layers have been developed. These methods and techniques are first reviewed
below. Then some selected experimental results are reviewed; results that
elucidate mechanisms and factors in them are emphasized. Finally interpreta-
tions and mechanisms are discussed. The emphasis is on silicate glasses because
of their commercial importance and because they have been most studied; a
few results on the new zirconium fluoride glasses are included.
MEASURING METHODS
The traditional way to study the chemical durability of glass was to immerse
a glass powder in water or aqueous solution and measure its weight change
with time. Weight change of bulk glass is still a convenient method, and can
give valuable information on dissolution rates. 7 If surface precipitates form,
this method is less useful. Next, chemical analysis of the solution for glass
constituents was adopted. 8 This analysis gives information on processes such
as preferential leaching and solution conditions. More recently a variety of
methods for observing, analyzing and measuring profiles in glass surfaces have
been developed. The most useful of these are described briefly.
There are different methods of reacting glass with liquid water and aqueous
solutions. To keep solution conditions constant, dilute solutions have been
used, and the amount of glass dissolved limited, so solution concentrations
remain low. The solution pH can be held constant with buffers, the solutions
refluxed (Soxhlet extractor), or solution flowed through glass powder. In other
experiments, the solution conditions have changed during the experiment
("static" test). Interpretation of this kind of test is difficult because solution
conditions can change in complex ways; for example, the solution pH can rise
to a maximum and decrease,9 as shown in Fig. 1. One reason for preferring
static tests (or a flow test) may have been that they model the corrosion in
MEASURING METHODS 217
-..
I . ..
. "
'E I '
U I .'......
" 10- I
"':'
Q} .'
"'0 I
E !
'"
'0 I
S. ;
J: ,
g5 ,
U I
r I,.
, -/
,
I
Hz.O
,
....
....
....
.....
..........
5loe
---
-..- ---.
-
........----........
, --.
- - .... 46°C
---r--_
-. - - --
- time/min
20
50
100
, 150
Fig. 1 Hydroxyl ion concentration as a function of time in water for 015 soda-lime
silicate glass. Reprinted from Ref. 9 with permission from Elsevier.
natural conditions; this modeling is rarely reliable, however, because natural
conditions vary so widely with location and time. In this chapter results with
constant solution conditions are emphasized, because their interpretation is
much more straightforward than for static tests.
Light and electron microscopy are valuable tools for revealing the morphol-
ogy of a glass surface after it has reacted with water. An example is in Fig. 2,
which shows crystals of zirconium fluoride that grew on the surface of a
zirconium-barium fluoride glass in water. 10
Several different methods are available to measure profiles of constituents in
a glass surface. The glass can be etched with hydrofluoric acid solution and the
solution analyzed. 11 ,12 Non-destructive methods to a depth of about 1 p.m are
analysis by Rutherford backscattering (RBS) or nuclear reactions. 13 . 14 In RBS
the sample surface is bombarded with 2 MeV helium ions, and the energy of
the back scattered ions measured; since the collisions with atoms in the glass
are elastic, the absolute concentrations as a function of depth below the surface
can be calculated from spectra such as that in Fig. 3. Each different atom in
the glass shows an "edge" in the spectrum. This method is especially useful for
heavy atoms; the spike for implanted xenon atoms is clearly shown in the
figure. Resonant nuclear reactions are useful for analyzing particular atoms,
especially hydrogen. If the sample is bombarded with 15N ions, the reaction
15N + lH = 12C + 4H emits 4.4 MeV gamma raysl and their yield is measured.
Because there is a narrow isolated resonance with a large peak cross-section,
this reaction will occur only when the 15N ions are at the resonance energy of
6.405 MeV. If the sample is bombarded with ions of this energy, the yield of
gamma rays is proportional to hydrogen on the sample surface. As the beam
Fig. 2 Scanning electron micrograph of the surface of a Zr-Ba-La fluoride glass after
30 min in water at 25°C. 300 x. Reprinted from Ref. 10 with permission from Chapman
and Hall.
1000
400
800
(/) 600
-
c:
;:,
o
()
200
Xe
o
o
800
1000
400 600
Channel Number
Fig. 3 Rutherford back scattering spectrum of R.6 soda-lime silicate glass after it was
implanted with xenon ions, which have the spike on the right. Reprinted from Ref. 34
with permission from the American Ceramic Soc.
200
218
MEASURING METHODS 219
energy is raised, the 15N ions penetrate into the sample and lose energy until
their energy is 6.405 MeV, when they react with the hydrogen at this depth,
which can be calculated from the density of glass constituents.
If the sample surface is sputtered away, the surface can be analyzed with
secondary ion mass spectrometry (SIMS).15,16 This method has high sensitiv-
ity and can be used for light elements including hydrogen. A disadvantage is
that the absolute concentration cannot be determined, only relative values.
Profiles can also be determined on sputtered surface by spectrochemical
analysis. 17 Other methods of surface analysis are reviewed in Ref. 15.
Special care is needed to obtain reliable analysis of hydrogen in a glass
surface. Water can outgas rapidly from a gl ss surface even at room tempera-
ture, especially if the surface has been "transformed" to a more open structure
(see section on ion exchange below). To obtain a reliable hydrogen profile, that
is, one characteristic of the profile while the glass is in water, the glass with a
transformed layer must be cooled rapidly to well below O°C, held at this
temperature, and measured at this temperature. 18 In Fig. 4 the profile of
hydrogen in a soda-lime glass (015, see Table 1 for composition) after cooling
rapidly, held at low temperature, and measured at low temperature is com-
pared with the same glass after it was held in the vacuum system at room
temperature. More than half of the hydrogen was removed by this treatment.
The hydrogen level of 2.7 x 10- 20 atoms/cm 3 is about three times the
i :xJ.0
"-
....
'"'
r.1
[J 1.69 hours
o warm
6
[J
[J
<}I 20.0 [J
o !;I
x
o
o
[) 0
10.0
J
0.0
0.0
0.2
0.4 0.6
Depth (10-6 m )
0.8
1.0
Fig. 4 Hydrogen concentration profiles in 015 soda-lime silicate glass, hydrated 1.69
h at 80°C, chilled, and measured chilled (0); then held for 12 h in a vacuum at 25°C
(0). Reprinted from Ref. 18 with permission from Elsevier.
220 REACTION OF WATER WITH GLASS
concentration of sodium leached from this glass of 9.8 x 10 - 21 atoms/cm 3 .18
After the chilled sample was held in ambient air at 25°C for 1 week, the
hydrogen level decreased to 2.2 x 10 - 20 atoms/cm 3. These results show that
most of the measurements of hydrogen profiles in silicate glasses reported in
the literature are not reliable and are low because of outgassing of water. In
certain durable compositions such as commercial soda lime glasses, it is not
necessary to chill the glass to obtain reliable results, because outgassing of
water is much slower in these "untransformed" glasses}8
EXPERIMENTAL RESULTS
In the next sections selected experimental results on reaction of silicate glasses
in water and aqueous solutions are discussed under headings of the list of five
different processes given in the introduction. Emphasis is on results in which
solution conditions were held constant, because they are easier to interpret.
Ion Exchange
Alkali ions are preferentially leached from multicomponent silicate glasses
containing alkali oxides. This leaching was first demonstrated by solution
analysis of sodium and silicon. 8 It has also been demonstrated by analysis of
alkalis in the glass surface, which shows a layer of reduced sodium concentra-
tion near the glass-solution interface. 5, 7 ,11 - 19 An example of profiles of
sodium and hydrogen in the surface of a commercial soda-lime glass (see Table
1 glass no. 4, for composition) as measured with resonant nuclear reactions is
shown in Fig. 5. The pH of the distilled water used for leaching did not change
from neutral (about 6) during the experiment. The concentration of hydrogen
to about a depth of OJ p.m was three times that of sodium in the glass. The
sum of one-third the hydrogen concentration plus the sodium concentration
was constant at the level of sodium in the dry glass. Hydrogen profiles in this
glass after different leaching times in water are shown in Fig. 6, and the depths
of hydrogen penetration at half the surface concentration are plotted versus the
square root of time in Fig. 7. The plot is initially linear, and then the
penetration depth becomes constant. The Rutherford backscattering spectra
from this glass after leaching 14 showed no evidence for preferential leaching of
constituents other than sodium, and no formation of precipitation or layers of
other constituents on the glass surface.
The leaching or ion exchange of alkali ions leaves a surface layer on the
glass depleted of these ions, as shown in Fig. 5. The structure of this hydrated
surface layer is critical in determining the rate of ion exchange and of
dissolution of the glass. There is much experimental evidence that the surface
layer can have either of two structures. 20 In a durable glass such as the
commercial soda-lime glass containing 2% alumina, shown in Fig. 5, the
EXPERIMENTAL RESULTS 221
3.0
,;j'
Ie o 0
N U
N Q 2.0
<..)
z
0
U
1.0 Sodium
. .
.
0
0 0.8 0.9 1.0 1.1
Fig. 5 Hydrogen and sodium concentration profiles in the surface of a commercial
soda-lime glass (see Table 1, glass no. 4) held in water at 90°C for 404 h. Measured with
resonant nuclear reactions. Reprinted from Ref. 13 with permission from Elsevier.
3.0
" 3.83 hrs
. 139
v 35,6
. 679
o 100.7
. 147
. 195hrs
c 262
+ 317
.404
0540
1"'1
'E
u
N
N
Q
u
z
o
U
J:
01
0.2
03
Depth (,u.)
04
05
06
.
Fig. 6 Hydrogen profiles in a commerical soda-lime glass (no. 4 in Table 1) after
hold in water at 9Q°C for different times, as measured with a resonant nuclear
reaction. 13 Reprinted from Ref. 13 with permission from Elsevier.
222 REACTION OF WATER WITH GLASS
.6
(L..... - -
/ 1,1'"
/
V
/
/
/
) 7
5
- *
::t
s:.
Q.
" .3
o
2
.1
00 2 4 6 8 10 12 14 16 18 20 22 24 26 28
I I
[Time)' (hrs) 1
Fig. 7 The depth of hydrogen penetration versus square root time for the data in Fig.
6. Reprinted from Ref. 13 with permission from Elsevier.
silicon-oxygen network retains the configuration it has in the dry glass, and
the diffusion in the layer is similar to that in the dry glass. In other less durable
silicate glasses, the surface hydrated layer is transformed to a different more
open structure in which diffusion is more rapid. Models for this transformation
are described below in the interpretations sections. The experimental evidence
for two different structures of the hydrated layer is: 20
1. Outgassing of water in a transformed layer is much more rapid than in
an un transformed layer. 18 ,20
2. Ionic interdiffusion is more rapid in a transformed layer than in an
untransformed layer. 2o
3. The electrical resistance of a transformed hydrated layer is much less than
that of an untransformed layer. 21 ,22
4. Infrared transmission spectra in the Si-O stretching region (9-11 J.lm)
show much greater changes in glasses with transformed layers than in
glasses without them. 23 Reflection infrared spectra of hydrated .glasses
with transformed layers also show substantial changes. 24
5. The surface of a glass with a transformed layer swells during hy-
dration,25.26 whereas a glass with an untransformed layer does not
swell. 25
Wikby measured the electrical resistance of glass bulbs as they were etched
EXPERIMENTAL RESULTS 223
16 ,
'"
14
12
i 8
.;
u
c 6
..
'Iii
..
a:
4
2
0
0 4 8 12 16 20 24
time, min
Fig. 8 Electrical resistance of a hydrated bulb of 015 soda-lime glass etched in 0.3%
hydrofluoric acid. 5 . 21
with hydrofluoric acid. 21 He used a pulse technique to avoid electrode
polarization, and the glass was so thin that the resistance of the surface layer
was an appreciable fraction of the resistance through the glass cross-section.
The resistance as a function of etching time is shown in Fig. 8 for 015 soda-lime
glass (see Table 1). The nearly constant initial resistance is evidence for rapid
ionic motion in the transformed hydrated layer on this glass. Next, is a sharp
drop of resistance and then a decrease that corresponds to the dry glass. See
the interpretation section for further discussion.
In contrast to these results on a glass with a transformed hydrated layer,
TABLE 1 Composition of Glasses
Composition (wt%)
Density
Glass (g/cm 3 ) Si0 2 Na 2 0 CaO Al 2 0 3 MgO H 2 0 3
Sodium trisilicate 2.44 75 25
Corning 015 soda -lime 2.49 72 22 6
PPG soda-lime 2.49 74 13.3 8.3 0.06 3.7
Kimble R6 soda-lime (U) 2.45 74 12.9 6.8 1.8 4.5
Pyrex borosilicate (U) 2.23 82 4 2 14
Obsidian° (U) 2.36 76 3.6 0.5 13
"4.8 wt% K 2 0, 0,7 wt% FeO, 0.1 wt% Ti0 2 .
U, untransformed surface.
224 REACTION OF WATER WITH GLASS
electrolysis of thin bulbs of a commercial soda-lime glass (Kimble R-6,
Table 1) showed that mobilities in the hydrated layer were the same as in the
dry glass,22 demonstrating that the glass network in the hydrated layer had the,
same structure as in the dry glass.
The infrared absorption bands from stretching, bending, and rocking
vibrations of silicon-oxygen bonds in glass no. 6 in Table 1 were little affected
by hydration. 23 In Pyrex borosilicate glass (Corning 7740, glass no. 4, Table 1)
hydration did not change the positions or intensities of boron-oxygen and
silicon-oxygen vibrational bands. 23 On the contrary, vibrational silicon-
oxygen bands in a 70% Si0 2 -30% Na 2 0 glass and in 015 soda-lime glass shift
and change intensity after hydration of these glasses. I conclude that the former
glasses retain their network structure in the hydrated layer, whereas the
hydrated layer in the latter glasses is transformed to a somewhat more open
structure, consistent with the other evidence presented here.
The sum of all this evidence strongly supports the interpretation of a
structural change in the hydrated layers of less durable silicate glasses and no
structural change in these layers on durable glasses.
Measurements of lithium and sodium profiles in a variety of glass composi-
tions show a similar S-shape to that in Fig. 5 (refs. 11, 14, 16, 18, 19, 20, 26-30
and references in these papers). Curiously, profiles of potassium in binary
potassium silicate glasses have the shape of more traditional diffusion pro-
files. ll ,31 Interpretation of these results is given below.
Solution conditions can influence the concentration level of alkali ion at the
glass-solution interface. If the pH is basic and there are alkali ions in solution,
the amount of alkali in the glass surface increases. Baucke studied the exchange
equilibrium between lithium and hydrogen-bearing ions in a lithium silicate
glass. 32 Ion exchange equilibria in glass are discussed in the next chapter.
The reaction of glass with water vapor in the ambient air, instead of with
TABLE 2 Major Constitutents of Glass for Radioactive Waste
wt%
Oxide Swedish J-10
Component ABS (Ref. 59) LWR DWPF
Si0 2 48.5 38.3 34.8 50.0
B 2 0 3 19.1 11.8 12.9 8.0
Na 2 0 12.9 20.3 5.5 8.7
CaO 6.4 2.0 1.0
Fe203 5.7 4.1 1.0 10.4
AI 2 0 3 3.1 7.4 4.0
Waste oxides 10.7 14.0 21.3
Other oxides 22.0 17.9
EXPERIMENTAL RESULTS 225
liquid water or aqueous solutions, is called weathering. This reaction involves
ion exchange but not congruent dissolution of the glass. The ion exchange can
be written as
Na + (glass) + 2H 2 0 = H 3 0+(glass) + NaOH
(1)
The form of the hydrogen-bearing species is discussed in the interpretation
section. The sodium hydroxide remains on the glass surface, and reacts with
ambient carbon dioxide:
2 NaOH + CO 2 = Na 2 C0 3 . H 2 0 (2)
The infrared spectra of the surface crystals on hydrated glass show they are
sodium carbonate,23 from absorption bands at 1450cm- 1 and 230cm- l ;
sodium bicarbonate does not absorb at 1450cm -1. An electron micrograph of
surface crystals on a hydrated sodium silicate glass is shown in Fig. 9.
Dissolution of Glass In Water
In liquid water and aqueous solutions, silicate glasses dissolve congruently at
a constant rate, concurrently with ion exchange and other processes. Since the
ion exchange depth is proportional to the square root of time, as shown in Fig.
6, dissolution becomes the dominant process at long times, and is therefore the
important process in determining the long-term durability of glass, for
example, for encapsulating radioactive waste.
The rate of dissolution of glass can be measured in several different ways.
Many workers have analyzed the solution for glass constituents, for example,
silica. 33 This method is sometimes reliable, but if there is formation of
precipitates or colloids in solution, or deposits or adsorption on the glass
surface, it gives misleading results. Weight change is a useful method if there
are no deposits on the glass surface.,,34 Two other methods involve the glass
surface directly.
The first of these requires implantation of a heavy marker ion in the glass
before dissolution.'.14 Then the depth of these implanted atoms, for example
xenon, is measured with Rutherford backscattering, as shown in Fig. 3. Next,
the glass is treated in solution, and some of it dissolves. The xenon is then not
as deep in the glass; calculation of the depth with time gives the dissolutibn
rate, which was constant in different glass compositions.,.14 The back scattering
spectrum clearly shows whether there are deposits or adsorption or layers of
modified composition on the glass surface. In Fig. 3, the spectrum shows edges
and profiles for glass constituents as expected for uniform concentration right
to the glass surface.
A second method involves protecting part of the glass surface from dissol-
ution. The height of the step between this protected region and the dissolved
region is measured with a profilometer stylus.' This technique has vertical and
lateral resolutions of less than 1 nm and 1 IJm, respectively.
226 REACTION OF WATER WITH GLASS
"
I)
f
.fl-
"
« ...
,,1
'\
\.
"....
.
\"\" ""I
.:,.",:t .
.7)
",
.\
,- .
;
-I'
'\
,
.
r 1
\,
,) .
, \.
t
., "
.\.,
l,::
L,
:1"' :
'''.
I,
/"; l'
x;.
, ,
....., .. :
, .....'1<
'\ ;"'1'
c'.1
. ,
'f'
.
1
, #
Fig. 9 Electron micrograph of crystals on the surface of a Na 2 0. 2Si0 2 glass after
fracture. 42,000. x
In a study of dissolution rates of a variety of silicate glasses, 7 ,34 the results
of these two techniques and weight change measurements agreed within
experimental error, verifying the validity of the results, and showing that the
implanted xenon does not influence the rate of dissolution. Dissolution rates
for a wide variety of glasses at pH 7 as a function of I/T are shown in Fig. 10,
and rates of many glasses and activation energies are given in Table 3. The
2.8 2,6 2.4
103fT
Fig. 10 Dissolution rates of different silicate glasses (Table 1) at pH 7 as a function of
reciprocal temperature. +, Na 2 0. 3Si0 2 ; 0, 015; 6., PPG soda-lime; 0, Pyrex
borosilicate, 0, R-6 soda-lime; and x, obsidian. Reprinted from Ref. 7 with permission
from the American Ceramic Society.
-6
SO. 70.
+
-7 +
+
+
-6
-9
UI
E
u
aJ
c:
.2
'S
"0
UI
UI
..J -11
-13
3.2
EXPERIMENTAL RESULTS 227
100.
130. 160. 200.
/
3,0
2,2 2.0
rates of dissolution of Vycor and vitreous silicate glasses are about equal to
those in Fig. 10 for commercial soda-lime glass containing alumina. Crystalline
quartz 37 has a much lower dissolution rate than vitreous silica, and the rate
for quartz is about the same as found for obsidian natural glass in this study.
TABLE 3 Rates of Dissolution of Different Glasses at 90°C'
and Activation Energies for Dissolution
Glass
-log v
(v in cm/s)
Activation energy,
Q (kJjmol)
Sodium trisilicate
Corning 015 soda-lime
PPG soda-lime
Pyrex borosilicate
Kimble R6 soda-lime
Obsidian
6.4 b
8.18
9.05
9.64
10.70
12.7 b
84
68
54
79
62
"From Fig. 10.
bExtrapolated.
228 REACTION OF WATER WITH GLASS
A large number of minerals, mostly aluminosilicates, have rates of dissolution
similar to those of quartz and obsidian,38 with an activation energy of about
56 kJ/mol from 70 to 700°C.
A commercial soda-lime silicate glass containing about 2% alumina dissol-
ved much more slowly than a glass with a similar composition but without
much alumina. Pyrex borosilicate glass has a surprisingly high rate of dissol-
ution despite its use as a chemically durable glass. At room temperature and
pH 7 Pyrex borosilicate glass dissolves about two orders of magnitude faster
than commercial soda-lime glasses containing alumina.
Solution pH has a strong influence on the rate of dissolution of silicate
glasses. 1 - 6 ,33,34,39.40 It has long been known that these glasses dissolve more
rapidly in basic solution. Boksay and Bouquet 33 found a minimum rate of
dissolution of 015 soda-lime glass at pH 4, and vitreous silica 341 apparently has
a minimum rate at somewhat lower pH. The rates of dissolution of glasses R-6,
PPG float, and Pyrex borosilicate increased more than a factor of ten 34
between pH4 and 9 (see also ref. 36, p. 73).
Build-up of the silica concentration in solution during dissolution of silicate
glass reduces the rate of dissolution. The equilibrium solubility of amorphous
silica in water at 25°C was found to be about 0.012 wt% by Alexander et al.,41
in close agreement with previous work cited in their article. The dissolved
species was unionized monomeric silicic acid, H 4 Si0 4 :
Si0 2 + 2H 2 0 = H 4 Si0 4
(3)
The solubility was about constant at pH values from 2 to 8, but decreases at
lower pH (strongly acid solutions).4o Above pH 8 the solubility rose sharply
because of the ionization of the silicic acid:
H 4 Si0 4 + OH- = H 3 SiOi + H 2 0
(4)
However, the amount of unionized silica in solution remained constant, even
though the total amount of dissolved silica increased by formation of H 3 SiOi
ions. 41 Between 25 and 200°C, the solubility of amorphous silica in water at
pH 7 increased linearly with temperature to about 0.083 wt% at 200°C.
The influence of silica concentration on dissolution rates of PPG and Pyrex
glasses (see Table 1) was measured in two different ways.42 In the first, the
decrease of dissolultion rate caused by the increase of silica in the solution from
the dissolving glass was followed. In the second method, silica was added to
the solution at different concentration levels and the dissolution rate measured.
The dissolution rate approached zero as the silica reached its solubility limit
in solution. A similar result was found for a simulated nuclear waste glass PNL
76-68 at 90°C from analysis of silica in the solution. 43 In both cases, the change
of silica concentration in solution c fits a first-order reaction equation,44
dc
- = k o - k - R c
dt r r
(5)
EXPERIMENTAL RESULTS 229
where ko is the rate of dissolution initially, k r is the reverse reaction, and r is
the concentration of silica in the glass. At high supersaturation, the reverse
reaction (k i ) is anomalously high. 341
Solubilities determined from these experiments 42 are given in Table 4. The
solubilities of silica for Pyrex borosilicate and soda-lime glasses at 140° and
pH4 are not far from the silica values of 6(10)4 gm/cm 3 ; at pH9 and 90°C, the
solubility of silica is about five times higher than that measured for these
glasses.
In highly acidic (pH 1 and below) and alkaline solutions above pH 9, the
rate of dissolution of silicate glasses becomes rapid and dominates ion
exchange; the thickness of the leached layer becomes negligibly small, of atomic
dimensions. The weight loss of several commercial glasses in sodium hydroxide
is compared in Table 5. The first four glasses have about the same rate of loss,
in spite of their different rates of dissolution at pH 7. At this pH, the weight
loss is linear with time,45 consistent with dissolution control. Zirconia in a
silicate glass imparts substantial durability to alkaline attack, as shown in
Table 5 corresponding to its strong resistance to alkali as the pure oxide. 48 A
number of other oxides of multivalent cations impart some resistance to
alkaline attack, but less than by zirconia; examples are oxides of aluminum,
beryllium, lanthanum,46 and transition metals such as iron, 50 manganese, 50
and chromium. 46 ,51 The rate of dissolution of silicates at pH above about 7 is
apparently related to surface charge. 49
Concentrated strong acids (HCI and H 2 S0 4 above 1 M) attack soda-lime
glass more rapidly than dilute acids or neutral solutions. 52 There is an initial
rapid attack and subsequent reduction of the rate of attack to zero.
Molecular Diffusion
As described in Chapters 8 and 12, water dissolves molecularly in vitreous
silica and reacts with the silicon-oxygen lattice to form -SiOH groups. At
temperatures above 100°C, water diffuses molecularly into certain alkali silicate
glasses forming "hydrosilicates" as described in the last chapter; the reaction of
TABLE 4 Solubility of Silica from Commercial Soda-Lime and Pyrex Borosilicate
Glasses
Pyrex borosiJicate
Temperature Solubility
("C) pH (gJcm 3 x 10⁴) Method
197 4 8.0 Saturation, Eq. 5
140 4 3.4 Saturation, Eq. 5
90 9 1.0 Saturation, Eq. 5
90 9 1.0 Addition of silica
70 9 0.2 Saturation, Eq. 5
140 4 7.0 Saturation, Eq. 5
90 9 1.0 Addition of silica
Glass
Soda-lime
230 REACTION OF WATER WITH GLASS
TABLE S Weight Loss of Different Silicate Glasses after 6h in S% NaOH at 100°C
Corning no.
Glass
Weight loss,
(mgjcm 2 )
7900
7740
0080
0010
7050
8870
1710
7280
96% silica
Pyrex borosilicate
Soda-lime
Lead glass
Sodium borosilicate
High lead
Aluminosilicate, low alkali
Alkali resistant (with Zr0 2 )
0.9
1.4
1.1
1.6
3.9
3.6
0.35
0.09
Approximate compositions (wt. %)
Si0 2 B 2 0 3 Al 2 0 3 CaO MgO PbO Na 2 0 K 2 0
7740
0080
0010
7050
1710
81.0
72.6
77.0
68.0
64.0
13.0 2.0
0.8 1.7 4.6 3.6
1.0 8.0
24.0 1.0
4.5 10.4 8.9 10.2
4.0
15.2
9.0
7.0
1.3
5.0
0.7
this water with the silicon-oxygen network causes a dramatic change in the
mechanical properties of these glasses. During this molecular diffusion, the
concentration of alkali in the bulk of the glass is unaffected, except by ion
exchange just at the glass surface. There is no evidence for appreciable
molecular permeation of molecular water in a durable glass such as a
commerical soda-lime containing alumina below 100°C.except as part of the
hydronium ion. The amount of hydrogen in the surface of such a glass is just
three times the sodium concentration, as shown in Fig. 5, and expected from
reaction 3. Even in less durable glasses, such as 015, soda-line, there is no
evidence for more water than exchanges for sodium (Fig. 4). It is only at
temperature above 100°C or in less durable glasses such as binary alkali
silicates that there is evidence for molecular diffusion of water from liquid
water.
At higher temperatures and in water vapor, it is likely that molecular
permeation of water is appreciable in all silicate glasses. The penetration depth
of water vapor in tektite glass 53 (aluminosilicate, see Table 1) at 200°C after
122 days was about 3 p.m. The effective diffusion coefficient of reacted water in
vitreous silica measured by Moulson and Roberts 54 was about
D = 3.5 x 1O-14 cm 2/ s , extrapolated to 200°C; from the approximate relation
X = J2Dt, where X is the penetration depth after time t, one expects
penetration to about 6 p.m. Thus it is quite possible that the hydration front
measured by Mazer et al. 53 resulted from diffusion of molecular water.
EXPERIMENTAL RESULTS 231
At higher temperatures of 650-950°C, the profiles of water in a rhyolitic
obsidian glass 55 ,56 were the same as in vitreous silica (Chapter 8, Fig. 6), so it
is quite likely that the water diffuses and reacts in this glass in the same way
that it does in vitreous silica. These aluminosilicates have relatively low
amounts of alkali or alkaline earth oxides (see Table 1), so their structure may
be more open, similar to vitreous silica.
Reaction Layers on Glass
Vitreous silica shows minimum formation of reaction layers on its surface.
After strong hydration in acid, a thin (a few atomic layers) hydrated surface
layer forms on vitreous silica on which there is enhanced adsorption; see first
edition, p. 225. Other durable glasses, such as commercial soda-lime contain-
ing alumina, also show minimum tendency to form reaction layers in
solution. The Rutherford backscattering spectra and infrared spectra of these
durable glasses show no evidence for surface layers after hydration in water of
neutral pH below 100°C. Less durable glasses show an increased tendency to
form reaction layers with alteration of the structure of the silicon-oxygen
network. A step towards these structural changes is the formation of a
transformed hydrated layer described above and discussed in the interpreta-
tions section.
Some factors that favor the formation of reaction layers on silicate glasses
are:
1. Treatment of the glass in water vapor, rather than liquid vapor. Products
of ion exchange remain on the glass surface and react with it, whereas in
liquid water they are dissolved away. Clay-like phases formed on the
surface of an aluminosilicate tektite after hydration at 200°C for 122 days
in water vapor;53 clay-like phases also formed on nuclear waste glasses
in water vapor. 57
2. Nondurable glasses are more likely to form structurally altered and
reaction layers. Surfaces of binary sodium and potassium silicate glasses
crack in acid solution. 47 ,58 Certain sodium borosilicates have con-
siderably altered network structures after leaching. 58
3. Higher temperatures (above 100°C) favor surface reactions and layer
formation.
4. High solution concentrations of constituents of less soluble phases lead
to precipitation on the glass surface. Zinc silicate was found on the
surface of a nuclear waste glass after hydration at 90°C in static
solution,43 giving a final pH from 9 to 10.
5. Certain constituents of glasses are preferentially leached in acidic or basic
solution. Boron is removed in acids, and aluminum in bases. Since the
silicon-oxygen network is rapidly dissolved in basic solutions, most
silicate glasses have close to the same dissolution rate in strong base, as
shown in Table 5.
232 REACTION OF WATER WITH GLASS
Murakami and Banba 59 studied surface layers formed on a simulated
nuclear waste glass with a large number of components (glass no. J-I0, Table
2). Many other authors also studied nuclear waste glasses. 60 ,61 Murakami and
Banba identified four different surface layers after treatment of the glass at
100°C for 200 days in refluxed water (Soxhlet test). The total layer thickness
was about 0.55 mm. These authors found that alkali metals and molybdenum
were depleted from surface layers, and that manganese, iron, nickel, zirconium,
lanthanum, cesium and neodymium had about the same concentration in the
surface layers as in the glass. Silicon, aluminum, and calcium had lower
concentrations in the surface layers than in the glass. There were finely divided
crystals in the layers of a layer silicate containing the elements that remained
in the layers.
The possible influences of surface layers on the kinetic processes of ion.
exchange and dissolution are discussed below.
INTERPRETATIONS
There is strong experimental evidence that certain silicate glasses retain their
network structure in a hydrated ion exchanged layer, as described above; these
glasses with un transformed hydrated layers are designated with a "U" in Table
1. Outgassing of water from them is slow after hydration,13,18,20 even at
temperatures up to 100°C and in a vacuum.
In ion exchange in these un transformed glasses, three hydrogen atoms
replace each sodium, as shown in Fig. 5. This result is good evidence that
hydronium ions exchange for alkalis (reaction 1). Even in less durable glasses,
the ion exchange involves three hydrogen atoms for each alkali ion,18 as shown
in Fig. 4, also suggesting hydronium exchange. 62 ,63 Several previous workers
have found less than three hydrogen atoms exchanged in these less durable
glasses, and have questioned hydronium exchange; these lower hydrogen
concentrations result because of outgassing of water from the transformed
hydrated layers on these glasses, as established in Ref. 18, and are not
representative of true hydrogen concentrations during hydration.
The dependence of hydration depth and sodium concentration in solution
on the square root of time during ion exchange is evidence for a diffusion-
controlled process. The S-shaped profiles found for ion exchange during
hydration of silicate glasses show that the diffusion depends upon ionic
concentration. The interdiffusion of tw.o monovalent cations on fixed sites can
be described 64 ,65 by a concentration-dependent interdiffusion coefficient D,
D= DHD A = D A (6)
NAD A + NBD B 1 + bN A
where D H and D A are diffusion coefficients for individual ions and N A and N H
are their ionic fractions; N A + N H = 1, and b = (D A/ D H ) - 1. As a first
approximation, one can assume that the individual D H and D A values are not
INTERPRETATIONS 233
a function of ionic ratio; then b is a constant. Experimentally variations in D H
and D It are small compared to those in D. Equation 6 applies to
interdiffusion during hydration of glass with A and H alkali cation and
hydrogen (hydronium ion), respectively.66 Profiles calculated with the concen-
tration-dependent interdiffusion coefficient of Eq. 6 are compared with experi-
mental profiles in Fig. 5; the agreement is good. The diffusion coefficients of
sodium and lithium ions in glasses with untransformed hydrated layers,
obtained from the measured profiles, agree with diffusion coefficients calculated
from Eq. 6. 20 ,30 Also diffusion coefficients calculated from the Einstein equa-
tion (see Chapter 15, Eq. 11) and measured electrical conductivity agree with
measured coefficients,22 This good agreement is strong evidence for the validity
of the interdiffusion theory of the rate of ion exchange during hydration of
these glasses. Some workers have suggested that the ion exchange rate is
controlled by molecular diffusion of water into the glass. However, there is no
experimental support for this idea. 67 The ionic interdiffusion control of ion
exchange during hydrolysis is also confirmed by electrolysis experiments;22 the
same ratio of ionic mobilities is found in these experiments as in the experi-
ments without an electrical field.
In ion exchange in glasses with transformed surface layers, the mobilities of
ions are much greater than in the dry glass. 8 ,12,16.20,30,47,58 However, the
profiles of ions are similar to those in the glasses with untransformed layers.
The applicability of Eq. 6 in this case must be tested with independent
measurements of ionic mobilities in the hydrated layers, which have not been
carried out.
At the same time that diffusion-controlled ion exchange is taking place, the
glass is dissolving congruently. To account for these two simultaneous pro-
cesses, Boksay et al. 11 introduced a new distance variable y = X - vt, in which
X is the distance from the initial glass-solution interface and y is the distance
from the actual interface after dissolution at a constant rate v after time t. An
equation for the concentration profile with a constant diffusion coefficient can
be derived from this new variable;5.11 however, this profile does not have the
required S-shape. With the concentration-dependent interdiffusion coefficient
of Eq. 4, an analytical solution is difficult. At long times a steady-state is
reached in which the thickness of the hydration layer is constant. In this
steady-state regime, the concentration profile of alkali with a diffusion coeffi-
cient from Eq. 6 is 66
1 - exp( -vy/D H )
N A = 1 + b exp( -vy/D H ) (7)
Curves from this equation fit experimental profiles well. 6 ,13,30
In some nondurable glasses, cracks form on the surface during hydration,
for example binary sodium silicate glasses. 4 7.58 In this case, the amount of
alkali in the solution can become linear with time while the thickness of the
hydration is still increasing, presumably because water reaches deeper into the
glass along the cracks.
234 REACTION OF WATER WITH GLASS
The increase in solution pH to a maximum in a static solution of limited
volume 9 is shown in Fig. 1. This pH change can be modeled with a series of
differentials for the different reactions.9.68 Qualitatively these changes in pH
can be understood as follows. At first the alkaline products of ion exchange
(Eq. 1) build up in the solution, causing an increase in pH. This increase speeds
the rate of lattice dissolution, including the formation of silicic acid by Eq. 3.
This acid neutralizes the alkaline products, and because the amount of silica in
the glass is greater than the other constituents, it eventually dominates and
causes the pH to decrease. In some glasses containing less silica in solution of
limited volume, the pH seems to reach a constant value.
The transformation of the hydrated glass layer to a somewhat more open
structure in which outgassing and ionic mobilities increase is perhaps similar
to separation into two fine phases, one in which water and ions can diffuse
rapidly. Tomozawa and Capella found evidence for a two-phase structure in
the surface of a hydrated sodium silicate glass with small angle X-ray
scattering. 69
DISSOLUTION
Surface structure is an important factor causing different rates of dissolution
from silicate glasses of different compositions. The higher dissolution (and ion
exchange 30 ) rates of soda-lime silicate glasses without alumina compared to
glasses with almost the same composition but containing a few % alumina
result from the transformed hydrated surface layers in the former. Perhaps the
alumina inhibits a phase separation of the type described in the last paragraph;
alumina inhibits phase separation in silicates (see Chapter 4).
In vitreous silica, molecular water penetrates into the surface layers of the
silicon-oxygen lattice and reacts with silicon-oxygen bonds. 70
Si-O-Si + H 2 0 = SiOH + HOSi
(8)
There is evidence that a sequence of these bond-breaking reactions causes large
molecular "islands" to dissolve from the silicate surface and slowly hydrolyze
to monomeric silicic acid (eq. 3). Whatever the details of the dissolution
process, the more open structure of the transformed layer provides easier access
of water to the silicon-oxygen network and increases its dissolution rate. The
binary alkali silicate glasses have more open transformed layers than the
soda-lime glasses,69 so they dissolve even more rapidly.
The dissolution of many aluminosilicate crystalline minerals, crystalline
quartz, and obsidian natural glass are all about the same and much lower than
vitreous silica and soda-lime with alumina. 38 Perhaps these low rates represent
the rate of reaction of water with a relatively impenetrable surface, and are
therefore the minimum possible for a silicon-oxygen network. The higher rates
for R-6 soda-lime and vitreous silica may result because water can diffuse into
INFLUENCE OF REACTION LAYERS ON KINETICS 235
their surface layers more easily than into obsidian or quartz. This difference
corresponds to the much greater permeation of gases into vitreous silica than
an alumino silicate glass or quartz (Chapter 8, Fig. 7).
The rate of dissolution of vitreous silica is closely related to the surface
charge on the silica,39,49 as determined by titration of surface silica groups. 7 10
The dissolution rate has a minimum at pH 2 or 3, which is close to the point
of zero charge of amorphous silica. Perhaps the silicon-oxygen bonds on the
silica surface become weaker as neighboring SiO - groups are charged. Some
authors have suggested that hydrogen or hydroxyl ions "catalyze" the hy-
dration and dissolution reactions. It seems unlikely that attraction of specific
groups or molecules is the mechanism of charge enhancement, because both
positive and negative charges on the silica surface appear to enhance the rate
of dissolution.
The extent of reactions 1, 3 and 4 and their relation to solution conditions
such as pH can be related to the thermodynamic properties of reactants and
products. Free energies of formation of compounds in these reactions ae given
in Ref. 5, in which there is discussion of these values and their use. The
solubility of amorphous silica in water increases with temperature and pH.
These increases correspond qualitatively with increases in dissolution rates of
silicate glasses, but not quantitatively; for example, the solubility of amorphous
silica is about seven times greater at 200°C than at room temperature, whereas
the dissolution rates in Fig. 10 increases much more over this temperature
range.
Durabilities of multicomponent glasses have been compared with ther-
modynamic properties of component oxides and silicates (e.g. calcium sili-
cate).72,73 The influence of other components in a multicomponent glass on
thermodynamic properties (activities) of a specific oxide is difficult to deduce;
often mixtures are highly nonideal. This approach neglects the important role
of surface structure on glass durability. For example, quartz dissolves much
more slowly than amorphous silica, yet their free energies of hydration are
almost the same. See Refs. 5, 7, 72 and 73 for discussion.
The chemistries of component ions in solutions can give clues as to the
influence of these components on reactions with acidic and basic solutions. An
amphoteric ion (one that forms both acids and bases) such as aluminum is
likely to be soluble in both acids and bases, even if it is not soluble in neutral
water. Certain ions form highly insoluble silicates in aqueous solutions, for
example zirconium, thorium, beryllium and zinc. The first three impart
increased resistance to corrosion in alkali as a glass constituent.
INFLUENCE OF REACTION LAYERS ON KINETICS
Silica in solution, either deliberately added or from the dissolution of glass,
reduced the rate of congruent dissolution of the glass. 42 This reduction follows
236 REACTION OF WATER WITH GLASS
the first order kinetic equation of Eq. 5, and can render the dissolution rate
negligible.
Some workers have suggested that surface reaction layers inhibit leaching
from glass. There is no direct evidence for this idea. The layers are usually loose
mixtures of amorphous and crystalline phases. It seems likely that water and
ions can diffuse in these layers more or less easily. I suggest that the inhibition
of dissolution results mainly from the increase of silica in the solution, causing
a reduction in the dissolution rate (Eq. 5). This reduction is more likely to
occur in solutions of limited volume, which is just the condition that favors
layer formation. The ratio A/V of surface area of glass to solution volume is
an important parameter for determining the build-up of silica concentration in
solution.
The solubility of silica from different glasses can be considerably smaller
than from vitreous silica, as shown in Table 4. In some compositions this
reduction in solubility is related to the fraction of silica in the glass; in other
glasses at pH 9, it is much greater than expected from the silica concentration
in the glass. Apparently constituents of the glass in solution reduce the silica
solubility.
RADIOACTIVE WASTE DISPOSAL
Large amounts of highly dangerous radioactive waste, generated from weapons
development, are stored in liquid form in steel tanks, and large quantities of
degenerated radioactive fuel are produced in commercial atomic reactors.
Some of these tanks are beginning to leak. Thus it has been essential to develop
a more stable form for the waste. Encapsulation in glass is being carried out
in Europe, and a plant to incorporate radioactive waste in glass has been built
at the Savannah River facilities in South Carolina. This plant represents a
major technological achievement of remotely treating the waste and melting it
into glass.
The glass compositions chosen for waste encapsulation are similar to those
in Table 2. This composition was chosen because it can be melted at relatively
low temperature, avoiding vaporization of radioactive material during melting.
Unfortunately the compositions cJlOsen, while durable compared to other
materials, are not as durable as some other glasses. The rate of dissolution is
not as low as desired to insure long-term (10 4 years or greater) durability of
the glass, so methods of confining leach products and reducing the dissolution
are being considered. One is to bury the waste in rock or remote sites such as
Yucca Mountain in Nevada. These methods have led to wrenching controver-
sies (Ref. 74, see also Refs. 36,60 and 61 for discussions of waste disposal).
It was necessary and wise to start with a glass that was relatively convenient
to process. It seems appropriate, however, to consider improving the durability
of the glass to the point that it can be relied on entirely to confine the waste
by dissolving slowly even under adverse conditions. The present discussion
REFERENCES 237
shows that there is considerable possibility of reducing the dissolution rate of
the encapsulating glass by judicious change in the glass composition.
ZIRCONIUM FLUORIDE GLASS
A variety of glasses based on zirconium fluoride have infrared transmission to
8 J1.m or beyond, and therefore have excellent potential for optical fibers and
other optical components. In liquid water these glasses dissolve rapidly and
congruently,75 and crystals deposit on the surface as shown in Fig. 2. These
crystals are zirconium fl uo riM, 10 and they grow from solution near the glass
surface. In water vapor these glasses are quite durable. 76 There is evidence
from hydrogen profiles that water from solutions penetrates into the glass,
perhaps increasing the ease of dissolution. 77 Glasses formed directly from the
melt can be much more durable than cut and polished surfaces. 78
REFERENCES
1. R. W. Morey, The Properties of Glass, Reinhold, New York, 1954, pp. 101 ff.
2. F. R. Bacon, Glass Ind., 49, 438, 494, 554, 557 (1968).
3. V. Gottardi, Ed., The Chemical Durability of Glass-A Bibliographic Review, Int.
Comm. on 0- ss, 1972.
4. A. M. Filbert and M. L. Hair, in Advances in Corrosion Science and Technology, M.
G. Fontana and R. W. Stachle, Eds" Plenum Press, New York, 1976, p. 1.
5. R. H. Doremus, Chemical Durability of Glass, in 7reatise on Materials Science and
Technology, Vol. 17, M. Tomozawa and R. H. Doremus, Eds., Academic Press, San
Diego, CA, 1979, p. 41.
6. H. H. Dunken, Physikalische Chemie der Glasoberflache, VEB Deutscher Verlag flir
Grundstoffindustrie, Leipzig, Germany, 1981, p. 284ff.
7. G. Perera, R. H. Doremus, and W. A. Lanford, J. Am. Ceram. Soc., 74, 1269 (1991).
8. M. A. Rana and R. W. Douglas, Phys. Chern. Glasses, 2, 179 (1961).
9. H. H. Dunken and R. H. Doremus, J. Noncryst. Solids 92, 61 (1987).
to. R. H. Doremus, N. P. Bansal, T. Bradner and D. Murphy, J. Mater. Sci. Lett. 3,
484 (1984).
11. Z. Boksay, G. Bouquet and S. Dobos, Phys. Chern. Glasses, 9, 69 (1968).
12. H. Scholze, J. Noncryst. Solids, 52, 91 (1982).
13. W. A. Lanford, K. Davis, P. Lamarche, T. Laursen, R. Groleau, and R. H. Doremus,
J. Noncryst. Solids, 33, 249 (1979).
14. W. A. Lanford, C. Burman, R. H. Doremus, Y. Mehrotra and T. Wassick, Advances
in Materials Characterization, D. R. Rossington, R. A. Condrate and R. L. Snyder,
Eds., Plenum, New York, 1983, p. 549.
15. L. L. Hench, in Characterization of Materials in Research, Ceramics and Polymers,
V. Weiss and J. J. Burke, Eds., Syracuse University Press, Syracuse, NY, 1975, p.
211.
238 REACTION OF WATER WITH GLASS
16. B. M.1. Smets and M. G. W. Lommen, Phys. Chern. Glasses, 23, 83 (1982).
17. H. Bach and F. G. K. Baucke, J. Am. Ceram. Soc., 65, 527, 533 (1985).
18. K. H. Schnatter, R. H. Doremus, and W. A. Lanford, J. Noncryst. Solids, 102, 11
(1988).
19. F. G. K. Baucke, J. Noncryst. Solids, 14, 13 (1974).
20. R. H. Doremus, Y. Mehrotra, W. A. Lanford, and C. Burman, J. Mater. Sci., 18,
612 (1983).
21. A. Wikby, Electrochim. Acta, 19, 329 (1974).
22. R. H. Doremus, A. Babinec, K. D'Angelo, M. Doody, W. A. Lanford, and C.
Burman, J. Am. Ceram. Soc., 67, 476 (1984).
23. R. D. Husung and R. H. Doremus, J. Mater. Res., 5, 2209 (1990).
24. D. E. Clark, M. F. Dilmore, E. C. Ethridge, and L. L. Hench, J. Am. Ceram. Soc.,
59, 62 (1976).
25. D. Hubbard, E. H. Hamilton, and A. N. Finn, J. Res. Natl. Bur. Stand., 22, 339
(1939).
26. H. Scholze, D. Helmreich, and J. Bakardjico, Glastech. Ber. 48, 237 (1975).
27. J.-C. Petit, G. Della Mea, J.-C. Dran, M. C. Magonthier, P. A. Mando, and A.
Paccagnella, Geochim. Cosmochim. Acta, 54, 1941 (1990).
28. B. M. J. Smets and M. G. W. Tholen, Phys. Chern. Glasses, 26, 60 (1985).
29. T. Richter, G. H. Frischat, G. Borchardt, and S. Scherrer, Glastech. Ber., 63, 300
(1990).
30. T. A. Wassick, R. H. Doremus, W. A. Lanford, and C. Burman, J. Noncryst. Solids,
54, 139 (1983).
31. S;Dobos, Acta Chim. Acad. Sci. Hung., 68, 371 (1971).
32. F. G. K. Bauke, in Mass 7ransport Phenomena in Ceramics, A. R. Cooper and A.
H. Heuer, Eds., Plenum Press, New York, 1975, p. 337.
33. Z. Boksay and G. Bouquet, Phys. Chern. Glasses, 21, 110 (1980).
34. G. Perera and R. H. Doremus, J. Am. Ceram. Soc., 74, 1554 (1991).
34a. B. A. Fleming, J. Colloid Interface Sci., 110, 40 (1986).
35. K. B. Harvey, C. D. Litke, and C. A. Boase, Phys. Chern. Glasses, 27, 15 (1986).
36. D. E. Clark and B. K. Zoites, Eds., Corrosion of Glass, Ceramics, and Ceramic
Superconductors, Noyes Pub., Park Ridge, N.J., 1992.
37. T. M. El-Shamy, J. Lewins, and R. W. Douglas, Glass Technol., 13, 81, 1972.
38. B. J. Wood and J. V. Walther, Science, 222, 413 (1983).
39. G. S. Wirth and J. M. Gieskes, J. Colloid Interface Sci., 68, 492 (1979).
40. T. H. Elmer and M. E. Nordberg, J. Am. Ceram. Soc., 41, 517 (1958).
41. G. B. Alexander, W. M. Heston, and R. K. Her, J. Phys. Chern., 58, 453 (1954); 61,
1539 (1957).
42. G. Perera and R. H. Doremus, Ceram. 7rans., 20, 41 (1991).
43. J. L. Means, E. D. Spinosa, A. J. Markworth, J. K. McCoy, N. E. Miller, R. E.
Kurth, and H. C. Taylor, Report NUREG/CR-4795, BMI-2143, Battelle, Columbus,
1987.
REFERENCES 239
44. T. L. O'Connor and S. A. Greenberg, J. Phys. Chem., 62, 43 (1958).
45. T. M. El-Shamy, J. Lewins, and R. W. Douglas, Glass Technol., 13,81 (1972).
46. 1. V. Rogogine and L. A. Zayonts, 10th Int. Glass Congr.. Ceramic Soc. Japan,
Kyoto, 1974, p. 9-63.
47. B. C. Bunker, G. W. Arnold, E. K. Beauchamp, and D. E. Day, J. Noncryst. Solids,
58, 295 (1983).
48. F. A. Cotton and G. Wilkinson, Advances Inorganic Chemistry, Wiley, New York,
1988, p. 780.
49. P. V. Brady and 1. V. Walther, Geochim. Cosmochim Acta, 53, 2823 (1989).
50. A. Paul and A. Youssefi, J. Mater. Sci., 13,97 (1978).
51. H. Ohta and Y. Suzuki, Am. Ceram. Soc. Bull., 57, 602 (1978).
52. R. Wollast, P. Brennet, and A. Jelli, Verres Refract., 24 251 (1970).
53. 1. 1. Mazer, J. K. Bates, 1. P. Bradley, C. R. Bradley and C. M. Stevenson, Nature,
357,573 (1992).
54. 1. Moulson and 1. P. Roberts, 7rans. Faraday Soc., 57, 1208 (1961).
55. J. L. Karsten, 1. R. Holloway, and 1. R. Delaney, Earth Planetary Sci. Lett., 59, 420
( 1982).
56. K. E. Lapham, 1. R. Holloway, and 1. R. Delaney, J. Noncryst. Solids, 67,179 (1984).
57. T. A. Abrajano, 1. K. Bates, A. B. Woodland, 1. P. Bradley, and W. L. Bourcier,
Clay Clay Miner., 38, 537 (1990).
58. B. C. Bunker, D. R. Tallant, T. 1. Headley, G. L. Turner, and R. 1. Kirkpatrick,
Phys. Chem. Glasses, 29, 106 (1988).
59. T. Murahami and T. Banba, Nucl. Technol., 67, 419 (1984); 70, 243 (1985).
60. Scientific Basis for Nuclear Waste Management, Vols. I-XV, Materials Research
Society, Pittsburgh, PA, 1976-1992.
61. Nuclear Waste Management, Vol. I, 1984; Vol. II, 1988, American Ceramics Society,
Columbus, OH.
62. 1. S. T. Tsong, C. A. Hauser, W. B. White, A. L. Winterberg, P. D. Miller, and C.
D. Moak, Appl. Phys. Lett., 39, 669 (1981).
63. F. M. Ernsberger, J. Noncryst. Solids, 38-39, 557 (1980).
64. F. Hel/ferich and M. S. Plesset, J. Chem. Phys., 28,418 (1958).
65. R. H. Doremus, J. Phys. Chem., 68,2212 (1964).
66. R. H. Doremus, J. Noncryst. Solids, 19, 137 (1975).
67. R. H. Doremus, J. Noncryst. Solids, 55, 143 (1983).
68. H. H. Dunken and R. H. Doremus, Mater. Res. Bull., 22, 868 (1987).
69. M. Tomozawa and S. Capella, J. Am. Ceram. Soc., 66, C-24 (1983).
70. R. H. Doremus, in Reactivity of Solids, 1. W. Mitchell, R. C. DeVries, R. W. Roberts
and P. Cannon, Eds., Wiley, New York, 1969, p. 667.
71. S. S. Jorgensen,'Acta Chem. Scand., 22, 335 (1968).
71a. R. P. Abendroth, J. Colloid interface Sci., 34, 591 (1970).
72. A. Paul, J. Mater. Sci., 12,2246 (1977).
73. C. M. Jantzen and M. 1. Plodinec, J. Noncryst. Solids, 67, 207 (1984).
240 REACTION OF WATER WITH GLASS
74. E. Marshall, Science, 251, 864 (1991).
75. C. 1. Simmons, H. Sitter, J. H. Simmons, and D. C. Tran. Mater. Res. Bull., 17, 1203
(1982).
76. S. 1. Loehr, K. H. Chung, C. T. Moynihan, G. Fonteneau, P. Chistensen, and 1.
Lucas, Mater. Sci. Forum, 19-20,327 (1987).
77. R. H. Doremus, D. Murphy, N. P. Bansal, W. A. Lanford, and C. Burman, J. Mater.
Sci., 20, 4445 (1'985).
78. C. Burman, W. A. Lanford, R. H. Doremus, and D. Murphy, Appl. Phys. Lett., 44,
845 (1984).
CHAPTER 14
ION EXCHANGE AND POTENTIALS
OF GLASS ELECTRODES
Although glass is not usually thought of as an ion exchanger, many of the
chemical properties of glasses are determined by ion exchange, as shown by the
discussions in the preceding two chapters of hydrogen-alkali ion exchange in
the reactions of water with glass. Ion exchange also gives rise to the potentials
of glass electrodes, and the introduction of larger ions into glass by ion
exchange results in a compressive surface stress, thus strengthening the glass
(see Chapter 9). This chapter contains sections on measurements of the
distribution of ions between glass and solutions, experimental results on
distribution coefficients, theories of the selectivity of anionic groups in glass for
different cations, potentials of glass electrodes, and tests of the ion exchange
theory of glass electrode potentials. My review on ion exchange in glasses 1
should be consulted for more details on earlier work. Hel[erich's treatise on
ion exchange 2 emphasizes work on organic exchangers, but gives some
discussions applicable to glasses.
MEASUREMENT OF IONIC DISTRIBUTION
An ion exchanger can be treated as a separate phase. The exchange of an ion
B in a solution with an ion A in the exchanger (glass) is represented by the
following equation:
A(g) + B(s) = A(s) + B(g)
(1)
where (s) represents the solution and (g) is the glass. At equilibrium the ions
are distributed between the two phases in a fixed ratio. A number of coefficients
241
242 ION EXCHANGE AND POTENTIALS OF GLASS ELECTRODES
have been used to represent this equilibrium, as discussed in Ref. 2, pp. 152 ff.
Here the thermodynamic equilibrium constant K is used whenever possible,
K = a.b g
agb.
(2)
where the lower-case letters represent the thermodynamic activities of the A
and B ions. The absolute value of K depends on the reference functions and
states chosen to define the activities. For aqueous solutions, the most usual
reference state is the concentration at infinite dilution. However, for fused salts,
it is more convenient to use the mole fraction N of a component in the pure
state; that is,
lim !!.. = 1
N-+l N
The latter reference state is also used for the glassy exchang'er in this work. If
the exchanger is homogeneous and has only one type of site, K is constant with
changing composition at constant temperature and pressure. Inhomogeneous
exchangers are considered in refs. 1 and 6.
The value of K reflects the selectivity of the exchanger. It is a quantitative
measure of the preference of the exchanger for one ion over another in solution
with it. The surface potential of a glass electrode also depends on K, as
described below.
Two methods have been used to estimate K in glass. One technique is a
direct measurement of the distribution of ions between the solution and glass;
the second method is an indirect inference of the selectivity of a glass electrode
from measurement of its electrical potential. The first method is preferable and
can be used in a molten salt at higher temperatures, where considerable
exchange takes place. When a glass electrode is used in aqueous solution, the
region of exchange at the glass surface is limited and direct measurement of
ionic concentrations becomes difficult. Therefore, almost all results on equilib-
ria between glass and ions in aqueous solution come from potential measure-
ments.
In making a direct measurement of K for exchange between a molten salt
and a glass, powdered glass can be equilibrated with a salt bath of desired
composition and then analyzed for the exchanging constituents. If the rate of
diffusion in the glass is too slow for a bulk sample, such as a tube or rod, to
come to equilibrium with the melt, it is still possible to find K by measuring
the concentrations of the exchanging ions near the glass surface.!,3 To find the
surface concentration, layers of the glass are etched off with hydrofluoric acid
and analyzed for the exchanging ions. The concentrations are then plotted as
a function of distance from the glass surface and extrapolated back to the
surface. To ensure that the exchange process at the surface has reached
equilibrium, measurements can be made at different times of immersion in the
molten salt.
MEASUREMENT OF IONIC DISTRIBUTION 243
In some glasses such as fused silica the concentration of exchanging ions is
so low that conventional analysis is difficult. In this case it is possible to
calculate the exchange coefficient from the conductivity of the glass in equilib-
rium with melts of different concentration. 4 The total conductivity (1r of the
glass is then made up of contributions from the two ions,
(1r = N"t(1"t + N B (1B
(3)
where (1j is the conductivity of the glass containing only one kind of ion, and
N j is the mole fraction of this ion (N"t + N B = 1). In using this equation, it is
assumed that the total ionic concentration in the glass is constant and uniform,
and also that the mobility ratios of the ions do not depend on ionic
concentration.
If the thermodynamic activities of the ions in the salt are known, tentative
selectivity coefficients K' can be calculated from them and the measurements
of the concentration ratio CBIC"t in the glass:
K' = a,C B
b.C"t
If the K' values are constant with changing solution concentration, the ionic
activities in the glass should be equal to the concentrations, as required for an
ideal solution. If the Ks vary with solution concentration, the pairs of ions in
the glass behave nonideally, and the calculated Ks provide a measure of this
nonideality.
To find exchange coefficients between aqueous solutions and the hydrated
layer on glass, Eisenman measured the uptake of radioactive ions, as described
in Ref. 1, p. 8, and Ref. 5, Chapter 5.
The potential of a glass electrode can also be used to examine the selectivity
of a glass for different ions. The electrical potential V of a glass electrode
immersed in a solution containing A and B ions with thermodynamic activities
a and b is given by (see section on glass electrode below)
V= V o + RJ In {a + K( :: )b} (4)
when the ions in the glass behave ideally (activities can be equated to
concentrations), and their mobility ratio, uBlu"t, in the glass is constant with
composition. In Eq. 4, R is the gas constant, T is the absolute temperature, F
is the Faraday constant, and V o is invariant with the composition of the
solution. The product K(UBlu"t) can be found from measurements of the glass
electrode potential (membrane potential) as a function of ionic activities in
solution. Since it is relatively easy to measure the potential of a glass electrode
in aqueous solution, many such measurements have been 1I1ade, and this
dependence of potential on K has given information on K values in many
systems for which no direct measurements are available. However, there are
unknown factors in the relationship between potential and K, so these results
244 ION EXCHANGE AND POTENTIALS OF GLASS ELECTRODES
must be analyzed carefully. For example, only if values of the mobility ratios
uduj are similar for different pairs of ions for a particular glass, or for the same
ions for different glasses, can relative values of K be deduced from potential
measurements. Such similarities exist for some of the glasses for which
measurement of mobility ratio have been made; however, in other cases large
differences in mobility ratios are found for different ions and different glasses. 6
Many empirical equations have been proposed to describe the variation in
selectivities of ion exchangers with solution concentration. 7 - 9 In the present
notation, the equations are essentially the means for describing the activity
ratio, bg/a g , of the ions in the glass. The most successful of these equations for
a variety of ion exchangers was first proposed by Rothmund and Kornfeld 10:
b g = ( N B ) "
a g N...
where n is a constant, usually equal to or greater than 1, and N i is the mole
fraction of ion i in the exchanger. Eisenman has shown that this equation is
particularly useful for deduction of K from potential measurements. 11 When
(N B/N ...)" is substituted for bg/a g in Eq. 2, a plot of log(b./a.) against
10g(N B/ N ...) is characterized by a slope of n if K is constant with concentration.
This formulation is used here to describe experimental results and is related to
theories of selectivity described below.
(5)
EXPERIMENTAL RESULTS ON DISTRIBUTION COEFFICIENTS
Results of measurements of K values for various glasses are summarized in
Tables 2 and 3. The compositions of the glasses are given in Table 1. Unless
otherwise stated these results were found by analysis of equilibrated glass
powders.
TABLE 1 Compositions of Glasses
C wt.%
A B (Pyrex) D E F G H J K L
Si0 2 69.0 73.0 81 71.5 79.7 66.7 64.1 69.0 31.6 80
B 0 3 0.8 13 75 18.7 11.9
Na 2 0 15.2 15.2 4 25 16.3 11.4 27.0 20.7 20
Li 2 0 11.4 5.9
K 2 0 3.6 0.7
CaO 7.4 4.6
MgO 0.4 3.6 4.1
Al 2 0 3 4.4 1.7 2 16.5 11.5 13.2 5.8 4.0 35.8
Ti0 2 3.8 3.8
Fe 2 0 3 0.4
TABLE 2 Equilibrium Coefficients for Ionic Distribution Between Nitrate Melts and Glasses
Ion in Ion in
Refs. to Solution Glass Temperature
Glass Table 1 (B) (A) eq K n Remarks Refs.
Soda-lime A,B Ag+ Na+ 320 120.0 1.08 From surface 3, 12
conc.
Soda-lime B K+ Na+ 350 0.05 12
Sodium borate D Cs+ Na+ 550 1.5(10) - 3 Ions dilute 13
Sodium borate D Sr 2 + Na+ 550 2(IW in NaN0 3
Sodium borate D Eu 3 + Na+ 550 4(IW
Lithium aluminosilicate E Na+ Li+ 400 0.28 1.9 14
Lithium aluminosilicate E Ag+ Li+ 300 3.2 2.2 14
Sodium aluminosilicate G K+ Na+ 500 0.94 3.2 14
Lithium aluminosilicate F Na+ Li+ 400 0.27 3.2 14
Sodium borosilicate H Ag+ Na+ 300 2.6 1.4 14
Fused silica
(General Electric 204) Ag+ Na+ 337 2.1 1.0 From Eq. 3 15
Fused silica
(General Electric 204) K+ Na+ 823 2.1 From Eq. 3 17
Sodium aluminoborate K Ag+ Na+ 375 79.0 0.71 18, 19
Sodium silicate L Ag+ Na+ 350 50.0 20
Sodium silicate L K+ Na+ 350 0.08 20
Pyrex C Ag+ Na+ 335 1.6 Two Phases 22
Pyrex C K+ Na+ 380 l.l 23
465 1.4
N
".
UI
246 ION EXCHANGE AND POTENTIALS OF GLASS ELECTRODES
TABLE 3 Ionic Radii
Ion Radius (A) Ion Radius (A)
H+ Small
Li+ 0.68 Be 2 + 0.33
Na+ 0.95 Mg 2 + 0.67
Ag+ 1.26
K+ f1.3 3 Ca 2 + 0.99
Rb+ 1.48 Sr H 1.13
Cs+ 1.67 Ba H 1.35
The sequence of preference of soda-lime glass for ions from nitrate melts
(Table 2) is Ag+» Na + > K +. In lithium aluminosilicates, the order is
Ag+ > Li + > Na +, with not nearly so strong a preference for silver. In
borosilicates and fused silica, the preference for silver over sodium is further
reduced.
In chloride melts, the attraction of the glass for silver is dramatically lower,
undoubtedly because of the strong bonding between chloride and silver ions in
the melt. From Stern's work 16 the sequence in fused silica would appear to be
Na+ > Li+» Ag+, but van Reenan et al. 21 found sodium and lithium about
equally favored by fused silica. This difference may result from the use by the
latter authors of a zinc chloride melt, although the size of the difference is
surprising. These authors also found the sequence Li + > K + > Na + for a
soda-lime glass and Pyrex borosilicate glass. One questionable aspect of both
studies of ionic distributions with chloride melts is that the authors apparently
used solution concentrations in calculating their exchange coefficients; that is,
they assumed the solutions were ideal and the activities were equal to the
concentrations. This assumption is probably not valid and it may be respon-
sible for some of the peculiarities of the results.
Results on the exchange of ions in Pyrex borosilicate glass were interpreted
with a two-phase model because the calculated K values were not constant,
nor did they fit Eq. 5, for silver-sodium exchange. 24 This glass separates into
two phases as described in Chapter 4, in agreement with the two-phase model.
Nicolsky et al. have also presented equations for ion exchange with two
different sites in glass. 25 ,26
Eisenman (Ref. 5, Ch. 5) investigated the equilibrium between samples of a
hydrated-soda aluminasilicate glass (glass G, Table 1) and solutions of potas-
sium ions by the method described in the preceding section. He found K values
of 90 and 102 (glass prefers potassium) for two different samples of about the
same composition.
Baucke 27 measured the equilibrium between hydrogen-bearing (hydronium)
ions and lithium ions in a lithium silicate electrode glass. The glass strongly
preferred hydronium ions, with values oflog K of -11.30, -10.60, and -9.88
at 25, 50, and 75°C. Equation 5 fit well at 25°, and progressively less well at
EXPERIMENTAL RESULTS ON DISTRIBUTION COEFFICIENTS 247
high temperatures,28 with n values of 1.61, 1.60 and 1.43 at temperatures of 25,
50 and 75°C.
Since few direct measurements of K with aqueous solutions are available, it
is important to try to supplement these data from estimates of K values from
potential studies. As described above, the product K(uB/u...), where the U is the
ionic mobility, can be calculated from measurements of membrane potentials
across glasses. The utility of this approach is dependent on knowledge of the
value of uB/u.... From measurements of mobility ratios in dry glass, it seems
likely that certain generalities about the properties of this ratio can be made.
For example, the mobility ratios of sodium to potassium ions seem to be
about the same in a variety of glasses whose only univalent cation is sodium
(soda glasses). In lithia or potash glasses, this ratio is lower than in soda
glasses. Thus the selectivity of different glass electrodes made of sodium
silicates may be compared, but comparisons of these with glasses containing
lithium or potassium ions should be less reliable. These conclusions are based
on mobility measurements in dry glasses; mobilities in hydrated glasses are
much higher, and it is quite possible that some of the differences in mobility
ratios found in dry glass are reduced in hydrated glasses. A more definitive
analysis awaits further mobility measurements on hydrated glasses.
Results of numerous measurements of selectivities of glass electrodes for ions
in aqueous solution, mainly in connection with the "alkaline error" of pH
electrodes, are reviewed in Ref. 5, particularly Chapters 3, 6, 7, and 9. Since
most of these measurements were not specifically designed to examine the role
of glass composition, discussion of this work is limited to the extensive
experiments of Eisenman. 11
In Eisenman's experiments the conditions on one side of the glass were held
constant. The potential on this side of the glass, the electrode potentials, and
junction potentials of salt bridges are constant with changing ionic concentra-
tions and contribute only to Yo, so the experiments should provide a measure
of the product K(uB/u...). For an ideal solution in the glass, Eq. 4 applies. If the
glass is not ideal and the activities are given by Eq. 5, the potential is (see
section on electrode potentials below)
v = V o + n T In {a 1/n + [ K"' B (:: ) b J/n}
Since hydrogen ions are always present in aqueous solution, Eisenman
measured the selectivities of the glass for alkali ions by determining the
potential as a function of pH for a constant concentration (0.1 M) of alkali
cation B. At higher pH the potential becomes constant because the glass is
sensitive only to the alkali ion; the difference between this constant potential
and one at a pH where the glass is sensitive only to hydrogen ions is equal to
(R T/F)[ln KHB(UB/U",)]. If ion B is different from the alkali ion in the glass
(usually sodium), the system contains three cations. However, as long as this
ion is not in the solution, it contributes only a constant additional diffusion
potential to V o and does not affect this method of calculating KHB(UB/U...). The
(7)
248 ION EXCHANGE AND POTENTIALS OF GLASS ELECTRODES
selectivity of the glass for any pair of ions can be found from the results of these
measurements, since
K AB ( U B ) = KHB(UB/U H )
U A KHA(UA/UH)
Results of this kind are presented schematically for a variety of glasses in
Fig. 1, taken from Ref. 11. The results are plotted in terms of the sodium-
potassium selectivity of the glasses, therefore the abscissa is In KNaK(UK/UN.J,
and the ordinate is the same term for any pair of ions, ij, In KjiU j/Uj). At the
right of the figure, the lines are plotted in terms of the cesium-potassium
selectivity. Although the data scatter considerably, a definite qualitative pattern
in the selectivity of the ions emerges. Eisenman analyzed these patterns into the
11 sequences shown in Fig. 1. The data in the figures fit almost entirely into
these few sequences, out of the 120 (5!) that are possible for the five ions. Thus
the sodium-potassium selectivity provides a basis for estimate of the selectivity
sequences of the glass.
The selectivity sequences are related in a definite way to the composition of
the glass. For example, data for silicate glasses without boron and aluminum
fall off Fig. 1 to the left, whereas the borosilicates fall to the right of the
figure. In the sodium aluminosilicates, the important factor determining
selectivity is the sodium/aluminum atom ratio. The theoretical significance of
these results is discussed below.
2
x
VII. VI.
IX VII:'\ V
4
2. 0
"
')(e.-
-2
-4
3
Fig. 1 Selectivity of sodium aluminosilicate glasses for monovalent cations. The roman
numerals refer to selectivity sequences. A particular glass composition would be
represented by a vertical line on the figure. From Eisenmann,u
SELECTIVITY THEORIES 249
Other monovalent ions, such as silver, thallium, and ammonium, seem to fit
into the selectivity sequences in a regular way.29
Values for n from Eq. 5 and the potential data for hydrogen-alkali ion pairs
were found to depend on the glass composition, and strongly on the cation,
being higher (up to 6 for cesium) the larger the cation.
SELECTIVITY THEORIES
The simple empirical relation of Eq. 5 between activity and concentration of
ions in the glass fits data on many different types of ion exchangers. 8 ,9 Garrels
has shown that this description is related to the solution theory of binary
mixtures. 1.30
One of the simplest models of a binary solution results from quasichemical
or nearest-neighbor assumptions about bonding in the solution. Somewhat
more generally one can define a simple mixture as one that has a molar Gibbs
free energy of mixing L1G", with the composition dependence. 31
L1G", = -EN...N B + RT(N... In N... + N B In N B )
where E is a net interaction energy that can depend on temperature, but not
composition, and the N's are the mole fractions. In terms of positive bond
energies U,E = U AB - (U AA + U BB )/2. The second term results from the ideal
entropy of mixing expression. From this equation, the activity coefficients
gamma of the two components are given by31
In Y... = -ENi;RT
In YB = -EN /RT (8)
Here the reference state for activity is pure A for component A and pure B for
B. Then the ratio of the activity coefficients is
In Y... = E(N - Ni) = E(N... - N B )
YB RT RT
To compare this with Eq. 5, it is assumed that the solution theory can be
applied to the glass being considered as a rigid matrix with a mixture of A and
B ions on the anionic sites. From Eq. 5,
Y... ( N ... )
In - = (n - 1) In -
YB N B
If the logarithm is expanded,
( N... ) [ ( N... - N B ) 3 ( N... - N B ) 5 ]
In N B = 2 (N... - N B) + 3 + 5 + ..,
For N... between 0.1 and 0.9, where most ion-exchange data are obtained, only
250 ION EXCHANGE AND POTENTIALS OF GLASS ELECTRODES
the first term in the brackets is important. A comparison of the two earlier
equations gives
E
n = 1 + 2R T
Thus the empirical Eq. 5 of Rothmund and Kornfeld has the same form as is
derived from the simple solution model. When one or the other component is
very dilute, the n representation of Eq. 5 is unrealistic for an exchanger with
identical sites, since it requires the activity coefficient of the dilute component
to be a function of its concentration even at great dilution. Under these
conditions the simple solution equations should be used, but at intermediate
compositions the simple n equation is often more convenient.
In the nearest-neighbor solution model a positive value of E denotes a net
attraction between unlike atoms, whereas a negative value indicates repulsion.
Since Eisenman,11 Garfinkel,14 and Baucke 27 found n values greater than or
equal to 1, their deviations from ideality in glasses were caused by attraction
of the alkali and hydrogen ions. One would expect that as the size difference
between the exchanging ions becomes greater, the nonideality or n value
should become greater; this functionality was found, except for sodium-
hydrogen exchange, which is nearly ideal (n ::::: 1) for all glasses studied. Glasses
with small selectivity between ions were closer to ideal than those with greater
selectivity, possibly because the former are more hydrated. From this simple
model one would expect more ideal behavior as the site density decreased;
however, Fig. 5 of Ref. 11 does not seem to show any such dependence.
Apparently the deviations from ideality depend on several factors in a
complicated way.
The data of Eisenman, summarized in Fig. 1, show that the selectivity of
glasses for ions has a definite dependence on the composition of the glass. The
most important factor in this dependence is the type of anionic site in the glass.
Thus the alkali silicate glasses containing no other glass former than silica
show sequences X or XI (Fig. 1), with a strong preference for hydrogen and the
smaller alkali ions. With aluminum or boron in the glass, however, the
sequence is different and depends in a regular way on the glass composition.
Eisenman proposed the following theory, based on the structure of the anionic
sites in the glass, to explain these dependences. ll
The SiO- anionic groups are more compact (the negative charge is less
"spread out") than for the AIOSi - site. Therefore the field strength, or
attractive force for cations, is greater for the SiO - site, giving it a smaller
equivalent anionic radius. The interaction energies of these sites with alkali
cations were calculated by Eisenman with a simple electrostatic model and
compared to the free energies of formation of the hydrated ions in aqueous
solution. 11 The SiO - site showed the selectivity pattern XI, whereas the
AIOSi - site showed pattern I. It is therefore clear qualitatively why the glasses
with only SiO- sites prefer small ions, whereas the AIOSi - sites (and similarly
the BOSi - sites) tend to show a preference for larger ions. Eisenman defined
(9)
SELECTIVITY THEORIES 251
the equivalent anionic radius of a site to be the radius which yields the same
electrostatic energy with each cation as does the actual site. On this basis the
silicate site has an effective radius of about 0.9 A, whereas the aluminosilicate
site has one of about 2.0 A.
It is also possible to estimate the effective anionic radius of a group from
the dissociation behavior of an acid containing it. For example, Eisenman
observed that silicic acid is very weak, whereas the aluminosilicate group gives
a strong acid. He calculated anionic radii comparable to those of the preceding
paragraph by comparing the dissociation constants of these groups with those
of halide acids. ll Boric acid is quite weak, so the selectivity of sodium borate
glass should be similar to that of sodium silicate glass. The attraction of borate
glass for higher valent ions, as opposed to the behavior of silicate glasses, may
possibly result from a shorter distance between neighboring anionic groups in
the former. This behavior is also found in amorphous and polymeric phos-
phates. In borosilicates, on the other hand, the BOSi - group appears to be
similar to the AlOSi - group.
Nicolsky et al. 26 showed that both the SiO - and AIOSi - sites contribute to
the potentials measured in glass electrodes made with sodium aluminosilicate
glasses containing less than about 3 wt% A1 2 0 3 ; however, above this compo-
sition only the AIOSi - sites seem to be effective. In hydrated glass the SiO-
site has H +, rather than N a +, associated with it. Apparently the presence of
the AlOSi - sites supresses exchange of other ions with the SiO - H + site or, in
terms of Eisenman's model, increases the field strength of the silica site.
In comparing experimental data derived from electrode potentials with the
calculations, the effect of changes in mobility ratio has been completely
ignored. As mentioned previously, this assumption may be reasonable for
certain groups of glasses, for example, for sodium silicates, but is uncertain for
others. The qualitative success of Eisenman's considerations indicates that in
hydrated glasses the equilibrium selectivity effects are possibly larger than
changes in mobility ratios. In a more refined treatment, however, these changes
in mobility ratio must be taken into account.
Eisenman's selectivity theory can also be applied to the results on distribu-
tions between glass and fused salts, although in this case data are not available
for hydrogen, rubidium, or cesium ions. The strong selectivity of soda-lime
glass for sodium over potassium results from the small anionic radius of the
SiO- groups, just as for hydrated glasses. Silver is anomalous for its size
because of its strong polarizability, which causes it to be attracted strongly by
the SiO- anion.
In the aluminosilicates, the preference for silver is reduced because of the
larger anionic radius of the aluminosilicate group. The selectivity of sodium
over potassium found in the soda-lime glasses is lost, although the smaller
lithium ion is still preferred over sodium. In the borosilicate phases there is
little selectivity between silver, sodium, and potassium ions, again reflecting the
larger anionic size of the borosilicate groups. In fused silica, the monovalent
ions are associated with the alumina groups in the glass, so a greater relative
252 ION EXCHANGE AND POTENTIALS OF GLASS ELECTRODES
attraction of these groups for lithium than for sodium, and little selectivity
between sodium and silver, is reasonable. In a sodium aluminoborate glass
with no non bridging oxygens, as determined for XPS spectra (see Chapter 12),
silver from silver nitrate was still strongly preferred by the glass to sodium 18 ,19
(see Table 1). However, in this glass the n value was less than 1, in contrast to
all other results on silicate glasses. This result suggests that the silver and
sodium ions in the glass have a net repulsion, rather than the net attractior.
found in all other ion exchange pairs. Surprisingly the silver-sodium equilib-
rium data fit the un" equation 5 better than the full quasichemical expression,
suggesting some strange behavior at both high and low silver concentrations
in the glass.
Recent interest in new optical components such as gradient index lenses and
optical waveguides has led to ion exchange as a method of introducing a
gradient of refractive index in the surfaces of these optical components. This
interest has led to a large number of papers in this area, which is discussed in
Chapter 17. Introducing silver by ion exchange is attractive because silver
changes the refractive index substantially, because of its high polarizability. In
exchange with nitrate melts, the preference of the glass for silver is an asset for
these applications (see Refs. 49 and 50 and other references in these papers and
in Chapters 15 and 17).
POTENTIALS OF GLASS ELECTRODES
Until the 1960's the origin of potentials in glass electrodes was not well
understood. However, recognition that the glass electrode is analogous to an
ionic membrane, and studies of ionic behavior in glass in both aqueous
solution and fused salts, have led to clarification of this problem. The historical
development of the understanding of glass electrode potential is summarized
in Ref. 5, Chapters 3 and 5, and Ref. 29. The treatment of the ion exchange
theory given here is taken from Chapter 4 of Ref. 5, to which the reader is
referred for further details.
The experimental arrangement that is used to measure electrode potentials
is shown schematically in Fig. 2. A thin piece of glass separates two sources of
ions. These sources could be gases, liquids, or solids; however, only two types
of sources have been studied: aqueous solutions and mixed fused salts. These
sources are referred to as solutions. A reference electrode is placed in each
solution, and the total potential between these electrodes is read by an external
instrument, such as a potentiometer or electrometer.
Two types of measurements are of interest here. In the first type, the
conditions in solution 2 are held fixed, and the potential is varied by changing
the conditions in solution 1. The potential between reference electrode 1 and
solution 1 must also be constant under these changing conditions. Then the
only changes in the system occur at the solution I-glass interface. No attempt
is made to interpret the absolute value of the potential measured; only its
POTENTIALS OF GLASS ELECTRODES 253
GLASS
REFERENCE
ELECTRODE
1
REFERENCE
ELECTRODE
2
SOLUTION 1
SOLUTION 2
Fig. 2 Schematic diagram of a cell used to measure potential in glass.
changes with respect to an arbitrary value are considered. This is the type of
measurement made in conventional pH meters and in most measurements of
the concentrations of other ions with a glass electrode. In the pH application
the glass is formed into a bulb, with solution and reference electrode 2 on the
inside and solution and electrode 1 outside. Reference electrode 2 is usually a
calomel or silver-silver chloride electrode, and solution 2 a buffered chloride
solution. 32 Reference electrode 1 can be a calomel electrode connected to
solution 1 by a saturated potassium chloride salt bridge. Under these condi-
tions, variations in the pH of solution 1 change the total cell potential by
changing the conditions at the solution-glass interface.
In a second type of measurement, the absolute value of the cell potential is
studied. Usually solvents 1 and 2 are the same, and the reference electrodes are
also the same, therefore their potentials cancel or are calculable. Then the total
membrane potential (measured directly or calculated) is that caused by
different ionic concentrations in solutions 1 and 2, giving rise to different
conditions at the the two solution-glass interfaces.
The total membrane potential V of a glass electrode can be separated into
two additive parts: the boundary or surface potential V. and the diffusion
potential YD' To interpret measurements of the membrane potential, equations
for both V. and V D are necessary. First the equations for the surface potential
are described.
Consider an ionic solute in two different phases at constant temperature and
pressure. If both positive and negative ions can exchange between the two
phases, considerations similar to those for a molecular solute apply. However,
if only ions of one sign can exchange between the two phases as with silicate
254 ION EXCHANGE AND POTENTIALS OF GLASS ELECTRODES
glasses, electrical fields can arise. At equilibrium between the two phases the
total (or electro-) chemical potentials Jl of the exchanging cations in them must
be equal. However, this equality cannot be achieved by gross changes of the
cation concentration in the glass because the concentration is fixed by the
number of anionic groups in the glass network. As the cations leave or enter
the glass, giving an excess or deficient total charge, an electrical-potential
difference between the two phases builds up. At equilibrium this electrical-
potential difference (x' - X") just balances the difference in thermodynamic
activity of the cations between the two phases. In equation form,
Jl' - Jl" = <p' - <p" + RT In (::, ) + Z(x' - X")F = 0
where F is the Faraday constant, Z is the valence (assumed to be + 1) of the
exchanging ions, <p is a function of temperature only and is often called the
standard chemical potential, and one prime represents the solutions and two
primes the glass.
In the experimental arrangement of Fig. 2, an equation of this type applies
to both solution-glass boundaries, so the overall boundary potential V. for the
presence of one cation is
V. = ( , _ " ) _ ( , _ II ) = [(<P'l -<P'1)-(<P'2 <P2)] + ( RT ) In ( a'l a 2 ) (10)
. X 2 X2 X 1 Xl F F a2 a 'i
where solution 2 is considered positive.
If the glass is uniform and homogeneous, <p'i = <P2 and a'i = a2' If both
solvents are the same and the same reference state for activity of the ion is used
for them, then <P'l = <P2, and
v. = (R; ) In (:D
(11)
so that the boundary potential is a direct measure of the activity ratio of the
exchanging ion in the two solutions. In the normal use of glass electrodes, the
conditions in solution 2 are held constant, and the relative variation of V. then
measures the activity of the ion in solution 1. If only one ion is present, there
is no diffusion potential in the glass.
Purists may object to the individual ionic activities used in the above
derivation, since they cannot be measured separately. However, if other
components are carried along throughout the derivation, the results are the
same. Only ratios of ionic activities, which can be measured, appear in the final
results. A further discussion of this point is given by Helfferich (Ref. 2, pp. 140
369 ff.).
From Eq. 2, for both surfaces 1 and 2,
a' (a' + Kb')
a" = (a" + b")
POTENTIALS OF GLASS ELECTRODES 255
so from Eq. 10 the bounday potential is
RT ( a'l + Kb'l a'{ + b'{ )
v. - In - In
· F a2 + Kb 2 a2 + b ' 2
If the sum of the activities in the glass is the same at both surfaces, the total
boundary potential is related to the solution activities by
V. ( R T ) I [ (a'1 + Kb I 1 ) ]
· F n (a ' 2 + Kb 2 )
(12)
However, if Eq. 5 is followed and n is not unity, the sum of the activities at the
two faces is generally not the same, and the second term must be retained. An
alternative form for this case is given by Eisenman,ll and also below (Eq. 17),
including the diffusion potential.
In the limit of small concentrations of either A or B in both solutions, Eq.
12 goes to Eq. 11. Similar, but more complicated expressions, are valid when
more than two ions exchange.
Now equations for the diffusion potential are derived from the Nernst-
Planck equations for interdiffusion of two ions, as described in Chapter 15.
From Eq. 19, Chapter 15, the electrical field set up when two monovalent ions
interdiffuse is
E= RT UB-U.. 8c..8Ina.. (13)
F c..u.. + CBUB 8x8lnc..
and the diffusion potential V D is, again considering solution 2 positive,
V D = f 2 Edx = RT f CA (2) (UBU,,) - 1 8 In a.. dc.. (14)
1 F CA(1) CB(UB/U..) + c.. 8 In c..
Therefore the diffusion potential depends only on the ionic concentrations at
the two surfaces c..(2) and c..(I), the mobility ratio uB/u.., and the ther-
modynamic factor 8Ina../81nc... The latter can be written
8 In a.. = 1 + ( C.. ) ( 8 Y ,, )
8 In c.. Y.. 8c ..
since the activity coefficient Y is defined by a yc. Therefore this term measures
the change in activity coefficient with concentration; if this coefficient is
constant, the term is unity. If the ion exchange follows Eq. 5, and a constant
mobility ratio, Eq. 14 can be integrated to
V D = nRT In c..(2) + c B (2Xu B/ U ,,)
F c..(1) + CB(1XUB/U..) (15)
where use is made of the constancy of the total ionic concentration c.. + CB'
The diffusion potential can be related to the ionic concentrations in the
256 ION EXCHANGE AND POTENTIALS OF GLASS ELECTRODES
external solution through the coefficient K of Eq. 2. For the same solvent in
the two solutions and n = l(a"/b" = c.../c B ), the result is 33
V. - RT [ I a2 + K(u B /u...)b'2 I a2 + Kb 2 ]
D-- - n + n
F a'l + K(UB/U...)b'l a'l + Kb 2
The total membrane potential V for n = 1, including both boundary and
diffusion contributions, is the sum of Eqs. 12 and 16 (see Ref. 33):
V = RT In at + K(u B /u...)b'l
F a2 + K(u B /u...)b'2
(16)
(17)
If the mobility ratio and thermodynamic term are functions of concentra-
tion, Eq. 14 cannot be integrated without knowledge of this functionality.
However, even in this case the potential V D is not a function of time, but only
of the surface concentrations, for a given dependence of the mobility ratio and
thermodynamic term on ionic concentration. Therefore as soon as equilibrium
between the solutions and glass surfaces is established, the diffusion potential
is fixed and does not change with time, independent of the concentration
profile of diffusion ions in the glass. The diffusion potential should change with
time only if there is some change in structure of the glass with time or position,
giving changes of mobility ratio or thermodynamic factor with time and
position. Examples of this kind of change are progressive hydration of the glass
in contact with water, internal variations in the glass structure, and stress
changes in the glass.
Various complications in potentials of glass electrodes are treated in the
following references: multicationic systems (Refs. 6 and 34); pressure or stress
gradients (Ref. 6); inhomogeneous glass (Refs. 6 and 34); and phase separation
(Ref. 35).
EXPERIMENTAL MEASUREMENTS OF POTENTIALS
OF GLASS ELECTRODES
A vast number of measurements of potentials of glass electrodes have been
made, with objectives ranging from the development of practical analytical
tools to the understanding of theories for the electrode potential. Earlier
measurements are reviewed in Refs. 5, 32, 36 and 37. In this section, a few more
recent measurements of special kinds are singled out for comment.
Changes of glass electrode potentials and electrical resistance in aqueous
solutions as a function of time have been measured under a variety of
conditions. 38 - 40. These experiments are important in determining the time
required before the electrodes are acceptably stable. Response times for glass
electrodes have also been studied. 4 1.42
The selectivity of Pyrex electrodes to various ions in fused nitrate has
been deduced from their potentials,43.44 and a selectivity sequence of
EXPERIMENTAL CONFIRMATION OF POTENTIAL EQUATIONS 257
Na+ > Ag+ > Li+ > K+ > NH: TI+ was found. However, these results
represent changes in the product K(UB/U A ) and not in K itself, since the
mobility ratios were not measured. These ratios can be quite different from
unity in dry glass, so the above sequence must be considered tentative.
Furthermore, ionic activities in molten ammonium nitrate, which was used as
a solvent in some experiments, were not measured, leading to further uncer-
tainties in the meaning of the selectivities found.
EXPERIMENTAL CONFIRMATION OF POTENTIAL EQUATIONS
Many theories, in addition to the ion exchange theory given above, have been
suggested to explain the origin of potentials of glass electrodes. 29,36,37,45.46
Dole classified the theories into phase-boundary, ion-adsorption, and diffusion-
potential categories. In virtually all of t ese theories, it is found that the
potential V of a glass electrode when it is sensitive to only one ion A is given by
RT
V = V o + F In a. (18)
where V o is independent of concentration, and a. is the activity of the ion in
solution in contact with the electrode. This equation is the same as Eq. 11 with
V o = - R T/2 Fin a2' V o can be different from this value if electrode compart-
ment 2 has different conditions (for example, if different ions are in it), but as
long as conditions in this compartment are held constant, V o will be constant.
In this single-ion case there is no diffusion potential. A large number of results
agree with Eq. 18; for example, pH measurements with a glass electrode.
When another ion B also has influence on the potential, the following
equation is derived in most theories when the glass phase is ideal (ions have
constant activity coefficients in it):
V = V o + R: In (a. + K'b.)
(19)
where b. is the activity of B in the solution, and K' is a coefficient independent
of ionic concentration. This equation has the same form as Eq. 17 with
conditions constant in one compartment and K' = K(UB/U A ). If the glass is not
ideal, but activities in it are given by Eq. 5, then the potential is given by Eq. 7.
Several investigators have found agreement between Eq. 19 and data on
electrode potentials and claimed this agreement was proof of the theory they
espoused. However, since different theories can lead to Eq. 19, it is essential to
test values of K' with independent data to decide which theory is preferable.
Only a few such tests have been made. In the ion exchange theory derived
above, K' = K(UB/U A ), the product of the equilibrium distribution coefficient
and the mobility ratio of the ions.
Eisenman measured the potentials of hydrated glass electrodes selective to
258 ION EXCHANGE AND POTENTIALS OF GLASS ELECTRODES
sodium and potassium ions in aqueous solutions of these ions (Ref. 5, Chapter
5) and calculated values of K(UB/U A ) from these measurements. He also
measured the mobility ratio and distribution coefficient independently from the
penetration of radioactive tracer ions into the hydrated layer. The product
K(UB/U A ) calculated in these two different ways was nearly the same, confirm-
ing the ion exchange theory for hydrated glass electrodes in aqueous solution.
The ion exchange theory was tested for dry fused silica electrodes immersed
in molten nitrate mixtures at 333°C. 4 Again Eq. 19 was obeyed for the
membrane potentials, from which K' = 0.18 was calculated for sodium-silver
nitrate ion solutions. The ratio of silver-to-sodium mobility was found to be
0.073 from the conductivities of the glass containing only one ion or the other,
and K was measured from electrolysis experiments, as described in the first
section, and was found to be 2.1, giving K' = 0.15 in good agreement with the
value measured from membrane potentials. Thus the ion exchange theory is
judged to be valid in this case also.
Measurements of K' for Pyrex glass tubes immersed in molten nitrates have
also been made;23.J5 however, the two-phase behavior of this glass complicates
interpretation of the results. For concentrations of silver nitrate above about
10%, K' was calculated to be about 1.1 from measurements of the membrane
potential, although these were deviations of up to 10 m V from the expected
potential. 35 In this range of melt concentrations, K :::::: 2.0, and the mobilities of
silver and sodium were about equal, giving K' = 2. This agreement within a
factor of two is further evidence for the validity of the ion exchange model.
Garfinkel measured membrane potentials, mobility ratios, and distribution
coefficients for sodium-potassium nitrate melts exchanging with Pyrex
glass. 14 . 23 ,47 He found evidence for change in individual ionic mobilities as
a function of concentration, as well as other concentration dependencies
resulting from the two phases, and thus was unable to make an exact
comparison between his result and the ion exchange theory.
van Keenan et al. 21 measured membrane potentials of glass electrodes in
zinc chloride melts containing sodium and lithium ions. Their results for ionic
distribution coefficients and mobility ratios were derived from electrolysis
measurements, and were somewhat uncertain because they did not take
account of activity coefficient changes in the melt, as mentioned above.
Furthermore, they neglected the two-phase nature of the glass. Nevertheless
they achieved reasonable agreement between measured potentials and those
calculated from the mobility ratio, which was a function of ionic concentration
in the glass, and distribution coefficients. It seems likely that compensating
errors in measurements of mobility ratios and distribution coefficients were at
least partly responsible for this agreement, since the authors reported that these
two factors seemed to be related and not independent. In spite of these
uncertainties these results provide further evidence that the ion exchange
theory is valid for glass electrodes.
Tadros and Lyklema found that the surface charge of hydrated sodium-
EXPERIMENTAL CONFIRMATION OF POTENTIAL EQUATIONS 259
sensitive glass electrodes in solutions of various alkali chlorides was the same
for several different cations (lithium, sodium, potassium, cesium, and tetraethyl
ammonium).48 The surface charge at a certain pH was calculated from the
amount of acid or base that had to be added to a solution plus powdered glass
to reach this pH, less the amount that had to be added to the same solution
without glass to reach the desired pH. Thus the surface charge was actually a
measure of the adsorption of monovalent cations on the surface, associated
with the negatively charged SiO groups (see the section on adsorption from
solution, 1st edition). These authors concluded that the surface potential JI,; for
all these ions was the same, since the affinity of the hydrated layer for the ions
was the same. They therefore concluded that the value of K (with respect to
hydrogen ion) for all these cations was the same, and differences in the
selectivity of the glass resulted entirely from different mobility ratios and
diffusion potentials, and not from differences in surface potentials. Such a result
is not inconsistent with the ion exchange theory, but is contrary to Eisenman's
finding that mobilities of sodium and potassium ions in the hydrated layer
differed only by factors of five to twelve, and that most of the selectivity of these
electrodes resulted from different K values and surface potentials.
The resolution of this discrepancy may reside in the distinction between
adsorption just at the glass surface and the selectivity of groups inside the
hydrated layer. The experiments of Tadros and Lyklema measured adsorption
at the outermost portions of the glass surface, since in their experiments there
was insufficient time for interdiffusion of ions very far into the hydrated layer.
On the other hand, the equilibrium membrane potential of a glass electrode in
a solution of two ions, both of which are present in appreciable amounts in the
hydrated layer, results from. the selectivity of the bulk of the hydrated layer,
not from its surface groups. A longer time is required for these ions to
interdiffuse and equilibrate s.ome appreciable distance (several molecular
layers) into the hydrated layer than for adsorption at its outer surface. This
requirement for longer equilibration time is not contradicted by the rapid
response time of a glass electrode in solutions of ions that the electrode selects
strongly, for example, in pH electrodes. In this case the surface is saturated with
the ion to which the electrode is responding, and when the concentration of
this ion in solution changes, the electrode potential changes rapidly because no
interdiffusion in the hydrated layer is necessary for establishment of the
characteristic membrane potential. Thus Tadros and Lyklema were measuring
selectivities of the outermost surface SiO groups for hydrated ions in solution,
which can be very different from the selectivities for the un hydrated ions in the
bulk of the hydrated layer on the glass.
Different amounts of surface adsorption do not affect overall membrane
potentials as long as the adsorbed layer is in equilibrium with both the glass
exchanger (hydrated layer) and the surrounding solution. If the adsorbed layer
is at equilibrium, it can have no concentration gradients and therefore no
diffusion potential, and this layer will contribute no additional phase boundary
260 ION EXCHANGE AND POTENTIALS OF GLASS ELECTRODES
potential to the measured membrane potential, since the electrochemical
potential of ions at the membrane surface will still equal their potential in
solution.
The insensitivity of membrane potential to surface adsorption was shown by
experiments on fused silica membranes. 28 If the silica surface was treated with
nitric acid its surface was highly hydrated, and it strongly adsorbed silver ions
from nitrate melts containing silver ions; as shown by radioactive tracer
measurements. When the silver surface was treated with dilute hydrofluoric
acid, the hydrated layer was removed, and the adsorption of silver was
negligible. However, in both these samples, the measured membrane potential
was the same for the same contacting solutions, as was the coefficient K.
Baucke 46 put forward a theory of glass electrode potential that he describes
as including a "dissociation mechanism". In this theory the equilibrium of ions
at the glass surface (Eq. 12) is included, but not the diffusion potential. In his
words: "Particularly, the correct pH response of protonated glass electrodes in
alkali-free solutions excludes mechanisms which are based on an exchange of
different ions between glass and solution, e.g. as assumed for the ion exchange
theory." To the contrary, the above treatment shows that the internal diffusion
potential must be included, even if there are alkali ions in solution. The ion
exchange theory has been established to hold for glasses experimentally;4,5 the
mobility ratio or internal diffusion potential must be included to obtain
agreement between theory and experiment. Diffusion potentials also occur in
organic ion exchange membranes; these potentials must be included to obtain
experimental and theoretical agreement for these membranes (Ref. 2, p. 377 ff).
REFERENCES
1. R. H. Doremus, in Ion Exchange, 1. Marinsky, Ed., Marcel Dekker, New York,
1969, p. 1.
2. F. Helfferich, Ion Exchange, McGraw-Hili, New York, 1962.
3. G. Schulze, Ann. Phys., 40, 335 (1913).
4. R. H. Doremus, J. Phys. Chern., 72, 2877 (1968).
5. G. Eisenman, Ed., Glass Electrodesfor Hydrogen and Other Cations, Marcel Dekker,
New York, 1967.
6. R. H. Doremus, in Glass Electrodesfor Hydrogen and Other Cations, G. Eisenman,
Ed., Marcel Dekker, New York, 1967.
7. F. Helfferich, Ion Exchange, McGraw-Hili, New York, 1962. pp. 193 ff., where there
are other references.
8. H. F. Walton, in Ion Exchange, Theory and Application, F. C. Nachod, Ed.,
Academic Press, New York, 1949, p. 1.
9. E. Hogfeldt, Acta Chern. Scand., 9, 151 (1955).
10. V. Rothmund and G. Kornfeld, Z. Anorg, AUg. Chern., 103, 129 (1918); 108, 215
(1919).
REFERENCES 261
11. G. Eisenman, Biophys. J., 2, 259 (1969).
12. R. H. Doremus, unpublished work.
11 M. H. Rowell, J. lnorg. Chern., 4, 1802 (1965); 5, 1828 (1966).
14. H. M. Garfinkel, J. Phys. Chern., 72, 4175 (1968).
15. R. H. Doremus, Phys. Chern. Glasses, 10,28 (1969).
16. K. Stern, J. Phys. Chern., 74, 1323 (1970).
17. O. R. Flinn and K. H. Stern, J. Phys. Chern., 76, 1072 (1972).
18. C. Kaps and W. Fliegel, Glastech. Ber., 64, 199 (1991).
19. C. Kaps, Glastech. Ber., 64, 235 (1991).
20. V. V. Moiseev, J. Noncryst. Solids, 42, 589 (1980).
21. T. H. van Reenan, M. Niekerk, and W. J. deWet, J. Phys. Chern., 75, 2815 (1971).
22. R. H. Doremus, Phys. Chern. Glasses, 9, 128 (1968).
23. H. M. Garfinkel, J. Phys. Chern., 73,1766 (1969).
24. R. H. Doremus, J. Phys. Chern., 72, 2665 (1968).
25. B. P. Nicolsky and T. A. Tolmacheva, Zh. Fiz. Khirn., 10, 504 (1937).
26. B. P. Nicolsky, M. M. Schulz, E. A. Materova, and A. A. Balijustin, Akad. Nauk
SSSR, 140, 641 (1961).
27. F. G. K. Baucke, in The Physics of Noncrystalline Solids, G. H. Frischat, Ed., Trans.
Tech., Aedermannsdorf, Switzerland, 1977, p. 501
28. R. H. Doremus, unpublished.
29. G. Eisenman, Adv. Anal. Chern. lnstrurn., 4, 305 (1965).
30. R. M. Garrels and C. L. Christ, Solutions, Minerals, and Equilibria, Harper and
Row, New York, 1965, pp. 272 If.
31. C. H. P. Lupis, Chernical Therrnodynarnics of Materials, North-Holland, Amster-
dam, 1983, p. 235 If.
32. R. G. Bates, in Reference Electrodes, D. 1. G. Ives and G. J. Janz, Eds., Academic
Press, New York, 1961, p. 231.
33. G. Karreman and G. Eisenman, Bull. Math. Biophys., 24,413 (1962).
34. F. Conti and G. Eisenman, Biophys. J., 5, 247 (1965).
35. R. H. Doremus, J. Elect. Soc., 115, 924 (1968).
36. M. Dole, Glass Electrode, Wiley, New York, 1941.
37. K. Schwabe and H. D. Suschke, Angew. Chern., 76, 39 (1964), and earlier papers by
Schwabe and co-workers.
38. M.1. D. Brund and G. A. Rechnitz, Anal. Chern., 41,1788 (1968).
39. R. P. Buch, J. Electroanal. Chern., 18, 363 (1968).
40. A. Wikby and G. Johansson, J. Electroanal. Chern., 23, 23 (1969); 33, 145 (1971).
41. G. A. Rechnitz and G. C. Kugler, Anal. Chern., 39, 1682 (1967).
42. A. E. Bottom and A. K. Covington, Anal. Chern., 24, 251 (1970).
41 N. Notz and A. G. Kennan, J. Phys. Chern., 70, 662 (1966).
44. A. G. Keenan, N. Notz, and F. L. Wilcox, J. Phys. Chern., 72, 1085 (1968).
45. M. Dole, J. Arn. Chern. Soc., 53, 4620 (1931).
46. F. G. K. Baucke, J. Noncryst. Solids, 73, 215 (1985); 129, 233 (1991).
262 ION EXCHANGE AND POTENTIALS OF GLASS ELECTRODES
47. H. M. Garfinkel, Phys. Chern. Glasses, 11, 151 (1970).
48. 1. F. Tadros and 1. Lykelema, J. Electroanal. Chern., 22, 9 (1969).
49. S. N. Houde-Walter and D. T. Moore, Appl. Opt., 25, 3373 (1986).
50. T. Poszner, G. Schreiter, and R. Mulli, J. Appl. Phys., 70, 1966 (1991).
CHAPTER 15
ELECTRICAL CONDUCTIVITY
AND IONIC DIFFUSION
In many applications, glass must serve as an electrical insulator or conductor,
and therefore understanding of its electrical conductivity is important. Ionic
transport plays a role in other applications and in manufacture of glass. Rates
of chemical reactions in glass melting are often controlled by diffusion. Ionic
motion in the amorphous silica layers on silicon devices can interfere with their
performance and must often be suppressed.
In most oxide glasses, the electrical conductivity results from ionic motion.
In certain special compositions containing multivalent oxides, such as
vanadium pentoxide or iron oxide, the conduction is electronic. Most chal-
cogenide glasses, those containing pure or combined sulfur, selenium, or
tellurium, are also electronic conductors; it is their semiconducting and
switching properties that have excited interest in these glasses. The "salt"-type
glasses of halides, nitrates, sulfates, and aqueous solutions are ionic conductors.
Organic glasses can be either electronic conductors or show ionic conduction
resulting from impurities.
The ionic conductivity of virtually all oxide glasses results from the
transport of monovalent cations. In most commercial glasses the conducting
ion is sodium. Faraday's law is found to hold for these glasses, and a number
of electrolysis experiments,l,2 reviewed in detail in earlier publications,3,4 have
established the ionic nature of the conduction process. Lithium ions also are
quite mobile in oxide glasses. Potassium and hydrogen ions sometimes carry
current, although their mobility is usually lower than that of sodium and
lithium. Even in glasses with no nominal addition of monovalent ions, the
conductivity results from transport of monovalent cations. In fused silica,
263
264 ELECTRICAL CONDUCTIVITY AND IONIC DIFFUSION
electrolysis experiments show that sodium and lithium ions are the conducting
species, even though they are present only in quantities of a few parts per
million. 5
The conduction mechanism in various "alkali-free" silicate and borate
glasses containing lead, aluminum, and alkaline earth ions is uncertain.
Conduction does not result from sodium ion motion in sodium-lead silicate
glasses containing less than 5 mol% Na 2 0, 50% Si0 2 , and the balance PbO,
as shown from electrolysis measurements. 6 In a 50mol% BaO, 50% Si0 2 glass
the diffusion coefficient and concentration of sodium were too low to give the
measured conductivity,7 as calculated from the Einstein equation, given in the
section below on the relation between conductivity and diffusion. The electrical
conductivity of 50 mol% CaO, 50% Si0 2 glasses was insensitive to sodium
concentration in the range from 45 parts per million to 1.26 mol% Na 2 0. 8
Thus it appears that alkali ions do not carry the current in any of these glasses.
The diffusion coefficient of oxygen in calcium aluminum silicate glasses is
apparently too low to account for their conductivity;9 in calcium aluminum
borate glasses, the contril;mtion of oxygen is uncertain,9,10 In lead silicate and
borate glasses, the diffusion coefficient of oxygen gives too high a conductivity
from the Einstein equation, and the activation energy for oxygen diffusion, 11
kcal/mol, is much less than the 24 kcal/mol for conduction. ll It therefore seems
likely that these experiments measure the diffusion of molecular oxygen and its
reaction with the lattice, as described in Chapter 8, and that the diffusion of
lattice oxygen is much slower.
The electrical conductivity of lead silicate, 6 calcium silicate,12 and barium
aluminum borate 13 glasses was affected by the presence of -GH groups. Thus
it seems possible that hydrogen ions are carrying the electrical current in these
glasses,6.12,13 In most silicate glasses, the mobility of hydrogen ions is about
three to four orders of magnitude lower than the mobility of sodium ions,14,15
but it is possible that the mobility of protons is higher in the alkaline earth,
lead, and aluminosilicate glasses. It is known that alumina groups lead to
relatively less tightly bound hydrogen ions in silicate glasses,15 so a relatively
high hydrogen ion mobility is particularly likely in alumino silicate glasses.
In barium silicate glasses with 30 and 50 mol% barium oxide, Evstrop'ev
and Kharyuzov 7 found that the diffusion coefficient of barium ions and the
electrical conductivity obeyed Einstein's equation; however, in calcium silicate
glasses the diffusion coefficient of calcium is much too low to account for the
electrical conductivity, and apparently hydrogen ions carry the current. 12 The
diffusion coefficient of lead in lead silicate glasses gives about the right value
of conductivity from the Einstein equation; however, electrolysis experiments
show that the lead ion is not conducting. 6 It is also possible that electrons carry
part or all of the current in these glasses.
Trnovcova et al. 151 studied the electrical conductivity of alkaline earth
aluminophosphate glasses and found that the conductivity increased as the
water content of the glasses increased. They found that the diffusion coefficients
of the alkaline earth ions and impurity sodium ions were too low to cause the
conductivity, and concluded that protons were the dominant carriers.
MEASUREMENT OF ELECTRICAL CONDUCTIVITY 265
Abe and co-workers 16 - 18 have explored the electrical conductivity of
alkali-free phosphate glasses. They found that the conductivity was directly
related to the concentration of hydroxyl groups (OH) in calcium phosphate
glass, and they also concluded that protons were the charge carriers in this
glass and a variety of alkaline earth phosphates. Their published infrared
absorption spectra show strong absorption of the base glass at the wave
number where molecular water absorbs (1630 em - 3), so it is not possible to
tell whether the glass contains appreciable molecular water.
Ernsberger 19 has concluded that bare protons are bound too tightly to
oxygen ions in oxide glasses to have appreciable mobility, even at high
temperatures. He suggested that hydrogen ion transport occurs only in
association with a water molecule. A careful study o( the infrared absorption
band of molecular water at 1630 cm -1 in these glasses should help to decide
upon the validity of this mechanism.
This chapter contains sections on the following subjects: methods of
measuring ionic conductivity and diffusion; the relation between conductivity
and diffusion; the effect of temperature, stress, and glass composition on ionic
transport in glass; fast ion transport, interionic diffusion in glass; and finally
theories of ionic transport. Earlier reviews on these subjects are given in Refs.
3,4, 15, and 20-30.
MEASUREMENT OF ELECTRICAL CONDUCTIVITY
AND IONIC DIFFUSION
The electrical conductivity of a solid ionic conductor can be measured with
direct 'or alternating current. In a direct current (DC) measurement, a space
charge is often set up in the glass because of partial blocking of the ionic
current by the electrodes; then the current decreases rapidly with time, and its
value must be extrapolated to zero time if an accurate value of conductivity is
desired. To avoid this electrode polarization, alternating current is usually
used, of a frequency from 10 3 to 10 6 cycles/so Silicate glasses show dielectric
losses at these frequencies, however, so care must be taken to make the
measurements over a wide frequency range. If a constant sample resistance is
found over several decades of frequency, one can be reasonably Certain that an
accurate value of conductivity is being measured. Such constancy is usually not
found. The result of these difficulties is that many experimental measurements
of electrical conductivity of glasses that have been reported in the literature are
not reliable.
The type of electrode and preparation of the glass surface can have a strong
influence on the measured conductivity, especially at frequencies below 10
cycles/so Kim and Tomozawa found that evaporated gold electrodes showed
fewer deviations from low frequency dielectric constants and conductivity than
did gold paste electrodes. 31 Polishing and etching the glass surface gave quite
different results from the as-received glass. Kim and Tomozawa concluded that
surface hydrated layers influenced the results, and that electrode and surface
266 ELECTRICAL CONDUCTIVITY AND IONIC DIFFUSION
effects resulted from space charge at the glass surface. These results show that
blocking or partially blocking electrodes can cause misleading results of
electrical conductivity measurements. 29 Electrode and surface hydration prob-
lems are more severe with less durable glasses (see Chapter 13).
A method that avoids these problems is to return to a DC measurement and
to use. electrodes of fused salts. 5 ,32 In this way electrode reactions and
frequency effects are eliminated. A simple experimental arrangement consists of
a glass tube partially filled with molten salt in a molten salt bath. A variety of
metallic electrodes can be inserted into the bath; if small currents are used,
contamination of the bath by electrode reactions is minimized. The molten salt
has a much higher conductivity than the glass, so nearly all the potential drop
is across the glass. Care must be taken that the bath contains the ion
conducting in the glass, usually sodium, in sufficient quantity to prevent
depletion, and that other possible conducting ions, such as lithium, must be
present in low enough quantity so that they do not cause any change in the
conductivity of the glass by exchanging with the conducting ions in it. One
difficulty with this method is to find stable salt melts for wide ranges of
temperatures. Alkali nitrates have low melting points but decompose above
about 450°C. Many other salts are hygroscopic; that is, they absorb moisture
from the atmosphere, so that many of them can be used only in a dry
atmosphere. Any fused salt should be purged with dry gas to remove residual
water. In some salts, such water is tenaciously held, and they must be heated
for long times at high temperatures to remove it. Even in fused salts there is
some evidence of problems with surface resistance. 33
Stresses in glass can increase the conductivity up to a factor of 10. These
stresses are removed by holding the glass at its annealing temperature for
about 0.5 h and then cooling it slowly (I°C/min). All results reported here are
on annealed glasses unless otherwise stated.
The specific resistivity p in ohm-cm is defined as the resistance of a sample
of unit area A and unit thickness d, so p = AR/d, where R is the resistance of
a platelike sample. The conductivity (J is the reciprocal of the resistivity:
(J = l/p.
Ionic diffusion can be studied with radioactive tracers; such diffusion, called
"tracer diffusion," takes place without chemical changes or ionic gradients in
the sample. The tracer can either be deposited on the sample surface from a
solution to provide a concentrated source of tracer, or the tracer concentration
at the sample surface can be maintained constant by a large dilute source such
as a fused salt.
The diffusion coefficient D is defined by the equation
oc
J = -D-
ox
(1)
where J is the flux of diffusing species and oc/ox is its gradient of concentration
c in thcf direction. From the equation of continuity
MEASUREMENT OF ELECTRICAL CONDUCTIVITY 267
ac a( -J) a 2 C
- = - =D- (2)
at ax ax 2
where t is the time and D is independent of concentration.
If at time zero an amount Q of substance per unit area is added to one face
of a semi-infinite solid containing none of this substance, then the solution of
Eq. 2 is 34
C = Jm exp ( - 4 t )
where c is the concentration of diffusion substance at a distance x from the face
after diffusion for a time t. To calculate the diffusion coefficient D from Eq. 3,
only the slope of the log concentration against x 2 plot for a certain time of
diffusion is needed, since Q and t are constants for these conditions. The
boundary condition of Eq. 3 applies when material containing a radioactive or
isotropic tracer of high specific activity is deposited on a solid. The concentra-
tion profile in the solid after diffusion for a certain time can be determined by
removing successive layers of the solid and analyzing for the tracer with a
counter or mass spectrometer.
Under certain conditions, Frischat found profiles of sodium tracer in glasses,
measured as described in the preceding paragraph, that deviated from Eq. 3
close to the sample surface. 35 However, McVay and Farnum were able to
eliminate similar effects by making the diffusion anneal in argon instead of
atmospheric air. 36 It seems likely that the deviations resulted from introduction
of hydrogen ions by reaction and ion exchange with water in the air. These
results are further evidence of the possible interference of water in diffusion and
conductivity measurements in glass, as mentioned above.
If the solute concentration at the face of a semi-infinite solid that contains
no solute initially is maintained at c j , then with D constant
C = Cj erfc C ) (4)
(3)
where
erfc z = fO e-Jl'dy
The total amount of material M that has diffused into the solid after a time t is
M = 2cj ( t Y/2 (5)
The functional form of Eq. 5 is preserved even if D is a function of the
concentration of the diffusing material. This is so because the solute concen-
tration C depends only on the variable y = x/,JD;i, where D j is the diffusion
268 ELECTRICAL CONDUCTIVITY AND IONIC DIFFUSION
coefficient when C = C j (x = 0). Then the flux J 0 crossing the surface x = 0 is
.' ( ac ) ..jD; ( ac )
J 0 = - D ax " = 0 = - Ii a y y = 0
The derivative is not a function of x, t, or D j , since y does not appear in it. The
resulting expression for M is
M = {r J 0 dt = - 2.jD;i (a ac )
Jo y y=o
Therefore M is proportional to Ji regardless of the functional relation
between D and solute concentration. This relation can usually be deduced from
the profile of diffusing material. To determine this profile, the concentration of
diffusing material as a function of penetration distance into the glass after a
certain time of diffusion must be found. To do this, layers of glass can be
removed, either by etching with acid, by grinding, or by sectioning, and the
amount of diffusing material in each layer determined by chemical or tracer
analysis.
If the electrical resistance of a glass is changed by the diffusing species, this
change can sometimes be used to follow the progress of diffusion. Consider a
solid sample of fixed cross-sectional area with flat faces and thickness L. The
resistance R per unit cross-sectional area of the sample measured between its
faces can be expressed as
R = {L dx
Jo (1
where (1 is the specific conductivity of the glass at the distance x from one face.
If the penetration of diffusing material is limited to a thin layer of the sample
throughout the diffusion process, there is a constant concentration C such that
i "dX
R = - + Ro
o (1
throughout the diffusion, when x is the distance corresponding to c and Ro is
the initial resistance of the sample when it contains no solute. Since the
penetration of diffusing material is limited to a thin layer, the equations for a
semi-infinite solid apply. Thus, if the concentration of diffusing material is held
constant at one face at Cj, the reduced solute concentration c/c j at a distance x
from the fact is a function of y = x/jD;i only, in which Dj is the diffusion
coefficient of solute at the concentration C j . Then the above equation can be
transformed to
i y dy
R - Ro = 2jD;i -
o (1
(6)
RELATION BETWEEN ELECTRICAL CONDUCTIVITY AND IONIC DIFFUSION 269
Since y is constant with time, because c is constant, and (J varies only with y
for a particular diffusion run at constant temperature, the integral is a constant
throughout a diffusion experiment, and the resistance increment R - Ro is
proportional to )t. This equation was derived without assuming a relation
between resistivity and concentration, or between the diffusion coefficient and
concentration. To relate R - Ro to D j under conditions of changing tempera-
ture, the Einstein equation (Eq. 11) can be used for (J.
RELATION BETWEEN ELECTRICAL CONDUCTIVITY
AND IONIC DIFFUSION
If the electrical current in a glass is carried by a single ionic species, the
electrical conductivity of the glass is related to the diffusion coefficient of the
ion by the Einstein equation. This equation can be derived as follows: 37 the
driving force for ionic transport in the x direction is the negative of the gradient
in total chemical potential ("electrochemical potential"):
aJl. = RT ac a In a + ZFE
ax c ax a In c
(7)
where a is the thermodynamic activity, c is the concentration, Z is the ionic
charge, F is the faraday, E is the electrical potential gradient, R is the gas
constant, and T is the temperature. A generalized mobility can be defined as
the average ionic velocity v per unit driving force. Then since the flux J of
diffusing species is equal to cv, the mobility u* for tracer diffusion is given by
-v
u*=-
RT ac
c ax
-J D
= R T ac = R T
ax
(8)
since there is no electrical potential gradient in tracer diffusion, and the term
a In a = 1 + ay
a In c y ac
(9)
is unity because there is no gradient in activity coefficients. The tracer-diffusion
coefficient is D. The electrical mobility U e in an experiment measuring the
electrical conductivity (J is
-v (J
u =-=-
e ZEF Z2 F 2 c
(10)
The Einstein equation is found by equating the electrical and diffusive
mobilities,
Z 2 F 2 Dc
(J=
RT
(11)
270 ELECTRICAL CONDUCTIVITY AND IONIC DIFFUSION
In other derivations of this equation, thermodynamic expressions for a
system in equilibrium are used, but these expressions are unsatisfactory, since
in a transport experiment the system is not in equilibrium. Deviations from the
Einstein equation in aqueous solutions because of the distortion of the electric
field around a moving ion demonstrate this deficiency. The present derivation
is based on a simple physical assumption, the equivalence of electrical and
diffusive mobilities, and a deviation from the Einstein equation shows when
this assumption is not valid.
In glasses, Eq. 11 is often not obeyed exactly; to give equality (] must be
multiplied by a factor f of less than 1. Kelly et a1. 38 have summarized
experimental results on f factors, sometimes called the Haven ratio. In silicate
glasses at alkali concentrations below about 5 mol%, several investigators find
f values close to 1. At higher alkali concentrations, there is a wide scatter of
results of different investigators even in glasses of the same composition
varying from 1 to 0.2. In germanate glasses, there is better agreement between
different investigators with f factors of 1 for alkali concentrations below about
2%, with a sharp decrease to 0.2 to OJ for higher (15 -30%) alkali concentra-
tions. In borate glasses, the results of two investigators are similar to those in
the germanates. Earlier measurements are discussed in the first edition of this
book, pp. 153-154.
The f factor can be measured in an experiment in which an electrical field
moves tracer in a glass, first devised by Chemla for alkali halides. 39 The
distance of motion is related to the electrical conductivity of the glass, and the
spreading of the tracer in the glass to the diffusion coefficient. In three different
research groups, results of this method for Na 2 0' Si0 2 were 0.69, 0.50 and 0.32
in refs. 40, 41 and 33, respectively. The origin of these differences is not clear.
Ideas about transport mechanisms in glass have been based on values of f, but
until the large differences in experimental results on silicate glasses by different
investigators are resolved, this approach seems premature.
In spite of these problems, the Einstein equation is valuable in comparing
results of conductivity and diffusion experiments. Thus the temperature de-
pendences of these two processes are accurately related in Eq. 11, and so are
other relative changes caused by stress, ion size, and glass composition. In the
following discussions of these effects, no distinction needs to be made between
conductivity and diffusion, since the trends apply to both processes.
Electrochemical experiments provide intriguing methods for measuring
diffusion coefficients of ions in glass melts. Examples are chronopoten-
tiometry,42 cyclic voltametry,42 and square-wave voltametry.43 The principles
behind these methods can be understood from a description of chronopoten-
tiometry in fused salts. 44 In chronopotentiometry, a constant current flows
through a melt at a potential difference of an electrode reaction of an ion in
dilute solution in the melt (electrolyte). An experimental parameter is the
transition time t, which is the time after the start of constant current
electrolysis when the surface concentration of the ion just reaches zero and a
jump of electrode potential occurs, because the ion is depleted at the electrode.
TEMPERATURE AND PRESSURE (STRESS) 271
The experimental value of 't' ,can be related to the diffusion coefficient D of the
ion in the melt with the assumption that the concentration gradient of diffusing
ion in the melt at the electrode surface is equal to J/nFD, in which J is the
constant applied current density, n is the number of electrons in the electrode
reaction, and F is the Faraday. Then at the electrode surface, the ionic
concentration cis"
c = c _ 2J {t
o nF .y;[)
Since the transition time 't' is the time when c = 0,
't' = ( co;F Y 1CD (13)
From this equation, the diffusion coefficient D can be calculated from known
values of Co' F, I and 't'. Application of an alternating current, instead of a
constant current, avoids certain experimental problems. Analysis of these cyclic
voltametry techniques is more complicated, but the principle for measuring a
diffusion coefficient is based on Eq. 13, with modification for an alternating
current. Square-wave voltametry45,46 gives good results in glass melts. 43 In
this technique the glass, for example a soda-lime composition, serves as an
electrolyte, and the ion of interest is melted with the glass at a level of
about 0.5%.
(12)
DEPENDENCE OF IONIC TRANSPORT ON TEMPERATURE
AND PRESSURE (STRESS)
The electrical resistivity of a glass containing about 26.5 wt% Na 2 0 and 73.5%
Si0 2 is shown in Fig. 1 as a function of reciprocal temperature. The data were
taken by Babcock 47 at higher temperatures and Sed den et al. 48 at lower
temperatures on glasses of almost the same composition. Sed den et al. annealed
their glass carefully and cooled it slowly to obtain reproducible measurements.
The temperature dependence shown in the figure parallels that found by
Johnson 49 for diffusion of sodium ions in binary sodium silicate glasses (see
Fig. 6). A similar temperature dependence for diffusion or conductivity is found
for other alkali silicate glasses, both binary and multicomponent, that have
been measured.
At lower tempertures the resistivity fits an Arrhenius-type equation, with a
pre-exponential factor Po and activation energy Q independent of temperature.
This dependence shows the relative stability of the glass structure below the
transition temperature. As the temperature approaches that where structural
rearrangements become possible, the resistivity drops more rapidly with
increasing temperature, leading to a second temperature region with a constant
although higher activation energy than at lower temperatures. As the glass
structure is further broken up with increasing temperature, the effective
272 ELECTRICAL CONDUCTIVITY AND IONIC DIFFUSION
t'C)
.
.
1
I
E
Of
!
>-
:>
4
iii
III
iii:
!i!
S
2
o
4
Fig. 1 Electrical resistivity of a 26.5 wt% Na 2 0, 73.5% Si0 2 glass as a function of
reciprocal temperature. 0, Seddon et al;48 6, Babcock. 47
activation energy continuously decreases. At temperatures above the glass
transition temperature, Q is constant over short temperature ranges, but
logp versus I/T is actually curved. For the glass in Fig. 1, the activation
energy at low temperatures is 16.0 kcal/mol, about 23 kcal/mol just above the
glass transition temperature, and about 8 kcal/mol from 1100 to 1500°C.
The intersection of the lines on the log p versus I/T plot at low and
intermediate temperatures has been used to determine a transition tempera-
ture. However, this temperature of about 430°C for the glass in Fig. 1 is
considerably lower than the temperature of about 490°C, where the viscosity
is 10 13 P, which is the more conventional transition temperature. Thus it
appears that ionic transport changes character at a lower temperature than
thermal expansion, the more usual property used as a criterion for the
transition temperature.
A constant Q for the resistivity implies, from Eq. 11, a factor of tempera-
ture in the pre-exponential term for the diffusion coefficient in an Arrhenius-
type equation. However, the experimental data for diffusion and conductivity
TEMPERATURE AND PRESSURE (STRESS) 273
in glasses are not accurate enough or taken over a wide enough range of
temperature to tell whether a pre-exponential factor of temperature is needed
for either property. Thus activation energies for both diffusion and conductivity
are reported for Arrhenius equations with no pre-exponential temperature
factor. The result is that activation energies for diffusion are somewhat (about
10%) lower than those for electrical conductivity.
The electrical conductivity and viscosity of glasses have been related by
various empirical formulae. 3 ,47 However, it, seems unlikely that there is any
quantitative relation between these properties because their temperature de-
pendence is very different. The viscosity shows no unusual changes in the
transition region, as discussed in Chapter 6, whereas ion transport is markedly
affected at temperatures in the transition region. Furthermore, the Stokes-
Einstein equation relating viscosity 17 and the diffusion coefficient D of a
particle of radius r,
RT
D=-
61t17r
(15)
gives ionic radii orders of magnitude too small for alkali ions diffusing in
silicate glasses. Therefore, although both viscosity and ionic transport reflect
changes in the glass structure with temperature, there is no general quantitative
relation between them.
The temperature dependence of ionic transport in vitreous silica appears to
be different from that in other silicates containing more transporting ion,
perhaps because the transport properties of silica in the rigid state can be
measured over such a wide temperature range. The diffusion coefficient of
sodium in vitreous silica made from fusion of natural quartz crystals is shown
in Fig. 2, from the measurement of Frischat. 51 A further discussion of diffusion
of sodium in vitreous silica is given in the next section on composition
dependence.
In order to measure the electrical mobility of sodium ions in vitreous silica,
it was necessary to electrolyze the glass in fused salt to remove other mobile
ions from the glass and replace them with sodium. This was done for the
sample shown in Fig. 3; initially it contained mobile lithium ions as well as
sodium ions. This sample was also used to test the Einstein equation, as
described in the preceding section for Frischat's measurements. The concentra-
tion of sodium was calculated from the time course of electrolysis;5 good
agreement with the Einstein equation was found for the data in Fig. 3 and
Frischat's results in Fig. 2.
At low temperatures, the activation energy for sodium ion conduction in
vitreous silica was constant, as shown in Fig. 3. Similar results were found for
lithium and potassium ions. As the temperature was varied above a certain
temperature, which was different for the different ions, the activation energy
started to decrease and continued to decrease slowly as the temperature was
raised. For sodium, the activation energy for conduction at temperatures below
274 ELECTRICAL CONDUCTIVITY AND IONIC DIFFUSION
5
0
6 00
7 <0
IQ
8 0
lG 0
E 9 00
0
Q 10 0 8
C)
0
-' o
I 11
12 8
8e
13
0
14 0
.7 .1.7 2.2
1000/T
Fig. 2 Diffusion coefficient of sodium in vitreous silica as a function of reciprocal
temperature, measured by Frischat.' 1
about 280°C was 35 kcal/mol, whereas above about 600°C the activation
energy was down to about 24 kcal/mo1. 52 Veltri 53 measured the conductivity
of vitreous silica from 1000 to 1800°C and found a constant activation energy
of about 24 kcal/mol in this temperature range. Thus the activation energy for
ionic transport is constant at high and low temperatures, but changes at
intermediate temperatures. Diffusion coefficients of a variety of ions in amor-
phous silica at l000°C are given in Table 1. The diffusion of several other ions
in vitreous silica is complex. Boron and phosphorous diffusion depends
strongly on ion concentration and the ambient atmosphere,67,68 and gallium,
indium, and thallium (three-valent) appear to have two different diffusing states
in silica. 68
Russel and co-workers 43 measured the diffusion coefficients and their
activation energies for a number of ions in a melt of soda-lime glass with
square-wave voltametry, which was described in the measurements section. In
this glass of composition 74 mol% Si0 2 , 16% Na 2 0 and 10% CaO, a variety
of ions were included at a level of 0.5% in different samples. At l000°C, the
sequence of mobilities was Ag+ »Cd2+ > Fe H > Ni H > Te H > rH >
Sn H > Bi H > AsH> Pb H Co2+ > Sb H > Sn 4 + Ta H »Cr 6 +, from
3.5 x 10- 7 cm 2 /s for silver to 3.9 x 10- 11 cm 2 /s for Cr 6 +. The activation
energies increased in roughly the same sequence, from 107 kJ/mol for silver to
TEMPERATURE AND PRESSURE (STRESS) 275
10 8
o GE 204
L::. SPECTROSIL
10 13
10 12
1011
fI)
::E
::I:
o
W 10 10
()
Z
10 9
a:::
10 7
1.6
1.8 2.0 2.2
10001T
2.4
Fig. 3 Resistance of fused silica containing sodium ions, as a function of liT. From
Ref. 5.
327 kJ/mol for Cr 6 +. Except for the end-members, this sequence is curious.
There seems to be little relation between ion charge, size, or chemical character
and mobility.
Stress has long been known to affect the electrical conductivity of glasses. A
quenched glass has a higher conductivity than an annealed one. The effects of
compaction by hydrostatic stress and expansion by quenching on a soda-lime
glass are shown in Fig. 4 from the work of Charles. 55 The figure indicates a
linear dependence of log conductivity on pressure, since for small volume
changes this change is proportional to the pressure P. Thus
( v*P )
(f = (fo exp RT
(16)
where (fo and V*, the "activation volume," are independent of pressure at
constant temperature. Charles' results show that the effect of compressing the
276 ELECTRICAL CONDUCTIVITY AND IONIC DIFFUSION
TABLE 1 Diffusion Coefficients of Ions in Vitreous
Silica at lOOO°C
Ion D (cm 2 /s) Ref.
Sodium 7.98 x 10- 6 51
Lithium 1.2 x 10- 6 5
Silver 6.5 x 10- 7 5
Potassium 1.6 x 10- 8 54
Rubidium 2.5 x 10- 9 54
Cesium 3.2 x 10- 11 66
Calcium 2.0 x 10- 8 66
Aluminum 1.3 x 10- 13 66
Arsenic 4.0 x 10- 17 68
glass with hydrostatic pressure has a much smaller effect on resistivity of glass
for unit volume change than do the structural changes brought about by
quenching a sample to put it in tension internally. A V* of about 3.7 cm 3 /mol
for hydrostatic compression is calculated from Fig. 4. Hamann 56 measured the
effect of pressure on different alkali silicate glasses and found the following
activation volumes in cm 3 /mol: lithium, 1.0; sodium, 3.4; potassium, 6.0. These
results can be compared with the molar volumes of the ions as calculated from
the ionic radius: lithium, 0.55; sodium, 2.2; potassium, 5.9. In crystalline solids
the activation volume is usually about half the molar volume, whereas in
liquids it is closer to the molar volume. Thus diffusion in glasses is between
these extremes and changes with the size of the diffusing ion.
The presence of a stress gradient in a glass gives an additional driving force
for ionic transport. In the presence of a stress gradient oP/ox, Eq. 7 for the
gradient in chemical potential becomes
OJI. = RT oc a In a + ZFE + V* oP
ox c ox a In c ox
(17)
Weber and Goldstein 57 devised an ingenious experiment to measure V* from
this effect. They bent a glass plate to give a stress gradient across the thickness
of the glass and measured the current J p that flowed as a result of the applied
stress &P. Then from this current and the electrical current I in a conventional
measurement of electrical conductivity with an applied potential V they
calculated V* from the relation
V* = J p V F
I &P
where F is the Faraday constant. For a soda-lime glass they found V* = 1.3
cm 3 /mol, which is about one-third the value calculated from Charles' results.
The reason for the difference is not clear.
EFFECT OF GLASS COMPOSITION ON IONIC TRANSPORT 277
lOll
.
CONPACT10N IV
H'I'DROITATIC PRESSURE
EX_lION IV INCIlt!UE
OF QUINCHIN. TEWERATUIIt!
Q.
>
t IO
(II
iii
-FULLV ANNEALED UIIE 'LAS'
i
c:t
10'
Fig. 4 Resistivity at nec of a commercial soda-lime glass (Corning No. 0080, see
Chapter 1) as a function of changes in its specific volume caused by hydrostatic
pressure or by quenching from various temperatures. 55
EFFECT OF GLASS COMPOSITION ON IONIC TRANSPORT
The electrical conductivity is proportional to the product of concentration of
the current-carrying ion and its mobility or diffusion coefficient, as shown by
Eq. 11. Thus in a comparison of glasses with different concentrations of ions,
the diffusion coefficient is the more meaningful parameter. However, the
activation energy for either property is not dependent directly on composition,
and so it may be used to follow changes caused by, for example, changes in
glass structure.
The tracer diffusion coefficient of sodium silicate glasses as a function of
glass composition and temperature is shown in Fig. 5, from the measurements
of Johnson. 49 The diffusion coefficient decreases as the concentration of sodium
278 ELECTRICAL CONDUCTIVITY AND IONIC DIFFUSION
j
E
u 0
ci
% Na20
X 34.1
<> 25.4
c 16.6
614.5
10- 9 o 11.4
0.9 1.0 1.1 1.2 1.3 1.4 1.5 1.6
1000fT
Fig. 5 Diffusion coefficients of sodium in binary sodium silicate glass, measured by
Johnson. 49
ions decreases. Qualitatively the silica lattice is less broken-up the smaller the
sodium concentration, making ionic transport more difficult. Similar trends are
found for multicomponents silicate glasses, and in other alkali silicate glasses,
the diffusion coefficient of the alkali ion also decreases as its concentration
decreases.
The activation energy for electrical conduction in binary alkali silicates is
about 15-17 kcal/mol above an alkali concentration of about 20 mol %, and
increases at lower alkali concentrations. 58 The data of different investigators'
do not agree very well, 58 particularly for sodium silicates. Conduction in
binary sodium and lithium silicates may be affected by phase separation in
these glasses.
The addition of an oxide of a higher-valent metal ion to an alkali silicate
leads to a decrease in the ionic mobility of the alkali ion. The decrease is related
to the ionic size of the added ion for divalent ions; the largest change was found
for barium ions, with a decreasing effect for lead, strontium, and calcium ions
and a relatively small change for addition of magnesium, zinc, or beryllium
oxides. 4 . 24 ,59 Addition of aluminum oxide increases the ionic mobility and
decreases its activation energy,24 as discussed further in the section on theory.
When a second alkali oxide is added to an alkali silicate glass, the
conductivities decrease sharply. This "mixed-alkali" effect is shown in Fig. 6 for
mixed binary alkali silicate glasses. 6o Measurements of diffusion coefficients in
INTERIONIC DIFFUSION AND ION SIZE EFFECTS 279
',0
' !5
: 7,0
U
:)
'1:1
&
u ',5
0-
.2
I
K-L,
_ 1,0
'e
u
'e 7,S
a
S,o
S .S
Concentration Ratio
.S
Fig. 6 The electrical conductivity of mixed binary alkali silicate glass containing 26
mol% alkali and 74% Si0 2 at 250°C, from Lengyel and Boksay.60
such glasses show that the mobility of each ion is decreased by the addition of
the other 61 - 63 The decrease in conductivity results from these reductions in
mobility, but the reason for the mobility reductions in terms of the mechanism
of diffusion is uncertain. Borate glasses also show a mixed alkali effect,64 but
in aluminosilicate with R/AI = 1, R being th alkali ion, there is no effect. 65
Additional data on diffusion of different ions in glass is summarized in Refs. 23,
24, and 69-71.
INTER IONIC DIFFUSION AND ION SIZE EFFECTS
If glass is placed in contact with a medium containing monovalent cations,
such as a fused salt or an aqueous solution, these cations can exchange with
monovalent cations in the glass and interdiffuse with them into the glass. The
ionic equilibrium between the glass and solution is considered in Chapter 14,
as are the electrical potentials that result from this exchange and are reponsible
for the operation of glass electrodes. In this section, the interdiffusion of
like-charged ions is treated.
An alkali silicate glass can be considered as a matrix of immobile negative
groups with associated mobile cations. An exchange cation normally has a
280 ELECTRICAL CONDUCTIVITY AND IONIC DIFFUSION
different mobility from the original ion; therefore as interdiffusion proceeds,
one ion tends to outrun the other, and an electrical charge is built up. However,
accompanying this charge is a gradient in electrical potential that slows down
the fast ion and speeds up the slow one. To preserve electrical neutrality, the
fluxes of the two ions must be equal and opposite, and the electrical potential
ensures this condition in spite of the difference in mobility of the two ions. The
mobility U in an experiment with both ionic and electrical gradient is found
from Eq. 7 and the definition of mobility as the velocity v per unit driving force;
the flux J per unit time and area equals cv in the ionic concentration, so that
( . oc 0 In a )
J= -u RT--+ZcFE
ox 0 In c
An equation of this form applies to each mobile cation in the glass. These flux
equations are usually called the Nernst-Planck equations, and were derived
here from the assumption that the driving force is the gradient of electrochemi-
cal potential, and the definition of the mobility.
If two monovalent cations A and B interdiffuse, each has a flux equation
(Eq. 18), with Z = 1. The conditions of electroneutrality require that J A = - J B
and oCA/ox = - oCB/ox because the number of negative groups is constant and
immobile. From these four relations, the gradient E in electrical potential is
(18)
E= RT UB-U A oCAolna A
. F CAU A + CBUB ox 0 In C A
(19)
To develop this electrical potential, small deviations in electrical neutrality
must occur in the ionic system. However, the number of ions involved in these
deviations is negligible compared to the total ionic concentrations.
When Eq. 19 is substituted into Eq. 18, the flux for ion A is
( CAUB + CBU B ) oCA 0 In aA
J = -u RT --
A A CAUA + CBUB ox oinC A
The coefficient of the concentration gradient is the same for ion B; if the
activity coefficients are constant 0 In aA/o In C A = 1, and this interdiffusion
coefficient D is
(20)
D = DAD B
NAD A + NBD B
where N j = Cd(C A + C B ), and Eq. 8 is used to relate the mobilities to the
tracer diffusion coefficient D. This latter substitution amounts to assuming that
the mobilities in a tracer diffusion experiment, in which there are no gradients
in ionic concentration, are equal to those in an interdiffusion experiment. Even
if the Einstein equation (Eq. 11) is not obeyed, the ratio D A/DB still equals
UA/UB if the deviations from this equation are the same for the two ions.
The diffusion equations with the concentration-dependent diffusion coeffi-
cient of Eq. 21 have been solved for various ratios of D A/DB and different
geometries by Helfferich and Plesset,72,73 with the assumption that the diffu-
(21)
INTERIONIC DIFFUSION AND ION SIZE EFFECTS 281
sion coefficients D A and DB were concentration independent. In Fig. 7 their
curve 'is compared to experimental data for silver-sodium interditTusion in a
soda-lime glass. 37 The tracer ditTusion coefficients of sodium and silver were
measured, and the ratio DNa/DAI and the absolute value of D calculated from
these tracer diffusion coefficients agreed well with those calculated from the
data in Fig. 7. Furthermore, measurements of the total amount of diffused
material and the change in resistance with time of diffusion gave agreement
with the interdiffusion coefficient of Eq. 21 in Eqs. 5 and 6, respectively. Thus
the assumptions leading to Eq. 21 are confirmed: the validity of the Nernst-
Planck equations, the equality of mobility ratio for tracer and interdiffusion
experiments, and especially the independence of the (tracer) diffusion coeffi-
cients DNI and DAI with changing ionic ratio in the glass. The equivalence of
the mobilities in the two types of experiments is additional evidence that the
Einstein equation (Eq. 11) is obeyed in this system, as was deduced from
measurements of electrical conductivity and tracer diffusion of sodium in the
ini tial glass.
In certain other glasses, conditions are not so simple. For example, in Pyrex
borosilicate glass, silver 74 and potassium 7 5 exchange for sodium are influenced
by the two-phase structure of the glass. Silver ions are preferentially bound by
one phase, so their effective diffusion coefficient is reduced at low silver ion
concentrations.
1.0
.8
40 60
DISTANCE, MICRONS
80
100
.6
.g-
.4
.2
Fig. 7 Profile of silver that diffused from a silver nitrate melt into a soda-lime glass
(Corning 0080, Chapter 9, Table 1) after 1097 min at 378°C. Line for DNa/D Ag = 10. 37
282 ELECTRICAL CONDUCTIVITY AND IONIC DIFFUSION
A careful distinction should be made between interdiffusion experiments
done well below the transition temperature of the glass and diffusion in silicate
glasses melted with different or mixed alkali ions. The structure of the glass is
determined by the melting conditions, and interdiffusion well below the
transition temperature does not alter it. Thus the result that the tracer diffusion
coefficient of an ion is constant with varying ionic ratio cannot be compared
with the results on mixed alkali glasses in which a change in the ionic ratio
changes the tracer diffusion coefficient; in this case, the structure of the glasses
is different.
Interionic diffusion experiments have been carried out at temperatures not
too far below the transition temperature. 76 ,77 In the sodium-potassium ex-
change of these experiments, large stresses arise in the glass because of the
difference in the sizes of the ions. This stress slowly relaxes at these tempera-
TABLE 2 Ratios of Diffusion Coefficients of Monovalent Ions in Rigid Silicate Glasses
Mol% Temperature Ions
Glass type M 2 0 (0C) A-B D,./DB Refs.
Soda-lime 15.2 Na 2 0 354 t.. A . 4 32
Na-Ag 12 37
Na-K 500 79
14.0 Na20 250 Ag-Li 2 80
13.0 Na20 350 t"H 1800 14
Na-K 1400 14
Na-Rb 3.4(10)' 14
Potash-lime 12.5 K 2 0 350 K-H 2 14
K-Rb 190 14
Sodium binary 13 Na 2 0 415 Na-K 25 61
20 Na20 415 Na-K 39 61
25 Na 2 0 415 Na-K 48 61
Potassium 13 K 2 0 415 Na-K 0.5 61
binary 20 K 2 0 415 Na-K 0.5 61
25 K 2 0 415 Na-K 0.6 61
Sodium 12.5 Na 2 0 400 Na-K -300 81
alumino silicate
(hydrated) 27 Na 2 0 25 Na-K 3; 7 82
Lithium 5.2 Li 2 0 415 Na-Li 1 83
aluminosilicate
Pyrex "4 Na 2 0 335 Na-Ag 1 74
borosilica te 373 Na-K -30 75
Vitreous 1.1(10)-4 Na 2 0 380 Na-Li 6.7 5
silica 3.4(10)-4 Li 2 0 380 Na-Ag 12 5
(G.E. 204) 380 Na-K >500 5
(Spectrosil) ? 380 Na-Li 33 5
380 Na-K 1400 5
(Vitreosil) _5(10)-4 Na 2 0 1000 Na-H _104 84
GLASSES WITH HIGH ELECTRICAL CONDUCTIVITY 283
TABLE 3 Ionic Radii
Ion Radius (A) Ion Radius (A)
H+ Small
Li+ 0.68 Be 2 + 0.33
Na+ 0.95 Mg 2 + 0.67
Ag+ 1.26
K+ 1.33 Ca 2 + 0.99
Rb+ 1.48 Sr2+ 1.13
Cs+ 1.67 Ba H 1.35
tures, leading to a time-dependent change in the structure of the glass and also
of the tracer diffusion coefficients of the ions. Thus interpretation of these
experiments is difficult. When the stress is completely relaxed the diffusion
coefficients have nearly the same dependence on ionic ratio as in the mixed
alkali glasses melted with a range of ionic ratios. 78
In Table 2 the mobility ratios of diffusing ions in various rigid alkali silicate
glasses are listed and can be compared with ionic radii in Table 3. In soda-lime
glass, the maximum mobility is found for sodium and lithium ions, with a large
decrease for smaller (hydrogen) and larger (potassium and rubidium) ions. For
fused silica the sequence is similar, except that lithium is less mobile than
sodium. Silver is somewhat more mobile in lime glass than would be expected
from its size, probably because it is much more polarizable than the alkali ions.
Interest in making optical wave guides and gradient index lenses (see
Chapter 17) by exchanging ions such as silver with alkalis to change the surface
refractive index has led to a number of fresh studies of ionic interdiffusion in
glass. The principles outlined in this section, especially Eq. 21 for the concen-
tration-dependent diffusion coefficient, have been applied and confirmed in
these studies. See Refs. 85-87 for reviews. In some cases in the most precise
work it may be necessary to take into account small change of the individual
diffusion coefficients D A and DB with ionic composition N A. 88
GLASSES WITH HIGH ELECTRICAL CONDUCTIVITY
("FAST ION CONDUCTORS")
Electrolytes with high conductivity at temperatures below 300°C or even at
room temperature are of interest for applications in batteries, sensors and
display devices. Reviews of glasses with high conductivity are given in Refs.
26-29; Ref. 29 has 250 citations to work on ionic conductivity. In certain oxide
glasses with high alkali ion concentrations, especially sodium and lithium,
conductivities of about 10- 3 (ohm-cm) -1 are possible. 89 To obtain high
conductivity at room temperature, silver halides have been added to a variety
284 ELECTRICAL CONDUCTIVITY AND IONIC DIFFUSION
of glasses. With about 50% silver iodide and 50% silver phosphate, selenide
molybdate or chromate, glasses with conductivities of about 10 - 2 (ohm-cm) - 1
at 25°C have been reported. These glasses are probably related to the high
electrical conductivity of crystalline iX-silver iodide and mixed silver salts at
room temperature. In some compositions, substitution of sulfur for oxygen
increases the conductivity.26 Many glasses with high copper or silver halide
concentrations show high conductivity at room temperature.
One problem with these glasses is their lack of chemical durability. All are
among the less durable glass compositions, and some are strongly attacked by
water and acids. Practical applications of these glasses are presently possible
only in' chemical conditions in which they are durable.
THEORIES OF IONIC TRANSPORT
The diffusion coefficient D of Eq. 1 can be described in terms of a random walk
of molecules in discrete steps. From the probability of finding a molecule at a
certain place after a fixed number of steps
D = gA,2 r
(22)
where g is a geometrical constant, A,2 is the average of the squares of the step
lengths, and r is the average number of steps made in unit time. The jump rate
r m for ionic motion can be calculated from various models; its usual form is
r = v ex p ( S _ H )
m R RT
(23)
where v is the vibration frequency of the diffusing atom, and Sm and Hm are
the entropy and enthalpy of activation for the motion of an atom from one site
to another. In some cases, it is found that the pre-exponential frequency term
depends on the temperature. In the preceding chapter, results on diffusion of
gases in glass showed such a dependence. However, the results on ionic
diffusion have not been accurate enough or measured over wide enough
temperature ranges to tell whether such a temperature factor is needed;
therefore it will be ignored in this discussion.
The diffusion coefficients of monovalent cations in oxide glasses cannot be
described by considering the glass to be a viscous liquid. Equation 13, the
Stokes-Einstein equation, predicts much too Iowa diffusion coefficient, as
described in the section on temperature effects. Furthermore, these cations
diffuse much more rapidly than the lattice elements, such as silicon and oxygen,
so the glass behaves like a rigid solid with mobile interstitial ions.
A variety of theories have been proposed for ionic motion in glass. Anderson
and Stuart 90 considered the activation enthalpy H for ionic transport of
alkali ions to consist of two parts, one of electrostatic interaction with the
immobile nonbonding oxygen ion, and the other a resistance to pushing the
CONDUCTION IN HIGH FIELDS 285
ion through a "doorway" (Chapter 8, Eq. 33). This model gives a strong
dependence of activation energy on ion size, with a minimum activation energy
for an intermediate ion size.
A "weak electrolyte" theory has been proposed for glasses, 91 - 93 analogous
to partially ionized molecules in aqueous solution. From Eq. 11, the electrical
conductivity is proportional to the product of ionic concentration c and
diffusion coefficient D. In the weak electrolyte theory, the concentration of
carriers is much less than c, the total number of alkali ions, because most of
them are held tightly to nonbridging oxygen ions:
SiONa = SiO - + Na + (24)
Other theories have involved a combination of the Anderson-Stuart and
weak electrolyte models,94 defects (the first edition of this book, p. 171, and
Ref. 29), a "cluster bypass" model, in which ions move through disordered
regions between ordered regions,95 a relaxation model,96 in which the Charles
idea of a defect with two alkali ions at a nonbridging oxygen is resurrected, a
three configuration model,97 and a relation between ionic motion and the
thermodynamic state of the glass. 98 However, none of these models has been
generally accepted. The conclusion of Greaves 99 seems apt: "Nevertheless,
taken on their own, transport measurements remain inconclusive as to the
precise diffusion mechanism occurring."
A number of explanations of the mixed alkali effects have been put forward,
including ionic interactions, 100 defects, pathways, percolation, cluster bypass,29
and thermodynamic state. 10l None of these models has achieved widespread
acceptance. Hyde and Tomozawa have shown that the mixed alkali effect
becomes less marked at high frequency or at high fields, and they suggest that
these limiting conditions can be explained from the theory of ionic interactions
in an electrolyte. 102
Structural factors may be quite important in diffusion mechanisms in
glass. 99 For example, in vitreous silica there is evidence that the alkali ions are
associated with impurity aluminum ions. These aluminum ions may be
arranged in cells or ribbons in a three-dimensional network, and not uniformly
distributed. 103 These alumina cells may provide a preferred path for alkali
transport in vitreous silica. 1 03
CONDUCTION IN HIGH FIELDS
Results on the ionic transport in very high electrical fields may shed some light
on the mechanism of ionic transport in glass, although the correct interpreta-
tion of these results is still not entirely clear. If a Boltzmann distribution of
energy exists among ions, their jump rate is given by Eq. 23. When an electric
field E is imposed on them, jumps in one direction become more probable than
286 ELECTRICAL CONDUCTIVITY AND IONIC DIFFUSION
in the other, giving rise to the following equation for the conductivity:104
_ 2gcF A.r . h F EA. (24)
(1 - E Sin 2R T
For low fields, sinh X = X and Eq. 24 becomes
gcF 2 A. 2 r
(1=
RT
which is Eqs. 11 and 22 combined. When the fields are very high, Eq. 24
becomes, in terms of the current I = (IE
1= 2gcFA.r exp ( ) (25)
so that the current depends exponentially on the field. This exponential
dependence at high fields has been found by several different workers for
sodium silicate glasses.l04-109 The hyperbolic sine law over the whole range
of fields was found by Maurer l04 and Zagar and Papanikolau. 108 Maurer and
Vermeer l07 found the expected temperature dependence of the pre-exponential
and exponential factors of Eq. 25 from their low-field results on the same
glasses. Maurer's jump distances calculated from Eq. 25 were high. However,
when these A. values were corrected by using the effective local field E L ,
calculated from the Lorentz-Lorentz relation
E L = e ; 2 ) E
where e is the DC dielectric constant, instead of the external field Eo,
reasonable values of A. (about 5 A) were found. This correction has been
questioned,4 but it probably is valid. This distance of 5 A is not too different
from the average separation of the sodium ions in this glass. Zagar and
Papanikoiau l08 calculated values of the jump distance for several different
sodium silicates, soda-lime silicate, and sodium borosilicate glasses, and found
an average value of 28 A for all glasses, with little difference between glasses
and no effect of temperature between - 30 and 100°C. Again the high value
could be corrected by the Lorentz-Lorentz relation to a more reasonable value.
Barton and Leblond 1 09 criticized Eq. 25 because of the high-jump distances
calculated from it and the differences between these distances and those
calculated from the low-field conductivity. However, the latter are uncertain
because of uncertainties in the factor g and correlation effects. Barton and
Leblond suggested that a better equation would be that of Poole and Frenkel,
in which the log current is proportional to the square root of the field at high
fields. However, this mechanism would require a change from Eq. 25 to this
different dependence at some intermediate field. There is no evidence for such
a shift from Eq. 25 in the data of Maurer, and Zarar and Popanikolau, which
REFERENCES 287
agree with Eq. 25 at all fields. The jump distances calculated from the
Poole-Frenkel equation are about 20 A, and therefore are also higher than
would be expected. Thus Eq. 25 still seems to be the best for representing
conduction data at high fields.
REFERENCES
1. E. Warburg, Ann. Phys., 21, 622 (1884).
2. R. C. Burt, J. Opt. Soc. Am., 11, 87 (1925).
3. G. W. Morey, The Properties of Glass, 2nd edn., Reinhold, New York, 1954, p. 465.
4. A. E. Owen, in Progress in Ceramic Science, J. E. Burke, Ed., Macmillan, New
York, 1963, p. 77.
5. R. H. Doremus, Phys. Chem. Glasses, 10, 28 (1969).
6. K. Hughes, 1. O. Isard, and G. C. Milnes, Phys. Chem. Glasses, 9,43 (1968).
7. K. K. Evstrop'ev and V. A. Khar'yuzov, Dokl. Akad. Nauk USSR, 136, 140 (1961);
Translation in Proc. Acad. Sci. USSR, 136, 25 (1961).
8. M. Schwartz and J. D. Mackenzie, J. Am. Ceram. Soc., 49, 582 (1966).
9. W. G. Hagel and 1. D. Mackenzie, Phys. Chem. Glasses, 5, 113 (1964).
10. A. E. Owen, Phys. Chem. Glasses, 2, 87, 152 (1961): 6, 253 (1965).
11. H. A. Schaeffe\ and H. J. Oel, Glastech. Ber., 42, 493 (1969); Z. Naturforsch, 25a,
59 (1970).
12. M. Schwartz, Thesis, Rensselaer Polytechnic Institute, Troy, N.Y., 1969.
13. E. Gough, 1. O. Isard, and 1. A. Topping, Phys. Chem. Glasses, 10, 89 (1969).
14. P. Ehrmann, M. deBilly, and 1. Zarzycki, Verres Refract. 18, 164 (1964).
15. R. H. Doremus, in Ion Exchange, Vol. 2, 1. A. Marinsky, Ed., Marcel Dekker, New
York, 1969, p. 1.
15a. V. Trenovcova, E. Majkova, A. Bohun, 1. Thurzo, and E. Mariani, Proc. XIth
Int. Congress on Glass, Prague, CVTS-Dum Techniky Prague, Czechoslovakia,
1977, Vol. II, p. 405.
16. Y. Abe, H. Shimakawa and L. L. Hench, J. Noncryst. Solids, 51, 357 (1982).
17. Y. Abe, H. Hosono, Y. Ohta, and L. L. Hench, Phys. Rev., B38, 10166 (1988).
18. M. Kotama, 1. Nakanishi, H., Hosono, Y. Abe, and L. L. Hench, J. Elect. Soc.,
138, 2928 (1991).
19. F. M. Ernsberger, Phys. Chem. Glasses, 21, 146 (1980); J. Noncryst. Solids, 38&39,
557 (1980); J. Am. Ceram. Soc., 66, 747 (1983).
20. 1. M. Stevels, in Handbuch der Physik, Vol. 20, Springer-Verlag, Berlin, 1957,
p.350.
21. R. H. Doremus, in Modern Aspects of the Vitreous State, Vol. 2, J. D. Mackenzie,
Ed., Butterworths, London, 1962, p. 1.
22. R. H. Doremus, J. Elect. Soc., 115, 181 (1968).
23. P. Winchell, High Temp. Set., 1, 200 (1969).
24. G. H. Frischat, Ionic Diffusion in Oxide Glasses, Trans. Tech., Bay Village, OH,
1975.
2B8 ELECTRICAL CONDUCTIVITY AND IONIC DIFFUSION
25. L. Pietroneco and A. Avogadro, Solid State Ionics, 314, 7 (1981).
26. 1. L. Souquet, Annu. Rev. Mater. Sci., 11,211 (1981).
27. H. L. Tuller and M. W. Barsoum, J. Noncryst. Solids, 73, 331 (1985).
28. C. A. Angell, Solid State Ionics, 18,19, 72 (1986).
29. M. D. Ingram, Phys. Chem. Glasses, 28, 215 (1987).
30. S. W. Martin, J. Am. Ceram. Soc., 74,1767 (1991).
31. C. Kim and M. Tomozawa, J. Am. Ceram. Soc., 59, 127, 321 (1976).
32. G. Shultz, Ann. Phys. Leipzig, 40, 335 (1913).
33. P. Laborde, C. Kaps, H. Kahnt, and A. Feltz, Mater. Res. Bull., 24, 921 (1989).
34. 1. Crank, The Mathematics of Diffusion, Oxford University Press, London, 1956, p.
26.
35. G. H. Frischat, Phys. Chem. Glasses, 11, 25 (1970); J. Am. Ceram. Soc., 53, 285
( 1970).
36. G. L. McVay and E. H. Farnum, J. Am. Ceram. Soc., 55, 275 (1972).
37. R. H. Doremus, J. Phys. Chem., 68, 2212 (1964).
38. 1. E. Kelly, J. F. Cordaro and M. Tomozawa, J. Noncryst. Solids, 41, 47 (1980); 51,
345 (1982).
39. M. Chemla, Annales de Physique, 13, 959 (1956).
40. 1. Heinemann, Ph.D. Thesis, Technical University, Clausthal, Germany, 1986.
41. 1. R. Engel and M. Tomozawa, J. Am. Ceram. Soc., 58, 183 (1975).
42. T. Takahashi and Y. Miuri, J. Noncryst. Solids, 95196, 119 (1987) and earlier
papers by these authors.
43. C. Russel, J. Noncryst. Solids, 134, 169 (1991) and earlier papers by this author
and colleagues.
44. H. A. Laitinen and R. A. Osteryoung, in Fused Salts, B. S. Sundheim, Ed.,
McGraw-Hill, New York, 1964, p. 255.
45. 1. G. Osteryoung and 1. 1. O'Dea, in Electroanalytical Chemistry, Vol. 14, A. 1.
Bard, Ed., Marcel Dekker, New York, 1986, p. 209.
46. 1. G. Osteryoung and R. A. Osteryoung, Anal. Chem., 57, lOlA, (1985).
47. C. L. Babcock, J. Am. Ceram. Soc., 17, 329 (1934).
48. E. Sedden, E. 1. Tippet, and W. E. S. Turner, J. Soc. Glass Technol., 16,450 (1932).
49. 1. R. Johnson, R. H. Bristow, and H. H. Blau, J. Am. Ceram. Soc., 45, 135 (1951);
see also 1. R. Johnson, Thesis, Ohio, State University, 1950.
50. 1. O. Bockris, 1. A. Kirchener, S. Ignatowicz, and 1. W. Tomlinson, Trans. Faraday
Soc., 48, 75 (1952).
51. G. H. Frischat, J. Am. Ceram. Soc., 51, 528 (1968).
52. A. E. Owen and R. W. Douglas, J. Soc. Glass Technol.,43, 159 (1959).
53. R. D. Veltri, Phys. Chem. Glasses, 4, 221 (1964).
54. S. 1. Rothman, T. L. M. Marcuso, L. 1. Nowicki, P. M. Baldo, and A. W.
McCormick, J. Am. Ceram. Soc., 65, 578 (1982).
55. R. 1. Charles, J. Am. Ceram. Soc., 45, 105 (1962).
56. S. D. Hamann, Aust. J. Chem., 18, 1 (1965).
57. N. Weber and M. Goldstein, J. Chem. Phys., 41, 2898 (1964).
REFERENCES 289
58. R. M. Hakim and D. R. Uhlmann, Phys. Chem. Glasses, 12, 132 (1971).
59. O. V. Mazurin and E. S. Borisovski, J. Tech. Phys. Moscow, 27, 275 (1957); Sov.
Phys. Tech. Phys., 2, 243 (1957).
60. B. Lengyel and Z. Boksay, Z. Phys. Chem., 203, 93 (1954); 204, 157 (1955).
61. K. K. Evstrop'ev, in The Structure of Glass, Vol. II, Consultants Bureau, New York
1960, p. 237.
62. G. L. McVay and D. E. Day, J. Am. Ceram. Soc., 53, 508 (1970).
63. 1. P. Lacharme, C. R. Acad. Sci. Paris, 270C, 1350 (1970); 275C, 993 (1972).
64. H. Jain, H. L. Downing, and N. L. Peterson, J. Noncryst. Solids, 64,335 (1984).
65. P.1. Hayward, Phys. Chem. Glasses, 17, 54 (1976).
66. G. H. Frischat, J. Am. Ceram. Soc., 53, 625 (1969).
67. M. Ghezzo and D. M. Brown, J. Elect. Soc., 120, 110, 146 (1973).
68. A. H. vanOmmen, Appl. Surf. Sci., 30, 244 (1987).
69. N. P. Bansal and R. H. Doremus, Handbook of Glass Properties, Academic Press,
San Diego, 1986.
70. O. V. Mazurin, M. V. Streltsina, and T. P. Shviko-Shvaikovskaya, Handbook of
Glass Data, Parts A, B, and C, Elsevier, Amsterdam, 1985.
71. P. Winchell, J. Am. Ceram. Soc., 54, 63 (1971).
72. F. Helfi'reich and M. S. Pies set, J. Chem. Phys., 28, 418 (1958).
73. F. Helfi'reich, J. Phys. Chem., 66, 39 (1962).
74. R. H. Doremus, Phys. Chem. Glasses, 9, 128 (1968).
75. H. M. Garfinkel, Phys. Chem. Glasses, 11, 151 (1970).
76. 1. Tochon, C. R. Acad. Sci. Paris, 236C, 829 (1966).
77. G. H. Frischat, Glastech. Ber., 44, 113 (1971).
78. G. H. Frischat, J. Mater. Sci., 6, 1229 (1971).
79. R. H. Doremus, unpublished results.
80. C. M. Hollabaugh and F. M. Ernsberger, unpublished results; see ref. 21, p. 33.
81. A. 1. Burggrafi' and 1. Cornelissen, Phys. Chem. Glasses, 5, 123 (1964).
82. G. Eisenman, in Glass Electrodesfor Hydrogen and Other Cations, G. Eisenmann,
Ed., Marcel Dekker, New York, 1967, p. 133.
83. M. H. Garfinkel and C. B. King, J. Am. Ceram. Soc., 53, 686 (1970).
84. G. Hetherington, K. H. Jack and M. W. Ramsay, Phys. Chem. Glasses, 6, 6 (1965).
85. S. N. Houde-Walker and D. T. Moore, Appl. Opt., 25, 3373 (1986).
86. T. Findakly, Opt. Eng., 24, 244 (1985).
87. R. V. Ramaswamy and R. Srivastava, J. Mod. Opt., 35, 1049 (1988).
88. L. Tronev and I. Savatinova, J. Mod. Opt., 35, 919 (1988).
89. C. C. Hunter and M. D. Ingram, Solid State Ionics, 14, 31 (1984).
90. O. L. A derson and D. A. Stuart, J. Am. Ceram. Soc., 37, 573 (1964).
91. R. L. Muller, Electrical Conductivity of Vitreous Substances, Consultants Bureau,
New York, 1971, p. 93.
92. D. Ravaine and 1. L. Souquet, Phys. Chem. Glasses, 18,27 (1977); 19, 115 (1978).
93. 1. F. Cordaro and M. Tomozawa, Phys. Chem. Glasses, 21, 74 (1980).
290 ELECTRICAL CONDUCTIVITY AND IONIC DIFFUSION
94. S. W. Martin and C. A. AngeU, Solid State Ionics, 23, 185 (1986).
95. M. D. Ingram, Philos. Mag., 860, 729 (1989).
96. S. R. Elliott and A. P. Owens, Phi/os. Mag., B60, 777 (1989).
97. A. Pradel, F. Henn, 1. L. Souquet, and M. Ribes, Phi/os. Mag., B60, 741 (1989).
98. M. Tomozawa, V. McGahay, and 1. M. Hyde, in Ceramics: Toward the 21st
Century, N. Soga and A. Kato, Eds., Ceramic Society of Japan, Tokyo, 1991, p.
580.
99. G. N. Greaves, in Ceramics: Toward the 21st Century, N. Soga and A. Kato, Eds.,
Ceramic Society of Japan, Tokyo, 1991, p. 793.
100. J. R. Hendrickson and P. 1. Bray, Phys. Chern. Glasses, 13, 43, 107 (1972).
101. M. Tomozawa and V. McGahay, J. Noncryst. Solids, 128, 48 (1991).
102. 1. M. Hyde and M. Tomozawa, Phys. Chern. Glasses, 27, 147 (1986).
103. R. H. Doremus, J. Am. Ceram. Soc., 67, C-150 (1984).
104. R. 1. Maurer, J. Chern. Phys., 9, 79 (1940).
105. H. Schiller, Ann. Phys., 83M, 137 (1927).
106. A. M. Venderovitch and V. 1. Chenykh, J. Tech. Phys. USSR, 18, 317 (1948).
107. 1. Vermeer, Physica, 22, 1257 (1956).
108. L. Zagar and E. Papanikolau, Glastech. Ber., 42, 37 (1969).
109. 1. L. Barton and M. Leblond, Verres Refract., 24, 225 (1970); J. Noncryst. Solids,
4, 220 (1979).
CHAPTER 16
DIELECTRIC AND MECHANICAL LOSS
In many substances mechanisms for dielectric and mechanical loss (internal
friction) are entirely different. However, in nonmetallic solids and liquids, there
is often a loss of both kinds that is related to the electrical conductivity of the
material.
Various mechanisms have been suggested for this loss, but none has been
universally accepted. Therefore, in this discussion experiments on each kind of
loss are discussed separately with no interpretation in terms of mechanism. For
each type, experimental methods and effects of frequency, temperature, and
glass composition on the loss are considered. In the final sections the relation
between these two types of loss and theories for them are treated. Reviews of
dielectric relaxation in glass are in Refs. 1-10.
EXPERIMENTAL MEASUREMENT OF DIELECTRIC LOSS
The charge Q on a conductor is proportional to the potential difference V
between this conductor and other conductors within the electric field of the
charge, so that
Q=CV
(1)
where C is called the capacitance. The capacitance depends on the geometrical
arrangement of the conductors and the material in between them called the
dielectric and is measured in farads, which are coulombs/volt. The property of
the material that determines the capacitance is called the dielectric constant e.
For a vacuum e is called eo, the dielectric constant of free space, and equals
291
292 DIELECTRIC AND MECHANICAL LOSS
8.85 X 10- 12 F/m.lfthe conductors are flat plates of area A a distance d apart,
the capacitance of this "condenser" or "capacitor" is given by
e
C=A-
d
(2)
If an alternating voltage is impressed across the plates of a condenser with
a vacuum dielectric, the current in the circuit leads the voltage by 90° . If the
dielectric is not a vacuum, the current often is not exactly 90° out of phase
with the voltage, giving rise to a power loss. This property can be described
by considering the dielectric constant to be a complex number with a real and
imaginary part,
e* = e' - ie"
(3)
In this case the capacitance given by Eq. 2 can also be considered to be a
complex quantity. The loss angle () by which the current deviates from a 90°
advance with the voltage is given by
e"
tan () = - (4)
e'
The complex dielectric constant is usually measured with an AC bridge,
such as a Schering bridge. ll A schematic diagram of such a bridge is given in
Fig. 1. The variable capacitors C N and C B are alternatively adjusted until the
detector shows a minimum current, first without the sample X and then with
it. At low loss, the real part of the capacitance C' of the sample is just the
difference between the two readings of C N, and tan () is proportional to the
difference between the readings of C B and CN' For tan () greater than about
0.1, these readings must be corrected by adding squared terms. l1 If the sample
OSCILLATOR
Fig. 1 Schematic diagram of a bridge circuit used to measure dielectric properties.
EFFECT OF FREQUENCY ON DIELECTRIC LOSS 293
is the dielectric of a capacitor with plates of area A a distance d apart, then 8"
can be calculated from tan () and Eq. 4.
In recent years a variety of automated capacitance and conductance bridges
have been developed and are available commercially, for example the Gen Rad
Model 1615 and 1689 (Digobridge)@ capacitance bridge, for frequencies
between 12 and 100 kHzY
The type of electrodes used in measuring the dielectric loss of glass can
substantially influence the results. The usual type of electrodes have been films
of metal deposited on the glass. With this type of electrode, it is necessary to
make a correction for the contribution of the normal DC resistivity of the
sample to the apparent value of 8". This correction is inversely proportional to
the frequency, so that at low frequency it is much larger than the other losses
in the glass, and makes results at these frequencies quite unreliable. Another
disadvantage of the film electrodes is that surface conductivity can contribute
to the loss. This contribution can be avoided by a third "ring" electrode, but
this electrode leads to additional complications in the measuring circuit. Silver
electrodes can also react with the glass.
Kim and Tomozawa 13 studied the influence of different electrode materials,
such as pastes and vapor-deposited silver and gold, and pretreatment of the
glass surface, on dielectric measurements. They found large differences between
measured dielectric constants and losses at lower frequencies, for example
below about 10 4 Hz at 250°C for a soda-lime silicate glass. Paste electrodes
showed the largest deviations but were not sensitive to surface preparation;
evaporated electrodes were quite sensitive to surface preparation. Silver elec-
trodes reacted strongly with a Li 2 0' 2SiO z glass at 400°C.
An alternative type of electrode is made of stainless steel disks, which are
simply pressed against the flat glass sample. 14 The electrodes and sample can
be held in vacuum for measurements at high temperatures. With this arrange-
ment, the glass is partially isolated from the electrodes, which are covered with
a thin oxide layer. The DC resistivity of a sample between such electrodes was
about three orders of magnitude lower than measured with silver electrodes
painted on the same sample.
EFFECT ON FREQUENCY OF DIELECTRIC LOSS
At high frequencies (above about 10 6 cycles/s at room temperature), the real
part of the dielectric constant changes little with frequency, and the imaginary
part is small. However, at lower frequencies there is a loss peak, and 8'
decreases with increasing frequency in the frequency range of the loss. Results
at 253°C for an alkali borosilicate glass containing 7.2 wt% Na 2 0, 8.7% K 2 0,
and negligible LizO and CaO, are shown in Figs. 2 and 3. These measurements
were made as described above, with stainless steel electrodes. 14 The increase in
loss at low frequencies probably results from the DC resistivity of the
sample, for which no correction was made. The values actually plotted are
(8' - 8 01 ,)/(8. - 8e.,) and ..)28"/(8. - 8e.,)' where 8 00 is the high-frequency dielec-
294 DIELECTRIC AND MECHANICAL LOSS
3
LOG FREQUENCY, cpI
Fig.:Z Reduced real part of the dielectric constant for an alkali borosilicate glass.
Points, experimental data; curve, theoretical. 14
3 4
LOG FREQIEJCY, cpI
Fig. 3 Reduced dielectric loss as a function of frequency for an alkali borosilicate glass.
Points, experimental data; curve, theoretical. 14
0.4
8
...
I.
...
- '== 0.3
-
02
1.0
o
o
0.8
'9
r 0.6
..
...
'9
r 0.4
'"
o.z
o
I
4
5
0.6
0.5
0.1
0,
5
.
z
EFFECT OF TEMPERATURE ON DIELECTRIC LOSS 295
tric constant, and B. is the estimated value of the "static" dielectric constant, or
the real part at zero frequency.
A number of earlier measurements of dielectric loss of silicate glass as a
function of frequency have been made. l - 3,15,16 Taylor l found that his loss
peaks for a number of soda-lime glasses and Pyrex borosilicate glass had about
the same frequency dependence; an example is shown in Fig. 4. Charles 15 found
a similar loss curve for a commercial soda-lime glass. The loss peaks found by
these investigators are somewhat broader than the one shown in Fig. 3. Taylor
and Charles made their measurements on samples with painted silver elec-
trodes. It is not certain whether the different experimental techniques are
responsible for the differences in the shape of the loss curves. Isard 17 found
some change in peak shape for Na 2 0' 4Si0 2 glass as a function of temperature,
using sodium amalgam electrodes, and he found an asymmetric peak, in
agreement with Fig. 3. Asymmetric loss peaks have also been found for
lithium 18 and cesium 19 silicate glasses.
Owen and Douglas measured some dielectric properties of fused silica. They
found that the dispersion curves of e' had the same shape at different
temperatures and for different fused silicas. Their loss curves were narrower
than those measured by Taylor and Charles, but similar to the one shown in
Fig. 3.
EFFECT OF TEMPERATURE ON DIELECTRIC LOSS
The loss peak and dispersion curve shift to higher frequencies as the tempera-
ture is increased. If the peak shape remains the same as the temperature is
?
..III
..
o
o
234
10 11 1 0 -r-
....
s
6
Fig. 4 Dielectric loss curve. for a soda-lime glass, measured by Taylor. 1
296 DIELECTRIC AND MECHANICAL LOSS
changed, the shift of the peak maximum gives a measure of the temperature
dependence of the loss. For glasses, the frequency at which the loss is a
maximum increases exponentially with reciprocal temperature following the
relation
fm = A exp ( ; )
where Q is the activation energy, R is the gas constant, T is the temperature,
and A is independent of temperature.
The activation energies of relaxation and electrical conduction for some
commercial and laboratory glasses are shown in Table 1. The activation energy
for relaxation was close to that for conduction for every glass examined
including many not listed in Table 1.
Gough, et al. 21 found a dielectric loss at high temperatures in alkali-free
borate glasses (alkaline earth or lead aluminoborates) that was related to the
lectrical conductivity of the glasses, even if the conductivity was electronic, as
for bismuth borate glasses. Except for these latter glasses, the conductivity is
probably ionic and results either from the metal ions or residual hydrogen ions.
Isard also concluded that dielectric loss in glass is related to conductivity,
whether it is electronic or ionic. 22 Mansingh et al. 23 found a dielectric loss in
an electronically conducting vanadium phosphate glass.
(5)
EFFECT OF COMPOSITION ON DIELECTRIC LOSS
High-frequency dielectric constants and power factors (power factor = cos 0
tan 0) at room temperature are summarized by Navias and Green;24 see also
Ref. 6. The high-frequency reduced dielectric constants e' / eo of some different
TABLE 1 Activation Energies (or Dielectric Relaxation and Electrical Conductivity
Activation energy
Composition (mol%) (kcal/mol)
Glass
type Si0 2 Na 2 0 CaO Relaxation Conductivity Refs.
Soda-lime 74.2 15.3 10.5 20.6 19.8
Soda-lime 70.4 19.1 to.5 19.2 18.8
Soda-lime 74.4 19.1 6.5 18.7 18.6
(commercial)
Pyrex borosilicate 80.0 4.1 23.9 22.2 1
Soda-lime 73.9 15.9 4.7 20.8 20.2 15
(Corning (080)
Fused silica 100.0 23.0 22.0 20
(600 -800°C)
MEASUREMENT OF MECHANICAL LOSS 297
glasses at 25°C are fused silica, 3.7; Pyrex borosilicate, 4.6; and commercial
soda-lime (Corning 0080), 7.2. The dielectric constant usually increases as the
amount of alkali in the glass increases. Factors for calculating the dielectric
constant from the composition are given by Scholze,zs as taken from Appen
and Brecker. 26
The power factor (tan 0) also increases as the amount of alkali increases.
Many measurements of tan 0 for glasses, particularly for small tan 0 values,
are not very accurate.
MEASUREMENT OF MECHANICAL LOSS
When a stress is applied to a material there is an instantaneous deformation
and sometimes a further deformation that increases with time. When the stress
is released there is an instantaneous elastic relaxation, but some of the
deformation may relax more slowly.
If a periodic stress S = So cos wt of frequency W/21C is applied to the
material, the deformation lags behind the stress and is proportional to cos
(wt - <5) because of these time-dependent relaxations. The tangent of the lag
angle <5 is called the internal friction. Two different experimental methods have
been used to measure this mechanical loss or internal friction in glass: the
torsion pendulum and the crystal oscillator.
In the torsion pendulum, a fine glass rod is twisted and the damping of its
oscillations observed. If there were no internal friction or external damping
forces the pendulum would oscillate through the angle of the initial twist.
However, internal friction causes this angle <Pl to decrease to <P2 in the
subsequent cycle. The logarithmic decrement In <Pd<P2 is equal to one-half of
the fractional energy loss E / E per cycle. In turn E / E is related to the
internal friction tan <5:
<PI E
In - = - = 1C tan <5
<P2 2E
(6)
Thus by measuring the deformation angles of a torsion pendulum after
successive oscillations it is possible to calculate the internal friction. The
frequency of the torsion pendulum usually is in the range from 0.05 to 10
vibrations / s.
The internal friction of glass can be measured at frequencies in the kilocycle
range by a piezoelectric driver-gage method. 27 One quartz bar drives a
composite oscillator of which the sample is a part, and another quartz bar acts
at the gage. The total energy loss in the composite oscillator is proportional to
the ratio of the voltage V" on the driver crystal to the voltage V 9 from the gage
crystal, and if the angle <5 is small, so that tan <5 <5, then
<5 = K V" Z (7)
Vgm,!r
298 DIELECTRIC AND MECHANICAL LOSS
where m is the total mass of the oscillator and j, is the resonant frequency of
the composite oscillator. The proportionality constant can be measured from
the half-width of the resonance peak. To find the internal friction of glass, two
samples differing in length by one-half of a wave length are used. Then
() = (m L () L - m. ().) (8)
m L - m.
where the m's are the masses of the larger and smaller samples and the ()'s are
the total losses calculated from Eq. 7, for the appropriate sample.
EFFECT OF FREQUENCY AND TEMPERATURE
ON MECHANICAL LOSS
The internal friction of glass has been measured as a function of temperature
at constant frequency because it is easier to change the temperature than the
frequency in the techniques mentioned above. It is unfortunate that no
measurements at constant temperature over a wide frequency range have been
made, because many properties of glass change with temperature. Thus it is
easier to compare theories of mechanical loss with measurements at constant
temperature than with those at constant frequency.
The internal friction of sodium silicate and a sodium-aluminum silicate glass
over a wide range of temperatures is shown in Fig. 5. At high temperatures the
loss probably results from large-scale relaxations in the silicate network. The
rate of these relaxations is related to viscous flow; they are discussed in more
detail in Refs. 28 - 3o Viscous flow and the glass transition are discussed in
Chapters 6 and 7, respectively.
At intermediate temperatures two internal friction peaks appear that are
related to ionic motion in the glass. These peaks are shown in Fig. 5 for a
sodium disilicate glass. The peak at low temperature is related to alkali ion
movement in the glass, whereas the peak at higher temperatures is related to
hydrogen ions in the glass. The reasons for these assignments are enlarged
upon in the next paragraphs.
The temperature for maximum internal friction can be measured for
different frequencies. At two different frequenciesf1 andf2 the temperatures T 1
and T 2 of maximum tan () are related by
In fl = -Q ( - ) (9)
f2 R T 1 T 2
where the activation energy Q is independent of temperature. The activation
energies for the low-temperature peaks of a number of alkali silicate glasses are
found to be close to those for electrical conductivity and alkali ion diffu-
sion, 31 - 34 just as for the activation energies of the dielectric loss peaks.
Furthermore, the height of the internal friction peak is related to the concen-
EFFECT OF FREQUENCY AND TEMPERATURE ON MECHANICAL LOSS 299
15
z
o
p
(.)
if
I
I
I
I
I
,
,
I
\
\
I
I
I
\
\ /
\ /
'-.../
I
I
J
I
I
I
I
I
I
I
I
I
I
I
.....-, I
/ , /
,-.....
10 0
)(10
'0
,j
5
II:
LLI
....
I
/
/
200 400
TaFERA TURE (e C )
Fig. 5 Internal friction of a Na 2 0' 3Si0 2 glass (dashed line) and a
Na20' Al 2 0 3 . 6Si0 2 glass (solid line) at 0.4 cycles/s as a function of temperature,
measured with a torsion pendulum. 37
<2 200
o
600
tration of alkali ion in the glass, usually becoming smaller as this concentration
becomes smaller, as described in the following section. Thus there appears to
be a definite connection between alkali ion motion and the low-temperature
peak. Mechanisms for this relaxation are discussed in the section on theories.
The internal friction peak at higher temperatures, sometimes called the
"intermediate temperature" peak is probably related to the motions of hydro-
gen ions in the glass. 35 A number of experimental results point to the
importance of hydrogen ions for this peak. First, there is a close correlation
between the rate of weathering of a silicate glass and the occurrence of the
peak. Glasses that weather rapidly show the peak, whereas those that are less
reactive do not. Weathering results from the exchange of hydrogen ions from
atmospheric water with alkali ions in the glass (see Chapters 13 and 14). The
rate of weathering is controlled by the rate of interdiffusion of alkali and
hydrogen ions in the glass. The addition of alkaline earth ions to the glass
reduces the diffusion coefficient of alkali ions and consequently the rate of
weathering. Aluminosilicates have a lower rate of weathering because the
aluminosilicate groups in glass have a lower ratio of hydrogen-to-sodium ion
affinity than do -SiO groups. Therefore, on the aluminosilicate glasses the
fraction of surface alkali ions that exchange with hydrogen ions is lower than
for other alkali silicate glasses. The internal friction peak at higher tempera-
300 DIELECTRIC AND MECHANICAL LOSS
tures becomes smaller as more alkaline earth or aluminum oxide is added to
an alkali silicate glass,36,37 and is absent in some commercial glasses contain-
ing these oxides and known for good weatherability.33.38,39
Second, Vaugin et al. 40 showed that when a fine glass fiber reacts with the
atmosphere an internal friction peak slowly develops at higher temperatures
than the alkali peak. Their fibers were stored in a desiccator and measured in
a vacuum, under which conditions this peak did not develop.
Third, DeWaal 41 studied the internal friction of a sodium disilicate glass
before and after exchange with hydrogen ions from a melt of NH 4 HS0 4 . He
treated the glass for 2.5 h at 275°C. At this temperature, the effective
interdiffusion coefficient of sodium and hydrogen ions is about 1.3 x 10- 11
cm z Is, so that the average distance of penetration of the hydrogen ions was
about 5 J.J.m. After this treatment DeWaal found a substantial increase in the
height of the second internal friction peak at higher temperature, as would be
expected if this peak resulted from motion of hydrogen ions.
Fourth, Abdel-Latif and D ay 42 were able to introduce a high-temperature
peak in an Li 2 0' Al 2 0 3 . 2SiO z glass that should not contain non bridging
oxygen atoms. The original glass did not show this peak, but after hydrogen
ions were introduced by ion exchange in molten ammonium acid sulfate for 21
h at 366°C such a peak appeared. Therefore the experimental evidence is in
favor of a connection between hydrogen ion motion in the glass and the
appearance of the high-temperature peak.
EFFECT OF GLASS COMPOSITION ON MECHANICAL LOSS
The effect of alkali ion concentration on peak height for number of different
silicate glasses is shown in Fig. 6. There is considerable scatter in the results
from one investigator to another for identical compositions, but for each
investigator there is a consistent increase in peak height with alkali oxide
concentration. These results show that the particular experimental technique
used, and the history of the samples, can influence the background contribu-
tions to the peak height. Results on some glasses containing a third oxide are
not consistent with those in Fig. 6; for example, in a glass containing 12.5
mol% Na 2 0, 12.5% A1 2 0 3 , and 75% Si0 2 , the peak height was about
12 x 10- 3 ,37 and in Pyrex borosilicate glass (4% Na20) it was about 10- 3 ,38
In fused silica with about 5-10 ppm by weight Na 2 0, the peak height was
measured to be about 3 x 10- 5 . 27
In sodium borate glasses with Na20 concentrations greater than about 15
mol%, the alkali ion peak behaves much the same as in sodium silicates,31.45
The temperature of maximum loss decreases as the sodium concentration
increases, as does the peak height, paralleling an increase in conductivity in the
glass. Below about 15% Na20, the peak is obscured by background damping,
since the temperatures approach the glass transition range.
The internal friction of sodium germanate glasses is quite similar to that of
(,() 9
Z
<t
8
z
o 7
()
CE 6
u..
<i
Z
ffi4
THEORIES OF DIELECTRIC AND MECHANICAL LOSS IN GLASS 301
X 10- 3
12
II
10
3
2
o
Si0 2 10 I 20 2 30 3 40 4
MOLE PER CENT No 2 0
Fig. 6 Height of the internal friction peak in binary alkali silicate glasses as a function
of alkali oxide concentration. ., Coenen;31 0, Deeg;43 0, Jagdt;44 6, Mohyuddin and
Douglas;34 \7. Forry.441 From Ref. 28.
sodium silicate glasses. 46 ,47 The alkali ion peak has an activation energy close
to that for electrical conductivity of the glasses and for sodium ion diffusion in
them, and the peak height is related to the sodium ion concentration. A higher
temperature peak is similar to the same peak in sodium silicate glasses, and is
also probably related to hydrogen ions in the glasses.
A mechanical loss peak has been found in an iron phosphate glass; this peak
has the same activation energy as the conductivity for the glass. 48 This result
is curious because the conductivity in this glass is electronic rather than ionic.
THEORIES OF DIELECTRlq AND MECHANICAL LOSS IN GLASS
Most theories of the alkali ion peaks in dielectric and mechanical loss in glass
have considered these peaks to result from short-range rearrangements of the
alkali ions in the glass. In dielectric loss this.rearrangement leads to an effective
302 DIELECTRIC AND MECHANICAL LOSS
dipole moment, and in mechanical loss it leads to a time-dependent change in
modulus.
The dielectric properties are usually described in terms of the complex
dielectric constant of Eq. 3. Alternative descriptions are the complex conduc-
tivity
a* = a' + ia"
(10)
both real and imaginary parts can depend on frequency. The complex conduc-
tivity is related to the complex dielectric constant as
8* = a*/iw
Another representative is the complex modulus M
(11)
M = M' + iM" = 1/8* = iw/a* (12)
as introduced by Macedo et al. 50 This modulus emphasizes data at higher
frequencies than the dielectric constant of Eq. 3, and therefore reduces
problems with electrode effects and direct current conduction.
The shapes of the loss peaks can be calculated by assumining an exponential
decay of current or deformation. For dielectric loss this assumption leads to a
complex dielectric constant of the form
8 - 8
8* = 8' - i8" = 8 + 0 ""
"" 1 - iwt
(13)
or
, 8 0 - 8""
8 = 8"" + 1 2 2
+w t
(14)
and
" (8 0 - 8",,)wt
8 =
1 + w 2 t 2
Here 8 0 is the static (DC) dielectric constant, 8""is the dielectric constant at
high frequency, w is 21t times the frequency, and t is a relaxation time.
For the internal friction tan (j can be found, based on similar equations, to
be 49
(15)
tan (j 2wt
= 2 2 (16)
(tan (j)mu 1 + w t
Equations 15 and 16 give symmetrical loss peaks that are considerably
narrower than those measured for dielectric and mechanical loss in glass. To
explain the broader peaks, it is necessary to assume that there is a spectrum of
relaxation times t, rather than a single time. This broadening of the loss peaks
can also be taken into account with the "b function" described in Chapter 7
REFERENCES 303
for structural and strain relaxation. Instead of a simple exponential, the decay
of the current or field follows the function
E = Eo exp( - t/t)b
(17)
Theories of dielectric and mechanical loss are reviewed in Refs. 4, 5, 7-10,
and 14. Elliott 8 reviewed models of dielectric relaxation and data for amor-
phous chalcogenides, phosphorus and arsenic. Angell 9 reviewed dielectric and
mechanical relaxation of silicate and fluoride glasses. Especially intriguing are
the trenchant comments of Dyre. 10 He emphasizes that at high frequencies the
real part of the conductivity a' follows a power law with an exponent for
0.7-1.0, as found in several experiments;5,22,51.52 however, he finds that .....
there is no basis for concluding that power laws are fundamental. . ." Dyre
discusses models involving hopping charge carriers, and concludes that al-
though they are simple and give reasonably good fits to experiments, other
models may be more appropriate. He lists open problems and suggestions for
future work: reliability of d{lta, additional kinds of measurements, relation of
loss to the scale of inhomogeneities, and the similarity between model predic-
tions (see also ref. 50a).
Because there is a close correlation between dielectric and mechanical loss
peaks and electrical conductivity, theories of conductivity (see Chapter 15)
also are pertinent to loss mechanisms. For example, the relationship between
high field conduction and dielectric relaxation was examined by Hyde and
Tomozawa,53 and they concluded that the weak electrolyte theory gave a
qualitative but not quantitative description of the data. These authors also
explored the relation between dielectric relaxation and thermodynamic
nonideality54 and the "b" function of Eq. 13 as applied to mixed alkali
glasses. 5 5 Ngai et al. 56 relate traditional relaxation results to spin-lattice
relaxation.
The conclusion is that there is no completely satisfactory explanation of
dielectric and mechanical relaxation in glasses, and that uncertainties in
measurements and interpretations remain.
REFERENCES
1. H. E. Taylor, J. Soc. Glass Technol., 41, 350 (1957); 43, 124 (1959).
2. 1. M. Stevels, in Handbuch der Physik, Vol. 20, Springer-Verlag, Berlin, 1957, p. 350.
1 A. E. Owen, in Progress in Ceramic Science, 1. E. Burke, Ed., MacMillan, New York,
1961
4. M. Tomozawa, in Treatise on Materials Science and Technology, Vol. 12, M.
Tomozawa and R. H. Doremus, Eds" Academic Press, San Diego, CA, 1977, p. 281
5. A. K. Jonscher, Dielectric Relaxation in Solids, Chelsea Dielectric, London, 1983.
6. N. P. Bansal and R. H. Doremus, Handbook of Glass Properties, Academic Press,
San Diego, CA, 1986, Ch. 14, p. 450.
304 DIELECTRIC AND MECHANICAL LOSS
7. M. D. Ingram, Phys. Chem. G/asses, 28, 215 (1987).
8. S. R. Elliott, Adv. Phys., 36, 135 (1987).
9. C. A. Angell, Chem. Rev., 90, 523 (1987).
10. 1. C. Dyre, J. Noncryst. Solids, 135,219 (1991).
11. F. A. Laws, Electrical Measurements, McGraw-Hill, New York, 1938, p. 417.
12. Gen. Rad Corp., Bolton, MA, Instruction Manual, 1983.
13. C. Kim and M. Tomozawa, J. Am. Ceram. Soc., 59, 127, 321 (1976).
14. This book, first edition, p. 192.
15. R. J. Charles, J. Appl. Phys., 32,1115 (1961); J. Am. Ceram. Soc., 45,105 (1962).
16. J. Volger, J. M. Stevels and C. van Amerongen, Philips Res. Rep., 8, 452 (1953).
17. 1. O. Isard, Proc. IEEE (London), 100B, 22, 440 (1961).
18. L. Heroux, J. Appl. Phys., 29, 1639 (1958).
19. D. R. Uhlmann and R. M. Hakim, J. Phys. Chem. Solids, 32, 2652 (1971).
20. A. E. Owen and R. W. Douglas, J. Soc. Glass Technol.,43, 159 (1959).
21. E. Gough, J. O. Isard and J. A. Topping, Phys. Chem. Glasses, 10, 89 (1969).
22. J. O. Isard, J. Noncryst. Solids, 4,357 (1970).
23. A. Mansingh, J. M. Reyes and M. Sager, J. Noncryst. Solids, 7, 12 (1972).
24. L. Navias and R. L. Green, J. Am. Ceram. Soc., 29, 267 (1946).
25. H. Scholze, Glass, Springer-Verlag, Berlin, 1991, pp. 318-319.
26. A. A. Appen and R. J. Bresker, J. Tech. Phys. USSR, 22, 946 (1952).
27. J. W. Marx and J. M. Sivertsen, J. Appl. Phys., 24, 81 (1953).
28. J. L. Hopkins and C. R. Kurkjian, in Physical Acoustics, Vol. II, Part B, Academic
Press, New York, 1965, p. 91.
29. R. W. Douglas, P. J. Duke and O. V. Mazurin, Phys. Chem. Glasses, 9, 169 (1968).
30. K. L. Ngai and G. B. Wright, Eds., J. Noncryst. Solids, 131-133 (1991).
31. M. Coenen. Z. Elektrochem., 65, 903 (1961).
32. H. Rotger, Glastech. Ber., 19, 192 (1941).
33. J. V. Fitsgerald, J. Am. Ceram. Soc., 34, 314, 339, 399 (1951).
34. J. Mohyuddin and R. W. Douglas, Phys. Chem. Glasses, 1, 71 (1960).
35. R. H. Doremus, J. Noncryst. Solids, 3, 369 (1970).
36. R. J. Ryder and G. E. Rindone, J. Am. Ceram. Soc., 43, 662 (1960).
37. D. E. Day and W. E. Steinkamp, J. Am. Ceram. Soc., 52,571 (1969).
38. P. L. Kirby, J. Soc. Glass Technol., 39, 385 (1955).
39. G. J. Copley and D. R. Oakley, Phys. Chem. Glasses, 9, 141 (1968).
40. L. Vaugin, J. C. Breton, P. Gobin, Verres Refract., 23,174 (1969).
41. H. deWaal, J. Am. Ceram. Soc., .52, 165 (1969).
42. A. I. A. Abdel-Latif and D. E. Day, J. Am. Ceram. Soc., 55, 254 (1972).
43. E. Deeg, Glastech. Ber., 31, 1, 85, 124, 229 (1958).
44. R. Jagdt, Glastechn. Ber. 33, 10 (1960).
44a. K. E. Forry, J. Am. Cer. Soc. 40, 90 (1957).
45. K. H. Karsch and E. Jenckel, Glastech. Ber., 34, 397 (1961).
REFERENCES 305
46. C. R. Kurkjian and J. T. Krause, J. Am. Ceram. Soc., 49, 134 (1966).
47. 1. E. Shelby and D. E. Day, Phys. Chern. Glasses, 11, 224 (1970).
48. R. A. Miller and K. W. Hansen, J. Elect. Soc., 116, 254 (1969).
49. C. Zener, Elasticity and Anelasticity of Metals, University of Chicago Press, 1948,
pp. 6ft'.
50a. R. H. Doremus, J. Appl. Phys., 41, 3366 (1970).
SO. P. B. Macedo, C. T. Moynihan and R. Bose, Phys. Chern. Glasses, 13,171 (1972).
51. A. E. Owen, J. Noncryst. Solids, 25, 372 (1977).
52. G. A. Niklasson, J. Appl. Phys., 66 4350 (1989).
53. 1. M. Hyde and M. Tomozawa, Phys. Chern. Glasses, 27, 147 (1986).
54. 1. M. Hyde and M. Tomozawa, J. Noncryst. Solids, 109, 18 (1989).
55. M. Tomozawa, 1. M. Hyde, J. F. Cordaro, and M. Yoshiyagawa, Phys. Chern.
Glasses, 33, 69 (1992).
56. K. L. Ngai, Y. Strom and O. Kanest, Phys. Chern. Glasses, 33 109 (1992).
CHAPTER 17
OPTICAL ABSORPTION IN GLASSES
Optical absorption in glass in the visible spectral region colors the glass,
leading to applications in optics and to many decorative uses. Absorption and
transmission in the infrared and ultraviolet are important in optical uses in
instruments. Absorption in all three regions can be used to study short-range
structure of glasses, that is, the immediate surrounding of the absorbing atom.
In recent years there have been many new exciting applications of glasses in
optics: optical fibers as waveguides, laser hosts and optical components, glasses
that change absorption with light level (photochromic) and electric field
(electrochromic), gradient index lenses, new glasses such as fluorides with
different optical properties from silicates, planar wave guides, sensors, and
glasses with nonlinear optical properties.
Data on the refractive indices of glasses as a function of glass composition,
wavelength, and temperature are given in Refs. 1-8; Refs. 3 and 4 contain large
numbers of references to sources of data. The optical constants n (refractive
index) and k (extinction coefficient or absorption index) of a large number of
solids over a wide range of wavelengths, with critical assessments, are given in
Ref. 8. Included are the amorphous solids silica, silicon, silicon monoxide,
silicon nitride, carbon and polyethylene.
In this chapter, the absorption of different glasses is discussed separately in
the following order: . fused silica, other network oxides, alkali and alkaline-
earths oxides, transition-metal oxides, chalcogenides, and small metallic par-
ticles in glass. Then there are sections on the recent developments mentioned
above.
306
FUSED SILICA 307
FUSED SILICA
Fused silica is useful as an optical material because of its high transmission of
visible and ultraviolet light. The transmission edge in the ultraviolet depends
on the purity and state of oxidation (stoichiometry) of the silica, and therefore
on its method of manufacture. Figure 1 shows the optical absorption at
intermediate wavelengths of different fused silicas that are listed in Chapter 1,
Table 3. The table also gives the methods of manufacture of the various types
of fused silica and their approximate Impurity contents. References to reviews
on fused silica are given in Chapter 1.
The optical constants nand k are listed for amorphous silica for wavelengths
from 0.05 J.J.m to 500 J.J.m by Philipp.9 He discusses measurement methods and
evaluates the data critically.
The absorption edge for amorphous silica in the ultraviolet is at about
0.16-0.17 J.J.m (about 8 eV). Absorption at longer wavelengths results from
impurities in the silica, as described by Sigel;lO the most common impurities
are alkalis, alkaline earths, and iron. There is a reduced center that causes
absorption at about 0.24-0.28 J.J.m in fused silicas melted in mildly reducing
conditions, as for Type I silica in Fig. 1. This center probably is associated with
an impurity in the silica such as aluminum. ll . 12 This band emits fluorescence
radiation at 0.28 and 0.39 J.J.m when it absorbs.
100
90
c: 80
0
en 70
en
E 60
en
c:
0
... 50
....
... 40
c:
Q)
0 30
...
Q)
a.. 20
10
0
.14 .16
I
m
I
.20 .24 .28 .32
4.0
5.0
1.5 2.0
3.0
wavelength. pm
Fig. 1 Optical transmission of different types of fused silica (see Chapter 1, Table 2),
in the near ultraviolet, visible, and near infrared. Sample thickness about one mm.
308 OPTICAL ABSORPTION IN GLASSES
When silicates are irradiated with ultraviolet light, X-rays, or y-rays ("ioniz-
ing" radiation) or atomic particles, defects are formed that absorb light in the
ultraviolet and visible parts of the electromagnetic spectrum. These irradiation
effects in glasses, especially silica, are reviewed by Frieble and Griscom in Refs.
13, 14 and 15.
The absorption band of fused silica in the near infrared at 2.7 p.m is
associated with hydroxyl groups in the silica. 16 . 17
The absorption of vitreous silica in the infrared is shown in Fig. 2. The
absorption bands are the same for different types of fused silica and can be
considered to result from transitions of the silicon-oxygen network that are
not disturbed by the impurities in fused silica. The band at about 1100 em- 1
is not found in the Raman spectrum, and is attributed to the stretching
vibration of the -Si-O-Si- bond. 10 . 18 ,19 The lack of a Raman band indicates
conditions of high symmetry, in agreement with the structure of fused silica
suggested in Chapter 3 in which there is considerable short-range order in the
arrangement of the silicon-oxygen tetrahedra. The band at 465 cm -1 has been
assigned to "rocking" of the Si-O-Si bond. 20 The lower-intensity bands at
intermediate frequencies involve various bending modes mixed with the
stretching and rocking modes of the Si-O-Si bonds.
Absorption and reflection of vitreous silica in the ultraviolet at frequencies
higher than the absorption edge (wavelengths below about 0.16 Jlm) have been
measured by Loh,22 Philipp,9,23 Sigel, 1 0 and Tarvio and Schnatterly.231 The
reflectance of fused silica and quartz at these higher energies is shown in Fig.
3. The similarity between these curves shows that optical absorption at these
energies is determined by the short-range structure of the silicon-oxygen
tetrahedra, which is the same in both amorphous and crystalline silica. This
result is consistent with the random-network structure for fused silica discussed
c
o
-.:
Q.
..
o
.,
,g
<{
Wave Number
Fig. 2 Optical absorption of fused silica in the infrared.
FUSED SILICA 309
25
W
20
f!
u
W
-I 15
U.
W
a::
I-
Z 10
W
U
a::
W 2
a. 5
o
6
14
8 10 12
PHOTON ENERGY (eV)
Fig. 3 The reflectance of fused silica and quartz in the ultraviolet,lo The values for
fused silica have been lowered by 5%.
in Chapter 3, where it was shown that at short distances of the order of less
than 10 A the crystalline and amorphous structures are virtually identical.
By studying silicate glasses containing various amounts of alkali, Siegel
showed that the 11.5 e V band is. characteristic of the silicon-oxygen network
and is not affected by these additions. tO However, the band at 10.2 eV is
apparently not present in silicate glasses of the disilicate composition (67%
Si0 2 , 33% alkali oxide); in these glasses there is another band at 8.5 eV.
Theoretical calculations of the electronic structure of silica have employed
valence band 24 and molecular orbital 25 . 26 approaches. The 11.5eV band is
interpreted to result from band-to-band electronic transitions 24 or atomic-like
electronic transitions. 25 Loh and Ruffa suggest that the 1O.2eV band results
from an "exciton" (a bound electron-hole pair). Sigel discussed this assignment
as a possible way to explain the shift of the 10.2eV band to 8.5eV, which could
result from the change in the effective dielectric constant of the glass as alkali
is added. tO Other calculations of Si0 2 electronic structure are given in Refs. 27
and 28.
From a study of the ultraviolet relfectance of mixed silicon and oxygen films,
Philipp concluded that amorphous substances of all compositions between Si
and Si0 2 can be formed, and that they are made up of random mixtures of
Si-Si and Si-O bonds with the silicon atoms being four coordinated. 23 He
found evidence that these materials are not mixtures of silicon and silica.
310 OPTICAL ABSORPTION IN GLASSES
OTHER NETWORK-FORMING OXIDES
The approximate ultraviolet wavelengths at which the optical transmission
drops sharply (the absorption edge) for simple oxide glasses in micrometers are
Si0 2 , 0.16; B 2 0 3 ,29 0.17; Ge0 2 ,30 0.22; and P205,31 0.27. The higher edge for
P 2 0 5 may occur because of the oxygen atoms doubly bonded to the phosphor-
ous that are not part of the phosphorus-oxygen network.
The infrared spectrum of vitreous germania is similar to that of fused silica,
but shifted to lower frequencies, with a strong absorption band at about
880cm -1 resulting from -Ge-O-Ge- stretching vibration and bands at lower
frequencies corresponding to those in silica. 32 - 35 The infrared spectrum of
amorphous germania is similar to that of the hexagonal crystalline form, but
different from that of the tetragonal crystalline form. This result is consistent
with a germanium coordination number of four in amorphous germania, since
in the hexagonal form germanium is four-coordinated, whereas in the tetra-
hedral it is six-coordinated.
The infrared absorption spectrum of amorphous anhydrous boron oxide
(B 2 0 3 ) has been measured by several workers. 36 - 39 Strong absorption bands
are found at 1260 cm - 1 and 718 cm - 1, with a broad band at lower frequencies,
and a shoulder on the 1260cm- 1 band at about 1370cm- l , as shown
schematically in Fig. 4. The raman spectrum 38 shows a very intense band at
,2
8 1 0 1
G.o l S.OI
S.OI G.O I BIOI
S.OI
1
200
400
800 800
Wove Number, cm 1
1000
1200
1400
1,0
,8
>-
"i .8
c
.5
:0:
,4
II::
o
o
Fig. 4 Comparison of strong infrared absorption lines in vitreous silica, germania, and
boric oxide.
GLASSES CONTAINING ALKALI OXIDE 311
808cm- l and a strong band at 1260cm- l . Krogh-Moe 39 has interpreted these
results in terms of the boroxol structure of vitreous B 2 0 3 , which from X-ray
measurements appears to be the correct one (see Chapter 3). In this structure
planar boroxol rings with three boron and three oxygen atoms are linked
together by other B-O bonds. The band at 1260 cm - 1 is assigned to the
stretching vibration of the B-O bonds linking the boroxol groups. In the ideal
case the vibration giving rise to this band should be inactive, but because of
its coupling with its surroundings, the selection rules are relaxed. As water
reacts with vitreous B 2 0 3 the intensity of this band decreases. 4o The B-O
bonds linking the boroxol groups should be the most reactive, consistent with
this result.
The Raman line at 808 cm - 1 has a degree of depolarization which indicates
that it results from a symmetrical vibration. 39 This vibration is considered to
be a "breathing" motion of the oxygen atoms in the boroxol ring;41.42 this
vibration is inactive in the infrared. The band at 718 cm - 1 is assigned to an
out-of-plane vibration of the boroxol ring. These assignments are therefore
consistent with the boroxol structure of vitreous B 2 0 3 and strengthen the
evidence for this structure.
The infrared spectrum of vitreous arsenic trioxide has been discussed by
Wong and Angell. 19
GLASSES CONTAINING ALKALI OXIDE
As alkali oxide is added to silica, the infrared absorption band at 1100 cm - 1
decreases and new bands at 1075 and 940cm- 1 develop.lO,19.43-48 The band
at 940 cm - 1 has been assigned to the Si -0 stretching vibration when the
oxygen is not bonded to another silicon (non bridging oxygen), and the
1075-cm -1 band is the llOO-cm -1 Si-O stretching band shifted by the
presence of SiONa + groups. A Raman band at 540cm -1 can be assigned to
bond- bending involving a non bridging oxygen atom. 49
Similar results for the infrared spectra of the alkaline-earth silicates have
been found,18,19 supporting the interpretation that the changes with respect to
fused silica result from the introduction of nonbridging oxygen ions.
In the far infrared the absorption of a silicate glass (Corning 0211) was
found 50 to increase with the square of the frequency in the range from 10 to
100 cm - 1. This absorption was interpreted to result from the excitation of
lattice vibrations (phonons) by the alkali ions and other lattice-breaking ions
in the glass. In fused silica the absorption in this frequency range is much lower
and apparently results from charged defects, either associated with impurities
or intrinsic in the silica lattice. 50
Sigel found that the optical density in the ultraviolet at wavelengths longer
than the absorption edge (about 0.16 pm for fused silica) was directly propor-
tional to the alkali concentration in the glass. 10 The intensity of absorption
increased in the order of lithium, sodium, and potassium for a given alkali
312 OPTICAL ABSORPTION IN GLASSES
concentration. When aluminum was added to the alkali silicate glasses, the
absorption decreased. These results indicate that this absorption is associated
with the non bridging oxygen ions introduced with the alkali ions; when
aluminum is added these ions are associated with it, rather than increasing the
number of non bridging oxygens. The size of the alkali ions influences the
electric field at the non bridging oxygen ions, changing the absorption. It is not
clear if this absorption results from broadening of the 8.5 e V band or represents
formation of a new band.
At shorter wavelengths reflection spectra of alkali silicate glasses indicated
absorption bands at 11.5 and 8.5 eV, as mentioned in the preceding section. 10
The 11.5 eV band is also present in fused silica and is therefore interpreted to
result from electronic transitions associated with the silico.n-oxygen lattice. The
8.5 eV band is also found in alkaline-earth silicates, and its position is not
much affected by the type lattice-breaking cation. This band could result from
a shift of the 10.5 eV band in silica, as discussed in the preceding section.
References to measurements of infrared optical absorption of multicompo-
nent alkali and alkaline-earth silicate glasses are given by Wong and Angell. 19
They show no particularly different features from absorption of binary silicates.
When alkali oxide is added to boron oxide, the infrared band at 1260 cm - 1
decreases in intensity and a new peak forms 37 ,43 at about 1400cm 1 . This
change can be interpreted to result from the reaction of the boron-oxygen
bonds linking the planar boroxol rings with alkali oxide to form boron atoms
coordinated to four oxygen atoms, the excess charge of the boron being
compensated by the alkali ions. This continuous change in the coordination
number of boron with addition of alkali has been found with other techniques,
as described in Chapter 3. Alkaline-earth borates show similar changes in the
infrared spectrum as alkaline-earth oxides are added. 19
When sodium oxide is added to boron oxide, the ultraviolet absorption edge
is not much affected up to about 15mol% Na 2 0. 29 This result is consistent
with the interpretation above of the changing boron coordination number with
addition of alkali, and contrasts with the increase in ultraviolet absorption in
silicate glasses caused by the introduction of non bridging oxygen ions. In the
borates all oxygens are linked to boron atoms and there are no non bridging
oxygen ions. Above about 15 mol% Na 2 0, the ultraviolet absorption edge
moves sharply to higher wavelengths. This increase in absorption is probably
related to other changes in properties at this composition, known as the
"borate anomaly."
The infrared spectra of a variety of alkali and alkaline-earth phosphates
were very similar,19 indicating that the absorption bands resulted from the
vibration of phosphorus-oxygen groups. These metaphosphates have a chain-
like structure, and the spectra are consistent with calculations based on this
structure. 19 In the ultra violet, the addition of alkali or alkaline-earth oxides
to phosphorous oxide shifts the absorption edge to lower wavelengths, rather
than higher ask for other glass formers. This shift may occur because of tighter
oxygen lattice.
The addition of alkali oxide to germanium induces a larger shift in the main
TRANSITION METAL IONS 313
infrared absorption band than for the same addition to silica. 32 The larger shift
apparently results because the coordination number of germanium with
oxygen is changing from four to six as alkali is added.
TRANSITION METAL IONS
A variety of colors in glasses are caused by transition metal ions in them, often
in small concentrations. Thus the green color observed for thick slabs of most
commercial glasses results from absorption of impurity ferric ions in the glass,
and some absorption of this ion in the ultraviolet persists even when it is
present in concentrations of less than 1 part/million. Other familiar coloring
ions for glass are chromium for green, cobalt for blue, and manganese for
purple.
The absorption bands for several different transition metal ions in glass are
summarized in Table 1. Also given in the table are the most common colors
TABLE 1 Visible Optical Absorption in Soda-Lime Silicate Glasses
of Transition Metal Ions
Coordination Color
No. of d Abs. No. with of
Ion electrons max. (Ilm) oxygen Glass Remarks Refs.
Cr 3 + 0.66 6 Green 51,62,64
0.45
Ti H 0.57 6 Purple Borosilicate 52
glass
V 4 + 1 1.12 6? Red 53
V H 2 0.645 6 Green 53
0.425
Mn H 4 0.50 6 Purple 52
Mn H 5 0.435 4,6? Brown 52, 54, 55
Fe H 5 0.41 4? Green Potassium 56-58
silicate
Fe H 6 1.10 4,6? Blue 56,58
Co 2 + 7 0.56 6 Blue Low alkali 59-61
borate
0.60 4 High alkali
borate
Ni H 8 1.33 6 Purple, Low alkali 59
0.76 grey borate 60
0.42 61
1.19
0.68-0.49 4 High alkali
borate
Cu 2 + 9 0.79 6 Blue 53,58
314 OPTICAL ABSORPTION IN GLASSES
derived from each ion, its coordination number with oxygen, and the number
of d electrons.
These visible absorption bands result from electron transitions of the 3d
electrons of the ions. When the transition metal ions are coordinated with
other ions, the energy levels of these d electrons are split by the electric field of
the coordinating ions, instead of being degenerate as in the free ion. The
d-electron orbitals are strongly directional, so the splitting is sensitive to the
arrangement of the surrounding ions, and the electronic transitions and
resulting absorption spectra can be used to study the coordination numbers of
the central ions. The theory of these effects, called "ligand field" theory, was
first developed by H. Bethe, and its application to glasses has been discussed
in detail by Bates,5! and also in Refs. 10 and 19. Various experimental
measurements on spectra of transition metal ions in glass are reported in Refs.
10, 19 and those in Table 1.
The assignment of coordination numbers given in Table 1 was mostly
determined from the absorption spectra. In some cases (iron, cobalt, and
nickel), both tetrahedral (4) and octahedral (6) coordination is possible,
depending on the compositon of the glass. Unequivocal determination of the
coordination number from the optical spectrum alone is not always possible,
for example, in the case of iron, so other techniques such as Mossbauer
spectroscopy and electron spin resonance have been used to help in deciding
on the correct coordination number.
OTHER GLASSES AND IONS
The optical properties of amorphous semiconductors are discussed in a series
of articles in Ref. 76; see also Refs. 19, 77, and 78. Optical properties of halide
glasses are reviewed in Ref, 79. Some recent studies of rare earth ions in glass
are listed in Table 2. Tellurium in glass was described in Ref. 80, and
neptunium in Ref. 81.
METALLIC PARTICLES
Small metallic particles dispersed in glass absorb light and can develop striking
colors. Best known of these glasses is gold ruby glass. which has been known
since the seventeenth century. Faraday recognized that the color of gold ruby
glass resulted from finely divided gold particles. 82 This glass is made by
dissolving gold in the glass melt, as an ion, in which state the gold is retained
when the glass is cooled rapidly.83 To form the gold particles the glass is
reheated to an intermediate temperature region. Certain agents, such as
antimony oxide, in the glass aid nucleation of the particles, or they can be
nucleated by ultraviolet, X-ray, or y-radiation if a radiation-sensitive ion such
NEW APPLICATION OF GLASS IN OPTICS 315
TABLE 2 Optical Studies of Rare-Earth Ions
Ion
Symbol
Refs.
Lanthanum
Cerium
Praseod yni urn
Neodymium
Samarium
Europium
Gadolinium
Terbium
Holmium
Erbium
Ytterbium
La
Cr
Pr
Nd
Sm
Eu
Gd
Tb
Ho
Er
Yb
66
63,64
67
19,65
68
65, 70
71
72
73
74
75
as cerium is present. 83 The growth of the particles takes place by diffusion of
gold atoms or ions to the particles. 84
The color of gold ruby glass results from an absorption band at about
0.53 J1.m as shown in Fig. 5. This band comes from the spherical geometry of
the particles and the particular optical properties of gold. 85 It can be consider-
ed as a "plasma-resonance" band, in which the free electrons in the metal are
considered as a bounded plasma. These electrons oscillate collectively at a
particular frequency in the bulk metal, known as the plasma-resonance
frequency. The spherical boundary condition of the particles shifts this reson-
ance oscillation to lower frequencies (longer wavelengths).
The size of the gold particles influences the absorption. For particles larger
than about 200A in diameter, the band shifts to longer wavelength as the
oscillation becomes more complex. 85 For smaller particles, the bandwidth
progressively increases because the mean free path of the free electrons in the
particles is about 400 A, and is effectively reduced. 86
Silver particles in glass color it yellow, resulting from a similar absorption
band at 0.41 J1.m. 87 Copper has a plasma absorption band at 0.565 J1.m for
copper particles in glass. 88
NEW APPLICATION OF GLASS IN OPTICS
A large number of new uses of glass involve its optical properties. These are
described briefly, with references.
The development of silica (Si0 2 ) glass fibers for long distance optical
communication has been a major technological achievement, jointly worked
out by America Telephone and Telegraph and Corning Glass. The fibers must
be drawn to great lengths (kilometers) and must be extremely strong to prevent
their fracture. Information on the making of fibers and their applications is
316 OPTICAL ABSORPTION IN GLASSES
16
2
- 25°C
---- 514°C
14
i 12
E
(J
....-
10
o
;;:
u..
UJ 8
8
z
o
t 6
0::
CD
c( 4
o
0.35 0.40 0.45 0.50 0.55 0.60 0.65 0.70
WAVELENGTH, MICRONS
Fig. 5 Absorption spectrum of gold particles about 200 A in diameter in glass.
given in Ref. 89; a review of optical propagation theory and its relation to fiber
properties is given in Ref. 90; other reviews on fibers are given in Refs. 91, 92
and 92a.
Optical waveguides in bulk glass can be prepared by ion exchange in the
glass surface, for example of silver ion for sodium, to change the refractive
index in a surface layer. 93 - 95 There has been considerable work on diffusion
in ion exchange, both concentration and field driven, and the relation of the
ionic concentration to the refractive index. 93 - 95
Glass is an excellent laser host, and also can be used for active and passive
optical components in laser systems. 2 ,96
Gradient index lenses result when the index of refraction of a material
changes continuously in such a way as to focus light rays. Such an index
gradient can be formed in a glass by exchanging ions; again exchange of silver
for sodium ions in a glass is a favorite method for making the gradient, because
such exchange results in a relatively large index change. There is a review in
Ref. 97, and papers from meetings on these lenses have been published in
Applied Optics. 98
Photochromic glasses that change their optical absorption when they are in
REFERENCES 317
visible light are reviewed in Refs. 99 and 100. One example is a glass containing
tiny silver chloride particles that are sensitive to light. Electrochromic glasses
change their absorption in response to an electrical field;101.102 many are based
on tungsten oxides.
The change in optical absorption or refractive index of a material with light
intensity at high intensities is called nonlinear optical behavior. Such changes
may lead to optical switches and other devices, and possibly to all-optical
amplifiers, sensors, switches, rectifiers, and other circuits and devices. Certain
components in a glass can give rise to enhanced optical nonlinearity; examples
are small metallic and semiconductor particles, and heavy metal ions giving
high refractive index in the glass, such as lead, bismuth, titanium, tantalum,
tellurium and niobium. A review is given in Ref. 103.
REFERENCES
1. J. Fanderlik, Optical Properties of Glass, Elsevier, Amsterdam, 1983.
2. T. S. Izumitani, Optical Glass, Kyoritsu Shupp an, Tokyo, 1984; Translation
American Institute of Physics, New York, 1986.
3. N. P. Bansal and R. H. Doremus, Handbook of Glass Properties, Academic Press,
San Diego, 1985, p. 539.
4. O. V. Mazurin, M. V. Streltsina, and 1. P. Shivaiko-Shaikovskaya, Handbook of
Glass Data, Parts A, B, and C, Elsevier, Amsterdam, 1984-1987.
5. H. Scholze, Glass, Springer-Verlag, Berlin, 1991, p. 214tr.
6. D. R. Uhlmann and N. J. Kreidl, Eds., Optical Properties of Glass, American
Ceramic Society, Westerville, OH, 1991.
7. W. Vogel, in D. R. Uhlmann and N. J. Kreidl, Eds., Optical Properties of Glass,
American Ceramic Society, Westerville, OH, 1991, p. 1.
8. E. D. Palik, Ed., Handbook of Optical Constants of Solids, Vols. I and II, Academic
Press, New York, 1985 and 1991.
9. H. R. Philipp, in E. D. Palik, Ed., Handbook of Optical Constants of Solids, Vol.
I, Academic Press, New York, 1985, p. 749.
10. G. H. Sigel, in Treatise on Materials Science and Technology, Vol. 12, M.
Tomozawa and R. H. Doremus, Eds., Academic Press, San Diego, CA, 1977, p. 5.
11. G. Hetherington, K. H. Jack, and M. W. Ramsay, Phys. Chem. Glasses 6, 6 (1965).
12. See also Glass Science, 1st edn., p. 320.
13. E. J. Friebele and D. L. Griscom, in 1Teatise on Materials Science and Technology,
Vol. 17, M. Tomozawa and R. H. Doremus, Eds., Academic Press, San Diego, CA,
1979, p. 257.
14. E. 1. Friebele, in D. R. Uhlmann and N. 1. Kreidl, Eds., Optical Properties of Glass,
American Ceramic Society, Westerville, OH, 1991.
15. D. L. Griscom, J. Ceram. Soc. In., 99, 923 (1991).
16. V. Garino-Canina, C.R., 239, 705 (1954).
17. R. V. Adams and R. W. Douglas, J. Soc. Glass. Technol.,43, 147 (1959).
318 OPTICAL ABSORPTION IN GLASSES
18. J. Simon, in Modern Aspects of the Vitreous State, Vol. I, J. D. Mackenzie, Ed.,
Butterworths, London, 1960, p. 138.
19. 1. Wong and C. A. Angell, Glass Structure by Spectroscopy, Marcel Dekker, New
York, 1976.
20. R.1. Bell, P. Dean, and D. C. Hibbins-Butler, J. Phys., 1, 299 (1968); 3, 2111 (1970);
4, 1214 (1971).
21. A. Kats and 1. M. Stevels, Philips Res. Rep., 11, 115 (1956).
22. E. Loh, Solid State Commun. 21, 269 (1964).
23. H. R. Philipp, Solid State Commun., 4, 73 (1966); J. Phys. Chem. Solids, 32, 1935
(1971).
23a. C. Tarrio and S. E. Sc natterly, J. Opt. Soc. Am., BI0, 952 (1993).
24. A. E. Ruffa, Phys. Status Solidi, 29, 605 (1968).
25. M. H. Reilly, J. Phys. Chem. Solids, 31, 1041 (1970).
26. A.1. Bennett and L. M. Roth, J. Phys. Chem. Solids, 32, 1215 (1971).
27. E. P. O'Reilly and 1. Robertson, Phys. Rev., B/27, 3780 (1983).
28. K. Huber, A. Stern, and E. D. Klinkenberg, Phys. Status Solidi, 136, 211 (1986).
29. B. D. McSwain, N. F. Borrelli, and G. 1. Su, Phys. Chem. Glasses, 4, 1 (1963).
30. A. 1. Cohen and H. L. Smith, J. Phys. Chem. Solids I, 301 (1958).
31. E. Kordes and E. Worster, Glastech. Ber., 32, 267 (1959).
32. E. R. Lippencott, A. V. Valkenburg, C. E. Weir, and E. R. Bunting, J. Res. Natl.
Bur. Stand., 61,61 (1958).
33. V. V. Obukhov-Denisov, N. N. Sobolev, and V. P. Chemisinov, Opt. Spect.
(USSR), 8, 267 (1960).
34. M. K. Murthy and E. M. Kirby, Phys. Chem. Glasses, 5, 144 (1964).
35. B. T. K. Chen and G. J. Su, Phys. Chem. Glasses, 12, 33 (1971).
36. 1. L. Parsons and M. E. Milberg, J. Am. Ceram. Soc., 43, 326 (1960).
37. N. F. Borrelli, B. D. McSwain, and G. 1. Su, Phys. Chem. Glasses, 4, 11 (1963).
38. E. N. Lotkova, V. V. Obukhov-penisov, and N. N. Sobolev, Opt. Spect. (USSR),
1, 772 (1956).
39. 1. Krogh-Moe, Phys. Chem. Glasses, 6, 46 (1965); J. Noncryst. Solids, I, 269 (1969).
40. J. A. Siderov and N. N. Sobolev, Opt. Spect. (USSR), 3, 560 (1957).
41. 1. Goubeau and K. Keller, Z. Anorg. Chem., 272, 303 (1953).
42. L. A. Kristionsen and 1. Krogh-Mae, Phys. Chem. Glasses, 9,96 (1968).
43. P. E. Jellyman and J. P. Proctor, J. Soc. Glass Technol., 39, 173 (1955).
44. V. A. Florinskaya and R. S. Pechenkina, The Structure of Glass, Consultants
Bureau, New York, 1958, p. 55; J. Struct. Chem. USSR, 4, 850 (1963) (English
translation).
45. G. 1. Su, N. F. Borrelli, and A. R. Miller, J. Phys. Chem. Glasses, 3, 167 (1962).
46. R. Hanna and G. 1. Su, J. Am. Ceram. Soc., 47, 597 (1964).
47. D. Crozier and R. W. Douglas, Phys. Chem. Glasses, 6, 240 (1965).
48. S. A. Brawer and W. B. White, J. Chem. Phys., 63, 2421 (1975).
49. G. Wilmot, Ph.D. Thesis, Massachusetts Institute of Technology, 1954.
REFERENCES 319
50. W. Bagdage and R. Stolen, J. Phys. Chem. Solids, 29, 2001 (1968).
51. T. Bates, in Modern Aspects of the Vitreous State, Vol. 2, 1. D. Mackenzie, Ed.,
Butterworths, London, 1962, p. 195.
52. W. E. Weyl, Colored Glasses, Society of Glass Technology, Sheffield, England,
1959.
53. S. Kumar, Cent. Glass Ceram. Res. Inst. Bu/l., 6,99 (1959).
54. K. Bingham and S. Parke, Phys. Chem. Glasses, 6, 224 (1965).
55. S. Kumar and P. Nath, 7rans. Ind. Ceram. Soc., 25, 12 (1966).
56. V. V. Vargeime and T. 1. Weinberg, in IVth Congres Int. Verre, Imprimerie Chaix,
20, Rue Bergere, Paris, 1957, p. 197.
57. C. R. Kurkjian and E. A. Sigety, Phys. Chem. Glasses, 9, 73 (1968).
58. R. W. Douglas, 10th Int. Congress on Glass, The Ceramic Soc. of Japan, 1974, Vol.
1, p. 45.
59. M. A. Aglan and H. Moore, Trans. Soc. Glass Technol., 39, 351 (1955).
60. A. Paul and R. W. Douglas, Phys. Chem. Glasses, 8, 151,233 (1967).
61. W. H. Turner and 1. A. Turner, J. Am. Ceram. Soc., 55, 201 (1972).
62. M. Yamaga, B. Henderson, K. P. O'Donnell and Y. Gao, Phys. Rev., 844, 4853
(1991).
63. 1. S. Stroud, J. Chem. Phys., 35, 844 (1961); 37, 836 (1962).
64. V. I. Arbuzov and N. B. Belyankind, Sov. J. Glass Phys. Chem., 16, 327 (1990).
65. E. Antic-Fidancev, 1. Holsa, M. Lemaitre-Blaise, and P. Porcher, J. Phys.,
Condensed Matter, 3, 6829 (1991).
66. E. M. Larson, et aI., J. Noncryst. Solids, 130, 260 (1991).
67. B. C. Joshi, M. C. Joshi, and B. D. Joshi, J. Phys. Chem. Solids, 52, 939 (1991).
68. E. L. Demskaya and S. S. Pivovarov, Sov. J. Glass Phys. Chem., 16, 327 (1990).
69. F. Rasheed, K. P. O'Donnell, B. Henderson and D. B. Hollis, J. Phys., Condensed
Matter, 3, 1915 (1991).
70. S. Todoroki, S. Tanabe, K. Hirao, and N. Soga, J. Noncryst. Solids, 136, 213
(1991).
71. M. V. Ramana, P. S. Lakshmi, K. Sivakumar, S. G. Sathyanarayan, and G. S.
Sastry, Phys. Status Solidi, A126, K181 (1991).
72. K. Tonooka, N. Kamata, K. Yamada, J. Lumin., SO, 139 (1991).
73. K. Hirao, S. Kishimoto, K. Tanaka, S. Tanabe, and N. Soga, J. Noncryst. Solids,
139, 151 (1992).
74. M. A. Marcus and A. Polman, J. Noncryst. Solids, 136, 260 (1991).
75. S. B. Stevens and H. 1. Stapleton, Phys. Rev., 842,9794 (1990).
76. P. G. Taylor and Z. V. Vardeny, Eds., J. Noncryst. Solids, 141 (1992).
77. R. Zal1en, The Physics of Amorphous Solids, Wiley, New York, 1983, p. 260ff.
78. N. F. Mott and E. A. Davis, Electronic Processes in Noncrystalline Materials,
Clarendon Press, Oxford, 1970, p. 237ff.
79. 1. Lucas and 1.-L. Adams, in D. R. Uhlmann and N. J. Kreidl, Eds., Optical
Properties of Glass, American Ceramic Society, Westerville, OH, 1991.
320 OPTICAL ABSORPTION IN GLASSES
80. A. Abdel-Kader, A. A. Higazy, and M. M. Elkholy, J. Mater. Sci. Mater. Electron.,
2, 204 (1991).
81. J. S. Muller, J. Noncryst. Solids, 134, 147 (1991).
82. M. Faraday, Phi/os. Mag., 14,401, 512 (1857).
83. S. D. Stookey, J. Am. Ceram. Soc., 32, 246 (1949).
84. R. H. Doremus, in Nucleation and Crystallization in Glasses and Melts, American
Ceramic Society, Columbus, OH, 1967, p. 117.
85. G. Mie, Am. Phys., 25, 377 (1908).
86. R. H. Doremus, J. Chem. Phys., 40, 2389 (1964).
87. R. H. Doremus, J. Chem. Phys., 41, 414 (1965).
88. R. H. Doremus, S.-C. Kao, and R. Garcia, Appl. Opt., 31, 5773 (1992).
89. C. K. Kao, Optical Fiber Systems, McGraw-Hill, New York, 1982.
90. M. A. Newhouse, in D. R. Uhlmann and N. J. Kreidl, Eds., Optical Properties of
Glass, American Ceramic Society, Westerville, OH, 1991, p. 185.
91. K. 1. Beals and C. R. Day, Phys. Chem. Glasses, 21, 5 (1980).
92. R. D. Maurer, J. Noncryst. Solids, 47, 135 (1982).
92a. H. Kogelink, Science, 228, 1043 (1985).
93. M. C. Page, R. Oven, and D. G. Ashworth, Electron. Lett., 27, 2073 (1991).
94. G. Lamouche and S. 1. Najafi, Opt. Eng., 30, 1365 (1991).
95. T. Poszner, G. Schreitner, and R. Muller, J. Appl. Phys., 70, 1966 (1991).
96. M. J. Weber, J. Noncryst. Solids, 123,2098 (1990).
97. D. T. Moore, Ceram. Bull., 68, 1941 (1989).
98. Applied Optics, GRIN I (April 1, 1980), GRIN II (March 15, 1982), GRIN III (Feb.
I, 1983), GRIN IV (June I, 1984), GRIN V (Dec. IS, 1985), GRIN VI (Oct. I,
1986), GRIN VII (Feb. 1, 1988), GRIN VIII (June, 1990).
99. R. 1. Araujo, in 7reatise on Materials Science and Technology, Vol. 12, M.
Tomozawa and R. H. Doremus, Eds., Academic Press, San Diego, CA, 1977, p. 91.
100. R. J. Araujo, in D. R. Uhlmann and N. 1. Kreidl, Eds., Optical Properties of Glass,
American Ceramic Society, Westerville, OH, 1991, p. 185.
101. F. G. K. Bauke and J. A. Duffy, Chem. Br., 21, 643 (1985).
102. R. B. Goldner et aI., SPIE, 562, 32 (1985).
103. N. F. Borrelli and D. W. Hall, in D. R. Uhlmann and N. 1. Kreidl, Eds., Optical
Properties of Glass, American Ceramics Society, Westerville, OH, 1991, p. 87.
AUTHOR INDEX
'"
'" '"
m m
m m
'" ,.
'" m
" "
'" "
'" m
'" "
" "
m m
m '"
m '"
m m
" "
'" "
'" '"
"
m
"
Index Tenns Links
Almeida, R M. 40 47
Alpert, D. 126 147
Altemose, V O. 140 148
Anderegg, YO. 156 159
Anderson, 0.1. 145 149 284 289
Andreev, N. S. 119 121
Angell, CA 15 16 23 40
47 104 106 109
III 112 285 289
291 303 304 308
311 312 318
Antic-Fidancer, E. 315 319
Antonini, J R 185 193 196
Appen, A A 297 304
Araujo, RJ 317 320
Arbuzov, V I. 313 315 319
Arita, J H. 85 96
Annistead, C G. 187 196
Arnold, G. W 231 239
Asequawa, H. 40 47
Augis, J A 83 96
Avrarni, M. 16 24 81 96
A waza, K. 202 213
B
Babcock, C 1. 10 11 271 288
Babinec, A 222 238
Babonneau, A F. 47
Bach, H. 189 195 219 237
Index Tenns Links
Bacon, F. R 215 237
Bagdage, W. 311 319
Bagley, B. G. 44 47
Bain, D. 208 214
Bakardjico, J 222 238
Balijustin, A A 247 261
Banba, T. 232 239
Bansal, N. 10 11 82
83 84 94 95
96 105 III 113
120 130 148 217
237 279 289 291
303 306 317
Barnes. A C. 26 44
Barrer, R M. 122 125 132 147
Barry, T.J 86 88 89 96
Bartenev, G. M. 101 III
Bartholomew, R F. 200 212
Barton, J 1. 140 148 202 213
286 290
Bastress, A W. 203 213
Bates, J K. 230 231 239
Bates, R G. 253 261
Bates, T. 313 319
Baucke, F. G. K. 219 220 224 237
238 246 257 261
317 320
Bauer, G. H. 39 47
Beall, G. H. 68 72 74 75
81 96
Index Tenns Links
Beals, K. J 316 320
Beauchamp, E. K. 125 147 227 239
Beckman, K. H. 201 212
Begeal, D. R 125 147
Bell,R J 31 45 308 318
Bennett, A J 309 318
Benneff J E. 83 96
Bergeron. C. G. 19 24
Bennudez, V M. 187 195
Bernal, J D. 44 47
Berry, J P. 168 171
Bestul, A B. 55 71 113 120
Bever, M B. 10 11
Bhattacharya, G. K. 178 183
Bilby, B. A 159 170
Bingham. K. 313 319
Biscoe. J. 32 33 45 46
Blackburn, D. H. 54 71
Blau. H. H. 271 288
Block 58 71
Blodgetf, K. B. 203 213
Bockris, J O. 105 112
Boehm, 1. 55 71
Boekenhauer, R 208 214
Bokov, N. A 119 121
Boksay, Z. 217 225 228 233
237 238 278 289
Bolchakov, O. J 140 148
Bondi, A 43 47 109 112
Borchardt, G. 224 238
Index Tenns Links
Borisovski, E. S. 310 311 318
Borom, M. P. 278 289
Borreilli, N. F. 317 320
Bottinga, Y. 19 23
Bottom, A E. 256 261
Boulon, G. 29 45
Bouquet, G. 217 225 228 237
538
Bourcier, W. 1. 231 239
Boyce, R S. 137 148
Brace, W. F. 168 171
Bradley, C. R 230 239
Bradley, J P. 230 231 239
Bradner, T. 217 237
Brady, G. W 38 46
Brady, P. V 229 239
Brandt, W. W. 147 149
Brawer, S. 29 45 110 112
116 120 311 318
Bray, P. J 37 45 46 285
290
Brehardt, G. 189 196
Brehler, B. 41 47
Brennet, P. 229 239
Bresker, R J 297 304
Breton, J C. 300 304
Brinker, C. J 10 11
Briscoe, J. 32 33 45
Bristow, R H. 271 288
Brodsky. M H. 15 23
Index Tenns Links
Brosset, C. 33 46
Brown, D. M 211 214
Brown, R B. 126 143 147
Bruce, A J 83 84 94 96
Bruckner, R 33 46 199 212
Bnmd. M J D. 256 261
Buchert, R C. 39 47
Buck, R P. 256 261
Bueche. F. 109 112
Buff, H. 11
Bw1ker, B. C. 231 239
Bunting, E. R 310 318
Bruggraaf, A J 282 289
Burke, J E. 175 183
Burlitz, R S. 126 147
Bunnan, C. 189 196 217 222
224 237 238 240
Burn. I. 135 148
Burnett, D. G. 53 54 70 89
97
Burt, R 135 148 263 287
Bury, K. V 178 183
Busby, R F. 101 III
Busse, 1. 119 121
C
Cable, M 210 214
Calin, J W. 67 68 72 91
97
Index Tenns Links
Cameron, N. M. 150 169
Capella, S. 234 239
Car,R 30 45
Cargill, G. S. 44 47
Cawley, J D. 137 148
Chandan, H. C 176 183
Chandra, D. 208 214
Chang, S. S. 113 120
Chao, T. S. 189 197
Chapman, J D. 33 49 54 71
191 197
Charles, R J 53 59 67 68
71 72 176 180
183 275 288 295
304
Chaudhari, P. 32 46
Chaudhri, M M 159 170
Chemisinov, V. P. 310 318
Chemla, M. 270 288
Chen, B. T. K. 310 318
Chenykh, V. J 286 290
Chieux, P. 26 44
Chlebik, A 199 212
Christ, C 1. 249 261
Christensen, P. 237 239
Christian, J W 56 61 71 84
96
Chuang, T. 181 183
ChWJg, K. - H. 55 71 237 239
Clare, A C 37 46
Index Tenns Links
Clark, D. E. 22 228 238
Clarke, A R 210 214
Clemens, K. 70 72
Clinton, D. 86 97
Coenen, M. 114 120 293 304
Colien, A J 310 318
Colien, M H. 15 20 23 24
109 112
Collins. J A 29 45
Colmenero, J 26 44
Congleton, J 168 171
Conti, F. 256 261
Cook, R 1. 109 112
Cooper, A E. 11
Cooper. A R 8
Copley, G. J 300 304
Cordaro J F. 285 289
Connia, R 1. 19 23 92 97
103 III
Cornelissen, J 282 289
Cotton, F. A 229 239
Cottrell, A H. 56 71
Covington, A K. 256 261
Coyne. D. C 177 183
Cramer, D. 17 24
Crank, J 130 148 267 288
Cranmer, D. 82 96
Cricliton, S. N. 119 120
Crozier, D. 311 318
Curtis, H. 1. 194 197
Index Tenns Links
Cushm an, K. 173 183
Cusumano, J A 191 197
Czandema, W. A 189 196
D
Dalton, R N. 77 96
D' Angelo, K. 22 238
Datta, R K. 14 23
Davidge, R W 165 171
Davies, 1. B. 44 47
Davis, E. A 26 44 314 319
Davis, K. 217 237
Davydov, V Y. 185 196
Day, D. E. 229 239 279 289
300 301 304
Deal, B. E. 144 149
Dean, P. 31 45 308 318
DeBast, J 118 120
DeB illy, M 264 287
DeBolt, M A 119 120
Deeg. E. 301 304
Dejong. B. H. W. S. 29 45
Delaney, J R 231 239
Della Mea, G. 224 238
DeLuca, J P. 19 24
Demskaya, E. 1. 315 319
Denney, D. J 20 24
DeNordwall, H. J 14 23
DeRiu, 1. 189 196
Index Tenns Links
Devi.A 193 197
DeWaal, H. 300 304
DeWel. W J 246 261
Dezsi, J 29 45
Dick, E. 163 170
Dilmore, M. F. 222 238
DiMarcello, F. V 150 169
Dobos, S. 217 224 237 238
Dole,M. 256 257 261
Dornenici, M. 34 46
Donovan, E. P. 113 120
Doody, M 222 238
Doolittle, A K. 109 112
Douglas, R W. 10 11 53 54
67 70 71 72
89 97 103 III
198 204 209 211
212 213 214 216
227 229 237 238
274 288 295 298
304 308 311 313
317 318 319
Douglas, R W. 10 11 205 213
Dran. J-C 224 238
Draper, N. R 179 183
Drexhage, M. G. 14 23 70 72
94 97 106 112
Drury. T. 135 148 198 212
Duffy. J A 14 23
Duke, P J 298 304
Index Tenns Links
Dulaney, E. N. 168 171
Dumbgen, G. 137 148
DW1ken. H. H. 184 195 196 215
216 234 237 239
Dupree, R 29 45
Duwez, P. 15 23 44 47
Dyre, J C. 291 303 304
E
Eagan. R J 19 24
Eastal, A J 113 119 120
Ebbsjo, I. 30 45
Ebstrop' ev, K. K. 264 279 287 289
Eckersley, M. C. 26 44
Eckert, C. A 182 183
Ehnnann, P. 264 287
Eisenberg, A 39 47
Eisenman, G. 243 244 246 247
249 250 260 282
289
el-Bayoumi, O. H. 55 71
Elliott, S.R 10 11 25 26
29 39 44 45
47 285 290 291
303 304
Ellis, R C. 14 22
Elmer, T. H. 70 72 191 197
228 238
El-Shamy, T. M 227 229 238
Index Tenns Links
Endo, H. 15 23
Endo, T. 14 22
Engel, J R 270 288
Equchi, K. 70 72
Erdogan, F. 168 171
Ernsberger, F. M. 156 158 159 163
169 170 184 195
200 212 232 239
265 282 287 289
Eschbach, H. 1. 140 148
Ethridge, E. C. 222 238
Evans, D. 1. 31 45
Ewell,R 109 112
Eyring, H. 106 109 112
F
Faile, S. P. 14 23 201 212
Fanderlik, J 306 317
Faraday, M 3 11 194 197
314 320
Farman, J 29 45
Farnum, E. G. 267 288
F arooqui, K. 208 214
Fedlman, C. 15 23
Feller, S. 208 214
Ferguson, C. 122 147
Ferrier, R P. 15 23
Ferris, K. F. 189 197
Ferry, J D. 109 100 III 112
Index Tenns Links
Feuston, B. P. 30 45
Field, J E. 159 170
Filbert, A M 215 237
Fincham, C. J B. 208 214
Findakly, T. 283 289
Finn, A N. 22 238
Finney, J 1. 44 47
Finnie, I. 150 169
Firth, E. M 210 214
Fitzgerald, J V. 298 304
Flemning, B. A 228 238
Fletcher, J P. 35 46
Fliegel, W 245 261
Flinn, O. R 245 261
Flood, E. A 191 197
Florinskaya, V. A 311 318
Folman, M. 193 197
Fontana, E. J 19 23 102 III
Fonteneau, G. 237 239
Fony, K. E. 301 304
Fowler, R H. 126 147
Frank, F. C. 66 71 159 170
Frank, R C. 123 147
Frank, S. 10 24
Franz, H. 199 212
Frechette, V. D. 157 169
Freed, R 1. 4 47
Freiman, S. W. 158 169
Frenkel, D. 90 97
Frenkel, J 127 147
Index Tenns Links
Frerichs, R 14 22
Friebele, E. J 308 317
Friedman, G. S. 173 183
Frischat, H. 143 149 189 196
224 238 267 273
276 282 283 288
289
Frohnsdorff, G. J C. 191 197
Fry, D. 1. 126 147
Fuhs, W. 39 47
Fukumi, K. 38 46
Fulcher, G. S. 109 112
Fuller, E. R 181 183
Fulrath, R M. 128 147 149
G
Gaffney, R F. 142 149 210 214
Gagliardi, G. 189 195
Galeener, F. 1. 25 38 44 46
Gan Fuxi 14 23
Garcia, R. 95 98 189 195
GarfW1kel, H. M. 245 250 258 261
281 282 289
Garino-Canina, V. 198 212 308 317
Garofalini, S. H. 30 45
Garrels, R M. 249 261
Gaskell, P. H. 26 28 29 31
34 44 45 189
195
Index Tenns Links
Gauthier, F. R 102 III 164 170
Geddes, S. 194 197
Gee, G. 39 47 106 112
Geotti-Bianchini, F. 189 195
Gerber, T. 34 46
Gerth, K. 55 71
Ghezzo, M. 274 288
Ghose, A C. 120 144
Gibbs, J W. 61 71 110 112
Gieskes, J M. 228 238
Gilard, P. 118 120
Giler, G. H. 90 93 97
Gilman, J J 162 165 170 182
183 184 195
Gladden, 1. F. 26 45
Glasser, F. P. 52 70
Gobin, P. 300 304
Goldbeck-Wood, G. 93 97
Goldner, R B. 317 320
Goldschmiodt, V M 30 45
Goldstein, M 110 112 276 288
Golub, H. R 48 70 167 171
Golubhov, V V 53 70
Gonser, Y. 29 45
Gonzalez-Oliver, C. J R 77 96
Gottardi, V 215 237
Gotz, J 199 212
Goubeau, J 36 46 311 318
Gough, E. 264 287 295 304
Graczyk, J F. 32 46
Index Tenns Links
Graham, W. A G. 43 47
Granick, S. 109 112
Gravina, S. J 37 46
Greaves, G. N. 28 29 35 45
285 290
Green, R 1. 202 213 296 304
Greene, C. H. 142 143 149 210
212 214
Greenberg, S. A 228 238
Greenwood, G. W. 66 72
Greer, A 1. 81 195
Greet, R J 19 24
Grest, G. S. 109 112
Griffith, A A 11 155 169
Grimley, D. J 25 44 46
Griscom, D. 1. 308 317
Groleau, R 217 237
Grosskopf, K. 189 196
Gruer, R M. 158 169
Gnmdy, P J 44 47
Guggenheim, E. A 126 147
Guglielmi, M 189 196
Gupta, P. K. 70 72
H
Hagel, W. C. 137 148 264 287
Hagen, J T. 159 166 170 171
Index Tenns Links
Hair, M 1. 33 46 54 71
185 187 193 196
197 215 237
Hakim, R M 278 288 295 304
Hallbrucker, A 15 23
Haller, W. 54 68 71 72
Halloran, I. W. 137 148
Hamann, S. D. 276 288
Hambleton, F. H. 187 193 195 197
Hamilton, E. H. 222 238
Hammel, I. I. 48 63 70 71
Hammetter, W. F. 86 97
Han, C. I. 137 148
Han, W. T. 158 169 181 183
Handwerker, C. A 82 96
Hanna, R 311 318
Hansen, I.-P. 120 121
Hansen, K. W. 301 305
Harding, F. 1. 211 212 214
Hamon, M A 210 214
Harrick, N. I. 201 212
Harrington, R V 2 4 11
Hartman, I. S. 35 46
Hartwig. C. M 129 148
Harv ey, K. B. 238
Hass, M. 31 45
Haul,R 137 148
Hauser, C. A 232 239
Haymet, A D. 90 97
Hayward, P. I. 279 289
Index Tenns Links
Heaelley, G. 1. 231 239
Heaton, 1. 39 47
Heckman, R W. 202 213
Heinmann, J 270 288
Helfferich, F. 232 239 241 244
260 280 289
Helmreich, D. 222 238
Helms, C. T. 137 148 149
Hench, 1. 1. 219 222 237 238
Hendrickson, J R 285 290
Hennig, H. P 189 196
Henninger, E. H. 39 47
Herbst C. A 109 112
Herd, 1. R 32 46
Hennan, H. 68 72
Heroux, 1. 295 304
Herrell, D. J 15 23
Hertl 187 193 196 197
Hertz, H. 159 170
Hesse, W. 109 112
Heston, W. M. 228 238
Hetherington, G. 33 46 102 103
III 198 199 201
212 282 289 307
317
Heurer, A H. 89 97
Heyes, D. M 101 III
Heynes, M S. R 105 112
Hibbins-Butler, D. C. 308 318
Index Tenns Links
Hiemeng, P. C. 15 23 43 47
192 197
Hill, C. F. 41 47
Hillig, W B. 87 91 93 97
156 169 175 180
183
Hilsch, R 15 23
Himmel, B. 34 46
Himo, K. 315 319
Hishinuma, A 82 96
Hobson, J P. 192 197
Hochstrasser, G. 185 193 195
Hockey, J A 187 193 196 197
Hodkin,F. W 210 214
Hofmaier, G. 102 III
Hogfeldt, E. 244 260
Hollabaugh. C. M. 282 289
Holland, D. 29 45
Holland, 1. 184 195
Holloway, J R 231 239
Homeny, J 42 47
Hood, H. P. 48 70
Hopkins, J 1. 298 304
Horisaka, T. 40 47
Hotta, H. 162 170
Houde-Walter, S. N. 252 262 283 289
Hubbard, D. 194 197 222 238
Huber, K. 309 318
Hughes, K. 264 287
Hulme, R A 25 44
Index Tenns Links
Hunt, J D. 91 97
Hunter, C. C. 283 289
Husung, R D. 222 238
Hutchins. J R 2 4. II
Hwa, 1. G. 119 121
Hyde, J M 52 70
Hyde, J M 285 290 303 305
Ihm, S. K. 18 24
Her, R K. 228 238
Imaoka, M 163 170
Inglis, C. E. 160 170
Ingram, M. D. 14 23 265 283
285 288 290 291
304
Inoue, H. 40 47
Irene, E. A 144 149
Irmann, F. 204 213
Irwin, G. R 165 170
Isard, J O. 209 214 264 287
295 296 304
Izumitani, T. S. 10 II 19 195
197
J
Jack, J H. 33 46 102 III
199 201 212 282
289 307 317
Index Tenns Links
Jackson, K. A 90 91 97
Jagdt, R 301 304
J akus, K. 176 177 183
James, P. F. 53 70 77 79
81 96
Jantzen, C. M. 235 239
Jarcho, M 150 169
Jeanloz, R 26 28 44
Jelli,A 229 239
Jellyman, P. E. 311 318
Jenckel, E. 300 304
Jewell, J M 200 212
Jiang, J 29 45
Johansson, G. 256 261
Johari, G. P. 15 23
Johnson, J 135 148
Johnson, J E. 175 183
Johnson, J R 271 277 288
Johnson, P. A V 37 46
Johnson, R A 178 183
Johnson, W. C. 158 169 181 183
Johnston, J W. 150 169
Johnston, W. D. 204 213
Jones, G. O. 11
Jonscher, A K. 291 303
Jorgensen, P. J 126 147
Joshi, B. C. 315 319
Index Tenns Links
K
Kadone, K. 29 45
Kageyama, H. 29 45
Kalia, R K. 30 45
Kalish, K. 176 183
Kambeyanda, S. 208 214
Kamijo, N. 29 45
Kao, C. K. 316 320
Kao, S.-c. 144 149
Kaps, C. 245 261
Karrern an, G. 256 261
Karsch, K. H. 300 304
Karsten, J 1. 231 239
Kaschiev, D. 66 71
Kats, A 136 148
Kauzmann, W. 113 115 120
Kawamoto, Y. 40 47 52 70
72
Kawazoe. H. 202 213
Keaton, S. C. 133 148
Keller, A 89 93 97
Keller, H. 36 46
Keller. K. 311 318
Kelton, K. F. 81 96
Kemmechi, K. 189 197
Kennan, A G. 246 261
Kennedy, J C. 102 III
Kennedy, J H. 14 23
Kepak, F. 194 197
Kerkhof, F. 159 168 170 171
Keshizaki, N. 189 196
Index Tenns Links
Khar'yuzov, V A 264 287
Kieth, H. D. 89 97
Kim,C. 265 288 293 304
King, C. B. 282 289
King, H. E. 109 112
King, S. V 31 45
Kinton, G. 1. 191 197
Kirby, E. M 310 318
Kirby, P 1. 300 304
Kirkpatrick, R J 35 46
Kirschner, H. P. 158 169
Kiselev. A V 185 196
Kissenger, H. E. 83 96
Kitano, J 143 149 210 214
Kitchener, J A 105 112
Klein, 1. C. 82 96
Knight, C. G. 159 170
Ko, S.-H. 40 41 47 95
98 189 196
Kogelink, H. 316 320
Kohli,! T. 125 147
Kohnstam, G. 182 183
Koike, Y. 14 22
Kolbeck, A G. 114 120
Komatsu, T. 14 23
Kardes, E. 310 318
Karitaka, S. 208 214
Kornfeld, G. 244 250 260
Kotama, M. 265 287
Koumetzov, A. Ya. 194 197
Index Tenns Links
Kozuka, H. K. 38 46
Krause, J T. 150 162 170 176
183 301 304
Kreidl, N. 50 70
Kriedl, N. J 10 12 308 317
Kristiansen, L. A. 311 318
Kritz, H. M. 29 37 45 46
Kroger, C. 208 213
Krogh-Mae, J 36 46
Krogh-Mae. J 36 46 85 97
310 311 318
Krutter, K. 30 45
Kugler, G. C. 256 261
Kuhl, C. 210 214
Kumar, S. 313 319
Kurkjian, C. R 29 45 103 III
117 120 150 169
176 180 183 298
301 304 313 319
Kushiro, J 105 III
L
Laberge, N. 109 112
Laborde, P. 265 288
Lachanne, J P. 279 289
LaCourse, W. C. 157 169
Ladik, J 162 170
Laird, J A 19 24
Laitinen, H. A 270 288
Index Tenns Links
Lamarche, P. 217 237
Lamouche. G. 316 320
Lamparter, P. 189 196
Landel, R F. 109 112
Lanford, W. A 189 196 216 217
220 222 224 238
240
Langer, J S. 90 97
Lapham, K. E. 231 239
Larsen, E. M 315 319
Laska, H. M. 126 147
Laughlin, W. T. 106 112
Laursen. T. 217 237
Lawn, B. R 159 166 170 171
Laws, F. A 292 304
Lay, 1. A 86 97
Leadbetter, A J 31 38 41 45
46 47
Leblond, M 286 290
Lee, C. 1. 189 197
Lee, H. A 210 214
Lee, R W. 123 124 126 147
201 212
Lee, T. F. 189 197
Lee, W. E. 89 97
Leeds, R E. 202 213
LeGuillou, J C. 60 71
Lengyel, B. 278 289
Leontewa, A. 19 23
Levengood, W. C. 158 169
Index Tenns Links
Levin, E. M. 51 58 70 71
Levy, M.. 60 71
Lewchuk, R R 48 70
Lewins, J 227 229 238
Lewis, G. G. 14 23
Li. G. H. 101 III
Li,P 114 120
Liebau, F. 33 46
Lifshitz, E. M. 66 72
Lillie, H. R 164 170
Lin, X. 29 45
Ling, A C. 106 112
Lippencott, E. R 310 318
Little, 1. H. 185 196
Lockyer, M. W. G. 29 45
Loehman, R E. 86 97 213
Loehr, S. J 237 239
Loh, E. 308 318
Lommen, M. G. W. 219 237
Lotkova, E. N. 310 318
Lauer, D. 40 47
Low, M. J D. 190 191 197
Lucas. J 29 40 45 47
237 239 14
319
Lummenheim, D. 208 213
Lumsden, J 64 71
Lundberg, M. H. 85 97
Lupis, C. H. P. 204 213 249 261
Lyklema. J 258 259 262
Index Tenns Links
Lyle, A K. 211 214
Lyng, S. 85 97
M
MacCrone, R K. 68 72
MacDowell, J F. 68 92
Macedo, P. B. 54 71 103 109
III 112 114 120
Macfarlane, D. R 84 96
Mackenzie, J D. 10 II 12 19
23 40 47 92
97 103 105 106
III 112 137 148
163 170 264 287
Mader, S. R 15 23 44 47
Magill, J D. 19 24
Magonthier, M. C 224 238
Maider, A 19 24
Major, 1. D. 137 148
Mandelkern, 1. 93 97
Manda, P. A 224 238
Mansingh, A 296 304
March, P. 189 196
Marcus, M. A 315 319
Margraf, T. 95 98 189 196
Markah, J 85 97
Markworth, A J 228 238
Marsh. D. M. 164 170
Marshall, E. 236 239
Index Tenns Links
Martin, S. W 25 44 104 III
265 285 288 289
Marx, J W. 297 304
Masaryk, J S. 129 148 149
Matecki, M. 84 96
Materova, E. A 246 261
Matthewson, M J 176 180 183
Matusita, K. 80 83 96
Matzke, H. 135 148
Maurer, R D. 74 77 86 96
97 140 149 151
169 316 320
Mayer, E. 15 23
Mazer, J J 230 239
Mazurin, O. V. 10 11 50 53
70 278 279 289
298 304
McCoy, M 89 97
McCurrie, R A 67 72
McDonald, R S. 185 191 196 197
McGahay, V. 59 71
McMillan, P. W 53 54 70 74
96 199 212
McMurdie, H. F. 51 70
McSwain, B. D. 310 318
McTague, J P. 90 97
McVay, G. 1. 267 279 288 289
Means, J 1. 228 238
Mecholsky, J J 158 169
Mehrotra, Y. 189 196 217 237
Index Tenns Links
Meier Zu Kocker, H. 208 214
Meiling, G. S. 19 24 105 III
Mercer, R A 86 97
Merzbaclier, C. J 35 46
Messier, D. R 213
Meyer, H. 39 46
Miclial, E. J 204 213
Micus, G. 19 24
Mieller, E. 189 196
Mikesell, S. 1. 9
Mikkelson, J C. 137 138 148
Milberg 33 34 46 310
318
Miller, A A 106 112
Miller, P. D. 232 239
Miller, R A 301 305 311 318
Miller, R P. 86 97
Milnes, G. C. 264 287
Mitcliell, S. A 187 196
Miyaji,F. 38 46
Moak, D. 232 239
Molir, R K. 101 III
Moliyddin, J 298 304
Moiseev, V V 245 261
Montez, B. 35 46
Montrose, 1. J 101 III
Moore, D. T. 252 262 316 320
Moore, H. 313 319
Moorjami, K. 15 23
Morain, M. 140 148 202 213
Index Tenns Links
Morelock, C. R 93 97
Morey, G. W. 2 11 100 III
215 237 263 287
Morgan, A M. 191 197
Moriya, Y. 53 71
Morningstar, O. 30 45
Morrow, B. A 193 197
Mortuza, M. G. 29 45
Matt, N. F. 168 171 314 319
Mould, R E. 153 156 169 174
183
Moulson, A 198 212
Moulson, J 135 148 230 239
Moynihan, C. T. 55 71 94 97
113 119 120 121
237 239 302 305
Mozzi, R 1. 28 30 36 45
46
Mukherjee, S. P. 85 87
Muller, J S. 314 320
Muller, R 1. 285 289
Mulli,R 252 262
Murahami, T. 224 232 239
Murphy, D. 217 237 240
Murthy. M K. 310 318
Myhra, S. 189 196
Mysen, B. O. 46
Index Tenns Links
N
Nakajima, H. 68 72
Nakayama. G. S. 125 147
N akayam a, J 165 171
Napolitano, A 54 71 103 III
Narayanaswarny, O. S. 118 120
Nardy-Szabo, J 162 170
Nath, P. 313 319
Naudin, F. 66 68 72
Navias, L. 296 304
Neely, J E. 163 170
Neilson, G. F. 68 72 81 96
Nelson, G. G. 42 47
Nemer, 1. N 143 149
Neumann, K. 19 24
Newhouse, M A 316 320
Ngai, K. 1. 116 120 298 303
304 305
Nicolsky, B. P. 246 250 261
Niekerk, M 246 261
Niklasson, G. A 303 305
Nofz, M 29 34 45 46
Nordberg, M E. 48 70 191 197
228 238
North, P. 204 213
Norton, F. J 125 137 138 139
147 148 203 213
Notz,N 256 261
Nowich, A S. 15 23 44 47
Index Tenns Links
0
Oakley, D. R 300 304
Obukhov-Denisov, V. V. 310 318
O'Connor, T. 1. 228 238
Oel, H. J 143 149 158 169
264 287
Ohlberg, S. M 33 46 48 70
167 171
Ohta, H. 229 239
O'Keefe, J G. 29 37 46 49
Ordway, F. 31 45
O'Reilly, E. P 309 318
Osteryoung, J G. 271 288
Osteryoung, R A 270 288
Otto, W. H. 156 169
Owen, A E. 263 264 274 287
288 291 295 303
304
Owen, G. D. T. 39 47
Oxtoby, D. W. 90 97
P
Pace agnella, A 224 238
Padden, F. J 89 97
Page, N. C. 316 320
Palik, E. D. 306 317
Panhorst, W. 87 97
Papanikolau, E. 286 290
Index Tenns Links
Park, M. J 29 37 45 46
Parke, S. 313 319
Parker, J M.. 26 44
Parkiale, V E. 29 45
Parks, G. A 103 III
Parks, G. S. 115 120
Parrinello, M. 30 45
Parsons, J 1. 167 171 310 318
Parsons, J M. 33 46
Pask, J A 19 24
Patano, C. G. 189 196
Paul,A 204 205 213 229
235 239 313 319
Pavelchek, E. K. 153 155 169 170
173 180 183
Pearce, M. 1. 208 213 214
Pechenkina, R S. 311 318
Pederson, 1. R 189 197
Peglar, R J 193 197
Perera, G. 216 218 228 237
238
Peri, J B. 192 197
Perkins, W. G. 123 147
Petch, N. J 168 171
Peter, K. W. 159 163 170
Peters, C. R 33 34 46
Peterson, G. 1. 37 46
Pethica, B. A 187 196
Petit, J-c. 224 238
Pettifer, R F. 29 45
Index Tenns Links
Philipp, H. R 307 308 318 319
Phillips, J C. 31 45
Pietroneco, L. 265 288
Pike, R G. 194 197
Pincus, A G. 58 71
Platts, D. R 212 214
Plazek, D. J 19 24
Plesse!, M. S. 232 239 280 289
Plodinec, M J 235 239
Plum at, E. 55 71
Plummer, W. A 19 23 102 III
Polk, D. E. 44 47
Pony on, V 29 45
Porai-Koshits, E. A 31 45 48 53
70
Portier, J 14 23
Poszner, T. 252 262 316 320
Poulain, M. 22 24 84 96
Powell, R E. 106 112
Pozza, F. 34 46
Pradel, A 285 290
Preston, E. 208 213
Prince, D. 1. 25 44
Prins. J A 2 11
Priqueler, M. 198 212
Prochazka, S. 41 47
Proctor, B. A 150 156 169 175
183
Proctor, J P. 311 318
Purdy, G. R 85 96
Index Tenns Links
R
Rajaram, M. 213
Ramana, M. V 315 319
Rarnasubrarnanin, N. 190 197
Ramaswamy, R V 283 289
Ramsay, M W. 282 289 307 317
Rana, M. A 217 237
Randall, J R 202 213
Raoux, D. 28 45
Rasheed, F. 315 319
Rauch, F. 189 196
Ravaine, D. 285 289
Rawson, H. 14 22 58 71
Ray, C. S. 83 96
Reau, J-M. 14 23
Rechnitz, G. A 256 261
Reilly, M G. 309 318
Rekhson, S. M. 101 III 119 120
121
Renlund, G. M 41 42 43 47
Reugh, J D. 115 120
Reyes, J M 296 304
Rice, R W. 158 169
Richardson 208 214
Richet, P. 19 23
Richter, H. 168 171
Richter, T. 189 196 244 238
Richter-Mendou, J 189 196
Riga, S. 137 148 149
Index Tenns Links
Rindone, G. E. 77 96 300 304
Rino, J P 30 45
Risbud, S. H. 35 42 46 47
Ritter, J E. 176 177 183
Riviere, J C. 189 196
Robbins, C. R 51 70
Roberts, G. J 135 148 198 212
Roberts. J P. 135 148 198 199
212 230 239
Robinson, M 94 97
Robinson, P. 1. 14 23
Roche!, R 137 148 149
Roesler, F. C. 159 169
Rogers, P. S. 85 96 97
Rogers, W. A 126 131 147
Rogogine, J V 229 238
Rotger, H. 298 304
Roth, 1. M 309 318
Rothman, S. J 276 288
Rothm une!, V 244 250 260
Rowell, M H. 245 261
Roy, D. M 14 23 201 212
Roy,R 22 24 52 70
Ruckenstein. E. 18 24
Rudow, H. 210 214
Ruffa, A E. 309 318
Russel, C. 270 288
Ryder, R J 8 212 214 300
305
Index Tenns Links
S
Sadler, D. M. 93 97
Sager, M. 296 304
Sakaguchi, F. 40 47
Sakaino, T. 53 71
Sakka, S. 10 11 38 46
162 170
Saloma, R 82 96
Salomau, R 17 24
Salsbury, R 1. 150 169
Sandhage, K. H. 11
Sana, N. 208 213
Sarjeant, P. T. 22 24
Sarkar, A 53 71
Sato, T. 14 22
Sawai, I. 85 96
Sayre, E. J 14 23
Schaeffer, H. A 264 287
Scherer, G. 10 11 70 72
100 115 116 118
120
Scherrer, S. 189 196 224 238
Schiffner, V 87 97
Schiller, H. 286 290
Schnatter, K. H. 189 196 219 238
Schnatterly, S. E. 308 318
Schnaus, V E. 113 120
Index Tenns Links
Scholze, H. 10 11 198 199
200 212 217 222
237 238 297 304
307 317
Schonhorn, H. 150 169
Schramm, C. M. 29 45
Schreiter, G. 252 262
Schrieber, H. D. 205 213
Schroeder. J 119 121
Schuhmann, R 204 213
Schultz, M M 246 261
Schulze, F. 11
Schulze, G. 242 266
Schwabe, K. 256 261
Schwartz, M. 264 287
Scott, W. D. 19 24
Scott, W. E. 14 29
Sears, G. W. 91 93 97
Sedden, E. 271 288
Service, T. E. 176 183
Seward, T. P. 68 72
Sewell, P. A 191 197
Shackelford, J F. 123 128 129 147
Shand, E. B. 158 169
Shardin. H. 168 171
Shanna, S. K. 105 III
Shartsis, 1. 55 71 184 196
Shaw, R R 53 70
Index Tenns Links
Shelby, J E. 122 123 125 126
129 133 135 139
147 148 200 212
301 304
Shenner, H. F. 55 71
Sherriff, B. 1. 35 46
Shess, M. S. 200 212
Shimada, M 14 22
Shore, A C. 19 24
Shultz, G. 266 288
Shute, C. J 176 183
Shvaiko-Shvaikovskaya, T. P. 10 11 105 III
130 148
Siderov, J A 310 318
Sigel, G. H. 307 309 317
Sigety, E. A 313 319
Sih, G. S. 168 171
Simmons, C. J 237 239
Simmons, J H. 53 54 70 71
74 81 91 96
97 101 III 237
239
Simon, J 308 317
Sinclair, R N. 25 37 44 46
Sitter, H. 237 239
Sivertsen, J M. 297 304
Skinner, S. 184 196
Slavyanskii, V T. 210 214
Slyozov, V V 66 72
Smekal, A 159 170
Index Tenns Links
Smets, B. M J 219 224 237 238
Smith, G. 1. 94 98
Smith, H. 179 183
Smith, H. 1. 310 318
Sommer, E. 158 169
Satter, W. A 158 169
Soules, T. F. 27 29 30 44
45 101 III
Souquet, J 1. 265 283 288
Southwick, R D. 156 169 174 183
Sovolev, N. N. 310 311 318
Spaght, M E. 103 III
Speny, 1. 1. 167 171
Spinosa, E. D. 228 238
Srinivasan, G. 54 71
Stanworth, J E. 21 24
Stavely. 1. A K. 14 23
Steinberg, U 29 45
Steinike, Y 189 196
Steinkamp, W E. 300 304
Stephenson, G. B. 68 72
Stem, K. 245 246 261
Stevels, J M. 265 287 291 295
303 304 308 318
Stevens, S. B. 315 319
Stevenson, C. M. 230 239
Stewart, A M. 189 196
Stillinger, F. 115 120
Stock, A 14 22
Stolen, R H. 311 319
Index Tenns Links
Stone, F. G. A 43 47
Stoneham, A M. 144 149
Stookey, S. D. 74 77 96 200
212 314 320
Stbsser, R 29 45
Streltsina, M V 10 11 54 71
105 III 130 148
Strnad, Z. 208 213
Stroud, J S. 77 96 315 319
Stuart, D. A 145 149 284 289
Stub, S. 189 196
Studt, P 1. 128 147
Su,G. J 19 24 114 120
310 311 318
Subramanian, R. S. 144 149
Sucov, E. W. 137 148
Sugarman, B. 169
Summer, D. J 37 46
Sun, H. W. 14 23
Sun, K. H. 21 23 24
Suscavage, M J 55 71
Suschke, H. D. 256 261
Suzuki, J 163 170
Suzuki, Y 229 239
Swain, M V 159 170 171
Swalin, R A 204 213
Swartz, E. 1. 212 214
Swets, D. E. 123 147
Swift, H. R 88 97
Symmers, C. 169
Index Tenns Links
T
Tadros, J F. 258 259 262
Taghavore, A P. 35 46
Takahasi. T. 270 288
Takamori, T. 69 72
Takayangi, M 19 24
Tallant, D. R 231 239
Tarnrnann, G. 11 14 22
109 112
Tanaka, H. 29 45 70 72
Tanguy, B. 14 23
Tappin, G. 165 171
Tarrant, J D. 31 45
Tarrio, C. 308 318
Taylor, E. W. 163 170
Taylor, H. E. 291 303
Taylor, N. W. 182 183
Taylor, P. G. 314 319
Tegetmeier, F. 3 11
T estardi, 1. R 162 170
Thiel, K. 14 23
Tholen, M G. W 224 238
Thomas, M B. 150 169
Thomas, W. F. 153 156 169
Thurston, R N. 162 170
Tippet, E. J 271 288
Titov, A P. 53 70
Tobolsky, A V 39 47
T ochon, J 282 289
Index Tenns Links
T odoroki, S. 315 319
T olmacheva, T. A 246 261
Tomlinson, J W. 105 112
Tornozawa, M. 10 12 50 52
59 68 69 70
71 72 158 169
181 183 200 212
234 239 265 270
285 288 289 290
291 293 303 304
305
Tong, H. C. 182 183
T onooka, K. 315 319
Topping, J A 264 287 296 304
Torza, S. 150 169
T otesh, A S. 54 71
Tran, D. C. 113 120
Tmovcova, V. 264 287
Tronev, L. 283 289
Tsang, J S. T. 232 239
T suei, C. C. 15 23
T sukihashi, F. 208 213
Tucker, J 119 120
Tuller, H. 1. 265 283 288
Turkalo, A M. 32 46 48 70
78 96 175 183
Turkdogan, E. T. 208 214
Index Tenns Links
Turnbull, D. 15 16 19 20
23 24 44 47
61 68 71 72
92 93 97 109
112
Turner, G. 1. 231 239
Turner, J A 313 319
Turner, N. H. 313 319
Turner, W. E. S. 48 70 208 210
213 214 271 288
Turner, W. H. 313 319
Tuttle, O. F. 14 23
Tweer, H. 54 71 109 112
Tyler, A J 187 196
U
Uhlmann, D. R 10 12 16 17
18 19 22 23
24 53 68 70
72 75 81 82
91 94 97 101
104 105 106 III
112 114 120 278
288 295 304 306
308 317
Underwood, S. M 71 97
Ur,H. 14 23
Urbain, G. 19 23 102 III
Urnes, S. 33 46
Index Tenns Links
V
Valkenburg, A V 310 318
Van Amerongen, C. 295 304
Van Caugh, 1. 147 149
Vander Sande, J B. 44 47
Van Hook, A 19 24
Van Megan, W. 93 97
Van Omrn en, 274 276 288
Van Reenan, T. J 246 261
Vardar, O. 150 169
Vargeime, V V 313 319
Varner, J R 158 169
Vashista, P. 30 45
Vaughn, 1. 300 304
Vazirani, H. N. 150 169
Veltri, R D. 274 288
Venderovitch, A M. 286 290
Vergano, P. J 19 23 92 97
Veffileer, J. 286 290
Verrall, D. J 26 45
Videau, J J 14 23
Virgo, P. 105 III
Vogel, H. 109 112
Vogel, W 50 53 55 70
71 97 306 317
Volger, J 295 304
Volmer, M. 19 24
Vostrov, G. A 140 148
Vuilland, G. E. 15 23
Index Tenns Links
W
Wagner, C. 66 72 136 148
Wagman, D. D. 204 213
Wagstaff, F. E. 18 23 54 70
71 92 97
Wakasugi, T. 208 213
Wall,F. T. 203 213
Walters, 1. C. 124 135 147 148
Walther, J V 228 229 238 239
Walton, H. F. 244 260
Wang T. T. 176 183
Warburg, E. 11 263 287
Ward, J B. 169
Warren, B. E. 11 28 30
32 33 36 41
45 46 47 58
71
Warrington, D. 53 71
Warshaw, J 52 90
Wassick, T. A 189 196 217 224
237 238
Weaver, E. A 202 213
Weber, M. J 316 320
Weber, M. Y. 29 45
Weber, N. 276 288
Weigelt, J 34 46
Weinberg, M C. 144 149
Weinberg, T. J 313 319
Weir, C. E. 310 318
Index Tenns Links
Weiss, A 14 23
Wells, A F. 39 47
Weyl, W A 210 214 313 319
White, J To 105 112
White, W B. 35 46 232 239
Whitney, J 150 169 175 183
Wiecker, C. 14 23
Wiecker, W. 14 23
Wihsmann, F. G. 29 45
Wikby, A 222 238 256 261
Wilcox, F. 1. 256 261
Wilder, J A 113 120
Wilkinson, G. 229 239
Willams, Q. 26 44
Willard, J E. 106 112
Williams, E. 1. 137 148 202 213
Williams, G. A 122 147
Williams, M. 1. 109 110 112
Williamson, D. 1. 85 96
Williamson, J 85 93 96 97
Wilmot,G. 311 318
Wilshaw, T. R 159 170
Wilson, H. A 91 97
Winchell, P 265 279 287 289
Winks, F. 48 70
Winter, A 14 22
Winterberg, A 1. 232 239
Wirth,G. S. 228 238
Wolf, W W. 9 11
Wollast, B. 229 239
Index Tenns Links
Wong, J 308 311 312 318
Wood, B. J 228 238
Woodland, A B. 231 239
Woods, K. N. 122 147
Worster, E. 310 318
Wright, A C. 25 28 32 37
38 41 44 45
46 47
Wright, G. B. 116 120
Wustner, H. W. 122 147
X
Xu, X. J 83 96
Y
Yamaga, M 313 319
Yarnane, M. 53 71 94 97
202 213
Yannas, J 15 23
Yasui, I. 40 47 163 170
Yazawa, T. 70 72
Y innon, H. 17 24 82 96
Yokota, R 68 72
Young, G. J 185 196
Young, 1. 15 23
Youssefi, A 229 239
Yurek, G. J 11
Index Tenns Links
Z
Zachariasen, W. H. 11 20 24
30 45
Zagar, 1. 286 290
Zallen, R 10 11 39 47
314 319
Zaman, M. S. 212 214
Zarzycki, J 10 11 32 41
46 47 53 67
68 72 264 287
Zayonts, 1. A 229 238
Zener, C. 66 71 146 149
302 304
Zhang, H. 47 208 214
Zhang, Z. 14 23
Zhao, X. S. 119 121
Zhurav lev, 1. T. 185 196
Zinn-Justin, J 60 71
Zoitos, B. K. 228 238
Zupko, H. M 176 183
SUBJECT INDEX
Index Tenns Links
Aluminum oxide and, anionic size (Cont.)
in vitreous silica 33
water solubility 199
Annealing 116
Annealing point 100
Anorthite 17 82
B
Bases, dissolution in 230
Bonding 27
in dissolution in water 228
glass strength 162
in oxidation 204
Books 10
Borate glasses, density 6
heat capacity 114
molecular diffusion in 139
optical absorption 310
phase separation 53 55
structure 35
viscosity 103
Boron oxide anomaly 37
Borosilicates, chemical durability 227
compositions 6
crack propagation 167
crystallization 79
diffusion in 140 282
dissolution in water 227
ion exchange selectivity 245
Index Tenns Links
Borosilicates, chemical durability (Cont.)
leaching 223
rnechanicalloss 300
molecular solubility 125
phase separation 54
properties 6
static fatigue 173 177
strength 152 154
surface adsorption 193
viscosity 100
Boroxyl groups 36
Bubbles, diffusion from 142
in fining 209
in strength studies 157
C
Carbon dioxide, in fining 210
reaction with, glass 208
glass surface 231
Chain structure 35
Chalcogenide glasses:
optical absorption 314
structure 38
Chemical durability 215
crack propagation 181
testing methods 216
Chemical reactions, on glass surface 192
with water 135
Clearing temperature 52
Index Tenns Links
Coarsening of a phase 66 68
Color and sulfates 203
metallic particles 314
transition metal ions 313
Compositions, commercial 6
Conductivity, electrical 236
and diffusion 269
in high fields 285
measurement 265
surface 194
water and 265
Computer simulation, of structure 29
of surfaces 90
Consolute temperature 51 53
Coordination numbers 31 35 40
of transition metal ions 313
Correlation in diffusion 210
Cracks, and energy 165
in fracture 165
nucleation of 166
origins of 167
propagation of 167 181
revealed with sodium vapor 158
stress at 160
velocity of 160 167
Crystallite structure 31
Crystallization 16 19 73
and heat flow 90
nucleation of 75
surface 77
Index Tenns Links
Crystallization (Cont.)
theories of 91
velocity 18 90 92
Crystal morphology 88
Crystal structure 30
D
Definitions
Delayed failure, see Static fatigue
Density 6
Dielectric constant 292
Dielectric loss 291
effect of frequency 293
measurement 291
relation with electrical conductivity 296
theories 301
Diffusion, and chemical reaction 135
and electrical conductivity 269
of gases 122 130
inter ionic 232 279
in ion exchange 229
molecular 135
in phase growth 66
theories 145 284
Dissolution, in melts
in water 225 234
Distribution coeficients, in ion exchange 241 244
between two phases 246
DSC, and crystallization 82
Index Tenns Links
E
E Glass composition 6
Einstein Equation 269
Elastic modulus, and crack propagation 167
and molecular diffusion 145
and strength 162
F
Fast ion conductors 283
Faulting 163
Fictive temperature 118
Fiberglass 9
Fining 209
Fire-polishing 156
Flaws, surface, in fracture 165
Fluoride glasses:
crystallization 94
reaction with water 218 237
surfaces 218
structure 40
viscosity 106
Fracture 150
and crack length 160
flaw theories 160
Fragile glasses 109 115 120
Free volume 109 126
Fused salts, ion exchange with 245
Index Tenns Links
G
Gases, reaction with glass 198
solubility in glass 122
Geffilanate glasses, infrared absorption 310
rnechanicalloss 300
molecular diffusion in 139
structure 38
viscosity 103
Glass-ceramics 74
Glass electrodes 252
Gold particles, diffusion to 140
optical absorption 314
Growth rates of, crystals 19 92
phases 66
H
Hackle 158
Halogens, on glass surface 193
Haven ratio 270
Heat capacity 114
History 2
Hopping conduction 285
Hydrated layer 222 231
Hydrogen, diffusion 135
reaction with glass 136 201
Hydrogen ions 225
in interionic diffusion 225
and rnechanicalloss 200
Index Tenns
Hydrogen ions (Cont.)
from sulfur dioxide
Hydronium ion
Hydrosilicates
Hydroxyl groups, acid ionization constants
in diffusion
on glass surface
from hydrogen
infrared, spectra
from water
Links
236
225
200
193
135
187
201
186
198
Immiscibility, see Phase separation
Indentation 163
Infrared spectra 186 308 310
Internal friction, see Mechanical loss
Ion exchange 220 241
in dissolution 220
equilibrium 244
at glass surface 220
and rnechanicalloss 202
selectivity 249
with water 225
Ionic distribution and electric conductivity 284
in alkali silicate glasses 33
between melts and glass 244
in vitreous silica 33
Ionic salts 40
viscosity 108
Index Tenns
Links
K
Kauzman paradox
115
L
Life prediction
Light scattering, and phase separation
178
52
M
Mechanical loss, alkali ion peak 299
effect of, composition 300
frequency and temperature 298
and hydrogen ions 299
intermediate peak 299
measurement 297
theories 301
Melting
Metallic glasses 44
Metallic particles, in nucleation of crystals 77
optical absorption 314
Mixed-Alkali effect, in electrical conductivity 279
in mechanical loss 299
Morphology, of crystals 88
of separated phases 67
N
Narayanaswamy model 119
Nemst-Einstein equation, see Einstein equation
Nemst-Planck equations 232
Index Tenns Links
Nitrogen, reaction with glass 207
Nuclear magnetic resonance 35 38 41
Nucleating agents, in crystallization 85
impurity particles 77
mechanisms 86
metal particles 77
oxides 86
in phase separation 55
Nucleation in glass fOffilation 17
in crystallization 75
mechanisms 77
by phase separation 86
in phase separation 60
measurements 64 78
theory 57 75
transient 62
0
Optical spectra 186 307
Organic liquids 20 44
viscosity 108
Organic polymers 42
crystallization of 93
Oxidation state, of glass 203
in fining 211
of ions 202
Oxycarbide glass 41
Index Tenns Links
Oxygen, diffusion 135 137
reaction with, glass 137 202
glass surface 193
p
Peffileation of gases in glass, effect of
composition 139
measurement 130
Phase diagram s 50
Phase rule 202
Phase separation 48
free energy 57
nucleation of 60
relation to valence 52
theories 56 67
Phosphate glasses, electrical conduction in 265
rnechanicalloss 301
structure 37
ultra-violet absorption 310
viscosity 103
Plastic defonnation 163
Polishing 194
Potential of glass electrode, and ion
exchange equilibrium 252
and adsorption 260
measurement 253 256
theories 254
Processing
Index Tenns Links
Pyrex glass, see Borosilicates
composition 6
R
Radioactive waste disposal 224 236
Random network 24
Rare earth ions 315
Reaction layers 231 235
Refractive index 6 306
Regular solution model 54
and ion exchange selectivity 249
Relaxation 116
Rutherford backscattering 218
S
Sealing 240
Selectivity, and anionic size 246
in ion exchange 247
sequences 248
theories 249
Selenium, structure of 39
Silica, vitreous:
bond angles in 32
chemical adsorption 192
compositions 7
crack propagation 167
crystallization 18
dielectric loss 295
diffusion in 276
Index Tenns Links
Silica, vitreous:
bond angles in (Cont.)
dissolution in, melts
water 227
electrical conductivity 275
gas solubility in 122
ion exchange selectivity 245
ionic diffusion in 274 276
manufacturers 7
molecular diffusion in 132 134
optical adsorption 307 310
physical adsorption 190
reaction with hydrogen 201
solubility of water in 229
static fatigue 175 177
strength 156
structure 27 30
surface structure 185
viscosity 103
water in 135
Silicon, oxidation of 144
Size, anionic, and exchange selectivity 250
ionic and diffusion 282
molecular and diffusion 132 146
Soda-Lime glass, composition 6
crack propagation 167
density 6
dielectric loss 296
electrical conductivity 278
ion exchange selectivity 245
Index Tenns Links
Soda-Lime glass, composition (Cont.)
ionic diffusion in 274
rnechanicalloss 299
molecular diffusion in 141
phase separation in 49 55
properties 6
static fatigue 177
strength 154
viscosity 100 105
Softening point 100
Sol-gel fanning 9
Solubility, carbon dioxide 208
of gas molecules 122
of glass in water 229
hydrogen 124
theories 126
water 135
Spherulites 88
Spinodal decomposition 67
Static fatigue 172
experimental results 174 177
statistics of 177
and surface treatment 176
theories 180
Stokes-Einstein equation 67 273
Strength 154
distribution of 151
testing of 150
theoretical 162
Index Tenns Links
Stress, accelerated reactions 182
at crack tips 161 181
and ionic diffusion 271
and molecular diffusion 132
relaxation 116
Stress- intensity factors 161
Sulfur, structure of 39
Sulfur dioxide, in fining 211
reaction with glass 209
Surface conductivity 194
Surface energy 184
and strength 165
Surface experimental techniques 189
Surface structure 185
T
Theffilal expansion 114
Thirsty glass 44 190
Transition, glass 113
and electrical conductivity 272 278
Transition metal ions, coordination numbers 313
glass-fanning tendency 14
optical absorption 313
oxidation state 204
TIT curv es 17
U
Uses of glass 4
Index Tenns Links
V
Viscosity 99
definition 99
measurement 101
theories 109
Vycor glass 44 48 190
W
Water, diffusion 135
effect on electrical conductivity 265
reaction with glass 135 198 215
solubility in glass 135
surface 187
Weathering 209 231
Working point 100
X
X-Ray diffraction 28 31 36 41
small-angle 68
Z
Zachariasen's Rules for glass fOffilation 21