/


Текст
1 I I O T T
1 T U t
1
Hi ■'
• s* »** ■
I'*"
. -.-V
*:- \ *
t. ■ \
*^
MASTERING
ELLIOTT
WAVE
j ^ Frvsentlng tise ■ yS iflod-
.>■: fln>J Sdent \
pproach rtet Forecasting
by Glenn Neely
wim Eric Hail
rl
Cs,
/
■v-ir 1 -m. i
^
>-■ -.1 .v ■ I .
TV' :
s
v.,
Mastering Elliott Wave
Version 2.0
Copyright © 1990 by Glenn Neely
This is a revised edition of a work originally published
under the title of "Elliott Waves In Motion"
Copyright ® 1988 by Glenn Neely
All rights reserved
including the right of reproduction in whole or in part in
any form or by any means without permission from the pnblisher.
For information contact:
Windsor Books
P.O. Box 280
Brightwaters, N.Y., 11718
Manufactured in the United States of America
ISBN 0-930233-44-1
For information on related products and services, write or call:
Elliott Wave Institute
1278 Glenneyre - Suite 283
Laguna Beach, California (CA) 92651
Office: (714)497-0949 • TeleFax: (714)497-0983
Disclaimer
"Mastering El tiott Wave" is an independendy producedprodnct of die Elliott Wave Insu tute. Every effort has been made
to supply complete and accurate information. However, neither the author, the Elliott Wave tnstitnte, nor anyone else
associated with this publication shall be liable for any liability, loss, or damage direcfly or indirectly caused or alleged to be
caused by this book. All ideas and material presented are entirely those of the author and do not necessarily reflect those of
the publisher or bookseller.
Warning: all commodity trades, patterns, charts, systems, etc., discussed in this book are for illustrative purposes only
and are not to be construed as specific advisory recommendations. No method of trading or investing is foolproof or without
difficulty. Therefore, always proceed with caution before investing and realize mat past performance of a trading system or
technique is no gnarantee of future investment snecess.
Acknowledgments
This book has been nearly adecade in the making. During that period of time, a multitude of friends,
clients and associates have provided me with support, helped me solidify my ideas regarding the Wave
Theory and have indirectly assisted me in creating the knowledge which is presented in "Mastering
Elliott Wave." Some listed may not have realized or, through time, may have forgotten their impact on
my work. Here, I would like to remember them for their contributions.
First, the current and past "Elliott Wave Telephone Course" clients too numerous to all be mentioned,
but who were instrumental in the culmination of this treatise. A few should be singled out due to their
support beyond normal expectations: John Lux (my very first Course client - you probably thought I
forgot about you); Jim Cottone, who gave me the encouragement and assistance to write my first book
(no longer available); George Limberg (a great student); John Porter (thanks for all the help during the
early newsletter days); Jo Roberts (for all the valuable statistics she provided); Percy Stokes (for his
generous support); Jay Walman (thanks for letting me on your show and for being a friend); Robert Blum
(a true believer); Bob Stark (who has been my friend longer than I can remember, and has always been
there when I needed him); Mark Brantley (one of the most devoted and helpful students I have ever
worked with); Mike Walker (who was not only a client, but a close, personal friend from my home town,
Lafayette, La. and who I will never forget - thanks for all the free computer time, charts and support);
Walter Koval (who, for personal reasons, gives me the greatest sense of accomplishment for having
taught); Donald Anderson (who currently holds the record for the highest number of retakes of my
Telephone course [six-times]) and finally and especially Jack Sumich (much more than a course client,
his belief and support have been incalculable).
Next, the close associates I would like to thank are: David Reif (who provided me with some of the
most valuable knowledge I have ever learned about market behavior); Gerald Friedman (it has been a
pleasure working with you); Jeannine Henry (hope our relationship continues for a long time); Jim Barth
(the best broker I have ever known); Jeff Bower of Financial News Network for allowing me to be on
his program and for being the first one to establish my "Guru" status; Richard Mogey of the "Foundation
for the Study of Cycles" for maintaining the integrity of that organization and for allowing me to be one
of their occasional guest speakers; Larry Jacobs for inviting me to participate in his annual Conferences;
Irwin Mintz for his interest in expanding the Institute's horizons; Phyllis Kahn (of Gann World) for being
such acaring and generous friend and a true lady; Perrin Gower for his promotional "plugs," ardent letter
writing and stimulating conversation; Robert Debnam, my best contact with Europe; Walter Murphy
(Merrill Lynch's resident Elliott Wave analyst); Michael Jachtschitz (for his valuable assistance and
effort above and beyond the call of duty); Evans Design Associates for creating the powerful graphics
on the front cover and finally, Steve Schmidt ofWindsor Books for his interest in publishing "Mastering
Elliott Wave" and for letting me do it my way.
At this point I would like to thank a special group of friends who were invaluable in finalizing the
"infamous" rewrite of Chapter 3 (which took eight months), I call them my "beta" testers: Gary Long
(a long-time devotee of the Elliott Wave Institute, his ideas for Chapter 3 were pivotal to its design), John
Kozma (the most enthusiastic tester of Chapter 3 who had some great ideas of his own), Richard
Schmoeller (thanks for all the time you spent error checking my rough drafts), John Lomas (thanks for
your ideas), Bill Wilson (the most energetic Telephone Course client I have eveT taught, thanks for your
input) and to Bill Abrams (that towering icon of the east coast who benevolently holds the "Big Apple"
in the palm of his hand).
This next person has been such a believer and promoter of my approach to Elliott Wave analysis you
would think he ran a P.R. firm and was charging me for the exposure. He has done so much to help me
over the years and has never asked for anything in return (but my friendship) that I feel it only appropriate
to devote an entire paragraph to giving him a long over-due heart-felt "thank you." This wonderful fella's
name is Tim West. Thanks, Tim, for your assistance at my talks in New York City and Chicago in 1989,
thanks for proof-reading so many of my manuscripts over the last three years and for giving me your
opinions on promotional literature and thanks for all your terrific ideas regarding Chapter 3. Tim West
is everything you could expect from a friend and more. Even though we live on opposite coasts and I
virtually never see him in person, I feel Tim possesses all the qualities most people could only hope to
have. Tim, your a great friend (I hope this makes up for any occasion in the past [andfuture] when I have
not remembered to thank you for your help).
Furthermore, the following personal friends who have never stopped believing in me: Jeannie Bishop
(who has meant more to me than she will ever know); all the Aucoins (where can I begin - Mrs. Aucoin
- you're an inspiration to us all, Carla -I'll never forget you, you are the best friend I have ever had, Kevin
- the most creative person I know, Kim and Doug, Keith and Mr. Aucoin); Eric Hall (without whom this
book could not have been done); Billy Leblanc - thanks for being a friend; Claude - a terrific and long-
term friend, Kip-thanks for helping me get started; Travis, Chuck, Hanna and Wright - the people to
know in New Orleans; Myrtle Blanchett, a realtor and an inspiration - she wants diings her way and
everyone steps aside to let her have it; Renee' Havig, the most feminine and well adjusted Chiropractor
on the west coast and to my wonderful brothers and sister (Bobby, Brent, Karen and Mark).
Finally, a standing ovation to my mother, Doris L. Neely, who provided the most ideal upbringing
imaginable, who has been an incredible pillar of strength (morally, financially, and psychologically) all
these years, and who has unconsciously implanted the drive for perfection and the confidence that
enabled me to create this book and who I miss very much (additionally, who is the best proof-reader in
the state of Louisiana, helping to make "Mastering Elliott Wave" as error-free aspossible — any errors
still remaining are exclusively of my own making).
Glenn Neely ■ 1989
(revised April 1990)
Table of Contents
Elementary Discussions
What is the Elliott Wave Theory?
Price Patterns of Psychology
Natural, Non-Periodic Phenomenon
A Unique Analytical Too!
Additional Examples
Why Learn Elliott Wave Theory?
Multiple Benefits
Multi-area Application
Numerous Techniques Unnecessary
Helpful in Indicator Clarification
Signals Infrequent, but Reliable
Why the Controversy?
Complexity
Public Mind Set
Years to Master
Application Requires Time
Endless Array of Specifics
Memorization
Frequent Indeterminacy
Difficulty
Why This Book May Create More Controversy
What Makes Elliott Wave Theory Unique?
Complete Perspective
Quantification of Mass Psychology
Detailed Categorization
Grand Simplification
Clear Delineation of Price Behavior
How Should You Learn the Theory?
Why Another Book on Elliott Wave was Necessary
Additional Techniques Required
Specific Procedures Described
Realistic Diagrams Previously Non-Existent
Disclosure of Advanced Concepts
Original Presentation Sequence
New Terminology
New Discoveries, The Neely Extensions
How I Discovered these New Concepts and Techniques
The Telephone Course
Long Hours of Work
Where is the Theory Applicable?
How Should You Work with and Perceive Elliott?
Meticulously
Open-Mindedly
What's Next?
General Concepts 21
What is a "Wave"? 2-1
Why Do Waves Occur? 2-3
Why Are Waves Important? 2-3
Finances 2-3
Psychology 2-3
Patterns 24
How Do You Categorize Waves? 2-4
Classes 2-4
Degree 2-4
How Do You Label Waves? 2-5
Structure Labels 2-5
Organization 2-5
Progress Labels 2-5
What Data Should Be Used To Analyze Waves? 2 6
Closing Price Data 2-6
Bar Charts 2-6
Futures Charts 2-8
Cash Data 2-9
How Do You Plot Data? 2 11
//ow Wony Charts Are Necessary? 2-12
How Complicated Do Waves Get? 2-12
How Is This Knowledge Used To Analyze? 2-13
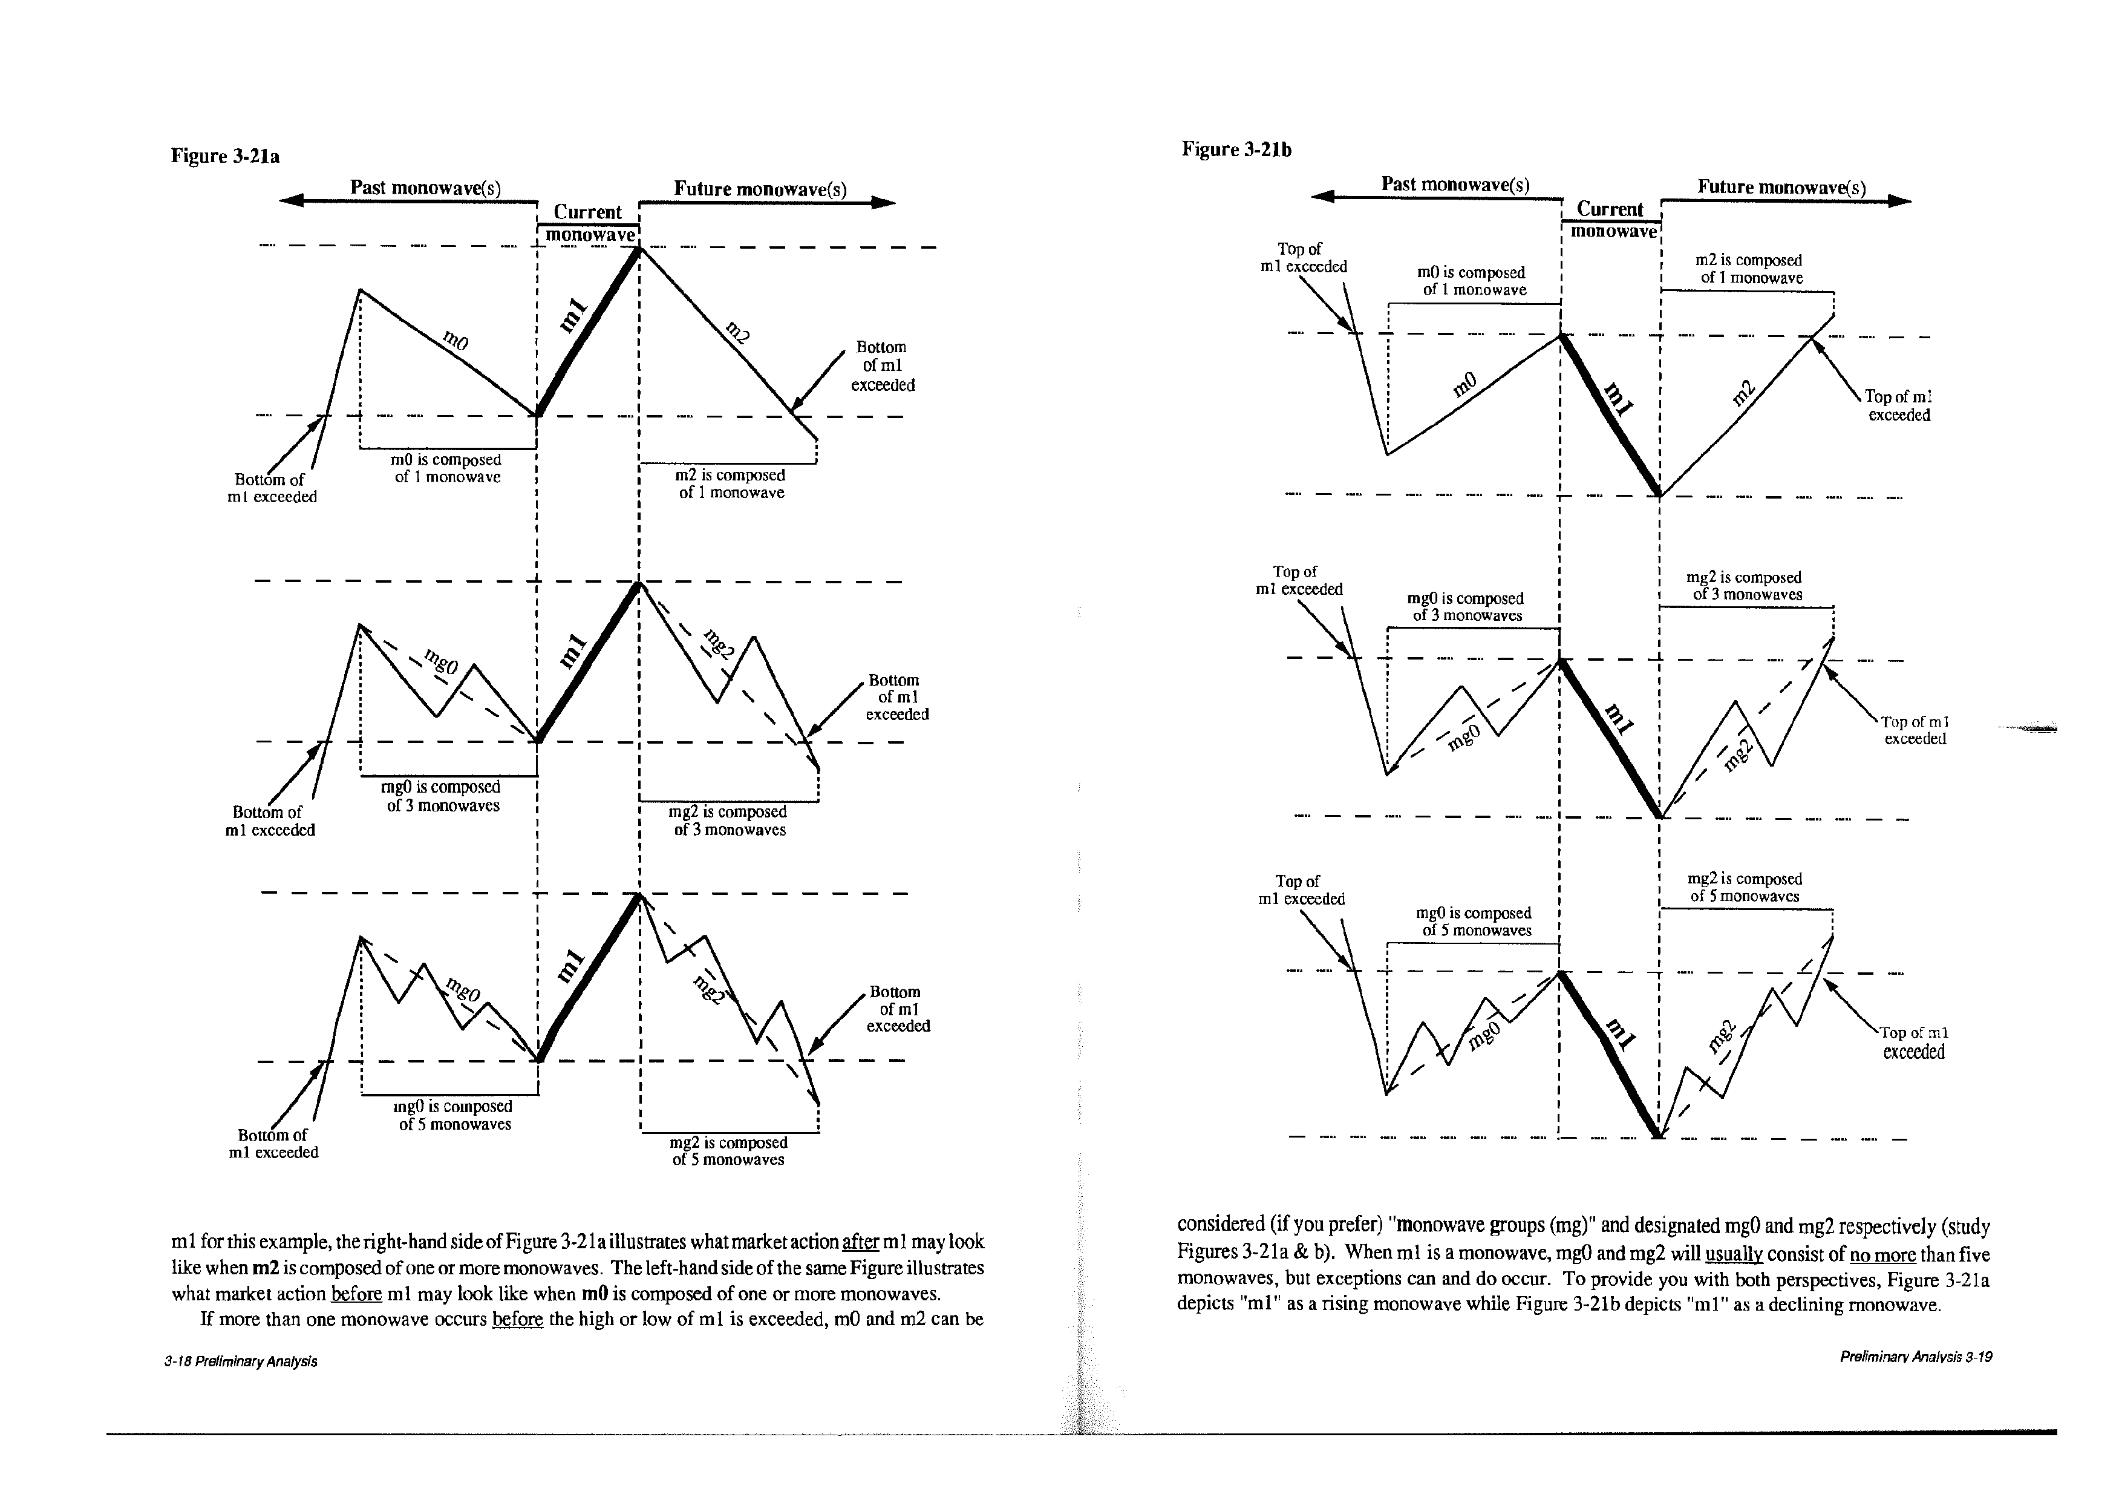
Preliminary Analysis 3-1
Chart Preparation and Data Management 3-1
Identification ofMonowaves 3-2
Rule of Proportion 3-3
Rule of Neutrality 3-9
Chronology 3-14
Rules of Observation 3-14
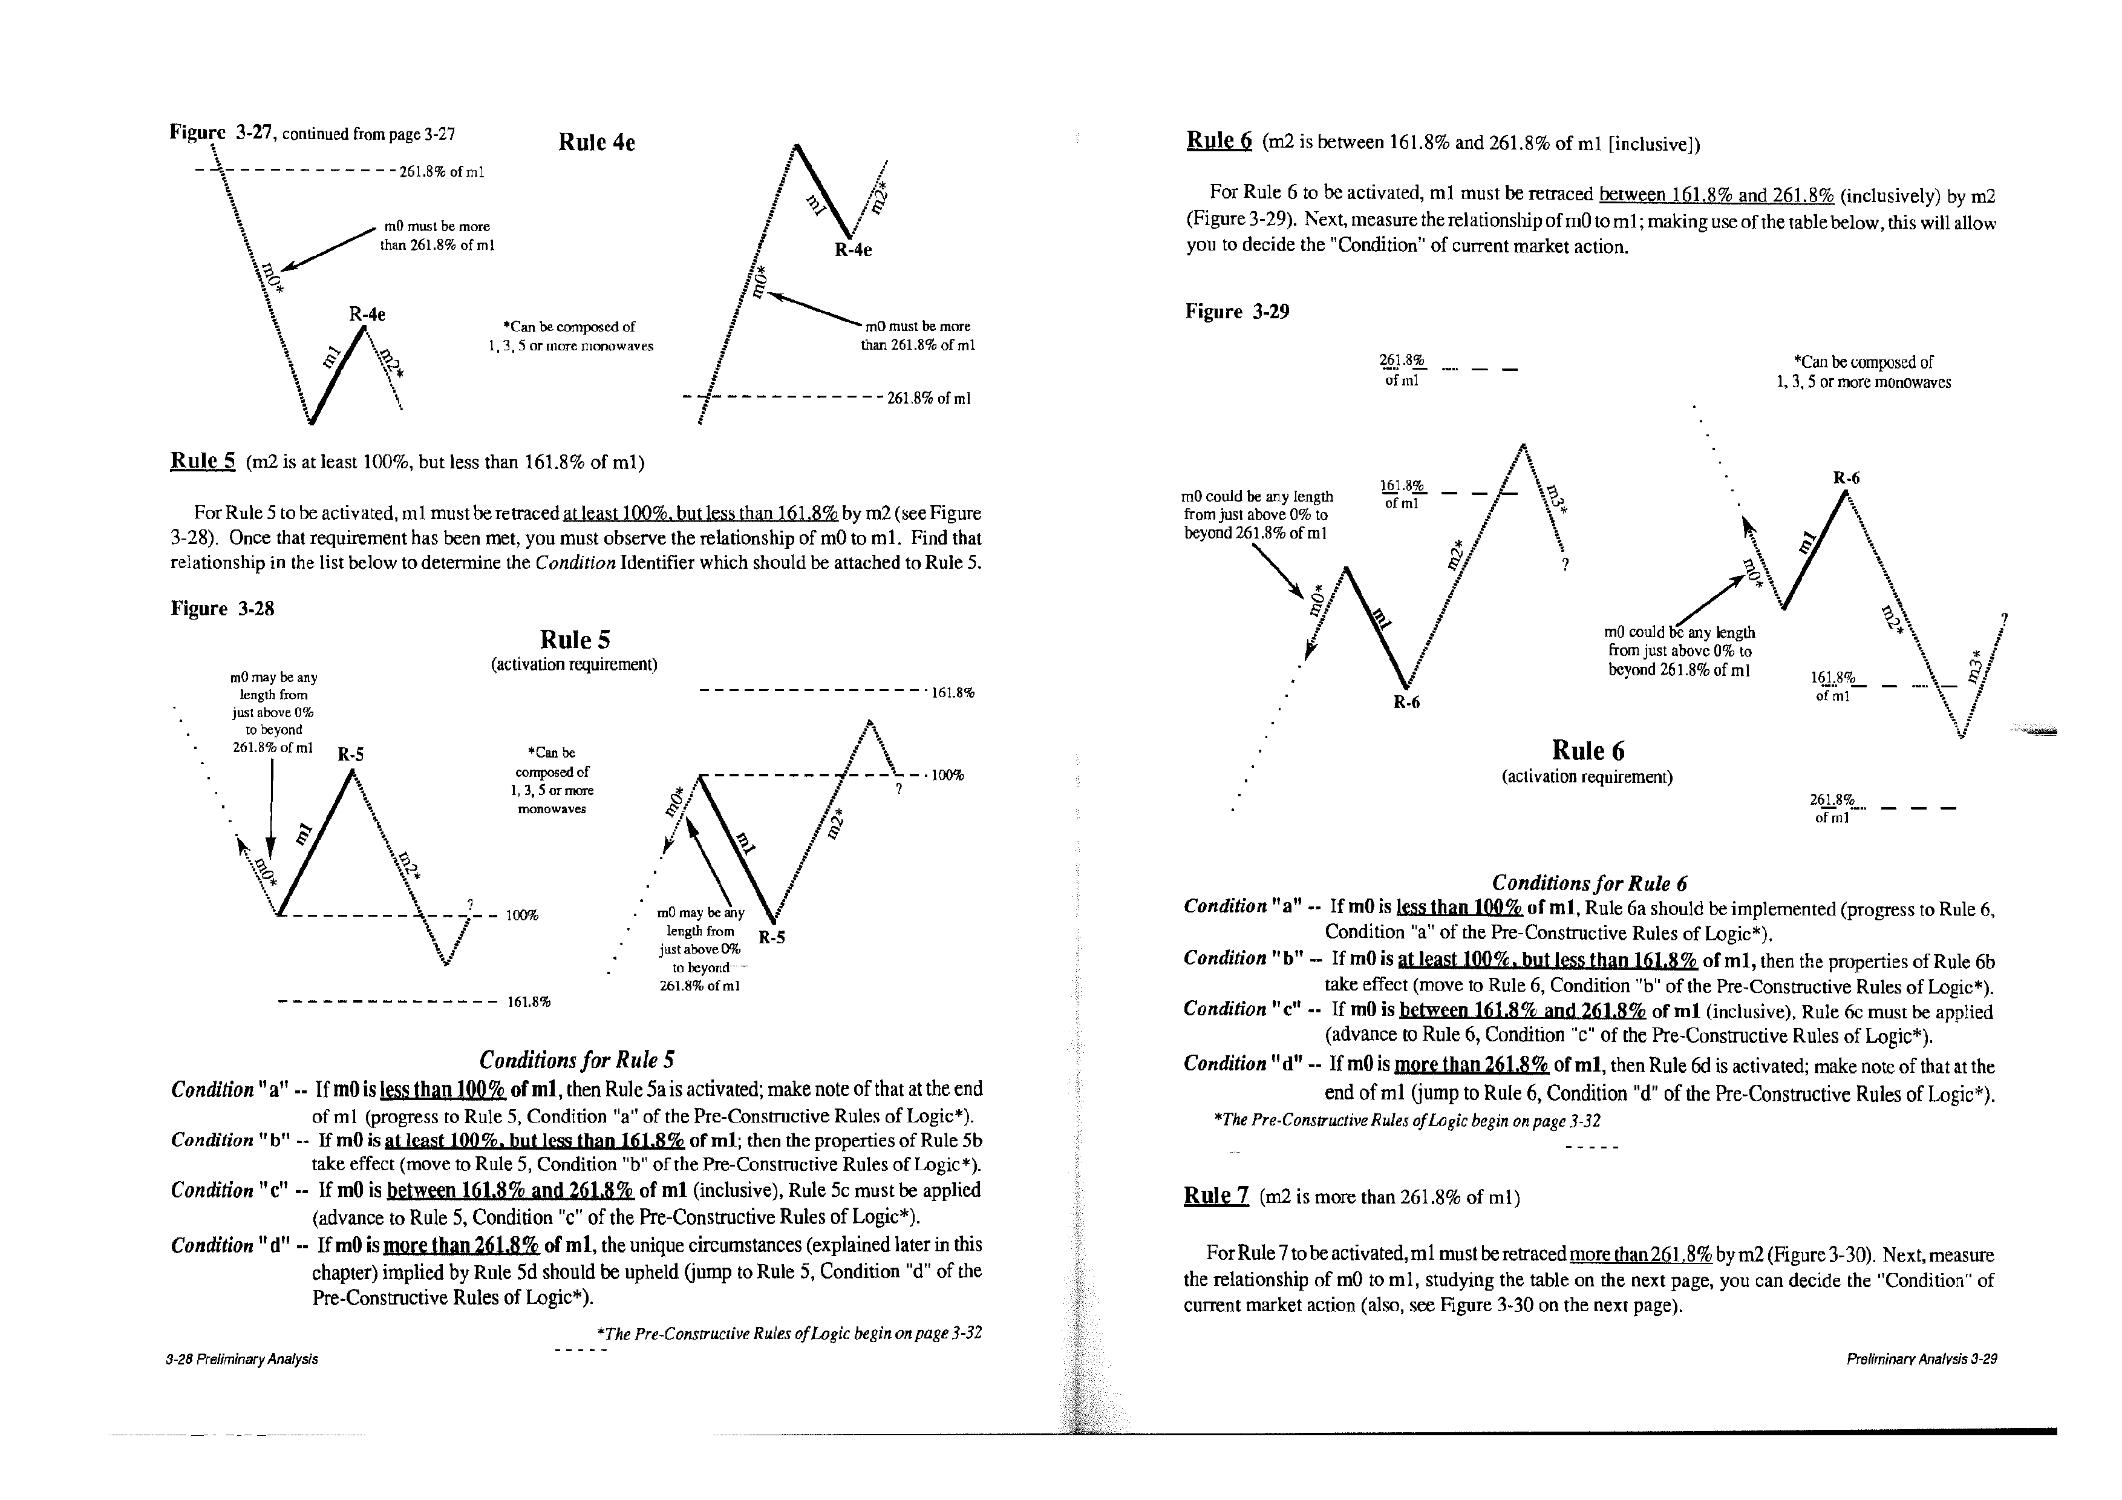
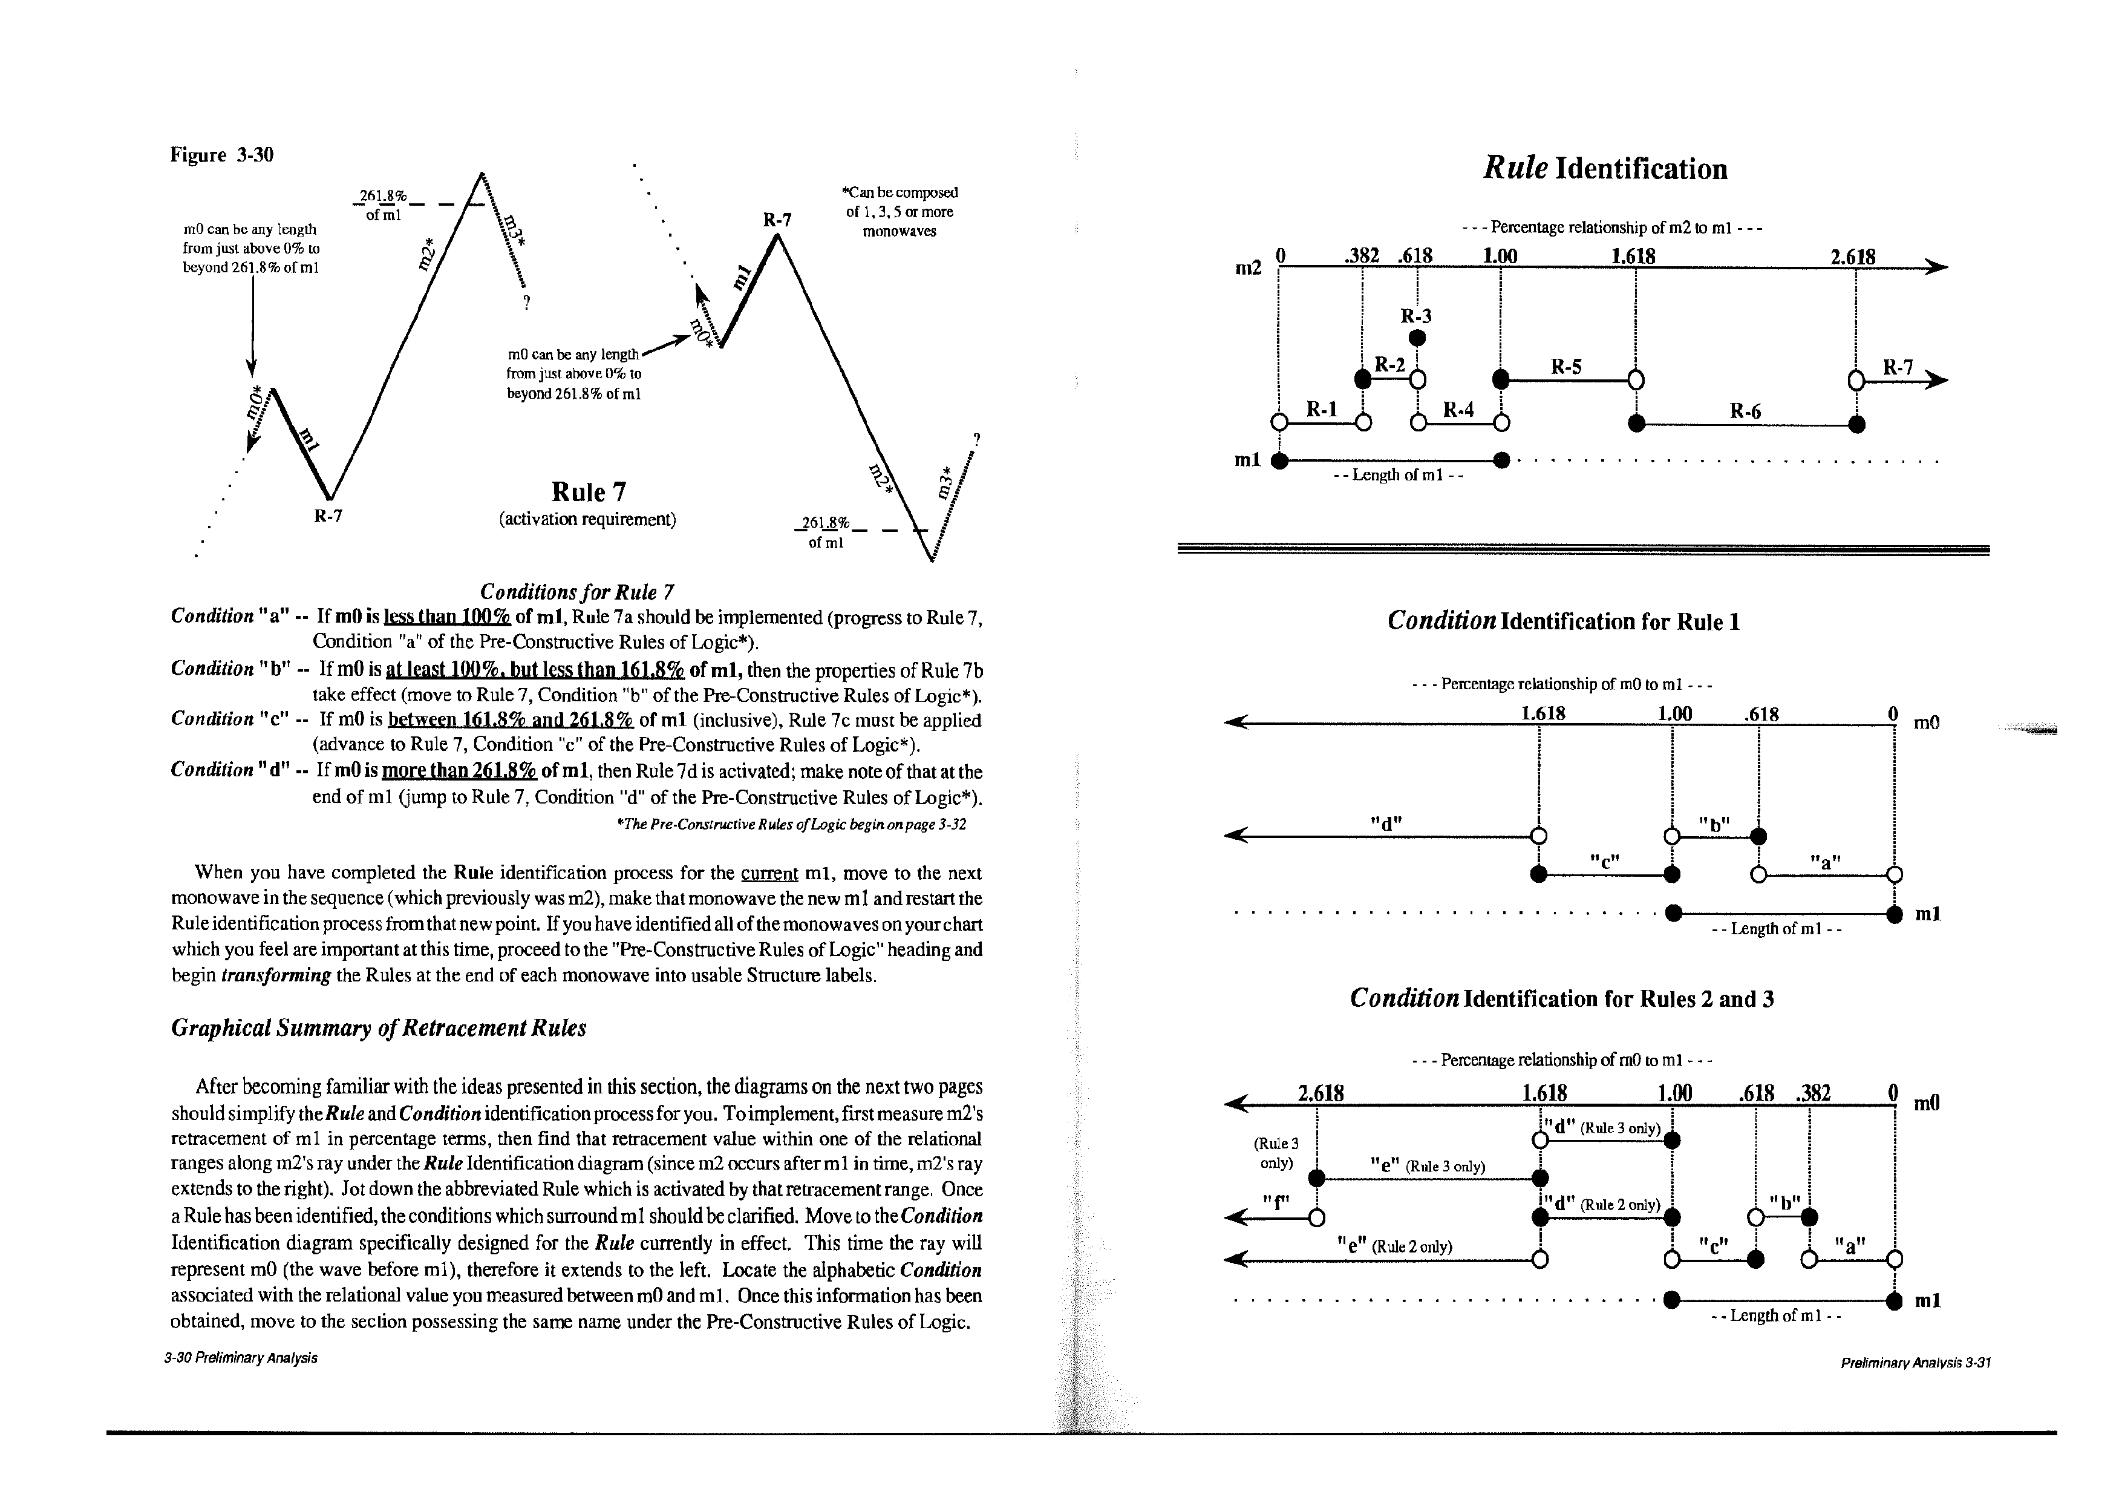
Retracement Rules 3-22
flufe Identification 3-23
Graphical Summary of Retracement Rules 3-30
Pre-Constructive Rules of Logic 3-32
Transformation of Rule Identifiers 3-33
Implementation of Position Indicators 3-60
Directions 3-61
Position Indicator Definitions and Sequences 3-6l
Pattern Isolation Procedures 3-65
Special Circumstances 3-68
Synopsis of Chapter 3 3-69
2 - Table of Contents
Intermediary Observations
Monowave Groups
Rule of Similarity and Balance
Price
Time
Rounds (1 through 3)
Zigzag "DETOUR" Test
What's Next?
Central Considerations
Construction of Polywaves
ImPHlfijons
Essential Construction Rules
Application to market action
Extension Rule - (the Litmus Test]
Introduction o/ProgTess Labels to the Wave Group
Conditional Construction Rules
Rule of Alternation
Rule of Equality
Overlap Rule
Review
IreuMmig Pauflimft -Impulsions
Channeling
Fibonacci Relationships
1st Wave Extension
3rd Wave Extension
5th Wave Extension
Degree
Realistic Representations
Corrections
Introduction a/Progress Labels to the Wave Group
Essential Construction Rules
Flats
Strong b-wave
Normal b-wave
Weak b-wave
Zigzags
Normal
Truncated
Elongated
Triangles 5-23
Contracting 5-27
I. Limiting 5-28
a. Horizontal variation 5-28
b. Irregular variation 5-30
c. Running variation 5-30
IT. Non-Limiting 5-30
Post-Triangular Thrusts 5-31
Expanding 5-31
I. Limiting 5-32
a. Horizontal variation 5-32
b. Irregular variation 5-33
c. Running variation 5*33
U. Non-Limiting 5-33
Conditional Construction Rules - Corrections 5-34
Alternation 5-34
Price 5-34
Time 5-34
SreaMnng PajJuDtt -Corrections 5-34
Channeling 5-35
Fibonacci Relationships 5-35
Flats 5-35
Strongb-wave 5-35
Normal b-wave 5-35
Weakb-wave 5-36
Zigzag 5-36
Normal 5-36
Elongated 5-36
Tiuncaied 5-36
Triangles 5-36
Degree 5-37
Realistic Representations - Corrections 5-37
Chapters 6 through 12 are almost exclusively the
Neely Extensions
of Elliott Wave Theory
Post-Constructive Rules of Logic 6-i
Impulsions 6-1
Two Stages ofPattern Confirmation 6-1
Stage 1 6-1
Stage 2 6-2
1st Wave Extension 6-2
3rd Wave Extension 6-2
5 th Wave Extension 6-2
5th Wave Failure 6-3
Corrections 6-3
Requirements for Pattern Confirmation 6-3
Flats and Zigzags 6-3
Triangles 6-4
4 ■ Table of Contents
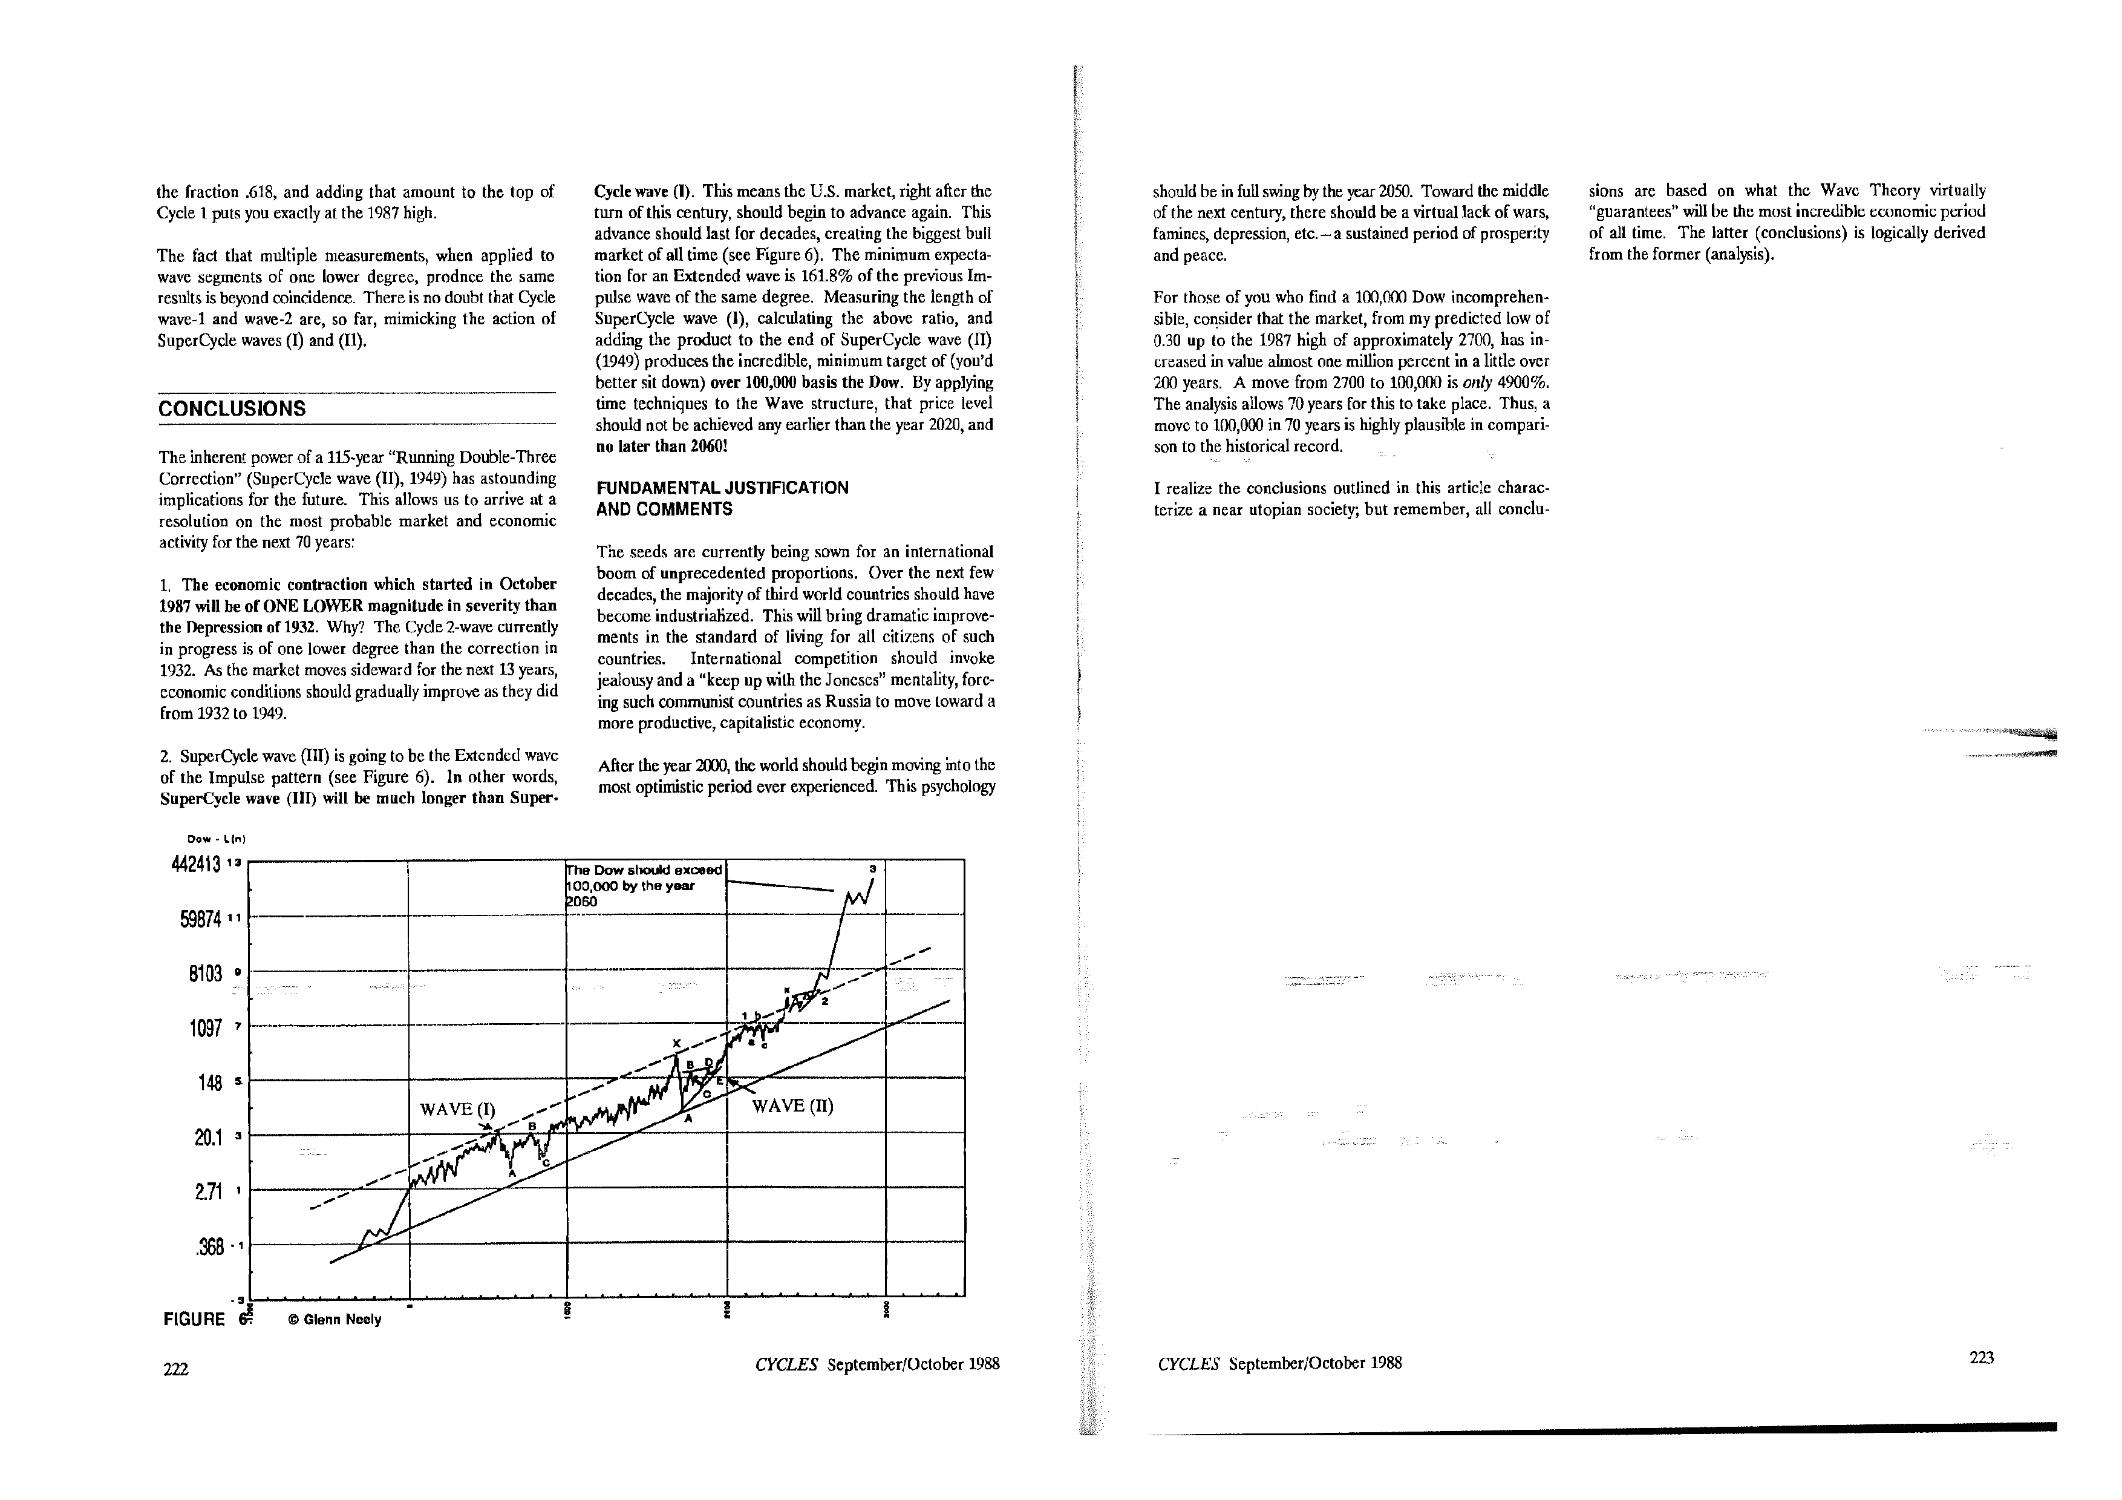
Conclusions
Compaction Procedures
Regrouping
Integration
Progress Labels - Revisited
Complexity Rule
Monowaves
Polywaves
Multiwaves
Macrowaves
More on Degree
Degree Titling
Degree Symbolizing
Review
What is a Wave? - Revisited
Flow Chart of Entire Neely Method of Elliott Wave Analysis
Construction of Complex Polywaves, Multiwaves etc
Construction of Complex Polywaves
Standard Type
Non-Standard Type
Additional Retracement Rules
Specifications
Condition 1
Condition 2
Complex Correction with Small x-Wave(s)
Complex Correction with Large X-Wave(s)
Review
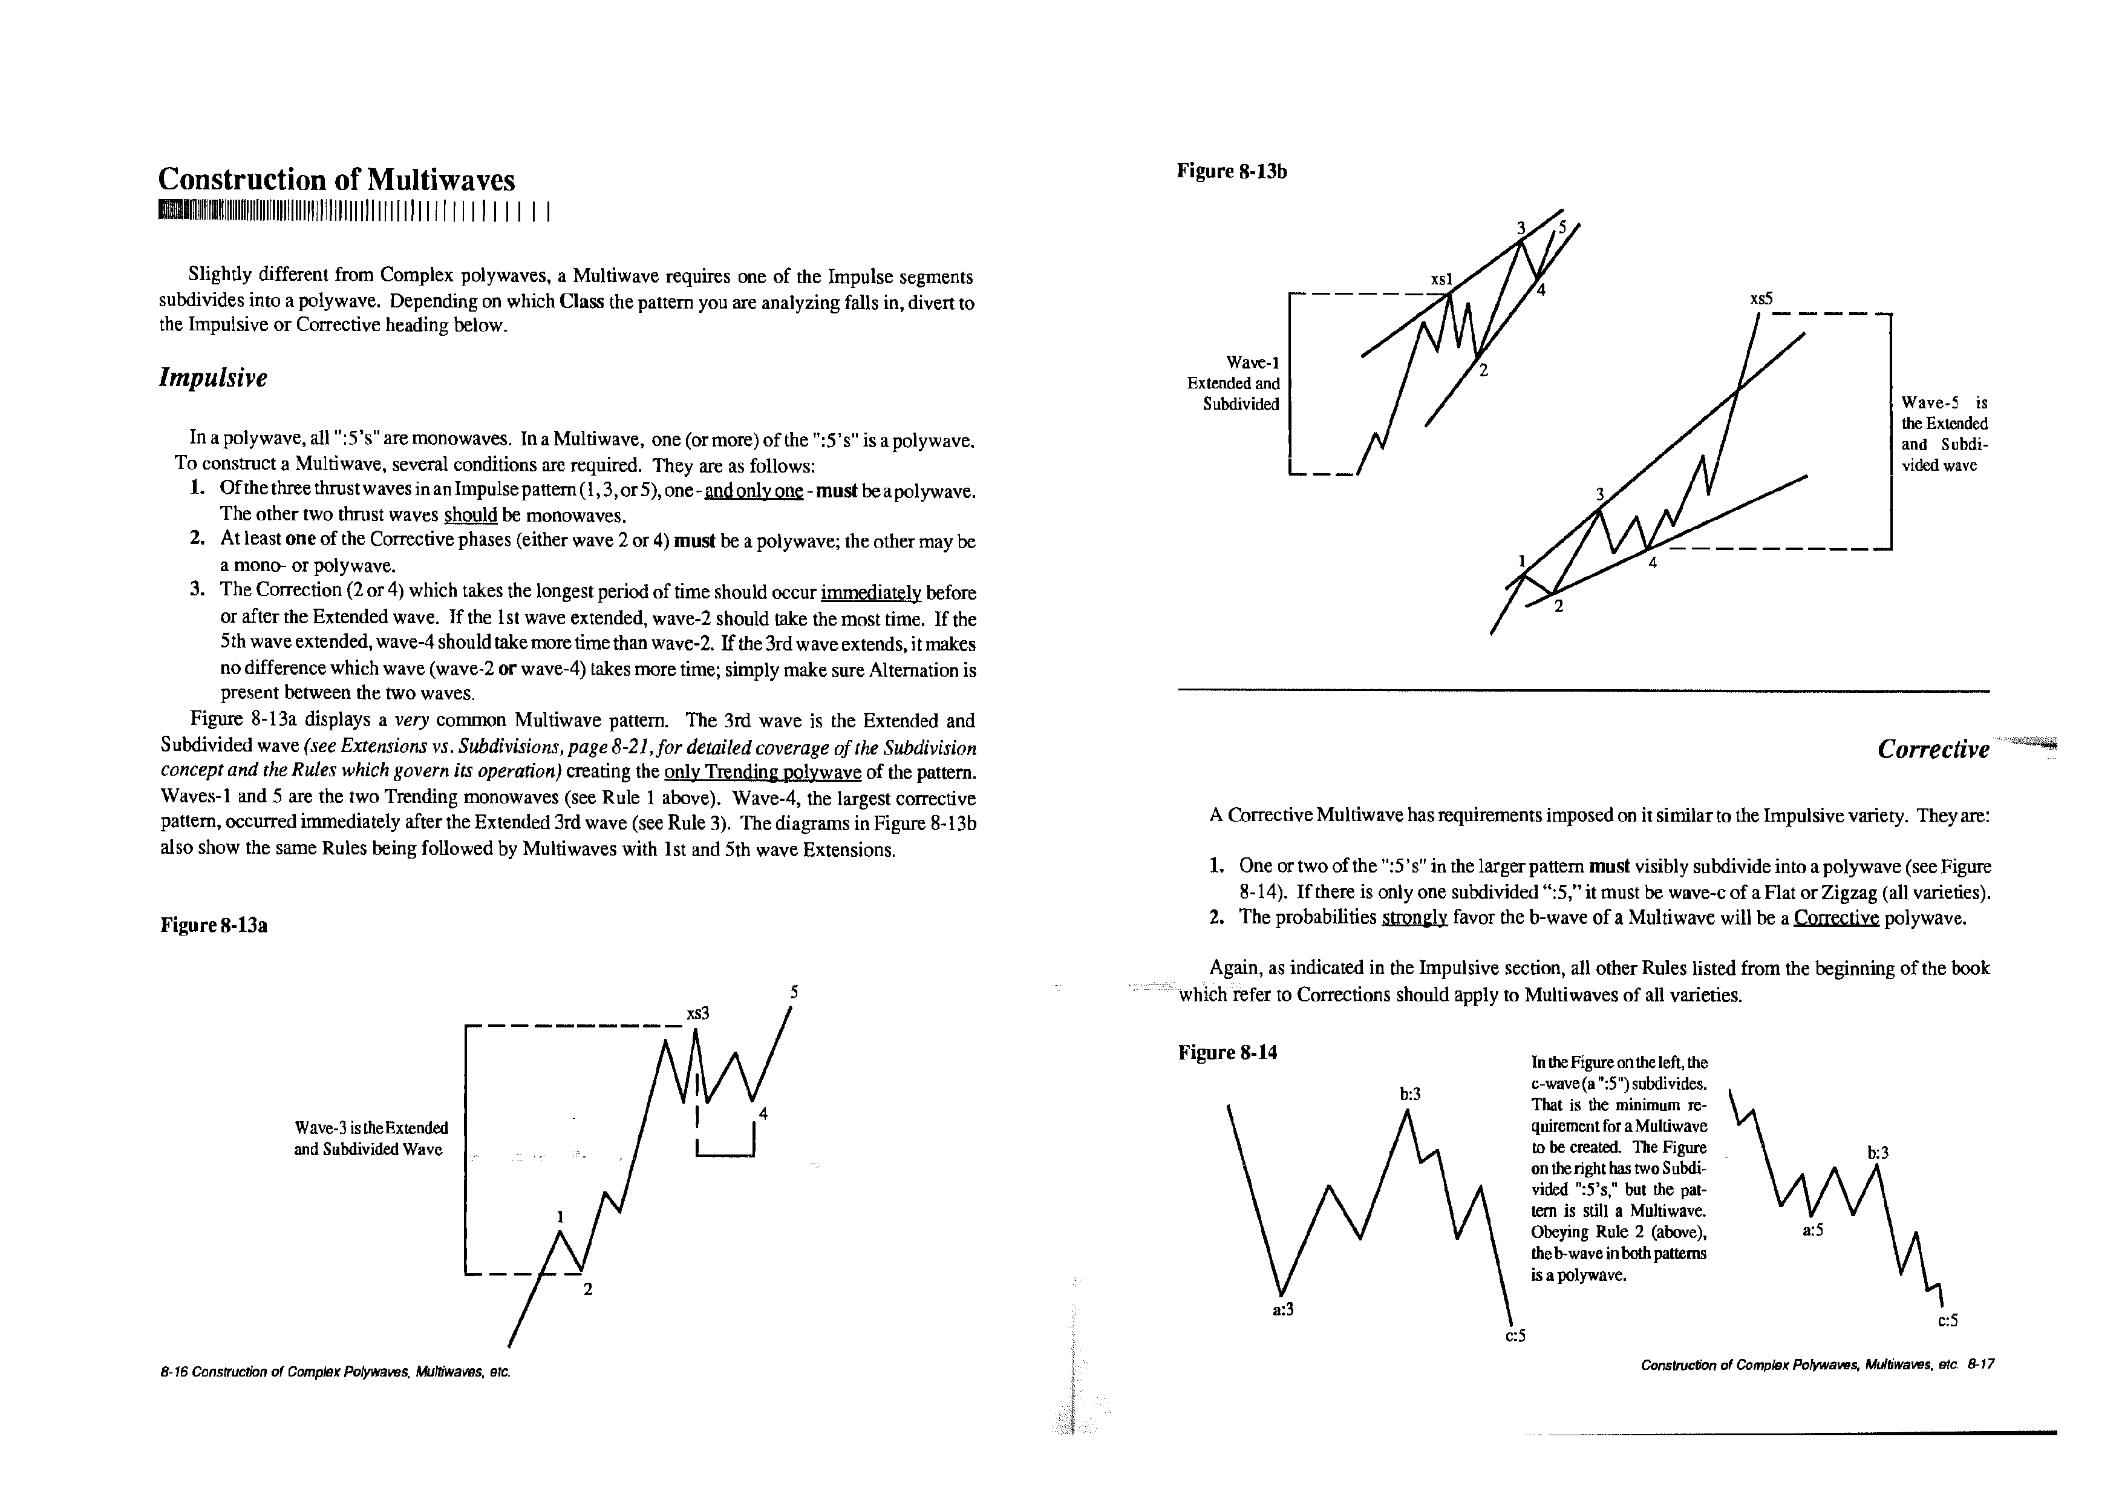
Construction of Multiwaves
Impulsive
Corrective
Construction of Complex Multiwaves
Construction of Macrowaves
Impulsive
Corrective
More on Alternation
Intricacy
Construction
More on Extensions
Extensions vs. Subdivisions
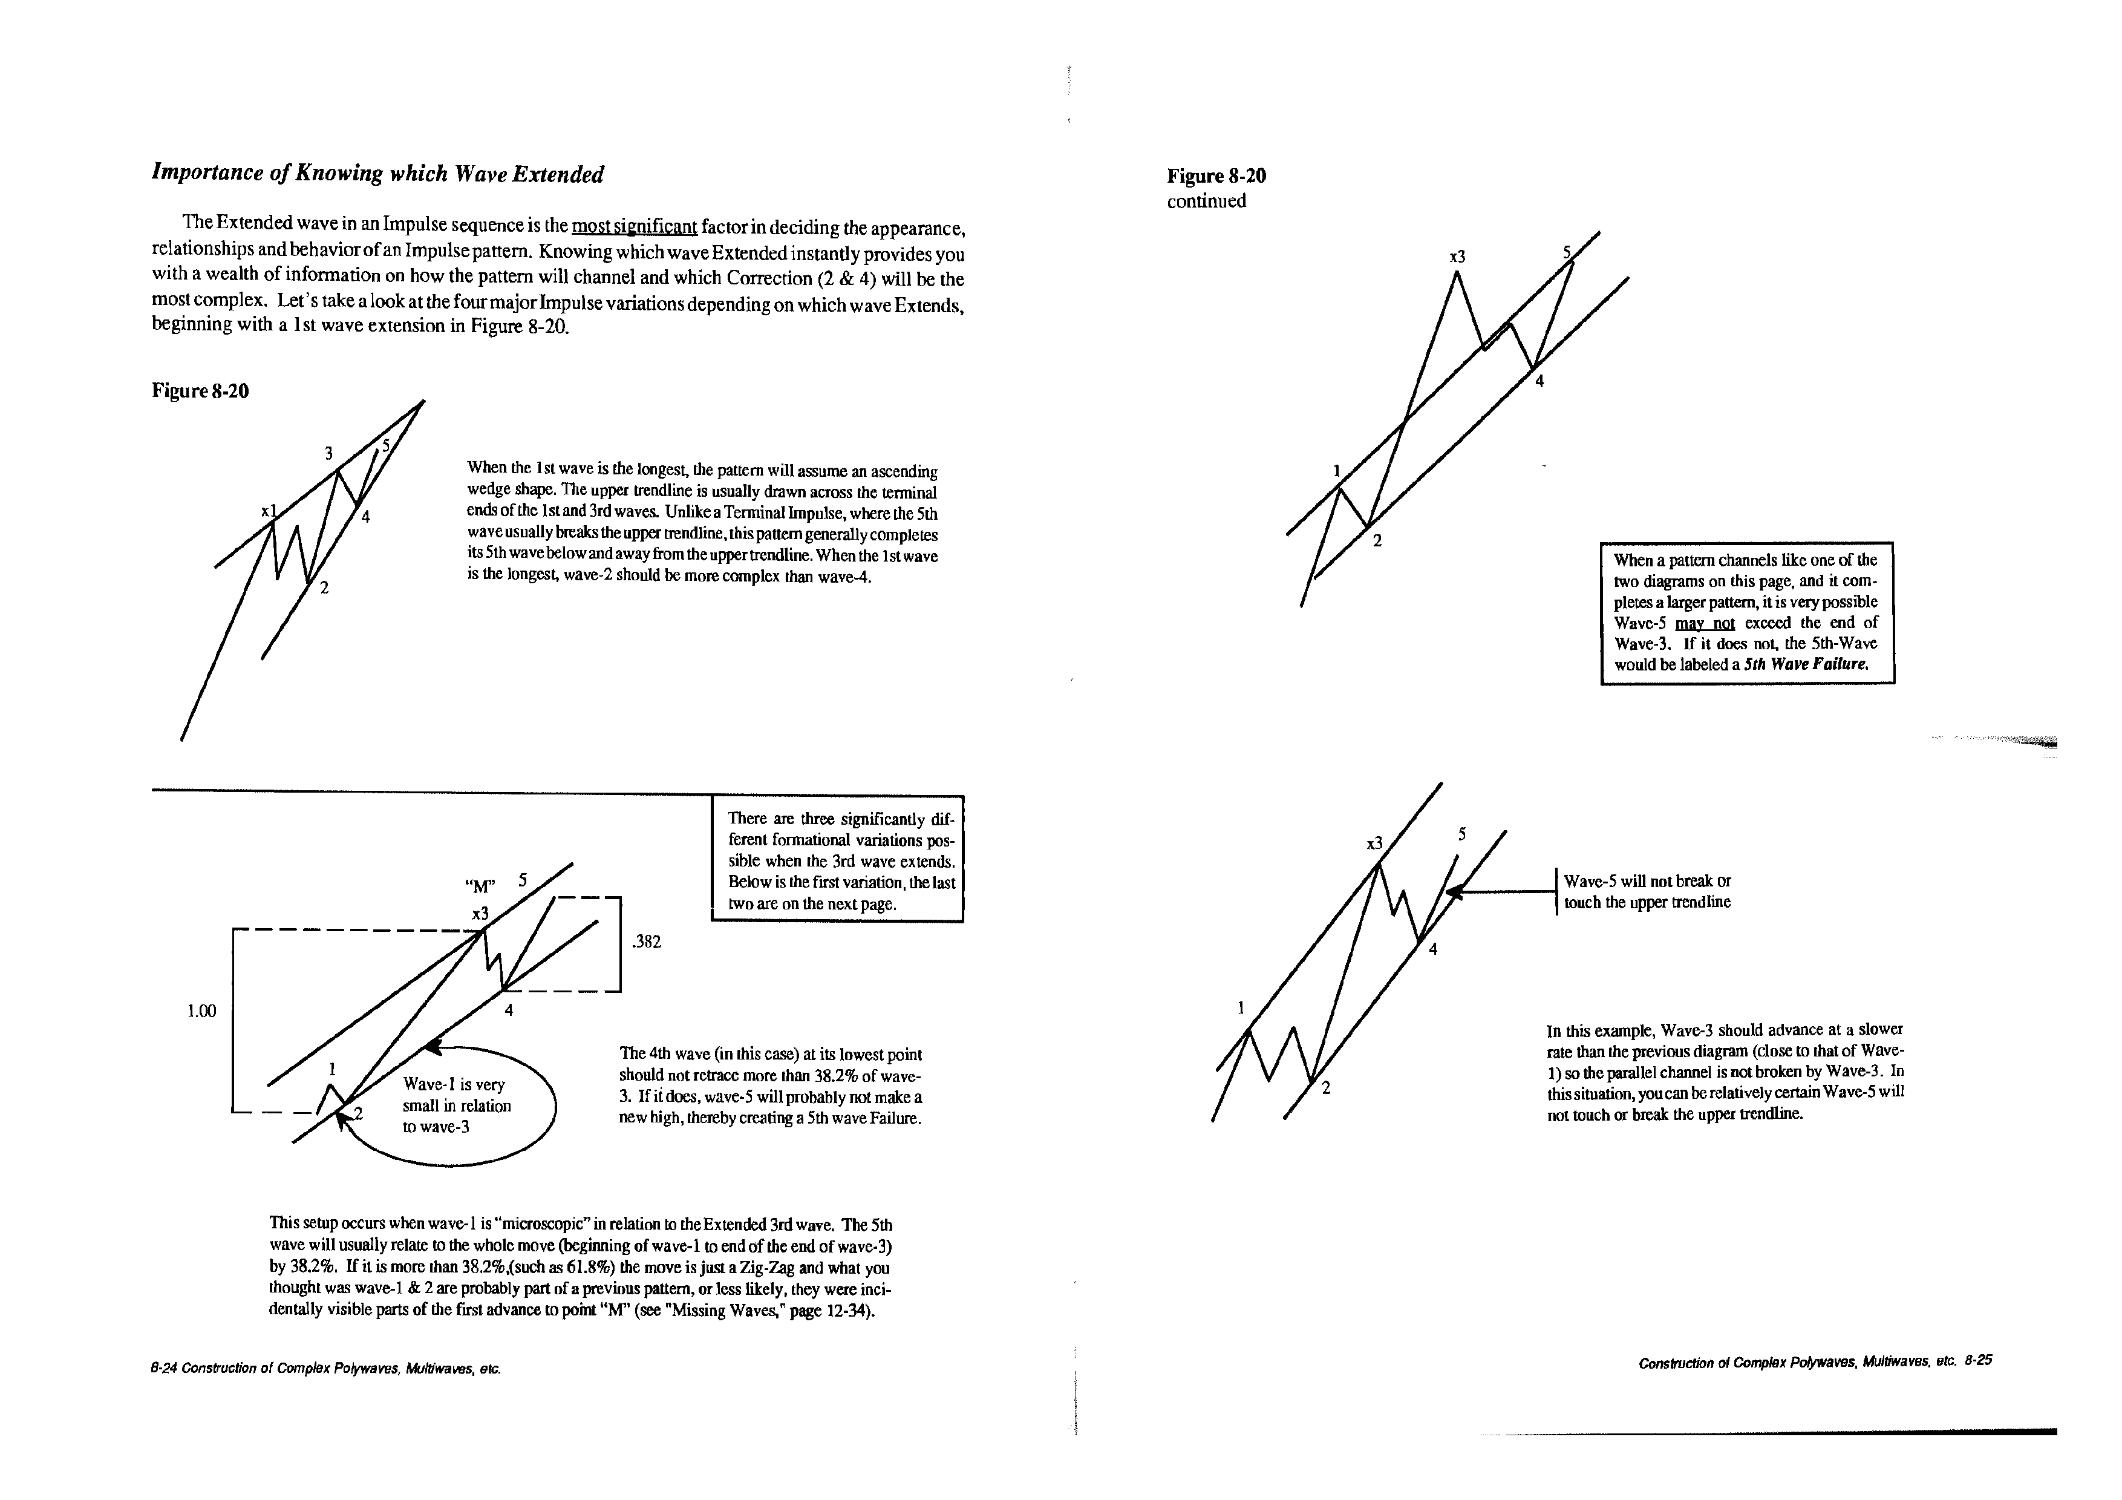
Importance of Knowing Which Wave Extended
Knowing Where to Start a Count
Basic Neely Extensions 9-1
Trendline Touch Points 9-1
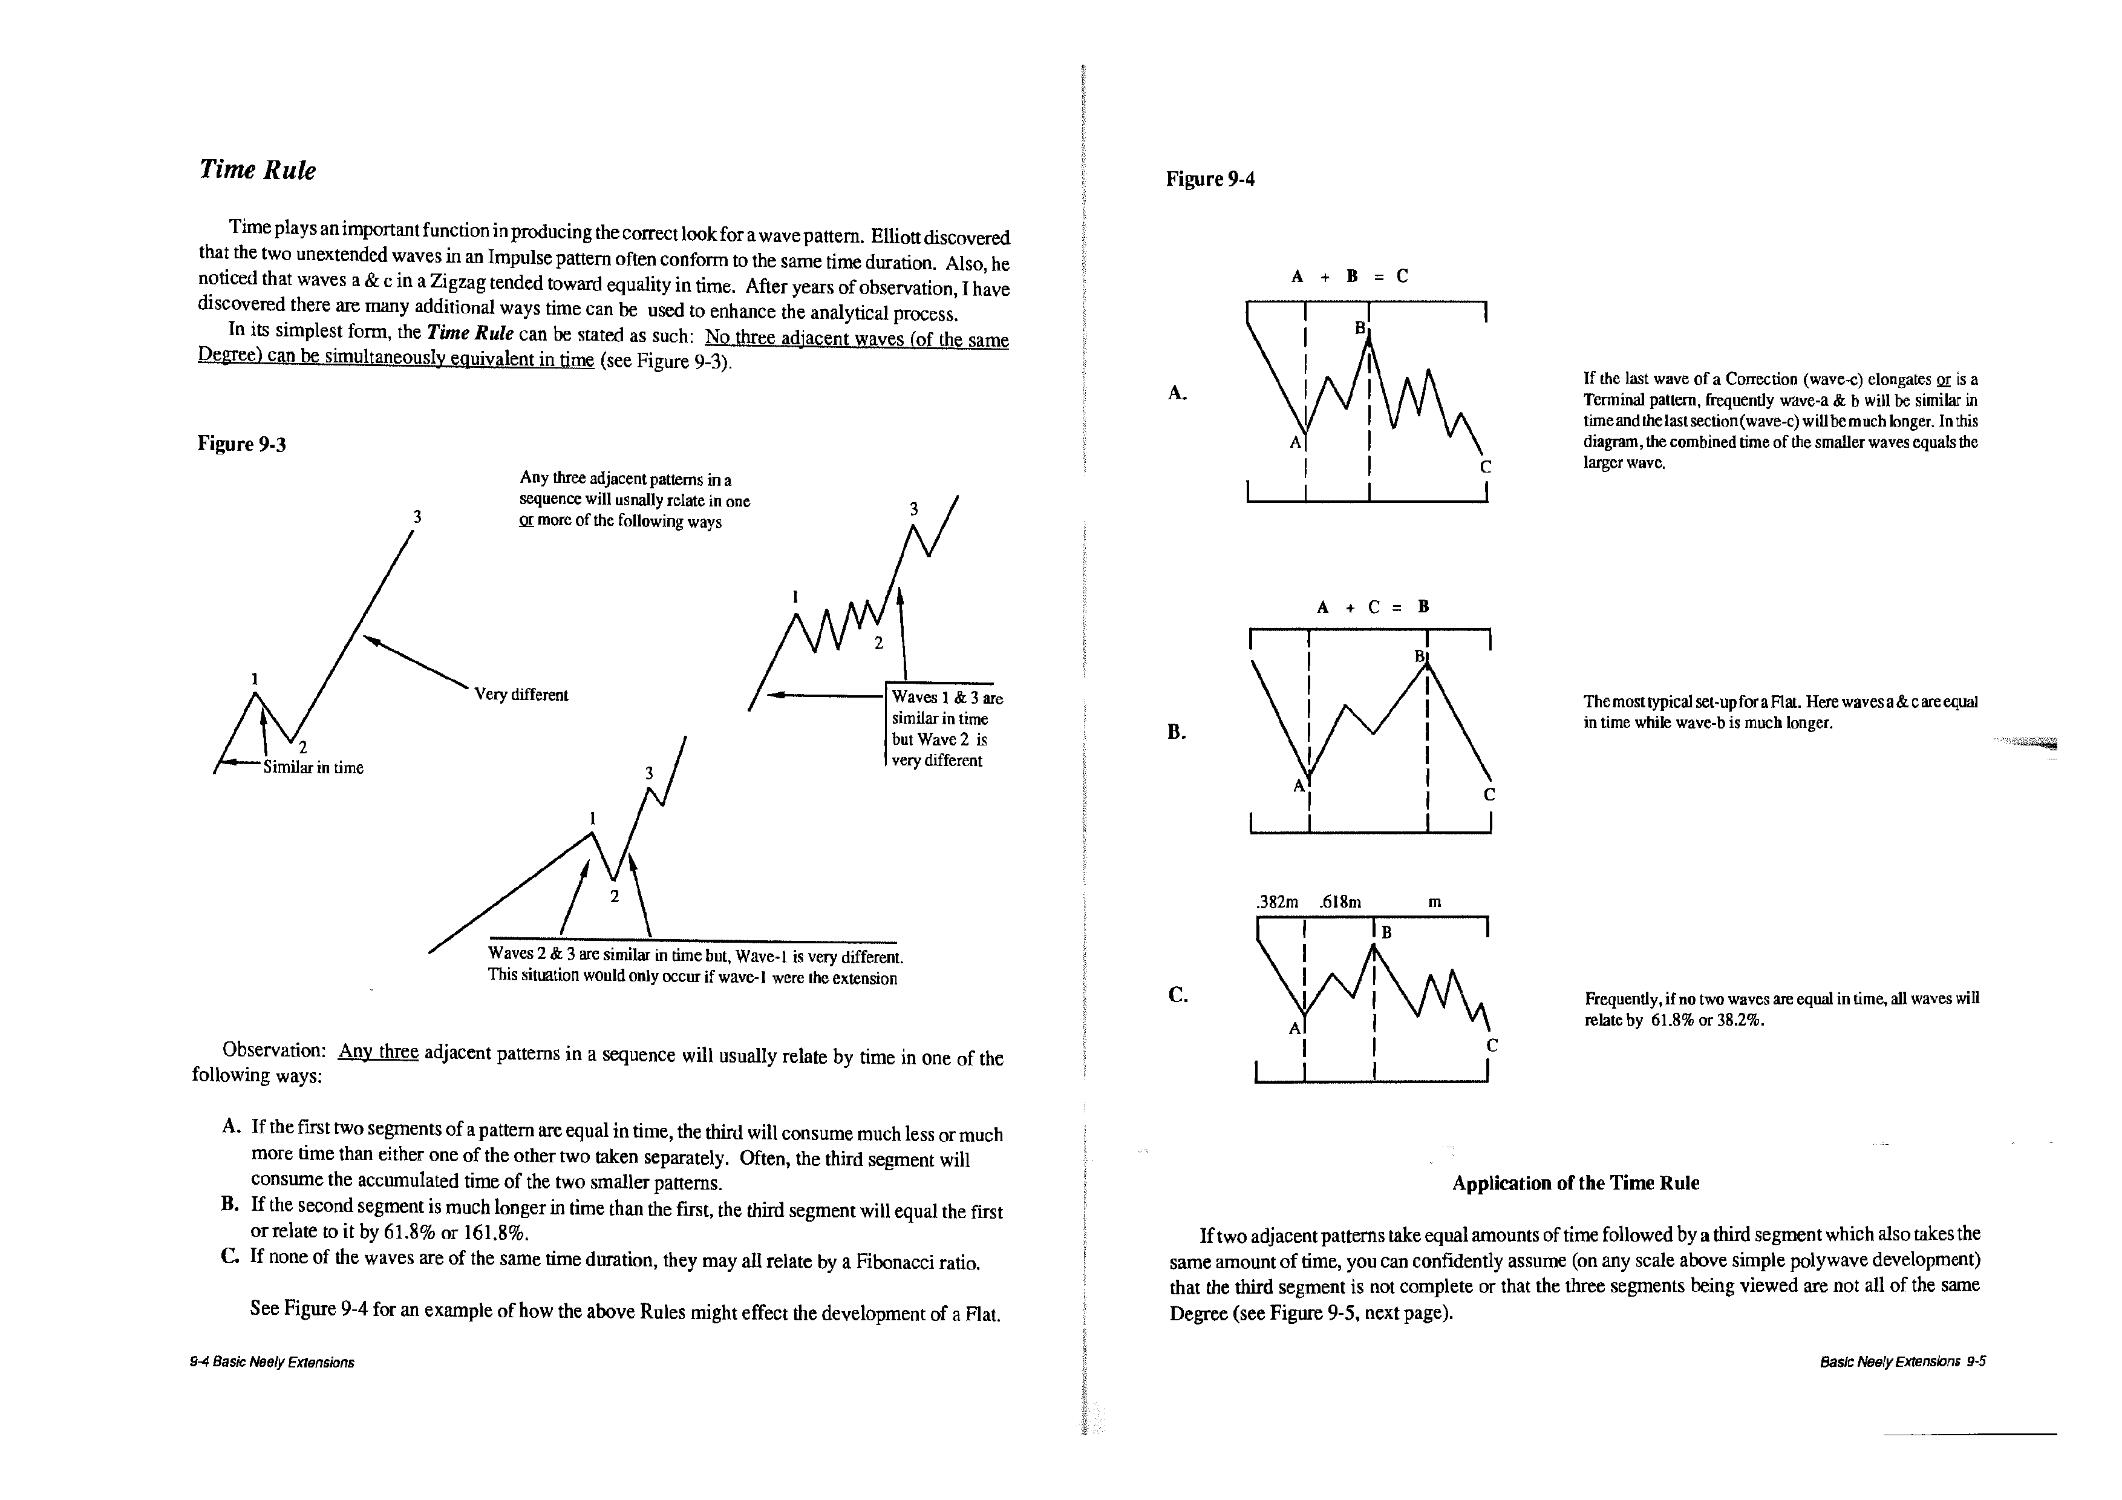
Time Rule sw
Independent Rnle 9-7
Simultaneous Occurrence 9-7
Exception Rnle 9-7
Aspect-1 9-7
Aspecl-2 9-8
Necessity of Maintaining "Structnre" Integrity 9-8
Locking in Structure 9-8
Flexibility of "Progress" labels (expansion of a pattern) 9-10
Advanced Logic Rules 10-1
Pattern Implications 101
RetracementBasedon Power Ratings 10-2
All Corrections (except Triangles) 10-3
Triple Zigzag 10-3
Triple Combination 10-4
Triple Flat 104
Double Zigzag 10-4
Double Combination 104
Double Flat 104
ElongatedZigzag 104
Elongated Flat 10-5
2j2fl£ 10-5
Wavc-clongest 10-5
Wave-c equal
Wave-c shorter
B-Failure 10-5
Common 10-5
Irregular 10-5
C-Failure 10-6
IrregularFailure 10-6
Double Three 10-6
TripleThree 10-6
Running Correction 10-6
Double Three Running Correction 10-7
TV/pfe TTiree Running Correction 10-7
10-5
10-5
6 - TflMe of Contents
Triangles 10?
1. Limiting
a. Horizontal
II. Non-Limiting
Expanding
Impulsions
Terminal
Wave-3 Extended
Wave-3Non-Ex tended
Wave4
Wave-2
Wave-3 Extended
Wave-3Non-Extended
Wave4
Wave-5 Extended
10-7
10-8
10-8
b. Irregular i no
c. Running i no
10-8
10-9
I. Limiting 1()_0
A. Non-Limiting , n „
10-9
Trending ,0,0
10-10
Advanced Progress Label Application n-i
Impulse Patterns u_2
Trending U-2
Wave-1 Extended \\-2
Wave-1 Non-Extended n_3
Wave-2 n_3
11-3
11-3
114
Wave-5 Extended 114
Wave-5 Non-Exlcndcd 114
5th Wave Failure 114
Terminal 11 _£
Wave-1 Extended u_6
Wave-1 Non-Extended 11^
11-6
11-6
11-7
11-7
11-7
Wave-5 Non-Extended n.7
Corrective Patterns n-7
Flats n-8
B-Failurc 11-8
C-Faimrc H-8
Common '1-11
Double Failure 11-12
Elongated 11-13
Irregular 11-15
IrregularFailure ]\-l(,
Running 11-17
Zigzags n-18
Wave-a n-18
Wave-b 11-19
Wave-c 11-19
Table of Contents - 7
Triangles 11-19
Crjnlracling 11-20
1. Limiting 11-20
a. Horizontal 11-21
W.vc-. 11-21
W.vc-b 11-21
w.vt-c 11-22
w.vM 11-22
W.v=-B 11-22
b. Irregular 11-22
w,v=-. 11-22
W.vc-b 11-22
W.ve-c 11-23
WivB.d 11-23
w.v=-= 11-23
c. Running 11-23
W.vc-. 11-24
Wav=-b 11-24
W.vk, 11-24
W.vcd 11-24
Wave-e 11-24
n. Non-Limiting 11-25
Wave-a 11-26
Wave-e 11 -26
Expanding 11-29
I. Limiting 11-30
a. Horizontal 11-31
b. Irregular 11-31
c. Running 11-31
II. Non-Limiting 11-31
Advanced Neely Extensions 12-1
Channeling (unique applications) 12-1
Wove-2 12-1
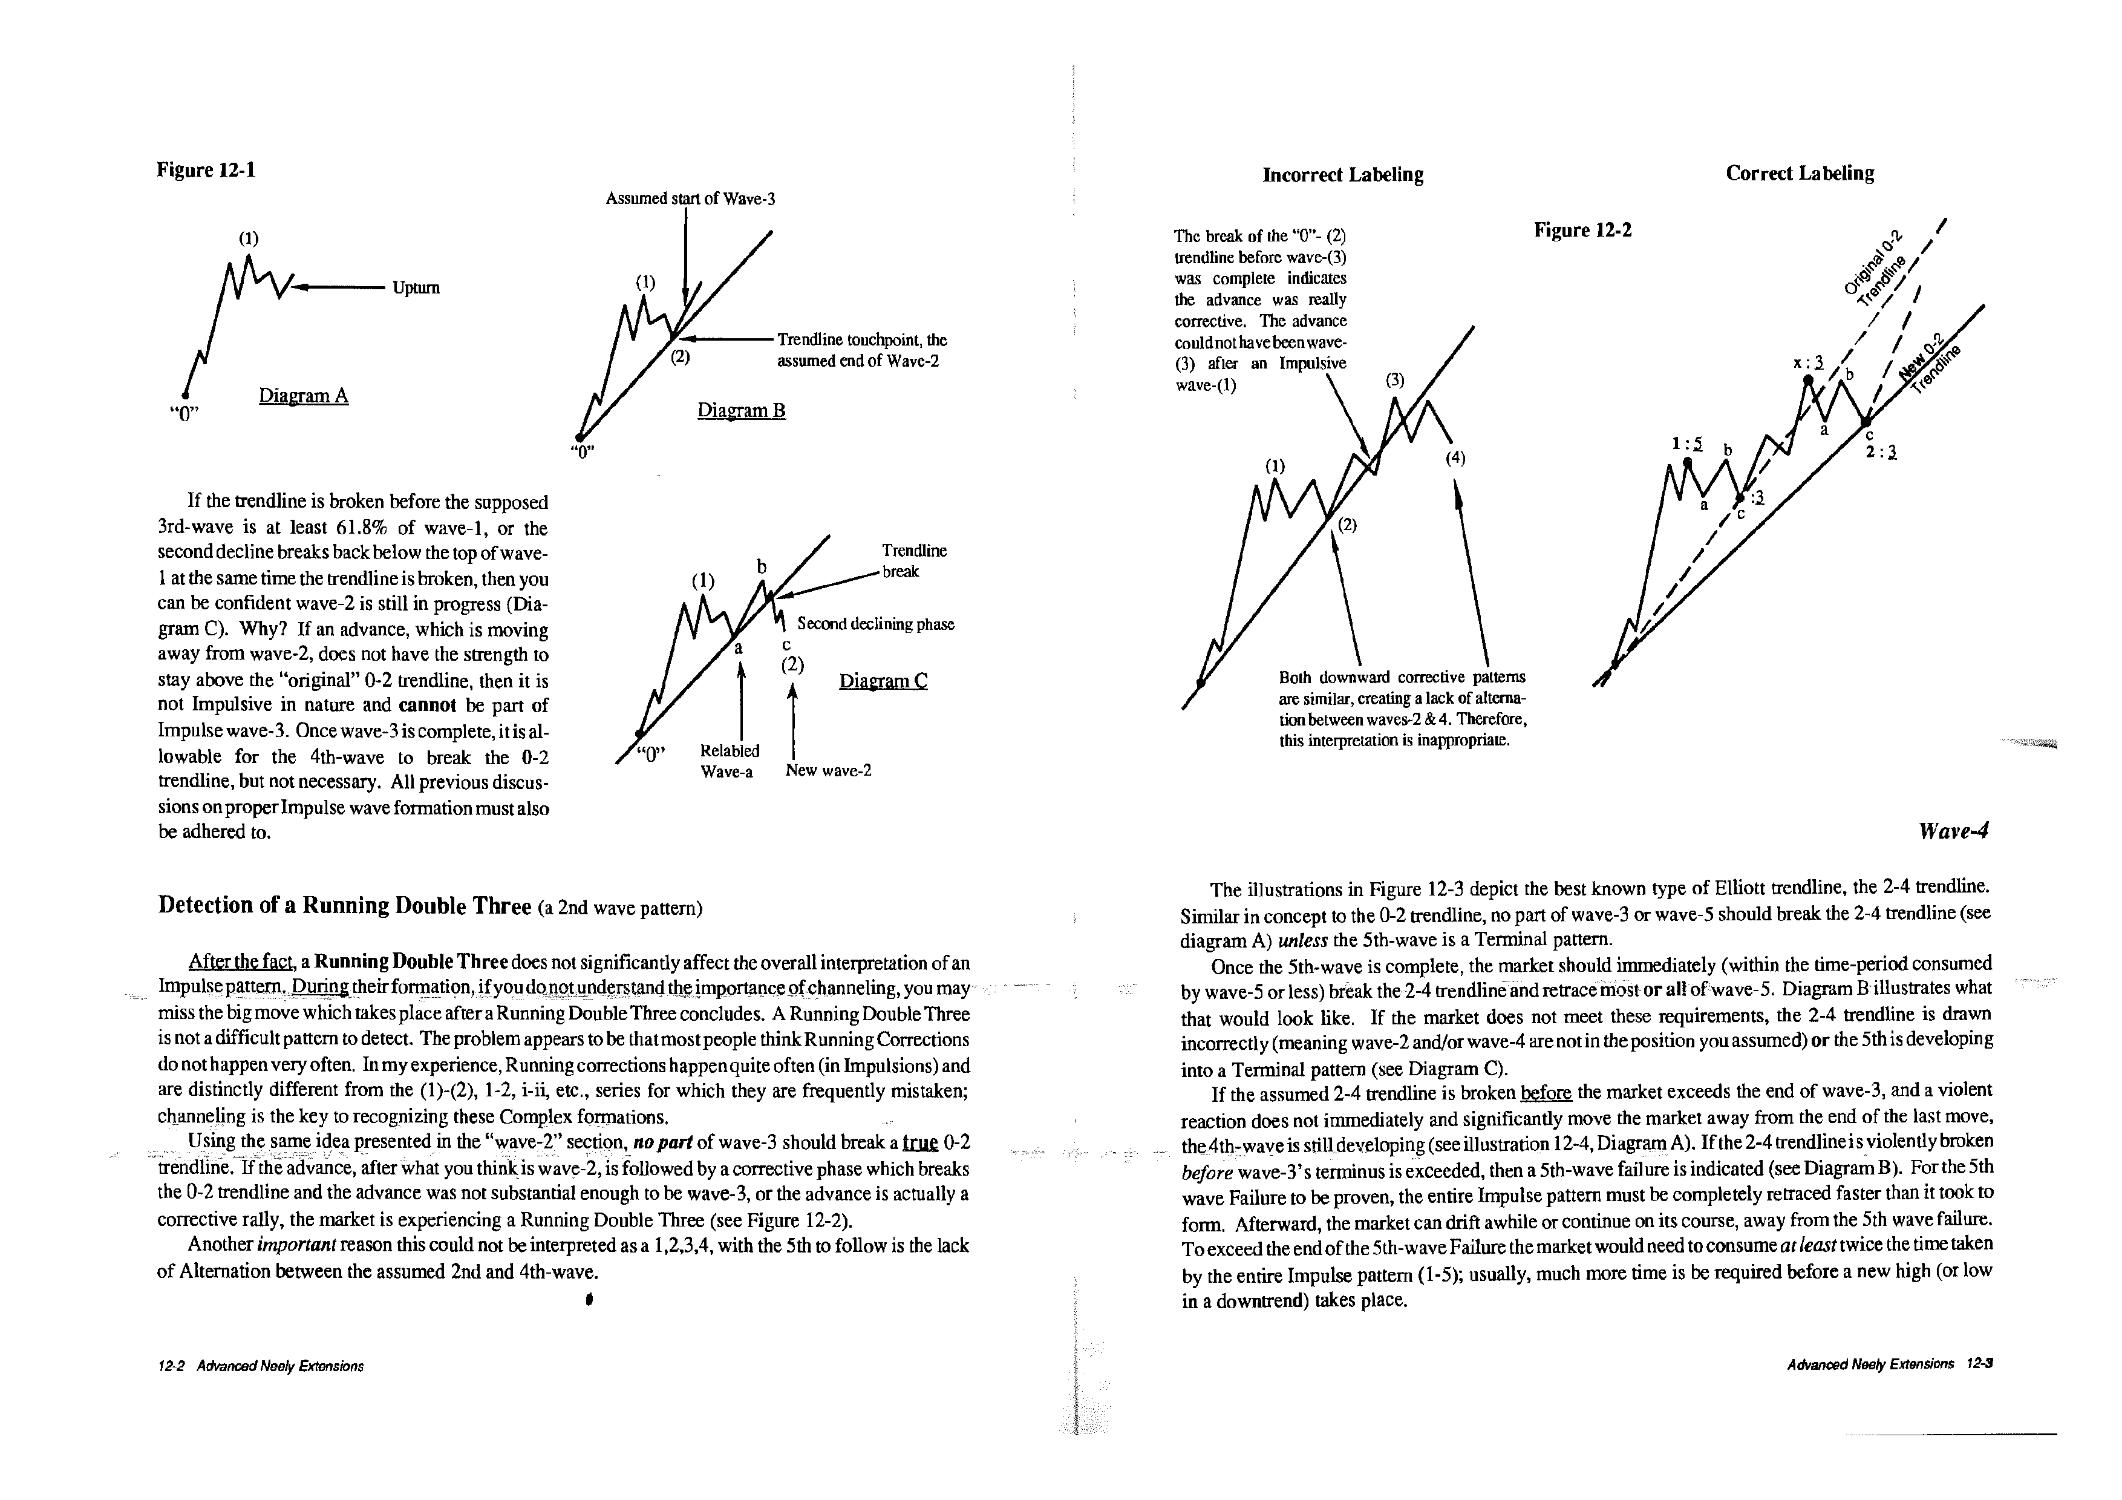
Delectionoja Running DoubleThree 12-2
Wave-4 12-3
Wave-B 12-6
Triangular Activity 12-6
Terminal Activity 12-8
Real 2-4 Trendline 12-8
Impulse Identification with Channeling 12-10
1st Wave Extension 12-10
3 rdWave Extension 12-10
5lAlVave<-nsion 12-10
Double Extension 12-10
Corrections Identification with Channeling 12-10
Ftals 12-10
Zigzags 12-16
Trionsta 12-17
5 - Tafrfc of Contents
Complex Patterns 12-18
Double & Triple Zigzags 12-18
Double & Triple Combinations (which slart with Zigzags) 12-18
Double& Triple Hals 12-20
Double &Triple Combinalions (which slart with Flats) 12-20
Identifying the Completion of Waves 12-22
Advanced Fibonacci Relationships 12-22
Internal 12-22
Impulse Patterns 12-23
1st Wave Extension 12-23
3rd Wave Extension Yl-lTr
5th Wave Extension 12-24
Corrections 12-25
Wave-2 & Wave-4 12-25
Wave-a & Wave-b 12-25
Wave-c InZigmgs 12-26
Wave-c In Flats 12-26
Wave-c In Triangles 12-28
Wave-d 12-28
Wave-e 12-28
External 12-29
Impulsions 12-30
1st Wave Extension 12-30
3rd Ware Extension 12-31
Sth Wave Extension 12-31
Corrections 12-33
Double & Triple Zigzagsand Combinations 12-33
Double & Triple Flats and Combinations 12-34
Missing Waves 12-34
Where and when do they occur? 12-35 s
How do they occur? 12-35
Why do they occur? 12-37
Which patterns are susceptible? 12-37
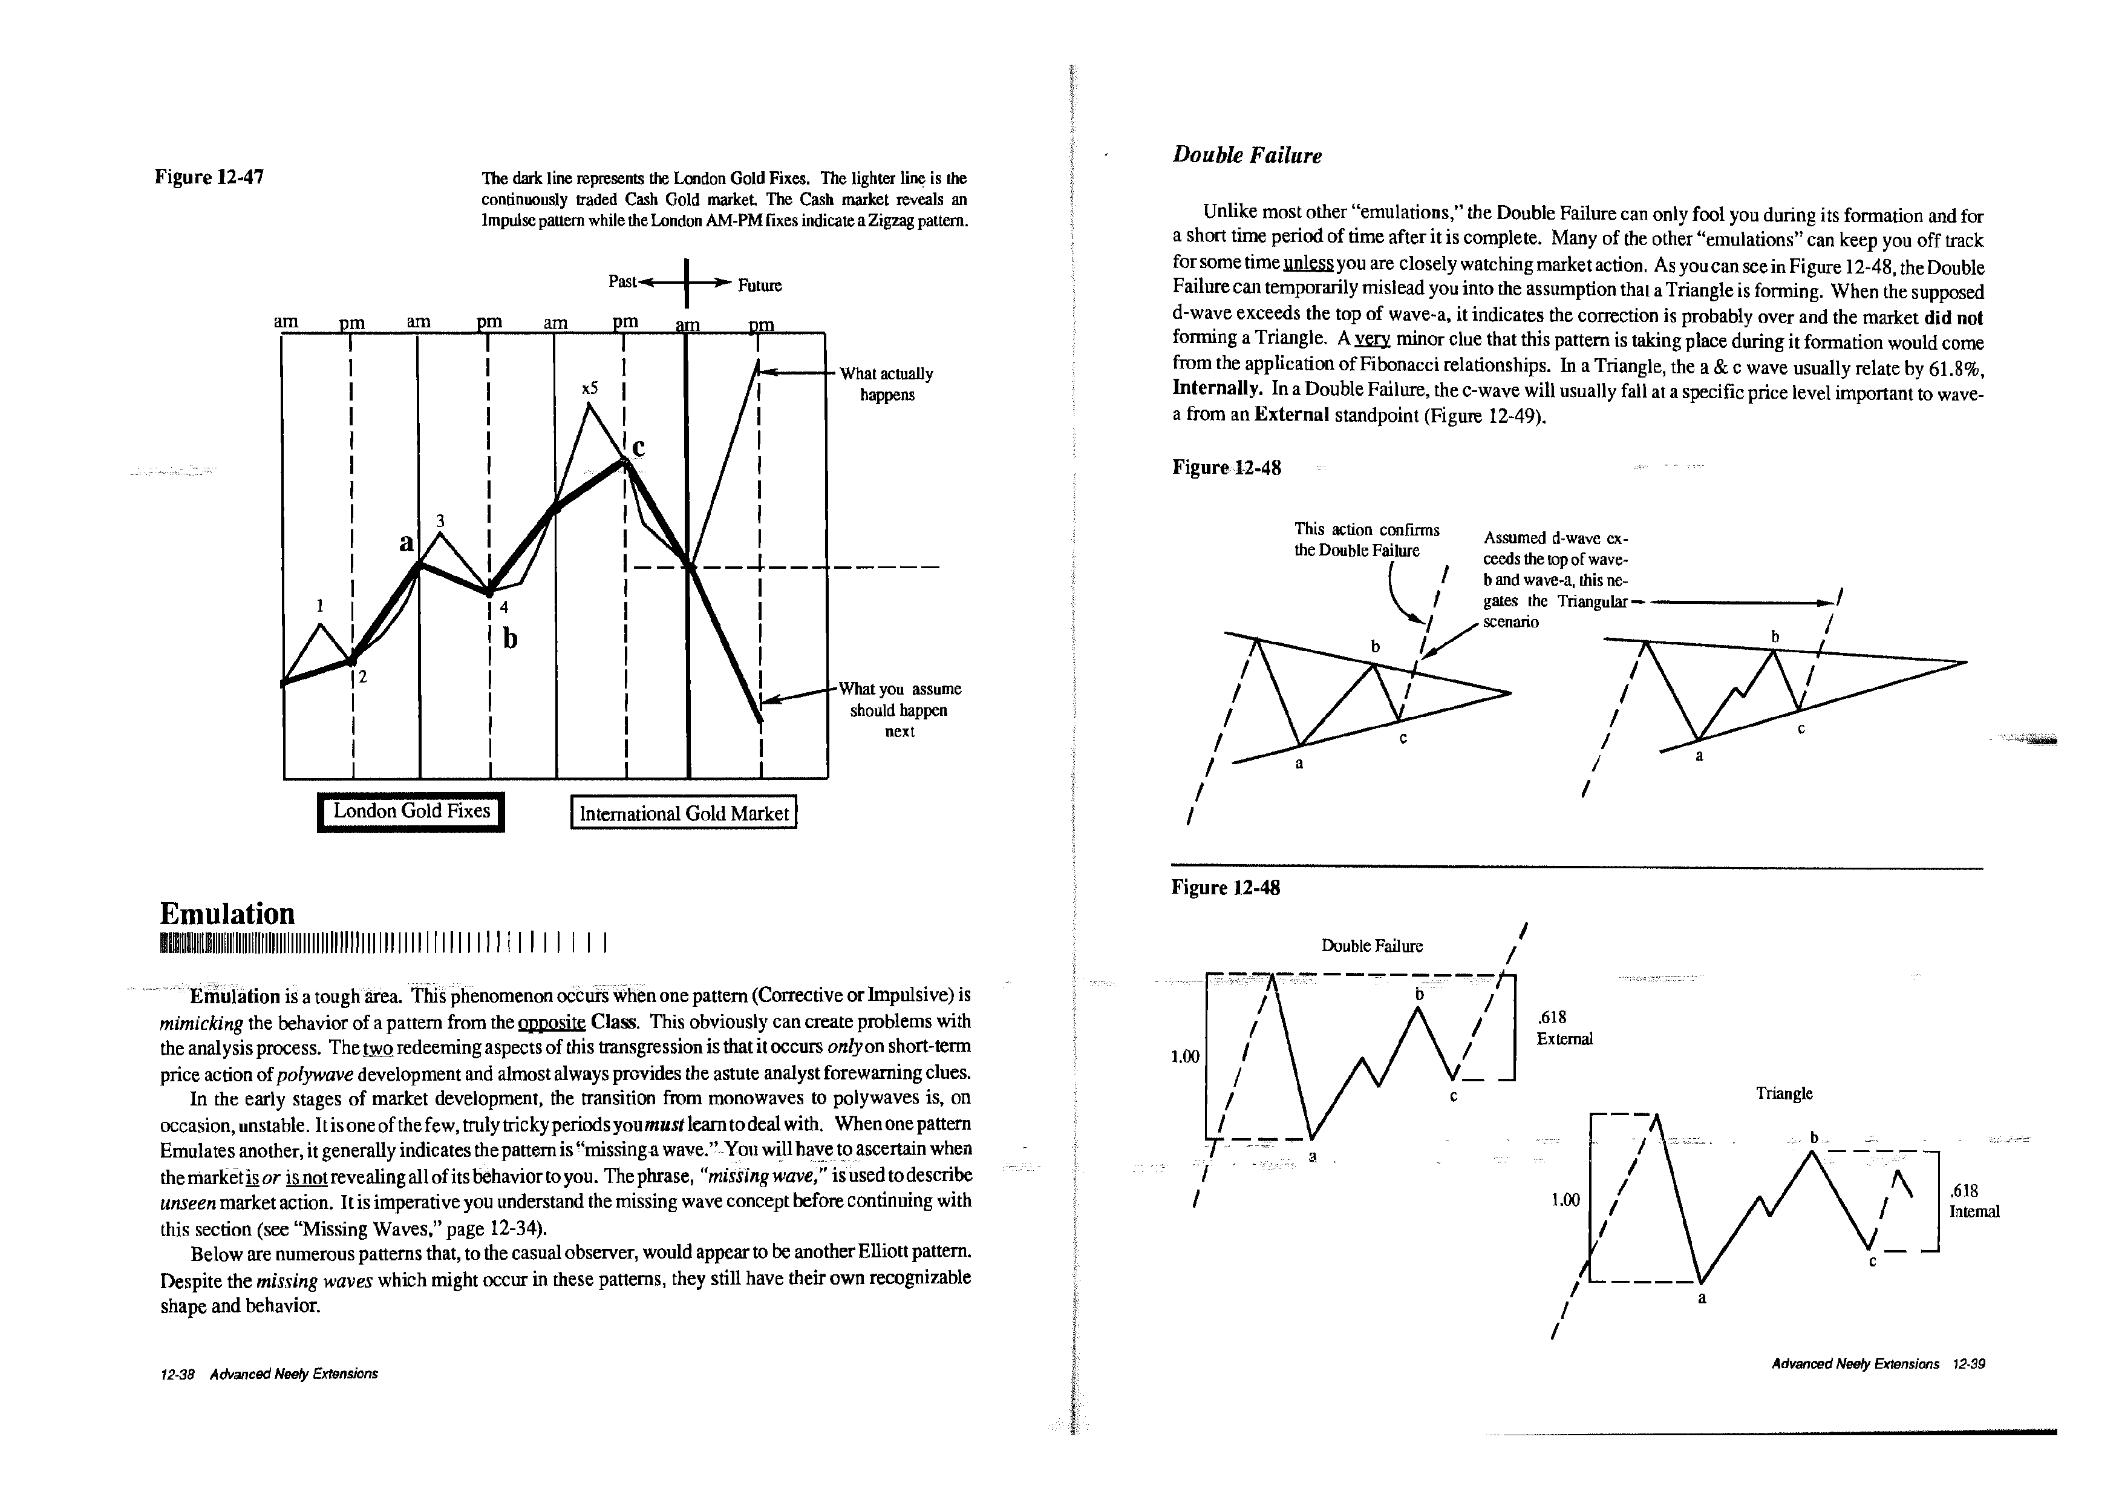
Emulation 12-38
Double Failure 12-39
DoubleFlats 1240
Double & TripleZigzags 1240
IstWave Extension 1243
Sth Wave Extension 1143
Expansion of Possibilities 1243
Localized Progress Label Changes 1245
Appendix
Forecast to the Year 2060
Table of Contents- 9
Dedication
This book is dedicated to Richard J. Teweles, Charles V. Harlow and Herbert L. Stone. None of
these people have I met or talked with, but they are the authors of the book "The Commodity Futures
Game." It was while reading that book that I first set my eyes on the phrase "Elliott Wave Theory."
For me, that is where it all began.
HP
-JI^L. his book was written with the intent of significantly advancing the viability of Elliott Wave
Theory by introducing a scientific, objective approach to market analysis. This innovative approach,
known as the Neely Method of Elliott Wave analysis, is the result of a decade of trading, teaching and
extensive research by the author. In reading this book, you will quickly realize it is like no other you have
ever found on market analysis. Presented herein is the first step-by-step approach to Elliott Wave
analysis ever devised. No aspect of the Theory is left for you to ponder. Every detail is thoroughly
explained and, in the words of BruceBabcock (Commodity Traders Consumer Reports), "every sentence
is devoted to something important."
The concept of the Wave Theory was originally presented to the investment world by R.N. Elliott
in the early 1930's. Going well beyond the original discoveries of Mr. Elliott, this book reveals new
techniques, rules and market price patterns never before disclosed to the public. These new discoveries
will dramatically increase your market forecasting accuracy and your confidence in trading.
"Mastering Elliott Wave" deals in great detail on the subject and application of the Neely Method.
In support of such detail, the accurate prediction and profitable trading of a market on a continuous basi s
requires a complex understanding of economic and financial price activity. Another reason for this
extensive detail is to ensure the book serves as a valuable guide and reference for years to come.
If you desire the ability to forecast and profit from the complex undulations of economic activity, this
book will help you achieve that goal like no other. In addition, every effort has been made to create in
"Mastering Elliott Wave" a truly interactive learning environment which will allow you to follow the
book's instructions while simultaneously analyzing real-time market action. You will definitely find the
Neely Method to be challenging and I am confident you will find reading this book to be time well spent.
Now, turn the page and prepare yourself for a new adventure; your entrance into the world of high-tech
market analysis.
Glenn Neely - December 1987
(revised April 1990)
Elementary Discussions m
What is (he Elliott Wave Theory? M
Price Patterns of Psychology 1 1
Natural, Non-Periodic Phenomenon 1 -1
A Unique AnalyticalTooi 1-2
Additional Examples 1 -3
Why Learn Elliott Wave Theory? 1-3
Multiple Benefits 1-3
Multi-area Application \ -3
Numerous Techniques Unnecessary 1 -4
Helpful in/ndicator Clarification 1 -4
Signals Infrequent, but Reliable 1-4
Why the Controversy? 1.4
Complexity 1 j
Public Mind Set h5
Years to Master 1-5
Application Requires Time * "5
Endless Array of Specifics *~*
Memorization *""
Frequent Indeterminacy *'&
Difficulty 1 -6
Why This Book May Create More Controversy 1 -6
What Makes Elliott Wave Theory Unique? 1-7
Comp tete Perspective I -7
Quantification of Mass Psychology 1 -7
Detailed Categorization I -7
Grand Simplification 1 -7
Clear Delineation of Price Behavior 1-7
How Should You Learn the Theory? 1 8
Why Another Book on Elliott Wave was Necessary 1 -8
Additional Techniques Required 1 -8
Specific Procedures Described 1 -8
Realistic Diagrams Previously Non-Existent \ -8
Disclosure of Advanced Concepts 1 -8
Original Presentation Sequence I -9
iVew Terminology I -9
New Discoveries, The Neely Extensions 1-9
How I Discovered these New Concepts and Techniques 1-9
The Telephone Course 1 -9
£h9«£ //flwrj- of Work 1-10
Where is the Theory Applicable? J -10
How Should the Analyst Work with and Perceive Elliott? MO
Meticulously 1-10
Open-Mindedly I -H
What's Next? 1-11
# IF
What is the Elliott Wave Theory? >*?
Price Patterns of Psychology
From an Elliott Wave perspective, the plotted price activity of a market is the graphical
representation of crowd psychology. The Wave Theory describes how local plotted data relates to surrounding
data, how data should behave under a muldtude of circumstances, when and how psychological trends
begin and end, how one psychological environment mandates the unfolding of another and what general *
shape the price action should exhibit upon compledon. In other words, the ElliottWave Theory organizes
the seemingly random flow of market price action into identifiable, predictable patterns based on the
natural progression of crowd psychology.
Individuals behave in certain ways depending on their current opinions and feelings. When elated,
that individuals actions will invariably be distincdy different from the same individuals actions when
depressed. Just the way one person can feel excited or concerned about his or her personal future, the
same feelings can permeate and be manifested by society. When a majority of people have similar
feelings (favorable, unfavorable, indifferent) about their, or society's, prospects for the future, their
cumulative action unfolds in predictable patterns. In addition, the same way an individual can change
his or her mind over time (occasionally in an instant), so can the crowd. The Crash of 1987 was a good
example of an almost universal, "instant" change in the crowd's opinion of the stock market and the future
of the United States economy.
Once a certain psychological mood has runits course, people tend to get bored with an idea or concept
(sometimes financially ruined by them), so they grab onto new ideas. It is this changing from one mood
to the next that terminates one psychological trend (price pattern) and begins another.
Natural, Non-Periodic Phenomenon
The amount of time consumed by a specificpan-societal mood appears to have noabsoluteminimum
or maximum time requirement, but there are general limits. By analyzing previously completed patterns
and applying certain principles of time behavior, it is possible to approximate the best time periods for
completion of a formation. These techniques, many of which I have developed over the last ten years,
will be discussed in later chapters.
Elementary Discussions 1-1
The "structure" of market movement should almost always supersede time observations. Some
people consider this an annoying aspect of the Theory since they want to know "when" to make a trade,
in advance! Elliott virtually proves that absolute anticipation of market movement is impossible. The
greatest degree of predictability occurs immediately after a move has terminated. In other words, you
wait for a pattern to complete, then you take action.
A Unique Analytical Tool
Unlike most forms of technical analysis, the Wave Theory was developed strictly from a price
behavior standpoint. The Theory helps the analyst realize that whatever the market does, it does for a
reason. There is no "chance" in market activity, no aberrations and no unclassifiable price behavior.
A large portion of market technicians spend their time trying to manipulate price data to find that
"magical" key-indicator. How can a transformation of price data be better than the original data? In other
words, price should be considered the ultimate indicator. It is the only indicator of market action that
can be absolutely depended on and the only one that directly affects your bottom line. It does not make
any difference what someone thinks or what an indicator signals, die bottom line is, "what did the market
do?" If prices are going up (and you are long), you make money. If prices are going down (and you are
long) you lose money, all other indicators notwithstanding.
Some of die remarkable aspects of die Elliott Wave Theory are:
1. Its adaptability to new technological developments and unexpected fundamental news;
2. Its thoroughness in describing ALL possible market behavior; and
3. Its progressive and dynamic characteristics.
The Theory inherendy indicates man, and his markets, continually charts new territory and types of
behavior. It stipulates that at no point in history is a market's action or psychological environment
identical to any other period. Similarities are allowed, but not exact duplication. This can be a problem
for traders, and especially "system" developers, who endeavor to formulate strategies based on historic
price action and behavior. Unlike most systems and forms of analysis, the Wave Theory warns the
analyst to look for change and warns him when and where a market will not behave as it has in the past.
The "Elliott" point of view, that "history does not repeat exactly," is the perfect explanation of why
most mechanical systems (and other forms of analysis based on the expectation of exact repetition) fail.
This is particularly evident when a market changes from a bullish to bearish environment, or vice versa.
The computer age has dramatically (and probably permanently) altered certain aspects of the trading
environment and thus market behavior. This is an example of why working widi historical data way back
to "who knows when" will not necessarily make a mechanical system function any better. Ever
expanding technology continuously transforms the decision element of the market, people. The way
people react to, use and learn from new technology cannot be decided by historical study. A form of
analysis which explains, categorizes and structures progress, not repetition, is needed. That is what the
Elliott Wave Theory is capable of doing.
1-2 Elementary Discussions
Additional Examples
The 1987 crash was a perfect illustration of how a study of history could not have prepared one for
what happened October 19,1987. Even me largest declining day during the crash of 1929 was only half
as detrimental (percentage-wise) as the one experienced in 1987. Anyone using the 1929 crash as a
barometer may have decided to buy the market after it had fallen 10% or so the day of October 19,1987,
expecting no day to be worse than that experienced in 1929. Of course, anyone taking such an approach
would have been in for a very unpleasant surprise.
During the 1987 advance, I remember continually hearing people talk about (and seeing ads espouse)
the extreme similarities between 1982-1987 and 1920-1929. They assumed everything would continue
on course exactly (same time and percentage advance), widi the 80's bull market repeating the nine year
boom as if it were another 1920-1929. Unfortunately, those who believed such an easy comparison of
history was their road to riches may now be doing something besides investing in me stock market.
Why Learn Elliott Wave Theory?
II^'T!!!!"!!!!!!!!!'!!!!!!!!!!,!!! !!!|'! ',||! I I
To die beginning student, the Theory's complexity, multiple pattern variations, "alternate count"
possibilities and apparent subjectivity seem almost insurmountable and appear to nullify the Theory's
validity. This is due to the extreme demand of specifics required of the Elliott Wave analyst. All general
pattern categories, and each of its variations, requires different relationships, channeling, price behavior
and technical characteristics. This creates the illusion that the Theory is purely subjective and can be
molded to fit anyone's opinion. While there may have been some justification for this stance in the past,
before the publication of this book, this simply is not true anymore. The Pre-Constructive and Post-
Constructive Rules of Logic (Chapters 3 & 6, respectively), in collaboration with numerous,
completely new techniques developed by the author over many years, will greatly enhance your ability to
arrive at a single wave pattern conclusion. Caveat: These techniques, and the specifics involved in
applying uiem, are so numerous and varied that their proper application can take years of practice and
real-time trading. Asa result, until you uioroughly understand the concepts presented in this book, your
conclusions may frequently be incorrect.
Multiple Benefits
The long-term benefits of "Mastering Elliott Wave" are numerous. As a business person or investor,
you can frequently anticipate major changes in the economic environment allowing you to sidestep
disaster or even profit from the winds of change. Proper understanding of crowd psychology (the
fundamental basis of uie Theory) can help you avoid financially dangerous business dealings at the end
of an economic cycle.
Multi-area application
The Wave Theory can be applied to virtually all areas of mass human endeavor: the stock market,
commodities, real estate, production of goods and services, etc.; all that is required is accurate, consistent
data. The benefits of the Theory's multi-area application are obvious.
Elementary Discussbns 1-3
Numerous Techniques Unnecessary
When incorporating Elliott's original rules and observations with the Neely Method and the new
techniques revealed in this book, you have at your disposal a virtually all encompassing description of
market behavior and how to decipher it. This allows you to know, under most circumstances, a great deal
about the current position of a market without any information other than price action. You will not need
to keep track of numerous time consuming (and sometimes subjective) indicators.
Remember, no matter how good a mechanical system or indicator works during a particular period
in history, the minute the pattern (which was unfolding during the formation of the system) completes,
that system or indicator will usually not work anymore. The environment in which it was designed to
perform so perfectly no longer exists and (according to the Wave Theory) will never exist again.
Helpful in Indicator Clarification
If you decide to use other indicators (outside of Elliott) to "clarify" wave counts, the Wave Theory
is actually instructive in qualifying where and when a particular indicator does and does not work.
Example:
Readings of investor sentiment normally indicate a significant market turning point only when in
overbought or oversold territory (usually considered to be around 75% and 35%, respectively). A
comprehensive understanding of Elliott patterns allowed me to recognize in 1986 and 1987 that
sentiment could oscillate around neutral readings even if amajor market turning point was forming. This
was a logical deduction based on an understanding of Horizontal Triangles and Terminal patterns (ex.
Gold Jan. June 1986 and S & P 500 Jan. - Sept. 1987). When most were confused by the lack of public
excitement generated during the 1987 stock market advance, I constantly warned clients that was a sign
a Terminal Impulse wave (diagonal triangle) started in the last quarter of 1986 and would portend acrash,
in three months or less, back to 1900 on the DOW and 230 on the S&P 500 Cash Index.
Signals Infrequent, but Reliable
Only after an identifiable pattern is complete is it safe ordesirable to enter a market. This helps avoid
over-trading and prevents entering the market when there is little potential. On the other hand, it
promotes trading when the probabilities are greatly in your favor and risk is at a minimum. The Theory
also allows for the placement of very objective stops, enabling you to know when in time and where in
price your interpretation is wrong. What else could a trader ask for?
Why the Controversy?
^llNrilll'llfflll'lllrilllllllliririllirilll ' Ml' | |
Complexity
The Wave Theory is probably the most complex and all encompassing form of market analysis ever
devised. It requires a lot of time and practice to master. As a result, most people do not have the time
nor inclination to properly leam or apply it. The Theory takes more time to perfect than most people are
willing to commit. In addition, the idea of an analytical technique allowing someone to call market
1-4 Elementary Discussions
turning points to the day, even the hour, is considered by most to be ridiculous or at least suspect. When
a majority of investors have trouble being on the right side of a market, attempting to pick the highest
or lowest tick of a trend is not even considered a serious possibility. A Theory which professes to produce
such astounding results will always create controversy and be treated with skepticism by the uninitiated.
Public Mind Set
Profitable application of the Wave Theory requires a mentality divergent from the norm. To
accurately call market turning points demands you buck die crowd precisely at the time the majority is
most convinced an event will occur (you may possibly even be ridiculed for your beliefs, one of the most
reliable signs your analysis is correct). Extreme self-confidence is a must; control of greed, strict money
management (which includes risk control), an open mind and the ability to change your entire perspective
(from bullish to bearish or vice versa) in die blink of an eye are all necessary attributes and abilities of
the successful analyst and/or trader. Most of these characteristics are not all present in one person,
making it difficult to be a prognosticator and profitable investor. Many people can predict future market
action when no money of their own is at risk. When trading becomes personal, everything changes.
Years to Master
Even if you had all of the qualities mentioned above, it could take years of practice to confidently
and accurately apply the Theory to real-time. Since most people will not spend die time necessary to
properly learn the Theory, diey misapply it and lose money in the market. This creates disgruntled "ex-
students" who, of course, blame their misfortune on the Theory, thus continuing the controversy.
Application Requires Time
Even if you have die mentality and the years of experience and knowledge, you still must spend time
analyzing everyday or so to stay in practice and keep up with the current position of a market. If you are
following numerous markets, this alone can take several or more hours everyday.
On many occasions, I have spent an entire weekend looking at one market, sometimes just one chart,
trying to figure a way to fit all the important elements of a good count into die price patterns. Most people
want making money in the market (and all otherendeavors) to be easy. They work all day at anodier job,
go out to eat, go to the movies, then right before going to bed in the evening, spend 5 or 10 minutes on
dieir charts to "decide" what die market is going to do the next day.
This is just one of many reasons most people never make money trading. If you are in the above
mentioned category, you are competing against a handful of devoted, full-time professionals who derive
their sustenance from profitable trading or investing. The chances of a part-timer consistently winning
against this group are small. If you are not able to spend the time required to follow markets properly,
it is recommended you find a professional who can advise you on your investments.
Endless Array of Specifics
To apply Elliott Wave properly under all circumstances requires the application of an almost endless
array of specific criteria fitting particular situations. Relationships, channeling, the significance of
certain turning points to the over all picture, Structure (Impulsive or Corrective and what type of
Impulsion and Correction) all need to be considered when piecing together a pattern's count.
Elementary Discussions 1-5
Memorization
From the statements on the previous pages, it should be obvious that a large amount of information
needs to be memorized in order to hasten the application of important Elliott Wave and Neely techniques
to a price series. This memorization is one of the major obstacles most students encounter to successful
application of the Wave Theory to real-time action.
Frequent Indeterminacy
The price or time termination area of a trend is not predictable, with ahigh degree of confidence, until
an Elliott Wavepattern is on the verge of completion. Sometimes, confidence is not obtainable until after
a pattern has completed. This fact keeps most of the public suspicious about the Theory. Why? If you
ask an Elliottician for his prediction of future market activity before a pattern is near completion, the
probabilities are high his analysis will be wrong, at least in detail. As the market approaches the end of
a move, the pattern in progress begins to become clear. As it moves away from the identified turning
point of a previous pattern and moves toward the middle of a new pattern, the number of possible patterns
in progress again increases. This is the reason experienced Elliott analysts can disagree on the position
of a market during certain time periods; each is choosing what he or she considers to be the best scenario
of the interpretations possible.
When experts in the same field continuously disagree on the same subject, that is the very foundation
of controversy. In a latter chapter, a whole new concept developed by the author, will be introduced to
handle these areas of "uncertainty" (see Expansion of Possibilities - Page 12-43).
Difficulty
The extreme complexity, subtlety, and demanding nature of the Wave Theory prevents most people
from pursuing this area of analysis. Also, most of the reasons listed throughout Chapter 1 prevent the
Theory from being completely computerized. Application of the Theory sometimes demands forms of
abstract thought, not a specialty of the computer realm. For example, application of all the rules under
certaincircumstances may leave no obvi'oitf possibilities. These situations require personal
brainstorming sessions to "unlock" the count or, sometimes, merely patience to wait for a count to reveal itself.
Mastery of this formof analysis will be applicable forthe rest of your life. Thereis no need to concern
yourself with the possibility of heavy public participation, most will apply it wrong. As Elliott has
become increasingly popular, the wave patterns in most markets, to compensate, have begun to develop
on an ever more complex level preventing amateur Elliotticians from correctly deciphering market
behavior. Again, this helps to perpetuate the controversy in favor of the Theory's inadequacy or, at the
very least, its supposed subjectivity.
Why This Book May Create More Controversy
Ililllllll'IIIIIIITIIIIIIIIIIIlllHI lll!l HIIIMII'I'IM I I Mill
The degree of detail covered in this book will significantly increase the number of important rules
and guidelines that have to be memorized to properly apply the Theory. Most people feel there are
already too many rules associated with Elliott Wave.
1-6 Elementary Discussions
Many experienced practitioners will disagree with some of the findings in this book proclaiming "my
wave behavior criteria is too specific or demanding lo be applied to real-time market action." This is
absolutely not true. It is understandable, though, how these feelings might have come about in others.
Many practitioners have, for years, used data toplot their charts which is inaccurate or improperly plotted
forcing them into invalid conclusions. This obviously would affect their perception of the Wave Theory.
When data is inconsistent (which it will be when collected and plotted incorrectly), it is impossible to
analyze a market's action with exactitude. [For a more detailed description of what constitutes good data
and how to plot it, see "How Do You Plot Data To Analyze Waves," in Chapter 2.]
What Makes Elliott Wave Theory Unique?
M'!!!|!|!ri!'!|!!|!!!|!|!|!!!!'!ll!!|| |!!|' HIM! !||!| ! I | | | | |
Complete Perspective
Unlike most all mechanical systems and many analytical techniques, the Elliott Wave Theory allows
the analyst to study any time frame: hourly, daily, weekly, monthly, yearly, etc. Even more interesting,
the anal yst can study all time frames simultaneously, allowing a decision to be made on which time frame
currently provides the greatest trading environment and how all the long and short-term movements
interplay with one another.
Quantification of Mass Psychology
Even if a system or technique tells you what to do in the market, rarely will it give you a feeling for ..
the economic outlook of a society or of the psychology overshadowing all market action. Due to the
Theory's mathematical quantification of mass psychology, it allows you to experience the economic
"boom and bust" phenomenon with greater interest and understanding.
Detailed Categorization
Almost in a class by itself, Elliott allows for the categorization of moves which cover just a few
seconds in length up to hundreds of years. Every move on a price chart has its effect on the larger patterns
that are evolving and each can be labeled based on its specific impact. If you know what type of pattern
is unfolding, you have a better idea of what to expect from that move in the area of speed, complexity,
breadth, volume, etc. (many of these areas will be covered later).
Grand Simplification
The whole Elliott Wave analysis process involves the deciphering of small price patterns, combining
those with numerous others into larger price patterns and then reducing those complex patterns back into
simpler patterns again. This is what makes the Theory so unique; development is the same on all scales.
Clear Delineation of Price Behavior
No matter how small or large a trend turns out to be, you can clearly label the movement as an upward
correction in a downtrend, a downward correction in an uptrend, etc.
Elementary Discussions t-7
How Should You Learn the Theory?
MIIBfflM | | | |
Reading this book is a good start! "Mastering Elliott Wave" (the book and the process) requires a
lot of real-time practice. Initially, your charts should be constructed on a short-term basis until you grasp
the basic concepts. Memorization of numerous rules is required along with an understanding of general
shapes and channeling. It is recommended you follow no more man one market until you have
memorized the basic rules and can quickly apply them to a market as it unfolds in real-time.
Why Another Book on Elliott Wave was Necessary
iiiiiiiiiiiiiiiiiiiimiiiiiiiiiiiiiiiiiiiiiiiNiiiiiiiiiiiin 11 n 1111 i i i i
Additional Techniques Required
The purpose of this book is to provide new, introductory methods to assure objective application of
me Theory and, in later chapters, discuss more subtle qualifying techniques. These will be required by
the experienced analyst to enhance the wave tracking process. These techniques can be employed even
when the market is developing on a very complicated basis, eliminating the need to resort to other types
of less reliable indicators or techniques.
Specific Procedures Described
Despite the preponderance of information now available on Elliott, most people interested in the
subject do not know where to begin when trying to apply it to real-time. The approach in this book is
to logically progress from the simplest concepts (many of which were developed for the benefit of my
course clients), to me more complex as each stage of wave analysis is understood. In addition, exact
startup procedures and data-plotting memods will be explained in detail.
Realistic Diagrams Previously Non-Existent
Even in Elliott's original works, diagrams of market behavior were very poor and unrepresentative
of real-time market action. In my early days of fighting with the Theory, those diagrams were a strong
influence on my thinking. The idealized patterns presented never reflected actual market behavior. Any
student familiar with Elliott's original works will greatly appreciate the attention to "real-life" detail
present in the charts of this book. In the early sections of the book, the "typical" diagrams are used to
instill the general shape of each Elliott pattern, but they are quickly discarded later for more accurate
representations.
Disclosure of Advanced Concepts
Even though general descriptions of Elliott's tenets can be found in all writings on the subject, very
little is available on advanced techniques and applications. It is in that area that this book really excels.
1 -8 Elementary Discussions
Original Presentation Sequence
The difficulty most students have in the early stages of learning Elliott Wave is mostly due to the
standard method of presentation. A lot of importance is placed on what I call "Progress Labels"
(l,2,3,4,5,a,b,c) too early in most publications. That area of knowledge is of little importance in the early
learning stages; it just tends to confuse if discussed too soon. Also, far too much significance is placed
on Degree in Elliott's work and its spinoffs. If there is any aspect of the Wave Theory that is subjective,
Degree is it. For the above reasons, both concepts are presented after more basic ideas are covered.
New Terminology
The difficulty of discussing the Wave Theory over the phone to clients and in book form required
the creation of new terminology in order to convey precise meanings. Some coined words and phrases
were also needed to describe new discoveries and techniques covered in this book. In addition, a few
old terms have been renamed for clarity. Many "Standard and Non-Standard" Elliott patterns have been
broken down into more specific sub-categories. This was done to aid the application of "pattern specific"
rales and guidelines which will enhance your forecasting accuracy and pattern interpretation.
New Discoveries, The Neely Extensions
illlll'.llllillllllllllllTINIIII llllllilll II! I I M
Initially, I intended to include a separate section on ajl the new discoveries (channeling, Fibonacci,
price, time, structure, patterns, degree, relativity, momentum) I had made over the years. This proved
too difficult. For the completeness of each section, the presentation of only oMinformation/im and then
new information later would have required introducing all the same categories twice. For reasons of
continuity and space preservation, each new technique, concept or discovery has been introduced at its
proper place with the assumption that the reader will clearly detect the presence of "never before
presented" information. The value of these Extensions to Elliott's work will be proven to anyone who
applies them properly. For those new techniques, concepts and discoveries which could not be included
in the normal flow of the text, there are several sections toward the end of the book which present
information that has either never been presented before (i.e., Rule of Similarity and Balance, The Neely
Extensions, Complexity Rule, Power Ratings, Logic Rules, Emulation, Reverse Logic Rule, Missing
Waves, etc.) or have only been implied but never explained in detail (i.e., Structure Series, the dominance
of Structure over Progress Labels, Compaction, Progress Label Application, the importance of
Channeling, the differences between Extensions and Subdivisions, etc.).
How I Discovered these New Concepts and Techniques
llllllllllllllllllllllll|]]||]|llll[llllll[|llllllll[|lllll!IIIIIIIMI 11111 I I I llllllilll
The Telephone Course
When I started my studies of the Wave Theory, many things appeared to be missing from available
literature on the subject. Questions like; "where do you start a chart, how do you organize charts, how
Elementary Discussions 1-9
do you plot price action, how do you analyze and treat a near vertical advance or decline on a price chart
that exhibits no up and down price action?" came to mind. This, along with the frustration I experienced
when wrong about the direction of a market's move, kept me searching for answers. Refusing to believe
a market could outwit me, I believed with enough time and work the Theory could be reduced to a
scientific approach where all market action could be explained and most future action could be
anticipated. My purpose was to eliminate any subjectivity in the analysis process, therefore allowing
rational, logical trading decisions to prevail.
In an attempt to explain market action which did not fit into the Wave Theory as R.N. Elliott described
it, I set out to quantify every unquantified facet. As part of this study, eight years of notes were kept on
all manner of market behavior in an attempt to classify and regiment market action above and beyond
Elliotts original discoveries.
Most of what I have discovered has come from teaching a"one of akind" Telephone Course on the
Theory since 1983. Due to this detailed teaching process, new ways of presenting the Theory to
beginners, important wave behavior discoveries (sometimes very subtle and specific), Channeling
techniques, Fibonacci relationships and charting approaches emerged. Through constant application
and research, I believe I have quantified almost every, up till now, unquantified aspect of the Theory.
Long Hours of Work
Since I generally work seven days a week, ten to fifteen hours a day and have been studying this
subject since 1980,1 estimate I have logged more than 30,000 hours in the study of Elliott Wave Theory.
This alone was a good breeding ground for new ideas.
Where is the Theory Applicable?
i'.llll.linilllllllllilll'IIIIIMIlNIMIli:1 Nil II'MMMMM' 11T M II I I I
The Wave Theory manifests itself in markets that have broad public appeal and involvement.
Markets that are more susceptible to weather and other natural events are less reliable followers of the
Wave Theory since the weather is not dependent on human thoughts or actions. Many individual stock
issues are not broadly based enough to set into motion this natural law of mass human psychology and
so may not yield consistent results. On the other hand, markets such as gold, broadly based stock
averages or real estate (even though reliable data is harder to obtain forreal estate), work well since little
can happen to change the value of the commodity or index except human action. Virtually any mass
human endeavor will exhibit predictable progress as long as there is consistent, reliable data available.
How Should You Work with and Perceive Elliott?
[IIIIIIIIIIIIIIIIIIIIIIIIIIIIIIIIIIMIIIIIIIIIIMIMIIMIIIMIII111111111II11 I I I I I I I I I I I
Meticulously
All market action needs to be accounted for and classified to produce bankable interpretations.
Counts should be built from the ground up on a "molecular" basis. Do not start the analysis process by
trying to interpret a long-term price chart first. The long-term count is the by-product of all the short-
term studies. Keep your short-term analysis accurate and the long-term possibilities will usually become
evident as they unfold.
1-10 Elementary Discussions
Once charts are organized on a daily, weekly and monthly basis, the analyst should patiently work
with the short-term data until a clearly definable pattern appears. Later it will be discussed what to do
with the completed pattern and what part of the whole the pattern becomes.
The Elliott Wave Theory is the graphic representation of a natural law which is continuously at work
in all areas of mass human activity. As an analyst working with the Theory, do not try to create count
scenarios or force the market into a pattern which would favor your current opinion of where the market
should be headed. Let each pattern evolve, then objectively deduce how that pattern, based on the highest
probabilities, fits into a grander scheme.
Elliott frequently allows you the pleasure (intellectually and financially) of calling major turning
points to the day or even the hour. At these junctures you will be a "lone voice in the woods." If you
have the courage to act on your convictions, the Elliott Wave Theory will produce results for you.
Open-Mindedly
To properly apply the Theory requires an open-mind to allpossibilities. Never begin the analysis of
a market with a preconceived scenario and then attempt to mold an Elliott count which would verify your
opinions. Your conclusions should be the by-product of a carefully constructed wave count. Also, try
to avoid all optimistic or pessimistic impulses. When all techniques are followed correctly, you do not
need to make a guess, the completed wave count will virtually tell you what price level the market should
reach and in what time frame that should happen.
What's Next?
^iliM^nillllTilJIIIIIIIINIIIIIIIIIIIII I'lll III! I I I
The next chapter of this book, General Concepts, is designed to answer basic questions you may
have about the Wave Theory, but - until now - have gone unanswered. The third chapter, Preliminary
Analysis, describes how to prepare and maintain chart data, how to identify waves, properly observe
wave interaction and much more. Chapter 3 contains the most complete and methodical explanation of
price analysis available. These techniques will allow the novice to accurately decipher even the most
complex market conditions. The fourth chapter, Intermediary Observations, discusses how to combine
individual waves into acceptable groups to form "standard" Elliott formations. Chapter 5, Central
Considerations, advances further into the construction of specific Elliott patterns with numerous rules
explained to eliminate unsatisfactory wave development. Chapter 6 introduces the Post-Constructive
Rules of Logic discovered by the author. These rules will describe how to confirm the authenticity of
patterns you have identified. Chapter7, Conclusions, will help you solidify your wave patterns, simplify
their Structure and prepare them for future use. Chapters 9-12 contain a vast array of mostly new pattern
formulation, testing and verification techniques.
Elementary Discussions 1-11
Gm0ml Coomptt 2>
WhM fa i «W»v«"? 2-1
Wli| Do Wttm Occur? 2"3
Why Am V/arm Important? 2-3
^inartwf 2-3
Psychology 2-3
Patterns 24
How Do You Categorize Waves? 24
Ctesej 24
Degree 24
How Do You Label Waves? 2 5
StruaureLabels 2-5
Organization 2-5
Progress Labels 2-5
What Data Should Be Used To Analyze Waves? 2-6
Closing f rice Dola 2"6
Bar Chans v 2"6
Futures Charts 2'8
Cash Data 2-9
How Do You Plot Data? 2-ll
How Many Chans Are Necessary? 2-12
How Complicated Do Waves Get? 2 12
How Is This Knowledge Used To Analyze? 2-13
What is a "Wave"?
■fflmriiiJiiiiiiiiiiiiniiiifiiiiiiiiiiiiiiiiiiiiiiniHiiiiiMiii 111111111
It seems quite remarkable that the basis of the Wave Theory, "waves," has never - to my knowledge
- been defined in any literature ever available on the subject. To make sense and be of use, a wave must
be described in specific terms with absolute limits. A more general definition will be offered later, after
you have been introduced to some additional concepts.
The obvious place to start with the definition of a "wave" is in its simplest form. Since waves refer
to the movement of a market, and markets are measured in price, the definition will depend on references
to price action. Clearly, the simplest price movement on a chart would be comprised of a straight line
of any length moving in any direction - except parallel to the y-axis on an x-y plane (see Figure 2-1 on
the next page).
General Concepts 2-1
Figure 2-1
I
Time
Time
S
Pri
1
1 £
1
• \
/ V
Time
Impossible!
■>
o
o
7
Time
8
Pn
"I
J
8
£
Time
Time
All of these diagrams represent reliable price
action except the bottom right. To
materialize, price action requires a "unit" of time
elapse ("unit" is described later in this
chpater). Therefore, absolutely vertical
price movement isimpossible.
To describe this type of action (which is paramount to our discussions throughout this book) it was
necessary to coin a new term: Monowave (see Fig. 2-2). A Monowave is the movement of a market
starting/rom a change in price direction untilthe next change in price direction occurs and is the
simplest type of "wave." In Figure 2-3a, the starting point "m" is where theprice changed direction/rom
its previous course. The point labeled "n" is where the next change in price action occurred. Between
any "m" and "n" you usually witness a straight line. Except when the Rule of Neutrality is applied
(explained in detail in Chapter 3), even if price action does slow down temporarily and then speeds up
again, (see Figure 2-3b) the entire advance or decline should be considered one "wave" (a monowave)
until price actually changes direction; when it does, the "Wave" is over.
Monowaves are the micro components (the building blocks) of all wave patterns. Learning how to
decipher monowaves is your first step toward understanding Elliott Wave Theory. Remember, all
market patterns and trends (no matter how large), begin with a single move. Unfortunately, analyzing
every move a market makes is tedious, but usually necessary to correctly interpret the larger picture
accurately on a consistent basis.
Figure 2-2
A monowave can be of any price ansLtime duration. As long as
price continually moves up or down (with no intervening action
in the opposite direction), the movement should be considered
a monowave. The most important task to lcam as an Elliott
Wave analyst is to correctly interpet monowaves. The entire
Theory is based on the proper identification of monowaves.
2-2 General Concepts
Figure 2-3a Change In Price Direction
/
Figure 2-3b
Change In Price Direction
Usually monowaves are
perfectly straight, but
Change In Price Direction sometimes (see Fig-
ure2-3b) they arc not.
/
Even if the upmove is not
completely straight, it still
Change In Price Direction should be considered "one
wave"(a monowave) until
a change in price direction
occurrs.
Why Do Waves Occur?
"Waves" are the result of imbalances which occur between the number of buy and sell orders on an
exchange floor or in the open market, for whatever reason. When demand for a product, in relation to
its supply, is increasing (or in the case with commodities, the total number of "buy" orders exceeds the
total number of "sell" orders) theprice goes up; this event could be called an "up-wave." When demand
for a product, relative to its supply, is decreasing (in commodities, the sell orders overpower the buy
orders), the price falls creating a "down-wave." Each time one force overpowers another, even for the
shortest period of time, a change in price direction occurs which starts a new wave. These supply and
demand forces are continuously falling into and out of balance on scales of varying magnitude (Degree).
Why are Waves Important?
■DllllIlllHllllll
Finances
Market movement is composed of waves which continually combine to form larger waves with larger
reactions. Accurate analysis of a market's wave patterns can give you an overview of current economic
conditions. As a businessman, investororspeculator, an understanding of these conditions coulddirectly
affect your financial status and standard of living by allowing you to profit from circumstances few are
expecting.
Psychology
When a market moves in a particular direction for a long period of time, it tends to attract the media
who then alerts the public (the crowd). The longer a market moves in one direction, the easier it becomes
General Concepts 2-3
for the "crowd" to believe the trend will never stop or believe die trend will continue much farther than
current levels. These feelings affect how peopleconduct business, especially if itisinanarea of personal
interest. It will affect how they invest, bank, entertain, consume, etc. How much many people spend,
and on what they spend it, affects a whole list of other people and industries. Even if a person is not
involved in specu lating or in vesting, he can be affected by the events in the stock and commodity markets.
Patterns
Correct combinations of individual monowaves create larger, recognizable patterns. Elliott
discovered that certain types of action can be depended upon when specific patterns occur. Through much
practice and hard work, it is possible to reach a point where you can predict, occasionally with great
accuracy, the price and time extent of a market move. Of course, the regular display and application of
such skill can produce great financial rewards.
How Do You Categorize Waves?
ffllS'!!!!,!'!!!!!!!!!!!!!!!!!!!!!!!!!!!!!!!!!!!!! ' I Mill MM
Classes
All market movement under Elliott falls into two, logical Classes:
Impulsions (trending & terminal patterns): These are the patterns which occurin the direction of the
trend. When analyzing short-term market movement, Impulsions can be monowaves. If the Impulsion
is more complex than a monowave, it will be composed of five (5) segments.
Corrections (non-trending patterns): These are the patterns which occur against the trend.
Corrections can also be monowaves but, if more complex, will generally appear as sideways consolidations
on a price chart and are usually composed of three (3) segments.
These concepts will be covered in increasingly greater detail as you progress throughout this book.
Degree
"Degree" is a broad, rather nebulous term detailing the hierarchical stratification of waves based on
price and time interrelationships. If you closely study a price chart of any market, it should be obvious
some waves consume a lot of time, some do not. Some waves consume a lot of price, some do not. A
wave which consumes a far greater amount of time and price than another should always be considered
a largerdegree move. More specific definitions of Degree are gradually introduced over the next several
Chapters to ease you into the concept.
With waves of different sizes simultaneously present on a chart, Degree, to be employable, must be
thought of in relative "levels" of price complexity/time duration. Degree can never be described or
applied in absolute terms. In other words, just because a move takes a week, a month, a year, $1, $10,
$100 does not make it a particular Degree. All that can be derived from a pattern which takes a month
or $ 100 is that a pattern of the same degree will probably take a comparable amount of time and/or price.
The specific limits of Degree commonality will be partially discussed in Intermediary Observations (see
"Rule of Similarity and Balance," Chapter 4) along with specific quantification rules.
Once you chooses a Degree label and symbol for a particular move Degree takes on a more concrete
meaning. Why? A frame of reference is created allowing comparisons to be made among all other
2-4 General Concepts
moves. This frame of reference will provide you with enough information to begincalling certain moves
by certain names. The names will imply how a move relates to another, not how big or small it is
inherently. Due to the esoteric nature of die Degree concept, it is advised if you are a beginning student
to not spend much time or pay much attention to this area of the Wave Theory until a greater
understanding of more important basics is achieved.
How Do You Label Waves?
Once individual monowaves have been identified, they will have to be classified. This involves the
application of structure labels.
Structure Labels
As mentioned in the last section, all market action is placed into one of two categories. Out of
necessity, each category must be given a symbol for use in marking price action. This will enable you
to quickly note into which "Class" a particular move falls.
Deciding on the symbols needed to represent wave Structure was not difficult. As indicated in the
last section, Impulsive patterns should always be comprised of- or thought to be comprised of - five (5)
individual segments. Corrections are usually comprised of three (3) individual segments. Therefore, the
symbol to represent Impulsive action is the number five (5) preceded by a colon (i.e., ":5"). To represent
corrective action, die symbol ":3" is used. The colon before each number is there to prevent any direct_
connection to additional forms of labeling which you will implement later in the analysis process.
Structure labels are critical on all levels of application to the Wave Theory. They must be applied
to waves of all shapes, sizes and complexities. Structure labels inform you whether a movement is widi
or against the trend "of one larger degree." Proper attention to structure labels will aid you in answering
mat ubiquitous market question, "which way is the market going?"
Organization
After having designated numerous monowaves on a chart with a ":3" or a ":5," you will be able to
follow die market's development into more advanced stages. To achieve this, the specific serialization
of those ":3 V and ":5's" into groups will be necessary. The groups created from the serialization process
will be given different names (another form of categorization beyond Structure labeling) which not only
indicate their CLASS (Impulsive or Corrective), but their general appearance (shape).
Progress Labels
As you become more proficient at the basic labeling concepts presented in this book, more advanced
forms of labeling will eventually need to be mastered. Progress Labels are a dramatic step for the
beginner. The complexity of this subject is such that a whole Chapter is devoted to it later. A brief
introduction follows to familiarize you with the concept, but complete coverage is scheduled for later.
Progress Labels are an essential and critical part of testing a group of waves forproper development.
They direct die analyst "down a narrow path," guiding him through certain conditions and observations
which are relevant to the current environment. Progress Labels provide order and limits to a market's
General Concepts 2-5
movement, allowing the skilled technician to finalize his opinions and prepare strategies to take
advantage of a move which "should" take place in the future.
Unlike Structure labels (:3's and :5's), which represent the inherent number of segments in a pattern,
Progress Labels identify the position of each segment within a standardizedpattern. The five segments
in an Impulse pattern are labeled as such: "1,2,3,4,5." Even though there are generally only three
segments to a correction, exceptions do occur. For this reason, more than three labels are needed, at times,
to describe all types of Corrective beh avior. The various segments of Corrective market action are given
the first three or more of the following letters: "a,b,c,d,e,x."
When referring to market action with the use of a Progress label, use the word "wave" in front of it.
For example, if you are discussing a move which meets all the criteria and inherent characteristics of
Progress label "1," you should refer to that move as "wave 1." This may seem mundane to experienced
Elliotticians, but it may not be obvious to the beginner, so is included for completeness.
In addition, to make things perfectly clear, each Progress label is placed next to the termination of
the market action it represents. The labels are placed in order from left to right as each segment unfolds.
In other words, wave-2 cannot be marked until wave-1 is completed.
Finally, keep in mind that Progress labels should not be implemented until you become familiar with
numerous preliminary and secondary procedures covered in this book. For this reason, the discussion
and application of Progress Labels is reserved for Chapter 5.
What Data Should be Used to Analyze Waves?
iiiiiuiiiiiiiiiiiiiiiiiiiiiiiiiiiiiniiiiiiiiiiiiMiiiniiniiiiii11111111111111 ii i i i i
Closing Price Data
The use of closing prices on a monthly, weekly, daily, or hourly basis is the most unreliable way to
track development of a market from an Elliott Wave standpoint. The closing price of a market has little
to do with the action which took place intra-monthly, weekly, daily, or hourly. It will not give you any
idea of how high or low the market traded during a particular period (Figures 2-4a & 2-4b illustrate why
this is the case), thus making it virtually impossible to apply the wide range of "pattern specific" criteria
presented in this book. For example, a market could rally lOpoints during the first hour of the day, close
near the low of that hour, drop 20 points the next hour, recover and close where it closed the previous
hour. Under those circumstances, the plotting of closing data would not accurately represent reality.
Therefore, closing figures - over any time frame - should never be used unless nothing else is available.
If you want to employ hourly data, the correct way of collecting data is revealed on page 2-9 (see Cash
Data, #2). Proper plotting of data, collected over any time frame, is discussed on page 2-11.
Bar Charts
Bar charts reveal what a market has done in the past by showing the trading range which existed over
a standardized portion of time plotted on a single, vertical line (Figure 2- 4c). The problem with bar
charts, from an Elliott perspective, is they do not possess the necessary qualities to allow for the analysis
of waves in absolute terms. If you were to draw a line across only the highs or lows of some price action,
you would have a band of price action similar to Figure 2-4d. This produces the right idea, but is still
not the best representation of the entire day's price action. The motion is important, but to correctly
interpret market action requires data be of a singular nature. The price action on a bar chart consists of
dual price factors occurring simultaneously, the high and low. Only one figure per time period should
2-6 General Concepts
Figure 2-4a
Intra-Day activity separated by the hour
Day's Open
Day's Close
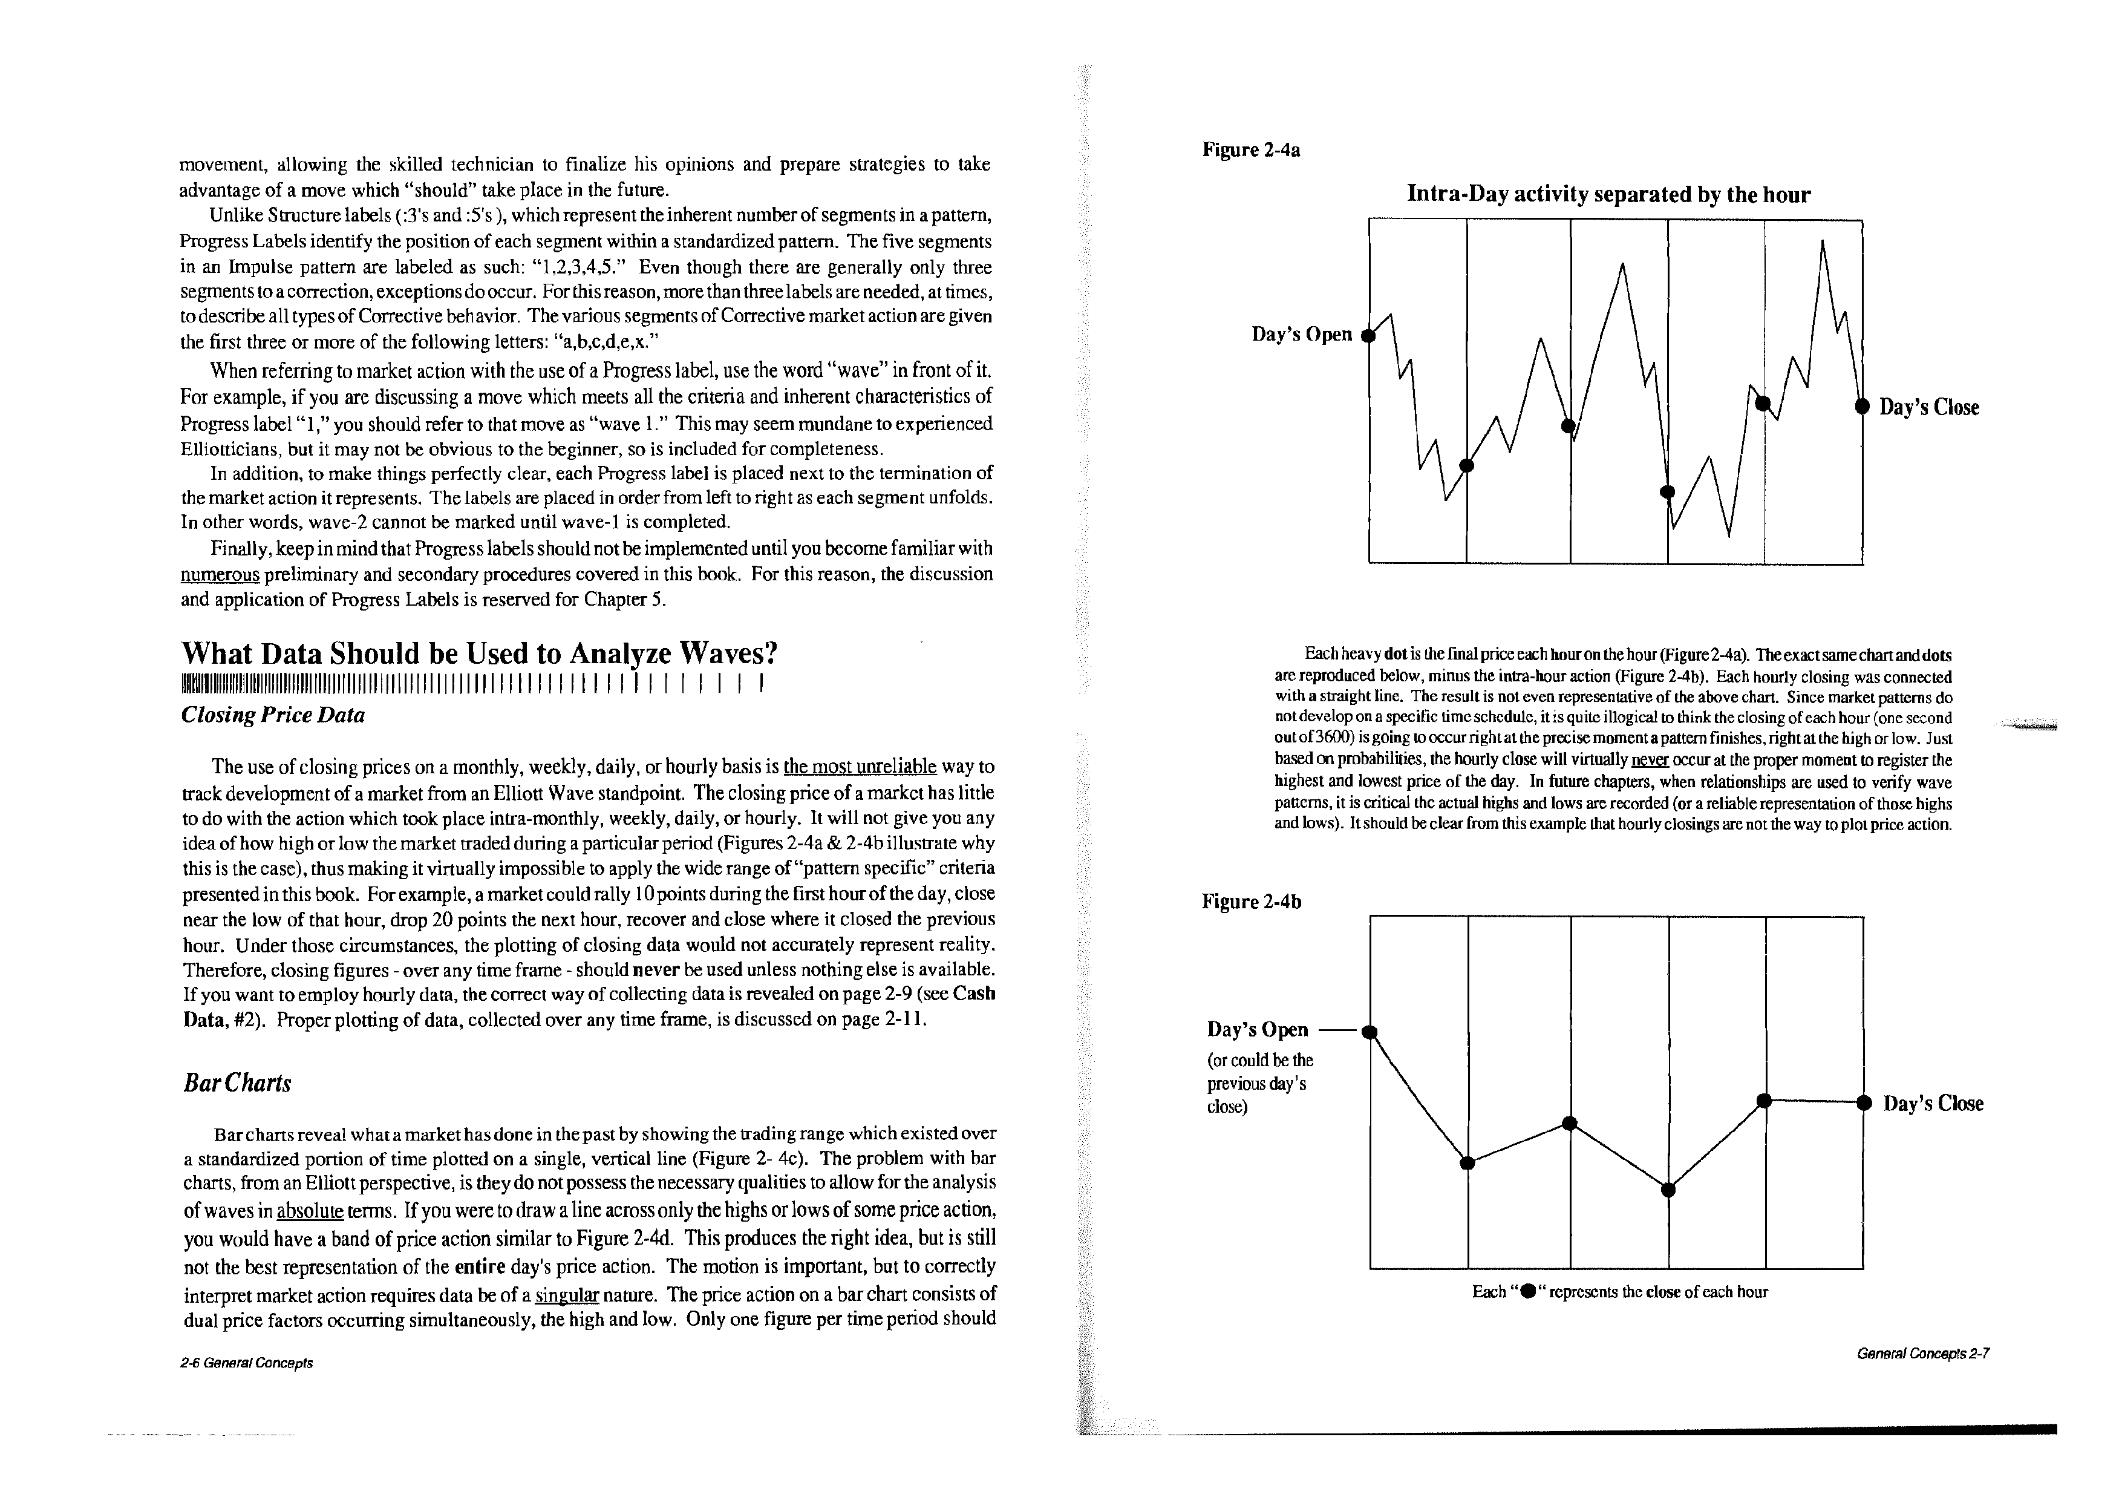
Each heavy dot is Hie final price each hour on the hour (Figure 2-4a). The exact same chart and dots
are reproduced below, minus the intra-hour action (Figure 2-4b). Each hourly closing was connected
with a straight line. The result is not even representative of the above chart. Since market patterns do
not develop on a specific time schedule, it is quite illogical to think the closing of each hour (one second
outof 3600) is going looccurrightatihe precise moment a pattern finishes, rightat the high or low. Just
based on probabilities, the hourly close will virtually never occur at the proper moment to register the
highest and lowest price of the day. In future chapters, when relationships are used to verify wave
patterns, it is critical the actual highs and lows are recorded (or a reliable representation of those highs
and lows). It should be clear from mis example dial hourly closings are not the way to plot price action.
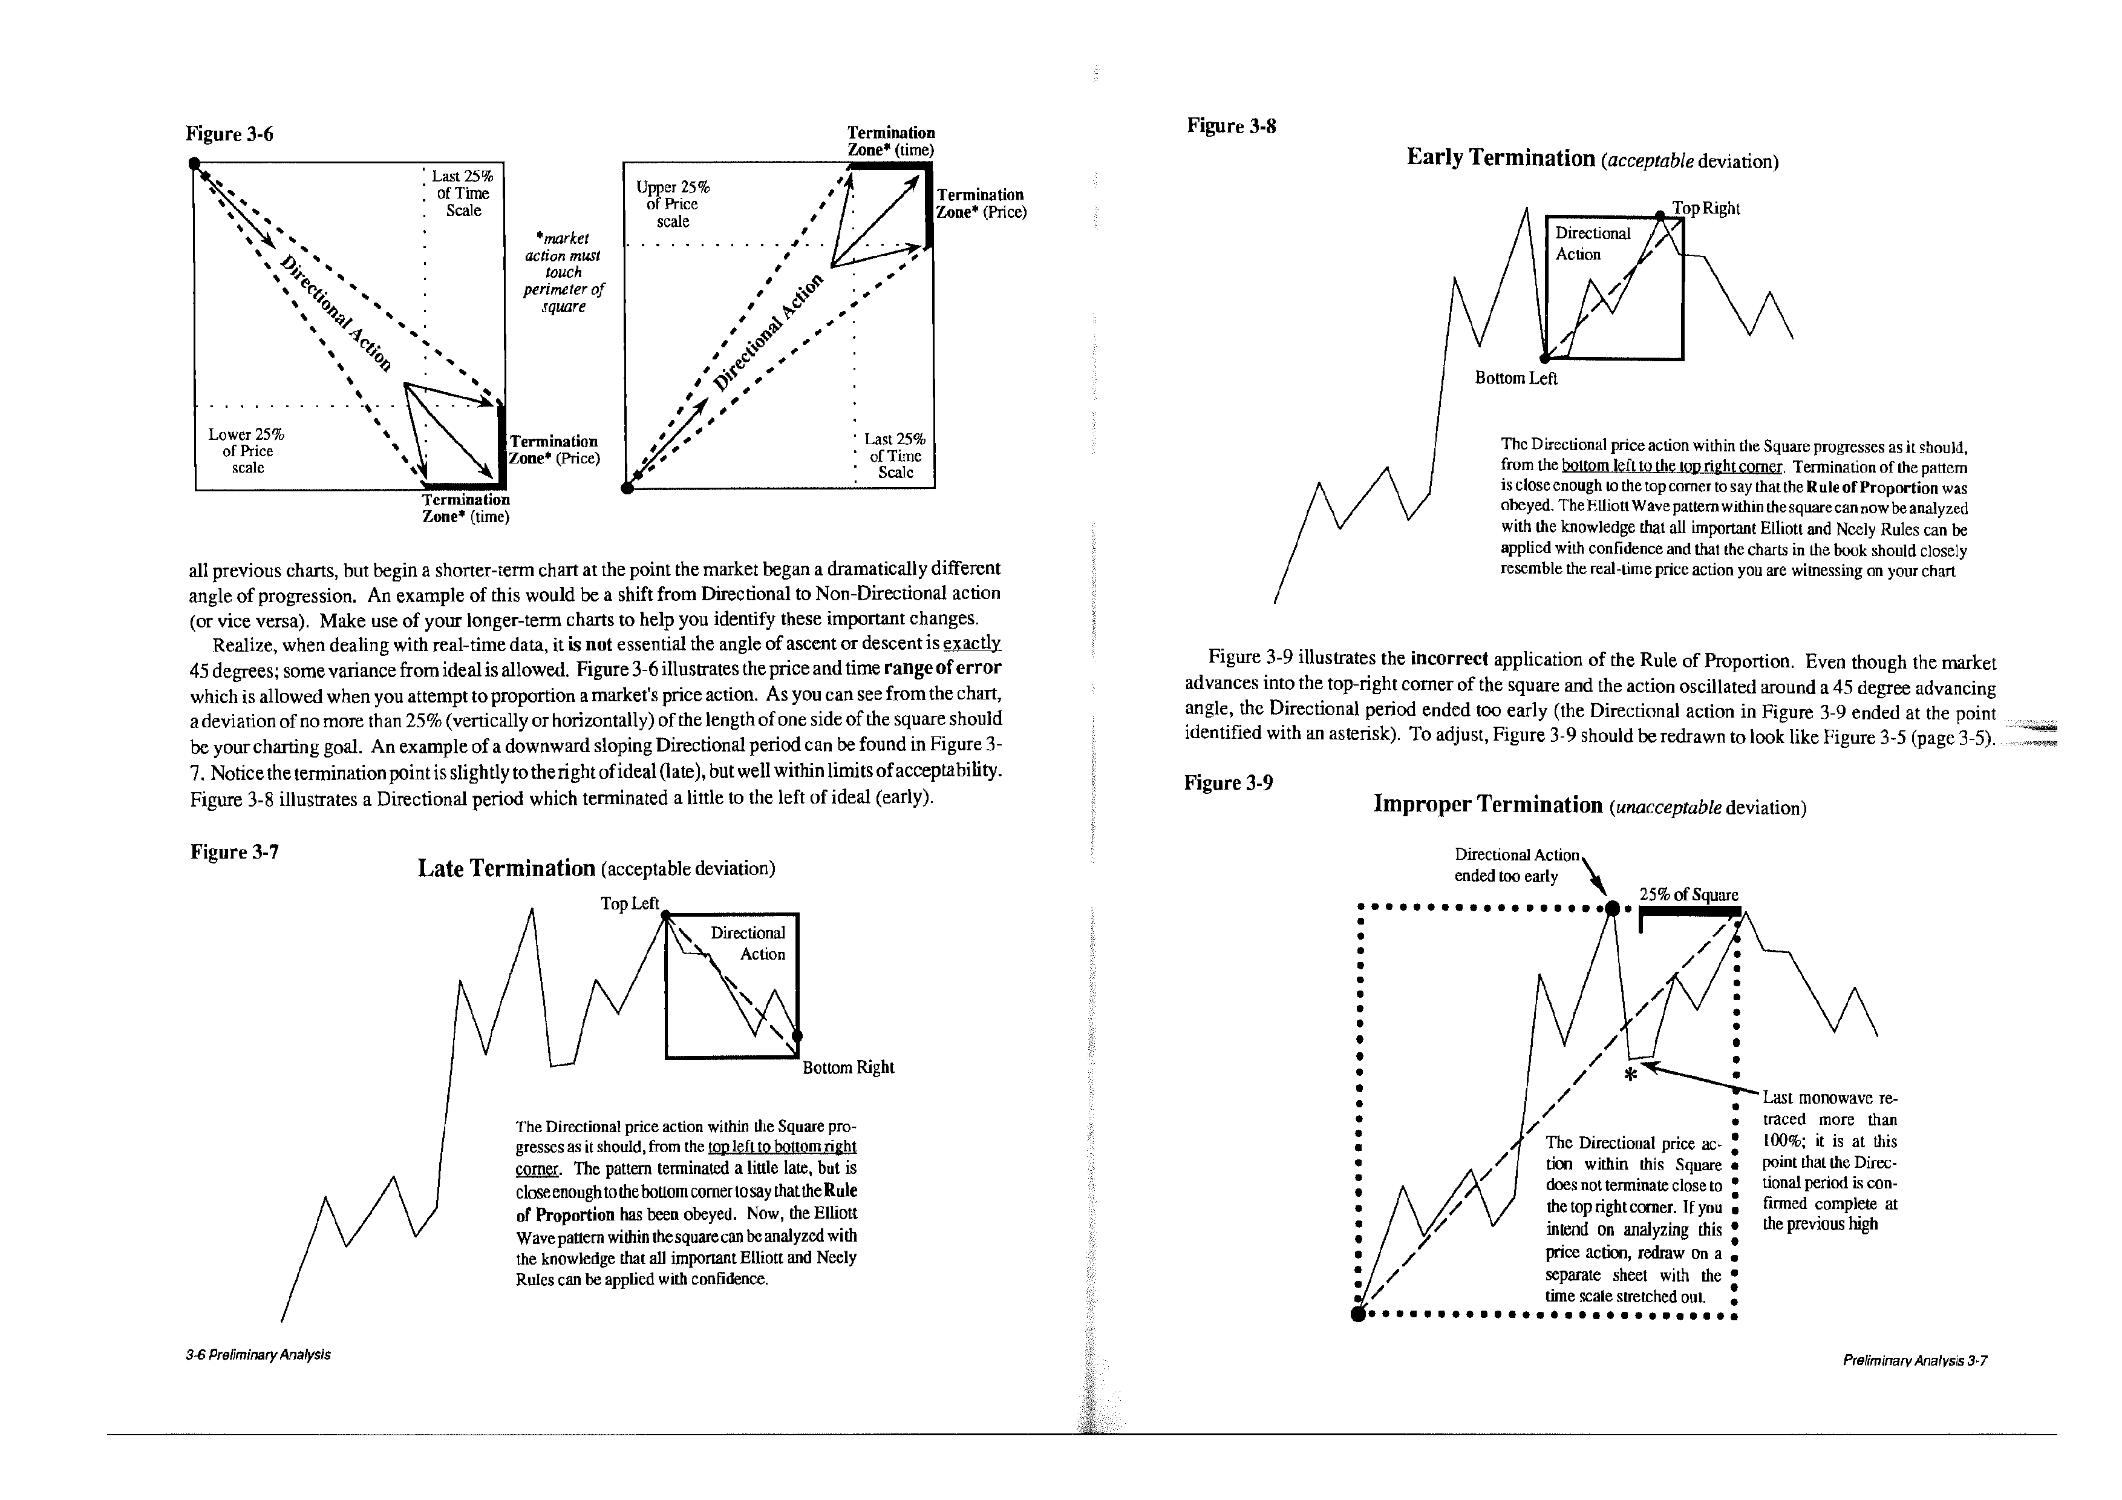
Figure 2-4b
Day's Open
(or could be the
previous day's
close)
O
Day's Close
Each "•" represents the close of each hour
General Concepts 2-7
Figure 2-4c
tii'Vf
yr/r
•r>
Bar Chart
High and low
plotted simultaneously
Figure 2-4d
Line Chart
A single, continuous line connects the
highs only of the Bar chart on the left.
Only one figure per time period should be employed so it is possible to decide how each figure changes
(if at all) the current expectations and possibilities of the market. This does not mean only one figure
per day should be used for your analysis, simply that a single figure per time unit (whatever that time unit
is - one day, week, hour, etc.) is optimal. This allows you to arrive at a definitive conclusion on current
market conditions and future expectations. A price band (the bar line on a bar chart) does not enable you
to make an absolute, immediate decision on current and future market possibilities (see Figure 2-5).
Figure 2-5
1
iV
Depending on whether the high or low on this day
came first, it could change the possibilities from
bullish to bearish. If die low came first, anew high
here would indicate a fifth wave extension is in
progress. If the high cameflrstthepreviousupmove
(x-y) might be corrective (3 parts) and the down
move could be the start of a new decline. This
example illustrates how important is it to know
whether the high or the low came first, reinforcing
the concept that data needs to be analyzed on a
singular basis to have "real-time" value to the trader.
For this example, let us assume the market experiences a violent day. When looking at a chart you
notice the price action for one day is above and below the previous day's high and low. This creates a
dilemma. Proper analysis requires you know which of the two (the high or the low) came first to make
a decision on whether price action is continuing as it should or deviating from the assumed path,
indicating changes in opinion are necessary. Therefore, bar charts should be avoided when employing
Elliott Wave Theory. Reasons for this will become clearer as you progress through the book.
Futures Charts
Futures charts present a unique problem to the application of the Wave Theory. They contain an
element of "deterioration." When dealing with distant Futures contracts in most commodities, the Cash
market trades well below the Futures price. As expiration of the Futures contract draws near, the Futures
2-8 General Concepts
price will approach the cash and, for most markets, will be equal at expiration. Occasionally, supply and
demand factors in some of the agricultural commodities can create severe imbalances which prevent the
Futures from equaling the cash at expiration. As carrying charges and other costs are subtracted from
the Futures contract on a daily basis, a continuous and gradual price erosion occurs during the life of me
contract.
Over a period of time, the inherent price distortion in a Futures market can wreak havoc with long-
term wave analysis. In addition, some Futures markets (due to limited public participation) are
susceptible to intentional or accidental manipulation by "strong hands" (well capitalized individuals or
groups). Again, this can create great difficulty in deciphering an Elliott Wave pattern.
Cash Data (the proper data for the creation of wave charts)
Manipulation of a true cash market is far more difficult than a Futures market and requires much more
capital (due to a lack of leverage) and time to initiate. Therefore, the return on investment is less when
attempting to manipulate a Cash market. Additionally, a Cash position is not as liquid as a Futures
position. The result, manipulation of a Cash market is seldom attempted or successful.
The Wave Theory requires a large degree of public involvement (which generally precludes or
greatly hinders any manipulation potential) to manifest itself. Since Cash markets always involve more
participation by the public (through direct buying and consumption, as is thecase with commodities) than
Futures markets, wave formations always tend to be more standardized and predictable when cash data
is used. In constructing your data series, use cash data whenever possible.
Now, we need to deal with another matter which has to be broken up into three different discussions.
As mentioned earlier, proper analysis requires only one price data point occur per predetermined time
period. How is this data obtained or decided upon? The next three numerical divisions discuss that
problem:
1. For most Cash markets, there is no decision to be made; only a single price quote per day is
available. When only one data point per day is available, you simply plot that data over a predetermined,
consistent horizontal distance ("base" time unit) which represents one full trading day. Each new data
point will be plotted an equal distance from the next (this always applies no matter what time frame is
covered on the chart).
2. It becomes more difficult to deal with a Cash market which has data available continuously all
day (such as the S&P 500, NYSE, MAXI, Value Line, etc.). First, you need to decide which minimum
time frame you plan on following. The shorter the time frame, the more sophisticated the equipment and/
or software necessary to track the data and the more charts which will need plotting and deciphering.
Following shorter and shorter time frames for trading requires you have a progressively greater
understanding of the Wave Theory and a "warehouse" of memorized information at your disposal. The
shorter the time frame followed, the greater the likelihood one of the many important, but subtle factors
necessary for proper Wave analysis will be overlooked in the rush and excitement of the trading day. We
could call this the "Elliott time crunch;" everyone is subject to it, some more than others. Guard yourself
against the danger of trying to trade with the Theory over shorter periods of time man can possibly be
handled. If you do not, adverse and unexpected market action will cure you of the habit.
The greatest benefit of following a market on a short-term time frame (if you are holding positions
General Concepts 2-9
overnight) is it increases your ability to determine when a pattern has completed* Personally, I usually
employ the intraday market action as part of my charting arsenal only when I am looking for a low risk
entry and price patterns indicate the end of a campaign is approaching.
As an analyst, trader or investor, you will need to decide which time frame is best suited to your needs.
If you decide one figure a day is all you would like to deal with, you are also deciding the type of move
you are interested in is one that lasts several weeks to a few months. You will not be able to day-trade
following only one figure per day, obviously. To arrive at one figure per day for a continuously traded
cash market, add the extreme (real) high and low together and divide by two (2). Plot as described in
"How Do You Plot Data," which immediately follows. If you want a little more daily detail by using
two figures a day, there are two choices. You can divide the day in two equal parts and take the average
of the high and low for each session 0£ you can use the high and low for the entire day and plot them in
the order they occurred (this last approach is the best). That is, if the high of the day came first, reserve
it for the first time slot of the two slot day and plot the low second (or vice versa).
There is a small problem with plotting real-high/low readings that are available for cash market
indices based on underlying stocks. Not all stocks open at the same time. The practice of most exchanges
is to calculate the opening from the few stocks which are open early in the morning with the previous
days closes of all stocks not open during early trading. This forces the cash market to always open
approximately where it closed the previou s day even if the Futures price "gaps" at the opening. By using
averages, you basically eliminate any significant distortion created by this form of tabulating. Without
any adjustment, correctly using a cash Index's "real" high/low plot often exhibits horizontal price
movement (during the opening period) even when the Futures market opens hundreds of points higher
or lower. The only way to avoid thi s situation is to drop the first 10 to 15 minutes of the trading day from
the recorded data, then calculate the high and low for the day. This way you are usually assured most
stocks arc open and the openings (not the previous day's closes) are part of the current reading.
3. The last situation of concern when plotting data is in reference to 24-hour markets; markets not
just traded here in the U.S., but those which continue to trade around the clock on virtually every
exchange in the world. Currency markets are a perfect example of a situation. How do you properly keep
track of such markets?
Over a period of time, I experimented with plotting the cash markets of Gold, Silver, Australian $/
U.S.$ and the Swiss Franc/Australian $ in different ways. When these markets were plotted using data
available only during the time they traded in oneparticular country (the U.S., London, or Australia), the
wave patterns were decipherable and followed typical Elliott patterns. Another approach was to equally
space the price action of a 24-hour market among the number of markets in which the product is traded
and plot that action in a continuous string. Another way is to separate the world into time zones of equal
amounts and place the price action of the important world market that falls into that time zone on the chart
♦Determining when apattern has completed, to most beginners, is perceived as picking top or bottom tick in amarkel and
is the assumed key to making money in the markets. Always trading with the intent of only getting in at top or bottom tick
is a very dangerous habit and is not the way large amounts of money are made in this game. Profits can usually be made faster
and safer when entering right before a market's acceleration phase. This usually takes place well after the high or low in the
market has occurred. In addition, it is generally very important io let the market confirm (even it only in the smallest way)
a change in trend has occurred before entering a position. By demanding confirmation before entering a market, you can
almost always eliminate the possibility of gettingcaught on the wrongside of a"gap" opening. Also.ifyouratlentionisstrictly
focused on short- term or overnight trading, large patterns which have been form ing for months oryears can unwind overnight,
creating panic "gap" openings. (A "gap" opening occurs when the market opens substantially higher or lower than the
previous day's close and usually indicates the opening is outside of the previous day's trading range.) The Silver market
experienced one of these openings two days in arow in mid-April 1987. The "gap" was so large on both days that the market
opened "up-the-limit" preventing anyone from exiting the market who was short from the previous day. Wrongly positioned
in just one such situation can eliminate an entire year's worth of trading profits (assuming you had a profit to lose).
2-10 General Concepts
in a continuous chain of events. The wave patterns under both of the last two approaches tended not to
conform to normal Elliott patterns and were quite often indecipherable. The only approach I have not
experimented with, that may work, is keeping track of an entire high/low range for all the world markets
per every 24-hour time period. The easiest way to do that would be to use the close of the market in your
country as the close of each 24-hour period. The minute your country's market closes, the next trading
day begins. Just like die odier markets which have a high/low range, instead of just one price per day,
you could average the range of the 24-hour time period or plot the high/low in order (in this situation
that might be difficult information to obtain).
Conclusion: From the above experiments, it was proven that each market should be followed in one
country only! Most people involved in a market get in and out of their positions using the same exchange;
this creates multiple closed-loop trading environments for each exchange (and country). In essence, each
market, despite its similar name to another market traded in another country, is trading on its own internal
perception of the technical and fundamental factors which affect that market in the country of origin. This
indicates that as each trading day passes, each country is basically reliving the same market conditions
experienced by all the others during their trading day (with minor variations, of course). After a period
of time has passed, the technical and fundamental conditions will exert themselves in such a way that
each market is poised to make a significant move in unison with all me others. Under these conditions,
it takes only one market to "start the ball rolling" and the rest follow suit as they open.
To get to the root of the problem, this is how 24-hour markets should be handled. Keep cash charts
on the market you follow, but only during die trading time of yourparticular country. If it is a very thinly
traded vehicle in your country, you may want to follow die cash price in a country where the currency
or commodity is more heavily traded and follow the Futures contract in that country.
For protection against a significant move which starts in another country, it is essential you have a
brokerage firm which provides an overnight trading desk. This will allow you to place orders to protect
against gap openings which may occur in the Futures market of your country. How does it work? The
overnight desk keeps tabs on trading as it circles the globe. When a market starts to move in another
country, any movement which hits your stop (with the overnight desk) will be activated immediately.
You will be out well before die move has had a chance to pick up steam and really cause damage by the
time the U.S. markets open. This basically eliminates the possibility of a market opening at a price much
worse than where you wanted to be stopped out.
In closing, because of die circumstances surrounding 24-hour markets, if you do not have a broker
who can provide you with a night desk to place overnight stops, it is strongly recommended you only
day-trade (no position held overnight) OR only intermediate to long-term trade the 24-hour markets.
Taking a position with the intent of only holding it overnight OR just for a few days (short-term) can be
very risky without the aid of an overnight desk.
How Do You Plot Data?
Si,!,1:!!!!'!!!!!,!'!!!!!!!!!!!!!,!!!!!!!!!!!!,!!!!'!!'!!!!!!!'! | III!
Once you have decided on the market you wish to follow and the data desired, it is necessary to choose
the time frame which will be employed on the chart. A properly plotted data series should be constructed
like Figure 2-6 (next page). This diagram shows one figure (represented by each dot) being placed in
the center of the time slot which die figure covers. After all figures have been plotted, use a straight line
to connect each dot. Monowaves will immediately begin to appear (see Figure 2-7, next page).
General Concepts 2-11
Figure 2-6
•
Smallest time unit. Price
plotted in middle of time unit.
How Many Charts are Necessary?
Normally, a minimum of three charts is necessary on each market followed; daily, weekly and
monthly. On some of my favorite markets, I keep as many as twenty different charts of varying shapes,
sizes and scales, including logarithmic plots of long-term data.
How Complicated Do Waves Get?
^-illl":. 'MM' Mill i I! I I I I I I
Until now, all discussions have been exclusively aimed at monowaves. Monowaves, you remember,
are the simplest wave forms possible. More complicated patterns do of course occur. After you
understand how to analyze the monowave stage of market development (discussed in Chapter 3),
combining monowaves into groups (the purpose of Chapter 4) is the next step in the analysis process.
When combining three or five monowaves, you create what I have termed a Polywave, one level
above monowave development. When you combine three or five polywaves, you generally create a
Multiwave. Three or five multiwaves generally can be combined to create a Macrowave. This is the
highest level of development I have named. Anything above that level will continue to be referred to as
a Macrowave.
Remember, all smaller waves become part of larger patterns. This process continues indefinitely.
Therefore, as an answer to the question created by the heading of this section, there is no limit to how
large, time consuming or complicated an Elliott Wave pattern can get. Despite this fact, all market action
remains explainable within the limits of the Theory.
With most theories and techniques, it would be safe to say "as the time period covered increases, the
action in a market gets more difficult to decipher." On the contrary, due to increases in the certainty of
wave Structure for each segment of a large move, Elliott Wave can actually make long-term prediction
easier than short-term prediction.
Figure 2-7
2-12 General Concepts
How is This Knowledge Used to Analyze?
fl|,;,|lll|,!l,l|l,l,,llli; 'm1'11,1,1,111.!11111!11!111, I!.MM I ' ' I
The most important aspect of identifying Impulsive or Corrective monowaves is that it allows you
the ability to deduce the trend of a particular market. With a comprehensive understanding of all the rules
and factors which influence wave patterns, it is possible to predict the distance a move will travel and
approximately how long it will take. You can also accurately describe the psychological environment
which should unfold during the development of the predicted pattern. Even more useful and impressive,
an accurate view of current action can frequently allow you to predict market action on a day-to-day basis
with precision accuracy. Finally, through the process of Compaction (explained in Chapter 7), you can
derive larger and larger trends to be taken advantage of.
Genera! Concepts 2-13
Preliminary Analysis 3-1
Chart Preparation and Data Managemeut 3-1
Identification ofMonowaves 3-2
Rule of Proportion 3-3
Ride of Neutrality 3-9
Chronology 3-14
Rules of Observation 3-14
Retracement Rules 322
Rule Identification 3-23
Graphical Summary ofReiracemenl Rules 3-30
Pre-Constructive Rules of Logic 3-32
Transformation of Rule Identifiers 3-33
Implementation of Position Indicators 3-60
Directions 3-61
Position Indicator Definitions and Sequences 3-61
Pattern Isolation Procedures 3-65
Special Circumstances 3-68
Synopsis of Chapter 3 3-69
Whether you are a novice or an advanced student of the Elliott Wave Theory, the meticulous study
of simple wave patterns is essential to accurate, long-term analysis. Monowaves, being the simplest price
action possible on a chart, are the obvious place for you to begin your observations. Unless you learn,
early on, how to indirectly categorize monowaves into one of the two classes (Impulsive or Corrective),
making progress with Elliott is extremely difficult. Let's start out by creating the proper charts. After- -<■*
ward, we can proceed with the observations and quantitative mathematics necessary to decide whether
a monowave is representing an Impulsion or representing a Correction.
Chart Preparation and Data Management
iiii:iii!::!!i:i::iiii:i:iiiii::::!ii::!i:iii!iiMiiiiiii n: 1111 i
On your initial exposure to this material, you may simply want to follow the illustrations in the book.
After reviewing this section, it is recommended you construct your own real time charts as directed.
The first step in making a chart is to pick a market you wish to analyze and then decide on a starting
point for your observations. Without a specific starring point, none of the techniques to be described in
this chapter will make any sense. Here is what you do: plot a year of data consisting solely of the highest
and lowest price of each month in theirorder of occurrence (using the techniques described earlier under
"WhatDataShouldBeUsedToAnalyzeWaves,"page2-6and"HowDoYouPlotData,"page2-llj,
then look over that wave chart and locate the monthly monowave which is closest to the center of the
entire price range (high to low). [You want a starting point which is not of historical significance. Why?
Major turning points are more difficult to work with under Elliott since they are generally associated
with abnormal behavior. For our purposes we need to make things as simple as possible.] Next,
ascertain a date which falls around the price center of that middle, monthly monowave.
Once a date has been established, begin constructing your first daily wave chart (in the proper manner)
using approximately 60 cash data points covering about 8 inches of horizontal space on a sheet of graph
paper. On this scale, monowaves should be relatively easy to identify. After constructing your first chart,
pick the earliest important high or low that occurred (see Figure 3-1). From that point you want to draw
Preliminary Analysis 3-1
a second chart that doubles the detail of the first one (Figure 3-2a starts from the important low marked
in Figure 3-1; its time scale has been enlarged to allowforclose scrutiny ofmonowaves). In other words,
the same 8 inches of horizontal space used for the first chart will, on the second chart, cover only half
as much time as the first and employ approximately 30 data points.
Figure 3-1
In this example (Figure 3-1), an important low has been made around the center of the time period. From
that point a new chart was started (Figure 3-2a) that displays about half the time covered by the first chart.
Identification ofMonowaves
After the proper charts have been completed, identifying each monowave becomes the next step in
the analytical process. Using Figure 3-2a for demonstration purposes, start from the lowest and earliest
point (designated "Important Low"). Follow the price action upward, data point by data point, until one
data point is lower than the previous, no matter how minor the amount. Once that change in price
direction occurs, you have just identified your first monowave. Put a DOT at the end of that initial
monowave (see Figure 3-2a).
Follow the down move from the dotted monowave's high (data point by data point). The first data
point that is higher than the previous indicates the market completed its second monowave. Put a dot
next to the secondmonowave's low (see Figure 3-2a). Continue this identification process until you have
dotted the end of numerous monowaves. In Figure 3-2b, all monowaves have been identified with their
own dot (the end of the last monowave is not dotted since a change in price direction has not occurred).
3-2 Preliminary Analysis
Figure 3-2a
End of First Monowave
identified with a DOT
[In this example, the market has been ad-
vancingfromanimportantlow. Itcouldjust
as well have been declining from an
important high; the same rules would apply.]
End of Second Monowave
"Important" low
Figure 3-2b
[Each change in price direction on the chart has
been identified widi adot. The dots mark die
beginning and ending points of each monowave.
These extremes arc subject to revision if any of
die price action comes under the jurisdiclion of
die Rule of Neutrality (covered shortly). Once
die Rule is considered - and applied where
appropriate - the position of the dots becomes final.]
"Important" low
Rule of Proportion (proper scaling of charts)
When you pick a particular price and time scale to plot a market, you are also simultaneously deciding
which Elliott Wave patterns will be visible and which will not. In other words, each pattern develops
based on its own, unique price/time scale. To detect and analyze a particular Elliott Wave pattern, your
chart must possess the correct proportions. The proper proportionality of market action is predicated on
the pattern developing. Adherence to the Rule of Proportion is essential to the accurate application of
the Rule of Neutrality (covered after mis section) and to the standardized look of price patterns.
Preliminary Analvsis 3-3
The reason no single time scale will work for all analytical purposes is due to the flexible nature of
time. Just as Einstein's Theory of Relativity revealed, time is not absolute, but variable. In Einstein's
Theory, time was dependent on the velocity of the observer. Under Elliott Wave Theory (as it relates
to market action), time is dependent onmasspsychology. Due topsychological influences, time expands
and contracts as the financial and economic hopes and fears of the masses are recorded through buying
and selling on an exchange floor. The reason no single price scale will work for all purposes is due to
the dynamic and fractal basis of price action under the Wave Theory. Price patterns develop
simultaneously on all dimensions large and small.
Before we can discuss the proportions of an ideal Elliott Wave chart, we must define the two ways
price action progresses through time; Directionally and Non-Directionally (this is not to be confused
with Impulsive and Corrective activity). Just like all Elliott patterns, if Directional or Non-Directional
action begins at a low, it will complete at a high and vice versa. Directional action is always composed
of a series of monowares which, on the average and as a whole, create an increase or decrease in a
market's value (see Figure 3-3 below). As a general rule, the first monowave of a Directional period is
retraced no more man 61.8%. Directional action usually terminates when a monowave, traveling in the
direction of the Central Oscillation line, is retraced more than 100%. Non-Directional action is
composed of a series ofmonowaves which, on the average and as a whole, create stagnation of a market's
value (see Figure 3-4). The first monowave of a Non-Directional period is always retraced more than
61.8%. Furthermore, all phases (with the occasional exception of one phase) of Non-Directional action
must be retraced at least 61.8%. Non-Directional action usually terminates when price action moves
beyond the range of the entire Non-Directional period by a factor of 161.8% or more (see Figure 3-4).
To properly study a market using the Neely Method of Elliott Wave analysis (discussed in this chapter
and throughout the book), you must strive to achieve a price-to-time ratio which will produce an angle
of ascent or descent predicated on the type of market action unfolding. Irrespective of the price or time
consumed by a pattern, this angle should be implemented on charts of immediate analytical importance.
Figure 3-3
Directional Action
Directional Action
First monowave*.
retraced less
than 61.8%
(value increase)
Until here, no advance was
retraced more than 100%
Central Oscillation
line through Time
(valueincrease) I,-. ,. , , .
1 Directional Action
Minor retracement
previous advance'
Central Oscillation
line through Time
Complete retracement of
previous monowave,
Directional action complete
Directional Action
3-4 Preliminary Analysis
Figure 3-4
Non-Directional Action
This bracket encases Directional Action which is
contained within the Non-Diieciional phase. Before the larger
Non-Directional action could have been analyzed, the Di- I
rectional action would have to have been studied.
This is the first monowave of
the Non-Directional action; it
is retraced more than 61.8%
This is the first (1st)
monowave of the
Non-Directional
action, it is retraced
more than 61.8% b
the second (2nd)
monowave
Non-Directional
Action
(value stagnation)
I 1
2nd
A/
(value stagnation)
Central Oscillation
line through Time
Tliis advance is more
than 161.8% of
previous consolidation, the
Non-Directional
action is complete
Central Oscillation
line through Time
Non-Directional Action
What is this specific angle of progression needed to view the Elliott Wave phenomenon? When
dealing with price action which is Directional, ploi the data so it travels from the bottom left to top right
or top left to bottom right corner of a perfect square. In other words, the data should oscillate around an
angle which is approximately 45 degrees from start to finish (see Figure 3-5). This emphasizes the
important fact that the market dictates how charts should be constructed, thus eliminating the need to
subjectively deduce a charts' plotting parameters. This is not meant to suggest that every time the market
changes slope or direction, you throw away your current chart and start a new one. Continue to update
Figure 3-5
Complete retracement of
previous advance,
Directional action finished
Preliminary Analysis 3-5
Figure 3-6
Termination
Zone* (time)
Lower 25%
of Price
scale
Upper 25% /f
of Price / /
scale * /
* l/ij
0 ^■"^
' O*
/ p y
'v ♦
* 7f *
'/ '
,'/'
*s*
Jf+
*\
/ 1
/ 1
'^A
*~~~~~^ +
+
Last 25%
of Time
Scale
Termination
Zone* (Price)
all previous charts, but begin a shorter-term chart at the point the market began a dramatically different
angle of progression. An example of this would be a shift from Directional to Non-Directional action
(or vice versa). Make use of your longer-term charts to help you identify these important changes.
Realize, when dealing with real-time data, it is not essential the angle of ascent or descent is exactly
45 degrees; some variance from ideal is allowed. Figure 3-6 illustrates the price and time range of error
which is allowed when you attempt to proportion a market's price action. As you can see from the chart,
a deviation of no more th an 25% (venically or horizontally) of the length of one side of the square should
be your charting goal. An example of a downward sloping Directional period can be found in Figure 3-
7. Notice the termination point is slightly to theright of ideal (kte), but well within limits of acceptability.
Figure 3-8 illustrates a Directional period which terminated a little to the left of ideal (early).
Figure 3-7
Late Termination (acceptable deviation)
Top Left
Bottom Right
The Directional price action within the Square
progresses as it should, from the top left to bottom right
corner. The pattern terminated a little late, but is
close enough to the bottom corner lo say that the Rule
of Proportion has been obeyed. Now, the Elliott
Wave pattern within the square can be analyzed with
the knowledge that all important Elliott and Neely
Rules can be applied with confidence.
3-6 Preliminary Analysis
Figure 3-8
Early Termination (acceptable deviation)
Top Right
The Directional price action within the Square progresses as it should,
from the bottom left to the lop right corner Termination of the partem
is close enough lo the top comer to say that the R ule of Proportion was
obeyed. The Elliott Wave pattern within the square can now be analyzed
with die knowledge that all important Elliott and Ncely Rules can be
applied with confidence and that the charts in die book should closely
resemble the real-time price action you are witnessing on your chart
Figure 3-9 illustrates the incorrect application of the Rule of Proportion. Even though the market
advances into the top-right corner of the square and the action oscillated around a 45 degree advancing
angle, the Directional period ended too early (the Directional action in Figure 3-9 ended at the point
identified with an asterisk). To adjust, Figure 3-9 should be redrawn to look like Figure 3-5 (page 3-5)
Figure 3-9
Improper Termination (unacceptable deviation)
Directional Actionv
ended too e
) early \
25% of Square
The Directional price
action within this Square
does not terminate close to
the top right corner. If you
intend on analyzing this
price action, redraw on a
separate sheet with the
time scale stretched out.
" Last monowave
retraced more than
100%; it is at this
point dial die
Directional period is
confirmed complete at
the previous high
Preliminary Analysis 3-7
Figure 3-10
Non-Directional Action
Squares A & B are examples of
the proper price/time
proportionality which should exist
when dealing with Non-
Directional price action
Acceptable deviation
50%*
*Dashed lines mark the vertical half-way point of the squares
Figure 3-11
Non-Directional Action
Furthest price level from the
beginning of the pattern
Nor-Directional
period confirmed
complete; a new
phase of Directional
action has started
*Dashed line marks the vertical half-way point of the square
3-8 Preliminary Analysis
When analyzing price action which is Non-Directional, you want the up and down periods to cover
approximately half of a perfect square (see Figure 3-10). Notice how the Non-Directional action in
Figure 3-10 (Square A) terminates its horizontal period around the vertical 50% retracement point of
the square. Even when a Non-Directional period consumes a large amount of time and contains many
monowaves, the goal is the same (see Square B). Sometimes this goal may be impossible to obtain if
thepattern continuously contracts over aperiod of time. For those situations, make sure the furthest price
level from the beginning of the pattern falls around the 50% point (see Figure 3-11).
To synopsize, when it is time to construct a new chart, the Rule of Proportion directs you to design
the price and time scale to fit the requirements of the pattern forming. This will help your charts look
like those in this book, thus allowing for the most direct comparison and accurate analysis of the market
action. It will also prepare your chart's data for the possible application of the Rule of Neutrality.
Rule of Neutrality
After marking every change in price direction on your chart, you will find that most monowaves
travel at a diagonal to the price/time axis. Occasionally, you will find a monowave containing price
action which is progressing more horizontally than vertically. It is that type of behavior which comes
under the jurisdiction of the Rule of Neutrality. The Rule of Neutrality explains how to deal with these
problem monowaves and the dots which define their borders.
There are several areas of sideward price action which could come into question if we restudied Figure
3-2b, page 3-3 (reproduced below as Figure 3-12). Those areas have been designated in Figure 3-12 with
empty circles. We will spend some time later analyzing those areas. First, a detailed discussion of the
Rule of Neutrality - and how you should apply it to real-time - is necessary.
Figure 3-12
t I RN
/ l / \ Aspect 2
RN
Aspect 1
The only periods on the chart which might
be "nearer to the hori?ontal than to the
vertical plane" have been circled and
designated by the capital letters "RN" (Rule of
Neutrality). It is at these junctures that the
Rule of Neutrality should be considered.
;rn
Aspect 1
Preliminary Analysis 3-9
Horizontal price action can separate two waves that are traveling in opposite (counter) directions
(see Figure 3-13a) or two waves that are moving in the same direction (see Figure 3- 13b). To spot these
two types of behavior and to make the Rule of Neutrality useful and applicable, the term "horizontal"
must be defined. Creating perfectly horizontal price action on a chart requires the same data point be
plotted twice in succession. Perfecdy horizontal price action is not the only action which can qualify for
consideration under the Rule of Neutrality. The term "horizontal" describes price action which operates
within limits on either side of perfection; these specific limits are covered below.
Figure 3-13a
Horizontal
Price Action
/ ^^_JL-^-Counter Directiona
/ V^ monowaves
'■.. / V" Horizontal
' • / Price Action
Figure 3-13b
Monowaves Monowaves
moving in the moving in the
If you discover price action which appears to be moving more horizontal than vertical, apply me
following techniques. Draw a vertical (90°) and horizontal (0°) axis on your chart beginning from the
start of the suspected price action. Next, if the monowave is moving downward, draw a line from the
origin of the plane through the lower right quadrant (see left-hand side of Figures 3-14a and 3-14b); if
the monowave is moving upward, draw a line from the origin of the plane through the upper right
quadrant (see right-hand side of Figure 3-14a and of 3-14b). This will create a 45 degree angle to the
time (0°) axis. The result is the separation of the quadrant into two equal parts. If price is moving
downward and is on or below the 45 (top left, Figure 3-14a and 3-14b) or is moving upward and is
on or above the 45 (top right, Figure 3- 14a and 3- 14b),do not consider the Rule of Neutrality. If market
action is moving downward and is above the 45 (bottom left, Figure 3- 14a or 3- 14b) or is moving
upward and is below the 45 (bottom right, Figure 3-14a or 3- 14b), the Rule should at least be considered.
The closer price action moves to the horizontal axis, the more likely the Rule will take effect.
3-10 Preliminary Analysis
Figure 3-14a
Counter Directional
Monowaves
This "Horizontal" Price
Action dots mil qualify
More than 45
Degrees, Rule of
Neutrality sJuoild.
nut be considered
More than 45
Degrees, Rule of
Neutrality 5hj2u]d_
mil be considered
This "Horizonial" Price
Action does not qualify
This "Horizontal" Price
Action dots qualify
Less than 45
Degrees, Rule of
Neutrality should
probably be applied
Less than 45
Degrees, Rule of
Neutrality should
probably be applied
This "Horizontal" Price
Action does qualify
Figure 3-14b
Same Direction
Monowaves
More than 45
Degrees, Rule
of Neutrality
should not be
considered
This
"Horizontal"
Price Action
( docs not Qualify
More than 45
Degrees, Rule
of Neutrality
should not be
considered
Less than 45
Degrees, Rule
of Neutrality
should be
considered
This
"Horizontal"
Price Action
does qualify
- Less dian 45
Degrees, Rule
of Neutrality
should he
considered
Preliminary Analysis 3-11
If price action indicates you should consider the Rule of Neutrality, it becomes necessary to observe
pre- and post-horizontal action to decide which Aspect of the Rule applies to the current situation. If the
horizontal price action separates two counter-directional monowaves. Aspect 1 of the Rule applies (see
Figure 3- 15a). If the horizontal period separates twomonowaves which are moving in the same direction.
Aspect 2 applies (see Figure 3-16). NOTE: An easy way to decide which Aspect of the Rule applies in
any situation is to count the number of empty circles required to encase the horizontal price action. If
only one circle is placed on theprice action, Aspect-l(one) applies. If two empty circles must be drawn,
then Aspect-2 (two) is in effect (restudy Figure 3-12 [page 3-9] while considering this concept).
Aspect-1 allows for the termination of monowaves to occur above lows and below highs (Figure 3-
15a). Aspect-2, applicable only after the fact, allows the analyst to divide a single advancing or declining
phase (under the proper conditions) into three smaller segments (Figure 3-16). WARNING: Aspect-
1 should not be applied if the monowave, whose dot is being considered for transference, is retraced less
than 61.8% and then the market exceeds the end of said monowave (see Figure 3-15b).
In simpler terms, Aspect-1 states that "when dealing with horizontal (or near-horizontal) price action
which separates two waves moving in opposite directions, resolve the first monowave to the far right,
at the termination of the horizontal price action." Aspect-2 states that "when horizontal (or near
horizontal) price action is found separating two waves moving in the same direction, the horizontal
action can be ignored, leaving just one larger monowave to contend with, or it may be employed to create
three smaller monowaves.
Figure 3-15a
Figure 3-16
Aspect-1
Termination of
previous monowave
occurs here (below
the high) instead of at
the high
Aspect-2
Depending on
surrounding price
action, the horizontal
action could be ignored
or included. If
ignored, the entire
move would be a
single monowave. If
* the horizontal action is
included, the entire
move would be divided
into three smaller
monowaves.
Termination of
previous monowave
occurs here (above
the low) instead of at
the low
Figure 3-15b
End exceeded
before previous
monowave
retraced 61.8%
.618
3-12 PreliminaryAnalysis
Aspect-2 of the Rule of Neutrality does not apply if the "horizontal" price action is actually counter-
directional to the two same-direction waves it separates. The horizontal price action must drift in the
same general direction as the two waves it separates. For example, if the market begins moving upward
then hesitates for a time period, but no data point is lower than the last, and then the market begins to
advance again, Aspect-2 of the Rule may be used. If at any time a single data point is lower than the last,
Aspect-2 CANNOT be applied. WARNING: Anytime horizontal (or near-horizontal) price action
consumes more than one time unit and separates two same-direction waves, Aspect-2 must be applied
to break the horizontal period into three segments.
Application of the Rule of Neutrality can, at times, be conditional. When a market contains horizontal
price action of only one time unit, the decision to apply Aspect-2 frequently rests with the relation of past
and future market action to the current. For example, if alternation of Intricacy is enhanced or Levels
of Complexity between patterns is improved or "missing" waves are eliminated by employing Aspect-
2, then it should be used. If use of the Rule actually creates these or odier problems with standard pattern
formation, it should be ignored. If the termination of a monowave would occur beyond 38.2% from the
end of said monowave, do not apply Aspect-1 (see explanation in Figure 3-17, below).
Until you have read most of this book and have come to understand the complex concepts discussed
in the previous paragraph which would prevent the use of Aspect-1 or Aspect-2of the Rule of Neutrality,
the best approach is to employ the Rule in a simplistic manner. If your chart is properly scaled according
to the Rule of Proportion (see page 3-3) and price action progresses at an angle less than 45 degrees
(upward or downward) from the horizontal and the Rule can be applied to the current situation, use it.
Ignore the Rule when "horizontal" action progresses at an angle greater than 45 degrees.
The previous Figure 3-12 (page 3-9) contained several "horizontal" periods which may require
consideration under the Rule of Neutrality. Employing the concepts revealed in this section to those periods,
the horizontal action has been identified, discussed and finalized in Figure 3-17.
Figure 3-17
The angle of ascent at the
pointmarked is less than 45%
when the chart is properly
proportioned. But, based on
the percentage re tracementof
the previous monowave
(which isgreater than 38.2%),
it is probably best to continue
terminating it at the low.
t Terminated slightly
higher than the low
Aspect 2 of the
Rule of Neutrality
This near-horizontal mono-
wave can be ignored,
leaving just one long monowave
between the two dark dots m
the hazy dots can be used tc
divide the down move into
three smaller monowaves.
Past and future market
action usually dictates which
is necessary or best.
38.2%
Aspect I of the Rule of Neutrality
Near-horizontal price action separating
two counter-directional waves requires
that the first wave terminate to the far
right. Thisnileshouldbeadheredtoeven
if it forces you to end a monowave
slightly higher than its lowest price level
or slightly lower than its highest price
Prefiminarv Analysis 3-13
Chronology
The numbering of monowaves is useful when discussing wave analysis with others over the phone
or through the mail as I do for my Telephone course and in my correspondent publication, "WaveWatch,"
respectively. The numbering of monowaves is not necessary if you have no plans of discussing your
wave interpretations with other people. When doing so, all monowaves which do not contain verified
Progress labels should be referred to by their Chronological number (i.e., Chronological 1,
Chronological 2, etc., or abbreviate them as Chrono-1, Chrono-2). To properly label each monowave, begin
numbering with the first monowave on the far left of your chart (see Figure 3-18). Notice the neutral
period (Chrono-13) has also been numbered prior to the decision to apply Aspect-2.
Figure 3-18
Rules of Observation (determiningrelativeposition of monowaves)
All wave movement, no matter how large or small, must be classified into one of two categories:
Impulsive (:5) or Corrective (:3). The term "Impulsive" defines action which moves in the direction of
the trend. "Corrective" represents price action which travels against the trend. For reasons which will
become clear later, the number ":5" is short for Impulsive action and ":3" is short for Corrective action.
These numerical representations (or symbols) have been given the namsStructure Labels and are useful
when beginning real-time chart analysis. [For a general description of Structure Labels, refer back to
page 2-5.] Some new analytical terms, techniques and Rules have been developed by the author to assist
you in the accurate placement of Structure Labels to real-time action even before you have a
comprehensive understanding of the intricacies and complexities inherent in Elliott Wave Theory. These
techniques will soon be applied to each of the monowaves recently identified in Figure 3-18. If you are
following along with your own chart, apply the same techniques in the order indicated.
Since monowaves have no indicative features, their Structure (:3 or :5) must be detected indirectly.
This is accomplished through the observation of preceding and proceeding market action. Obviously,
before you can actually begin the placement of Structure labels on price action, you must leam how to
3-14 Preliminary Analysis
associate preceding and proceeding market action to the monowave currendy under analysis. The
presentation of these concepts will require what I call "relative perspective" diagrams.
Under all circumstances, the indirect analysis of monowaves depends on the relation of the "current"
monowave to surrounding monowaves. Whenever studying a chart, the monowave under analysis will
be considered monowave number one ("ml," see Figure 3-19). The monowaves immediately after ml
Figure 3-19
Past market action
contains mO and additional waves
Future market action
contains m2 and additional waves
will consist of m2 and additional monowaves. The monowaves which occurred immediately before ml
consist of mO and additional waves. Figure 3-19 illustrates how the choosing of any monowave on a chart
mentally creates the relative label "ml" for the chosen monowave.
Figure 3-20a presents the observations required to discover where m2 completed when m2 is a
monowave. Figure 3-20a also demonstrates the importance of breaking either the high or low of ml
before the finalization of m2 can take place. Figure 3-20b presents a similar process which is used in
uncovering the termination of mO. These techniques will be used in the next section, "Retracement
Rules," to calculate the percentage relation of ml to m2, mO to ml, mO to m2, etc.
In Figures 3-20a & 3-20b, mO and m2 were monowaves. Unlike m 1, which must he a monowave (or
a compacted* Elliott wave pattern), mO and m2 can be composed of one (or any odd number) of
monowaves, compacted or uncompacted. The composition of mO and m2 is dependent upon the amount
of market action that takes place within the confines of the high and low of m 1. Using an upward slanting
'Compaction is covered in detail in Chapier 7
Preliminary Analysis 3-15
Figure 3-20a
Current
Future monowave(s)
— High of ml
When high of m 1 broken, m2
confirmed complete at the
lowest point between the high
of ml and the newest high
Low of ml
High of ml
Low of ml
broken during Unless m2 is a compacted wave
formation of m2 group, the first turn-up in price
action (after thebreakofml'slow)
should complete m2.
— -*C— — y* — Low of ml
m2 is complete at this low
m2 is complete at this high
\
— ^ — H'gh of ml
V.
\
■ Unless m2 is a compacted wave
group, the first turn-down in
High of ml P"ce (after the break of mi's
broken during h'gn) should complete m2.
formation of m2
■ Low of ml
— — — — — — — High of ml
m2 confirmed
complete at this high
When low of ml broken, m2
confirmed complete at the
highest point between the low
of m 1 and the newest low
— Low of ml
3-16 Preliminary Analysis
Figure 3-20b
Past monowave(s)
High of ml — r^ — — — — — —
Moving backwards, the last time the
market was above the now established
high of ml, mO would be confirmed
complete at the lowest point between the
high of ml and this older high.
Low of ml
High of ml — —
Moving backwards, the last time the
market was below the now established
low of ml, mO would be confirmed
complete on the turn-up in price
action which preceded the older low.
Low of ml
mO completed at this low
mO completed at this high
High of ml —
Moving backwards, the last time the
market was above the now established
high of ml, mO would be confirmed
complete on the turn-down in price
action which preceded the older high.
/
High of ml
broken during
formation of mO
Low of ml — — — — — — — —
High of ml
Moving backwards, the last time the
market was below the now established
low of ml, mO would be confirmed
complete at the highest point between the,
low of ml and this older bw.
Low of ml —
Current
monowave
Preliminary Analysis 3-17
Figure 3-21a
Past monowave(s)
Future monowave(s)
mg2 is composed
of 5 monowaves
ml for this example, the right-hand side of Figure 3-21 a illustrates what market action after m 1 may look
like when m2 is composed of one or more monowaves. The left-hand side of the same Figure illustrates
what market action before ml may look like when mO is composed of one or more monowaves.
If more than one monowave occurs before die high or low of ml is exceeded, mO and m2 can be
3-18 Preliminary Analysts
Figure 3-21b
Past monowave(s)
Future monowave(s)
Top of
ml exceeded
Top of ml
exceeded
considered (if you prefer) "monowave groups (mg)" and designated mgO and mg2 respectively (study
Figures 3-21a & b). When ml is a monowave, mgO and mg2 will usually consist of no more than five
monowaves, but exceptions can and do occur. To provide you with both perspectives, Figure 3-21a
depicts "ml" as a rising monowave while Figure 3-21b depicts "ml" as a declining monowave.
PreHminarv Analysis 3-19
Figure 3-22a
Past mpnowave(s) Futnre monowave(s)
Occasionally, when implementing the Retracement Rules (which follow this section) to determine the
internal Structure of a monowave, the study of monowaves other than mO or m2 is necessary. Figure 22a,
above, demonstrates the Rules of Observation as they apply to monowaves which occur before mO and
after m2. Careful study of the chart will demonstrate how to determine each monowaves' starting and
stopping points based on the high or low of the monowave before or after the current one.
3-20 Preliminary Analysis
Figure 3-22b
_ Pasl monowayefe) Future monowave(s)
Sometimes, breaking the high or low of ml (or any other monowave) requires the development of
more than one monowave. Figure 3-22b illustrates how m(-2), m(-l), mO, m2, m3 or m4 may be
composed of oneormoremonowaves. Itisimportantto remember thatthetermination of allmonowaves
to the right of ml must break a previous high or low; the termination of all monowaves to the left of
ml must be figured backwards in time based on when they "break" a latter high or low.
Preliminary Analysis 3-21
Before going any further with this chapter, it is imperative you understand the procedures necessary
in obtaining the terminal points of m(-2) through m4. If you do not feel comfortable with these
procedures, continue to study the Rules of Observation until you do; no additional work can be done until
this process is understood.
After you have become proficient at applying the Rules of Observation to actual market action, the
next analytical step involves the application of Ihs Retracement Rules. This will require calculating the
relationship of m2 to ml and mO to ml (on a percentage basis), then deciding which preestablished
relational range the calculated ratio falls within. The m2/ml ratio describes which Rule Identifier
applies to "ml." Then, the mO/ml ratio indicates which alphabetic Condition of each Ruleapplies. Keep
in mind, the Retracement Rules work the same whether ml is slanting upward or downward.
Retracement Rules
r;;:i:V-!;|!;!!!T|!!!!7!!;r;|!|!!|!! !!!!!,!!!|!ri| ! |
WARNING; This section j&QMintended to be readstraight through. If this is yourfirst reading,
skim through to grasp the general ideas, but do not spend much time on the details. The next time
you read this section, have your own chart handy and ready for analysis.
Once you have finalized die terminal points of all monowaves on your chart, you are ready to identify
the specific Retracement Rule which accurately describes the behavior of surrounding monowaves.
[NOTE: Your chart should never be so complicated that this process involves the identification of more
than 20 monowaves at any one time. For the best results (and the maintenance of your sanity), it is
recommended you apply the Rules in Chapter 3 to just a few monowaves of real-time action each day.]
To begin this process, pick the earliest monowave on your chart which you wish to analyze. That
monowave, as described earlier, should mentally be considered m 1 (monowave-1). Applying the Rules
of Observation discussed earlier (see page 3-14), measure the retracement of ml by m2 - in percentage
terms - using the terminal points (dots) of each. These measurements can be made accurately and swiftly
with the aid of a proportional divider set to a 61.8% ratio. Proportional dividers are available from most
engineering supply stores and are highly recommended for die purposes of this section. If you are
performing this procedure more precisely (and tediously) with the aid of an electronic calculator,
measure the vertical price coverage of m2 and divide it by the vertical price coverage of ml. Multiply
the result by 100. The number remaining is the relationship of m2 to ml in percentage terms.
Refer to die table at the top of the next page (titled RULE IDENTIFICATION); in that listing, locate
the relationship just calculated. That listing provides you with a Rule Identifier which represents
particular characteristics of current market behavior. Next, move forward to the heading which matches
your findings (i.e., Rule 1, Rule 2, etc.). Further clarification of the market environment is obtained by
calculating the mO/ml ratio. Measure the price coverage of mO, divide it by mi's price coverage and
multiply the result by 100. Locate thai percentage relationship under the "Conditions" section following
each Rule diagram and translate die mO/ml ratio into a Condition Identifier (lowercase Arabic letter).
When working with Rule 4, you will also be asked for the relationship between m2 and m3; this further
defines market action into Categories (Roman numerals). Finally, these Rules, Conditions and
Categories will, in the "Pre-Constructive Rules of Logic" section, betransformedinlo Structure labels which
reveal the internal (unseen) make-up of the monowaves under analysis.
When you have decided which specific Rule applies to each situation, place those markings at the end
of ml. Write it on your chart in pencil or photocopy the original and write on the copy. An even better
approach requires die use of plastic acetate placed over your chart and drawing on the acetate with a china
marker. When you place a Rule at the end of ml, abbreviate the Rule and its sub-sections to prevent
clutter on your chart (for example, Rule 4, Condition "a," Category "i" should be abbreviated R-4a-i).
3-22 Preliminary Analysis
RULEPENTIFICATION:
If m2's relation to ml is:
less than 38.2%, refer to Rule 1 (below);
at least 38.2%, but less than 61.8%, refer to Rule 2 (page 3-24);
exactly 61.8%, refer to Rule 3 (page 3-25);
between 61.8% and 100% (exclusive), refer to Rule 4; (page 3-26)
at least 100%, but less than 161.8%, refer to Rule 5; (page 3-28)
between 161.8% and 261.8% (inclusive), refer to Rule 6; (page 3-29)
more than 261.8%, refer to Rule 7; (page 3-30).
Rulel (m2 is less than 38.2% of ml)
If ml is retraced less than 38.2% by m2, Rule 1 applies; note that fact at the end of ml (see Figure
3-23). Next, measure the relation of mO to ml as previously described, then find that ratio in the list
below. That will provide you with the "Condition" Identifier (alphabetic companion) which is to be
placed to the right of the Rule Identifier.
Figure 3-23
mO may be any
length from
just above 0%
to beyond
261.8% of ml
Rulel
(activation requirement)
38.2%
*Can be composed of 1, 3,5
or more monowaves
mO may be any
length from
just above 0%
to beyond
261.8% of ml
38.2%
Conditions for Rule 1
Condition "a " -- If mO is less than 61.8% of ml, ml falls under the jurisdiction of Rule 1 a (progress
to Rule 1, Condition "a" of the Pre-Constructive Rules of Logic*).
Condition "b" - If mO is at least 61.8%. but less than 100% of ml, the properties of Rule lb take
effect (move to Rule 1, Condition "b" of the Pre-Constructive Rules of Logic*).
Condition "c" - If mO is hetween 100% and 161.8% of ml (inclusive), Rule lc must be applied
(advance to Rule 1, Condition "c" of the Pre-Constructive Rules of Logic*).
Condition "d" ■■ If mO is more than 161.8% of ml (inclusive), Rule Id should be considered (jump
to Rule 1, Condition "d" of the Pre-Constructive Rules of Logic*).
*The Pre-Constructive Rules of Logic begin on page 3-32
Preliminary Analysis 3-23
Rule 2 (m2 is at least 38.2%, but less than 61.8% of ml)
If m2 retraces at least 38.2%. but less than 61.8% of ml, Rule 2 takes effect (see Figure 3-24). Next,
observe the relation of mO toml to decide which alphabetic Condition Identifier applies. Place that letter
to the right of Rule 2.
Figure 3-24
mO may be any
length from
just above 0%
to beyond
261.8% of ml
R-2
Rule 2
(activation requirement)
♦Can be composed of
3, 5 or more monowaves
mO may be any
length from
just above 0%
to beyond
261.8% of ml
Conditions for Rule 2
Condition "a" - If mO is less than 38.2 % of ml. ml fallsunderthe jurisdiction of Rule 2a (progress
to Rule 2, Condition "a" of the Pre-Constructive Rules of Logic*).
Condition "b" - If mO is at least 38.2%. hut less than 61.8% of ml, the properties of Rule 2b take
effect (move to Rule 2, Condition "b" of the Pre-Constructive Rules of Logic*).
Condition "c"~ Tf mO is af least 61.8%. hut less than 100% of ml. Rule 2e must be applied (advance
to Rule 2, Condition "c" of the Pre-Constructive Rules of Logic*).
Condition "d" - If mO k hrfwmn 100% and 161.8% of ml (inclusive). Rule 2d should be considered
(jump to Rule 2, Condition "d" of the Pre-Constructive Rules of Logic*).
Condition "e" - If mO is more than 161.8% of ml, then Rule 2e is the appropriate (proceed to Rule
2, Condition "e" of the Pre-Constructive Rules of Logic*).
*The Pre-Constructive Rules of Logic begin on page 3-32
3-24 Preliminary Analysis
Rule 3 (m2 is exactly 61.8% of ml)
An exact 61.8% retracement of ml by m2 (see Figure 3-25) establishes the dominance of Rule 3.
When market action activates Rule 3, the structure of ml is the most difficult to decipher since the
retracement of ml is right on the border line of indicating m 1 is more likely corrective or more likely
Impulsive. To further clarify the market environment surrounding ml, calculate the relationship of mO
to m 1 and find that relationship in the listing below to obtain a Condition Identifier for Rule 3.
Figure 3-25
Rule 3
(activation requirement)
mOma)
be any
length from
jusi above 0%
to beyond
261.8% of ml
V t /
%/
\/
R-3
A
f\ '
/ v« /
f \* /
V
*Can be composed
of 1, 3, 5 or more
monowaves
m0 may be any
length from
just above 0%
to beyond
261.8% of ml
R-3
Conditions for Rule 3
Condition "a"-- If mO is less than 38.2% of ml. ml falls under the jurisdiction ofRule 3a (progress
to Rule 3, Condition "a" of the Pre-Constructive Rules of Logic*).
Condition "b" -- If mO is at least 38.2%. but less than 61.8% of ml, the properties of Rule 3b take
effect (move to Rule 3, Condition "b" of the Pre-Constructive Rules of Logic*).
Condition "c"- If mO is at least 61.8%. hut less than 100% of ml. Rule. 3c must he applied (advRnrx.
to Rule 3, Condition "c" of the Pre-Constructive Rules of Logic*).
Condition "d"~ If mOisat least 100%. hut less than lfil.8% of ml. then Rule 3d should he considered
(jump to Rule 3, Condition "d" of the Pre-Constructive Rules of Logic*).
Condition "e" - If mO is between 161.8% and 261.8% of ml (inclusive), Rule 3e is appropriate
(proceed to Rule 3, Condition "e" of the Pre-Constructive Rules of Logic*).
Condition "f - If mO is more than 261.8% of ml, Rule 3f exerts its influence (proceed to Rule 3,
Condition "f" of the Pre-Constructive Rules of Logic*).
*The Pre-Constructive Rules of Logic begin on page 3-32
Preliminary Analysis 3-25
Rule 4 (m2is between 61.8% and 100% [exclusive])
Rule 4 applies when m2 retraces more than 61.8%. but less than 100% of ml. Figure 3-26 gives an
example of this event. Calculate the relation of mO to ml; then, using the list below, locate a Condition
Identifier. Next, measure the percentage retracement of m2 by m3 to obtain a Category Identifier.
Figure 3-26
Rule 4
(activation requirement)
'Can be composed
of 1. 3. 5 or more
monowaves.
100%
Conditions for Rule 4
Condition "a" -■ If mO is less than 38.2% of ml, ml falls under the unique jurisdiction of Rule 4a
(see Rule 4, Condition "a" of Figure 3-27).
Condition " b" - If mO is at least 38.2%. hut less than 100% of ml, then the unusual properties of
Rule 4b take affect (see Rule 4, Condition "b" of Figure 3-27).
Condition "c" -- If mO is at least 100%. hnt less than 161.8% of ml, Rule 4c must be applied (see
Rule 4, Condition "c" of Figure 3-27).
Condition "A" - If mO is herween 161.8% and 261.8% of ml (inclusive), then Rule 4d should be
considered (see Rule 4, Condition "d" of Figure 3-27).
Condition " e" -- If mO is more than 261.8% of ml, then Rule 4e is the most appropriate (see Rule 4,
Condition "e" in Figure 3-27).
Categories for Conditions "a" through "e" of Rule 4
Category i - If m3 is at least 100%. hnt less than 161.8% of m2, then Rule 4?-i is appropriate
(proceed toRule 4, Condition"?" [the one currently in effect], Category "i" of the Pre-
Constructive Rules of Logic*).
Category ii - If m3 is between 161.8% and 261.8% of m2 (inclusive), then Rule 4?-ii takes effect
(proceed to Rule 4, Condition"?" [the one currently in effect], Category "ii" of the Pre-
Constructive Rules of Logic*).
Category iii - If m3 is more than 261.8% of m2, Rule 4?-iii applies (move to Rule 4, Condition"?"
[the one currently in effect], Category "iii" of the Pre-Constructive Rules of Logic*).
*The Pre-Constructive Rules of Logic begin on page 3-32
3-26 Preliminary Analysis
Figure 3-27
Rule 4a
m0 is less than
38.2% of ml
R-4a
mO is at least
38.2%, but less
than 100% of ml
Rule 4b
ulO is at least
38.2%, but less
than HXWS of ml
161.8% of ml-
100% of ml
mOis at least 100% but
less than 161.8% o£ml
Rule 4c
100% of ml --
161.8%ofml--
* s
y. R-4c
\____
mO is at least 100% but
less than 161.8% of ml
261.8% of ml
mO must be between
161.8% and 261.8%
of ml (inclusive)
Rule 4d
Figure 3-27 continued on next page
*In all diagrams
on this page, mO
and m2 can be
composed of 1,
3, 5, or more
monowaves
161.8% of ml
mO must be between
161.8% and 261.8%
of ml (inclusive)
-261.8% of ml
Preliminary Analysis 3-27
Figure 3-27, continued from page 3-27
\
V
\
\
a
261.8% of ml
~ mO must be more
•^ than 261.8% of ml
R-4e
N, ■
Rule 4e
*Can be composed of
1.3. 5 or more monowaves
mO must be more
than 261.8% of ml
-261.8% of ml
Rule 5 (m2 is at least 100%, but less than 161.8% of ml)
For Rule 5 to be activated, ml must be retraced at least 100%. hut less than 161.8% by m2 (see Figure
3-28). Once that requirement has been met, you must observe the relationship of mO to ml. Find that
relationship in the list below to determine the Condition Identifier which should be attached to Rule 5.
Figure 3-28
mO may be any
length from
jusl above 0%
to beyond
261.8% of ml
V 1
■*/
'%/
\/
R-S
A
A
/ \
f
\
%
-A-
\
\
i
i
f
Rule 5
(activation requirement)
A
*Can be / \
1,3, Sormore J= /\ / ?
monowaves ^ -' \ $ *
A V /*
■ \\/
- 100% ■ m0 may be any V?
length from »_r
just above 0%
to beyond ~
261.8% of ml
Conditions for Rule 5
Condition "a" — If mO is less than 100% of ml, then Rule 5a is activated; make note of that at the end
of ml (progress to Rule 5, Condition "a" of the Pre-Constructive Rules of Logic*).
Condition " b" - If mO is at least 100%. hut less than 161.8% of ml; then the properties of Rule 5b
take effect (move to Rule 5, Condition "b" of the Pre-Constructive Rules of Logic*).
Condition " c" -- If mO is between 161.8% and 261.8% of ml (inclusive), Rule 5c must be applied
(advance to Rule 5, Condition "c" of the Pre-Constructive Rules of Logic*).
Condition "d" - If mO is more than 261.8% of ml. the unique circumstances (explained later in this
chapter) implied by Rule 5d should be upheld (jump to Rule 5, Condition "d" of the
Pre-Constructive Rules of Logic*).
*The Pre-Construaive Rules of Logic begin onpage 3-32
3-28 Preliminary Analysis
Rule 6 (m2 is between 161.8% and 261.8% of ml [inclusive])
For Rule 6 to be activated, ml must be retraced between 161.8% and 261.8% (inclusively) by m2
(Figure 3-29). Next, measure the relationship of mO to ml; making use of the table below, this will allow
you to decide the "Condition" of current market action.
Figure 3-29
261 .8%.
of ml
"Can be composed of
1,3,5 or more monowaves
mO could be any length
from just above 0% to
beyond 261.8% of ml
161.8%.
of ml
A
9/
\%
mO could be any
from just above
beyond 261.8%
length
0%to
of ml
R-6
16_1.8%_
of ml
Ik
?/
Rule 6
(activation requirement)
26L8%_
of ml
Conditions for Rule 6
Condition "a" -- If mO is less than 100% of ml, Rule 6a should be implemented (progress to Rule 6,
Condition "a" of the Pre-Constructive Rules of Logic*).
Condition " b" - If mO is at least 100%. but less than 161.8% of ml, then the properties of Rule 6b
take effect (move to Rule 6, Condition "b" of the Pre-Constructive Rules of Logic*).
Condition " c" -- If mO is between 161.8% and 261.8% of ml (inclusive), Rule 6c must be applied
(advance to Rule 6, Condition "c" of the Pre-Constructive Rules of Logic*).
Condition " d" - If mO is more than 261.8% of ml, then Rule 6d is activated; make note of that at the
end of ml (jump to Rule 6, Condition "d" of the Pre-Constructive Rules of Logic*).
*The Pre-Constructive Rules of Logic begin on page 3-32
Rule 7 (m2 is more than 261.8% of ml)
For Rule 7 to be activated, ml must be retraced more than261.8% bvm2 (Figure 3-30). Next, measure
the relationship of mO to ml, studying the table on the next page, you can decide the "Condition" of
current market action (also, see Figure 3-30 on the next page).
Preliminary Analysis 3-29
Figure 3-30
mO can be any length
from just above 0% to
beyond 261.8% of ml
_26L8%_
of ml
*Can be composed
of 1,3,5or more
monowaves
R-7
mO can be any length
from just above 0% to
beyond 261.8% of ml
Rule 7
(activation requirement)
2sns%_
of ml
Conditions for Rule 7
Condition " a" -- If mO is less than 100% of ml, Rule 7a should be implemented (progress to Rule 7,
Condition "a" of the Pre-Constructive Rules of Logic*).
Condition "b" - If mO is at least 100%. hut less than 161.8% of ml, then the properties of Rule 7b
take effect (move to Rule 7, Condition "b" of the Pre-Constructive Rules of Logic*).
Condition "c" -- If mO is between 161.8% and 261.8% of ml (inclusive). Rule 7c must be applied
(advance to Rule 7, Condition "c" of the Pre-Constructive Rules of Logic*).
Condition " d" -- If mO is more than 261.8% of ml, then Rule 7d is activated; make note of that at the
end of ml (jump to Rule 7, Condition "d" of the Pre-Constructive Rules of Logic*).
*The Pre-Constructive Rules of Logic begin on page 3-32
When you have completed the Rule identification process for the current ml, move to the next
monowave in the sequence (which previously was m2), make that monowave the new m 1 and restart the
Rule identification process from that new point. If you have identified all of the monowaves on your chart
which you feel are important at this time, proceed to the "Pre-Constructive Rules of Logic" heading and
begin transforming the Rules at the end of each monowave into usable Structure labels.
Graphical Summary of Retracement Rules
After becoming familiar with the ideas presented in this section, the diagrams on the next two pages
should simplify tUeRule and Condition identification process for you. To implement, first measure m2's
retracement of ml in percentage terms, then find that retracement value within one of the relational
ranges along m2's ray under the Rule Identification diagram (since m2 occurs after m 1 in time, m2's ray
extends to the right). Jot down the abbreviated Rule which is activated by that retracement range, Once
a Rule has been identified, the conditions which surround ml should be clarified. Move to the Condition
Identification diagram specifically designed for the Rule currently in effect. This time the ray will
represent mO (the wave before ml), therefore it extends to the left. Locate the alphabetic Condition
associated with the relational value you measured between mO and m 1. Once this information has been
obtained, move to the section possessing the same name under the Pre-Constructive Rules of Logic.
3-30 Preliminary Analysis
Rule Identification
iu2
— Percentage relationship of m2 to ml - -
0 .382 .618 1.00 1.618
2.618
R-l
ml #-
R-3
6 6-^-6
- Length of m 1 - -
R-6
6-h^
Condition Identification for Rule 1
- Percentage relationship of mO to ml - -
1.618 1.00
.618
-Length of ml -
mO
-# ml
Condition Identification for Rules 2 and 3
2.618
- Percentage relationship of rnO to ml - - -
1.618 1.00 .618 .382 0
mO
(Rule 3
only)
J^'d" (Rule3only)^
e (Rule 3 only)
-0
^|'d"(Rule2only)^
iii.ii i
6 c » 6—^-0
-Length of ml - -
-% ml
Preliminary Analysis 3-31
Condition Identification for Rule 4
2.618
— Percentage relationship of mOio ml •
1.618 1.00
382
-- Length of ml -
Condition Identification for Rules 5,6 and 7
4 ml
^
-<-
2.618
"d" ,
^
k
- - - Percentage relationship of mO to m 1 —
1.618 1.00
<
£ i
J 1
5—
0
"a"
— c
-Length of ml ■
mO
-+ ml
Pre-Constructive Rules of Logic
!i:ilT|!!H!'!'!!T!l'!!!!||]|!!l!|!||!!||!!!'!!||lll!!!!!l MM
The purpose of the "Pre-Constructive Rules of Logic" section is to provide Structure Labels to
replace the Rules you established earlier for each analyzed monowave. All Rules (including their
Condition Identifiers) are listed over the next 26 pages. Under each Rule are numerous paragraphs
separated into retracement values based on the length of mO, m2 or m3. These paragraphs query you on
circumstances unfolding in real-time on your chart. Based on your input regarding market conditions,
specific suggestions will be made on the most appropriate Structure Label(s) for each monowave and a
guess is usually made on the most likely Elliott pattern unfolding around m I. These Structure labels
indicate all possible locations a monowave can occur within an Elliott Wave pattern (simple or complex).
Sometimes it is recommended a Structure label be surrounded byparentheses or brackets. If this situation
develops on your real-time chart, those Structure labels in brackets represent rare or extremely unlikely
possibilities. Structurelabels surrounded byparentheses simply havealower probability of beingcorrect
than those which possess no encasement (i.e., no parentheses or no brackets).
3-32 Preliminary Analysis
To understand and make complete use of Chapter 3, at least a cursory knowledge of all chapters from
1 through 8 (inclusive) is required. If you are still in the early stages of your Elliott Wave learning curve,
many concepts and techniques (not as yet explained) will be suggested for use in this section which you
do not understand completely or have no working knowledge of. For this reason, become familiar with
these other chapters before attempting any analysis which is backed by capital investment. The Elliott
Wave Theory is such a maze of interlocking, interdependent concepts that an understanding of only
portions of the Theory is insufficient for accurate forecasting. The inherently complex nature of the
Wave Theory makes it impossible to confidently apply the prognosticative techniques discussed in this
section without some awareness of the general principles which guide wave pattern development.
After reading the book through the end of Chapter 8, return to Chapter 3 and begin the analysis
process; you will then be better equipped to understand and apply the ideas presented. For those still
becoming familiar with general Elliott Wave concepts, this section is designed to speed your learning
curve by providing you with expert counseling on Wave analysis until you become proficient at the
process. Furthermore, applying the Pre-Constructive Rules of Logic is a great way to learn of the
numerous observations and measurements required to properly dissect market action.
It is not recommended you begin your analytical "baptism of fire" by constructing a highly detailed
chart and attempting to analyze every wave. Construct a short-term chart and begin with the current day,
applying the rules one wave at a time and updating your chart and analysis regularly with daily data. This
approach will allow careful consideration of each Rule as it applies to specific situations. Applying the
Pre-Constructive Rules of Logic in this fashion should minimize the tedium of repetitious application
and the chances of analytical error possible when dealing with such extensive relational calculations.
WARNING: This section should NOT be read straight through. The instructions which follow
will only make sense, and be useful, when applied in conjunction with real-time market action. If
you currently do not have a chart to analyze or this is your first time reading this section, scan
through it then proceed to - and scan - the "Implementation of Position Indicators" (page 3-60).
Transformation of Rule Identifiers
The reliable application of Structure labels to replace Rule Identifiers usually requires the study of
price action before and after ml. If ml is the first monowave on your chart, there is no previous market
action to help you indirectly decide on the internal Structure of m 1. Therefore, simply place the entire
Structure list, which appears immediately to the right of each new Rule section, at the end of this first
monowave. For example, to the right of Rule 1 (turn page to see listing) appears the Structure list (:5/
(:c3)/(x:c3)/[:sL3]/[:s5]). If ml is the first wave on your chart, place that entire list at the end of ml.
Warning: Do not apply these Rules to Compacted patterns which exceed their own beginning;
retain only the pattern's base Structure. Refer to the top of page 3-68 for a lull discussion of this
concept. Figure 3-36 on the same page illustrates this behavior. If conditions on your chart are not
anticipated under the appropriate Rule section, please verify you are working with the correct Rule and
then make sure you reread the conditions necessary to activate that Rule. If ml is a monowave and you
still find there are no stipulations for the conditions on your chart, use the entire Structure list next to the
Rule heading of each section. If ml is a compacted polywave (or higher) pattern and you, again, find
no stipulations for the conditions on your chart, move on to the section entitled "Implementation of
Position Indicators" (page 3-60) and use surrounding Structure labels to decide which Position Indicator
- if any - belongs in front of mi's compacted Structure label (i.e., in front of ":3" or ":5").
Remember, all time and price calculations should be made from termination points (the dots used
earlier to identify the end of each wave); this applies whether working with monowaves or compacted
Preliminary Analysis 3-33
wave groups. If measurement is required to test the validity of a statement and the statement does not
specifically mention whether to measure price or time, price is always implied. Furthermore, do not take
these relationships so seriously that you eliminate a possibility just because a particular wave was 60%
of ml when it was supposed to be"atleast61.8% of ml." All specific ratios mentioned in this text (such
as 61.8%, 161.8%, etc.) must be given a slight range of error. When two patterns relate by 61.8%, that
means the smaller of the two may be anywhere from approximately 58% to 66% of the larger wave. This
provides about four (4) percent leeway either side of an ideal Fibonacci relationship. Finally, the phrase
"almost" and "close to" used throughout this section translate to "within 10% of the ratio mentioned."
For the same reasons that relationships between waves cannot always be expected to behave
perfectly, when following the guidelines listed in this section, if all conditions except one are
scrupulously adhered to (and the one which is not followed is off by just a little), you should probably assume
the rules were correctly followed and place the suggested Structure label or list at the end of ml. This
is all part of the Exception Rule discussed in Chapter 9, page 7.
On the other hand, time calculations which involve retracement of previous patterns must be taken
precisely as written. For example, many times throughout this section you will find something like this;
"if ml (plus one time unit) is retraced completely in the same amountof time thatit took to form (or less),"
that statement must be taken literally. In this case, you would add one standard time unit (the time
consumed from one data point to the next) to the number of time units consumed by ml, then compare
that larger amount to die number of dme units taken by m2 to completely retrace the length of ml. If
the two numbers are equal or if ml is a larger number, the statement above is true. If m2, after such
proceedings, is a larger number than ml, the statement above would be false.
The greatest technical and analytical value is derived from this section when the Rules are applied
to monowaves. When returning to mis section for reassessment of a confirmed, Compacted Elliott
pattern, the primary purpose in applying the Rules is to detect the presence of "missing" waves. During
this reassessment, if none of the conditions listed (under the appropriate section) agree with the base
Structure of the compacted pattern, the compactedpattern might be missing a wave (page 12-34 discusses
this phenomenon). Encase those choices which do not agree with the base Structure of the compacted
pattern within squares. This provides you with a warning which should only be taken seriously if it is
later found that the compacted pattern cannot be adjoined acceptably to any surrounding monowaves or
wave groups. During reassessment, if you find that the Structure labels suggested by mis section do not
allow you to connect the compacted pattern with surrounding price action, assume the pattern is part of
a Complex formation. If trying to reassess a compacted pattern and you find none of the conditions listed
under the appropriate section apply to the pattern, place all Structure labels listed next to the Rule heading
and encase those labels which disagree with the base Structure of the pattern within squares.
At the beginning of each Rule section, the chart used during the Rule Identification process earlier
has been duplicated for your convenience. It will probably help to glance at these diagrams as you read
the directions, comparing your real-time chart with the prescribed action. The first sentence of each of
the paragraphs to follow is the most important. If the conditions described in the first sentence are not
reflected in the actual market action, move on to the next paragraph (unless otherwise directed). If the
first sentence of a paragraph accurately describes the market action you are analyzing, always read the
rest of the entire paragraph. Some of the sentences which follow are very lengthy and contain many
conditions. Usually, all parameters enumerated in one sentence must be adhered to for the Structure list
to apply. Carefully read each sentence while comparing the statements to your chart and apply those
Structure labels to the end of those monowaves which it directs you to. Sometimes you will be trying
to analyze ml, but the section will direct you to place Structure or Progress labels or both at the end of
mO, m2 or other waves other than ml; those directions are not misprints, place those labels as directed.
3-34 Preliminary Analysis
mO may be any
length from
jusl above 0%
to beyond
261.8% of ml
Rulel
(activation requirement)
38.2%
Can be composed of 1, 3,5
or more monowaves
mO may be any
length from
just above
to beyond
261.8% of m
38.2%
Rulel {:5/(:c3)/(x:c3)/[:sL3]/[:s5]}
Condition "a" -- ifmO is less than 61.8% of ml
If m2 takes the same amount of time (or more) as ml OR m2 takes the same amount of time (or more)
as m3, place a ":5" at the end of ml. If the length of m(-l) is between 100-161.8% (inclusive) of mO and
mO is very close to 61.8% of ml and m4 does not exceed the end of mO, m 1 may complete a Flat pattern
within a Complex formation where m2 is an x-wave (xx3); place ":s5" at the end of ml. Read through
the rest of this section to see what other possibilities could be unfolding.
If mO is composed of more than three monowaves and m 1 retraces all of mO in the same amount of
time (or less) that mO took to form, mO is probably the end of an important Elliott pattern; note on chart.
If mO and m2 are approximately equal in price and time (or related by 61.8% in either case) and
m(-l)is 161.8% (or more) of ml and m3 (or m3 through m5) achieves a price length equal to or greater
than m(-1) within a time frame equal to or less than mat of m(-l), a Running Correction (any variation)
is probably unfolding; take note of that fact and add "[:c3]" after the ":5" already at the end of ml. If the
Running correction is a simple variation, it most likely started at the beginning of mO and concluded at
the end of m2 with ml the "b-wave" of the correction. For die Running Correction to be of the complex
Double Three variety, m(-2) must be shorter than m(-1); in that case, the formation probably started with
m(-2) and concluded with m4 making ml the "x-wave" of the formation (x:c3). Read the next paragraph
to be aware of any additional or unusual circumstances which could evolve under these conditions.
If mO and m2 are approximately equal in price and time (or related by 61.8% in either case) and
m(-l) is less than 161.8% of ml and m(-l) is larger than mO and m3 prm5 is 161.8% of ml (or more),
a Running Correction (any variation), which concludes more than one pattern, might be under formation;
note that fact and add" :c3" after the ":5" already at the end of ml. If m(-2) is longer than m(-1), go back
to what is currently m(-l) and add ":sL3" to its Structure list. If the Running correction is a simple
variation, it most likely started at the beginning of mO and concluded at the end of m2 with ml the "b-
wave" of the correction. For the Running Correction to be of the complex Double Three variety, m(-2)
must be shorter than m(-1) and m3 must not be more than 161.8% of ml; under those specific conditions,
the formation probably started with m(-2) and concluded with m4 making ml the "x-wave" of the
formation (add an "x" in front of the ":c3").
Preliminary Analysis 3-35
If mO and ml are approximately equal in price and time (or related by 61.8% in either case) and m3
is less than 161.8% of ml andm3 (plus one time unit) is completely retraced in the same amount of time
(or less) that it took to form, ml may be part of a Complex Correction which will necessitate the use of
an "x-wave" Progress label. The x-wave would be in one of two places; the end of mO or hidden from
sight (i.e., invisible or "missing") in the center of ml. This concept of "missing waves" is discussed in
Chapter 12, page 12-34. To warn of these two possibilities, take apencil and place an "x:c3?" at the end
of mO. Also, circle the center of ml and, to the right of the circle, place "x:c3?," to the left place ":s5."
If m(-2) is longer than m(-1), the x-wave is not at the end of mO, drop that as a possibility. If the length
of m3 is less than 61.8% of ml, the probabilities increase dramatically that the x-wave is hidden in the
center of ml. These warnings will come in helpful as you group monowaves in Chapter 4 and as you
finalize your interpretation throughout the analysis process. If the x-wave is used, the previously placed
":5" Structure label applies.
If mO and m2 are obviously different from each other in price or time or both and mO and m2 do not
share any similar price range and ml, when compared to m(-1) and m3, is not the shortest of the three,
ml may be part of a larger Trending Impulse pattern; if so, the previously placed ":5" is used.
Condition "b " - if mO is at least 61.8%, but less than 100% of ml
Place a ":5" at the end of ml. If the length of m(-l) is between 100-161.8% (inclusive) of mO and
m4 does not exceed the end of mO, ml may complete a Flat pattern within a Complex formation where
m2 is an x-wave; place ":s5" at me end of ml and "x:c3?" at the end of m2. Additional Structure labels
may be needed if certain behavior is exhibited by the price action. Read the below descriptions to decide
if any additional Structure labels should be added.
If mO is composed of more than three monowaves and ml (minus one time unit) retraces all of mO
in the same amount of time (or less) mO took to form, mO might conclude an important Elliott pattern.
If part of m2's price range is shared by mO and m3 is longer and more vertical than ml during a time
span equal to (or less than) ml and m(-l) is longer than ml, add ";sL3" to mi's Structure list.
if part of m2's price range is shared by mO and m3 is longer and more vertical than m 1 during a time
span equal to (or less than) ml and m(-l) is shorter than ml and mO and m2 are obviously different in
price or time or both and m4 (or m4 through m6) returns to the beginning of ml in a time period 50%
of that consumed by ml through m3, a 5th Extension Terminal pattern may have completed with m3;
add ":c3" to mi's Structure list.
If m3 is shorter than ml and part of m2's price range is shared by mO and m(-l) is longer than mO
and ml, when compared to m(-l) and m3, is not the shortest of me three and from the end of m3, the
market returns to the beginning of m 1 (or beyond) in a span of time which is 50% or less of that consumed
by m(-l) through m3: place ":c3" at the end of ml.
Condition"c" - ifmO is between 100% and 161.8% of ml (inclusive)
Place a" :5" at the end of m 1. Read the below descriptions to decide if any additional Structure labels
should be added.
If mO and ml are approximately equal (allow for 10% leeway) in price and mO and ml are equal or
related by 61.8% in time and m3 is longer and more vertical than ml and m2 takes at least as much time
as mO or ml and m2 is very close to 38.2% of ml and one of mO's Structure label choices is ":F3," then
add "[:c3]" to the Structure list for ml. For ":c3" to be a good choice, it is preferable m2 terminate at an
important Fibonacci price level to mO, ml or the previous Impulsive wave (monowave or higher). Keep
in mind that a" :c3," even under these conditions, is still a risky choice (that is the re ason for the brackets
which surround it).
3-36 Preliminary Analysis
If m3 is longer and more vertical than ml and either m3 is completely retraced OR m3 is retraced
no more than 61.8% and m2 is very close to38.2%of ml and one of mO's Structure label choices is ":c3"
and m(-3) is longer than m(-2) and m(-2) or m(-l) is longer than mO, ml may be the second-to-last leg
of a ContractingTriangle; add "(:sL3)" to the Structure list. Keep in mind that an ":sL3," even underthese
ideal conditions, is still a less likely Structure label than the ":5" placed earlier (that is the reason for the
brackets which surround iL).
Condition"d" - ifmO is more than 161.8% of ml
There is only one possibility under these circumstances, place a ':5" at the end of ml.
m0 maybe any
length from
just above 0%
to beyond
261.8% of ml
Rule 2
(activation requirement)
*Can be composed of
1, 3, 5 or more monowaves
mO may be any
length from
just above 0%
to beyond
261.8% of ml
R-2
Rule 2 {:5/(:sL3)/[x3]/[:s5]}
Condition "a" -- ifmO is less than 38.2% of ml
Placea":5"attheendofml. If m4does not exceed theendofmO, ml may becompletinga Corrective
pattern within a Complex formation where m2 is an x-wave; place ":s5" at the end of ml and "x:c3?" at
the end of m2. When comparing m(-l), ml andm3, if ml is not the shortest of the three and the longest
of the three is close to (or greater than) 161.8% of the next longest and m3 is retraced at least 61.8%, the
market may be forming an Impulse pattern with ml the center phase (wave-3). For additional Structure
label possibilities which may pertain to ml, read the rest of this section.
If mO is composed of more than three monowaves and ml retraces all of mO in the same amount of
time (or less) that mO took to form, mO is probably the end of an important Elliott pattern.
If mO and m2 are related by 61.8% in price and equal or related (by 61.8%) in time and m(-l) is
161.8 % or more of m 1 and m3 (and any additional monowaves required) achieves a price length longer
than m(-l) within a time frame equal to or less than m(-l), a Running Correction (any variation) is
probably unfolding; take note of that fact and add" [:c3]" after the" :5" already at the end of m 1. The
Running correction most likely started at the beginning of mO and concluded at the end of m2. When you
begin grouping your Structure labels in Chapter 4, work on the Running Correction as the first possibility
with the ":c3" either wave-b of a Running Correction or wave-x of a Double Three Running Correction.
Read on to be aware of additional circumstances possible at this juncture.
Preliminary Analysis 3-37
If mO and m2 are approximately equal in time and m3 is less than 161.8% of m 1 and m(-1) is longer
than mO, ml might be part of a Complex Correction which will necessitate the use of an "x-wave"
Progress label. The x-wave will be in one of threeplaces; if m(-2) is shorter than m(-1), the x-wave might
be at the end of mO; if m4 is no more than 161.8% of m3, the x-wave may be at the end of m2; or, if mO
is no more than 50% of ml and ml is the longest when compared to m(-l) and m3, the x-wave may be
hidden from sight (i.e., invisible or missing) in the center of ml. To warn of the three possibilities, take
apencil and place an "x:c3?" at the end of mO, the end of m2 and, if appropriate, the center of ml (using
acircle to mark the center of ml). The "missing" x-wave in the center of ml is the least likely of the three
choices under these circumstances. [The concept of "missing waves" is discussed in Chapter 12, page
12-34.] NOTE: The x-wave can occur in only one of the three places mentioned. If the x-wave concept
is used at one point, erase the other two possibilities. These warnings will come in helpful as you group
monowaves together in Chapter 4 and as you finalize your interpretations throughout the analysis
process. The x-wave possibility makes use of the ":5" Structure label which should already be in place
at the end of ml.
If m(-l) is longer than mO and mO is shorter than ml and ml, when compared to m(-l) and m3, is
not the shortest of the three and m3 (plus one time unit) is completely retraced in the same amount of
time (or less) that it took to form, ml may be wave-3 of a Terminal Impulse pattern; place ":c3" at the
end of ml.
Condition "b" -- ifmO is at least 38.2%, but less than 61.8% of ml
Place a ":5" at the end of ml, if m4 does not exceed the end of mO, ml may complete a Corrective
pattern within a Complex formation where m2 is an x-wave; place ":s5" at the end of ml and "x:c3?" at
the end of m2. Read through the rest of this section to see what other possibilities could be unfolding.
If mO is composed of more than three monowaves and m 1 retraces all of mO in the same amount of
time (or less) that mO took to form, mO is probably the end of an important Elliott pattern.
If mO and m2 are approximately equal in price and time (or related by 61.8% in either case) and the
monowave before mO is 161.8% or longer than ml and if m3 (and any additional monowaves that are
required) achieves a price lengm longer than m(-1) within a time frame equal to or less than m(-1), then
a Running Correction (any variation) is probably unfolding; take note of that fact and add "[:c3]" after
the ":5" already at the end of ml. The Running correction would most likely start at the beginning of mO
and conclude at the end of m2. When you begin grouping your Structure labels in Chapter 4, work on
the Running Correction as the first possibility with the ":c3" either wave-b of a Running Correction or
wave-x of a Double Three Running Correction. Read the next paragraph to be aware of any additional
or unusual circumstances which could evolve under these conditions.
IfmO and m2 are approximately equal in price and time and m3isnot 161.8% (or more) of ml and
m3 (plus one time unit) is retraced completely by m4 faster than m3 took to form, ml may be part of a
complex correction which will necessitate the use of an "x-wave" Progress label. The x-wave will be
in one of three places; the end of mO, the end of m2 or hidden from sight (i.e., invisible or missing) in
the center of ml. [The concept of "missing waves" is discussed in Chapter 12, page 12-34.] To warn
of these three possibilities, take a pencil and place an "x:c3?" at the end of mO, the end of m2 and me center
of ml (using a circle to mark the center of ml). As die length of m3 drops below 61.8% of ml, the
probabilities increase dramatically that the x-wave (if it exists) is hidden in the center of ml. These
warnings will come in helpful as you group monowaves together in Chapter 4 and as you finalize your
interpretation throughout the analysis process.
If part of the price range of m2 is shared by mO and mO and m2 differ by at least 61.8% in time and
if ml is not the shortest wave when compared to m3 and m(-l) and after m3, the market quickly returns
3-38 Preliminary Analysis
to the beginning of ml, there is a chance ml is an ":sL3" which is part of a Terminal pattern; jot down
that fact and add ":sL3" to the Structure list.
Condition"c" - ifmO is at least 61.8%, but less than 100% of ml
Under all circumstances, place ":5" at the end of ml. If m4 does not exceed the end of mO, ml may
complete a Hat pattern within a Complex formation where m2 is an x-wave; place ":s5" at the end of ml
and "x:c3?" at the end of m2. Other possibilities could be unfolding, read the rest of this section to make
sure no additional possibilities are missed. If the ":5" is used as the preferred Structure label, it may be
the end of aZigzag within a Running or Irregular Failure Flat correction OR part of a Complex correction
where wave-x is at the end of mO or m2 (add "x:c3?" to the end of mO). If considering the Complex
scenario, for the x-wave to work in the mO position, m(-2) must be shorter than m(-1) and it is extremely
likely m(-4) would be larger than m(-3). For the x-wave to work in the m2 position, it is extremely likely
m(-2) would be longer than m(-1). Furthermore, for the x-wave to work in the m2 position, m 1 must be
at least 38.2% of m(-l) with it preferable ml be 61.8% ormore of m(-l). Record these facts and classify
them based on their proper Chronological label.
If m(-l) is larger than mO, but less than 261.8% of ml and m3 is shorter than ml and after m3, the
market quickly returns to the beginning of ml (or beyond), a Terminal may have completed with m3;
place ":c3" at the end of ml.
IfmO is composed of more than three monowaves and ml retraces all of mO in the same amount of
time (or less) that mO took to form, mO probably ends an important Elliott pattern; note that on chart.
If m2 (plus one time unit) is completely retraced in the same amount of time (or less) that it took to
form and m3 is longer and more vertical than ml and m(-l) is not more man 161.8% of ml, a Running
Triangle may have terminated wim m2; place " :sL3" at the end of ml. If the thrust out of the Triangle
(m3) is completely retraced by m4 faster than it took to form, the Triangle is of the Limiting variety. If
m3 is not completely retraced by m4 0_B m4's slope is much less than m3's and m4 is completely retraced,
the Triangle is probably of the Non-Limiting variety or m3 will become pan of a five segment Terminal
formation.
If m3 and m(-l) are both at least 161.8% of ml, an Irregular Failure may have completed with m2;
place ":c3" at the end of ml.
Condition"d" — ifmO is between 100% and 161.8% of ml (inclusive)
If m2 takes the same amount of time (or more) as ml 0_B m2 takes the same amount of rime (or more)
as m3, place a ":5" at the end of ml; other possibilities could be unfolding, read the rest of this section
to make sure no possibilities are overlooked.
If m2 (plus one time unit) is completely retraced in the same amount of time (or less) that it took to
form and m3 is longer and more vertical than ml and mO and ml consume a similar amount of time
(within a 61.8% tolerance) and m2 is at least 61.8% of the time of mO or ml and mO is no more than
138.2% of ml, then a severe "C-Failure" Flat may have concluded with m2; place ":c3" at the end of ml.
If m3 is longer and more vertical than ml and either m3 is completely retraced OR m3 is retraced
no more than 61.8% and one of mO's Structure label choices is ":c3" and mT,-3) is longer than m(-2) and
m(-2) or m(-l) is longer than mO, ml may be the second-to-last legof a Contracting Triangle; add "(:sL3)"
to the Structure list.
If m3 is shorter than ml and m3 is retraced at least 61.8% and ml takes less time than mO and m2
takes just as much time (or more) as ml, then ml is probably part of a Zigzag which concludes with m3;
put a ":5" at the end of ml.
Preliminary Analysis 3-39
Condition' 'e" -- ifmO is more than 161.8% of ml
No matter what the circumstances, a" :5" is a very likely Structure label for ml; place ":5" at die end
of ml. If m3 is shorter and less vertical than ml, the ":5" is the only plausible choice.
If m2 (plus one time unit) is completely retraced in the same amount of time (or less) that it took to
form and m3 is longer and more vertical than ml and m(-l) does not share any similar price territory
with ml, the market may have completed a Complex Correction at m2 with a "missing" x-wave in the
middle of mO; add ":c3" to the current Structure list of ml, place a dot in the center of mO (around the
same price level ml completed) and place "x:c3?" to the right of die dot and ":5" to the left of the dot.
mO maj
be any
length from
jusl above 0%
to beyond
261.8% of ml
V '
y
' /
% /
\ /
R-3
A
/ \
/ \
\
rli
/
J
-V
*Can be composed
of 1,3,5
armore
monowaves
Rule 3
(activation requirement)
/
Rule 3 {:F3/:c3/:s5/:5/(:sL3)/L:L5J}
Condition"a" - ifmO is less than 38.2% of ml
If m3 is more than 261.8% of ml, ml most likely is the center portion of a Running Correction, but
it could also be the end of a Zigzag within a Complex Correction; place ":c3/(:s5)" at the end of ml to
show these two possibilities respectively. Ifml is the longest when compared to m(-l) andm(-3)and
m2 breaks a trendline drawn across the low ofm(-2)andm0 in a period of time equal to or less than that
taken by ml,ml may be the 5fh wave of a 5 th Extension pattern; add[:L5] to the end of ml. If m(-l)
is more than 161.8% of ml, drop ":s5" from the list. If m(-l) is less than 61.8% of m3, more than one
Elliott pattern (each of a larger magnitude) may have completed at m2.
If m3 is between 161.8 and 261.8% (inclusive) of ml, ml may be the center portion of an Impulse
pattern with a 5th wave Extension, the center portion of a Running Correction, or the first leg of an Elliott
pattern within a Complex Correction; place M:s5/:c3/:F3" at the end of ml to list these three possibilities
in their respective order. If ml is the longest when compared to m(-l) and m(-3) and m2 breaks a
trendline drawn across the low ofmf-llandmO in a period of time equal to or less than that taken by ml,
ml may be the 5th wave of a 5th Extension pattern; add [:L5] to the end of ml. If m(-l) is longer than
m3, drop ":c3" from the Structure list. If m(-l) is longer than ml, the ":s5" (if used for ml) could only
be the c- wave of a Zigzag within aComplex Correction; m2 would be an x-wave which is thenmost likely
followed by wave-a of a Contracting Triangle.
3-40 Preliminary Analysis
If m3 is at least 100. but less than 161.8% of ml. ml may he the first leg of a Standard F.llintt pattern
within a Complex Correction, wave-3 of an Impulse pattern with a 5th-wave Extension or the c-wave
of a Zigzag within an ongoing Complex Correction; place ":F3/:5/:s5" at the end of ml to show these
three possibilities respectively. If ml is the longest when compared to m(-l) and m(-3) and m2 breaks
a trendline drawn across the low of m(-2) and mO in a period of time equal to or less than that taken by
ml, ml may be the 5th wave of a 5th Extensionpattern; add [:L5] to the end of ml. If m4 is smaller than
m3, drop ":F3" from the Structure list. IfmO simultaneously takes less time than m(-l)andml, drop ":s5"
from the list. If m(-l) is longer than ml and the ":s5" is used, ml could only he the c-wave of a Zigzag
within a Complex Correction; m2 would be an x-wave.
If m3 is shorter than ml and m3 is completely retraced faster than it took to form, an Impulsive or
Complex Corrective pattern may have concluded with m3; place ":5/:F3" at the end of ml. Ifml is the
longest when compared to m(-1) and m(-3) and m2 breaks a trendline drawn across the low of m(-2) and
mO in a period of time equal to or less than that taken by m 1, m 1 may be the 5lh wave of a 5th Extension
pattern; add [:L5] to the end of ml.
If m3 is shorter than ml and m3 is completely retraced slower than it took to form, ml concludes
a Zigzag which is part of a Complex Corrective pattern; place ":s5" at the end of m 1. If m 1 is the longest
when compared to m(-1) and m(-3) and m2 breaks a trendline drawn across the low ofmf-2)andm0 in
a period of time equal toor less than that taken by ml, ml may be the 5th wave of a5th Extension pattern;
add [:L5] to the end of ml.
If m3 is shorter than ml and m4 is shorter than m3, ml may have completed a Zigzag which is part
of a Complex Correction or is part of a Terminal Impul se pattern; place ":s5/:F3" at the end of m 1 to show
these two possibilities, respectively. Ifml is the longest when compared to m(-l) and m(-3) and m2
breaks a trendline drawn across the low ofm(-2)andm0 in a period of time equal to or less than that taken
by ml, ml may be the 5th wave of a 5th Extensionpattern; add [:L5] to the end of ml. Ifm5 is longer
than m3, drop ";F3" as a possible Structure label.
Condition "b" - ifmO is at hast 38.2%, but less than 61.8% of ml
Ifm3 is more than 261.8% of ml. ml most likely is the center portion of an Irregular Failure, but it
could also be the end of a Zigzag within a Complex Correction; place ":c3/(:s5)" at the end of ml to show
these two possibilities respectively. If m(-l) is more than 161.8% of ml, drop ":s5" from the list. If
m(-1) is less than 61.8% of m3, more than one Elliott pattern may have completed at m2 (each of a larger
magnitude).
If m3 is between 161.8 and 261.8% (inclusive) of ml, ml may be the center portion of an Irregular
Failure, the c-wave of a Zigzag within a Complex Correction or the center portion of a 5th Extension
Terminal Impulse pattern; place ":c3/:s5" at the end of ml. The Running Correction and Terminal
Impulse both make use of the ":c3" while the ":s5" would be used for the Zigzag scenario. If m(-l) is
longer than ml, forget the Terminal scenario.
If m3 is at least 100. but less than 161.8% of ml, ml may be the fust or last leg of a Zigzag within
a Complex Correction or the center portion of a 5th Extension Terminal Impulse pattern; place ":5/:s5/
:c3" at the end of ml. If m(-l) is longer than ml, drop ":c3" from the list of possibilities. Ifm(-l) is longer
than ml and the ":s5" is used for ml, ml would be wave-c of a Zigzag within a Complex Correction;
place "x:c3?" at the end of m2. If m4 is smaller than m3, drop ":5" from the Structure list. If m3 (plus
one time unit) is completely retraced faster than it took to form, drop ":s5" from the Structure list.
Preliminary Analysts 3-41
If m3 is shorter than ml and m3 (plus one time unit) is completely retraced faster than it took to form,
a Complex Correction may have concluded with m3; place ":5" at die end of ml. If m4 returns to the
beginning of m(-l) within a period of time equal to 50% (or less) of that consumed by m(-l) through m3
and m(-l) is not more than 261.8% of ml, ml may be part of a Terminal Impulse pattern; add ":c3" to
ml.
If m3 is shorter than ml and m3 is completely retraced slower than it took to form, ml concludes
a Zigzag which is part of a Complex Corrective pattern; place ":s5" at the end of ml.
If m3 is shorter than ml and m4 is shorter than m3, ml may have completed a Zigzag which is part
of a Complex Correction or is part of a Terminal Impulse pattern; place ":s5/:F3" at the end of ml to show
these two possibilities, respectively. If m5 is longer than m3, drop ":F3" as a possible Structure label.
Condition "c" - ifmO is at least 61.8%, but less than 100% of ml
If m3 is more than 261.8% of ml, m2 probably completed an Irregular Failure Flat or a Non-Limiting
Triangle; place ":c3/:sL3" at the end of ml. If m(-l) is more than 161.8% of ml, drop ":sL3" from the
list of Structure possibilities. If m(-l) is not more than 161.8% of ml and m(-2) is at least 61.8% of
m(-l), drop ":c3" from the Structure list.
If m3 is between 161.8% and 261.8% (inclusive) of ml, ml may be the center portion of an Irregular
Failure Flat, the second-to-last leg of a Contracting Triangle or part of a Complex Correction; place" :F3/
:c3/:sL3/:s5" at me end of ml. If m3 (plus one time unit) is completely retraced faster man it tookto form,
drop ":s5" from the above list. If m(-l) is more than 161.8% of ml, drop ":sL3" from the above list. If
m(-l)is not more man 161.8% of ml and m(-l) is retraced at least 61.8%, drop ":c3" from the above
list. If m4 is shorter than m3, drop ":F3" from the list.
If m3 is at least 100%. butless than 161.8% of ml, m 1 may be the center portion of an Irregul ar Failure
Flat, the second-to-last leg of a Contracting Triangle, the center leg of a 5th Extension Terminal pattern
or one of the legs of a Complex Correction; place ":F3/:c3/:sL3/:s5" at me end of ml. If m4 is shorter
than m3, drop ":F3" from the list and forget about the Terminal scenario. If m3 (plus one time unit) is
completely retraced faster than it took to form, drop ":s5" from the above list. If m(-l) is more than
161.8% of ml, drop ":sL3" from me above list. Ifm(-l) is not more than 161.8% of ml and m(-l) is
retraced at least 61.8%, drop ":c3" from me above list.
If m3 is shorter man ml and m3 (plus one time unit) is completely retraced faster than it took to form,
a Terminal Impulse or Complex Correction may have concluded with m3; place ":c3/:F3" at the end of
ml. If m(-l) is less than 138.2% or more than 261.8% of ml, the ":c3" becomes very improbable; place
brackets around it - "[:c3]."
If m3 is shorter than ml and m3 (plus one time unit) is completely retraced slower man it took to form,
m 1 may be wave-a of a Zigzag or the c-wave of a Zigzag within a Complex Correction; place ' :F3/(: s5)"
at the end of m 1. If m5 (plus one time unit) is completely retraced by m4 faster than m4 took to form,
drop "(:s5)" from the list.
If m3 is shorter than ml and m4 is shorter than m3, m 1 may be the last leg of a Zigzag or Flat within
a Complex Correction, one of the center legs of a Running Contracting Triangle OR the first leg of a
Terminal Impulse pattern; place ":s5/:c3/(:F3)" at the end of ml. If m5 is longer man m3, drop "(:F3)"
from the Structure list. If m(-l) is longer than 261.8% of ml, drop ":s5" from the list.
Condition "d" - ifmO is at least 100%, but less than 161.8% of ml
If m3 is more than 261.8% of m2, m 1 may be the first leg of a Zigzag, the center secdon of a C-Failure
Flat or the second-to-last leg of a Triangle; place" :5/:c3/(:sL3)" at the end of ml. If m(-1) is less than
61.8% or more than 161.8% of mO, drop "(:sL3)" from the Structure list. If m2 is retraced slower than
it took to form, drop "(:sL3)" and ":c3" from the list. If m3 is more than 161.8% of ml, drop ":5" from
the list.
3-42 Preliminary Analysis
If m3 is between 161.8 and 261.8% (inclusive) of m2, ml may be the center section of a C-Failure
Flat, the second-to last leg of a Contracting Triangle or the first leg of a Zigzag; place ":c3,' sL3/:5" at
the end of ml to show these mree possibilities respectively. If m(-l) is less than 61.8% of mO OR more
than 161.8% of mO, then check to see if ml is less than 38.2% of m(-3) through mO; if so, drop ":sL3"
from the list; if ml is more than 38.2%, but less than 61.8% of m(-3) through m(-l), place parentheses
around ":sL3" to show that, though it is possible, it is not the preferred choice. If m(-l) falls between
61.8-161.8% of mO, drop ":c3" from the list. If m4 is less than 61.8% of mO, place parentheses around
":5" to indicate its lower probability.
Ifm3 is at least 100, but less than 161.8% of m2. ml is probably the first leg of a Zigzag, but it may
be in a Triangle; place ":5/(:c3)/[:F3]M at the end of ml. If m4is larger than m3, drop "(:c3)" and "[:F3]"
from the list of possibilities. If m4 is shorter than m3 and m5 retraces m4 faster than m4 took to form
and m5 is equal to (or longer) and more vertical than ml, drop ":5" from the list.
Condition "e" - ifmO is between 161.8% and 261.8% of ml (inclusive)
If m3 is more than 261.8% of m2, ml may be the first leg of a Zigzag, the center section of a C-Failure
Flat which concludes a Complex Correction (with a "missing" x-wave in the middle of mO) or the second-
to-last leg of a Triangle; place ":5/:c3/(:sL3)" at the end of ml. If m(-l) is less than 61.8% or more than
161.8% of mO, drop "(:sL3)" from the Structure list. If m2 is retraced slower than it took to form, drop
"(:sL3)" and ":c3" from the list. If m3 is more than 161.8% of ml, drop ":5" from the list.
Ifm3 is between 161.8 and 261.8% (inclusive) of m2, ml may be the first leg of a Zigzag or the center
section of a C-Failure Hat which concludes a Complex Correction (with a "missing" x-wave in the
middle of mO); place ":5/:c3" at the end of ml and put a dot in die middle of mO with "x:c3?" to theright
and "isS?" to me left of the dot. If m2 is retraced slower than it took to form, drop ":c3" from the list.
If m3 is more than 161.8% of ml, drop ":5" from the list.
If m3 is at least 100. hut less than 161.8% of m2, m 1 may be the first leg of a Zigzag or the first leg
of a Triangle; place ":5/(:F3)" at the end of ml. If m4 is a monowave and m4 is longer than m3, drop
"(:F3)" from the Structure list.
Condition "f - ifmO is more than 261.8% of ml
If m3 is more man 261.8% of m2, ml may be the first leg of a Zigzag or the center section of a C-
Failure Flat which concludes a Complex Correction (with a "missing" x-wave in the middle of mO); place
":5/(:c3)" at the end of ml. If m2 is retraced slower than it took to form, drop ":c3" from the list. If m3
is more than 161.8% of ml, drop ":5" from the list. If the "(:c3)" Structure label is used for ml and
m(-l) shares no similar price territory with ml, mark the middle of mO with a dot and place "x:c3?" to
the right of it and ":s5" to the left of the dot to represent mO's "missing" x-wave possibility.
If m3 is between 161,8 and261,8% (inclusive) of m2,ml may be thefirst legof a Zigzag or the center
section of a C-Failure Hat which concludes a Complex Correction (with a "missing" x-wave in the
middle of mO); place ":5/(:c3)" at the end of ml. If m3 is longer than m2, drop "(:c3)" from the list. If
m2 is retraced slower than it took to form, drop "(:c3)" from the list. If m3 is more than 161.8% of ml,
drop ":5" from the list. If the "(x3)" Structure label is used for ml and m(-l) shares no similar price
territory wiui ml, mark die middle of mO with a dot and place "x:c3?" to the right of it and ":s5" to the
left of the dot to represent mO's "missing" x-wave possibility.
If m3 is at least 100. but less than 161.8% of m2, ml may be the first leg of a Zigzag or the first leg
of a Triangle; place ":5/(:F3)" at the end of ml. If m4 is a monowave and m4 is longer than m3, drop
"(:F3)" from the Structure list
Preliminary Analysis 3-43
m3 may be any length from
100% to bevond 261.8% of m2
Rule 4a
38.2% of ml-
*Can be composed of 1,
3, 5 or more monowaves
38.2% of ml"
m3 may be any length from
100% to beyond 261.8% of m2
Rule 4
Condition "a" {:F3/:c3/:s5/[:sL3]}
Category "i" - ifm3 is at least 100%, but less than 161.8% of ml
If m3 (plus one time unit) is completely retraced slower than it look to form, ml should be the first
leg of a correction which follows an x-wave (mO) or the end of a corrective phase which is part of a larger
Standard or Non-Standard formation; place ":F3/:s5" at the end of ml. If ":F3" is chosen, ml is wave-
a of a Flat correction. If" :s5" is appropriate, ml is the end of a Zigzag pattern. If ml is less than 61.8%
ofm(-l),drop ":s5" from the Structure list. If mO simultaneously takes less time than m(-l) and ml, drop
":s5" from mi's list.
If m3 is completely retraced in the same amount of time (or less) that it took to form, there is virtually
no chance ml completed an Elliott pattern; place only ":F3/:c3" at the end of ml. If ml is retraced no
more than 70% and none of m2's price range is shared by mO and m3 is almost 161:8% of ml and mO
takes more time dianm(-l)orm0 takes more time than ml, add ":s5" to the Structure list. Ifnoneofm2's
price range is shared by mO, drop" :c3" as a choice. If" :F3" is used, m 1 would be wave-a of a correction
within a larger complex formation; mO would be an x-wave. If ";c3" is still a possibility, ml may be part
of an Expanding Triangle or a Terminal Impulse pattern. If ":s5" is a possibility, it would be wave-3 of
a 5m Extension Impulse pattern.
If m3 is retraced less than 100%, place ":F3/:s5" at the end of ml. Tf m2 is composed of more than
three monowaves and m2 (plus one time unit) is completely retraced faster than it took to form and m2
takes more time than ml and m2 breaks a line draw across the end ofmf-2)andm0 faster than ml took
to form, then ml maybe the end of a Zigzag contained within an Irregular or Running Correction; add
":L5" to the Structure list at the end of ml. The ":L5" in this case was justified based on the two stages
of confirmation possible when dealing with poly wave patterns (see Chapter 6 for further details). If mO
simultaneously takes less time than m(-i) and ml, drop ":s5" from list. If ":F3" is chosen, mi is wave-
a of a Flat or Triangle correction. If ":s5" is appropriate, ml is the end of a Zigzag pattern.
Category "ii" - ifm3 is between 161.8% and261.8% of ml (inclusive)
If m(-l) is more than 261.8% of ml, there is virtually no chance ml is the end of any Elliott formation;
place only ":F3" at the end of ml.
If m4 is longer than m3, it is extremely unlikely m 1 is the end of any Elliott pattern, place only " :F3,!
at the end of ml.
If m3 is retraced less than 100%, place ":s5" at the end of ml then follow the below directions to
decide what type of Elliott pattern is forming.
1. If ml is retraced no more than 70% andml is from 101-161.8% ofm(-l)andnone of the price
range covered by m2 is shared by mO and m(-2) is longer than m(-l), ml may conclude the 3rd wave of
3-44 Preliminary Analysis
a Trending 5th Extension Impulse pattern. If ml is between 161.8-261.8% ofm(-l), it becomes more
likely that ml is the end ofaZigzag inside of a Complex Correction with m2 the end of an "x-wave." But,
the 3rd wave idea is still possible as long as you identify the 3rd wave as part of a Double Extension
Impulse pattern (see diagram; Chapter 12,page 12) with the 5th wave the longest. If ml is more than
261.8% ofm(-l), the Complex corrective scenario is the only proper choice.
2. Ifml is retraced no more than70% and ml isatleastl00,butlessthanl61.8%ofm(-l)and
some of the price range covered by m2 is shared by mO and m(-2) is longer titan m(-l), then ml may
conclude the 3rd wave of a Terminal 5th Extension Impulse pattern. Ifml is between 161.8-261.8%
(inclusive) ofm(-l), it becomes more likely ml is the endofa Zigzag inside of a Complex Correction with
ml the end of an "x-wave." But, the 3rd wave idea is still possible as long as you identify the 3rd wave
as part of a Double Extension Terminal Impulse pattern with the 5 th wave the longest. Ifm 1 is more than
261.8% ofm(-l), the Complex Corrective scenario is the only proper choice.
3. Ifml is retraced no more than 70% and ml is smaller than m(-l), ml can only be part of a
Zigzag pattern.
4. Ifml is retraced more than 70%, it is most likely ml terminated a Zigzag. But, if the price
ranges ofmO and m2 share some common territory and m3 is retraced faster than it took to form, ml
may be the 3rd wave of a 5th Extension Terminal Impulse pattern.
Make notes of these facts on your chart.
Category "Hi" -- ifm3 is more than 261.8% of ml
If m(-l) is more dian 261.8% of ml, there is virtually no chanceml is the end of any Elliott formation;
place only ":F3" at the end of ml.
If m3 is retraced completely by m4, it is extremely unlikely m 1 is the end of any Elliott pattern, place
only ":F3" at the end of ml.
If m3 is retraced less than 100%, it is extremely unlikely ml is the beginning of any Elliott pattern,
place only ":s5" at the end of ml.
Rule 4b
m3 may be any length from
100% to beyond 261.8% of m2
100%ofml-
38.2% of ml
1009b of ml-
38.2% of ml \~ / \ / '*" *Can be composed of m3 may be any length
\ M 'v 1, 3, 5 or more monowaves from 100% in beyond
V 261.6% of m2
Condition "b" {:F3/:c3/:s5/(:sL3)/(x:c3)/[:L5]}
Category "i" -- ifm3 is at least 100%, but less than 161.8% ofm2
If m3 (plus one time unit) is completely retraced in the same amount of time (or less) that it took to
form, there is virtually no chance ml completed an Elliott pattern; place only ":F3/:c3" at the end of ml.
If later it is found that ":c3" is the preferred choice, ml may be part of a Terminal Impulse pattern. If
the end of m3 is exceeded before die end of mO and ml is the longest when it is compared to m(-1) and
m(-3) and m2 breaks a trendline drawn across the low of m(-2) and mO. in a period of time equal to or
less of that taken by ml, ml may be the 5th wave of a 5th Extensionpattern; add [:L5] to the end of ml.
Preliminary Analysis 3-45
If m3 is completely retraced slower than it took to form; place ":F3/:c3/:s5" at the end of ml. If the
endofmlisexceededduringdieformationofm2,addan''x''infrontof'':c3.'' Iftheendofm3isexceeded
before the end of mO and ml is the longest when compared to m(-l) and m(-3) and m2 breaks a trendline
drawn across die low of m(-2) and mO in a period of time equal to or less than mat taken by ml, ml may
be the 5th wave of a 5th Extension pattern; add [:L5] to mi's Structure list. If ml is less than 61.8% of
m(-l), drop ":s5" from the list. If m(-l) is 161.8% (or more) of ml and m3 is retraced less dian 61.8%,
drop ":F3" as a possibility. If mO (plus one time unit) simultaneously takes less time than m(-l) and ml,
drop ":s5" from list.
If m3 is retraced less than 100%. it is extremely unlikely ml is the beginning of any Elliott pattern;
place ":c3/:s5" at the end of ml. If the end of ml is exceeded during the formation of m2, add an "x"
in front of ":c3." Even if this next condition is not met, read this entire paragraph. If m2 is composed
of more than three monowaves and m2 is completely retraced faster than it took to form and ml takes
more time than ml and m(-l) is at least 161.8% of mO and m2 breaks a line which is draw across the
end of m(-21 and mO faster than m 1 took to form, then m 1 may be the end of a Zigzag contained within
an Irregular or Running Correction; add ":L5" to the Structure list at die end of ml. The ":L5" in this
case was justified based on the two stages of confirmation possible when dealing with polywave patterns
(see Chapter 6 for further details). If mO (plus one time unit) takes less lime dian m(-1) and less time than
ml, drop ":s5" from list. If m(-2) is longer than m(-l) and ":c3" in the list is not preceded by an "x," drop
":c3" from the list. If m5 is not completely retraced as fast as it took to form, drop ":c3" from die list.
If ":c3" is still a possibility, ml may be the x-wave of a Complex Correction; add "x:c3?" as a additional
Structure label to mi's list.
If m3 is retraced less than 61.8%. it is extremely unlikely ml is the beginning of any Elliott pattern;
place ":c3/:sL3/:s5" at the end of m 1. If the end of ml is exceeded during the formation of m2, add an
"x" in front of" :c3." If ml is the longest when compared to m(-1) and m(-3) and m2 breaks a trendline
drawn across die low of m(-2) and mO in a period of time equal to or less than that taken by m 1, ml may
be the 5th wave of a 5th Extension pattern; add [:L5] to the end of ml. If m3 through m5 do not achieve
a price distance of 161.8% of ml (or more), drop ":sL3" from the list. If m2 (plus one time unit) is not
completely retraced in the same amount of time that it took to form (or less), drop ":sL3" from die list.
If mO (plus one time unit) simultaneously takes less time dian m(-l) and ml, drop ":s5" from list. If
m(-2) is longer (inprice)than m(-l) and ":c3" is notpreceded by an "x," drop ":c3" from die list. If ":c3"
is still a possibility, ml may be the x-wave of a Complex Correction; add "x:c3?" as an additional
Structure label to mi's list.
Category "ii" - ifm3 is between 161.8% and 261.8% ofm2 (inclusive)
If m(-l )is more than 261.8% of ml, there is virtually nochance ml is the end of any Elliott formation;
place only_ ";F3/:c3" at the end of ml. If the end of ml is exceeded during the formation of m2, add an
"x" in front of ":c3."
If ml is the longest wave when compared to m(-1) and m(-3) and m2 (plus one time unit) breaks a
trendline drawn across die low of m(-2) and mO in a period of time equal to or less than that taken by ml,
ml may be the 5th wave of a 5di Extension pattern; add [:L5] to the end of ml.
If m3 is retraced less than 61.8%, it is extremely unlikely ml is die beginning of any Elliott pattern,
place only ":c3/(:sL3)/(:s5)" at the end of ml. If the end of ml is exceeded during the formation of m2,
add an "x" in front of ":c3." If m3 through m5 do not achieve a price distance of 161.8% (or more) of
ml, drop ":sL3" from the list If mO (plus one time unit) simultaneously takes less time man m(-l) and
ml, drop ":s5" from list. If m2 is completely retraced slower than it took to form, drop ":sL3" from the
list. NOTE: if ":sL3 is used, me Triangle (which concludes with m2) is Non-Limiting.
3-46 Preliminary Analysis
If neither of the conditions above applies, place ":F3/:c3/:sL3/:s5" at the end of ml. If the end of ml
is exceeded during the formation of m2, add "x:c3" to the Structure list. If ml is the longest when
compared to m(-1) and m(-3) and m2 breaks a trendline drawn across the low ofm(-2)andm0in a period
of time equal to or less than that taken by ml, ml may be the 5di wave of a 5th Extension pattern; add
[:L5] totheendofml. When comparing m(-l), ml anm3,ifml is the shortest of the three and m3 (plus
one time unit) is completely retraced faster than it took to form, drop ":c3" as a possibility. If ml is less
man 61.8% of m(-l), drop ":s5" from the list. Ifm3isretracedlessthan61.8%,drop":F3"asapossibility.
If mO simultaneously takes less time than m(-l) and ml, drop ":s5" from the list. If m2 (plus one time
unit) is retraced slower than it took to form, drop ";sL3" from the list.
Category "Hi" -- ifm3 is more than 261.8% ofm2
If m(-l) is more than 261.8% of ml, there is virtually nochance ml is the end of any Elliott formation:
place only ":c3/(:F3)" at the end of ml. If the end of ml is exceeded during the formation of m2, add
an "x" in front of ":c3."
Ifm(-l)isatleastl61.8%ofml andmOisretracedslowerthanit took to form andml takes 161.8%
of the time of mO (or more), it is almost certain m0-m2 form an Irregular Failure Hat, place ":c3/(:F3)"
at the end of ml. If the end of ml is exceeded during the formation of m2, add an "x" in front of ":c3."
If ml is the longest when compared to m(-1) and m(-3) and m2 breaks a trendline drawn across the
low of m(-2) and mO in a period of time equal to or less than that taken by ml, ml may be the 5th wave
of a 5th Extension pattern; add [:L5] to the end of ml.
If m3 is retraced less than 61.8%, it is extremely unlikely ml is the beginning of any Elliott pattern,
place only ":F3/:c3/(:s5)" at the end of ml. If ":F3" is used, an Elongated Hat begins with the start of
ml. If ml is die longest when it is compared to m(-1) and m(-3) and m2 breaks a trendline drawn across
the low of mf-21 and mO in a period of time equal to or less than that taken by ml, ml may be the 5th
wave of a 5th Extension pattern; add [ :L5] to the end of ml. If mO simultaneously takes less time than
m(-l) and ml, drop ":s5" from list. If the end of ml is exceeded during the formation of m2, add an "x"
in front of ":c3."
If none of the conditions above apply, place ":F3/:c3/:sL3/:s5" at the end of ml. If ml is the longest
when compared to m(-l) and m(-3) and m2 breaks a trendline drawn across die low ofm(-2) andmO in
a period of time equal to or less than that taken by m 1, m 1 may be the 5th wave of a 5m Extension pattern;
add [:L5] to the end of ml. If ml is less than 61.8% of m(-l), drop ":s5" from the list. If m3 is retraced
less man 61.8%, drop ":F3" as a possibility. If mO simultaneously takes less time than m(-l) and ml,
drop ";s5" from list. If theend of ml is exceeded during the formation of m2, add as "x"infront of ":c3."
Rule 4c
m3 may be any length
from 100% lo beyond
261.8% of m2 #/ \ oJ/x
W *;
100% of ml-
f &.
R-4c>
161.8% of inl-
\ I \ ; § m3 may be any length
\l \/ from 100% to beyond
•Can be composed of \f 261.8% of m2
1.3, 5 or more monowaves
Preliminary Analysis 3-47
Condition "c" (:c3/(:F3)/(x:c3)}
Category "i" - ifm3 is at least 100%, but less than 161.8% ofm.2
The subtleties of this situation do not allow for specific quantifications, just place an ":F3/:c3" at the
end of ml. If the end of ml is exceeded during the formation of m2, add an "x" in front of ":c3." The
interaction of ml with surrounding Structure will help to decide which of the two Structure labels best
fits current conditions.
Category "ii" - ifm3 is between 161.8% and 261.8% of ml (inclusive)
If m2 (plus one time unit) is completely retraced in the same amount of time (or less) that it took to
form and m3 is more than 161.8% of ml, the chances are better that ml was the center section of a C-
Failure Flat or of a Contracting Triangle; place ":c3/(:F3)" at the end of ml. If the end of m 1 is exceeded
during the formation of m2, add an "x" in front of ":c3." If the lower probability "(:F3)" is correct, ml
is part of an Elongated Flat.
Under all other situations, place ":F3/:c3/x:c3" at the end of ml.
Category "Hi" — ifm3 is more than 261.8% ofm2
If m2 (plus one time unit) is completely retraced in the same amount of time (or less) that it took to
form, it is almost certain ml is the center section of a C-Failure Flat or a Non-Limiting, Contracting
Triangle; place ":c3/[:F3]" at the end of ml. If the end of ml is exceeded during the formation of m2,
add an "x" in front of ":c3." The only way "[:F31" should be considered is if m3 is retraced more than
61.8% within a period of time equal to or less than m3.
•261.8% of ml
m3 may be any length
from 100* to beyond
261.8% of m2
Rule 4d
♦Can be composed of
1, 3, 5 or more
monowaves
161.8%
■ -of ml
m3 may be any length
from 1009b to beyond
261.8% of m2
■261.8% of ml
Condition "d" {:F3/(:c3)/(x:c3)}
Categories "i" & "ii" - ifm3 is between 100% and261.8% ofm.2 (inclusive)
If m2 (plus one time unit) is completely retraced in the same amount-of rime (or less) that it took
to form and m3 is not retraced more than 61.8% and m3 (or m3 through m5) consumed 161.8% (or more)
of ml in price within the same amount of time (or less) as ml, ml may be part of a complex correction
in which mO contains a 'missing" x-wave toward its center; place ":F3/[:c3]" at the end of ml andmark
(widi a pencil) the center of mO with a circle and place "x:c3?" to the right of it, "c:5?" to the left of it
and ":F3?" at the end of mO. All of the labels widi question marks are interdependent; if one is used all
must be used, if one is not used, none of diem can be used.
3-48 Preliminary Analysis
If m2 is completely retraced slower than it took to form, a Flat or Triangle is probably
involved; place ":F3/:c3" at the end of ml. If the end of ml is exceeded during the formation of m2,
add an "x" in front of ":c3."
If m3 (plus one time unit) is completely retraced in the same amount of time (or less) that it took to
form, ":F3" is the only reasonable choice for ml.
If m3 is retraced at least 61.8%, but less than 100%, ":F3" is the only reasonable choice for ml.
Ifm3isretracedlessthan61.8%,place":F3"attheendofml. If m5 is not the longest whencompared
with m 1 and m3 and m.5 (plus one time unit) is completely retraced in the same amount of time (or less)
that it took to form, ml may be part of a Terminal pattern. If m.5 is longer than ml and m3, ml may be
part of a Complex Double Hat pattern in which m4 is an x-wave. Make note of these possibilities. Under
both conditions listed in this paragraph, ml would be marked with an ":F3."
Category "Hi" - ifm3 is more than 261.8% ofm2
If m3 takes the same amount of lime (or less) as ml and m2 (plus one time unit) is completely retraced
in the same amount of time (or less) that it took to form, there is a strong possibility of a "missing" x-
wave hidden toward the middle of mO; place ":c3" at the end of ml. If the end of ml is exceeded during
the formation of m2, add an "x" in front of the ":c3" at the end of ml. If m3 is retraced at least 61.8%,
it is possible ml is the first leg of a Flat; add ":F3" to the end of ml.
If m3 takes more time than ml, place" :F3/:c3" at the end of m 1. If the end of m 1 is exceeded during
the formation of m2, add an "x" in front of ":c3."
Rule 4e
■261.8% of ml
m3 may be any length
from 100% to beyond
261.8% of m2
*Can be composed
of 1. 3,5 or more
monowaves
/
l
A /* X*
V f\
R-4e / ^
m3 may be any length
from 100% to beyond
261.8% of m2
Condition "e" (:F3/(x:c3)/[:c3])
Categories "i" & "ii" - ifm3 is between 100% and 261.8% of ml (inclusive)
If m3 (plus one time unit) is completely retraced in the same amount of time (or less) that it took to
form, ":F3" is the only reasonable choice, place it at the end of ml.
If m3 is not more than 161.8% of m2 and m3 is not completely retraced and m4 is retraced faster
than it took to form, ml could be the x-wave of a complex correction; add "x:c3" to the end of ml. In
diis scenario, if m(-l) is more than 61.8% of mO, mO would be missing an x-wave toward its center.
Preliminary Analysis 3-49
If m2 (plus one time unit) is completely retraced in the same amount of time (or less) that it took to
form and m(-l) is not more than 61.8% of mO and m3 is retraced no more than 61.8% andm3 (orm3
through m5) achieved a price distance equal to ml (or more) within the same amount of time (or less)
as ml, ml may be part of a Complex Correction in which mO contains a "missing" x-wave toward its
center or m 1 is the x-wave after a Zigzag; place " :F3/[:c3]" at the end of ml and mark (with a pencil) the
cemerofm0withadotandplace"x:c3?"totherightand":s5"totheleftofit. If the end of ml is exceeded
during the formation of m2, ml may be an x-wave, add "x:c3" to mi's list.
If m2 is retraced slower than it took to form and m(-l) is not more than 61.8% of mO and m3 is
retraced no more than 61.8% and m3 through m5 consume 161.8% (or more) of ml in price within the
same amount of time (or less) as ml, ml may be part of a complex correction in which mO contains a
"missing" x-wave toward its center; place ":F3/[:c3]" at the end of ml and mark (with apencil) the center
of mO with a dot and place "x:c3?" to the right and ":s5" to the left of it. If the end of ml is exceeded
during the formation of m2, ml may be an x-wave, add "x:c3" to mi's list.
If m2 is retraced slower than it took to form, a Flat or Triangle is probably involved; place an " :F3"
at the end of ml.
If mO is a polywave (or a monowave widi a suspected "missing" wave toward its center), ml may
be an x-wave of a Complex Correction; add "x:c3" to any existing Structure labels at die end of ml.
If m(-l) is no more than 61.8% ofmO, ml may be an x-wave of a Complex Correction; add "x:c3"
to any existing Structure labels at die end of ml.
Category "Hi" — ifm3 is more than 261.8% ofm2
If m3 takes no more time than ml and m2 (plus one time unit) is completely retraced in the same
amount of time (or less) that it took to form, there is a strong possibility of a "missing" x-wave hidden
toward the middle of mO; put an "xx3" next to the termination of ml. If m3 through m5 fail to exceed
the beginning of mO and m3 is retraced at least 61.8%, it is also very possible ml is the first leg of an
Elongated Flat; add ":F3" to the end of ml.
Rule 5
(activation requirement)
mO may be any
length from just
. above 0% to beyond
• 261.8% of ml R.5
w ,r
*Can be composed of
1,3,5 or more monowaves
t".
\fi
mO may be any
length from
just above 0% K"5
to beyond
261.8% of ml
100%
3-50 Preliminary Analysis
Rule5 (:F3/:c3/:5/:L5/(:L3)}
Condition "a" - mO is less than 100% of ml
**(if m2 is composed of more than three monowaves [or monowave groups])
If the first three monowaves ofm2 do not retrace more than 61.8% of ml, a Complex Correction may
be unfolding widi the first or second monowave (immediately after the end of m 1) moving in the opposite
direction of ml representing an x-wave OR ml contains a "missing" x-wave or "missing" b-wave in its
center OR ml is the 3rd-wave of an 5th-Failure Impulse pattern (Trending or Terminal); place ":5/:s5"
at the end of ml. Add ":F3" to the end of ml if ml is retraced at least 25% by the first 3 monowaves.
NOTE: if the "missing" x-wave is used, circle the center of ml and place ":5 ?" to the left of the circle
and "x:c3 ?" to the right of the circle. If the "missing" b-wave is used, circle the center of m 1 and place
":5 7" to the left of the circle and "b:F3 ?" to the right of the circle. If die b-wave is used, the termination
of the Complex Correction will be confirmed immediately before the point where the market violently
turns (in die opposite direction of ml) and exceeds die 61.8% retracement level of ml.
If the first three monowaves of m2 retrace more than 61.8% of ml, ml may have completed wave-
a of a Flat with a complex b-wave OR ml may have completed wave-3 of a 5di Failure Impulse pattern;
place ":F3/:5" at die end of ml to show these two possibilities respectively.
**(if m2 is composed of three monowaves [or monowave groups] or less)
If m 1 (plus one time unit) is completely retraced in the same amount of time (or less) that it took to
form and m(-2) and mO do not share any similar price territory and m2 is larger than m(-2) and m(-2)
and mO are obviously different in price or time or both and when the price lengths of m(-3), m(-1) and
ml are compared, m(-l) is not the shortest, a Trending Impulse pattern may have concluded with ml;
place ":L5" at the end of ml.
If m 1 (plus one time unit) is completely retraced in the same amount of time (or less) that it took to
form and m2 is longer than m(-2) and m(-4) is longer than m(-3), a Zigzag or Flat may have concluded
with ml; place ":L5"atthe end of ml.
If ml (plus one time unit) is completely retraced in the same amount of time (or less) that it took to
form and m2 is longer tlian m(-2) and m(-3) is longer tlian m(-2) and m(-4) is shorter than m(-3), ml
may be die end of a Standard Elliott pattern which is part of a Complex Correction where m( 2) is an x-
wave; place ":L5" at the end of ml and "x:c3?" at the end of m(-2). In the above situation, if m(-l) is
atleast 161.8% of mO, the Standard Correction unfolding is probably a Zigzag. If m(-l)isatleast 100%,
but less than 161.8% of mO, the Standard Correction is probably a Flat.
If ml (plus one time unit) is completely retraced in the same amount of time (or less) that it took to
form and m2 is smaller than m(-2), a Flat or Zigzag may have concluded with ml; place ":L5" at the end
of ml.
If ml (plus one time unit) is completely retraced in the same amount of time (or less) that it took to
form and m(-2) is smaller than m(-1) and m(-1) is not the shortest when compared to m(-3) and m 1 and
m2 is not retraced more than 61.8% and the market approaches (or exceeds) the beginning of m(-3)
within a time period which is 50% or less of that consumed by m(-3) through m 1 and the end of m 1 is
not exceeded for a period which is four times as long as that consumed by m(-3) through ml and m2-
m4's price coverage is at least twice tliat of ml and one of m(-l)'s possible Structure labels is ":c3," a
Terminal Impulse may have completed at the end of ml; add ":L3" to the current Structure list for ml.
If ml (plus one time unit) is completely retraced in the same amount of time (or less) that it took to
form and m3 is between 61.8-100% of ml, ml may be part of an Irregular Failure Hat; place ":F3" at
the end of ml.
Pmliminarv Analysis 3-51
If ml (plus one time unit) is completely retraced in the same amount of time (or less) that it took to
form and m3 is longer than m2 and mO is at least 161.8% of m2 and m3 is completely retraced in the
same amount of time (or less) that it took to form, ml may be part of an Irregular Flat; place ":F3" at the
end of ml.
If ml is completely retraced slower than it took to form and m2 did not retrace more than 61.8% of
the distance from the beginning of m(-l) to the end of ml andm3 is shorter than m2, the market may
be conol uding a Complex Correction in which m 1 will be the most extreme price obtained by the market
for a period at least twice drat of the combined times of m0-m2; place an ";F3" at the end of ml.
If ml is completely retraced slower than it took to form and m3 is longer than m2 and m2 is not more
than 61.8% of the price distance from the beginning of m(-l) to the end of ml, then the market could be
forming a Complex Correction (where ml would be the end of one corrective phase of the pattern and
m2 would probably be the end of an x-wavc'i or an Expanding Triangle; place ":F3/:c3/:L5" at the end
of ml.
If ml is completely retraced slower thanit took to form and m2is smaller than m(-2), a Zigzag (which
is part of a Contracting Triangle) may have concluded wim ml; place ":L5" attheendofml.
If ml is completely retraced slower than it took to form and m(-l) is at least 61.8% of ml and m3
is smaller than m2 and m3 (plus one time unit) is completely retraced in the same amount of time (or
less) that it took to form, ml may be part of a Flat which concludes a larger pattern; place ":F3" at the
end of ml.
If m3 is longer than m2 andm4is longer than m3 and mOis less than 61.8% of ml, ml may have
begun an Expanding Triangle; add "(:F3)" to the Structure list at the end of ml.
If m3 is longer than m2 and m4 is longer than m3 and mOis between 61.8-100% of ml, the market
may be forming an Expanding Triangle; add "(:c3)" to ml.
Condition "b" - mO is at least 100%, but less than 161.8% of ml
If m3is longer than m2 and mO is closer to 100%; than to 161.8% of ml, place ":c3" at the end of
ml. If m(-l) is longer than mO and the ":c3" is used as the preferred Structure choice, add "b" in front
of "x3" to get "b:c3." This means that ml is the b-wave of a Flat correction. If m(-1) is less than mO,
ml may be the x-wave of a Complex correction, add "x" in front of die ":c3" instead.
If m3 is longer than m2andm0is closer to 161.8% of ml than to 100% of ml. place ":F3" at the end
of ml. If m(-1) is longer than mO, m2 is probably the end of a Zigzag. If m(-1) is shorter than mO, ml
may be an x-wave of a Complex Correction which ends with m4. To show these two possibilities
respectively, add "b:c3" and "x:c3" to the Structure list at the end of ml.
If m3 is at least 61.8% of ml and m3 completes without any part of it exceeding the end of m2 and
m2iscloseto61.8%ofm0.mlmavbemefirstlegofanIrregularFailureFlat;add'':F3"tomrsStructure
list if it is not already present.
If m2 is retraced less than 100% and m3 is at least 61.8% of ml and m3 completes without any part
of it exceeding the end of m2, place ":F3" at the end of ml.
If m2 is retraced less than 61.8% and ml and m3 share some of the same price range and m4 is no
more than 261.8% of m2 and m2 is not the shortest wave when compared with mO and m4 and m4 (plus
one time unit) is completely retraced faster than it took to form with the market approaching (or
exceeding) the beginning of mO in 50% of the time (or less) that it took to form mO through m4, then the
market possibly completed a Terminal pattern at m4; place ":c3" at the end of ml (if ":F3" is one of mi's
current Structure possibilities, add brackets"[]" around it to indicate ":c3" is a much better choice).
3-52 Preliminary Analysis
If m 1 (plus one time unit) is completely retraced in the same amount of time (or less) that it took to
form and m2 is almost 161.8% of ml and m2 is retraced less than 61.8% and m(-l) is at least 61.8%
of mO and m(-2) is tie tween61.8-161.8% of m(-l) and m(-3) is be tween61.8-161.8% of m(-2) and the
combined price coverage ofm2 through m4 is longer than mO, m 1 may have completed a Contracting
Triangle; add ":L3" to any existing Structure list.
If ml (plus one time unit) is completely retraced in die same amount of time (or less) that it took to
form and ml is not more than 161.8% of m(-l) and m2 is almost 161.8%/ of ml and m2 is retraced less
than 61.8%) and the combined price coverage of m2 through m4 is longer than mO, ml may have
completed a Flat pattern; add ":L5" to any existing Structure list.
If m(-l) is shorter than mO and m2 (plus one time unit) is completely retraced in the same amount
of time it took to form (or less) and mO is not the shortest when compared to m(-2) and m2 and the market
approaches (or exceeds) the beginning of m(-2) in a period of time 50% (or less) of that consumed by
m(-2) through m2, add "(:sL3)" to the Structure list, a Terminal Impulse pattern could have completed
at the end of m2.
If none of the above conditions fit your current situation and ml is a monowave, place all Structure
Labels at the beginning of this section at the end of ml. If none of the above conditions fit your current
situation and ml is a compacted polywave (or higher) pattern, just move on to the section entitled
"Implementation of Position Indicators" and use surrounding Structure labels to decide the Position
Indicator which belongs in front of ml's compacted Structure label.
Condition "c" - mO is between 161.8% and 261.8% of ml (inclusive)
If m3 is between 61.8-161.8% of ml (inclusive) and m2 is less than 61.8% of mO and m4 is at least
100% of m2 and m4 (or m4 through m6) is at least 100% of mO, ml may be the first leg of an Irregular -»««
Flat (either variation) or a Running Triangle pattern; place ":F3" at the end of ml.
It ni3 is between 101%-161.8% of m2, there is the unlikely possibility an Expanding Triangle is
forming; place ":e3" at the end of ml.
If m2 (plus one timt inirt is completely retraced in the same amount of time (or less) that it took to
form and m(-l) is shorter than iJ ■ :md mO, when compared to m(-2) and m2, is not the shortest of the
three and m(-l) and m 1 share some ot u, :■ s ame price range and the market approaches (or exceeds) the
beginning of m(-2) in a period of time which is u2 !<" for less) of diat consumed by m(-2) through m2, add
"(:sL3)" to the Structure list (indicating the possibility of >i Terminal pattern completing with m2).
If m2 is retraced less th an 61.8% and ml and m3 share some ui 'he same price range and m4 is shorter
than m2 and m4 (plus one time unit) is completely retraced faster that, i* took to form with the market
approaching (or exceeding) the beginning of mO in a period of time which is 30.'- (or less) of that taken
to form mO through m4, then the market possibly completed aTerminal pattern at m4; pi ice "x3" at the
end of ml.
If ml (plus one time unit) is completely retraced in the same amount of time (or less) that it took to
form and m2 is close to 161.8% of ml and m2 is retraced less than 61.8% and m(-l) is at least 61.8%
of mO and m(-2) is between 61.8-161.8% of m(-l) and m(-3) is between 61.8-161.8% of m(-2) and the
combined price coverage of m2 through m4 is longer than mO, ml may have completed a Contracting
Triangle; add ":L3" to any existing Structure list.
If ml (plus one time unit) is completely retraced in the same amount of time (or less) that ii took to
form and ml is very close to 61.8% of mO, butml is no more than 161.8% of m(-l) and m2is very close
to 161.8% of ml and m2 is retraced less dian 61.8% and the combined price coverage of m2 through
m4 is longer than mO, ml may have completed a Flat pattern; add":L5" to any existing Structure list.
If no Structure label has been placed for ml during this section, place ":F3" at the end of ml.
Preliminary Anatvsis 3-53
Condition "d" - mO is more than261.8% of ml
If m2 is composed of more than three monowaves, place ":F3" at me end of ml.
If m2 (plus one time unit) is completely retraced in the same amount of time (or less) that it took to
form and m(-2) is shorter than mO and after m2, the market approaches (or exceeds) the beginning of
m(-2) within 50% (or less) of the time taken to form m(-2) through m2; add "(:sL3)" to me Structure list
(indicating the outside possibility of a 3rd Extension Terminal pattern completing with m2).
If m2 is retracedlessthan61.8% and ml and m3 share some of the same price range andtr>4 is shorter
than m2 and m4 is completely retraced faster than it took to form with the market approaching (or
exceeding) the beginning of mO within 50% (or less) of the time it taken to form mO through m4, then
the market possibly completed a Terminal pattern at m4; place "x3" at the end of ml.
If m2 is retraced less than 61.8% and m2-m4's combined price coverage is larger and their movement
more vertical than mO's and m(-l) is at least 61.8% of mO, there is a remote chance ml completed a
Contracting Triangle; add "(:L3)" to ml.
If m2 is retraced less than 61.8 % and m2-m4's combined price coverage is larger and their movement
more vertical than mO's and m(-1) is approximately equal to mO in price and ml is equal (or greater) in
time to m(-1) and mO takes more time than m(-1) and more time than m 1, there is a remote chance m 1
completed a "severe" C-Failure Flat; add "[:L5]" to ml.
If m3 is between 61.8-100% of m2 and m4 is less than 61.8% of mOand ml takes less time than mO,
ml may be an "x-wave" within a Complex Correction; jot that down and place "x:c3" at the end of ml.
If m3 is between 61.8-100% of m2 and m4 is 61.8% of mO (or more), put ":F3" at the end of ml.
If m3 is less than 61.8% of m2. place an ":F3/:c3" at the end of ml.
If m3 is at least 61.8% of ml but less than 100% of m2 and m4 is at least as long as m2 and m4 (or
m4 through m6), without breaking beyond the end of m3, is at least 61.8% of mO, there is a good chance
ml is the first leg of an Irregular Failure Hat; add ":F3" to ml.
If at this time there are still no Structure label(s) present for ml, place ":F3" at the end of ml.
26l.8%_ *Can be composed of
of ml 1, 3. 5 or more monowaves
mfj could be any length
from just above 0% to
beyond 261.8% of ml
R-6
?
mO could be any length ^* \ j
from just above 0% to \ *
beyond261.8%ofml 1618% N £?/
Rule 6
(activation requirement)
of ml
261.8%
\
3-54 Preliminary Analysis
Rule 6 { any Structure possible, if no descriptions apply, use Position Indicator Sequences on page 3-61 for guidance}
Condition "a" — mO is less than 100% of ml
**(if m2 is composed of more than three monowaves [or monowave groups])
If the first three monowaves of m2 dn not retrace more than 61. S% of m 1. a Complex Correction may
be unfolding with the first or second monowave (immediately after the end of ml), moving in the
opposite direction of ml, representing the x-wave OR ml contains a "missing" x-wave in its center OR
ml is the 3rd-wave of a 5th-Failure Impulse pattern (Trending or Terminal); place ":5/:s5" at the end of
m 1. NOTE: if the "missing" x-wave is used, circle the center of m 1 and place": 5 ?" to the left of the circle
and ":F3 ?" to the right of the circle, the end of the Complex Correction will be confirmed immediately
before the point when the market violently turns (in the opposite direction of ml) and exceeds the 61.8%
retracement level of ml.
If the first three monowaves of m2 retrace more man 61.8% of ml, ml may have completed wave-
a of a Hat with a complex b- wave OR ml may have completed wave-3 of a 5th Failure Impulse pattern;
place ":F3/:5" at the end of ml to show these two possibilities respectively.
**(if m2 is composed of three monowaves [or monowave groups] or less)
If m2 is retraced less than 61.8% by m3, place ":L5" at the end of ml. If mO and m(-2) share some
of the same price territory, add ":L3" to the list.
If m2 is retraced 61.8% or more by m3, place ":L5" at the end of ml.
If ml (plus one time unit) is completely retraced in the same amount of time (or less) thai it took to
form, a Trending Impulse partem may have completed with ml; place ":L5" at the end of ml.
If m 1 (plus one time unit) is completely retraced in the same amount of time (or less) that it took to
form and m3 is shorter than m2 and m2 (or m2 through m4) approaches (or exceeds) the beginning of
m(-3) within a time frame which is 50% (or less) of that taken by m(-3) through ml and mO and m(-2)
share some of the same price territory, then ml may have completed a Terminal Impulse pattern; add
"(:L3)" to the Structure list at the end of ml. If m3 is between 61.8-100% (exclusive) of m2 and ":L3"
is used as the preferred Structure label, m2 is probably an x-wave OR the Terminal pattern which
completed with ml is within a larger Triangle; place "x:c3?" at the end of m2.
If m 1 is completely retraced slower than it took to form and m2 does not exceed the end of m(-2)
and m(-l) is at least 61.8% of ml and m(-2) is shorter than m(-l), ml may be wave-a of a Flat pattern
which concludes a Complex Correction and mO is the x-wave of the pattern; place" :F3" at the end of m 1
and "x:c3?" at the end of mO.
Condition "b" -- mO is at least 100%, but less than 161.8% of ml
**(if m3 is composed of more than three monowaves [or monowave groups])
If the first three monowaves of m3 do not retrace more than 61.8% of m2, a Complex Correction may
be unfolding with the first or second monowave (immediately after the end of m2) moving in the opposite
direction of m2 representing an x-wave OR m2 contains a "missing" in its center OR m2 is the 3rd-wave
of a 5th-Failure Impulse pattern (Trending or Terminal); place ":5/:s5" at the end of ml. NOTE: for the
"missing" wave scenario, circle the center of m2 and place ":5 ?" to the left of the circle and ":F3/x;c3?"
to the right of the circle, the end of the Complex Correction will be confirmed complete when the market
violently turns (in the opposite direction of ml) and exceeds the 61.8% retracement level of m2. The
termination of the Complex Correction would be at the beginning of the violent turn-around.
If the first three monowaves of m3 retrace more than 61.8% of m2, m2 may have completed wave-
a of a Flat with a complex b-wave OR m 1 may have completed wave-3 of a 5th Failure Impulse pattern;
place ":F3/:5" at the end of ml to show these two possibilities respectively.
**(if m3 is composed of three monowaves [or monowave groups] or less)
If ml is less than or equal to mO in time ox ml is less than or equal to m2 in time and m(-2) is shorter
than m(-l), ml may be the x-wave of a Complex Correction; place "x:c3" at the end of ml.
Preliminary Analysis 3-55
If m 1 takes the same amount of time (or more) as mO ox ml takes the same amount of time (or more)
as m2 and mO is close to 161.8% of ml, ml may be pan of a Zigzag or Impulse pattern, place ":F3" at
the end of ml.
If ml (plus one time unit) is completely retraced by m2 in the same amount of time (or less) that ml
took to form and m2 is retraced lessthan61.8% OR more than 100% in a period of time equal to (or less)
than that taken by m2 and m(-l) is at least 61.8% of ml in price and Lime and if ml is a Compacted
pattern, make sure no part of ml moved beyond the beginning of ml during mi's formation, then there
isachanceml completed the C-wave of a Flat; place ":L5" at the end of ml to show this possibility.
If ml (plus one time unit) is completely retraced by m2 in the same amount of time ml took to form
(or less) and m2 is retraced less than 61.8% and m(-l) is at least 61.8% of mO in price and time, there
is a chance ml completed a Contracting Triangle or one of several Hat variations [depending on the
length of m(-l)]; place ":L3/:L5" at the end of ml to show these two possibilities (respectively). If ml
is a polywave and part of ml exceeds mi's beginning, drop ":L5" as a possibility.
If ml is completely retraced slower than it took to form and m2 is composed of three or more
monowaves and m2 is longer than both m(-l) and mO, men ml may be one of the middle legs of a
Triangle; place ":c3" at the end of ml.
If m2 (plus one time unit) is completely retraced in the same amount of time (or less) that it took to
form and mO, when compared to m(-2) and m2, is not the shortest of the three and the market approaches
(or exceeds) the beginning of m(-2) in a period of time 50% (or less) of that taken by m(-2) through m2,
a Terminal pattern may have concluded with m2; add ":sL3" to any current Structure list present at the
end of ml.
If m3 is between 101%-161.8% of m2, an Expanding Triangle may be forming; if mere is an ":F3"
in mi's Structure list, add brackets around it to indicate ":c3" is the better choice.
Condition "c" — mO is between 161.8% and 261.8% of ml (inclusive)
Despite any particular circumstances, ";F3" is a good possibility; place ":F3" at the end of ml.
If ml (plus one time unit) is completely retraced in the same amount of time (or less) that it took to
form and m2 is retraced less than 61.8% and during a period equal to the time of mO, m2 exceeded the
length of mO and m(-l) is between 61.8-161.8% of mO and m2's price coverage is larger and its
movement more vertical than that exhibited by mO, ml may have completed a Contracting Triangle or
a severe C-Failure Flat; place ":L3/(:L5)" at the end of ml to show these two possibilities (respectively).
If m2 (plus one time unit) is completely retraced in the same amount of time (or less) that it took to
form and m(-1) and m 1 share some of the same price range and mO, when compared to m(-2) and m2,
is not the shortest of the three and the market approaches (or exceeds) the beginning of m(-2) in a period
of time 50% (or less) of that taken by m(-2) through m2, then a Terminal pattern may have concluded
with m2; add ":sL3" to the end of ml.
If m3 is between 101%-161.8% of m2, there is the unlikely possibility that an Expanding Triangle
is forming; add "(:c3)" to the Structure list.
Condition "d" ■- mO is more than 261.8% of ml
If mO (minus one time unit) is less than or equal to ml in time OR if m2 (minus one time unit) is less
than or equal to ml in time, and as long as ml is not simultaneously less in time than both mO and m2.
ml is either the first phase of a larger correction or the completion of a correction within a Zigzag or
Impulse pattern; place ":F3" at the end of ml.
If m2 is retraced less than 61.8% and the combined time of m2 through m4 is equal to or less than
that consumed by mO and m2-m4's combined price coverage is larger and their movement more vertical
than that exhibited by mO, there is a small chance that ml completed a Contracting Triangle or a severe
C-Failure Rat; place "(:L3)/[:L5]" at the end of ml to show these two possibilities (respectively).
3-56 Preliminary Analysis
If m2 (plus one time unit) is completely retraced in the same amount of time (or less) that it took to
form and m(-l) and ml share some of the same price range and mO, when compared to m(-2) and m2,
is not the shortest of the three and the market approaches (or exceeds) the beginning of m(-2) in a period
of rime 50% (or less) of that taken by m(-2) through m2, then a Terminal pattern may have concluded
with m2; add ":sL3" to the end of ml.
mO can be any length
from just above 0% to
beyond 261.8% of ml
_261ji%
of ml
mO can be any length
from just above 0% to
beyond 261.8% of ml
Rule 7
(activation requirement)
*Can be composed
of 1,3, 5 or more
monowaves
261.8% .
of ml
Rule 7 { any Structure possible, if no descriptions apply, use Position Indicator Sequences on page 3-61 for guidance}
Condition "a" - mO is less than 100% of ml
**(if m2 is composed of more than three monowaves [or monowave groups])
If the first three monowaves of m2 jjojioi retrace more than 61.8 % of m 1, a Complex Correction may
be unfolding with the first or second monowave (immediately after the end of ml), moving in the
opposite direction of ml, representing the x-wave OR ml contains a "missing" x-wave in its center OR
ml is the 3rd-wave of a 5th-Failure Impulse pattern (Trending or Tenninal); place ":5/:s5" at the end of
ml and "x:c3?" at the end of m2. NOTE: if the "missing" x-wave is used, circle the center of ml and
place ":5 ?" to the left of the circle and ":F3 7" to the right of the circle, the end of the Complex Correction
will be confirmed immediately before the point when the market violently turns (in the opposite direction
of ml) and exceeds the 61.8% retracement level of ml.
If the first three monowaves of m2 retrace more than 61.8% of ml, ml may have completed wave-
a of a Flat with a complex b-wave OR ml may have completed wave-3 of a 5th Failure Impulse pattern;
place ":F3/:5" at the end of ml to show these two possibilities respectively.
**(if m2 is composed of three monowaves [or monowave groups] or less)
No matter what the surrounding evidence, an ":L5" is very likely; place it at the end of ml.
If m2 is retraced less than61.8%andm(-2) is shorter than m(-1) and m(-2) andmO share some similar
price territory, there is the possibility a Terminal Impulse pattern completed with ml; add"(:L3)" to the
existing Structure list.
Preliminary Analysis 3-57
Condition "b" - mO is at least 100%, but less than 161.8% of ml
**(if m3 is composed of more than three monowaves [or monowave groups])
If the first three monowaves of m3 do not retrace more than 61.8 % of m2, a Complex Correction may
be unfolding with the first or second monowave (immediately after the end of m2), moving in the same
direction as ml, representing an x-wave - - this might also mean m2 is "missing" a b-wave in its center
OR m2 is the 3rd-wave of a 5th-Failure Impulse pattern (Trending or Terminal); place ":F3/:c3/:L3/:L5"
at the end of ml. If more thanfive monowaves are required to retrace more than61.8% of m2,drop":F3"
and the "3rd-wave/5th-Failure" scenario as a possibility. NOTE: for the "missing" wave scenario, circle
the center of m2 and place ": 5 ?" to the left of the circle and "b:F3 / x:c3 ?" to the right of the circle. The
end of the Complex Correction will be confirmed complete when the market violently turns (in the
opposite direction of ml) and exceeds the 61.8% retracement level of m2. The termination of the
Complex Correction would be at the beginning of the violent turn-around. To account for all of these
possibilities, place "x:c3 ?" at the end of the first and second monowave (immediately after the end of
m2) which are moving in the same direction as m 1.
If the first mree monowaves of m3 retrace more than 61.8% of m2, m2 may have completed wave-
a of a Flat with a complex b-wave OR ml may have completed wave-3 of a 5th Failure Impulse pattern;
place ":F3/:5" at the end of ml to show these two possibilities respectively.
**(if m3 is composed of three monowaves [or monowave groups] or less)
If mOis at least 61.8% of ml and m3 is between 100-261.8% of m2, ml may be part of an Expanding
Triangle; place ":c3" at the end of ml. If m4 is more than 61.8% of m.3, add ":F3" to mi's Structure list.
If ml is not much more than 61.8% of mO and m2 is retraced less than 61.8% OR more man 100%
in a period of time equal to or less than that taken by m2 and the time it took for m2 to equal the length
of mO was equal to or less than that consumed by mO and m2's price coverage is more vertical than mO,
there is a good chance ml completed a Contracting Triangle or a C-Failure Flat; place ":L3/:L5" at the
end of ml to show mese two possibilities (respectively).
If m2 is retraced at least 61.8 %, but less than 100%, an Elongated Flat is the most likel y pattern which
concluded with m.2; place ";c3" at the end of ml.
If m2 (plus one time unit) is completely retraced in the same amount of time (or less) that it took to
form, a Trending Impulse pattern may have concluded with m2; place ":L5" at the end of m 1 's Structure
list. If m(-1) is shorter than mO and mO, when compared to m(-2) and m2, is not the shortest of the three
and the market approaches (or exceeds) the beginning of m(-2) in a period of time 50% or less of that
consumed by m(-2) through m2, a 5th Extension Terminal may have completed with m2; add ":sL3" to
the list of possibilities at the end of m 1.
Condition "c" — mO is between 161.8% and 261.8% of ml (inclusive)
If ml takes the same amount of time (or more) as mO OR m 1 takes the same amount of time (or more)
as m2, despite any other circumstances, ":F3" is a good possibility; place ":F3" at the end of ml.
If the time it took for m2 to equal the length of mO was equal to (or less) than that taken by mO and
m2's price coverage is larger and more vertical than mO and m(-4) is longer than m(-2), then ml may
have completed a Contracting Triangle; place ":L3" at the end of ml.
If the time it took for m2 to equal the length of mO was equal to (or less) than that taken by mO and
m2's price coverage is larger and more vertical than mO and m(-2) is at least 161.8% of mO and m(-2)
is at least 61.8% of m2 and one of m(-l)'s Structure possibilities is an ":F3," ml may have completed
an Irregular Failure Flat; place ":L5" at the end of ml.
If m2 (plus one time unit) is completely retraced in the same amount of time (or less) that it took to
form and the market approaches (or exceeds) the beginning of m(-2) in a period of time 50% (or less)
3-58 PretiminaryAnalysis
of that consumed by m(-2) through m2 and mO is longer than m(-2), an Expanding Terminal Impulse
pattern may have concluded with m2; add ":sL3" to the end of ml.
If ml (plus one time unit) is completely retraced in the same amount of time (or less) that it took to
form and m2 is at least 161.8% of mO and ml breaks through a line drawn across the end of m(-3) and
m(-l), a Running Correction could have completed with ml; place :L5 at the end of ml.
Condition "d" - mO is more than 261.8% of ml
If mO (minus one time unit) is less than or equal in time to m 1 OR if m2 (minus one time unit) is less
than or equal in time to ml, and as long as ml is not simultaneously less in time than both mO and m2.
ml may be part of a Zigzag or Impulse pattern, place ":F3" at the end of ml.
If ml takes the same amount of time (or less) as mO and/or ml takes the same amount of time (or
Iess)asm2andm(-2)isl61.8%ormoreofm(-l)andm(-l)isshorterthanm0andmlislessthan61.8%
of the distance from the beginning of m(-2) through the end of mO andif m3 is longer than m2, then make
sure m4 is shorter than m3 and if m3 is longer than m2. then make sure that 61.8% of m(-2) through m2
is retraced before the end of m2 is exceeded, THEN ml may be the x-wave of a Double Zigzag or a
Complex correction which begins with a Zigzag; place "x:c3" at the end of ml.
If ml takes the same amount of time (or less) as mO OR m 1 takes the same amount of time (or less)
as m2and mO is between 100-161.8% of m(-l)andm2is not more than 161.8% of m0andm4is at
least 38.2% ofm2 and if m3 is longer than m2, then make sure m4 is shorter than m3, THEN ml may
be the x-wave of a Complex correction which starts with a Flat and ends with a Flat or Triangle; put "x:c3"
at the end of ml.
If ml is less than or equal to mO in time and/or ml is less than or equal to m2 in time, place ":c3"
at the end of ml. If m(-l) and ml are almost equal in price or time or both (or related in either case by
61.8%) and m(-l) is shorter than mO and when comparing the price lengths of m(-2), mO and m2 you""*aM,*
find that mO is not the shortest of the three and not one of the three is more than 161.8 of the next smaller,
then ml may be part of a Complex Double Zigzag (which will involve one or two x-waves); add an "x"
in front of ":c3." If mO is not the longest of the three mentioned above, the x-wave is probably at the end
of ml, but if there are other Structure label possibilities forml other than ":c3," the x-wave could be at
the end of m(-l) or m(3). If mO is the longest of m(-2), mO and m2, the x-wave may be "missing" in the
center of mO, mark the center of mO with a dot and put "x:c3?" to the right of the dot and place ":s5!l to
the left of the dot; m(-2), in this instance, would be the beginning of the pattern and m2 would be the end.
If m(-2) through m2 constitute a Complex Correction with a "missing" x-wave, the market should retrace
between 61.8-100% of it before me next wave group (of me same Degree as the Complex Correction)
begins. If the "missing" x-wave Complex Correction is retraced less than 61.8% and then the market
exceeds the end of me Complex Correction, either m(-2) through m2 does not make-up such a pattern
or the Complex Correction is part of a Terminal Impulse pattern.
If ml (plus one time unit) is completely retraced in the same amount of time (or less) that it took to
form and m(-l) and ml are equal in price and time (or related by 61.8% in either case) and m2 is at least
161.8% ofmO and ml and m(-1) do not share any similar price range and m2 is not retraced faster than
it took to form, then ml may have completed a Running Correction^ place ":L5" at the end of ml. If
m(-2) is less than 161.8% of mO and m2 is retraced less than 61.8% and the ":L5" is used, ml
simultaneously terminates more than one Elliott pattern, each of consecutively larger degree.
If m2 is retraced less than 61.8% and m2's price coverage is larger and more vertical than mO and
m(-l) is no more than 161.8% of mOand m(-l) and ml share some of the same price range and at least
one of mO's Structure possibilities contains a ":3" (any variation), there is a small chance ml completed
Preliminary Analysis 3-59
a Contracting Triangle; place "(:L3)" at the end of ml. If m(-l) and ml are equal (or related by 61.8%)
in price or time or both and m(-l) and ml share some of the same price range, ml may have completed
an Irregular or C-Failure Flat; place ":L5" at the end of ml.
If m2 is retraced less than 61.8% and m2's price coverage is between 61.8% and 161.8% of mOand
m(-l) is shorter than mO and m(-l) is notmore than 161.8% of mO, ml may be an "x-wave" of a Complex
Corrective pattern; make note of that on the chart next to ml and add "x:c3" to mi's Structure list if it
is not already present.
If m2 (plus one time unit) is completely retraced in the same amount of time (or less) that it took to
form andm3 is not retraced more than 61.8% and m(-l) is shorter than mOandpartofm(-l) shares some
of the same price range as ml and mO, when compared to m(-2) and m2, is not the shortest of the three
and m3, in a period of time 50% (or less) of that consumed m(-2) through m2, closely approaches (or
exceeds) the beginning of m(-2), a Terminal pattern may have concluded with m2; add ":sL3" to the
Structure list at the end of ml.
Implementation of Position Indicators
(Rules to reduce Structure lists to a single possibility)
Position Indicators are the alphabetic companions ("c, F, L, s or sL") which precede most Structure
Labels (:3's and :5's). Position Indicators do just what their name implies, they describe - sometimes
generally, sometimes specifically - the position of a Structure Label within the context of surrounding
market action. Since two varieties of Structure labels exist (those that contain Position Indicators and
those that do not), specific phrases representing each variety have to be coined to allow for accurate and
intelligible coverage of this subject. The phrase, "base Structure label,"describes a Structure label which
is not preceded by a Position Indicator (i.e., solely a ":3" or a ":5" is present). A Structure label which
is preceded by a Position Indicator (i.e., :F3, :c3, :s5, :L5, etc.) will be termed a "positioned Structure
label." In the paragraphs to follow, if the Structure of a pattern is not important, is unknown or bares no
significance to the discussion, the truncated phrase, "Structure Label," will be used to encompass both
possibilities.
The Position Rules must be used whenever there are wave segments which contain multiple Structure
label possibilities. The use of Position Indicators is the only way novice Elliotticians can properly piece
together reliable Wave patterns. Surprisingly, this same approach is used by expert Elliott Wave
analysts, but most have internalized the process (through practice) to the point that they do not realize
they are applying these concepts; they probably do not even realize they are applying Elliott Wave
techniques in a standardized fashion - the same approach presented in this book.
The implementation of Position Indicators begins to intensify the bonds between adjacent wave
segments due to rules which guide Position Indicator coexistence. They begin to exert a degree of order
to the seemingly random fluctuations of market action. Position Indicators are the the next clarifying step
toward unraveling current market action.
If you find a wave on your chart which possesses multiple Structure label choices, the Position
Indicators will be needed to simplify your choices. These Indicators will assist you in eliminating all but
one Structure choice from mi's list. Once all waves on your chart possess only one Structure label, later
in this chapter you will learn how to use these S tructure labels to isolate important beginning and ending
points of Elliott patterns. For those of you who have had difficulty in the past deciding where to start
your analysis, this section will be the answer to your prayers.
3-60 Preliminary Analysis
Directions
By the time you reach this section, the internal Structure of numerous monowaves on your chart
should have been established. Unfortunately, the "Pre-Constructive Rules of Logic" are not always
capable of reducing the Structure choices of each wave to a single possibility. Therefore, it is likely
several waves on your chart contain two or more Structure labels. Studying each Position Indicator's
unique characteristics (described in this section) and logically integrating that label's implications with
surrounding Structure should enable you to eliminate all but one label from each wave segment.
Each Structure label in the listing to follow is separated by either a dash ("-")ortwoplus signs ("++").
All Structure labels connected with a dash are pan of the same, Standard Elliott Wave pattern. If
separated by double plus signs, a completed Standard pattern occurred right before the double plus signs
and another Standard pattern begins right after the second set of double plus signs. The action isolated
between the double plus signs constitutes an "x-wave." Explained in detail later, "x-waves" connect
multiple Standard Corrections to form one larger Complex Correction (a Non-Standardformation). For
a detailed explanation of Standard and Non-Standard patterns, refer to Chapter 8.
Under the sub-heading, "Position Indicator Definitions and Sequences," are descriptions of all
Positioned Structure Labels. Knowledge of the characteristics of each Position Indicator is valuable
when attempting to reduce amonowave's listing to one possibility. Acquaint yourself with these
descriptions so you can quickly spot and eliminate illogical Structure possibilities. Do not eliminate positioned
Structure labels (which are connected to questionmarks"?") or base Structure labels (which are theresult
of compaction) unless they are within the confines of a larger Compacted pattern.
If a Position Indicator's definition does not allowyou to reduce amonowave's Structure list to a single
possibility, below each label is a list of acceptable "before and after" S tructure labels which can be found
in partnership with the current label being analyzed. Tthe left-hand sequences usually start with
corrective variations (:3's). The right-hand sequences usually begin with Impulsive variations (:5's). The
darkened, larger positioned Structure label toward the middle of each sequence represents ml. Taking
note of the Structure choices surrounding ml and comparing them with allowable "before and after"
possibilities on your chart, you should be able to eliminate improper Structure labels for all current m 1 's,
leaving just one Structure label per wave. Keep in mind, once a pattern is compacted, its base Structure
label (:3 or :5) instead of its positioned Structure label (such as :c3, :sL3, :s5, etc.) may beneeded to create
Complex Elliott Corrections. This is another reason to retain base Structure labels on a compacted wave
group even after positioned Structure labels have been assigned to 'he pattern.
Position Indicator Definitions and Sequences
":F3"
This Structure label is me abbreviation for "First three(3)." An ":F3" either starts a series, occurs after
an "x:c3" or is found between two ":5's" (all variations). If you find two ":F3's" next to each other, a new
pattern (of a smaller magnitude) begins with the second ":F3." Circle the start of both ":F3's," but do not
attempt to connect the two until the second ":F3" can become part of a poly wave pattern using waves
which proceed it (a poly wave is an Elliott pattern composed of three or more monowaves). Examples
of where an ":F3" can be found under real-time conditions follow:
1. 7-F3-C3-L5 (circle start of F3)
2. ?-F3-c3-c3 (circle start of F3)
3. x:c3 ++ F3 - C3 - L5 (circle start of F3)
4. x:c3++F3 - c3 - C3 (circle start of F3)
5. 5-F3-5-F3-L5 (second5ai]east38.2%offirst5)
6. 5 - F3 - 5++x:c3 (second 5 at least 38.2% of Fust 5)
7. 5 - F3 - S5++x:c3 (s5mustbeatleast38.2%of5)
8. 5 - F3 - L5 (L5 must be at least38.2% of 5)
9. S5-F3-L5 (L5 must be more than 100% of s5)
PreilminarvAnalvsis 3-61
":c3"
This Structure label is the abbreviation for "center three(3)." A ":c3" can never start or end a
sequence; as aresult,alargeviolentmove will virtually neveroccurafter":c3." If the first wave in a group
contains more than one Structure label, and one of those happens to be a ":c3," you can eliminate it. If
trying to complete a three or five segment pattern and the last leg contains" :c3" as a possibility, the ":c3"
can be eliminated. If any sequence from lto7 below isused, circle the beginningof the ":F3." Following
are examples of where" :c3's" can be found under real-time circumstances and the conditions which must
be present for their proper positioning:
1. F3-C3 -C3-C3 (second or third c3 must be 9. 5 ++ X:C3* ++5 - F3 (c3 must be smaller than 5)
smallest or largest of all four) 10. 5 ++ x:c3* ++ F3 - c3 (c3 must be smaller than 5)
2. F3 - C3 - 5 (5 must be larger than c3; if 5 is 161.8% 11. s5 ++ X:c3* ++ 5 - F3 (c3 must be smaller than s5)
ormoreofF3.5shouldberetraced61.8%ormore) 12. s5 ++X:C3* ++F3 - c3 (c3mustbesmallerthans5)
3. F3 - C3 - s5++Xic3 (read sequence 2 guidelines) 13. L5 ++ X:c3* ++ F3 - c3 (c3must be larger than L5,
4. F3 - C3 - L5 (if L5 shorter than c3. F3 must be smaller than c3)
start of F3 or end of c3 must be exceeded swiftly)
5. F3 - c3 - C3 - c3 - L3 Oast c3 or L3 should be smallest
or largest of all five Structure labels)
6. F3 - c3 - C3 - Sl3 - L3 (13 must be the smallest of all five Structure labels)
7. c3 - c3 - C3 - L3 (L3mmtbesmal]estwiththelastc3thenextsmallestr^L3orlastc3mustbethelongestofaufoiff)
8. :3-X:c3**-:3 (x:c3shouldbelcssthan61.8%OTmoreihanl61.8%ofthefinit:3)
*In this position,the":c3" wouldbe considered an "x-wave" of aComplexCorrection. If the Strac lure labelssurrounding
":c3" agree wilh those in this series, you are allowed to add an "x" in front of ":c3." NOTE: A ":c3" can become an "x:c3,"
but the reverse is not allowed.
**In this position, the "x3" would be considered an "x-wave" of a Complex Correction. If the Structure labels
surrounding M:c3" agree with those in this series, you are allowed to add an "x" in front of ":c3." The underlined ":3_'s" represent
compacted polywave (or higher) corrections which should not contain Position Indicators. NOTE: A ":c3" can become an
"x:c3," but the reverse is not allowed.
"x:c3"
This Structure label is the abbreviation for "center three(3) in me x-wave position." An "x:c3" can
never start or end a sequence, as a result, if a large violent move (relative to surrounding activity) takes
place after an "x:c3," it is almost always wave-aof aNon-Limiting Triangle. An "x:c3" occurs between
Standard Elliott patterns as a connecting agent to help build single corrections into larger formations. If
the first wave in a group contains more than one Structure label in its list of possibilities and one of those
happens to be an "x:c3," you can eliminate it. If trying to complete a three or five segment pattern and
the last leg contains an "x:c3" in its list of possibilities, obviously the "x:c3" can be eliminated.
When working with compacted corrections (whose base Structure is ":3") like those found in series
3,4 and 9 below, thecomplexity of "x:c3" should never be higher than the complete Elliottpattern which
occurs before and after it. The "x:c3" will usually be one lower complexity level than the two patterns
which surround it, but on rare occasions (such as series 4), the middle ":3" may be two levels higher in
complexity than one or both "x:c3's" (see Chapter 7 for information on Complexity and Compaction).
The following are examples of where ":c3's" can be found under real-time circumstances and the
conditions which must be present for their proper positioning:
3-62 Preliminary Analysis
1. L3 ++X:C3 ++F3-C3 5. 5 ++ XX3 ++ 5 - F3 (x:c3 must be smaller than both 5's)
(extremely rare. c3 must be larger than L3 and F3) 6. 5++X:c3++F3 - c3 (x:c3 must be smaller than 5 and F3)
2. L3++X:C3 ++5 - c3 7. S5++X:c3++5 - F3 (x:c3 must be smaller than s5 and 5)
(virtually Impossible, c3 must be larger than L3 and 5) 8. s5++X:C3++F3 - c3 (x:c3 must be smaller than s5 and F3)
3. :3*++X:c3++:3* 9. S5 ++X:C3++ :3* (last :3 terminates pattern OR rare Triple
(last :3 is termination of pattern) Combination pattern forming - if so. after:! another x:c3 would occur)
4. :3* ++ X:c3 ++ :2* ++ x:c3 ++ :3* 10. L5 ++ x:c3 ++F3 - c3 (x:c3 must be larger than L5 and F3)
(last :3 is termination of pattern)
*Represents a compacted polywave (or higher) correction which should not contain an alphabetic Position Indicator
The Structure Series under list "3." and "4." above have underlines beneath their ":3's." Those
underlines denote ":3_'s" which represent Compacted Elliott corrections of polywave Complexity or
higher (if you are unfamiliar wim Compaction and Complexity and have at least read through the end
of Chapter 5, refer to Chapter 7 for a detailed discussion of these concepts). The corrections that these
":3's" represent could be Zigzags, Flats or Triangles. If a Triangle is involved in one of these Complex
formations it will almost always be positioned as the last ":3" in the list.
":sL3"
This Structure label is the abbreviation for "second to Last three(3)." An " :sL3" never begins or ends
an Elliott Wave pattern. This is a conditional Structure Label diat cannot be present without its partner,
the ":L3" label. Whenever you contemplate using ":sL3" there must be an ":L3" immediately afterward.
This grouping of labels always indicates one of two Elliott patterns is forming; a Terminal or a Triangle.
Therefore, the ":sL3" (along with its partner the ":L3") must be one of five consecutive corrective (:3's)
Structure labels with the ":sL3" the "second-to last" of the series. The following is the only position an
":sL3" can be found in during real-time circumstances:
1. c3-SL3-L3-7 (L3shouldnotbemorethan61.8%ofsl3ORitshouldbemorethanl00%ofsl3)
":L3"
This Structure label is the abbreviation for "Last three(3)." Unlike an ":sL3" (which must be
proceeded by an ":L3"), an ":L3" label does not insist on a preceding ":sL3." If it is the smallest wave,
an " :L3," requires its own price distance (plus one time unit) be completely retraced in me same amount
of time or less that the ":L3" took to form. Similar to the ":sL3" label above, an ":L3" must be part of
a Terminal or Triangle pattern and therefore requires a total of five" :3's" be found adjacent to one another
with the ":L3" the last of the five ":3's." By applying the Essential Impulse Construction Rules (Chapter
5, page 2) to the wave group, you will be able to decide whether the market is forming a Terminal or a
Triangle. If the market action obeys the Rules found on page 5-2, a Terminal is forming; if it does not,
a Triangle is unfolding. The following are examples of Structure labels which may surround an ":L3"
under real-time conditions (NOTE: none of the ":c3's" in Structure list" 1" or "2" [below] may have an
"x" in front of them):
1. F3 - c3 - c3 - c3 - L3 - ? (13 must be larger than second OR larger than third c3, circle end of L3)
2. F3 - c3 - C3 - SL3 - L3 - ? (L3 must be the smallest wave, it must be violently retraced; circle end of L3)
3. SL3 - L3 ++X:c3 ++F3 (sL.3 and c3 must both be larger for sL3 and c3 must both be smaller! than L3)
Preliminary Analysis 3-€3
":5"
This Structure label is simply pronounced "five" and can represent any Impulsive wave which does
not terminate an Elliott pattern. It can be the first leg of a Zigzag or Impulse pattern OR the middle leg
of a Complex Correction or Impulse pattern. This is one of the more common Structure labels and can
be found under a multitude of conditions. If you are examining the first" :5" of a series, the market cannot
retrace more than 61.8% of it and the market must then exceed the end of the ":5." If you find conditions
counter to this requisite, the ":5" (as long as it is not the only Structure label representing ml) should be
eliminated. Below is a complete listing of where ":5" can occur along with a parenthetical description
of its implications to surrounding price action:
1. ?- 5 -F3- 5 (the "?" indicates the start of the current partem OR there is no market action before the 5)
2. ? - 5 - F3 - SJ - F3 (s5 must be longer than 5 and both F3's are shorter than the previous Structure label)
2. 7 - 5 - F3 - s5++x:c3 (x:c3 must be shorter tlians5 and F3 must be shorter than both 5 and s5)
3. F3 - 5 - F3 - L5 (the two F3's cannot share any similar price territory and L5 must be longer than 5)
4. F3-5++XX3++F3 (x:c3 and first F3 must be smaller than5; second F3 almost always longer than x:c3)
5. F3 - 5 ++ x:c3 ++ 5 (x:c3 andF3 must be smaller than first 5; second 5 must be larger than x:c3)
6. c3-5 ++XX3++F3 (x:c3iseitherl61.8%ormoreof5orlessthan61.8%of5;ifx:c3islargerthan5
then F3muii be smaller thanx:c3; if x:c3 is smaller than 5, th en F3wouldalmost always be larger thanx:c3)
":s5"
This Structure label is the abbreviation for "special five (5)." It imposes specific limits on past,
present and future market action. An ":s5"can function as if it were an ":L5," but without the reversal
action normally required to confirm an ":L5." An ":s5" usually occurs in Complex Elliott formations,
but (under very limited conditions) it can be the 3rd wave of a Trending Impulse pattern with a 5th wave
Failure or with a 5th wave Extension. If you find a wave with only an ":s5" Structure label, two previous
labels (going backward in time) must be connected to the ":s5." The two sequences which must precede
the ":s5" are "5 - F3" or " F3 - c3." The following are examples of where ":s5's" can be found under
realtime circumstances:
1. 5 - F3 - S5 ++ x:c3 ++ F3 (x:c3 and the first F3 must be smaller than s5)
2. 5 - F3 - S5 - F3 - L5 (both F3's must be smaller than s5 and L5 must be longer than s5)
3. F3-C3- S5++X:c3 ++F3 (both c3andx:c3 must be smaller than s5;F3 will usually be larger thanx:c3)
":L5"
This Structure label is the abbreviation for "Last five (5)." Since an L5 is always the conclusion of
a larger Elliott pattern, the presence of an ":L5" can be the simultaneous termination of larger Degree
patterns. The minimum confirmation of an ":L5" requires that the trendline drawn across the end of mO
and m(-21 be broken in a period of time equal to that of the" :L5" (plus one time unit) or less. To connect
an ":L5" to previous market action, the Structure label immediately before the ":L5" must be an ":F3"
or a ":c3." If you find an Impulsive Structure label (:L5, :s5 or :5) immediately before the ":L5," circle
the end of both waves. When you reach Chapter 4, search for a possible Structure Series which ends with
the earlier ":L5, :s5 or :5." Once the earlier Impulsive Structure label has been integrated into an Elliott
pattern, Compact the pattern to its base Structure (Compaction is discussed in Chapter 7), dot the start
3-64 Preliminary Analysis
and finish of it, then attempt to connect the second Impulsive Structure with the Compacted pattern and
earlier Structure labels. Examples of where ":L5's" occur under real-time conditions follows:
1. 5 - F3 - L*5 - ? (F3 must be shorter than both 5 and L5; circle end of L5)
2. s5 - F3 - L5 - ? (L5 must be longer than s5, preferably L5 will be 161.8%ormoreof s5;circleendof L5)
3. F3 - c3 - L5 - ? (if c3is 138.2% or more of F3.L5 will almost certainly be shorter than c3;circleend of L5)
4. F3 - c3 -L5 ++ x:c3 ++F3 (both c3 and x:c3 must be larger than L5, F3 must be smaller than x:c3)
Pattern Isolation Procedures
If there are no ":L5's" or ":L3's" on your chart, keep updating the price action each day - applying
the Retracement and Pre-Constructive Rules - until there is a wave with only an ":L5" or ":L3" (or both)
attached. Once an " :L5" or": L3" has been identified, the Pattern Isolation Procedures can be initiated.
From the far left of your chart, begin a forward search for the first wave which contains only an ":L5"
or an ":L3" or both; when you have found the first occurrence, circle the end of that wave (see Figure
3-31), it will probably be the end of an Elliott pattern. [The wave just circled will usually be followed
by a significant, maybe even violent, market move in a relatively short period of time. Be on the look out
for such activity; itis a reliable indication of recent Elliottpattern termination] By applying the Position
Rules and techniques discussed in this section, that circled wave will now assist you in identifying the
start of an Elliott pattern.
From the circled point, move backward three Structure labels. If that new wave contains only one
label and it is one of the following, ":F3, x:c3, :L3, :s5 or :L5," stop there; you may have found the
beginning of an Elliott Wave pattern. If the third wave back possesses more than one Structure label,
Figure 3-31
Start
of Data'
Significant price move
occurred immediately after
the circled ":L3." The
same type of action is
expected after an ":1.5."
, Begin a forward search
\An ":L3" is found
* here, circle the
end of the wave
for an ":L5" or ":L3"
Pretiminarv Analvsis 3-65
Figure 3-32
Start
of Data'
3. Continuation of 2. It the third Structure label back is
search for ":F3, x:c3, not an ":F3, x:c3, :L3, :s5 or :L5,"
:s5 or :L5" _ continue moving backward until
you find one of the listed labels
4. An ":F3" is found here, circle
thejjsginniiujof this wave
or the single Structure label which it does possess is not one of those listed above, continue moving
backward one wave at a time until you find a wave with a single Structure possibility which is one of those
listed above. When you finally find a wave which meets the above requirements and it is an ":F3," circle
the beginning of that wave; if it is an "x:c3, :L3, :s5 or :L5," circle the end of that wave (refer to Figure
3-32 for a demonstration of this process). Later, after a pattern has been tested and proven to be
legitimate, the circles encasing the pattern should be turned into dots (darkened). Since all Elliott patterns
require an odd number of waves to complete, count the number of waves betweeen the two circled points.
If an even number of waves is present, countinue moving backward in search of another ":F3, x:c3, :L3,
:s5 or :L5." If an odd number of waves is present, you can proceed to the next page.
Figure 3-33
Start
of Data'
Beginning the next forward
search for an ":L5" or ":L3""
Original
(or most recently
identified) ":L3"
Possible Elliott pattern found
3-66 Preliminary Analysis
Figure 3-34
This high is a solid circle due to the
compaction of a previous pattern.
Moving backward from an identified ":L5," aprevi-
ously circled high is found before an ":F3, x:c3, :L3,
:s5 or :L5" is found. If the number of waves between
thecirc led points is"threeormore,"anEUiott pattern
may be unfolding. Make sure all waves between
those two points possess only one Structure label.
After you have accomplished that task, return to the ":L5" or ":L3" you most recently circled; then,
move forward in time until you get to the next wave which is labeled widi only an ":L5" or ":L3" (or
both) and repeat die above process (see Figure 3-33). If mere is not another ":L5" or ":L3" to work with,
proceed to Chapter 4 (and beyond) to verify and compact the patterns currently isolated.
When you repeat this process, frequently a high or low is found which has already been darkened
(dotted) from previous analysis. That means the Current pattern actually began at the previously dotted
point (Figure 3-34) OR the previously dotted point is the end of a Compacted wave group which, as a
whole, is the same Degree as the current ":L5" or ": L3." [Theprevious statement would be true even ifthe
":L5" or ":L3" were one Complexity Level different from the Compacted pattern (see Chapter 7, page
4 for details on Compaction and Complexity Levels)], The Compacted pattern will eventually become
an integral pan of a larger pattern terminating with the ":L5" or ":L3." If (he current ":L5" or ":L3" oc-
curs immediately after a dotted point (like in Figure 3-35), not enough waves occurred between the points
to create an Elliott pattern. Therefore, the base Structure of the dotted point should be used for grouping
waves when you proceed to Chapter 4. Usually, it is clear which of me two circumstances is unfolding.
No matter what type of grouping occurs, the current ":L3" or ":L5" should conclude an Elliott pattern.
Figure 3-35
Compacted pattern
The above compacted pattern is
part of this larger formation
End of a previously
Compacted Elliott pattern
(notice a filled circle is used
instead of an empty circle);
L5 immediately follows
■There must be at least three waves (or wave
groups) between two circled or dotted points
beforealarger Elliott Wave pattern can exist.
If less than three waves (or wave groups) are
present, the base Structure of the earlier dot-
led point will have to be integrated with the
L5 or L3 to become part of a larger pattern.
The larger pattern wil 1 end with the L5 or L3.
Preliminary Analysis 3-67
Special Circumstances
When in the process of simplifying Structure lists, if you find a compacted pattern's price action
exceeding its own beginning before it terminates (see Figure 3-36), the base Structure of the compacted
pattern is unequivocally corrective in nature (a ":3") no matter what the Pre-constructive Rules suggest.
Therefore, if the condition presented below in Figure 3-36 is found on your chart, do not attempt to apply
the Pre-Constructive Rules of Logic during the Reassessment process; simply retain the compacted
patterns base Structure instead. When trying to integrate these special compacted patterns with
surrounding market action, use the Position Rules to help you decide if only the base Structure of the
compacted pattern is required or if a Position Indicator is necessary to connect it to a larger Elliott pattern.
Figure 3-36
The beginning of the pattern was exceeded
before the pattern reached its own end. This
type of behavior guarantees the base Smic-
tuteis corrective (: 3) nomatter what thePre-
Construcuve Rules might suggest.
You may run into difficulty when piecing together multiple polywave (or higher) patterns if you do
not understand Complexity and its impact on market behavior and pattern interaction. Make sure
adjacent patterns (represented solely by base [:3 or :5J or positioned Structure labels [:F3, :L5, etc.])
are never more than one Complexity Level removed. For example, if mO, ml and m2 were previously
identified as Standard Elliott Wave corrections and mO were Complexity Level-1, ml were Level-2 and
m2 were Level-1, the three could be combined into a larger Standard Elliott Correction. If mO were
Level-1, m 1 were Level-2 and m2 were Level-4, the difference between m 1 and m2 is two (2) Complexity
Levels; that is not allowed under the Neely Method of pattern formulation.
"Degree" is another important concept which must be understood and applied during the
amalgamation of various wave segments. If you are unfamiliar with Degree and its application to price action, read
the "Rule of Similarity and Balance" on page 4-4 before attempting to eliminate Structure labels from
your chart. That section of Chapter 4 will assist you in detecting and combining waves of the same
Degree. Chapter 7, page 11, goes into more detail on the Degree concept; as your understanding of
Degree improves, you will want to become acquainted with that section, also.
3-68 Prsiiminary Analysis
Synopsis of Chapter 3
Bt!!'1:!'!''!!!'!!!!"!!!!!'!!''!'!'!!!!!!!!'"! IHTIIMII MM
The complexity of Chapter 3 warrants a brief overview of all the processes covered. When beginning
actual market analysis, first construct a chart of cash data using approximately 60 data points.
Reconstruct a new chart (starting from an important top or bottom found on the first chart), but this time employ
the Rule of Proportion. Using dots, identify the end of all monowaves and apply the Rule of Neutrality
where necessary. Pick a recent monowave to analyze (do not go back more than 20 monowaves);
implementing the Rules of Observation, place Rule, Condition and Category Identifiers at theend of each
important monowave. Next, read through the appropriate section (dictated by the Rule and Condition
[ and sometimes, Category] Identifier) under the Pre-Constructive Rules of Logic and begin transforming
the Rules into Structure labels. Locate any monowaves which contain more than one Structure label and,
using the Position Indicator Definitions and Sequences section, eliminate all but one Structure label
from the end of each ml and then apply the "Pattern Isolation Procedures." Your chart will then be
prepared for Chapter 4 where the grouping of Structure labels into an Elliott Series is required.
Preliminary Analysis 3-69
Intermediary Observations 4-1
Monowavc Groups 4-1
Rule of Similarity and Balance 4-3
Price 4.4
Time 44
Rounds (1 through 3) 4.5
Zigzag "DETOUR" Test 4.8
What's Next? 4_8
^f
The previous chapter, Preliminary Analysis, provided you with a strong foundation on which to
continue your search for legitimate Elliott patterns. These Elliott patterns will be constructed from
groups you isolated based on rules listed at the end of Chapter 3 (see "Pattern Isolation Procedures," page
3-65). To continue a wave group's qualification process in becoming an Elliott pattern, the Structure
labels of the isolated group must adhere to a rigid sequencing scheme. In addition, certain tests will be
applied (before proceeding to Chapter 5) to make sure all wave segments are of the same Degree.
Monowave Groups
As you already know, monowaves are the building blocks of the Elliott Wave Theory. Unfortunately,
if studied individually, monowaves only provide you with a limited perspective on the future course of
a market. A greater understanding of market possibilities can be derived by grouping monowaves which
exhibit specific Structure label sequencing (which the wordpolywave was coined to describe). This
specific sequencing is guided by the Position Indicators preceding each Structure label.
Just like monowaves, poly waves can either be Corrective or Impulsive in nature. It takes at least three
monowaves to create a Corrective polywave. At least five monowaves are needed to create an Impulsive
polywave. At the top of the next page, Figure 4-1 illustrates an idealized Corrective pattern while Figure
4-2 depicts an idealized Impulsive pattern. As can be ascertained from a study of Figures 4-1 & 4-2,
Impulsive patterns occur when a market is gaining or losing ground (similar la Directional action, see
Chapter 3) while Corrective patterns usually travel sideward (similar to Non-Directional action).
Intermediary Observations 4-1
Figure 4-1
Three monowaves
Polywave •« \\ Jy "%\ ^- c°mbined >" *e pr°pe'
m i\ v / -s\ ^r fashion create one (1)
Coneclive polywave.
Figure 4-2
Five monowaves com-
Polywave •£ $/7 >- bincd in "^ proper
^* .n / / ^r fasnion create one (1)
Impulsive polywave.
Figure 4-3
A.
B.
C.
D.
E.
:5-:F3-:?5-:F3-:L5
:5-:Yi-:1St
:F3-:c3-:?5'
:F3-:c3-:c3-:?3-:?3!
:F3-:c3-:c3-:?3-:L3
Standard Patterns (for all students)
Impulsion (trending nature, refer to page 5-2)
Zigzag (corrective nature, refer to page 5-19)
Hat(correclive nature, refer to page 5-17)
Triangle (corrective nature, refer u> page 5-23)
Terminal (conclusive nature, refer to page 5-2)
'If the last Structure label of a Standard Corrective Series does not contain an "L" Position Indicator, the Scries
will need to be Compacted to a ":3" and made part of one of the Non-Standard Patterns lilted helow
Non-Standard Patterns (for advanced students)
R :3!++x:e3(smallcr')++:3' Any "Double" Grouping (corrective, Chapter 8)
G. :33++x:c3(larger')++:3-' Double Three Running (corrective, sec Chapter 8)
H. :32++x:c3(si7.e?!)++:3-'++x•.c3(size?5)++:3', Any "Triple" Grouping (corrective, see Chapter 8)
'Could he any Standard Flat, Zigzag or Expanding Triangle (when the "x:c3" is larger than
the previous ":3," a Zigzag should not occur before or after the "x:c3")
3Could be a Standard Hat or Triangle (if first ":3" is a Triangle, it should be Expanding)
'Could be any Standard Corrective pattern. 5The "x:c3" could be larger o£ smaller than die previous r:3"
*"x:c3" must be smaller than previous ":3" 7"x;c3" must be larger than previous ":3''
4-2 Intermediary Observations
With singular Structure "lists" inhabiting the end of numerous monowaves on yourchart, locate those
wave groups created during the "Pattern Isolation Procedures" at the end of Chapter 3. Of the groups
isolated, always choose among those which contain only three or five monowaves, those three or five
adjacent monowaves may form a Standard Elliott polywave pattern (as you gain experience, some or all
of the three or five segments chosen could be compacted wave groups). IMPORT ANT: Of those wave
groupings chosen, work first on the group which consumes the least overall price and time.
The deciding factor in creating a polywave is the presence of a Structure Series found among the
isolated string of monowaves. A Structure Series is an organized listing of properly Positioned Structure
labels which combine to form an Elliott pattern (see top of Figure 4-3 on previous page). Through the
process of Compaction, Structure Series' will allow you to amalgamate many simple Elliott Wave
patterns into more complex patterns in a logical, natural fashion.
Figure 4-3 illustrates the Position Indicator sequencing and the exact number of ":3's" and ":5's"
which must be present to create a Standard or Non-Standard Elliott pattern. If some of the waves you
are dealing with are compacted and only possess their base Structure label, the compacted pattern's base
Structure can represent any legal Positioned Structure label of the same Class (for a definition of "Class"
refer to page 2-4). Any pattern above monowave development must conform to one of the four Standard
Structure Series' or oneofthe various varieties of Non-Standard Series'. [Notice, in the last sentence only
four Structure Series'were mentioned. Five Standard Structure Series' are listed in Figure 4 -3 , but only
four of those Series' are actually unique. The last Standard Series, ":3-:3-:3-:3-:3," is repeated and can
be used to create two separate patterns with vastly different implications. Depending on the shape of
the waves grouped {and other conditions introduced in Chapter 5), you will be able to decide which of
the two patterns is unfolding.] Figure 4-3 illustrates and names these combinations allowing you to
further define development on your chart. Notice, some Structure labels in Figure 4-3 do not contain
Position Indicators. When Position Indicators are not present in this official listing, any Position
Indicator "legally" allowed in front of the Structure label in question could be used.
When comparing the isolated wave groupings on your chart with those in Figure 4-3, and your
grouping is composed strictly of monowaves, one of the "Standard Patterns" at the top portion of Figure
4-3 should be appropriate. If you have already Compacted some previous price action and an "x:c3"
occurs anywhere in your isolated wave group, one of the Non-Standard Patterns will take effect.
No matter how large or time consuming, all grouped market action pegged for analysis must match
one of the Structure Series listed in Figure 4-3. Your goal is to find a Structure Series listed which mimics
the one on your chart. Ultimately, the identification of Structure Series' is paramount in your search for
larger, reliable wave patterns. Once a series has been found, many additional tests (some covered
immediately after this section and some covered in Chapters 5-12) must be conducted to elevate your
monowave group to polywave status.
Rule of Similarity & Balance
Once an acceptable Structure Series has been identified, the Rule of Similarity & Balance must be
considered. All Elliott patterns depend on combininglike with like. Waves that are not "similar" cannot
be combined to complete a larger Elliott formation.
Market action develops under two general categories - price and time. For two adjacent waves to be
"similar" the relationship between the two waves should fall into a specific relational range based on
price or based on time or a combination of the two. Similarities of price and time can simultaneously
occur between adjacent waves but are not necessary to pass inspection under this Rule.
Intermediary Observations 4-3
When comparing adjacent waves within an Impulse pattern, similarities of time are more common
than price; in Corrective patterns, similarities of price are more common than time. To decide whether
two adjacent waves are "similar" is a matter of simple mathematics. Following are instructions on how
to detect similarities based on the two elements (price and time) which define market action.
Price
For there to exist uprice similarity between two adjacent waves, the smaller of the two waves should
be no less than one-third (1/3) in price of the larger wave.
Time
For time similarity to be present between two adjacent waves, the shorter time pattern should not
be less than one third of the longer time pattern.
If you have been following along with your own chart and have one or more isolated groups which
adhere to an Elliott Structure Series, only investigate those Series where all adjacent waves adhere
to one or both of the above Rules of Similarity and Balance. If in any comparison, neither of the above
Rules is obeyed, the likelihood two adjacent waves are of the same Degree is very slim. When two waves
are not of the same Degree, they cannot be directly or immediately connected to form a larger Elliott
pattern; Compaction of several or more smaller waves will first be required.
Figure 4-4
4'
100%
Price
y.J.
4-4 Intermediary Observations
m2 should be considered a
smaller Degree pattern due
to its less than 1/3 relation
in price and time to ml
m2 should be considered a
smaller Degree pattern due
to its less than 1/3 relation
in price and time to ml
In Figure 4-4, the Rule of Similarity and Balance is not adhered to in either respect indicating ml and
m2 are not of the same Degree; therefore, m 1 and m2 cannot be directly combined. To eventually include
ml and m2 within the same Elliott pattern, m2 has to be connected to waves of similar price and time.
Those waves will have to be grouped and identified as an Elliott pattern, tested, confirmed and then
reassessed. Afterward, if the waves grouped with m2 consume enough time orprice to relate to m 1 (based
on the Rule of Similarity and Balance), ml and m2's group can be combined with surrounding action to
create a larger Elliott pattern. In Figure 4-5, both conditions of the Rule of Similarity and Balance are
obeyed indicating the two waves might be of the same Degree. Consequently, if S trueture labels allow,
ml and m2 may be directly attached as part of a larger Elliott pattern. NOTE: Just because two waves
adhere to the Rule of Similarity and Balance does not mean they are of the same Degree, it just indicates
they might be.
Figure 4-5
m2 more than 1/3 the price
and time of m 1, as a result
it could be considered the
.same Degree as ml
m2 more than 1/3 the price
and time of m 1, as a result
it could be considered the
same Degree as ml
To illustrate how the identification of Structure Series' assists you in the wave building process over
an extended period and how larger and larger Elliott patterns develop and are detected, the following
Rounds have been created:
Round 1
Using the Rules and techniques described in Chapter 3, all monowaves in Figure 4-6 have been
Structurally labeled. Isolated between the beginning of Chrono-2 and the end of Chrono-4, the Series
"F3-c3-L5" occurs. Looking at die Table in Figure 4-3, that Series can be identified as a possible Flat
pattern. Beginning with Chrono-9 and ending with Chrono-11, a Zigzag Series (5-F3-L5) is found.
Chrono-12 through Chrono-16 form an Impulse Series.
Intermediary Observations 4-5
Figure 4-6
(an updated version of Figure
3-18, taken from page 3-14)
:L5
:L5
Round 1
:F3
Flat Series
:c3
,:F3
:s y
/'"V
9/ :F3
F3
1
1
:5 \ :F3 /
14\lsA /
* £
1
1
Impulse Series
Zigzag Series
Figure 4-7
:L5
:£2
Round 2
5
:S a 1
J :E2
1 lmportanllow
1
1
:F3
:F3
Corrective Flat Series
■hi
1
1
I
Trending Impulse Series
4-6 Intermediary Observations
Round 2
All wave groups (the Flat, Zigzag and Impulse) identified in Round 1 have been thoroughly tested
and have proven their validity. Therefore, they were Compacted (see Chapter 7 for details) to their base
Structure of ":3" or ":£>" (the underline represents Complexity level; refer to Chapter 7) and the circles
encasing the Elliott wave pattern have been darkened. Figure 4-7 displays these transformations.
On your return to the Retracement Rules in Chapter 3, all Compacted patterns must be analyzed as
if they were single waves containing one Structure label. Initially, the Compacted patterns must go
through reassessment to detect for the possible existence of "missing" waves. Also, the two Structure
labels adjacent to the Compacted pattern must be reassessed to decide if the changed environment
(caused by the Compacted pattern) has had any influence on surrounding market Structure.
In Figure 4-7, all of these procedures have been carried out with the results exhibited therein. Notice,
just as directed in Chapter 3, all labels and markings between the boundaries of the Compacted patterns
have been eliminated.
Round 3
During Round 3, no Structure labels containing "L" Position Indicators are present. Until additional
price action is plotted and a new ":L5" or ":L3" appears, no further progress can be made with pattern
construe lion. What can be derived from the chart (Figure 4-8) as it currently stands. An uptrend began
with Chrono-1 which, according to the table in Figure 4-3, cannot terminate until another Impulsive
advance unfolds (very valuable information indeed). Under these circumstances, you know the proper
strategy would be to stay long until another advance satisfied the required Impulsive characteristics.
Figure 4-8
Intermediary Observations 4-7
Zigzag "DETOUR" Test
Whenever you find an ":L5" which concludes a possible Zigzag pattern, always be aware that the
Zigzag could really be the last three segments of an Impulse pattern. For example, in Figure 4-7 after
the first ":F3" (moving forward from the low marked "Important Low") a ":5 - :F3 - :L5" Zigzag Series
can be found. In isolation, the waves make a legitimate Zigzag pattern. On the other hand, if you connect
market action preceding the first leg of the Zigzag, an Impulsive Series can be created beginning at the
"Important Low."
Whenever you are working with Zigzags, always check the two Structure labels preceding to assure
no Impulsive pattern is accidentally overlooked. If an Impulse Series can be assembled by connecting
two previous Structure labels to the Structure Series (see Figure 4-9), always test the Impulsive pattern
(applying the guidelines described in Chapters 5-12) before attempting to work with the Zigzag. If die
Impulse pattern obeys typical construction Rules, use it. If the Impulse does not adhere to all the Rules,
drop the first two Structure labels, return to the Zigzag scenario and test it for reliable construction. If
die Zigzag is well constructed, use it. If the Zigzag does not obey the Rules, skip that section of the chart
and work on another area until surrounding action clarifies the situation.
Figure 4-9
Zigzag Series at the end
of an Impulse pattern
Whenever working with a Zigzag, to guarantee an Impulse
pattern is not overlooked, make sure the two Structure labels
before the Zigzag cannot be used to make a larger Impulse
pattern. If an Impulse Series is present, proper testing of the
pattern must occur before considering the Zigzag possibUity.
If the Impulse idea is invalid, return to the Zigzag scenario.
What Next?
Once you reach this point, you have identified a possible Elliott pattern which will now need to be
run through a battery of tests to see if it really is what it appears to be. If your wave group obeys one of
the Standard Patterns Series' in Figure 4-3, move on to Chapter 5. If the wave group follows one of the
Non-Standard Pattern Series' and you feel you have enough experience to tackle a Complex pattern,
proceed to Chapter 8.
1st 2nd 3rd 4th 5th
Possible Zigzag
5 - F3 - 5 - F3 - L5
I I
Possible Impulse pattern
4-8 IntermediaryObservations
Central Considerations 51
Construction of Polywaves 5-1
Impulsions 5-2
Essential Construction Rules 5-2
Application to marketaction 5-3
Extension Rule - (the Litmus Test) 5-4
Introduction of'Progress Labels to the Wave Group 5-4
Conditional Construction Rules 5-4
Ride of Alternation 5-5
Rule of Equality 5-8
Overlap Rule 5-8
Review 5-9
IBrffisMsEg MmS -Impulsions 5-9
Channeling 5-9
Fibonacci Rclationstops 5-11
Isi Wave Extension 5-11
3rd Wa ve Extension 5-12
5tk Wave Extension 5-12
Degree 5-12
Realistic Representations 5-13
Corrections 5-16
Introduction (/Progress Labels to the Wave Group 5-16
Essential Construction Rules 516
Flats 5-17
Strongb-wave 5-18
Normal b-wave 5-18
Weakb-wave 5-19
5-19
Normal 5-21
Truncated 5-21
Elongated 5-22
Triangles 5-23
Conxracune 5-27
I. Limiting 5-28
a. Horiionlal variation 5-28
b. Irregular variation 5-30
c. Running variation 5-30
II. Non-Limiting 5-30
Post-Triangular Thrusts 5-31
Exptmdini 5-31
I. Limiting 5-32
a. Horizontal variation 3-32
b. Irregular variation 5-33
c. Running variation 5-33
H. Non-Liniiting 5-33
Conditional Construction Rules - Corrections 5-34
Alternation 5-34
Price 5-34
Time 5-34
JBr«fflMmg Ptofimi - Corrections 5-34
Channeling 5-35
Fibonacci Relationships 5-35
Flats 5-35
Strong b-wave 5-35
Normal b-wave
Weak b-wave
Zigzag
Normal
Elongated
Truncated
5-35
5-36
5-36
5-36
5-36
5-36
Triangles 5-36
Degree
Realistic Representations - Corrections
5-37
5-37
Until now, die main focus of the book has been on monowaves, a very basic concept. The more
advanced stages of Wave Theory application require a "group" mind set, Monowave combinations. The
"Structure Series" was a step in that direction. To continue the analytical process, more specific rules
will need to be introduced to further differentiate between Impulsive and Corrective action. Exacting,
bottom line rules will be presented for every standard Elliott pattern and its respective variations.
As you know from the previous section, each Structure Series represents a particular Elliott pattern.
One of die more important aspects of pattern identification depends on appearance. Unfortunately,
because of numerous Impulsive and Corrective pattern variations, mere is no "standard" way of
diagraming either category that reflects the realistic appearance of each variation. Elliott, in all of his
writings, used illustrations similar to those found in Figure 5-1. The figures on the left were intended
to represent Impulsive patterns. Those on the right were drawn to represent a certain type of Corrective
pattern. The unrealistic nature of these diagrams tends to wrongly influence the perceptions and
expectations of die beginning student on how wave patterns should really look. Avoiding this problem,
which has continued up to the present, required diis book contain hundreds of diagrams which do reflect
realistic wave behavior. These diagrams will allow you to quickly become accustomed to the correct
appearance of Elliott patterns, thus significantly diminishing die period between preliminary
investigation and actual application of the Theory to real-time market action.
Construction of Polywaves
We have been working with "Structure Series" combinations to detect possible polywave
development, but no rules have been presented to explain how Polywaves should look or behave based on their
Class. Let's do diat now.
Central Considerations 5-1
Figure 5-1
Standardized Impulse patterns (very unrealistic)
Impulsions
There are specific guidelines which apply to Impulse patterns that are not present in most Corrective
patterns. Presented here will be behavior confining rules designed to solidify (or negate) groups of
monowaves into patterns which are "Impulsive in nature."
Essential Construction Rules
Market action must adhere to the following rules to be considered a candidate for Impulsive behavior:
1. Five adjacent segments must be present (monowave or larger), which meet the
Structure Series requirements of a Trending or Terminal pattern.
2. Three of those five segments must "thrust" in the same upward or downward direction.
3. Immediately after the first segment, a minor move in the opposite direction takes
place (the second segment). This second segment can never retrace all of the first
4. The third segment must be longer than the second.
5. immediately after the third segment, a minor move in the opposite direction of the
third (but the same direction as the second) takes place (segment four). The fourth
segment must never retrace all of the third.
6. The fifth segment will almost always be longer than the fourth, but only has to be
38.2% of the fourth segment (price wise). When the fifth segment is shorter than the
fourth, the fifth segment is termed a "failure."
7. When the vertical price distances covered by the first, third, and fifth segments are
measured and compared, the third does not have to be the longest, but it can never be
the shortest of the three segments.
If a single one of the above rules is not adhered to, the market action being analyzed, by default, must
be Corrective in nature, not Impulsive OR your wave group is incorrectly combined. If the pattern you
are analyzing does not follow the above criteria, proceed to the Correction section (page 5-16).
5-2 Central Considerations
Application to market action
We now have some general, broad application rules at our disposal for the detection of potential
Impulse behavior. To make use of them, we need to work with five adjacent, "similar" monowaves.
Figure 5-2 has multiple "five monowave" groups forus to study. Once we have gone through each pattern
in the illustration, you should get out yourown"wavechart" and practice the application of the "Essential
Construction" rules on groups of real-time monowaves. These are the most critical rules of the entire
Theory. You should not continue with your study of "Mastering Elliott Wave" until you are able to
correctly apply these rules to real-time market action.
Making use of the "Essential Construction" rules, let's take a look at some monowave combinations
and decide which patterns have Impulsive potential and which do not. Remember, if a pattern does not
meet all of the rules, it cannot be Impulsive, it must automatically be Corrective. In Figure 5-2:
A fails the test since the 2nd segment retraces all of the first (see Rule 3, page 5-2).
B does not break any of the rules, so is possibly an Impulsive pattern.
C also obeys all of the aforementioned rules.
There are only four segments in D, five are required (see Rule 1).
In E, ihe 3rd segment is the shortest of the three advancing segments, an Impulsive pattern is impossible (see Rule 7).
F is up for consideration.
In G, the 4th segment retraces all of me 3rd, mat is not allowable (see Rule 5).
There are no rules broken in H, I, nor J (in J, the 5m segment is shorter than the 4th, creating a '■failure").
K is acceptable in all respects except for one, the third segment is not longer than segment two (see Rule 4)
Figure 5-2
• Too large
■ Too small
5th segment
"failure"
Too
short
Central Considerations 5-3
Extension Rule - (the Litmus Test)
An Extension is an essential element of any reliable Impulse pattern and is exclusively associated
withthem. The term Extension is used to describe "thelongest wave" in an Impulsive grouping. The
presence (or lack) of an Extended wave is the analytical "fork in the road," delineating Impulsive from
Corrective behavior. This test will virtually always separate real Impulse patterns from imitations
(Corrections).
By following all of the rules up to this point, you should be working with a group of five monowaves
(or higher, if your abilities have increased). Among this group, one wave should be noticeably longer
in price than all the others. The longest wave will be the Extension candidate. To actually qualify as
an Extension, the longest wave should be at least 161.8% of the next longest wave (price-wise).
If apattern has followed all of the Impulse rules up to the present, including the Extension Rule, move
on to the next section in this chapter to verify whether the wave group meets further Impulsive
requirements. [NOTE: If this test is passed, but you still feel the pattern is corrective (based on
severe retracement of the move by later market action or other more subde observations, which will be
explained later), a wave hidden in the price action may be the reason for the odd Corrective
construction (see Missing Waves, page 12-34).]
On the other hand, if any of the rules up to this point were not followed, it would virtually guarantee
the pattern is corrective with two important, but rare exceptions:
1. When the firsj segment in a pattern is the longest, it might be slightly shorter than 161.8% of the
third segment, but the third will not conclude higher than 61.8% beyond the end of the first.
2. When the third segment is the longest, but less than 161.8% of the first, and the fifth segment is
shorter than the third, there is the remote possibility the market is forming an extremely rare
Terminal Impulse pattern variation (see Terminal Impulse, Wave-3 Extended, page 11-6).
When the Extension Ruleis broken, and neitherof the two above exceptions is unfolding, the market
is absolutely experiencing a Correction; proceed to the "Corrections" section. If one of the above two
situations does appear to be unfolding, continue with your assumption the pattern is Impulsive and
proceed to the next heading.
Introduction of Progress Labels to the Wave Group
If your pattern has passed the Extension test, you are finally ready for the placement of Progress
Labels to your price charts. Progress Labels serve the purpose of testing market activity for the presence
of very specific attributes. The testing will provide you with enough "ammunition" to allow for confident
conclusions and the eventual solidification of the proposed wave pattern.
Here is how the Progress Labels should be placed: The first segment of your pattern will be
considered wave-1. The second segment will be wave-2, the third wave-3, the fourth wave-4 and the fifth
wave-5. Place these labels in order on your chart at the termination of each wave.
Conditional Construction Rules
ni'j/llllllllllV,!!! I!,,!!!!'!!!!!!'!!!'!'!!!!!!!!, !|'| ! | |
There is a great deal of difference between market action which does not break any of the Essential
Impulse Construction rules and an actual impulse pattern. The Essential Impulse Construction rules,
discussed a few headings back, are for general application to all Impulse wave patterns. They are the
first rules to employ on market action believed to be Impulsive in nature. If a single "Essential" rule is
5-4 Central Considerations
broken, there is no need to proceed to the next stage of Impulse examination. Automatically assume the
pattern is Corrective, or you have started your analysis from an improper point in the count, or all of the
monowaves involved in the sequence are not of the same degree (for details, see "Degree," page 5-12).
If you are following along with your own real-time price chart, all the rules after this point will be
dependent on the Progress Labels you recently placed on your wave pattern.
Rule of Alternation
The concept of Alternation is one of the most important, guiding influences on market action and
is at the very foundation of the Wave Principle. Without it, the Theory would be basically useless. It
applies to virtually all aspects of application (for additional information on Alternation, see page 8-19).
The Rule states that: when adjacent or alternate waves of the same Degree are compared, they
should be distinctive and unique in as many ways as possible. The major, deciding factor in the full
manifestation of the rule is time. The greater the time period covered by each formation, the more
complete, in all respects, the Alternation between the two formations will become. There are many ways
Alternation can occur. Regarding Impulse patterns, the most important application of the Rule of
Alternation is to its "counter trend" phases (i.e., waves 2 & 4). If and when you find the market is
unfolding in a Corrective manner, the Rule best applies to waves A & B. The possible types of
Alternation, which should always be considered in every formation, are as follows:
A. Price (the distance covered in vertical units)
B. Time (the distance covered in horizontal units)
C. Severity (the percentage retracement of the preceding wave)
(applicable only to waves 2 & 4 of an Impulse pattern [all Impulse variations])
D. Intricacy (the number of subdivisions present in a pattern)
E. Construction (one pattern may be a Flat, the other a Zigzag, etc.)
To continue with the assumption that your wave group is Impulsive, Alternation must be present
between waves 2 & 4 in at least one of the way s mentioned above. [A t this stage in the analysis process,
you may or may not be working with more complex polywave patterns, so illustrations of simple and
complex polywaves are presented on the next two pages for completeness J
Figure 5-3a shows the area of an Impulse pattern where Alternation is most critical and reliable.
A. Diagram A shows Alternation on a price, time, and severity basis; wave-3 is the extended wave.
B. In Diagram B, again the 2 & 4 wave Alternate in similar ways as shown in Figure A, but the
extended wave has changed to wave-1.
C. Diagram C changes some of Figure B's conditions; wave-4 is more severe, time consuming and
larger in price than wave-2 and the extended wave is now wave-5.
D. The only alternation in Diagram D is severity. The two corrections appear so similar as to make
the pattern very suspect Other possibilities would need to be considered and kept in mind until
further market action clarifies the situation. If the entire Impulse pattern gets retraced more than
Central Considerations 5-5
Figure 5-3a
In order for waves 2 and 4 to interact correctly,
there must be some type of Alternation between them
in at least one (preferably more) of the ways listed
under the Rule of Alternation on the previous page. On
shorter term charts, you may rjpj get any Alternation
other than retracement severity, but it is important at
least one factor is present. The larger and more time
consuming the patterns being compared, the more
important it is for adjacent and local (same Degree)
market action to Alternate.
If this rule is not satisfied, ihe move is most likely
a Complex Correction wilh a "Missing" x-wave in the
center of what you are assuming is wave-3 (for details
on Complex Corrections, see Chapter 8). If you
recently began your study of Elliott Wave, avoid
confusion by returning to the Preliminary Observations
chapter and study a new group of monowaves.
Figure 5-3b
Wave-4
Wave-2
II Wave-4
Wave-2
Wave-4
I Wave-2
C.
Wave-4
Wave-4
Wave-2
Wave-4
~| Wave-2
5-6 Central Considerations
Figure 5-3b continued
Wave-4
Wave-2
(Continued from page 5-5)
61.8%, but less than 100%, by the preceding
market action, it would almost assure the pattern
is acorrective Double Zigzag with a "missing x-
wave" toward its center (see "Missing Waves,"
Chapter 12). If that is the situation on your
realtime chart, go to Chapter 8 ("Construction of
Complex Poly waves...") to continue your
analysis. If you do not feel ready for more complex
market discussions, move to a completely new
group of monowaves and restart the analysis
process. If the pattern is retraced less uian
61.8%, and later its end is exceeded, the Impulse
scenario would be reinforced.
E. Diagram E is an example of all facets of
Alternation (price, time, severity, intricacy
and construction) between waves 2 & 4.
F. In Diagram F, the reverse situation occurs
from that of figure E, it is still an
excellent example of Alternation.
G. The similarities of time and price
between waves-2 and 4 in Diagram G make it
necessary for Alternation to occur in a
different way. In this case they are
Alternating in construction (wave-2 is a
Double Three Running correction and
wave-4 is a triangle [covered later]). Time
Similarities are most common between
Waves 2 & 4 when die 3rd wave extends.
Note: Alternation is a relative phenomenon. A simple or complex correction is not dependent so
much on what Elliott pattern is created as much as how the two Alternating patterns relate and "look"
to each other. For example, a Double Three correction for wave-2 could be considered the simple pattern
if wave-4 were a much larger and more time consuming Horizontal Triangle (see Figure 5-4).
Figure 5-4
(2) "Simple" Double Three
NOTE: This diagram is stricdy for the illustration of the
Ruleof Alternation. Thetimeconsumptionofwaves-(2)
& (4) is excessive in relation to waves-(I), (3) & (5).
(4) "Complex" Horizontal Triangle
From this diagram it should be obvious that the name given to a naiiem
does not automatically indicate its nature is simple or complex. Simple
and Complex are relative terms which make sense only in a
comparative environment (Triangles will be covered in the Corrections section
of this chapter and Complex patterns are covered in Chapter 8
["Construction of Complex Polywaves, Muliiwaves, etc."]).
Central Considerations 5-7
Rule of Equality
In any Impulse pattern, as discussed under the Extension Rule, one of the waves must be significantly
longer than any other wave. Once you have identified the longest wave, the Rule of Equality needs to
be considered. This Rule applies to only two of the following three waves: 1,3, & 5. Whichever wave
extended in the pattern, the Rule refers to the other two. The combinations would be:
1. If wave-1 extended, the rule applies to waves 3 & 5.
2. If wave-3 extended, the rule applies to waves 1 & 5.
3. If wave-5 extended, the rule applies to waves 1 & 3.
The Rule of Equality states that the two unextended waves should tend toward equality in price and/
or time OR relate by a Fibonacci ratio (usually 61.8%) under either parameter or both. Price is the far
more important consideration when looking for equality of two waves. In addition, the Rule exerts the
most influence in Impulse patterns when the 3rd wave extends. The Rule is especially useful when the
5th wave fails after a 3rd wave extension. The rule is least useful when a pattern contains a 1st wave
extension or is a Terminal Impulse.
Refer back to Figure 5-3b for some examples of how this takes place. In Diagram D, wave-3
extended, so waves 1 & 5 are approximately equal in price and time. Diagram B shows a 1st wave
extension, in which waves 3 & 5 relate by 61.8% in price and 61.8% in time. In Diagram C, the 5th wave
extended, so waves 1 & 3 relate to each other by 61.8% in price and 100% in time.
Overlap Rule
The Overlap Rule can be applied in two different ways, depending on whether you are analyzing
a Trending or Terminal Impulse wave. Both categories are listed below.
Trending Impulse (5-3-5-3-5)
In a Trending Impulsive polywave (or higher), nopart of wave-4 can fall into the pricerange covered
by wave-2 (Figure 5-5a). This Rule creates one of the most obvious, visual differences between Trending
Impulse patterns and Terminal Impulse or Corrective patterns.
Terminal Impulse (3-3-3-3-3)
Contrary to Trending Impulse patterns, it is required in a Terminal pattern that the price action zone
of wave-2 be partially violated by the price action zone of wave-4 (Figure 5-5b).
Figure 5-5a 5
Figure 5-5b
}
Price Range
of Wave 4
Note the separation of waves 2 & 4
by price level. This occurs only in
Trending Impulse patterns.
J Price Range of Wave 2
} Overlap
Note the lads of separation between
waves 2 & 4. This occurs only in
Terminal Impulse patterns.
5-8 Centra! Considerations
Review
If the price action you have been working with has passed all the tests from the Preliminary section
up to the Overlap Rule, the action is all but guaranteed to be Impulsive. If it has not passed all these rules,
the probabilities are extremely high the move is Corrective. Anytime one of the rules, up to this point,
is not followed by market action (with the few exceptions listed taken into account), move to the
Corrections section and go through that market behavior check list to decide what type of Correction is
unfolding. The wide variance of Corrective possibilities and flexibility allowed such phases makes the
process more time-consuming and tedious than that required to decipher Impulsive behavior.
EBraaMimg Braimft - Impulsions
^irLlllTI'IIN!!!!!!!!]!!!'!!!,!!! !||!||!|l! ! ! | |
From this point forward (limited to the Impulsions section), additional Impulse formation rales
develop in one of two directions:
1. They become more subtle, conditional and difficult to work with requiring experience and
confidence to properly apply, OJ$
2. They are easy to apply and not very subtle. They serve more as supplemental evidence
of an interpretation's validity than as concrete proof.
Not all of the rules which follow (until the end of the "Impulsions" section) need to be obeyed by
market action, but usually they are (see Exception Rule). If you are working with a pattern of Complex
Polywave or Multiwave development, and are having trouble with solidifying your formation into an
Impulse wave, side track to the "Progress Label and Logic Rule" chapters. Subtle Impulse behavior
requirements are covered wave-by-wave. Once you are satisfied with the conclusions, return here, or
if you are not satisfied, you may want to go to the Corrections section in this chapter.
Channeling
Channeling is a very important part of the analysis process. It is crucial in deciding when an Impulse
pattern has completed and is fundamental in the search for the terminal points of waves 2 & 4.
There are two types of base channel lines when working with an Impulse pattern. They are the 0-
2 trendline and the 2-4 trendline. Each serves a different purpose and provides important clues as to what
type of Impulse pattern is forming, along with the type of Correction the market will create for waves
2 & 4. Channeling is most useful in Impulsions when wave-2 or wave-4 is a Polywave or higher.
Figure 5-6 shows how base channels are drawn. Illustrated are various combinations of development
for 2nd waves. During the early stages (diagram A), the 0-2 trendline is employed and is essential in
deciding when and where the 2nd wave completes. In diagram A, the first retracement of wave-( 1) was
originally believed to be the end of wave-(2). This was a legitimate assumption. Unfortunately, the
minute the 0-2 trendline was broken and the break occurred with action still in wave (2)'s price zone, the
2nd wave was confirmed incomplete and the original trendline touch point becomes wave-a of wave-(2).
If after moving away from the revised 0-2 trendline, the market breaks the trendline a^ain (before
any significant advance occurs or if price again falls into the 2nd wave price zone), it is still likely wave
(2) is incomplete. The trendline will have to be revised once again and the movement previously thought
Central Considerations 5-9
Figure 5-6
2nd wave
price Zone
Highest
point of
B- wave (2)
2nd wave
price Zone
Original touch point —
Now wave-a of Wave-(2)
Trendline revised again
In diagram A. die firstretracementof Wave (1) was originally considered the end of Wave (2). This was
a correct assumption at the time. However, the instant die 0-2 trendline got broken (diagram A) and that
break occurred with price action within the 2nd wave zone, price action indicates that wave (2) is not
over and the original touch pointbecomeswave-aofwave(2). If Uierevised0-2trendlineisbroken again
(diagram B) before a significant advance occurs or the price action falls into the 2nd wave zone again,
it is likely Wave (2) is not complete and the movement to the "revised trendline" is only the first a-b-
c of a Complex Correction which will form Wave (2). After a sequence like the one diagramed in Figure
B, the correction will probably conclude.and Wave (3) willcoinmence. If you witness a significant move
(relative to the x-wave) followed by a Correction which terminates outside of the price range of Wave
(2), the 3rd wave should be in progress, or perhaps even complete. After a pattern such as the one in
Figure B, the wave- 3 should be much longer than wave-1 and it should definitely be the extended wave.
Correct
Important: If the 0-2 trendline is real, no
part of wave 1 ox 3 shonld break the line.
No part of Wave 1 or 3
should break the 0-2
trendline. (It is allowable for
part of Wave-2 to partially
break die 0-2 trendline.)
This first trendline
is incorrect; it
should be redrawn
to account for the
to be the end of wave-(2) will likely be only the a-b-c of a complex 2-wave [i.e. wave-2 may be a Double
or Triple Three, (for details on Complex patterns such as Double and Triple Threes, refer to Chapter 8)].
After a sequence like Diagram B, the Correction will probably conclude and wave-(3) can get
underway. Once you witness a significant advance (more than 161.8% of wave-1) followed by a
5-10 Central Considerations
Figure 5-6 continued
Triangle
correction which stays above the highest price range of wave-1, the 3rd wave is probably in progress (or
may have even completed). Important: If the 0-2 trendline (of any degree) is "real," no part of wave-
1 or wave-3 should break it (see the left-hand side of diagram C).
Once it is decided wave-3 has terminated, you will need to begin a similar channeling process to
detect the conclusion of wave-4. Diagram D (above) shows the steps necessary to arrive at a viable
conclusion. In the diagram, it is assumed wave-3 is finished since it is much longer than wave-1 arid -
because a correction following wave-3 stayed above the price zone of wave 2. To decide whether wave-
4 has finished, you need to draw a trendline across the lowest point of the correction after the supposed
3rd wave high. If the market runs to new highs shortly after without breaking or touching the 2-4
trendline, the fifth wave is probably in progress. If, before making a new high, the market breaks the 2-
4 trendline, wave-4 is probably still forming andthefirstcorrectivelowisonly wave-a of wave-4. [Note:
More than one revision of the 2-4 trendline might be necessary. All of the above procedures and
techniques also apply to downward Impulse movement.]
Fibonacci Relationships
Fibonacci relationships are most prevalent when the 5th wave Extends in an Impulse pattern.
Relationships are least common in a 3rd wave Extension pattern. More specific relationship discussions
take place in Advanced Fibonacci Relationships (Chapter 12). For now the discussion will be limited
to general observations based on which wave Extended in the Impulse sequence.
1st Wave Extension
The most common arrangement is for wave-3 to relate to wave-1 by 61.8% and wave-5 to relate to
wave-3 by 38.2%. The next most likely combination is the reverse of the above; wave-3 will be 38.2%
of wave-1 and wave-5 will be 61.8% of wave-3.
Central Considerations 5-11
3rd Wave Extension
This situation allows for a limited number of relationships, which usually occur between waves-1 &
5. Wave-1, if not equal to wave-5, will normally be 61.8% or 161.8% of wave-5. Wave-3 must be more
than 161.8% of wave-1 if it is the Extended wave.
5th Wave Extension
It is during 5th wave Extensions that wave-3 will normally be related to wave-1 by 161.8%. The 5th
wave most commonly will relate to the entire move from the beginning of wave-1 to the end of
wave-3 by 161.8%, added to die end of wave-3 or wave-4.
Degree
In order to keep track of a market's varying levels of development, Elliott devised stratified wave
Degree Titles. Disappointingly, to some, Degree cannot be described in absolute terms such as days,
weeks, dollars and cents. It is a relative concept describing how one pattern interacts with another. The
smallest Degree Tide that Elliott coined was Sub-Minuette. Since the monowaves we have been
working with are the simplest wave patterns on a chart, it is logical to adopt the Sub-Minuette Title for those
monowaves being analyzed.
Adoption of a Degree Title also requires the utilization of a specific Symbol. Looking over your
chart, if you are still working with monowaves, replace the plain Impulsive Symbols you have been using
on your pattern (1,2,3,4, 5) into the specific Impulse Symbols which represent Sub-Minuette Degree.
Those symbols are as follows:
i ■
ii
iii
iv
V
for wave-1
for wave-2
- for wave-3
- for wave-4
■ for wave-5
As your skills improve, you will need to Title and Symbolize larger Degree patterns. If you are
working with polywave (or higher) patterns at this point, the steps involved in deciding Degree are described
in the "More on Degree" section (Chapter 7).
NOTE: Degree is a very difficult concept. It is something the beginning student should not be very
concerned with, just aware of. Whether something is of Supercycle or Minor degree is purely subjective
and not at all important in the early stages of analysis. What is not subjective is die relationship between
each wave. For example, if you label one move Minor and it completes a larger Elliott sequence, the
larger sequence will have to be of Intermediate Degree.
5-12 Central Considerations
Realistic Representations - (Impulsions)
inillirillllllllllllllinillllllllMMIMIillllllMMIiniNII 11111111111111 I I
On the next two pages there are diagrams depicting realistic Impulse patterns just as they might occur
on a plot of real-time market action. Based on the aumor's discoveries of standardized pattern design,
the diagrams illustrate the typical shape an Impulse pattern will exhibit as a direct result of which wave
segment Extended. The extended wave of an Impulsive Elliott pattern is the most important factor in
deciding its appearance. Furthermore, each diagram lists Progress Labels on the left of the colon (:) and
Structure Labels on the right. The "X" in front of some Progress Labels' (only used in front of Progress
Labels' "1, 3 or 5") indicates which wave eXtended.
If you plot data in the proper fashion (clearly described and illustrated in Chapter 2 & 3 of "Mastering
Elliott Wave"), real-time market action will closely, and sometimes exactly, resemble the diagrams
which follow. If you use bar charts, hourly closing figures, or other types of incorrectly plotted or
calculated data, the action sometimes will and sometimes will not look like the diagrams to follow.
Central Considerations 5-13
3rd Wave
Extension ^3.5
If the 5th wave is shorter than
wave 4. it creates a situation
called a 5th-wave Failure. A
5th-wave Failure is only
possible in Impulse patterns with
1st or 3rd-wave Extensions
(5th-wave Failures in Impulse
moves with 3rd-wave
Extensions being the far more com -
mon of the two). Of all 3rd-
wave Extension variations,
the 5th-wave is most likely to
Fajl when wave-1 is
"microscopic" in relation to wave-3
(see diagram on right).
3rd Wave
Extension
All Impulsions outside of this rectangle are Trending
1st Wave
Extension
1st Extension
Terminal Impulse
5th wave usually, but
can be a C-wave
—££—-—"
. f^-J y/^3
5th Extension
Terminal Impulse
C-wave usually, but
can be a 5th wave
yY
l:j/ / ]/
5:3
_-3^3_A-7
Waves 2 & 4 \
Overlap
Minimum retracement
of Terminal, 100%
/ x5:3
/ ""2-3 >\
Waves 2 & 4 Overlap
5-14 Central Considerations
3rd Wave
Extension
5th Wave
Extension
If the 5th wave is shorter than
wave-4, it creates a situation -
called a 5th-wave Failure. A
5ih-wave Failure is only
possible in Impulse patterns with
1st or 3rd-wave Extensions
(5th-wavc Failures in Impulse
moves with 3rd-wave
Extensions being the far more
common of the two). Of all 3rd-
wave Extension variations,
the 5th-wave is most likely to
Bui when wave-1 is
"microscopic" in relation to wave-3 "
(see diagram on right).
1:5)
3rd Wave
Extension
k4:3 ■■
x3:5^
5:5
1st Wave
Extension
xl:5N
. \ x3
3^5
All Impulsions outside of this rectangle are Trending
Minimum retracement
of Terminal. 100%
1st Extension
Terminal Impulse
5th wave usually, but
can be a C-wavc
5th Extension
Terminal Impulse
C-wave usually, but
can be a 5th wave
Central Considerations 5-15
Corrections
Corrections are patterns which occur between Impulse waves. As you already know, Corrections
are normally made up of three monowave (or larger) segments. How to relate those segments and form
a Standard, reliable Elliott pattern is the purpose of this chapter.
In general, Corrective phases are more difficult to interpret than Impulsive phases due to a largerpool
of variation possibilities. Deciphering Corrective phases often requires a complex understanding of
market behavior and, sometimes, lots of patience. Do not get discouraged when unable to figure out a
wave count during corrective activity, that is typical; simply give the market additional time to develop.
Corrections (and Impulsions) only become "crystal clear" when they have completed or are near
completion. At termination of a pattern it is usually obvious which variation is occurring.
Introduction of Progress Labels to the Wave Group
Unlike Impulsions, which require a multitude of specific criteria exist before Progress Labels can be
placed on the price action, Corrections are less demanding. When you reach this stage of the analysis
process, you are not trying to decide whether the pattern is Corrective or Impulsive. You "know" it is
Corrective simply because it is not Impulsive. This allows for the immediate placement of Progress
Labels to the price action. The first Structure Label in the group should be marked wave-a. The second
is marked wave-b, the third wave-c. If still working strictly with monowaves, and there is a fourth and
fifth monowave, mark them waves-d and wave- e, respectively.
Essential Construction Rules
Jnl'^l'lllll'lllllllllllllllllllllllllllll !,' I'll | |
Since there are many different types of Corrections, general rules covering all eventualities cannot
be devised. The only way to describe all corrective patterns is indirectly:
If market action does not follow all necessary Impulse rules from the "Preliminary
Observations" chapter up to, but not including, the Breaking Point discussion
under the Impulsions section, bydefault the market action is Corrective.
The following rules are essential in the construction of specific Corrective polywaves. Even though
larger patterns should almost always abide by the same parameters, these guidelines are designed to help
you form Corrective polywaves from only three or five adjacent monowaves. As a result of the numerous
patterns (and variations) falling under the Corrective umbrella, the parameters for each will have to be
listed separately.
First, all patterns which fall under the category of Flats (B Failure, C Failure, Common, Double
Failure, Elongated, Irregular, Irregular Failure, Running) will be covered. ZigZag patterns will be
discussed second; and finally, the most difficult and important Corrective pattern, the Triangle, will be
introduced last.
S-16 Central Considerations
To continue with your analysis, return to the monowave group you have been working on. Match
the "Series"possibility you are currendy testing with one of those listed below and branch to the heading
(in this section) indicated by that series.
ZigZag 5-3-5
Flat 3-3-5
Triangle 3-3-3-3-3
[If you are not following along with your own chart or this is your first time reviewing this section, just
read straight through.]
Flats (3-3-5)
Let's start off by defining the minimum retracement requirements for each wave in a Flat to make
sure the "Series" is properly constructed. If the requirements below are not met, go back to your chart,
pick a new wave group isolated in Chapter 3 and start the process over beginning from the Intermediary
Observations chapter.
The three monowaves (or higher patterns, if you have developed your skills to that level) under
observation must exhibit the following criteria before they can fall under the Flat category:
1. Wave-b must retrace at least 61.8% of wave-a. (see Figure 5-19)
Figure 5-19
Price
length
ofA
.618 of A added
to the low of
Wave-A
Price
length
of A
The A & B Progress labels may
be correct, but lhey will not be
the A & B section of a Flat since
the B-Wave concluded at less
than 61.8% ofWave-A.
.618ofA
2. Wave-c must be at least 38.2% of wave-a (see Figure 5-20).
Figure 5-20
J
382
Price
length
of A
This illustrates themmimum percentage retracement of wave-
A which wave-C must attain to even consider wave-C has
completed. For this arrangement of monowaves to complete a
Flat, other factors must also be present (see Channeling).
Central Considerations 5-17
Figure 5-21
End of wavc-a, start of wave-b
} Horizontal parallel lines /\ |
offthehighestandlowest I \ /\ v
price of the first / v \ |
monowavc in the group / ? J
End of wave-a, start of wave-b
There are more variations on Flat patterns than any other Elliott formation. To get a general idea of
what type is taking place, the following technique should be implemented. Draw two horizontal, parallel
lines, one off the highest point of the first monowave and the other off the lowest point of the first
monowave (see Figure 5-21). This will provide an accurate measuring tool to detect the differences
between one Flat variation and another.
Beginning the observations, if wave-b breaks the horizontal line opposite its starting point, the
market action indicates a "stronger than normal" Flat is forming (refer to StrongB-Wave, below). If the
b-wave retraces between 81-100% of wave-a, refer to Normal B-Waves. If the retracement of wave-a
is between 61.8-80%, refer to Weak B-Waves.
Strong B-wave
Depending on the size of the b-wave in relation to wave-a, the c-wave may or may not exceed the
beginning of wave-b. If the b-wave falls between 101-123.6% of wave-a, there still exists a relatively
good chance wave-c will completely retrace wave-b. If the b-wave falls within the above range, the c-
wave is 100% or more of wave-b and wave-c is not more than 161.8% of wave-a, the market is forming
mlrregular correction. If the c-wave is more than 161.8% of wave-a, designate the pattern an Elongated
Flat.
If the b-wave is more than 123.6% of wave-a, there is little chance wave-c will retrace all of wave-
b. If it does, it will still bean Irregular pattern. When the b-wave exceeds 138.2% of wave-a, there is
no chance the c-wave will retrace all of wave-b (the c-wave of a Triangle might, but not the c-wave of
a Flat). As long as part of wave-c falls within the range of the horizontal parallel lines, but does not
completely retrace wave-b, the pattern should be considered an Irregular Failure. If the c-wave does
not fall within the horizontal, parallel lines, the pattern should be considered a Running Correction.
Once the specific Flat variation taking place is known*, proceed to the "Conditional Rules" section
(page 5-34) for further testing of the pattern.
Norma) B-wave
The b-wave, to be considered "normal," should fall between 81-100% (inclusive) of wave-a. Under
these conditions, the c-wave will most likely retrace all of wave-b. If the length of wave-c falls between
100-138.2% of wave-b, the pattern should be considered a Common Flat. If the c-wave is more than
138.2% of wave-b, the market is forming an Elongated Flat. If the c-wave is less dian 100% of wave-
b, the pattern is a C-Failure.*
* Knowing what type of Flat pattern is forming during your early stages of study will not be that helpful, but will be of
great assistance and application at a later dale. If you feel you have assimilated everything up to this point and are ready
for some new "formation solidifying" guidelines, refer to Chapters 10 & 11 at this juncture and then return to Chapter 5.
y
5-18 Central Considerations
Weak B-wave
Weak b-waves are characterized by their less than normal retracement of wave-a. To classify as a
weak b-wave, it must retrace between 61.8% - 80% (inclusive) of wave-a. If the c-wave is less than 100%
of wave-b, thepattern should be cal\ed ^Double Failure. If wave-c is between 100%- 138.2%of wave-
fa, the pattern should be called nB-Failure. If wave-c is longer than 138.2% of wave-b, it will once again
fall under the Elongated Flat category.*
ZieZa?s (5-3-5)
There is alimited number of variations onZigZag patterns. ZigZags and their complex combinations
" (see Chapter 8) are the only correctivepatterns which can temporarily "resemble" Impulsive activity. To
avoid misinterpretation, very specific limits must be placed on Zigzag behavior. Below are the minimum
requirements which allow a pattern to be categorized as a ZigZag.
1. Wave-a should not retrace more than 61.8% of the previous Impulse wave (if present) of one
larger degree (see Figure 5-22a).
Figure 5-22a
Impulse pattern is
"one larger degree"
than Wave-a
.618 of impulse pattern
2. Wave-b should retrace at least 1% of wave-a (Figure 5-22b).
Figure S-22b
3 1 % of Wave-a
Central Considerations 5-19
3. Wave-c must move, even if only slightly, beyond die end of wave-a (Figure 5-23)
Figure 5-23
b
Termination of Wave-a
Wave-c is below the termination of Wave-a
Price
length
of wave-c
Here, Wave-c is just
slightly longer than Wave-
B (but, it is longer).
Wave-c is slightly lower than
the terminus of Wave-A
If your wave group has followed these three minimum parameters, it is time to check for adherence
to the maximum limits imposed on wave-b of a ZigZag.
1. No part of wave-b will normally retrace more than 61.8% of wave-a.
2. If part of wave-b retraces more than 61.8% of wave-a, that part will not be the end of
wave-b. It will only be the first segment of a more complex correction for wave-b. The
termination of wave-b will complete at 61.8% of wave-a orjejis. (see Figure 5-24).
Figure 5-24
Maximum Retracement
.618 of A
Wave-b retraced less
than 61.8% of Wave-A
All part of Wave-b
I 1
Impossible - this wouldnot fall
under the category of ZigZags,
but could be considered a Flat.
Termination of
-Wave-b
-.618 of Wave-a
Occasionally happens
5-20 Centra! Considerations
C?
The length of wave-cis the deciding factor for categorizing a ZigZag formation. It's length says many
things about me current and future market action. If the c-wave of the Zigzag you are working with is
less than 61.8% of wave-a, refer to Truncated Zigzag. If the c-wave completes at a point which is more
than 161.8% of wave-a added to the end of wave-a, move to the "ElongatedZigzag" section (be careful
with this pattern, it could be part of an Impulse wave). In any omer situation, refer to "Normal Zigzags".
Norma)
In a Normal Zigzag, the c-wave can be anywhere from 61.8% to 161.8% (Internally and Externally,
for details, refer to page 12-22) of wave-a. The listing below describes and illustrates the conditions
necessary for Normal Zigzag formation.
1. Wave-b (when measured from its terminus) must not retrace more than 61.8% of wave-a. Figure
5-24 (previous page) shows several situations which allow for, or negate, Zigzag formation.
Figure 5-25a
Figure 5-25b
Length
of Wave-a
= 1.00
Maximum length of
wave-c in a Normal
Zigzag - 161.8% of
Wave-a added to the
end of Wave-a
Length
ofWave-
a=1.00
1.618
Minimum length
of wave-c in a
Normal Zigzag-61.8%
of Wave-a added to
—I the end of wave-b
2. Wave-c should not exceed 161.8% of the length of wave-a added to the end of wave-a (Figure 5-
25a), but should be at least 61.8% of wave-a, Internally (see Figure 5-25b).
When a move, which you think is a c-wave, exceeds me limits described above, refer to "Elongated
Zigzag" (page 5-22) and/or "Impulsions" (page 5-2).
Truncated
This is the rarest Zigzag variation, to be justified it must meet the following criteria:
1. Wave-c cannot be shorter than 38.2% of wave-a, but should be less than 61.8% of wave-a.
2. After completion of the Zigzag, the market must retrace at least 81 % of the entire Zigzag, and
preferably, it should retrace 100% or more (Figure 5-26, next page).
This is essential due to the counter trend strength indicated by the extremely short c-wave.
3. The pattern will most likely be found as one. of the five legs of a Triangle or as a segment of one
of the legs of a Triangle.
Central Considerations 5-21
Figure 5-26
Minimum retracement of a
Truncated Zigzag is about 81%
Truncated C-wave of a Zigzag pattern
c
Elongated
An ElongatedZigzag is characterized by an oversized c-wave. As stated earlier, Zigzags temporarily
resemble Impulsive activity. Of the Zigzag variations, the Elongated is die best imitator of Impulsive
behavior. This makes them very difficult to recognize and dangerous to assume while diey are unfolding.
Usually, they can only be confirmed after the fact. Their redeeming quality is that they only take place
in the early stages of Complex Polywave (or higher) Contracting Triangles (see Chapter 8) or the late
stages of Complex Polywave (or higher) Expanding Triangles.
Whenever a c-wave is more than 161.8% of an a-wave, the probabilities greatly favor the assumed
a-b-c is actually the 1-2-3 of a five segment Impulse pattern. The criteria which helps decide between
the two different patterns is retracement. After an Elongated Zigzag, the market should reverse and
retrace more than 61.8% of die c-wave before the end of wave-c is violated. If those conditions are met,
assume the pattern is an ElongatedZigzag. If those conditions are not met, it likely the pattern forming
is an Impulse wave. Return to the Preliminary Analysis chapter and tack on some additional
monowaves to the wave group you are working with and see if you can come up with a possible Impulse
Series (also referto the Zigzag "DETOUR" Test onpage 4-8). If not, go on to a new group of monowaves
and start from the beginning. Eventually, through all the techniques described in this book, the pattern
you could not figure out will become clear once the surrounding price action is correcdy deciphered.
Figure 5-27
As the b-wave becomes more
complex, it will usually be an Irregular
Failure or a Running Correction
^RetI■acement.ofwaye-c
is more than 61.8%
5-22 Central Considerations
Triangles (3-3-3-3-3)
Some of the most difficult patterns to work with under the Wave Theory are variations of Triangles.
They have no specific time limits for completion. Absolute certainty as to the direction of post-
Triangular action is often impossible. One of their redeeming qualities is that after they complete, they
provide a significant amount of information on current market position and offer numerous clues on how
post-triangular price action should behave for extended periods of time.
Despite their difficulties, Triangles are some of the most common Elliott patterns; therefore, a
thorough understanding of them is essential. Learning to identify Triangles early in their formation can
save you from many hours of from frustration and from unnecessary trading losses (especially in
Options). Following are the most important Rules and characteristics of Triangular formations. The
majority of these Rules (which are essential) are presented here for the first time, so pay close attention.
Following is a list of minimum requirements in the formation of all Triangle variations:
1. Elliott said there are five segments to a Triangle, no more, no less. This rule applies no matter
how simple or complex each segment is. In order of occurrence, each segment of the Triangle
is given a letter of the alphabet: (a,b,c,d,e).
(see Figure 5-29)
2. Each Segment of the Triangle is (or represents, in the case of monowaves) a Complete Corrective
phase (a ":3").
Figure 5-29
As in an Impulse sequence, three of the Corrective patterns go
with the corrective trendand two go against the corrective trend.
The Corrective trend is down The Corrective trend is up
3. Unlike an Impulse pattern, which tends to trend up or down, the five segments of a Triangle will
oscillate over and over in die same price territory (overlap) with a slightly Expanding or
Contracting bias (Figure 5-30, next page).
4. The Triangle can drift slightly upward or downward without affecting these general guidelines
(see Figure 5-31, next page).
5. The length of wave-b must fall between 38.2-261.8% of wave-a. NOTE: there is a strong tendency
for wave-b to avoid a 100% price relation to wave-a.
Central Considerations S-23
Figure 5-30
Price action being
"forced" through
converging barriers
^■Breakout - one force (buying or sell-
y^ ing power) finally and quickly over-
,J* comes the other causing a "thrust"
Oscillation point - right at die end
of aContractingTriangle, a state of
near equilibrium is reached
between buying and selling pressure.
Look (or relatively slow, tight market
action toward ihe end of the Triangle. This
will "bore" marketparticipants, therefore
diverting their attention and surprising
them when the "thrust" occurs.
The reverse characteristics of
aContracting Triangle, the volatility increases
toward the end of anExpandingTriangle.
Figure 5-31
Pivot point of
Contracting
Triangles
Pivot point of
Contracting
Triangle
Pivoted up slightly
Apex-»-
Buying pressure
slightly overpowering
selling pressure
Selling pressure
slightly overpowering
buying pressure
- Think of the apex point
of a Triangle as movable
The apex point of the Triangle can be raised or lowered to
any extent between the two limits designated by the dashed
lines without bringing up any additional possibilities. Once
the trendlines are going in the same general direction (up or
down), both a Terminal Impulse and a Running Triangle
must be considered as possible patterns.
5-24 Central Considerations
6. Of the five segments in a Triangle, four retrace a previous segment. The retracing segments are
waves b,c,d & e. Of those four, three segments must retrace at least 50% of the previous wave
(see Figure 5-32). During a rare Running Triangle, this parameter may not be completely met.
Figure 5-32
The e-wave does not need to retrace a lot of wave-d in
this case since three of the other retracemenls were
substantial enough. If the e-wave had retraced at least
50% of wave-d, then one of die others would not have
had to retrace 50%, but probably would have anyway.
Ihns.50%+
Retracements
(i
Wave-b retraces more dian 50% of Wave-a
2. Wave-c retraces more than 50% of Wave-b
Wave-d retraces more than 50% of Wave-c
}
This sequence meets minimum
retracement criteria.
7. When dealing with die important reference points in a Triangle, there are six you
need to be concerned with. They are all of the same degree:
i. The beginning of wave-a, which is called point "0" (zero)
ii. End of wave-a, point "a"
iii. End of wave-b, "b"
iv. End of wave-c, "c"
v. End of wave-d, "d"
vi. End of wave-e, "e"
Only four of the terminal points (of the same degree) in a Triangle should be channeled between
contracting trendlines. NOTE: Non-Limiting Triangles usually follow this rule, but there are occasional
exceptions which may create a 5th touch point (see Figure 5-33 for an illustration of this Rule).
Figure 5-33 (continued on next page)
Each dark dot represents a possible touch point which
you can employ to draw converging trendlines which
encase the triangle. Only four (of Ihe six) turning points
can simultaneously touch the converging trendlines.
1
5 /
Too many Touchpoints on this side
This partem would not qualify as a proper triangle. If
market action did channel like this, the action could be part
of a Triangle, but it almost certainly would not be the
completion of a Triangle at the last point on the lower right.
Too many Touchpoints on this side
Central Considerations 5-25
Figure 5-33 continued
Only two
touchpoints
on this side
Only two
touchpoints
on this side
This is how channeling should occur in
a normal Horizontal Contracting Triangle.
Note that there are two points of the same degree which do not
touch the trendlines. The beginning of wave-a (where the
Triangle began) and the end of wave-e (the end of the Triangle).
The channel line crossing waves B & D in a Triangle should be thought of as the Base line. Its
function is similar to a 2-4 trendline in an Impulse wave. As a general rule, the B-D trendline
should not be broken by any part of wave C or E in the Triangle (Figure 5-34a). In other words,
there should be a clear path from wave B to D and from wave D until the end of wave E. Figure
5-34b illustrates behavior around the Triangle's B-D trendline which is not acceptable.
Figure 5-34a
This break is fine
since it occurred after
wave-e completed
Figure 5-34b
| Incorrect!
Termination of
wave-d exceeded
by part of wave-e,
this is unacceptable
Once the real b-dtrendlinegets
broken, the Triangle should be
complete. Here, wave-e
temporarily breaks beyond the end
of wave-d, then makes a new
low. This makes the current b-
d trendline improper; it should
be redrawn across the "break
point" high.
5-26 Central Considerations
"""Contracting Triangles (general)
Contracting Triangles are, by far, the most common type of triangle. Following is a list of necessary
elements in the formation of a Contracting Triangle.
Minimum Requirements (all Contracting Triangles):
1. After a Contracting Triangle completes, there occurs a "thrust" that must be at least 75% of the
widest segment of the Triangle and under "normal" circumstances will not exceed 125% of the
widest segment (Figure 5-35).
Figure 5-35
I Wave-a is the widest
J segment of the Triangle
Price
length of
wave-a
"Thrust" must be at least 75% of the widest
wave, but should not be much more than 125%
100% of the widest
wave (wave-a in this
case) has been added
to the end of wave-e
Minimum target,
75% of wave-a
:~i
: 5-35 (continued)
Minimum price thrust 75% of the
widest wave. (Wavc-b in this case)
y
100% of price length
of the widest wave,
X
The a-wave does not have to be
the largest wave in aTriangle. In
the diagram below the b-wave is
the widest wave.
L'
The minimum of 75% Is not enough nnder these conditions \
since it would not produce a new low below wave-b. |
Figure 5-35 (continued)
The c-wave can also be the
largest wave in a contracting
triangle, but it is very infrequent.
Price length
of widest
wave (wave-
I c in this
case)
subtracted from
the end of
wave-e.
J
Centra! Considerations $27
2. In a Contracting Triangle, the thrust must exceed the highest or lowest price (depending on the
direction of the thrust) achieved during the formation of the triangle (Figure 5-36).
Figure 5-36
When aTriangle is about to complete, draw two parallel horizontal lines. One should be drawn across the highest
price level achieved during the formation of the Triangle; the other across the lowest price level. Following the
guidelines below, those parallel lines will help you predict what to expect after the Triangle completes. The only
exception to this Rule would occur when the Triangle noticeably drifts in the opposite direction of its dirust.
If "thrust" is up, j^—""*^
this price level ^^~-~^' S
must be reached \^
If "thrust" is down,
this price level
must be reached
3. The e-wave must be the smallest wave in the Triangle (based on price, not time), see Figure 5-37.
Figure 5-37
wave-e must be the shortest
I wave measured by price
/. Limiting (specific)
"Limiting" are the type of Triangles that Elliott discovered and talked about in his original writings.
They occur in 4th-waves and b-waves. The post triangular action of a Limiting Triangle is constricted
within very specific parameters, hence the name Limiting. The termination of wave-e in these patterns
should occur from 20-40% before the apex point of the Triangle. Below are all three variations of
Limiting Triangles and the specific formation rules which make them unique
a. Horizontal Variation
Of the Contracting Triangles, the Horizontal is die most common. When the market obeys the list
of rules below, it indicates a Horizontal triangle is forming.
1. The trendlines of the Triangle must travel in opposite price directions (see Figure 5-38).
5-28 Central Considerations
Figure 5-38
The trendlines are going
^_ in opposite directions.
2. The Apex point of the Triangle must fall widiin a range 61.8% of the longest segment of the
Triangle, centered in the middle of the longest segment (see Figure 5-39).
Figure 5-39
Longest wave
The same technique would apply if the a-
wave or the c -wave were the longest wave.
61.8% of Wave-b, centered in Wave-b's range
For die Triangle to follow the rules under
the horizontal section, the apex of the
Triangle should fall somewhere in this range
3. Wave-d must be smaller than wave-c (see Figure 5-40).
Figure 5-40
Wave-d covers te price
c I territory than Wavc-c
4. Wave-e must be smaller than wave-d (see Figure 5-37, previous page).
Central Considerations 5-29
b. Irregular Variation
This type of Triangle implies slightly greater "thrust" and velocity potential than a Horizontal
Triangle. The key element in the formation of an Irregular Triangle is the b-wave. It must be longer
than wave-a. The parameters below should be obeyed by market action to indicate an Irregular Triangle
has formed:
1. Wave-b should not be more than 261.8% of wave-a and will usually be less than 161.8%. An
exact Fibonacci relationship between wave-a and wave-b of any Triangle is very unusual.
2. Waves c, d, & e must all be smaller than the previous wave.
3. The trendlines of the Triangle should move in opposite directions.
c. Running Variation
This is among the most misinterpreted patterns of the Wave Theory. It compares with the confusion
associated with Double Three Running corrections. The important features of a Running Triangle are:
1. Wave-b is longer than wave-a and is the longest wave of the Triangle.
2. Wave-c is smaller than wave-b.
3. Wave-d is larger than wave-c.
4. Wave-e is smaller than wave-d.
5. Both trendlines will slope upward or downward.
6. The "thrust" after the Triangle will be much larger than the widest leg of the Triangle,
sometimes as much as 261.8%, but no more.
//. Non-Limiting (specific)
There is very little difference between Contracting Non-Limiting and Contracting Limiting
Triangles. All of the rules covered above should apply, except for the following subtle differences that set
the two patterns apart. This listing is completely original, developed by the author after years of
observing and carefully quantifying triangular behavior.
1. Channeling - a Non-Limiting Triangle will behave slightly different around the converging
trendlines than a Limiting Triangle. The behavior occurs in one of three variations, all of which
are noticeably different from Limiting action:
a. The most common and distinguishing Non-Limiting action is congestion right into, or very
near the apex point of the converging trendlines. "Right into, or very near" is quantified by the
following calculation. Measure the time consumed by the triangle from its beginning to the end
of wave-e. If the converging trendlines occur before 20% of that time (added to the end of wave-
e) has elapsed, that defines the above quoted statement.
b. Measuring the time distance from the beginning of the Triangle to the end of wave-e, if the
apex point of the converging trendlines occurs after 40% of thattime has elapsed, it should, again,
be considered a Non-Limiting Triangle. This is harder to anticipate since the Triangle formation
is not quite as obvious.
c. The last way a Non-Limiting Triangle can signal its existence is by a post-thrust correction
into the apex's time zone of the converging trendlines. In a Limiting Triangle, the time zone
occupied by the apex point is where the "thrust" generally concludes* (unless the thrust forms
into a Terminal pattern). The most common way for a Correction to retrace into the apex point
of the recent Triangle is for the thrust, out of the Triangle, to be very violent, reaching its initial
5-30 Central Considerations
price length (based on the widest wave of the Triangle) well before the apex time period occurs. This
allows the market to correct back into the time period of the apex point until time "runs out" during the
apex time zone.
If any one of the above three situations arises toward the end of, or immediately after, the formation
of a Triangle, the Triangle should be considered Non-Limiting in nature.
Post-Triangular Thrust
The "thrust" distance out of a Non-Limiting Triangle is not confined to any specific amount. It may
(and usually does) temporarily react when it has achieved a price length approximately equal to the
widest leg of the Triangle, but that is generally short-lived. The move will then usually resume in the
direction of the original thrust and go for a distance which can only be determined by examining the larger
patterns under formation.
**Expanding Triangles (general)**
Expanding Triangles are most common during very large Complex Corrections. They are created
when five Corrective phases occur in a row with most or all of the segments, from left to right, covering
more price territory than the previous. The word "most," underlined in the last sentence, was used based
on the observation that frequently one (and possibly two during Running Expanding Triangles) of the
segments in an Expanding Triangle will be smaller than the previous (Figure 5-41, next page).
The general rules which apply to all Expanding Triangle formations are as follows:
1. The a-wave or the b-wave will always be the smallest segment of the Triangle.
2. Wave-e will almost always be the largest wave of the pattern.
3. Expanding Triangles cannot occur as b-waves in Zigzags or h.c or d-waves of a larger Triangle.
4. The e-wave will usually be the most time consuming and complex segment of the Triangle. The
most typical construction of the e-wave (if you can see any subdivisions), would be a Zigzag (in
small Expanding Triangles), or a Complex Combination of corrections in larger patterns.
5. The e-wave will almost always break beyond the trendline drawn across the top of wave-a and
wave-c.
6. The b-d trendline should function the same as it would in any Contracting Triangle.
7. The "thrust" out of an Expanding Triangle should be less than the widest wave of the Triangle
(which, in this case, is wave-e) unless it concludes a powerful, larger Correction.
8. Backward from wave-e, three of the previous waves must be at least 50% of the wave to the right.
Just like Contracting Triangles, Expanding Triangles divide into two distinct categories; Limiting
and Non-Limiting. The same category names were used to keep things as simple as possible, but unlike
their Contracting counterparts, the two terms do-not have any significant post-triangular implications.
[As stated above in Rule #7, the "breakout" of an Expanding Triangle is less than the widest segment of
the Triangle.] The terms Limiting and Non-Limiting under this formation merely indicate whether the
Triangle is in a Standard wave position or part of a more elaborate Correction involving multiple
formations connected end to end.
•This concept was firstpresented in "Elliott Wave Prtiiciple.KeyloStcck Market Profits," by Frost and Prechter
(New Classics Library, Gainesville, GA)
Central Considerations 5-31
Figure 5-41
Irregular Running Horizontal
Most common Less Common Least common e
Wave-b is shorter than Wave-a Wave-d is shorter than Wave-c Every succeeding wave is longer than previous
/. Limiting (specific)
The term Limiting always refers to 4th-wave or b-wave Triangles. Personally, I have never seen a
"4th-wave Expanding Triangle." It must logically be assumed they exist, but must be considered rare.
Of the few b-wave Expanding, Limiting Triangles witnessed, the following are the only descriptions
which seem to regularly apply:
1. A b-wave Expanding, Limiting Triangle appears to be possible only in an Irregular Failure or
C-Failure Hat pattern.
2. The "thrust" out of the Triangle is minimal, retracing approximately 61.8% of the Triangle from
highest to lowest point.
a. Horizontal Variation
A perfectly Horizontal Expanding Triangle is probably the least common way for an Expanding
formation to manifest itself. Why? It defies the natural tendency of a market to accumulate or distribute.
If you continually make new highs and new lows in a market, no trend is established. The market would
have to be in a state of Fundamental (as opposed to Technical) limbo. No large economic force pushing
the market one direction or the other would be at work. That is a very unlikely position for a market to
be in, especially for long periods of time. As a personal assessment, the longer the period of time covered,
the more improbable the formation of a Horizontal Expanding Triangle becomes.
The parameters to create an Expanding Horizontal Triangle would be as such:
(1). Wave-a must be the smallest wave in the pattern.
(2). Wave-b, c, d, ande muMeach exceed the previous segment's termination point (which may
or may not be the highest or lowest price).
(3). The e-wave will probably break beyond the trendline drawn across wave-a & c.
5-32 Central Considerations
b. Irregular Variation
The Irregular Expanding Triangle is a little more common than the Horizontal type and is
characterized by several factors:
(1). Either wave- b is smaller than wave-a and all the rest of the waves are larger than the previous,
or wave-d is smaller than wave-c and all the other waves are larger than the previous.
(2). The longer the period of time covered by the pattern, the more likely the channeling of the pattern
will be upwardly or downwardly skewed.
c. Running Variation
The Running Triangle has a trending appearance which is created by both wave-b being slightly
larger uian wave-a and wave-d being slightly shorter than wave-c. Instead of die trendlines going in
opposite directions, they both go in the same direction, but still diverge. The e-wave in this type of pattern
can be quite violent. Another variation occurs when all waves are larger than the previous except wave-
c (which is shorter uian wave-b).
//. Non-Limiting (specific)
TheNon-LimitingExpandingTefers to Triangles which form within more complex formations. For
example, the first or last phase of a Correction involving one or more x-waves could have as one of its
components a Non-Limiting Expanding Triangle. This is due to Rule #7 (page 5-31), which generally
states that the "thrust" out of an Expanding Triangle does not follow the same guidelines required of
Contracting Triangles. Since the "breakout" should not be as large as the widui of the Expanding
Triangle (wave-e), obviously the "thrust" cannot start a major new advance or decline. This is an ideal
situation for an x-wave to develop. The "thrust" out of the Non-Limiting Expanding Triangle will usually
be an x-wave, but it could be the 5 th wave of a Terminal or the second x-wave of a Triple Three or Triple
Combination.
Non-Limiting Expanding Triangles will be formed in the same manner as Limiting Expanding
Triangles with one exception regarding the apex point (which is backward in time). Measure the time
consumed by the entire Triangle then take 40% of that amount and subtract it (i.e. go backward in time)
from the beginning of wave-a. The apex will occur before the 40% time frame is reached. Usually it
will be reached wiuiin 20% of the larger time frame.
Central Considerations 5-33
Conditional Construction Rules - Corrections
lllli'ilUN I!!|' 'II|!!|!!||I|!!MII!|I!| 11!!!'! I! I! | | | | | | ! | | | | | | | |
Alternation
Price
The price relations in a Correction are one of the least useful applications of the Rule of Alternation.
Why? The vast majority of waves in Corrections will be close to the same price length. When the Rule
is applied to Corrections, it has its greatest usefulness in ZigZags. The a-wave and b-wave of a ZigZag
should alternate in price. Wave-b will be 61.8% or less of wave-a. That is about the extent of Price
Alternation in Corrective patterns. The Intricacy and Construction aspects of Alternation (presented on
page 5-5) should also be considered at this time if your correction is composed of monowaves and
polywaves (or higher).
Time
The Rule of Time Alternation assumes full force in Corrective patterns. To apply correctly, three
adjacent corrective phases must be compared. The first two patterns will normally be very different in
time duration. The first pattern may take "n" number of time units while the second one takes n(l .618
or greater) or n(.618 or less) number of time units. The third segment of the group will either be equal
to one of the previous two segments, relate to one of them by 61.8% or 161.8% OR equal the total time
consumed by both previous patterns combined. For more detail on this subject, refer to the "Time Rule"
section. NOTE: When dealing with polywaves that consume only three time units, Alternation of time
is impossible. Lack of time Alternation is a warning there may be a better way to arrange the monowaves
, but if it appears correct, it can be used as a legitimate pattern.
BBirSfflMmg IP (DOT ft- Corrections
llL'lllirillLlllllllllllllllllirilllllH:!!!!,'" IN M I
From this point onward, the rules covered in this section concerning Corrections develop in one of
two directions:
1. The rules get more subtle, conditional and difficult to apply, requiring lots of experience;
OX
2. They become less reliable, where they serve more as a reinforcement for an interpretation than
as a critical deciding factor.
As your analytical skills increase, there are additional considerations which will improve your
realtime accuracy and forecasting ability. It is recommended that the beginning student stop at this point and
reread the earlier sections of the book, study, practice and commit to memory all of the rules and
techniques covered up to this point. The rest of the book is dedicated to more complex discussions of
market behavior. There is no need to go through the more difficult sections until you are comfortable
with your knowledge of the basics.
5-34 Centra] Considerations
Channeling
In channeling Corrections, the important point of reference is the b-wave. For Zigzags and Hats,
always draw a trendline from the startof wave-a to die end of wave-b (called the OB trendline). Aparallel
line should be drawn across the termination of wave-a. If the pattern you are working with is a ZigZag,
the c-wave may break beyond or stay away from the parallel trendline, but it should not touch it. If it
does, it indicates the ZigZag will be part of a more complex correction, such as a Double, Triple
Combination or Double, Triple ZigZag pattern (for details on this concept, refer to page 9-3). Once the
0-B trendline is broken, the c-wave (and the larger pattern) is probably over. For Triangles, the trendline
is drawn across the end of wave-b and wave-d. When the B-D trendline is broken, the Triangle is
probably over. More advanced Channeling techniques are covered in Chapter 12.
Fibonacci Relationships
Fibonacci relationships are among an array of "final touch" formation tests which help to solidify a
proposal. Almost all Elliottpatterns have theirown unique combination of Fibonacci Relationships. This
is one of the more difficult aspects of the Theory since there are a multitude of relationship possibilities.
First, relationships are dependent on which general Correction category the market is in. Then, each
Corrective variation has its own subtle differences (advanced Fibonacci concepts are discussed in
Chapter 12).
Below is a listing of each "standard" Corrective category. Under each heading is a description of
which waves generally relate in a particular pattern. After each heading, a more specific breakdown is
given of the unique relationships usually associated with each Corrective variation.
a. Flats (3-3-S)
Of all Corrective patterns, Flats are least likely to display Fibonacci relationships since each wave
is approximately equal to the previous one. When the b-wave of a Flat is much smaller or much larger
than wave-a, then relationships can start to appear. Below is a basic listing of what to expect. [For amore
detailed rundown of Fibonacci relationships, refer to "Advanced Fibonacci Relationships" Chapter 12.]
Strong b-wave
When the b-wave exceeds the end of wave-a, it would basically be limited to a 138.2% (not a true
Fibonacciratio, but acombination of two separate ones-1.00&. 382) or 161.8% relationship, butngijher
may be reached. Usually, if the b-wave is longer than wave-a, especially if it is substantially longer,
wave-a & c will be nearly equal in price. If the c-wave did relate by a Fibonacci ratio to wave-a, the ratio
would be 161.8% or 61.8%.
Normal b-wave
This is the Flat pattern least likely to exhibit Fibonacci relationships. The only possibility for
relationships would occur if the c-wave failed or elongated. If it failed, it is highly probable the c-wave
would relate to wave-a by 61.8%. On very rare occasions, wave-c can relate to wave-a by 38.2%, but
that is the minimum requirement.
If the c-wave Elongates, it is not likely there will be any relationship between wave-a & c. If there
is, it would have to be 161.8% or 261.8%.
Centra! Considerations 5-35
Weak b-wave
This situation allows for the greatest possible number of Fibonacci relationships. If wave-a and
wave-b related, it would be by 61.8%. Waves-a & c could relate by the same amount (Internally or
Externally, refer to page 12-22 for details). The c-wave could also be 61.8% of wave-b.
b. Zigzag (5-3-5)
Since there are not many ZigZag variations (compared to those possible in Flats and Triangles), there
are only a few relational possibilities.
Normal
Fibonacci relationships between adjacent waves of a pattern cannot be strictly depended upon. If
waves-a & b do relate, it will be by 61.8% or 38.2%. The more reliable relationships will occur between
waves-a & c. Wavc-a will be either 61.8%, 100% or 161.8% of wave-c (either Internally or Externally,
see "Advanced Fibonacci Relationships," page 12-22 for details).
Elongated
When a ZigZag is given the title, "Elongated," it means the c-wave is excessively long in relation to
wave-a. Usually an Elongated c-wave will have no relation to wave-a; if it does, it will be by 261.8%.
Truncated
The only relationship likely in a Truncated Zigzag is between wave-a and wave-c. Wave-c would
be 38.2% of wave-a.
c. Triangles (3-3-3-3-3)
Triangles are composed of more wave segments than any other "standard" Elliott Correction. Asa
result, they have a high probability of exhibiting multiple Fibonacci relationships. As a matter of fact,
a Contracling Triangle without Fibonacci relationships should be considered impossible. The normal
way Fibonacci relations manifest themselves in Triangles is the same way they usually happen in most
other patterns, between alternate waves. The most common setup is for waves-a, c, & e to relate by 61.8%
or 38.2% and the b & d-waves to relate by 61.8%. The only two adjacent waves which will consistently
relate to each other by a Fibonacci ratio (usually .618) are waves-d & e.
Important Note: If wavc-b is 61.8% of wave-a, you are probably not in a Triangle.
5 36 Central Considerations
Degree
Looking kick ill your chart, if you are working with monowaves. transform the plain Corrective
symbols you have been using on your diail pattern into ihe specific symbol which represents Sub-
Minuette Degree (a-br-il-c x). With all Monowave patterns, start off by lalieling each segment Suh-
Minuetle degice. If you are beyond the monowave development Mage, the Degree Symbols used fo~ llir
current pattern will be diciatcd by comhhing the smaller pattern;: (which have already been carefully
analyzed and labeled) into larger lilliotl patterns. How is Ihis done'.' Gcneralty, three patterns of one
ilcgiiv liirm to make one Corrective pattern of one larger degree (Triangles Ijcinr; the exception since
thevrei|nircfivcsegii!ciilMoci)mp'.iietliet'orreclioiHif(melargerDegree). Taking three Minor Decree
patterns and combining them into one largci Elliott pattern raise* the IVgree of that pattern one level,
■rile three Minor labels will lie replaced with one Intermediate label, ll-nr ti mure nmpleie dixcussiim
of Degree, refer in "Mute on Degree" on page 7-11 cf Chapter 7.1
Realistic Representations (Omcuions)
P!ililii.iiIIIlllil!!!li|!iii!!il!:iNI i!h III! 11 |
The diagrams on the next three pages show the most common arrangement of wave segment'; o:i a
Simple ami ('ample* Poly wave scale. Harhcatcgory variation is diagramed separately. When reviewing
the section on Triangles, keep in mind the "Pivotal" discussion at the bottom of page >-24.
I: you plot data in the inannerdcscrihid earlier in Ihis book', sec pages 2- II and 3-2). p-al-iime market
action will closely, and sometimes exactly, resemble the diagrams which follow. If you use bar chails.
hourly closing figures, futures data or oilier types of inmrrecily plotted or calculated daia, the ac.ion
sometimes will and sometimes will not look like the diagrams to follow and price, behavior will not
always ol>ey the rules in this book.
Central Comldwa'Jons .1 -37
ZigZags 5-3-5's
Dashed lines between
waves-a & b indicate
thatsectionmayormay
not subdivide at the
polywave level
Common
\
'\ A
1 \ /
i V
b:3
A
y\
^ \
\
i
i
i
i
\i
a:3
Elongated
b:3
c:5
Irregular Failure
Running
Flats (all types)
Downward
Corrections
3-3-5's
B Failure
a:3
5-38 Central Considerations
Running \
\ C Failure
c:5
b:3 I
Irregular Failure
w . Flats (all types)
^3 \ Upward Corrections \ Irregular
3-3-5's
ZigZags 5-3-5's c:5
Dashed lines between waves-a & b
indicate that section may or may not
subdivide at the polywave level
y Common C:5
Central Considerations 5-39
Contracting Limiting Triangles
Wave-3 or A
Correcting Down Trend I JVav£ilar£\
Complex
Wave-5prC\
Correcting Up Trend
Wave4 or B
Wave-5orC
Wave-3 or A
Complex
End of larger
combination
pattern
Complex
Complex
Contracting Non-Limiting Triangles
5-40 Central Considerations
Expanding Limiting Triangles
Wave-4orB
e:3
Wave-3 or
Complex
Simple
Wavr.-3 nr A
Complex
Simple
Simple
♦For Progress Label possibilities
be fore and after this pattern,check
the section on Expanding
Triangles (page 5-31) and the
Advanced Logic Rules (page 10-9).
*For Progress Label possibilities
before and after this pattern, check
the section on Expanding
Triangles (page 5-31) and the
Advanced Logic Rules (page 10-9).
Complex
Complex
e:3 \
Expanding Non-Limiting Triangles
Central Considerations 5-41
s
^^^t^r ince the beginning of this book, the main focus has been on explaining the step-by-step
process of proper monowave detection and the assemblage of monowave groups into Standard Elliott
polywave patterns. Each chapter and heading was organized in a very logical way to allow objective,
methodical application of the Rules to real-time price action. As your understanding of the Wave Theory
expands, the implementation of more sophisticated Rules and techniques is necessary to correctly
manage larger wave formations.
The last seven chapters of this book have been broadly titled The Neely Extensions. This is not to
be confused with the term "extension" which is the longest wave of an Impulse pattern. In this context,
the term "extensions" is used to indicate the presentation of new, but essential techniques and concepts
developed by the author which you should use when constructing wave patterns. Not every item
mentioned over the next seven chapters is completely new. A few ideas which have previously been
presented publicly are noted appropriately. Some previously known concepts have been greatly
expanded upon. Most of the ideas to follow, however, are completely new and should be very helpful
as you gain experience as an Elliott Wave analyst. Due to the prevalence of information now available
on this subject (books, newsletters, etc.), it is possible that concepts presented here may have, at
sometime, been presented before. If so, the previous presentation of that information is completely
unknown to the author.
From this point forward, the concepts and techniques for analyzing market behavior get more
involved and subtle. Many of the Rules, observations and tests require some knowledge of what the
market did before the current pattern and what it has done since the pattern completed. Until you are
comfortable with the construction of polywaves (and associated Rules), it is suggested you review the
previous sections and practice the Rules presented on real-time market action.
To give you a "taste" of what is to follow, some of the important topics covered in the rest of this book
are: discussions on the finalization and confirmation of polywave patterns; the reduction of polywaves
to simpler, more manageable forms; the ranking of polywaves based on Complexity level; the grouping
of polywaves (using Progress Labels) into larger, Standard or Non-Standard Elliott formations; the
Integration of several polywaves to form a multiwave (or Non-Standard polywave) pattern, and much,
much more. If you learned a lot from the first five Chapters of "Mastering Elliott Wave," the next seven
are even more informative.
Intermission 1
Post-Constructive Rules of Logic
Impulsions
Two Stages ofPatternConfimation 61
Stage 1 &l
Stage 2 fi
1stWave Extension .-
3 rd Wave Extension , „
5lhWave Extension fi1
5th Wave Failure , ,,
Corrections
Requirements for Pattern Confirmation 63
Flats and Zigzags fi t
Triangles 64
Chapters 6 through 12 are almost exclusively the
Neely Extensions
of Elliott Wave Theory
An important test of the validity of an interpretation involves the integration of Logic Rules. The
Logic Rules have evolved from years of diligent market observation by the author. The Rules require
all market action conform to specific behavior based on the implications of the pattern which preceded
it. The expected behavior must be present or there is a flaw in your current interpretation (these flaws
can sometimes be explained if the pattern or market environment allows for exceptions; see Exception
Rule, page 9-7). In other words, all action must be accounted for, it must logically integrate with its
surroundings and post-pattern behavior must meet specific requirements.
If you have been following along with your own price chart, at this point the Post-Constructive
Rules of Logic will need to be employed (more advanced rules are discussed under the "Advanced
Logic Rules" Chapter 10). Deciding which Rules to apply is a result of the type of pattern developing,
Impulsive or Corrective. Refer to the appropriate heading now if you are analyzing your own chart,
otherwise just read straight through.
Impulsions
II1I1I1I1BIIIIIII1IIIIIIIIIIIIIIIIIIIIIIIIIIIIIIIIIIIIIIIIIII 1111111 I I I
Two Stages of Pattern Confirmation
Stage 1 - Break 2-4 Trendline
The first point to apply the Logic Rules is immediately after an Impulse pattern finishes. Draw a
trendline across the end of waves (2) and (4). To confirm whether the Impulse pattern you discovered
is authentic, post-Impulsive market action must tireak the 2-4 trendline in the same amount of time
consumed by the 5di wave or less (see Figure 6-1). If it takes more time, the 5 th wave is developing into
a Terminal or wave-4 is not complete or your Impulse interpretation is wrong.
Basic Rules of Logic 6-;
Figure 6-1
Time taken to return
tothe2-4Trendline
Break of 2-4 Trendline occurs in
less lime than wave-5 took to form
-Wave-5 is completely
retraced in less time
than it took to form
Time taken to
completely
retrace wave-5
Stage 2 - 5th Wave Retracement Requirements
Next, check to see which wave of the Impulse pattern Extended. Depending on which wave is the
Extension, price action will return to a support/resistance level defined by the price range of wave-2 or
wave-4 of the Impulse pattern. Soon to follow is a list of minimum and maximum retracement
expectations based on which Impulse variation took place.
1st Wave Extension
The retracement to follow this Impulse variation must return to the termination of wave-4. Elliott
said it usually will return to the price zone of wave-2. This is the case when the 1 st Extension is wave-
1 or wave-5 of a larger Impulsive pattern. If the 1st Extension is wave-3, price action (depending on
conditions) may not be able to return to the 2nd wave zone. If the market moves beyond the termination
of wave-2, the whole Impulse pattern ended an even larger Impulsion or Correction.
3rd Wave Extension
Price action must return to the 4th wave zone of the completed Impulse pattern and will usually end
near the termination of wave-4. If the move retraces more than 61.8% of the entire pattern, the 3rd
Extension Impulse-also completed an Impulse wave of one higher degree.
5th Wave Extension
The correction to follow a 5th extension pattern must retrace at least 61.8% of the 5di wave, but must
not retrace all of the 5th wave if the trend is to remain in effect. If the 5th extension does get completely
retraced, it indicates the extension terminated a larger trend. Here are the different ways thatcan happen:
6-2 Basic Rules of Logic
1. The 5th Extension pattern was part of a larger Impulse which was also a 5th Extension;
2. The 5th Extension was the c-wave of a Flat or Zigzag pattern.
5th Wave Failure
A 5th wave Failure occurs when wave-5 is shorter than wave-4. This situation implies a great deal
of counter trend power. If the 5th wave failed in your wave group, the move to follow should completely
retrace the entire Impulse wave. If the Impulse was moving upward (downward), there should be no new
highs (lows) in the market until the Impulse is completely retraced.
If the price action after the Impulse pattern did not conform to the above, applicable behavior
requirements, something is wrong with your interpretation. Changes in the Progress Labels used will
probably need to occur. Possibly, reinstituting the entire wave identification and Structural labeling
process of the waves on your chart will be required (if so, return to Chapter 3).
A Word of Warning: If market acdon has, up to this point, followed all the necessary rules for
Impulse formation, do not be quick to throw out your entire count when one factor does not develop as
expected. Generally, asjm^changeinmeProgressLabelswillputtheentirecountbackontrack. The
most frequent reason the market will not follow through after breaking the 2-4 trendline is because the
4th wave is not actually complete (under Channeling in Chapter 5, see "Wave-4" for an explanation of
this process and Localized Progress Label Changes on page 12-45 for a more complete description of
how to make alterations of a scenario without destroying the whole interpretation).
Corrections
fjiiiiiiraiiiii'iiiiiiiiiiiiiiriiiiiiiiiiiiiiiii 11
Requirements for Pattern Confirmation
Unlike Impulse patterns, the corifirmation of a Correction does not require a sequential unfolding of
specific retracement events. The order of the confirmation stages depends on whether wave-b is shorter
or longer than wave-a in the Correction. Since Complex Corrections terminate with Standard Elliott
patterns, the only requirement to confirm that aComplex Correction has ended is to confirm the Standard
Correction which terminates the Complex Correction. Complete confirmation of a pattern always
involves two Stages. If the confirmation of both Stages occurs, there is virtually no doubt of die
authenticity of the Correction on your chart. If only one of the Stages passes inspection die pattern can
still be legitimate, but considerit a warning and be on the look out for more appropriate possibilities. See
the description (below) for the Corrective category.you are currendy studying.
Flats and Zigzags
Wave-b Shorter than Wave-a
Under these conditions, draw a trendline across the beginning of wave-a and the end of wave-b. To
satisfy Stage 1 and confirm the authenticity of the Correction, post-Corrective market action must break
the "0-B" trendline in the same amount of time (or less) that wave-c took to form. If it takes more time,
Basic Rules of Logic 6-3
the c-wave is developing into a Terminal or wave-4 (of wave-c) is not complete or your Corrective
interpretation is incorrect. If Stage 1 confirmation is met, Stage 2requires wave-c be completely retraced
in the same amountof time (orless) that wave-c tooktoform. In Figure 6-2, the b-wave was intentionally
drawn so that it related to wave-a by 61.8%; this allows the one diagram to dually function as an
illustration of how Flat confirmation and Zigzag confirmation occurs.
Figure 6-2
Time taken to
completely
retrace wave-c
Wave-c is completely
retraced in less time
than it took to form
Break or 0-B Trendline
occurs in less time than
wave-c took to form
Time taken to return
to the 0-B Trendline
Wave-b Longer than Wave-a
In this situation, Stage 1 Confirmation is met if wave-c is completely retraced in the same amount
of time (or less) that it took to form. Stage 2 Confirmation is satisfied if the market breaks the 0-B
trendline in the same amount of time (or less) that wave-c took to form (sec Figure 6-3). The larger the
b-wave, the more the market will have difficulty attaining this second Stage of Confirmation. Therefore,
be lenient on the time factor for Stage 2 duringRunning Corrections and Irregular Failures with very large
b-waves.
Triangles
There are two Triangular categories, "Expanding" and "Contracting." Contracting Triangles can
easily be confirmed based on post-Triangular market behavior. Expanding Triangles confirm their
legitimacy through "non-confirmation." In other words, after the e-wave of an Expanding Triangle, the
market should either not retrace the e-wave completely (obviously simultaneously eliminating the
chance to break the B-D trendline) or it will take more time to completely retrace wave-e than wave-e
took to form. Below are listed the two, sequential Stages of confirmation for a Contracting Triangle.
Stage 1
In Triangles, a B-D trendline is implemented instead of a 0-B. To obtain confirmation, the market
must break the B-D trendline in the same amount of time (or less) as that consumed by wave-e.
6-4 Basic Rules ot Logic
Figure 6-3
Notice in this example that the
break of ihe 0-B trendline occurs
after wave-c is completely retraced
Time taken to return
to the 0-B Trendline
Break of 0-B Trendline
occurs in less time than
wave-c took to form
Wave-c is completely
retraced in less time
than it took to form
Time taken to
completely retrace wave-c
Stage 2
The "thrust" after wave-e of a Triangle should exceed the highest or lowest price level achieved
during the Triangle. [This concept has already been discussed in Chapter 5, page 5-28.] The Triangle's
"thrust" must terminate in a time frame which is less than 50% of that taken by the Triangle (Non-
Limiting Triangles are not bond to the 50% time rule) added to the end of wave-e.
All Elliott Wave patterns imply certain levels of strength or weakness (see Pattern Implications
under the Advanced Rules of Logic heading, Chapter 10). Whenapattern completes, the mdiketmust
react in a fashion which is consistent with the implications of that pattern. For example, if a Running
Correction just completed, the move afterward needs to be very explosive (upward or downward) and
achieve a price distance equal to or greater than 161.8% of the wave (or wave group) preceding the
Running Correction. To view diagrams of Running Corrections, see Realistic Representations, pages
5-38 and 5-39.
How will you know what to expect from other types of patterns? Multiple Corrective categories and
numerous variations of each category preclude a simple discussion on this subject in Chapter 6. If you
are at a more advanced level and feel ready to learn some new concepts, study the Advanced Rules of
Logic in Chapter 10.
If you do norfeeTready to tackle a new section, simply continue applying the more simplistic
approaches outlined in this and previous chapters, but keep trying to form your wave pattern's with the
logical concept in mind. Put another way, do not allow a weak Corrective pattern to precede a strong
move or a strong Correction to occur before a weak move. That condition would produce a contradiction
in the pattern's implications and virtually guarantee the interpretation is incorrect. With practice and keen
observation, the concept will become easier to apply.
Bask Rules ot Logic 6-5
Conclusions 1A
Compaction Procedures 7_1
Regrouping 7_3
Integration 71
Progress Labels - Revisited 7.3
Complexity Rule 7_4
Monowaves
7-5
Polywaves 7 c
Multiwaves
Macrowaves
7-7
7-10
More on Degree 7 I j
DegreeTUIing -^U
DegreeSymboiizing 7.12
Review
7-13
What is a Wave? - Revisited 7_14
Flow Chart of Entire Neely Method of Elliott Wave Analysis 7-14
By meticulously following all the steps from Preliminary Analysis up to die Central
Considerations section and carefully monitoring the effects of the Post-Constructive Rules of Logic, you should
know whedier the combination of waves you have been testing (since the beginning of Chapter 3) are
Impulsive or Corrective in nature. It should also be relatively evident which Elliott pattern variation is
unfolding. As a result of this testing, there should be little doubt as to the validity of the formation. Now
mat you have identified a legitimate Elliott pattern, most of the pattern management procedures are
behind you. There are only a few more things to cover:
1. How is your completed pattern simplified to make it easier to work with in the future?
and
2. How is die Degree Title and Symbol of mat simplified pattern decided upon?
To answer the first question, the Compaction Process is used. Compaction allows you to simplify
a pattern's Structure Series into its base Structure (simply either a ":3" or a ":5"). Using the Complexity
Rule, a technique developed by the author, the base Structure has to be "stratified" contingent on the
intricacies of the segments which made up the compacted pattern. This technique will greatly assist in
the proper combiningof large scale and complex formations as yourskillsdevelop. To answer the second
question, the "More On Degree" heading at the end of this Chapter will enable you to deduce the proper
Degree Title and Symbol of each pattern compacted.
Compaction Procedures
|-'i!!li:illllllfl|!||||!||||l!lllllll!!l!!!llllll!|!|l! I I I
"Compaction" is a term used to describe an essential, heretofore undefined, Elliott process. It is a
technique employed to reduce a completed series of Mono-, Poly-, Multi-, or Macrowaves into a single
Impulsive or Corrective structure (":3" or ":5"). Due to the dynamic nature of this concept; any
completed Elliott pattern, no matter how large or small, can be handled as and labeled as a single
Corrective (:3) or Impulsive (:5) event. This process is necessary to continually simplify what would
eventually become an unmanageable web of price action. The technique Cjfflnot be employed until after
all previously discussed criteria has been considered (i.e., Structure, Series identification, Essential and
Conditional Construction Rules, Channeling, Fibonacci ratios, Post-Constructive Rules of Logic, etc.).
Once all basic Rules and procedures have been followed, the Compaction process is implemented.
Conclusions 7-1
Below is a listing of how to reduce all Elliott formations based on their Structure Series.
A.
B.
C.
D.
E.
5-3-5-3-5 =
5-3-5 =
3-3-5 =
3-3-3-3-3 =
3-3-3-3-3 =
Trending Impulse=
Zigzag =
FIat =
Triangle=
Terminal Impulse =
":5"
":3"
":3"
":3"
":5"
F. All patterns which contain "x-waves"
(immediately before Compaction is
performed) can be reduced to a ":3."
Upon completion of a correctly formed Elliott pattern, the Structure Series which makes up the
pattern can be compacted into the single number (the base Structure label) on the right of each Series.
If you are diligent in the practice of Compaction, the larger and longer-termpatterns can be put together
with the same, and sometimes greater, ease as the shorter-term patterns.
Below is an example of a Standard wave pattern being Compacted into a single Structure label (see
Figures 7-1 and 7-2).
Figure 7-1
Structure sequence before Compaction; a Flat
pattern is found in the middle of the sequence:
a. 5-|F3-c3-L5|-5 = Hat
After Compaction, pattern reduces to a ":3_"
5
|5
F3
F3
Is
5
F3
-F3
L5|
L5|
12
♦Compacted
value of Flat
Important Low
The new Structure sequence, due to
implementation of the recently Compacted pattern's
base value, creates two possible Series for
consideration:
Zigzag Series
Impulse Series
After checking all necessary criteria, if conditions typical to the
pattern being studied are met, its Structure Series is replaced widi that
pattern's Compacted base Structure. When attempting to combine the
Compacted pattern withsurrounduig market action, the base Structure
should be used for all Series Combinations from that time onward.
In the diagram, the F3-C3-L5 which makes up the Flat is
compacted to a ":3_" (level-1 Complexity). That ":2" should be used in new
Structure Series' which will form even larger formations.
7-2 Conclusions
Note: After Compaction, reassessment of that pattern's base Structure is required. Return to
Chapter 3 and pretend the Compacted pattern is a monowave. Apply the necessary Rules to detect the
groups internal Structure. If this produces a base Structure contrary to the pattern's nature (Class), a
"missing" wave may exist. Note that, then reassess the two monowaves (or wave groups) on either side
of the Compacted pattern. Afterward, proceed to Chapter 4 and resume normal analysis protocol.
(Warning: do not reassess patterns which exceed their own beginning: for details see page 3-68).
Regrouping
After Compaction, the wave group's base Structure (with the assistance of Chapter 4) will be used
to form larger Standard or Non-Standard Structure Series'.
For example: The group of monowaves in Figure 7-1 has already been Structurally labeled. After
making the proper observations and applying the appropriate tests, you decide the Hat pattern uncovered
in Fieure7-1 is legitimate: therefore, itis compacted to produce atom Structure of ":3." When you return
to Chapter 3, larger patterns may be formed by taking the base Structure of that pattern and combining
it with Structure labels of surrounding patterns (which, themselves, may or may not have been through
the Compaction process). Before searching for a new Structure Series, make sure there are at least five
Structurally labeled wave segments to analyze. After Compacting the Hat in Figure 7-1, only three
Structure Labels remained. Therefore, two additional monowaves were added to Figure 7-2. In Figure
7-2, moving backward from the ":L5" at die top of the wave group, only the compacted value of die
recently found Flat should be used as part of this new Structure Series.
Integration
Integration is a term used to describe the transference of shorter-term, compacted wave Structure
to longer-term charts allowing larger formations to slowly be pieced together. For example, if every time
a polywave pattern completed on a shorter-term chart you were to place that pattern and its compacted
Structure label on a slighdy longer-term chart, eventually numerous poly waves would be present, each
with its own base Structure identified. Combining those poly waves into larger formations would involve
exacdy the same procedures described for monowaves. Only a few additional Structure Series
possibilities, which are covered in the next chapter (Construction of Complex Polywaves, Multiwaves,
or higher), would need to be considered.
Another application of the Integration concept would include the cross-referencing of information
(i.e., comparing price/time projections of long and short-term charts to arrive at a consensus projection)
between charts to arrive at the most logical and accurate assessment of the future course of a market.
Through a process of elimination and through the cross-referencing of target zones and time projections
you can usually reduce the number of interpretation possibilities to a single choice. At the very least,
you should be able to decrease the number choices and keep your trading with the trend of the market.
Progress Labels - revisited
In the process of transferring Structural information from a shorter to longer-term chart, do not
transfer the Progress Labels associated with the pattern. Why not ? Progress labels serve a very specific
and short-lived purpose. They solidify and confirm (or invalidate) your grouping of several adjacent
mono-, poly-, multi-, or macrowaves by providing a list of necessary attributes which must be adhered
to by the market action. They are an essential part of the procedures leading up to the Compaction
Conclusions 7-3
process. After a pattern meets all necessary attributes and has been properly Compacted, the Progress
Labels (1-2-3-4-5 or a-b-c, etc.), which organized the market action into an Elliott formation, no longer
serve an important function to the pattern. The base Structure (:3 or :5) is now the most important
consideration. It is the base Structure which properly guides you in the formation of larger Complex
Polywave or Multiwave patterns.
Complexity Rule
illEIIIUIIIIlllIllllllllillllllllllllllllllilllllllllllllllillll 11111111 I I I
This Rule, another tool developed by the author, provides a standard for the categorization of
subdivisions within a pattern. It assists in combining large scale patterns and in deciding the relative
Degree Title of a segment. As patterns get larger and more time consuming, it can be difficult to know
which patterns can and cannot be combined with others to form larger ones (a function of Degree).
Basically, all analysis begins with the combining of monowaves into polywaves, those polywaves into
multiwaves, etc. As you progress, each pattern (visually and structurally) gets more difficult to manage
if you do not keep track of the Complexity level of each pattern, before and after Compaction.
Complexity is not an important concept to understand when you are just beginning your studies of
me Elliott Wave Theory, but it will become increasingly important as you begin to chart and keep track
of long-term wave patterns. Complexity identification plays an important role in the detection of large
scale patterns of the same Degree. Generally, patterns only of the same or of an adjacent Complexity
Level can be considered the same Degree (Degree is explained in greater detail later in this Chapter).
In the early stages of market development, the Complexity Level of a pattern is relatively easy to
ascertain. It is a direct product of the number of subdivisions visible in a price move. A single monowave
has a Complexity Level of "0" (see Figure 7-3). Arranging three or five monowaves into a polywave
constitutes the development of a pattern from its base level of Complexity to Level-1 (see Figure 7-5a).
Level-2 is the point where one of the Trending patterns in a polywave noticeably divides into a smaller
Impulse sequence, turning the polywave into a multiwave.
The detection of Complexity Level-3 (and higher) patterns is not quite so obvious. A larger pattern's
Complexity Level is almost solely dependent upon the Complexity of smaller Impulse segments within
the pattern. The "Complexity identification" techniques will keep you on track when attempting to
combine patterns of extended price and time characteristics. For example, you cannot expect the straight
line in Figure 7-4a (below left) to be of the same degree as the pattern in Figure 7-4b (below right). That
is, of course, an obvious example. When a pattern covers several months or several years, the Complexity
Level can be very difficult to discover without implementing the techniques to follow. The next few
pages describe how Complexity Level is arrived at on varying scales of market activity.
Figure 7-4a Figure 7-4b
These two patterns - /
cannot be considered / Multiwave
the same degree. A f*
7-4 Conclusions
Monowaves
The Complexity Level of a monowave is easy to determine. With no visible subdivisions, the
Complexity Level of a monowave is always "0." When it comes to integrate monowaves in the
Complexity evaluation process, assign all monowaves a mathematical value of "0."
Figure 7-3
Complexity Level- 0
Polywaves
Anytime a market completes an Elliott pattern which has visible subdivisions and conforms to all
applicable rules, me Complexity Level must automatically be Level-1 or greater. In other words,
anything greater in Complexity than a monowave is of Complexity Level-1 or higher. The Complexity
Level of a pattern is designated by the presence (or absence) of underlines to existing Structure Labels
(the greater the number of underlines, the higher the Complexity Level of the pattern completed). No
underlines indicate Level-0. One underline stands for Complexity Level-1, two underlines, Complexity "•**™ii«
Level-2, etc.
A simple Polywave is composed of only three or five monowaves. In Figure 7-5a, two simple
polywaves (one Corrective, one Impulsive) are diagramed which fall under typical Elliott guidelines.
Since bom patterns subdivide, they must immediately be given a Complexity rating of Level-1. To
confirm whether the pattern is oris not of greater Complexity, it is necessary to investigate the Impulsive
Figure 7-5a
Conclusions 7-5
Polywaves
Complexity Level!
segments of the move and pick the segment of greatest Complexity. In Figure 7-5a, all the Impulse
patterns (:5's) are monowaves. Monowaves, as mentioned earlier, are Level-0. This value would be
added to the assumed Level-1 rating. The final result; both patterns in Figure 7-5a are Level-1.
Figure 7-5a
(Continued)
Level-1 Polywaves
All the Impulsive and
Corrective segments of die
wave patterns on the right
and left are monowaves
Monowaves
Monowaves -
Strictly due to visible subdivision, both of the above patterns automatically must be of Complexity Level 1 or higher.
To make sure there is no misunderstanding, several additional examples are needed. In Figure 7-
5b (the bottom of this page and the top of the next), both patterns are of Complexity Level-1. Even though
Corrective segments within each pattern subdivided (wave-b in the Flat and waves 2 & 4 in the Impulse
pattern), the Complexity Level of the Impulse segments of those patterns remained at Level-0. This
means the Complexity of the entire move is still Level-1.
Figure 7-5b
The :3 & :5 do nol
subdivide (therefore
are not underlined),
which indicates
Level-0 Complexity.
Complex Corrective Polywave
Compacted to a Correction
Here, the ":2" is underlined once because it
subdivides into three segments. Its Complexity Level
cannotbe any greater than Level-1 since nopartcon-
tains an Impulse pattern which subdivides.
A subdivided Correction does notraise the
Complexity of the largerpattem. Toraise the Complexity
Level of a pattern always requires asubdivided":5.*
If a pattern contains an Impulse segment, simply add
the Complexity Level of the most complex Impulse
pattern to its automatic Level-1 Complexity.
Since the formation on the left does contains an
Impulse pattern, and that segment exhibits Level-0
Complexity, add Level-O.to the automatic Level-1
and the result is still Level-1.
7-6 Conclusions
Figure 7-5b
(continued from last page)
Complex Impulsive Polywave
:5 = Compacted value of entire advance
:L5
The same rules which guide the discovery of
Complexity Level in Corrections applies to Impulse patterns which
have polywaves in the 2nd or 4th-wave position. Note here
that both Corrections are of Level-1, but none of the Impulse
advances subdivide. To arrive at the correct Complexity
Level, you immediately assume a Level-1 rating simply
because there are visible subdivisions in the pattern. When
you check for the most complicated Impulse segment, all are
ofComplexityLevel-O. Adding that amount to fheautomatic
Level 1, you again arrive at Level 1 for the entire move.
Multiwaves
All Multiwaves are Complexity Level-2 patterns. What is the major difference between a Polywave
and a Multiwave? In a Multiwave, at least one (and usually, only one) of the ":5's" within the multiwave
subdivides into its own Impulsive polywave (see Figure 7-6a). On rare occasions, and under specific
circumstances, more than one Impulsive polywave mighi occur in a multiwave. A Corrective Multiwave
is diagramed in Figure 7-6b (next page).
Figure 7-6a
5:L5
An Impulsive
Polywave is found
within an
Impulsive Multiwave
Impulsive Multiwave
Complexity Level-2
_J To get an idea of how Progress and Slruc-
ture labels can be used together, this
diagram has both at the end of each wave.
Conclusions 7-7
Figure 7-6b
Complete
Impulsive
polywave
within the
Corrective
Multiwave
Corrective Multiwave
Complexity Level-2
Referring to Figure 7-6c, this is how Complexity of that pattern would be decided. First, observe if
the pattern subdivides or not. It does, therefore it automatically qualifies for the minimum Complexity
rating of Level-1. Next, examine each individual Impulse segment and note the Complexity Level of
each. Out of the three Impulse patterns of the same Degree, choose the one with the highest Complexity
rating. The most complex segment in this pattern is the middle advance (wave-3), which is Level-1
Complexity. Add "1" to the automatic Level-1 and you get Level-2. That is the Complexity of the
diagram in Figure 7-6c. Figure 7-6d describes the Complexity delineation process for a Corrective
Multiwave.
Figure 7-6c
Compacted Complexity
Value =:£ (Level-2)
ThesameprinciplesusedtodecideComplexity
Level of aCorrection are used for Impulse waves. In
the diagram, the visible subdivisions again indicate
a minimum Level-1 rating. Noting the Complexity
of each individual segmentof the Impulse wave, the
most complex Impulse wave is wave-3 (it is a ":5").
This Level-1 pattern would be added to the
automatic Level-1. The result, a Level-2 rating for
the entire compacted pattern.
7-8 Conclusions
Figure 7-6d
The Complexity Level is assumed to be at least
Level-1 since there are visible subdivisions. Next,
note that the second Trending pattern is the highest
level of the two Impulsive patterns. The Level-1
Complexity of the final Impulse wave is added to
the automatic Level-1. Consequendy, the Zigzag
is Complexity Level-2. Note: each underline
denotes an additional level of Complexity.
Corrective Multiwave
Complexity Level-2
Compacted value of Zig Zag = :2
Figure 7-6e is a discussion on how to derive the Complexity Level of a Complex Multiwave. Pay
close attention; these are a little tricky since the Complexity Level is Jess than it would appear.
Figure 7-6e
Compacted|
Value = :3_
(Level-1)
This is the x-wave
Complex Multiwave Correction
Complex Corrections assume the Complexity
Level of the most complex Standard Correction.
Compacted
Value = J
(Level-2)
I I
The entire formation would compact to the Complexity Level of the
most complex standard Elliott pattern. The second Zigzag is the most
complex standard pattern, so the rating of that Zigzag correction
(Level-2) would be the rating of the entire larger Complex Correction.
This Double Zigzag, when complete,
will need to be compacted to its base
structure(whichis":3"). Tomaintainthe
proper Complexity Level, assign the
whole correction the Complexity Level
of the most complicated, independent
Standard Elliott pattern. In this case, the
second Zigzag is themost complex and is
a Level-2 pattern. That would be the
assigned value of the whole formation.
Conclusions 7-9
Macrowaves
" Macrowave" is a less precise term than the previous three descriptions of market Complexity. As
greater periods of time elapse, apattern gets more and more complicated. Visually, there is an undefined
point where it becomes very difficult to distinguish one Complexity Level from another. For this reason,
there was no need to continue naming moves of greater and greater Complexity. Therefore, the term
"Macrowave" will be used to describe any complex pattern above the Multiwave stage.
The minimum requirement for a pattern to fall into the Macrowave category is that it containsaf least
one Multiwave and one Polywave (usually there will be two polywaves, see Figure 7-7). To derive 'he
Complexity Level of Figure 7-7, first use the "automatic" rule. The pattern should immediately be
considered of at least Level-1 Complexity since subdivisions are visible. Examine each Impulsive
segment (of the same Degree) within the Macrowave. Choose the one with the highest rating and add
that to the automatic Level-1 rating. In this case, the final advance is a Level-2 pattern. Add that to the
automatic Level-1 and you get Level-3. Since this is the minimum Construction of a Macrowave, all
Macrowaves must have a Level-3 rating or higher.
Figure 7-7
x5:L5
Minimum structural requirement
for a Macrowave:
A. 1 Polywave
B. 1 Multiwave
This is amonowave. In
realtime, it would more tikely
have been a polywave. If the
pattern remained a I
monowave. it would create a —|
rare event 1 call "Triplexity."
This means the pattern has at i
least three segments, each of
a different Complexity.
Compacted Complexity of entire pattern = :£ (Level 3)
7-10 Conclusions
More on Degree
^VJIIIIIEIT'IHIIIIIIIIITIIIIIIIIII!!!, !|!!!!|!!|!| I I I
If you were to ask technicians their definition of Degree as it relates to the financial or agricultural
markets, most would probably use non-specific descriptions such as short-term, intermediate-term, and
long-term. Vaguely, they may describe how much time each Degree consumed (of course, from then-
own perspective). What constitutes a long period of time for some may be a short period of time for the
more patient. This general description of Degree leaves a lot to be desired by the demanding technician
and serious market student.
Precise rules are necessary to discern every aspect of market behavior if you expect to make accurate
predictions. Having specific criteria for the evaluation of different Degree levels also aids in the
discussion of a market, allowing you to speak about various types of price action with others from a common
vantage point. Knowing the relative Degree of a pattern is essential to the proper application of numerous
rules, the integration of information from a shorter to longer-term chart and the Compaction (discussed
earlier) of a completed pattern into its base Structure (:3 or :5).
Degree has been purposely skimmed over (until now) to prevent any confusion. A good foundation
of the more concrete concepts of the Elliott Wave Theory is required to properly understand Degree.
Degree is important if you are employing a combination of short, intermediate and long-term charts, not
when you are still learning to interpret and combine monowavts into polywaves.
Degree Titling
Degree is a concept which must be considered when you combine several (or more) Mono-, Poly-
Multi, or Macrowaves to form a larger Impulsive or Corrective pattern. The realization of this process
creates a higher Degree Title for the combined group of waves as a singular entity. In other words, when
three or five segments are combined into one larger, legitimate Elliott pattern, a pattern of one higher
Degree is created. Therefore, any visible subdivisions in apattern are always at least of one lower Degree
than the pattern as a whole.
The Degree concept cannot take root until you finally Title a specific move on your chart. The Title
of a particular move is basically up to you, but some suggestions were given earlier to designate the
original monowaves on your first and smallest timeframe chart as Sub-Minuette in Degree. Once a
segment is Titled, there is a frame of reference from which to compare all other patterns.
On the next page is a chronologically progressive listing of the Titles and Symbols which make up
the various wave Degrees. These Title listings are the same as those R. N. Elliott originally devised (with
two additions by the author).
Conclusions 7-11
TITLES:
I SUB-MICRO* I
1 MICRO* I
| SUB-MINUETTE I
I MINUETTE I
MINUTE
MINOR
INTERMEDIATE
PRIMARY
CYCLE
SUPERCYCLE
GRAND SUPERCYCLE
"Additions to Elliott's original titles
The Titles listed above represent progressively larger Degrees from die top downward. Beginning
at the top, the Titles are encased in larger and largerrectangles to show their increasing size. By stacking
die rectangles in pyramid fashion, it should provide you with a visual understanding of how each smaller
Degree pattern builds the foundation for the next larger Degree.
When is it necessary to use the additional Degree Titles at the top of the list? The Complexity of a
wave pattern expands and contracts as the time element allowed for its formation expands and contracts.
The Sub-Minuette Degree designation used on the monowaves of your original chart may eventually
represent patterns of increased complexity as time passes. The Sub-Minuette Tide, which previously
denoted only monowaves, may eventually represent polywaves, also. This takes place when the market
expands the time element allowed to complete a formation of a specific Degree. The division of theSwfc-
Minuette pattern will require assigning each segment with a lower Degree Title. For each division, you
would employ the Micro symbols. If the Micro waves subdivide, use the Sufi-Micro Titles and Symbols.
Degree Symbolizing
A Degree Symbol is die simultaneous representation of a Progress Label (depicting pattern position),
and a Degree Title (which, in a relative manner, loosely describes a pattern's price and time parameters
and its intricacy relative to patterns of one larger and one smaller Degree).
On the next page is a repeat listing of all Degree Titles from the above diagram. This time, specific
Progress Label Symbols have been added to show which Degree Title the Symbols represent. The
Symbols in Figure 7-8 are not exactly like diose Elliott used originally. A more logical labeling system
has been devised by die audior to make memorization easier.
7-12 Conclusions
Figure 7-8
SYMBOLS
GSC -
sc -
C -
P -
In -
Mnr -
Mnt -
Mnut -
SM -
Mc -
SMc -
Grand Supercycle
Supercycle
Cycle
Primary
Intermediate
Minor
Minute
Minuette
Sub-Minuette
Micro
Sub-Micro
Impulsive
E
[i]
[i]
CD
®
(i)
(i)
1
i
.1
.i
-
-
-
-
-
-
-
-
-
-
-
E
[5]
[v]
CD
®
(5)
(v)
5
V
.5
.V
Corrective
E
[A]
[a]
®
®
(A)
(a)
A
a
.A
.a
-
-
-
-
-
-
-
-
-
-
-
E
[C]
[c]
©
©
(C)
(c)
c
c
.c
.c
Review
For two (or more) patterns to be combinable, they must be of the same Degree. Anytime an Elliott
pattern is assembled, it is automatically implied each segment is of die same Degree (but not necessarily
of die same Complexity). For two waves to be of the same Degree, it is imperative diey possess some
similarities of Price and/or Time (see "Rule of Similarity and Balance"; Chapter 4, page 3). Ideally, a
mixture of time and price similarities is present in waves of the same Degree. Realistically, when a same
degree wave is not similar in price, the market will compensate by closely matching (or exceeding) die
time consumed by the previous move. If time is not within the relational range indicated in the "Rule
of Similarity..." section, then price will adjust for the deficiency by closely matching (or exceeding) that
of the previous wave. If neither die time nor the price consumed by a wave falls within the_"relational
range" of an adjacent wave, die two waves are almost surely not of die same Degree.
Another method of detecting "same Degree" patterns involves Complexity Level. For patterns to
be considered the same Degree, they must be of the same Complexity or of an adjacent complexity.
[NOTE: an extremely rare exception to this statement may take place between the center portion of a
Triple Combination Correction and one or both of the x-waves which surround it.} This concept
becomes very helpful as the patterns being studied unfold beyond the 2nd or 3rd complexity level. It will
keep your patterns in proper relationship to each other and help avoid incorrect integration of patterns.
Conclusions 7-13
To begin your application of Degree labels, it is suggested the Sub-Minuette Tide be used on the
monowaves of your smallest chart (this should have already been done in the Chapter 5). After moving
to the Compaction section, the Degree of die compacted pattern will be one level above me Degree of
me highest Degree labels used before Compaction. This applies every time you compact a pattern. For
example, the first wave group you worked with (or are working with) should have been composed of three
or five Sub-Minuette monowaves. After a group is compacted into a single Structure label, the pattern,
as a whole, would be elevated to Minuette Degree.
What is a Wave? - revisited
Ea'lllllll!!!!!!!!!!!!!!!!!!!!!!!!!!!!!!!'!!!!'!!!!!!! ||! | |
At the very beginning of the book, the term "wave" was described strictly from a Monowave
perspective. Not until the end of the Conclusion chapter could a more general description of the term
"wave" be given which encompasses patterns of every Degree (mono-, poly-, multi- and macrowave):
A Wave is the distance between two adjacent Progress Labels "of the same degree."
For example, the action between Progress Label's (1) and (2) or A and B, is a Wave. This differs
from the definition given earlier of the more specific monowave which was strictly limited to the motion
between one change in price direction and the next. Now that you know the general definition of "wave,"
it should be clear why it was impossible to provide you with a general description earlier.
Flow Chart of Entire Neely Method
of Elliott Wave Analysis
I!'"1:!''!!!!!,!!!!,!,!!!!!!!!!!!!!!!!!!!!!!!!!!!!'!!'!! Illlllllllllll II I I I I I
The diagram on the next page is a complete "flow chart" of the Neely Method of Elliott Wave
analysis. After readmg_"Mastering Elliott Wave" through the end of Chapter 7, you have been exposed
to all of the major steps in this analysis process (each step is clearly deliniated on the flow chart). Chapters
8-12 are designed to provide you with more specific information for the proper designing and testing of
each Elliott pattern but are not "named" steps in the general process of analysis. The flow chart should
significantly increase your general understanding of how (and in which order) Elliott and Neely concepts
should be applied to price action. After you become comfortable with Chapters 1-7, simply following
the flow chart of the Neely Method may be enough to assist you in the accurate compilation of any Elliott
Wave pattern. ~"~" " " """' '
7-14 Conclusions
of Elliott Wave Analysis
by Glenn Neely
T
Elliott Wave Institute -1278 Glenneyre, Suite 283 - Laguna Beach, CA (714) 497-0949
General
Concepts
I Plot Data
I ,
Pick important high or
low for starting Date
"Cash Data only!
Central
Considerations
Impulsive
v
Extension
Rule
II
1
Progress
Labels
IRuleofEc
ualitv
$2.
Yes
No
Impulse
Construction
Rules
Corrective
_
Conditional
Construction
Rules
*
Imp ulsive?
__
| Overlap Rule |,
Alternation
Realistic
Representations
, {[Channeling]
\
Degree[-<--j Fibonacci |
Construction
of Complex
Polywaves
■ ..__
Basic Neely
Extensions
Neely's
Advanced
Logic Rules
-
Neely Extensions
i
■ • •"
'
Neely's Advanced
Progress Label
Application
Advanced Neely
Extensions
Preliminary
Analysis
Monowave
Identification
Pre-Cons tractive
Rules of Logic
Rule
Identification*
•Upon nt-gvmliMtkin. only aiseu
Compacted and adjacent patterns
Intermediary
Observations
Locate Position
Indicators
Rule of
Similarity and
Balance
Group
Monowaves
Identify
Monowaves
and monowave
groups
| Re-combine
Basic Rules
of Logic
llmpulie?
Which wave Extended?
5th
What
Variation?
""J Post-pattern Confirmation* F"
•Refer to Wisely ExteraicnH fer iddjliontf nnituacci
Conclusions
| Regrouping [« - I Compaction I
| Integration f-
I More on Degree I* I Complexity Rule!
Return for
Hf-Evaluatlon
of Compacted
patterns and
surrounding
Monowaves*
S
Copyright © 1989 Glenn Neely - Elliott Wave Institute, Laguna Beach, CA
7-15 Conclusions
Construction of Complex Polywaves, Multiwaves etc. s_i
Construction of Complex Polywaves 8-1
Standard Type g_l
Non-Standard Type g_2
Additional Replacement Rules g-2
Specifications g_2
Condition I g_2
Condition 2 g_3
Complex Correction with Small x-Wave(s) 8-3
Complex Correction wilh Large X-Wave(s) g41
Review g.y
Construction of Multiwaves 8_15
Impulsive g_^
Corrective g^
Construction of Complex Multiwaves g.jg
ConstrnctionofMacrowaves g_18
Impulsive g_i g
Corrective g.jg
More on Alternation g_19
Intricacy g.jo.
Construction g_20
More on Extensions 8_2i
Extensions vs. Subdivisions g_2l
Importance of Knowing Which Wave Extended 8-24
Knowing Where to Start a Count 8-27
^su0°
0° -
V ^ %w"'
x Polywaves; mj^waves etc.
V> <& *
After identifying one or more Polywave patterns on a real-time price chart, to expand your
perspective of the market's future possibilities, you will need to combine a group of poly waves (to create
a Complex Polywave) or combine a combination of mono- and polywaves to create a Multiwave pattern.
Construction of Complex Polywaves
raiiwiiH 111
Complex Polywaves fall into two categories. The first category is theStandard type which is an
Impulsive or Corrective pattern where die most subdivided wave is a Corrective polywave only. Impulsive
polywaves are excluded.fromthe previous sentence because a pattern containing^! Impulsive polywave
is a Multiwave pattern (or higher).
The odier category of Complex Polywave is the Non-Standard type. Special rules must be obeyed
and certain circumstances must exist to create a Non-Standard pattern. Non-Standard patterns are only
possible when combining several poly waves (or higher). They cannot simply occur from a combination
of uncompacted monowaves.
Standard Type
The formation of a Standard Impulsive or Corrective Polywave is not normally composed strictly
ofthreeorfiveadjacentmonowaves. Usually, one of the Corrective phases (butnotany. of die Impulsive
phases) of the polywave will itself be a polywave (see Figure 8-1 on page 8-4). This allows for better
Alternation between die two detached corrective phases of an Impulse pattern (i.e., waves 2 and 4) or
the two adjacent segments of a Corrective pattern (i.e., waves A and B).
Construction of Complex Polywaves, Multiwaves, etc 8-1
When a Polywave contains one or more Corrective Polywaves, it is considered a Complex
Poly wave. For a pattern to remain a Complex Polywave, no segment labeled with a Structure of" :5" can
subdivide. If one or more of the ":5's" in a pattern does subdivide into a Polywave, the pattern should
be considered a Multiwave (refer to "Construction of Multiwaves," page 3-16).
Whether a Polywave is strictly composed of monowaves or one or two Corrective polywaves, all the
same Construction Rules covered in the Central Considerations chapter apply.
Non-Standard Type
The presence of a Non-Standard formation is only possible if there are at least two Corrective
polywave patterns (compacted to their base Structure of ":3") which are separated by a mono- or
polywave corrective phase. These base Structure labels serve the same combining function they did for
monowaves in Chapter 4, to assist you in the proper grouping of adjacent wave patterns.
Due to the more elaborate design of polywaves (relative to monowaves), they can interrelate with
other polywaves in ways not possible at the monowave level. For example, to detect the internal
Structure of a monowave requires observing how much surrounding market action retraces it. On the
other hand, when working with polywaves, the Structure is already known; there is no need to wait for
a reaction. This fact brings up additional interaction possibilities which are covered below.
Additional Retracement Rules
If you are following along with yourown chart and see a confirmed, Compacted Correctivepolywave
which is retraced less than 61.8%, or more than 161.8% by the next monowave or Corrective polywave,
and men another Corrective polywave occurs immediately thereafter, refer to the "*Specifications*"
section below for an explanation of what such an arrangement could mean and how to solidify such a
grouping into a legitimate Elliott formation.
If neither of the above relational circumstances is present in your polywave grouping, the grouping
should be considered of Standard design. If that is the case for your wave group, go to the "Standard"
heading on page 8-1, then move on to the Intermediary Observations chapter. Work with your
polywave group as if it were a monowave group; all the same Rules and procedures apply. The size of,
or time consumed by, a wave group has virtually no effect on how it is analyzed. Wave patterns lasting
several years will still subdivide into Flats, Triangles, Impulsions, etc. In working with such large
patterns, Structure Labels are the key to maintaining analytical perspective and formational integrity.
*Specifications*
All Non-Standard market action involves X-waves. An X-wave is a Corrective pattern (always)
which separates two Standard Elliott Corrections. Locating behavior indicative of X-waves is the key
to finding Non-Standard wave patterns.
How do you recognize X-wave behavior? There are two important conditions to watch for.
Condition 1: The strongest signal of an X-wave developing in the market occurs when two
compacted Corrections (polywave or higher) are separated by an intervening Corrective wave
(monowave or higher and of Standard or Non-Standard nature) which retraced thefirsiCorrective phase
less than 61.8%. That intervening wave (the x-wave) will usually be of one lower Complexity Level
than the two Corrections which it separates.
8-2 Construction ol Complex Polywaves. Multiwaves, etc.
Condition 2: If three Compacted polywave Corrections occur one after the next, with the second
Correction 161.8% (or more) of the first, the probabilities are very high the second Correction is anX-
wave. In this situation, all Corrections will usually be of the same Complexity. If any one of the patterns
is of a higher Complexity, it will usually be the last Correction of the entire formation.
If you witness either one of the above Conditions, the market is probably creating a Non-Standard
formation. At that time it would be necessary to revert your Compacted poly- multi-, or macrowave
pattern back into its pre-compacredStructure Series [i.e., if the first Correction of the group was aZigzag,
and you Compacted it to a "3," reverse the process and return it to its original ":5-:3-:5" condition.]
To continue with the analysis, note which of the two above conditions was met by your wave group.
If Condition-! was met, move on to the heading Complex Correction with Smallx-Wave ("a." below).
If Condition-2 was met, go to the ComplexCorrection with Large X-Wave heading ("b." on page 8-11).
a. Complex Correction with Small x-Wave(si)
When a Non-Standard wave pattern unfolds, the chances are much greater the x-wave will be
smaller in price than the previous Corrective phase (less than 61.8%). This Non-S tandard variation will
often produce the look of an Impulse pattern, but close attention to detail should rule out that possibility
(for details, see Emulation and Missing Waves in Chapter 12).
Each Non-Standard wave pattern, depending on its Structure Series, is given a different name. Listed
below are the Non-Standard Structure Series Combinations which contain small X-waves. Each
Combination listed has the ^re-compacted Structure of each Corrective phase on the left. The entire
formation's compacted value is on the right (c.t. = "Contracting Triangle only"). On the far right are the
Figures which correlate to the formations on the left. In each Figure, a correctand incorrect interpretation
is provided to help you avoid misinterpretations when deciphering market action.
Table A
1. (5-3-5) + (x-wave) + (5-3-5) = Double Zigzag = ":3"
2. (5-3-5) + (x-wave) + (3-3-3-3-3, c.t.) = Double Combination = ":3"
3. (5-3-5) + (x-wave) + (3-3-5) = Double Combination = ":3"
4. (3-3-5) + (x-wave) + (3-3-5) = Double Flat = "-.T
5. (3-3-5) + (x-wave) + (3-3-3-3-3, c.t.) = Double Combination = ":3"
6. (5-3-5) + (x-wave) + (5-3-5) + (x-wave) + (5-3-5) = Triple Zigzag = ":3"
7. (5-3-5) + (x-wave) + (5-3-5) + (x-wave) + (3-3-3-3-3, c.t.) = Triple Combination =
8. (5-3-5) + (x-wave) + (3-3-5) + (x-wave) + (3-3-3-3-3, c.t.) = Triple Combination =
In each sequence above, the Structure of the x-wave is not revealed. This is done because X-waves
can be virtually any Corrective pattern without effecting the name or overall look of the larger formation.
An X-wave can even be a Non-Standard pattern when the time period covered by me two surrounding
patterns is long enough to allow for it. When reviewing the listing in Table B (page 8-11), keep in mind
that an X-wave will usually alternate its formation with the Corrective pattern which immediately
preceded it. For example, if the first Correction is a Zigzag, the x-wave will probably be a monowave,
Hat or Triangle. If the first Correction is a Hat, the X-wave will probably be a monowave, Zigzag or
Non-Standard formation (probably not a Triangle). Exceptions do occur, but they are relatively rare.
[Continued on page 8-111
:3"
:3"
Fig.i
Fig. i
3-2a
!-2b
Fig. 8-3
Fig-
Fig.
Fig.
Fig.
Fig.
8-4
8,5
8-6
8-7
8-8
Construction of Complex Polywaves, Multiwaves, etc. 5-3
Figure 8-1
As the time covered by a polywave begins to
increase, one of the corrective sections of the
polywave will begin to subdivide (either wave-2 or
wave-4). Never will one of the odd numbered
segments of an Impulse pattern subdivide before
one of the even numbered segments (unless the
Impulse pattern is Terminal).
Wave-4 was the first corrective phase
to break down into its own Polywave
Monowaves
In this diagram, wave-a and
wave-c are both monowaves.
The b-wave was the first
corrective phase to subdivide into a
Polywave. Note: The b-wave is
usually the first section of a
correction to subdivide. As a
result, the b-wave is usually
more complex and time
consuming dian wave-a.
Figure 8-2a
Double Zigzag
Incorrect
Interpretation
Waves (1),1.3,5 & (2),2,4:
taken as two separate groups,
these waves are all £qq similar
in price, time and Complexity
for the above interpretation to
hold true. Remember, one
wave must extend in an
Impulse pattern. In addition, the
pattern channels too well,
another strong sign the entire
decline is Corrective, not
Impulsive (see Channeling of
Complex patterns, p. 12-18).
The x-wave can be
smaller or larger than
either one of the b-waves,
but is usually smaller.
Correct
Interpretation
8-4 Construction of Complex Polywavos, Multivtaves, etc.
Figure 8-2b
Double Combination
(ending with a Triangle)
Incorrect
Again, waves (1),1,3,5 & (2), 2,4 (as two separate
groups) are lfjQ similar in price, time and Complexity
for the interpretation lo hold true. One wave must
extend. In addition, ih;4th wave has retraced well
beyond its normal support/resistance zone, which
wouldnormally be the 4th wave of one lower Degree.
Correct
End of entire
move from "o"
The end of this ZigZag
is generally mistaken
as the end of a larger
Double ZigZag or (as
indicated above)the
end of Wave (3) of an
Impulse pattern.
Second Phase
Construction ot Complex Potywaves, Multiwaves, etc. 8-5
Figure 8-3
Double Combination
(ending with a Flat)
Incorrect Intcrpetation
For the following reasons, an Impulse
interpretation is eliminated. Wave-(3) is
the shortest wave of the group
(impossible). Even if wave-(3) were longer than
wave-( 1), the break-out of the fourth wave
Triangle is too large. Any Triangular
break-out of more than 200% virtually
guarantees a Non-Limiting Triangle is
forming, not a 4th-wave or b-wave
Triangle. The length and time durations of
each advance are too similar for them to be
labeled with the same Impulsive degree.
Correct Intcrpetation
c:5 Failure
A Triangle (or a monowave) is the most
likely formation to occur in the x-wave
position if the last pattern is going to be a Flat
withac-waveFailure. The next best choice
for the x-wave would be a monowave (as
long as the Overall formation is not too
complicated). The Complexity Level of the x-
wave should be at least the same as the c-
wave which preceded it and should be no
more complex than the most complex
Standard pattern in the entire formation.
6-6 Construction of Complex Polywavss, Multiwaves, etc.
Figure 8-4
Incorrect
Interpolation
Double Flat
Correct
Interpetation
If you were to counl this as an Impnlsive pattern, you
have learned nodiing from this book. This count
breaks all the rales. Wave-2 retraces too much of
wave-1, wave-3 looks corrective instead of Impulsive
and mere is no Alternation between waves-2 & 4
This is the only way to
count this formation!
Figure 8-5
Double Combination
Incorrect Interpretation
Wave-2 retraced too much of wave-1 and the
Rule of Equality is not being adhered to by
waves 1 & 5. The c-wave is too simple in
relation to wave-a, unless a Triangle is
forming. Even though the 3rd wave is the longest,
it barely meets the requirements of a 3rd
wave extension. Normally, the extended
wave (wave-3 in mis case) will be 161.8% or
more of the next longest Impulse segment.
Here, wave-3 is less than 161.8% of wave-5.
Elongated
Flat
Triangle
Correct Interpretation
The post-pattern market action would
be the most substantial evidence that a
Complex Correction formed instead
Of and Impulse pattern.
Construction of Complex Potywaves. Multiwaves. etc 6-7
Figure 8-6
There are far too many
touch points along the
parallel trendlines to consider
this an Impulse pattern.
Triple Zigzag
Incorrect Interpretation
Triple Zigzags contain so many advancing or
declining waves that they are usually mistaken
for Impulse waves. One of the major differences
between an Impulse and Triple Zigzag is the way
it channels. The Triple will react too perfectly
between parallel channel lines.
a:5
c:5
b:3
a:5
x:3
b:3
c:S
x:3
a:5
b:3
Correct Interpretation
Comparing all of the advances to advances and
declines to declines, too many similarities in price and
time occur for this to be an Impulse pattern.
Sometimes this is mistakenly called a9orll-wave move OR
a move without an identifiable extension. This is
absolutely incorrect Every Elliott pattern has to be-
have a particular way; if it does not, itisnoi the pattern
it is assumed to be, PERIOD. Impulse patterns need
clearly visible extensions and alternation must occur
between waves two and four. Without those two rules
present in a pattern, you do not have an Impulse wave.
8-8 Construction of Complex Polywavos, Multiwaves. etc.
Figure 8-7
Triple Combination
There are a total of
seven touch points
along the parallel
trendlines. That is too
many to consider this
an Impulse pattern.
(iv)?
Incorrect Interpretation
In this Triple variation, the Triangle at die
end is the real fooler. Most would think it to
be a Limiting 4th wave Triangle and would
assume at least one more advance is due.
Correct Interpretation
Construction of Complex Pol/waves, Multiwaves, etc. 8-9
Figure 8-8 _
Zigzag
This type of Triple Combination is a little more
unusual. Each corrective phase is different The
first phase is a Zigzag, the second a Common Flat
and the third a Triangle. This would be a logical
development process. As the pattern nears
completion, it loses more and more of its momentum.
Triple Combination
Contracting, Non-
Limiting Triangle
This diagram shows two
Zigzags andaTriangle. Each
corrective phase is separated
by an X-wave.
End of Triple Combination
Initial "False" Break
serves as a warning sign
of a Triangular formation
Additional Triple Combinations
Here, two Rats are followed by a
Triangle. Again, each correction is
separated by a simple X-wave. Thedarkdots
show the beginning and ending point of
each pattern or segment.
S-ra Construction of Complex Pofywaves, Multiwaves. etc.
The possible Corrections which can occur in the X-wave position are listed below by their
Structure Series:
Table B
1. 5-3-5 Zigzag
2. 3-3-5 Flats (all variations, except Elongated)
3. 3-3-3-3-3 Triangles (Contracting Non-Limiting, only)
4. 3? This series (mostly included to get your attention) represents a Corrective
monowave which can be an X-wave in "simple" Double and Triple patterns. Keep
in mind, x-waves are almost always the smallest Corrective patterns (time-wise) of a
complex formation whether or not they are larger or smaller in price coverage than
the previous Correction.
5. When the X-wave is shorter than the previous corrective phase and is not one of the
above patterns, its Construction is limited to Non-Standard Category 2 patterns (see
Chapter 10, the Power Ranking diagram. [As a reminder, to properly associate
a complex X-wave with the previous Correction, make sure the LOGIC Rules are
followed for proper integration of market action.]
b. Complex Correction With Large X-Wave(s)
When the X-wave of a Complex formation is larger than the previous Correction (price-wise), the
entire formation will be categorized as a Double or Triple Three pattern. Listed below are the
Nonstandard wave patterns, along with their names and compacted wave Structures, in which the X-wave
is larger than the previous Corrective phase (in the listing, c.t. = "Contracting Triangle only!").
1. (3-3-5) + (x-wave) + (3-3-3-3-3, c.t.) = Double Three Combination= 3 Fig. 8-9
2. (3-3-5) + (x-wave) + (3-3-5) = Double Three = 3 Fig. 8-10
3. (3-3-5) + (x-wave) + (3-3-5) + (x-wave) + (3-3-3-3-3, c.t.) = Triple Three Com.= 3 Fig. 8-11
4. (3-3-5) + (x-wave) + (3-3-5) + (x-wave) + (3-3-5) = Triple Three = 3 Fig. 8-12
The Non-Standard wave patterns listed above are in order of most to least likely. Triple Threes, as
mentioned earlier, should be considered rare. When you see one of these patterns, it probably will be
constructed like one of the two variations listed on page 8-15.
Review
Once you have decided whatNon-Standard wave pattern variation the market has formed, detour
to the Logic Rules chapter and check the list of attributes associated with that particular formation.
Examine the "realistic" diagrams in the Non-Standard section to see if the pattern you are working with
resembles the one in the book. Remember, exact correlations are not only unnecessary, but very
improbable. Afterward, move on to the Conclusion chapter to finalize your assessment.
Construction ot Complex Potywavos, Muttiwaves. etc 8-11
Figure 8-9
Double Three Combination
(in this form, it is rare)
Intervening
X-wave
Nole: the x-wave exceeded ihe end of wave-b
slightly. The stronger the move to follow this
enure formation, the higher the x-wave will go.
This pattern would be difficult
lo count incorrectly, so a faulty
interpretation is not included.
Flat
Triangle
Figure 8-9
Continued
Double Three Combination
(Running variation)
Correct Interpretation
Wave
Powerful Impulse
Wave (almost
always a 3rd wave
Extension) will follow
this formation.
Preceding Impulse /
NOTE: It is not
impossible for the
"First Three" of
such a pattern to
also be a Triangle,
but it is
exceedingly rare.
(ii):3
This pattern is usually misinterpreted.
Occasionally, due to the Triangle formation, it is
interpreted as an Impulse wave about to begin
wave-5 (see upper right, next page).
Sometimes it is labeled as an Impulse wave under
formation which is about to complete a series of
1 's and 2's (see lower right, next page).
8-12 Construction of Complex Polywavos, Multiwaves, etc.
Figure 8-9
Continued
This incorrect interpretation of a
Double Three Running Correction is
very common due to the association
many make of Triangles with 4ih
waves. Complicating the situation, a
Triangle in one of these patterns
frequently does not "overlap" the fusia-
b-c Correction, thus creating the
illusion of an Impulse wave with a first
wave extension. The signal that this
interpretation is incorrect is the S
tincture of wave-3. In this diagram it is
Corrective, eliminating the possibility
that this interpretation is correct,
unless the market is forming a Terminal
Impulse. The thrust out of the
Triangle will answer that question. If the
thrust is bigger than wave-3, Ihe
pattern is a Double Three Running
Correction; if less, a Terminal Impulse.
Double Three Combination
(continued from previous page)
Incorrect Interpretation
Preceding Impulse
Wave
Figure 8-9
Continued
Incorrect Interpretation
' Preceding Impulse
' Wave (could be much
' bigger than diagramed)
/
This interpretation is so full of errors it
is hard to know where to begin. To have a
reliable series of l's and 2's (of decreasing
Degree), before a powerful "3rd wave of a
3rd wave" move begins, itis mandatory the
market develop in a parabolic fashion.
Each smaller Degree 2nd wave should take
less time and price, be of a more Powerful
Construction and retrace less
(percentagewise) than the previous larger Degree 2nd
wave. In a like manner, each smaller
Degree 1 st wave should take less time and
price and advance at a greater slope than
the previous, next higher Degree 1 st wave.
As is obvious, most of the above
parameters do not hold true in die figure on the
left. NOTE: A true Series of l's and 2's
(simultaneously visible on the same chart)
beyond me second set is very rare.
Construction of Complex Polrwaves. Multiwaves, etc. 8-13
Figure 8-10
Double Three
(in this form it is rare)
Flat - -First "3"
Correction
Flat --Second "3"
Correction
This pattern is unusnal in any
position except wave-b of a
Zigzag, or as a smaller x-
wave. Even then the pattern
will have a strong tendency to
drift wira the trend of one
larger Degree.
Figure 8-10
Continued
This pattern is very similar to the
Double Three Running Correction
illustrated at the bottom of page 8-12
Double Three
(this version is die most likely)
Flat - - Second ":3"
Correction
8-14 Construction of Complex Polywaves, Multiwaves, etc.
Figure 8-11
Triple Three Combination (very rare)
Flat - -First "3"
Correction
Flat - -Second "3"
Correction
Non-Limiting Triangle
Third "3"
Correction
Not only is a Triple
Three Combination
extremely rare, but for it to
occur over an almost
perfectly horizontal
plane should be
considered basically
impossible. If you ever see one
of these formations, it
should definitely drift
with the trend of one
larger Degree.
Figure 8-12
Triple Three (very rare)
b:3
Intervening
x-wave
I I
x:3
a:3
c:5
b:3
Intervening
x-wave
x:3
a:3
c:5
b:3
a:3
c:5
All of the above script
for the Triple Three
Combination also
applies to the Triple Three.
Flat -First "3"
Correction
Flat--Second "3"
Correction
Flat-Third "3"
Correction
Construction of Complex Polywaves. Multiwaves, etc. 8-15
Construction of Multiwaves
oiririiiiiiiiiiiiiii'iiMiiiiiiniiHi " mm
Slightly different from Complex polywaves, a Multiwave requires one of die Impulse segments
subdivides into a poly wave. Depending on which Class the pattern you are analyzing falls in, divert to
the Impulsive or Corrective heading below.
Impulsive
In a poly wave, all ":5's" are monowaves. In a Multiwave, one (or more) of the ":5's" is apolywave.
To construct a Multiwave, several conditions are required. They are as follows:
1. Of die three thrust waves in an Impulse pattern f 1.3. or 51. one - and only one - must be a pol vwave.
The other two thrust waves should be monowaves.
2. At least one of the Corrective phases (either wave 2 or 4) must be a polywave; the other may be
a mono- or polywave.
3. The Correction (2 or 4) which takes the longest period of time should occur immediately before
or after die Extended wave. If the 1st wave extended, wave-2 should take the most time. If the
5th wave extended, wave-4 should take more time than wave-2. If the 3rd wave extends, it makes
no difference which wave (wave-2 or wave-4) takes more time; simply make sure Alternation is
present between the two waves.
Figure 8-13a displays a very common Multiwave pattern. The 3rd wave is the Extended and
Subdivided wave (see Extensions vs. Subdivisions, page 8-21, for detailed coverage of the Subdivision
concept and the Rules which govern its operation) creating the only Trending polywave of the pattern.
Waves-1 and 5 are the two Trending monowaves (see Rule 1 above). Wave-4, the largest corrective
pattern, occurred immediately after the Extended 3rd wave (see Rule 3). The diagrams in Figure 8-13b
also show the same Rules being followed by Multiwaves with 1st and 5th wave Extensions.
Figure 8-13a
Wave-3 is theExtended
and Subdivided Wave
B-16 Construction of Complex Polywaves. Multiwaves. etc.
Figure 8-13b
Corrective
A Corrective Multiwave has requirements imposed on it similar to the Impulsive variety. They are:
1. One or two of the ":5' s" in die larger pattern must visibly subdivide into a polywave (see Figure
8-14). If diere is only one subdivided ":5," it must be wave-c of a Flat or Zigzag (all varieties).
2. The probabilities strongly favor the b-wave of a Multiwave will be a Corrective polywave.
Again, as indicated in the Impulsive section, all other Rules listed from the beginning of the book
which refer to Corrections should apply to Multiwaves of all varieties.
Figure 8-14
In the Figure on the left, the
c-wave(a ":5") subdivides.
That is the minimum
requirement for a Multiwave
to be created. The Figure
on the right has two
Subdivided ":5's," but the
pattern is still a Multiwave.
Obeying Rule 2 (above),
theb-wave in both patterns
is a polywave.
Construction of Complex Polywaves, Multiwaves. etc. 8-17
Construction of Complex Multiwaves
nillfllllllll'!!r!||l!ll1ll!!!||!.!l'lllll!!!l MMI! I I I I
The discussion on Complex Multiwaves is basically the same as Complex Polywaves. The only
difference is Complex Multiwaves are made from a collection of Multiwaves, not a collection of
Polywaves. If you witness a Corrective Multiwave which is retraced 161.8% or more by the next
correction, OR is retraced less than 61.8% by the next corrective phase, then a Complex pattern is
forming. Apply the same Rules and principles as those discussed in the Complex Polywave section.
Construction of Macrowaves
^[i^iiiiiiiiihiiiiiiiiiiiiiiiimii iiiiiiii in i
As a market continues to unfold, a group of Multiwaves will eventually need to be formed into a
Macrowave. Fortunately, the processes explained in the Multiwave section under die Impulsive and
Corrective headings are the same as those mat need to be used to form Macrowaves. The only differences
are diose listed below under the Impulsive and Corrective headings.
Impulsive
The minimum construction necessary to form a Macrowave is at least one of the ":5's" (wave-1,3,
or 5) must be a Multiwave and one of the other ":5's" must be a Polywave. Usually there will be two
polywaves, but on rare occasions, the smallest wave might be a monowave. This creates a condition of
"Triplexity," a word coined by the author which means "three Levels of Complexity contained within
the same pattern." From observation, it appears the only time Triplexity is possible is when the 5th wave
Extends and Subdivides in an Impulse wave or when wave-c is the most complex pattern of a Flat or
Zigzag. For an illustration of Triplexity in action, refer to die bottom of page 7-10.
Corrective
To form a Macrowave Correction, at least one wave must be a Multiwave and one wave a Polywave.
If only one Multiwave occurs in a Correction, it should be wave-c of a Zigzag or Flat. All other rules
applying to Multi- and Polywaves would also apply for Macrowaves.
8-18 Construction of Complex Polywaves, Multiwaves, etc.
More on Alternation
Olinilllll'illlliiii'lllllllllil'IILIIII Nil! I!
Intricacy
In the Central Considerations chapter, the concept of Alternation was presented. The simple
aspects of the Rule (Time, Price, Severity) should be readily understood by now. The more difficult
aspects of Alternation (Intricacy and Construction, first mentioned on page 5-5) will be covered here to
make sure there is no misunderstanding on the subject. Starting with Intricacy, this deals with the
number of subdivisions present in one pattern compared to those of an adjacent pattern. This concept
is difficult to apply to highly developed patterns, but is a very useful and critical test at the polywave and
multiwave level. It is always preferable that one wave subdivides and one does not. Below are examples
of how this happens in Corrective and Impulsive formations (see Figure 8-15).
Figure 8-15
Wave-2 Subdivided
into three segments
Wave-b Subdivided
into three segments
Unlike a corrective phase, wave-1 cannot
subdivide without wave-2 subdividing (unless the
market is forming a Terminal pattern).
Waves-3 & 4 can Alternate on an Intricacy
basis in the same way waves! & 2 did above.
Wave-a Subdivided
into three segments
Construction of Complex Polywaves, Multiwaves, etc. 8-19
Construction
If adjacent waves in an Impulsive or Corrective pattern both subdivide, other forms of Alternation
need to be considered to keep die count accurate. One of the forms in which Alternation can occur is
Construction. If one pattern is a Zigzag, expect the next pattern to be anything but a Zigzag (see Figure
8-16a). If the market forms an Impulse pattern, expect the next move, of the same Degree, always to be
a Corrective pattern (see Figure 8-16b below).
Figure 8-16a
This pattern is a Hat
This pattern
is a Zigzag
Figure 8-16a
The dots indicate where each
pattern starts and stops
Impulsive (:5)
Both of theses patterns exhibit
Alternation of Construction. In the upper
diagram, the Alternation is between
two different correctivepattems. In the
lower diagram, the Alternation is
between an Impulsive pattern and a
Corrective pattern. Obviously, the lower
diagram presents a form of Alternation
which is much easier to detect
Corrective (:3)
8-20 Construction of Complex Polywaves, Multiwaves, etc.
More on Extensions
r;rj!l!i;;i!lW,!!|!!!!!!!!!!!|l|!|,!| !!!!!!! I
nun
Extensions i£. Subdivisions
Most Elliotticians think of the term Extension as describing two inextricably linked factors; that of
length and the number of subdivisions present in a pattern. Through many years of study, I have
discovered the two factors, Extensions and Subdivisions, to be separate phenomena. The term Extension
should only be thought of as describing the longest trending wove (wave-1, 3 or 5) of an Impulse
sequence. It should not automatically be assumed that the longest wave in a pattern will be the most
subdivided. On rare occasions, the longest wave will be one of the simpler patterns (based on Complexity
ratings) and the subdividedpattem will be the second longest segment. This indicates the ExtensionRule
should be applied separately from the Subdivision Rule (see Independent Rule, page 9-7). Granted, the
two rules (Extension & Subdivision) will usually be simultaneously present in the same wave (90% of
the time), but not always. Figure 8-17 shows how a pattern looks when both Rules are affecting the same
wave. Figure 8-18 shows how the two Rules might act independently of each other. Figure 8-19 shows
how the Rules should not be applied and where they cannot act independently of each other.
Figure 8-17
In this diagram, the 1 st wave was the longest (the extension)
and it subdivided one Level of Complexity more than the
other Impulse advances (waves 3 and 5). Each Extended
segment (on this page and the next) is designated with an
X and each Subdivided wave is marked with a capital S.
Here,wave-3isthe
Extended and
Subdivided segment.
The 5th wave
Subdivided and Extended.
Construction of Complex Polywaves, MulSmves, etc. 6-21
Figure 8-18
on manifestation of separate
Extended and Subdivided waves. Wave-3
is Extended, Wave-5 is Subdivided.
Next most likely occurrence:
Wave-1 is Extended
Wave-3 is Subdivided
break
Least likely occurrence. If you were to witness this
setup, the final thrust (wave-5) would probably be
a Terminal Impulse. As arule, when the final thrust
is a Terminal pattern, me base line (across the two
corrective phases, wave-2 and wave-4) will be
broken several times before the pattern terminates.
8-22 Construction of Complex Polywaves, Muftjwaves, ere.
Figure 8-19
This arrangement of
Progress labels should be
considered impossible
Wave-1
The progress labels in mis diagram
could not be considered correct even
if wave-3 or wave-5 was the largest.
If wave-1 is not the extended wave, it will not
subdivide more than the other Impulsive waves
no matter which of the other two extends.
It would not be impossible for market action like that above to unfold, but the Progress labels would have to be changed. It
is impossible for the high (circled) to be die end of the Impulse wave. The net diagram below illustrates the correct labeling
for such a situation. The Degree of me labels may differ in real-time, but me relationship between Degrees will not.
(iii) or 3
All of this price action
would only be pan of
wave-(3).
Due to the large and powerful move after the point
marked (2), the probabilities are high that the conclusion
of the downtrend actually occurred at that point and the
powerful advance was me beginning of the new uptrend.
Construction of Complex Polywaves, MuM/aves, etc. 6-23
Importance of Knowing which Wave Extended
The Extended wave in an Impulse sequence is the most significant factor in deciding the appearance,
relationships and behavior of an Impulse pattern. Knowing which wave Extended instantly provides you
with a wealth of information on how the pattern will channel and which Correction (2 & 4) will be the
most complex. Let's take a look at the four major Impulse variations depending on which wave Extends,
beginning with a 1st wave extension in Figure 8-20.
Figure 8-20
When the 1st wave is the longest, the pattern will assume an ascending
wedge shape. The upper trendline is usually drawn across the terminal
ends of the 1 st and 3rd waves. Unlike a Terminal Impulse, where the 5th
wave usually breaks the upper trendline, this pattern generally completes
its 5th wave below and away from the upper trendline. When the 1st wave
is the longest, wave-2 should be more complex than wave-4.
1.00
There are three significantly
different formational variations
possible when the 3rd wave extends.
Below is the first variation, die last
two are on the next page.
.382
The 4th wave (in this case) at its lowest point
should not retrace more than 38.2% of wave-
3. If it does, wave-5 will probably not make a
new high, thereby creating a 5th wave Failure.
Thissetupoccurswhen wave-1 is "microscopic" in relation to the Extended 3rd wave. The 5th
wave will usually relate to the whole move (beginning of wave-1 to end of the end of wave-3)
by 38.2%. If it is more than 38.2%,(such as 61.8%) the move is just aZig-Zag and what you
thought was wave-1 & 2 are probably part of a previous pattern, or less likely, they were
incidentally visible parts of the first advance to point "M" (see "Missing Waves," page 12-34).
6-24 Construction of Complex Polywaves, Muttiwaves, etc.
Figure 8-20
continued
When a pattern channels like one of the
two diagrams on this page, and it
completes a larger pattern, it is very possible
Wave-5 may not exceed the end of
Wave-3. If it does not, the 5th-Wave
would be labeled a 5th Wave Failure.
Wave-5 will not break or
touch the upper trendline
In this example, Wave-3 should advance at a slower
rate than the previous diagram (close to that of Wave-
1) so the parallel channel is not broken by Wave-3. In
this situation, you can be relatively certain Wave-5 will
not touch or break the upper trendline.
Construction of Complex Polywaves. Multmaves. etc. 8-25
Figure 8-20
Continued
The 5ih wave (when extended) will quite often
break the upper trendline {"false break") only to
quickly retrace61.8%-95%of thecntire5th wave.
When the 5th Wave is the longest, waves-1 &
3 will usually be equal or related in time by
61.8%. The 3rd wave must be slightly longer
than the 1st wave, but it should not complete
beyond 161.8% of wave-1 added to the top of
wave-1. Usually wave-1 & 3 relate internally*
by about 161.8% (price-wise).
Wave-5 is the
x5
Wave-3 should
rarely ever finish
above this point
"False
Break"
Most Common Setup
— 1.618
-1.618
■1.00
"m"
A 5th wave Extension will usually be 161.8%of
the entire move measured from the veiy
beginning of the pattern to the top of wave-3,
illustrated by "m" & "n's" External relationship*.
Occasionally, the 5th wave will relate
Internally to "m" by adding the equal length (or
161.8% of the lengdi) to die end of wave-4.
Less likely relationships include the 5m wave
being 100% of "m"oi 261.8% of "m."
Wave-4 should be more complex and time
consuming Uian wave-2 when the 5th wave
extends. One odd thing about wave-4
(when wave-5 extends) is it generally
retraces a significant amount (40-61.8 % of
wave-3. Forwave-4tocounteractasignifi-
cant retracement, it will usually end in a c-
wave failure (see diagram abuve) or
complete above its lowest point by way of a
Complex correction concluding widi a
Non-limiting Triangle).
* For a complete discussion of External Relationships, refer to pages 12-22 through 12-34
8-26 Construction of Complex Polywaves, Multiwaves, etc.
Knowing Where to Start a Count
fi;!j|!i::1i;i!n!!!'i''|!!iii!!!!iiiiiiiiilii!iniii"ii!1 mm 11
As the Complexity of a pattern increases beyond the lst-Level, Trending waves within Impulse
patterns begin to develop into their own Impulsive polywaves. Due to the difficulties which arise when
trying to decipher moves beyond Level-2 Complexity, knowing when an Impulse sequence is complete
requires strict adherence to numerous rules, channeling techniques, and Fibonacci relationships (all to
be oudined in this book). Proper analysis requires knowing how Impulse patterns begin and end and how
they combine with omer patterns. To do this you must first correctly decipher small Impulse patterns.
When first trying to analyze a market's price action, You may be tempted to start with long-term price
charts. In doing this, you could easily misinterpret the position of the market due to a common mistake;
that of starting the count from a major high or low (see Figure 8-21). To start an interpretation from the
Figure 8-21a
Incorrect
An inexperienced analyst would be tempted
to begin the analysis from the circled low
and possibly label the move upward as
indicated in Figure 8-21a. For several
reasons this would be incorrect.
1. Both waves-2 & 4 indicate strength.
That conflicts with the Rule of Alternation.
2. Wave-2 retraces more than 61.8% of
Wave-1 contradicting the signs of strength
indicated by an Irregnlar correction.
3. Waves-3 & 5 are too close in price
coverage. This conflicts with the "Rule of
Extension"
4. Finally, the low from which the
analysis began was not me termination of the
down move.
Figure 8-21b
If you are analyzing a market's price
action for the first time, you could
easily misinterpret me action due to a
common mistake; that of starting the
count from a major high ui low.
Believe it or not, most large Elliott
patterns do not finish at the highest or
lowest price obtained by the market.
Uptrend starts here!
Failure
Figure 8-21 b indicates the correct interpretation of
die price action. Due to the 5th wave Failure, the
upside count starts above the lowest price level.
Construction of Complex Polywaves. Mu/ttoaires, etc. 8-27
Figure 8-23
C.
Highest price
5th wave Failure
terminates pattern
Highest price
Termination point
lower than the high
created by ihe Non-
Limiting Triangle
B.
Highest price C-Failure
Terminates pattern
-t Ten
\ J
b \
C-Wave
Terminal pautem
Each advance is
shorter than ihe last
This is signaling a
loss of momentum.
Figure 8-24a
Figure 8-24b
An incorrect analysis of this move could easily make you
think 2nd waves frequently retrace almost all (i.e. more than
61.8%) of Wave-1. Actually, a 2nd wave relracement of
wave-1 exceeding more lhan 61.8% (even if the termination
of wave-2 settles at a lesser level) is extremely rare.
How can Figure 8-24b be proven correct over Figure 8-24a7. Wave-2
of 8-24a has retraced too much of Wave-1. This indicates Wave-2 must
subdivide in such a way dial the c-wave of Wave-2 does not exceed the
end of wave-a of Wave-2; a large move could not begin until it did.
Based on the length of the dashed line in Figure 8-24a, Wave-2 did not
subdivide.
On die ottier hand, die action after a 5di wave failure, like dial in
Figure 8-24b, would produce a violent reversal of trend due to die
weakness an upside failure implies. Since a severe drop (depicted by
die dashed line) did occur and die Impulse pattern was retraced rapidly,
it is confirmed the 5uVFailure scenario is correct (Figure 8-24b).
8-28 Construction of Compiax Polywaves. Multmases. etc.
improper point makes it very difficult to correctly predict what will take place in the future. Believe it
or not, most large Elliott patterns do not finish at the highest or lowest price on a chart. This is an inherent
part of the Wave Theory which is frequently misunderstood and is essentially unique to Elliott. I say it
is unique since most techniques look at the highest high or lowest low as the important price or time
measuring point for further calculations. Often, with Elliott, points below the high or above the low are
more important for specific calculations than the actual high or low. The concept of a pattern finishing
after a high or low is one of the significant reasons many Elliotlicians experience difficulty applying
Elliott to longer time periods.
If you start a count from a point on a chart which is not die termination of an Elliott pattern, your
analysis could run astray for long periods of time. Eventually you should be able to recogni ze the mistake
and make the appropriate adjustments. Unfortunately, by the time a mistake is detected, the market move
could be nearing completion or you may have taken several losses due to trades initiated based on
inaccurate assumptions. All this is, of course, due to starting a count from a "visually" important top or
bottom which is not the termination of an Elliott pattern.
The more Elliott patterns you combine into larger patterns, the more likely the larger pattern will
finish below (above) the highest (lowest) price level obtained (see Figure 8-21 b at the bottom of page
8-27). Why does this happen? At the end of a major trend, the market begins to lose momentum. It is
this loss of momentum which sometimes prevents the market from making a new high or low right at
the end of a pattern. Loss of momentum generally manifests itself in one of four forms:
a. An Impulse pattern will contain a Sth-Wave Failure
b. A Flat pattern will finish with a C-Wave Failure
c. A complex or rare formation will end with a Contracting, Non-Limiting Triangle
d. An Impulsion will conclude with a Terminal pattern
(Each incident listed above is diagramed on the previous page (Figure 8-23) using the same
alphabetic lettering.)
Three of the four situations above (a, b & c) always create a situation where the highest or lowest price
on the chart iajnot the end of the Elliott pattern. The Terminal pattern, if its 5th wave subdivides, can
also conclude below the highest high or above the lowest low if wave-5 exhibits a loss of momentum
in one of the three circumstances listed above (scenario a,b, or c).
If a pattern is completely retraced and the highest price achieved by the market is not the end of the
Elliott pattern, the termination point will occur after the high, not before. Always be on the lookout for
a secondary spike or trough following an important high or low. It may be warning that an Elliott pattern
terminated after the top or bottom. Also, watch for a significant amount of consolidation near, but after,
an important high or low. The consolidation may be a Non-Limiting Triangle which terminates the trend
after the high or low.
Starting counts from improper points can often lead to incorrect conclusions about the correct
application of Elliott Rules. Figure 8-24 demonstrates how that may take place. Another incorrect
conclusion most analysts make is in reference to the series of l's and 2's of decreasing degree which
occasionally takes place as the market approaches the center of a 3rd wave Extension, the most frequent
wave to extend (see Figure 8-25, next page).
Construction of Complex Polywaves, Multiwaves. etc. 0-29
Figure 8-25
Count A
This is the starting
point for the downtrend
(O)-(ii)
trendline
There are a number of significant Logic and Rule errors involved in count "A"; they are as follows:
1. The length of waves 1, 3 & 5 are all too close to the same price distance.
2. Waves 2 & 4 do not alternate well.
3. During the decline, wave-2 takes more time and percentage retracement than wave (ii). This
indicates the market is not getting weaker (which is mandatory as you approach the middle
of a declining 3rd wave) but is getting stronger.
4. The O-(ii) trendline was broken by the 2nd-wave indicating wave-(ii) is ncl finished
or it is incorrectly interpreted.
Count "B" presents the proper way to label the above move. Notice the market did not begin to
decline quickly until time "ran out" at the apex point of the triangle. This is typical of diis type of Non-
Limiting Triangle.
Figure 8-25
(continued)
Count B
8-30 Construction of Complex Potywaves. Multiwaves, etc.
':--£El£$3%ftj^w
Basic Neely Extensions 91
Trendline Touch Paints 9_1
Time Rule 94
Independent Rule 9.7
Simnltaneous Occurrence 9.7
Exception Rule 9,7
Aspect-1 9.7
Aspect-2 9_g
Necessity of Maintaining "Structure" Integrity 9.8
Locking in Structure 9_g
Flexibility of "Progress" labels (expansion of a pattern) 9-10
Mentioned in the beginning of the book, many of the Neely Extensions have simply been integrated
into the text where appropriate. Virtually all of Chapter 3 discussed techniques which I developed over
years of teaching the Telephone Course. The step by step, objective process of analysis - which is the
essence of "Mastering Elliott Wave" - was also created during the teaching of the same course. A
multitude of new, more descriptive words were coined orredefined (Monowaves, Polywaves,
Complexity, Compaction etc.) to assist in more accurate communication on the subject The Progress Label and
Logic Rule sections, the concept of a NEW type of Triangle with its own, unique formational rules and
the significant advances in the quantification of Triangular activity are all important additions to the
Elliott Wave Theory and are what comprise the Neely Method. Furthermore, all the rules in Chapter
9 also belong in the above list.
While the Rules which follow are not quite as important as the ones discussed up to this point, they
are very helpful in increasing your pattern interpretation confidence level. Quite often, the utilization
of these more subtle Rules will help you decide which of a list of possibilities is the most probable.
Trendline Touchpoints
This rule will help you quickly differentiate between Impulsive and Complex Corrective activity.
The Rule states that, "in a pattern consisting of five segments (which has six possible 'same degree'
touch points), only a total of four can simultaneously touch the two opposing trendlines (see Figure
9-1). This rule is applicable to Impulsive (Trending and Terminal) and Triangular patterns since both
are composed of five segments. NOTE: This Rule was partially covered under the Triangle heading
(Central Considerations, page 5-25).
Basic Neely Extensions 9-1
Figure 9-1
Ssome leeway to the Touch Points Rule
may occasionally be required during the
formation of non-limiting Triangles.
The dots are the four points
which touch opposing
trendlines, the x's do not.
In this diagram, of the six points
which make-up an Impulse wave,
onlyalataloffottr (the dots) touch
the upper and tower trendlines.
The x's indicate the two points
which do not touch a trendline.
Again, only four (a different four)
points of the same degree touch ihe
parallel trendlines (marked with
dots). The two that do not touch
either one of the trendlines are
marked widi an "x".
How can this Rule beused to best advantage? Over long periods of time, when apattern is developing
on a Complex Poly-, Multi- or Macrowave level, the existence of trjgrg. than four touchpoints on the
parallel trendlines is a strong indication of Corrective, not Impulsive, activity. Usually, the Corrective
pattern would be a Double or Triple Zigzag or Combination. Even though it is not typical, more than
four touch points could occur along the two trendlines (which may be converging, diverging, or parallel)
in an Impulse pattern, but not all of those touch points will be of the same Degree. Remember, the Rule
only applies to waves of the same degree.
The rule also applies to other Standard corrective patterns. All Standard Corrections have four
possible touch points. Only three of the four points should touch parallel trendlines. If four points of
the "same degree" touch parallel trendlines in any Standard correction (except Triangles), it is areliable
indication the Correction will be pan of a Complex, Non-Standard formation. This rule is most useful
during Zigzags (see Figure 9-2).
9-2 Basic Nealy Extensions
Figure 9-2
Parallel Trendlines
All four term ination points touch the
parallel trendlines. If the last touch point is
the end of the Zigzag, it indicates the
Zigzag will only be pan of a much larger
Double or Triple Zigzag OR Double or
Triple Combination. See below.
Expect an x-wave to form immediately after
a situation such as that discussed above. What
type of Complex Zigzag pattern is going to take
place depends on a lot of variables. Read the
Advanced Progress Label Application and the
Advanced Logic Rules chapters for clues on
what to expect.
If the Zigzag is not over at the fourth touch
point, expect that touch point to be the end of a 1 st
wave extension within the c-wave of the Zigzag
(see below).
i:^i{MSj^a|
,(B)
(A)N
Basically, the Touch Point rule states that
"a perfectly channelable Zigzag should not
be the end of a Corrective phase."
xP
Bash Noety Extensions 9-3
Time Rule
Time plays an important function in producing the correct look for a wave pattern. Elliott discovered
that the two unextended waves in an Impulse pattern often conform to the same time duration. Also, he
noticed that waves a & c in a Zigzag tended toward equality in time. After years of observation, I have
discovered there are many additional ways time can be used to enhance the analytical process.
In its simplest form, the Time Rule can be stated as such: No three adjacent waves (of the same
Degree'! can be simultaneously equivalent in time (see Figure 9-3).
Figure 9-3
Any three adjacent patterns in a
sequence will usnally relate in one
a more of the following ways
Very different
" Similar in time
Waves 1 & 3 are
similar in time
but Wave 2 is
very different
Waves 2 & 3 are similar in time but, Wave-1 is very different.
This situation would only occur if wave-1 were the extension
Observation: Any three adjacent patterns in a sequence will usually relate by time in one of the
following ways:
A. If the first two segments of a pattern are equal in time, the third will consume much less or much
more time than either one of the other two taken separately. Often, the third segment will
consume the accumulated time of the two smaller patterns.
B. If the second segment is much longer in time than the first, the third segment will equal the first
or relate to it by 61.8% or 161.8%.
C. If none of the waves are of the same rime duration, they may all relate by a Fibonacci ratio.
See Figure 9-4 for an example of how the above Rules might effect the development of a Flat.
S-4 Basic Neely Extensions
Figure 9-4
A + B
If the last wave of a Correction (wave-c) elongates or is a
Terminal pattern, frequently wave-a & b will be similar in
time and the last section (wave-c) will be m uch longer. In this
diagram, the combined time of the smaller waves equals the
larger wave.
A + C = B
The most typical set-up for a Rat. Here waves a & c are equal
in time while wave-b is much longer.
c.
.382m .618m m
~i n—
Frequently, if no two waves are equal in time, all waves will
relate by 61.8% or 38.2%.
Application of the Time Rule
If two adjacent patterns take equal amounts of time followed by a third segment which also takes the
same amount of time, you can confidently assume (on any scale above simple polywave development)
that the third segment is not complete or that the three segments being viewed are not all of the same
Degree (see Figure 9-5, next page).
Bast Neely Extensions 9-5
Figure 9-5
(3)
(1)
(2)
Incorrect
All these moves take the same
amount of time. This virtually
guarantees the third advance is only pan
of a much bigger advance.
Good Possibility
This interpretation eliminates the
problem of three same degree waves occurring
one after the next with all of them taking
the same amount of time. The third
segment (wave-1) is a tower degree pattern,
so now only two adjacent waves are equal
in time, which is how it should be.
(3)
W
Oil) /
A /
/ V
/ (iv)
Also Incorrect
For the same reasons as those mentioned in
the top diagram, this action cannot be the the
a-b-c of a Zigzag since all waves (of the
same degree) are of the same time duration.
C
/
c
B
Also Possible
Correctly interpreted, the
market could be forming a Running
Correction (left) or may be
subdividing for wave-c (right).
9-6 Basic Neely Extensions
Independent Rule
The Independent Rule applies to all other Rules of the Theory that already have been and will be
presented in this book. All Elliott Rules and guidelines (and the Neely Extensions) should be applied
as separate entities to every wave pattern deciphered (as long as there is enough detailed price action to
apply them). In other words, do not get in the habit of thinking certain characteristics always go hand-
in-hand. Example: Most Elliotticians believe Extensions and Subdivisions are synonymous. Usually,
the two concepts are present in the same pattern at the same time, but not always. Each Rule, that of
Extensions and Subdivisions, should be considered independently. If they are simultaneously present
in the same move, fine. If they are not, the validity of the proposed count is not in jeopardy.
Simultaneous Occurrence
This Rule was needed to solidify all the other rules presented in this book. To define Simultaneous
Occurrence, all Elliott rules applicable to a particular situation have to be "simultaneously" present in
order to create a reliable interpretation. To apply this rule, begin with the rules and techniques described
in Preliminary Analysis, continue to through the Intermediary Observations, Central
Considerations, etc. If any Rule normally associated with the pattern on your chart does not manifest, it is likely
some other formation is developing. The count which meets all or most of the applicable parameters
should be considered the best interpretation. Do not forget, even post-pattern behavior is part of the
investigative process needed to find the foremost choice.
Exception Rule
ASPECT 1
Occasionally, at important market turning points or under "unusual" conditions, one of the Rules
which is usually critical to proper pattern construction may not apply or be followed. An important Rule
would be any found from Chapter 3 up to (but not including) the "Breaking Point' section under
Impulsions or Corrections in Chapter 5. Situations which substantiate "unusual" conditions are:
A. The end of a Multiwave or larger pattern.
B. The 5th wave or C-wave of a Terminal (diagonal triangle) pattern.
C. A move which is or ends with a Contracting or Expanding Triangle.
Not mentioned until now, Triangles and Terminal patterns are the exception to virtually all Rules,
situations and conditions (i.e. time, price, channeling, Progress Labels, Fibonacci relationships, etc.).
Whenever an important Rule gets broken, it is likely that a Triangle or aTerminal pattern had something
to do with it.
If a major Rule is not represented in the market action being observed, the interpretation might still
be acceptable aslong as thereissubstantiationforthefailureoftheRule. Substantiationmightcomefrorr;
one of the conditions above (A, B, or C). The extreme importance of the Rules discussed up to the
"Breaking Point" headings in Chapter 5 precludes the possibility that two important Rules be broken
simultaneously. If more than one important Rule is "broken" the count should be eliminated.
Basic Neely Extensions 9-7
ASPECT 2
Another aspect of the Exception Rule states:
"The failure of a Rule occurs for a specific reason; this reason usually creates another Rule."
Below are two examples of how this happens:
1. The 2-4 trendline of an Impulse wave should never be broken by any part of wave-3 and
hardly ever by any pan of wave-5. If the 2-4 trendline is broken by part of wave-5, this activates
a Rule which says "the markel must be forming a Terminal Impulse pattern." A Terminal
pattern is a legitimate reason for the break of a true 2-4 trendline.
2. When the "thrust" out of a Triangle does not stop advancing or declining when the time zone
occupied by the apex point of the Triangle is reached, then the market is forming a Terminal
pattern or the previous Triangle was of the Non-Limiting type.
Necessity of Maintaining "Structure" Integrity
Structure is the critical consideration in putting together a "Progress Label" scenario. Only through
strict attention to detail, and adherence to past wave Structure, can you expect to accurately interpret a
markel with any consistency. With larger patterns, analysis can become more difficult, unless proper
care has been taken to dissect each subsegment and classify it as Corrective or Impulsive (:3 or :5). Even
if it is currently not clear which pattern a market is forming, adherence to past, provable price "structure"
is mandatory. Eventually, the Elliott pattern which has been under formation all along will become
obvious. This usually occurs as the pattern approaches a conclusion.
Locking in Structure
After having identified a reliable Elliott pattern, and then proceeding through the process of
Compaction, it is very important the simplified Structure of the move (being just a :3 or :5) is not changed
at some later date. This would be a drastic mistake. Generally, you should never change the Structure
of a properly Compacted pattern. Often, you might be tempted to do so in order to create an interpretation
you would like to believe is unfolding, but as a Rule, never do it.
Contrary to what appears a common belief among Elliotticians and especially the general public, the
Structure of a formation cannot be legitimately changed at the whim of the analyst to suit current opinion,
market fundamentals, technical indicators, etc. Wave patterns develop based on the net result of all the
buy and sell orders reaching the floor of an exchange. Those buy and sell orders are sent to the floor by
traders around the country who are analyzing Fundamentals, Technicals, Astrological aspects, Volume,
Open Interest, Bullish Sentiment, etc. Since a market cannot move unless there is someone bidding to
buy or someone asking to sell (all other events notwithstanding), when the two come together it creates
an "official" supply/demand price level. As a result, there is no disputing that price action is the net result
of all external market influences and therefore is the best indicator of future market performance.
The level at which a market trades does not occur by chance. The trade takes place because it satisfies
both sides of the equation, the buyer and the seller. Waves are the by-product of these transactions
connected end-to-end showing a continuous chain of events. Transforming the structure of a pattern to
fit what you feel is going on or because you are confused about the market's position is a very poor reason
to alter the previously established "Structure" of a count. Changing previous wave "structure" to make
the count finish the way you"believe"itshouldorto get the pattern tocomplete sooner will almostalways
9-8 Basic Neely Extensions
result in an incorrect interpretation.
Under the Wave Principle, extreme confidence in a change of price direction is only possible as the
market terminates the last wave segment. The only way to stay on track between one important
termination point and the next is to do the following:
a. Mark the termination point of every single monowave on your chart with a dot
(this step can be eliminated as you become more experienced).
b. Study the Retracement Rules and then using the Pre-Constructive Rules of Logic, carefully
place the appropriate Structure Label(s) at each turning point.
c. Look for group Structure combinations among adjacent monowaves which adhere to
acceptable (Standard or Non-Standard) Elliott Series'.
d. Once a Series is identified, move to the appropriate section
(Impulsions or Corrections) of Chapter 5.
e. Proceed through all the Essential Rules which apply to that general formation category.
f. Place Progress Labels on the wave pattern and continue through the "Conditional
Rules" section.
g. Check all the applicable Rules and guidelines (under Advanced Progress Label Application &
the Advanced Rules of Logic) to confirm all minor details and subtleties of wave behavior
are present (Alternation, Fibonacci relationships, etc.). If itpasses those tests, go to the next step.
h. Compact the pattern to its base structure, ":3" or ":5" (see Compaction, Chapter 7).
i. If you are working strictly with monowaves, raise the Complexity Level of the Compacted
pattern to Level-1 (underline the :5 or :3). If you have developed beyond the monowave stage,
raise the Complexity of the Structure Label to the appropriate level based on the techniques
discussed in the "Complexity" section of Chapter 7.
j. After Compaction and Complexity designation, the process begins over again. Return
to step-b to confirm if the newly compacted pattern effects or changes any potential
Structure Labels for the monowaves (or higher) surrounding the compacted pattern.*
Then move on to step-c, etc. Continue returning to step-b until you have numerous
compacted patterns each marked with a single Structure Label. These single Structure
Labels will eventually form identical Series just as the monowave groups once did. The
only difference, each Structure Series will be representing a polywave (or higher) instead
of a monowave. All the Rules discussed up until now, and throughout the book, will work
for these more complex patterns in the same fashion as they did for the simple formations
(except where noted). Work with the compacted Series' just as if they were monowave
Structure Labels. Look for Series combinations, apply the "Rule of Similarity...", etc. The
only additional step necessary in working with the more complex patterns is to check for and
follow the Rules under the "Construction of Complex Polywaves, Multiwaves etc."
The compacted Structure Labels should be placed on your charts which cover a period of time longer
than the original monowave chart. On your longer-term chart, only mark the single Structure of each
compacted polywave, do not bother with each individual monowave's Structure.
The Wave Theory is a relative phenomenon. It does not matter how complex or simple a pattern is;
what matters is whether the pattern is Corrective or Impulsive in nature. That will tell you how to handle,
combine, interpret and trade market action.
This is describing the process of Reassessment which is covered in greater detail at the top of page 7-3 in Chapter 7.
Basic Neely Extensions 9-9
Unti 1 the market reaches the end of a Series, guessing on the proper Progress Labels which apply is
just that, a guess. You do not have to know the Progress Labels of a wave pattern to trade it profitably!
Trade with the trend which, based on the Wave Theory, is in die direction of the ":'5's" (Impulsions).
Until you have at least three or five S tructure Labels to work widi, it is impossible to complete an Elliott
pattern and thus impossible to be completely certain of the name of the pattern actually unfolding.
In conclusion, you should not have any preconceived notions of a markets' future behavior. The only
objective way to analyze a market is to stay strictly with previously determined wave Structure and only
combine the patterns when an identifiable Series is complete and when the pattern meets all important
criteria. Do not waste time trying to continually guess, and trade on, what you think is the current position
of the market.
Flexibility of "Progress" Labels (expansion of a pattern)
It should now be evident why the earlier sections of the book dealt with Structure, instead of Progress
labels. It may not be clear, though, why Structure should still be the main focus of your attention.
As mentioned in the last section, Progress Labels are the final touch on a wave pattern, not the first
step. What was not mentioned; "after Progress labels have served their purpose in solidifying a pattern,
they are no longer helpful in clarifying the larger picture."
Once a pattern is complete, Compaction (see Chapter 7) is necessary to reduce the larger formation
to its base Structure. This base Structure is needed to integrate the pattern with other Compacted
segments into a larger formation. Knowing the Progress labels of each individual section of the
previously Compacted pattern has no further value. You must use the base Structure of the compacted
pattern on a longer-term chart to decide how the Compacted segment becomes part of a larger Series.
9-10 Bash Neety Extensions
Advanced Logic Rules ioi
Pattern Implications ,0-1
Retrocement Based on Power Ratings 10-2
All Corrections (except Triangles) 10-3
Triple Zigzag 10-3
TripleCombination 10-4
Triple Flat 104
Double Zigzag ] 04
Double Combination 104
Double Flat 104
Elongated Zigzag 104
Elongated Flat 10-5
Zigmg 10-5
Wave-clongesl 10-5
Wave-cequal 10-5
Wave-c shorter 10-5
B-Failure 10-5
Common 10-5
Irregular 10-5
C-Failure 10-$
Irregular Failure 10-6
Double Three 10-6
Triple Three 10-6
Running Correction 10-6
DoubleThreeRunning Correction 10-7
TripleThreeRunning Correction 10-7
Triangles 10-7
Contracting 10-7
I. Limiting 10-8
a. Horizontal 10-8
b. Irregular 10-8
c. Running 10-8
IT. Non-Limiting 10-8
Expanding 10-9
I. Limiting 10-9
n. Non-Limiting 10-9
Impulsions 10-9
Trending 10-10
Terminal 10-10
One of the last, critical considerations of an interpretation's validity involves the incorporation of
Logic into the market action. This is an area of the Wave Theory which is completely overlooked by the
majority. The Logic rules are the product of exhaustive market research and observation by the author,
from an Elliott Wave standpoint, for over a half-decade. The essence of the Logic Rules: Post-pattern
market action must adhere to specific types of behavior which is predicated upon the pattern just
completed.
For example: after completing a Terminal Impulse pattern, the reaction should be quite violent and
should retrace all of the Terminal pattern within less than 50% of the time consumed by the Terminal
Impulse. Lack of obedience to this Rule indicates a significant flaw with the current interpretation. If
you thought you had uncovered a Terminal pattern in a market, but post-Terminal behavior did not react
as described, a Terminal Impulse pattern never existed in the configuration predicted.
From a slightly broader perspective, the Logic Rules pertain to the integration of separate Elliott
patterns in areasonable,coherent, andconsistentmanner. The majority of rules which make up the "logic
complex" revolve around the inherent strength and weakness implications of each Corrective pattern and
it's variations. The table below covers many situations in which pattern implications are crucial to the
correct interpretation of a move.
Pattern Implications
All Elliott patterns imply and transfer specific amounts of "Power" to future market action. In
addition, many require particular post-pattern behavior including the minimum price length the next
pattern should achieve and the minimum time it should consume.
The table below lists each Corrective pattern, along with its Power rating. Power ratings indicate
whether strength or weakness is inferred by the pattern in question. Using a numerical scale from -3 to
+3, the lowest rating belongs to market action which is very detrimental to upside price potential. The
Advanced Logic Rules 10-1
+3 ranking is for patterns which are very beneficial to the continuation of a market advance. To decide
on the subtle "Power" differences between two corrections given the same rating, here is what you do.
When the rating is positive, the Correction listed farthest away from neutral is the stronger of the two.
If the rating is negative, the pattern farthest away from neutral will be the weaker correction.
Retracement Based on Power Ratings
Having an idea of the "power" of a correction is extremely important in the Logical integration
process. It provides you with an accurate idea of whether a Correction will, should, might, should not
or will not get completely retraced by the next move. Some corrections are so weak (or strong) they
cannot terminate a move. Any formation which concludes upward and has a+1 to +3 rating should not
be fully retraced by the next pattern (of the same Degree). Caveat: It has been the author's experience
that the legs of Triangles and Terminals do not transfer implications to the next leg (there is always one
exception to every formationalRule). This indicates if a DoubleZigzag isan entire segment of a Triangle
or Terminal it might be retraced completely by the next leg "of the same Degree." In addition, the next
move may be simpler than the Double Zigzag. As a result of this phenomenon, an important Rule can
bederived. Ifapatternwitha(+l, +2, +3 )or(-l, -2, -3)power rating is completely re traced by a pattern
with a Power Rating closer to zero but which is still of the same Degree, the market is signaling a Triangle
or Terminal pattern if forming (all variations; Expanding or Contracting, 1st, 3rd or 5th Extended).
POWER RATINGS —
1. Triple Zigzag
2. Triple Combination
3. Triple Flat
4. DoubleZigzag
5. Double Combination
6. Double Flat
7. Elongated Zigzag
8. Elongated Rat
9. Zigzag
10. B-Failure
11. Common
12. C-Failurc
13. Irregular
14. Irregular Failure
15. Double Three
16. Triple Three
|17. Running Correction
18. Double Three
Running Correction
19. Triple Three
Running Correction
When the pattern
completes upward:
+3
+3
+3
+2
+2
+2
+1
+1
0
0
0
-1
-1
-2
-2
-2
-3
-3
-3
When the pattern
CO
(in a Triangle
(in a Triangle
(in a
(in a
(in a
Triangle =
Triangle -
Triangle =
npletes downward
-3
-3
-3
-2
-2
= 0)
= 0)
= 0)
= 0)
= 0)
-2
-1
-1
0
0
0
+1
+1
+2
+2
+2
iT 1
'J 1
+3
+3
Non-Standard
Formations
(Category 1)
Standard
Formations
Non-i
Forr
(Cat
Standard
nations
egory2)
10-2 Advanced Logic Rules
Realize, a pattern's Power rating can only be properly applied if you fully compact all patterns under
formation. By compacting a move, you arrive at the largest, allowable formation possible. It is the
compacted formation which the Power ratings will reliably affect. For example, let us assume a Double
Zigzag recently completed. If the Double Zigzag occurs anywhere from the first to the second to last
formation of a larger pattern, the Power rating should be reliable. At any one of those points, the
Compaction process would only reveal a completed Double Zigzag as a separate pattern. But, if the
Double Zigzag occurred as the last part of a more Complex formation (such as a Terminal Impulse), the
Power rating of the DoubleZigzag would not be reliable since the largestpattemcompletedisaTerminal
Impulse, not a Double Zigzag. In other words, when a pattern is the last part of a larger formation, the
smaller pattern is unimportant. Only take into account the Power rating of the largest pattern.
The higher the absolute value of the Power Rating, the less likely the move will be completely retraced.
Below are the anticipated retracement ratios implied by each possible Power rating:
1. A ("0") rating does not imply any specific retracement value, virtually any retracement level
is possible from just above 0% to beyond 100% of the previous pattern.
2. A (+1,-1) rating would allowforno more than about 90% retracement by the next completed
pattern of the same Degree.
3. A (+2,-2) would indicate no more than about 80% retracement.
4. A (+3,-3) rated pattern should be retraced the least, around 60-70%.
Listed below are all Elliott Corrective patterns (except Triangles, which will be covered shortly).
When the last segment of one of the Corrections listed on the previous page terminates upward on a chart,
the pattern designated #19 would be considered the weakest, while pattern #1 would be the strongest.
If the last segment of one of me Corrections terminated downward, the reverse is true.
Under the next heading, "special situation" notes are listed for each Elliott pattern. These guidelines
will direct you in "solidifying" price action into absolutely reliable Elliott Wave patterns.
All Corrections (except Triangles)
illilinUBIII[llllllllllllllllll!l[|[|||||||[|[||||||||||[||||1111111 I I I
The largest price moves in a market happen after Corrective action. This makes understanding the
implications of a Correction far more important than those of an Impulse pattern.
Triple Zigzag
This is the most powerful corrective pattern that can occur. If its movement is downward, it implies
the market is currently very weak. If its movement is upward, the market is currently strong. A Triple
Zigzag will hardly ever be seen but, when it does occur, it is usually the longest segment of a Terminal
or Triangle. When part of a Terminal pattern, it should definitely be the Extended segment. Based on
market position, if a Terminal is not possible, the only choice is that the Triple Zigzag is the largest
segment of a Triangle. If part of a Flat or Contracting Triangle, a Triple Zigzag can never be completely
retraced by the pattern which immediately follows it of the same Degree.
Advanced Logic Rubs 10-3
Triple Combination
This pattern can be a combination of Zigzags, Hats (frequently elongated) and Triangles. Virtually
always, a pattern which falls into this category terminates with a Triangle. Either one of the two x-waves
can also be Triangles, but are not required to be. The first two Corrections (the one which starts the move
and the one right after the first x-wave) should not be Triangles. When a Triple Combination occurs in
a Triangle, it will be the largest wave of the Triangle in price and probably time also. It can occur in only
one other pattern, a Terminal Impulse. When a Triple Combination occurs as the extended 5th wave of
a Terminal, it is the only time the market should completely retrace a Triple Combination, even though
the retracement will be of a larger Degree.
Triple Flat
The pattern which follows a Triple Flat should not completely retrace it unless the Triple Flat is the
last leg of a 5th Extension Terminal (i.e. wave-5). Even then, the retracement pattern would be of one
larger Degree. They should not be completely retraced by the next move of the same Degree. These
patterns are very rare and it is unlikely you will ever see one. It is only included here for thoroughness.
Double Zigzag
This pattern should not be completely retraced by the move to follow unless, once again, it is the last
segment of a 5fh Extension Terminal.
Double Combination
Just like a Triple Combination, a Double Combination will almost always end with a Triangle, OR
during simpler (level-1 Complexity pattern) patterns, a c-wave failure. This pattern can be completely
retraced if it completes a larger formation (such as a Terminal Impulse - 1st, 3rd or 5th wave Extended),
but usually will not be. If the Corrective phase, after wave-x, finishes with a "severe" C-Failure or a
Running Triangle, then it is possible the entire correction will be completely retraced.
Double Flat
These are not very common patterns, but they do occur. The pattern to follow will probably not
completely retrace the Double Hat unless the Double Flat finishes with a "severe" C-wave Failure or
concludes a larger formation (such as aTerminal Impulse, any variety). The move following one of these
patterns should be a little faster than the move following a Double Zigzag.
Elongated Zigzag
Named by the author, an Elongated Zigzag pattern occurs almost exclusively in Triangles and
Terminal Impulse patterns. It will usually be the entire leg of such a pattern. It could occur as any wave
in a Contracting Triangle (except wave-e) or any wave in an Expanding Triangle (except wave-a). It
should never be completely retraced by the wave of the same degree that immediately follows it.
10-4 Advanced Logic Rules
ElongatedFlat
This is one of the most interesting and distorted Elliott patterns. The fact that this pattern occurs
almost exclusively in Triangles is a discovery of the author's. It occasionally can be found in Terminal
Impulse patterns. When in Triangles, it is almost always an entire leg of the Triangle. If not the entire
leg, then it will occur as a "one lower degree" segment of a complex correction which is the entire leg
of a Triangle.
Zigzag
This ranks among the top three, most common patterns. To be considered simply a Zigzag, the c-
wave should not be less than 61.8% of wave-a nor more than 161.8%.
Wave-c longest:
Of the three Zigzags listed here, this has the weakest implications if it is moving down and the
strongest if it is moving up. It is not likely to be completely retraced unless the next wave (of the same
degree) is more complex and time-consuming or the Zigzag completes a Corrective phase.
Wave-c equal:
This pattern may or may not be completely retraced. It is one of the most frequently occurring
corrective patterns. Virtually anything could happen after this pattern.
Wave-c shorter:
This pattern is almost sure to be completely retraced unless it is followed by an x-wave. It does not
really give any clues of what to expect from the next pattern.
B-Failure
A B-Failure is the most neutral pattern existing under the Wave Theory. Nothing in particular can
be expected following this pattern since virtually anything is possible.
Common
Again, this is a pretty neutral pattern. It can occur virtually anywhere a Correction is allowed. Itdoes
not imply anything about future market action, but is definitely more powerful than a Zigzag.
Irregular
Despite what many readers may believe, this pattern is actually quite abnormal and infrequent. It
creates a state of "self contradiction." Why? When the b-wave of a pattern exceeds the beginning of
wave-a, it demonstrates the power of the trend of one higher degree. When the c-wave turns around and
exceeds the end of wave-b, it nullifies the power exhibited by the b-wave creating an illogical condition.
This behavior is acceptable in Terminals and Triangles, not in Flats (which is what an Irregular is).
Advanced Logic Rules 10-5
C-Failure
This pattern must be completely retraced by the move to follow of the same degree. If the C-Failure
completes the Corrective phase, the Impulse wave to follow should be larger than the previous Impulse
wave which is traveling in the same direction and is of the same degree. If the C-Failure is not the end
of the larger Correction, the rally to follow should be the x-wave of a Double Three Running Correction.
or less likely, the b-wave of a Running Correction.
Irregular Failure
This pattern must be completely retraced. From this point onward, the patterns listed begin to
indicate "Power" in the opposite direction that they conclude. Usually this pattern will occur as wave-
2 (of a Trending pattern) which will be followed by an Extended 3rd wave. The Impulse wave after an
Irregular Failure should be bigger than the previous Impulse wave usually by a factor of 1.618.
Double Three
As a general rule, the longer this Correction takes, the more powerful the move to follow should be.
Double Threes are more common as b-waves than 2nd waves. WHY? If a second wave is a Complex
(Non-Standard) Correction, the 3rd wave is most likely going to be the Extended wave. The inherent
Power of that Extension will affect the formation of wave-2. Generally, this power "stretches" the
Double Three in the direction of the 3rd-wave extension to follow, making it a Double Three Running
Correction, not just a Double Three.
The price action for a c-wave would not normally be as large as a 3rd wave Extension. The c-wave's
inherent lack of power usually avoids the stretching effect of the Double Three and therefore prevents
the Double Three from turning into a Running pattern.
Double Three Running Corrections imply a great deal of strength for the trend of one larger degree;
therefore, you are only likely to see one in the 4th wave position if it is followed by a 5th wave extension.
The Impulse move after a Double Three should be at least 161.8% of the previous Impulse wave (i.e.,
if an Impulse wave occurred immediately before the Double Three).
Triple Three
Triple Threes' are a virtually non-existent phenomenon. If you witness one, the Impulse move to
follow should be at least 261.8% of the previous Impulse wave (if there was one). Almost without
exception, Double and Triple Threes drift slightly in the opposite direction of their last wave.
Running Correction
The movement to follow a Running Correction must be the extended wave of an Impulse pattern or
an Elongated c-wave of a Flat or Zigzag. After a Running Correction is complete, the market should
commence with the next Impulse wave; it should not continue to form a more complicated Double or
Triple Three. The Impulse wave afteraRunning Correction should be more than 161.8% of the previous
Impulse wave; frequendy it is 261.8% or more.
10-6 Advanced Logic Rules
Double Three Running Correction
This is a pattern which seems to cause more confusion and Controversy than any other. The funniest
part of this story is that a Double Three Running is virtually never interpreted correctly. During their
formation, some Elliotticians count this pattern as a series of l's and 2's. Some will interpret it as a
Terminal Impulse pattern. Some will call it a complex Correction such as a Double Zigzag. The most
important aspect of correctly deciding between all of these unrelated formations is wave Structure (:3
or :5). Strict adherence to Structure is an area many analysts tend to overlook. They casually put together
an interpretation based on general shape and appearances, not on concrete structural evidence. To foil
this less diligent group, there are patterns which can Emulate the appearance of other patterns causing
drastic errors in judgment Fortunately, close attention to detail will usually reveal the correct
interpretation. Channeling is another key to avoiding the misinterpretation of this pattern (see page 12-2).
The move after a Double Three Running correction must be Impulsive. This Impulsion should
exceed 161.8 % of the previous Impulse wave. More than 261.8 % is common. Basically, the only place
this pattern will occur is as wave-2; furthermore, the formation almost always concludes with a Triangle.
Triple Three Running Correction
This formation is incredibly rare and for good reason. The power built up by a Double Three Running
Correction is so great it is unrealistic to expect the market to continue to postpone the day of reckoning.
Remember, a market never develops beyond the Triple Three Corrective phase; as a result, the market
cannot "continue creating x-waves indefinitely," as one of my clients once asked. If you were to see a
Triple Three Running Correction, expect the Impulse move following to be a minimum length of 261.8%
of the previous Impulse wave.
Triangles
liiTiiiiiiiiiinniiiiiiiiiiiiiiiiniii mi iiinii!! 11
The unusual nature of Triangles necessitates they fall into a category all their own. [Non-Limiting
Triangles are a category developed by the author.]
Contracting
A "thrust" (powerful, violent price movement) always follows a Contracting Triangle which,
depending on the variation, may be large or small, long or short-lived. The thrust out of a Contracting
Triangle should always exceed the highest or lowest price obtained during the formation of the Triangle
unless it drifts against the direction of wave-b. Depending on subtle formational differences, the
Contracting Triangle may be a 4th orb-wave (see Limiting) or an x-wave or the last phase of a Complex
Correction (see Non-Limiting, page 10-8).
Triangles create (or identify), important support or resistance zones in the market. Once a Triangle
has finished, the price level at which the apex point of the Triangle occurred will provide significant
resistance to any advance or support to any decline. When the market breaks through one of these
"barriers" it will generally be violent. The important support orresistance created (orrecognized) by the
Triangle is almost always a reliable point to look for Fibonacci relationships, especially if the Triangle
is the b-wave of a Zigzag.
Advanced Logic Rules 10-7
The influence of the Triangle's apex point (horizontally, price-wise), will usually hold for only two
or three violations. If the market has moved up or down through the price level occupied by die apex
point more than three times, die market is indicating that price level has lost its significance.
/. Limiting
Unlike most Corrections, whose Implications depend a great deal on what the previous Impulse or
Corrective pattern did, Limiting Triangles are "self-descriptive." Post-triangular action in a Limiting
Triangle is dictated by die widdi of die widest leg of the Triangle and die placement of the apex point
created by the converging trendlines which form the Triangle.* These two factors provide a reliable
price/time window which readily verify (or nullify) a Limiting Triangle's validity. If die Triangle being
analyzed is truly Limiting, die market action after the thrust should return to the breakout point and will
usually exceed it.
Depending on the slope of the trendlines which encase the Triangle, the thrust could be as much as
261.8% of die widest legof the Triangle (added to the end of wave-e) or as little as 75%. The thrust should
terminate almost exacdy into die time period (not price level) where the converging trendlines crossed,
creating the apex point. If all indications are that the Triangle is a b-wave or a 4th wave, but the post-
dirust action has not returned to the breakout point or beyond and the market action has exceeded the
original thrust's highest or lowest price level, diere must be a Terminal pattern forming (applies to both
situations) or an x-wave unfolding (only applies if the Triangle is a b-wave).
If working with a Limiting B-wave Triangle and the "post-thrust" action does not exceed the
breakout point shortly after the apex time zone is reached, an x-wave is probably forming after the thrust.
a. Horizontal
The thrust out of the Triangle should be approximately equal to the widest wave of the Triangle, plus
or minus 25%. This Triangle variation implies normal market conditions.
b. Irregular
Since the b-wave in one of these patterns exceeds the end of wave-a, it implies the pattern is more
powerful than a Horizontal (ineither price direction). The thrust out of this variation can be as much as
161.8% of die widest leg of the Triangle.
c. Running
This is the most powerful Triangular pattern. The thrust can be as much as 261.8% of the widest leg.
Market conditions are unusually strong (probably climactic) if the Triangle is drifting upward or weak
if the Triangle is drifting downward.
//. Non-Limiting
A Non-Limiting Triangle imposes no specific post-triangular price or time limitations on market
action. The only way to decide what the pattern "implies" is to study the pre-Corrective action. If a
Correction completes with a Triangle it means the Correction must be complex in construction (any
10-6 Advanced Logic Rules
Double or Triple pattern). The Impulse segment of the same Degree after such a pattern (if one occurs),
should be at least the same length as the previous Impulse wave.
The "thrust" out of a Non-Limiting Triangle can, and usually will, be much larger than the width of
die Triangle. Despite this fact, during the early stages of the thrust, the market will usually try to emulate
"normal" post-triangular behavior by initially breaking out approximately the width of the Triangle and
then reacting. Where the two variations differ is in what happens next. As mentioned in the Limiting
section, the apex point of the Triangle (price-wise) should be touched or broken after the thrust. In aNon-
Limiting Triangle, the reaction will not return to the apex point (price-wise) and will eventually exceed
the end of the initial thrust. Another major difference between Limiting and Non-Limiting patterns is
die Non-Limiting "thrust" will not terminate during the time period occupied by die apex point.
Expanding Triangles
The interesting characteristic of Expanding patterns is that they basically imply the opposite
attributes of a Contracting formation. The "dirust" (actually a misnomer), should be less than the widest
leg of the Triangle. If the pattern takes place in the b-wave position, a C-wave Failure is inevitable. Even
if an Expanding Triangle completes a larger pattern, it is unlikely the next move will completely retrace
the e-wave of me Triangle. If it does, the retreacement should take more time than the e-wave.
I. Limiting
There is very little difference between the varieties of Expanding Triangles. The Limiting and Non--
Limiting categories were kept to identify between the 4fh-wave/b-wave variety and all other variations.
The only implication diat is reliable about this pattern is it should not be completely retraced.
II. Non-Limiting
This variation would define those Expanding Triangles mat occur as x-waves, OR the first or last
phase of a complex Corrective pattern. Its most common position is the first phase of a Complex
Correction. In that position it will not be completely retraced by the next move of the same Degree.. If
it is die last phase of a Complex Correction (which is not likely, then it has to be completely retraced.
Impulsions
rr™,!!!1!,!!!!!!!1!!!!'!!!!!!!!!!!'!! Illl 'I! HI'! I I I
The implied future behavior of a market is not quite as useful when working with Impulsions. About
the only predictable action after an Impulse pattern regards how much the next move, of the same Degree,
should retrace die Impulsion. It would be very difficult to predict what type of Correction is going to
take place after an Impulsion. The listing to follow covers post Impulsive behavior almost stricdy from
me vantage of retracement expectations.
* A concept first presented in the book Elliott Wave Principle, Key to Stock Market Profits, by Frost & Prechter:
New Classics Library, Gainesville, GA
Advanced Logic Rules 10-9
Trending
After a Trending Impulse wave concludes, it should never be completely retraced unless it is wave-
5 or wave-c of a larger pattern. If the Trending Impulse is wave-a, wave-1 or wave-3 of a larger pattern,
the action to follow should not retrace more than 61.8% of the Impulse wave.
If retracement of the previous Impulse pattern exceeds 61.8% and the previous Impulse pattern is
wave-1 of the next larger Degree, expect a complex (relative to wave-1) time consuming 2nd-wave
correction to develop which contains a c-wave Failure. If the Impulse pattern finalized was wave-3 of
the next larger pattern and wave-3 was retraced close to or slightly more than 61.8% by wave-4, expect
a 5th wave Failure to occur. If the 4th-wave recovers from the severe retracement of wave-3 and it
concludes at a 61.8% retracement of wave-3 (or less), a 5th wave Extension is a possibility if wave-4 is
more complex and time consuming than wave-2 and wave-3 is not more than 261.8% of wave-1.
1st Wave Extension
In an Impulse pattern with a 1 st Wave Extension, the action to follow should definitely retrace to the
termination of wave-4 (within the recently completed Impulsion). If the Impulsion completed wave-
(1) or wave-(5) of a larger Impulse wave, the market should fall into (or beyond) the price zone for wave-
2 of the previous Impulsion.
3rd Wave Extension
If the 3rd wave extends within an Impulse wave, the reaction should at least return to the 4th wave
zone (anywhere from the highest to lowest price of that zone) of the recent Impulse wave. If the entire
Impulse pattern (with the 3rd wave Extension) completes wave-(5) of alargerpattern, the whole Impulse
wave should be retraced more than 61.8%. If the entire Impulse completes wave-(l) or wave-(3) of a
larger Impulse, the pattern (with the 3rd wave Extension) should be retraced less than 61.8%.
Sth Wave Extension
The 5th Wave Extension is the only extended wave which should be consistently retraced more than
61.8% by the next wave of the same Degree no matter what part of a larger scale the 5th wave is. A 5th
wave Extension should not be completely retraced by the next move of the same Degree unless the 5th
wave concluded wave-c of a Correction. A 5th Extension is one of the few patterns which is not likely
to be completely retraced by even the next move of one higher Degree.
Terminal
The market action after a Terminal Impulse must retrace the entire pattern in 50% or less of the time
consumed by the Terminal pattern. Usually, all that is required is 25% of the time (give or take a few
percentage points). A Terminal pattern always completes alarger formation and the high or low it creates
should hold for approximately twice the time period (or more) covered by the Terminal. If the Terminal
is the 5th wave of an Impulse pattern, usually the larger Impulse pattem will also be completely retraced.
10-10 Advanced Logic Rules
Advanced Progress Label Application
Wave-1 Extended
Terminal
Wave-2
Wave-3 Extended
Wave-3 Non-Extended
Wave-4
Wavc-5 Extended
Corrective Patterns
flats
B-Failure
C-Failure
Common
a. Horizontal
11-1
Impulse Patterns u2
Trending n_2
11-2
Wave-1 Non-Extended ^.3
Wave-2 j ,.3
Wave-3 Extended 113
Wave-3Non-Extended U_3
Wave-4 1M
Wave-5 Extended jj_4
Wave-5 Non-Extended 1M
5th Wave Failure 114
11-6
Wave-1 Extended j].g
Wave-1 Non-Extended jj.g
11-6
11-6
11-7
11-7
11-7
Wave-5 Non-Extended [^_7
11-7
11-8
11-8
11-8
11-11
Double Failure 11-12
Elongated 11-13
Irregular JJ.J4
Irregular Failure 11-16
Running jj.jy
Zigzags n.18
Wave-a u.,8
Wave-b n.19
Wave-c Ij.jg
Triangles u.19
Conlractine 1 j 20
I. Limiting H-20
11-21
Wavc-a H-21
Wave-b 11-21
w.vcc H-22
Waved 11 -22
Wave-e H-22
b. Irregular 11-22
Wave-a ' -a: ■'■■ ""' H-22
Wave-b 1 j .22
Wave-c 11-23
w,v»-d n-23
Wavee H-23
c. Running H_23
w.vc.. H-23
Wavc-b H-24
Wave-c H-24
Wave-d " H-24
W.ve-c H-24
IT. Non-Limiting 11-25
Wave-a 11-26
Wmie-e H-26
Expanding H-29
I. Limiting 11-30
a. Horizontal 11-31
b. Irregular 11-31
c. Running 11-31
U. Non-Limiting 11-31
One of the major reasons the Elliott Wave Theory allows you to predict future price action with such
a high degree of accuracy (at times) is due to its strict limitation on where certain types of market behavior
can and cannot occur. The information in this section should help to further clarify a market's current
position and assist you in predicting its future activity. Specific pre- and post-market action requirements
are listed in this chapter to aid you in correctly linking one pattern with the next. This area of the Theory
should be dealt with only after all the elementary aspects of analysis are considered (i.e., Retracement,
Structure Series, Channeling, Alternation, Fibonacci relationships, etc.).
The proper application of Progress Labels requires a vast understanding of market behavior. The
minute you use a Progress Label on market action you instantly imply certain types of time, price,
structure, complexity, volume, velocity and momentum characteristics which must be inherent in the
market action labeled. These are not characteristics the beginning student could be expected to
instinctively understand. Obviously, the use of Progress Labels is much more involved than just looking
to see how much a move gets retraced.
To confidendy place Progress Labels on price action you must understand the subtle implications
and slight differentiations of each Elliott pattern and its variations. As the market approaches the middle
of a Trending or Corrective Elliott pattern, it is especially important to deal with the basics of market
"Structure." Why? Because it is at these times, more often than not, you will not be able to limit Progress
Label possibilities enough to arrive at only one scenario (or possibly, any scenario at all).
Advanced Progress Label Application 11-1
Only after you understand the rudiments of deciphering monowave market action as either Trending
or Corrective in nature, after you learn to Serialize the Structure of the monowaves and then learn how
toroughly correlate the action to Standardized Elliott patterns, are you ready for this section oaAdvanced
Progress Label Application. Progress labels are thefinal check on a proposed wave count. To properly
apply Progress Labels, it is required you check through a sometimes lengthy list of essential and subtle
criteria. This list will solidify the proposed combination of Trending and Corrective segments into larger,
legitimate Elliott patterns.
Each/Yog/-e.y.s Label'samatt characteristics allow die knowledgeable Elliottician to finalize current
market structure and forecast future activity. They invoke form to a market's action and, due to their
ordered occurrence (i.e., 1,2,3,4,5,a,b,c), provide a road map (albeit, sometimes rough) of future market
behavior. [If this subject is new to you, it should be obvious why this area of the Theory could not be
discussed until now, after an understanding of each label's implications was presented to you.]
The next section is intended to help you accomplish the task of transforming your chart's wave
"Structure" into "Progress" labels as quickly and reliably as possible. A check list of attributes, which
must be considered every time you place a particular Progress Label on real-time market action, is
included in this next section. Each listing contains an array of characteristics which describe die
implications of each Progress label on past and future market action. Try to understand the concepts
behind these listings; they are all based on logical induction and deduction. Once the concepts are
understood, it will be as if you had memorized this entire section because you will be able to logically
explain die interactions of Elliott Wave price patterns.
Attempting what has never been attempted before, each Progress Label has been listed under each
type of Elliott pattern. It is dirough this list that I hope to eliminate the belief in the investment world
that Elliott Wave Theory allows too many possibilities and has too many exceptions to be viable.
Actually, the reverse is true, but until now no source provided you widi this "process of elimination"
information.
Impulse Patterns
An Impulsion can transpire only in specific Progress Label positions. Never can waves-2,4, b, d,
e, or x be an Impulse pattern.
Trending
^■nHniMiniiiiiiiiiiiniiiiiiiiii i
Wave-1 Extended
The move that follows Extended wave-1 (wave-2) cannot retrace much more than 38.2% of wave-
1. Wave-2 will not likely be a Zigzag pattern. If you do see a Zigzag form after die 1 st wave Extension,
most likely it will be the completion of only wave-aof a larger Hat correction for wave-2. Wave~2canno/
be a Running correction. Wave-5 must be the shortest of the three thrust waves (1,3,5). Probabilities
greatly favor that wave-2 will be more complex and time-consuming than wave-4 and it is likely that it
will be the most complex and time consuming pattern in the entire series (1-5). If the pattern is above
polywave development, the probabilities greatly favor that wave-1 will be the subdivided wave (the most
complex of the three thrust segments). If wave-1 is not die subdivided pattern, dien it must be wave-3.
11 -2 Advanced Progress Label Application
Wave-1 Non-extended
Wave-2 can retrace as much as 99% of wave-1. If it does, and wave-1 is a polywave or higher, the
2-wave will subdivide into an a-b-c affair in which die c-wave will fail (the 2-wave may subdivide
whedier die 1 st wave does or not).
If you are witnessing the first wave-1 develop after a prolonged advance or decline, there are no
specific price level requirements for die termination of wave-1. If it is wave-1 of a larger 3rd or 5th wave,
then wave-1 should approach (and preferably exceed) the termination point of the last Impulse wave of
one larger degree. The 3rd wave must be longer than wave-1. If the pattern is above Complexity level
1, the third or fifth wave will be the subdivided segment, not wave-1. This is not to imply wave-1 will
not subdivide, it just means it will not be die. subdivided wave of the group. In other words, wave-3 or
5 will be more subdivided.
Wave-2
If wave-1 turns out to be (or is believed to be) the longest wave in the sequence, the second wave
cannot retracemuch more than 38.2%of the first wave. If die first wave isnot die longest wave, die lowest
point of wave-2 can retrace as much as 99% of wave-1. If wave-1 is a polywave or higher, the 2-wave
must subdivide into a polywave or higher pattern. If the 2-wave subdivides and wave-a (in wave-2)
retraces more than 61.8% of wave-1, the entire correction will inevitably turn out to be uDouble Failure
or a C-Failure, with the C-failure occurring at a point 61.8% or less of wave-1.
Wave-3 Extended
This is the most likely wave in a sequence to extend. If wave-(3) is also the subdivided wave, the
strongest tendency is for the 3rd wave of wave-(3) to also extend. To get a 3rd wave extension
immediately after wave-2 completes, without forming a smaller 2nd wave on the same chart, the 2nd
wave should be of Power level 1 (+or-) or higher. If the 3rd wave is a polywave, consecutively smaller
2nd-waves (before die explosive "3 of 3" move) will be similar in construction. Under those specific
conditions, it is mandatory that the smaller 2-waves take less time, less price and retrace less (as a
percentage of wave-1) than the larger 2-waves. Also, the larger 0-2 trendline should not be broken by
the smaller 2-wave correction. Always be aware that wave-5 can Fail if die 3rd wave extends.
Wave-3 Non-extended
When wave-3 is not the longest of die three thrust waves, either wave-1 or wave-5 will be shorter
in price dian wave-3. If wave-3 is shorter than wave-1, then wave-1 will be the extended wave and wave-
5 will be shorter dian wave-3. If wave-5 extended, wave-1 would be shorter than wave-3. When the first
wave extends, wave-3 should complete no further away than 61.8% above (or below if the market is
trending down) from the end of wave-1.
Advanced Progress Label Application 11-3
Wave-4
If the 5th wave extends, wave-4 should be more complex, time-consuming, and possibly of one
greater complexity level than wave-2. If wave-1 extends, wave-4 should be simpler in price, time and
structure than wave-2. If the fifth wave extends, wave-4 should retrace a greater percentage of wave-
3 than wave-2 does of wave-1. Frequently wave-4 will retrace as much as 50-61.8% of wave-3 when
the 5th wave is the extension. If the fifth wave fails in the Impulse sequence, the fourth wave should be
the most complex pattern and should retrace more than 38.2% of wave-3 (as much as61.8% is allowable).
Wave-5 Extended
Wave-5 should be at least equal to die price distance from the beginning of wave-1 (point "0")
through the end of wave-3 added to the end of wave-4. The maximum length of the 5th extension should
not exceed 261.8% of the length from "0" to the end of wave-3 added to the end of wave-3. When
considering waves-2 and 4, wave-4 should take the greatest amount of price/time and have the most
complex structure. Wave-1 should progress at the sharpest angle with wave-3 following closely behind
and wave-5 possessing the slowest rate of acceleration. A 5di wave extension cannot be completely
retraced unless it is the c-wave of a correction pr is the end of a larger 5th wave Extension.
Wave-5 Non-Extended
The 5di wave should be retraced close to 100% or more by die next corrective phase. If wave-1
extended in the sequence and die sequence concludes wave-(l) or wave-(a) of a larger Degree, the
correction after wave-5 should drop into the 2nd wave price zone. If the sequence completes wave-(3)
of a larger Degree, the correction after wave-5 will probably stop in the fourth wave zone.
5th Wave Failure
As a general rule, 5 th wave Failures are only possible when the 3rd wave is the Extended move. The
4th wave should be the most complex of the two corrective phases. Wave-4 should retrace more of wave-
3 than wave-2 does of wave-1. Almost always, wave-1 & 5 will be practically identical in price and time.
On fewer occasions, waves 1 & 5 will relate in price and/or time by 61.8%. A 5th wave can Fail in an
Impulse pattern only under one of die following circumstances:
A. If die Impulse pattern (which contains the 5th wave Failure) is itself the 5th wave of a larger
Impulse pattern (see Figure 11-1).
B. If the Impulse pattern (containing die Failure) is the c-wave of one (and only one) larger
Degree (see Figure 11-2).
C. Under extremely rare circumstances you might see a largerSrd wave experience a smaller
5th wave Failure. For this to take place, the market would need to be forming a top or bottom
that is very significant. "Significant" is, of course, a relative term. In this situation it would mean a
Multiwave pattern, or preferably higher. If you witness an event such as this, the larger 5th Wave will
also have to Fail, and it must Fail even further away from a high or low than the wave-5 Failure within
71-4 Advanced Progress Label Application
the 3rd wave. To have wave-5 Fail at the end of a larger 3rd wave would indicate exceptional counter
trend power. After such an event, a long-term top or bottom should be in place. Note: Even though it
cannot be absolutely ruled out, the author has never seen a 5th wave Failure at the end of a larger 3rd
wave. Through logical deduction and a long-term familiarity with wave behavior, it is reasonable to
assume that the conclusions above are valid for such a situation.
Figure 11-1
Highest price reached
Fifth Wave Failure
of a larger Fifth wave
Figure 11-2
Highest price
Wave-c is composed of
an Impulse wave with a
5th wave Failure. For
this reason, wave-c
completes below its own
highest price level.
Advanced Progress Label Application 11-5
Terminal
^■MnaniiiiiHiiiiiiiiiiimmmi
This type of pattern was referred to by Elliott as a "Diagonal Triangle." To avoid any incorrect
association of "Diagonal Triangles" with "Horizontal Triangles," I decided it was necessary to retitle the
pattern. The new phrase, "Terminal Impulse," is a more accurate description of the pattern and its
implications. I apologize to the reader who is accustomed to the old term, but I had to approach this
subject with the idea that the reader is completely inexperienced. This new term should provide you with
a better understanding of the phenomenon and its place in the larger scheme. Since Terminal and
Triangle patterns consist of the same Structure Series, they tend to exhibit similar behavior
characteristics. The deciding factor is that Terminal patterns adhere to all of the Essential Impulse Construction
Rules; it is impossible for a Horizontal Triangle to follow all the same Rules. [For diagrams of Terminal
pattern variations, refer to Chapter 5, pages 14-15]
Wave-1 Extended
A 1st wave extension in a Terminal pattern is by far the most common setup. Measured from its
termination point, wave-2 should not retrace more than 61.8% of wave-1. Wave-3 should not be much
more than 61.8% of wave-1, but at least 38.2% of wave-1. Wave-5 cannot be more than 99% of wave-
3,but will more likely be only 61.8% to38.2%. Wave-4 will usually be61.8% of wave-2 in price and
equal or relate by 61.8% in time. The 2-4 trendline should be clean and easy to identify. The only way
the 2-4 trendline can experience a 'false break' (under these circumstances) is if the 5th wave is an
Elongated Flat, a correction experiencing a C-Failure or a Horizontal Triangle or a c-wave Terminal
within the 5th wave.
Wave-1 Non-extended
Wave-2 can retrace as much as 99% of wave-1. When the 1 st wave does not extend, the Terminal
pattern will most likely be the c-wave of a correction (excluding the c-wave of a Triangle), not the fifth
wave of an Impulse pattern.
Wave-2
If the first wave extends, wave-2 should not terminate at a point lower than 61.8% of wave-1. If the
first wave does not extend, wave-2 can retrace up to 99% of wave-1. If the first wave extends, wave-
2 should consume more time and price than wave-4 and be the most complicated of the two corrections.
Wave-3 Extended
This constitutes one of the rarest possible wave patterns. When wave-3 "extends" in a Terminal
pattern (unlike all other instances), it cannot be much longer than the first wave. Wave-2 must retrace
more than 61.8% of the first wave and the fourth wave should retrace 38.2% (preferably less) of the third
wave. The 2-4 trendline should perform as usual. A1-5 trendline s/wu/dbedrawn which willbe broken
by the third wave. The fifth wave should not be more than 61.8% of wave-3. You will probably only
see this pattern as the c-wave of a sequence, not the 5th wave of an Impulse pattern.
11-6 Advanced Progress Label Application
Wave-3 Non-extended
If wave-3 does not extend, the probabilities are considerably in favor of the first wave being the
extension. If the first wave extended, wave-3 should not be much more than 61.8% of the first wave and
wave-5 should not be much more than 61.8% of wave-3. If wave-1 is smaller than wave-3 (but not less
than 61.8%) the 5th wave will probably extend. This would entail wave-4 overlapping wave-1, wave-
4 being larger inprice and/ortime than wave-2. The 5th wave should be at least equal to 1 -3 in price added
to the low of wave-4. The 5th wave should not be more than 161.8% of waves 1-3 added to the top of
wave-3.
Wave -4
Wave-4 cannotretrace more than 61.8% of wave-3 unless the fifth wave is going to extend and even
dien, it is extremely rare. If the fifth wave extends, wave-4 will probably take more time and price than
wave-2 and consist of more subdivisions than wave-2. Wave-2 and 4 will likely relate by 61.8% inprice
and/or time.
Wave-5 Extended
This setup should only occur if die Terminal comprises the 5th wave of a larger Impulse pattern in
which diat 5th wave is also the extended wave ox when the Terminal is the c-wave of any correction
except a Horizontal Triangle. To segregate this pattern from an Expanding Running Triangle, some
important observations are necessary. Unlike an Expanding Running Triangle, a Terminal must drift
slightly upward if the trend of one larger degree is up, making higher highs for waves 1 -3 & 5 and higher
lows for waves 2 & 4 (vice versa if the trend is down). In an Expanding Running Triangle, the first leg
must be shorter than the second. The 5th wave of the 5th Extension Terminal pattern should be at least
100% of waves-1 & 3, while wave-3 should not be more than 161.8% of wave-1. Wave-4 shouldretrace
at least half of wave-3 and can retrace up to 99% (even though that is highly unlikely).
Wave-5 Non-Extended
If the 5th wave is not extended, it should not be more than 61.8% of wave-3. It should not be of the
highest complexity of the three thrust waves. The 5th wave should break beyond the trendline drawn
across waves 1 & 3. The 2-4 trendline should be "clean" and will not be broken until after wave-5 is
complete (unless wave-5 is a Triangle). Wave-4 should consume less time and price than wave-2.
Corrective Patterns
To avoid repeating the same statements under each section, it should be known that no Corrective
pattern can occur in any Trending Impulse Progress Label position (i.e., wave-1, 3, 5, wave-a in a
Zigzag, or wave-c in a Zigzag or Flat [all variations]). The corrective patterns begin on the next page
with Flats.
Advanced Progress Label Application 11-7
Flats
■M»MIIIlllllllllllllll|[|!lllllllll
Flat patterns have many ways of manifesting themselves depending on the subtle differences of
strength between one pattern and the next. All the patterns that fall under the broad heading of Flats are
composed of the same Structure Series [3,3,5] (i.e. two adjacent corrective segments followed by a third
Impulsive segment). Previously, we dealt with minimum requirements and maximum limits of Flat
patterns. In this section, a little more detail will be covered along with the specific implications of each
situation.
Variations of the Flat theme appear when the b-wave begins to retrace more than 100% or less than
100% of wave-a. The larger wave-b is in relation to wave-a, the less wave-c will retrace of wave-b and
the more similar wave-c and wave-a will be to each other. The less wave-b retraces of wave-a, the larger
wave-c will become. In Figure 11-3, the three diagrams show how wave-c can act based on various b-
wave retracements of wave-a from 100% to 61.8%. (Keep in mind, these are minimum requirements
for the length of the c-wave in relation to wave-b depending on how much wave-b retraces of wave-a.)
B-Failure
This term describes a pattern where the a-wave is Corrective, but the b-wave retraces only 61.8-81%
of wave-a (see Figure 11-4).
The inability of wave-b to retrace more than 81% of wave-a indicates temporary weakness in the
market. When wave-b is that weak, you can expect wave-c (as long as it is Impulsive) to retrace at least
61.8% of wave-b.
A B-Failure almost always takes place when the a-wave is a Double Zigzag or Double Combination
(completing with a Triangle). It is characterized by the b-wave retracing at least 61.8%, but less than 81 %
of wave-a. The c-wave in a B-Failure pattern must retrace all of wave-b or else the pattern falls into the
Double Failure category. No specific Fibonacci price relationships are required between waves-a,b or
c, but wave-a & c may relate by 61.8%. Waves-a & b should alternate in time, construction and
complexity to the extent possible based on the time consumed by each. This pattern can occur as:
Waves: Any 2,4,a,b
Waves: c,d,e of a Horizontal Triangle
Part of a rare Running Double Flat
C-Failure
A C-wave Failure occurs whenever wave-c fails to retrace all of wave-b. This usually, but not
always, occurs when wave-b retraces all, or almost all, of wave-a. A C-wave Failure is definitely a sign
of counter trend strength (refer to Figure 11-5).
When a C-wave Failure occurs, the c-wave should definitely not be the shortest "time pattern" in the
correction and very frequently it will consume the longest period of time of the three Corrective
segments. Additionally, it can be equal to wave-a or wave-b (see Figure 11-6, bottom of next page).
When a C-wave Failure occurs, it quite frequently will be a Terminal Impulse. A Terminal Impulse
is the perfect way to consume time without damaging price levels (see Figure 11-7, to of page 11 -11).
11-8 Advanced Progress Label Application
Figure 11-3
100% of A
Minimum Requirements
(for length of wave-c based on the length of wave-b)
Regarding all the diagram son this page;
as the B-wavc retraces less and less of
wave-A, the C-wave will tend to
increase in lengih and take more time.
Market Losing
strength, wave-B
approx. 84% of—
wave-A
Under these circumstances the C-wavc
should be at least 61.8% of wave-B
Failure
helps to
regain
B strength
61.8% of B
The slope of wave-C becomes steeper as it gains
slrengUi from the weakening B-wave.
Remember, there is no reason why the C-Wave could
not be longer than illustrated here, these are
designed to show minimum allowable limits.
1.8% of A
When wave-B retraces 61.8% (or less) of wave-A, it
becomes almost mandatory wave-C retrace all of wave-B.
That does not mean it has to get to the lowest point of wave-
A. Remember, wave-a can complete above its own low.
At this point Wave-C is 100% of Wave-B
Advanced Progress Label Application 11-9
Figure 11-4
100% of
Wave-A
-181% 1
I 61.8%/
of Wave-A
A B-Failure pattern occurs when
Wave-b retraces between 61.8%
and 81 % of a corrective Wave-A
Figure 11-5
Figure 11-6
"Corrective Trend" down
I ' I
XX
Time
TopofWave-B
"Counter Trend" up
Bottom of Wave-C
Failure, did not get to, or below,
the bottom of Wave-B
I » I b I c I
Time
The a-Wave is the shortest wave in the pattern (time-wise). Waves-b & c took the same amount of time
Figure 11-7
Failure - Wave-c is shorter
than Wave-b (price-wise).
Wave-c takes a lot of time,
but basically does not go
anywhere price-wise.
11-10 Advanced Progress Label Application
C-wave Failures which are less than 61.8% of wave-b should be considered extremely rare. When
it does happen, the b-wave should take the most time, with wave-a & c equal in time (Figure 11-8).
In a C-Failure pattern, the b-wave should subdivide more completely than wave-a. Usually it will
be a Double Zigzag. The c-wave should be either 61.8% of wave-a 21 complete in a zone 61.8% of
wave-a taken from the beginning of wave-a. The b-wave must not exceed the highest point of wave-a.
If it does, refer to Irregular Failures. The c-wave must, of course, be Impulsive (5). This pattern can
occur as:
Wave: Any 2,4, a, b
Wave: 5 (of a Terminal Impulse)
Figure 11-8
Wave-C is less than
61.8%ofwave-B
.618 of B
This should be considered
extremely rare
Common
Fi gure 11-9 illustrates the typical shape of a Hat p attern. In a Com mon pattern, all of the waves will
be approximately equal in price (see Figure 11-9).
The Common can occur at virtually anytime in a sequence where the pattern needs to be corrective.
Wave-b should not be more than 100% of wave-a, but must retrace at least 81 % of wave-a and wave-
c must retrace all of wave-b. Wave-c should move slighdy beyond the end of w ave-a, but not by more
than 10 or 20%. It is not a terrifically strong pattern, but it does imply more strength than a Zigzag.
Alternation of time, construction, and complexity are the most important considerations. Wave-b
will, the majority of the time, be the most time-consuming of the three segments and will be more
subdivided (complex) than wave-a. Wave-c must be Impulsive.
1 This pattern can occur in the following places:
Waves: Any 2,4, a, b
Waves: c,d,e of a Horizontal Triangle or
Pan of a rare Running Double Hat.
Figure 11-9
or.
All waves are
approximately equal in
vertical price points
Advanced Progress Label Application 11-11
Double Failure
This describes the infrequent situation where the b-wave fails to retrace more than 81% of wave-a
and the c-wave fails to retrace all of wave-b (see Figure 11-10}. It can generally only take place if the
a-wave is a Double Combination, followed by a strong Zigzag for wave-b. Wave-c would fail to retrace
all of wave-b. Another possibility is that wave-a will be a Triple Combination and the b-wave will be
a Double Zigzag or Combination. This would prevent the c-wave from retracing all of wave-b (reasons
for this were discussed in Chapter 10, Advanced Logic Rules); refer to Figure 11-11 for details.
Frequendy, the a-wave of a Flat will help to create die appearance of a Double Failure (see
Emulation). This usually occurs when the a-wave is a Double Combination pattern completing with
a Horizontal Triangle (study Figure 11-12).
In a general sense, this pattern will resemble a Horizontal Triangle because of the continual exhibition
of contraction. Close attention to price detail is essential in deciding whether you are in a B-Failure or
Horizontal Triangle. In a B-Failure, the c-wave is an Impulse pattern. In a Horizontal Triangle, die c-
wave is a Corrective pattern. Virtually without exception, the a-wave in one of these patterns will be a
Double Zigzag or Double Combination (a pattern concluding with a Non-Limiting Triangle). The c-
wave will generally be 61.8% of wave-a or terminate in a price zone 61.8% of wave-a subtracted from
the beginning of wave-a. Places of acceptable formation;
Wave; Any 2,4
Wave: a (in an Irregular or Triangle pattern)
Wave: b (of a Zigzag, Common, or Elongated pattern)
The first corrective phase of a rare Running Double Flat
Figure 11-10
Figure 11-11
u
"A /--
/
PS
Wave-b is
less than 81%
of Wave-a
Wave-c did not
retrace all of wave-b
Figure 11-12
This pattern is
still considered a
Common Flat
( )
\ Wave-b started here
Not here
Wave-c retraced all of Wave-b
but appears to Jail since it did
a-wave termination
Lowest price of a-wave
H-12 Advanced Progress Label Application
Elongated
An Elongated pattern adheres to all of the general specifications of a Flat pattern with the following
additional criteria:
1. Wave-c must be more than 138.2% of wave-b (preferably, more than 161.8%); see Figure 11-13.
2. Wave-a and wave-b should be similar in price audZgr. time (one of the few times that Alternation
may not have a major impact on these two adjacent waves), while wave-c consumes a significant
amount more of both (refer to Figure 11-14).
Figure 11-13
Figure 11-13 (more complicated version)
Figure 11-14
a b /
m—
= a + b
I Quite often in an elongated
| pattern, the c-wave will con-
| sumethesameamoiintoftime
I as waves a & b combined.
It has been discovered by the author tiiat Elongated patterns take place only under special
circumstances. These patterns (with virtually no exceptions) occur as the entire leg of a Triangle or as
a segment within a leg of a Triangle (refer to Figure 11 -15, top of next page)
The reason these patterns appear ajrnflsj; exclusively in Triangles is due to the way Triangles behave.
During the early stages of a Triangle, market action tends to be very volatile. The market has the
propensity to hug one trend line for a while, then in a jolt of buying or selling, jump to the opposite side
of the formation (at the top of page 11-15, Figure 11-16 illustrates this concept).
Advanced Progress Label Application 11-13
Figure 11-15
Entire segment
of Triangle
The b-Wave is one entire
segment of a Five segment
Horizontal Triangle.
The b-wave is the motion between the two
circled points. It is an Elongated Flat.
The action between the circled points constitutes
an elongated pattern within a single segment of
a Triangle. In other words, the elongation is one
degree lower than the degree of the Triangle.
Elongated Hats are very important, early warning signs of triangular formation. Once you witness
one of these patterns, it is generally wise not to trade until you are sure the Triangle is complete. To form
this pattern, wave-a & b must be similar in price (wave-b must retrace at least 61.8% of wave-a) and will
usually be close in time (orrelated by 61.8%) widi the c-wave much larger in price. Points of occurrence
are as follows:
Wave: 1,3 or 5 of a Terminal Impulse
Wave: a,b,c or d of a Horizontal Triangle
Wave: "e" of an Expanding Horizontal Triangle; it is possible (but not likely) that wave-e
could be Wavej5 of an Expanding Terminal Impulse
Wave: It could be the first corrective phase of a Double Flat which will probably be
the entire leg of a Horizontal Triangle or Terminal Impulse
11-U Advanced Progress Label Application
Figure 11-16
Consolidation near
the lower trendline
Irregular
This is one of the easiest patterns to define and recognize. Some readers may be astounded to read
this, but on a real-time, properly plotted Cash chart, this pattern is not very common. Following are the
parameters which oudine this type of pattern.
Minimum Requirements:
1. Wave-b must be at least 101% of wave-a. (see Figure 11-17)
2. Wave-c must be at least 101% of wave-b. (see Figure 11-18)
Figure 11-17
Wave-b is slightly longer
than wave-a, it must be at
least 101% of wave-a
Length of Wave-a
Figure 11-18
-*-
■ Wave-c is slightly longer than wave-
b, it must be at least 101% of wave-b.
Advanced Progress Label Application 11-15
As the b-wave gets longer (in relation to wave-a), the probabilities dropped dramatically that wave-
c will be longer than wave-b. An Irregular pattern must adhere to the following Rules.
Maximum Limits:
1. The b-wave should not exceed 138.2% of the length of wave-a. If it does, the pattern will
probably not be an Irregular, but an Irregular Failure (see next heading). In other words, wave-
c will not retrace all of wave-b. If the b-wave is more than 138.2% of wave-a, the c-wave
is not likely to retrace all of wave-b; in that case the pattern will have to be called an
Irregular Failure (refer to Figure 11-19)
2. The b-wave in an Irregular Correction should subdivide more dian wave-a (see Figure 11-19).
The b-wave will almost always be a Zigzag (or less likely, a combination of corrections), while wave-
a will usually be some type of Flat. The c-wave must be Impulsive. If wave-c is corrective, you may
be experiencing an Expanding Triangle ox a Contracting Triangle with a large c-wave. This pattern can
be found as:
Wave: Any2,4,a,b
Wave: c,d,e (in a Horizontal Triangle)
Figure 11-19
138.2% of Wave-a
As long as wavc-b does not exceed 123.6% of
wave-a. it is still possible for wave-c to make a
move beyond the end of wave-a. If it is any longer,
the c-wave will have a tough time being bigger than
wave-b (thus moving beyond the end of wave-a).
Irregular Failure
This pattern starts to become very likely when die b-wave exceeds 138.2% of wave-a (see Figure 11-
20). As the b-wave becomes longer, wave-a and wave-c become more similar (see Figure 11-21). This
pattern signals post market-action strength. Wave-b must be larger than wave-a in price. Wave-c must
nor retrace all of wave-b. Wave-c will generally relate to the a-wave (price and time) by equality or the
Fibonacci ratio. This pattern should occur as one of the Progress Labels below:
Wave: 2,4 (before an extended wave)
Wave: b (before an Elongated c-wave of a Hat)
Wave: b (of a Zigzag in which wave-c is at least 161.8% of wave-a)
11-16 Advanced Progress Label Application
Figure 11-20
Wave-b exceeded 138.2% limit
/A- 138.2% of Wave-a
If the b-wave were more than 138.2% of wave-a, then
wave-c should not make a new low. If wave-c does make
a new low, the market is probably forming a Triangle. The
c-wavc will be corrective in nature (: 3), not Impulsive (: 5).
■ Low of Wave-b
Figure 11-21
The c-wave is still
longer in price and
time than wave-a
even though ii did
not exceed the end
of wave-a.
Here, wave-b is so large
(in price relation to wave-
a) that wave-c shortens
even more and starts to
greatly resemble wave-a
in price and time.
Similar in price and time
Running
The most powerful Standard Correction, the Running, imposes very specific requirements on post
market action. It is essential that the movement after a Running correction advances (or declines) quicker
than the pattern immediately before the Running correction (of the same degree). The movement
immediately after a Running Correction should always be the longest segment of the completed Elliott
pattern. Places where Running Corrections can occur:
Wave: 2 (right before an Extended 3rd wave)
Wave: 4 (right before an Extended 5th wave) - consider this rare
Wave: b (right before an Elongated c-wave and in which the whole a-b-c is probably the entire leg
of a Triangle or one of the completed phases of a Complex Correction which is the entire leg
ofaTriangle)
Wave: b (in a Zigzag that is part of a Triangle [of only one or two Degrees higher])
Wave: x (to be considered very unlikely, but could occur right before the longest Corrective group
of a Complex corrective series)
In a Running Correction, wave-b must be the largest wave by far. Wave-a and wave-c will tend
toward equality in price and dme. The b-wave does not have to relate to wave-a but, if it does it will
probably be 261.8% of wave-a (for more detail on Running Correction, refer back to Chapter 5).
Advanced Progress Label Application 11-17
ZigZags
HMMUItlllllllllllllllillllllllllllllll
Unlike Hats, Zigzags do not come in as many variations. Their construction and requirements are
few, but demanding. The two areas of significant consideration for Zigzag patterns are: how long is die
c-wave is in relation to die a-wave; and how much does wave-c subdivide in relation to wave-a? The
following diagrams have been drawn to show how these and other rules (when considered
simultaneously) go to form realistic Zigzag patterns (see Figure 11-22).
Wave-a
Wave-a must be an Impulse structure and should not be retraced by wave-b more than 61.8%. If you
are certain that the a-wave is Impulsive, but me b-wave retraces more than 61.8%, then mat retracement
will only be me a-wave (of one smaller degree) of wave-B in which the c-wave (of wave-B) will fail. If
part of me B-wave retraces 81 % or more of wave-a, men you should recheck your analysis of wave-a.
It will most likely fall under the Missing Wave Rule in which wave-a (that at a glance only looked
Impulsive) is better interpreted as a Corrective Double Zigzag or Double Combination.
Figure 11-22
Here wave-c is 61.8% of wave-a.
Here, wave-a & c are equal
in price and time. Notice
wave-b is different in
price, time and complexity
from wave-a, providing
great alternation.
/
1.00
Here, wave-c is 161.8% of wave-a
1.00
1.618
Here, Wave-c develops at
a Level-1 complexity,
Wave-a is Level-0.
11-18 Advanced Progress Label Application
Wave-b
Wave-b absolutely must be corrective (3) and should not retrace more than 61.8% of wave-a when
measured from its terminus. It should not be a Running Correction unless the Zigzag, of which the b-
wave is a part, is in a Triangle. If what you think is wave-b turns out to be a Running Correction, most
likely it is wave-2 of an Impulse wave. Wave-b can be almost any other Corrective pattern in a Zigzag
except a Double or Triple Zigzag or a Running Double or Triple Flat and their Combinations. If you see
one of those patterns forming after an Impulsive a-wave (which is in a Zigzag), then the Complex
movement will only be part of the b-wave correction, not die whole correction.
Wave-c
When aZigzag (of which wave-c is a part) is not part of a Triangle (of only one or two higher degrees),
itsprice length shouldfall between 61.8% and 161.8%of wave-a. IfthewholeZigzagispartofaTriangle
(of only one or two higher degrees), me c-wave can exceed those limits, but is not required to do so. If
the c-wave exceeds those limits, it is one of the better indications of Triangular formation (of one or two
higher degrees).
Triangles
■^■anmniiiiiiiiiiiiiiiiiiiiiiiniiiiii
After years of experience with real-time market analysis and trading, it was clear that Elliott's rules
concerning Triangles were not comprehensive enough to describe all market consolidation phases
which occurred between converging trendlines. It became evident there needed to be a subdivision of
the two general Triangular categories (Contracting and Expanding). The first sub-category I call
Limiting Triangles. These make up the well known types that Elliott described: b-waves and 4th-waves.
As their name implies, these Triangles have a limiting effect on post-Triangular market action.
The other Triangle sub-category I designated Non-Limiting. These make up a relatively unknown
type which occur in unusual places in a wave sequence. Non-limiting Triangles impose only minorpost
market action limitations. The formation of these Triangles is slightly different from the Limiting type.
Close attention to detail is necessary to properly detect which type of Triangle is forming. Both types
will be discussed during the next few pages.
All of the rules which follow are in reference to Triangles. Learning to decipher polywave activity
is at die root of the entire Theory, so most of the rules were designed wim polywaves in mind, but the
rules can be carried intothe multi- and macrowave arenas.
Note: Under no circumstances is wave-d die largest wave of any Triangle partem. Under no
circumstances can three legs (of the same degree) within a Triangle be equal in price (give or take 5%).
In Expanding Triangles, only four of a possible five retracements (including the pattern of the same
degree just before die Triangle started) needs to be 100% or more; one of the five may not be completely
retraced. Never can any leg (other than wave-e) of a Contracting Triangle be, itself, a Contracting
Triangle. When mentioned in later text that an a, b, c, ord-wave can be any Corrective pattern, it means
any Corrective pattern excSBi a Triangle (unless otherwise mentioned).
Advanced Progress Label Application 11-19
Contracting Triangles
Contracting Triangles are the most common Triangular formation. They come in two major
categories, Limiting and Non-Limiting, with each category breaking down into several varieties.
I. Limiting
It is crucial, if you want to master Elliott, that you understand the difference between the general
make-up of a Limiting and Non-Limiting Triangle. All Limiting Triangles have a very similar
construction. One of the mostimportant characteristics is that wave-e, the end of the Triangle, concludes
well before the apex point of the Triangle is reached (see Figure 11-23).
Another element, which I have discovered is characteristic of Limiting Triangles, deals with time.
The apex of the Triangle should complete in a time zone equal to 20-40% of the time consumed by the
Triangle added to the end of the e-wave (refer to Figure 11-24).
The apex of the Triangle has the greatest tendency to complete around the 38.2% [.6182 (squared)]
rime zone. As mentioned earlier, after a Triangle is complete, it produces what is called a "thrust." The
extent of the thrust is the key factor in the proper categorization of Triangles. In Limiting Triangles, the
thrust is usually limited to the widest leg of the Triangle (+ or - 25%). Only in rare cases, or when the
Figure 11-23
Apex of Triangle
End of Triangle
Figure 11-24
100% time lenglh of the Triangle
Aks will usually terminate
in a time zone around 38.2%
of the time consumed by
wave-a through wave-e
added to the end of wave-e.
| Time until Apex point
11-20 Advanced Progress Label Application
Figure 11-25
Longest wave
The same technique would apply if the a-wave
or the c-wave were the longest wave.
-61.8% of Wave-b,
centered in Wave-b's range
To be considered a Normal Triangle, the E-wave
should finish inazone61.8% of the longest wave of the
Triangle, centered in the large wave's price range.
Triangle falls into the "abnormal" classification, can the "thrust" exceed the above limits. A state of
abnormality occurs when the Triangle fails to follow the parameters discussed in Figure 11-25. Rare
cases occur if the Triangle is the last b-wave or 4th-wave before afinal major top or bottom in the market.
Contracting LimitingTriangles take place in only two Progress Label positions; as wave-4 or wave-
b. These are the best known types and are the ones which Elliott discovered. There are other types of
Triangles which Elliott did not discover. Immediately following are the different types of Contracting,
Limiting Triangles. Afterwards, we will proceed into the less known worlds of Expanding and Non-
Ljrnitiiuj Triangles.
a. Horizontal
Each leg of this type of Triangle should be at least 38.2% of the previous leg (excluding wave-e).
Wave-bean be no more than 261.8% of wave-a and wave-ccan be no more than 161.8% of wave-b.
Wave-d must be shorter than wave-c and wave-e must be shorter than wave-d.
Wave-a
Wave-a does not have to be the largest segment (price-wise), but it should definitely not be the
smallest wave of the pattern. If wave-a is not the largest wave, wave-b almost certainly will be. The a-
wave should not be less than 50% of wave-b. If wave-a is smaller than wave-b, wave-a will most likely
be a type of Flat and wave-b a Zigzag or if wave-a is a simple Zigzag, wave-b will most likely be a
complex Corrective pattern (Double Zigzag or Combination, Running Double Flat - a Triple Zigzag or
Combination is not very likely to occur in wave-b of this type of Triangle).
Wave-b
If wave-b is smaller in price than wave-a, then all the other patterns must be smaller than the previous
segment (from left to right). If wave-b is bigger than wave-a, the chances are very small (but do exist)
that wave-c may be slightly larger than wave-b and still maintain the Contracting Triangle formation.
If the c-wave is larger than wave-b, it is mandatory that waved be smaller than wave-c or else you are
Advanced Progress Label Applicatiort 11-21
entering the Expanding Triangle realm and should move to that section. In other words, in this type of
Triangle, once one segment is smaller in price than the last, all the rest must be smaller than the previous.
If this is not the case, then the market is not in a Contracting Horizontal Triangle. Maybe it is in some
other type of Triangle. Note: Wave-b should not be less than 38.2% or more than 261.8% of wave-a.
There may be exceptions to the foregoing guidelines, but they are rare, so be careful about ignoring them.
Wave-c
Wave-c is the last wave that has a chance (in a Contracting Horizontal Limiting Triangle) to be larger
in price than the previous wave (wave-b). It rarely happens, but it is not impossible. If wave-c is the
biggest price move, the trendline will be drawn across wave-c & e.
Wave-d
Wave-d must be shorter than wave-c. It should be at least 38.2% of wave-c. It may take more time
than wave-c, but should not be of greater complexity level (the same complexity level or one lower level,
only, is acceptable).
Wave-e
Wave-e must be shorter in price man wave-d. It can be shorter or longer in time than wave-d, but
should not be the longest tune Correction in the pattern.
b. Irregular
The Irregular Triangle is characterized by the b-wave of the pattern, which must be longer (price-
wise) than wave-a. After wave-b, all waves are continuously smaller until the Triangle is over.
Wave-a
With few exceptions, the a-wave should be smallerin time than the brwave. The b-wave should not
be more than 161.8% of wave-a (price-wise). Wave-c musfmove back into the price "zone" of wave-
fa enough so that the shorter e-wave can also finish in the price zone of wave-b. The a-wave can be any
corrective pattern except a Triple Zigzag or an Elongated Flat. To avoid confusion, I will once again
mention that wave a,b,c, ord of a Triangle can never, itself, be a Triangle. The e-wave is the only segment
of a Triangle allowed to form into a smaller Triangle.
Wave-b
The b-wave must be longer than wave-a. It will probably not be much more than 161.8% of wave-
a and must not be more than 261.8% of wave-a. If wave-adoes not subdivide, the b-wave will most likely
be a Zigzag. If wave-a subdivides into a Zigzag, then wave-b will probably be a Double Zigzag. If wave-
1 1-22 Advanced Progress label Application
a was a Flat, wave-b will probably be a single Zigzag. The b-wave should not be more than 61.8% of
the previous Impulse wave. The b-wave can be any Flat or Zigzag pattern. It can be any Complex
Correction such as a Double or Triple or a Combination.
Wave-c
Wave-c must be shorter than wave-b, but must retrace at least 38.2% of wave-b. The lowest point
of wave-c will probably fall back into the price zone of wave-a. If wave-b was a Double Zigzag, wave-
c should be a Zigzag or a Flat with an Elongated c-wave. If wave-b was a Zigzag, then wave-c will
probably be a Hat (of any type) or a monowave.
Wave-d
Wave-d must be shorter than wave-c. It may consume more time than wave-c. It must retrace at least
38.2% of wave-c. The d-wave can be any Corrective pattern as long as it Alternates with wave-c.
Wave-e
The e-wave must be smaller than wave-d and the probabilities greatly favor that the e-wave will be
the smallest wave (price wise) in the Triangle. It does not have to retrace the d-wave by any specific
amount, but it must move in the opposite direction of the d-wave by at least one tick and must terminate
in the price zone of waved.
Unlike the other four segments in the Triangle (waves a,b,c,d), the e-wave can, itself, be a Triangle,
but, e-wave Triangles are far more common at the end of Non-limiting Triangles than at the end of
Limiting Triangles. The terminal point of thee-wave will probably fall at an important Fibonacci point
to the pattern of one larger degree. If the pattern of one larger degree is a Zigzag (which means the
Triangle is a B-wave), then the e-wave terminus will probably be at 61.8% of the entire move from the
start of the Zigzag to its end added to the start of the Zigzag. If the larger pattern is a Flat, the e-wave
terminus will probably be at 61.8% of wave-a of the Flat. If the Triangle is the 4th wave of an Impulse
pattern, the e-wave terminus will likely occur at 38.2% or 61.8% of the a-wave of the Triangle.
c. Running
The Running Triangle is detected from the b & d-wave action. Wave-b will be longer than wave-
a and waved will be longer than wave-c. The thrust out of this type of Triangle will be more than normal.
It should be at least 161.8%of the widest segment of the Triangle, but should not exceed 261.8%. When
this type of Triangle occurs, frequently it signals that the end of a significant advance or decline is about
to take place. If the thrust out of the Triangle were more than 200%, then you can be relatively sure that
a significant top or bottom will take place.
Advanced Progress Label Application 11-23
Wave-a
Wave-a should be no less than 38.2% of wave-b. Wave-a will probably be a monowave or a Flat.
If it is a Zigzag, then wave-b will need to be a Double (and maybe a Triple) Zigzag. In this type of
Triangle, wave-a cannot be a Double or Triple Zigzag, a Triangle, or a Hat with an Elongated c-wave.
The most common type of Correction for wave-a would be a monowave or any Flat (excluding Elongated
Hats). Wave-a must not retrace more than 61.8% of the previous pattern (if an Impulse wave preceded
the Triangle). To do so would indicate weakness and would be a contradiction of the strength implied
by the Running Triangle. Normally, the a-wave should not retrace much more than 38.2% of the
previous Impulse pattern (if one is present).
Wave-b
If there is an Impulsive a-wave before a Running b-wave Triangle, wave-b should not be more than
261.8% of wave-a. Unless all the segments of the Triangle are monowaves, wave-b should be a Zigzag,
a Double Zigzag, or on a rare occasion, a Triple Zigzag. Wave-b must be the largest segment of the
Triangle, so obviously wave-c cannot retrace all of wave-b. If wave-a is a Hat, wave-b will probably
take less time than wave-a. If wave-a is anything else (including a monowave), wave-b should consume
more time.
Wave-c
Wave-c must be shorter than wave-b. Wave-c cannot be more complicated than a Double Zigzag or
Double Combination. It cannot be a Triple Zigzag. The probabilities are very high that the terminus
of wave-c will fall back into the price zone covered by wave-a.
Wave-d
Wave-d must be larger (in price) than wave-c. This, of course, means that it will exceed the terminus
of wave-b. Wave-d should not be a Triple Zigzag. It could be virtually any other corrective pattern.
Wave-d must not be completely retraced by wave-e. Due to the strong move that should occur
immediately after wave-e, the terminus of wave-e should not be at a point which would put it at more
than a 61.8% retracement of wave-d. If part of wave-e retraces more than 61.8% of waved, the e-wave
will develop into a Hat with aC-Fail ure or on a rare occasion, the e-wave could be a Contracting Triangle
as long as it did not congest direcdy into the apex point of the converging lines (see the discussion on
the construction of Limiting Horizontal Triangles).
Wave-e
Wave-e must be smaller than wave-d in price. It could take a longer period of time than wave-d,
especially if it were a Triangle, as long as it did not correct into the apex of the larger Triangle (see the
construction parameters of a Horizontal Triangle). If the Running Triangle created a larger b-wave, it
would be very common for the terminus of wave-e to occur at a 61.8% or 38.2% position to the entire
larger Corrective advance (Figure 11-26, top of next page).
11-24 Advanced Progress Label Application
Figure 11-26
Notice the thrust is larger than any
segment of the Triangle. The thrust
is approximately 161.8% of the
widest wave of the B-wave
Triangle. This should be considered
normal for a Running Triangle.
II. Non-Limiting Triangles
Someof my most importantdiscoveries concern Non-Limiting Triangles (Triangles that fall outside
of the 4th & b-wave realm). Understanding how a Non-Limiting forms is crucial to the proper analysis
of complex Corrections. In addition, it virtually eliminates being tricked into thinking a Triangle, that
is part of a Double or Triple Combination, is a 4th or b-wave. Non-Limiting Triangles occur at the end
of complex Corrections (Double and Triple Combinations of all types), as X-waves, Wave-e of a larger
Triangle, or as the 5th wave of a Terminal impulse pattern. The most reliable indication of a Non-
Limiting Triangle occurs when the market contracts right into the apex of the converging trendlines (see
Figure 11-27). This condition is best met when the e-wave, of the larger Non-Limiting Triangle, is also
a Non-Limiting Triangle. As a general rule, Non-Limiting Triangles are easier to spot than Limiting
Triangles. This is due to their tendency to consolidate longer, letting everyone "know" a Triangle is
forming. It is then up to you to decide if the break out will be approximately equal to or greater than the
widest wave of the Triangle and whether the thrust will be up or down.
Figure 11-27
The "thrust" will be bigger than
the width of the Triangle. The
potential after one of these
Triangles is basically unlimited.
Triangle
Advanced Progress label Application 11-25
Due to Elliott's original guidelines, many students get caught incorrectly positioned in the market
when a Non-Limiting Triangle occurs. Elliott never wrote about Triangle's which could occur in any
other position except the b-wave and 4th-wave Progress Label position. This leaves many practitioners
in a dangerous situation. They assume all Triangles are 4th-waves or b-waves. Remember, b-waves and
4th-waves do not provide thrusts of much greater distance man the widest segment of the triangle. Non-
Limiting Triangles are not bound to that Rule. For this reason, a person trying to pick the end of the thrust,
out of what is assumed to be a b-wave or 4th-wave Triangle, may get caught in a persistent up or down
move if the Triangle actually was a Non-Limiting Triangle.
All the above rules which apply to Limiting Triangles under each specific category also apply to Non-
Limiting Triangles of the same type. For example, each leg in an Irregular Limiting would follow the
same rules as those outlined for Irregular Non-Limiting Triangles. There are only a few additional
behavior characteristics which need to be mentioned; they are listed by Progress Labels.
Wave-a
In these patterns, wave-a is almost always the most violent segment of the Triangle (i.e., it coven the
most price distance in the shortest period of time). Usually, the a-wave will be the most violent market
action to have occurred for quite sometime. The reason for this appears to be that these Triangles retrace
Corrective patterns, not Impulsive patterns. A severe and violent retracement of a Correction would be
more acceptable and logical than the same event after an Impulse pattern. If wave-a is violent, then wave-
b should break down into a much more complex and slower developing wave.
Wave-e
The last segment of a Non-Limiting Triangle, wave-e, has a strong tendency to be a Non-Limiting
Triangle itself. This creates a Triangle at the end of a larger Triangle. That is the best way for the market
to converge right into the apex of the larger Triangle's contracting trendlines.
Of the three types of Non-Limiting Triangles, the Horizontal is the one you will most often see in
real-time market action. For a more complete explanation of how Triangles should look and behave pre-
and post- thrust, refer to all sections that mention Triangles in Chapters 5 & 10.
NOTE: Any Non-Limiting Triangle (except when it is an x-wave) must terminate a larger corrective
phase. If you spot one in any position (other than me x-wave position), you can compact the entire larger
moveintoasingle '3'.
Some common and uncommon places of Non-Limiting Triangular occurrences are:
1. Wave-e of a Horizontal Triangle (return to the previous Figure 11-27).
2. The last corrective phase of a Double or Triple Three (see Figure 11 -28).
3. The last corrective phase of a Running Double Three, one of me trickiest and most
common points of occurrence (see Figure 11 -29).
4. The last corrective phase of a Double or Triple Combination (refer to Figure 11-30).
5. The 5th wave of a Terminal Impulse (study Figure 11-31).
6. The x-wave of a complex Correction (see Figure 11-32).
If you did not notice, the above statements for numbers 1-5 indicate points of Triangular occurrence that
terminate a pattern. Number 6 lists the only time a Non-Limiting Triangle can occur in the middle of
a move.
11-26 A dvanced Progress Label Application
Figure 11-28
Triple Three
Figure 11-29
Intervening
x-wave
Double Three
Running Correction
/ Powerful Impulse Wave*
/ will follow this formation
Preceding /
Impulse /
Wave /
/
I
/
/
/
/
/
First "3"
Correction
Non-Limiting
Contracting Triangle at the
end of a Double Three
Running correction
Advanced Progress Label Application 11-27
Figure 11-30
Double Combination
Non-Limiting Contracting
Horizontal Triangle
Figure 11-30 continued
Triple Combination
d \
b \
11-18 Advanced Progress Label Application
Figure 11-31
Terminal Impulse
Double ZigZag
(1)
5th Wave
Horizontal Triangle
Break of the 2-4 trcndline does not negate this count,
it enhances it. Remember, Triangles create 'false'
breaks of the 2-4,0-2,0-B, or 0-X trendline.
Notice wave-4 drops below the top of wave-1
(overlap). Waves 2 & 4 alternate from multiple
standpoints. Waves 1,3, & 5 also alternate.
Figure 11-32
Double Zigzag
A Non-Limiting Triangle in the X-
wave position is the only time this
type of Triangle does not terminate a
larger Corrective pattern. It happens
right in ihc middle of the pattern.
Expanding Triangles
Of all the wave patterns under Elliott's Theory, the Expanding Triangle creates the most treacherous
trading environment Much worse than its non-trending mirror image (the Contracting Triangle), this
pattern continually creates the illusion the market is breaking out. This is quickly met with a reversal
and then the break of asupport orresistance level on the other side of the trading range. The phrase "whip-
sawed" was probably created by a trader experiencing this formation.
Toimproperly diagnose this pattern can cause severe financial "pain." Unfortunately, there is no way
to anticipate the formation of one of these patterns. On the other hand, strict and proper application of
all the rules and techniques discussed in this book should keep you out of the market since you will not
be able to decipher what is taking place. Lack of a clear pattern formation is the ultimate "no action"
indicator.
From the very few Expanding Triangles I have witnessed over the past eight years, a clear, specific
consensus of their nature has been difficult to distill. Instead of listing their behavior on a wave-by-wave
basis under each variation, more general descriptions have been settled upon.
Before moving on, the major formational parameters of all Expanding Triangles need to be covered
so you can check your wave group against these "standard" guidebnes to see if your assumption is on
the right track.
1. Either wave-a or wave-b will be the smallest segment of the Triangle.
2. The e-wave has a tendency to "blow off," being much longer in price
and time than the other waves.
Advanced Progress Label Application 11-29
3. In the same way (and for the same reasons) a Contracting Triangle can occur as the e-wave of
a larger Contracting Triangle, an Expanding Triangle can take place as the e-wave of a larger
Expanding Triangle.
4. As a general statement, watch for a progression from simple to complex (on a time and
subdivision scale) as each larger wave of the Expanding Triangle unfolds.
5. The pattern after the Triangle (wave-c or wave-5) should not completely retrace the e-wave.
6. One of the strangest aspects of Expanding Triangles appears to be their lack of numerous
Fibonacci relationships typical of Contracting Triangles. Generally, only one relationship can
be found, and you usually have to really search to find it. Included under each heading is the one
relationship which seems to normally occur in the pattern listed. If there is no relationship
indicated, it is because I have not been able to identify any present in the ones that were studied.
Believe it or not, lack of Fibonacci relationships can be a valuable test of the authenticity of an
Expanding Triangle. It is very difficult for five adjacent waves to form in such a way as not to
have aax (or even only one) Fibonacci relationships. From the information available, it seems
correct to say if there is more than one relationship present in a group of Expanding monowaves
(or higher), a pattern other than an Expanding Triangle is probably taking place.
7. Expanding Triangles cannot take place immediately before any powerful pattern such as a 1 st,
3rd or 5th wave extension, or an Elongated c-wave. They cannot terminate Double or Triple or
Combination Running Three Corrections. It also cannot be the b-wave of a Zigzag, and will not
likely occur as the x-wave of any pattern.
8. In order to draw the trendlines to view the pattern correctly, the typical b-d trendline should be
employed, with the opposing trendline always drawn across wave-a and wave-c.
I. Limiting
The Expanding Limiting Triangle can be in the 4th gr b-wave position. If it is a b-wave, it can only
be part of a Flat. This Triangle as the b-wave of a Zigzag, the x-wave of a Complex Correction, or the
b-wave of alarger Triangle appears to be impossible. Of the two Progress Label possibilities, the b-wave
Expanding Triangle seems to be far more common than the 4th wave of the same makeup.
The Triangle's apex point, created by the diverging trendlines. occurs backwards in time. Its position,
in relation to the whole Triangle, is important in the verification of it's Limiting status. This is how the
calculations should be done:
1. Measure the entire time duration of the Expanding Triangle from the beginning of wave-a to the
end of wave-e.
2. Take 20% of that amount and add it to the end of wave-a going backwards in time. If the apex
point occurs before that time period, the Triangle should be considered "limiting" in its
implications. In other words, it will be a b-wave or 4th wave pattern, and the "thrust" out of the
Triangle will be very limited:;.-It should be less than the length of the e-wave.
The following are general formation rules which should be present in all variations of Limiting
Triangles:
1. Waves-a & e will usually relate by 161.8% (wave-e, of course, the larger of the two).
2. Either wave-a or wave-b will be the shortest leg of the Triangle.
3. Only wave-b or wave-d can "Fail" to exceed the end of the previous wave.
11-30 Advanced Progress Label Application
a. Horizontal
These are the distinctive features which make up an Expanding Limiting Horizontal Triangle
pattern:
1. Wave-a is the smallest segment or the Triangle.
2. Each wave, after wave-a, is slightly larger than the previous, so there is no "failure".
3. The e-wave should be the most violent, complex and time-consuming pattern of the group.
4. The only Fibonacci relationship that appears to be reliable in this variation is between wave-a and
wave-e. The e-wave tends to be 161.8% of wave-a. If the e-wave is really explosive, it might
relate by 261.8% to wave-a.
b. Irregular
An Irregular Expanding Triangle is the most common Expanding Triangle variation. It is
differentiated by wave-b "failing" to move beyond the end of wave-a. If the b-wave fails, waves-a & e will likely
relate by 161.8%.
c. Running
This is the second most likely type of Expanding Limiting Triangle. It is characterized by wave-d
"failing" to exceed the termination of wave-c. If the d-wave "fails," the pattern will have a slightly
skewed upward or downward appearance; also, waves-a & e will probably relate by 261.8%.
[For diagrams of all the above Expanding Triangles, see Chapter 5, page 32.]
II. Non-Limiting
Non-Limiting Expanding Triangles should basically follow the same variational parameters
of the Limiting Expanding Triangle. There are only a few differences which need to be covered:
1. The chances are good in a Non-Limiting Triangle that no Fibonacci relationships will be present
between the various segments. If there is a relationship, it will probably be between wave-a &
e. Wave-e would be 261.8% of wave-a.
2. The apex point of the Expanding Non-Limiting Triangle (which occurs backwards in time and
can only be detected after the Triangle is complete) should be much closer to the start of the Non-
Limiting than of the Limiting Triangle. Listed below are the calculations that need to be
preformed to test for Non-Limiting status:
a. Measure the entire time duration of the Expanding Triangle from the beginning of wave-a to
the end of wave-e. Calculate 20% of that amount.
b. Add that time amount to the a-wave (going backward in time). If the apex point falls within
that time zone (between 20% and the start of wave-a), the Triangle is Non-Limiting.
Advanced Progress Label Application 11-31
12-1
Advanced Neely Extensions
Channeling (unique applications) 12_i
Wave-2 ,2_i
Detection of a Running Double Three 12-2
Wave-4
Wave-B
12-3
Triangular Activity 12«
Terminal Activity
Real 2-4 Trendline
12-10
12-16
12-8
12-8
Impuls* Identification with Channeling ^n
i sf Wave Extension 12-10
3 rdWave Extension 12-10
5fft WaveExtension 12-10
Double Extension 12-10
Corrections Identification with Channeling j 240
/"/aw
Triangles l2.1?
Complex Patterns 12-18
Double & Triple Zigzags 12-18
Double & Triple Combinations (which start with Zigzags) 12-18
Double & Triple Flals 12-20
Double & Triple Combinations (which start with Flals) 12-20
Identifying the Completion of Waves ]2_22
Advanced Fibonacci Relationships 12-22
Internal 12-22
Impulse Patterns 12-23
1st Wave Extension 12-23
3rd Wave Extension 12-23
5th Wave Extension 12-24
Corrections 12-25
Wave-2 & Wave-4 12-25
Wave-a & Wave-b 12-25
Wave-c [n Zigzags 12-26
Wave-c In Flats 12-26
Wave-c In Triangles 12-28
Wave-d 12-28
Wave-e 12-28
KxfcWlRj 12-29
Impulsions 12-30
1st WaveExtension 12-30
3rd Wave Extension 12-31
. 5th Wave Extension ' ..":.■--: . i~.-'~ - .'■ "V;:-.- '.'.-... -.. ;.l..„ —.... 12-31
Corrections 12-33
Double & Triple Zigzags and Combinations 12-33
Double & Triple FlatsandCombinations 12-34
Missing Waves 12-34
Where and when do they occur? 12-35
How do they occur? 12-35
Why do they occur? 12-37
Which patterns are susceptible? 12-37
Emnlaiion 12-38
Double Failure 12-39
Double Flats 12-40
Double & Triple Zigzags \ 240
1st WaveExtension 1243
5th WaveExtension 1243
Expansion of Possibilities 1243
Localized Progress Label Changes 12-45
Channeling (unique applications)
E11!III11!|||I1IIIIIIII!IIIIIIIIIIIIIIN I I
The importance of Channeling in the decision process is grossly misunderstood or ignored by the
majority. It seems that most analysts pay little or no attention to Channeling or treat it as if it were aminor
tool of the Wave Theory. Channeling ranks among the top, essential considerations of pattern
formation. Frequently, from a Channeling standpoint alone, it is possible to decide whether a move is
Impulsive or Corrective. It is critical in the confirmation of when a move is finished or is about to finish.
It is extremely helpful in deciding what type of pattern the market is forming and which segment of an
Impulse pattern is likely to be the Extended wave. It is essential in the detection of the end of wave-2
and wave-4. Proper use of Channeling can virtually guarantee when the market is creating a Terminal
Impulse wave, sometimes well in advance. It can provide reliable clues to when the market is
experiencing Triangular activity. From the other side, market action can dictate when an assumed 2-4
or 0-B trendline is real, thus helping to substantiate your interpretations. In Chapter 5, "Central
Considerations," some Channeling ideas were covered for waves-2 & 4 of an Impulse pattern. When
Channeling an Impulse wave there are additional considerations, those will now be discussed.
Wave-2
If you have detected an Impulsive polywave (or higher) and feel it might be wave-1 of a larger
Impulse pattern, the following Channeling rules can be employed (in Figure 12-1, we are assuming that
wave-1 is trending upward). After the market has formed a corrective polywave in the opposite direction
of wave-1 and has turned back up (Figure 12-1, diagram A), draw a line frgrn point "0" across the lowest
point of die downmove which is assumed to be wave-2 (diagram B). As long as the "0-2" trendline is
not broken, you can assume wave-2 is over and that it completed right at the point the trendline touched
the decline.
A dvtmced Neely Extensions 12-1
Upturn
Diagram A
Assumed start of Wave-3
Trendline touchpoint, the
assumed end of Wave-2
Diagram B
If the trendline is broken before the supposed
3rd-wave is at least 61.8% of wave-1, or the
second decline breaks back below the top of wave-
1 at the same time the trendline is broken, then you
can be confident wave-2 is still in progress
(Diagram C). Why? If an advance, which is moving
away from wave-2, does not have the strength to
stay above the "original" 0-2 trendline, then it is
not Impulsive in nature and cannot be part of
Impulse wave-3. Once wave-3 is complete, it is
allowable for the 4th-wave to break the 0-2
trendline, but not necessary. All previous
discussions on proper Impulse wave formation must also
be adhered to.
Second declining phase
c
(2)
Diagram C
"0" Relabled
Wave-a New wave-2
Detection of a Running Double Three (a 2nd wave pattern)
After the fact, a Running Double Three does not significantly affect the overall interpretation of an
Impulse pattern, .gurhig theff formation, ify
miss the big move which takes place after a Running Double Three concludes. A Running Double Three
is not a difficult pattern to detect. The problem appears to be that most people think Running Corrections
do not happen very often. In my experience, Running corrections happenquite often (in Impulsions) and
are distinctly different from the (l)-(2), 1-2, i-ii, etc., series for which they are frequently mistaken;
channeling is the key to recognizing these Complex formations.
Using the same idea presented in the "wave-2" section, no part of wave-3 should break a true. 0-2
trendline. If the advance, after what you think is wave-2, is followed by a corrective phase which breaks
the 0-2 trendline and the advance was not substantial enough to be wave-3, or the advance is actually a
corrective rally, the market is experiencing a Running Double Three (see Figure 12-2).
Another important reason this could not be interpreted as a 1,2,3,4, with the 5th to follow is the lack
of Alternation between the assumed 2nd and 4fh-wave.
12-2 Advanced Neely Extensions
Incorrect Labeling
Correct Labeling
The break of the "0"- (2)
trendline before wave-(3)
was complete indicates
the advance was really
corrective. The advance
couldnothavebeenwave-
(3) after an Impulsive
wave-(l)
Figure 12-2
4<
Both downward corrective patterns
are similar, creating a lack of
alternation between waves-2 & 4. Therefore,
this interpreiation is inappropriate.
Wave-4
The illustrations in Figure 12-3 depict the best known type of Elliott trendline, the 2-4 trendline.
Similar in concept to the 0-2 trendline, no part of wave-3 or wave-5 should break the 2-4 trendline (see
diagram A) unless the 5fh-wave is a Terminal pattern.
Once the 5th-wave is complete, the market should immediately (within the time-period consumed
by wave-5 or less) break the 2-4 trendline and retrace most or all of wave-5. Diagram B illustrates what
that would look like. If the market does not meet these requirements, the 2-4 trendline is drawn
incorrectly (meaning wave-2 and/or wave-4 are not in the position you assumed) or the 5th is developing
into a Terminal pattern (see Diagram C).
If the assumed 2-4 trendline is broken before the market exceeds the end of wave-3, and a violent
reaction does not immediately and significantly move the market away from the end of the last move,
the 4th-wave is still developing (see illustration 12-4, Diagram A). If the 2-4 trendlinei s violently broken
before wave-3's terminus is exceeded, then a 5th-wave failure is indicated (see Diagram B). For the 5th
wave Failure to be proven, the entire Impulse pattern must be completely retraced faster than it took to
form. Afterward, the market can drift awhile or continue on its course, away from the 5th wave failure.
To exceed the end of the 5th-wave Failure the market would need to consume at least twice die time taken
by the entire Impulse pattern (1-5); usually, much more time is be required before a new high (or low
in a downtrend) takes place.
Advanced Neefy Extensions 12-3
Figure 12-3
Diagram A
If this is Wave-5, no pan of it should break the
2-4 trendline. Once the 5th wave is over, the
market should quickly break the 2-4 trendline.
Assumed Wave-
2 and Wave-4
Diagram B
This is quick and violent enough
to indicate Wave-5 is complete.
Last high
Progress label
"5" Incorrect
Diagram C
Above Wave-3
This break is not
violent or severe enough
to indicate the last
high was Wave-5.
12-4 Advanced Neely Extensions
Figure 12-4a
Incorrect
Assumed 5th-wave
Failure
Break of trendline is not "eventful"
enough. A complete retracement of die
entire Impulse pattern in less time than
it look to form would be required to
indicate a 5th wave failure had occurred.
"0"
■ Minimum target after 5th-wave Failure
Correct
Figure 12-4b
Below die high of Wave-3
Complete retracement of the last
impulse pattern "of one larger degree"
wiihm a time period less than that
taken by the Impulse pattern proved
the existence of the 5th wave failure.
From here the market could bounceandrecover
to near the highs, but should not make a move
above the 5th wave failure for at least double the
period of the whole previous Impulse pattern
(i.e., waves 1-5).
Advanced Neeiy Extensions 12-5
Figure 12-5
Wave-B
The end of Wave-b is found in a similarfashion to wave-2, with the small difference that the Impulse
wave following wave-b (i.e., wave-c) will hardly ever be more than 161.8% of wave-a and the b-wave
can sometimes be a Triangle. To better understand this concept, look study Figure 12-5.
If wave-b is a Triangle, there are two ways in which the pattern will channel. In Diagram A, the "0-
B" trendline is actually drawn across the c-wave of the Triangle, not the e-wave. To draw the trendline
across wave-e would create a break of the trendline by wave-c, an unacceptable situation.
Frequendy, if wave-b is a Triangle, after the "0-B1 trendline has been drawn across the c-wave of the
Triangle, the e-wave will temporarily break that trendline and then reverse (Diagram B). This creates
what Elliott called a "false" break. This "false" break should be very short-lived (relatively speaking)
and the e-wave must not exceed the end of wave-c of the Triangle. After this "false" break, you may
redraw the trendline, but it is not necessary. The larger (c)-wave will not break the 0-B trendline until
it is complete (unless the c-wave becomes a Terminal pattern).
Triangular Activity
Through multiple observations, it is often possible to realize that a Triangle in forming even during
its early stages of development, sometimes Triangles are evident almost immediately after wave-a
completes. A few of these observations have already been discussed. In the paragraphs to follow,
additional techniques to anticipate triangular formations will be covered.
Let us assume the market is in a Zigzag rally and you have drawn what you believe to be a 0-B
trendline (Figure 12-6). The market starts to advance, but then turns down and breaks the trendline before
the minimum price and time requirements for wave-c have been met. If the breakdown does not exceed
the end of the last touch point of the trendline (in this case, what you thought was the end of wave-
b) and the market turns around again, this indicates triangular development (Figure 12-7). If the
market creates a second 'false' break, a Triangle is virtually guaranteed (Figure 12-8).
The patterns in a Triangle frequently act as if relevant, market-created trendlines were non-existent.
The corrections within the Triangle break these "trendlines" with the most non-violent, casualness
12-6 Advanced Neely Extensions
(Figure. 12-9). This is another important 'early warning signal' of triangular development. A casual,
meandering break of an established trendline does not assure a b-wave triangle is forming, but it does
virtually guarantee that some type of Triangle of one degree or another is taking place.
Figure 12-6
Begins to advance, so yon
draw in die 0-B trendline
The price behavior
depicted on this page is
typical of that
demonstrated by triangles.
Figure 12-7
Higher price than
last touchpoint
False Break
Last touch
point of
trendline
Figure 12-8
Second "False"
break; the triangle is
virtually guaranteed
Advanced Neely Extensions 12-7
Figure 12-9
This "market-eslablished" trendline
was broken as if it did not exist and
was of no particular importance, a
sign of triangular formation.
* Points the market price action
created which "made" the trendline.
Terminal Activity
When using trendlines, the detection of Terminal Impulse activity is very similar to that used in the
detection of Triangular behavior. Figure 12-10, Diagram A, shows what usually happens when a
Terminal is forming. Observe the break of the 2-4 trendline and notice how die marketreacted to it That
is a perfect example of a "non-eventful" trendline break. Notice in this example which wave subdivided,
not wave-(3), the extension, but wave-(5) which was the Terminal pattern. This is an example of the
Independence (see Rule page 9-7) of the Subdivision Rule from the Extension Rule. The Extended
(3)rd-wave is marked with an "x"; the subdivided (5)th-wave is marked with an "s."
During the formation of a Terminal pattern, part of it will usually break the larger 2-4 trendline. To
get only the structure of a Terminal pattern without the early warning of a temporary 2-4 break is rare,
but not impossible (see Figure B, 12-10).
Important: The Wave Theory does allow you to speculate when a particular formation (trend) has
completed, but the necessary reaction to dial formation is quintessential in the verification of your
assumptions. In Figure 12-10, the action afterjvave:(5) must return to the low of wave-(4) to confirm
die analysis; if that does not happen, the interpretation is wrong. Note: In Figure 12-10, wave-(4) is the
minimum target for the drop, 99% of the time it would return to the beginning of wave-(l) or lower.
Real 2-4 Trendline
When die 5th-wave of an Impulse pattern has completed, a correctly drawn 2-4 trendline must be
broken shortly afterward. "Shortly" is a market defined relative terra To ascertain What relative means
to a wave pattern you need to check the time consumed by the 5th wave. If the break from the termination
of the 5th wave to the 2-4 trendline takes an equal amount of time or less dian that consumed by wave-
5, the break adheres to normal behavior thereby confirming wave-5's conclusion. If the break takes more
time than wave-5, you must assume wave-5 is developing into a Terminal pattern or the 2-4 trendline
is incorrectly drawn and wave-4 is not finished. Maybe your entire interpretation is incorrect. Whatever
the circumstances, the market has not completed an Impulse sequence (Figure 12-11).
12-8 Advanced Neely Extensions
Figure 12-10
Oscillates around trendline
"False" break
Diagram B
No "false" breaks. This is not a
common occurrence when a
Terminal is forming, but it is allowed.
Figure 12-11
The time consumed by wave-5 is lss_s than the time
taken by the market to return to the 2-4 trendline.
If wave-4 & 5 are to be confirmed complete, the
move which starts after wave-5 should return to
the 2-4 trendline in the same amount of time (or
less) as that taken by wave-5. If it takes more time,
wave-5 is subdividing or wave-4 is not finished.
Advanced Neely Extensions 12-9
Impulse Identification with Channeling
nilllilfllllWIIII'lllllllll'IIIIIIIIHIIIIMI'IIMI! I I I II
With an understanding of the different ways the various Impulse patterns channel, you can frequently
use Channeling to decipher which wave of the pattern is going to be the Extension. The earlier you decide
which wave is the Extension the better you can trade die trend. The explanations and illustrations to
follow will provide you widi a clear idea of how each Impulse variation Channels and behaves.
1st Wave Extension
When the first wave Extends in a sequence, the channeling of the pattern should resemble the
channeling of a Terminal move (Figure 12-12). The 5th wave should not touch the upper trendline. It
will usually stay below it, but on occasion, if wave-2 is very larpe, it might exceed the upper trendline.
3rd Wave Extension
There are several ways a move with a 3rd wave Extension will channel. No n>:i tter which touch points
are used to draw the trendlines, they should always be parallel or near parallel (1 < cure 12-13). Notice,
in the diagrams, which of the two corrective phases was more complex (wave-2 or wave-4). Drawn are
the typical setups for each 3rd Extension Impulse variation.
5th Wave Extension
There is really only one way to channel a 5th-wave Extension (see Figure 12-14). It is basically the
reverse of a 1st wave Extension. The Channeling will tend to expand outward like a "megaphone."
Double Extension
Even though I am uncomfortable with this pattern, due to its extreme infrequency, it is included here
for completeness. From experience, this is how a Double Extension should channel (see Figure 12-15).
Correction Identification with Channeling
niiiiiiiiiiiiiiiniii'iiiiiiiiiiiiiiiiiiiiiiiiiiii iiiiiiiiiii iii 11111 i i
Flats
To detect which Hat variation is unfolding on you chart, all channel lines need to be parallel and
horizontal with the high and low of wave-a the beginning points. In Figure 12-16a(page 12-13), all Flat
patterns have been marked in this fashion. You should study them to understand how the Channeling
of the Correction tells you in advance which type of Flat variation is unfolding.
For support and resistance levels in a Flat, the Channel lines should be drawn differently. Draw the
Flats' trendline across the beginning of wave-a and the end of wave-b, Figure 12-16b(page 12-14). A
12-10 Advanced Neefy Extensions
Figure 12-12
Channeling 1st Extensions
The contraction of the uendlines is a
common feature of 1st wave extensions.
Figure 12-13
Frequent
Channeling 3rd Extensions
Occasional
Infrequent
Extremely small
1st and 2nd wave
Advanced Neety Extensions 12-11
Figure 12-14
5th Extension Impulse
Typical
The 5th wave should slay below
the Irendline. The "megaphone"
shape of thechanneling is typical
of a 5th wave extension.
Figure 12-15
x5
^>
Double Extension Impulse
Extremely Rare (nearly impossible)
In a Double Extension, the 5th
wave will normally break above
the 1-3 irendline. The reason this is
called a Double Extension is lhat
Ihe 3rd wave is more than 161.8%
ofwave-1 and the 5th wave is more
than 161.8% of wave-3.
12-12 Advanced Neely Extensions
Figure 12-16a
A
b /
/v.
■ o-b hne
Common
a-c line
/a c
ffiZ
C-Failure
/
M
I B-Failure
Rare Double
Failure
b /
/ \ / \ J Irregular
/ a
c Irregular Failure
Running
Advanced Neely Extensions. 12
parallel line shouldbe drawn across the endofwave-ato get an idea of the potential support area for wave-
c. Even if the b-wave of the Flat makes a substantial move beyond the end of wave-a (see Running
Correction in Figure 16-b), you still draw the trendline based on the above rules. Four of the Diagrams
from Figure 1246a have been reproduced below in Figure 12-16b to show how real-time channeling
would be administered to the following Flat variations.
Implications of Channeling Flats
The way a Flat channels provides you with subtle clues on the immediate strength or weakness of
the market and gives you an idea of how much the market should advance or decline after the correction
is over. Most of the clues which can be derived from channeling a correction are dependent on the length
of wave-b in relation to wave-a. The larger the b-wave the greater the chances of an explosive move
(either up or down) after wave-c completes. The smaller wave-b is in relation to wave-a, the more likely
the Flat will either be the first segment of a larger a-b-c or the Flat will be followed by an x-wave and
another Standard correction. If a Flat channeK perfectly (i.e., if wave-c is the same length as wave-a)
it will probably be followed by an x-wave and become part of a Complex Correction (see Irregular
Failure, Figure 12-16c). Figure 12-16c illustrates the imp1 ttions of various channeling conditions
when working with Hats.
Figure 12-l6b
5- Double Failure
6. Irregular
7. Irregular
Failure
12-14 Advanced Neely Extensions.
Figure 12-16c
Implications of Channeling
The slightly shorter b-wave (in relation to
wave-a) indicates temporary market weakness
5- Double Failure
Wave-c's ability to slay comfortably clear of the
opposing trendline indicates the weakness
initially created by wave-b has been neutralized
Based on the length of wave-b in relation to
wave-a, the market is in a strong position;
the next advance should be larger than the
advance immediately before wave-a.
7. Irregular
Failure
The touching of the opposing trendline by
wave-c does not negate any strength indicated
by wave-b, but it does indicate this correction
may be followed by an x=waye, making (he
entire correction only part of a larger Complex
formation. This concept is explained in further
detail under the Zigzag heading (p. 12-16).
When wave-b concludes at the same
high as wave-a it indicates a relatively
neutral market environment. But, if.
wave-b is also very similar in time to
wave-a, an elongated c-wave may occur.
2. Elongated
The new high for wave-b
indicates the power of the
uptrend is improving.
6. Irregular
The intial strength implied by the b-waves
new high has been negated by the
significant break of the opposing trendline
This is as powerful as
the b-wave ina Standard
correction can get. The
move to follow this
pattern should be much
bigger than wave-b and
at least 161.8% of the
move immediately be
fore wave-a.
g. Running
Wave-c continues to
promote the thesis of
a powerful trend in
effect. It is important
the c-wave achieve a
price relation to
wave-a of at least
61.8%; if it is much
less than that, the b-
wave is probably not
complete.
The extraodinarily long c-wave
warns that me market is getting
weak and that the c-wave wiU
probably not be retraced com-
petely by the next wave of the
same degree. An elongated
pattern also implies the market
is forming a Triangle.
Advanced Neely Extensions. 12-15
Zigzags
There are not many Zigzag varieties, but there are three distinct ways a Zigzag can Channel (see
Figure 12-17). Diagrams'A&B show "normal" Zigzagchanneling. Either one of the Zigzags in diagram
A orB could complete a corrective phase. If the Zigzag channels as in DiagramC, the probabilities highly
favor the Zigzag wjlljioi conclude the downward correction. It will be partofacomplex Double or Triple
pattern. If the Zigzag channels as in Diagram C, the wave which immediately follows should not retrace
all of the Zigzag. If that wave retraces less than 61.8% of the Zigzag, it should be labeled an X-wave.
The x-wave will separate two Standard Elliott corrections.
Figure 12-17
Diagram A
Diagram B
Stays above the
lower trendline
Breaks below
lower trendline
Diagram C
When the Zigzag touches the trendline, it
indicates it will be part of a more complex
correction. The rally to immediately follow the
zigzag will be an x-wave if it does not retrace
the Zigzag more than 61.8%.
■1.00
12-16 Advanced Wee// Extensions.
Triangles
Triangles have a base trendline just as Impulse waves do. The base line for a Triangle is the B-D
trendline. It should always be employed no matter which Triangle variation you are working with. When
the trendline gets broken you know the Triangle is over. The trendline on the other side of the Triangle
may be drawn three different ways. The most common is the A-C trendline (see Figure 12-18, Diagram
A), followed by the C-E trendline (Diagram B). The least common is the A-E trendline (Diagram C).
Figure 12-18
Diagram A
Most Common
b-d baseline
a-c trendline
When broken it signals the
completion of the triangle
Diagram B
Frequent
b-d baseline
c-e trendline
When broken it signals die
completion of the triangle
DiagramC
Rare
a-e trendline
When broken it signals the
completion of the triangle
Advanced Neely Extensions. \2-17
Complex Patterns
All the Channeling rules I have developed over the years and the clues which they provide are more
reliable in "standard" Elliott patterns. When die market unfolds in a more complex, Non-Standard
manner, specific rules are harder to define, but the following I have found to be reliable. Generally, die
base trendline will run across only the "0" point and the x-wave(s) or the b-waves of the pattern. If the
b-waves consume more time than the x-wave(s), me channel will be drawn using the b-waves. Tf the x-
wave(s) is the largest corrective phase, the trendline should be drawn from point "0" across the first x-
wave. Below is a list of rules for each category of Complex Correction.
Double &Triple Zigzags
The Double or Triple Zigzag, unlike any other Elliott pattern, can provide an ideal channeling
environment. Two parallel lines should contain the entire series of multiple advances and declines
(Figure 12-19 ). This is one of the significant differences between Impulse formations and Double &
Triple Zigzags (which are frequently mistaken as Impulse patterns).
Figure 12-19
Double Zigzag
Triple Zigzag
A well-contained
movement of multiple advances
and declines between two
parallel lines will usually be
a Double or Triple Zigzag.
The typical B-B trendline
of a Complex Correction
is being implemented
Double & Triple Combinations (which start with Zigzags)
Like Double and Triple Zigzags, usually Double and Triple Combinations will channel within well
defined parallel lines, until the last corrective phase is nearing completion. Mentioned earlier, most
Double and Triple Combinations conclude with a Triangle. As you know from previous discussions,
Triangles create problems with Channeling. Therefore, the last few segments of the Triangle, which will
conclude the last corrective phase of the Double or Triple Combination, will provide at least one (if not
twoormore) 'false' breaks ofthebaseparallelline before finally completing. SeeFigure 12-20 for some
examples.
12-18 Advanced Neely Extensions.
Figure 12-20
Double Combination
End of Double Combination
False Break"
Triple Combination
End of Triple Combination
"False" Break
Advanced Neely Extansions, 12-19
Double &Triple Flats
The x-waves in Double or Triple Flat are almost always much smaller than the a-b-c's which they
separate, so the Channeling has to be executed using the b- waves of each Hat (see Figure 12-21). When
the baseline is broken (if drawn correctly), the pattern should be over. Note: A C-Failure pattern is a
likely candidate for the last Flat of one of these complex formations.
Figure 12-21
Double Flat
Baseline
Trendline
Formation
confirmed
complete
Triple Flat
/ When the b-b-b
' baseline is broken, the
' ^^ formation is complete.
c-fail ure Flat
c-failuie
Double & Triple Combinations (which start with Flats)
Because mere are many variational possibilities with such patterns, it is difficult to create any
Channeling process which will work for all possibilities. The baseline, composed of b-wave termination
points, mWahvays bemorereliablethanthetrendline composed of a-wave termination points. The best
approach is to continue using the b-wave's baseline as the important channel and realize that a-wave
termination points may not create a very clean trendline. In Diagram A of Figure 12-22, me trendline
is satisfactory, but in Diagram B it does not perform its function as well.
12-20 Advanced Neefy Extensions.
Figure 12-22
Diagram A
Double Combination
Elongated Flat
b-b Baseline
Triangle
a-a Trendline
False break of B-B Baseline
caused by triangle
Triple Combination
Diagram B
Elongated
With so many a-waves, it is
difficult for them to all align'
in a perfectly straight line.
Advanced Neely Extensions. 12-21
Identifying the Completion of Waves
When you are having difficulty deciding where each Elliott pattern is beginning or ending, the use
of diagonal channel lines will help you identify exposed points which can usually be used to formulate
reliable Elliot Wave counts. Figure 12-24 gives you an idea of how this technique is implemented.
Figure 12-24
End of previous pattern
Exposed points are best
identified with the use of slanting
parallel (or near parallel)
channel lines. These channel lines
should encase all market
activity of the time period you wish to
study. Furthermore, the channel
lines must connect at least two
market-created highs or lows
which fall farthest to the right or
left of the slanting channel line.
In the diagram, numerous
"exposed points" are identified
along with some guesses of
which Progress labels may be
present at each juncture [note:
the highest price has been
confirmed as the end of a previous
Elliott pattern].
This is the first low
(which falls along the
channel line) since the
last pattern terminated,
therefore wave-1 or
wave-a must be finishing
at this low. With the
decline from the high
composed of three parts,
wave-a is the best choice.
This being the first high since the first
important low, it must be wave-b,
wave-a of wave-b or wave-x.
The labeling here is totally
dependent on what is
placed at the previous
high. This low could be
wave-c, part of wave-b or
wave-a of the next section
of a Complex correction.
Notice this high is the
farthest to the right of
the channel line and is
the reason it was chosen
over the high
immediately before it.
* Exposed Points
Advanced Fibonacci Relationships
There are two major categories of Fibonacci relationships. The first, and most common, I have
termed Internal relationships. Internal relationships are frequently found in standard Elliott patterns.
External, the other way the market creates Fibonacci relationships, are common in unusual patterns:
Non-Standard Complex Corrective and Terminal or Failure patterns. Each type is covered below, with
examples, and the places they most regularly occur.
Internal
Internal relationships are characterized by the comparison of the price length of one wave to another
with no concern over the price level each wave began or ended (see Figure 12-25). These price ranges
will usually partially overlap. This means part of one move will be in the same price level zone as the
other. Relationships in Impulse patterns, with a few exceptions, are almost exclusively Internal.
Depending on the circumstances, relationships in corrections can fall into both camps. Below is a
complete listing of the most common (and some of the less common) ways Internal relationships occur
in Impulse patterns.
12-22 Advanced Neety Extensbns.
Figure 12-25
Internal Relationships
Length of wave-a is
compared to wave-c
Length of wave-c
Partial overlap of the two separate
price ranges of wave-a and wave-c
The length of "a"
relates to "b" by a
ratio of .618 (61.8%).
.618
1.00
The direct comparison of the
length of wave-a to wave-c
shows the smaller segment is
61.8% of the larger.
Impulse patterns
1st Wave Extension
When wave-1 is the longest wave in a pattern, wave-3 should not be more than 61.8% of wave-1.
When wave-3 is 61.8% of wave-1, wave-5 (applying the rule of Alternation) will usually be 38.2% of
wave-3. If wave-3 is 38.2% of wave-1, then wave-5 will usually be 61.8% of wave-3. That is basically
all the Internal relationships possible in a 1st wave Extension (see Figure 12-26).
3rd Wave Extension
When the 3rd wave extends in a pattern, wave-1 must not relate to wave-3 Internally by 61.8%. It
could be 38.2% of wave-3, but frequently they will notrelate Internally at all (study Figure 12-27). When
jhc 3rd>w3ve,is..the longest, wave4 and wave-5 should be nearly equal (100%) in price or related by
61.8% or 38.2% (ordered from the most to least common relationship). If wave-4 is the complex
correction, the 5th-wave should be equal to or greater than wave-1. If wave-2 is the complex correction,
wave-5 should be equal to or less than wave-1. If wave-1 is extremely small in relation to wave-3, the
5th wave will be 38.2% of the entire distance traveled from the beginning of wave-1 to the top of wave-
3 added to the end of wave-4 (refer to Figure 12-27). The 5th wave mart be less than 61.8% of wave-
3 if wave-3 is the Extension.
Advanced Wsa/y Extensions. 12-23
Figure 12-26
1.00
38.2% of
Wave-3
Figure 12-27
Wave-3,
.618 of
Wave-1
Waves
"0"- 3
Wave-1 is "microscopic" in
relation lo Wave-3.
5th Wave Extension
The only possible Internal relationship between wave-1 and wave-3, when the 5th wave extends,
isthatwave-3 will be 161.8% of wave-1. If diey do not relate, wave-3 must be more than 100%,buttes
than 261.8% of wave-1. If the 5th wave Extension Internally relates to 1 & 3, it will usually be 161.8%
of the distance from " the beginning of wave-1 to the end of wave-3" added to the end of wave-4 (see
Figure 12-28). Wave-5 should be at least 1CK)% of 1+3 or 161.8% of wave-3, whichever is shorter. It
can be as much as 261.8% of 1+3, but that is about the maximum limit for the length of a 5th-wave
extension (refer to Figure 12-28).
Remember, all discussions above are in reference to Internal relationship possibilities. There are
other ways that wave-1, 3, and 5 can relate in Impulse patterns, but those relationships fall under the
External category. It is also possible, under unusual circumstances, for relationships not to occur
between certain segments of an Impulsive or Corrective pattern.
Figure 12-28
1.618
The 5th-wave Extension could
have been as short as 100% of 0-3 or
161.8%of wave-3, whichever is the
lessor of the two. The maximum
length of wave-5 would be 261.8%
of (0-3).
12-24 Advanced Neely Extensions.
Corrections
Wave-2 & Wave-4
If wave-2 is the largest price correction of the Impulse partem, the 4th wave will likely be 61.8% of
the price covered by wave-2 (see Figure 12-29, Diagram A). The next choice would be 38.2%. If wave-
4 is the larger price correction in the Impulse pattern, wave-2 should be 61.8%, or less liJcely, 38.2% of
wave-4 (refer to Figure 12-29, Diagram B).
Wave-a & Wave-b
UnlUce waves 2 &4, waves a & b move in opposite directions. Contrary to the prevailing beliefs of
many, Fibonacci relationships are more reliable between patterns traveling in the same direction, not
opposite directions. As a result, there are no consistendy reliable relationships between waves-a & b.
The relationship between waves a &b is used mostly in deciding the Structure of the a-wave (see
Retracement Rules and Pre-Constructive Rules of Logic, Chapter 3).
Figure 12-29
3- Price covered by
Wave-4 = .618
Price covered Tjy
Wave-2 =1.00
Wave-4 could have
been 38.2% of Wave-2,
fcut61.8% is more likely
Price covered by
Wave-4 = 1.00
Price covered by
Wave-2 =.618
compared lo Wave-4
Diagram A
Diagram B
Advanced Neety Extensions 12-25
Wave-c (in a Zigzag)
The Internal length "limit" of wave-c, in relation to wave-a, is about 161.8% of wave-a (Figure 12-
25, page 12-23). If the length of wave-c falls outside of the maximum Internal and External limits (see
External: c-wave, Zigzags) of its relation to wave-a, then the Zigzag is Elongated and should be
consideredpartofaTriangle. It will either be an entire leg of aTriangleorpartofacomplexpattern which
is an entire leg of a Triangle.
The c-wave could also be equal in length to wave-a, which is very common (Figure 12-30, Diagram
A). Wave-c should not be less than 61.8% of wave-a, Internally. If so, it is probably due to a very small
b-wave Triangle. The Zigzag is probably the entire leg of a Triangle or part of a complex correction which
is the leg of a Triangle, Figure 12-30, Diagram B.
Wave-c (in a Flat)
The c-wave in a Flat should not exceed the a-wave by more than 138.2% (see Figure 12-31). If the
c-wave is more than 138.2% of wave-a, then it falls into the Elongated Flat category. The most common
relation between wave-a and wave-c, in Hats, is near equality (refer to Figure 12-32). The next most
likelyrelationshipis61.8%. Thiscanhappenin basically two ways, as ac-failure (Figure 12-33, Diagram
A) or as a b-failure (Diagram B). The minimum Internal relationship allowed between wave-a and
wave-c is 38.2%. This only happens on rare occasions in what 1 call a 'severe' failure. This can happen
in three general ways. The b-wave retraces most of wave-a (up to, but not exceeding, 100% [see Diagram
A of Figure 12-34]). The b-wave retraced wave-a in the area of 81% (Diagram B). The b-wave must
retrace at least 61.8% of wave-a for this 'severe' failure to still be possible (Diagram C). Of the three,
Diagram A is the most common; Diagram B is next in line and Diagram C is very unlikely.
Figure 12-30
c
Wave-a and wave-c are equal in this
Zigzag; a very common arrangement.
b
Diagram B c
If wave-c were shorter than 61.8% of wave-
a, the Zigzag would likely be part of a
Triangle. NOTE: You will hardly ever see a
Zigzag with a c-wave shorter than 61.8% of
wave-a.
Diagram A
1.00
.618
12-26 Advanced Neefy Extensions
Figure 12-31
1.382
If wave-c is more than 138.2%
of wave-a, the market is
creating an Elongated Flat.
Figure 12-32
1.00
The most common rela-
=100 tionship between wave-a
and wave-c of a Flat.
Figure 12-33
Diagram A
1.00
.618
The c-wave failure
indicates strengdi in the
opposite direction.
Diagram B
1.00
.618
AdvancedNeefy Extensions 12-27
Figure 12-34
Diagram A
For wave-c 10 be only 38.2% of wave-a, wave-b can be
no higher than the top of wave-a. If the b-wave is larger
than wave-a, the 38.2% of the rally from wave-a's low
would all be part of wave-b, not the entire correction.
~ \ A >2
1.00 \ / C
a
This would be called a "severe" c-wave Failure. It must
produce a rather quick move after wave-c completes.
Diagram C
1.00
Wave-c in Triangles
The c-wave of a Triangle usually relates to wave-a by 61.8%, but do not eliminate a Triangle count
just because that parameter is not met (Fig. 12-35). If wave-b is bigger than wave-a, wave-c might be
61.8% of wave-b (Fig. 12-36). Remember, Triangles are probably the most common, flexible, varied,
and annoying of all Elliott patterns. As long as the market experiences an obvious contraction period
composed of five separate segments and there are at least two Fibonacci relationships that occur between
the various segments, you have a likely candidate for a Triangle (see Chapter 5 for additional Rules).
Wave-d
Wave-d only occurs in Triangles. It will normally relate to wave-b by 61.8%. Waved could relate
to virtually any wave in the Triangle by 61.8% or 38.2%.
Wave-e
Wave-e will usually relate to wave-d by 61.8% fin 38.2%. It could also relate to the larger waves by
38.2%. If it relates to wave-a it would probably be because the b-wave were larger than wave-a.
Diagram B
81% of "Wave-a
1.00
Severe C-wave failure; a
strong move should follow.
The b-wave must retrace
at least 61.8% of wave-a.
b
3
.382 This pattern is a
Double Failure.
c
Severe c-wave failure,
healmy move to follow.
12-28 Advanced Neety Extensions
External
Unlike Internal relationships, External relationships are based on non-overlapping, but touching
price ranges. For example, wave-a may be 50 points long and complete at the 500 level. If the c-wave
were to relate Externally to wave-a, you would calculate 61.8%, 100%, and 161.8% values of wave-a
and add or subtract those amounts from the 500 level (Figure 12-37). Here you are not directly relating
the length of wave-a to wave-c; you are measuring wave-a and then subtracting price amounts, based on
the Fibonacci ratios, from wave-a's low which relate only to wave-a. In other words, External relations
are derived by using one price length and taking Fibonacci ratios in increasing or decreasing scale and
adding or subtracting those values directly from a specific price level defined by the termination of one
of the waves of the pattern being studied. These levels would be considered potential support or
resistance zones. If the market stops and reverses at one of these levels it has confirmed their importance.
Figure 12-35
1.00
Triangle Pattern
b
.618
Figure 12-36
Wave-b=1.00
Advanced Neely Extensions 12-29
Figure 12-37
Initial price length
550
50
Notice how each
price distance is
starting from the
same point.
Non-overlapping
measurement point
Potential support
zones tor Wave-c
All measurements are
subtracted from the end of wave-a.
A move by wave-c beyond
this level would signal the
Zigzag is part of a Triangle.
Impulsions
1st wave Extension
Since wave-3 should not be much more than61.8% of extended wave-1, there are not many External
relationship possibilities for a 1st wave extension. If you take 61.8% of wave-1 in Figure 12-38, and add
that amount to the end of wave-1, you have a resistance level for the next advance. If wave-2 retraced
any of wave-1 (which is mandatory in Multiwave or higher patterns), the 3rd wave would be too long
if it reached that resistance level. The only conclusion is that that is where the entire advance will
terminate (Fig. 12-38). If the 1st wave extension is going to form around External relationships, the
61.8% resistance point is the most common. It is possible the entire advance could terminate 38.2%
above the 1st wave, but it is not likely and would indicate a fairly high level of market weakness (or
strength if the pattern completed downward). A 38.2% External relation would favor that the whole
Impulse pattern terminated a larger formation.
12-30 Advanced Neety Extensions
3rd Wave Extension
There are no reliable External relationships within 3rd wave Extension patterns. Why? The market
turning points are too close or too for away to relate by common Fibonacci ratios (see Figure 12-39).
5th Wave Extension
External relationships are more common than Internal relationships when the 5th wave extends.
There are two situations where External relations can apply in an Extended 5th wave pattern:
(1) First, the 3rd wave can stop at a point that is 161.8% above the end of wave-1 (Figure 12-40,
diagramA). That would be the most likely i/external relations are involved. Thenextpossibilityis 100%
above the end of wave-1 (Figure 12-40, Diagram B). If the 3rd wave exceeds the 161.8% level, it will
likely be the Extended wave and the 5th wave should be shorter than wave-3.
(2) Second, the 5th wave can stop at apoint that is 100%, 161.8% or261.8% above the top of wave-
3 (Figure 12-41). Thel61.8% level is the mostlikely level forthe termination of the5th wave Extension.
The 100% level is the next most likely, and the 261.8% level is only likely if the market is terminating
a large, long term advance (or decline). Note, in Figure 12-41, at each level there is a comment on the
implications of each relationship at that point.
Figure 12-38
618
1.00
Termination of entire
Impulse advance
Figure 12-39
Original
Measurement Value
Advanced Neefy Extensions 12-31
Figure 12-40
1.00
Diagram A
1.00
1.00
5th Extension
/
/
/
/
/
I
I
Diagram B
Figure 12-41
T ,... , ...... _ , Strong Indication of major top
Least likely possibility 3rd—nr- -" — -*
A
/
/
Most likely resistance lsi /-
Continuation of trend likely
Secondary possibility 2nd
1.00
1.618
2.618
12-32 Advanced Neely Extensions
Corrections
Double & Triple Zigzags and Combinations
Quite often in more complex corrections, after the first External support or resistance level has
produced areversal, the market may turn around and break through that level. Almost always, the second
push to new price levels will move only 61.8% of the previous break. If there is a third break, it should
move 38.2% of the original move. This is what I call the "waterfall effect" (Figure 12-42).
Frequently, the first Zigzag of the complex pattern will have its own External relationships between
waves-a & c. Afterward, it is necessary to use the entire price value of the first Zigzag as a "yardstick"
for the rest of the support or resistance levels. This "entire" value is marked with an asterisk (*) in the
diagram below and is next to the larger "1.00."
The Waterfall Effect is, by far, most often found in Double Zigzag patterns or complex patterns that
start with a Zigzag. To apply the concept to Triple Zigzags and Combinations, work with two groups
at a time. In other words, work with the first two corrections as if the pattern were only a Double Zigzag.
After completing that study, work with die second two Zigzags in the same way (you will be making use
of the middle correction twice). All the same rules should apply as the ones discussed for Figure 12-42.
Figure 12-42
1.00
ZigZag
If this level gets broken,
lake theenlire length of die
first zigzag and subtract
61.8% from this low.
Then lake 38.2% of
the initial amount
and subtract that
from this new low.
Advanced Nmly Extensions 12-33
Double & Triple Flats and Combinations
External relationships for Double Flat and Combination patterns will probably not create the
Waterfall Effect mentioned in the previous paragraph. Usually, one External support orresistance level
is all that is needed to stop the market's rise or fall (Figure 12-43). A Triple Flat or Combination pattern
will likely exhibit the Waterfall Effect (Figure 12-44).
Figure 12-43
1.00
Figure 12-44
Triple Combination
Missing Waves
KIIOINIIlllllllllllllllllllllllllllinil!
Ml I
When available data creates price action which falls somewhere between the monowave and
polywave stage of development, an event never before discussed in Elliott literature comes into play,
"Missing Waves." This phenomenon, when not understood, can wreak havoc with your short-term
assessment of a market's possibilities. When a wave is "missing" it is always a monowave, it is never
apolywave orhigherpattern. Fortunately, even when a wave is missing from yourdata, itcan be detected
indirectly based on theillogical integration of pattern implications and based on the strange development
of price behavior inherent with "missing" waves.
12-34 Advanced Neely Extensions
Where and when do they occur?
Missing waves occur only on a polywave scale, not multiwave or higher. They are possible in
Impulsive polywaves, but are more common in Non-Standard complex, corrective poly waves. Standard
Elliott corrections cannot contain "Missing Waves." Waves will occasionally be missing in a formation
when the market is preparing to make a significant change in trend.
How do they occur?
All Elliott patterns require a minimum number of monowaves to be correcdy formed. An Impulse
wave cannot be formed with only four monowaves, it must contain at least five (5). A correction requires
at least three (3) monowaves. As should be clear, to make a specific number of monowaves requires a
certain number of data points. When such things as Alternation, Time relationships, Rule of Equality,
etc., are considered, it is possible to calculate the number of data points necessary to create a minimally
acceptable Elliott polywave pattern.
Below is a listing of the minimum number of data points needed for a pattern to have the chance of
fully developing without a missing wave. Possessing the minimum number of data points does not
eliminate the possibility of a missing wave in the pattern, it only decreases the likelihood. Having less
than the needed number of data points guarantees there exists a missing wave in the pattern (as long as
your progress label interpretations are correct). A polywave with twice the minimum number of data
points required (or more) should not be considered a candidate for a missing wave. Each one of the
listings below includes the starting data point as part of the minimum required to form the pattern hsted
(Figure 12-45).
POLYWAVE PATTERNS (only):
1. Impulse wave - 8
2. Zigzag - 5
3. Flat - 5
4. Triangle - 8
5. Double Flats & Zigzags - 10
6. Doubles ending with Triangles - 13
7. Triple Flats & Zigzags - 15
8. Triples ending with Triangles - 18
Figure 12-45
__-•: Starting Data Point
There are four data points in this diagram. The starting data point is
included in the listings above. When you are counting the number of data
points which make op a pattern, make sure to count the starting point.
V\
Advanced Neely Extensions 12-35
For a pattern to contain a missing wave, it must take just the right number of data points to formmost,
but not all, of die monowaves needed. What is "just the right number"'! It is not a specific amount, but
a range. Fifty percent of the minimum amount required for a formation (or less) basically eliminates die
possibility of a missing wave and so does a doubling of the minimum amount. Why? At half the
minimum, the pattern would be so simple it would on register as a monowave gr a simpler corrective
pattern. [For example, Double Zigzags will appear as single Zigzags when severe time restraints are
placed on theirformation; see Figure 12 -46] At twice the minimum level, there would be too much detail
to allow for a missing wave.
From diis it becomes clear that me range of data points which allows for a missing wave is half of
the minimum plus one (+1) or twice the minimum minus one(-l). Any number of data points below the
minimum (but higher than halfway) indicates a missing wave is a certainty or that your wave count is
incorrect. For each additional data point above the minimum, the chances increase geometrically that
a missing wave will not be present Once the number of data points reaches twice the minimum level
a missing wave should be considered impossible.
Figure 12-46
In Diagram A, there are 9 (latapoints which make
up a Double Zigzag (the 10th data point confirms
the conclusion of the Double Zigzag). If the time
element available for the formation of this move
were only half the currently allotted 10 time units,
the Double Zigzag would look like a single Zigzag
(see Diagram B).
Working with the same dabt as in Diagram A, but only
plotting every other point, you can clearly see how the
detail of a pattern decreases and simplifies. This
reduction in the number of data points distorts what actually
look place in the market, making the action look like a
Simple Zigzag instead of a Complex Correction.
Fortunately, such a severe reduction in the number of data
points generally produces a different, but still
identifiable, Elliott pattern. It is when the available data falls
somewhere between the two diagrams that a missing
wave becomes reality. Even when a wave is missing, it
still can be detected due to the strange behavior it creates.
12-36 Advanced Neely Extensions
Why do they occur?
Now that you know how diey occur, the question comes up, "Why would a market not have enough
data points to create an Elliott pattern}" All analytical studies must be done within certain limitations.
When you want to do some analysis, you have to decide which market to observe, you have to decide
when to start you chart, what period of rime the chart will cover and what type of data will be used. Will
it be yearly data (which may be appropriate for real estate, farming or interest rates). Maybe the study
requires shorter-term information such as weekly or daily (which is more appropriate for stock and
commodity analysis). No matter what your decision, it will create limits; either on the amount of market
action visible for analysis or on your time to analyze.
Whatever period of time you choose to monitor, there is usually shorter-term price data available
which would revc :il further intricacies of price action. When a pattern on a shorter-term chart completes,
there may or may not be enough data points on the next larger chart for the same (but less detailed) pattern
to fully develop. When the complexity of a short-term move exceeds the number of data points (time
units) available to form the same pattern on a longer term chart, a simplified version of the same move,
a monowave or a "missing wave"is unavoidable. An example of asimplified version is acomplex pattern
turning into a simple pattern (a Double Zigzag into a single Zigzag, see Figure 12-46). Or, if there is too
much time disparity between one chart and the next, then the complex pattern on the short-term chart will
appear as a monowave on the longer term chart. If the time difference between charts is small, a"missing
wave" is virtually inevitable.
For our theoretical example, we have chosen the London Gold am/pm fixes for our "longer-term"
data and the continuously traded International Gold Market as our shorter-term data. The London Fixes
(die best way to follow Gold, in my opinion) will provide us with two average Gold prices per day. The '•'"'SB
international Cash market will allow us to monitor the formation of super short-term Elliott patterns.
In Figure 12-47, there are two plots. One is of the am/pm Gold Fix, the other of intraday cash Gold
market data. The light line is the IGM over several days. The dot in the middle of each day and at the
end of each day represents the time when the London Fix was released. Thedarkline is the London Gold
fixes plotted separately and each connected with a straight line. As you can plainly see, the IGM reveals
an Impulsepattern over the three-day period. The London data displays a pattern which resembles a near
perfect Zigzag; that is how a "missing wave" can occur.
The London Gold plot would force you to assume the market is ready to decline since it appears to
be correcting upward. The market action which follows the "Zigzag" will prove that interpretation
wrong. If you study the "Emulation" section (page 12-38), you should be able, at least in hindsight, to
correcdy reconstruct die "Zigzag" into a bullish pattern.
Which patterns are susceptible?
The most susceptible patterns to missing waves are Complex Corrective Poly waves (corrections that
involve x-waves). Virtually without exceptions, it is the x-wave which is "missing" in one of these
patterns (see "emulation" for a more detailed description). This is due to the fact that x-waves are almost
always the smallest corrective waves of such patterns, so they are die first to disappear as the time element
of the Correction is reduced. Much less frequently, Impulsive polywave patterns which have a 1 st or 5th
wave Extension can "miss" their smaller corrective phase. In a 5th wave Extension that would be wave-
2 (as in Figure 12-47). In a 1st wave Extension it would be wave-4.
Advanced Neely Extensions 12-37
Figure 12-47
The dark line represents the London Gold Fixes. The lighter line is the
continuously traded Cash Gold market The Cash market reveals an
Impulse pattern while the London AM-PM fixes indicate a Zigzag pattern.
*" Future
What actually
happens
What you assume
should happen
next
Emulation
1!
I I
Emulation is a tough area. This phenomenon occurs when one pattern (Corrective or Impulsive) is
mimicking the behavior of a pattern from the opposite Class. This obviously can create problems with
the analysis process. The two redeeming aspects of this transgression is that it occurs on/yon short-term
price action of polywave development and almost always provides the astute analyst forewarning clues.
In the early stages of market development, the transition from monowaves to polywaves is, on
occasion, unstable. Itisoneof the few, truly trickyperiodsyoumiialeamtodeal with. When one pattern
Emulates another, it generally indicates the pattern is "missinga wave." You will have to ascertain when
the market is. or is not revealingall of its behavior to you. Thephrase, "missingwave," is used to describe
unseen market action. It is imperative you understand the missing wave concept before continuing with
this section (see "Missing Waves," page 12-34).
Below are numerous patterns that, to the casual observer, would appear to be another Elliott pattern.
Despite the missing waves which might occur in these patterns, they still have their own recognizable
shape and behavior.
12-38 Advanced Neely Extensions
Double Failure
Unlike most other "emulations," the Double Failure can only fool you during its formation and for
a short time period of time after it is complete. Many of the other "emulations" can keep you off track
for some time unless you are closely watching market action. As you can see in Figure 12-48, the Double
Failure can temporarily mislead you into the assumption thai a Triangle is forming. When the supposed
d-wave exceeds the top of wave-a, it indicates the correction is probably over and the market did not
forming a Triangle. A xsiy. minor clue that this pattern is taking place during it formation would come
from the application of Fibonacci relationships. In a Triangle, the a & c wave usually relate by 61.8%,
Internally. In a Double Failure, the c-wave will usually fall at a specific price level important to wave-
a from an External standpoint (Figure 12-49).
Figure 12-48
This action confirms
the Double Failure
Assumed d-wave
exceeds the top of wave-
b and wave-a, this
negates the Triangular—
scenario
Figure 12-48
Advanced Neely Extensions 12-39
Double Flats
This pattern, if missing the x-wave, could easily be mistaken for an Impulse wave with a 3rd wave
extension (see Figure 12-50, Diagram A). On short-term patterns, it is very possible the x-wave will be
"missed" since x-waves are usually the smallest corrections in apattern. There are three major clues the
pattern is actually corrective.
First, the supposed 2nd wave (Figure 12-50A) retraced more than 61.8% of wave-1, which indicates
wave-1 is more likely corrective (:3) than Impulsive (:5). [Caveat: it is acceptable for pad ofwave-2
to retrace more than61.8% of wave-1, but it is not acceptable for wave-2 to terminate beyond the 61.8%
level, which it did in the diagram.]
Second, there is ne alternation in time, price or structure between waves 2 & 4 in Figure 12-50A. If
there is not alternation of any sort between waves 2 & 4, it does not matter what the pattern looks like;
the move is not Impulsive.
Third, attention to Fibonacci relationships could indicate the presumed "3rd extension" is only
161.8% or less of the presumed 1st wave. This, of course, tells you "wave-3" is agt the extension and
the assumed 5th wave should have been much larger.
If you witness a situation like the one shown in Figure 12-50A (and described above), divide the
longest wave (the one that looks like wave-3) in half and assume the halfway point is where a "missing"
x-wave occurred (Figure 12-50B). After the pattern terminates, it should be compacted to a ":3."
Double & Triple Zigzags
The major difference between the Double Hat and the Double Zigzag is wave-b in the first Zigzag
will not retrace more than 61.8% of wave-a. From an Emulation standpoint, this makes the Double Flat
(missing the x-wave) easier to detect since true 2nd-waves should not terminate at a point that is more
than a 61.8% retracement of wave-1. Similar to the Double Flat, the lack of alternation between the
assumed waves 2 & 4 would still be present and may be the only early warning the move is actually
corrective. Attention to Fibonacci relationships may provide a clue if the presumed "3rd extension" is
only 161.8% or less of the presumed 1st wave. This should not happen in a real Impulse pattern unless
the 5th wave extends; from the diagram, that is clearly not the case. The next clue will not come until
much later when the market retraces the Double Zigzag by more than 61.8% (implying the presumed
"Impulse" pattern is actually Corrective).
To the inexperienced Elliottician, the Triple Zigzag or Combination pattern will look like an Impulse
pattern. Triple Zigzags, with missing x-waves, would not generally be aproblem since Triples "emulate"
Double Zigzags (Figure 12-52C). Double and Triple Zigzags have nearly the same implications, so
misinterpreting one as the other would not make much difference to the larger trend.
The following are reasons why Figure 12-52A does not make a dependable Impulse pattern:
1. A Triple Zigzag or Combinatiqrii will usuallychannel far too well to be considered an Impulse
pattern (see "Channeling" - Impulse waves). When a move channels like 12-52A, that is about
as good a signal of complex corrective behavior as you can get.
2. The declining waves are too similar in price and time coverage leaving the market without an
Extended wave, which is mandatory for Impulsive activity.
3. The action after the presumed 5th wave did not break the 2-4 trendline soon enough (see 2-4
Trendline).
4. Both waves 2 & 4 indicate weakness, breaking the rule of alternation.
12-40 Advanced Neely Extensions
It would truly be a dereliction of an analyst's duties to misinterpret a Triple Zigzag which is not
missing any x-waves (Fig. 12-53). The problem with the proposedxount should be obvious; waves-3
& 5 are clearly Zigzag patterns, not Impulsions. That type of development for the odd numbered sections
of an Impulse wave is impossibleunless the market is formin a Terminal pattern. Due to the Channeling
of the move (see Channeling - Terminal patterns), this is without a doubt, not a Terminal pattern.
Figure 12-50
Incorrect
Assumed Count
Correct
Actual Count
Diagram A
Incorrect
Assumed Count
Correct
Actual Count
Lack of alternation
between waves 2 & 4. The
only early clue that this
is correcive behavior.
The x-wave is
invisible due to its
simplicity
A dvanced Neely Extensions 12-41
Figure 12-52
Assumed count
Triple Combination
Actual count
Diagram B
The lack of necessary Impulsive criteria indicates
the pattern must be corrective. Each of the X-
waves in diagram B should be termed a "missing
wave" since there is no visible subdivision for the
x-wave. Double and Triple Zigzags and their
Combinations are the only corrective formations
wqhich closely mimic Impulsive behavior. So, if
a pattern "looks" Impulsive, but does not meet
importamlmpulsive parameters, the partem must
be a Complex correction involving X-waves.
Diagram C
The Triangle is the clue that this
pattern may be incorrectly labeled.
It has an excessively long a-wave
This same pattern might
be mistaken for a
12-42 Advanced Neety Extensions
Double Combination
Figure 12-53
Incorrect
Interpretation
Correct
Interpretation
1st Wave Extension
When a wave is missing from an Impulse pattern, the resultant price action will almost always look
like a Zigzag correction. This makes Impulsions the hardest to detect, especially before they are
complete.
When the first wave extends, the 2-wave should almost always be the most complex and time-
consumingpattern. Over short periods of time, when the numberof data pointscomprising the polywave
is in the range of "missing wave" susceptibility, the 4th wave may not be visible, creating what looks like
a Zigzag with a c-wave equal to or shorter than wave-a (Figure 12-54). It cannot be proven this partem
is missing a wave until after it is completed.
5th Wave Extension
When the 5th wave extends, the 2nd wave, being the smallest correction, will be the first pattern to
disappear during a contraction of the time element. A 5th wave extension with a missing 2nd wave will
look like a Zigzag with a c-wave which is equal to or longer than wave-a (Figure 12-55).
Expansion of Possibilities
raiJilllllllllllllillll'MIIIILILIIINIINMI! Ml
This is a completely new conceptual discovery by the author which, for the first time, helps you
overcome the problem of alternate counts. When you are working with price action, there are time
periods when the Elliott pattern forming is clear and no reliable alternatives to the interpretation exist.
At other times, numerous possibilities exist which can leave many analysts in a quandary.
As remarkable as it may sound, this state of confusion can be exploited to aid you in deciphering the
market's position; if not specifically, at least generally. This involves a process I call "Reverse Logic."
Advanced Neely Extensions 12-43
Figure 12-54
Assumed
Count
If the 4ih wave is the smallest
"time" wave in an Impulse
pattern, as the data series (left) is-
reduced it will be the fust to
disappear, producing this pattern.
Missing
4th Wave
correction
Figure 12-55
Actal
Count
Note the complex 2-wave in
Figure 12-54 and the complex 4-wave
in 12-55. Both mm into
monowaves as the number of data
points used in the series is reduced.
Reduce "the number of
data points for this
pattern and you get a pattern
which looks like a zigzag
withalongc-Wave
Missing 2nd wave
12-44 Advanced Neely Extensions
Plainly, the rule states: When more than one, perfectly acceptable wave interpretation is possible
from the same data series, the marketmusi be near the center of a Corrective or Impulsive pattern.
The more possibilities that exist the closer the market is to the center of a large Elliott formation
(wavc-b of wave-b; wave-3 of wave-3 or wave-x of a Non-Standard Complex Correction).
How can the Reverse Logic Rule be used to advantage? Whenever the market reaches a point in
which careful study reveals numerous possibilities, you should automatically assume the market is
toward the middle of a pattern. This knowledge will allow you to eliminate all alternate interpretations
which indicate a pattern is about to complete. If you keep only the interpretations which indicate the
market is in wave-b, wave-3 or wave-x (the middle section of each type of Elliott pattern), usually only
one interpretation will remain.
This rule has additional significance and use in trading. If you are waiting to enter a market, but there
are numerous interpretations possible, do not trade until the possibilities decrease to only one.
Obviously, if there are too many possibilities die market is halfway through its move. Entering at Uiat
time would mean more risk and less potential. The only way to take advantage of such a situation is to
work with a trend following technique until the count starts to become clear and the possibilities diminish
to only one. Another beneficial aspect of this Rule occurs when you are already positioned in a market.
If you entered the market when only one logical interpretation of the wave pattern is possible and you
are currently inprofit, do not be scared out when the number of interpretation possibilities increases. That
is just a sign that the market has a lot further to go before it can top or bottom out.
Localized Progress Label Changes
riWIillllllNI'illlNIIIITIIIIIIIII'lllll'lir'NIIII II'I I I
If you have been following a market and successfully calling its turning points for awhile, then
suddenly something completely unexpected occurs, uiat is not reason to completely discard your
interpretation. A count which has been accurately revealing die path of future price action must have some
factors which are correct even if those factors are based only on Structure. The most important
consideration when making changes to a count is to make diem as minor as possible. If minor changes
do not work, more significant ones will need to be implemented.
How do you make minor count changes? The vast majority of the time the need for a count adjustment
is due to the expansion of a pattern (refer to Flexibility of Progress Labels). What you thought was the
end of a Correction or Impulse pattern was only wave-a or wave-1 (respectively) of a more complex
Correction or Impulse move. This fact provides you with a very simple process of count adjustment.
Starting with the very last monowave on your chart, whatever label that monowave has been assigned,
drop down to the next smaller Degree title. Using that Tide, assume the monowave is only wave-a or
wave-1 (whichever is appropriate for the situation) of a larger Correction or Impulse pattern. The same
principle would work for segments larger than monowave development.
- - For example, let us say you observe a large Impulse advance which you assume is the end of a bull
market. After correcting, the market makes a new high. The new high indicates the bull market is not
over. What do you do about your previous labeling? The high you had marked as die end of wave-5 (of
any degree) at the top of the bull market, becomes wave-1 of the same Degree. The degree Title of wave-
5 drops down one level. If you had been working with a corrective pattern, what you marked as the end
of the Correction would become a lower degree a-wave of a larger corrective partem.
Advanced Nsely Extensions 12-45
Appendix
Stock Market Forecast
to the Year 2060
by
Glenn Neely
(this forecast was compiled during the late summer of 1988)
This following is a reprint of an article written for the "Foundation for the Study of Cycles" in their
September/October 1988 "Elliott Wave" issue. Thank you to Richard Mogey for giving us permission
to reproduce the article and Diane Epperson for preparing the camera-ready art work of the original.
For more information on the Foundadon, call 714-261-7261.
MARKET CYCLES
The Future Course of the U.S. Stock Market
An Elliott Wave Viewpoint
by Glenn Neely
THE GROUND WORK: What Does the
Theory Furnish the Technician?
The Elliott Wave Theory furnishes a framework within
which to organize a market's price action into specific
formations over any time period. All market action under
the Wave Theory breaks down into two major categories:
1. Action with the larger trend.
2. Action against the larger trend.
1. Simplistically, price action moving with the trend (of the
next larger magnitude) will be constructed differently from
that going against the trend. The majority of price
movement in the direction of the trend will be constructed of
rive smaller phases or segments (see Figure la). Broadly
speaking, this type of price action is defined as Impulsive
(in nature). If a pattern on the largest scale possible is
Impulsive, it cannot be completely retraced until at least
one more comparable Impulse wave (in the same direction
as the first) is completed.
2. Price action that moves iri the opposite direction of the"
next larger trend is usually constructed of three smaller
segments (see Figure lb). This type of action is classified
as Corrective (in nature). When price action is correctively
constructed, future price action will usually retrace the
Correction completely.
DYNAMIC CONCEPTS
For anyone who has tried, it is usually futile to linearly
extrapolate current market or economic action into the
future. Ask any corporation how well they predicted their
Glenn Neely established the Elliott Wave Institute in 1983,
and teaches the only real-time Elliott Wave course in the
world. He is author of ELLIOTT waves m motion.
Impulsive
(5 segments)
Corrective
(3 segments)
own growth and future demand for their products based
on previous years' data. Usually their forecasts are
significantly different from the final results.
History demonstrates that man's progress is dynamic and
logarithmic, not static or hnear. Look at the historical,
logarithmic chart on the U.S. stock market dating back to
1789 (see Figure 2, courtesy Foundation for the Study of
Cycles). Sometimes advances occur in spurts, followed by
consolidation phases that last for long periods of time.
Then again, occasionally the reverse happens. This reveals
the market's dynamic behavior. The relatively consistent
advance on a log scale for the last 200-plus years
demonstrates the logarithmic nature of economic progress.
The Wave Theory supplies the analyst with a forecasting
tool that is best implemented on a logarithmic basis.
Furthermore, it allows for dynamic development
contained within a fractal process. Fractals are part of a
relatively new and burgeoning area of science called "Chaos."
Chaos deals with the multifarious character of .turbulence
and the complex geometry of propagation in nature. The
association with fractals comes from the Wave Theory's
flexibility within a structured format. Repetition of Elliott
patterns occurs over and over, each time with a slight
variation or new twist. These repetitive patterns can then
be combined to create larger patlerns of appearance or
design similar to the smaller structures. For example, if you
examined Figure la under a microscope, the long center
CYCLES September/October 1988
217
segment would break down into a pattern which might
closely represent the appearance of the entire diagram.
With the introduction of Chaos, science is now able to
explain what has, heretofore, been considered random
behavior. The numerous similarities between the Wave
Theory and Chaos science further validates the
applicability of the Wave Theory to the once-thought "random"
action of stock and commodity prices.
PRICE ACTION LIMITATIONS
Elliott Wave price patterns force the analyst into specific
conclusions. The conclusions are not based on emotion or
opinion, but are forced upon the analyst through objective
and detailed study. Predictions are derived from the
highest probability outcome founded on historical
precedent. When applied correctly, the Theory can help the
analyst produce short- and long-term forecasts which are,
occasionally, pinpoint accurate.
THE ANALYSIS: Implications of the
Long-Term Data
A quick overview of the long-term price activity (Figure 2)
immediately brings to bear one important fact. The start
of the advance, which has been in progress for at least 200
years, cannot be coincident with the beginning of the cur-
Dow
42413
rently available long-term data series. Remember, the
Wave Theory is a natural law of progression. Its reflections
of societal development are present whether someone is
around to register them or not. It is only logical to assume
that the recording of data would not necessarily coincide
with the advent of a multi-century advance.
DETERMINING AN HISTORICAL LOW
FOR THE LONG-TERM DATA SERIES
The data we are working with starts in 1789. Obviously, this
country was inhabited and growing before that time, so
there was economic activity taking place, albeit
unrecorded. A quick glance at the start of the data series
reveals that the price action was initially drifting sideways
for several decades. This is not the way a trend (Impulsive
action) begins. The commencement of a trend (under the
Wave Theory) must begin with Impulsive action - action
that is only minimally retraced by later activity. You can
see that the market drifted back and forth many times
before finally advancing in the early 1800s. This implies the
20-plus-year consolidation must have been a Corrective
phase following an Impulse (trending) pattern.
Methodically administering a host of subtle Elliott Wave
techniques, 1 dednced that the best point of inception for
the last 200-plus year advance wis 0 JO (le., 30 cents). The
market was most likely at that level around the year 1765
±10 years. The following observati oris helped me to arrive
at the above conclusions:
1739
19E0
FIRST ADVANCE S
meo
Consolidation
toward center
19
|
1940
32
j
COND ADVANCE THlRI
toea J
™ 1B74
Largest, most
persistant advance In
i
ADVANCE
59874
6103
1097
148
20.1
2.71
.368
FIGURE 2 © Glenn Neely TIME
218
CYCLES September/October 1988
1. For the last 200-plus years, the U.S. economy (based on
stock market averages) has been advancing at a great clip
(approx. 100,000% since the official projected low around
2.51 in 1789). Based on this evidence, it is safe to assume
that the U.S. stock market has been in a trending pattern
(Impulsion) since that time or before. According to R.N.
Elliott, an Impulse wave should contain an Extension (one
advance that is significantly longer than the other
advances). Since 1789, there has not been an Extended wave
(see Figure 2); the second and third advance are about
equal, and the First advance is much smaller. This is a
pivotal observation. If the nature of the advance since the
1700s is to be considered Impulsive, there must eventually
be one advancing wave that is substantially longer than the
others. Resting solely on that fact, it is imperative to assume
the multi-century economic expansion, probably beginning
with the colonization of North America, has not ended.
2. The large middle section (second advance) of the last
200-year advance (1860 to 1929) is Corrective in nature.
Impulse patterns are known for their acceleration phases.
These nsually occur toward the center of the longest wave.
It is immediately evident that the advance from 1860 to the
high in 1929 does not exhibit any such acceleration phase
toward its center. Actually, the reverse is true; the second
advance consolidates toward its center (see Figure 2). This
is basically impossible in an Impulse pattern.
3. From 1940 to 1960, (he U.S. experienced the largest,
most persistent, least retraced stock market advance in
recorded history (see Figure 2). If a market starts to
increase its rate of acceleration after prolonged periods of
slower action (relatively speaking), it is an excellent
indication that an Extended wave is getting underway. The
strongest argnment for an extension beginning in 1949 is
the gradually increasing market volume over the last forty
years as the market continues to make new highs. Volume,
as a rule, increases toward the center of an Extended wave,
especially if that extension is a third wave.
4. A base trend line can aid in the identification of
Corrective patterns of the same degree (i.e., patterns within the
same Elliott formation). When employing this technique
on the available data (see Figure 4), the trend line runs
across the low in 1860 and 1932. There is no doubt that a
Flat pattern (with a C-wave failure), starting in 1835,
concluded at the low in 1860. That Flat pattern contained
the typical three segments common to most corrections.
The complexity of the Flat correction is far too great to be
directly relatable to the virtually vertical decline which
started in 1929 and Finished in 1932. If the two points
identified by the trend line are to have any relation, the
Corrective period after 1929 must have been more complex
and time consuming than is immediately apparent. During
Elliott's lifetime, he interpreted the price action from 1929
to ahout 1949 as a 21-year contraction phase (a Triangle,
using Elliott's terminology, see Figure 4). Once a 21-year
Triangle is included in the price structure, there is better
time corroboration between the two corrective phases
Dow . L(n)
442413"
59B74"
8103 »
1097 '
148 ■
20.1 •
2.71 '
.368-
■ '""
*«•
^*"J* /
'^"i'V'
^yc
--j WAVE (1)
1 1765-1835
1 -"2
.1 -»--'J
' uJ'' LoS-"
i
WAVE (II)
1835-1949
I")
WAVE (111)
1949-2020-2060
^
^
FIGURE 3 <S> Glenn Neely
CYCLES September/October 1988
219
along the base trendline (i.e., a 25-year Flat Correction
from 1835 to 1860, and a 21-year Triangle).
THE LONG-TERM WAVE COUNT
The previous analysis enabled me to determine that the
historical starting point for the U.S. stock market was most
likely 30 cents in 1765 (±10 years)! From this it was
possible to place a long-term wave count on the historical
data series. The results displayed in Figure 3 (p, 219) are:
Wave (I) 1765 to 1835
Wave (II) 1835 to 1949
Wave (III) 1949 to 2020-2060
The following analysis details the placement of the above
wave count:
1. With a starting level or 030 (around 1765) established,
the advance to 1835 now becomes a very clear Impulse
pattern with a long (extended) first wave (see Figure 4).
The 1835 high would be labeled wave (I) of SuperCyclc
degree.
2. It has already been decided that there was a Flat
correction from 1835 to 1860, which was part of SuperCycle wave
(II); and that the advance from 1860 to 1929, based on the
highest probabilities, was corrective in nature. If that rally
had been Impulsive, the low in 1860 would have been the
end of wave (II) of SuperCycle degree. Since the advance
is Corrective, the rally from I860 to 1929 must also be part
of SuperCycle wave (II) (see Figure 4).
When a second wave contains a Corrective advance of thai
magnitude (1860-1929), the second advance must be some
variation of Running Correction. The most common form
of Running Correction is the Double Three. A Double
Three typically concludes with a Non-Limiting Triangle
(Elliot! Waves in Motion, pp. 5-30,10-8). This provides a
perfect explanation for the 21-year Triangle between 1929
and 1949 that Elliott described. That Triangle terminated
a 115-year corrective phase which finalized SuperCycle
wave (II) (beginning in 1835; see Figure 4).
3. Wave-3 started In 1949 and is still unfolding. The
powerful implications of a second-wave Running
Correction guarantee that the third wave will be the longest wave
of this multi-century advance. When the third wave is the
longest wave of a pattern, it will generally subdivide more
than wave-1 or wave-5. As this subdivision occurs, a
smaller five-wave move (Impulse pattern) will become
evident within the third wave. Inside this larger third wave,
wave-1 and 2 will usually mimic the price action of the
larger first and second wave. (In this case, the larger first
wave begins approximately 1765, and the second wave ends
in 1949.) Applying this concept, we can anticipate that the
advance from 1949 to some future date will look similar to
the price action from 1765 to 1949 (see Figure 4).
Haavli si volume In
hlslor ' shortly Deli re
Irm hii h
FIGURE 4 <S> Glenn Neely
220
CYCLES September/October 1988
From 1949, an Impulse wave is present that concludes at
the high in 1966. That high is wave-1 of Cycle degree. The
sideward action from 1966 until 1974 would complete a
three-phase Flat correction. It was from the 1974 low that
the latest "bull market" began in stocks. Once again, just
like the period from 1860 to 1929, the 1980s "bull" market
was Corrective In nature (see Figure 5). In addition, all of
the action since the high in 1987 is unfolding into
Corrective patterns.
The remarkable parallelism between Supercycle wave (I)
and (II) and the latest Cycle wave-1 and wave-2 (Cycle 2 is
still unfolding) cannot be discarded. These additional
conclusions can be derived from the growing evidence:
1. When measured from the low in 1932 (approximately
55.00), Cycle wave-1 and SuperCycle wave (I) (ending
1835) relate to each other by 61.8% in price and time. This
development is very interesting when it is considered that
the historical prediction for the time and price beginning
of the 200-plus year advance was concluded independently
of this fact.
2. The corrections that follow the larger and the smaller
first waves are both Flat corrections.
3. The two large corrective advances, one from 1860 to
1929 and the other from 1974 to 1987(7), are both Double
Zigzag patterns (see Figure 5). Since the larger advance
from 1860 was a Cycle degree X-wave, it is only logical to
assume that the pattern from 1974 to 1987 would be an
X-wave of Primary degree (one degree lower than Cycle).
As in 1929, the 1987 high is only part of a larger second
4. Implementing the 61.8% ratio again, this time to the
21-year Triangle, we can assume that a 13-year contraction
started October 1987 (21 x .618).
5. The maximum extent of the correction, which began in
October 1987, is limited to the 1932 percentage retrace-
ment of the previous Cycle X-wave (1860-1929). That
retracement value was about 50%. Taking 50% of the
advance from 1974 to 1987, a level of approximately 1640
is indicated on the Dow. Since the low the day after the
1987 crash was 1706 (very close to 1640), there is good
reason to believe that the 1987 crash low is the corollary
to the 1932 bottom. It cannot be ruled out that the crash
low may be exceeded. If so, it should not be broken by
more than about 100 Dow points.
6. Measuring the advance for SuperCycle wave (I),
calculating 61.8%, and adding that amount to the end of Super-
Cycle wave (I), you arrive at precisely the 1929 top (see
Figure 5). This is a very typical stopping point for an
X-wave in a Double-Three Running Correction. Checking
the length of Cycle wave-1 (1949 to 1966), multiplying by
Dow
»« - Mnl
12413 -*
i9874"
8103 •
1097 '
148 «
20.1 »
2.71 -
.368--
■
■
.*!•
1.00 1
\J
/
(.30) - 176S
r " "
J 1135
1 <■>
L ■
a ppt
c
FlM -
\~
IflZB
X '■■•
/i-S
•V T .1139 .
1BHO
1 1
* to* *
ifsaa y
HWvvr '
Fl»1 - 1«74
End ol Trianel* mn4 Supar-
Cy«l*w«v« (II) - 1»4«
FIGURE 5 © Glenn Neely
CYCLES September/October 1988
221
the fraction .618, and adding that amount to the top of
Cycle 1 puts you exactly at the 1987 high.
The fact that multiple measurements, when applied to
wave segments of one lower degree, prodnce the same
results is beyond coincidence. There is no doubt that Cycle
wave-1 and wave-2 are, so far, mimicking the action of
SuperCycle waves (I) and (II).
CONCLUSIONS
The inherent power of a 115-year "Running Double-Three
Correction" (SuperCycle wave (II), 1949) has astounding
implications for the future. This allows us to arrive at a
resolution on the most probable market and economic
activity for the next 70 years:
1. The economic contraction which started in October
1987 will be of ONE LOWER magnitude in severity than
the Depression of 1932. Why? The Cycle 2-wave currently
in progress is of one lower degree than the correction in
1932. As the market moves sideward for the next 13 years,
economic conditions should gradually improve as they did
from 1932 to 1949.
2. SuperCycle wave (III) is going to be the Extended wave
of the Impulse pattern (see Figure 6). In other words,
SuperCycle wave (III) will be much longer than Super-
Cycle wave (I). This means the U.S. market, right after the
turn of this century, should begin to advance again. This
advance should last for decades, creating the biggest bull
market of all time (see Figure 6). The minimum
expectation for an Extended wave is 161.8% of the previous
Impulse wave of the same degree. Measuring the length of
SuperCycle wave (I), calculating the above ratio, and
adding the product to the end of SuperCycle wave (II)
(1949) produces the incredible, minimum target of (you'd
better sit down) over 100,000 basis the Dow. By applying
time techniques to the Wave structure, that price level
should not be achieved any earlier than the year 2020, and
no later than 2060!
FUNDAMENTAL JUSTIFICATION
AND COMMENTS
The seeds are currently being sown for an international
boom of unprecedented proportions. Over the next few
decades, the majority of third world countries should have
become industrialized. This will bring dramatic
improvements in the standard of living for all citizens of such
countries. International competition should invoke
jealousy and a "keep up with the Joneses" mentality,
forcing such communist countries as Russia to move toward a
more productive, capitalistic economy.
After the year 2000, the world should begin moving into the
most optimistic period ever experienced. This psychology
442413 <
■
■
■
-*■'*"
^-- /
WAVE (I) ^"
[tie Dow should exoeod
100,000 by the year
J0B0
3
f
p • i ^^^
WAVE (II)
-""
8103 •
1097 '
148 *
20.1 »
2.71 '
.368-
FIGURE 6? © Glenn Nocly
222
CYCLES September/October 1988
should be in full swing by the year 2050. Toward the middle
of the next century, there should be a virtual lack of wars,
famines, depression, etc.—a sustained period of prosperity
and peace.
For those of you who find a 100,000 Dow
incomprehensible, consider that the market, from my predicted low of
0.30 up to the 1987 high of approximately 2700, has
increased in value almost one million percent in a little over
200 years. A move from 2700 to 100,000 is only 4900%.
The analysis allows 70 years for this to take place. Thus, a
move to 100,000 in 70 years is highly plausible in
comparison to the historical record.
I realize the conclusions outlined in this article
characterize a near Utopian society; but remember, all
conclusions are based on what the Wave Theory virtually
"guarantees" will be the most incredible economic period
of all time. The latter (conclusions) is logically derived
from the former (analysis).
CYCLES September/October 1988
223
Elliott Wave Institute
The Elliott Wave Institute, established in 1983 and the pioneering force in this area of analysis,
will continue to pursue its research into pattern formation and the development of new techniques
useful to students of the Elliott Wave Theory. The products and services listed below are the most
up-to-date results of this endeavor.
Products and Services
WaveWatch - the only source of innovative techniques to assist the Elliott Wave analyst. A virtual gold mine
of ideas, WaveWatch takes you through the application of these ideas while describing every thought process
necessary to arrive at an appropriate and logical conclusion. All rules are applied to actual market action.
Elliott Wave Telephone Course - The oldest and longest running, REAL-TIME training course available.
This unique and exclusive course is conducted one-nn-one over the telephone to each student. Contact with Mr.
Neely is made three times per week for four months allowing the student to experience a multitude of market
conditions and trading strategies. Participation in Mr. Neely's class is very limited. Contact the Institute for current
availability or future, expected vacancies. Openings are infrequent and may require you be put on a waiting list.
Mastering Elliott Wave - The new, definitive guide to the Elliott Wave Theory. This is the most pioneering
work since R.N. Elliotts original discoveries. Not like any other book, it is the only one to present a scientific,
objective approach to Elliott Wave analysis allowing for confident conclusions again and again even through the
most treacherous market environments.
The Art of Trading- our acclaimed two-day Elliott/Gann seminar. The first seminar of this series was conducted
at fheEmbassy Suites Hotel in Los Angeles. It featured detailed discussions of standard Elliott and Gann approaches
along with a multitude of new techniques discovered by Mr. Neely. There are plans for a New York and London
seminar and another one in Los Angeles. If you have wish to be informed of future engagements, please make sure
your current address is on file with the Institute.
Consultation - For those of you who need a little assistance now and then with your wave counts, phone
consultation is available on apersonal basis with Mr. Neely. Financial arrangements must be made before beginning
this service.
To receive more information on the above products and services, call or write the:
Elliott Wave Institute
1278 Glenneyre, Suite 283
Laguna Beach, CA 92651
Office: (714) 497-0949 TeleFax: (714) 497-0983
About the Author:
Glenn Neely is President and Founder of the
Elliott Wave Institute (1983) located in Laguna Beach,
California. He teaches the only rear-time Elliott
Wave Course in the world (conducted solely over the
telephone) and publishes "WoveWatch," an Elliott
Wave Correspondence Course, which
systematically describes how to apply Elliott Wave to real-time
market action. Indisputably the premier
contemporary innovator in the Elliott Wave arena, many
consider Mr. Neely also to be the most accurate ana
knowledgeable Elliottician in the world!
In 1979 Mr. Neely began studying markets and
economics. Itwasin 1980,whileexaminingabook
entitled "The Commodity Futures Game," that he first
came across a summaty of the Elliott Wave Theory;
that was the beginning of this pioneering analyst's
career. After researching all available materipl, Mr.
Neely realized there were many unanswered
questions regarding proper Theory application. Over a
period of time he discovered other price patterns, not
discussed by R. N. Elliott, which classified previously
unexplained behavior. The need for greater
forecasting accuracy was the impetus of Mr. Neel/s ten
year quest for a scientific, objective process o f Elliott ■
Wave analysis. Finally having obtained that goal,
his resulting Elliott Wave philosophy, techniques andaa
sequential form of analysis are known as the Neely
Method. For the first time, the results of his decade
long search are meticulously presented in
"Mastering Elliott Wave" to improve your understanding of
market dynamics, your trading acumen and, most
importantly, your bottom line.
Mr. Neely has appeared on CNN and numerous
financial radio talk snows, been a guest speaker at
thelnternational Headquarters for the Foundation for
the Study of Cycles, conducted several seminars on
Elliott Wave and Gann techniques, written articles
for. "Cycles" magazine and.has spoken before the
Market Technicians Association. He frequently
appears on Financial News Network (FNN) and is
often quoted by Jeff Bower on FNN's "Guru Revue."
Mr. Neely spends most of his business time doing
research, personally teaching his Method to a
handful of serious market students and pioneering new ..
ideas in the field of Elliott Wave and Gann Analysis.
He also enjoys working on computer plotting and
data manipulation programs along with proprietary
forecasting and trading techniques. Currently, Mr.
Neely isplanning many new and exciting projects for
the future. Weare proud to be a part in bringing you
his current product and hope to be a part in bringing
you the results of his future efforts.
Windsor Books